


Abstract
Fertilizer reduction and improved fertilization management are important approaches to achieving green and organic grape production and vineyard management. This study aims to examine whether digital agricultural extension tools can facilitate fertilizer reduction among grape growers, or whether their actual effects may be weakened by limited attention and information overload. Using data from a randomized controlled trial (RCT) involving 475 grape growers in Liaoning Province, this study employs ordinary least squares (OLS) models and propensity score matching (PSM) to test the effect of digital information loading on growers’ fertilizer-reduction behavior. Specifically, this study constructs three dimensions, including information loading breadth (comprehensiveness), loading depth (accuracy), and loading length (completeness), and employs ordered logit models and threshold regression models to explore their mechanism effects and threshold effects on fertilizer reduction. The results indicate that (1) digital information loadingsignificantly promotes fertilizer reduction behaviors among grape growers. (2) The breadth and depth of information loading facilitate fertilizer reduction by enhancing growers’ perceived usefulness, whereas this mechanism is not significant for the length dimension. (3) Information loading length has a threshold effect on fertilizer reduction behavior, which means there is an optimal time interval for single video viewing; beyond that, the limited attention triggered information overload that causes the fertilizer reduction behavior to disappear. (4) There are also long-term effects of digital information loading. These findings provide micro-level empirical evidence for promoting green and organic-oriented grape production systems, and offer policy implications for countries pursuing sustainable agricultural transition and fertilizer reduction.
1. Introduction
Chemical fertilizer is a cornerstone of modern agricultural production. It can substantially increase crop yields and plays a vital role in safeguarding food security. In grape production, fertilization management is related to the long-term sustainable operation of vineyards. From the perspective of the ecological environment, excessive fertilizer application may lead to soil degradation by reducing soil microbial activity and declining soil fertility [1], as well as non-point source pollution, nutrient runoff, and soil contamination [2,3,4], thereby weakening the long-term productivity of vineyards. From an economic perspective, excessive fertilizer use does not necessarily translate into higher yields due to diminishing marginal returns. Instead, it often leads to input redundancy, increased production costs, and lower input efficiency [5].
At the micro level of growers’ production decisions, fertilizer reduction is one of the most direct behavioral manifestations of sustainable fertilizer management. However, in reality, excessive fertilizer application is widespread in Chinese agricultural production, and the average fertilizer input per mu (1 mu is approximately 667 square meters) for crops is 2.72 times that of the United States [6]. This extensive production pattern constrains the sustainable development of agriculture. To address this challenge, the Plan for Comprehensive Rural Revitalization (2024–2027) explicitly calls for the promotion of green production technologies, the reduction in fertilizer application intensity in cash crops, and the acceleration of organic and low-carbon agricultural development. Therefore, exploring pathways through which grape growers can achieve fertilizer reduction not only helps alleviate agricultural non-point source pollution and ecological degradation but also contributes to the sustainable management of grape production.
Existing studies have extensively investigated fertilizer reduction. Growers’ fertilizer-reduction behavior is influenced by individual characteristics, household characteristics, production and management characteristics, and external environmental conditions. Individual characteristics mainly involve risk perception and non-cognitive abilities [7,8]. Household characteristics primarily include social capital and land endowments [9,10]. Production and management characteristics mainly involve agricultural insurance and outsourced services [11,12]. External environmental conditions are reflected in cooperative participation, agricultural technical training, and related regulations [13,14,15]. Taken together, these studies establish a framework linking traditional factors to growers’ fertilizer-reduction behavior. In fact, in the production of cash crops such as grapes, fertilization decisions tend to involve stronger technological dependence and greater managerial complexity, while traditional agricultural extension approaches exhibit limitations in terms of knowledge delivery efficiency, information targeting, and behavioral conversion. Furthermore, with the penetration effect of the Internet across the entire agricultural production process and multiple domains of rural society [16], the pathways through which agricultural technologies diffuse have undergone profound transformation, driving agriculture toward a digitalized and modernized mode of development.
Against this background, digital and information-based agricultural technical services have become an important approach to promote scientific fertilization and fertilizer reduction among growers. Relevant studies have shown that access to agricultural technical information through platforms such as apps and WeChat official accounts helps improve growers’ perceptions of economic and ecological benefits [17], reduces risk perception [18], and thereby significantly decreases fertilizer use. As the frequency of digital agricultural service use increases, the search, comprehension, and bargaining costs faced by growers in acquiring technical information decline substantially. This process helps growers choose greener fertilization pathways [19]. Some scholars have further classified digital agricultural technical services into three categories: short-video platforms, content aggregation platforms, and social communication platforms. They find that short-video services, due to their concise mode of delivery, are more easily accepted by growers and more likely to promote scientific fertilization [20]. More recent research, based on an RCT, divides information interventions into environmental information, yield information, and cost information, and finds that yield and cost information are more effective in reducing growers’ subjective fertilization standards and expected fertilizer intensity [21].
It is worth noting that, in the era of digital intelligence, information is growing explosively, which exacerbates the contradiction between the infinite supply of information and the limited capacity for attention. From the perspective of attention economics, the more abundant information becomes, the scarcer the attention that individuals can allocate. What is truly scarce is no longer information itself, but attention as a distributable resource [22]. When the volume of information, the frequency of updates, and the demands of information processing exceed an individual’s cognitive processing capacity, it leads to phenomena such as increased cognitive load, reduced decision-making quality, and information avoidance. This condition is known as information overload [23,24]. For grape growers, more digital agricultural technical information is not necessarily better. The key issue is whether it can enter growers’ cognitive processing in an appropriate manner under the constraint of limited attention and ultimately be translated into practice. Accordingly, identifying the effective boundary conditions of digital agricultural technical information in grape production is crucial for improving fertilization management efficiency and promoting the green transformation of vineyards.
Compared with prior studies, this study makes three potential marginal contributions. First, by implementing an RCT, this study effectively mitigates the endogeneity arising from omitted variables in conventional research and improves the accuracy of causal identification. Second, the study develops a multidimensional framework of digital information loading by distinguishing among breadth, depth, and length, and further examines how these dimensions shape fertilizer reduction behavior through perceived usefulness. Third, based on the theory of limited attention, this study focuses on the length dimension of information loading and identifies its optimal duration, with the aim of providing practical implications for the design of digital agricultural technical videos, the optimization of grape fertilization knowledge dissemination, and the management of green input use in vineyards.
2. Theoretical Analysis and Research Hypotheses
2.1. Direct Effect of Digital Information Loading on Fertilizer-Reduction Behavior
Akerlof (1970) [25] introduced the theory of information asymmetry, arguing that market participants differ in the amount of information they possess. Information asymmetry in growers’ fertilization practices is mainly reflected in three aspects: gaps in technical knowledge, blind spots in environmental recognition, and imbalances in market information [26]. Therefore, fertilizer reduction depends on whether growers can access, understand, and retain scientific fertilization information. On this basis, this study introduces the concept of digital information loading It refers to the process through which technical information is delivered in ways consistent with growers’ attention patterns and is then actually received, browsed, and remembered by them in a digital media environment.
First, digital information loading is characterized by demand responsiveness, immediate accessibility, repeatable access, and cyclical completeness. Unlike traditional extension channels such as classroom-based training and field demonstrations, which are constrained by time and space, digital technology information enables growers to access key fertilization techniques at any time, thereby improving the scientific basis of fertilization practices [27] and promoting fertilizer reduction. Second, the delivery of digital information in video format optimizes the allocation of growers’ cognitive resources through both visual and auditory channels, thereby improving memory efficiency. Technical videos allow growers with limited educational endowments to overcome textual barriers [28] and capture key fertilization techniques through images and audio, thereby strengthening the scientific basis of fertilization. Finally, video-based digital information loading transforms abstract techniques into intuitive and contextualized dynamic demonstrations [29], enabling growers to develop imitation-based learning and facilitating their transition from experience-driven extensive fertilization to scientific fertilization.
H1.
Digital information loading can promote growers’ fertilizer-reduction behavior.
2.2. Mechanism Analysis of Perceived Usefulness in the Relationship Between Digital Information Loading and Fertilizer-Reduction Behavior
The Stimulus–Organism-Response (SOR) framework emphasizes that external stimuli influence individuals’ internal perceptions and thereby trigger behavioral responses [30]. As the carrier of digital information, fertilizer technology videos convey key knowledge on scientific fertilization and sustainable input management to growers, thereby serving as an external stimulus. Specifically, information loading breadth reflects the comprehensiveness of growers’ technical acquisition, helping them understand fertilization requirements across different grape growth stages and develop an overall cognition of fertilizer-related technologies. Information loading depth measures the precision or degree of matching in technical acquisition, helping growers address technical deficiencies and accurately grasp key technical points. Information loading length reflects continuity of technical exposure, helping growers strengthen knowledge retention and enhance confidence in technology application. The synergy of these three dimensions enhances growers’ positive behavioral attitude toward scientific fertilizer use, namely perceived usefulness [31]. When growers exhibit a higher level of perceived usefulness, they are more likely to adopt scientific fertilization technologies. In practice, this is reflected in growers’ active adjustment of fertilization methods in line with the standardized demonstrations shown in the videos, thereby achieving fertilizer reduction.
H2.
The breadth, depth, and length of digital information loading promote fertilizer-reduction behavior among grape growers by enhancing perceived usefulness.
2.3. Threshold Effect of Information Loading Length on Fertilizer-Reduction Behavior
Simon (1996) [32] described attention as a scarce resource and pointed out that, under conditions of information overload, attention becomes the main bottleneck in information processing. The contradiction between excessive digital information and limited attention resources has become increasingly evident [33], leading individuals to switch frequently between focused attention and distraction [34]. This study further analyzes the thresholds through which digital information loading affects fertilizer reduction from the three dimensions of breadth, depth, and length. Among these dimensions, breadth mainly reflects the comprehensiveness of technical content, whereas depth primarily captures the degree to which such content matches specific production contexts. In this study, the RCT delivered 11 technical videos targeting key fertilization nodes across the entire grape production cycle. These videos not only covered the major fertilization stages but were also embedded in a customized APP for Beizhen City, thereby closely aligning with local production contexts. Therefore, information loading breadth and information loading depth are more likely to supplement and reinforce growers’ technical cognition [35], and their effects on fertilizer reduction are more likely to involve continuous improvement rather than a significant threshold effect [36].
By contrast, the effect of information loading length on growers’ fertilizer-reduction behavior is more likely to exhibit a non-linear threshold effect. Given the scarcity of attentional resources among growers [37], it is difficult for them to maintain sustained concentration during a single viewing of fertilizer technology videos, and attention may easily drift or become fatigued. Growers may therefore experience a process in which attention first increases, then becomes highly concentrated, and eventually weakens or even disappears. As a result, technical information cannot be fully processed, internalized, and translated into production decisions, so the effect of information loading length on fertilizer reduction may follow a pattern of being initially effective, then becoming stronger, and then weakening or disappearing. In other words, there exists an optimal range of video exposure length. Once this range is exceeded, information overload causes the behavioral effect to disappear.
H3.
The promotional effect of digital information loading length on growers’ fertilizer-reduction behavior exhibits a threshold effect.
3. Experimental Design, Model Development, and Variable Selection
3.1. Experimental Design
3.1.1. Sample Selection and Intervention Assignment
The data used in this study come from a field survey conducted by the research team in 2020 among grape growers in Beizhen City, Liaoning Province. Beizhen was selected as the study area for three main reasons. First, it is one of China’s major table-grape producing regions and has a solid industrial base. Second, as an economic crop, grape production is often characterized by excessive fertilizer use, which puts pressure on soil and the environment. Grape growers therefore constitute a representative population for studying fertilizer-reduction behavior. Third, according to data from the Institute of New Rural Development at Peking University, the digital infrastructure index of Beizhen in 2020 was 60.36 (Peking University Open Research Data Platform. County-Level Digital Rural Index (Peking University Institute for New Rural Development), https://opendata.pku.edu.cn/file.xhtml?fileId=12781 (accessed on 25 May 2026)), indicating that digital infrastructure covered more than half of the area and thus provided a sound basis for research on digital information loading. Taken together, Beizhen is a representative study area.
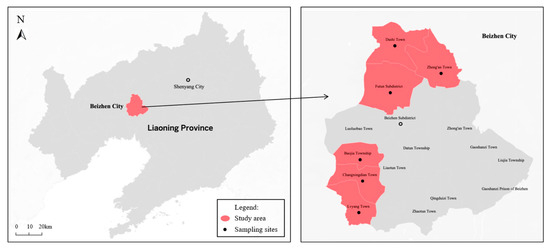
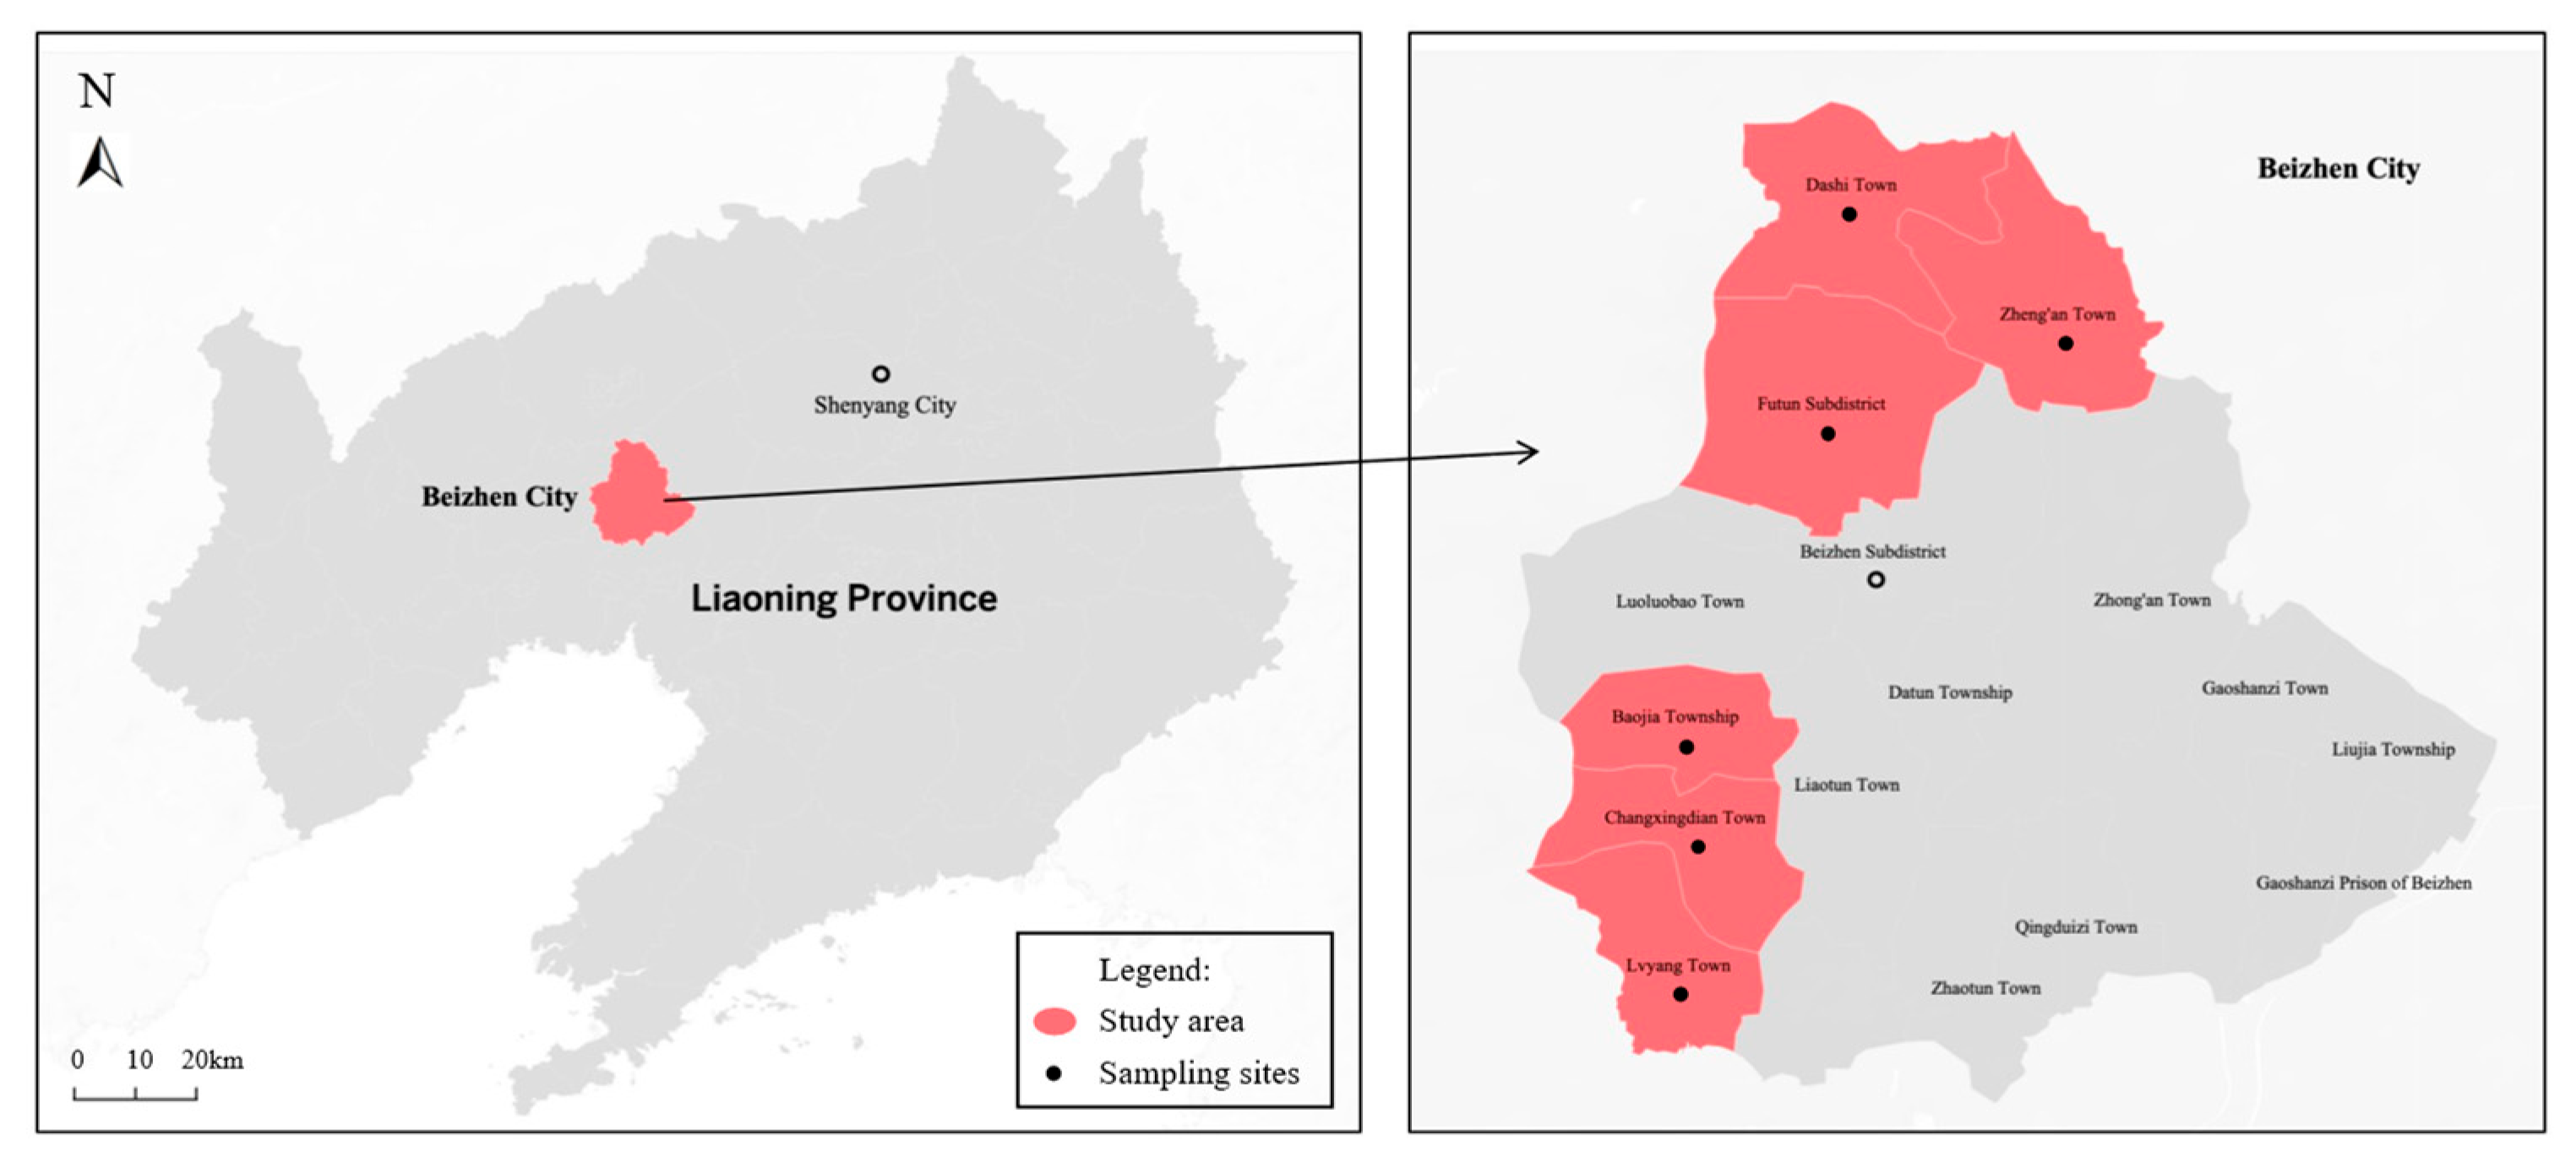
The research team used a random number generator to select six townships. All selected townships are located within the geographical indication area of the agricultural product and are also major grape-producing townships. During the survey, one-to-one in-depth interviews with growers were conducted using online questionnaires to ensure the authenticity and validity of the survey data. Figure 1 shows the study area and sampling sites.
Figure 1.
Study area and sampling sites.
3.1.2. Intervention Items and Intervention Assignment
To evaluate the effect of digital information loading on fertilizer reduction among grape growers, the research team conducted an RCT and developed a customized “Agri+” APP for grape growers in Beizhen [38]. The technical videos were provided by leading local grape growers. Maertens (2017) [39] showed that farmers continue to rely primarily on interpersonal communication for livelihood-related technical information and are more inclined to learn from leading growers with stronger technical expertise and managerial capacity. In Beizhen, some leading grape growers possess extensive practical experience and systematic training, enabling them to effectively serve as transmitters of agricultural knowledge. On this basis, in collaboration with the Beizhen Grape Association, the research team selected four growers with strong local technical influence to record technical videos covering the entire grape growth cycle. Given their familiarity with local climatic conditions, soil characteristics, and input-use practices, they were well positioned to ensure the authenticity and accuracy of the content. The presentations by the four leading growers are all based on a unified technical framework and thematic structure, ensuring consistency in content. In addition, the use of local dialect in the videos helped reduce communication barriers, improve the relevance and comprehensibility of technical dissemination, and better align the information with growers’ actual production needs.
Based on fertilizer application needs across the full production cycle of the local grape industry, 11 fertilizer-technology videos were customized as the intervention items for digital information loading. The video covers key stages, including grape flowering, fruit enlargement, color development, and ripening and harvest, addressing technical points related to water and fertilizer management, timing and methods of fertilization, and fertilizer reduction at each stage. The experiment adopted a randomized grouping method. Based on the GPS location information of growers’ addresses and village information, the sample was divided into 116 clusters using spatial grids of approximately 1 km × 1 km [40]. This grouping strategy ensured a certain degree of spatial clustering among the sample growers, thereby reducing, to some extent, the possibility of frequent contact and information diffusion across different groups.
The treatment group watched technical videos together with placebo videos, whereas the control group watched only placebo videos. The placebo videos consisted solely of scenic footage with narration and did not include any agricultural technical information. Therefore, there was no impact on farmers’ technical knowledge or production practices. When a new video was released in the app, the enumerator who had previously helped the farmer install the app provided a one-to-one, targeted reminder on the same day. The newly released videos for that day were displayed prominently on the main interface, without requiring additional actions such as switching pages or selecting menus.
3.1.3. Experimental Process and Data Recovery
The baseline survey was completed in January 2020 and yielded 1026 valid observations. The endline survey was completed in January 2021 and yielded 687 valid observations, corresponding to an attrition rate of 33.04%, mainly due to refusal to be revisited, changes in contact information, and withdrawal from grape production. After the intervention began, the APP backend automatically recorded each grower’s video entry time and viewing duration. Viewings shorter than 10 s were excluded from the statistics.
According to backend records and the statistical analysis of the endline survey data, 239 of the 433 growers in the treatment group watched the fertilizer-technology videos, while the control group comprised 254 growers. The completion rate of the fertilizer-technology videos reached 94%, indicating strong interest in the content and relatively efficient and comprehensive information transmission. The main reasons why some treatment-group growers did not watch the technical videos were that they changed phones and did not reinstall the APP, or had no time to watch during the busy farming season. After excluding treatment-group growers who did not watch the fertilizer-technology videos, 493 valid observations remained across the two groups. After further removing questionnaires with missing key information or inconsistent response, the final sample consisted of 475 valid questionnaires, including 232 in the treatment group and 243 in the control group, corresponding to an effective questionnaire rate of 96.35%.
3.2. Model Specification
This study focuses on the effect of digital information loading on fertilizer reduction and specifies the baseline regression model as follows:
where denotes fertilizer input of grower , is the core explanatory variable, represents control variables, is the random error term, and is the parameter to be estimated.
To examine the mechanism through which different dimensions of information loading affect growers’ fertilizer-reduction behavior via perceived usefulness, this study follows Jiang (2022) [41] and adopts a two-step approach to test the mediating mechanism. Since perceived usefulness is an ordered multi-categorical variable, an OLogit model is employed, as specified below
where represents perceived usefulness of grower , denotes the breadth of information loading, denotes the depth of information loading, denotes the length of information loading; represents control variables; denotes the parameters to be estimated; and is the random error term.
The threshold regression model proposed by Hansen [42] is a classic approach for analyzing threshold effects and is suitable for continuous dependent variables. Its core purpose is to identify the points at which the effect of an explanatory variable changes significantly as the threshold variable crosses different values. Taking information loading length as the threshold variable, the model is specified as follows
where denotes the threshold variable, namely information loading length; (·) is an indicator function that takes the value of 1 when the condition in parentheses holds and 0 otherwise; represents the threshold value to be estimated. Equation (3) allows for triple-threshold specifications, and the actual number of thresholds is determined empirically; are parameters to be estimated and is the random error term, respectively.
3.3. Variable Selection
3.3.1. Dependent Variable
The dependent variable is growers’ fertilizer-reduction behavior, for which fertilizer input is used as a proxy. Because there are so many types of chemical fertilizers, and their formulations, sizes, and active ingredient concentrations vary, it is difficult to accurately estimate input quantities in weight terms. In addition, growers within the same town generally use similar fertilizer types, with only small differences in unit prices and almost no internal differences in usage structure. Lastly, growers generally remember the cost of inputs better than the specific amount they applied. It is therefore feasible to measure fertilizer input using expenditure per mu.
3.3.2. Core Explanatory Variables
The first component of digital information loading is “whether digital information loading”, that is, whether the grower watched the fertilizer-technology videos in the APP developed by the research team. A value of 1 is assigned if the grower watched the fertilizer-technology videos, and 0 if the grower watched only placebo videos. The second component captures the breadth, depth, and length of information loading. Breadth is measured by the number of distinct fertilizer-technology videos watched by the grower. Depth is measured by the maximum number of times growers have watched different fertilizer application technique videos. Reality shows that growers usually do not repeatedly watch all videos, but may repeatedly watch one specific video, indicating that the technique presented in that video is a key learning focus. Repeated viewings of one key video may therefore exert a stronger behavioral effect than the average number of repeated viewings across multiple videos. Length is measured by the average viewing duration, calculated as total viewing seconds divided by total viewings.
3.3.3. Mediating Variable
Perceived usefulness is the mediating variable in this study. It is measured by the survey item: “Is watching the APP videos helpful for your grape production?” with response options coded as 1 = not helpful, 2 = partially helpful, and 3 = helpful. A higher value indicates that the grower perceives the technical content delivered through the video APP to be more helpful for grape production. It should be noted that this question was asked only of growers in the treatment group. Since the control group watched only scenic videos, the item does not apply to them.
3.3.4. Control Variables
Drawing on previous studies [10,14,17], control variables are selected from three dimensions, including individual characteristics of growers, household operation characteristics, and other characteristics. Individual characteristics include gender, age, education level, health status, growing experience, and nonfarm employment. Household operation characteristics include the number of agricultural laborers, growing area, land quality, grape yield, grape variety, and grape attribute. Other characteristics include internet use and offline technical training. Definitions and descriptive statistics for all variables are reported in Table 1.
Table 1.
Variable definitions and descriptive statistics.
Table 1 shows that the average grape yield of the sampled farmers exceeded 4000 jin per mu, equivalent to more than 3 kg per square meter. Given the actual conditions of local grape production, this yield level indicates that most of the vineyards in the sample are in their full-bearing stage. The average age of the sampled farmers was approximately 49 years, reflecting the broader context of rural labor aging and youth labor outmigration in China [43,44]. The average grape growing area was approximately 11 mu, equivalent to about 7333.33 square meters, indicating the small-scale, family-based nature of grape production [45]. Given the high cost and limited availability of hired labor in the local area, farmers’ operational scale is generally constrained by household labor endowments and is therefore difficult to expand substantially.
4. Empirical Results
4.1. Baseline Regression Results
To verify the homogeneity of the control and treatment groups before the intervention, a t-test is first conducted on fertilizer input before the intervention. The analysis software used in this study is Stata 18.0, developed by StataCorp LLC (College Station, TX, USA). As shown in Table 2, the difference in means between the two groups is 25.814 and the p-value is 0.624, indicating that there was no significant difference in pre-intervention fertilizer input between growers in the control and treatment groups.
Table 2.
T-test results for fertilizer input before the intervention in the control and treatment groups.
Table 3 reports the OLS results for the effect of digital information loading on growers’ fertilizer-reduction behavior. In Model (2), after controlling for other variables, digital information loading still exerts a significantly negative effect on growers’ fertilizer input at the 1% level. Specifically, compared with growers in the control group, those in the treatment group reduced fertilizer expenditure per mu by 114.386 yuan (equals to 0.0245 US dollars per square meter), which is equivalent to an approximately 16.1% reduction in fertilizer input (114.386/711.577 ≈ 0.161). This indicates that fertilizer-technology videos enabled growers to obtain more scientific fertilization information, effectively reduced information asymmetry, and promoted growers’ fertilizer-reduction behavior. Hypothesis 1 is confirmed.
Table 3.
Baseline regression results for the effect of digital information loading on growers’ fertilizer input.
Among the control variables, growing area has a significantly positive effect on fertilizer reduction, whereas nonfarm employment exerts a significantly negative effect. A plausible explanation is that, as land operation scale expands, the per-unit-output costs of technical learning and fertilizer application decline, and this scale-economy effect significantly strengthens growers’ incentives to adopt fertilizer reduction. In addition, growers engaged in nonfarm employment may be more likely to address labor shortages and technical constraints through outsourced services, and the precision and scale advantages of such services are conducive to reducing fertilizer use.
4.2. Robustness Tests
To examine the reliability of the baseline regression results, this study sequentially applies propensity score matching (PSM), alternative clustered standard errors, two-sided Winsorization, and quantile regression. First, PSM is used to rebalance the treatment and control groups. Table 4 reports the estimation results from four matching methods, with all four methods showing significantly negative ATT values. Overall, the PSM results indicate that, after improving between-group comparability through matching, digital information loading still exhibits a stable negative effect on fertilizer input, suggesting that the main conclusion does not depend on any particular matching method and is therefore robust.
Table 4.
Average treatment effects estimated by PSM.
Second, considering that growers within the same village may be correlated, standard errors are clustered at the village level to control for the potential influence of within-group correlation on the estimates. Third, to mitigate the influence of extreme values, the dependent variable is subjected to 1% two-sided Winsorization. Finally, quantile regression is conducted at the 25th, 50th, and 75th quantiles to uncover information that cannot be revealed by the OLS model. The results, reported in Table 5, again confirm the conclusions of this study.
Table 5.
Robustness test results.
4.3. Mechanism Analysis
In the mechanism analysis, digital information loading is categorized into breadth, depth, and length. Focusing on experimental group growers as research subjects, we primarily examine the mechanism role of perceived usefulness. According to Model (4) in Table 6, information loading breadth has a significantly positive effect on growers’ perceived usefulness at the 5% level. This suggests that, by increasing the number of videos watched, growers can acquire more fertilization knowledge covering the full grape growth cycle. Such systematic knowledge accumulation enables them to better understand the alignment between fertilizer application and the grape growth cycle, thereby allowing them to assess the practical value of the technologies shown in the videos more accurately and enhancing perceived usefulness. Growers with higher perceived usefulness are then more likely to successfully apply the video content in grape production management, ultimately promoting fertilizer reduction. Information loading depth also significantly improves perceived usefulness at the 5% level, indicating that repeated learning of key videos of interest helps growers fill technical knowledge gaps, more accurately grasp the key points of fertilizer reduction, and thereby enhance perceived usefulness and eventually promote fertilizer-reduction behavior.
Table 6.
Mechanism test results for perceived usefulness.
By contrast, the effect of information loading length on perceived usefulness is not statistically significant. A possible explanation is that information loading length reflects the duration of sustained attention during viewing. Because growers can maintain concentrated attention only for a limited period, longer viewing durations may induce fatigue and distraction, thereby weakening the transmission effect of the video content and preventing a significant improvement in perceived usefulness. Hypothesis 2 is therefore partially supported.
4.4. Threshold Effect Test
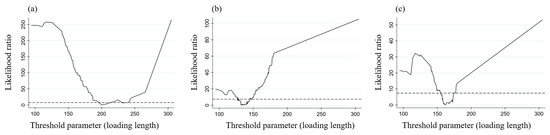
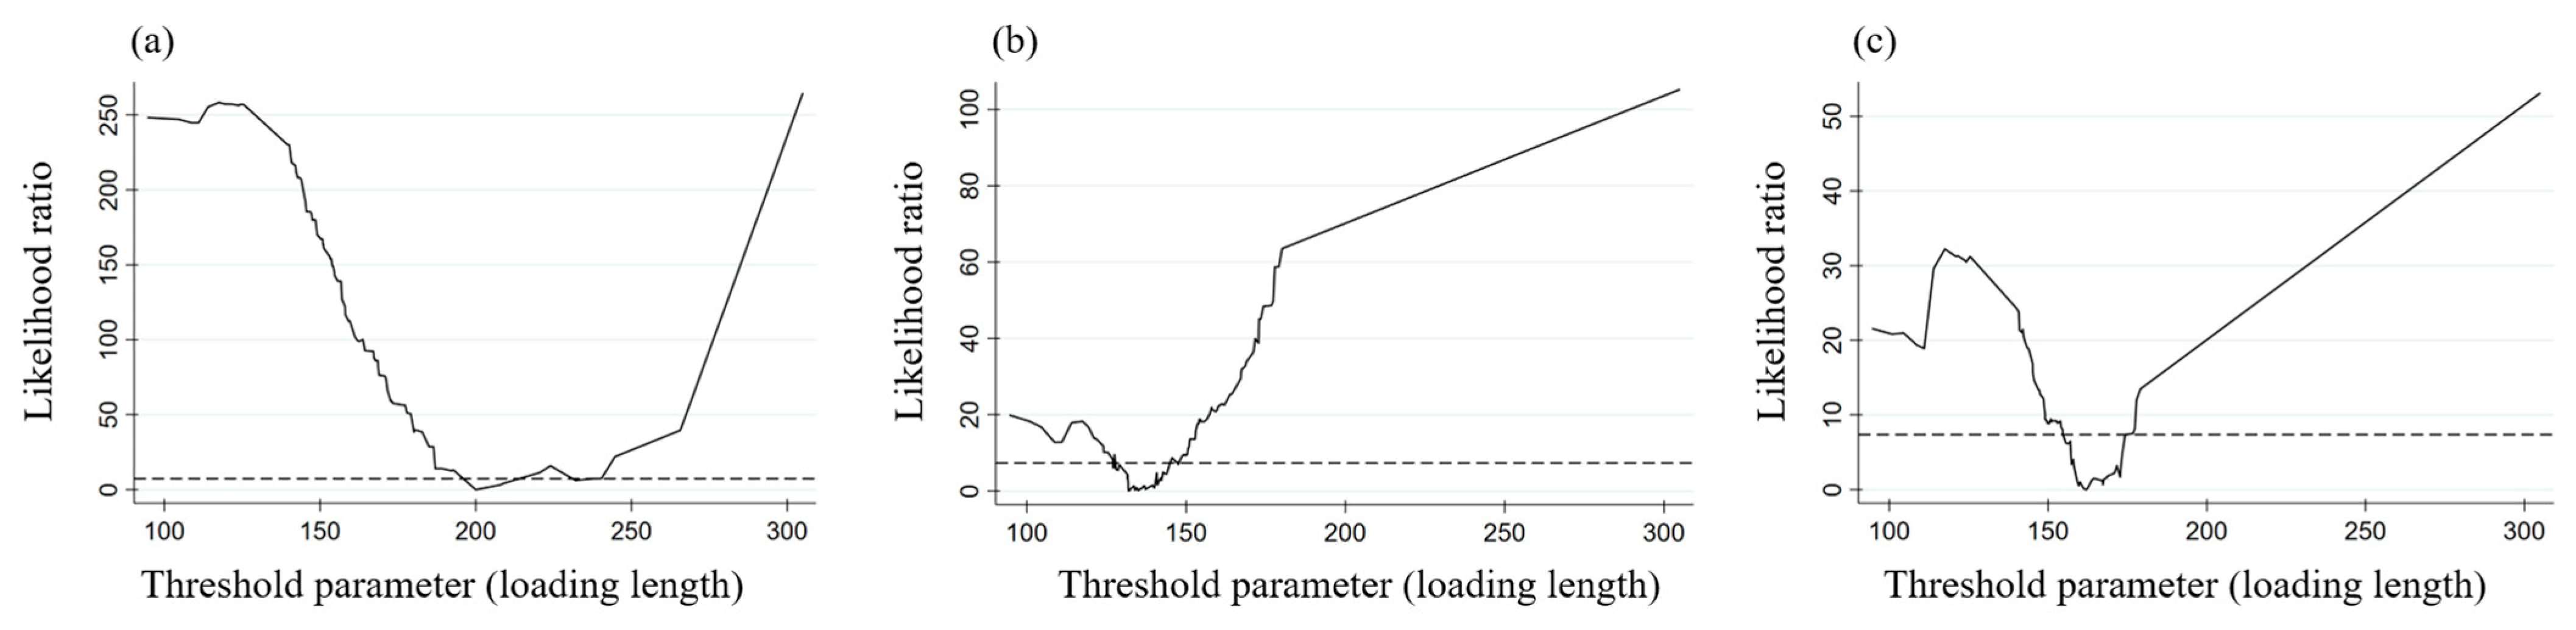
Given that the mediating effect of perceived usefulness in the relationship between information loading length and growers’ fertilizer-reduction behavior is not significant, this study further explores whether a nonlinear relationship exists between information loading length and fertilizer reduction, that is, whether information overload is present. A threshold model is employed, and 1000 bootstrap replications are used to test sequentially for single, double, and triple thresholds, yielding F-statistics and p-values. As shown in Table 7, information loading length passes the single, double, and triple-threshold tests at the 1% significance level, indicating a significant threshold effect in growers’ fertilizer-reduction behavior. The corresponding estimated threshold values are 200 s, 132 s, and 161 s, respectively. Figure 2 presents the likelihood-ratio function for the triple-threshold estimation.
Table 7.
Threshold effect test results.
Figure 2.
Estimated threshold values and likelihood-ratio function curves: (a) The first threshold is 200 s; (b) The second threshold is 132 s; (c) The third threshold is 161 s. The curve in the figure represents the likelihood ratio statistic (LR), and the horizontal dashed line represents the threshold value for the LR test.
Further examine the extent to which information loading length influences fertilizer reduction among growers across different threshold ranges. As shown in Model (1) of Table 8, when information loading length is less than 132 s, the coefficient on fertilizer input is −4.486 and is significant at the 10% level. This means that, compared with control-group growers, each additional second of video viewing by treatment-group growers is associated with a reduction of 4.486 yuan in fertilizer expenditure per mu. Model (2) shows that, when information loading length is greater than or equal to 132 s but less than 161 s, the coefficient increases to −8.411 and remains significant at the 10% level. This implies a reduction of 8.411 yuan in fertilizer expenditure per mu for each additional second watched. However, when information loading length is greater than or equal to 161 s, as shown in Models (3) and (4), the effect is no longer significant. These findings suggest that the effective interval of information loading length for promoting fertilizer reduction is 0–161 s. Within this range, growers can absorb and apply the technical information in the videos more effectively, thereby improving sustainable fertilizer input management in grape production. However, growers’ attention capacity is limited. Once the average viewing duration exceeds a certain interval, information overload emerges, lowering the efficiency with which growers absorb and apply information and ultimately causing the effect of information loading length on fertilizer reduction to disappear. Hypothesis 3 is thus supported.
Table 8.
Threshold regression results for the effect of information loading length on growers’ fertilizer input.
4.5. Long-Term Effect Test
Given the substantial one-time investment required for a customized digital agricultural technology promotion platform, this section further examines the long-term effect of digital information loading by focusing on changes in fertilizer use in 2022, two years after the treatment and control groups received the digital information loading intervention. The research team conducted individual telephone follow-ups in 2022 with grape growers who had participated in the 2020 baseline survey. By matching individual records, we obtained 445 data points related to fertilizer application and other factors. After removing outliers, 434 valid observations remained.
As shown in Table 9, with other control variables unchanged, digital information loading has a significant and persistent negative effect on growers’ fertilizer inputs at the 5% level. Specifically, compared with growers in the control group, growers in the treatment group reduced fertilizer expenditure per mu by 104.366 yuan in 2022. This confirms that digital information loading not only generates immediate effects but also exerts a lasting influence on growers’ fertilizer-reduction behavior. This long-term impact stems from the sustained internalization of knowledge and accumulation of technical skills, through which the learning outcomes are ultimately transformed into stable patterns of production behavior.
Table 9.
Long-term effect of digital information loading on growers’ fertilizer-reduction behavior.
5. Conclusions and Policy Implications
5.1. Conclusions
Using data from 475 grape growers in Liaoning Province and drawing on an RCT, this study employs OLS, OLogit, and threshold regression models to empirically examine the effect of digital information loading on growers’ fertilizer-reduction behavior and its underlying mechanisms. The main conclusions are as follows. First, digital information loading significantly promotes growers’ fertilizer-reduction behavior. Compared with growers in the control group, growers in the treatment group reduced fertilizer expenditure per mu by 114.386 yuan (equals to 0.0245 US dollars per square meter). Second, the breadth and depth of information loading promote fertilizer reduction through perceived usefulness, whereas this mechanism is not significant for information loading length. Third, the effect of information loading length on growers’ fertilizer-reduction behavior exhibits a threshold effect. When average viewing duration falls between 132 and 161 s, the fertilizer-reduction effect is most pronounced, whereas excessive duration may lead to the disappearance of the effect because of growers’ loss of attention. Fourth, digital information loading has a long-term effect. Growers who watched the technical videos not only reduced fertilizer use in the current period, but also maintained this behavioral change two years after the intervention. This indicates that digital information loading exerts a persistent influence by strengthening technical cognition and establishing behavioral inertia.
5.2. Policy Implications
Based on the above findings, four policy implications can be drawn. First, the digital infrastructure of agriculture should be strengthened by developing regionally customized agricultural technology platforms for grape growers. Resources from government, research institutions, agricultural enterprises, and leading growers should be integrated to build digital agricultural technology service platforms adapted to local conditions. This would allow agricultural knowledge to be delivered to growers in an intuitive and vivid manner, thereby ensuring the accessibility, comprehensiveness, and precision of technology dissemination. Second, a full-cycle technical video matrix should be developed to improve the precision of demand matching. A matrix of fertilizer management videos covering the entire grape growth cycle should be developed to help growers establish a systematic understanding of fertilizer application. By addressing growers’ production constraints and technical shortcomings, these videos can enhance perceived usefulness and facilitate the transition toward green production practices. Third, optimize the design of technical video duration to improve the efficiency of knowledge dissemination. Full consideration should be given to farmers’ attention patterns, and video length should be scientifically controlled. Complex technical videos should be split into multiple shorter videos to avoid weakening the absorption of fertilization knowledge due to information overload. Fourth, the institutional system for digital agricultural technology should be improved to provide a solid foundation for long-term service guarantees. Positive incentives should be provided to growers who participate in digital agricultural technology services for two consecutive years and achieve fertilizer reduction. At the same time, platform maintenance, together with technological iteration and upgrading, should be incorporated into a routine mechanism to ensure the sustainability of technical support and the stability of service quality.
5.3. Limitations and Future Directions
Although this study identifies the effect of digital information loading based on a randomized intervention design, several limitations remain. First, a certain degree of sample attrition occurred between the baseline and endline surveys. Approximately 33.04% of the baseline sample was not successfully recovered in the endline survey. Although most baseline characteristics did not differ significantly between the retained and non-retained samples, and no systematic difference was observed in the core dependent variable between the two groups, the potential influence of sample selection cannot be completely ruled out. Therefore, caution is needed when extending and generalizing the conclusions of this study.
Second, insufficient compliance was observed within the treatment group. Some growers assigned to the treatment group did not actually watch the fertilizer technical videos. To more clearly identify the mechanism through which digital information loading operates, the empirical analysis retained only growers who completed the intervention. This treatment helps estimate the intervention effect more accurately. However, the interpretation of intervention results should be limited to groups that have had sufficient time to receive the digital information. Future research could further improve the robustness and applicability of the findings by increasing the sample tracking rate and optimizing the intervention implementation process.
Author Contributions
Conceptualization, H.W. and X.Y. (Xiangning Yu); methodology, H.W.; software, H.W.; validation, X.Y. (Xiaoli Yang); formal analysis, X.Y. (Xiangning Yu); investigation, H.W.; resources, X.Y. (Xiaoli Yang); data curation, X.Y. (Xiaoli Yang); writing—original draft preparation, H.W. and X.Y. (Xiangning Yu); writing—review and editing, X.Y. (Xiaoli Yang) and Z.J.; visualization, H.W.; supervision, X.Y. (Xiaoli Yang) and Z.J.; project administration, X.Y. (Xiaoli Yang) and Z.J.; funding acquisition, X.Y. (Xiaoli Yang) and Z.J. All authors have read and agreed to the published version of the manuscript.
Funding
This research was funded by the National Natural Science Foundation of China General Program, grant number 72103143.
Institutional Review Board Statement
The study was conducted in accordance with the Declaration of Helsinki and approved by the Institutional Review Board of Shenyang Agricultural University (protocol code SYAU201993006 and date of approval 30 September 2019).
Data Availability Statement
The data of this study contain sensitive information on participants’ behavioral records collected through a mobile application. Due to privacy and ethical restrictions, the raw data are not publicly available. Data may be made available from the corresponding author upon reasonable request and subject to approval by the relevant ethics committee.
Conflicts of Interest
The authors declare no conflicts of interest.
Abbreviations
The following abbreviations are used in this manuscript:
| RCT | Randomized controlled trial |
| OLS | Ordinary Least Squares |
| Ologit | Ordered Logit |
| PSM | Propensity Score Matching |
| USDA | United States Department of Agriculture |
| GPS | Global Positioning System |
| APP | Application |
| ATT | Average Treatment Effect on the Treated |
References
- Pahalvi, H.N.; Rafiya, L.; Rashid, S.; Nisar, B.; Kamili, A.N. Chemical Fertilizers and Their Impact on Soil Health. In Microbiota and Biofertilizers; Dar, G.H., Bhat, R.A., Mehmood, M.A., Hakeem, K.R., Eds.; Springer: Cham, Switzerland, 2021; Volume 2, pp. 1–20. [Google Scholar]
- Sun, B.; Zhang, L.; Yang, L. Agricultural Non-Point Source Pollution in China: Causes and Mitigation Measures. AMBIO 2012, 41, 370–379. [Google Scholar] [CrossRef] [Scilit] [PubMed]
- Srivastav, A.L. Chemical Fertilizers and Pesticides: Role in Groundwater Contamination. In Agrochemicals Detection, Treatment and Remediation: Pesticides and Chemical Fertilizers; Elsevier: Amsterdam, The Netherlands, 2020; pp. 143–159. [Google Scholar]
- Rashmi, I.; Roy, T.; Kartika, K.S.; Pal, R.; Coumar, V.; Kala, S.; Shinoji, K.C. Organic and Inorganic Fertilizer Contaminants in Agriculture: Impact on Soil and Water Resources. In Contaminants in Agriculture: Sources, Impacts and Management; Naeem, M., Ansari, A.A., Gill, S.S., Eds.; Springer International Publishing: Cham, Switzerland, 2020; pp. 3–41. [Google Scholar]
- Burke, W.J.; Frossard, E.; Kabwe, S.; Jayne, T.S. Understanding Fertilizer Adoption and Effectiveness on Maize in Zambia. Food Policy 2019, 86, 101721. [Google Scholar] [CrossRef] [Scilit]
- Zhang, Y.; Yuan, J.; Huang, H. Historical Evolution, Theoretical Logic and Advancing Path of Agricultural Power with Chinese Characteristics. Issues Agric. Econ. 2023, 44, 4–16. (In Chinese) [Google Scholar]
- Jiang, M.; Luo, X.; Li, Y.; Sang, X.; Du, S. Capability Approach, Risk Perception and Farmers’ Fertilizer Reduction Technology Adoption Behavior. Chin. J. Eco-Agric. 2025, 33, 1207–1218. (In Chinese) [Google Scholar] [CrossRef]
- Liu, Q.; Yan, T. The Effect of Noncognitive Abilities on Promoting the Adoption of Soil Testing and Formula Fertilization Technology by Farmers: Empirical Insights from Central China. Environ. Dev. Sustain. 2025, 27, 4937–4969. [Google Scholar] [CrossRef] [Scilit]
- Wang, J.; Liu, R.; Tian, M.; Liang, F.; Ren, W.; Ma, H. Environmental Values, Social Networks, and Farmers’ Soil Testing and Formulated Fertilization Technology Adoption: Evidence from China. Environ. Dev. Sustain. 2024, 1–42. [Google Scholar] [CrossRef] [Scilit]
- Zhang, C.Z.; Chen, D.L.; Zhang, X.P. Impact of Cultivated Land Fragmentation and Labor Force Aging on Rice Fertilizers Application Intensity. J. Ecol. Rural Environ. 2023, 39, 344–352. (In Chinese) [Google Scholar] [CrossRef]
- Dong, Y.; Jia, C.; Su, L. The Impact of Digital Agricultural Insurance on Farmers’ Fertilizer Reduction Technology Adoption: Evidence from China. China Agric. Econ. Rev. 2025, 17, 379–397. [Google Scholar] [CrossRef] [Scilit]
- Zhao, P.; Huang, Y.; Bai, Y.; Qi, Q.; Wang, Q. The Effect of Agricultural Social Services on Encouraging Farmers to Reduce Fertilizer Use: Empirical Insights from Jianghan Plain in China. Environ. Dev. Sustain. 2025, 1–39. [Google Scholar] [CrossRef] [Scilit]
- Liu, X.; Xiang, J.; Qiu, L.; Fu, X.; Liu, Y. Research on Cooperative’s Information Services, Farmers’ Cognition, and Fertilizer Reduction Behavior: Evidence from China. Environ. Dev. Sustain. 2025, 27, 4513–4539. [Google Scholar] [CrossRef] [Scilit]
- Wang, X.; Zhao, X. The Moderating Effect of Training, Subsidies and Propaganda on the Relationship between Psychological Factors and Farmers’ Willingness to Reduce Chemical Fertilizer Application: Evidence from Dryland Farming Areas of China. Agric. Syst. 2025, 224, 104257. [Google Scholar] [CrossRef] [Scilit]
- Cui, G.; Liu, Z. The Impact of Environmental Regulations and Social Norms on Farmers’ Chemical Fertilizer Reduction Behaviors: An Investigation of Citrus Farmers in Southern China. Sustainability 2022, 14, 8157. [Google Scholar] [CrossRef] [Scilit]
- Cai, Y.; Zhang, J. The Substitution and Pervasiveness Effects of ICT on China’s Economic Growth. Econ. Res. J. 2015, 50, 100–114. (In Chinese) [Google Scholar]
- Mao, H.; Liu, S.; Peng, P. Digital Extension and Farmers’ Fertilizer Reduction: An Empirical Analysis of China’s Major Apple Producing Areas in Shaanxi Province. Chin. Rural Econ. 2023, 2, 66–84. (In Chinese) [Google Scholar] [CrossRef]
- Yu, X.; Sheng, G.; Sun, D.; He, R. Effect of Digital Multimedia on the Adoption of Agricultural Green Production Technology among Farmers in Liaoning Province, China. Sci. Rep. 2024, 14, 13092. [Google Scholar] [CrossRef] [Scilit] [PubMed]
- Gao, T.; Feng, H.; Lu, Q. Can Digital Agricultural Extension Services Promote Farmers’ Green Production Technology Choices: Based on Micro-Survey Data from Three Provinces in the Yellow River Basin. J. Agrotech. Econ. 2023, 9, 23–38. (In Chinese) [Google Scholar]
- Wen, S.; Chen, Z.; Xia, X.; Zhang, J.; Xie, S. Impact of Digital Agricultural Technology Promotion Services on Farmers’ Adoption of Green Production Technologies. J. Arid Land Resour. Environ. 2024, 38, 43–52. (In Chinese) [Google Scholar]
- Liu, B.; Lü, X.; Luo, X. The Application of Information Intervention Strategies in Fertilizer Reduction: Evidence from Randomized Controlled Trials. J. Northwest AF Univ. Soc. Sci. Ed. 2025, 25, 114–126. (In Chinese) [Google Scholar]
- Lanham, R.A. The Economics of Attention: Style and Substance in the Age of Information; University of Chicago Press: Chicago, IL, USA, 2006. [Google Scholar]
- Eppler, M.J.; Mengis, J. The Concept of Information Overload: A Review of Literature from Organization Science, Accounting, Marketing, MIS, and Related Disciplines. Inf. Soc. 2004, 20, 325–344. [Google Scholar] [CrossRef] [Scilit]
- Yan, Y. The Attention Economy, Poverty of Attention and Information Flow Empowerment of Poverty Reduction. Theory Reform 2023, 99–114+159–160. (In Chinese) [Google Scholar]
- Akerlof, G.A. The Market for “Lemons”: Quality Uncertainty and the Market Mechanism. Q. J. Econ. 1970, 84, 488–500. [Google Scholar] [CrossRef] [Scilit]
- Li, Y.; Luo, X.; Tang, L.; Huang, Y.; Yan, A. Impact of Perceived Normality of Agricultural Materials Market on Farmers’ Adoption of Soil Testing and Formula Fertilization Technology. Chin. J. Agric. Resour. Reg. Plan. 2022, 43, 38–48. (In Chinese) [Google Scholar]
- Fernando, A.N. Seeking the Treated: The Impact of Mobile Extension on Farmer Information Exchange in India. J. Dev. Econ. 2021, 153, 102713. [Google Scholar] [CrossRef] [Scilit]
- Tata, J.S.; McNamara, P.E. Impact of ICT on Agricultural Extension Services Delivery: Evidence from the Catholic Relief Services SMART Skills and Farmbook Project in Kenya. J. Agric. Educ. Ext. 2018, 24, 89–110. [Google Scholar] [CrossRef] [Scilit]
- Liu, D.; Luo, X. The Impact of Short-Video APPs on Farmers’ Adoption of Green Techniques of Pest and Disease Control. Resour. Sci. 2022, 44, 1879–1890. (In Chinese) [Google Scholar] [CrossRef] [Scilit]
- Mehrabian, A.; Russell, J.A. The Basic Emotional Impact of Environments. Percept. Mot. Ski. 1974, 38, 283–301. [Google Scholar] [CrossRef] [Scilit]
- Davis, F.D. Perceived Usefulness, Perceived Ease of Use, and User Acceptance of Information Technology. MIS Q. 1989, 13, 319–340. [Google Scholar] [CrossRef] [Scilit]
- Simon, H.A. Designing Organizations for an Information-Rich World. Int. Libr. Crit. Writ. Econ. 1996, 70, 187–202. [Google Scholar]
- Huang, Z. The Production, Realization and Distribution of Digital Surplus Value. Stud. Marx. 2022, 3, 104–119. (In Chinese) [Google Scholar]
- Wu, D. Attention Alienation and Criticism in the Era of Digital Capitalism. Ideol. Theor. Educ. 2025, 1, 48–53. (In Chinese) [Google Scholar]
- Rogers, E.M. Diffusion of Innovations, 5th ed; Free Press: Bucharest, Romania, 2003. [Google Scholar]
- Sweller, J. Cognitive Load During Problem Solving: Effects on Learning. Cogn. Sci. 1988, 12, 257–285. [Google Scholar] [CrossRef] [PubMed]
- Hu, X.; Yan, J. Effective Traffic Conversion and High-Quality Development of Traffic Economy in the Digital Age. China Ind. Econ. 2025, 4, 42–60. (In Chinese) [Google Scholar] [CrossRef]
- Yang, X.; Sun, X.; Mou, E. How Can Online Information Intervention Improve Agricultural Product Quality: A Randomized Controlled Trial Based on Grape Growers. J. Agrotechnol. Econ. 2025, 7, 20–34. (In Chinese) [Google Scholar]
- Maertens, A. Who Cares What Others Think (or Do)? Social Learning and Social Pressures in Cotton Farming in India. Am. J. Agric. Econ. 2017, 99, 988–1007. [Google Scholar] [CrossRef] [Scilit]
- Yu, X.; Yang, X.; Sun, X. How Neighbourhood Effects Shape Grape Farmers’ Storage Decisions: The Moderating Role of Risk Aversion. China Agric. Econ. Rev. 2025, 1–20. [Google Scholar] [CrossRef] [Scilit]
- Jiang, T. Mediating Effects and Moderating Effects in Causal Inference. China Ind. Econ. 2022, 5, 100–120. (In Chinese) [Google Scholar]
- Hansen, B.E. Threshold Effects in Non-Dynamic Panels: Estimation, Testing, and Inference. J. Econom. 1999, 93, 345–368. [Google Scholar] [CrossRef] [Scilit]
- Zhang, H.; Li, J.; Quan, T. Strengthening or Weakening: The Impact of an Aging Rural Workforce on Agricultural Economic Resilience in China. Agriculture 2023, 13, 1436. [Google Scholar] [CrossRef] [Scilit]
- Li, M.; Sicular, T. Aging of the Labor Force and Technical Efficiency in Crop Production: Evidence from Liaoning Province, China. China Agric. Econ. Rev. 2013, 5, 342–359. [Google Scholar] [CrossRef] [Scilit]
- Xu, J.; Lu, W.; Wang, W. From “Fragile Smallholders” to “Resilient Smallholders”: Measuring Rural Household Resilience in China. Humanit. Soc. Sci. Commun. 2024, 11, 1712. [Google Scholar] [CrossRef] [Scilit]

Disclaimer/Publisher’s Note: The statements, opinions and data contained in all publications are solely those of the individual author(s) and contributor(s) and not of MDPI and/or the editor(s). MDPI and/or the editor(s) disclaim responsibility for any injury to people or property resulting from any ideas, methods, instructions or products referred to in the content. |
© 2026 by the authors. Licensee MDPI, Basel, Switzerland. This article is an open access article distributed under the terms and conditions of the Creative Commons Attribution (CC BY) license.