


Abstract
Background: In the past ten years, the number of publications on injuries associated with electric scooters (e-scooters) has been increasing continuously. The aim of this systematic review and meta-analysis was to synthesize the original study results on injury types, injury severity, clinical care, accident mechanisms, risk factors, and patient characteristics associated with e-scooter accidents. Methods: The literature search was conducted in PubMed, EMBASE and Medline. We included quantitative clinical studies published between 07/2019 and 07/2024 that report e-scooter-associated injuries in patients who presented to an emergency department. Variables that were reported as proportions (e.g., frequency of extremity fractures) were summarized using a proportional meta-analysis. Parameters on a continuous scale were combined using a meta-analysis of the arithmetic means. Results: Among 524 unique records, 149 articles met the inclusion criteria, and 68 were eligible for quantitative analyses. Most e-scooter patients sustained injuries to the head and face with a pooled frequency of 42.1% (95% CI 38.7–45.4). Injuries of the upper extremities were estimated at 40.1% of patients (95% CI 35.8–44.4). Fractures of the extremities occurred with a pooled frequency of 25.7% (95% CI 22.5–28.9). An estimated proportion of 2.3% (95% CI 1.6–3.0) sustained severe traumatic brain injuries. Determined by the Injury Severity Score (ISS), 2.8% (95% CI 1.5–4.1) of the e-scooter patients were severely injured (ISS ≥ 16). Conclusions: Injuries to the head and face as well as the upper extremities are the most common causes for emergency department visits following e-scooter accidents. One in four patients presented with extremity fractures. Severe injuries, however, affect less than three percent of e-scooter patients.
1. Introduction
Electric scooters (e-scooters) increasingly contribute to road traffic injuries worldwide, especially in urban areas. Consequently, many countries introduced new regulations and laws aiming at primary prevention, such as speed limits, no-parking zones, or mandatory helmet use. A few large cities have even prohibited sharing companies from offering rental e-scooters. One reason behind these measures were reports of severe injuries sustained in e-scooter accidents. However, the incidence and patterns of severe injuries have not yet been thoroughly investigated. Although several clinical studies have been published on e-scooter-associated injuries, most were monocentric, and the ones that were collected in the initial years of e-scooter use rely on relatively small samples. However, the number of publications on e-scooter-associated injuries has been increasing steadily over the past 10 years. Furthermore, we found eight systematic reviews that have been published on this topic [1,2,3,4,5,6,7,8]. However, most of them report data that have been published earlier than 2021 [1,4,7,8]. In most countries, e-scooter legislations was introduced between 2018 and 2021. Therefore, relatively few clinical studies have been published within the early years of e-scooter use and they usually rely on small samples. More recent systematic reviews included more studies but only report specific injury types [2,6] (e.g., maxillofacial injuries). Another more recent review compared electric bicycle injuries to e-scooter-related injuries [3]. The most recent meta-analysis, including 25 observational studies, was conducted with a similar approach to our work but focused on the incidence of upper-limb injuries and head trauma [5]. Moreover, the authors did not perform a quantitative analysis of injury severity due to insufficient data. Given the growing number of publications but still lacking a meta-analysis of the severity of e-scooter injuries, we reasoned that a comprehensive review and meta-analysis may significantly advance the current state of knowledge in this field and provide a robust prior probability for clinical management.
2. Materials and Methods
The primary objective was to characterize the types of injuries and the severity of injuries sustained in e-scooter accidents. Secondary objectives were patient characteristics, clinical treatment, risk factors, accident mechanisms, and the relative frequency of e-scooter patients who presented to an emergency department.
2.1. Search Strategy
The protocol for this review was prospectively registered in the international prospective register of systematic reviews (PROSPERO, CRD42024574738) on 30 November 2024. The described subgroup analysis comparing German to non-German samples was not performed due to an insufficient number of studies. Otherwise, the registered protocol was followed. The review was conducted in accordance with the Preferred Reporting Items for Systematic reviews and Meta-Analyses (PRISMA) [9] see Supplementary Materials. We searched the electronic bibliographic databases PubMed, EMBASE, and Medline via OVID. The results were filtered for publication date (in the last 5 years) and article language (English or German). The PubMed search strategy described in Table 1 was last searched on 24 July 2024. Additionally, the reference lists of included articles were searched for further publications. We included publications starting from July 2019, as small electric vehicles, including e-scooters, were first permitted to participate in German public road traffic at this time, followed thereafter by the majority of European countries introducing similar regulations.
Table 1.
PubMed search strategy.
2.2. Selection Criteria
First, we identified and removed duplicate records. Next, titles and abstracts were screened for eligibility, followed by a full-text review of the articles. To be included, the articles had to (1) examine the injuries of patients who presented to an emergency department following e-scooter accidents; (2) report e-scooter-specific data; and (3) have been published between July 2019 and July 2024 in a peer-reviewed journal. Articles were excluded if they: (1) did not report original data (e.g., comments, reviews, meta-analyses); (2) did not analyze clinical data (e.g., questionnaire studies, biomechanical analyses); (3) did not describe electric scooters (e.g., pedelecs, hoverboards, nonelectric scooters); (4) reported only single cases (case studies); or (5) described the study in an abstract only (e.g., conference abstracts). We did not exclude articles based on sample characteristics such as age, gender, nationality or any other demographic aspect. E-scooter riders, as well as other road users who were injured in an e-scooter accident (e.g., pedestrians, bicycle riders), were included.
2.3. Data Extraction
Two reviewers independently undertook the screening of articles, data extraction, and risk of bias assessment. For each included study, the following data were extracted: year of publication, first author, data collection period, study type, patient population, sample size, country and city, participant’s age, participant’s sex, helmet use, alcohol use, substance use, time of the accident (time of day, month, season), accident mechanism (e.g., fall, collision), injury severity, road users (e.g., e-scooter riders, pedestrians), injury type, clinical care, duration of inpatient treatment, mortality, and proportion of e-scooter patients among all presentations to an emergency department.
2.4. Risk of Bias
The bias potential of the included studies was evaluated using the Risk of Bias Tool by Hoy et al. [10], which was developed for assessing prevalence studies. Two reviewers assessed the risk of bias for each included publication across 10 domains. The resulting sum values corresponded to low, moderate or high risk of bias. The robvis tool [11] version 1.0 was utilized to visualize the individual risk of bias assessment for each study, as well as to generate a risk of bias summary table.
2.5. Statistical Analyses
If the variables were presented as proportions (e.g., frequency of injury types), the data from the individual studies were analyzed using a proportional meta-analysis. If the parameters were continuous (e.g., age), the particular values were combined using a meta-analysis of the arithmetic means. A random effects model and REML (restricted maximum likelihood) estimator were used for the pooled analysis. We conducted a sensitivity analysis to compare injury type and injury severity between studies with a low risk of bias and those that included all studies, in order to evaluate the effect of bias on study estimates. The statistical analysis was performed using STATA version 16.1 [12].
The heterogeneity of the results between individual studies was assessed via forest plots and I2 statistics. The following values were used as cutoffs for classifying heterogeneity [13]: I2 > 25% to ≤50%: low heterogeneity; I2 > 50% to ≤75%: moderate heterogeneity; and I2 > 75%: high heterogeneity.
The following body regions and injury types were reported in a sufficient number of studies for quantitative analyses: head/face, upper extremities, lower extremities, abdomen/thorax/torso, back/spine, severe traumatic brain injuries, and extremity fractures. Reports of intracranial hemorrhage and skull fractures were categorized as severe traumatic brain injuries. All fractures of the extremities were summarized under extremity fractures.
3. Results
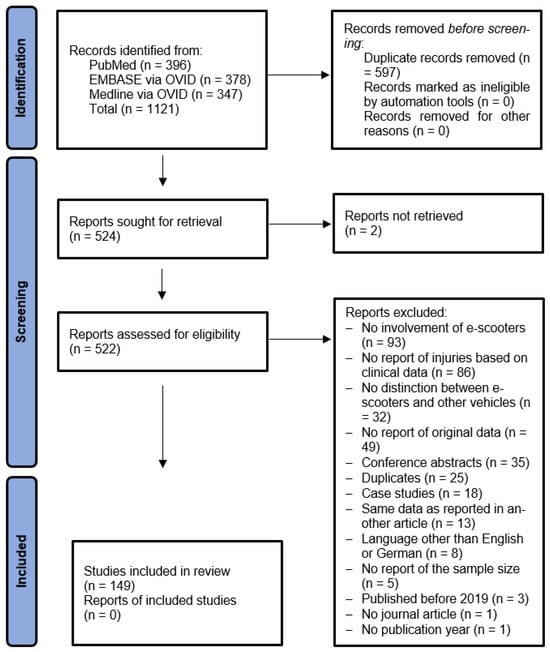
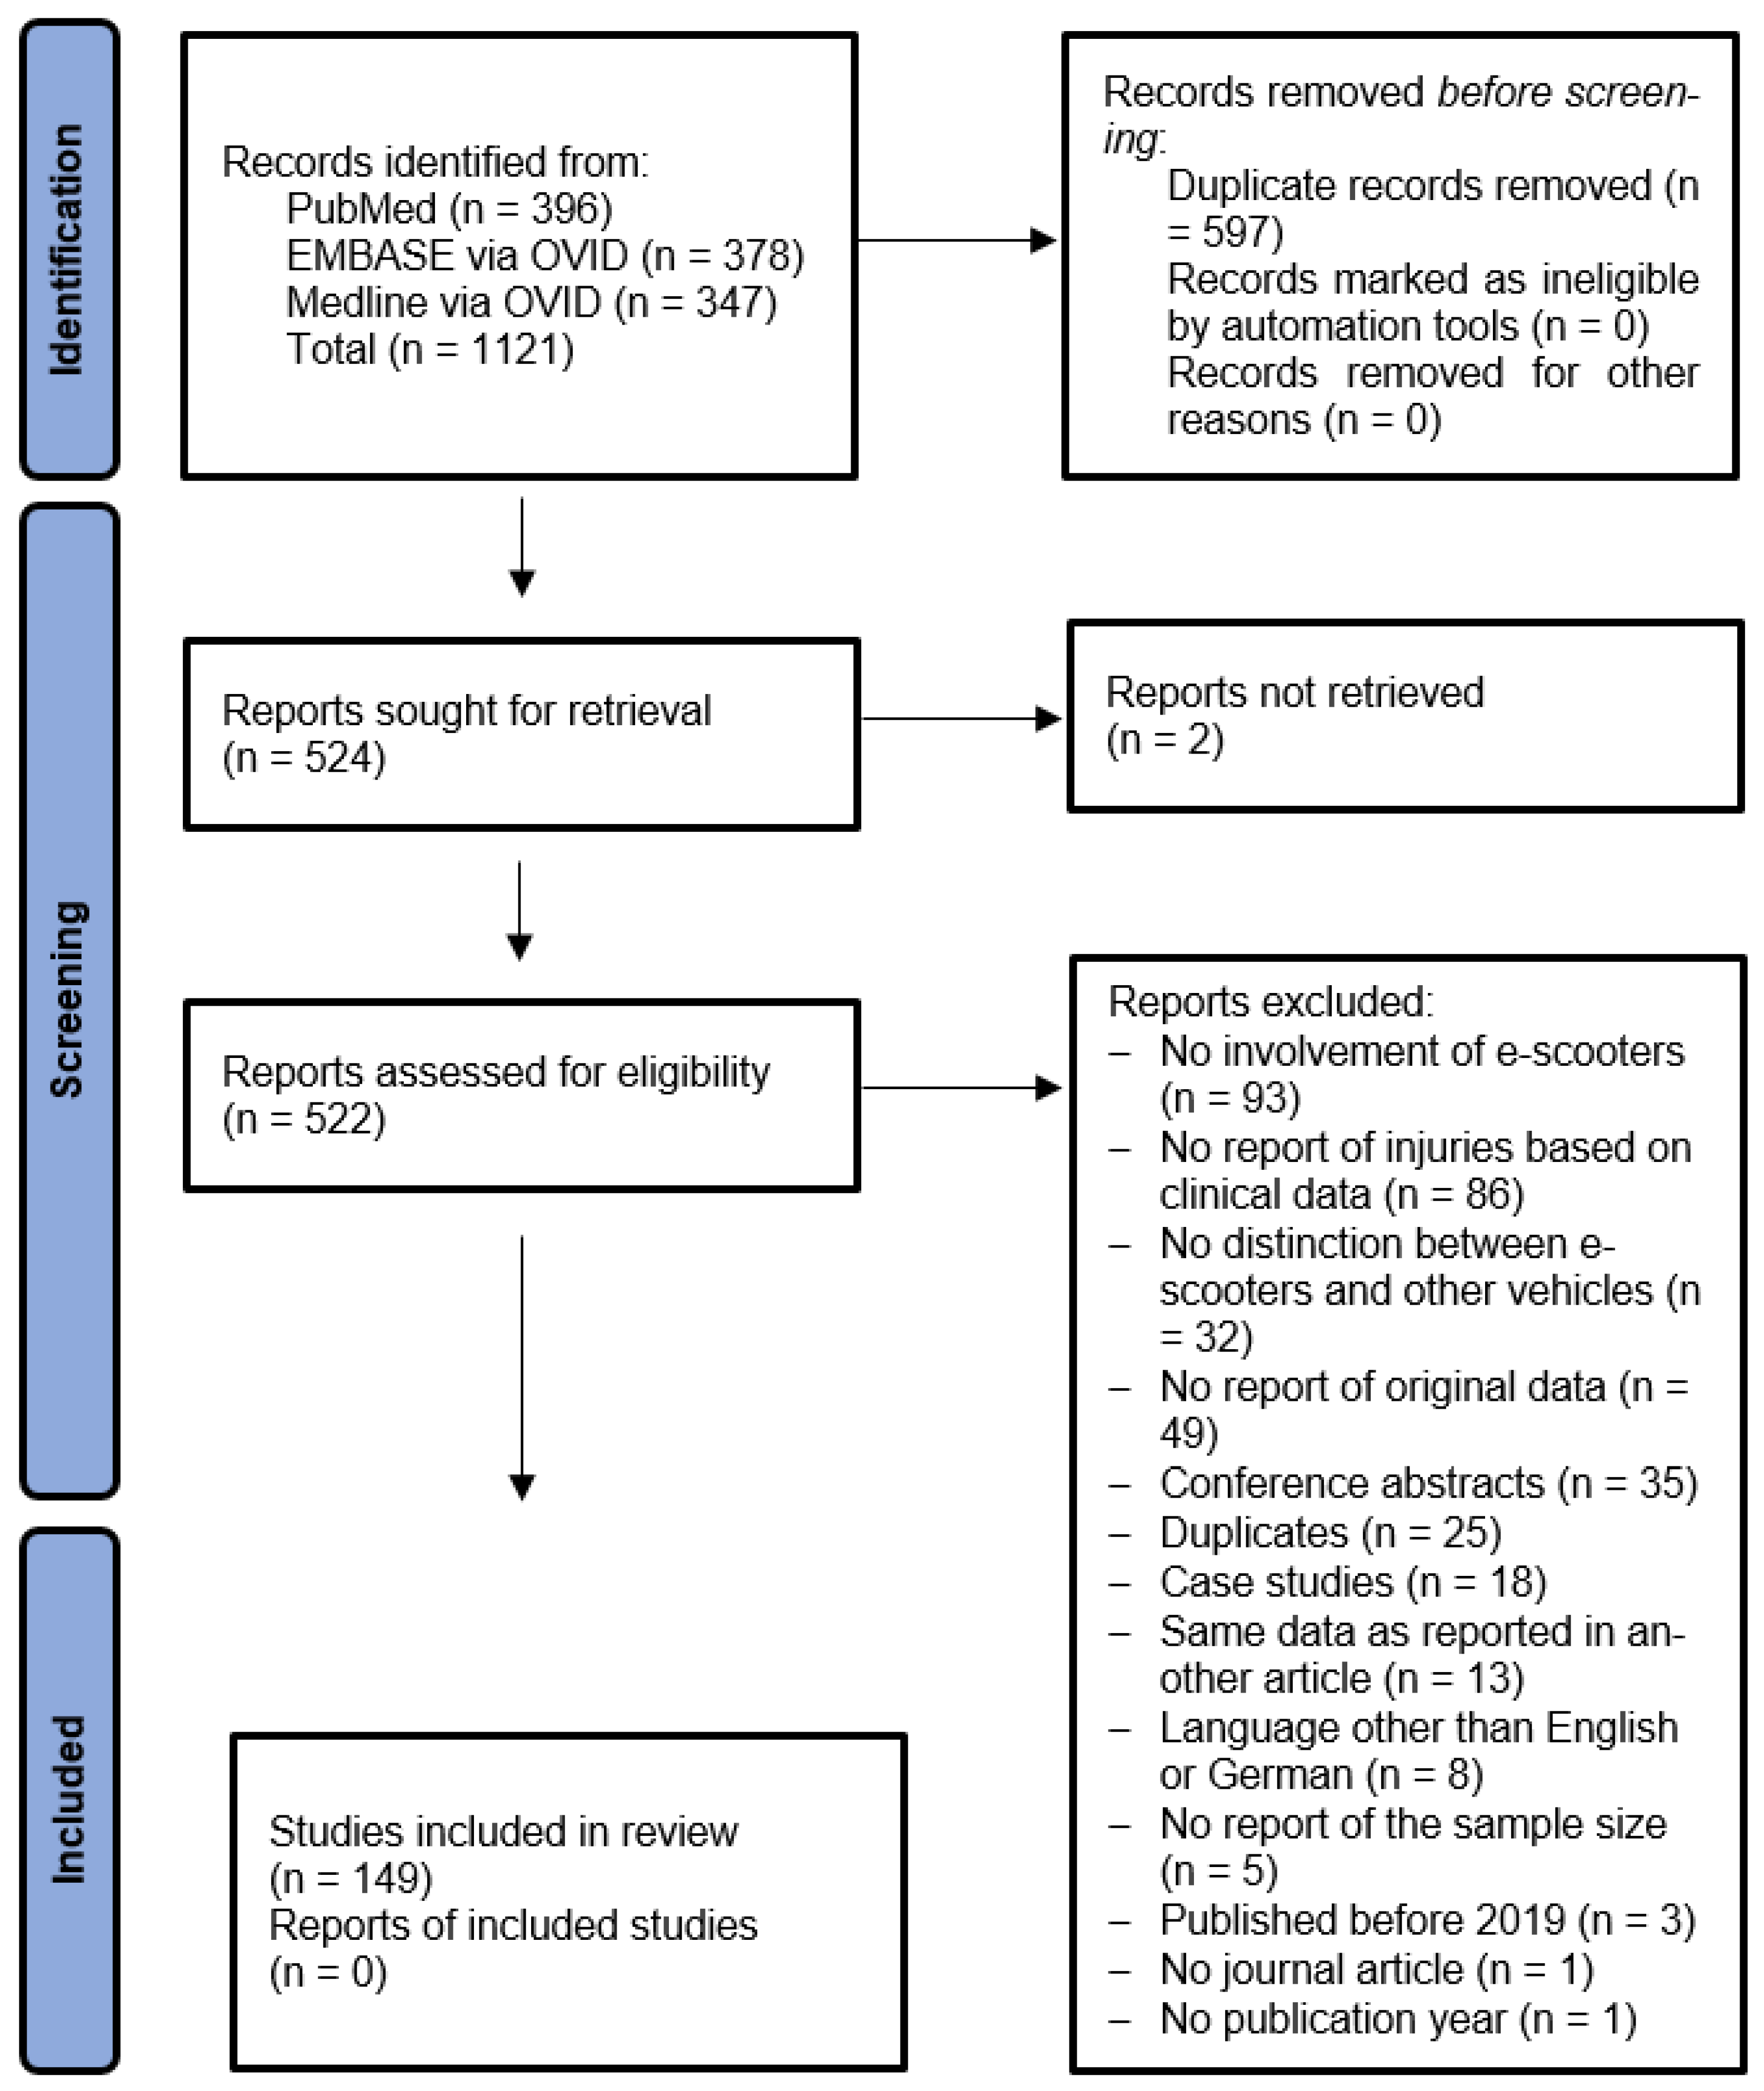
The automated search resulted in 524 unique records (see PRISMA flow chart, Figure 1). Following the manual screening of titles, abstracts and full texts, 149 articles met the inclusion criteria.
Figure 1.
PRISMA flow chart illustrating the identification and selection process.
Studies were eligible for quantitative analyses if the reported target population included patients with any type of e-scooter-associated injury. If the reported samples were restricted to certain injury types (e.g., maxillofacial injuries), the studies had to be excluded from the quantitative analyses. A total of 68 studies were eligible for quantitative analyses. The majority were retrospective cohort studies (76%, n = 52), followed by prospective cohort studies (16%, n = 11) and studies based on registry entries (7.3%, n = 5) (see Table 2).
Table 2.
Characteristics of the 68 studies included in the quantitative analyses.
3.1. Risk of Bias
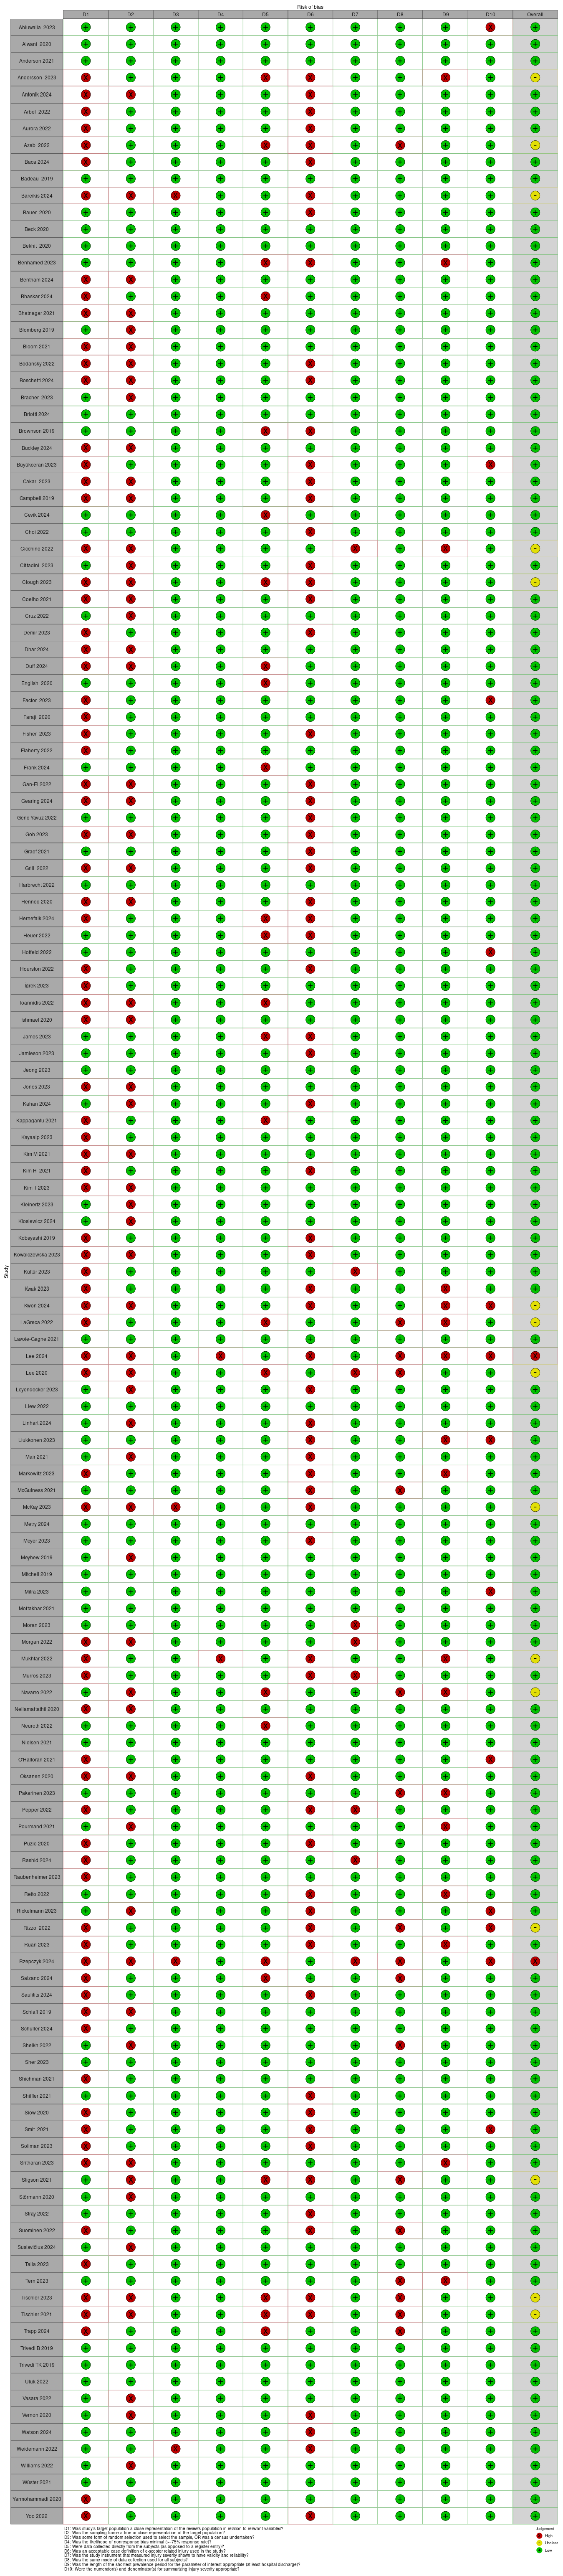
The risk of bias assessment revealed that 132 of the included 149 studies (89%) had a low risk of bias, 15 studies (10%) had a moderate risk of bias, and only two studies (1%) had a high risk of bias (see Figure 2). The individual risk of bias assessment for each study across the ten domains is presented in Figure A15.
Figure 2.
Risk of bias of the included studies.
Among the 68 studies included in the quantitative analyses, the proportions of studies with moderate risk of bias (n = 5; 7%) and high risk of bias (n = 0) were comparable. Accordingly, a sensitivity analysis yielded almost identical estimates for injury type and injury severity when comparing the analysis based on studies with a low risk of bias to the analysis that included all studies.
3.2. Injury Types
Based on 24 publications, the frequency of patients with head/face injuries varied between 21.8% and 58.1%. The pooled proportion of head/face injuries was 42.1% (95% CI 38.7–45.4). Indicating high heterogeneity, the variation between studies resulted in I2 = 84.9% (see Figure A1). Severe head injuries occurred with a pooled proportion of 2.3% (95% CI 1.6–3.0) of the patients. Among the 20 available studies, the frequency ranged from 0.4% to 7.4%, with moderate heterogeneity (I2 = 54.8%) (see Figure A2).
Twenty-one studies reported how many patients suffered injuries to the upper extremities and lower extremities. Injuries to the upper extremities were reported in 25.4% to 59.1% of the samples. In the random-effects model, a pooled estimate of 40.1% (95% CI 35.8–44.4) was determined for upper-extremity injuries (see Figure A3). Injuries to the lower extremities were documented less frequently, with a pooled proportion of 30.4% (95% CI 26.9–33.9). The proportions of the individual studies ranged from 17.4% to 47.5%. The large variability between the original studies resulted in an I2 of approximately 90% for both upper and lower extremities (see Figure A4).
Extremity fractures were documented in 16 studies, with a minimum of 11.5% and a maximum of 34.0%. Across all available studies, a pooled estimate of 25.7% (95% CI 22.5–28.9) was determined for extremity fractures. The heterogeneity was high, with an I2 of 77.8% (see Figure A5).
The categories abdomen/thorax/torso and back/spine were much less frequently affected by e-scooter-associated injuries. In the abdomen/thorax/torso region, the proportions ranged from 1.3% to 17.2% in 22 studies (see Figure A6). The pooled proportion was estimated at 6.6% (95% CI 5.0–8.3), with high heterogeneity (I2 = 86.8%). The pooled proportion of patients with injuries to the back or spine was only 1.7% (95% CI 1.0–2.4). The frequency varied between 0.4% and 6.8%. The heterogeneity for the back/spine region was considered moderate (I2 = 59.8%, see Figure A7).
A summary of the pooled proportions of affected body regions and injury types can be found in Table 3.
Table 3.
Affected body regions and injury types—summary.
3.3. Severity of Injuries
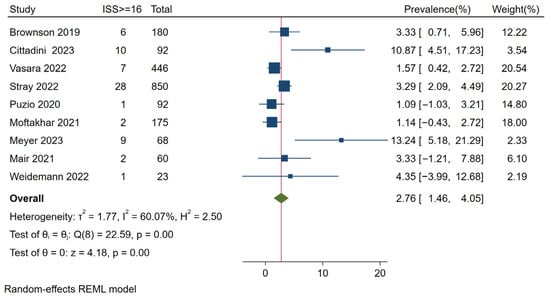
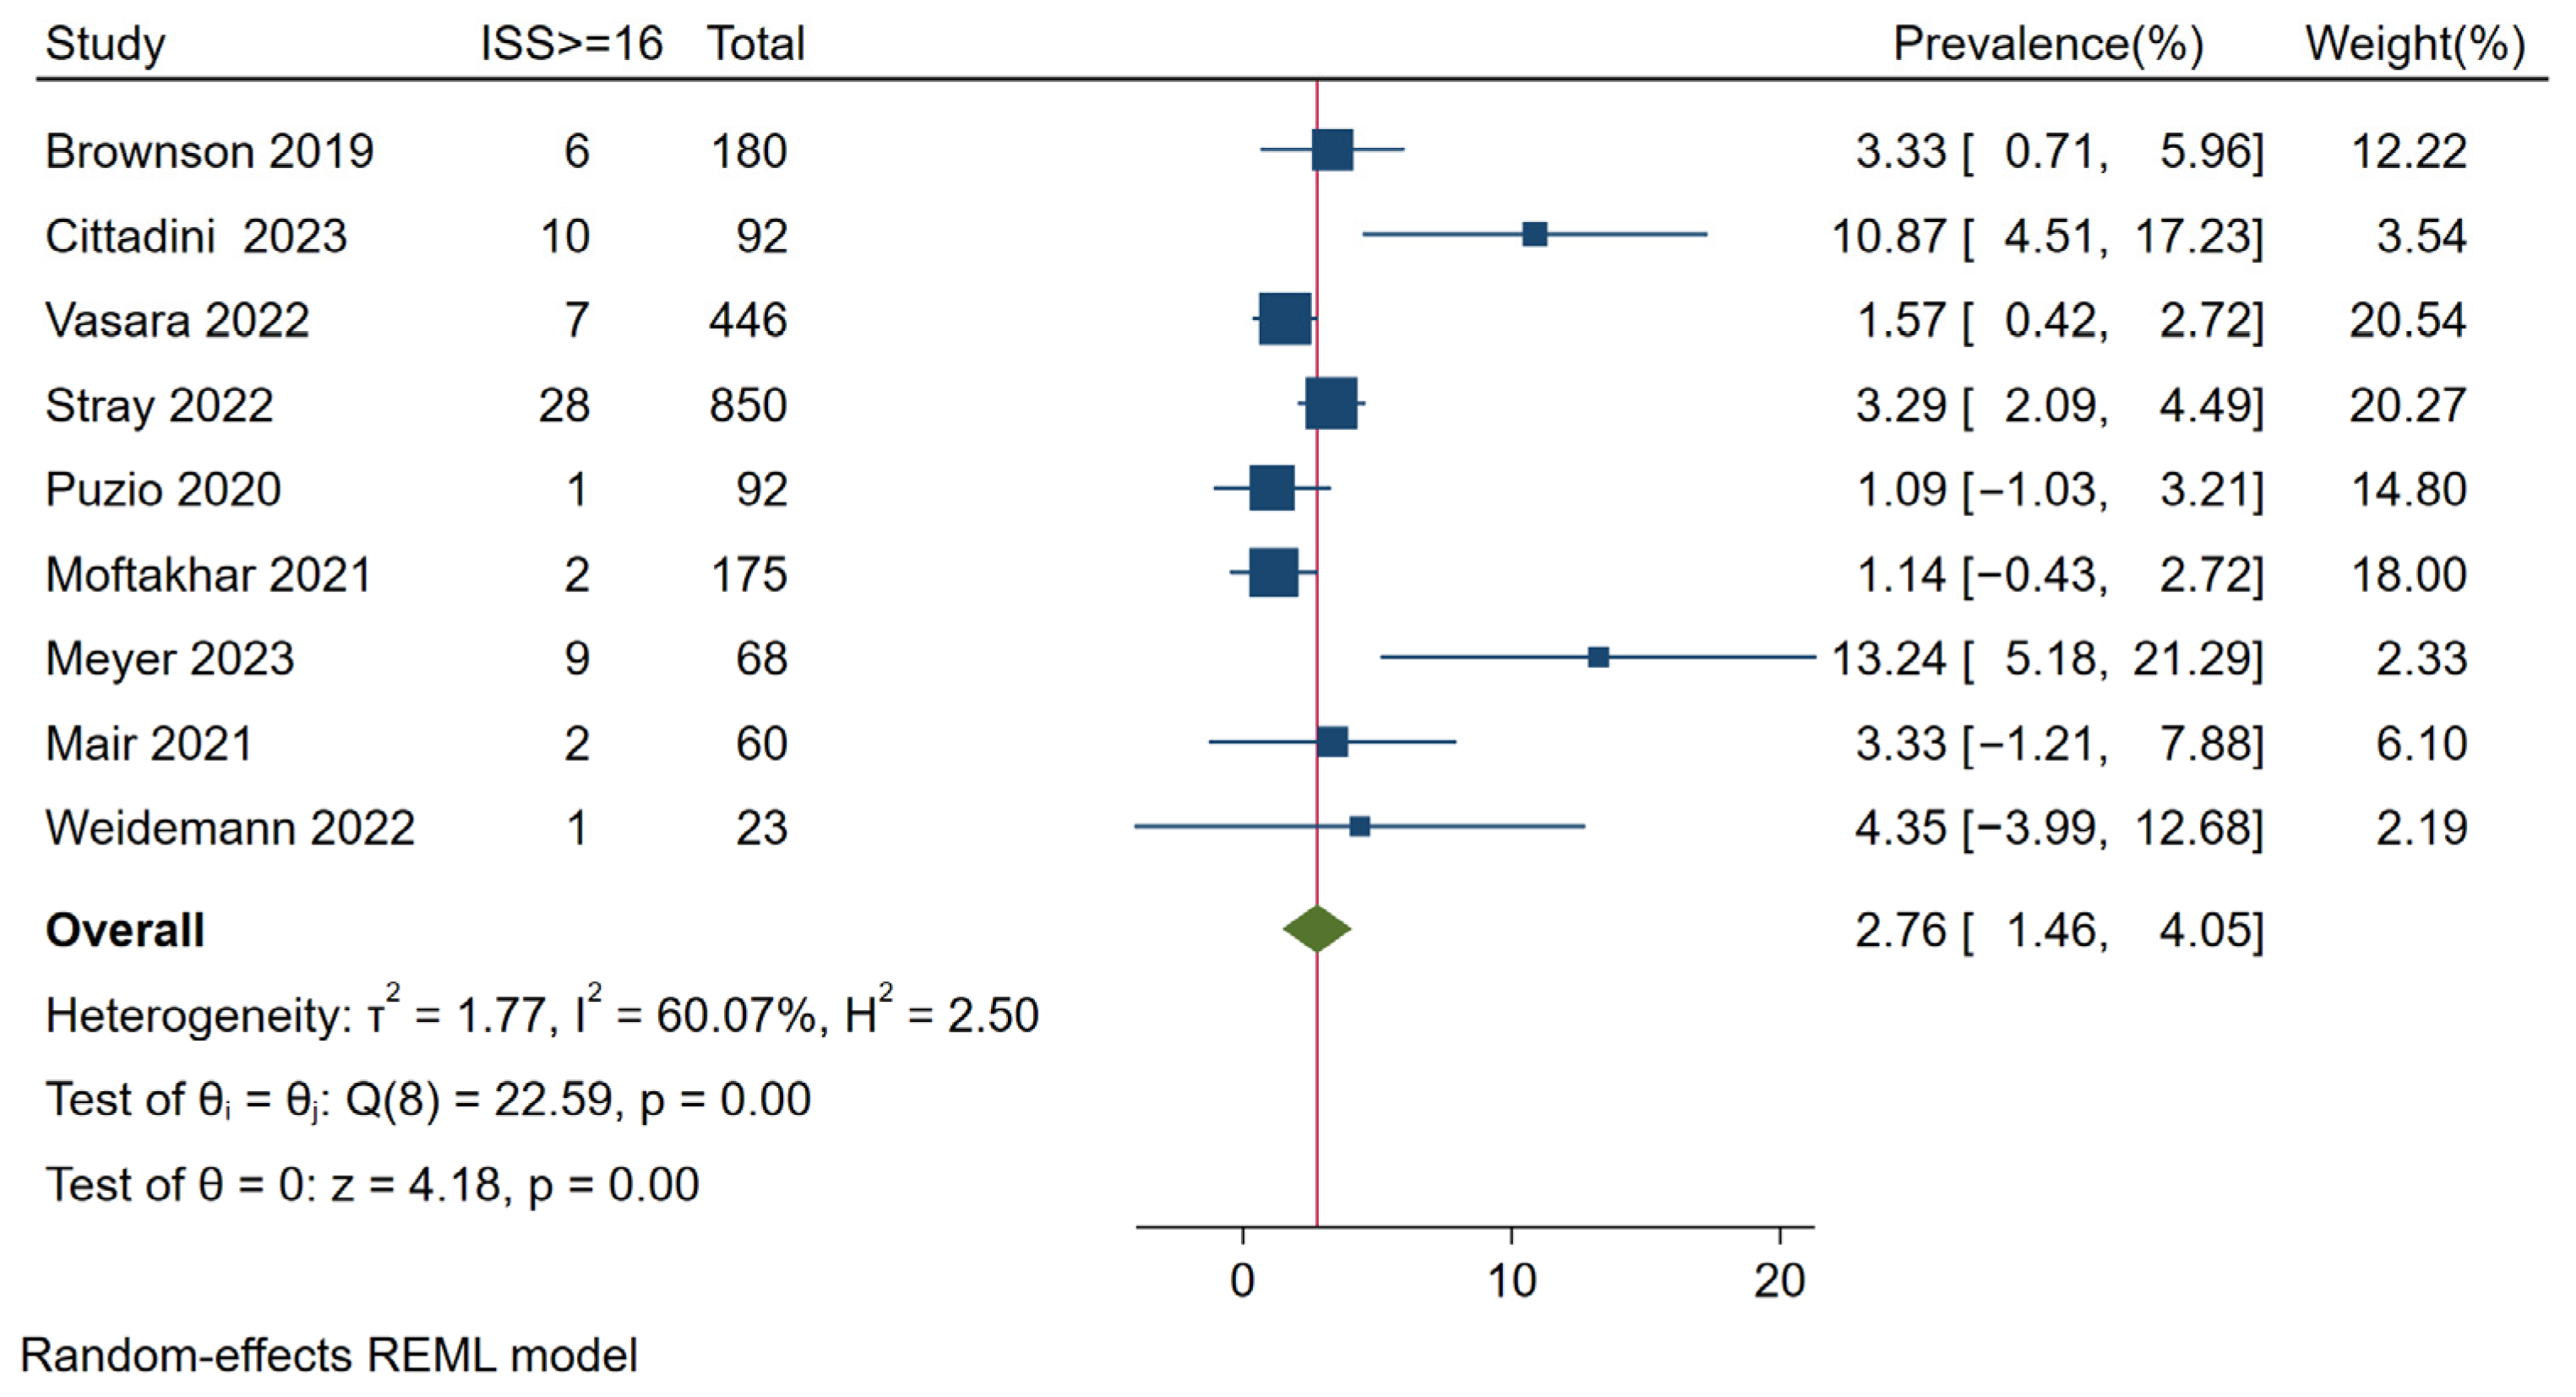
The originally planned analysis of the mean/median Injury Severity Score (ISS) could not be conducted because of a lack of the respective ISS parameters reported in the original studies. Nine original studies presented ISS results in a categorized format, primarily ISS < 16 vs. ISS ≥ 16. Therefore, we focused the analysis on patients with an ISS ≥ 16, referring to the proportion of seriously injured patients [82]. The proportion of seriously injured patients ranged from 1.1% to 13.2%. Notably, seven of nine studies reported that fewer than 5% of the patients were seriously injured, whereas the other two studies reported proportions of 10.9% and 13.2%. The pooled proportion of patients with an ISS ≥ 16 was 2.8% (95% CI 1.5–4.1). The heterogeneity was moderate (I2 = 60.0%) (see Figure 3).
Figure 3.
Proportion of patients with ISS ≥ 16. The blue square represents the study-specific prevalence, the horizontal line represent its 95% confidence interval. The green diamond represents the pooled prevalence across all studies, also indicated by a red vertical line. Included articles: Brownson 2019 [78], Cittadini [28], Vasara [55], Stray 2022 [53], Puzio [73], Moftakhar 2021 [62], Meyer 2023 [34], Mair 2021 [61], Weidemann 2022 [56].
3.4. Clinical Treatment
In 49 studies, the proportion of hospitalized patients ranged from 2% to 70.6%. The pooled proportion of patients who received inpatient treatment was 18.6% (95% CI 15.0–22.1). The heterogeneity was high (I2 = 98.0%). The pooled proportion of patients treated in an intensive care unit was 1.2% (95% CI 0.8–1.7) (see Figure A8).
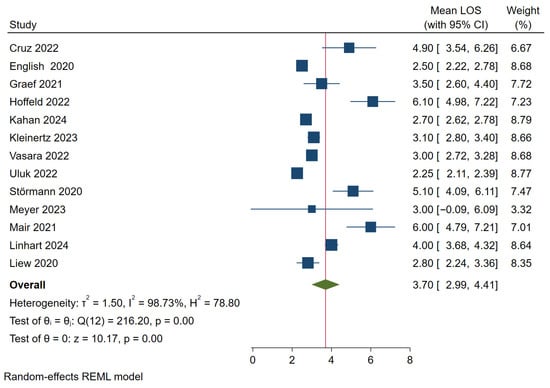
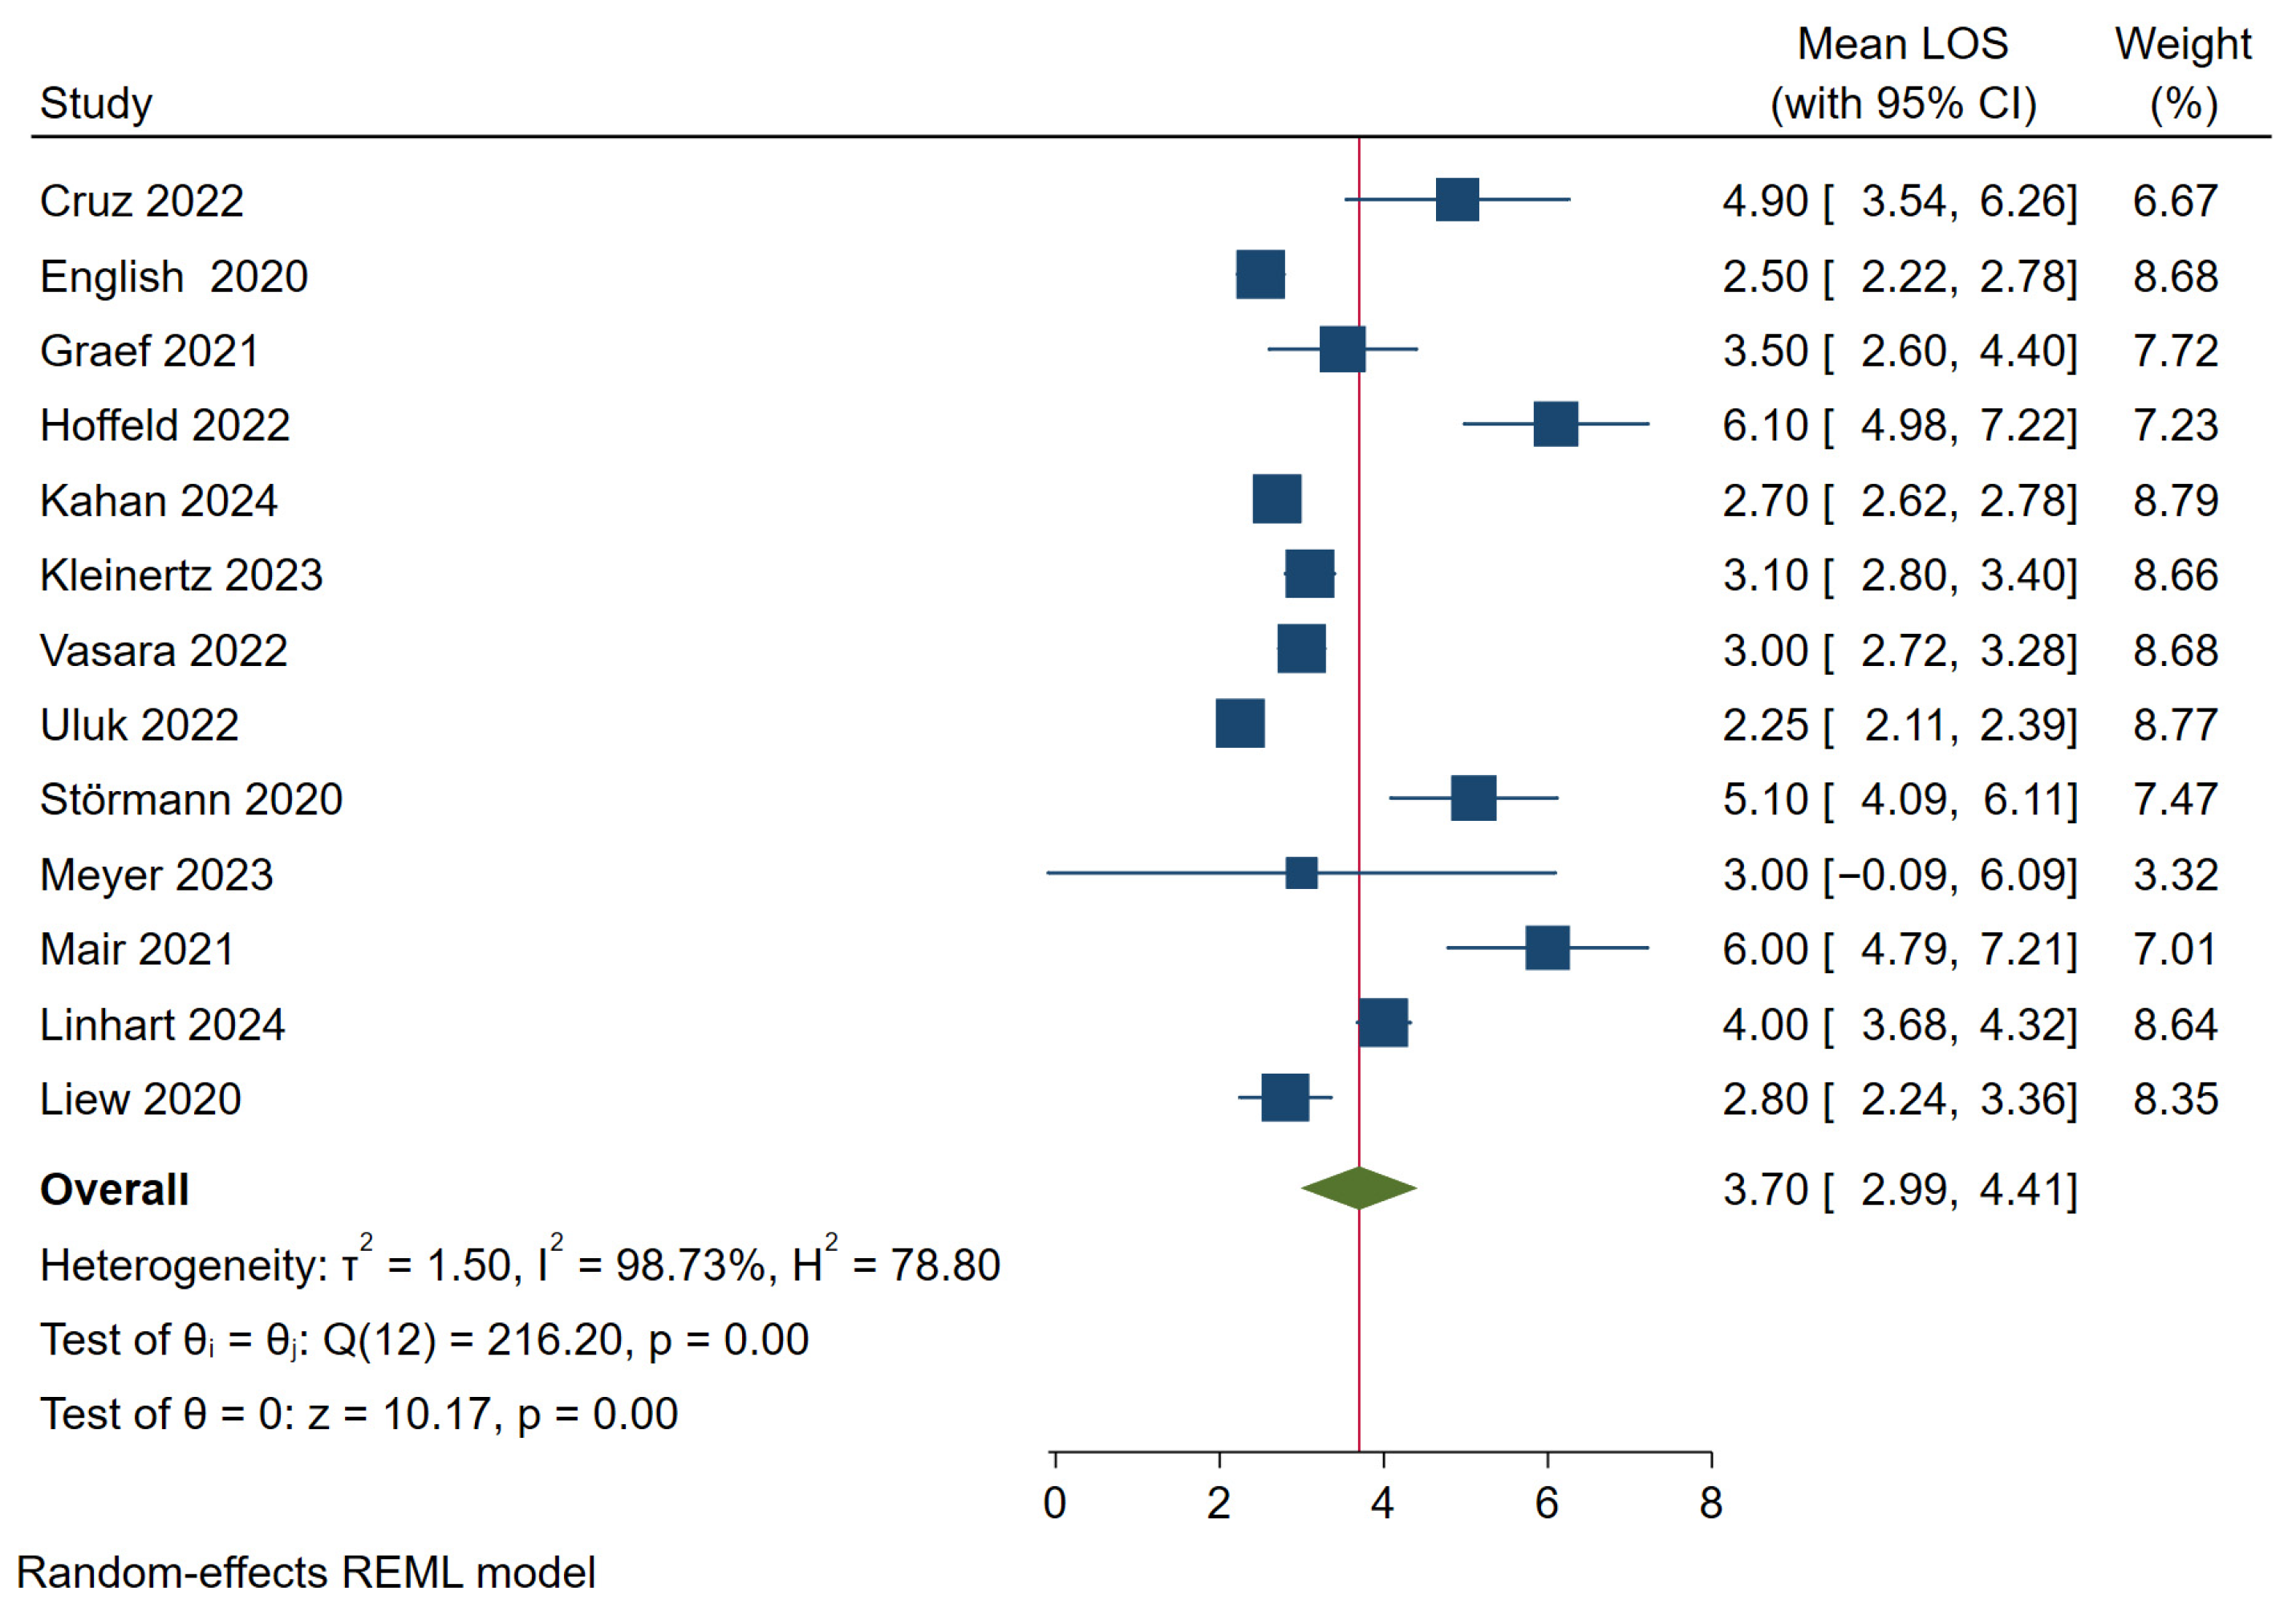
The average length of hospital stay ranged between 2.2 days and 6.1 days. The pooled estimate was 3.7 days (95% CI 3.0–4.4). The wide range between studies was reflected in an I2 of 98.7% (see Figure 4).
Figure 4.
Proportion of hospitalized patients. The blue square represents the study-specific arithmetic mean, the horizontal line represent its 95% confidence interval. The green diamond represents the pooled arithmetic mean estimate across all studies, also indicated by a red vertical line. Included articles: Cruz 2022 [43], Englisch 2020 [71], Graef 2021 [60], Hoffeld 2022 [48], Kahan 2024 [17], Kleinertz 2023 [31], Vasara 2022 [55], Uluk 2022 [54], Störmann 2020 [74], Meyer 2023 [34], Mair 2021 [61], Linhart 2024 [20], Liew 2020 [72].
3.5. Patient Characteristics
On the basis of 67 studies, the pooled proportion of male patients was estimated at 61.4% (95% CI 59.2–63.5). The individual proportions of male patients varied between 33.9% and 83.1%, resulting in high heterogeneity (I2 = 90.1%, see Figure A9). The mean age reported in 46 studies ranged from 25.3 to 41.8 years. The pooled estimate was 32.3 years (95% CI 31.1–33.5). The heterogeneity between the individual study results was high (I2 = 97.2%, see Figure A10). Approximately half of the analyzed studies were conducted in European countries (35 of 68, 51.5%). Nineteen studies (27.9%) were conducted in the USA or Canada, ten (14.7%) in Australia or New Zealand, three (4.4%) in South Korea, and one (1.5%) in Singapore (see Table 2).
3.6. Wearing a Helmet and Alcohol Intoxication
The proportion of patients wearing a helmet was reported in 46 studies. However, for the majority of the patients (in some studies, even more than 90%), no information was available on whether the patient was wearing a helmet. A large variation between the individual studies was evident in the forest plot. In 41 of 46 studies, fewer than one in seven patients wore a helmet. The other five studies reported significantly higher proportions, and in two studies, the reported proportion of patients wearing helmets even exceeded 50% of the sample. Consequently, the heterogeneity reached a maximum of I2 = 100%. Owing to the very heterogeneous individual results, the estimated proportion of 8.4% (95% CI 4.7–12.1) must be interpreted with caution (see Figure A11).
The proportion of patients intoxicated with alcohol was reported in 40 publications. Similar to the helmet wearing rate, for approximately 80% of patients, no information was available on alcohol consumption. The variance between studies was high, ranging from 2.9% to 72.2%. Owing to the high heterogeneity (I2 = 96.2%), the pooled estimate of 27.0% (95% CI 22.0–32.0) is of limited significance when determining how frequently e-scooter patients have been injured under the influence of alcohol (see Figure A12).
3.7. Accident Mechanisms
Thirty-one studies provided information on whether the accident was a single-vehicle accident or whether other road users were involved. The majority of at least 61.9% up to 98.6% were involved in single-vehicle accidents. Across all studies, the pooled estimate was 88.7% (95% CI 86.3–91.2). With an I2 of 91.1%, the heterogeneity was high (see Figure A13). In 86.2% to 100% of the reported cases, the accident victims were e-scooter riders. The pooled proportion of e-scooter riders among all patients was estimated at 95.7% (95% CI 94.3–97.0), with high heterogeneity (I2 = 100%) (see Figure A14). The remaining patients presenting at the emergency room were almost exclusively pedestrians.
The majority of accidents occurred during spring, summer, and autumn as well as on weekends and at night. However, owing to very heterogeneous documentation, a quantitative analysis of the season, day of the week, and time of day was not possible.
3.8. Frequency of E-Scooter Injuries
In 2020, a study from three London hospitals reported that 1.6% (83 out of 5177) of referrals to the orthopedic department were associated with e-scooter accidents [43]. In a single-center study from Turkey covering 2021 to 2022, the proportion of referrals due to fractures caused by e-scooter accidents among all referrals to the emergency orthopedic department was 0.8% (56 out of 6881) [83]. In a Berlin hospital in 2019, 43 (0.5%) of the 9366 patients who presented to the emergency department were affected by e-scooter accidents [67]. In a dataset from 2018 of patients from two hospitals in Indiana, USA, 0.3% (92 out of 742) of all emergency room visits were caused by e-scooter accidents [68]. However, as the two-month study period was during the fall, the authors assume that this percentage was underestimated. An evaluation of the Swedish STRADA database, which documents injuries from traffic accidents, revealed that in the summer months of 2019, 14% of all emergency room visits associated with traffic accidents were related to e-scooters [25]. With 15% of all emergency room visits in the summer months of 2019 and 2020, very similar ratios were reported in Calgary [52]. A quantitative analysis of the relative frequency of e-scooter injuries was not possible due to a lack of sufficient data.
4. Discussion
E-scooter-associated injuries are an ongoing subject of public debate and clinical research. The aim of this systematic review and meta-analysis was to synthesize the published evidence on injury patterns, injury severity, clinical treatment, patient characteristics, risk factors, accident mechanisms, and the relative frequency of e-scooter patients who presented to an emergency department.
4.1. Injury Types
E-scooter patients who present to an emergency department are most commonly diagnosed with injuries to the head and face as well as the upper extremities. Injuries to the lower extremities were less frequently observed. The abdomen and thorax are rarely affected by e-scooter accidents, and the back and spine are even less affected. These findings correspond with the results of previously published systematic reviews that reported most e-scooter-related injuries as involving the upper extremities as well as the head and face [5,7]. It has been assumed that injuries to the upper extremities are often caused by extending the arms during a fall. Injuries to the face and head, on the other hand, occur when the arm’s extension reflexes cannot prevent the head from hitting an object or the ground. Although the lower extremities are affected less frequently, almost every third patient was diagnosed with injuries to the legs and feet.
It needs to be noted, that a high degree of variability in the proportions of specific injury types was observed across most entities, indicated by an I2 greater than 75% for head/face injuries, upper- and lower-extremity injuries, extremity fractures, and abdomen/thorax/torso injuries. This large variation probably originates, among other factors, from varying infrastructures, legislations, and healthcare systems in the countries where the studies were conducted. Therefore, the point estimates for the observed proportions should always be interpreted in conjunction with the confidence interval.
One in four patients presented with extremity fractures. Thus, extremity fractures, mainly fractures of the upper extremities, are a common and relevant consequence of e-scooter-related accidents. Other common e-scooter-associated fractures affect the facial bones. The proportion of patients with facial bone fractures could not be estimated quantitatively because of a lack of available data. However, maxillofacial fractures are reported frequently and should be considered a relevant consequence of e-scooter accidents.
Severe traumatic brain injuries occurred in approximately two percent of all patients. Notably, serious brain injuries might be more common in e-scooter accidents than bicycle accidents [84,85]. Possible explanations are e-scooter-specific accident mechanisms and risk factors such as riding under the influence of alcohol and without a helmet. Alcohol reduces the reaction times and reflexes in the event of a fall. Therefore, it has been assumed that alcohol consumption results in fewer limb injuries and more head injuries [31,86]. Furthermore, e-scooter riders are less likely to wear a helmet than cyclists are, which poses further risks of serious brain injuries [3].
4.2. Injury Severity
The Injury Severity Score (ISS) was the most commonly reported measure of injury severity. With an ISS of at least 16, the proportion of seriously injured patients was less than three percent. A more detailed analysis of the ISS parameters was not possible due to a lack of consistent data. However, the relatively small proportion of severely injured patients indicates that most e-scooter patients who present to the emergency departments have minor or moderate injuries.
4.3. Clinical Care
Among all patients who presented to an emergency department, less than twenty percent were admitted to the ward. However, the study results were highly heterogeneous, indicating that regional or international differences might have caused varying admission rates (e.g., bed capacities, hospital densities, or the availability of outpatient services). Among all e-scooter patients registered in the emergency department, only one percent was treated in an intensive care unit.
The average length of hospital stay across all available studies was almost four days. However, the variation between studies was considerably high. The length of hospital stay might also be influenced by health care parameters such as bed capacities, billing systems, or health insurance.
4.4. Patient Characteristics
With sixty-one percent, the gender of e-scooter patients was predominantly male. The observed gender ratio corresponds with an overall greater proportion of male e-scooter riders [87] and a greater proportion of males who sustain injuries in accidents [88]. E-scooter patients who presented to the emergency departments were, on average, 32 years old. Research on patients who sustained injuries in bicycle accidents suggests that e-scooter patients are significantly younger than injured cyclists [3].
With regard to both patient characteristics, gender and age, the between study-heterogeneity was very high, with an I2 greater than 90%. This indicates substantial variability in age distribution and gender proportions across the individual studies.
4.5. Accident Mechanisms
With ninety-six percent of all patients, the accident victims were almost exclusively e-scooter riders. Other injured road users were pedestrians, cyclists, and passengers (co-riders). Pedestrians accounted for the largest proportion of injured non-riders. However, they made up for less than five percent of all e-scooter-injured patients. Due to unclear sample selection in some studies, the number of injured non-riders might be slightly underestimated, which most likely contributed significantly to the observed maximum heterogeneity, with an I2 of 100%. Nevertheless, riders apparently have a much higher risk of being injured in e-scooter accidents than pedestrians or cyclists. Among the injured e-scooter riders, nearly ninety percent suffered a single-vehicle accident (i.e., an accident not involving other road users). The most common accident mechanisms were falls, followed by collisions with stationary objects. The high rate of single-vehicle accidents and the proportion of falls as the most common accident mechanism were in accordance with findings of previous systematic reviews [5,7].
4.6. Risk Factors
Approximately one-quarter of the e-scooter patients were reportedly intoxicated with alcohol. However, the results must be interpreted with caution because of a high rate of missing values. Furthermore, most available data were based on self-reports or subjective external assessments, and blood alcohol levels were reported in only a minority of publications. The proportion of alcohol-intoxicated e-scooter patients might be lower than the results of retrospective clinical studies suggest. For comparison, fifteen percent of e-scooter accident victims had increased blood alcohol levels according to German police reports [89]. Nevertheless, police reports confirm that e-scooter riders were significantly more often intoxicated with alcohol than injured cyclists. In the future, prospective clinical studies are necessary to investigate the incidence of alcohol intoxication as well as correlations between enhanced blood alcohol levels and the frequency of severe injuries.
Another proposed risk factor for severe brain injuries has been the low rate of helmet use among e-scooter riders. On average, less than ten percent of the injured e-scooter riders reportedly wore a helmet at the time of the accident. However, an average of eighty percent missing values limits the significance of the results. Furthermore, we assume the high heterogeneity was partly attributable to helmet legislations. In countries that require helmet wearing, more than half of the injured e-scooter riders wore helmets [15,29]. Thus, mandatory helmet use increases the probability of helmet wearing and as a result might reduce the incidence of severe brain injuries. Moreover, riding bans at night-time have been suggested to prevent severe injuries caused by poor visibility at night and riding under the influence of alcohol. In the future, prospective clinical studies are necessary to investigate the incidence of helmet use as well as correlations between helmet use and the frequency of severe head injuries.
4.7. Frequency of E-Scooter Injuries
In two publications, the proportion of e-scooter patients was reported in relation to the total number of patients who presented to the emergency department [67,68]. The proportion of e-scooter patients was 0.3% and 0.5%, respectively. However, the data were collected in the early years of e-scooter legalization (2018–2022). Given the increasing number of e-scooter users, the relative frequency of e-scooter patients might have increased in recent years. The proportion of e-scooter patients among the total number of patients treated in the same facility is a useful indicator of the impact that e-scooters have on health care services. In addition to the total number of emergency department visits, subgroups of patients with relevant injuries (e.g., upper extremity fractures) might serve as a reference group to describe the relative frequency of e-scooter patients in future studies.
4.8. Limitations
The large variation across the original studies in reporting the injury types made it difficult to group injury patterns. Some injuries were described using a variety of symptoms, leaving only a few options for creating categories (e.g., traumatic brain injuries). In most studies that reported the ISS, the results were described only briefly, or the reported statistical parameters were not sufficiently consistent to allow for merging of the original study results. Therefore, we were not able to analyze average ISS scores as originally planned. The results concerning risk factors for severe injuries, such as alcohol intoxication or riding without a helmet, were of limited significance due to high rates of missing values and subjective methods. To overcome these limitations, the influence of risk factors on e-scooter injuries should be studied in prospective designs.
A limitation when interpreting the results was the high heterogeneity observed in most proportion analyses. Partly, the large variance between the individual study results might be attributed to differences between regions or countries with varying infrastructures, legislations, and health care systems. Furthermore, the documentation in the original studies did not permit an analysis of the relationship between e-scooter type and the frequency and severity of injuries. Therefore, we were unable to examine the influence of maximum speed, the weight of the e-scooter, motor power, or wheel size.
5. Conclusions
Extremity fractures and severe traumatic brain injuries are among the most relevant consequences of e-scooter accidents. However, the majority of patients treated in the emergency departments sustained minor injuries and only less than three percent were classified as severely injured. Nevertheless, the increasing use of e-scooters leads to more accidental injuries, additional visits to the emergency departments, and hospital admissions. More prospective studies are needed to identify risk factors that increase the likelihood of severe e-scooter injuries.
Supplementary Materials
The following supporting information can be downloaded at https://www.mdpi.com/article/10.3390/jcm15062154/s1, PRISMA 2020 Checklist.
Author Contributions
Conceptualization, W.K., A.H., and J.S.; methodology, A.H.; formal analysis, A.H.; writing—original draft preparation, W.K.; writing—review and editing, A.H., H.B.H.V., C.P., G.O., and J.S.; visualization, A.H.; supervision, J.S., G.O., and C.P.; project administration, H.B.H.V.; funding acquisition, J.S. All authors have read and agreed to the published version of the manuscript.
Funding
This research was funded by Björn-Steiger Stiftung, a non-profit organization with the objective of improving emergency assistance and rescue services in Germany (https://www.steiger-stiftung.com/). The APC was funded by Björn-Steiger Stiftung.
Institutional Review Board Statement
Not applicable (review article).
Informed Consent Statement
Not applicable (review article).
Data Availability Statement
The data presented in this study are available on request from the corresponding author.
Conflicts of Interest
The authors declare no conflicts of interest. The funder had no role in the collection, analyses, or interpretation of data or in the writing of the manuscript or he decision to publish the results.
Abbreviations
The following abbreviations are used in this manuscript:
| CI | Confidence interval |
| e-scooter | Electric scooter |
| I2 | Measure of between-study heterogeneity |
| N | Number |
| ISS | Injury Severity Score |
| PRISMA | Preferred Reporting Items for Systematic reviews and Meta-Analyses |
| PROSPERO | International prospective register of systematic reviews |
| % | Percentage |
Appendix A. Additional Forest Plots and Risk of Bias Assessment
Figure A1.
Proportion of patients with head or face injuries. The blue square represents the study-specific prevalence, the horizontal line represent its 95% confidence interval. The green diamond represents the pooled prevalence across all studies, also indicated by a red vertical line. Included articles: Ahluwalia 2023 [24], Alwani 2020 [68], Anderson 2021 [58], Beck 2020 [69], Bekhit 2020 [70], Blomberg 2019 [77], Cevik 2024 [15], English 2020 [71], Gan-El 2022 [44], Harbrecht 2022 [46], Hoffeld 2022 [48], Vasara 2022 [55], Uluk 2022 [54], Trivedi 2019 [80], Stray 2022 [53], Stigson 2021 [66], Pourmand 2021 [64], Pakarinen 2023 [37], Nielsen 2021 [63], Moran 2023 [36], Moftakhar 2021 [62], Meyer 2023 [34], Klosiewicz 2024 [19], Trivedi 2019 [81].
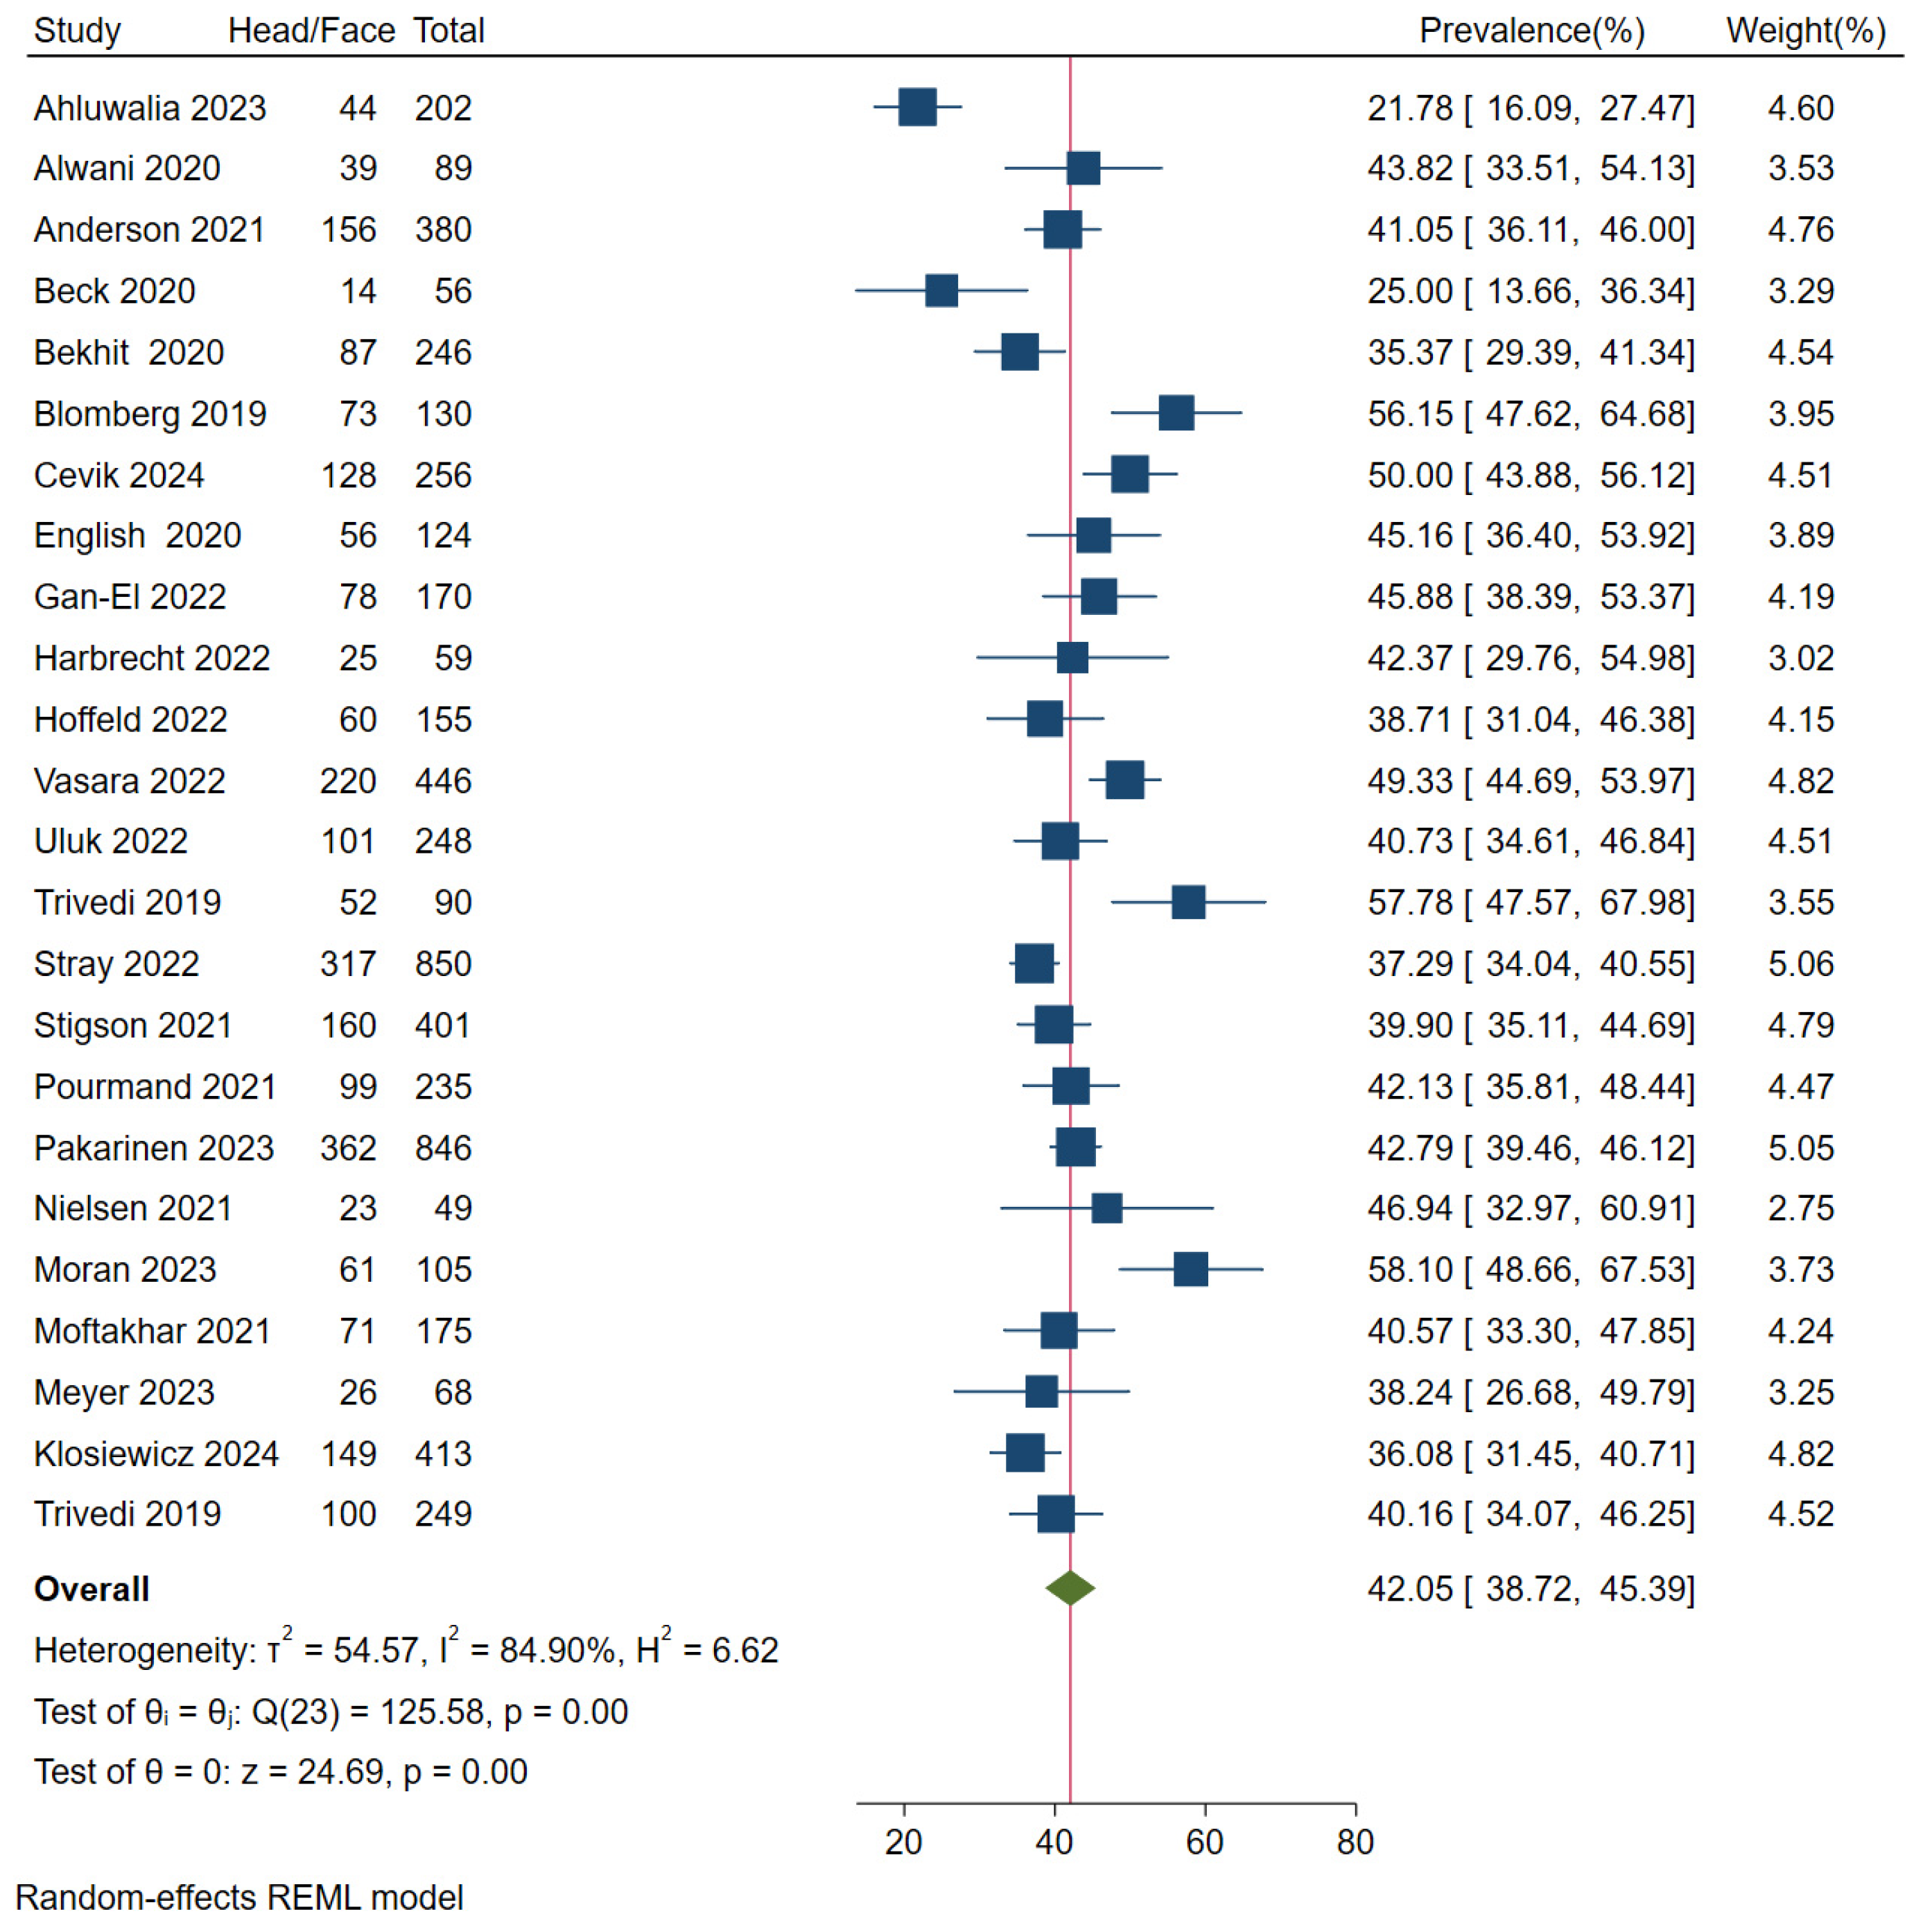
Figure A2.
Proportion of patients with severe traumatic brain injuries. The blue square represents the study-specific prevalence, the horizontal line represent its 95% confidence interval. The green diamond represents the pooled prevalence across all studies, also indicated by a red vertical line. Included articles: Ahluwalia 2023 [24], Alwani 2020 [68], Beck 2020 [69], Blomberg 2019 [77], Cevik 2024 [15], English 2020 [71], Harbrecht 2022 [46], Hoffeld 2022 [48], Kleinertz 2023 [31], Vasara 2022 [55], Uluk 2022 [54], Trivedi 2019 [80], Störmann 2020 [74], Puzio 2020 [73], Nielsen 2021 [63], Moran 2023 [36], Moftakhar 2021 [62], Meyer 2023 [34], Klosiewicz 2024 [19], Trivedi 2019 [81].
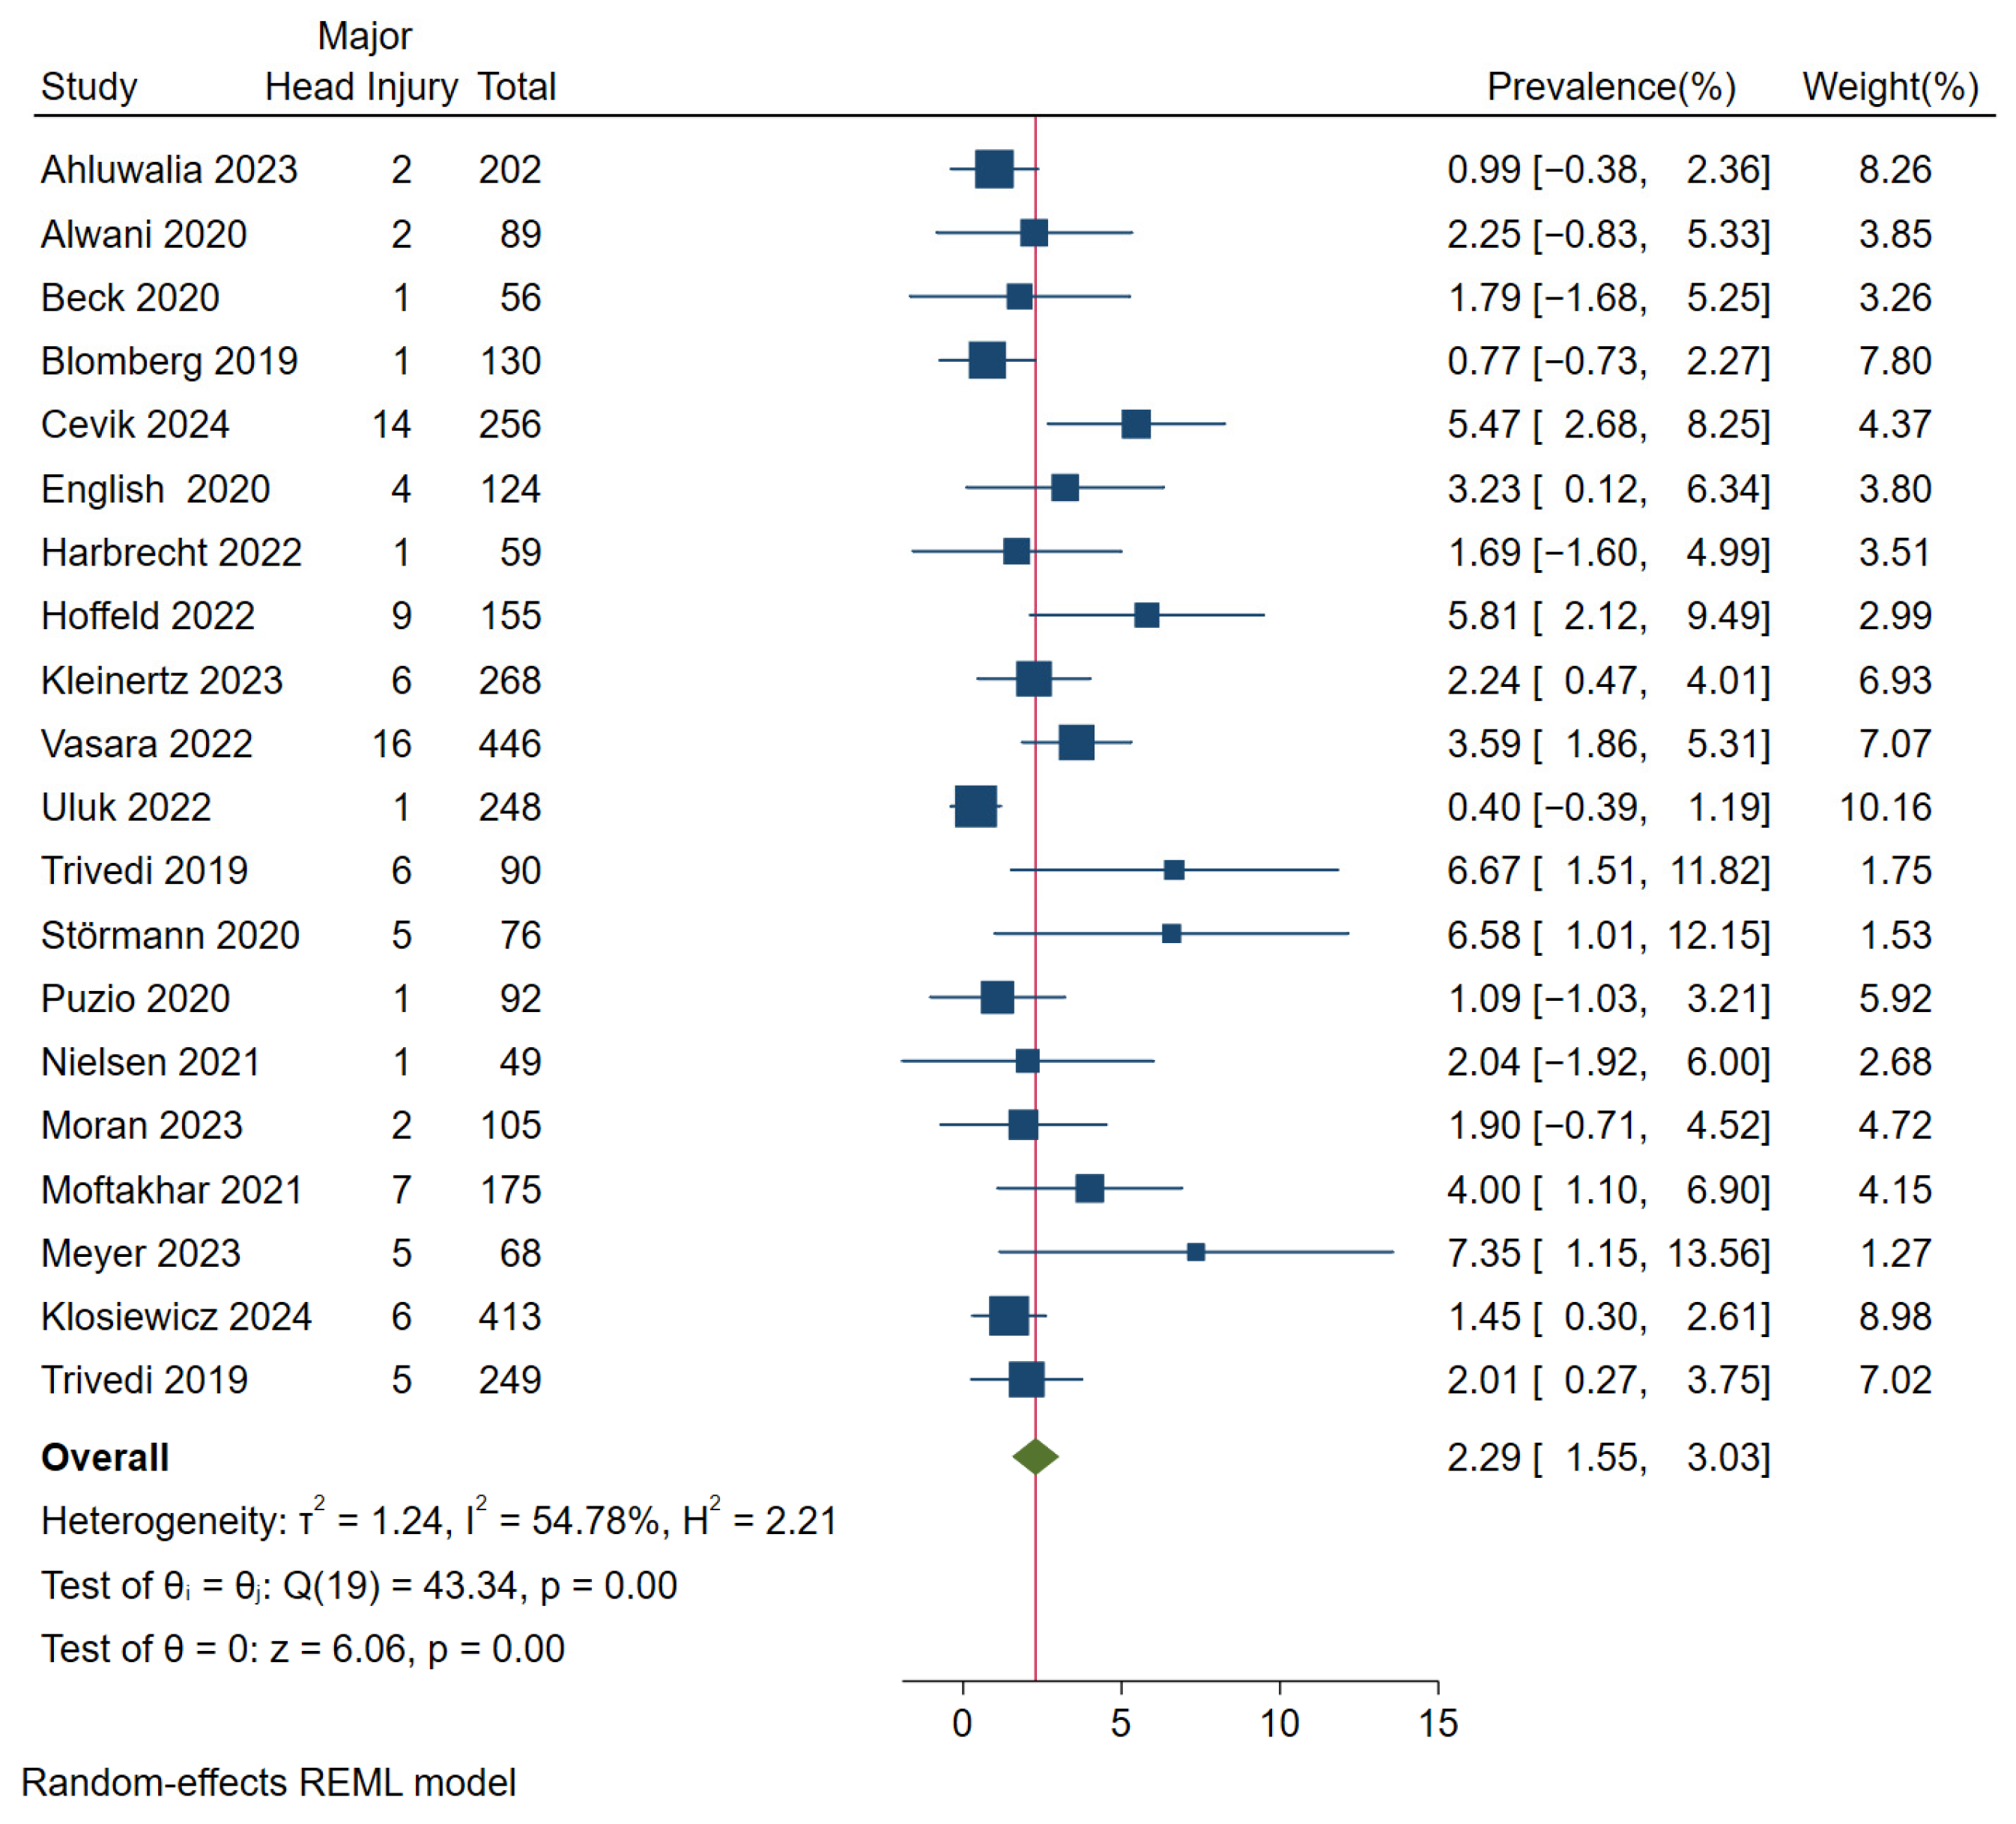
Figure A3.
Proportion of patients with upper-limb injuries. The blue square represents the study-specific prevalence, the horizontal line represent its 95% confidence interval. The green diamond represents the pooled prevalence across all studies, also indicated by a red vertical line. Included articles: Ahluwalia 2023 [24], Alwani 2020 [68], Bekhit 2020 [70], Blomberg 2019 [77], Cevik 2024 [15], English 2020 [71], Gan-El 2022 [44], Harbrecht 2022 [46], Hoffeld 2022 [48], Vasara 2022 [55], Uluk 2022 [54], Tern 2023 [40], Suslavičius 2024 [22], Stray 2022 [53], Störmann 2020 [74], Stigson 2021 [66], Puzio 2020 [73], Pourmand 2021 [64], Pakarinen 2023 [37], Meyer 2023 [34], Klosiewicz 2024 [19].
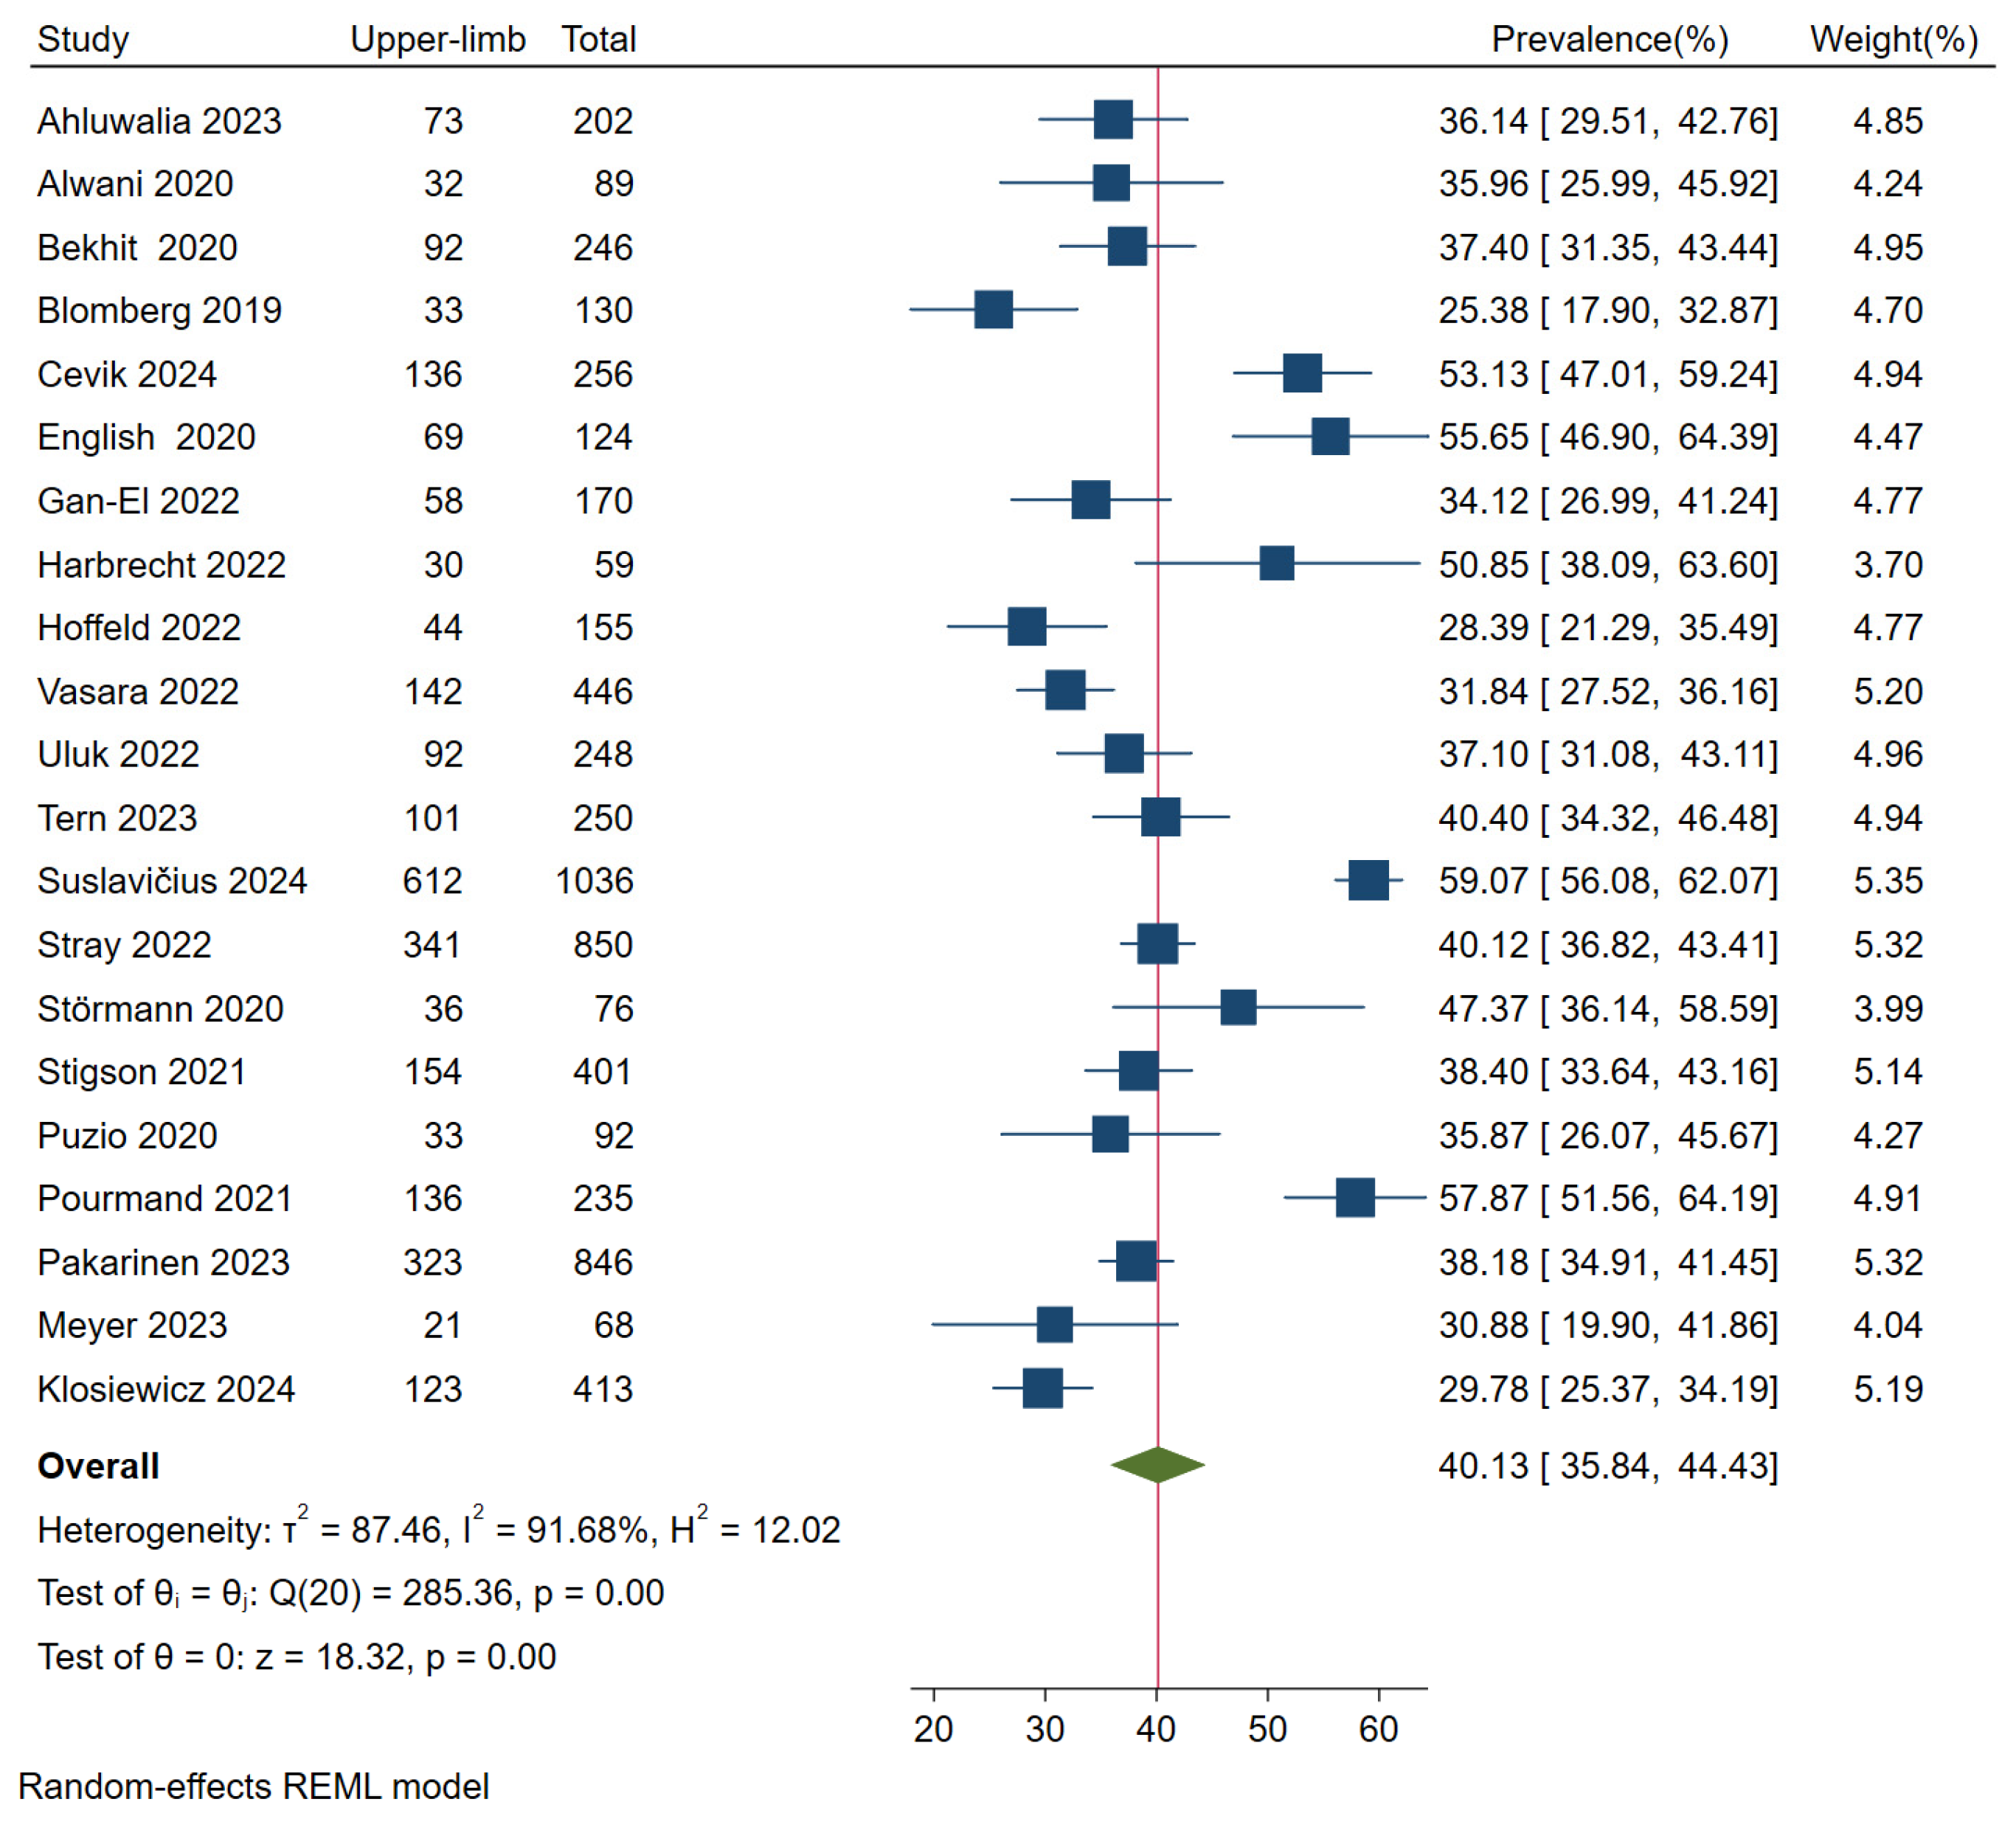
Figure A4.
Proportion of patients with lower-limb injuries. The blue square represents the study-specific prevalence, the horizontal line represent its 95% confidence interval. The green diamond represents the pooled prevalence across all studies, also indicated by a red vertical line. Included articles: Ahluwalia 2023 [24], Alwani 2020 [68], Bekhit 2020 [70], Blomberg 2019 [77], Cevik 2024 [15], English 2020 [71], Gan-El 2022 [44], Harbrecht 2022 [46], Hoffeld 2022 [48], Vasara 2022 [55], Uluk 2022 [54], Tern 2023 [40], Suslavičius 2024 [22], Stray 2022 [53], Störmann 2020 [74], Stigson 2021 [66], Puzio 2020 [73], Pourmand 2021 [64], Pakarinen 2023 [37], Meyer 2023 [34], Klosiewicz 2024 [19].
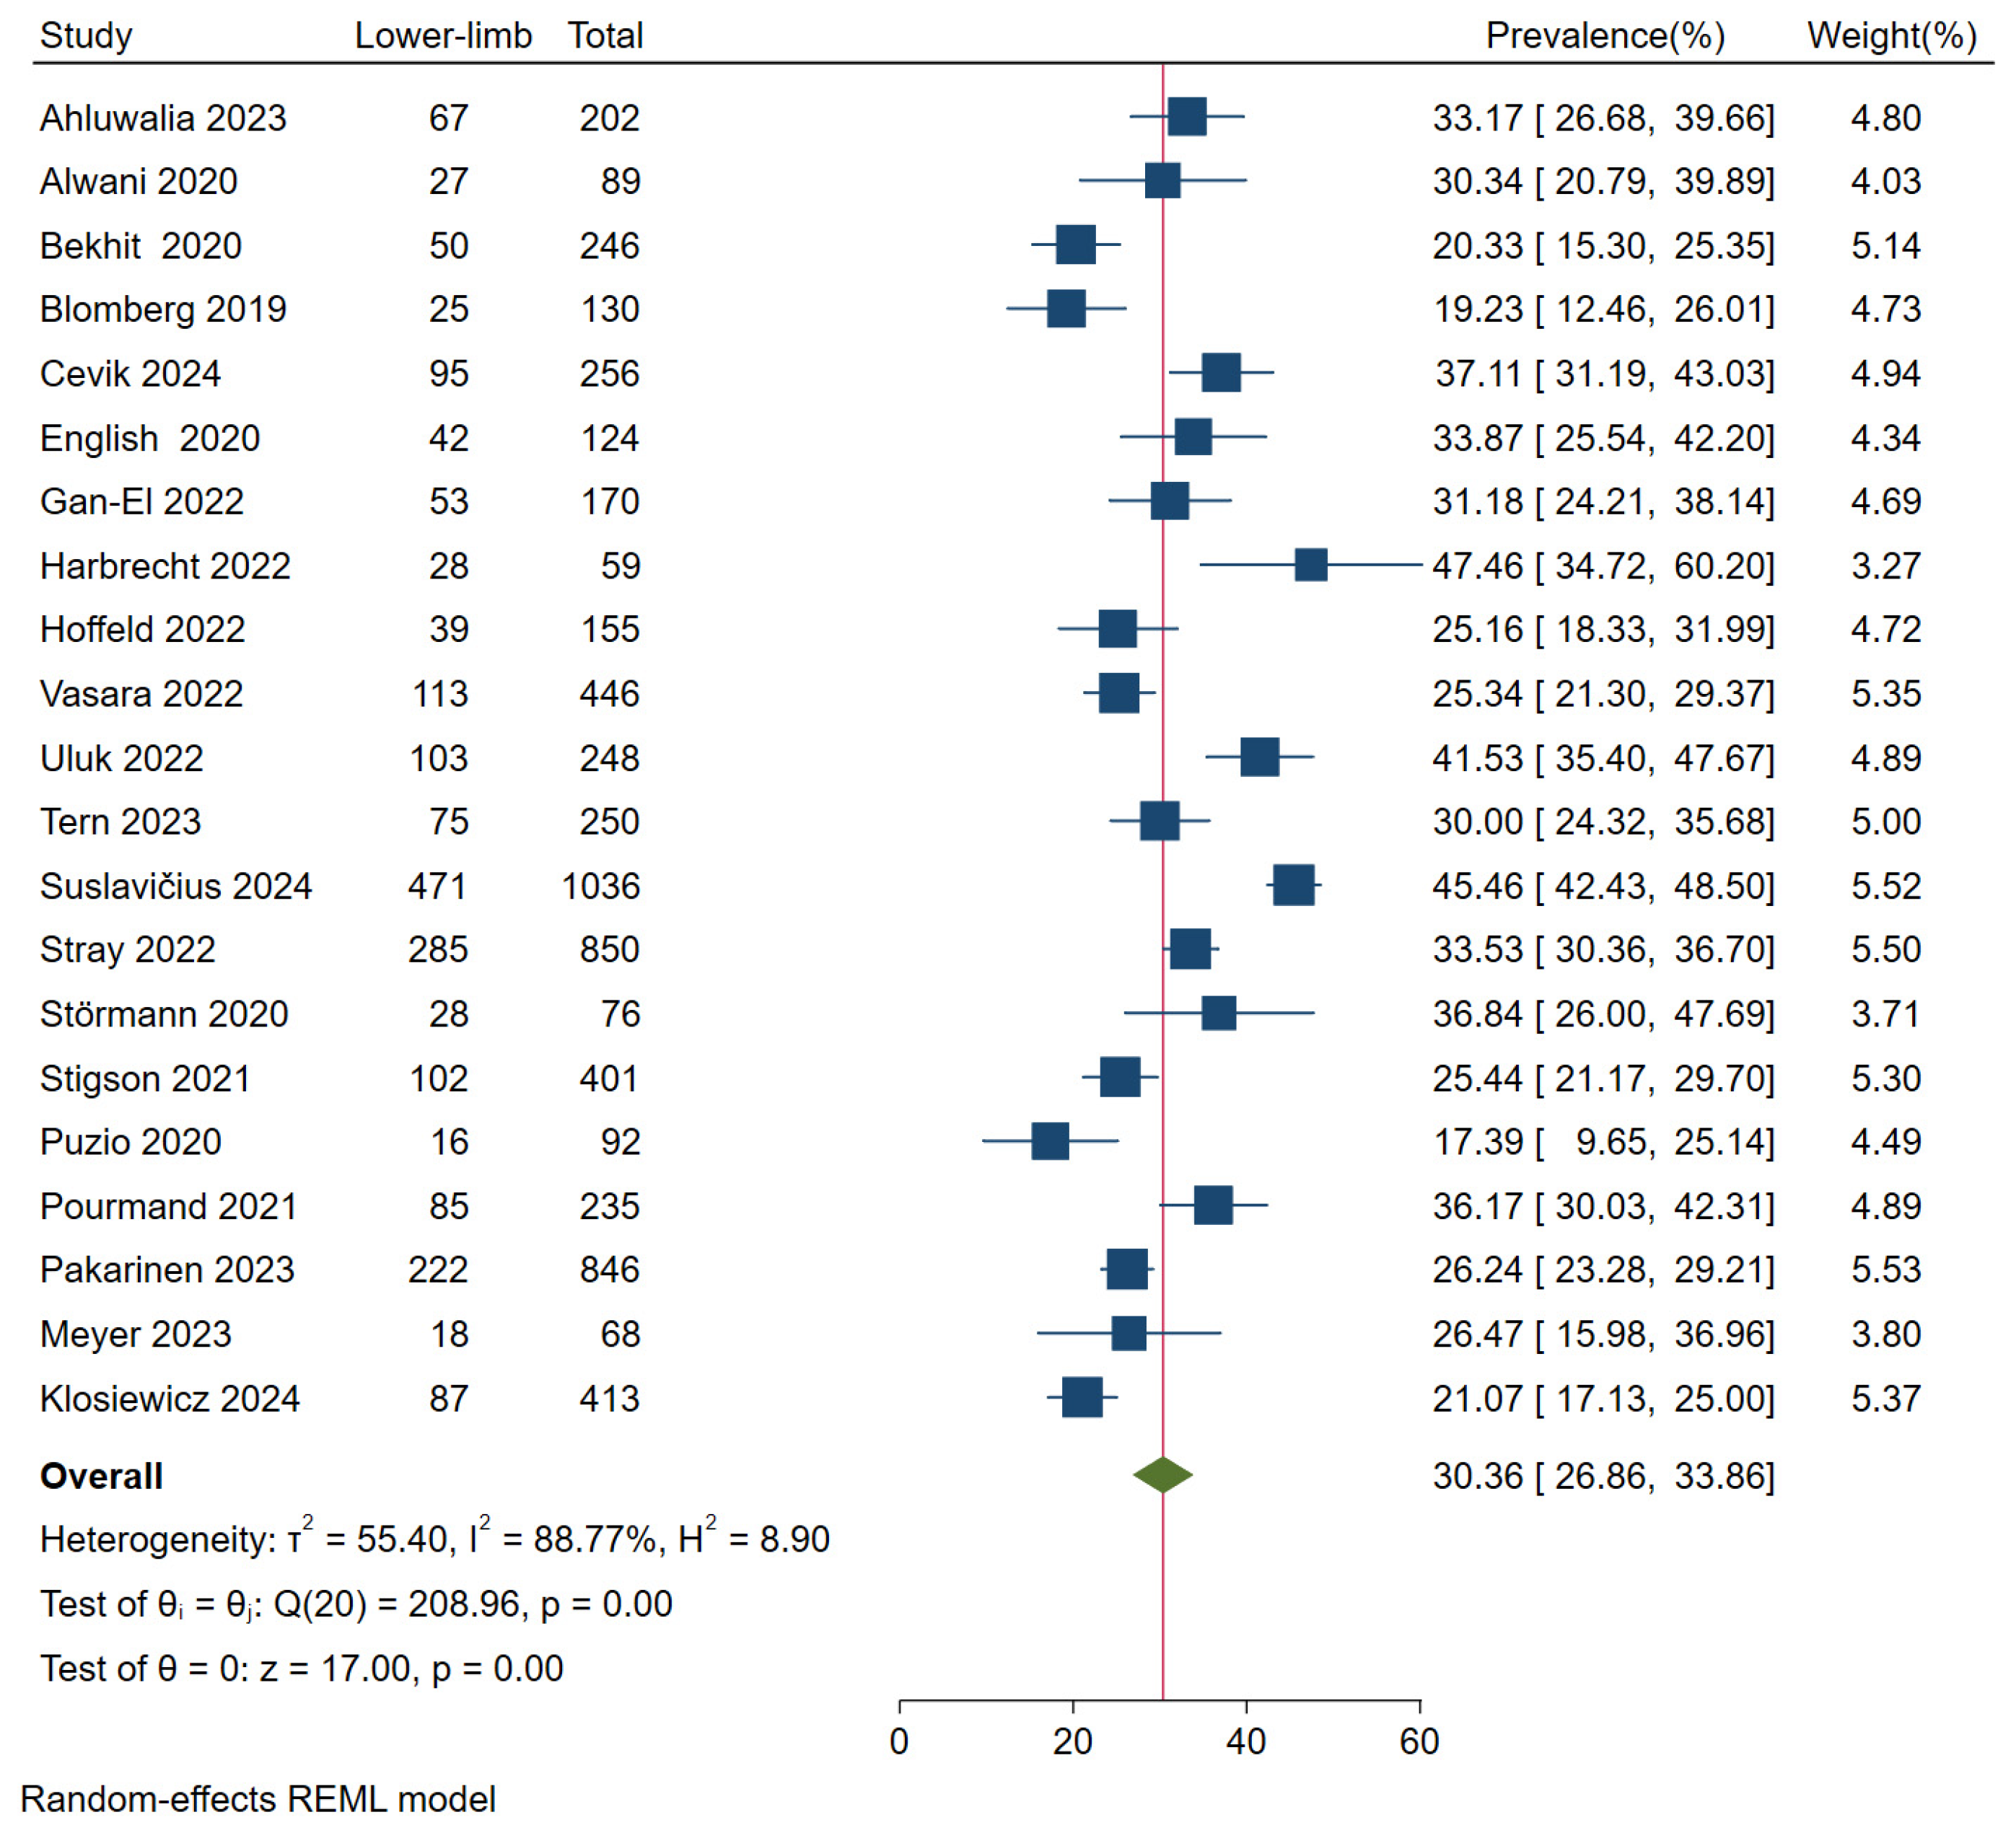
Figure A5.
Proportion of patients with extremity fractures. The blue square represents the study-specific prevalence, the horizontal line represent its 95% confidence interval. The green diamond represents the pooled prevalence across all studies, also indicated by a red vertical line. Included articles: Ahluwalia 2023 [24], Alwani 2020 [68], Bekhit 2020 [70], Blomberg 2019 [77], Cevik 2024 [15], Gan-El 2022 [44], Harbrecht 2022 [46], Hoffeld 2022 [48], Kleinertz 2023 [31], Vasara 2022 [55], Uluk 2022 [54], Suslavičius 2024 [22], Störmann 2020 [74], Nielsen 2021 [63], Moran 2023 [36], Moftakhar 2021 [62].
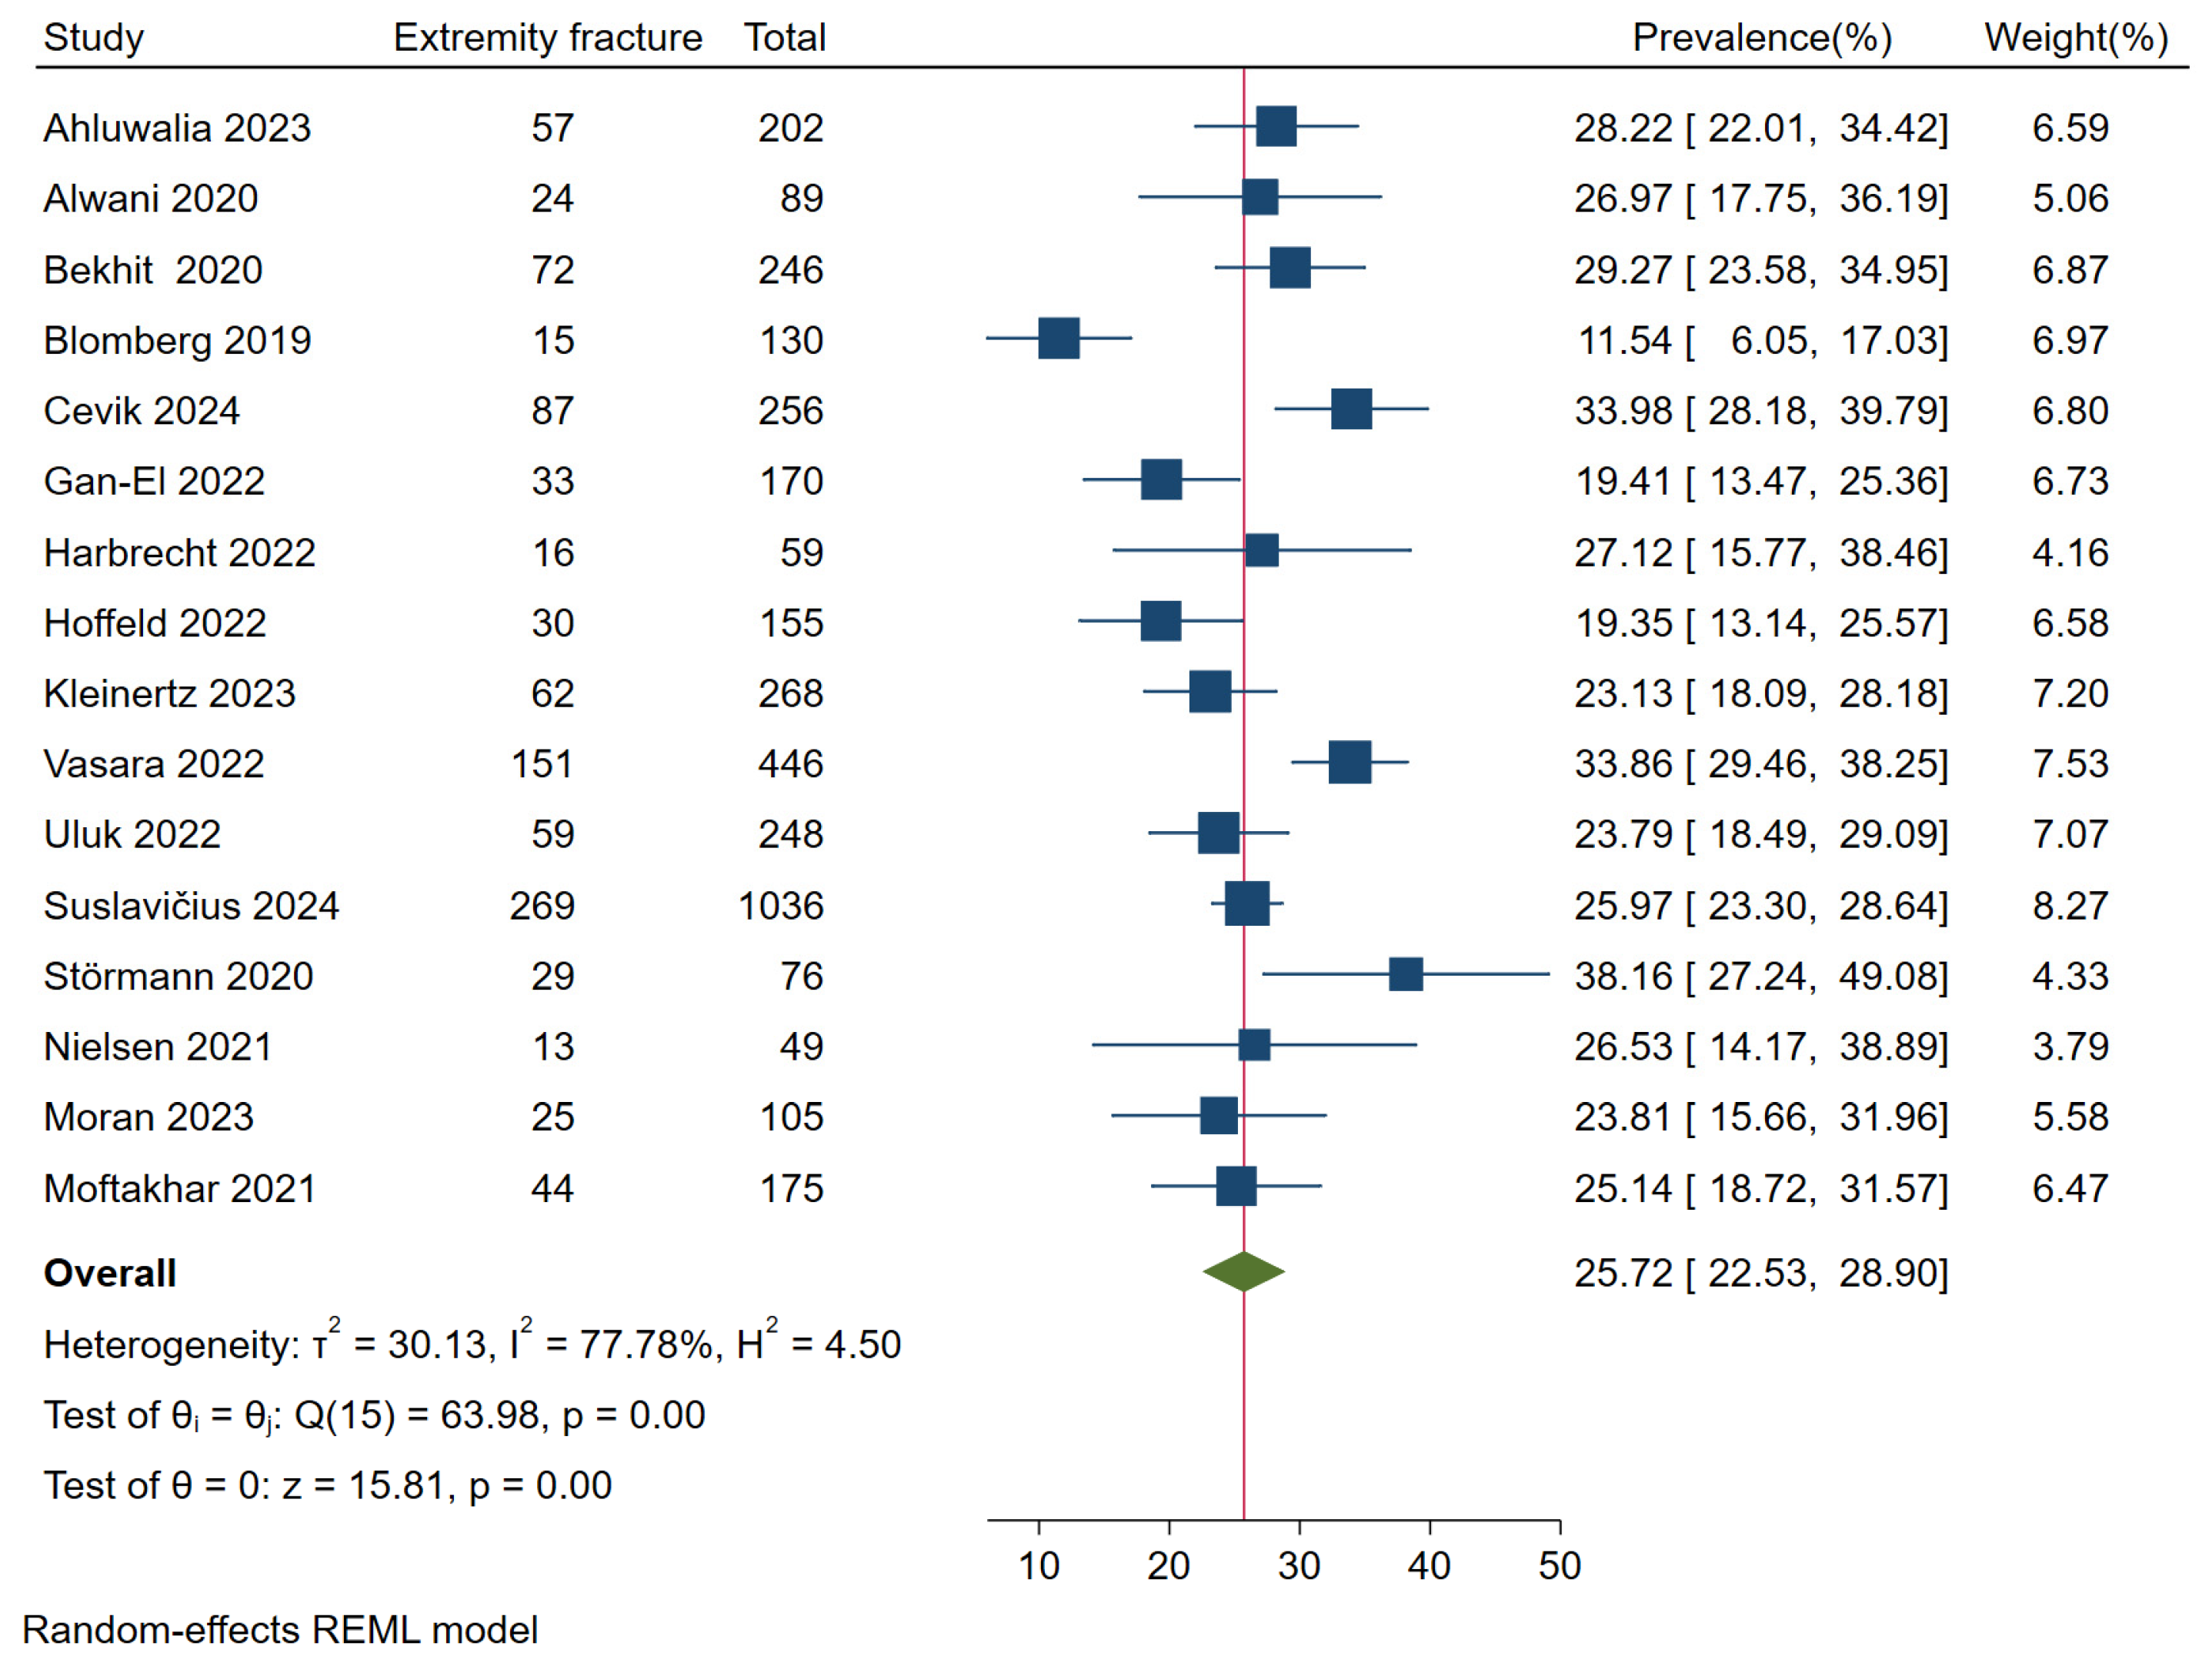
Figure A6.
Proportion of patients with injuries to the abdomen or thorax. The blue square represents the study-specific prevalence, the horizontal line represent its 95% confidence interval. The green diamond represents the pooled prevalence across all studies, also indicated by a red vertical line. Included articles: Ahluwalia 2023 [24], Alwani 2020 [68], Bekhit 2020 [70], Blomberg 2019 [77], Cevik 2024 [15], English 2020 [71], Gan-El 2022 [44], Hoffeld 2022 [48], Kleinertz 2023 [31], Vasara 2022 [55], Uluk 2022 [54], Trivedi 2019 [80], Tern 2023 [40], Störmann 2020 [74], Stigson 2021 [66], Puzio 2020 [73], Pourmand 2021 [64], Pakarinen 2023 [37], Moran 2023 [36], Meyer 2023 [34], Klosiewicz 2024 [19], Trivedi 2019 [81].
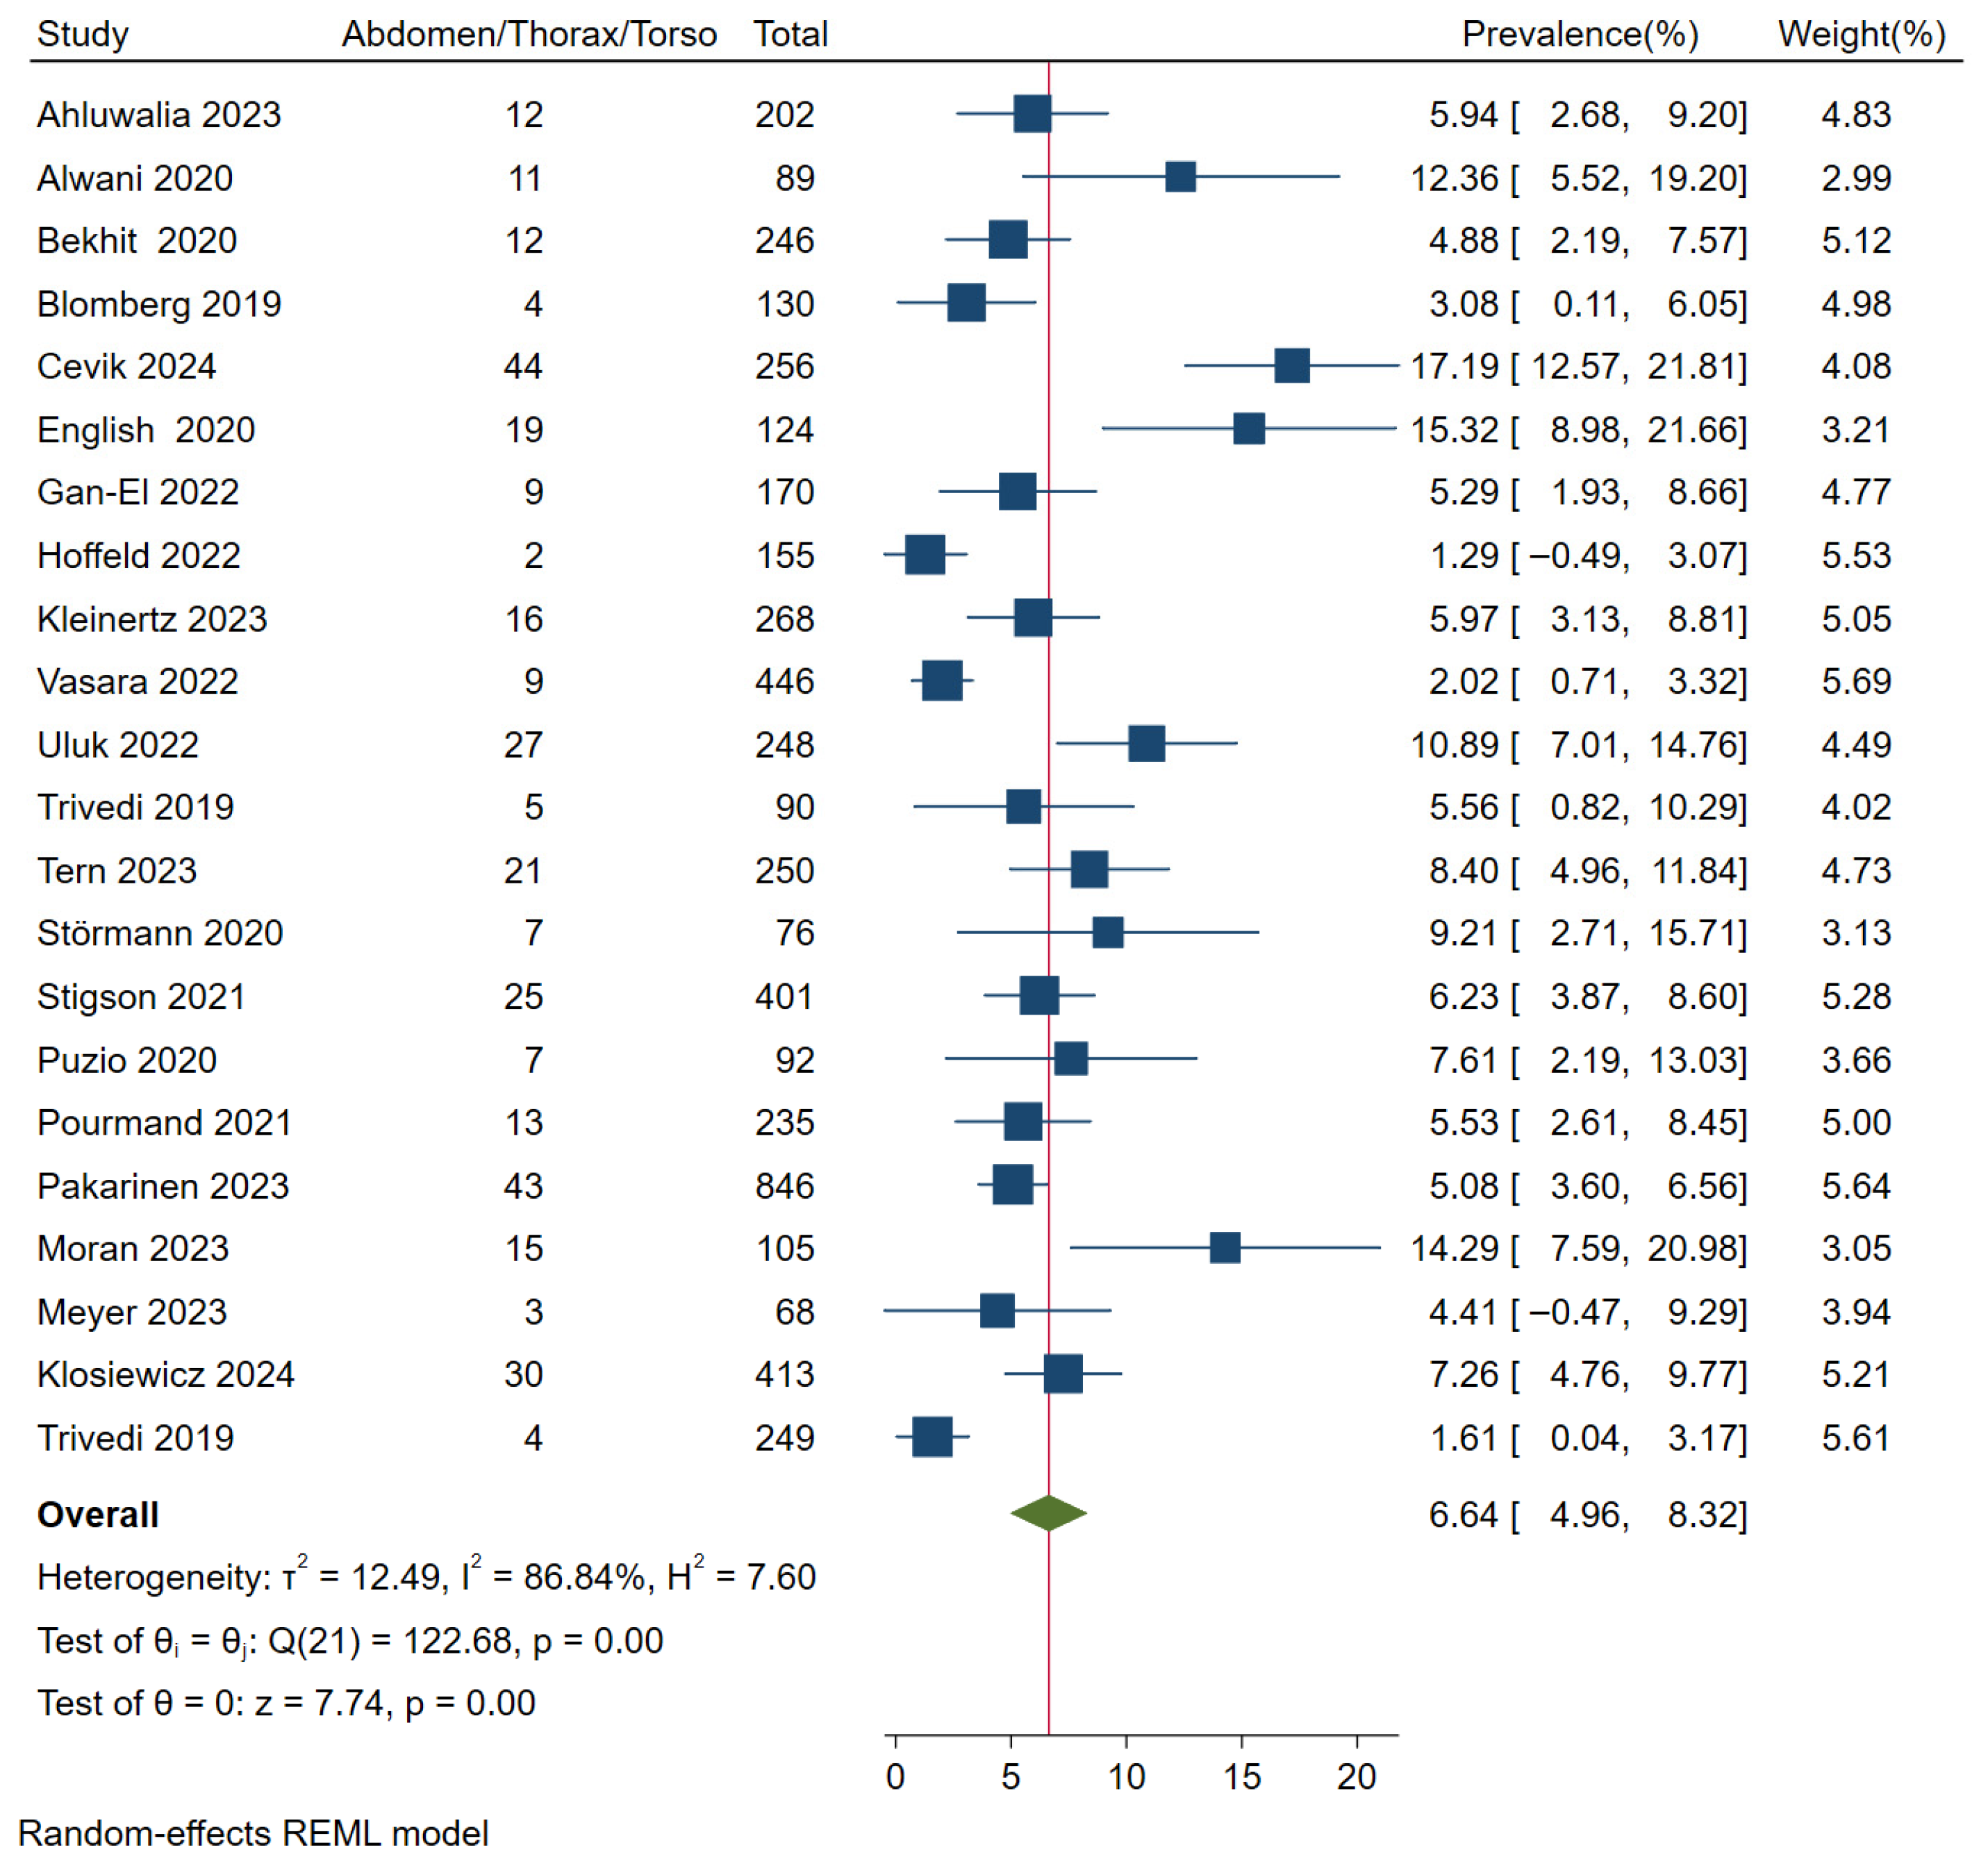
Figure A7.
Proportion of patients with injuries to the back or spine. The blue square represents the study-specific prevalence, the horizontal line represent its 95% confidence interval. The green diamond represents the pooled prevalence across all studies, also indicated by a red vertical line. Included articles: Ahluwalia 2023 [24], Bekhit 2020 [70], Blomberg 2019 [77], Cevik 2024 [15], English 2020 [71], Harbrecht 2022 [46], Hoffeld 2022 [48], Kleinertz 2023 [31], Uluk 2022 [54], Trivedi 2019 [80], Tern 2023 [40], Stigson 2021 [66], Moran 2023 [36], Trivedi 2019 [81].
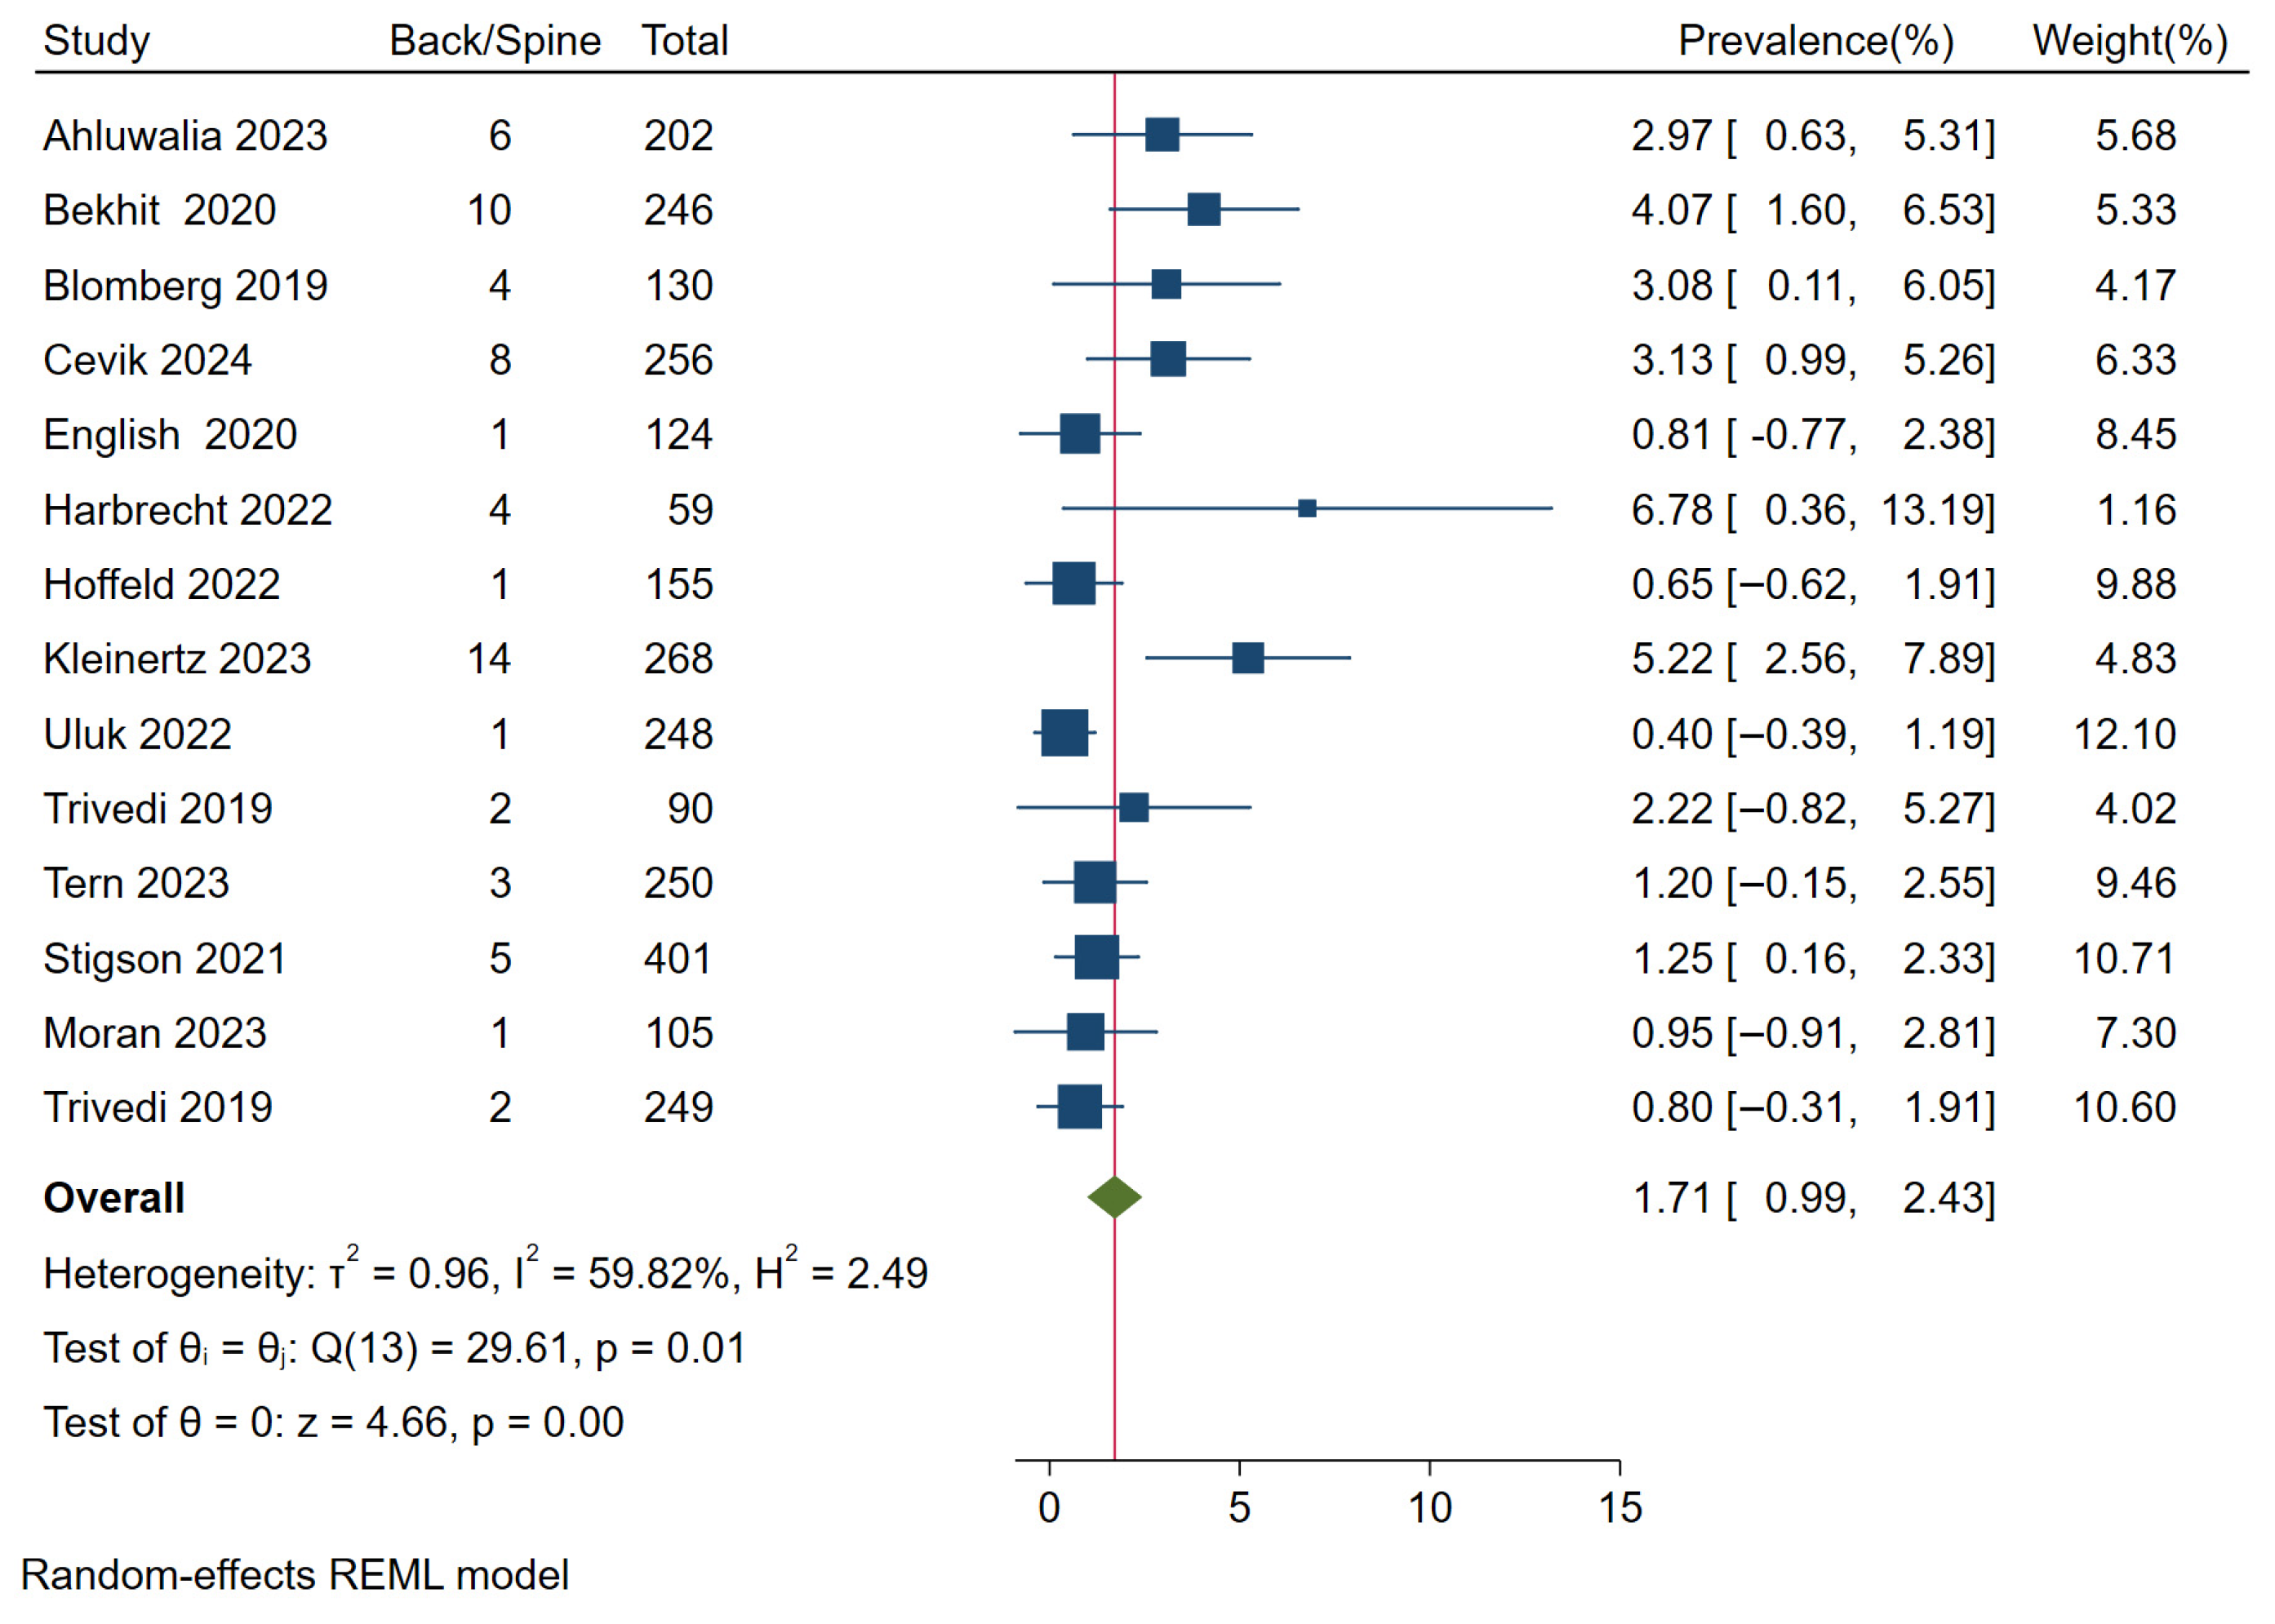
Figure A8.
Proportion of patients who were treated in an intensive care unit (ICU). The blue square represents the study-specific prevalence, the horizontal line represent its 95% confidence interval. The green diamond represents the pooled prevalence across all studies, also indicated by a red vertical line. Included articles: Ahluwalia 2023 [24], Beck 2020 [69], Bloom 2021 [59], English 2020 [71], Frank 2024 [16], Gan-El 2022 [44], Genc Yavuz 2022 [45], Graef 2021 [60], Harbrecht 2022 [46], Williams 2022 [57], Vasara 2022 [55], Trivedi 2019 [80], Störmann 2020 [74], Reito 2022 [51], Puzio 2020 [73], Pourmand 2021 [64], Nielsen 2021 [63], Meyer 2023 [34], Leyendecker 2023 [32], Trivedi 2019 [81].
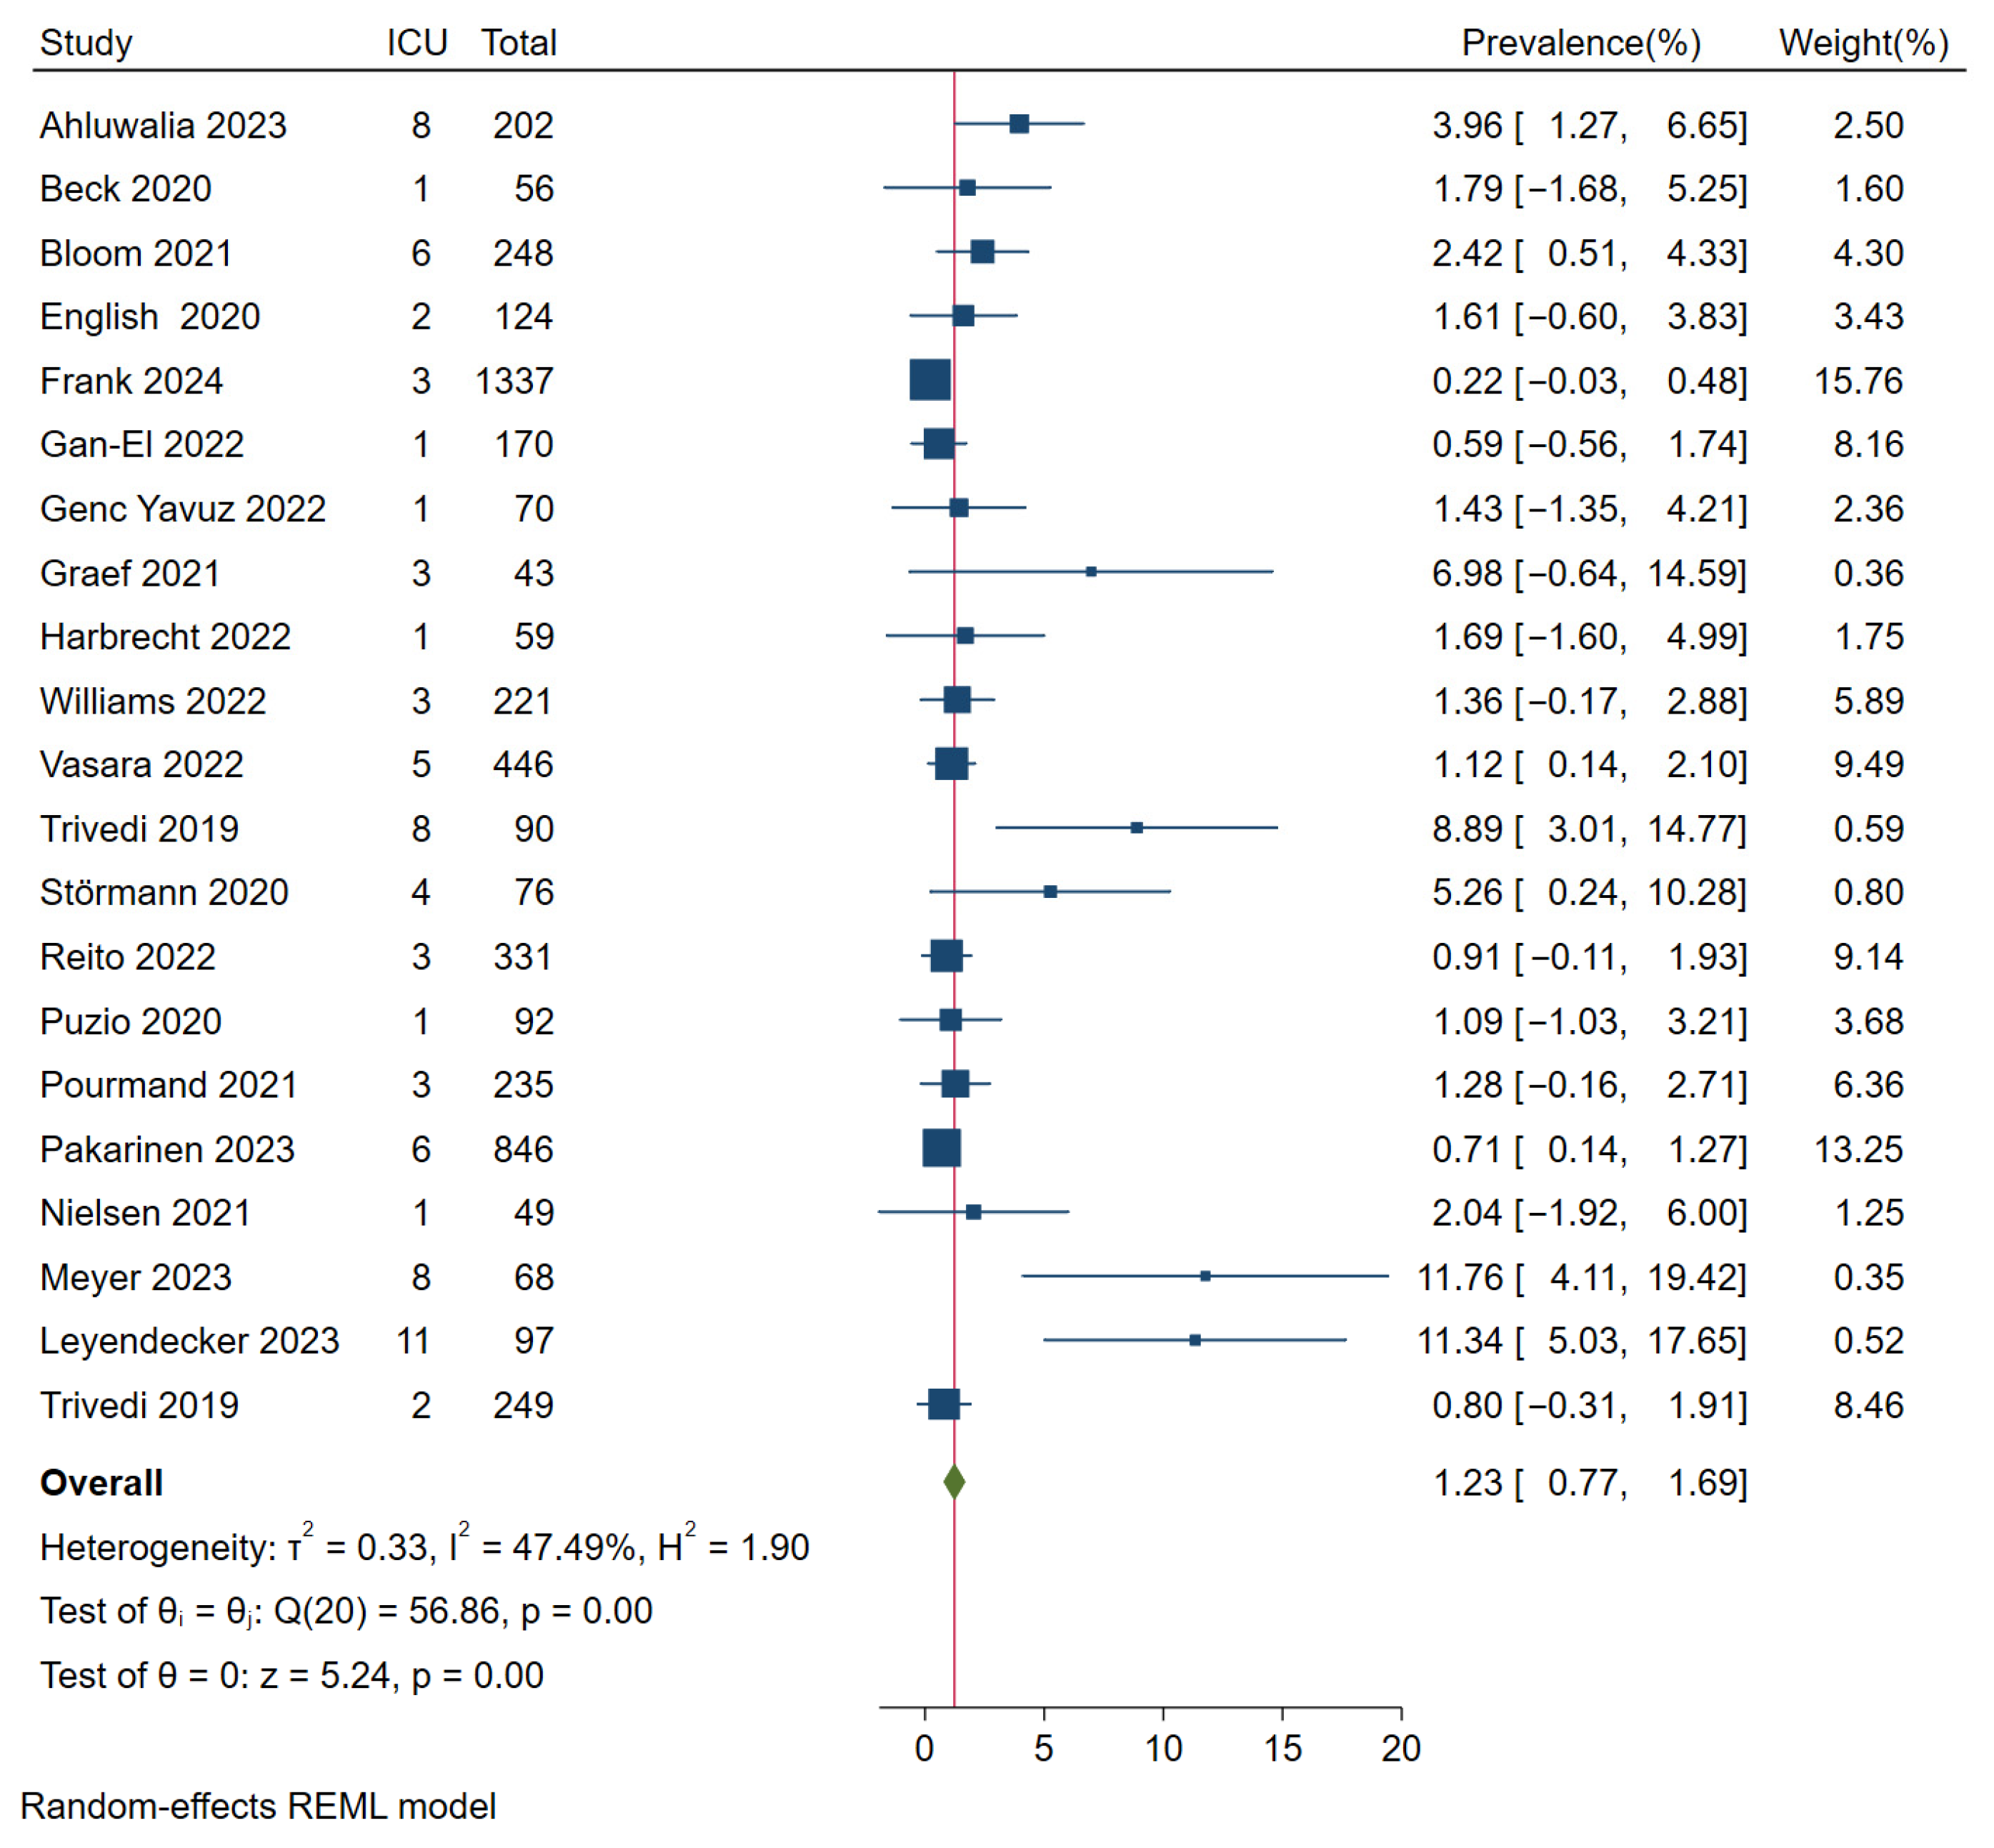
Figure A9.
Proportion of male patients. The blue square represents the study-specific prevalence, the horizontal line represent its 95% confidence interval. The green diamond represents the pooled prevalence across all studies, also indicated by a red vertical line. Included articles: Ahluwalia 2023 [24], Alwani 2020 [68], Anderson 2021 [58], Andersson 2023 [25], Badeau 2019 [76], Beck 2020 [69], Bekhit 2020 [70], Benhamed 2023 [26], Blomberg 2019 [77], Bloom 2021 [59], Bracher 2023 [27], Briotti 2024 [14], Brownson 2019 [78], Choi 2022 [41], Cevik 2024 [15], Cicchino 2022 [42], Cittadini 2023 [28], Cruz 2022 [43], English 2020 [71], Frank 2024 [16], Gan-El 2022 [44], Genc Yavuz 2022 [45], Graef 2021 [60], Harbrecht 2022 [46], Heuer 2022 [47], Hoffeld 2022 [48], Jamieson 2023 [29], Jeong 2022 [30], Kahan 2024 [17], Kim T 2023 [18], Kleinertz 2023 [31], Wüster 2021 [67], Williams 2022 [57], Watson 2024 [23], Vernon 2020 [75], Vasara 2022 [55], Uluk 2022 [54], Trivedi 2019 [80], Tern 2023 [40], Suslavičius 2024 [22], Stray 2022 [53], Störmann 2020 [74], Stigson 2021 [66], Shiffler 2021 [65], Sheikh 2022 [52], Rickelmann 2023 [38], Reito 2022 [51], Puzio 2020 [73], Pourmand 2021 [64], Pakarinen 2023 [37], Nielsen 2021 [63], Neuroth 2022 [50], Navarro 2022 [49], Moran 2023 [36], Moftakhar 2021 [62], Mitra 2023 [35], Mitchell 2019 [79], Meyer 2023 [34], Metry 2024 [21], Mair 2020 [61], Liukkonen 2023 [33], Linhart 2024 [20], Liew 2020 [72], Leyendecker 2023 [32], Klosiewicz 2024 [19], Trivedi 2019 [81], Weidemann 2022 [56].
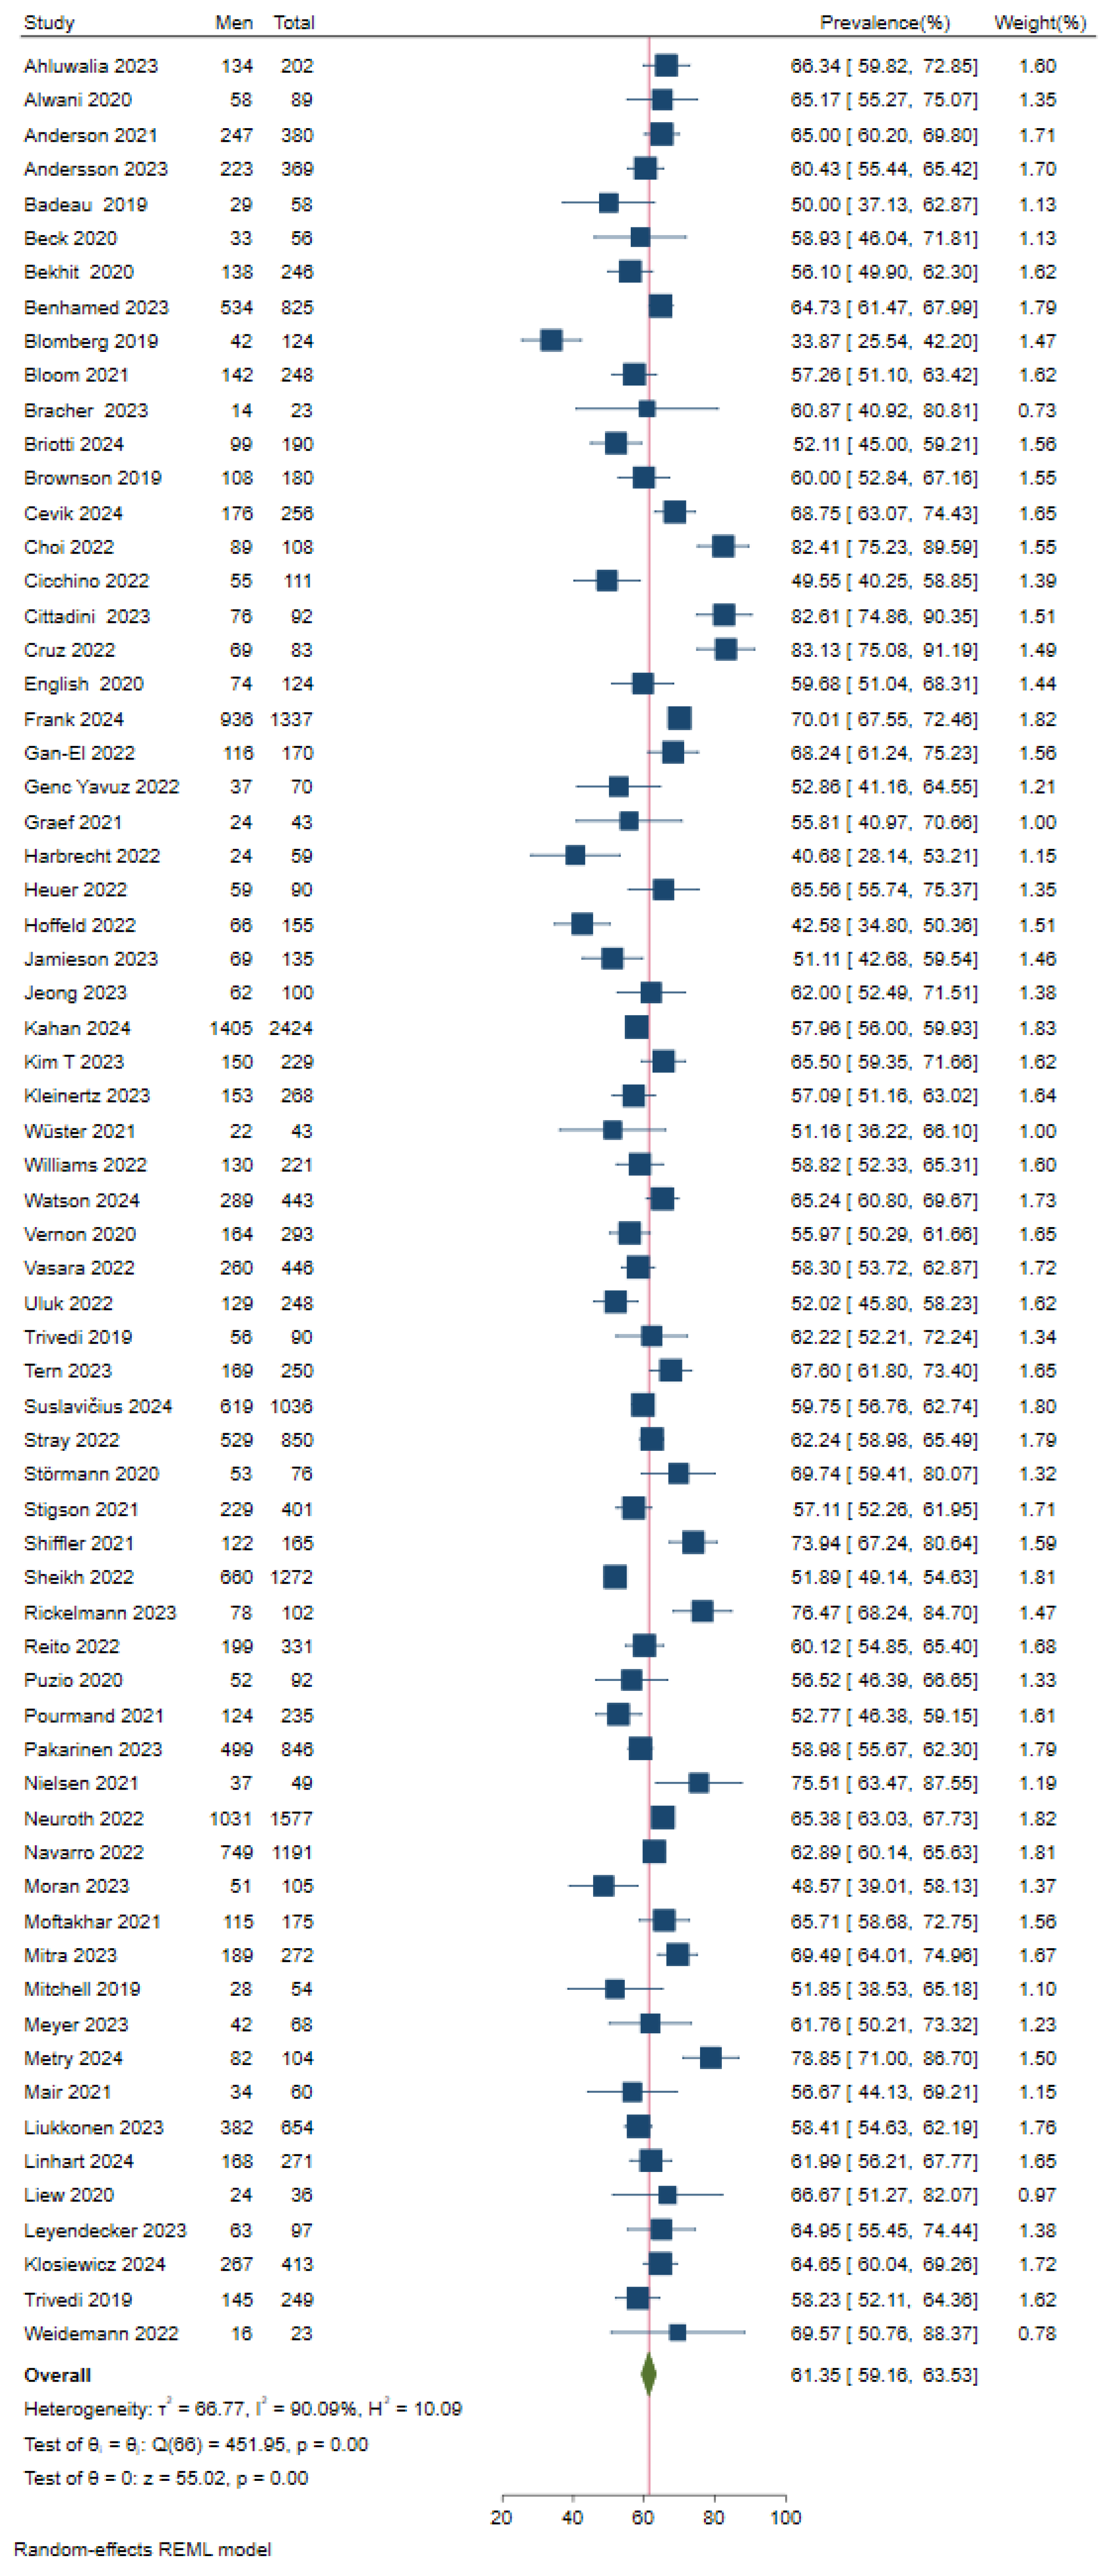
Figure A10.
Mean age of the included patients. The blue square represents the study-specific arithmetic mean, the horizontal line represent its 95% confidence interval. The green diamond represents the pooled arithmetic mean estimate across all studies, also indicated by a red vertical line. Included articles: Ahluwalia 2023 [24], Alwani 2020 [68], Anderson 2021 [58], Bekhit 2020 [70], Benhamed 2023 [26], Blomberg 2019 [77], Bracher 2023 [27], Brownson 2019 [78], Choi 2022 [41], Cevik 2024 [15], Cicchino 2022 [42], Cittadini 2023 [28], Cruz 2022 [43], English 2020 [71], Frank 2024 [16], Gan-El 2022 [44], Genc Yavuz 2022 [45], Graef 2021 [60], Harbrecht 2022 [46], Heuer 2022 [47], Hoffeld 2022 [48], Jeong 2022 [30], Kahan 2024 [17], Kleinertz 2023 [31], Williams 2022 [57], Vernon 2020 [75], Vasara 2022 [55], Uluk 2022 [54], Tern 2023 [40], Suslavičius 2024 [22], Stray 2022 [53], Störmann 2020 [74], Reito 2022 [51], Puzio 2020 [73], Pourmand 2021 [64], Nielsen 2021 [63], Navarro 2022 [49], Moran 2023 [36], Meyer 2023 [34], Mair 2020 [61], Liukkonen 2023 [33], Liew 2020 [72], Leyendecker 2023 [32], Klosiewicz 2024 [19], Trivedi 2019 [81], Weidemann 2022 [56].
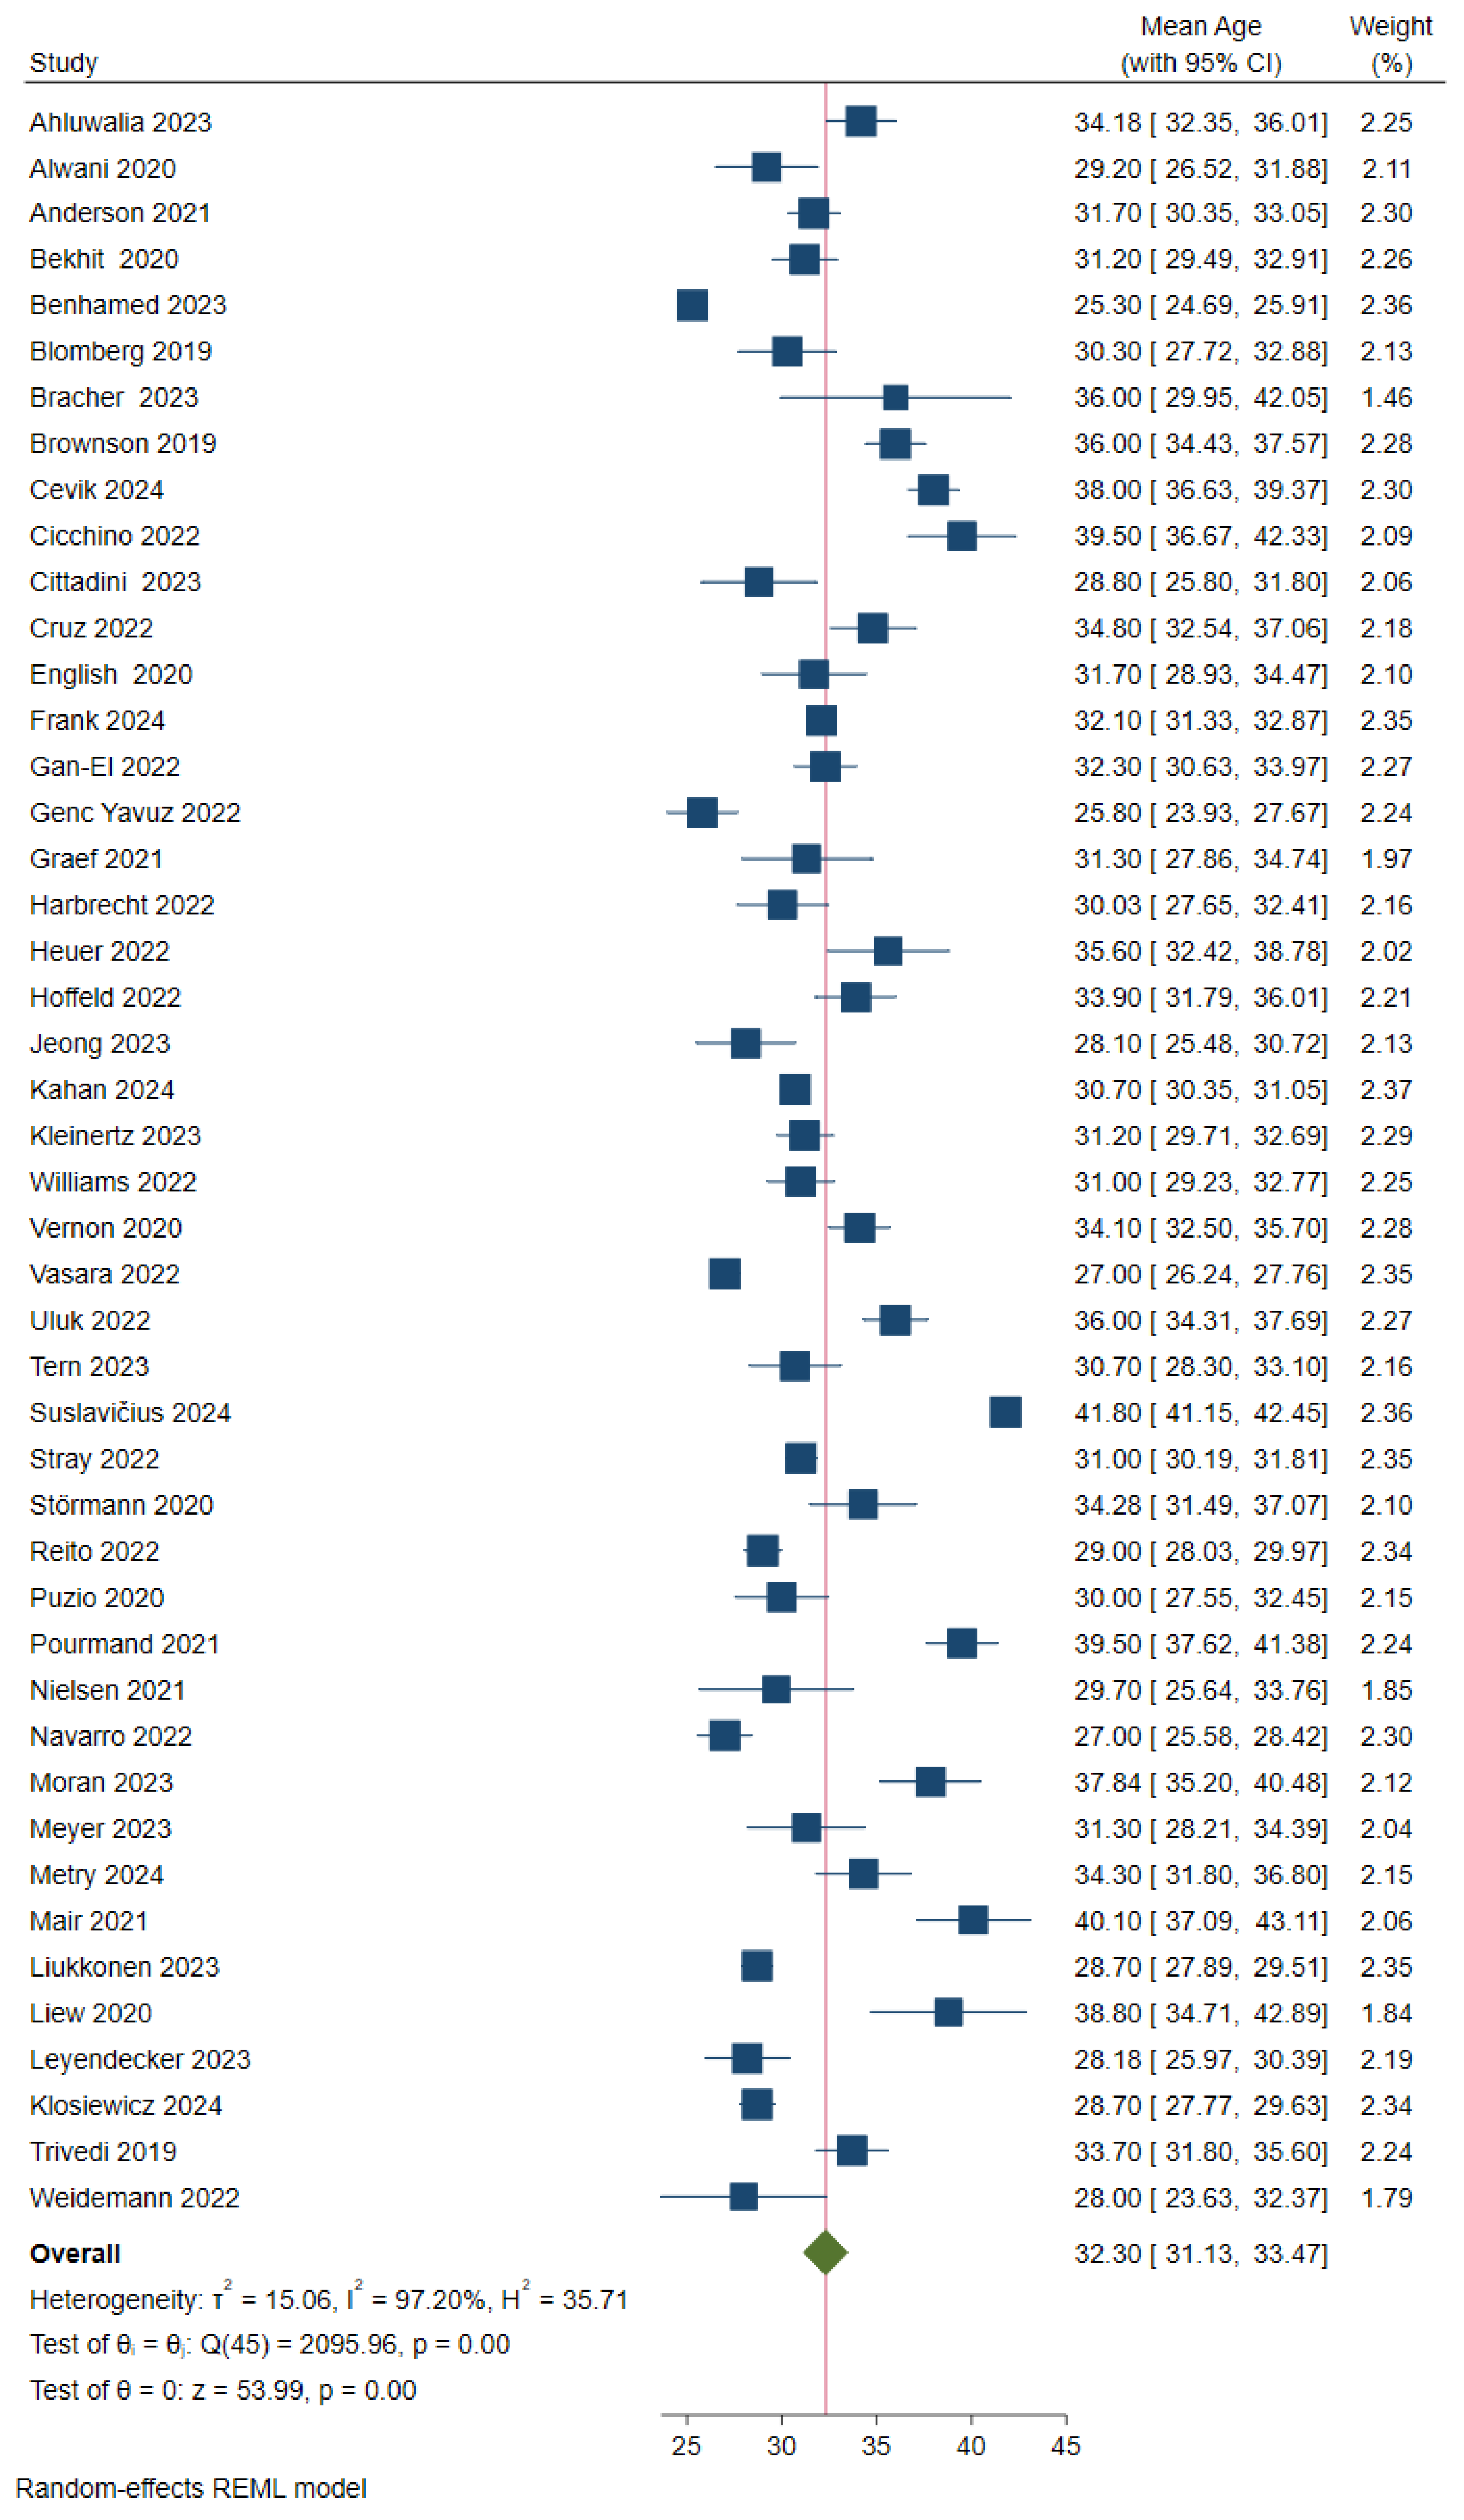
Figure A11.
Proportion of patients who wore a helmet at the time of the accident. The blue square represents the study-specific prevalence, the horizontal line represent its 95% confidence interval. The green diamond represents the pooled prevalence across all studies, also indicated by a red vertical line. Included articles: Ahluwalia 2023 [24], Alwani 2020 [68], Anderson 2021 [58], Andersson 2023 [25], Badeau 2019 [76], Beck 2020 [69], Benhamed 2023 [26], Blomberg 2019 [77], Bloom 2021 [59], Briotti 2024 [14], Brownson 2019 [78], Cevik 2024 [15], Choi 2022 [41], Cicchino 2022 [42], Cittadini 2023 [28], Cruz 2022 [43], English 2020 [71], Frank 2024 [16], Gan-El 2022 [44], Genc Yavuz 2022 [45], Graef 2021 [60], Harbrecht 2022 [46], Heuer 2022 [47], Hoffeld 2022 [48], Jamieson 2023 [29], Jeong 2022 [30], Kleinertz 2023 [31], Wüster 2021 [67], Williams 2022 [57], Vasara 2022 [55], Uluk 2022 [54], Trivedi 2019 [80], Tern 2023 [40], Stray 2022 [53], Störmann 2020 [74], Stigson 2021 [66], Shiffler 2021 [65], Puzio 2020 [73], Pakarinen 2023 [37], Mitchell 2019 [79], Meyer 2023 [34], Mair 2020 [61], Liew 2020 [72], Leyendecker 2023 [32], Trivedi 2019 [81], Weidemann 2022 [56].
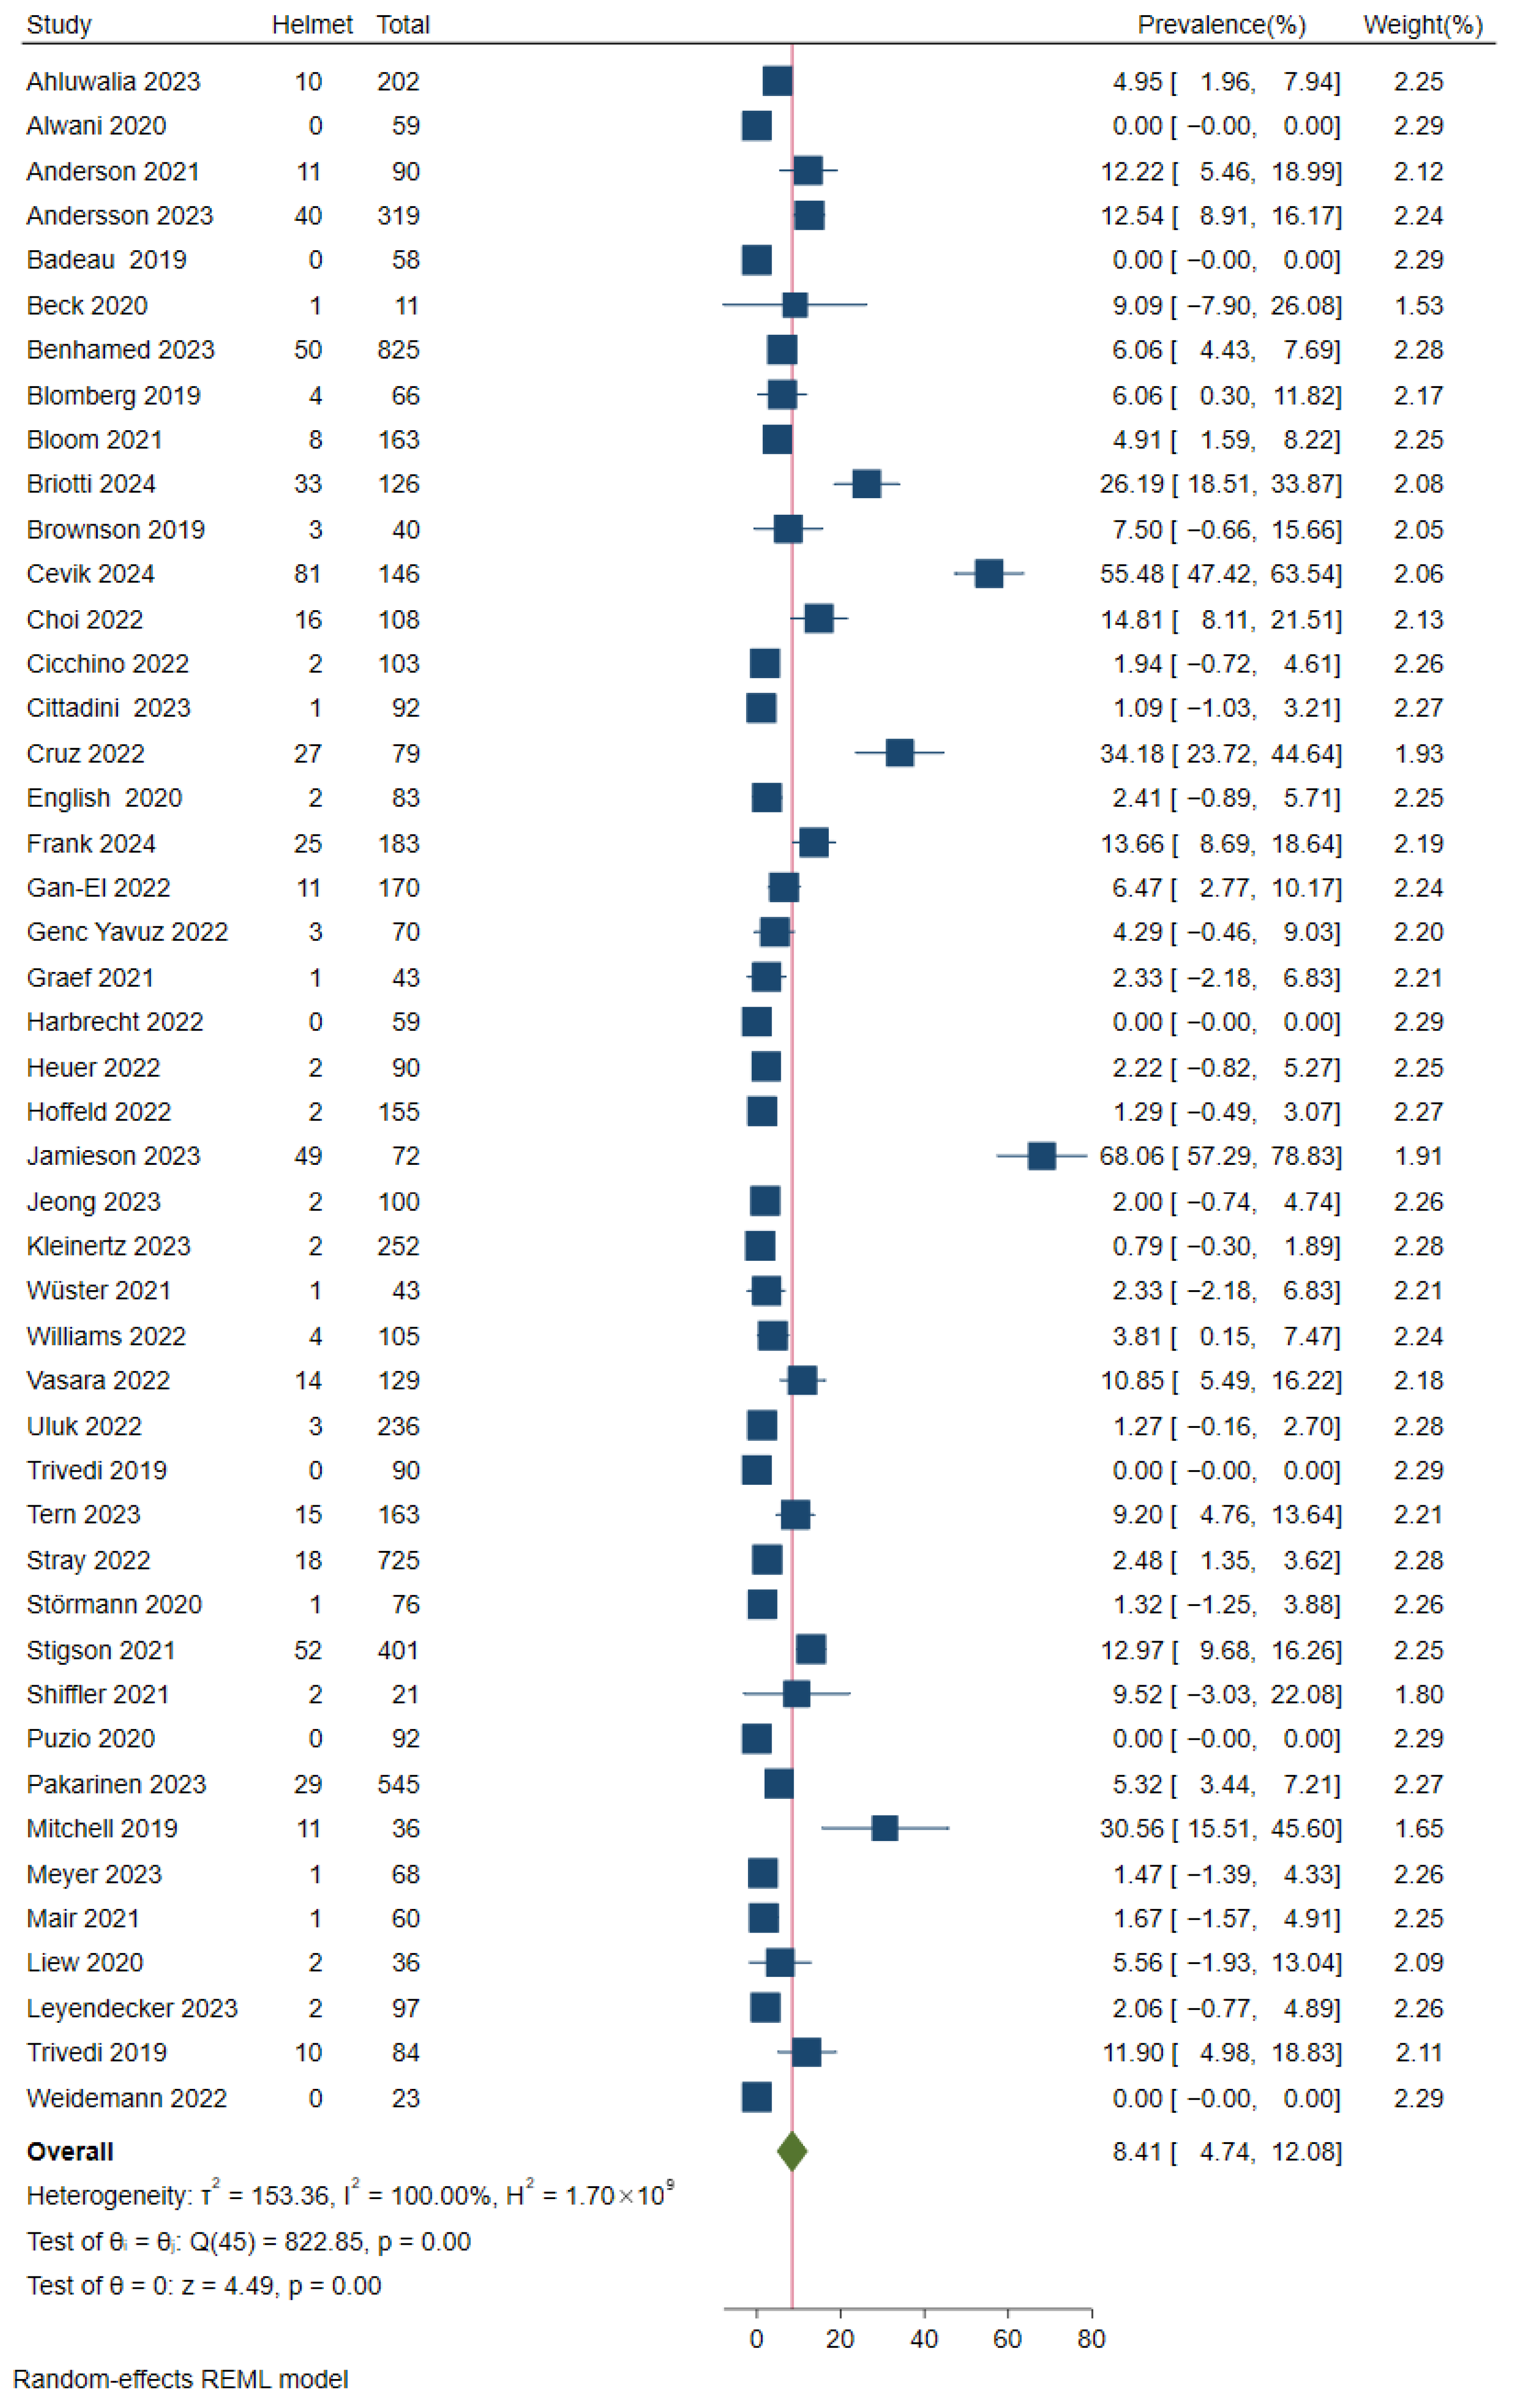
Figure A12.
Proportion of patients who were reportedly intoxicated with alcohol. The blue square represents the study-specific prevalence, the horizontal line represent its 95% confidence interval. The green diamond represents the pooled prevalence across all studies, also indicated by a red vertical line. Included articles: Ahluwalia 2023 [24], Alwani 2020 [68], Anderson 2021 [58], Andersson 2023 [25], Badeau 2019 [76], Beck 2020 [69], Bekhit 2020 [70], Blomberg 2019 [77], Briotti 2024 [14], Cevik 2024 [15], Choi 2022 [41], Cicchino 2022 [42], Cruz 2022 [43], English 2020 [71], Gan-El 2022 [44], Genc Yavuz 2022 [45], Graef 2021 [60], Harbrecht 2022 [46], Heuer 2022 [47], Hoffeld 2022 [48], Jamieson 2023 [29], Jeong 2022 [30], Kleinertz 2023 [31], Wüster 2021 [67], Williams 2022 [57], Vasara 2022 [55], Uluk 2022 [54], Trivedi 2019 [80], Tern 2023 [40], Suslavičius 2024 [22], Stray 2022 [53], Shiffler 2021 [65], Puzio 2020 [73], Moran 2023 [36], Mitra 2023 [35], Mitchell 2019 [79], Meyer 2023 [34], Mair 2020 [61], Liukkonen 2023 [33], Linhart 2024 [20].
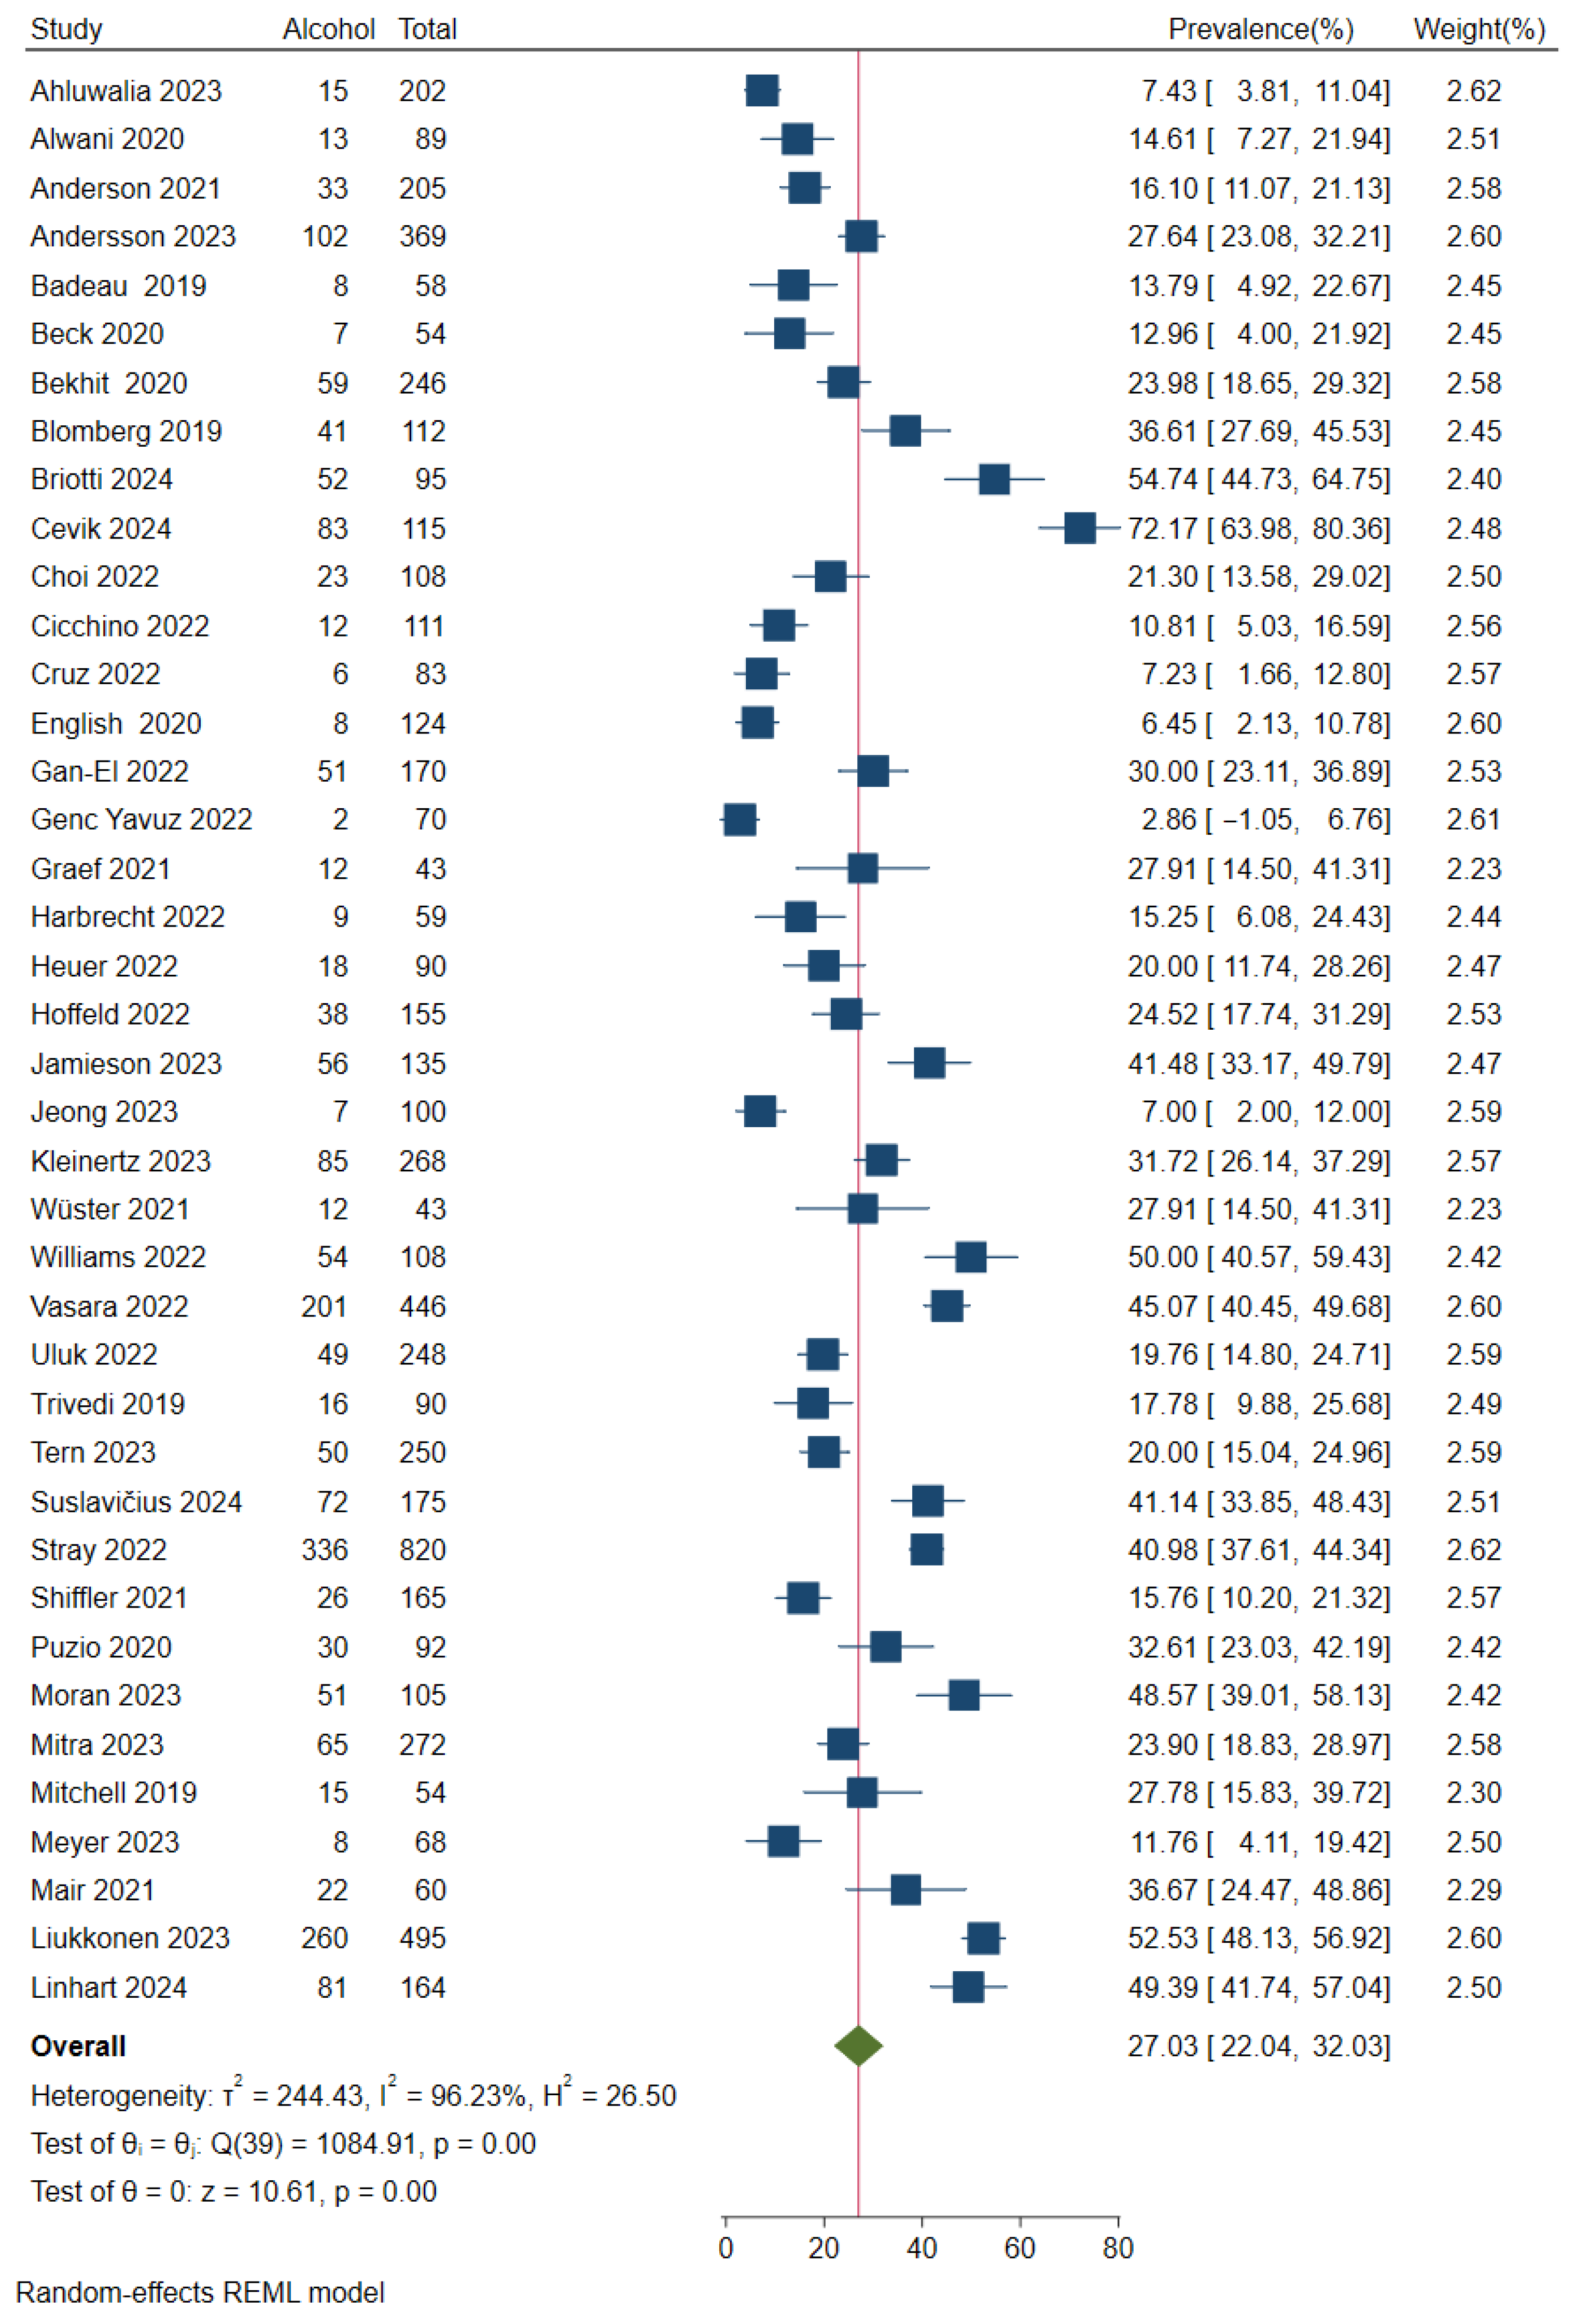
Figure A13.
Proportion of patients injured in a single-vehicle accident. The blue square represents the study-specific prevalence, the horizontal line represent its 95% confidence interval. The green diamond represents the pooled prevalence across all studies, also indicated by a red vertical line. Included articles: Alwani 2020 [68], Anderson 2021 [58], Blomberg 2019 [77], Bloom 2021 [59], Brownson 2019 [78], Choi 2022 [41], Cicchino 2022 [42], Cittadini 2023 [28], Cruz 2022 [43], English 2020 [71], Frank 2024 [16], Gan-El 2022 [44], Genc Yavuz 2022 [45], Graef 2021 [60], Heuer 2022 [47], Jeong 2022 [30], Kleinertz 2023 [31], Vasara 2022 [55], Uluk 2022 [54], Suslavičius 2024 [22], Störmann 2020 [74], Stigson 2021 [66], Shiffler 2021 [65], Rickelmann 2023 [38], Nielsen 2021 [63], Moran 2023 [36], Mair 2020 [61], Liew 2020 [72], Klosiewicz 2024 [19], Trivedi 2019 [81], Weidemann 2022 [56].
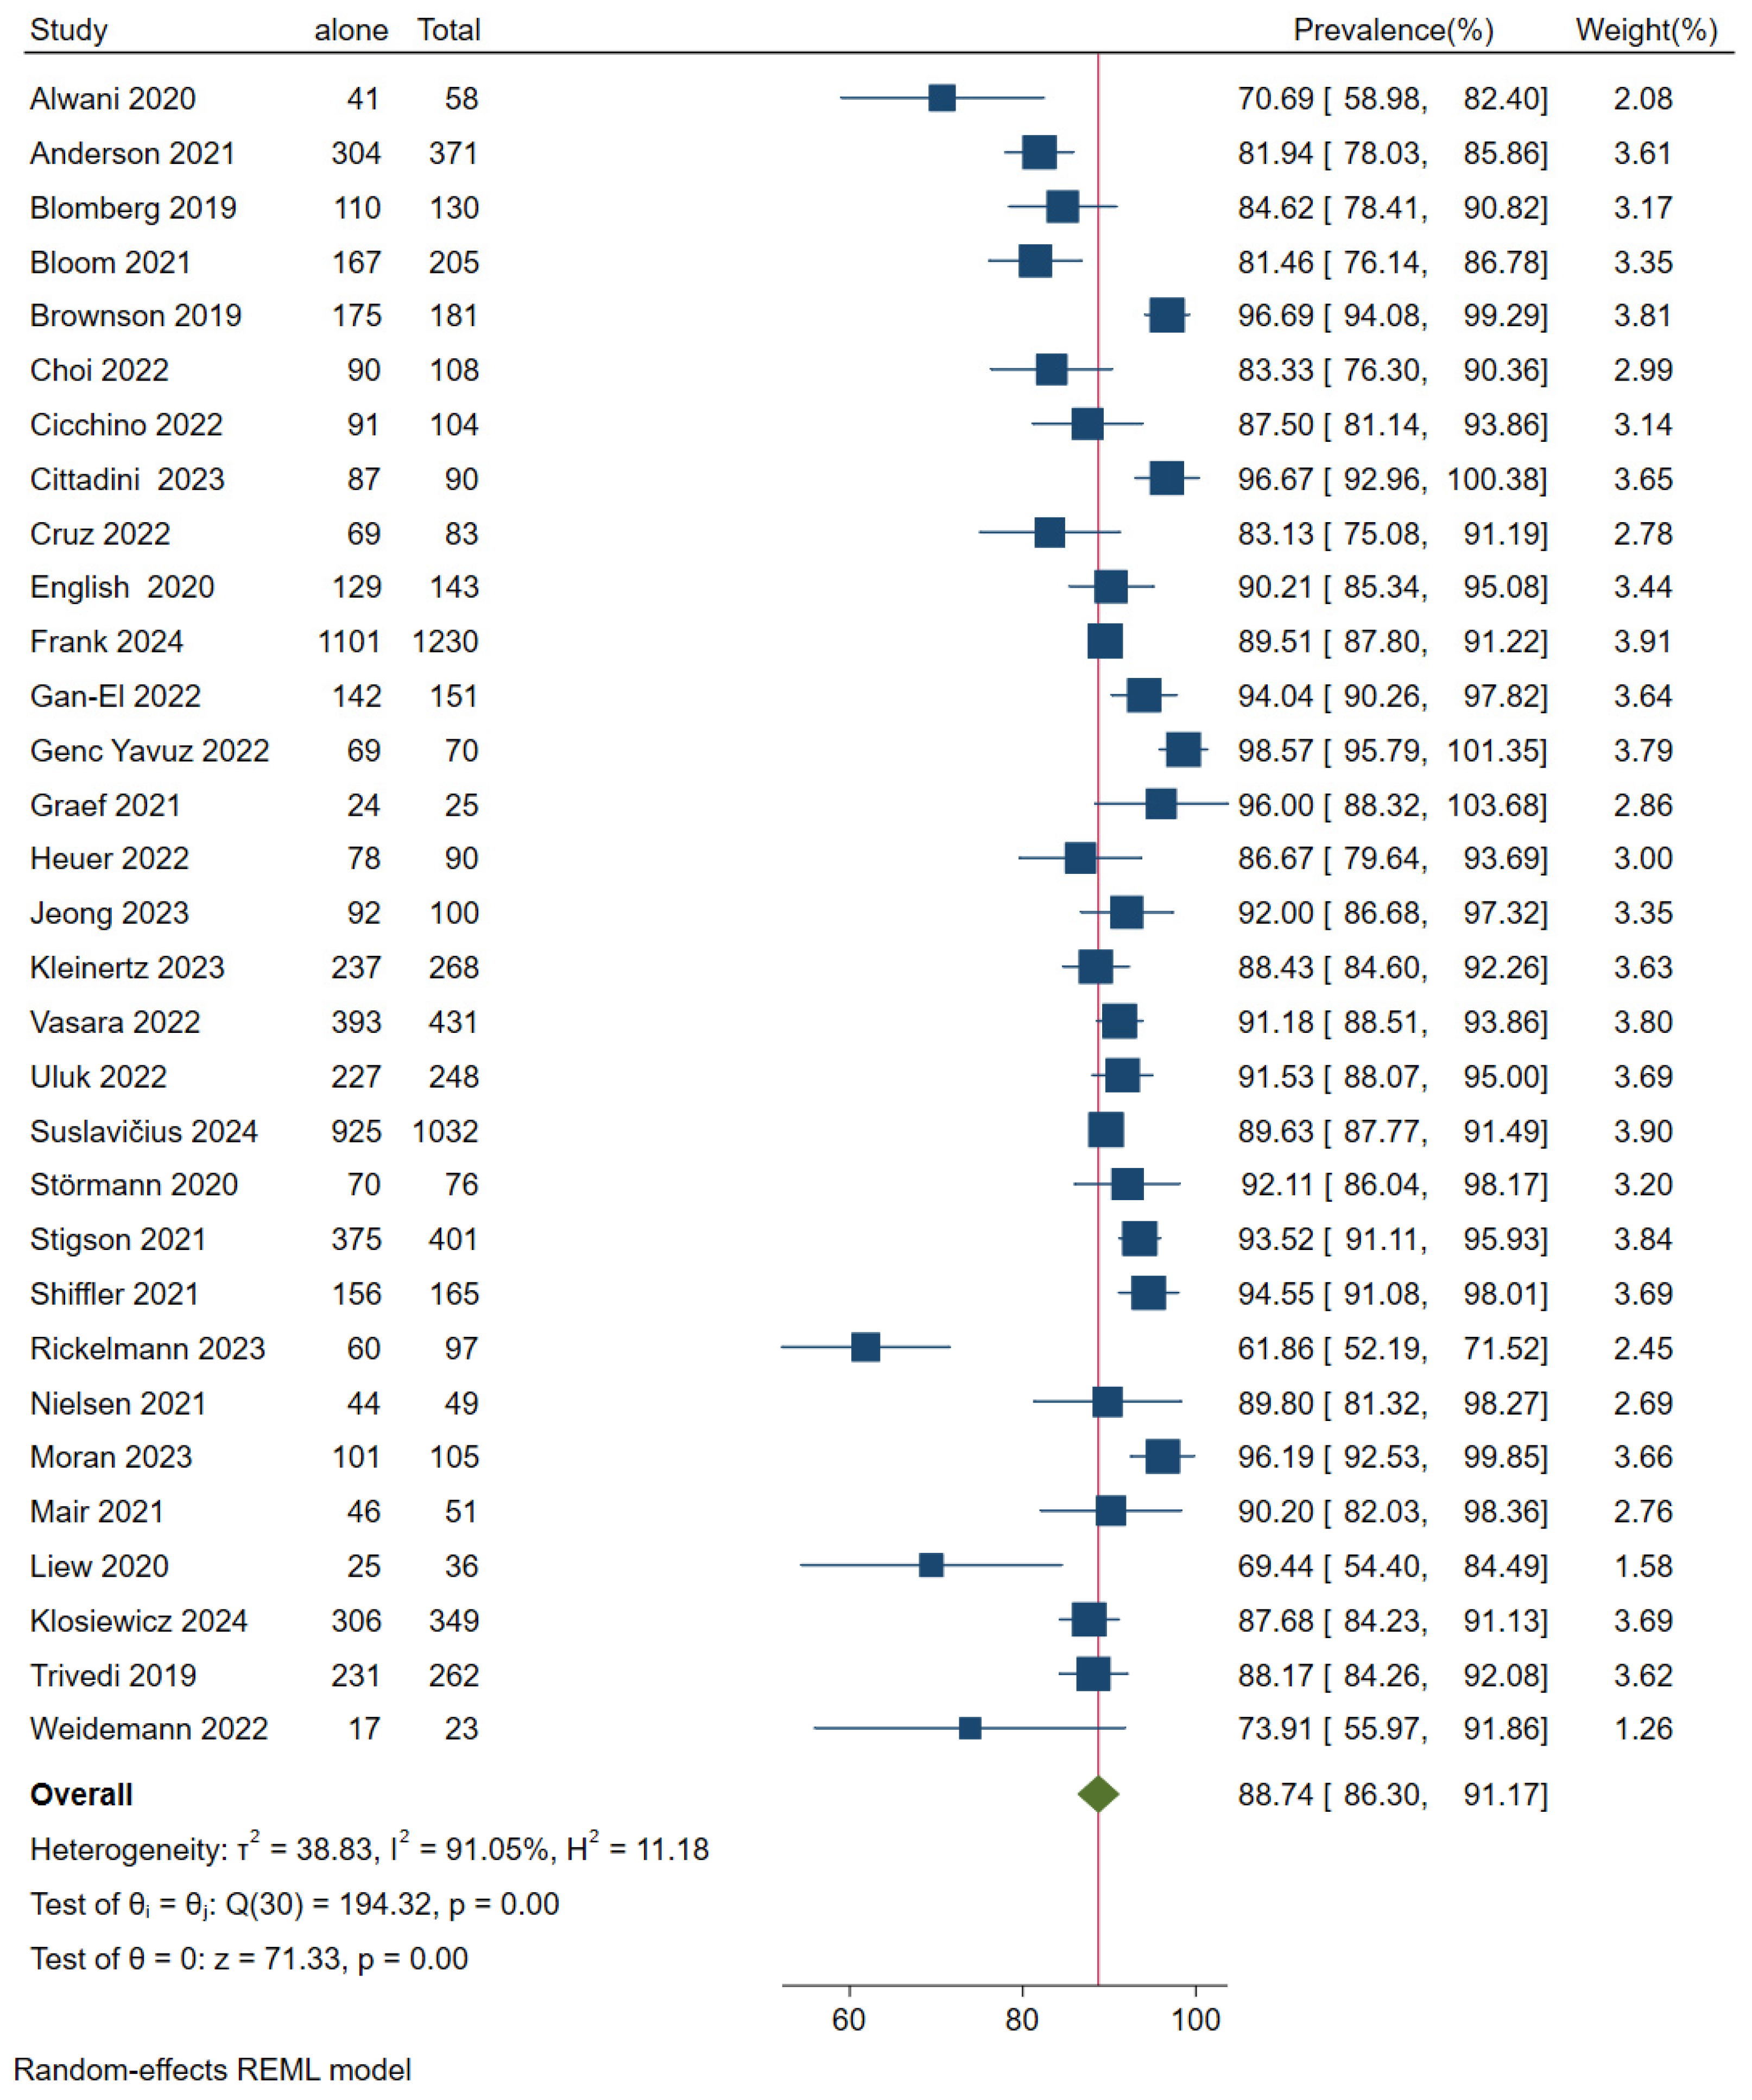
Figure A14.
Proportion of e-scooter riders. The blue square represents the study-specific prevalence, the horizontal line represent its 95% confidence interval. The green diamond represents the pooled prevalence across all studies, also indicated by a red vertical line. Included articles: Beck 2020 [69], Bekhit 2020 [70], Blomberg 2019 [77], Bloom 2021 [59], Cevik 2024 [15], Cruz 2022 [43], English 2020 [71], Frank 2024 [16], Gan-El 2022 [44], Graef 2021 [60], Harbrecht 2022 [46], Heuer 2022 [47], Jamieson 2023 [29], Kleinertz 2023 [31], Wüster 2021 [68], Vasara 2022 [55], Uluk 2022 [54], Tern 2023 [40], Suslavičius 2024 [22], Pourmand 2021 [64], Nielsen 2021 [63], Moran 2023 [36], Moftakhar 2021 [62], Mitchell 2019 [79], Trivedi 2019 [81].
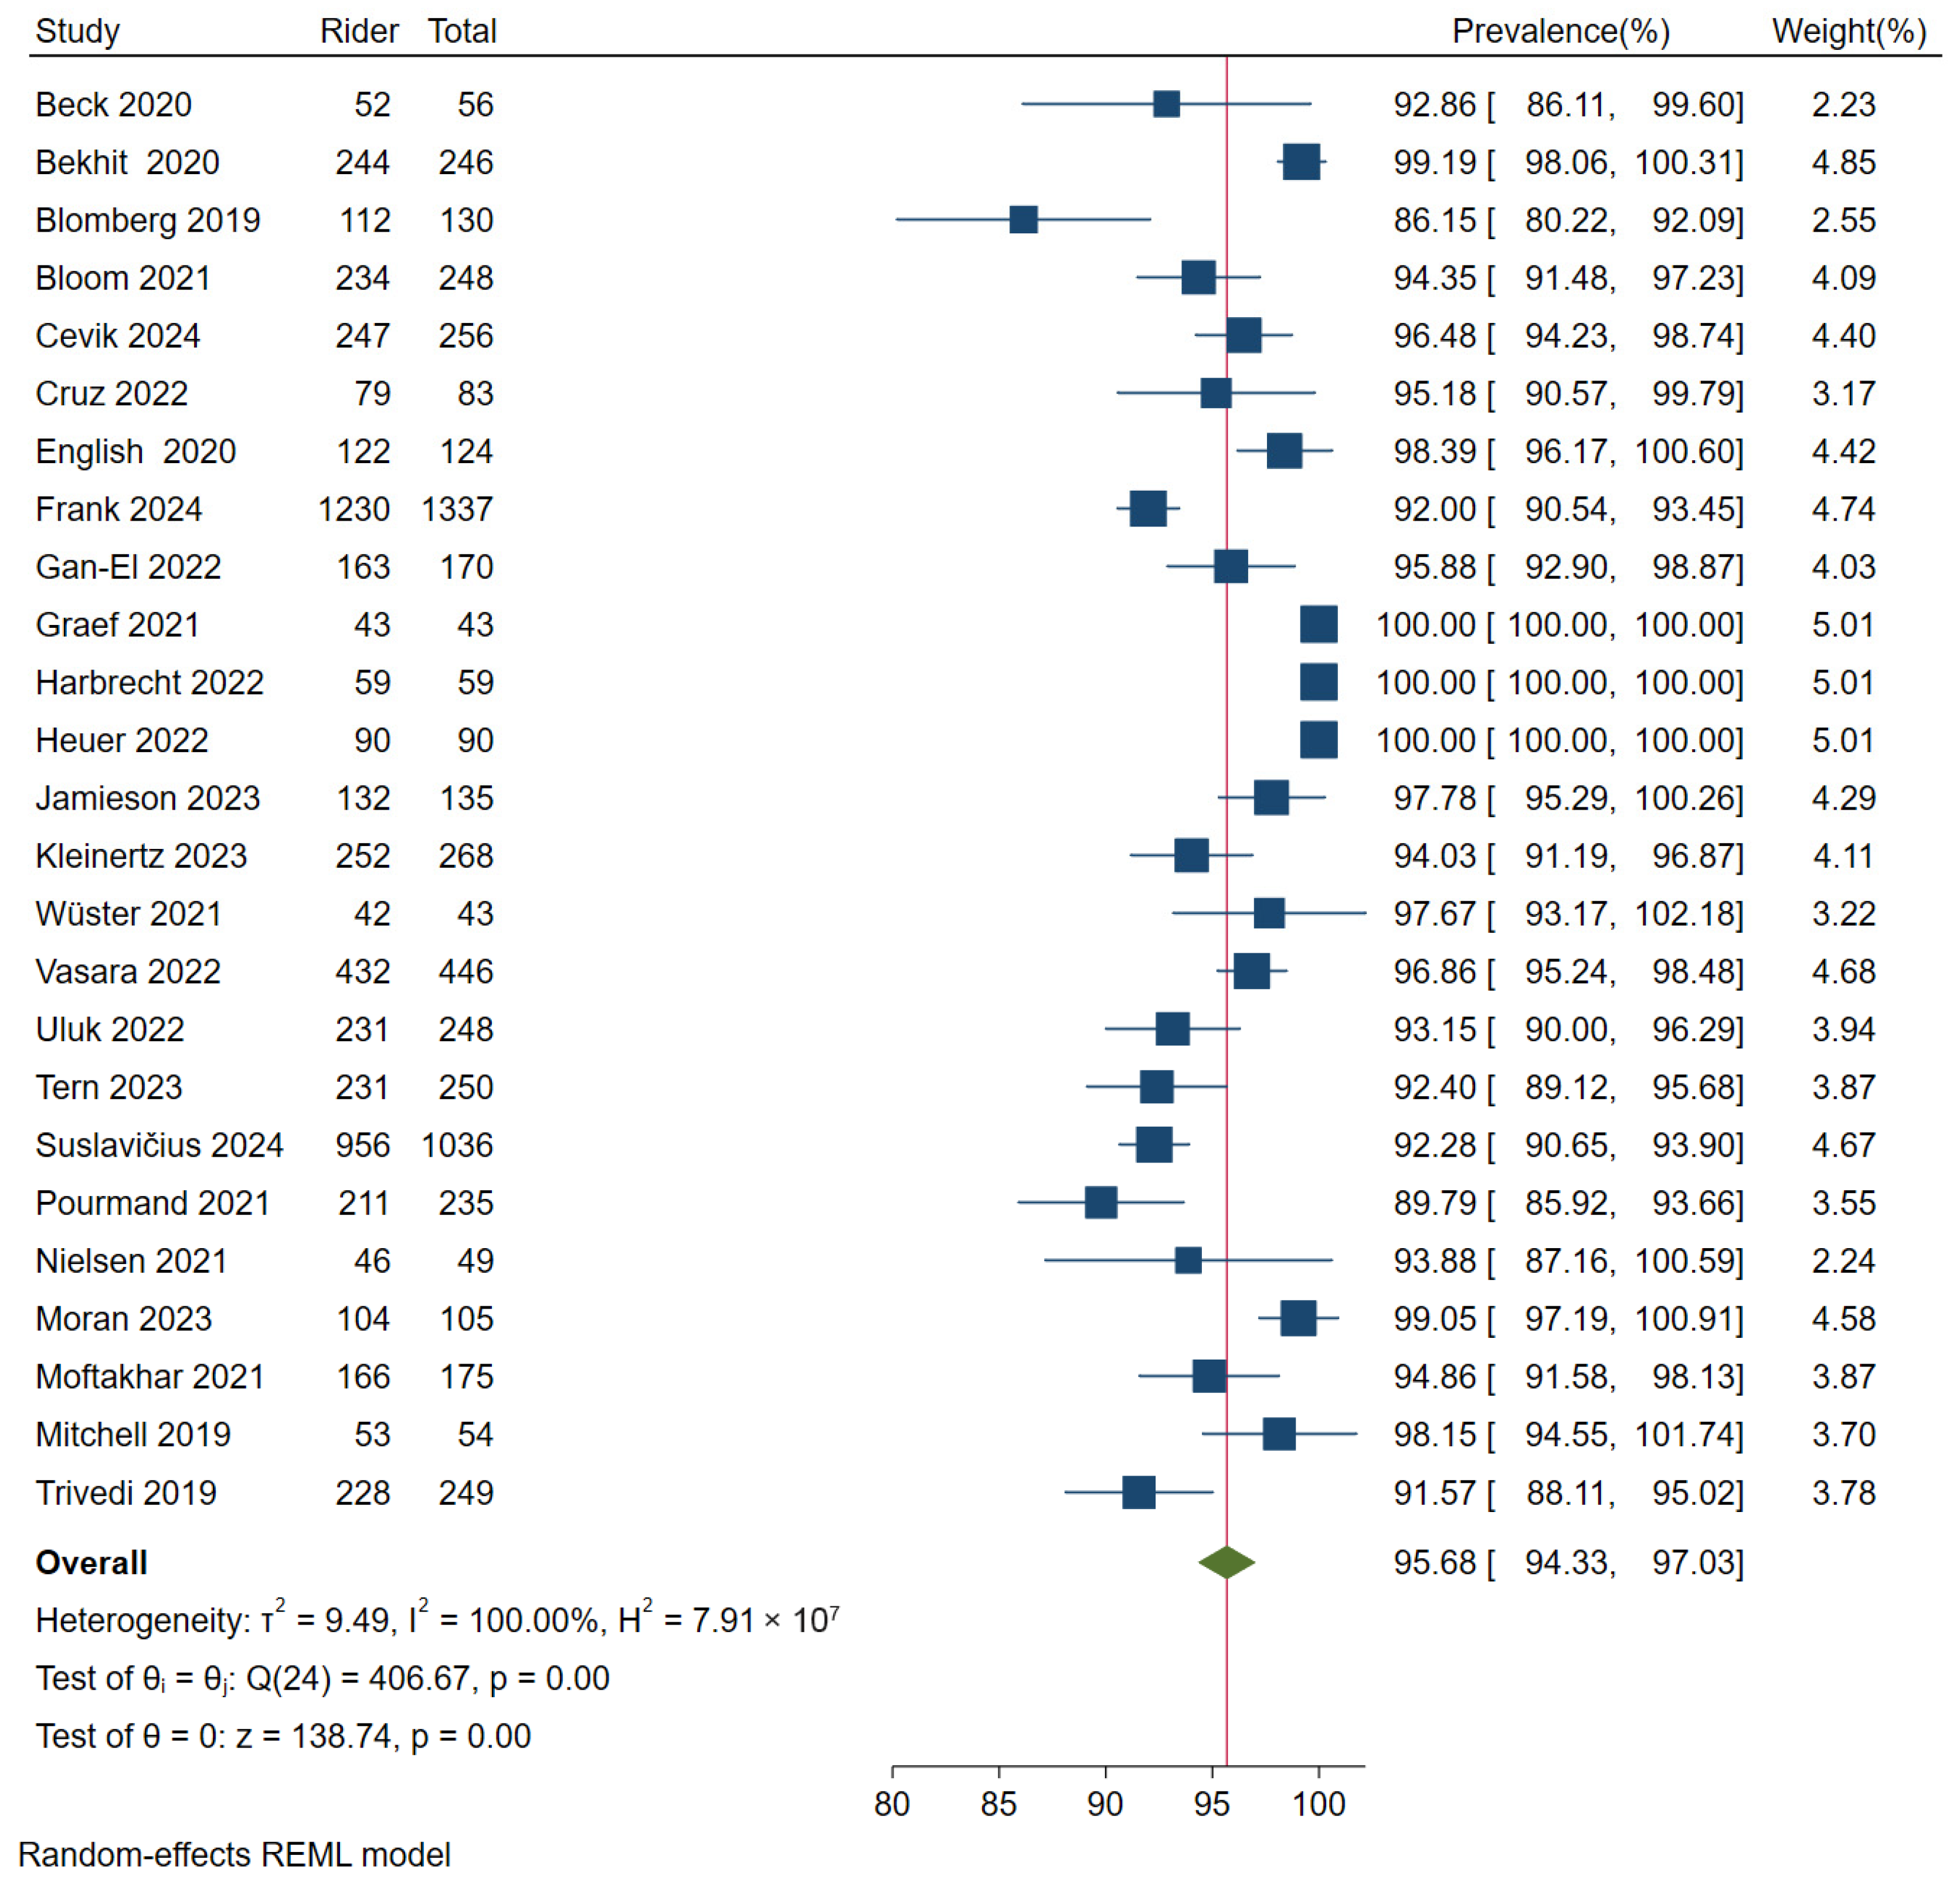
Figure A15.
Risk of bias assessment of each included study. Included articles: Azab 2022 [1], Ahluwalia 2023 [24], Alwani 2020 [68], Anderson 2021 [58], Andersson 2023 [25], Baca 2024 [83], Badeau 2019 [76], Beck 2020 [69], Bekhit 2020 [70], Benhamed 2023 [26], Blomberg 2019 [77], Bloom 2021 [59], Bracher 2023 [27], Briotti 2024 [43], Brownson 2019 [78], Cevik 2024 [15], Choi 2022 [41], Cicchino 2022 [42], Cittadini 2023 [28], Clough 2023 [83], Cruz 2022 [43], English 2020 [71], Frank 2024 [16], Gan-El 2022 [44], Genc Yavuz 2022 [45], Goh 2023 [4], Graef 2021 [60], Harbrecht 2022 [46], Heuer 2022 [47], Hoffeld 2022 [48], Jamieson 2023 [29], Jeong 2022 [30], Kahan 2024 [17], Kim SJ 2023 [2], Kim T 2023 [18], Kleinertz 2023 [31], Klosiewicz 2024 [19], Leyendecker 2023 [32], Liew 2020 [72], Linhart 2024 [20], Liukkonen 2023 [33], Mair 2020 [61], Metry 2024 [21], Meyer 2023 [34], Mitchell 2019 [79], Mitra 2023 [35], Moftakhar 2021 [62], Moran 2023 [36], Navarro 2022 [49], Neuroth 2022 [50], Nielsen 2021 [63], Niemann 2023 [3], Pakarinen 2023 [37], Pourmand 2021 [64], Puzio 2020 [73], Reito 2022 [51], Rickelmann 2023 [38], Sheikh 2022 [52], Sher 2023 [39], Shiffler 2021 [65], Singh 2022 [8], Spota 2024 [5], Stassen 2024 [6], Stigson 2021 [66], Störmann 2020 [74], Stray 2022 [53], Suslavičius 2024 [22], Tern 2023 [40], Toofany 2021 [7], Trivedi 2019 [80], Trivedi 2019 [81], Uluk 2022 [54], Vasara 2022 [55], Vernon 2020 [75], Wüster 2021 [67], Williams 2022 [57], Watson 2024 [23], Weidemann 2022 [56], Yarmohammadi 2020 [90], Yoo 2022 [91].
References
- Azab, M.; Gamboa, N.; Nadel, J.; Cutler, C.; Henson, J.C.; Lucke-Wold, B.; Panther, E.; Brandel, M.G.; Khalessi, A.A.; Rennert, R.C.; et al. Case Series and Systematic Review of Electronic Scooter Crashes and Severe Traumatic Brain Injury. World Neurosurg. 2022, 167, e184–e195. [Google Scholar] [CrossRef] [Scilit] [PubMed]
- Kim, S.J.; Lee, D.W. Epidemiology of Fractures Following Electric Scooter Injury. Indian J. Orthop. 2023, 57, 818–826. [Google Scholar] [CrossRef] [Scilit]
- Niemann, M.; Braun, K.F.; Otto, E.; Tiefenbrunner, M.; Wüster, J.; Stöckle, U.; Ahmad, S.S.; Märdian, S.; Graef, F. Dangers of e-mobility: A systematic review and meta-analysis of sustained injury patterns and injury severity. Saf. Sci. 2023, 167, 106283. [Google Scholar] [CrossRef] [Scilit]
- Goh, E.Z.; Beech, N.; Johnson, N.R. E-Scooters and Craniofacial Trauma: A Systematic Review. Craniomaxillofac. Trauma Reconstr. 2023, 16, 245–253. [Google Scholar] [CrossRef] [Scilit] [PubMed]
- Spota, A.; Granieri, S.; Ferrario, L.; Zamburlini, B.; Frassini, S.; Reitano, E.; Cioffi, S.P.B.; Altomare, M.; Bini, R.; Virdis, F.; et al. Injury Patterns of Electric-Scooter Related Trauma: A Systematic Review wth Proportion Meta-Analysis. Am. Surg. 2024, 90, 1702–1713. [Google Scholar] [CrossRef] [Scilit]
- Stassen, H.S.; Atalik, T.; Haagsma, J.A.; Wolvius, E.B.; Verdonschot, R.; Rozeboom, A.V.J. Effect of helmet use on maxillofacial injuries due to bicycle and scooter accidents: A systematic literature review and meta-analysis. Int. J. Oral Maxillofac. Surg. 2024, 53, 28–35. [Google Scholar] [CrossRef] [Scilit] [PubMed]
- Toofany, M.; Mohsenian, S.; Shum, L.K.; Chan, H.; Brubacher, J.R. Injury patterns and circumstances associated with electric scooter collisions: A scoping review. Inj. Prev. 2021, 27, 490–499. [Google Scholar] [CrossRef] [Scilit] [PubMed]
- Singh, P.; Jami, M.; Geller, J.; Granger, C.; Geaney, L.; Aiyer, A. The impact of e-scooter injuries: A systematic review of 34 studies. Bone Jt. Open. 2022, 3, 674–683. [Google Scholar] [CrossRef] [Scilit]
- Page, M.J.; Bossuyt, P.M.; Boutron, I.; Hoffmann, T.C.; Mulrow, C.D.; Shamseer, L.; Tetzlaff, J.M.; Akl, E.A.; Brennan, S.E.; Chou, R.; et al. The PRISMA 2020 statement: An updated guideline for reporting systematic reviews. BMJ 2021, 372. [Google Scholar] [CrossRef] [Scilit]
- Hoy, D.; Brooks, P.; Woolf, A.; Blyth, F.; March, L.; Bain, C.; Baker, P.; Smith, E.; Buchbinder, R. Assessing risk of bias in prevalence studies: Modification of an existing tool and evidence of interrater agreement. J. Clin. Epidemiol. 2012, 65, 934–939. [Google Scholar] [CrossRef] [Scilit]
- McGuinness, L.A.; Higgins, J.P.T. Risk-of-bias VISualization (robvis): An R package and Shiny web app for visualizing risk-of-bias assessments. Res. Synth. Methods 2021, 12, 55–61. [Google Scholar] [CrossRef] [Scilit] [PubMed]
- StataCorp. Stata Statistical Software, Release 16; StataCorp LLC: College Station, TX, USA, 2020.
- Higgins, J.P.T.; Thompson, S.G.; Deeks, J.J.; Altman, D.G. Measuring inconsistency in meta-analyses. BMJ 2003, 327, 557. [Google Scholar] [CrossRef] [Scilit]
- Briotti, J.; Sexton, L.; Robson, J.; Nasim, S. A 12-month retrospective cohort study investigating the incidence and short-term outcomes of e-scooter injuries in regional Western Australia. ANZ J. Surg. 2024, 94, 1995–1999. [Google Scholar] [CrossRef] [Scilit]
- Cevik, J.; Read, D.; Putland, M.; Fazio, T.; Gumm, K.; Varma, A.; Santos, R.; Ramakrishnan, A. The impact of electric scooters in Melbourne: Data from a major trauma service. ANZ J. Surg. 2024, 94, 572–579. [Google Scholar] [CrossRef] [Scilit]
- Frank, S.; Sator, T.; Kinsky, R.M.; Frank, J.K.; Frank, R.; Fialka, C.; Mittermayr, R.; Boesmueller, S. Continuously increasing e-scooter accidents and their possible prevention in a large European city. Eur. J. Trauma Emerg. Surg. 2024, 50, 2895–2904. [Google Scholar] [CrossRef] [Scilit]
- Kahan, R.; Higinbotham, S.; Garoosi, K.; Lauder, A. Electric Scooter-related Injuries Are Becoming More Frequent and Costly in Denver, CO. Clin. Orthop. Relat. Res. 2025, 483, 318–326. [Google Scholar] [CrossRef] [Scilit] [PubMed]
- Kim, T.G.; Choi, J.G.; Heo, Y.M.; Yi, J.W.; Yeo, I.U.; Ryu, H.S.; Choi, H.S.; Song, J.H. Epidemiology and Characteristics of Ankle and Foot Injuries in Electric Scooter-Related Accidents. Clin. Orthop. Surg. 2024, 16, 326–334. [Google Scholar] [CrossRef]
- Klosiewicz, T.; Konieczka, P.; Rutkowska, D.; Duchan-Ogrodnik, D.P.; Zasada, W.; Cholerzynska, H.; Rozmarynowska, M.; Bednorz, M.; Jodlowski, L. Burden and Patterns of Electric Scooter-Related Injuries: Insights from 2 Polish Emergency Departments. Med. Sci. Monit. 2024, 30, e944448. [Google Scholar] [CrossRef] [Scilit]
- Linhart, C.; Jagerhuber, L.; Ehrnthaller, C.; Schrempf, J.; Kussmaul, A.C.; Neuerburg, C.; Bocker, W.; Lampert, C. E-scooter accidents-epidemiology and injury patterns: 3-year results from a level 1 trauma center in Germany. Arch. Orthop. Trauma Surg. 2024, 144, 1621–1626. [Google Scholar] [CrossRef] [Scilit] [PubMed]
- Metry, A.; Manzoor, N.; Wattage, K.; Hussain, F.; Khilla, K.; Sain, A.; Sohail, Z. Observational Study of the Clinical Impact of E-scooter Injuries at a Major Trauma Centre. Cureus 2024, 16, e68788. [Google Scholar] [CrossRef] [Scilit]
- Suslavicius, K.A.; Utkus, S.; Uvarovas, V.; Sveikata, T.; Ryliskis, S. Unveiling the Surge: A Comprehensive Analysis of E-Scooter-Related Injuries at an Urban Level 1 Trauma Center in Vilnius, Lithuania (2018–2021). Cureus 2024, 16, e54616. [Google Scholar] [CrossRef] [Scilit] [PubMed]
- Watson, N.; Droder, B.; Mitchell, G.; Hacking, C. Head, face and neck injury patterns for electric scooter accidents identified on computed tomography scanning: Does legislative change enforcing safer riding practices have an impact on morbidity for significant head, face and neck trauma? J. Med. Imaging Radiat. Oncol. 2024, 68, 796–804. [Google Scholar] [CrossRef] [Scilit]
- Ahluwalia, R.; Grainger, C.; Coffey, D.; Malhotra, P.S.; Sommerville, C.; Tan, P.S.; Johal, K.; Sivaprakasam, M.; Almousa, O.; Janakan, G.; et al. The e-scooter pandemic at a UK Major Trauma Centre: A cost-based cohort analysis of injury presentation and treatment. Surgeon 2023, 21, 256–262. [Google Scholar] [CrossRef] [Scilit]
- Andersson, O.; Djärv, T. Electric scooter accidents leading to emergency department visits: Influence of alcohol and outcomes in Stockholm, Sweden. Sci. Rep. 2023, 13, 5946. [Google Scholar] [CrossRef] [Scilit]
- Benhamed, A.; Gossiome, A.; Ndiaye, A.; Tazarourte, K. Characteristics and comparison between e-scooters and bicycle-related trauma: A multicentre cross-sectional analysis of data from a road collision registry. BMC Emerg. Med. 2022, 22, 164. [Google Scholar] [CrossRef] [Scilit]
- Bracher, A.I.; Klingler, S.; Koba, S.; Jakob, D.A.; Exadaktylos, A.; Klukowska-Rotzler, J.; Burkhard, J.P. Trauma Characteristics Associated with E-Scooter Accidents in Switzerland-A Case Series Study. Int. J. Environ. Res. Public Health 2023, 20, 4233. [Google Scholar] [CrossRef] [Scilit]
- Cittadini, F.; Aulino, G.; Petrucci, M.; Valentini, S.; Covino, M. Electric scooter-related accidents: A possible protective effect of helmet use on the head injury severity. Forensic Sci. Med. Pathol. 2023, 19, 319–324. [Google Scholar] [CrossRef] [Scilit]
- Jamieson, J.; Hawkins, J.; Collins, C.; Mahoney, A. The rise and falls of electronic scooters: A Tasmanian perspective on electronic scooter injuries. Emerg. Med. Australas. 2023, 35, 159–161. [Google Scholar] [CrossRef] [Scilit] [PubMed]
- Jeong, Y.W.; Seo, Y.H.; Kang, S. Will the road traffic act reduce electric scooter injuries?: An observational study in Republic of Korea. Signa Vitae 2022, 19, 97–103. [Google Scholar] [CrossRef] [Scilit]
- Kleinertz, H.; Volk, A.; Dalos, D.; Rutkowski, R.; Frosch, K.H.; Thiesen, D.M. Risk factors and injury patterns of e-scooter associated injuries in Germany. Sci. Rep. 2023, 13, 706. [Google Scholar] [CrossRef] [Scilit]
- Leyendecker, J.; Hackl, M.; Leschinger, T.; Bredow, J.; Krane, F.; Eysel, P.; Muller, L.P.; Harbrecht, A. Lessons learned? Increasing injury severity of electric-scooter accidents over a period of one year: A monocentric follow-up study at a level 1 trauma center. Eur. J. Orthop. Surg. Traumatol. 2023, 33, 3643–3648. [Google Scholar] [CrossRef] [Scilit] [PubMed]
- Liukkonen, R.; Aarnikko, H.; Stenman, P.; Ovaska, S.; Reito, A. Association of Nighttime Speed Limits and Electric Scooter-Related Injuries. JAMA Netw. Open 2023, 6, e2320868. [Google Scholar] [CrossRef] [Scilit] [PubMed]
- Meyer, H.L.; Kauther, M.D.; Polan, C.; Abel, B.; Vogel, C.; Mester, B.; Burggraf, M.; Dudda, M. E-scooter, e-bike and bicycle injuries in the same period-A prospective analysis of a level 1 trauma center. Unfallchirurgie 2023, 126, 208–217. [Google Scholar] [CrossRef] [Scilit] [PubMed]
- Mitra, B.; Heald, E.; Sri-Ganeshan, M.; MacSuibhne, E.; Edwards, E.; Cameron, P.A. Electric scooter-related trauma, alcohol and other drugs. Emerg. Med. Australas. 2023, 35, 353–356. [Google Scholar] [CrossRef] [Scilit]
- Moran, J.; Buck, A.; Williams, J.; Piatkowski, T.; Unnikrishnan, R. Impact on the health service in the Top End, Northern Territory following the introduction of an electric scooter sharing service. Emerg. Med. Australas. 2023, 35, 194–199. [Google Scholar] [CrossRef] [Scilit]
- Pakarinen, O.; Kobylin, A.; Harjola, V.P.; Castren, M.; Vasara, H. Speed and Nighttime Usage Restrictions and the Incidence of Shared Electric Scooter Injuries. JAMA Netw. Open 2023, 6, e2341194. [Google Scholar] [CrossRef] [Scilit]
- Rickelmann, A.D.; Nguyen, T.M.; Martyak, M.T. Injury Patterns Associated with Electronic Scooter Crashes: An Institutional Observational Study. Am. Surg. 2023, 89, 3505–3507. [Google Scholar] [CrossRef] [Scilit]
- Sher, T.; Shah, J.; Holbrook, E.A.; Thomas, A.; Wilson, J. Electric Scooter Injuries in Tampa, Florida, Are Associated with High Rates of Head Injury, Hospital Admission, and Emergency Medical Service Transport and Low Rates of Helmet Use. Cureus 2023, 15, e39523. [Google Scholar] [CrossRef] [Scilit]
- TERN. Multicentre prospective observational study to evaluate healthcare impacts of e-scooters on emergency departments. Emerg. Med. J. 2023, 40, 785–786. [Google Scholar] [CrossRef] [Scilit]
- Choi, J.H.; Oh, S.S.; Kim, K.S.; Hwang, J.H.; Lee, S.Y. Electric Scooter-Related Trauma in Korea. J. Korean Med. Sci. 2022, 37, e181. [Google Scholar] [CrossRef] [Scilit]
- Cicchino, J.B.; Kulie, P.E.; McCarthy, M.L. Severity of e-scooter rider injuries associated with trip characteristics. J. Safety Res. 2021, 76, 256–261. [Google Scholar] [CrossRef] [Scilit]
- Cruz, N.J.M.D.; Morgan, C.; Morgan, R.V.; Tanna, S.; Talwar, C.; Dattani, R.; Sarraf, K.M.; Gibbons, C.E.R. Injury patterns of e-scooter-related orthopaedic trauma in central London: A multicentre study. Ann. R. Coll. Surg. Engl. 2021, 104, 187–194. [Google Scholar] [CrossRef] [Scilit]
- Gan-El, E.; Ngatchou Djomo, W.; Pascu Ciobanu, A.M.; Kaufman, L.; Nde Djiele, F.; Ulrix, M.; Kreps, B.; Plumacker, A.; Malinverni, S.; Bartiaux, M.; et al. Risk assessment, consequences, and epidemiology of electric scooter accidents admitted to an emergency department: A prospective observational study. Eur. J. Trauma Emerg. Surg. 2022, 48, 4847–4855. [Google Scholar] [CrossRef] [Scilit] [PubMed]
- Genc Yavuz, B.; Zengin Temel, T.; Satilmis, D.; Guven, R.; Colak, S. Analysis of electric scooter injuries admitted to the emergency service. Ir. J. Med. Sci. 2022, 191, 915–918. [Google Scholar] [CrossRef] [Scilit]
- Harbrecht, A.; Hackl, M.; Leschinger, T.; Uschok, S.; Wegmann, K.; Eysel, P.; Muller, L.P. What to expect? Injury patterns of Electric-Scooter accidents over a period of one year—A prospective monocentric study at a Level 1 Trauma Center. Eur. J. Orthop. Surg. Traumatol. 2022, 32, 641–647. [Google Scholar] [CrossRef] [Scilit]
- Heuer, S.; Landschoof, S.; Kornherr, P.; Grospietsch, B.; Kuhne, C.A. Epidemiology and Injury Pattern of E-Scooter Injuries—Initial Results. Z. Orthop. Unfall. 2022, 160, 559–563. [Google Scholar] [CrossRef] [Scilit] [PubMed]
- Hoffeld, K.; Mair, O.; Wurm, M.; Zehnder, P.; Pforringer, D.; Biberthaler, P.; Kirchhoff, C.; Zyskowski, M. Is the Use of Segways or E-Scooters in Urban Areas a Potential Health Risk? A Comparison of Trauma Consequences. Medicina 2022, 58, 1033. [Google Scholar] [CrossRef] [Scilit] [PubMed]
- Navarro, S.M.; Vakayil, V.R.; Solaiman, R.H.; Keil, E.J.; Cohen, M.W.; Spartz, E.J.; Tignanelli, C.J.; Harmon, J.V., Jr. Risk of hospital admission related to scooter trauma injuries: A national emergency room database study. BMC Emerg. Med. 2022, 22, 150. [Google Scholar] [CrossRef] [Scilit]
- Neuroth, L.M.; Humphries, K.D.; Wing, J.J.; Smith, G.A.; Zhu, M. Motor vehicle-related electric scooter injuries in the US: A descriptive analysis of NEISS data. Am. J. Emerg. Med. 2022, 55, 1–5. [Google Scholar] [CrossRef] [Scilit]
- Reito, A.; Oljymaki, E.; Franssila, M.; Mattila, V.M. Incidence of Electric Scooter-Associated Injuries in Finland from 2019 to 2021. JAMA Netw. Open 2022, 5, e227418. [Google Scholar] [CrossRef] [Scilit]
- Sheikh, M.; Islam, A.; Kroeker, N.; Walia, H.; Koger, K.; Lang, E.; Sedor, A.; VandenBerg, S.D. Electric scooter related injuries in Calgary emergency departments. Can. J. Emerg. Med. 2022, 24, 735–741. [Google Scholar] [CrossRef] [Scilit]
- Stray, A.V.; Siverts, H.; Melhuus, K.; Enger, M.; Galteland, P.; Næss, I.; Helseth, E.; Ramm-Pettersen, J. Characteristics of Electric Scooter and Bicycle Injuries After Introduction of Electric Scooter Rentals in Oslo, Norway. JAMA Netw. Open 2022, 5, e2226701. [Google Scholar] [CrossRef] [Scilit]
- Uluk, D.; Lindner, T.; Dahne, M.; Bickelmayer, J.W.; Beyer, K.; Slagman, A.; Jahn, F.; Willy, C.; Möckel, M.; Gerlach, U.A. E-scooter incidents in Berlin: An evaluation of risk factors and injury patterns. Emerg. Med. J. 2022, 39, 295–300. [Google Scholar] [CrossRef] [Scilit]
- Vasara, H.; Toppari, L.; Harjola, V.-P.; Virtanen, K.; Castrén, M.; Kobylin, A. Characteristics and costs of electric scooter injuries in Helsinki: A retrospective cohort study. Scand. J. Trauma Resusc. Emerg. Med. 2022, 30, 57. [Google Scholar] [CrossRef] [Scilit]
- Weidemann, F.; Schröder, B.; Johannsen, H.; Christian, K.; Sebastian, D. E-scooter crashes: Are they a risky underestimated new mode of transport? A medical and technical assessment. Arch. Trauma Res. 2021, 10, 215–220. [Google Scholar] [CrossRef] [Scilit]
- Williams, C.; Bitter, C.C.; Lorber, S.; Overfelt, C.R.; Zehfus, H.; Spangler, A.; Lew, V.; Lewis, L.M.; Naunheim, R.S. Incidence of Emergency Department Visits for Electric Rental Scooters Using Detailed Ridership Data. West J. Emerg. Med. 2022, 23, 174–182. [Google Scholar] [CrossRef] [Scilit] [PubMed]
- Anderson, B.; Rupp, J.D.; Moran, T.P.; Hudak, L.A.; Wu, D.T. The Effect of Nighttime Rental Restrictions on E-Scooter Injuries at a Large Urban Tertiary Care Center. Int. J. Environ. Res. Public Health 2021, 18, 10281. [Google Scholar] [CrossRef] [Scilit] [PubMed]
- Bloom, M.B.; Noorzad, A.; Lin, C.; Little, M.; Lee, E.Y.; Margulies, D.R.; Torbati, S.S. Standing electric scooter injuries: Impact on a community. Am. J. Surg. 2021, 221, 227–232. [Google Scholar] [CrossRef] [Scilit]
- Graef, F.; Doll, C.; Niemann, M.; Tsitsilonis, S.; Stockle, U.; Braun, K.F.; Wuster, J.; Mardian, S. Epidemiology, Injury Severity, and Pattern of Standing E-Scooter Accidents: 6-Month Experience from a German Level I Trauma Center. Clin. Orthop. Surg. 2021, 13, 443–448. [Google Scholar] [CrossRef] [Scilit] [PubMed]
- Mair, O.; Wurm, M.; Muller, M.; Greve, F.; Pesch, S.; Pforringer, D.; Biberthaler, P.; Kirchhoff, C.; Zyskowski, M. E-scooter accidents and their consequences: First prospective analysis of the injury rate and injury patterns in the urban area of a German city with over 1 million residents. Unfallchirurg 2021, 124, 382–390. [Google Scholar] [CrossRef] [Scilit]
- Moftakhar, T.; Wanzel, M.; Vojcsik, A.; Kralinger, F.; Mousavi, M.; Hajdu, S.; Aldrian, S.; Starlinger, J. Incidence and severity of electric scooter related injuries after introduction of an urban rental programme in Vienna: A retrospective multicentre study. Arch. Orthop. Trauma Surg. 2021, 141, 1207–1213. [Google Scholar] [CrossRef] [Scilit]
- Nielsen, K.I.; Nielsen, F.E.; Rasmussen, S.W. Injuries following accidents with electric scooters. Dan. Med. J. 2021, 68, A09200697. [Google Scholar] [PubMed]
- Pourmand, A.; Boniface, K.S.; Douglass, K.; Hood, C.; Frasure, S.E.; Barnett, J.; Bhatt, K.; Sikka, N. Utilization of Automated Keyword Search to Identify E-Scooter Injuries in the Emergency Department. Cureus 2021, 13, e19539. [Google Scholar] [CrossRef] [Scilit] [PubMed]
- Shiffler, K.; Mancini, K.; Wilson, M.; Huang, A.; Mejia, E.; Yip, F.K. Intoxication is a Significant Risk Factor for Severe Craniomaxillofacial Injuries in Standing Electric Scooter Accidents. J. Oral Maxillofac. Surg. 2021, 79, 1084–1090. [Google Scholar] [CrossRef] [Scilit] [PubMed]
- Stigson, H.; Malakuti, I.; Klingegard, M. Electric scooters accidents: Analyses of two Swedish accident data sets. Accid. Anal. Prev. 2021, 163, 106466. [Google Scholar] [CrossRef] [Scilit]
- Wüster, J.; Voß, J.; Koerdt, S.; Beck-Broichsitter, B.; Kreutzer, K.; Märdian, S.; Lindner, T.; Heiland, M.; Doll, C. Impact of the Rising Number of Rentable E-Scooter Accidents on Emergency Care in Berlin 6 Months After the Introduction: A Maxillofacial Perspective. Craniomaxillofac. Trauma Reconstr. 2021, 14, 43–48. [Google Scholar] [CrossRef] [Scilit]
- Alwani, M.; Jones, A.J.; Sandelski, M.; Bandali, E.; Lancaster, B.; Sim, M.W.; Shipchandler, T.; Ting, J. Facing Facts: Facial Injuries from Stand-up Electric Scooters. Cureus 2020, 12, e6663. [Google Scholar] [CrossRef] [Scilit]
- Beck, S.; Barker, L.; Chan, A.; Stanbridge, S. Emergency department impact following the introduction of an electric scooter sharing service. Emerg. Med. Australas. 2020, 32, 409–415. [Google Scholar] [CrossRef] [Scilit]
- Bekhit, M.N.Z.; Le Fevre, J.; Bergin, C.J. Regional healthcare costs and burden of injury associated with electric scooters. Injury 2020, 51, 271–277. [Google Scholar] [CrossRef] [Scilit]
- English, K.C.; Allen, J.R.; Rix, K.; Zane, D.F.; Ziebell, C.M.; Brown, C.V.R.; Brown, L.H. The characteristics of dockless electric rental scooter-related injuries in a large U.S. city. Traffic Inj. Prev. 2020, 21, 476–481. [Google Scholar] [CrossRef] [Scilit]
- Liew, Y.K.; Wee, C.P.J.; Pek, J.H. New peril on our roads: A retrospective study of electric scooter-related injuries. Singapore Med. J. 2020, 61, 92–95. [Google Scholar] [CrossRef] [Scilit]
- Puzio, T.J.; Murphy, P.B.; Gazzetta, J.; Dineen, H.A.; Savage, S.A.; Streib, E.W.; Zarzaur, B.L. The electric scooter: A surging new mode of transportation that comes with risk to riders. Traffic Inj. Prev. 2020, 21, 175–178. [Google Scholar] [CrossRef] [Scilit]
- Stormann, P.; Klug, A.; Nau, C.; Verboket, R.D.; Leiblein, M.; Muller, D.; Schweigkofler, U.; Hoffmann, R.; Marzi, I.; Lustenberger, T. Characteristics and Injury Patterns in Electric-Scooter Related Accidents-A Prospective Two-Center Report from Germany. J. Clin. Med. 2020, 9, 1569. [Google Scholar] [CrossRef] [Scilit]
- Vernon, N.; Maddu, K.; Hanna, T.N.; Chahine, A.; Leonard, C.E.; Johnson, J.O. Emergency department visits resulting from electric scooter use in a major southeast metropolitan area. Emerg. Radiol. 2020, 27, 469–475. [Google Scholar] [CrossRef] [Scilit]
- Badeau, A.; Carman, C.; Newman, M.; Steenblik, J.; Carlson, M.; Madsen, T. Emergency department visits for electric scooter-related injuries after introduction of an urban rental program. Am. J. Emerg. Med. 2019, 37, 1531–1533. [Google Scholar] [CrossRef] [Scilit] [PubMed]
- Blomberg, S.N.F.; Rosenkrantz, O.C.M.; Lippert, F.; Collatz Christensen, H. Injury from electric scooters in Copenhagen: A retrospective cohort study. BMJ Open 2019, 9, e033988. [Google Scholar] [CrossRef] [Scilit]
- Brownson, A.B.; Fagan, P.V.; Dickson, S.; Civil, I.D. Electric scooter injuries at Auckland City Hospital. N. Z. Med. J. 2019, 132, 62–72. [Google Scholar] [PubMed]
- Mitchell, G.; Tsao, H.; Randell, T.; Marks, J.; Mackay, P. Impact of electric scooters to a tertiary emergency department: 8-week review after implementation of a scooter share scheme. Emerg. Med. Australas. 2019, 31, 930–934. [Google Scholar] [CrossRef] [Scilit]
- Trivedi, B.; Kesterke, M.J.; Bhattacharjee, R.; Weber, W.; Mynar, K.; Reddy, L.V. Craniofacial Injuries Seen with the Introduction of Bicycle-Share Electric Scooters in an Urban Setting. J. Oral Maxillofac. Surg. 2019, 77, 2292–2297. [Google Scholar] [CrossRef] [Scilit] [PubMed]
- Trivedi, T.K.; Liu, C.; Antonio, A.L.M.; Wheaton, N.; Kreger, V.; Yap, A.; Schriger, D.; Elmore, J.G. Injuries Associated with Standing Electric Scooter Use. JAMA Netw. Open 2019, 2, e187381. [Google Scholar] [CrossRef] [Scilit]
- Copes, W.S.; Champion, H.R.; Sacco, W.J.; Lawnick, M.M.; Keast, S.L.; Bain, L.W. The Injury Severity Score Revisited. J. Trauma Acute Care Surg. 1988, 28, 69–77. [Google Scholar] [CrossRef] [Scilit]
- Baca, E.; Kaya, M.G.; Yalın, M. Unconventional mobility, conventional trauma: A comparative analysis of e-scooter-related fractures. Eur. J. Trauma Emerg. Surg. 2024, 50, 1145–1151. [Google Scholar] [CrossRef] [Scilit] [PubMed]
- Clough, R.A.; Platt, E.; Cole, E.; Wilson, M.; Aylwin, C. Major trauma among E-Scooter and bicycle users: A nationwide cohort study. Inj. Prev. 2023, 29, 121. [Google Scholar] [CrossRef] [Scilit] [PubMed]
- Hartz, F.; Zehnder, P.; Resch, T.; Römmermann, G.; Schwarz, M.; Kirchhoff, C.; Biberthaler, P.; Lefering, R.; Zyskowski, M. Severe injuries in e-scooter accidents. Dtsch Arztebl Int. 2025, 122, 265–270. [Google Scholar] [PubMed]
- Kähler, A.; Püschel, K.; Ondruschka, B.; Müller, A.; Iwersen-Bergmann, S.; Sperhake, J.P.; Heinemann, A.; Fitzek, A. One and a half years of e-scooters in Hamburg. Rechtsmedizin 2023, 33, 163–169. [Google Scholar] [CrossRef] [Scilit] [PubMed]
- Haddad, H.; Sanderson, N.; Goodman, J. Shared E-Scooters and Gender Equity—Learning from Women’s Perceptions and Experiences. 2022. Available online: https://eu-central-1-shared-euc1-02.graphassets.com/AMcYXQcgeRNu5q0szWSm1z/WYUckylsRDGDsoihutL6 (accessed on 30 June 2025).
- Destatis (Statistisches Bundesamt). Verkehrsunfälle: Unfälle von Frauen und Männern im Straßenverkehr 2020. Available online: https://www.destatis.de/DE/Themen/Gesellschaft-Umwelt/Verkehrsunfaelle/Publikationen/Downloads-Verkehrsunfaelle/unfaelle-frauen-maenner-5462407207004.pdf?__blob=publicationFile (accessed on 20 January 2022).
- Destatis (Statistisches Bundesamt). E-Scooter-Unfälle: 42% der Verunglückten im Jahr 2023 Jünger als 25 Jahre. 2024. Available online: https://www.destatis.de/DE/Presse/Pressemitteilungen/2024/07/PD24_N037_462.html (accessed on 26 July 2024).
- Yarmohammadi, A.; Baxter, S.L.; Ediriwickrema, L.S.; Williams, E.C.; Kobayashi, L.M.; Liu, C.Y.; Korn, B.S.; Kikkawa, D.O. Characterization of Facial Trauma Associated with Standing Electric Scooter Injuries. Ophthalmology 2020, 127, 988–990. [Google Scholar] [CrossRef] [Scilit] [PubMed]
- Yoo, K.; Kim, H.I. Types of injuries caused by isolated electric scooter accidents. J. Trauma Inj. 2022, 35, 232–239. [Google Scholar] [CrossRef] [Scilit] [PubMed]



Disclaimer/Publisher’s Note: The statements, opinions and data contained in all publications are solely those of the individual author(s) and contributor(s) and not of MDPI and/or the editor(s). MDPI and/or the editor(s) disclaim responsibility for any injury to people or property resulting from any ideas, methods, instructions or products referred to in the content. |
© 2026 by the authors. Licensee MDPI, Basel, Switzerland. This article is an open access article distributed under the terms and conditions of the Creative Commons Attribution (CC BY) license.