


Abstract
Background/Objectives: Pathological complete response (pCR) after neoadjuvant chemotherapy (NAC) is a validated surrogate endpoint in HER2-positive and triple-negative breast cancer. Most work on blood-count-derived inflammatory indices has examined a single pretreatment value rather than change during treatment. We tested whether an early reduction in the pan-immune-inflammation value (PIV) predicts pCR. Methods: We studied 272 patients with HER2-positive or triple-negative stage II–III breast cancer treated at one centre: a discovery cohort treated in 2018–2021 (n = 191) and a temporally independent validation cohort treated in 2022–2023 (n = 81). Early ΔPIV was the proportional change between the baseline complete blood count and the count before the second or third cycle. The 30% reduction threshold was fixed before the analysis for clinical interpretability. Reporting followed STROBE and TRIPOD. Results: pCR occurred in 157 patients (57.7%). The median early ΔPIV was −0.44 in patients with pCR and −0.11 in those without (p < 0.001). The area under the curve was 0.80 (95% CI 0.73–0.86) in the discovery cohort and 0.84 (0.75–0.93) in validation. pCR was reached by 78.6% of patients with a ≥30% early reduction versus 37.6% without it in the discovery cohort, and by 77.8% versus 27.8% in the validation cohort. In the primary three-variable model, the adjusted odds ratio was 6.45 (2.90–14.32; p < 0.001) in the discovery cohort and 27.85 (3.93–197.36; p < 0.001) in the validation cohort. Adding early PIV reduction to clinicopathologic factors raised the area under the curve from 0.69 to 0.80 (difference 0.111, 95% CI 0.047–0.175; p < 0.001). Conclusions: Early PIV reduction is associated with pCR and adds information beyond established factors. At 69% sensitivity and 73% specificity it is a candidate adjunct rather than a decision rule, and prospective multicentre validation is required.
1. Introduction
Breast cancer is the most frequently diagnosed cancer in women and a leading cause of cancer death [1]. In locally advanced and biologically aggressive disease, particularly HER2-positive and triple-negative tumours, neoadjuvant chemotherapy (NAC) is the standard first step [2,3]. Pathological complete response (pCR), defined as no residual invasive tumour in the breast and axilla, reflects how sensitive the disease is to systemic treatment and is an accepted surrogate endpoint in these two subtypes, where it is both common and prognostically informative [4,5]. It can only be confirmed after several months of treatment and definitive surgery.
Cancer-associated systemic inflammation supports tumour progression, angiogenesis, immune escape and treatment resistance [6,7,8,9]. Peripheral blood cell counts partly mirror this process, and several indices derived from the routine complete blood count (CBC) have been studied as prognostic markers: the neutrophil-to-lymphocyte ratio (NLR) [10,11], the platelet-to-lymphocyte ratio (PLR), the systemic immune-inflammation index (SII) [12] and the pan-immune-inflammation value (PIV) [13]. PIV combines neutrophil, platelet, monocyte and lymphocyte counts, and so samples four cell lineages rather than two. It was introduced in metastatic colorectal cancer [13] and its prognostic value there has since been confirmed in a meta-analysis [14]. In breast cancer, a high pretreatment NLR has been associated with worse survival [11,15,16] and, in triple-negative disease, with a lower chance of responding to NAC [17,18].
Almost all of this work rests on a single measurement taken before treatment. Systemic inflammation is not static, so the early trajectory of these markers may carry information that no baseline value can. Blood-count indices, including their change during treatment, have predicted outcome in lung cancer and melanoma [19,20,21] but have rarely been examined during NAC for breast cancer. The alternative early marker, tumour-infiltrating lymphocytes, does predict pCR [22,23,24,25] but requires tissue and cannot be repeated during treatment.
We therefore examined whether an early fall in PIV during NAC identifies patients who go on to achieve pCR. The primary outcome was pCR, and the primary predictor was an early ≥30% reduction in PIV. The secondary outcomes were the discriminative ability of early ΔPIV measured as a continuous variable; the reproducibility of the association in a temporally independent cohort; the incremental value of early ΔPIV over established clinicopathologic predictors; consistency across the two molecular subtypes; and the performance of related inflammatory indices.
2. Materials and Methods
2.1. Study Design, Setting, Ethics and Reporting
This retrospective cohort study was conducted at a single tertiary centre. We reviewed consecutive patients with invasive breast cancer who began NAC between January 2018 and December 2023. Patients treated in 2018–2021 formed the discovery cohort and those treated in 2022–2023 the temporally independent validation cohort, with identical eligibility criteria, laboratory definitions and outcome definitions in both. Reporting follows the STROBE statement [26] and, for the prediction-model components, TRIPOD [27,28]. The marker is intended as an adjunct to established predictors during NAC rather than as a stand-alone test, and no treatment decision in this cohort was based on it.
The study was conducted in accordance with the Declaration of Helsinki and approved by the Non-Interventional Clinical Research Ethics Committee of Istanbul Medipol University (approval number 1346). Record review began after approval. The committee waived informed consent because the design was retrospective and the data were anonymised.
2.2. Participants
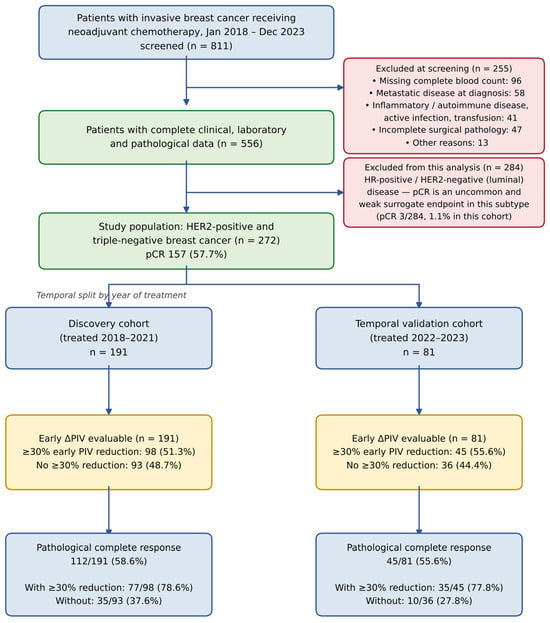
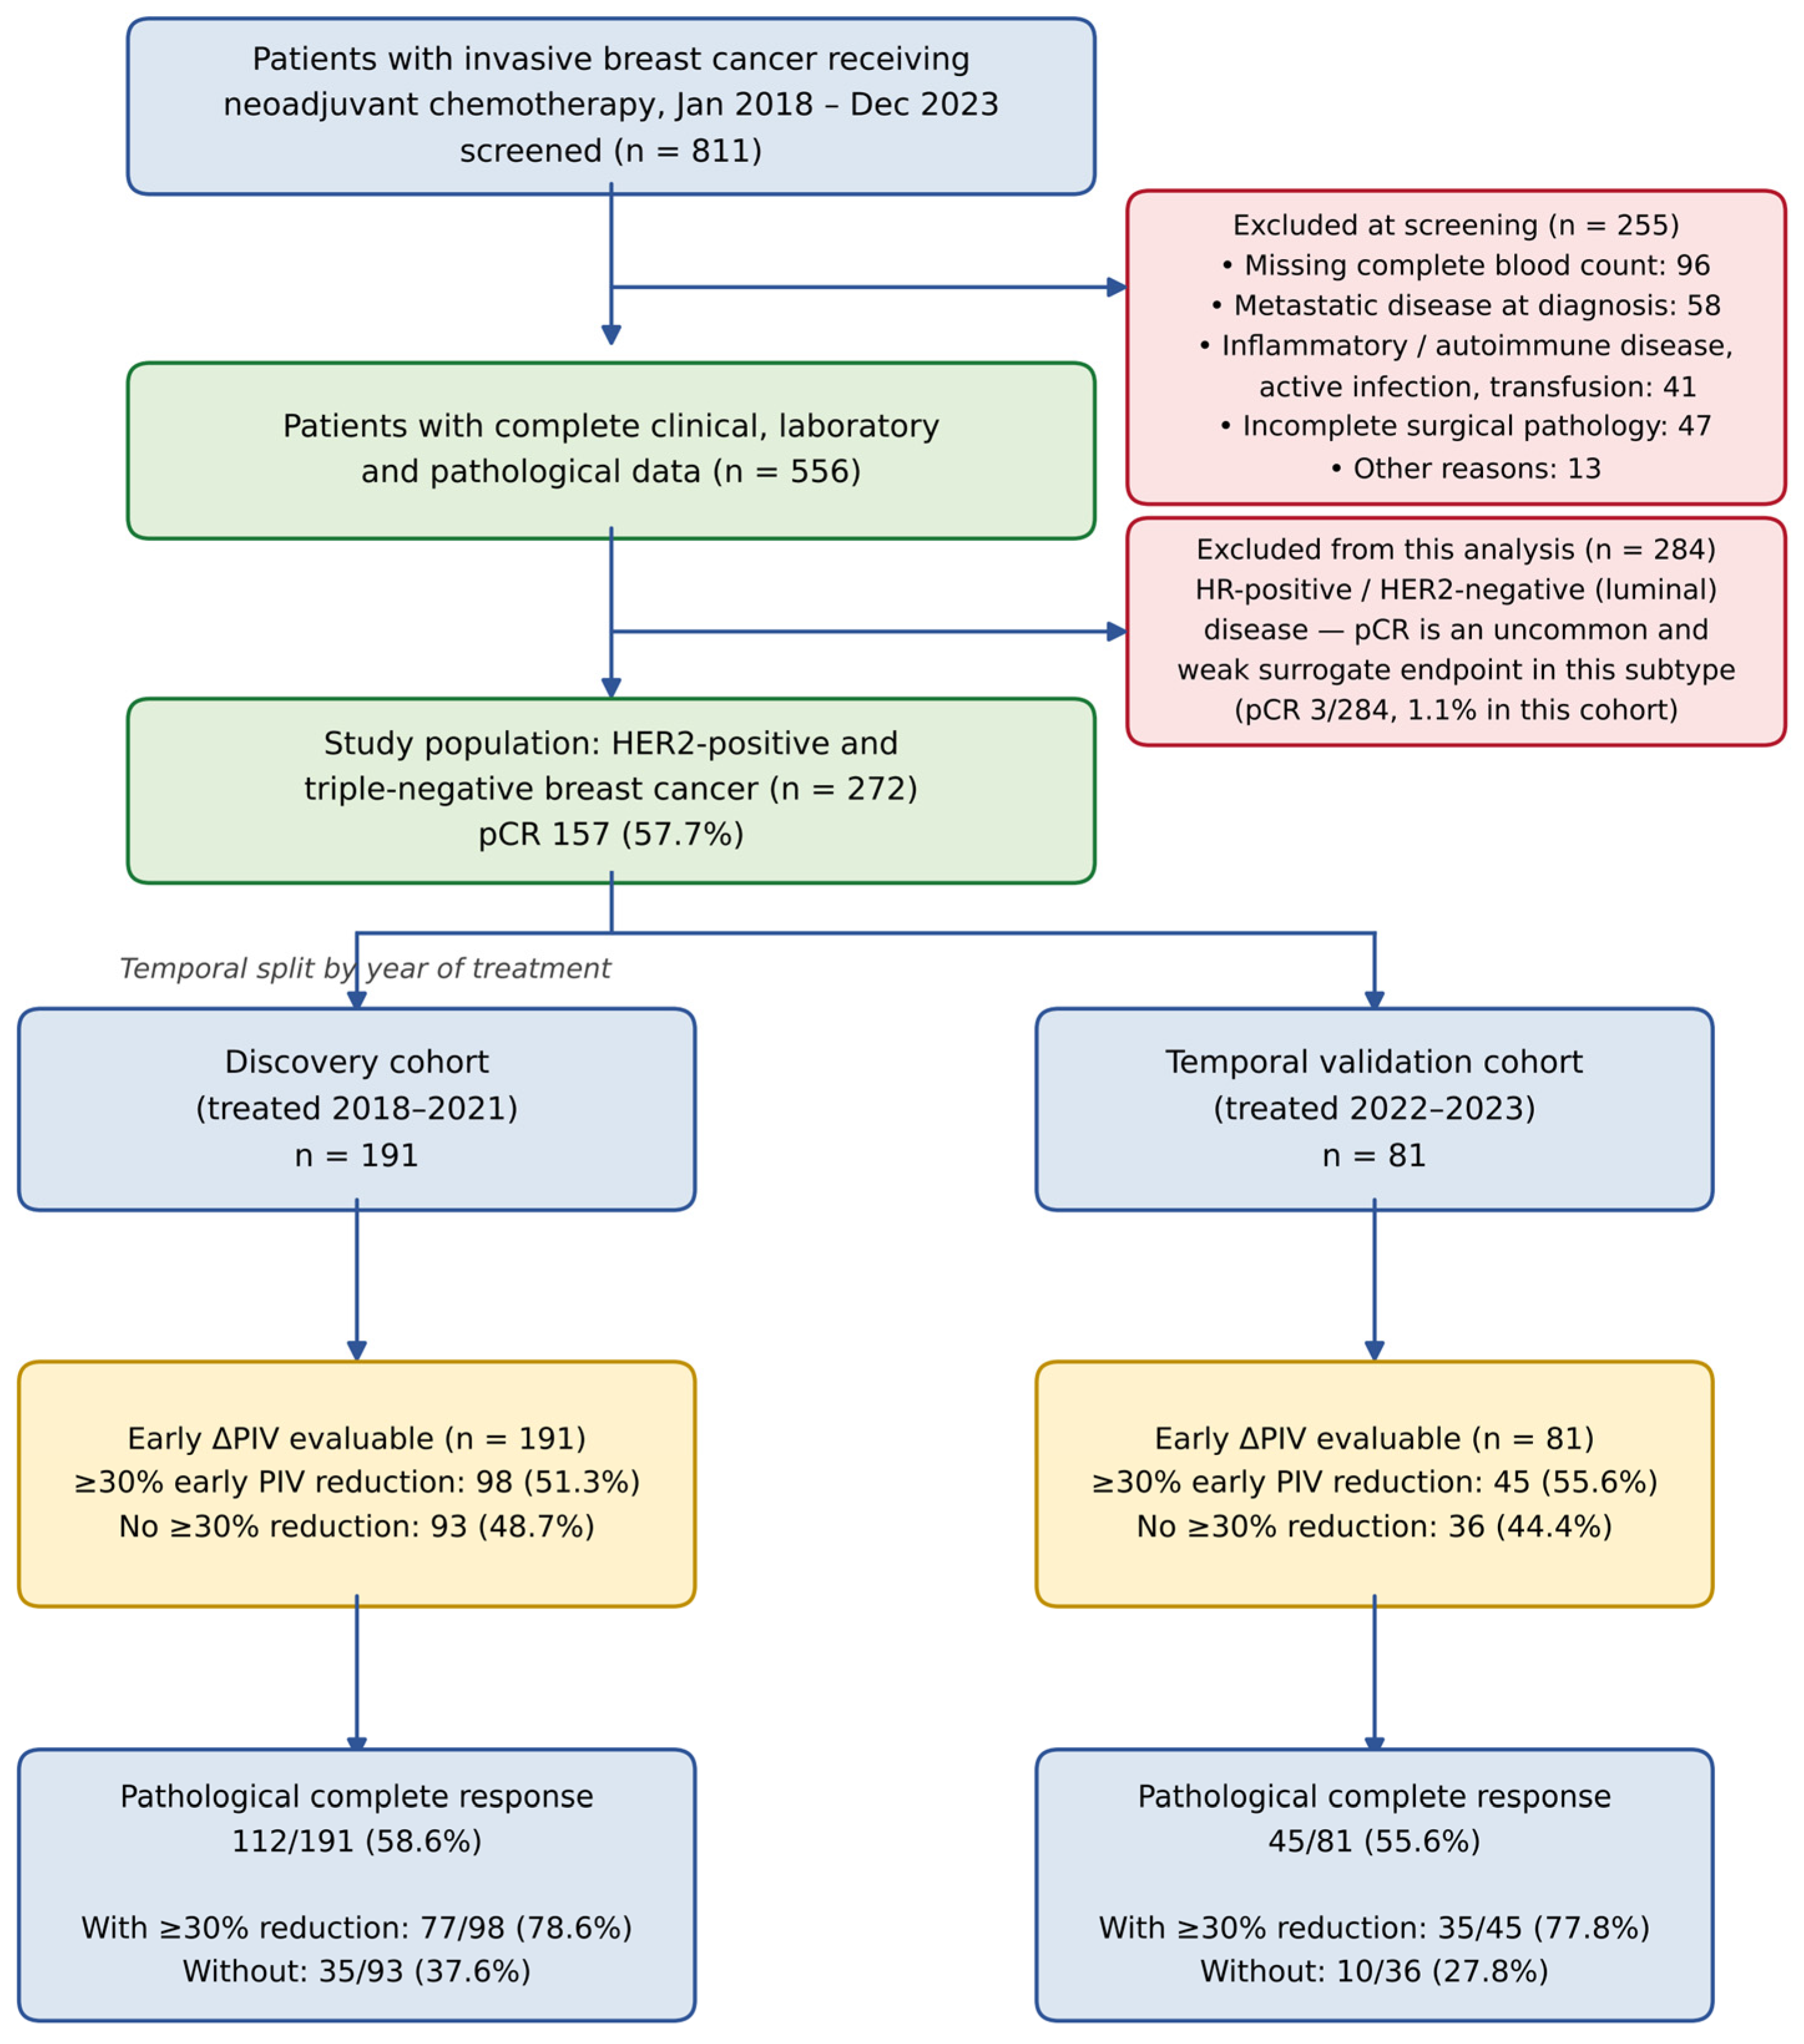
Eligible patients were at least 18 years of age with histologically confirmed invasive breast carcinoma, clinical stage I–III disease, NAC as first treatment, a complete blood count (CBC) available both before treatment and at the early on-treatment timepoint defined below, and definitive surgical pathology after NAC. Exclusion criteria were metastatic disease at diagnosis, active infection at the time of blood sampling, autoimmune or chronic inflammatory disease, concurrent haematologic malignancy, chronic corticosteroid or immunosuppressive therapy, transfusion within the preceding month, and missing data required for the primary analysis (Figure 1).
Figure 1.
Study flow diagram. Counts are shown for each exclusion reason, for the pre-specified restriction to HER2-positive and triple-negative disease, and for the discovery and temporal validation cohorts, including the number of patients with and without a ≥30% early reduction in the pan-immune-inflammation value (PIV) and the corresponding numbers achieving pathological complete response (pCR).
The analysis was restricted to HER2-positive and triple-negative tumours, a restriction defined before the analysis and applied at screening, because pCR is a validated surrogate of long-term outcome principally in these subtypes and is uncommon in luminal disease [4]. The excluded luminal patients are compared with the study population in Supplementary Table S5.
2.3. Neoadjuvant Treatment
Regimens followed contemporaneous national and institutional guidelines [29] and were chosen by the treating oncologist. Of all 272 patients, 221 (81.3%) received an anthracycline and 252 (92.6%) a taxane. All 119 triple-negative patients received a platinum agent, as did 13 of 153 HER2-positive patients, giving 132 of 272 (48.5%) overall. Dual HER2 blockade with trastuzumab and pertuzumab was given to 133 of the 153 HER2-positive patients (86.9%) and to no triple-negative patient (133 of 272, 48.9%). Dose-dense scheduling was used in 78 patients (28.7%) and granulocyte colony-stimulating factor (G-CSF) support in 107 (39.3%). All patients received the same corticosteroid premedication protocol.
2.4. Blood Sampling and Biomarker Definitions
No blood was drawn for research. We used the CBCs obtained in routine care before each chemotherapy cycle and again before surgery; these are recovery counts taken immediately before the next cycle, not nadir counts. Baseline (T0) was before the first cycle, early treatment (T1) before the second or third cycle, and post-neoadjuvant (T2) after NAC and before surgery. Counts drawn during documented infection, hospitalisation or transfusion were not used. The interval in days between T0 and T1 was not recorded in the institutional database and could not be retrieved; this is addressed in the Limitations Section.
Four indices were derived from the neutrophil, lymphocyte, monocyte and platelet counts: NLR = neutrophils/lymphocytes; PLR = platelets/lymphocytes; SII = platelets × neutrophils/lymphocytes; PIV = neutrophils × platelets × monocytes/lymphocytes. The early change in PIV was the proportional difference between T1 and T0 (early ΔPIV = (PIV_T1 − PIV_T0)/PIV_T0), so that a negative value means a fall. The 30% threshold was fixed before the analysis as a round, clinically interpretable cut-off, was not selected to maximise discrimination, and was applied to the validation cohort without recalibration. The threshold maximising the Youden index in the discovery cohort, and the optimism of that data-driven choice, are reported in Supplementary Table S4.
2.5. Outcomes
The primary outcome was pCR, defined as the absence of residual invasive carcinoma in the breast and axillary lymph nodes (ypT0/is ypN0) [4,30]; residual ductal carcinoma in situ with negative nodes counted as pCR. The primary predictor was an early ≥30% reduction in PIV. Secondary outcomes were those listed at the end of the Introduction, in that order.
2.6. Statistical Analysis
Continuous variables are reported as medians with interquartile ranges and compared with the Mann–Whitney U test; categorical variables are reported as counts with percentages and compared with the chi-square test, or Fisher’s exact test where an expected cell count was below five. The unadjusted biomarker comparisons carry Benjamini–Hochberg false discovery rate q values [31]. Areas under the receiver operating characteristic curve are reported with DeLong confidence intervals and compared with the DeLong test [32]; bootstrap resampling with 2000 replications provided the confidence intervals for the reclassification measures.
The primary model was kept small. With 112 responders and 79 non-responders in the discovery cohort and 45 and 36 in the validation cohort, a seven-covariate model gives about 11 and 5 events per variable [33,34]. We therefore specified, before refitting, a three-variable model containing the early ≥30% PIV reduction, baseline PIV and molecular subtype, which gives 26 and 12 events per variable. Baseline PIV was entered on the natural log scale rather than dichotomised [35], with odds ratios per 10% higher value; the seven-covariate model is retained in Supplementary Table S3, where low baseline PIV is defined by the discovery-cohort median of 375. Because early ΔPIV is calculated from baseline PIV the two are coupled, and regression to the mean is possible [36], so we report their correlation, the variance inflation factors, and two analyses that break the coupling: log T1 PIV adjusted for log baseline PIV, and the component of early ΔPIV orthogonal to baseline PIV. We also analysed the early proportional change in each cell count and decomposed the variance of the log change in PIV across its four components.
Incremental value was assessed by adding the early ≥30% PIV reduction to a model containing molecular subtype, clinical stage, histologic grade and Ki-67, reported as the change in the area under the curve with its confidence interval and DeLong p value, the likelihood-ratio test, and the continuous net reclassification and integrated discrimination improvements [37]; apparent discrimination was corrected for optimism by bootstrapping with 500 replications [34]. In the validation cohort the discovery coefficients were applied unchanged, with discrimination, calibration slope, calibration intercept and Brier score reported [38], and a model refitted within that cohort reported separately. Treatment variables were added to the adjustment set in a further sensitivity analysis. Cohort size was fixed by the number of eligible patients, so no sample size calculation was performed; the sample exceeds the minimum suggested for a model of this size [39]. No analysis variable had missing values, so all analyses are complete-case by construction. Tests were two-sided with p < 0.05 considered significant; analyses used Python 3.13 with statsmodels 0.15, scipy 1.18 and scikit-learn 1.9.
3. Results
3.1. Study Population
Of 811 patients screened, 255 were excluded: 96 for missing CBC data, 58 for metastatic disease at diagnosis, 41 for inflammatory or autoimmune disease, active infection or recent transfusion, 47 for incomplete surgical pathology and 13 for other reasons. Of the remaining 556, the 284 with luminal disease were excluded as planned, leaving 272 patients: 191 in the discovery cohort and 81 in the validation cohort (Figure 1). No patient had stage I disease. The excluded luminal patients were similar in age, stage, grade and Ki-67 but had higher baseline PIV and a pCR rate of 1.1% (3 of 284) against 57.7% in the study population (Supplementary Table S5). The two study cohorts were comparable in every baseline characteristic examined (Table 1).
Table 1.
Baseline characteristics of the discovery and validation cohorts.
3.2. Early PIV Change and Pathological Complete Response
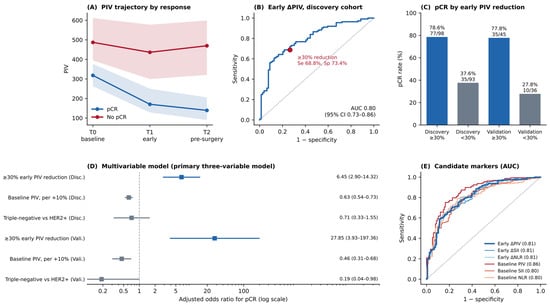
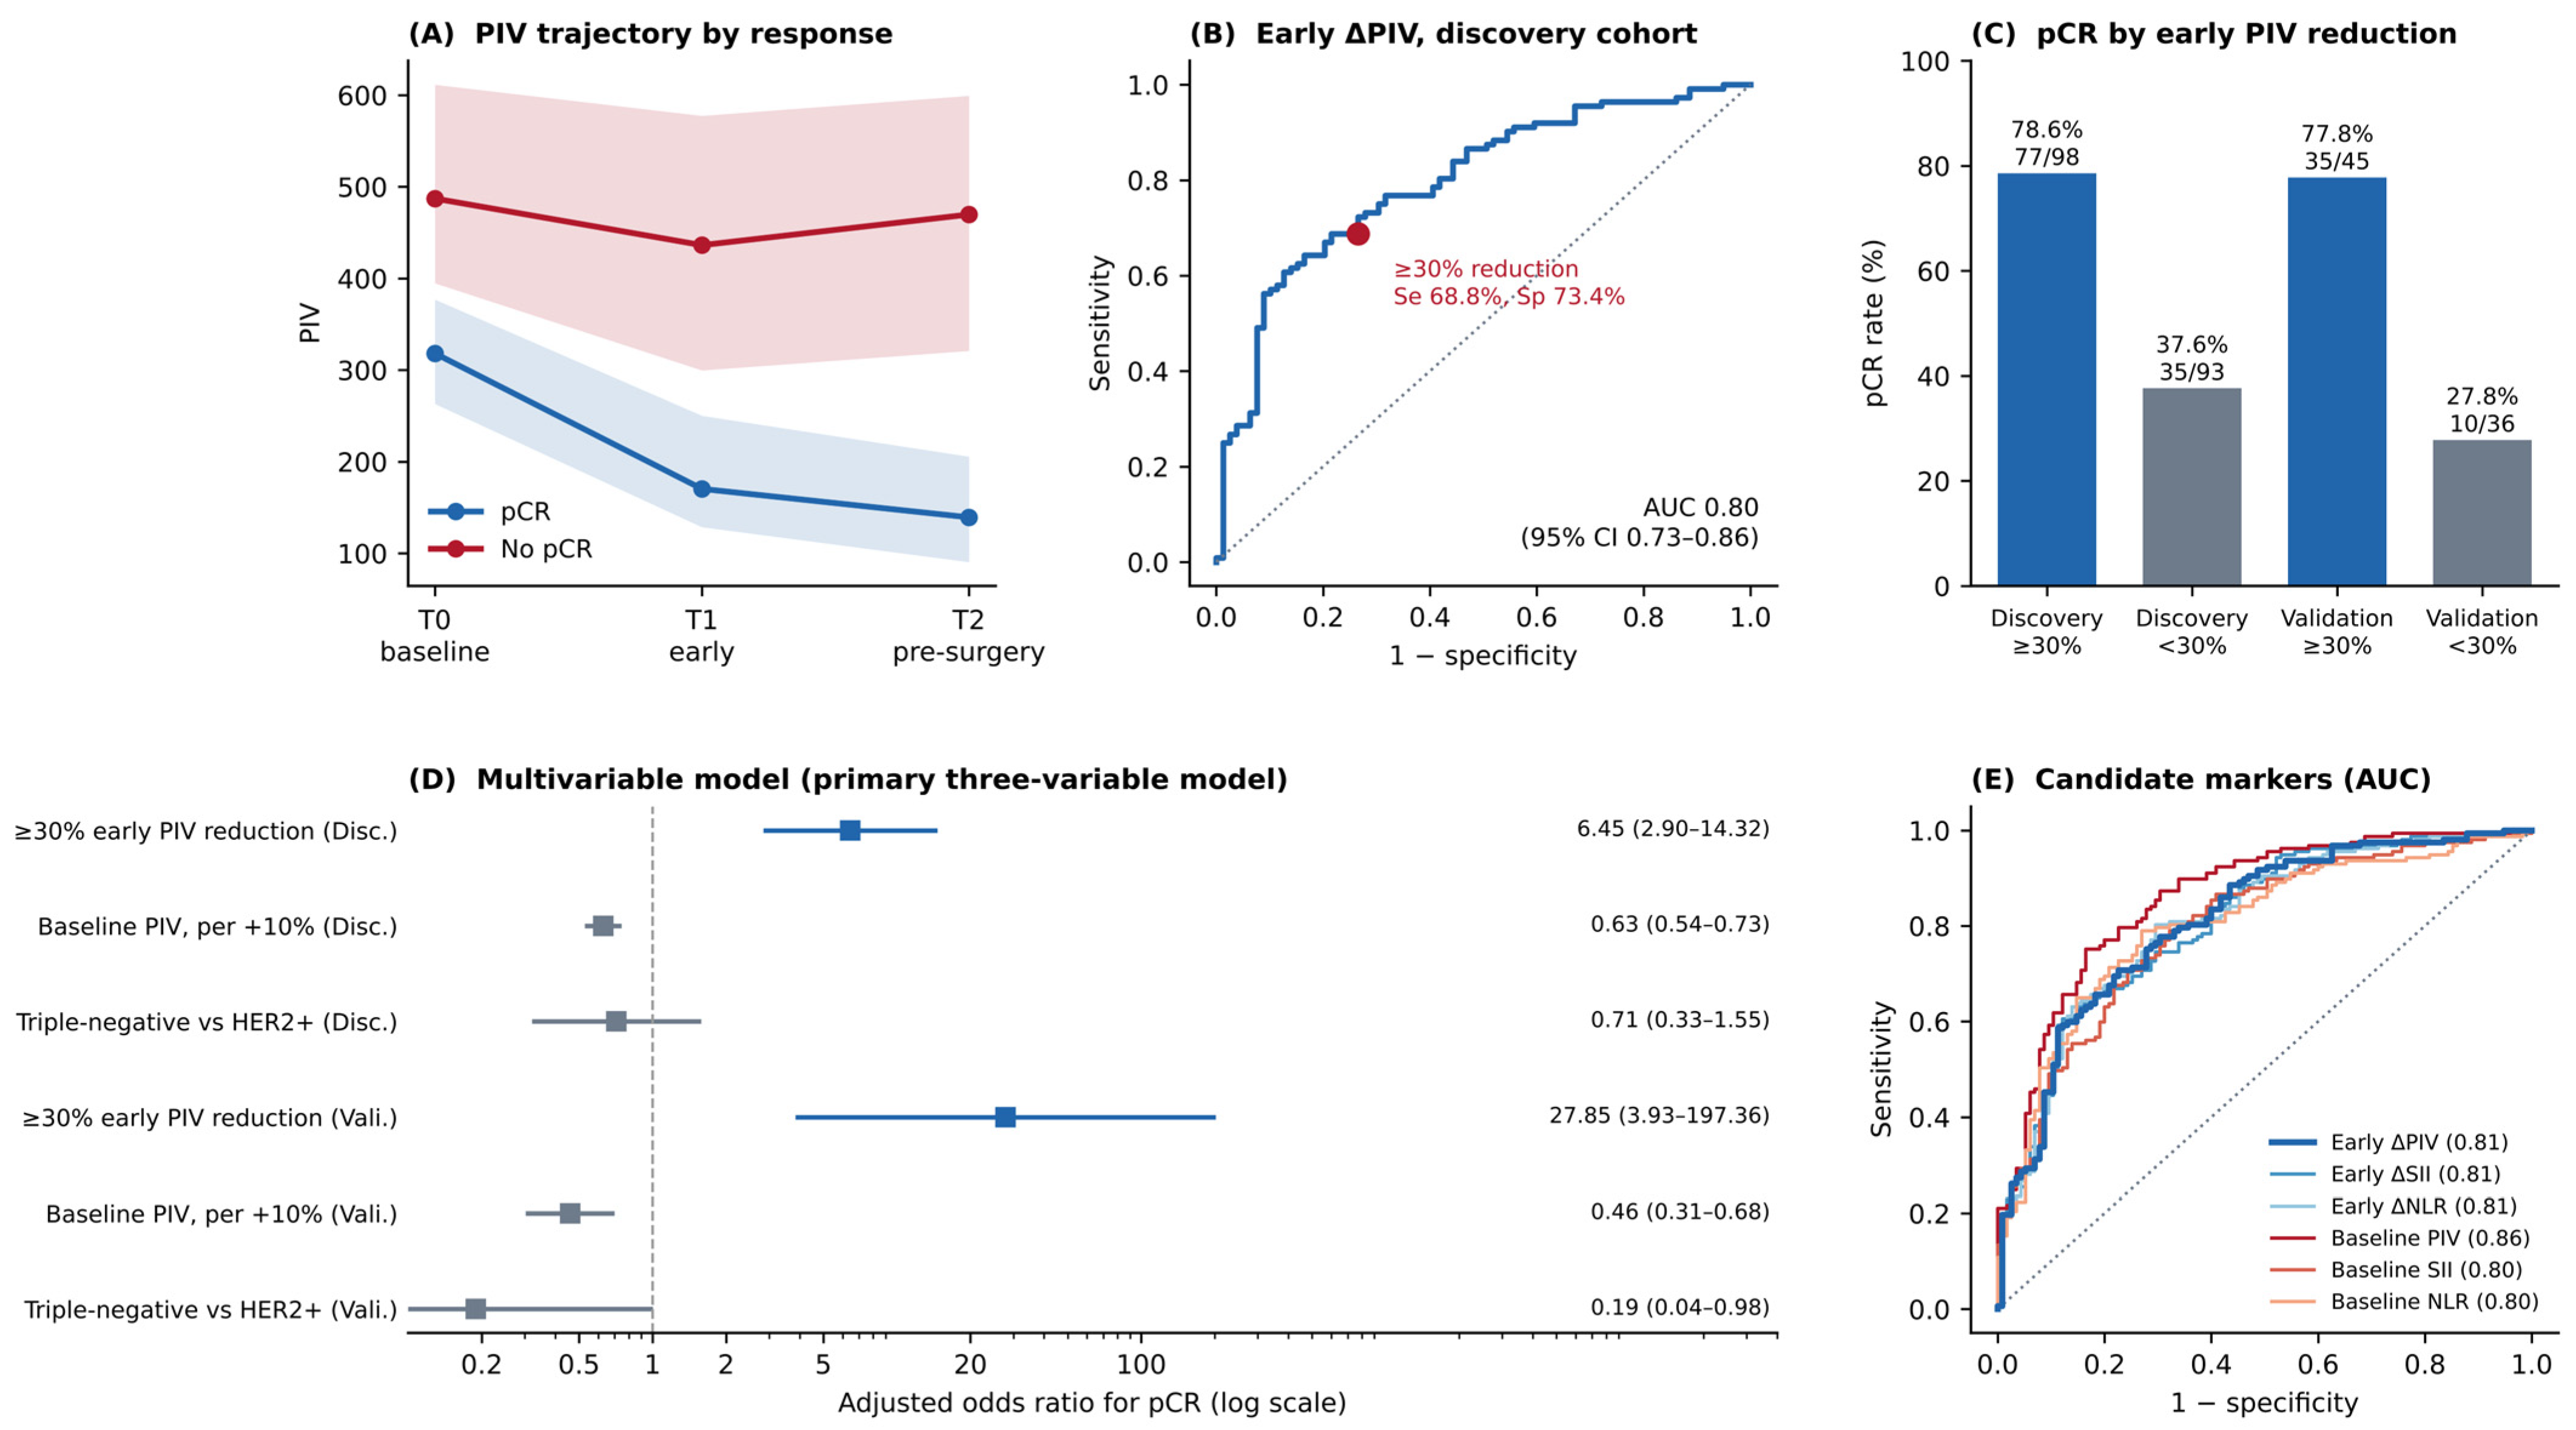
pCR was achieved by 157 of 272 patients (57.7%): 112 of 191 (58.6%) in the discovery cohort and 45 of 81 (55.6%) in validation. Patients who achieved pCR had both a lower baseline PIV and a larger early fall in PIV. The median early ΔPIV was −0.44 (IQR −0.57 to −0.29) with pCR and −0.11 (−0.30 to 0.08) without it (p < 0.001). The gap was already present at T1 and persisted to surgery (Figure 2A). Corresponding differences were seen for SII, NLR and PLR (Table 2).
Figure 2.
Early change in the pan-immune-inflammation value (PIV) and pathological complete response (pCR). (A) Median PIV at baseline (T0), early treatment (T1) and before surgery (T2) by pCR status, with shaded interquartile ranges. (B) Receiver operating characteristic curve for early ΔPIV in the discovery cohort, with the pre-specified 30% threshold marked. (C) pCR rates with and without a ≥30% early PIV reduction, by cohort; counts are shown above each bar. (D) Adjusted odds ratios from the primary three-variable model in both cohorts (log scale). Blue markers indicate the early ≥30% PIV reduction and grey markers the other two covariates; the colours carry no further meaning. (E) Receiver operating characteristic curves for six candidate markers in the whole cohort, with areas under the curve in parentheses.
Table 2.
Inflammatory indices and early changes in individual blood counts according to pathological complete response, whole cohort.
Early ΔPIV, analysed as a continuous variable, discriminated pCR with an area under the curve of 0.80 (95% CI 0.73–0.86) in the discovery cohort and 0.84 (0.75–0.93) in the validation cohort (Figure 2B). At the 30% threshold, sensitivity was 68.8% and specificity was 73.4% in the discovery cohort (positive predictive value 78.6%, negative predictive value 62.4%) and 77.8% and 72.2% in the validation cohort; a data-driven threshold would have been close to the one used and no less optimistic (Supplementary Table S4). An early reduction of at least 30% was present in 98 of 191 discovery patients (51.3%) and 45 of 81 validation patients (55.6%). pCR was reached by 77 of these 98 (78.6%) versus 35 of 93 without a reduction (37.6%) in the discovery cohort, and by 35 of 45 (77.8%) versus 10 of 36 (27.8%) in the validation cohort (both p < 0.001; Figure 2C).
3.3. Which Blood Count Component Drives the Early Change
The early fall in PIV was not a uniform suppression of all cell lines. Neutrophils fell by a median of 24% in patients who achieved pCR against 6% in those who did not, and monocytes by 16% against 5%; platelets fell by 7% against 2%. Lymphocytes moved in the opposite direction, rising by a median of 8% with pCR and 2% without it (all p < 0.001; Table 2). Taken alone, the early change in neutrophils discriminated pCR as well as the composite index (area under the curve 0.81, 95% CI 0.75–0.86 versus 0.81 for early ΔPIV; DeLong p = 0.657), followed by monocytes (0.79) and platelets (0.74). In a decomposition of the variance of the log change in PIV, neutrophils accounted for 47%, monocytes 29%, platelets 13% and lymphocytes 12%.
3.4. Independent Association and Temporal Validation
In the primary three-variable model, an early ≥30% reduction in PIV was independently associated with pCR in the discovery cohort (adjusted odds ratio 6.45, 95% CI 2.90–14.32; p < 0.001), together with a lower baseline PIV (odds ratio 0.63 per 10% higher baseline value, 0.54–0.73; p < 0.001). The same model in the validation cohort gave an adjusted odds ratio of 27.85 (3.93–197.36; p < 0.001) for the early reduction (Table 3, Figure 2D). Analysed continuously, each additional 10% of early reduction was associated with an adjusted odds ratio of 1.61 (1.33–1.94; p < 0.001) in discovery and 2.36 (1.49–3.73; p < 0.001) in validation. The width of the validation intervals reflects 45 responders and 36 non-responders and shows direction rather than magnitude.
Table 3.
Primary multivariable model for pathological complete response and performance of the discovery model in the validation cohort.
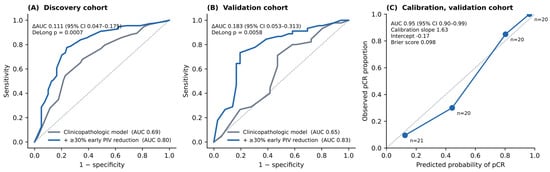
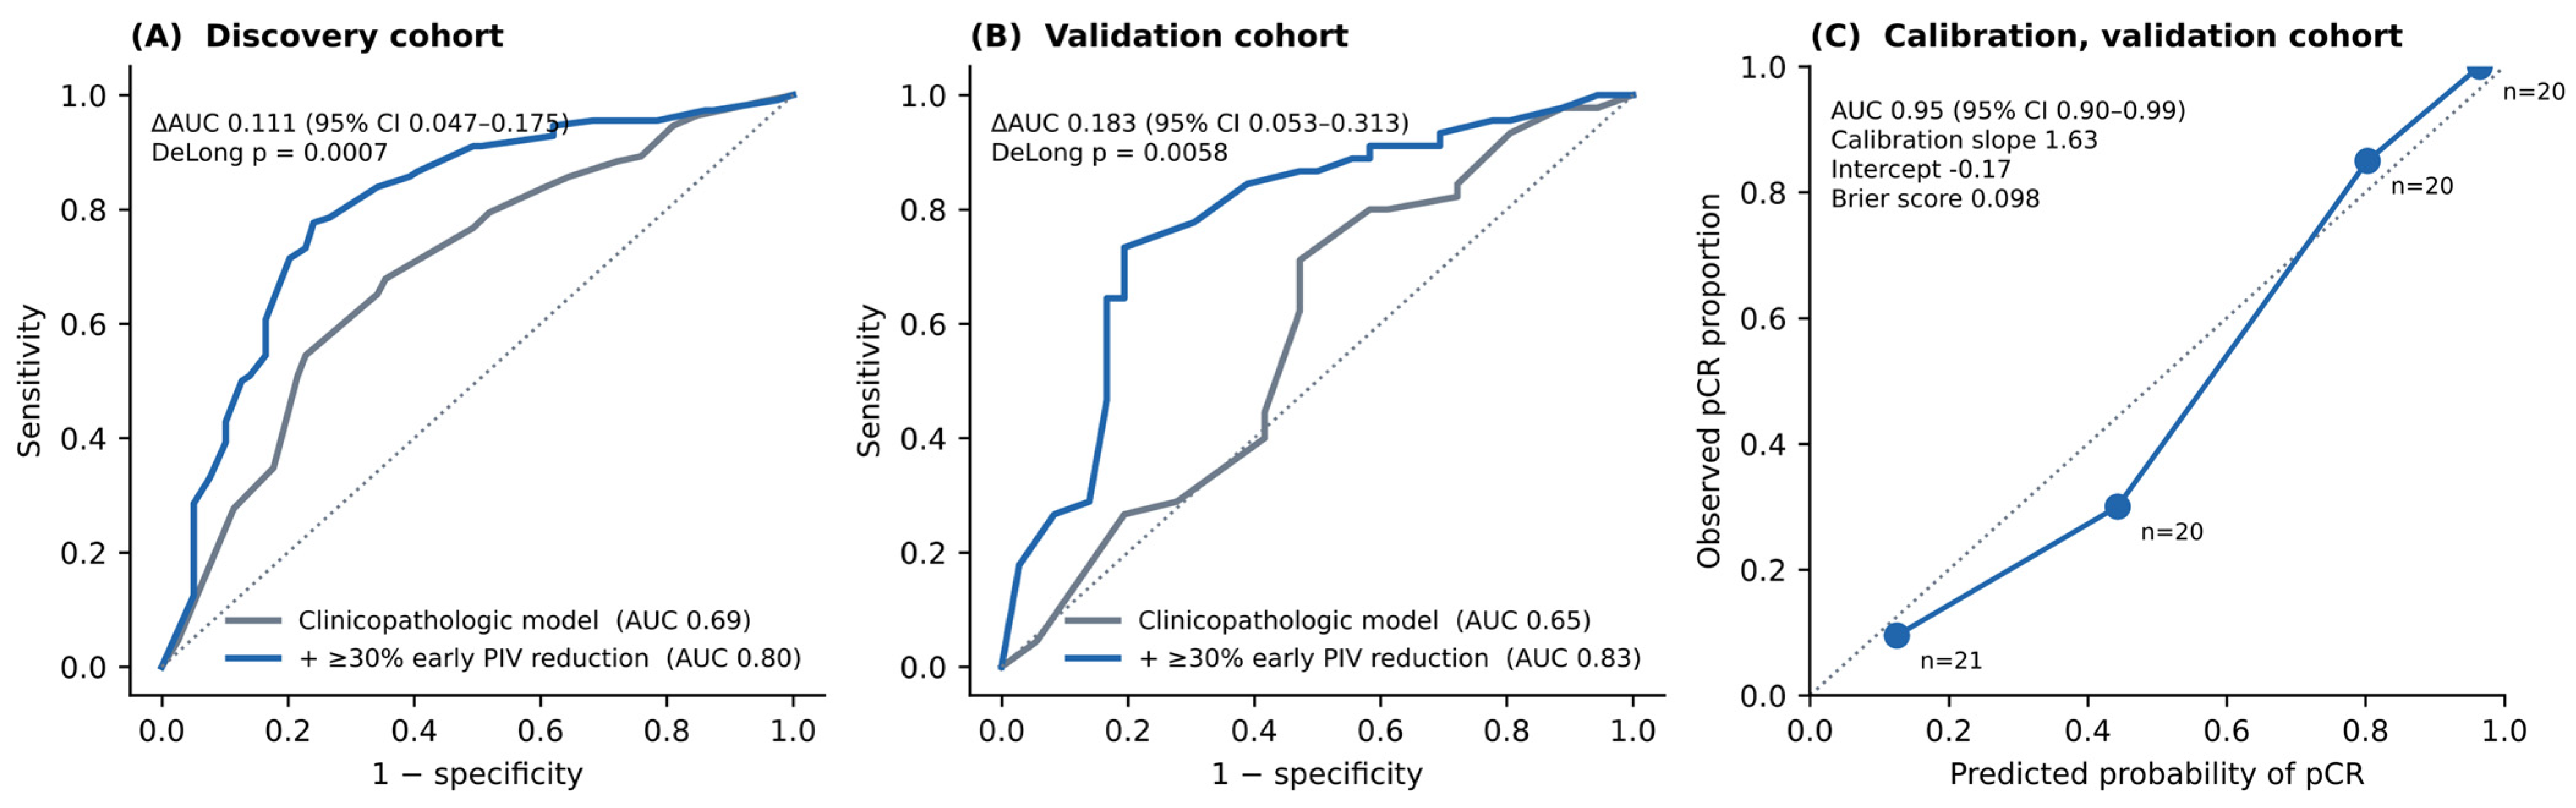
Applied to the validation cohort with its coefficients unchanged, the discovery model gave an area under the curve of 0.95 (0.90–0.99), a calibration slope of 1.63 (0.89–2.37), an intercept of −0.17 and a Brier score of 0.098 (Table 3, Figure 3C); optimism correction reduced the apparent discovery figure from 0.88 to 0.87.
Figure 3.
Incremental value of an early ≥30% PIV reduction over established clinicopathologic factors. (A) Discovery cohort and (B) validation cohort: receiver operating characteristic curves for a model containing molecular subtype, clinical stage, histologic grade and Ki-67, with and without the early PIV reduction. (C) Calibration of the primary three-variable discovery model applied to the validation cohort without recalibration, by quartile of predicted probability; the dotted line is perfect calibration.
Baseline PIV and early ΔPIV were positively correlated (Spearman ρ = 0.31, p < 0.001): a higher baseline PIV went with a smaller early fall, the opposite of the pattern regression to the mean would produce. Variance inflation factors were all below 1.2. Removing the arithmetic coupling changed nothing: with log T1 PIV modelled against log baseline PIV the adjusted odds ratio was 0.73 per 10% higher T1 PIV (0.64–0.84), and using the component of early ΔPIV orthogonal to baseline PIV it was 1.49 per 10% greater baseline-independent reduction (1.25–1.77; both p < 0.001).
3.5. Incremental Value
A model containing molecular subtype, clinical stage, histologic grade and Ki-67 discriminated pCR with an area under the curve of 0.69 (95% CI 0.61–0.77) in the discovery cohort; adding the early ≥30% PIV reduction raised this to 0.80 (0.74–0.87), a difference of 0.111 (0.047–0.175; DeLong p < 0.001; likelihood-ratio χ2 = 32.6, p < 0.001), with a continuous net reclassification improvement of 0.84 (0.59–1.10) and an integrated discrimination improvement of 0.158 (0.070–0.269). In the validation cohort the area under the curve rose from 0.65 (0.52–0.77) to 0.83 (0.74–0.92), a difference of 0.183 (0.053–0.313; p = 0.006) (Figure 3A,B). After correction for optimism the discovery figures were 0.67 and 0.79.
3.6. Subtypes and Other Inflammatory Markers
The association held in both tumour types. Among the 153 HER2-positive patients, pCR was reached by 68 of 83 (81.9%) with an early reduction versus 31 of 70 (44.3%) without it (odds ratio 5.70, 95% CI 2.74–11.85); among the 119 triple-negative patients, by 44 of 60 (73.3%) versus 14 of 59 (23.7%) (odds ratio 8.84, 3.86–20.25). The test for interaction was not significant (p = 0.200), so the data do not show a difference between subtypes, though with these numbers they would not detect a modest one (Supplementary Table S1).
Early ΔPIV was not better than the related indices. In the whole cohort the area under the curve was 0.81 for early ΔPIV, early ΔSII and early ΔNLR alike, and neither comparison with early ΔPIV reached significance on the DeLong test (both p > 0.44). Baseline PIV gave the numerically highest value, 0.86, but the difference from early ΔPIV was not significant (−0.048, 95% CI −0.117 to 0.021; p = 0.176). A ≥30% early reduction in SII was accompanied by pCR in 95 of 111 patients (85.6%) versus 62 of 161 (38.5%). These markers are strongly inter-correlated and the data cannot separate them (Figure 2E, Supplementary Table S4). We report PIV as the primary measure because it was specified in advance, not because it outperformed the others.
3.7. Sensitivity Analyses
The signal was not explained by treatment-induced cytopenia or growth-factor support. Severe cytopenia at T1 was rare, as expected for counts taken before the next cycle rather than at nadir: across the whole cohort the median T1 neutrophil count was 3.26 × 10⁹/L (IQR 2.48–4.49) and the median T1 lymphocyte count 1.61 × 10⁹/L (1.37–1.84), and one discovery patient had a T1 neutrophil count below 1.0 × 10⁹/L. Against a reference estimate of 8.73 (3.78–20.19) in the seven-covariate model, the adjusted odds ratio for the early reduction ranged from 7.95 to 9.28 across six sensitivity analyses covering G-CSF exclusion and adjustment, three definitions of low T1 counts, and the addition of the treatment variables to the adjustment set (Supplementary Table S2). G-CSF use was distributed similarly between patients who did and did not achieve pCR (p = 0.693) and between those with and without an early reduction (p = 0.379). Every patient received the same corticosteroid premedication, so its effect cannot be separated from the treatment effect here.
4. Discussion
In this single-centre study with temporal validation, an early fall in PIV during NAC was associated with pCR in HER2-positive and triple-negative breast cancer. The association survived adjustment for established clinicopathologic predictors, was reproduced in a cohort treated in later years, and added discrimination to a model built from subtype, stage, grade and Ki-67.
What distinguishes this analysis from earlier work on blood-count indices in breast cancer is the use of change rather than a single value. Previous studies examined pretreatment NLR, PLR or SII as fixed predictors of survival or response [11,15,16,17,18]. A baseline value describes the host–tumour relationship at diagnosis; it cannot describe what the tumour does once treatment starts. Both carry information and neither replaces the other: baseline PIV gave the numerically highest area under the curve of any single marker, early ΔPIV remained associated with pCR after adjusting for it, and the two were positively rather than negatively correlated. Early ΔPIV was not superior to early ΔSII or early ΔNLR, and with 272 patients the differences between these closely related indices sit well inside the confidence intervals.
The component analysis helps explain what the index measures. The early fall in PIV was driven mainly by falling neutrophils and monocytes while lymphocytes rose. Generalised marrow suppression would lower all four lineages, including lymphocytes, so this pattern is not simply a chemotherapy toxicity signal. It is more consistent with a shift away from the myeloid-dominated inflammatory state that accompanies an active tumour [6,7,9]. Neutrophils can promote tumour growth through proangiogenic mediators and proteases, monocytes can become tumour-associated macrophages that suppress immunity, platelets can shield circulating tumour cells, and lymphocytes carry the antitumour response [6,8,22]. The early change in neutrophils alone performed as well as the four-component index, so PIV’s value here lies in convenience rather than in any demonstrated advantage of combining four counts. Tumour-infiltrating lymphocytes also predict pCR in both subtypes studied here [22,23,24,25], but they require a biopsy and cannot be repeated through treatment, whereas PIV comes from a test already performed before every cycle.
The clinical reading should stay modest. Adding the early PIV reduction raised the area under the curve by 0.111, a larger gain than is usually reported when a blood-based marker is added to a clinical model. A change in discrimination of this size still does not establish clinical usefulness on its own: what matters is whether the resulting probabilities would change a decision, and at this operating point they would not. At the 30% threshold, sensitivity was 69% and specificity was 73%, so roughly one in three patients who eventually achieve pCR would show no early reduction, and the marker cannot be used to withhold or change treatment in an individual patient. What the data support is the weaker claim that early inflammatory kinetics carry information beyond the standard clinicopathologic variables, enough to justify prospective evaluation rather than adoption into practice.
Limitations
The design was retrospective, so selection bias and residual confounding cannot be excluded. Patients were excluded at screening mainly for missing blood counts or incomplete pathology, and those patients could not be characterised from the available records; if incomplete records were more common in patients treated irregularly, the analysed cohort is likely to be healthier than the source population and the performance reported here optimistic.
The timing of T1 is the clearest weakness. T1 was the count before the second or third cycle, and regimens were given every two or three weeks, so the interval between T0 and T1 varied between patients. Sampling dates were not recorded and could not be reconstructed, so we cannot report the median interval or adjust for it. Variable timing would be expected to add noise and bias the association towards the null rather than create it, but it limits the precision of any threshold and must be fixed prospectively. Several variables that would normally appear in a breast cancer baseline table were also unavailable: separate oestrogen and progesterone receptor status within the hormone receptor-negative groups, menopausal status, tumour size and separate clinical T and N categories. Residual confounding by tumour burden in particular cannot be excluded.
The validation cohort was small, with 45 responders and 36 non-responders, so its confidence intervals are wide and its refitted estimates unstable; this is why the primary model was restricted to three covariates and why validation relies on the transported discovery model. Validation was temporal and within one centre, so it tests reproducibility over time but not transportability to other populations, laboratories or analysers, and PIV is analyser-sensitive. All patients received the same corticosteroid premedication; steroids substantially affect neutrophil and lymphocyte counts, and with no unexposed group this effect could not be examined. Being shared by every patient it cannot explain the difference between responders and non-responders, but it may shift the absolute value of the threshold in cohorts premedicated differently. Finally, the endpoint was pCR; no survival data are presented, so whether early PIV change predicts long-term outcome is unknown.
5. Conclusions
An early reduction in the pan-immune-inflammation value during neoadjuvant chemotherapy was associated with pathological complete response in HER2-positive and triple-negative breast cancer, and added discrimination beyond subtype, stage, grade and Ki-67 in both a discovery and a temporally independent validation cohort. The index is calculated from a blood count that is already taken before every cycle, which makes repeated measurement free. At 69% sensitivity and 73% specificity it is a candidate adjunct rather than a decision rule, too modest to guide treatment in an individual patient, and it did not outperform the related SII and NLR indices. Prospective multicentre studies with fixed sampling intervals and survival follow-up are needed before early inflammatory kinetics can be used in response-adapted care.
Supplementary Materials
The following supporting information can be downloaded at: https://www.mdpi.com/article/10.3390/jcm15218748/s1, Table S1, Pathological complete response according to early PIV reduction, by molecular subtype; Table S2, Sensitivity analyses for the association between a ≥30% early PIV reduction and pCR (discovery cohort), and distribution of blood counts at the early timepoint; Table S3, Seven-covariate multivariable model (sensitivity analysis); Table S4, Pairwise comparison of candidate markers for predicting pCR (whole cohort, DeLong test); Table S5, Study population compared with the hormone receptor-positive, HER2-negative patients excluded by design.
Author Contributions
O.H.T. and P.B. conceived and designed the study. O.H.T., P.A., M.Z. and C.K.P. collected and curated the clinical data. O.H.T. performed the statistical analysis and prepared the figures and tables. O.H.T. wrote the manuscript. P.B. supervised the study and critically revised the manuscript for important intellectual content. All authors have read and agreed to the published version of the manuscript.
Funding
This research received no external funding.
Institutional Review Board Statement
The study was conducted in accordance with the Declaration of Helsinki and approved by the Non-Interventional Clinical Research Ethics Committee of Istanbul Medipol University on 13 February 2026 (approval number 1346), with an amendment approved by the same committee under the same number on 27 August 2026.
Informed Consent Statement
Patient consent was waived by the ethics committee because the design was retrospective and the data were anonymised.
Data Availability Statement
The de-identified dataset analysed in this study is available from the corresponding author on reasonable request, subject to institutional data-sharing policies and ethics approval.
Acknowledgments
The authors thank Ipek Basim for language editing of the manuscript.
Conflicts of Interest
The authors declare no conflicts of interest.
References
- Sung, H.; Ferlay, J.; Siegel, R.L.; Laversanne, M.; Soerjomataram, I.; Jemal, A.; Bray, F. Global cancer statistics 2020: GLOBOCAN estimates of incidence and mortality worldwide for 36 cancers in 185 countries. CA Cancer J. Clin. 2021, 71, 209–249. [Google Scholar] [CrossRef] [Scilit] [PubMed]
- Loibl, S.; Poortmans, P.; Morrow, M.; Denkert, C.; Curigliano, G. Breast cancer. Lancet 2021, 397, 1750–1769. [Google Scholar] [PubMed]
- Harbeck, N.; Penault-Llorca, F.; Cortes, J.; Gnant, M.; Houssami, N.; Poortmans, P.; Ruddy, K.; Tsang, J.; Cardoso, F. Breast cancer. Nat. Rev. Dis. Primers 2019, 5, 66. [Google Scholar] [PubMed]
- Cortazar, P.; Zhang, L.; Untch, M.; Mehta, K.; Costantino, J.P.; Wolmark, N.; Bonnefoi, H.; Cameron, D.; Gianni, L.; Valagussa, P.; et al. Pathological complete response and long-term clinical benefit in breast cancer: The CTNeoBC pooled analysis. Lancet 2014, 384, 164–172. [Google Scholar] [CrossRef] [Scilit] [PubMed]
- Bianchini, G.; Balko, J.M.; Mayer, I.A.; Sanders, M.E.; Gianni, L. Triple-negative breast cancer: Challenges and opportunities of a heterogeneous disease. Nat. Rev. Clin. Oncol. 2016, 13, 674–690. [Google Scholar] [CrossRef] [Scilit] [PubMed]
- Hanahan, D.; Weinberg, R.A. Hallmarks of cancer: The next generation. Cell 2011, 144, 646–674. [Google Scholar] [CrossRef] [Scilit] [PubMed]
- Mantovani, A.; Allavena, P.; Sica, A.; Balkwill, F. Cancer-related inflammation. Nature 2008, 454, 436–444. [Google Scholar] [CrossRef] [Scilit] [PubMed]
- Coussens, L.M.; Werb, Z. Inflammation and cancer. Nature 2002, 420, 860–867. [Google Scholar] [CrossRef] [Scilit] [PubMed]
- Grivennikov, S.I.; Greten, F.R.; Karin, M. Immunity, inflammation, and cancer. Cell 2010, 140, 883–899. [Google Scholar] [CrossRef] [Scilit] [PubMed]
- Templeton, A.J.; McNamara, M.G.; Šeruga, B.; Vera-Badillo, F.E.; Aneja, P.; Ocaña, A.; Leibowitz-Amit, R.; Sonpavde, G.; Knox, J.J.; Tran, B.; et al. Prognostic role of neutrophil-to-lymphocyte ratio in solid tumors: A systematic review and meta-analysis. J. Natl. Cancer Inst. 2014, 106, dju124. [Google Scholar] [CrossRef] [Scilit] [PubMed]
- Ethier, J.L.; Desautels, D.; Templeton, A.; Shah, P.S.; Amir, E. Prognostic role of neutrophil-to-lymphocyte ratio in breast cancer: A systematic review and meta-analysis. Breast Cancer Res. 2017, 19, 2. [Google Scholar] [CrossRef] [Scilit] [PubMed]
- Hu, B.; Yang, X.R.; Xu, Y.; Sun, Y.-F.; Sun, C.; Guo, W.; Zhang, X.; Wang, W.-M.; Qiu, S.-J.; Zhou, J.; et al. Systemic immune-inflammation index predicts prognosis of patients after curative resection for hepatocellular carcinoma. Clin. Cancer Res. 2014, 20, 6212–6222. [Google Scholar] [CrossRef] [Scilit] [PubMed]
- Fucà, G.; Guarini, V.; Antoniotti, C.; Morano, F.; Moretto, R.; Corallo, S.; Marmorino, F.; Lonardi, S.; Rimassa, L.; Sartore-Bianchi, A.; et al. The pan-immune-inflammation value is a new prognostic biomarker in metastatic colorectal cancer: Results from a pooled-analysis of the Valentino and TRIBE first-line trials. Br. J. Cancer 2020, 123, 403–409. [Google Scholar] [CrossRef] [Scilit] [PubMed]
- Yang, X.C.; Liu, H.; Liu, D.C.; Tong, C.; Liang, X.-W.; Chen, R.-H. Prognostic value of pan-immune-inflammation value in colorectal cancer patients: A systematic review and meta-analysis. Front. Oncol. 2022, 12, 1036890. [Google Scholar] [CrossRef] [Scilit] [PubMed]
- Azab, B.; Bhatt, V.R.; Phookan, J.; Murukutla, S.; Kohn, N.; Terjanian, T.; Widmann, W.D. Usefulness of the neutrophil-to-lymphocyte ratio in predicting short- and long-term mortality in breast cancer patients. Ann. Surg. Oncol. 2012, 19, 217–224. [Google Scholar] [CrossRef] [Scilit] [PubMed]
- Koh, C.H.; Bhoo-Pathy, N.; Ng, K.L.; Jabir, R.S.; Tan, G.-H.; See, M.-H.; Jamaris, S.; Taib, N.A. Utility of pre-treatment neutrophil-lymphocyte ratio and platelet-lymphocyte ratio as prognostic factors in breast cancer. Br. J. Cancer 2015, 113, 150–158. [Google Scholar] [CrossRef] [Scilit] [PubMed]
- Pistelli, M.; De Lisa, M.; Ballatore, Z.; Caramanti, M.; Pagliacci, A.; Battelli, N.; Ridolfi, F.; Santoni, M.; Maccaroni, E.; Bracci, R.; et al. Pre-treatment neutrophil to lymphocyte ratio may be a useful tool in predicting survival in early triple negative breast cancer patients. BMC Cancer 2015, 15, 195. [Google Scholar] [CrossRef] [Scilit] [PubMed]
- Asano, Y.; Kashiwagi, S.; Onoda, N.; Noda, S.; Kawajiri, H.; Takashima, T.; Ohsawa, M.; Kitagawa, S.; Hirakawa, K. Predictive value of neutrophil/lymphocyte ratio for efficacy of preoperative chemotherapy in triple-negative breast cancer. Ann. Surg. Oncol. 2016, 23, 1104–1110. [Google Scholar] [CrossRef] [Scilit] [PubMed]
- Diem, S.; Schmid, S.; Krapf, M.; Flatz, L.; Born, D.; Jochum, W.; Templeton, A.J.; Früh, M. Neutrophil-to-lymphocyte ratio (NLR) and platelet-to-lymphocyte ratio (PLR) as prognostic markers in patients with non-small cell lung cancer (NSCLC) treated with nivolumab. Lung Cancer 2017, 111, 176–181. [Google Scholar] [CrossRef] [Scilit] [PubMed]
- Mezquita, L.; Auclin, E.; Ferrara, R.; Charrier, M.; Remon, J.; Planchard, D.; Ponce, S.; Ares, L.P.; Leroy, L.; Audigier-Valette, C.; et al. Association of the lung immune prognostic index with immune checkpoint inhibitor outcomes in patients with advanced non-small cell lung cancer. JAMA Oncol. 2018, 4, 351–357. [Google Scholar] [CrossRef] [Scilit] [PubMed]
- Ferrucci, P.F.; Gandini, S.; Battaglia, A.; Alfieri, S.; Di Giacomo, A.M.; Giannarelli, D.; Cappellini, G.C.A.; De Galitiis, F.; Marchetti, P.; Amato, G.; et al. Baseline neutrophil-to-lymphocyte ratio is associated with outcome of ipilimumab-treated metastatic melanoma patients. Br. J. Cancer 2015, 112, 1904–1910. [Google Scholar] [CrossRef] [Scilit] [PubMed]
- Denkert, C.; Loibl, S.; Noske, A.; Roller, M.; Müller, B.M.; Komor, M.; Budczies, J.; Darb-Esfahani, S.; Kronenwett, R.; Hanusch, C.; et al. Tumor-associated lymphocytes as an independent predictor of response to neoadjuvant chemotherapy in breast cancer. J. Clin. Oncol. 2010, 28, 105–113. [Google Scholar] [CrossRef] [Scilit] [PubMed]
- Denkert, C.; von Minckwitz, G.; Darb-Esfahani, S.; Lederer, B.; Heppner, B.I.; Weber, K.E.; Budczies, J.; Huober, J.; Klauschen, F.; Furlanetto, J.; et al. Tumour-infiltrating lymphocytes and prognosis in different subtypes of breast cancer: A pooled analysis of 3771 patients treated with neoadjuvant therapy. Lancet Oncol. 2018, 19, 40–50. [Google Scholar] [CrossRef] [Scilit] [PubMed]
- Salgado, R.; Denkert, C.; Campbell, C.; Savas, P.; Nuciforo, P.; Aura, C.; de Azambuja, E.; Eidtmann, H.; Ellis, C.E.; Baselga, J.; et al. Tumor-infiltrating lymphocytes and associations with pathological complete response and event-free survival in HER2-positive early-stage breast cancer treated with lapatinib and trastuzumab: A secondary analysis of the NeoALTTO trial. JAMA Oncol. 2015, 1, 448–454. [Google Scholar] [PubMed]
- Dieci, M.V.; Miglietta, F.; Guarneri, V. Immune infiltrates in breast cancer: Recent updates and clinical implications. Cells 2021, 10, 223. [Google Scholar] [CrossRef] [Scilit] [PubMed]
- von Elm, E.; Altman, D.G.; Egger, M.; Pocock, S.J.; Gøtzsche, P.C.; Vandenbroucke, J.P.; Initiative, S. The Strengthening the Reporting of Observational Studies in Epidemiology (STROBE) statement: Guidelines for reporting observational studies. Lancet 2007, 370, 1453–1457. [Google Scholar] [CrossRef] [Scilit] [PubMed]
- Collins, G.S.; Reitsma, J.B.; Altman, D.G.; Moons, K.G. Transparent reporting of a multivariable prediction model for individual prognosis or diagnosis (TRIPOD): The TRIPOD statement. BMJ 2015, 350, g7594. [Google Scholar] [CrossRef] [Scilit] [PubMed]
- Moons, K.G.; Altman, D.G.; Reitsma, J.B.; Ioannidis, J.P.; Macaskill, P.; Steyerberg, E.W.; Vickers, A.J.; Ransohoff, D.F.; Collins, G.S. Transparent reporting of a multivariable prediction model for individual prognosis or diagnosis (TRIPOD): Explanation and elaboration. Ann. Intern. Med. 2015, 162, W1–W73. [Google Scholar] [CrossRef] [Scilit] [PubMed]
- Burstein, H.J.; Curigliano, G.; Thürlimann, B.; Weber, W.P.; Poortmans, P.; Regan, M.M.; Senn, H.J.; Winer, E.P.; Gnant, M. Panelists of the St Gallen Consensus Conference. Customizing local and systemic therapies for women with early breast cancer: The St. Gallen International Consensus Guidelines for treatment of early breast cancer 2021. Ann. Oncol. 2021, 32, 1216–1235. [Google Scholar] [CrossRef] [Scilit] [PubMed]
- Symmans, W.F.; Peintinger, F.; Hatzis, C.; Rajan, R.; Kuerer, H.; Valero, V.; Assad, L.; Poniecka, A.; Hennessy, B.; Green, M.; et al. Measurement of residual breast cancer burden to predict survival after neoadjuvant chemotherapy. J. Clin. Oncol. 2007, 25, 4414–4422. [Google Scholar] [CrossRef] [Scilit] [PubMed]
- Benjamini, Y.; Hochberg, Y. Controlling the false discovery rate: A practical and powerful approach to multiple testing. J. R. Stat. Soc. Ser. B Stat. Methodol. 1995, 57, 289–300. [Google Scholar] [CrossRef] [Scilit]
- DeLong, E.R.; DeLong, D.M.; Clarke-Pearson, D.L. Comparing the areas under two or more correlated receiver operating characteristic curves: A nonparametric approach. Biometrics 1988, 44, 837–845. [Google Scholar] [CrossRef] [Scilit] [PubMed]
- Peduzzi, P.; Concato, J.; Kemper, E.; Holford, T.R.; Feinstein, A.R. A simulation study of the number of events per variable in logistic regression analysis. J. Clin. Epidemiol. 1996, 49, 1373–1379. [Google Scholar] [CrossRef] [Scilit] [PubMed]
- Harrell, F.E., Jr.; Lee, K.L.; Mark, D.B. Multivariable prognostic models: Issues in developing models, evaluating assumptions and adequacy, and measuring and reducing errors. Stat. Med. 1996, 15, 361–387. [Google Scholar] [CrossRef] [Scilit]
- Altman, D.G.; Royston, P. The cost of dichotomising continuous variables. BMJ 2006, 332, 1080. [Google Scholar] [CrossRef] [Scilit] [PubMed]
- Barnett, A.G.; van der Pols, J.C.; Dobson, A.J. Regression to the mean: What it is and how to deal with it. Int. J. Epidemiol. 2005, 34, 215–220. [Google Scholar] [CrossRef] [Scilit] [PubMed]
- Pencina, M.J.; D’Agostino, R.B., Sr.; D’Agostino, R.B., Jr.; Vasan, R.S. Evaluating the added predictive ability of a new marker: From area under the ROC curve to reclassification and beyond. Stat. Med. 2008, 27, 157–172. [Google Scholar] [CrossRef] [Scilit] [PubMed]
- Steyerberg, E.W.; Vickers, A.J.; Cook, N.R.; Gerds, T.; Gonen, M.; Obuchowski, N.; Pencina, M.J.; Kattan, M.W. Assessing the performance of prediction models: A framework for some traditional and novel measures. Epidemiology 2010, 21, 128–138. [Google Scholar] [PubMed]
- Riley, R.D.; Snell, K.I.; Ensor, J.; Burke, D.L.; Harrell, F.E., Jr.; Moons, K.G.M.; Collins, G.S. Minimum sample size for developing a multivariable prediction model: Part II—Binary and time-to-event outcomes. Stat. Med. 2019, 38, 1276–1296. [Google Scholar] [CrossRef] [Scilit] [PubMed]

Disclaimer/Publisher’s Note: The statements, opinions and data contained in all publications are solely those of the individual author(s) and contributor(s) and not of MDPI and/or the editor(s). MDPI and/or the editor(s) disclaim responsibility for any injury to people or property resulting from any ideas, methods, instructions or products referred to in the content. |
© 2026 by the authors. Licensee MDPI, Basel, Switzerland. This article is an open access article distributed under the terms and conditions of the Creative Commons Attribution (CC BY) license.