


Abstract
Background: Patients with heart failure and reduced ejection fraction (HFrEF) who achieve improved ejection fraction (HFimpEF) after guideline-directed medical therapy exhibit superior prognosis. However, functional impairment remains a hallmark of HF. Aims: To characterize and compare exercise capacity profiles via cardiopulmonary exercise testing (CPET) between patients with HFimpEF and those with persistently reduced ejection fraction (HFprEF) using a baseline-adjusted analysis. Methods: Data from a longitudinal cohort of 111 HFrEF patients with baseline and follow-up CPET data (minimum 6-month follow-up) were analyzed. Patients were stratified into HFimpEF and HFprEF groups, according to the Universal Definition of HF. Changes between groups were evaluated using Analysis of Covariance (ANCOVA) adjusted for baseline values, with non-parametric Bootstrapping (2000 resamples) and multiplicity. Results: We included 111 patients: 69 with HFimpEF (62.2%) and 42 with HFprEF (37.8%). At a median follow-up of 8.7 months, the HFimpEF group showed significantly greater reverse remodeling (adjusted ΔLVEF +19.9%, p < 0.001) and a greater reduction in NT-proBNP levels (−557.6 pg/mL, p = 0.042). Both groups demonstrated intra-group functional improvements. However, in adjusted between-group ANCOVA models, HFimpEF achieved a significantly greater recovery in percentage of predicted peak oxygen consumption (adjusted difference: +8.5%; 95% CI: 1.2 to 16.1; p = 0.021). Net adjusted between-group differences for absolute VO2peak gain, submaximal threshold, ventilatory efficiency and recovery kinetics did not reach statistical significance. Multivariate analysis identified older age (beta −0.261, p = 0.010), diabetes mellitus (beta −0.210, p = 0.023) and baseline VO2peak (beta −0.569, p < 0.001) as negative predictors of improvement. Conclusions: Comprehensive HFrEF management improves exercise capacity across all patients. Although HFimpEF yields superior gains in normalized aerobic capacity, overall functional trajectories are largely comparable between phenotypes. This structural-functional decoupling underscores persistent residual limitations in HFimpEF, supporting CPET for longitudinal risk stratification.
1. Introduction
HF is characterized by a profound reduction in functional capacity, manifesting as severe exercise intolerance that restricts essential activities of daily living due to the onset of dyspnea, fatigue, or anginal symptoms [1]. CPET remains the gold standard for the objective quantification of these limitations [1,2,3,4]. In clinical practice, peak oxygen consumption (VO2peak) is the primary metric employed to gauge exercise capacity, as it provides a reliable reflection of systemic metabolic reserves [5]. However, since HF patients often cannot achieve maximal effort, submaximal variables have gained prominence as critical indicators. These parameters are essential for characterizing exercise capacity and serve as robust predictors of medium-term prognosis, including all-cause mortality, the necessity for cardiac transplantation, and the risk of HF-related readmissions [6,7,8].
Current evidence suggests that approximately 30–40% of patients with HFrEF exhibit significant recovery of left ventricular function during follow-up [9]. According to the Universal Definition of HF [10], patients with a baseline LVEF ≤ 40% who demonstrate an absolute increase of ≥10 points and a second measurement > 40% are classified as HFimpEF. Conversely, those failing to meet these criteria are categorized as having HFprEF. This HFimpEF phenotype is characterized by distinct clinical profiles and a markedly more favorable prognosis. Given that VO2peak is determined by both central hemodynamic and peripheral factors [1,11], it is hypothesized that patients with HFimpEF achieve a superior increase in exercise capacity—as quantified by CPET—compared with those with HFprEF [12]. This enhancement reflects greater metabolic and ventilatory efficiency secondary to left ventricular reverse remodeling. Nevertheless, while their exercise tolerance improves significantly, it often remains below that of healthy cohorts, with residual symptoms persisting in a substantial proportion of patients.
AIMs
The primary aim of this study is to characterize and compare the exercise capacity, as quantified by CPET, between patients with HFimpEF and those with HFprEF during clinical follow-up. Other secondary objectives are: (1) to analyze predictors of improvement in peak oxygen consumption in follow-up; (2) to evaluate the neurohormonal profile of the HFimpEF cohort by analyzing longitudinal variations in NT-proBNP levels; and (3) to assess left ventricular reverse remodeling by comparing echocardiographic parameters between patients with HFimpEF and those with HFprEF.
2. Materials and Methods
2.1. Study Design and Population
This work, the IMPRO2VEMENT-HF study, is an observational, retrospective, longitudinal, and analytical study of a cohort of HFrEF patients. The study population includes individuals who underwent exercise capacity assessment via CPET following either hospitalization or an outpatient consultation for HF symptoms. Participants were required to have a baseline CPET and a subsequent follow-up assessment conducted after the optimization of GDMT. The inclusion period spanned from June 2019 to December 2023.
2.2. Cohort Stratification
Patients were stratified into distinct clinical phenotypes based on longitudinal echocardiographic data and the evolution of their LVEF, in accordance with the universal definition of HF [10]: Cohort 1 (HFimpEF) and Cohort 2 (HFprEF).
2.3. Ergoespirometric Variables
Exercise capacity was assessed by means of an incremental ramp CPET on a treadmill, using a Schiller MTM-1500 treadmill coupled with a Ganshorn Powercube® gas analyzer. The protocol was selected according to each patient’s clinical characteristics and estimated functional capacity, with the aim of achieving an estimated exercise duration of 8–12 min. The Naughton protocol and three protocols specifically designed for patients with heart failure—EXTRA SOFT, SOFT, and SOFT-STAND—were used. To ensure comparability of exercise duration between the baseline and follow-up CPET assessments, each patient performed the same protocol ab both evaluations.
The Naughton protocol was performed at a constant speed of 3.2 km/h, with the treadmill grade increased by 3.5% every 2 min, starting at a 0% incline. Each of the other three protocols included a 2 min warm-up period, an incremental exercise phase lasting up to 13 min, and a 2 min recovery period. In the EXTRA SOFT protocol, the speed was initially set at 2 km/h and progressively increased to 8 km/h, while the treadmill grade increased from 4% to 9%. In the SOFT protocol, speed increased from 2 to 9 km/h and treadmill grade from 4% to 12%. Finally, in the SOFT-STAND protocol, speed increased from 2 to 11 km/h and treadmill grade from 10% to 15%.
The test was terminated upon symptom-limited exhaustion or the appearance of clinical, electrocardiographic, or metabolic termination criteria, including an RER ≥ 1.10, which was considered a specific criterion for patients with heart failure.
Aerobic capacity and gas exchange parameters included: Peak oxygen consumption (VO2peak), mL/kg/min and as a percentage of the predicted value (predicted %VO2peak), as well as oxygen consumption at the first ventilatory threshold (VO2-VT1) and the time required to reach VT1 (t-VT1). VT1 was determined using the oxygen equivalent method (VE/VCO2) and the V-slope method from the Wasserman Panel 5 (the point where the linearity of the VCO2 vs. VO2 slope breaks) [13,14]. When the results from these two methods did not align exactly, the oxygen equivalent method was given greater weight. Furthermore, maximal exercise time during CPET, measured in minutes, was also considered. Based on the predicted %VO2peak achieved by the patient during CPET, functional capacity was classified as: (1) good (VO2 > 110%), (2) normal (VO2 > 90%), (3) lower limit of normal (VO2 80–90%), (4) mildly reduced (VO2 60–80%), (5) moderately reduced (VO2 50–60%), and (6) severely reduced (VO2 < 50%).
Ventilatory Efficiency was evaluated via the VE/VCO2 slope (and the Weber functional classification (I–IV)), the Oxygen Uptake Efficiency Slope (OUES%). Additionally, end-tidal gas pressures (PETO2 and PETCO2) and equivalent fractions (VE/VCO2 and VE/VO2) were recorded at baseline, VT1, and peak exercise.
Hemodynamic and chronotropic responses were characterized by heart rate (HR) at rest, at VT1, and at peak exercise, and oxygen pulse (mL/beat and %predicted).
Recovery kinetics were assessed through the RER recovery ratio (RER-2minRec), and the Recovery Delay, measured in seconds. Finally, the MECKI Score (%) was calculated as a composite prognostic index.
2.4. Clinical, Analytical, Electrocardiographic, Echocardiographic and Treatment Variables
Secondary variables encompassed a comprehensive suite of clinical, biochemical, electrocardiographic, and echocardiographic parameters. Pharmacological optimization was monitored by recording the prescription and titration of neurohormonal antagonists at baseline and follow-up, specifically including betablockers, angiotensin-converting enzyme inhibitors (ACEi), angiotensin II receptor blockers (ARBs), angiotensin receptor-neprilysin inhibitors (ARNIs), mineralocorticoid receptor antagonists (MRAs), and sodium-glucose cotransporter-2 inhibitors (SGLT2i), alongside diuretic therapy. Furthermore, the presence of cardiac electronic devices was documented, including implantable cardioverter-defibrillators (ICDs) and cardiac resynchronization therapy, which in our cohort was exclusively performed via Left Bundle Branch Area Pacing (CRT-LBBAP) in all cases.
The Cardiac Rehabilitation Program (CRP) for patients with HF was developed in a structured and individualized manner, with exercise prescription tailored to each patient’s clinical status, functional capacity, and individual characteristics. The training program combined aerobic and resistance exercise. Aerobic exercise was generally performed two to three days per week, in sessions lasting approximately 60 min, using modalities such as walking, cycling, or treadmill exercise. The initial intensity was moderate and was progressively increased according to the patient’s tolerance. Resistance training was performed in combination during the same sessions, one to two times per week, using exercises targeting the major muscle groups and elastic bands, resistance machines, free weights, or body-weight exercises. Typically, participants performed one to three sets of 8–16 repetitions per exercise. The program was complemented by health education, promotion of heart-healthy lifestyle habits, and strategies aimed at improving adherence to treatment and exercise. Treatment adherence was strictly defined as attendance at ≥75% of the prescribed CRP sessions during the 3-month duration of the complete cardiac rehabilitation program.
2.5. Ethical Aspects
The study was approved by the Córdoba Research Ethics Committee under approval number TFG-FERE-2021. Given the retrospective design and the use of anonymized data, the Ethics Committee granted a waiver of the requirement for informed consent. Data were handled anonymously and in accordance with applicable data protection regulations. The data supporting the findings of this study are available from the corresponding author upon reasonable request, while respecting participant confidentiality. The study was conducted in accordance with the Declaration of Helsinki and applicable national ethical regulations.
2.6. Statistical Analysis
Data normality was assessed using the Kolmogorov–Smirnov test for samples exceeding 50 cases and the Shapiro–Wilk test for smaller cohorts. Continuous variables are presented as mean ± standard deviation (SD) for normally distributed data or as median and interquartile range (IQR) for non-normally distributed variables. Categorical data are reported as absolute frequencies and percentages (n, %).
For univariate comparisons of continuous variables, the t-test for paired or independent samples was employed where appropriate. For non-parametric distributions, the Wilcoxon signed-rank test or the Mann–Whitney U test was utilized. To directly compare the magnitude of change between clinical evolution groups (HFimpEF vs. HFprEF) while accounting for violations of normality and variance homogeneity, a robust analysis was performed. Specifically, an Analysis of Covariance (ANCOVA) was conducted on the follow-up values of continuous variables, utilizing their respective baseline values as covariates. To ensure the validity of the statistical inferences under heteroscedasticity and non-normal distributions, the ANCOVA model was coupled with a non-parametric Bootstrapping approach based on 2000 resamples. Statistical significance and effect sizes were determined using bias-corrected and accelerated (BCa) 95% confidence intervals (95% CI) and partial eta squared values, respectively. As a sensitivity analysis, to compare the change in ergoespirometric variables between groups, new variables were calculated as the difference between follow-up and baseline values. These differences were compared with the previously mentioned tests for independent variables, as appropriate. In case of discrepancy, the significance values obtained by the ANCOVA method were preferred.
Categorical variables were analyzed using the Pearson’s Chi-square test, Fisher’s exact test, or the McNemar test for paired proportions.
VO2peak, either expressed in mL/kg/min or as a percentage of the predicted value, was considered the primary CPET outcome. The remaining CPET parameters were considered secondary outcomes and were grouped according to their physiological domains: aerobic capacity, haemodynamic and chronotropic response, recovery kinetics, ventilatory efficiency, gas exchange, and prognostic assessment. For secondary CPET outcomes, p-values from the baseline-adjusted between-group ANCOVA analyses were adjusted for multiple comparisons using the Holm procedure within each physiological domain, controlling the family-wise error rate, and multiplicity-adjusted p-values were reported. In accordance with the analytical hierarchy of the study, neither absolute VO2peak nor predicted VO2peak was included in the multiplicity adjustment. Within-group pre–post comparisons were considered exploratory and their p-values were interpreted as nominal.
Univariate linear regression analysis was performed to evaluate the factors associated with the change in VO2peak from baseline to follow-up. To identify those factors independently associated with this variable, a multivariate linear regression analysis was run. To minimize data-driven model selection, a clinically prespecified model was fitted using the ENTER method, irrespective of statistical significance in univariate analyses. The model included age, sex, diabetes mellitus, ischemic etiology, heart failure duration, baseline VO2peak, baseline QRS duration, right heart catheterization, CRT/CRT-LBBAP, and change in left ventricular ejection fraction (ΔLVEF). Baseline pulmonary artery systolic pressure was not included in the multivariable model because of substantial missingness. Highly collinear cardiopulmonary exercise testing variables were not simultaneously entered into the model. Complete-case analysis was performed, resulting in 106 patients included in the multivariable model. Model fit was assessed using R2, adjusted R2, and the overall F-test. Multicollinearity was evaluated using tolerance and variance inflation factor (VIF), with VIF values > 5 considered indicative of potentially relevant multicollinearity. Residual assumptions were assessed using standardized residual histograms, normal probability plots, standardized residuals versus standardized predicted values, Durbin–Watson statistics, and Cook’s distance. The results are presented as unstandardized and standardized beta coefficients accompanied by their respective 95% confidence intervals.
All statistical tests were two-tailed, and a p-value ≤ 0.05 was defined as the threshold for statistical significance. Data processing and statistical computations were conducted using IBM SPSS Statistics, version 25.0.
3. Results
3.1. Baseline Clinical and Pharmacological Characteristics
We enrolled 111 HFrEF patients (median age 63 years, 69.4% male) in two cohorts: HFimpEF (69 patients; 62.2%) and HFprEF (42 patients; 37.8%). Baseline clinical and therapy measures were largely similar (Table 1). HFimpEF patients had a lower prevalence of diabetes (21.7% vs. 42.8%; p = 0.018), and less ischaemic etiology (13.0% vs. 45.2%; p < 0.001). HFimpEF patients had a shorter duration of HF (median 0 months [IQR: 0–6] vs. 11 months [IQR: 0–60]; p = 0.006) and a higher proportion of de novo HF presentation (63.8% vs. 42.8%; p = 0.042). Recent HF hospitalizations were less frequent in HFimpEF (≥1 admission in prior six months: 13.0% vs. 45.2%; p < 0.001). The median follow-up time to reassessment was 8.7 months (IQR: 7.1–12.8) for the overall cohort.
Table 1.
Baseline clinical characteristics.
3.2. Ventricular Remodeling and Neurohormonal Response
Baseline measures of ventricular size, volumes, and ejection fraction were comparable between groups (Table 1). At follow-up, HFimpEF demonstrated greater reverse remodeling: adjusted and clinically relevant reductions in LVEDD (adjusted Δ −9.0 mm; 95% CI −13.8 to −4.3; p = 0.002; ηp2 = 0.248), LVESD (Δ −16.6 mm; 95% CI −22.7 to −9.3; p = 0.007; ηp2 = 0.518), LVEDV (Δ −54.1 mL; 95% CI −85.6 to −28.8; p < 0.001; ηp2 = 0.185) and LVESV (Δ −56.9 mL; 95% CI −80.0 to −37.1; p < 0.001; ηp2 = 0.337), with a larger adjusted increase in LVEF (Δ +19.9%; 95% CI 17.4–22.5; p < 0.001; ηp2 = 0.646). Other echocardiographic variables (E/e’, LA volume index, TAPSE, S’ wave) did not show significant adjusted differences (Table 2).
Table 2.
Baseline clinical, biochemical, echocardiographic and therapeutic characteristics of the study population. Evolution of clinical, laboratory, echocardiographic and therapeutic parameters from baseline to follow-up across heart failure phenotypes. Continuous variables are expressed as mean ± standard deviation or median [interquartile range], and categorical variables as absolute numbers and percentages.
Also, NT-proBNP showed a larger adjusted decrease in HFimpEF (−557.6 pg/mL; 95% CI −1140 to −58.6; p = 0.042; ηp2 = 0.054), which is consistent with the structural and functional improvement.
3.3. Therapy Optimization
Both cohorts increased SGLT2i use (HFimpEF 53.6% to 68.1%, p = 0.002; HFprEF 40.5% to 64.3%, p = 0.003). Use of loop diuretics declined significantly only in HFimpEF (58% -> 42%, p = 0.019) but not in HFprEF. Device therapy (notably CRT-LBBAP) increased markedly in both groups, but was most frequent in the first one at the end of follow-up (HFimpEF 58.0%; HFprEF 35.7%; p = 0.023).
3.4. CPET Longitudinal Changes
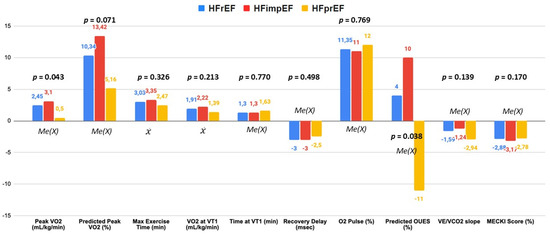
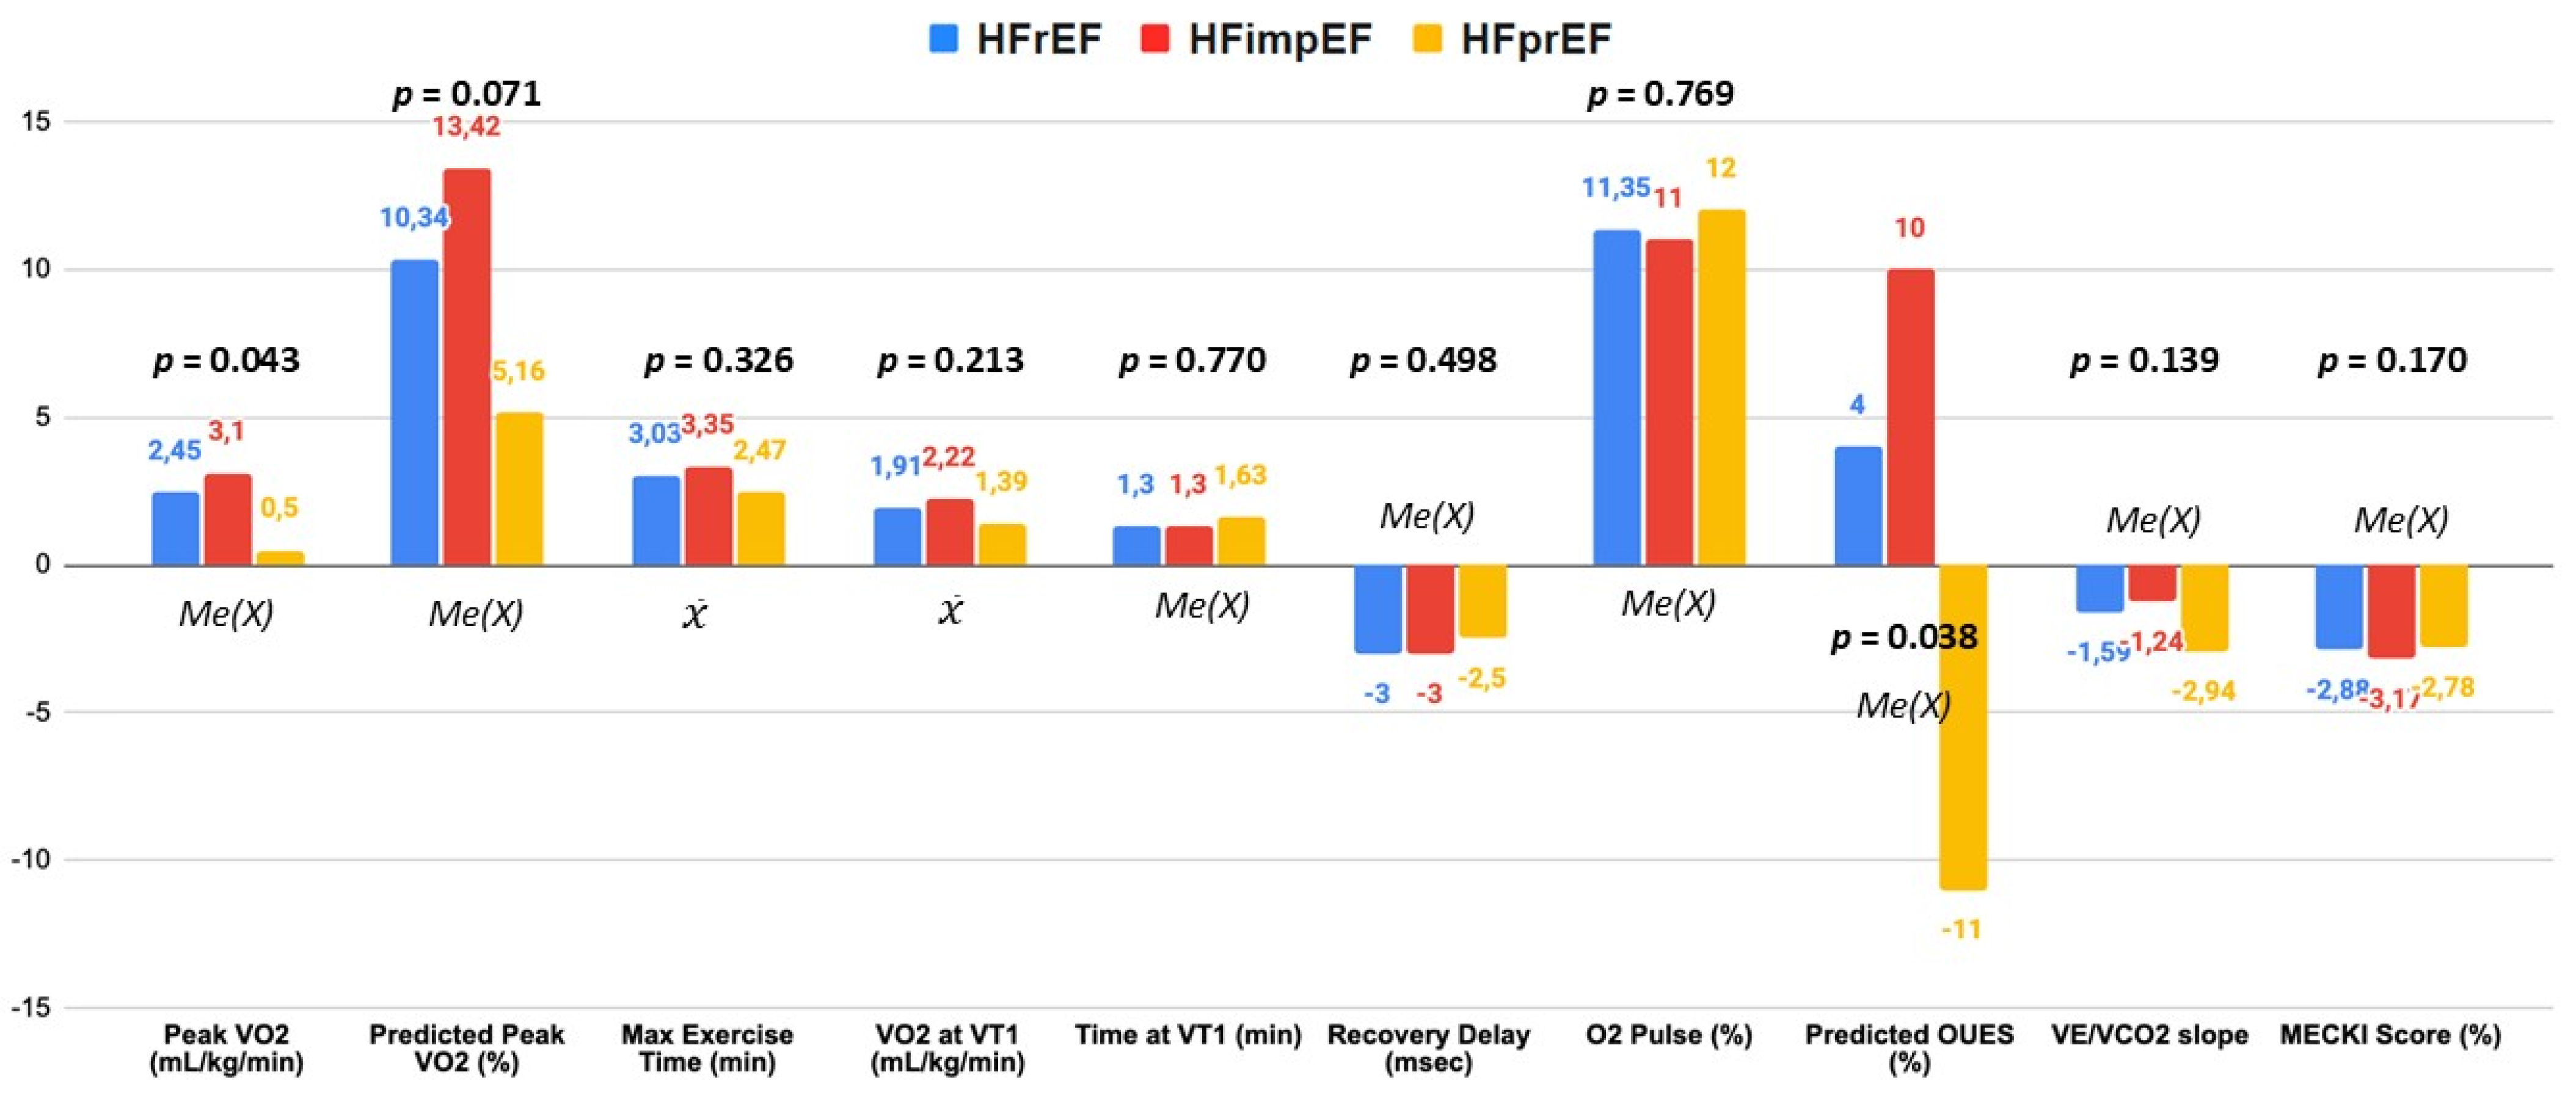
Analysis of CPET parameters—assessed at baseline and following GDMT—demonstrated significant differences in functional recovery trajectories between the study cohorts Graphical Abstract, Figure 1, Table 3. The Naughton protocol was the most frequently used, being performed in 86 patients (77.5%), followed by the SOFT protocol in 11 cases (9.9%), EXTRASOFT in 9 (8.1%), and SOFT-STAND in 5 (4.5%). A total of 82 tests (73.9%) met the prespecified peak RER threshold (≥1.10) at baseline, without differences between groups (49 [71.0%] vs. 33 [78.6%], HFimpEF vs. HFprEF, p = 0.379). At follow-up, 83 tests (74.8%) met the prespecified peak RER, without differences between groups (49 [71.0%] vs. 34 [81.0%], improved vs. persistent reduced, p = 0.242).
Figure 1.
Changes in cardiopulmonary exercise testing (CPET) parameters at follow-up according to Heart Failure phenotype. Values represent the absolute change from baseline to the follow-up. Data are expressed as mean () or median (MeX) of the differences, depending on the normality of the distribution. Abbreviations: VO2peak: peak oxygen consumption; Predicted PeakVO2%: percentage of predicted peak oxygen consumption; Max Exercise Time: maximum exercise duration; VO2 at VT1: oxygen consumption at the first ventilatory threshold; Time at VT1: time to reach the first ventilatory threshold; Recovery Delay: delay in oxygen uptake recovery kinetics; O2 Pulse: oxygen pulse; Predicted OUES: percentage of predicted oxygen uptake efficiency slope; VE/VCO2 slope: minute ventilation/carbon dioxide production slope; MECKI Score: metabolic exercise cardiac kidney index.
Table 3.
Cardiopulmonary exercise testing parameters across heart failure phenotypes. Comparative analysis of gas exchange, ventilatory efficiency, and hemodynamic response during maximal exercise. Data are presented as mean ± standard deviation or median [interquartile range], as appropriate.
Aerobic Capacity and Oxygen Consumption
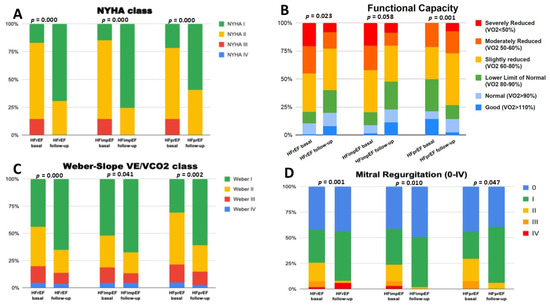
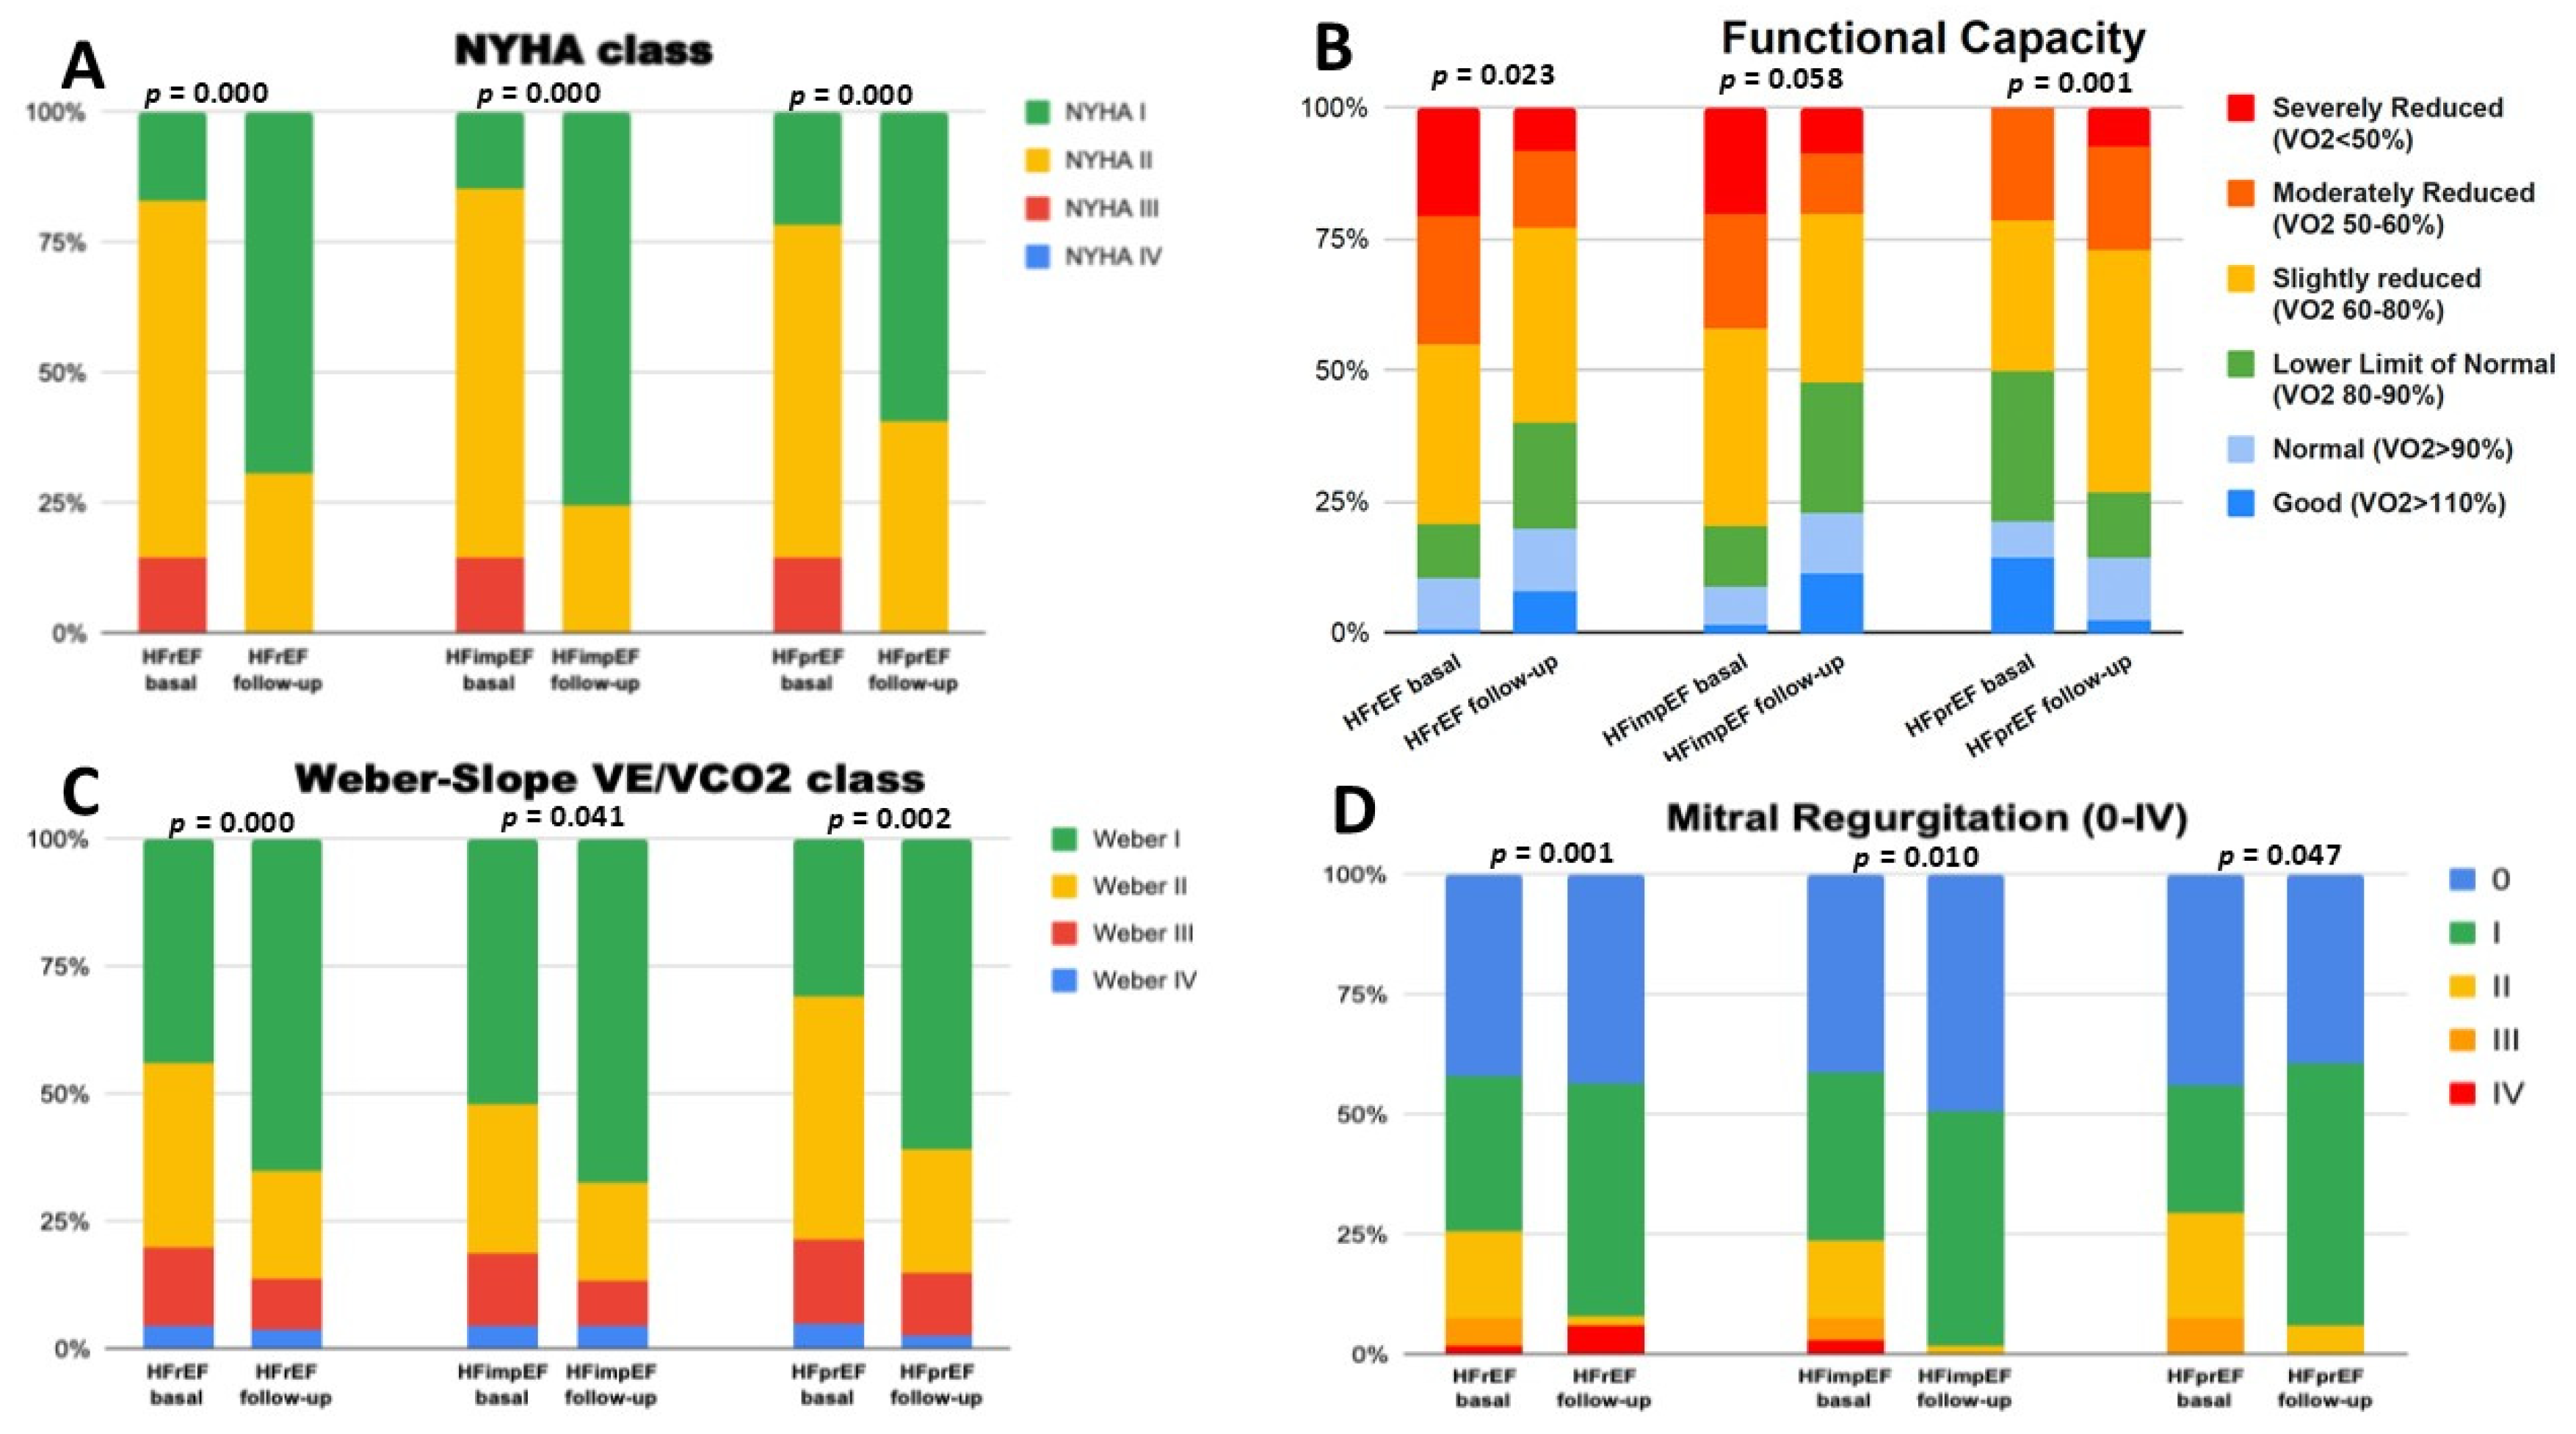
At baseline, both groups exhibited comparable functional impairment and were similar in terms of aerobic capacity and oxygen consumption. However, at follow-up, the HFimpEF group demonstrated superior improvement in VO2peak, from 15.5 to 19.2 mL/kg/min (p < 0.001, median of differences 3.1). In contrast, patients with HFprEF improved from 15.7 to 17.7 mL/kg/min (p = 0.043, median of differences 0.5). This difference between groups showed a trend by ANCOVA with bootstrapping (p = 0.072) and was significant by direct comparison (p = 0.043, Figure 1 and Table 2). This disparity became further pronounced when evaluating the percentage of predicted peak oxygen consumption (%VO2peak), which increased by a greater amount in HFimpEF (63% to 78%, p = 0.000, mean of differences 13.4%) than in the HFprEF group (60% to 68.0%, p = 0.167, mean of differences 5.2%), with this difference between groups being significant by ANCOVA with bootstrapping (p = 0.021), Table 2, and showed a trend by direct comparison (p = 0.071, Figure 1). In our series, moderate impairment (defined as %VO2peak < 60%) persisted in 20.3% of the HFimpEF group vs. 26.2% of HFprEF patients (Figure 2).
Figure 2.
Longitudinal Assessment of Functional and Clinical Parameters Across Heart Failure Phenotypes. Comparative analysis of patients with HFrEF, HFimpEF, and HFprEF at baseline and follow-up. (A) Evolution of symptomatic status according to the NYHA Functional Class; (B) exercise capacity distribution based on percentage of predicted peak oxygen consumption (VO2peak%); (C) Changes in metabolic efficiency and aerobic reserve (VE/VCO2) based on the Weber Classification; (D) Prevalence and severity of mitral regurgitation across the study cohorts. p-values indicate statistical significance for intra-group functional optimization over the study period.
The VT1 occurred later in all phenotypes, with increased oxygen consumption. In HFimpEF, VO2-VT1 rose from 11.1 to 13.3 mL/kg/min (p < 0.001), while in HFprEF it increased from 10.9 to 12.3 mL/kg/min (p = 0.013). Although HFimpEF showed the largest absolute gains, the adjusted difference in VO2-VT1 between groups was 0.9 mL/kg/min (95% CI −0.2 to 1.9; p = 0.100; ηp2 = 0.023) and did not reach statistical significance after adjustment. Exercise tolerance improved overall: maximal exercise time increased by approximately 3 min across the global cohort, with HFimpEF reaching a mean of 13.6 min. However, the adjusted between-group difference in maximal exercise time was 1.3 min (95% CI −0.3 to 2.9; p = 0.104; ηp2 = 0.024), also not significant after adjustment.
Overall, the data show functional improvements in all groups with larger absolute gains in HFimpEF, but adjusted between-group comparisons did not demonstrate statistically significant differences.
Ventilatory Efficiency and Gas Exchange Kinetics
Ventilatory efficiency, a pivotal prognostic determinant in heart failure, demonstrated favorable changes across both phenotypes. The VE/VCO2 slope decreased significantly in both groups: HFimpEF (29.0 to 27.0; p < 0.0025) and HFprEF (33.0 to 29.6; p < 0.001), reflecting an optimized exertional ventilatory response and likely reduction in physiological dead space.
Regarding the OUES, rose significantly in HFimpEF (1.4 to 1.8; p = 0.003), but the increase in HFprEF (1.6 to 2.2; p = 0.767) was not significant. When OUES was normalized for age and body size (predicted OUES%), the trend was similar to these findings, with HFimpEF nearing normal values (97% ± 29%; p = 0.052), Figure 1. However, adjusted ANCOVA comparisons revealed no significant between-group differences at follow-up for either VE/VCO2 slope (p = 0.755) or predicted OUES% (p = 0.077), Table 3.
Hemodynamic Parameters, Cardiac Reserve and Recovery Kinetics
The oxygen pulse -a surrogate measure of stroke volume during exertion- showed substantial improvement in both cohorts, with a more pronounced absolute gain in HFimpEF patients (from 10.1 to 12.3 mL/beat, +2.08; p < 0.001) than in HFprEF (+1.5 mL/beat; p = 0.001). Notably, when expressed as a percentage of predicted value, oxygen pulse reached near-normal levels in the HFimpEF group (75% to 89%; p = 0.008), whereas the increase in HFprEF did not achieve statistical significance. Although between-group ANCOVA comparisons at follow-up showed no significant differences for oxygen pulse (p = 0.239), post-exercise recovery dynamics revealed a distinct physiological advantage for HFimpEF. Specifically, Recovery Delay showed a nominal between-group difference favoring HFimpEF (adjusted difference: −9.0 ms; 95% CI: −18.0 to −0.6; nominal p = 0.047). However, after adjustment for multiple comparisons within the recovery kinetics domain using the Holm procedure, this association was no longer statistically significant (Holm-adjusted p = 0.141). Accordingly, Recovery Delay should be considered an exploratory finding rather than a confirmatory between-group difference. This comprehensive functional optimization was accompanied by a marked improvement in clinical prognosis, as assessed by the MECKI score [6], which decreased significantly in both HFimpEF [3.9% to 0.6%; p < 0.001] and HFprEF [5.9% to 3.3%; p < 0.001], without significant differences between groups.
3.5. Variables Associated with VO2peak Response at Follow-Up
In the univariate analysis, the following were identified as associated with VO2peak improvement at follow-up: diabetes mellitus, baseline PASP, baseline VO2peak, baseline %predictedVO2peak, VO2-VT1, %predicted VO2-VT1, exercise duration, baseline O2 pulse, baseline %predicted O2 pulse, and baseline QRS duration. In the prespecified multivariable linear regression analysis, 106 patients with complete data were included. The overall model was statistically significant (F(10,95) = 4.919, p < 0.001), explaining 34.1% of the variability in the change in VO2peak (R2 = 0.341; adjusted R2 = 0.272). Older age (B = −0.118 mL/kg/min per year; 95% CI, −0.207 to −0.029; standardized β = −0.261; 95% CI, −0.458 to −0.064; p = 0.010), diabetes mellitus (B = −2.250 mL/kg/min; 95% CI, −4.190 to −0.310; standardized β = −0.210; 95% CI, −0.392 to −0.029; p = 0.023), and higher baseline VO2peak (B = −0.580 mL/kg/min per mL/kg/min; 95% CI, −0.774 to −0.387; standardized β = −0.569; 95% CI, −0.759 to −0.379; p < 0.001) were independently associated with a lower magnitude of VO2peak improvement. No statistically significant independent associations were observed for sex, ischemic etiology, heart failure duration, baseline QRS duration, right heart catheterization, CRT-LBBAP, or ΔLVEF. In particular, greater ΔLVEF was not independently associated with ΔVO2peak (B = 0.019; 95% CI, −0.058 to 0.096; standardized β = 0.052; p = 0.617). No VIF exceeded 5, although relatively higher values were observed for baseline QRS duration (VIF = 4.021) and CRT/CRT-LBBAP (VIF = 4.848). Residual diagnostics did not identify major departures from the regression assumptions. Standardized residuals ranged from −2.017 to 3.324, and the maximum Cook’s distance was 0.177, suggesting no highly influential individual observation, Table 4.
Table 4.
Predictors of peak oxygen improvement. Univariate and Multivariate linear regression models.
4. Discussion
The IMPRO2VEMENT-HF study demonstrates that comprehensive management of HFrEF yields substantial and multifaceted gains in functional capacity and cardiopulmonary efficiency across the entire patient spectrum; our findings reveal a partial decoupling between echocardiographic improvement and exertional adaptations: while both HFimpEF and HFprEF phenotypes exhibited significant intra-group improvements in aerobic performance, ventilatory efficiency, and prognostic risk scores, between-group adjusted ANCOVA comparisons revealed that the magnitude of overall functional trajectory was largely comparable between phenotypes. Rather than displaying a complete divergence, these findings indicate that baseline HFrEF patients derive meaningful exertional benefits from contemporary guideline-directed therapies regardless of the extent of LVEF recovery, though specific metrics -such as normalized peak oxygen consumption (%predicted VO2peak) highlight a subtle, distinct advantage in those achieving reverse left ventricular remodeling.
Improvement in exercise capacity and Oxygen Consumption. Predictors of VO2peak Improvement.
The primary finding of our study lies in the gain in VO2peak observed within the HFimpEF cohort. Although a global improvement in aerobic capacity was noted across the entire study population, the HFimpEF subgroup achieved a median increase of 3.0 mL/kg/min, which substantially exceeded the 0.5 mL/kg/min median gain reported in the HFprEF group. These findings align with prior large-scale registry data, notably the studies by Agostoni et al. [12], based on the MECKI score database, and Magrí et al. [15]. Agostoni et al. documented significantly higher absolute VO2peak values in HFimpEF compared to persistent HFprEF (15.5 vs. 14.0 mL/kg/min; or 62.2% vs. 52.6% of predicted), while Magrí et al. reported a similar superiority in recovered mid-range EF patients (16.1 vs. 14.4 mL/kg/min; or 63% vs. 53% of predicted). The consistency between both studies and its relationship with our data is notable. Both place peak oxygen consumption at around 16.5–16.7 mL/kg/min for the recovered group. These studies validate that the recovery of LVEF typically leads to a gain of approximately 2.5 to 3 mL/kg/min in aerobic capacity compared to patients who do not improve, even though the increase in our series was somewhat smaller (+1.7 mL/kg/min). However, a crucial methodological distinction must be emphasized when contextualizing these comparisons. Both Agostoni et al. and Magrí et al. evaluated cross-sectional baseline differences between EF phenotypes without performing an adjusted ANCOVA analysis to compare the longitudinal magnitude of change between groups over time (Table S1). When we applied and adjusted ANCOVA model to account for baseline differences, the net between-group difference in absolute VO2peak gain did not reach statistical significance, whereas the percentage of predicted VO2peak did demonstrate a significant adjusted superior recovery in HFimpEF (adjusted difference: 8.5%; 95% CI: 1.2 to 16.1; p = 0.021). This suggests that while absolute aerobic gains reflect a broad therapeutic response across HFrEF phenotypes, normalized functional capacity (%predicted VO2peak) represents a more sensitive marker of the distinct metabolic advantage associated with LVEF recovery.
Time to VT1 represents the functional reserve for daily activities, such as walking, climbing a flight of stairs, or dressing, which occur at intensities near the first ventilatory threshold. In heart failure, not only is the “pump” function impaired, but skeletal muscles also exhibit lower mitochondrial density and reduced blood flow, causing the patient to reach the anaerobic threshold (VT1) much sooner than normal. Conversely, one might hypothesize that patients who improve their ejection fraction would delay the time to the first threshold. Following our comprehensive therapeutic intervention, we observed a significant delay in the time to VT1 across the entire study population. Notably, this improvement was virtually identical between the HFimpEF and HFprEF cohorts (ANCOVA p = 0.975). Rather than being solely dependent on LVEF recovery, this parallel gain indicates that peripheral muscular adaptations and the optimization of submaximal aerobic metabolism can be successfully achieved regardless of the extent of central pump restoration.
Furthermore, the enhancement in exercise tolerance -manifested by an increase in peak exercise duration (+3.4 min in HFimpEF vs. +2.5 min in HFprEF) -underscores the clinical impact of a comprehensive therapeutic approach. This multifaceted intervention, integrating GDMT, CRT-LBBAP, and structured CRP, directly contributes to superior improvements in patient quality of life.
A key finding of our study is the identification of specific clinical characteristics associated with the magnitude of functional recovery. To the best of our knowledge, there is limited evidence in the current literature regarding the determinants of longitudinal improvement in VO2peak in this specific patient population. While many studies have focused on the prognostic value of absolute VO2peak values [5,7,15,16,17], our data provide a novel perspective by analyzing the clinical factors associated with the magnitude of improvement in aerobic capacity over time.
In the prespecified multivariable analysis, older age, diabetes mellitus, and higher baseline VO2peak were independently associated with a lower magnitude of functional improvement. The inverse association with baseline VO2peak suggests a possible “ceiling effect”, whereby patients starting with a higher aerobic capacity have less margin for substantial improvement than those with greater baseline functional impairment. This interpretation is consistent with previous observations showing that patients with lower baseline exercise capacity may experience larger gains following optimization of heart failure treatment and cardiac resynchronization [18,19,20]. Diabetes mellitus was also independently associated with smaller improvements in VO2peak, possibly reflecting the combined influence of metabolic abnormalities, microvascular dysfunction, skeletal muscle impairment, and reduced physiological adaptability to exercise.
Baseline QRS duration showed a positive association with VO2peak improvement in the univariate analysis; however, this association was not maintained after adjustment for the prespecified clinical and therapeutic covariates. Therefore, our findings do not support baseline QRS duration as an independent determinant of functional improvement in this cohort. This result should be interpreted in the context of the complex relationship between electrical conduction delay, ventricular dyssynchrony, and response to cardiac resynchronization. Although prolonged QRS duration is an established marker used in the selection of patients for resynchronization therapy and has been associated with response to CRT-related outcomes, QRS duration alone does not directly quantify mechanical dyssynchrony and may not consistently predict changes in exercise capacity. Accordingly, the unadjusted association observed in our cohort may reflect, at least in part, differences in the underlying substrate and in the likelihood of receiving resynchronization therapy rather than an independent effect of QRS duration itself.
Analysis of ventilatory efficiency and hemodynamic response to exercise
Beyond aerobic capacity, ventilatory efficiency -quantified by the VE/VO2 slope- serves as a critical prognostic indicator in heart failure [14]. In the current study, the HFimpEF group demonstrated a statistically significant reduction in this parameter, decreasing from a baseline of 29 to 27. Clinically, a follow-up value of 27 reclassifies these patients within a low-risk stratum (Weber Class A), outperforming the efficiency levels reported by Agostoni et al. [12], who documented a mean slope of 30.6 in the MECKI score database. Regarding OUES, at baseline, it was depressed across all groups, reflecting a systemic impairment in the efficiency of oxygen extraction and utilization. Our findings regarding the significant increase in OUES within the HFimpEF cohort align with the large-scale observations from the MECKI score data base reported by Agostoni et al. and Magrì et al. [12,15]. These authors emphasized that physiological recovery in HF patients is multifaceted, involving not just LVEF improvement but also a significant shift in ventilatory efficiency and oxygen uptake kinetics. Specifically, the improvement of OUES in our HFimpEF group reinforces the concept that recovered patients achieve a more efficient metabolic response to exercise, which is traditionally associated with a better long-term prognosis in the literature. However, a crucial statistical distinction arises when comparing our longitudinal methodology with previous registry data. While both Agostoni et al. and Magrí et al. established significant baseline differences between EF phenotypes using cross-sectional univariate comparisons (e.g., Mann–Whitney U or t-tests), neither study performed an adjusted ANCOVA analysis to account for baseline imbalances when evaluating functional changes over time. In our series, when evaluating these ventilatory efficiency parameters in adjusted between-group ANCOVA models, the net differences at follow-up between both groups did not reach statistical significance (Table S1). This lack of statistical divergence after ANCOVA adjustment indicates that exertional ventilatory optimization is a shared, global benefit of modern, comprehensive heart failure therapy across HFrEF phenotypes, rather than an exclusive physiological feature driven solely by LVEF recovery.
Concurrently, a notable normalization of the oxygen pulse was observed, with a higher proportion seen in the HFimpEF cohort, which reflects a more efficient stroke volume during exercise; given that oxygen pulse is a surrogate for stroke volume and cardiac output during exertion, these data suggest that LVEF recovery is coupled with a restoration of hemodynamic reserved, facilitating more efficient cardiac performance during physical stress. In our series, the proportion of patients who achieved a normalization of the %predicted oxygen pulse was higher than that reported by Agostoni et al. [12], which was calculated at 62.2% and 52.6% for HFimpEF and HFprEF, respectively.
Reverse remodeling and metabolic efficiency
The debate regarding whether a heart with recovered LVEF represents a truly “cured” state remains complex. Our findings demonstrate a significant reduction in ventricular volumes and NT-proBNP levels within the HFimpEF cohort (from 1202 to 372 pg/mL). However, existing literature warns against the “echocardiographic recovery false positive”: if LVEF improvement is not accompanied by objective functional gains (e.g., VO2peak > 55% of predicted), a substantial residual risk for cardiovascular events persists. In fact, although our study did not include an analysis of CPET predictors for cardiovascular events, it is worth noting that up to one-fifth of patients who show improvement in their LVEF still exhibit moderately impaired functional capacity (predicted %VO2 < 60%).
In the IMPRO2VEMENT-HF study, functional optimization directly translated into an improved clinical prognosis as projected by the MECKI score, with a more pronounced risk reduction in the HFimpEF group. Consequently, HF risk is not static; therefore, HFrEF patients should have follow-up CPETs to restratify their risk, allowing for early detection of relapses and optimized exercise capacity through tailored pharmacological therapy and exercise [21].
Several limitations must be acknowledged. First, the retrospective nature of the study may introduce inherent selection biases. Second, the sample size is relatively modest when compared to large-scale registries, such as the MECKI score database, and may have limited the precision and stability of the multivariable regression estimates. Nevertheless, to minimize the risk of data-driven model selection, the multivariable analysis was based on a clinically prespecified set of variables selected according to clinical relevance and previous evidence rather than univariate statistical significance. Finally, as a single-center study, the generalizability of our findings to other clinical settings may be limited. Nonetheless, the meticulous depth of the CPET data provides robust internal validity, lending significant weight to our conclusions.
5. Conclusions
Comprehensive HFrEF management yields substantial functional gains across the entire patient spectrum. Although HFimpEF patients achieve superior gains in normalized aerobic capacity (%predicted VO2peak), adjusted comparisons reveal no significant between-group differences in absolute peak VO2, submaximal exercise thresholds, ventilatory efficiency or recovery kinetics. This partial decoupling between central structural remodeling and functional recovery underscores that residual exertional limitations persist despite LVEF normalization. CPET may be a useful tool for longitudinally assessing functional recovery and risk stratification in these patients.
Supplementary Materials
The following supporting information can be downloaded at https://www.mdpi.com/article/10.3390/jcm15218406/s1, Table S1. Comparative Analysis of Patient Cohorts, CPET parameters, and statistical methodology across the Agostoni et al. [12], Magrí et al. [15] and IMPRO2VEMENT studies.
Author Contributions
D.L.-S.: Data curation, validation, visualization, writing—original draft; J.L.-A.: conceptualization, funding acquisition, writing—original draft, supervision, methodology, project administration, visualization; J.A.T.-Z.: investigation, software, visualization, writing—review and editing; C.F.-A.: investigation, data curation; J.P.-A.: investigation, data curation; G.G.B.: investigation, data curation, formal analysis, writing—review and editing; G.H.C.: investigation, data curation; L.C.M.L.: investigation, data curation, resources; R.L.L.: investigation, data curation, resources; A.G.M.: investigation, data curation, resources; Á.H.T.: investigation, data curation, resources; J.M.G.M.: investigation, data curation, resources; J.M.S.S.-G.: investigation, data curation, resources; Á.R.-G.: investigation, data curation; M.C.-C.: investigation, data curation; M.D.-O.: investigation, data curation; R.G.M.: formal analysis, methodology; D.M.-R.: investigation, data curation; M.P.-Á.O.: investigation, data curation; M.A.-S.: investigation, supervision, validation; J.C.C.-D.: investigation, funding acquisition, supervision, validation, writing—review and editing, M.R.-O.: formal analysis, writing—review and editing, supervision, validation, methodology, visualization. All authors have read and agreed to the published version of the manuscript.
Funding
This work was partially supported by a research grant from the Andalusian Society of Cardiology.
Institutional Review Board Statement
This study has been approved by the Cordoba Research Ethics Committee (approval number TFG-FERE-2021, dated 27 October 2021).
Informed Consent Statement
Informed consent for participation was waived by the Córdoba Research Ethics Committee due to the retrospective design and the use of anonymized data.
Data Availability Statement
The data is available in its entirety upon request.
Conflicts of Interest
The authors declare that the research was conducted in the absence of any commercial or financial relationships that could be construed as a potential conflict of interest.
Abbreviations
HFrEF: Heart Failure with Reduced Ejection Fraction. HFimpEF: Heart Failure with Improved Ejection Fraction. HFprEF: Heart Failure with Persistently Reduced Ejection Fraction. CPET: Cardiopulmonary Exercise Test. LVEDD: Left Ventricular End-Diastolic Diameter. CRT-LBBAP: Cardiac Resynchronization Therapy via Left Bundle Branch Area Pacing.
References
- Mapelli, M.; Salvioni, E.; Mattavelli, I.; Vignati, C.; Galotta, A.; Magrì, D.; Apostolo, A.; Sciomer, S.; Campodonico, J.; Agostoni, P. Cardiopulmonary exercise testing and heart failure: A tale born from oxygen uptake. Eur. Heart J. Suppl. 2023, 25, C319–C325. [Google Scholar] [CrossRef] [Scilit]
- Juarez, M.; Castillo-Rodriguez, C.; Soliman, D.; Del Rio-Pertuz, G.; Nugent, K. Cardiopulmonary Exercise Testing in Heart Failure. J. Cardiovasc. Dev. Dis. 2024, 11, 70. [Google Scholar] [CrossRef] [Scilit]
- Moneghetti, K.J.; Christle, J.W.; Myers, J.; Haddad, F. Exercise testing in heart failure: A contemporary discussion in an era of novel diagnostic techniques and biomarkers. Curr. Opin. Cardiol. 2018, 33, 217–224. [Google Scholar]
- Malhotra, R.; Bakken, K.; D’elia, E.; Lewis, G.D. Cardiopulmonary Exercise Testing in Heart Failure. JACC Heart Fail. 2016, 4, 607–616. [Google Scholar] [CrossRef] [Scilit]
- Nadruz, W.; West, E.; Sengeløv, M.; Santos, M.; Groarke, J.D.; Forman, D.E.; Claggett, B.; Skali, H.; Shah, A.M. Prognostic value of cardiopulmonary exercise testing in heart failure with reduced, midrange, and preserved ejection fraction. J. Am. Heart Assoc. 2017, 6, e006000. [Google Scholar] [CrossRef] [Scilit]
- Salvioni, E.; Bonomi, A.; Re, F.; Mapelli, M.; Mattavelli, I.; Vitale, G.; Sarullo, F.M.; Palermo, P.; Veglia, F.; Agostoni, P. The MECKI score initiative: Development and state of the art. Eur. J. Prev. Cardiol. 2020, 27, 5–11. [Google Scholar] [CrossRef] [Scilit]
- Lala, A.; Shah, K.B.; Lanfear, D.E.; Thibodeau, J.T.; Palardy, M.; Ambardekar, A.V.; McNamara, D.M.; Taddei-Peters, W.C.; Baldwin, J.T.; Jeffries, N.; et al. Predictive Value of Cardiopulmonary Exercise Testing Parameters in Ambulatory Advanced Heart Failure. JACC Heart Fail. 2021, 9, 226–236. [Google Scholar] [CrossRef] [Scilit]
- Swank, A.M.; Horton, J.; Fleg, J.L.; Fonarow, G.C.; Keteyian, S.; Goldberg, L.; Wolfel, G.; Handberg, E.M.; Bensimhon, D.; Illiou, M.C.; et al. Modest increase in peak VO2 is related to better clinical outcomes in chronic heart failure patients: Results from Heart Failure and a Controlled Trial to Investigate Outcomes of Exercise Training. Circ. Heart Fail. 2012, 5, 579–585. [Google Scholar]
- Perea-Armijo, J.; López-Aguilera, J.; Sánchez-Prats, R.; Castillo-Domínguez, J.C.; González-Manzanares, R.; Ruiz-Ortiz, M.; Mesa-Rubio, D.; Anguita-Sánchez, M.; Prats, R.S.; Castillo-Dominguez, J.C.; et al. Improvement of left ventricular ejection fraction in patients with heart failure with reduced ejection fraction: Predictors and clinical impact. Med. Clin. 2023, 161, 1–10. [Google Scholar] [CrossRef] [Scilit]
- Bozkurt, B.; Coats, A.J.; Tsutsui, H.; Abdelhamid, M.; Adamopoulos, S.; Albert, N.; Anker, S.D.; Atherton, J.; Böhm, M.; Butler, J.; et al. Universal Definition and Classification of Heart Failure: A Report of the Heart Failure Society of America, Heart Failure Association of the European Society of Cardiology, Japanese Heart Failure Society and Writing Committee of the Universal Definition of Heart Failure. J. Card. Fail. 2021, 27, 387–413. [Google Scholar]
- Brawner, C.A.; Lazar, M.H. Cardiopulmonary exercise testing criteria for advanced therapies in patients with heart failure. Heart Fail. Rev. 2023, 28, 1297–1306. [Google Scholar] [CrossRef] [Scilit]
- Agostoni, P.; Pluchinotta, F.R.; Salvioni, E.; Mapelli, M.; Galotta, A.; Bonomi, A.; Magrì, D.; Perna, E.; Paolillo, S.; Corra, U.; et al. Heart failure patients with improved ejection fraction: Insights from the MECKI score database. Eur. J. Heart Fail. 2023, 25, 1976–1984. [Google Scholar] [CrossRef] [Scilit]
- Hansen, D.; Abreu, A.; Ambrosetti, M.; Cornelissen, V.; Gevaert, A.; Kemps, H.; Laukkanen, J.A.; Pedretti, R.; Simonenko, M.; Wilhelm, M.; et al. Exercise intensity assessment and prescription in cardiovascular rehabilitation and beyond: Why and how: A position statement from the Secondary Prevention and Rehabilitation Section of the European Association of Preventive Cardiology. Eur. J. Prev. Cardiol. 2022, 29, 230–245. [Google Scholar] [CrossRef] [Scilit]
- Gitt, A.K.; Wasserman, K.; Kilkowski, C.; Kleemann, T.; Kilkowski, A.; Bangert, M.; Schneider, S.; Schwarz, A.; Senges, J. Exercise anaerobic threshold and ventilatory efficiency identify heart failure patients for high risk of early death. Circulation 2002, 106, 3079–3084. [Google Scholar] [CrossRef] [Scilit]
- Magrì, D.; Piepoli, M.; Corrà, U.; Gallo, G.; Maruotti, A.; Vignati, C.; Salvioni, E.; Mapelli, M.; Paolillo, S.; Filardi, P.P.; et al. Cardiovascular Death Risk in Recovered Mid-Range Ejection Fraction Heart Failure: Insights From Cardiopulmonary Exercise Test. J. Card. Fail. 2020, 26, 932–943. [Google Scholar] [CrossRef] [Scilit]
- Sato, T.; Yoshihisa, A.; Kanno, Y.; Suzuki, S.; Yamaki, T.; Sugimoto, K.; Kunii, H.; Nakazato, K.; Suzuki, H.; Saitoh, S.I.; et al. Cardiopulmonary exercise testing as prognostic indicators: Comparisons among heart failure patients with reduced, mid-range and preserved ejection fraction. Eur. J. Prev. Cardiol. 2017, 24, 1979–1987. [Google Scholar] [CrossRef] [Scilit]
- Corrà, U.; Giordano, A.; Gambarin, F.I.; Gnemmi, M.; Marcassa, C.; Pistono, M. Cardiopulmonary exercise testing in patients with asymptomatic left ventricular dysfunction: Lack of prognostic predictive power of ventilatory variables. Eur. J. Prev. Cardiol. 2022, 29, 1158–1163. [Google Scholar] [CrossRef] [Scilit]
- Tokavanich, N.; Prasitlumkum, N.; Mongkonsritragoon, W.; Trongtorsak, A.; Cheungpasitporn, W.; Chokesuwattanaskul, R. QRS area as a predictor of cardiac resynchronization therapy response: A systematic review and meta-analysis. PACE—Pacing Clin. Electrophysiol. 2022, 45, 393–400. [Google Scholar] [CrossRef] [Scilit]
- Gutiérrez-Ballesteros, G.; Mazuelos-Bellido, F.; López-Aguilera, J.; Crespín-Crespín, M.; González-Manzanares, R.; García-Merino, M.A.; Mesa-Rubio, D.; Romero-Moreno, M.; Pan Álvarez-Osorio, M.; Segura Saint-Gerons, J.M. Changes in oxygen uptake in patients with non-ischemic dilated cardiomyopathy and left bundle branch block following left bundle branch area pacing. Front. Cardiovasc. Med. 2025, 12, 1551551. [Google Scholar] [CrossRef] [Scilit]
- Solano, J.; Rahunathan, N.; Sykes, D.L.; Eni, G.; Edhem, L.; Witte, K.K. The effect of Cardiac Resynchronization Therapy (CRT) on functional capacity based on Cardiopulmonary Exercise Testing (CPET): A systematic review and meta-analysis. Eur. Heart J. Open 2025, 6, oeaf176. [Google Scholar] [CrossRef] [Scilit]
- Pezzuto, B.; Piepoli, M.; Galotta, A.; Sciomer, S.; Zaffalon, D.; Filomena, D.; Vignati, C.; Contini, M.; Alimento, M.; Baracchini, N.; et al. The importance of re-evaluating the risk score in heart failure patients: An analysis from the Metabolic Exercise Cardiac Kidney Indexes (MECKI) score database. Int. J. Cardiol. 2023, 376, 90–96. [Google Scholar] [CrossRef] [Scilit]

Disclaimer/Publisher’s Note: The statements, opinions and data contained in all publications are solely those of the individual author(s) and contributor(s) and not of MDPI and/or the editor(s). MDPI and/or the editor(s) disclaim responsibility for any injury to people or property resulting from any ideas, methods, instructions or products referred to in the content. |
© 2026 by the authors. Licensee MDPI, Basel, Switzerland. This article is an open access article distributed under the terms and conditions of the Creative Commons Attribution (CC BY) license.