


Abstract
Background/Objectives: The early postoperative stress hyperglycemia ratio (SHR) may capture acute glycemic stress relative to chronic glycemia, but its association with infection-related events after cranial neurosurgery remains uncertain. We evaluated these associations in critically ill patients after cranial neurosurgical procedures. Methods: We retrospectively analyzed 1408 adults in MIMIC-IV after eligible cranial neurosurgical procedures. SHR was calculated from the first serum glucose measurement 6–24 h after surgery and estimated average glucose was derived from HbA1c. Primary outcomes were electronic health record (EHR)-defined suspected infection, culture-positive infection from any qualifying specimen, Sepsis-3-defined sepsis, and an EHR-based septic shock proxy. The secondary outcome was 90-day mortality. Results: In fully adjusted models, each 0.1-unit increase in SHR was associated with suspected infection (OR 1.08, 95% CI 1.04–1.12), culture-positive infection (OR 1.05, 95% CI 1.01–1.09), Sepsis-3-defined sepsis (OR 1.07, 95% CI 1.03–1.11), and septic shock (OR 1.10, 95% CI 1.05–1.15). In nested analyses, each 1-SD increase in SHR was associated with 90-day mortality (OR 1.59, 95% CI 1.29–1.96). Associations persisted in 24-h lag analyses. Adding SHR yielded small, non-significant AUC increases but improved reclassification for Sepsis-3-defined sepsis and septic shock. Conclusions: Higher early postoperative SHR was associated with EHR-derived, all-source infection-related and sepsis-related events and 90-day mortality in a heterogeneous postoperative neurocritical care cohort. These findings do not establish that SHR predicts postoperative neurosurgical infection; prospective external validation is required before clinical use.
1. Introduction
Postoperative infection is among the most serious complications after craniotomy, particularly in patients who require postoperative intensive care. In neurosurgical populations, the clinical impact of infection is amplified by procedure-specific vulnerabilities, including prolonged operative duration, repeated cranial intervention, cerebrospinal fluid (CSF) leakage, ventricular or CSF drainage devices, postoperative intracranial complications, and the frequent need for invasive monitoring and organ support [1,2,3,4,5,6]. A recent systematic review of cranial surgery for brain tumors reported pooled surgical-site infection rates of 4.03% at 30 days and 6.17% at 90 days, with higher rates after posterior fossa procedures [1]. In a large single-center series, post-craniotomy intracranial infection occurred in 6.8% of procedures, and most cases were diagnosed within the first 2 postoperative weeks [2]. Across studies, CSF leakage, external CSF drainage, reoperation, prolonged operative time, greater preoperative vulnerability, and more urgent or complex procedures have been associated with infection risk [3,4]. Once infection occurs, the clinical consequences may include prolonged hospitalization, reoperation, neurological disability, organ dysfunction, and death [4,5,6]. In a prospective cohort of critically ill post-craniotomy patients, hospital mortality was 13.7% in patients with sepsis versus 8.3% in those without sepsis [5]. In a separate prospective neurocritical care cohort of patients with subarachnoid hemorrhage, long-term poor functional outcomes (modified Rankin Scale score 4–6) occurred in 66% of septic versus 21% of nonseptic patients, and mortality was 52.5% versus 16%, respectively [7]. These estimates vary with the underlying diagnosis, infection definition, and disease severity. These observations highlight the need for early postoperative markers that can help identify patients at increased risk of infection-related complications without assuming that all patients follow a single, uniform disease trajectory.
Stress hyperglycemia is a common metabolic response to major surgery and critical illness, driven by neuroendocrine and inflammatory pathways that increase insulin resistance and hepatic glucose production and alter peripheral glucose utilization [8]. SHR relates acute glucose to the estimated average glucose derived from glycated hemoglobin (HbA1c), thereby accounting for chronic glycemic background [9]. This distinction is relevant in mixed ICU populations with diabetes, prediabetes, and previously unrecognized dysglycemia. Acute stress hyperglycemia may promote infection and organ dysfunction by impairing neutrophil chemotaxis, phagocytosis, oxidative burst, microbial killing, and complement activity and by disrupting inflammatory signaling, endothelial function, and microvascular reactivity [10,11]. Pre-existing diabetes may add chronic immune dysfunction, advanced glycation, oxidative stress, microangiopathy, impaired tissue repair, and cerebral microvascular and blood–brain barrier injury [12,13]. The observed complications may therefore reflect both acute metabolic stress and chronic diabetes-related susceptibility. SHR cannot fully separate these contributions and may also mark surgical stress, tissue injury, or occult infection rather than act as a direct cause.
Higher SHR has been associated with adverse outcomes in acute ischemic stroke, cardiovascular disease, heterogeneous critical illness, and established sepsis [14,15,16,17,18]. Most sepsis studies have focused on mortality after sepsis is already present, whereas evidence relating relative hyperglycemia to earlier postoperative infection-related events is limited. In orthopedic trauma cohorts, stress-induced hyperglycemia has been associated with surgical-site infection [19,20], and in elective craniotomy, elevated preoperative HbA1c and severe intraoperative hyperglycemia have been associated with early postoperative infection [21]. However, these studies do not establish whether an early postoperative measure that accounts for chronic glycemia is associated with distinct infection-related outcomes in critically ill patients after cranial neurosurgery. Moreover, culture positivity, suspected infection, Sepsis-3-defined sepsis, and septic shock capture different clinical constructs. Culture results depend on specimen type, timing, prior antimicrobial exposure, contamination, and local testing practice, whereas Sepsis-3-defined sepsis and septic shock additionally reflect organ dysfunction and circulatory or metabolic abnormalities [22]. Evaluating these outcomes separately may therefore provide a more clinically informative assessment than treating postoperative infection as a single binary endpoint.
Accordingly, this study examined the associations between early postoperative SHR and four prespecified primary infection-related outcomes—suspected infection, culture-positive infection, Sepsis-3-defined sepsis, and septic shock—in critically ill patients after eligible cranial neurosurgical procedures. The secondary outcome was 90-day mortality; additional analyses assessed dose–response patterns, subgroup consistency, incremental discrimination and reclassification, temporal robustness, nested clinical subsets, and exploratory model-based indirect associations.
2. Methods
2.1. Study Design, Data Source, and Population
This retrospective study used data from the Medical Information Mart for Intensive Care IV (MIMIC-IV) database [23], which contains detailed clinical information on critically ill patients admitted to Beth Israel Deaconess Medical Center between 2008 and 2019. Access to the database was granted after completion of the National Institutes of Health “Protecting Human Research Participants” training and certification through the Collaborative Institutional Training Initiative program (Certification No. 68889220). The study was conducted in accordance with the Declaration of Helsinki and reported according to the STROBE statement.
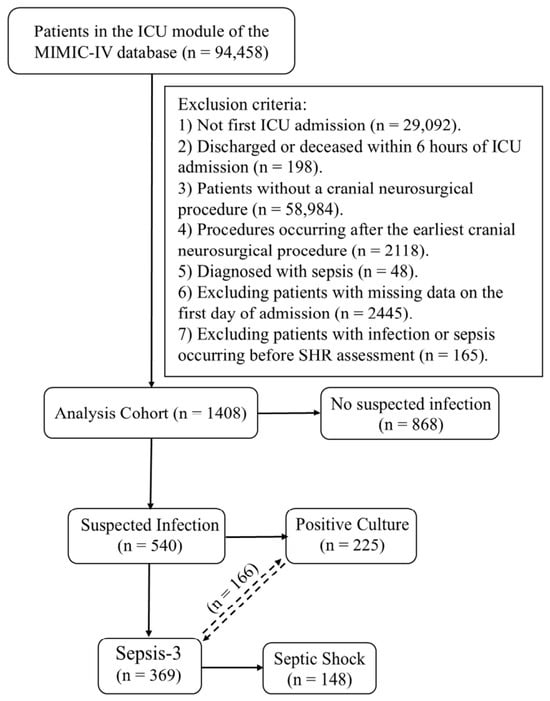
Adults aged 18 years or older with an ICU admission and a qualifying cranial neurosurgical procedure were screened. No prespecified upper age limit was applied. To construct a patient-level cohort, only each patient’s first hospital admission and first ICU stay were eligible, and only the earliest eligible procedure was retained. Procedure records were linked using subject_id, hadm_id, and stay_id. Multiple qualifying procedure codes recorded on the same date were consolidated as one operative episode, and the end of the earliest eligible operation was defined as the index time. Subsequent ICU admissions and repeated eligible procedures did not generate additional observations. Patients were excluded for an ICU stay of 6 h or less, absence of an eligible procedure, pre-existing Sepsis-3-defined sepsis, unavailable data required to calculate SHR, missing essential timing data, or infection-related outcomes occurring on or before SHR assessment. After all linkage and exclusion steps, the final cohort contained 1408 unique subject_id, hadm_id, and stay_id values, with no duplicate patient records (Figure 1).
Figure 1.
Flowchart of patient selection in the MIMIC-IV database. Solid arrows indicate cohort flow; the dashed bidirectional arrow denotes the overlap between culture-positive infection and Sepsis-3-defined sepsis (n = 166).
Eligible procedures were identified using prespecified ICD-9-CM and ICD-10-PCS codes (Supplementary Table S1). Standardized procedure descriptions were used to classify procedures into six mutually exclusive categories: cranial resection/biopsy, cerebrovascular procedure, intracranial evacuation/drainage, CSF diversion/drainage, skull-base/pituitary/cranial nerve procedure, and other cranial procedure. Because procedure descriptions do not reliably identify the underlying diagnosis or operative urgency, tumor- versus trauma-related indications and emergency versus elective surgery were not inferred. The resulting cohort therefore represents a heterogeneous postoperative neurocritical care population rather than a single diagnosis- or procedure-specific group. Procedure category was prespecified as a covariate in the multivariable analyses to account for measured differences among the broad surgical groups.
2.2. Assessment of Postoperative SHR
Postoperative glucose: The first serum glucose concentration obtained 6–24 h after the index procedure was used. A single early measurement was selected to preserve temporal ordering and reduce the influence of intraoperative fluctuations, subsequent treatment, nutritional support, and evolving complications. Because fasting status could not be verified, it was termed postoperative serum glucose rather than fasting glucose.
HbA1c selection: HbA1c measurements obtained within 90 days before surgery or during the index hospitalization before SHR assessment were eligible. When multiple values were available, the value closest to surgery was selected, prioritizing a preoperative measurement.
SHR calculation: Estimated average glucose (eAG) was calculated as eAG (mg/dL) = 28.7 × HbA1c (%) − 46.7. SHR was calculated as postoperative serum glucose (mg/dL)/eAG (mg/dL) and was dimensionless. Glucose values in mmol/L were converted to mg/dL by multiplying by 18.
Missing HbA1c: HbA1c was not imputed because it was a defining component of SHR; patients without an eligible measurement were excluded. Potential selection bias was assessed by comparing included and excluded patients and otherwise eligible patients with and without HbA1c measurements (Supplementary Tables S2 and S3).
Analytical classification: SHR was analyzed continuously and by quartiles. Glycemic status was classified as diabetes (documented diabetes or HbA1c ≥ 6.5%), prediabetes (HbA1c 5.7–6.4% without documented diabetes), or normal glucose regulation (HbA1c < 5.7% without documented diabetes).
2.3. Outcome Definitions
Suspected infection was defined by intravenous therapeutic antibiotic administration within 72 h after diagnostic culture collection or diagnostic culture collection within 24 h after antibiotic initiation. The index time was the earlier event. Routine perioperative prophylaxis was excluded. Qualifying bacterial or fungal cultures were obtained from blood, urine, respiratory tract, CSF, sterile body fluids, tissue, abscess, wound/deep tissue, or catheter tips; surveillance and other non-diagnostic tests were excluded. Culture-positive infection required growth of a potentially pathogenic organism from a qualifying specimen, and repeated cultures from the same episode were consolidated.
Suspected infection was an electronic health record (EHR)-derived indicator of clinical suspicion that prompted treatment and microbiological sampling, not a microbiologically confirmed diagnosis. Culture-positive infection remained susceptible to contamination and colonization. Because specimens came from multiple anatomical sites, both endpoints captured all-source postoperative infection-related events rather than neurosurgical surgical-site or intracranial infections. “Postoperative” denotes timing after the index procedure and does not establish surgery as the source.
Sepsis-3-defined sepsis was defined as suspected infection accompanied by an acute increase in SOFA score of at least 2 points from the admission baseline. Septic shock was defined using a strict Sepsis-3-consistent EHR proxy: Sepsis-3-defined sepsis plus vasopressor therapy, MAP < 65 mmHg, and lactate > 2 mmol/L within the same 24-h assessment window after sepsis onset. The MAP and lactate values closest to vasopressor initiation were selected. Because adequacy of fluid resuscitation could not be adjudicated, this endpoint was considered an EHR-based proxy rather than a fully clinician-adjudicated diagnosis. The secondary outcome was all-cause mortality within 90 days after the index procedure.
2.4. Covariates
Covariates were selected a priori according to clinical relevance and data availability, emphasizing baseline confounders and excluding post-exposure variables, potential mediators, and outcome components. Model 1 was adjusted for age, sex, race, and heart rate. Model 2 was additionally adjusted for chronic kidney disease, hypertension, atrial fibrillation, diabetes mellitus, congestive heart failure, hyperlipidemia, anemia, and procedure category. Model 3 was further adjusted for red blood cell count, platelet count, hemoglobin, hematocrit, bicarbonate, blood urea nitrogen, calcium, chloride, creatinine, sodium, potassium, international normalized ratio, prothrombin time, partial thromboplastin time, GCS, and the Charlson Comorbidity Index. Diabetes was included because it may confound associations between SHR and infection-related outcomes. The GCS variable was treated as an available ICU-recorded measure of neurological status rather than as a uniformly defined preoperative assessment.
For all other retained covariates, pre-imputation missingness was below 20%; variables with missingness of 20% or more were excluded from multivariable modeling. Missing values in retained covariates were imputed with missForest, leaving no missing modeled values [24]. No propensity score matching, inverse probability weighting, or other covariate-balancing procedure was applied. Table 1 presents unmatched and unweighted descriptive data from the completed analytic dataset after missForest imputation.
Table 1.
Baseline characteristics and clinical outcomes according to SHR quartile.
2.5. Statistical Analysis
Continuous variables are reported as the mean ± standard deviation or median (interquartile range), and categorical variables are reported as the number (or percentage). Groups were compared using analysis of variance or Kruskal–Wallis tests and chi-square or Fisher exact tests, as appropriate.
Multivariable logistic regression estimated odds ratios (ORs) and 95% confidence intervals (CIs) for SHR were modeled continuously and by quartiles. Restricted cubic splines with four knots at the 5th, 35th, 65th, and 95th percentiles were assessed nonlinearity; the median SHR was the reference. Overall and nonlinear associations were evaluated using Wald tests. Prespecified subgroup analyses used the primary adjustment set, excluding the stratification variable. Interaction p-values were obtained from multiplicative terms between continuous SHR and subgroup variables and were considered exploratory.
Boruta analyses were performed separately for each infection-related outcome using the Boruta package and normalized random-forest importance (getImpRfZ). Each forest contained 500 trees; maxRuns was 500; the p-value was 0.01 with Bonferroni correction; a fixed seed was used; and unresolved variables remained tentative. Correlated predictors were retained because Boruta seeks all relevant features; therefore, importance among correlated variables was interpreted as shared or redundant relevance rather than independent contribution. Boruta was used only for exploratory ranking and did not determine covariate selection.
Incremental performance was assessed by adding SHR to the clinical model and comparing AUCs using the DeLong test; category-free NRI and IDI were estimated with bootstrap CIs. Exploratory nested analyses evaluated associations across progressively severe clinical states. A 24-h lag sensitivity analysis excluded patients who developed the corresponding outcome within 24 h after SHR assessment and counted only later incident events.
Exploratory mediation analyses evaluated Sepsis-3-defined sepsis and septic shock as potential indirect pathways between standardized SHR and 90-day mortality within a regression-based counterfactual framework. Only mediator events occurring after SHR assessment and before death were included. ACME, ADE, total effect, and estimated indirect proportion were reported on the absolute probability scale with 95% CIs from 5000 nonparametric bias-corrected and accelerated bootstrap resamples. Because the assumptions required for causal mediation cannot be verified in this observational cohort, these results were interpreted as model-based indirect associations rather than causal effects.
All analyses were performed in R version 4.3.1 (R Foundation for Statistical Computing, Vienna, Austria). Tests were two-sided, with p < 0.05 considered statistically significant. Exploratory analyses were interpreted primarily using effect estimates and 95% CIs.
3. Results
3.1. Study Population and Baseline Characteristics
Among 94,458 patients screened in the intensive care unit module, 1408 met the eligibility criteria and were included in the final analysis (Figure 1). The mean age was 62.56 ± 15.71 years (range, 18.0–98.0 years), 687 patients (48.79%) were female, and 377 (26.78%) had pre-existing diabetes mellitus. Among patients with pre-existing diabetes mellitus, the median HbA1c was 7.09% (IQR, 6.30–8.30%); 174 (46.15%) had an HbA1c < 7.0%, 85 (22.55%) had an HbA1c of 7.0% to <8.0%, and 118 (31.30%) had an HbA1c ≥ 8.0%. Across increasing SHR quartiles, patients had higher heart rate, a greater prevalence of diabetes, congestive heart failure, and anemia, higher white blood cell count, lactate, potassium, and postoperative glucose concentrations, and lower lymphocyte percentages. Higher SHR was also accompanied by greater illness severity, as reflected by higher SOFA, SAPS II, OASIS, and Charlson Comorbidity Index values, together with more frequent mechanical ventilation and longer hospital and ICU stays. Procedure categories differed significantly across SHR quartiles (Table 1).
Overall, 540 patients (38.35%) met the suspected-infection definition, 225 (15.98%) had culture-positive infection, 369 (26.21%) met the Sepsis-3 definition, and 148 (10.51%) met the strict EHR-based septic shock proxy. The incidence of each infection-related outcome increased across SHR quartiles: suspected infection increased from 31.07% in Q1 to 54.26% in Q4, culture-positive infection increased from 10.73% to 25.28%, Sepsis-3-defined sepsis increased from 16.95% to 42.61%, and septic shock increased from 4.52% to 19.89% (all p < 0.001). Mortality also increased across quartiles; 90-day mortality was 3.11% in Q1 and 12.50% in Q4 (p < 0.001) (Table 1). Patients who met the Sepsis-3 criteria had greater physiological derangement, longer ICU and hospital stays, and higher 90-day mortality than those who did not meet these criteria (14.63% vs. 3.08%; Supplementary Table S4).
Culture positivity and Sepsis-3-defined sepsis overlapped but were not identical. Among the 369 patients meeting the Sepsis-3 criteria, 166 (45.0%) had a qualifying positive culture, whereas 203 (55.0%) did not. Conversely, 59 of the 225 culture-positive patients (26.2%) did not meet the Sepsis-3 criteria. Thus, the culture-positive infection and Sepsis-3-defined sepsis counts represent non-mutually exclusive features within the 540-patient suspected-infection cohort.
Comparisons undertaken to assess potential selection bias showed that patients included in the final cohort were older and had a higher prevalence of several cardiometabolic comorbidities than excluded patients, whereas 90-day mortality was similar (6.11% vs. 6.07%, p = 1.000; Supplementary Table S2). Likewise, otherwise eligible patients with an available HbA1c measurement were older and more frequently had diabetes, hypertension, and hyperlipidemia than those without HbA1c, but 90-day mortality did not differ significantly (6.11% vs. 7.29%, p = 0.280; Supplementary Table S3). The mean interval from the end of the index procedure to SHR assessment was 12.68 h. Among patients with suspected infection, the median interval from SHR assessment to the suspected-infection index time was 17.0 h. Among patients meeting the Sepsis-3-defined sepsis criteria, the corresponding interval was 30.4 h.
3.2. Associations Between SHR and Infection-Related Outcomes
Higher postoperative SHR was associated with all four infection-related outcomes in multivariable logistic regression analyses. In Model 3, each 0.1-unit increase in SHR was associated with higher odds of suspected infection (OR, 1.08; 95% CI, 1.04–1.12; p < 0.001), culture-positive infection (OR, 1.05; 95% CI, 1.01–1.09; p = 0.010), Sepsis-3-defined sepsis (OR, 1.07; 95% CI, 1.03–1.11; p < 0.001), and septic shock (OR, 1.10; 95% CI, 1.05–1.15; p < 0.001) (Table 2).
Table 2.
Associations of SHR with infection-related outcomes.
The quartile analyses showed a graded increase in risk. Compared with Q1, Q4 was associated with higher odds of suspected infection (OR, 1.98; 95% CI, 1.41–2.78), culture-positive infection (OR, 1.87; 95% CI, 1.20–2.91), Sepsis-3-defined sepsis (OR, 2.89; 95% CI, 1.98–4.23), and septic shock (OR, 2.90; 95% CI, 1.56–5.40). Higher odds of Sepsis-3-defined sepsis were also observed in Q3 (OR, 1.54; 95% CI, 1.03–2.29), whereas the odds of septic shock were elevated from Q2 onward (Q2: OR, 2.02; 95% CI, 1.03–3.96; Q3: OR, 2.19; 95% CI, 1.14–4.21).
3.3. Feature Importance and Dose–Response Relationship
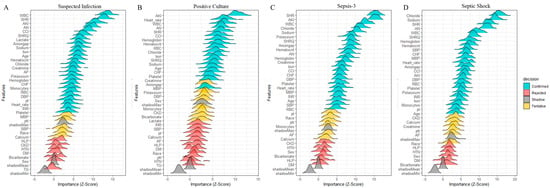
In the exploratory Boruta analysis, SHR was classified as a confirmed relevant feature for each infection-related outcome and ranked among the more influential features for Sepsis-3-defined sepsis and septic shock. Because Boruta is an all-relevant feature-selection method and correlated predictors may share importance, these findings were interpreted as model-based feature relevance rather than as independent effect estimates or evidence of causal importance (Figure 2).
Figure 2.
Boruta-based feature importance ridge plot for infection-related outcomes in patients after cranial neurosurgical procedures: (A) suspected infection; (B) culture-positive infection; (C) Sepsis-3-defined sepsis; and (D) septic shock.
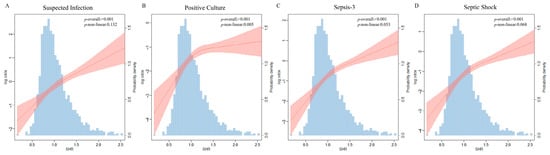
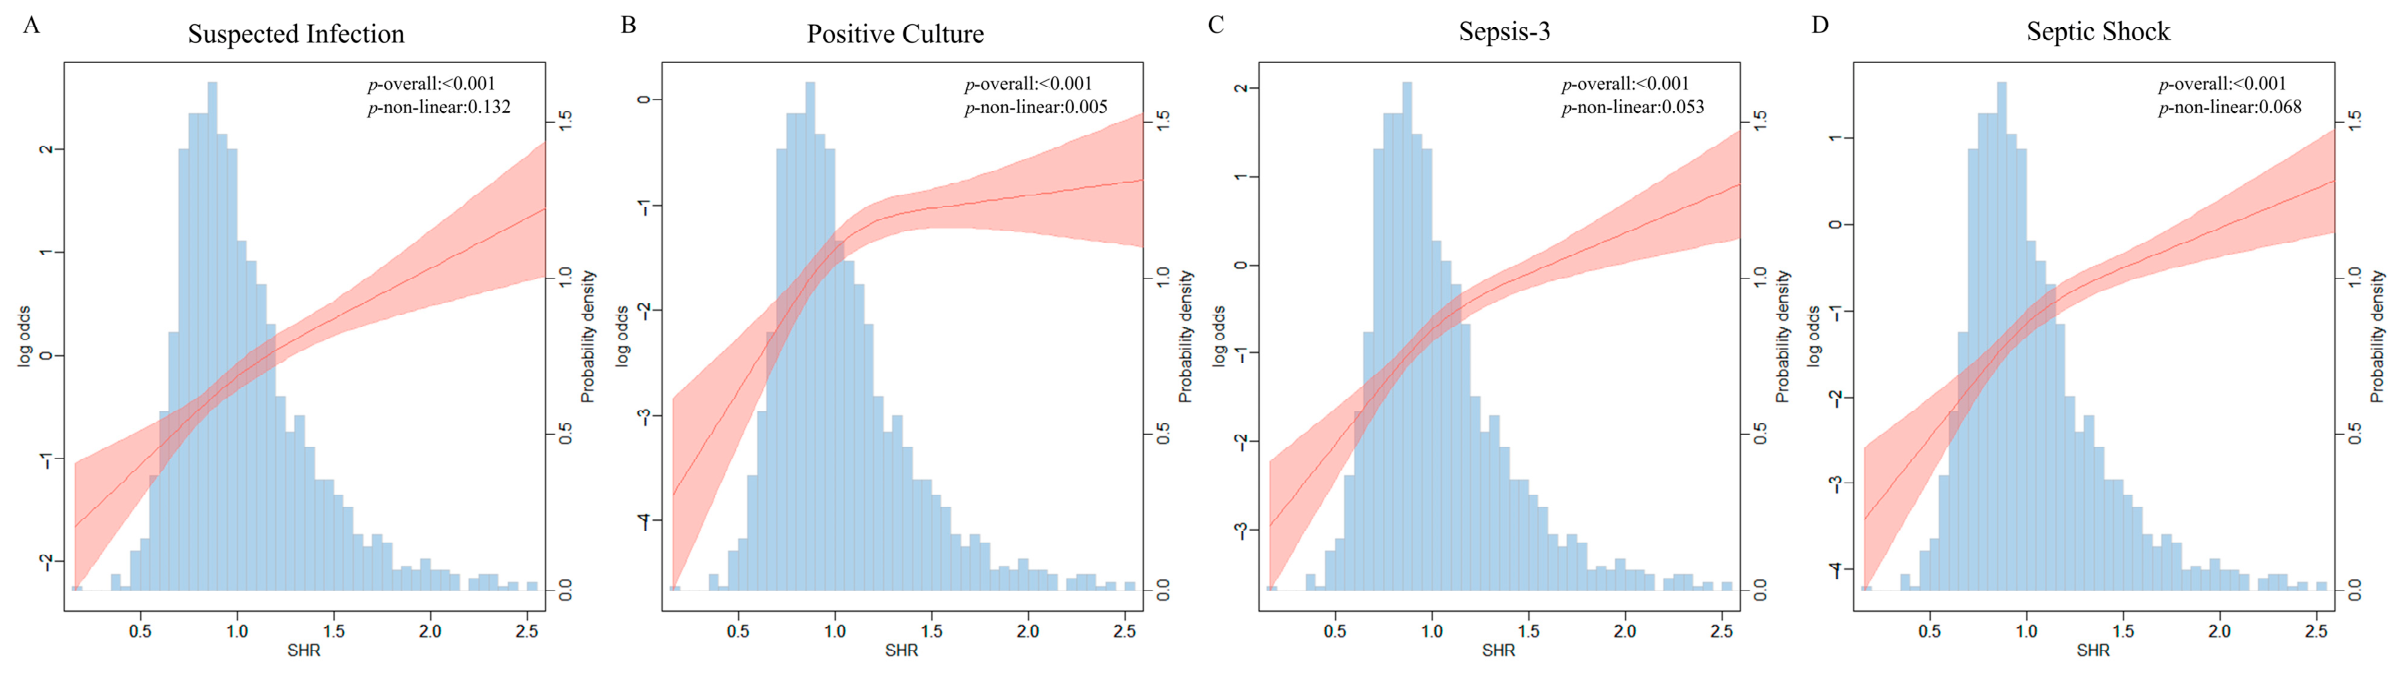
Restricted cubic spline analyses demonstrated significant overall associations between SHR and suspected infection, culture-positive infection, Sepsis-3-defined sepsis, and septic shock (all p-values for overall association were <0.001). The association with suspected infection was approximately linear (p-value for nonlinearity = 0.132). A significant nonlinear relationship was observed for culture-positive infection (p-value for nonlinearity = 0.005), characterized by a steeper increase at lower-to-moderate SHR values and a flatter slope at higher values. The associations with Sepsis-3-defined sepsis and septic shock were predominantly monotonic, with p-values for nonlinearity of 0.053 and 0.068, respectively (Figure 3).
Figure 3.
Dose–response relationships between SHR and infection-related outcomes in patients after cranial neurosurgical procedures ((A) Suspected Infection; (B) Positive Culture; (C) Sepsis-3; (D) Septic Shock). Restricted cubic spline models were fitted using four knots placed at the 5th, 35th, 65th, and 95th percentiles of the SHR distribution. Models were adjusted for age, sex, race, weight, HR, DM, CCI, GCS, and procedure category. SHR, stress hyperglycemia ratio; HR, heart rate; DM, diabetes mellitus; CCI, Charlson Comorbidity Index; GCS, Glasgow Coma Scale.
3.4. Subgroup and Stratified Analyses
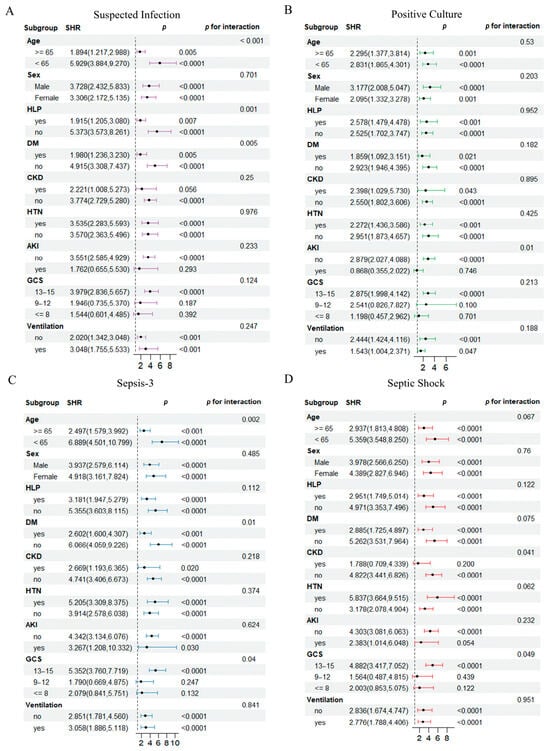
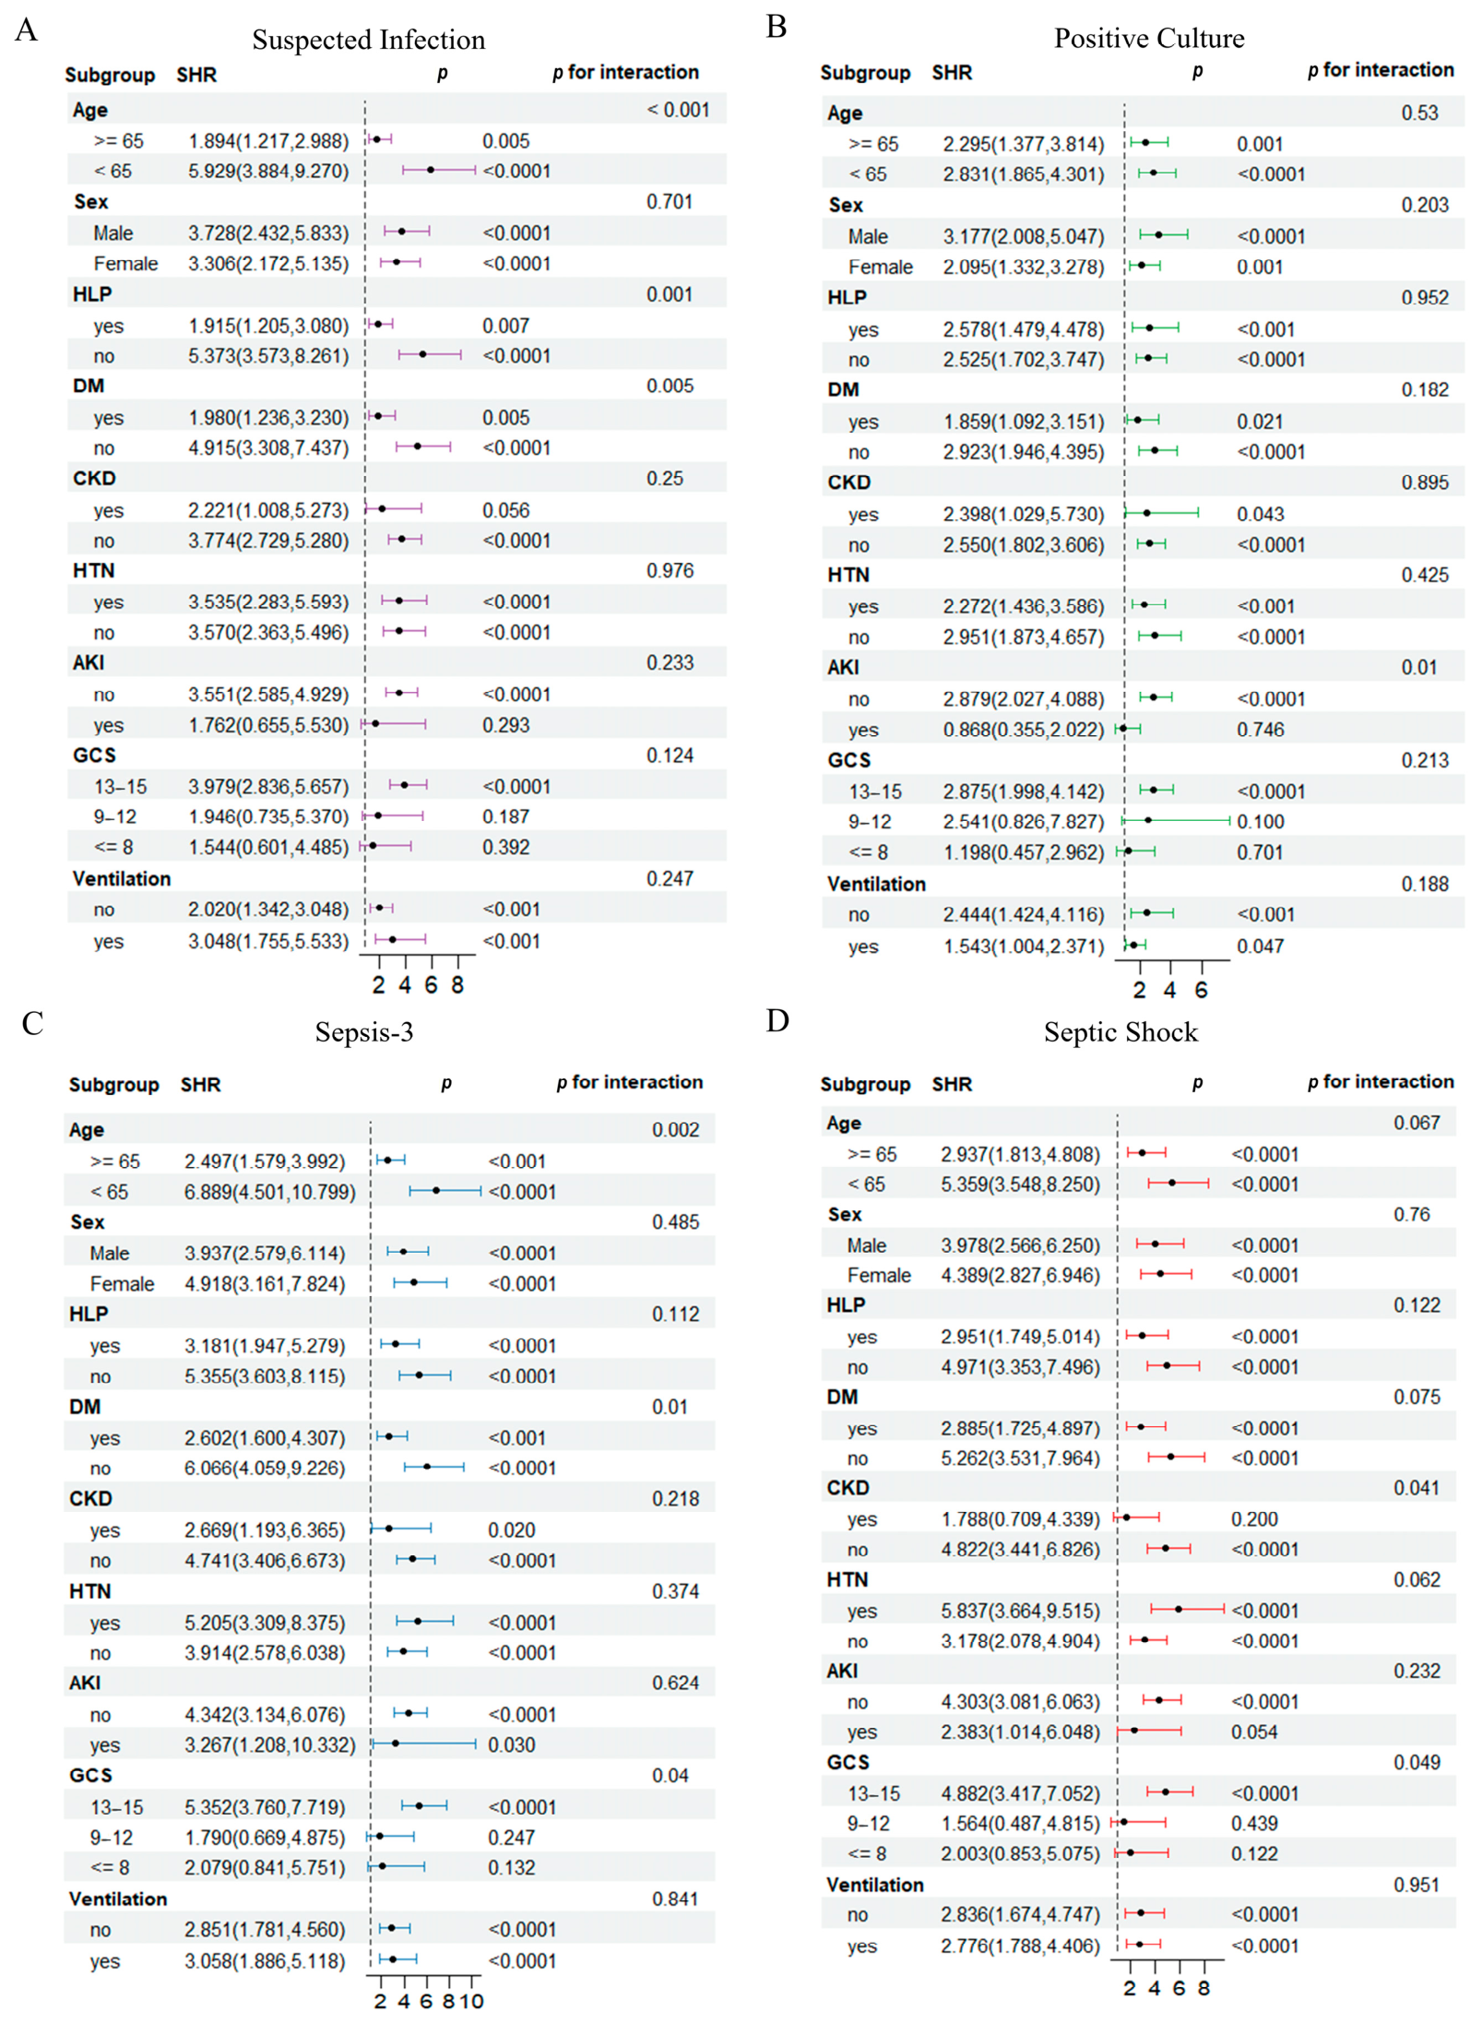
The direction of association between SHR and infection-related outcomes was generally positive across clinically relevant subgroups, although several interaction tests indicated heterogeneity (Figure 4). For suspected infection, significant interactions were observed for age (p for interaction < 0.001), hyperlipidemia (p = 0.001), and diabetes mellitus (p = 0.005). For culture-positive infection, an interaction was observed for acute kidney injury (p = 0.010). The association with Sepsis-3-defined sepsis varied by age (p = 0.002), diabetes mellitus (p = 0.010), and Glasgow Coma Scale category (p = 0.040). For septic shock, significant interactions were observed for chronic kidney disease (p = 0.041) and Glasgow Coma Scale category (p = 0.049). Because multiple subgroup comparisons were performed, these findings were considered exploratory.
Figure 4.
Subgroup analyses of the associations between SHR and infection-related outcomes in patients after cranial neurosurgical procedures: (A) suspected infection; (B) culture-positive infection; (C) Sepsis-3-defined sepsis; and (D) septic shock. Each panel presents adjusted odds ratios and 95% confidence intervals across clinically relevant subgroups. Models were adjusted for age, sex, race, weight, HR, DM, CCI, GCS, and procedure category, excluding the corresponding stratification variable from each subgroup-specific model. SHR, stress hyperglycemia ratio; HR, heart rate; DM, diabetes mellitus; CCI, Charlson Comorbidity Index; GCS, Glasgow Coma Scale.
In analyses stratified by glycemic status, higher SHR remained associated with several infection-related outcomes across normal glucose regulation, prediabetes, and diabetes (Supplementary Figures S1 and S2, and Table S7). In the normal-glucose-regulation subgroup, Q4 was associated with all four outcomes. In the prediabetes subgroup, Q4 was associated with suspected infection, Sepsis-3-defined sepsis, and septic shock, whereas the association with culture-positive infection was not statistically significant. In the diabetes subgroup, Q4 was associated with all four outcomes, including culture-positive infection (OR, 2.84; 95% CI, 1.41–5.74) and septic shock (OR, 2.96; 95% CI, 1.49–5.88).
3.5. Incremental Discrimination and Reclassification Analyses
Adding SHR to the clinical model produced small increases in discrimination that did not reach statistical significance for suspected infection (AUC, 0.774 to 0.776; p = 0.337), culture-positive infection (0.777 to 0.778; p = 0.401), Sepsis-3-defined sepsis (0.810 to 0.814; p = 0.067), or septic shock (0.796 to 0.804; p = 0.077). For suspected infection, the IDI was 0.004 (95% CI, 0.001–0.007; p = 0.014), whereas the NRI was not statistically significant. No significant improvement in NRI or IDI was observed for culture-positive infection. In contrast, addition of SHR improved both NRI and IDI for Sepsis-3-defined sepsis (NRI, 0.172; 95% CI, 0.056–0.290; p = 0.004; IDI, 0.007; 95% CI, 0.002–0.012; p = 0.002) and septic shock (NRI, 0.206; 95% CI, 0.043–0.372; p = 0.015; IDI, 0.010; 95% CI, 0.002–0.019; p = 0.018) (Table 3). These incremental discrimination and reclassification analyses were considered exploratory.
Table 3.
Incremental discrimination and reclassification after adding SHR to the clinical model.
3.6. Associations Within Nested Clinical Subsets
In analyses of nested clinical subsets, higher SHR was associated with suspected infection in the overall cohort (Model 3 OR, 1.32; 95% CI, 1.16–1.49; p < 0.001). Among patients with suspected infection, SHR was not associated with culture-positive infection (OR, 1.00; 95% CI, 0.84–1.17; p = 0.958), but remained associated with Sepsis-3-defined sepsis (OR, 1.31; 95% CI, 1.07–1.62; p = 0.012). Among patients with Sepsis-3-defined sepsis, higher SHR was associated with septic shock (OR, 1.36; 95% CI, 1.11–1.68; p = 0.004). Higher SHR was also associated with 90-day mortality in the overall cohort (OR, 1.59; 95% CI, 1.29–1.96; p < 0.001), among patients with Sepsis-3-defined sepsis (OR, 1.41; 95% CI, 1.06–1.86; p = 0.016), and among those with septic shock (OR, 1.63; 95% CI, 1.04–2.66; p = 0.039) (Table 4). These analyses describe associations within progressively restricted clinical subsets and do not establish a causal sequence of disease progression.
Table 4.
Associations of SHR with infection-related outcomes and 90-day mortality in nested clinical subsets.
3.7. Sensitivity and Exploratory Mediation Analyses
The associations remained directionally consistent in the 24-h lag analysis. After excluding patients who developed the corresponding outcome within 24 h after SHR assessment, each 0.1-unit increase in SHR remained associated with suspected infection (OR, 1.08; 95% CI, 1.04–1.12), culture-positive infection (OR, 1.05; 95% CI, 1.01–1.10), Sepsis-3-defined sepsis (OR, 1.10; 95% CI, 1.06–1.15), and septic shock (OR, 1.13; 95% CI, 1.07–1.19) in Model 3. Similarly, Q4 versus Q1 remained associated with suspected infection (OR, 1.90; 95% CI, 1.33–2.71), culture-positive infection (OR, 2.20; 95% CI, 1.37–3.53), Sepsis-3-defined sepsis (OR, 1.92; 95% CI, 1.23–3.00), and septic shock (OR, 3.91; 95% CI, 1.86–8.25) (Supplementary Table S5).
In exploratory mediation models, the estimated average indirect association through subsequent Sepsis-3-defined sepsis was 0.0070 (95% CI, 0.0029–0.0138), corresponding to an estimated indirect proportion of 19.7% (95% CI, 8.6–37.8%). The estimated average indirect association through septic shock was 0.0054 (95% CI, 0.0010–0.0094), with an estimated indirect proportion of 14.8% (95% CI, 2.9–28.0%) (Supplementary Table S6). These estimates were interpreted as model-based indirect associations rather than evidence of causal mediation.
4. Discussion
In this cohort of 1408 critically ill patients after cranial neurosurgical procedures, higher early postoperative SHR was associated with all four infection-related outcomes and 90-day mortality. Associations were strongest for Sepsis-3-defined sepsis and septic shock, weaker for culture-positive infection, and directionally consistent in the 24-h lag analysis. Adding SHR minimally changed AUC, although reclassification improved for Sepsis-3-defined sepsis and septic shock. SHR may therefore provide complementary risk information, but these associations do not establish that it predicts neurosurgical infection.
The present findings are consistent with the growing literature linking relative hyperglycemia to adverse outcomes in acute and critical illness [25,26]. SHR contextualizes acute glucose against the patient’s chronic glycemic background and may therefore distinguish an acute metabolic stress response from chronically elevated glucose more effectively than an isolated glucose value [8]. This distinction is particularly relevant in mixed ICU populations that include patients with diabetes, prediabetes, and previously unrecognized dysglycemia. Prior neurosurgical studies have linked perioperative hyperglycemia or elevated HbA1c to postoperative infection after craniotomy, while studies in spine and cardiac surgery have similarly associated postoperative hyperglycemia with surgical-site infection and other adverse outcomes [27,28,29,30,31,32,33,34,35]. Our results extend this literature by evaluating relative rather than absolute hyperglycemia and by examining several clinically distinct infection-related outcomes within the same neurocritical care cohort.
Differences in effect size across outcomes warrant caution. Culture positivity depends on specimen type, sampling intensity, timing relative to antimicrobial exposure, contamination, colonization, and local practice [36,37]. Sepsis-3-defined sepsis incorporates acute organ dysfunction, while the septic shock proxy also captures circulatory and metabolic abnormalities [22]. Stronger associations with these outcomes may reflect overall host response rather than microbiological confirmation. The short median intervals from SHR assessment to suspected infection (17.0 h) and Sepsis-3-defined sepsis (30.4 h) raise the possibility that occult infection or an evolving inflammatory response was already present when SHR was measured [10,11]. Because recorded onset represented the first fulfillment of the EHR criteria rather than biological onset, elevated SHR may partly reflect an ongoing inflammatory process. Although the 24-h lag analysis reduced temporal overlap, it could not exclude residual reverse causation or establish the temporal direction of the observed associations.
Suspected infection indicates clinical suspicion rather than confirmed infection. Culture positivity provides microbiological evidence but cannot distinguish infection from colonization or contamination. Because specimens were collected from multiple anatomical sites, neither endpoint specifically represents neurosurgical surgical-site or intracranial infection. The findings therefore concern all-source infection-related events in the postoperative neurocritical care setting.
Among patients meeting the Sepsis-3 criteria, 203 of 369 (55.0%) did not have a qualifying positive culture. Potential explanations include antimicrobial exposure before specimen collection; limitations in the timing, anatomical site, and sensitivity of microbiological sampling; low organism burden; or difficult-to-culture pathogens. In addition, the EHR-based definition may classify patients with suspected infection and acute organ dysfunction caused partly or wholly by noninfectious conditions. Because the retrospective data did not permit case-level adjudication of these possibilities, these cases should be interpreted as Sepsis-3-defined events without microbiological confirmation rather than as definitively proven culture-negative infections.
Associations were observed across normal glucose regulation, prediabetes, and diabetes, but subgroup findings remain exploratory because of multiple comparisons and limited event counts. The prognostic meaning of acute hyperglycemia may vary with chronic glycemic status [34,38], but these findings do not define subgroup-specific treatment thresholds or justify different glycemic targets. SHR is not a diagnostic test and should not independently trigger antimicrobial or insulin therapy. The modest AUC changes suggest that it cannot replace clinical assessment, although it may prompt closer review of glucose trends, infection-related findings, organ function, and hemodynamic status. Observational neurosurgical studies suggest benefits from structured perioperative glucose management [28], whereas critical-care trials show that intensive glucose lowering can cause hypoglycemia and worsen outcomes [39,40,41,42,43]. Prospective studies must determine whether SHR-guided surveillance or treatment improves outcomes.
The exploratory mediation analyses should also be interpreted with restraint. The observed indirect associations through subsequent Sepsis-3-defined sepsis and septic shock are compatible with, but do not prove, a pathway linking postoperative metabolic stress to mortality. Causal mediation requires no unmeasured confounding of the exposure–mediator, mediator–outcome, and exposure–outcome relationships, correct temporal ordering, and correct model specification. These assumptions are unlikely to be fully satisfied in a retrospective ICU cohort in which metabolic, infectious, and organ-dysfunction processes evolve simultaneously. The mediation results should therefore be regarded as descriptive, model-dependent, and hypothesis-generating.
Several limitations should be acknowledged. First, SHR required clinically available HbA1c, and testing was unlikely to be random. Patients with HbA1c were older and more often had diabetes, hypertension, and hyperlipidemia than eligible patients without HbA1c. Similar 90-day mortality did not eliminate selection bias; generalizability may therefore be limited to patients with available HbA1c. Second, EHR outcome times reflected first criterion fulfillment rather than biological onset, so the 24-h lag analysis could not exclude residual reverse causation. Third, suspected infection was an EHR-derived surrogate, while culture-positive infection remained sensitive to sampling, prior antibiotics, contamination, colonization, and culture-negative disease [36,37]. The septic shock proxy could not confirm adequate fluid resuscitation, and vasopressors in neurocritical care may support cerebral perfusion rather than treat distributive shock [44].
Fourth, unavailable perioperative factors—including corticosteroids, insulin treatment, nutritional glucose load, surgical urgency and indication, operative duration, transfusion, CSF leakage, and drain duration—may have caused residual confounding. Accordingly, adjusted associations should not be interpreted as independent causal effects. HbA1c may also be distorted by anemia, blood loss, transfusion, renal dysfunction, or altered erythrocyte turnover [45]. Finally, practice changed during 2008–2019, and exploratory analyses were susceptible to multiplicity and model dependence. Because the cohort included six broad procedure categories and MIMIC-IV uses patient-specific shifted dates, cohort size should not be interpreted as the annual volume of conventional craniotomy [23]. Local referral, coding, and ICU admission practices may limit generalizability. Residual confounding across procedure categories also remains possible, so estimates should be interpreted at the cohort level.
5. Conclusions
Higher early postoperative SHR was associated with EHR-derived, all-source infection-related and sepsis-related events and 90-day mortality after cranial neurosurgical procedures. These associations do not establish prediction of neurosurgical infection; prospective external validation is required before SHR informs surveillance or glycemic intervention.
Supplementary Materials
The following supporting information can be downloaded at https://www.mdpi.com/article/10.3390/jcm15197505/s1. Table S1: ICD-9-CM and ICD-10-PCS procedure codes used to identify eligible cranial neurosurgical procedures; Table S2: Baseline characteristics and clinical outcomes of patients included in versus excluded from the final analytic cohort; Table S3: Baseline characteristics and clinical outcomes of otherwise eligible patients with versus without available HbA1c measurements; Table S4: Baseline characteristics and clinical outcomes according to Sepsis-3 status; Table S5: Associations between SHR and infection-related outcomes in the 24-h lagged sensitivity analysis; Table S6: Exploratory model-based indirect associations between postoperative SHR and 90-day mortality; Figure S1: Dose–response relationships between SHR and infection-related outcomes stratified by glycemic status; Table S7: Associations between SHR and infection-related outcomes stratified by glycemic status; Figure S2: Associations between SHR quartiles and infection-related outcomes across glycemic-status groups.
Author Contributions
Conceptualization, D.T.; methodology, T.H.; formal analysis, D.T.; investigation, T.H.; data curation, D.T.; writing—original draft preparation, D.T.; writing—review and editing, T.H.; visualization, D.T. All authors have read and agreed to the published version of the manuscript.
Funding
The authors declare that no financial support was received for the research, authorship, and/or publication of this article. This investigator-initiated study was not conducted as part of a separately registered official scientific program or institutional research plan.
Institutional Review Board Statement
This study was a retrospective secondary analysis of fully deidentified data from the MIMIC-IV database. The collection of patient information and creation of the MIMIC research resource were approved by the Institutional Review Boards of the Massachusetts Institute of Technology (Protocol No. 0403000206) and Beth Israel Deaconess Medical Center (Protocol No. 2001-P-001699/14), with a waiver of individual informed consent. Under the institutional policy of Xiangya Hospital, Central South University, secondary analyses of fully deidentified existing data do not require additional local ethics committee review. Therefore, no study-specific local approval date or protocol number was applicable.
Informed Consent Statement
The requirement for individual informed consent was waived for the MIMIC research resource because all protected health information was deidentified. The present study involved no direct contact with participants and no collection of new patient data.
Data Availability Statement
The data analyzed in this study are publicly available in the MIMIC-IV database (version 2.2) at https://physionet.org/content/mimiciv/2.2/ (accessed on 11 August 2026) after completion of the required credentialing and data use agreement.
Acknowledgments
The authors thank the investigators, data contributors, and patients whose deidentified records constitute the MIMIC-IV database.
Conflicts of Interest
The authors declare no conflicts of interest.
References
- Lee, K.S.; Borbas, B.; Plaha, P.; Ashkan, K.; Jenkinson, M.D.; Price, S.J. Incidence and Risk Factors of Surgical Site Infection After Cranial Surgery for Patients with Brain Tumors: A Systematic Review and Meta-Analysis. World Neurosurg. 2024, 185, e800–e819. [Google Scholar] [CrossRef] [Scilit]
- Shi, Z.H.; Xu, M.; Wang, Y.Z.; Luo, X.Y.; Chen, G.Q.; Wang, X.; Wang, T.; Tang, M.Z.; Zhou, J.X. Post-craniotomy intracranial infection in patients with brain tumors: A retrospective analysis of 5723 consecutive patients. Br. J. Neurosurg. 2017, 31, 5–9. [Google Scholar] [CrossRef] [Scilit]
- Fang, C.; Zhu, T.; Zhang, P.; Xia, L.; Sun, C. Risk factors of neurosurgical site infection after craniotomy: A systematic review and meta-analysis. Am. J. Infect. Control 2017, 45, e123–e134. [Google Scholar] [CrossRef] [Scilit]
- Chiang, H.Y.; Kamath, A.S.; Pottinger, J.M.; Greenlee, J.D.; Howard, M.A.; Cavanaugh, J.E.; Herwaldt, L.A. Risk factors and outcomes associated with surgical site infections after craniotomy or craniectomy. J. Neurosurg. 2014, 120, 509–521. [Google Scholar] [CrossRef] [Scilit]
- Zhou, J.; Luo, X.Y.; Chen, G.Q.; Li, H.L.; Xu, M.; Liu, S.; Yang, Y.L.; Shi, G.; Zhou, J.X.; Zhang, L. Incidence, Risk Factors and Outcomes of Sepsis in Critically Ill Post-craniotomy Patients: A Single-Center Prospective Cohort Study. Front. Public Health 2022, 10, 895991. [Google Scholar] [CrossRef] [Scilit]
- Pertsch, N.J.; Tang, O.Y.; Seicean, A.; Toms, S.A.; Weil, R.J. Sepsis after elective neurosurgery: Incidence, outcomes, and predictive factors. J. Clin. Neurosci. 2020, 78, 53–59. [Google Scholar] [CrossRef] [Scilit]
- Goncalves, B.; Kurtz, P.; Turon, R.; Santos, T.; Prazeres, M.; Righy, C.; Bozza, F.A. Incidence and impact of sepsis on long-term outcomes after subarachnoid hemorrhage: A prospective observational study. Ann. Intensive Care 2019, 9, 94. [Google Scholar] [CrossRef] [Scilit]
- Dungan, K.M.; Braithwaite, S.S.; Preiser, J.C. Stress hyperglycaemia. Lancet 2009, 373, 1798–1807. [Google Scholar] [CrossRef] [Scilit]
- Roberts, G.W.; Quinn, S.J.; Valentine, N.; Alhawassi, T.; O’Dea, H.; Stranks, S.N.; Burt, M.G.; Doogue, M.P. Relative Hyperglycemia, a Marker of Critical Illness: Introducing the Stress Hyperglycemia Ratio. J. Clin. Endocrinol. Metab. 2015, 100, 4490–4497. [Google Scholar] [CrossRef] [Scilit]
- Turina, M.; Fry, D.E.; Polk, H.C., Jr. Acute hyperglycemia and the innate immune system: Clinical, cellular, and molecular aspects. Crit. Care Med. 2005, 33, 1624–1633. [Google Scholar] [CrossRef] [Scilit]
- Jafar, N.; Edriss, H.; Nugent, K. The Effect of Short-Term Hyperglycemia on the Innate Immune System. Am. J. Med. Sci. 2016, 351, 201–211. [Google Scholar] [CrossRef] [Scilit]
- Holt, R.I.G.; Cockram, C.S.; Ma, R.C.W.; Luk, A.O.Y. Diabetes and infection: Review of the epidemiology, mechanisms and principles of treatment. Diabetologia 2024, 67, 1168–1180. [Google Scholar] [CrossRef] [Scilit]
- van Sloten, T.T.; Sedaghat, S.; Carnethon, M.R.; Launer, L.J.; Stehouwer, C.D.A. Cerebral microvascular complications of type 2 diabetes: Stroke, cognitive dysfunction, and depression. Lancet Diabetes Endocrinol. 2020, 8, 325–336. [Google Scholar] [CrossRef] [Scilit] [PubMed]
- Zhang, Y.; Yin, X.; Liu, T.; Ji, W.; Wang, G. Association between the stress hyperglycemia ratio and mortality in patients with acute ischemic stroke. Sci. Rep. 2024, 14, 20962. [Google Scholar] [CrossRef] [Scilit]
- Esdaile, H.; Khan, S.; Mayet, J.; Oliver, N.; Reddy, M.; Shah, A.S.V. The association between the stress hyperglycaemia ratio and mortality in cardiovascular disease: A meta-analysis and systematic review. Cardiovasc. Diabetol. 2024, 23, 412. [Google Scholar] [CrossRef] [Scilit]
- Yan, F.; Chen, X.; Quan, X.; Wang, L.; Wei, X.; Zhu, J. Association between the stress hyperglycemia ratio and 28-day all-cause mortality in critically ill patients with sepsis: A retrospective cohort study and predictive model establishment based on machine learning. Cardiovasc. Diabetol. 2024, 23, 163. [Google Scholar] [CrossRef] [Scilit]
- Chen, L.; Zeng, X.; Zou, W.; Chen, M.; Fan, Y.; Huang, P. Predictive performance of stress hyperglycemia ratio for poor prognosis in critically ill patients: A systematic review and dose-response meta-analysis. Eur. J. Med. Res. 2025, 30, 613. [Google Scholar] [CrossRef] [Scilit]
- Xie, H.; Hao, T.; Qi, R.; Zhang, L.; An, Y.; Jia, D.; Wang, H.; Niu, W.; Han, X.; Sha, Y.; et al. Association between stress hyperglycemia ratio and all-cause mortality among ICU patients with sepsis: A systematic review and meta-analysis. Front. Med. 2025, 12, 1741993. [Google Scholar] [CrossRef] [Scilit]
- Richards, J.E.; Kauffmann, R.M.; Obremskey, W.T.; May, A.K. Stress-induced hyperglycemia as a risk factor for surgical-site infection in nondiabetic orthopedic trauma patients admitted to the intensive care unit. J. Orthop. trauma. 2013, 27, 16–21. [Google Scholar] [CrossRef] [Scilit]
- Richards, J.E.; Hutchinson, J.; Mukherjee, K.; Jahangir, A.A.; Mir, H.R.; Evans, J.M.; Perdue, A.M.; Obremskey, W.T.; Sethi, M.K.; May, A.K. Stress hyperglycemia and surgical site infection in stable nondiabetic adults with orthopedic injuries. J. Trauma Acute Care Surg. 2014, 76, 1070–1075. [Google Scholar] [CrossRef] [Scilit]
- Kulikov, A.; Krovko, Y.; Zagidullin, T.; Ershova, O.; Bilotta, F. Association of Preoperative Glycated Hemoglobin and Early Postoperative Infections After Elective Craniotomy: A Retrospective Cohort Study. World Neurosurg. 2023, 175, e505–e510. [Google Scholar] [CrossRef] [Scilit]
- Singer, M.; Deutschman, C.S.; Seymour, C.W.; Shankar-Hari, M.; Annane, D.; Bauer, M.; Bellomo, R.; Bernard, G.R.; Chiche, J.-D.; Coopersmith, C.M.; et al. The Third International Consensus Definitions for Sepsis and Septic Shock (Sepsis-3). JAMA 2016, 315, 801–810. [Google Scholar] [CrossRef] [Scilit]
- Johnson, A.E.W.; Bulgarelli, L.; Shen, L.; Gayles, A.; Shammout, A.; Horng, S.; Pollard, T.J.; Hao, S.; Moody, B.; Gow, B.; et al. MIMIC-IV, a freely accessible electronic health record dataset. Sci. Data 2023, 10, 1. [Google Scholar] [CrossRef] [Scilit] [PubMed]
- Stekhoven, D.J.; Bühlmann, P. MissForest--Non-parametric missing value imputation for mixed-type data. Bioinformatics 2012, 28, 112–118. [Google Scholar] [CrossRef] [Scilit]
- Li, L.; Zhao, M.; Zhang, Z.; Zhou, L.; Zhang, Z.; Xiong, Y.; Hu, Z.; Yao, Y. Prognostic significance of the stress hyperglycemia ratio in critically ill patients. Cardiovasc. Diabetol. 2023, 22, 275. [Google Scholar] [CrossRef] [Scilit]
- Seymour, C.W.; Liu, V.X.; Iwashyna, T.J.; Brunkhorst, F.M.; Rea, T.D.; Scherag, A.; Rubenfeld, G.; Kahn, J.M.; Shankar-Hari, M.; Singer, M.; et al. Assessment of Clinical Criteria for Sepsis: For the Third International Consensus Definitions for Sepsis and Septic Shock (Sepsis-3). JAMA 2016, 315, 762–774. [Google Scholar] [CrossRef] [Scilit]
- Kulikov, A.; Krovko, Y.; Nikitin, A.; Shmigelsky, A.; Zagidullin, T.; Ershova, O.; Gadzhieva, O.; Bilotta, F. Severe Intraoperative Hyperglycemia and Infectious Complications After Elective Brain Neurosurgical Procedures: Prospective Observational Study. Anesth. Analg. 2022, 135, 1082–1088. [Google Scholar] [CrossRef] [Scilit]
- Kulikov, A.; Krovko, Y.; Zagidullin, T.; Bilotta, F. Implementation of perioperative blood glucose monitoring and insulin infusion protocol can decrease postoperative infection rate in diabetic patients undergoing elective craniotomy: An observational study. J. Clin. Neurosci. 2024, 124, 137–141. [Google Scholar] [CrossRef] [Scilit]
- Weber, T.; Ge, B.; Tanaka, T.; Litofsky, N.S. The impact of poor post-operative glucose control on neurosurgical surgical site infections (SSI). J. Clin. Neurosci. 2021, 93, 42–47. [Google Scholar] [CrossRef] [Scilit]
- Pennington, Z.; Lubelski, D.; Westbroek, E.M.; Ahmed, A.K.; Passias, P.G.; Sciubba, D.M. Persistent Postoperative Hyperglycemia as a Risk Factor for Operative Treatment of Deep Wound Infection After Spine Surgery. Neurosurgery 2020, 87, 211–219. [Google Scholar] [CrossRef] [Scilit]
- Upadhyaya, S.; Lopez, W.Y.; Goh, B.C.; Chen, A.F.; Blucher, J.A.; Beck, A.; Kang, J.D.; Schoenfeld, A.J. Post-operative hyperglycemia and its association with surgical site infection after instrumented spinal fusion. Clin. Neurol. Neurosurg. 2020, 197, 106100. [Google Scholar] [CrossRef] [Scilit]
- Hikata, T.; Iwanami, A.; Hosogane, N.; Watanabe, K.; Ishii, K.; Nakamura, M.; Toyama, Y.; Matsumoto, M.; Kamata, M. High preoperative hemoglobin A1c is a risk factor for surgical site infection after posterior thoracic and lumbar spinal instrumentation surgery. J. Orthop. Sci. 2014, 19, 223–228. [Google Scholar] [CrossRef] [Scilit]
- Cancienne, J.M.; Werner, B.C.; Chen, D.Q.; Hassanzadeh, H.; Shimer, A.L. Perioperative hemoglobin A1c as a predictor of deep infection following single-level lumbar decompression in patients with diabetes. Spine J. 2017, 17, 1100–1105. [Google Scholar] [CrossRef] [Scilit]
- Greco, G.; Ferket, B.S.; D’Alessandro, D.A.; Shi, W.; Horvath, K.A.; Rosen, A.; Welsh, S.; Bagiella, E.; Neill, A.E.; Williams, D.L.; et al. Diabetes and the Association of Postoperative Hyperglycemia with Clinical and Economic Outcomes in Cardiac Surgery. Diabetes Care 2016, 39, 408–417. [Google Scholar] [CrossRef] [Scilit]
- Järvelä, K.M.; Khan, N.K.; Loisa, E.L.; Sutinen, J.A.; Laurikka, J.O.; Khan, J.A. Hyperglycemic Episodes Are Associated with Postoperative Infections After Cardiac Surgery. Scand. J. Surg. 2018, 107, 138–144. [Google Scholar] [CrossRef] [Scilit]
- Churpek, M.M.; Dumanian, J.; Dussault, N.; Bhavani, S.V.; Carey, K.A.; Gilbert, E.R.; Arain, E.; Ye, C.; Winslow, C.J.; Shah, N.S.; et al. Determining the Electronic Signature of Infection in Electronic Health Record Data. Crit. Care Med. 2021, 49, e673–e682. [Google Scholar] [CrossRef] [Scilit]
- Churpek, M.M.; Snyder, A.; Sokol, S.; Pettit, N.N.; Edelson, D.P. Investigating the Impact of Different Suspicion of Infection Criteria on the Accuracy of Quick Sepsis-Related Organ Failure Assessment, Systemic Inflammatory Response Syndrome, and Early Warning Scores. Crit. Care Med. 2017, 45, 1805–1812. [Google Scholar] [CrossRef] [Scilit]
- Plummer, M.P.; Bellomo, R.; Cousins, C.E.; Annink, C.E.; Sundararajan, K.; Reddi, B.A.; Raj, J.P.; Chapman, M.J.; Horowitz, M.; Deane, A.M. Dysglycaemia in the critically ill and the interaction of chronic and acute glycaemia with mortality. Intensive Care Med. 2014, 40, 973–980. [Google Scholar] [CrossRef] [Scilit]
- Furnary, A.P.; Wu, Y.; Bookin, S.O. Effect of hyperglycemia and continuous intravenous insulin infusions on outcomes of cardiac surgical procedures: The Portland Diabetic Project. Endocr. Pract. 2004, 10, 21–33. [Google Scholar] [CrossRef] [Scilit]
- Galindo, R.J.; Fayfman, M.; Umpierrez, G.E. Perioperative Management of Hyperglycemia and Diabetes in Cardiac Surgery Patients. Endocrinol. Metab. Clin. N. Am. 2018, 47, 203–222. [Google Scholar] [CrossRef] [Scilit]
- Duggan, E.W.; Carlson, K.; Umpierrez, G.E. Perioperative Hyperglycemia Management: An Update. Anesthesiology 2017, 126, 547–560. [Google Scholar] [CrossRef] [Scilit]
- Crowley, K.; Scanaill, P.; Hermanides, J.; Buggy, D.J. Current practice in the perioperative management of patients with diabetes mellitus: A narrative review. Br. J. Anaesth. 2023, 131, 242–252. [Google Scholar] [CrossRef] [Scilit] [PubMed]
- Finfer, S.; Chittock, D.R.; Su, S.Y.; Blair, D.; Foster, D.; Dhingra, V.; Bellomo, R.; Cook, D.; Dodek, P.; Henderson, W.R.; et al. Intensive versus conventional glucose control in critically ill patients. N. Engl. J. Med. 2009, 360, 1283–1297. [Google Scholar] [CrossRef] [Scilit]
- Carney, N.; Totten, A.M.; O’Reilly, C.; Ullman, J.S.; Hawryluk, G.W.; Bell, M.J.; Bratton, S.L.; Chesnut, R.; Harris, O.A.; Kissoon, N.; et al. Guidelines for the Management of Severe Traumatic Brain Injury, Fourth Edition. Neurosurgery 2017, 80, 6–15. [Google Scholar] [CrossRef] [Scilit] [PubMed]
- Radin, M.S. Pitfalls in hemoglobin A1c measurement: When results may be misleading. J. Gen. Intern. Med. 2014, 29, 388–394. [Google Scholar] [CrossRef] [Scilit]

Disclaimer/Publisher’s Note: The statements, opinions and data contained in all publications are solely those of the individual author(s) and contributor(s) and not of MDPI and/or the editor(s). MDPI and/or the editor(s) disclaim responsibility for any injury to people or property resulting from any ideas, methods, instructions or products referred to in the content. |
© 2026 by the authors. Licensee MDPI, Basel, Switzerland. This article is an open access article distributed under the terms and conditions of the Creative Commons Attribution (CC BY) license.