


Abstract
One of the major causes for hospital acquired infections is multidrug-resistant Pseudomonas aeruginosa strains. Polymyxins are a group of lipopeptide antibiotics used as a last-line resort for treatment of Gram-negative infections. Polymyxins initially target Lipid A’s of lipopolysaccharides in the bacterial outer membrane via both electrostatic and hydrophobic interactions. Resistance to polymyxins in P. aeruginosa includes modification of Lipid A’s to attenuate the interactions with polymyxins but to date our understanding of underlying mechanisms is still limited. This study was conducted to investigate the molecular mechanisms of Polymyxin B1 interacting with outer membranes of P. aeruginosa strains including wild-type strain PAK (Polymyxin B1 MIC = 1 mg/L) control and treated and PAKpmrB6 strain (MIC = 8 mg/L) control and treated. Molecular models of PAK as well as PAKpmrB6 membranes were established, and each of those four membrane compositions were simulated as eight independent simulation systems, excluding and including six Polymyxin B1 molecules. The created membrane systems were evaluated running Molecular Dynamic (MD) Simulations for up to 1150 ns each. MD simulations showed that different membrane compositions and Polymyxin B1 interaction affect the general membrane behaviour. In addition, Polymyxin B1 interacts with mutant PAKpmrB6 membranes more slowly and penetrates them less deeply compared to non-mutant membranes. In summary, MD simulations of different membrane compositions provide insights at the membrane level that are consistent with the observed difference in Polymyxin B1 susceptibility between the PAK and PAKpmrB6 strains.
1. Introduction
Multidrug-resistant (MDR) Pseudomonas aeruginosa poses critical challenges to public health worldwide and has a high incidence in cystic fibrosis patients, burn victims, and immune-compromised patients with nosocomial infections [1,2,3,4,5,6]. Due to the rapidly increasing resistance to almost all antibiotics available and the stagnating drug discovery pipeline, the World Health Organization has urged the development of novel antimicrobial treatments to combat this life-threatening Gram-negative pathogens.
Polymyxins, i.e., Polymyxin B1 and Colistin A, represent the last-line antibiotics for treatment of severe Gram-negative infections, but to date there is only limited knowledge of how resistance develops in P. aeruginosa strains [7]. The prevalence of polymyxin resistance in P. aeruginosa has increased dramatically over the past few years [3,8,9,10,11]. However, there are large knowledge gaps on how Polymyxin B1 resistance developed over time and what mechanisms accompany membrane interaction. It is however known how the initial electrostatic and hydrophobic interactions with Lipid A’s—a component of the lipopolysaccharide (LPS) in the bacterial outer membrane (OM)—occur: First, the cell envelope is disorganised, then cellular contents leak while oxidative stress increases, leading to apoptosis [2,7,12,13].
It was found that when treated with Polymyxin B1, the structure of Lipid A’s in P. aeruginosa is altered to attenuate the aforementioned electrostatic interactions [14]. In addition, our metabolomics data showed that numerous biochemical pathways are perturbed by Polymyxin B1 treatment. Therefore, the development of resistance to Polymyxin B1 triggered by P. aeruginosa appears to involve a complex interplay of multiple cellular processes [15]. P. aeruginosa features a large genome (5.5–7.0 Mb), complex regulatory networks, metabolic versatility, and is able to survive extreme harsh conditions including prolonged antibiotic exposure [16,17]. In response to Polymyxin B1 treatment, P. aeruginosa modify their Lipid A’s with cationic moieties—for example L-Ara4N—that act to repel the positive like-charge of the Polymyxin B1 molecule [18]. The general mode of action of Polymyxin B1 involves the initial electrostatic interaction between the cationic side chains of the Polymyxin B1 molecule with the anionic Lipid A head groups [19,20]. These events are followed by hydrophobic interactions between the N-terminal fatty acyl chain and position 6/7 hydrophobic side chains of the Polymyxin B1 with the hydrophobic fatty acyls of Lipid A’s [20].
In our transcriptomic and neutron reflectometry studies, it was discovered that deletion of the corresponding gene pagL (PA4661) resulted in increased susceptibility to polymyxins in a polymyxin-resistant mutant PAKpmrB6 derived from P. aeruginosa PAK [14]. It was concluded that the addition of L-Ara4N to Lipid A’s might play a key role in the response of P. aeruginosa to Polymyxin B1 treatment. Furthermore, genome-scale metabolic modelling showed that the surface physicochemistry can be changed: The modifications of Lipid A’s result in substantial physicochemical changes in the Outer Membrane (OM) of P. aeruginosa: the surface negative charge is neutralised by adding positively-charged L-Ara4N [19].
In previous work, the structure and function of the bacterial OM has been examined using a variety of biophysical techniques, e.g., differential scanning calorimetry [21], nuclear magnetic resonance [22], small-angle diffraction [23], as well as neutron scattering [24]. In contrast to Molecular Dynamics (MD) simulations, all of these techniques are unable to characterise the structural features of bacterial OMs with the required spatial and temporal resolution. MD simulations are capable of capturing the atomic and dynamic properties of biomacromolecules [25,26] thereby facilitating drug discovery [27,28]. Previous MD simulations of the bacterial OM have predominantly focused on characterising structural properties rather than antibiotic interactions [29,30], often employing simplified membrane compositions [31], steered or coarse-grained MD simulations [32,33,34,35], or studying other bacterial species [36,37,38,39]. Additionally, variations in Polymyxin (i.e., Colistin A) charge was studied, composed of a single Lipid A variant [40].
In our study, we employ MD simulations to investigate the membrane behaviour and interaction of Polymyxin B1 with membranes of varying compositions. We specifically examine the impact of membrane compositional changes in P. aeruginosa, derived from lipidomic experiments from treated and untreated PAK and PAKpmrB6 strains. Based on the experimental findings (see Han et al. [14,41]), the lipid compositions of phospholipids and Lipid A species were precisely defined for each membrane system (see Section 2.1 and Supplementary Information Figures S1 and S2). The following base membranes were created: PAK control, PAK treated, PAKpmrB6 control, and PAKpmrB6 treated. The term “treated” refers to the lipid composition measured by lipidomics in bacterial cells that had been exposed to Polymyxin B1 and harvested at a single experimental endpoint [14,41]. These compositions represent an adaptive end-state after sustained polymyxin exposure, not a dynamic remodelling process captured within the MD simulations. Each of those four membranes were simulated with and without the presence of six Polymyxin B1 molecules, in order to explore the structure-activity relationships of membrane-targeting antibiotics and to compare interactions in P. aeruginosa wild-type PAK and resistant PAKpmrB6 strains, focusing on how membrane structure affects Polymyxin B1 binding and membrane properties such as thickness, lateral lipid mobility, and fluidity.
We hypothesise that the L-Ara4N modification of Lipid A’s in PAKpmrB6 membranes reduces the electrostatic interactions with Polymyxin B1. Therefore, the penetration depth of Polymyxin B1 is limited, as is the disruption of the outer membrane. Our research focuses on the following research questions:
- (RQ1) How do the four experimentally derived membrane compositions differ in structural properties?
- (RQ2) How does membrane composition influence Polymyxin B1 binding mode, penetration depth, and interaction strength?
- (RQ3) Can the observed differences in Polymyxin B1–membrane interaction contribute a molecular explanation consistent with the observed MIC difference between PAK and PAKpmrB6 strains?
2. Materials and Methods
2.1. Membrane Composition
Based on lipidomic experiments, the lipid composition of the membranes were defined for all phospholipids as well as Lipid A’s [14,41] (see Table 1). The molecular structures used for this project are shown in Supplementary Information Figures S1 and S2. Please note that all the models in this study are lipid-only outer membrane models.
Table 1.
Effective lipid composition of the outer leaflet of different membranes in percent. Percentages after the membrane modelling in MembraneEditor which were used during MD simulations. For experimental values and corrected percentages see Supplementary Tables S1 and S2.
The inner leaflet of all membranes consists of 27.1% DDM, 59.7% DPE, and 13.2% DPP. The experimentally derived lipid composition of the outer leaflets is shown in Supplementary Information Table S1. The size of the membranes was set to 150 Å × 150 Å. This lateral dimension was chosen as a compromise to achieve both statistically meaningful lipid-type ratios (particularly for minor Lipid A species) and computational feasibility. We defined a cut-off for minor Lipid A hexa-acyl lipids of 3%; all Lipid A hexa-acyl lipids below this ratio were replaced by their penta-acyl counterparts. The 3% threshold was chosen as Lipid A variants contributing less than 3% would be represented by drastically less than a single molecule in a 150 Å × 150 Å bilayer patch, overstating the contribution to the biochemical reaction of this lipid type during the simulation. To ensure most structurally similar representation, they are replaced with their respective penta-acylated counterpart. The resulting percentages are shown in Supplementary Information Table S2. These values were used as input values for the following step:
The membrane models were created by using the CELLmicrocosmos 2 MembraneEditor (version 2.2.2_2) [42]. The MembraneEditor allows the use of freely customisable lipid models, the definition of ratios up to three decimal places including information on de facto ratios after lipid distribution, algorithms to achieve the desired lipid density, and extensive PDB (Protein Data Bank format compatible) export functionality to write PDB files to a compatible Gromacs format [43].
All membrane models were created using the Advanced Random Placing algorithm (with Atom and Shape Collision with Automatic Details). Density was set to High, Tolerance for Tilts to 5 Å, Tolerance for Random Shifts to 1 Å. For each membrane, five different versions were generated by using five different random seeds. Then, for each membrane, the composition matching closest to the one provided by our experimental data was chosen. The random seeds of the finally selected membrane models are for PAK control 16, PAK treated 9, PAKpmrB6 control 3 and for PAKpmrB6 treated 21. These different random seeds were used to achieve the optimal lipid ratios in the model membranes. The MembraneEditor protocols can be found in the Supplementary Information Section “Original Cm2 MembraneEditor Protocols”.
Table 1 shows the effective membrane composition after the membrane was generated with MembraneEditor. It also shows that none of the percentages differs more than 1.67% based on the input values shown in Supplementary Information Table S2. The resulting absolute number of lipid molecules in each membrane system is shown in Supplementary Information Table S3.
2.2. Polymyxin B1 Insertion into Membrane
Six Polymyxin B1 (PMB) molecules were inserted into the PAK control membrane using UCSF Chimera [44]. The PDB molecules are placed as far from the top of the simulation box as possible to prevent initial PMB-membrane interactions. The exported text-based PDB files contained all structural information associated to the Polymyxin B1 as well as the membrane. The information associated with Polymyxin B1 was copied into the remaining three membrane files for PAK treated, PAKpmrB6 control, and PAKpmrB6 treated.
Water was added to the membrane using Gromacs 2016.4 [45,46] (gmx solvate) [47] with a box height of 13 nm. gmx solvate implicitly uses a text file named vdwradii.dat where the user can modify the van der Waals radii of specific atoms which is used to determine viable positions to insert the solvent. This file is constructed so that the van der Waals radius of all atoms except H and O is increased to 0.5 nm to reduce the likelihood of water entering the lipid bilayer [47].
Some water molecules still enter the membrane. VMD contains a sophisticated selection tool for atoms and molecules [48]. This tool is used to create a selection that excludes all water molecules with a z coordinate of nm nm which is then saved as a pdb file. The topology file is then adjusted for fewer water molecules. The negative charge of the system is neutralised by adding sodium ions with gmx genion. This is required to enable a stable simulation of the membrane using Gromacs.
2.3. Lipid and Polymyxin B1 Parametrisation
Topology files were set up for six chemotypes of Lipid A’s: Lipid APAKpmrB6, Lipid AAra4N, Lipid A2-Ara4N with each of them in the penta-acylated and the hexa-acylated form. As previously mentioned in the Section 1, it was found that in response to Polymyxin B1 treatment, Gram-negative bacteria modify their Lipid A’s with L-Ara4N that act to repel the like-charge of the Polymyxin B1 molecule [18].
As a basic structure, the topologies from Pontes et al. [49] and Santos et al. [31], were used and adjusted according to the differences in Lipid A’s in the PAKpmrB6 strain. The hydroxy group was added to the PAK Lipid A’s with subsequent energy minimisation of the static structure in Avogadro [50]. The acyl chain was cut off at the C atom of the carbohydrate ring that was then hydrogenated. This acyl chain was then parameterised with the Automatic Topology Builder ATB (version 2.2) [51] using the Gromos 54A7 force field [52]. The parameters of the hydroxy group were added to the topology file and two dihedral angles were adjusted since they differed in our experimentally-derived data from the one presented by Santos et al. [31]. For the Ara4N modifications, Ara4N was added to a hydroxy group in the phosphate moiety in Avogadro and the energy of the static structure was minimised. In the topology file the charge groups were corrected, the Ara4N parameters were added and the phosphate parameters adjusted. Parameters for Polymyxin B1 are taken from Santos et al. [31]. The formal charges of key molecules (Lipid A’s chemotypes LP0, LP1, LP2, LH0, LH1, LH2; phospholipids DDM, DPE, DPP, and PMB) are listed in Supplementary Information Table S4 and all topology files are available for download on Zenodo [53].
2.4. Molecular Dynamics Simulation
The system was simulated using Gromacs 2016.4 on the BinAC supercomputer of the High Performance and Cloud Computing Group at the Zentrum für Datenverarbeitung of the University of Tübingen [45,46]. An overview of the process is shown in Figure 1 and the MD simulation parameters used in this study are summarised in Supplementary Information Table S5. For each membrane configuration (see Table 1), a control simulation without any Polymyxin B1 and a simulation with 6 Polymyxin B1 was performed. The system was neutralised with the respective amount of sodium ions to neutralise the net negative charge of the lipid bilayer. As solvent model, SPC water model was used [54].
Figure 1.
Schemata of how MD simulations were performed and set up.
The particle mesh Ewald (PME) was applied with Verlet as cutoff scheme to allow calculation of long-range electrostatic interactions [55]. The LINCS algorithm was used to constrain the bonds to their correct lengths [56]. Steepest descent minimisation was performed with a maximum of 20,000 steps or until a force of less than kJ was reached. The NVT equilibration ran for 100 ps with a time step of 2 fs. The velocity-rescaling thermostat [57] was used to achieve a constant temperature (300 K) and two temperature coupling groups were used (all lipids and water + ions + Polymyxin B1). Pressure coupling type was semi-isotropic at 1 bar in both the xy and z directions. NVT equilibration resulted in cavities within the solvent. More water was added to fill the cavities and minimisation and NVT equilibration were repeated with the same parameters. Subsequently, the NPT equilibration was run for 150 ps to 1 bar with the Berendsen barostat [58] and a step size of 2 fs prior to the MD run. Lipids and Polymyxin B1 were fully restrained during equilibration using harmonic position restraints with a force constant of applied to all heavy atoms. These were applied to prevent lipid disorder and bilayer disruption during the initial equilibration stages. In addition, full positional restraints prevent unphysical membrane deformations caused by solvent rearrangement and charge neutralisation. The control membranes were simulated for 1100 ns with a step size of 1 fs. The membranes with Polymyxin B1 were simulated for 50 ns while the Polymyxin B1 molecules were restrained at the top of the simulation box, where they cannot interact with the membrane. All six Polymyxin B1 molecules were placed initially at the top of the simulation box to avoid any pre-existing contact between Polymyxin B1 molecules and the membrane. Any clustering that is subsequently observed is therefore driven by self-association during the simulation. This approach ensured that there was no interaction between Polymyxin B1 and the membrane while the membrane still settled. During this phase, the z-coordinate of each Polymyxin B1 molecule was monitored to ensure that it remained within the water layer above the outer leaflet surface.
For the next 80 ns flat-bottomed restraints were applied. These restraints acted as a one-directional barrier in the z-direction at the top of the simulation box. This prevented Polymyxin B1 from crossing the upper periodic boundary, while allowing unrestricted lateral (x, y) and downward (z) diffusion towards the outer leaflet. This temporary restraint was implemented as the swapping of the PMB1 molecule from one side to the other would not reflect the behaviour in an in situ system. After 80 ns all Polymyxin B1 molecules were reliably in contact with the membrane. At this point, the restraints no longer influenced the performance of the simulation, and deactivation was a computational measure that enhanced the time taken to calculate the simulation. The simulation was continued for another 1020 ns resulting in a total of 1150 ns.
2.5. MD Analysis and Calculations
To analyse the simulation trajectory the first 50 ns of each trajectory were removed to consider only the equilibrated part of the simulation. For all systems, this yields an analysed production window of approximately 1000 ns per system (1050 ns for control membranes; 1100 ns total for PMB membranes of which the first 80 ns constitute the flat-bottomed-restraint approach phase). FATSLiM [59] was used to calculate the membrane thickness, and built-in Gromacs functions to calculate deuterium order parameters, mean squared displacement, number of contacts and hydrogen bonds. Hydrogen bonds were identified using gmx hbond with the standard geometric criteria (donor–acceptor distance Å, donor–hydrogen–acceptor angle ). Contacts were calculated with gmx mindist and defined as all heavy-atom pairs between PMB1 and membrane lipids within a distance of Å. To determine the mean and standard deviation of different values, the simulation trajectory was divided into two halves (first and second half) following the methodology of Gapsys et al. [60] and Cutarella et al. [40]. The trajectory-halving approach provides an estimate of temporal variation. Convergence between the two halves indicates that the property of interest has reached a stationary state, while divergence suggests ongoing drift. To investigate the mechanism of binding, the simulation trajectory was visually inspected and images were exported with PyMol [61]. For this approach, a single Polymyxin B1 molecule was selected based on two criteria: (1) Fast binding to the membrane and (2) not binding close to the border of the membrane. To investigate how deeply Polymyxin B1 penetrates the membrane, the distance between Polymyxin B1 atoms and the geometric centre of the membrane (determined by GROMACS, midplane at ) was calculated for each frame in the trajectory. A smaller value indicates deeper penetration and negative values indicate penetration into the inner layer of the membrane. Values are reported in Å. In addition to the distance, the atom closest to the membrane centre was determined for each frame to identify which atom has penetrated furthest below the membrane surface. The identified atom is then mapped back to its corresponding Polymyxin B1 residue. APL@Voro [62,63] was used to visually inspect the simulations and to calculate, analyse and visualise membrane properties. The colour codes used for the graphs in the following section of the membranes are listed in Supplementary Information Figure S31, showing the lipid colour codes, and Supplementary Information Figure S32 showing the Polymyxin B1 colour codes. Colour codes are based on the work of Green-Armytage [64].
3. Results and Discussion
3.1. Influence of Membrane Compositions on Membrane Properties
Supplementary Information Figures S3 and S4 visualise the initial membrane configuration based on the covalent radii of the atoms. The figures show that all membrane systems (02, 04, 06 and 08) remain stable and that at the end of each simulation all PMBs perturb the corresponding membrane. To analyse the membrane behaviour and membrane-PMB interactions, key properties were computed to investigate the effects of membrane compositions and Polymyxin B1 binding on membrane structure and dynamics. These include: area per lipid, membrane thickness, and mean squared displacement. Following the methodology of Gapsys et al. [60] and Cutarella et al. [40], each complete simulation trajectory was split into two halves (first and second half) to determine temporal fluctuations. In summary, we demonstrated that our membranes are stable during the simulation and that membrane composition and interaction with Polymyxin B1 influences the lateral lipid mobility of the membrane.
3.1.1. Area per Lipid
The APL of the inner leaflet is much smaller compared to the APL of the outer leaflet. This difference is expected, as the inner leaflet is solely made up of phospholipids which are more tightly packed compared to the mixture of phospholipids and different types of Lipid A’s in the outer leaflet. The APL averages of the inner leaflets range between 0.45 to 0.5 nm2 for each of the 20 frames distributed representing 1000 ns simulation time (see also Supplementary Information Figure S5). In addition, the APL for the inner leaflet of PAK control and PAKpmrb6 treated slightly declines from the first to the second half/as well as the curve in Figure 2, whereas the ones of PAK treated and PAKpmrb6 control remain relatively stable.
Figure 2.
Area per lipid in nm2 of both membrane leaflets as computed by APL@Voro. To smooth the curve, every 10th data point was sampled and every 499th data point is considered for plotting.
For simulations with PMB, the APL of the outer membrane shows a strong decrease during the first ca. 50 ns, whereas the outer membrane only systems show only a small drop. The APL of membrane with PMB ranges between ca. 1.02 and 1.24 nm2 (ignoring the first 50 ns when the PMBs are connecting to the membrane), whereas the APL of membranes without PMB range between ca. 1.28 and 1.46 nm2 (see also Supplementary Information Figure S6). This is due to the penetration of the PMBs into the membrane, as shown in Section 3.2.1. Based on Figure 2, it can be predicted that the PMBs—once they have entered the membrane—will remain attached or perturbed inside the membrane throughout the course of the simulation (see also Section 3.2.1). For example, PAK control with PMB, the APL is declining. For PAK treated APL@Voro shows the most stable curve with the lowest variation over time. For PAK treated with PMB examining the corresponding curve in APL@Voro clearly shows that the curve is first decreasing until ca. 270 ns (ca. 1.06 nm2), but then slowly increasing again (ca. 1.1 nm2). A reason might be that the penetration depth of the PMBs in overall is relatively high around 500 ns but then seems to slowly decrease again (see Section 3.2.1). Therefore, we conclude that Polymyxin B1 insertion into the membrane does influence their properties such as APL, with the extent of change depending on the membrane composition.
Compared with the literature, several studies have previously employed Gromacs to simulate Lipid A-containing membranes to investigate structural and dynamic properties of bacterial outer membranes.
Lopez et al. characterised the outer membrane composition of Pseudomonas aeruginosa by using the Gromos 53a7 forcefield and maintaining a temperature of 310K [65]. They reported an APL of approx. 1.8 nm2 for hexa-acylated Lipids As and 0.6 nm2 for DPPE [30]. The Lipid A’s valuefits our findings shown in Figure 3a,b for LP0 in the PAKpmrB6 control membrane very well. This was expected, as the temperature with 310K and the force field is relatively similar to what we are using here (300K and Gromos 54a7). However, the complexity of membranes models in Lopez et al. is drastically lower, as the top monolayer consists of Lipid A’s only, and the bottom monolayer of exclusively DPPE. Therefore, the DPPE value cannot be directly compared to the one in Figure 3a,b, as the DPE here resides in a heterogeneous membrane layer.
Figure 3.
Area per Lipid plots generated with APL@Voro. In the centre—coloured by lipid type, at the bottom—coloured by APL.
In Li et al. [29] penta-acylated Lipid A values are reported ranging from 1.1 to 1.3 nm2, compared with around 1.8 in Lopez et al. (for hexa-acylated Lipid A’s) and around 1.5 nm2 for the comparable penta-acylated Lipid A’s in our simulations. The membrane from Li et al. was considerably more simple in structure. Whereas our membrane was simulated with 300K, the one from Li et al. used a temperature of 323K and also a different force field, an extended version of the AMBER-based Glycam06 [66]. In combination with a very different force field, it was expected that the values are not similar to our approach.
The APL was analysed locally using top-down Voronoi tessellations via APL@Voro, based every 1000th data point. Figure 3 and Figure 4 (Graph 01–08) visualise the temporal development of APL and Voronoi diagrams.
Figure 4.
Area per Lipid plots generated with APL@Voro. In the centre—coloured by lipid type, at the bottom—coloured by APL.
The Voronoi diagrams were plotted each for ns, = 250 ns, = 500 ns, = 750 ns, and = 1000 ns. The line graph as well as the top Voronoi graphs use the same lipid type colour scheme (the legend is depicted top of the line graph), whereas the bottom Voronoi graphs use the LOCS colour scheme (Linearized Optimal Colour Scale by Haim Levkowitz) [67] to visualise the maximum and minimum area per lipid. The whole range of the LOCS colour scheme as well as the maximum (top) and the minimum (bottom) numbers are shown at the bottom-right colour scale. The top diagrams show the membrane-only systems for the Graphs 01, 03, 05, and 07, whereas the bottom diagrams of the figures show the Graphs 02, 04, 06 and 08. The bottom graphs show also the colour index of the PMBs depicted in the Voronoi diagrams, complementing the lipid type colour scheme. In the bottom Voronoi diagrams visualizing the APL intensity, the PMBs are white, to differentiate them from the surrounding lipids.
Graph 01: PAK control. The first graph in Figure 3a shows that the APL is highly unstable for DPP. As only a few DPP molecules reside in the membrane, small changes affect the APL drastically. For example, to show that the bottom left DPP has one of the largest APL in comparison to all molecules ( and second largest, largest)—the corresponding DPP resides in on the bottom right due to periodic boundary conditions and lateral lipid movement. DPE seems to be the weakest molecule in this composition which has to accommodate space of the surrounding lipids, as it has the lowest APL over time. The APL for the Lipid A’s, LH0 and LP0, are relatively stable over time with very low fluctuations. The latter ones seem to form clusters/networks.
Graph 02: PAK control with PMBs. Interestingly, DPP, which had the highest average APL in Membrane 01, has the lowest APL in Membrane 02, see Figure 3b. Again, strong fluctuations can be observed, whereas the APL of the LH0 and LP0 remain stable. Comparing Membrane 01 and 02, the Lipid A’s APL undergoes only very minor changes, whereas the APL of the phospholipids has to compensate for the inserted Polymyxin B1. Very early, all Polymyxin B1 have entered the membrane. Based on the APL analysis, the inserted Polymyxin B1 molecules first seem to reduce the lateral mobility of the surrounding lipids, reflecting increased membrane rigidity. Initial clusters remain stable throughout the simulation. In , PMB1-PMB6 (vertical neighbours) join in the centre right, PMB2-PMB3 (vertical neighbours) join in the bottom centre, and PMB4-PMB5 (horizontal neighbours) join in the top left. They maintain these clusters all over the simulation. Whereas PMB2-PMB3 seem to merge, the other two PMB clusters maintain a distance of 1–2 lipids between both neighbouring PMBs.
Graph 03: PAK treated. In the PAK treated membrane, the three Lipid A’s dominate the membrane in terms of APL, see Figure 3c. DPP, which had the largest APL in PAK control, now has the lowest one and has to compensate for the other lipids. The composition of this membrane is more stable than the one of PAK control, the fluctuations are lower, showing that this membrane mix has a higher degree of lateral lipid order. Observing the MSD values of all lipids they seem to be relatively similar and lie around 0.5 to 1 nm2, only the one of DPP lies around 2 nm2 towards the end of simulation.
Graph 04: PAK treated with PMBs. The development of the APL is relatively similar in the Polymyxin-end-state membrane system PAK treated with PMBs, only that all values are lower, suggesting reduced lateral lipid mobility and increased membrane rigidity upon PMB binding. Interestingly, the average APL for DPP drastically rises around = 750 ns and is for a period of ca. 150 ns the highest in Figure 3d. These strong fluctuations are not surprising as only four DPPs are in this membrane; therefore, changes in a single molecule can have strong impact on the average values. Comparing with , it is obvious that the average APL Voronoi size is smaller in . Whereas the previous membrane showed three clusters, this one only has a single one: PMB3-PMB5. The other PMB molecules are distributed over the membrane and their neighbourhood is dominated by Lipid A’s—which is however expected as the amount of Lipid A’s exceeds the one of Phospholipids. The DDM molecules which are from the beginning in proximity to PMB4 remain there all over the simulation. Therefore, no strong tendency is observed for DDM to avoid the Polymyxin B1.
Graph 05: PAKpmrB6 control. The mutant-based control membrane PAKpmrB6 control remains very stable all over the simulation in Figure 4a. This is the membrane with the highest amount of lipid species with eight lipid types, whereas five lipid types apply to Lipid A’s. The LP0, LP1 and LP2 dominate in terms of APL over LH0 and LH1. LP1 seems to form stable lipid networks.
Graph 06: PAKpmrB6 control with PMBs. There is one Polymyxin B1 cluster: PMB1-PMB6 which remains stable all over the simulation in Figure 4b. All other Polymyxin B1 are distributed on the membrane surface. Similar to the graph of PAKpmrB6 control, LP1 seems to form stable networks which are here surrounding the PMBs. In addition, towards the end of the simulation—starting around 500 ns—it can be seen that the APL for DDM and DPP are going down, whereas the one of DPE and LP2 is increasing.
Graph 07: PAKpmrB6 treated. The APL remains very stable all over the simulation for all lipid types in Figure 4c. DPE and DPP have the lowest values, whereas LP0 and LP2 show the highest value over the whole simulation, including DDM towards the end of the simulation.
Graph 08: PAKpmrB6 treated with PMBs. Whereas the APL for most lipids is relatively stable, the one for LH1 strongly fluctuates around in Figure 4d, having their peaks around and stopping around . As observed earlier, there are only three LH1 in this membrane, therefore minor changes in individual molecules have strong impact. Other than this, the phospholipid APL values of DDM and DPP are again relatively low, whereas DPP and DPE are swapping in terms of APL values between Graph 07/PAKpmrB6 treated and 08/PAKpmrB6 treated with PMBs. Also, DPP shows strong fluctuations this time. Interestingly, the Voronoi diagrams clearly show that only one LH1 is in proximity of a Polymyxin B1 (PMB6). There are two Polymyxin B1 clusters: PMB3-PMB5 and PMB1-PMB4, and PMB2 starts approaching the last-mentioned cluster in . Again, clusters remain stable over the simulation.
Graph Summary Observations. Whereas the first membrane-only system Graph 01 showed strong fluctuations, the other ones (03, 05, and 07) show stable lipid compositions. On the contrary, whereas the Polymyxin B1 of the first membrane composition in Graph 02 seemed to have a rigidifying effect in terms of APL, the other membranes showed more fluctuations due to Polymyxin B1-lipid interactions.
3.1.2. Membrane Thickness
The mean and standard deviation of the membrane thickness were calculated for all simulations (see Table 2). Note that when calculating the thickness with FATSLiM, Polymyxin B1 is not taken into account in the thickness values.
Table 2.
Thickness of membrane in nm.
Overall, membrane thickness increases slightly from the first (3.60 nm to 3.63 nm) to second half (3.64 nm to 3.66 nm) of the simulation, a trend consistent with the observed decrease in APL. It is a well-known correlation that the thickness and APL of a membrane are related [68]. When the thickness increases, the APL decreases at the same time, indicating a higher ordering of hydrocarbons of the membrane. The thickness values are consistent across different compositions, indicating high structural stability. Despite the presence of Polymyxin B1, which does not penetrate into the inner leaflet of the membrane, the overall membrane thickness remains largely unchanged, so the bilayer maintains its structural integrity and does not undergo significant structural perturbations due to binding.
Berglund et al. investigated the interaction of Polymyxin B1 with the membranes of E. coli bacteria and reported a membrane thickness of nm in their control simulation with an overall decrease in thickness under the influence of Polymyxin B1 down to nm [69]. There are two major differences between their and our membrane composition. Firstly, they use pure hexa-acylated Lipid A’s in their outer leaflet whereas this work features a mix of hexa- and penta-acylated Lipid A’s as well as various phospholipids—which is closer to the realistic composition of the membrane (see also Table 1, Tables S1 and S2). Lipid A’s, which are less acylated, form a thinner membrane since the tail ends tend to interdigitate [31,70]. Similar effects seem to be observed in the membrane simulation from Li et al. simulating a Lipid A’s (top layer) with a mixed phospholipid (bottom) layer (based on the density profiles and membrane renderings) [29]. Secondly, their membrane simulation is initialised with a high order parameter in the outer leaflet that gets lower once the Polymyxin B1 enters the membrane. In contrast, our membrane simulations start with an already low order parameter for the outer leaflet. These two differences explain the initially lower thickness of our membrane. The increase in membrane thickness under the influence of Polymyxin B1 with an initially low order parameter was also observed by Santos et al. [31]. Compared to the study by Cutarella et al. [40], our membrane thickness values are generally higher. This difference is expected, as their model system is not directly comparable to our system as it consists of a single penta-acylated Lipid A variant and uses Colistin A as the ligand. Nonetheless, in their work, the control membrane and the system with the analogous ligand (Colistin A, charge +5) exhibited similar thickness values, a trend we also observe in our simulations, supporting the consistency and reliability of our results.
3.1.3. Mean Squared Displacement
The mean and standard deviation of the mean squared displacement (MSD) of the inner and outer leaflet were calculated for all simulations (see Table 3 and Supplementary Information Figures S33–S48). During the course of the simulations, the MSD of both leaflets increases, along with the mean values of the first and second half of the simulations. The maximum difference for inner leaflets between with/without PMB compositions is for PAK control in the second half, the maximum difference for the outer leaflets between with/without PMB for the same membrane is .
Table 3.
Mean squared displacement of lipids in leaflets in nm2.
The MSD of the inner leaflet are lower than for the outer leaflet, indicating reduced mobility in the inner membrane region. Overall, the MSD values of the inner leaflet are consistent across the different simulation types, which is expected as the composition of the inner leaflet is identical. In addition, PMB does not penetrate the inner leaflet, explaining the lack of variation.
For the outer leaflet the MSD and therefore the lateral mobility of the membrane is influenced by membrane composition and Polymyxin B1 binding. The membrane lateral mobility is highest in the wild-type PAK system and decreases with the pmrB6 mutation and Polymyxin B1 binding, suggesting reduced lateral mobility in resistant strains, specifically under treatment. The integration of Polymyxin B1s into the outer membrane leaflet lowers the overall mobility of lipids. This effect has been previously reported in other studies [40,69] investigating Polymyxin-membrane interactions and is associated with cross-linking of sugar head groups of the outer membrane by Polymyxins.
3.2. Influence of Membrane Composition on Interaction with and Properties of Polymyxin B1
3.2.1. Polymyxin B1 Penetration of Membranes
To estimate how well Polymyxin B1 is able to disrupt membranes with different compositions, the penetration depth (see Figure 5 and Supplementary Information Table S6) and Polymyxin B1 residues penetrating deepest were evaluated for each time step (see Table 4). Results are shown as average over all six Polymyxin B1 molecules for each simulation. In the literature, the initial interaction of Polymyxin B1 to attach to the cellular membrane is mediated via ionised Dab residues that bind to Lipid A’s, but hardly interact with the hydrophobic core of the membrane. Therefore, Polymyxin B1 penetration into the membrane and conformational folding of Polymyxin B1 into the hydrophobic region of the membrane is caused by the following penetration of the fatty acid tail [32,36].
Figure 5.
PMB penetrations in all four membrane systems: 02/(left-top) PAK control with PMBs, 04/(right-top) PAK treated with PMBs, 06/(left-bottom) PAKpmrB6 control with PMBs, 08/(right-bottom) PAKpmrB6 treated with PMBs. Distances in Angstrom.
Table 4.
Residues of Polymyxin B1 penetrating the membrane the deepest. For each simulation frame and each of the six Polymyxin B1 molecules, the residue carrying the atom with the smallest penetration depth was identified. The percentage in each cell represents the proportion of all frame-molecule pairs for which the corresponding residue achieved the minimum distance to the reference surface. The percentages sum to 100% within each column.
All PMBs approach the membrane rapidly after the simulation has started. The maximum time that a Polymyxin B1 requires to start penetrating the membrane is approximately 30 ns in PAK control with PMBs. Most PMBs require less than 20 ns to start the PMB-membrane interaction (see Figure 5). For PAK strains, PMBs approach the membrane quickly.
When analysing the average penetration depth of each individual PMB molecule (see Supplementary Information Table S6), we can observe substantial variability. This observation reflects the heterogeneous binding modes adopted by individual PMB molecules at the membrane surface. The following section will discuss the qualitative differences in penetration behaviour between PAK and PAKpmrB6 strains in the context of Figure 5 and Table 4.
In PAK control with PMBs, PMB3 perturbs the membrane up to 40 Å from the membrane centre already after approx. 450 ns. The maximum penetration over all four simulations is reached by PMB1 in PAK treated with PMBs with an approximate 20 Å distance to the membrane centre after roughly 500 ns. Dab residues exhibit limited deepest penetration, while the fatty acid tail shows a higher amount of deepest penetration (see Table 4), suggesting a fast and more efficient integration into the bilayer core, which is well in agreement with literature. To enable the assessment of variability between molecules, residue-level penetration profiles are provided for all six Polymyxin B1 molecules in Supplementary Information Tables S7–S10.
In PAKpmrB6 control with PMBs the penetration values are relatively low. The maximum of approx. 50 Å is reached relatively early after 50 ns by PMB2 and afterwards the penetration of all PMBs does not reach this low value any more. At the end of the simulation, the maximum penetration depth is approx. 90 Å (PMB1). The relatively low penetration values also apply to PAKpmrB6 treated with PMBs. PMB6 is able to perturb the membrane up to approx. 40 Å after approx. 300 ns, but at around 700 ns it moves upward again. At the end of the simulation, the maximum penetration depth is around 100 Å. When considering the penetration depth of Dab residues and the fatty-acid tail in PAKpmrB6 simulation in comparison to PAK strain, Dab residues have a higher amount and the fatty-acid tail a lower amount of deepest penetration (see Table 4). These results indicate more interaction at the surface of the membrane with altered Lipid A’s. Polymyxin B1 is coordinating well with the hydrophilic part of the membrane rather than penetrating the hydrophobic core. This behaviour is consistent with our hypothesis: the L-Ara4N substitution replaces anionic dihydrogen phosphate groups with neutral moieties, reducing the electrostatic driving force for PMB1 insertion. As a result, PMB1 remains in a surface-associated binding mode rather than progressing to deep hydrophobic insertion of the fatty acid tail. This could be caused by a higher proportion of Lipid A’s with one dihydrogen phosphate and one Ara4N sugar group moiety.
Therefore, the orientation as well as penetration of Polymyxin B1 into the membrane seems to be more favourable for PAK simulations, as Polymyxin B1 can penetrate deeper than for PAKpmrB6 simulations. The differences in the penetration depth are consistent with the observed minimum inhibitory concentrations (MIC) differences between the PAK strain (MIC = 1 mg/L) and the PAKpmrB6 strain (MIC = 8 mg/L), suggesting a membrane-level factor that influences the MIC. However, it is important to acknowledge that the MIC measures the totality of cellular resistance mechanisms. The MD simulations presented here, on the other hand, characterise membrane-associated components. Therefore, our exploratory observations provide membrane-level insights that are consistent with, but do not provide a causal explanation for, the observed MIC difference.
3.2.2. Qualitative Interaction of Polymyxin B1 Binding
For investigating the Polymyxin B1 binding to the different membranes, one Polymyxin B1 per MD simulation was selected. The selection criteria were that the respective Polymyxin B1 (a) is the first one binding to the membrane, and (b) is not located too close to the border of the membrane, in order to be able to investigate the mechanism on a long-time scale.
Mechanism PAK control simulation: First contacts between Polymyxin B1 and the membrane occur between the charged amino groups of Dab that interact with the phosphate and hydrogen phosphate groups of the LP0 and LH0 lipid head (see Figure 6A), respectively. In addition, interactions with the carbonyl group of the glucosamine ring can be observed. The fatty acid tail of Polymyxin B1 begins to interact with the lipid heads on the surface of the membrane (see Figure 6B). During the simulation, interactions between amino groups of Dab with hydrogen phosphate groups of LP0 glucosamine ring are increasing and stabilise binding to the membrane surface. Also, the carbonyl group of threonine-2 and threonine-10 interact with the hydrogen phosphate group of LP0 (see Figure 6C). After a while, the Polymyxin B1 fatty acid tail starts to insert into the membrane, as an anchor, and interacts with the lipid acyl tails of LH0 and LP0 and pushes away the lipids (see Figure 6D). At the end of the simulation it is visible that a disruption of the membrane occurs with lipids being pushed away close to the Polymyxin B1 molecule.
Figure 6.
PAK control with PMBs: Binding of Polymyxin B1 molecule to Membrane. The PMB selected (yellow stick) for the MD simulation is PMB5. (A–D) indicate the following time points in the simulation: 3 ns, 20 ns, 200 ns and 1020 ns. In the background another PMB molecule is visible as cyan stick.
Figure 7 shows the first (left) and last frame (right) of the final simulation run. The lipids largely maintain their positions. Whereas the APL of Lipid A’s is relatively stable comparing the two frames, individual phospholipids seem to lose a drastic amount of space to entering Polymyxin B1 molecules (see top-left and bottom-right Polymyxin B1 in Figure 7). This again underpins that Polymyxin B1 uses the Lipid A’s as a stabiliser to submerge into the outer membrane layer, whereas the phospholipids are pushed aside or forced to shrink under the inserting Polymyxin B1.
Figure 7.
PAK control with PMBs: Voronoi visualisation of the Binding of Polymyxin B1 molecule to Membrane ((left) starting frame, (right) last frame). Colour codes: left membrane—by residue, centre membrane—by Area per Lipid, right membrane—by thickness.
Mechanism PAK treated simulation: In comparison to PAK control with PMBs simulation, the interaction is not solely based on LP0 and LH0, but also on LP1. The initial binding of Polymyxin B1 is initiated by interaction between the amino groups of Dab and the hydrogen phosphate groups of the glucosamine unit of LP0 (see Figure 8A). In Figure 9 the two top-left PMBs even assemble around single LP0s. Furthermore, the amino groups of Dab also interact with the hydrogen phosphate group of the glucosamine unit of LP1 (see Figure 8B). Unlike the simulation PAK control with PMBs, no penetration of the membrane occurs, and lipid positions remain stable (see Figure 9). Polymyxin B1 interacts with the membrane surface, without penetrating the membrane. The amino groups of Dab keep interacting with hydrogen phosphate groups of the glucosamine unit and seem to hold the molecule at the top of the membrane (see Figure 8C,D).
Figure 8.
PAK treated with PMBs: Binding of Polymyxin B1 molecule to Membrane. The PMB selected (yellow stick) for the MD simulation is PMB6. (A–D) indicate the following time points in the simulation: 6 ns, 14.2 ns, 100 ns and 1020 ns.
Figure 9.
PAK treated with PMBs: Voronoi visualisation of the Binding of Polymyxin B1 molecule to Membrane ((left) starting frame, (right) last frame).
Mechanism Simulation PAKpmrB6 control: The first contacts between Polymyxin B1 and membrane lipids are between the amino groups of different Dab residues and the hydrogen phosphate groups of the glucosamine unit of LP0 and LP1 (see Figure 10A). At the beginning of the simulation, there are also few interactions between the carbonyl group of threonine-2 and the amino group, as well as the phosphate group of the DPE lipid head. At first, Polymyxin B1 is well coordinated with the membrane (see Figure 10B), but needs time to fully establish the interaction. The amino groups of different Dab residues begin to interact mainly with the hydrogen phosphate group of the glucosamine ring and the carbonyl group of the sugar rings, but also with the hydrogen phosphate groups of LP1. Polymyxin B1 lies flat on the surface for most of the simulation time with a fatty acid tail and phenylalanine located at the top, further away from the membrane (see Figure 10C). At the end of the MD simulation, Polymyxin B1 moves slightly into the membrane but remains flat at the top (see Figure 10D). When the top view is shown, one can see that there is space around the phenylalanine and that the lipids move away at this position. The Voronoi visualisation of the corresponding membrane (see Figure 11) confirms that the Polymyxin B1 molecule discussed here (centre right) is mostly surrounded by the lipids LP1 and LH1.
Figure 10.
PAKpmrB6 control with PMBs: Binding of Polymyxin B1 molecule to Membrane. The PMB selected (cyan stick) for the MD simulation is PMB5. (A–D) indicate the following time points in the simulation: 6 ns, 100 ns, 200 ns and 1020 ns.
Figure 11.
PAKpmrB6 control with PMBs: Voronoi visualisation of the Binding of Polymyxin B1 molecule to Membrane ((left) starting frame, (right) last frame).
Mechanism Simulation PAKpmrB6 treated: The first contacts between Polymyxin B1 and the membrane occur between the amino groups of different Dab residues of Polymyxin B1 and LP1, which is part of the membrane. The amino groups of Dab start coordinating with the hydrogen phosphate groups of the glucosamine units of LP1. In addition, there is also interaction taking place with the carbonyl group at the glucosamine unit. In general, the amino group of Dab residues interacts with the hydrogen phosphate groups located on the different parts of the LP1. Furthermore, the carbonyl group of threonine-2 and threonine-10 of Polymyxin B1 can interact with them, too (see Figure 12A,B). After initial binding to the membrane, Polymyxin B1 lies flat on the surface of the membrane, with the fatty acid tail at the top. Almost all contacts are between LP1 and Polymyxin B1, only very few with LP0 and DPP. In the course of the simulation, phenylalanine residue 6 flips over and starts inserting into the membrane, while the fatty acid chain is located on the top of the molecule (see Figure 12C). Even though phenylalanine residue 6 is moving deeper into the membrane, amino groups of Dab residues still have a lot of interaction with the different phosphate groups of Lipid A. During the course of the simulation, this process is reversed, since phenylalanine-6 is not as deep in the membrane as before (see Figure 12D). For this reason, there is no disruption of the membrane and complete insertion of Polymyxin B1 is not observable during the time course of the simulation. This can also be seen in Figure 13 as the corresponding Polymyxin B1 occupies a spread-out space among the membrane (bottom part of the membrane).
Figure 12.
PAKpmrB6 treated with PMBs: Binding of Polymyxin B1 molecule to Membrane. The PMB selected (cyan stick) for the MD simulation is PMB6. (A–D) indicate the following time points in the simulation: 5 ns, 20 ns, 200 ns and 1020 ns.
Figure 13.
PAKpmrB6 treated with PMBs: Voronoi visualisation of the Binding of Polymyxin B1 molecule to Membrane ((left) starting frame, (right) last frame).
3.2.3. Quantitative Interaction of Polymyxin B1 with Membrane
To determine the stability of interaction between Polymyxin B1 molecules and the membrane, the total number of hydrogen bonds and contacts below a distance of [71,72] (see Table 5) were determined. Both were normalised by the number of lipids in each group. This normalisation ensures comparability across membrane systems regardless of lipid count.
Table 5.
Hydrogen bonds and contacts between Polymyxin B1 and membrane components. The values represent cumulative counts over the entire simulation trajectory, divided by the total number of lipids in each group (phospholipids, Lipid A’s or all lipids).
Hydrogen bond contacts: The number of hydrogen bond interactions per phospholipid is generally much lower than for Lipid A’s (see Table 5). This is expected as Lipid A’s is known to be most important for binding to the outer leaflet of the membrane and accounts for a higher proportion of interactions than the phospholipids. Therefore, the trend for hydrogen bonding is similar for all the interactions and for the interactions with the Lipid A’s. PAK control with PMBs and PAK treated with PMBs have the highest number of hydrogen bonds ( and , respectively) as well as the highest number of hydrogen bonds for Lipid A’s ( and , respectively).
PAKpmrB6 treated with PMBs and PAKpmrB6 control with PMBs have a lower number of total hydrogen bonds (24,701 and 24,007, respectively) and hydrogen bonds with Lipid A’s (111,335 and 110,123, respectively). The membrane compositions of PAKpmrB6 strains have a higher proportion of modified Lipid A’s and fewer Lipid A molecules with dihydrogen phosphate groups. Instead, they have higher levels of Ara4N sugar-modified Lipids A. For this reason, there are fewer hydrogen bonds between polymyxin B1 and Lipid A’s in these simulations, while at the same time there are more interactions with phospholipids (control: 3649, treated: 3887) compared to PAK strain membranes (control: 3392, treated: 1924).
Total number of contacts: In the literature, it has been described that the ionic and hydrophobic interactions between Polymyxin B1 and the membrane are the most relevant interactions [73]. For this reason, all contacts with a distance smaller than 4.5 were determined.
The analysis of the number of contacts shows a similar trend to the analysis of the hydrogen bonds. There are more contacts with phospholipids for PAKpmrB6 strains (control: 202,995, treated: 199,309) than for PAK strains (control: 166,513, treated: 112,706), while there are more contacts with Lipid A’s and in total for PAK strains (control: 5,781,070 and 1,200,395, treated: 6,014,064 and 1,284,081, respectively) than for PAKpmrB6 strains (control: 5,358,367 and 1,177,643, treated: 5,041,350 and 1,148,004, respectively), consistent with modification of Lipid A molecules.
In summary, the analysis of hydrogen bonds and contacts indicates an increased number of interactions between Polymyxin B1 and PAK strain membranes compared to PAKpmrB6 strain membranes. These are exploratory findings consistent with the hypothesis, not statistically confirmed differences. These results support the crucial role of Lipid A’s for interaction with Polymyxin B1 and confirm that the simulation of different membrane compositions aids in understanding the membrane contributions to the resistance phenotype of PAKpmrB6 strains.
4. Conclusions
In this work, we examined four different membrane compositions with and without six Polymyxin B1 molecules interacting with the corresponding membrane. The first membrane system is the outer membrane of the wild type P. aeruginosa, PAK control. The second membrane was based on the lipid composition of the wild type at the experimental end-state after treatment with Polymyxin B1, PAK treated. The third and fourth membrane, PAKpmrB6 control and PAKpmrB6 treated, were based on the polymyxin resistant mutant PAKpmrB6—while the latter again represented the lipid end-state after Polymyxin B1 exposure. We explored these four membranes in detail, and our initial hypothesis was supported on the molecular level. The membrane models remained stable over the simulation, but different membrane compositions and Polymyxin B1 interaction affected the general membrane behaviour.
It was found that the binding of Polymyxin B1 and the composition of the membrane influences the lateral mobility and movement of the membrane. The PAKpmrB6-related outer membranes showed reduced PMB penetration depth and interaction strength, consistent with a membrane-level contribution to the elevated Polymyxin B1 MIC observed in this strain. For PAK control simulation and PAK control with PMBs the membrane is more flexible and as such is more susceptible to Polymyxin B1. We demonstrated that all Polymyxins started to quickly interact with all membrane models. Whereas the Polymyxin B1 starts to insert into the outer membrane like an anchor, it mostly interacts with Lipid A molecules in the non-mutant membranes.
For the PAKpmrB6 strain membranes, the key mechanism at the molecular level is as follows: L-Ara4N substitution of dihydrogen phosphate groups in Lipid A’s reduces the negative surface charge density of the PAKpmrB6 outer membrane. Therefore, the electrostatic attraction of cationic Polymyxin B1 molecules is reduced, leading to an increased interaction with the phospholipids. This results in a flat, surface-associated binding of Polymyxin B1 rather than deep insertion of the N-terminal fatty acid tail into the hydrophobic lipid core of the membrane.
To conclude, it was shown that the simulation of different membrane compositions aids in understanding the membrane-level factors contributing to the resistance mechanism of PAKpmrB6 strains. The eight different membrane systems provide comprehensive and well-documented models for future simulation projects.
Nevertheless, several limitations apply to the presented study. First, each membrane system was simulated as a single trajectory without replicas. Although the trajectory-halving approach can provide an indicator of within-simulation stationarity, it cannot capture variability across different starting configurations or assess statistical convergence. Second, all simulated membrane systems are lipid-only outer membrane systems. While the lipid compositions are based on experimentally determined values—and in this way making them more realistic than those used in comparable studies, they lack outer membrane proteins(OMPs) and LPS sugar chains, which can influence membrane permeability and antibiotic access.OMPs and LPS sugar chains, which can extend several nanometres above the membrane and carry a net negative charge, constitute a significant proportion of the surface area of outer membranes. They probably physically and sterically obstruct Polymyxin B1’s approach to the Lipid A’s headgroup layer, thereby slowing the adsorption kinetics. Therefore, the approach times observed here (<30 ns) are likely faster than in a more realistic biological membrane, and the absolute penetration depths may be overestimated. However, the relative comparisons between PAK and PAKpmrB6 membranes are still valid, since both systems have the same structural approximations. In particular, to take OMPs and LPS into account would require a drastic expansion of the simulation box, the simulated system’s complexity, and the required simulation time. These additional resources were unavailable to this project.
Thirdly, while the simulation timescale of 1000 ns is substantial, it may be insufficient to sample rare events such as the complete transmembrane insertion of PMB1 or leaflet flip-flop. It might be promising to simulate these systems for 10,000 ns to elaborate if a Polymyxin B1 molecule is entering the inner membrane. A recent paper also came to a similar conclusion [40].
Future work should address these limitations by (i) running independent replica simulations on extended time scales, (ii) employing enhanced sampling methods such as umbrella sampling or replica exchange MD to obtain free energy profiles of Polymyxin B1 insertion, (iii) modelling vesicles or vesicle segments based on the membrane compositions to observe the implications of membrane curvature on the corresponding Polymyxin B1-anchoring mechanisms [74], and (iv) incorporating representative outer membrane proteins into membrane models in order to study their effect on the interaction of Polymyxin B1.
Supplementary Materials
The following supporting information can be downloaded at https://www.mdpi.com/article/10.3390/membranes16110365/s1, Figure S1: Structure of phospholipids; Figure S2: Structure of Lipid A and modified Lipid A; Figure S3: Membrane 01 to 04: left—start configuration, right—final configuration (after 1100 ns); Figure S4: Membrane 05 to 08: left—start configuration, right—final configuration (after 1100 ns); Figure S5: Area per lipid in nm2 of bottom membrane leaflets as computed by APL@Voro; Figure S6: Area per lipid in nm2 of top membrane leaflets as computed by APL@Voro; Figure S7: PAK control: Deuterium Order Parameters: Lipid A—top layer; Figure S8: PAK control: Deuterium Order Parameters: Phospholipids—top layer; Figure S9: PAK control: Deuterium Order Parameters: Phospholipids—bottom layer; Figure S10: PAK control w/PMB: Deuterium Order Parameters: Lipid A—top layer; Figure S11: PAK control w/PMB: Deuterium Order Parameters: Phospholipids—top layer; Figure S12: PAK control w/PMB: Deuterium Order Parameters: Phospholipids—bottom l; Figure S13: PAK treated: Deuterium Order Parameters: Lipid A—top layer; Figure S14: PAK treated: Deuterium Order Parameters: Phospholipids—top layer; Figure S15: PAK treated: Deuterium Order Parameters: Phospholipids—bottom layer; Figure S16: PAK treated w/PMB: Deuterium Order Parameters: Lipid A—top layer.; Figure S17: PAK treated w/PMB: Deuterium Order Parameters: Phospholipids—top layer; Figure S18: PAK treated w/PMB: Deuterium Order Parameters: Phospholipids—bottom l; Figure S19: PAKpmrB6 control: Deuterium Order Parameters: Lipid A—top layer; Figure S20: PAKpmrB6 control: Deuterium Order Parameters: Phospholipids—top layer; Figure S21: PAKpmrB6 control: Deuterium Order Parameters: Phospholipids—bottom layer; Figure S22: PAKpmrB6 control w/PMB: Deuterium Order Parameters: Lipid A—top layer; Figure S23: PAKpmrB6 control w/PMB: Deuterium Order P.s: Phospholipids—top l; Figure S24: PAKpmrB6 control w/PMB: Deuterium Order P.s: Phospholipids—bottom l; Figure S25: PAKpmrB6 treated: Deuterium Order Parameters: Lipid A—top layer; Figure S26: PAKpmrB6 treated: Deuterium Order P.s: Phospholipids—top layer; Figure S27: PAKpmrB6 treated: Deuterium Order P.s: Phospholipids—bottom layer; Figure S28: PAKpmrB6 treated w/PMB: Deuterium Order Parameters: Lipid A—top layer; Figure S29: PAKpmrB6 treated w/PMB: Deuterium Order P.s: Phospholipids—top l; Figure S30: PAKpmrB6 treated w/PMB: Deuterium Order P.s: Phospholipids—bottom l; Figure S31: The colour codes used for the lipids in the following images; Figure S32: The colour codes used for the Polymyxins B1 in the following images; Figure S33: PAK control: Mean Squared Displacement: Lipids—top layer; Figure S34: PAK control: Mean Squared Displacement: Lipids—bottom layer; Figure S35: PAK control w/PMBs: Mean Squared Displacement: Lipids—top layer; Figure S36: PAK control w/PMBs: Mean Squared Displacement: Lipids—bottom layer; Figure S37: PAK treated: Mean Squared Displacement: Lipids—top layer; Figure S38: PAK treated: Mean Squared Displacement: Lipids—bottom layer; Figure S39: PAK treated w/PMBs: Mean Squared Displacement: Lipids—top layer; Figure S40: PAK treated w/PMBs: Mean Squared Displacement: Lipids—bottom layer; Figure S41: PAK pmrB6control: Mean Squared Displacement: Lipids—top layer; Figure S42: PAK pmrB6control: Mean Squared Displacement: Lipids—bottom layer; Figure S43: PAK pmrB6control w/PMBs: Mean Squared Displacement: Lipids—top layer; Figure S44: PAK pmrB6control w/PMBs: Mean Squared Displacement: Lipids—bottom layer; Figure S45: PAKpmrB6 treated: Mean Squared Displacement: Lipids—top layer; Figure S46: PAKpmrB6 treated: Mean Squared Displacement: Lipids—bottom layer; Figure S47: PAKpmrB6 treated w/PMBs: Mean Squared Displacement: Lipids—top layer; Figure S48: PAKpmrB6 treated w/PMBs: Mean Squared Displacement: Lipids—bottom layer; Figure S49: PAK control w/PMBs Membrane Penetration; Figure S50: PAK treated w/PMBs Membrane Penetration; Figure S51: PAK pmrB6control w/PMBs Membrane Penetration; Figure S52: PAK pmrB6control treated w/PMBs Membrane Penetration; Table S1: Lipid composition of membranes in percent; Table S2: Lipid composition of membranes in percent; Table S3: Number of lipid molecules in each simulated membrane system; Table S4: Formal charges assigned to key molecules in the MD simulations, based on Santos et al., GROMOS 54A7 force field and ATB parameterisation; Table S5: Summary of MD simulation parameters used in this study; Table S6: Average penetration depth (in Angström) of individual Polymyxin B1 for each simulation; Table S7: Residues of individual Polymyxin B1 molecules penetrating the membrane the deepest in PAK control simulation; Table S8: Residues of individual Polymyxin B1 molecules penetrating the membrane the deepest in PAK treated simulation; Table S9: Residues of individual Polymyxin B1 molecules penetrating the membrane the deepest in PAKpmrB6 control simulation; Table S10: Residues of individual Polymyxin B1 molecules penetrating the membrane the deepest in PAKpmrB6 treated simulation; Section: Original Cm2 MembraneEditor Protocols.
Author Contributions
Conceptualisation, M.-L.H., B.S., Y.Z., F.S. and J.L.; software, M.K., B.S. and S.J.-H.; formal analysis, S.J.-H., M.K. and B.S.; investigation, M.K.; resources, F.S. and J.L.; data curation, S.J.-H., M.K. and H.B.; writing—original draft preparation, S.J.-H., M.K. and B.S.; writing—review and editing, M.-L.H., Y.Z. and F.S.; visualisation, S.J.-H., M.K. and B.S.; supervision, X.J., F.S. and J.L.; project administration, S.J.-H. and B.S.; funding acquisition, B.S., Y.Z., F.S. and J.L. All authors have read and agreed to the published version of the manuscript.
Funding
This work was supported by the Deutsche Forschungsgemeinschaft (DFG, German Research Foundation)—Project-ID 251654672—TRR 161. B.S. and Y.Z. would like to thank Monash University for supporting this work with a Microbiology@Monash Collaborative Grant 2016. B.S. and F.S. would like to thank the DAAD for supporting this work with the DAAD German/Australian Collaboration Project 57390446 (Programm Projektbezogener Personenaustausch Australien 2018). Y.Z. and J.L. thank the support of Australia-Germany Joint Research Co-operation Scheme 57390446.
Institutional Review Board Statement
Not applicable.
Informed Consent Statement
Not applicable.
Data Availability Statement
The following data are available free of charge: Topologies of Lipid A’s, Polymyxin B1 and Phospholipids used for setting up the MD simulations (ITP/TOP file format, 48.9 kB size), structural files and trajectory files of all eight MD Simulations (XTC/PDB file format, 149.5 GB size) are available in the Zenodo [75] repository: https://doi.org/10.5281/zenodo.22671060 [53].
Acknowledgments
The authors acknowledge support by the High Performance and Cloud Computing Group at the Zentrum für Datenverarbeitung of the University of Tübingen, the state of Baden-Württemberg through bwHPC and the German Research Foundation (DFG) through grant no INST 37/935-1 FUGG. Special thanks to Jens Krüger for his support during setting up the cluster environment for our purposes. The authors thank the Konstanz Research School of Chemical Biology (KoRS-CB).
Conflicts of Interest
The authors declare no conflicts of interest.
References
- Scales, B.S.; Dickson, R.P.; LiPuma, J.J.; Huffnagle, G.B. Microbiology, Genomics, and Clinical Significance of the Pseudomonas Fluorescens Species Complex, an Unappreciated Colonizer of Humans. Clin. Microbiol. Rev. 2014, 27, 927–948. [Google Scholar] [CrossRef] [Scilit]
- Breidenstein, E.B.; de la Fuente-Núñez, C.; Hancock, R.E. Pseudomonas aeruginosa: All Roads lead to Resistance. Trends Microbiol. 2011, 19, 419–426. [Google Scholar] [CrossRef] [Scilit]
- Liu, Y.Y.; Wang, Y.; Walsh, T.R.; Yi, L.X.; Zhang, R.; Spencer, J.; Doi, Y.; Tian, G.; Dong, B.; Huang, X.; et al. Emergence of Plasmid-Mediated Colistin Resistance Mechanism MCR-1 in Animals and Human Beings in China: A Microbiological and Molecular Biological Study. Lancet Infect. Dis. 2016, 16, 161–168. [Google Scholar] [CrossRef] [Scilit]
- Winstanley, C.; O’Brien, S.; Brockhurst, M.A. Pseudomonas aeruginosa Evolutionary Adaptation and Diversification in Cystic Fibrosis Chronic Lung Infections. Trends Microbiol. 2016, 24, 327–337. [Google Scholar] [CrossRef] [Scilit]
- de Almeida, K.d.C.F.; Calomino, M.A.; Deutsch, G.; de Castilho, S.R.; de Paula, G.R.; Esper, L.M.R.; Teixeira, L.A. Molecular Characterization of Multidrug-Resistant (MDR) Pseudomonas aeruginosa Isolated in a Burn Center. Burns 2017, 43, 137–143. [Google Scholar] [CrossRef] [Scilit]
- Church, D.; Elsayed, S.; Reid, O.; Winston, B.; Lindsay, R. Burn Wound Infections. Clin. Microbiol. Rev. 2006, 19, 403–434. [Google Scholar] [CrossRef] [Scilit]
- Nation, R.L.; Li, J.; Cars, O.; Couet, W.; Dudley, M.N.; Kaye, K.S.; Mouton, J.W.; Paterson, D.L.; Tam, V.H.; Theuretzbacher, U.; et al. Framework for Optimisation of the Clinical Use of Colistin and Polymyxin B: The Prato Polymyxin Consensus. Lancet Infect. Dis. 2015, 15, 225–234. [Google Scholar] [CrossRef] [Scilit]
- Pedersen, M.; Jensen-Fangel, S.; Olesen, H.; Nørskov-Lauritsen, N.; Wang, M. 129 Colistin Resistance in Achromobacter sp. and Pseudomonas aeruginosa Isolated from Danish Cystic Fibrosis Patients is not Related to Plasmid-Mediated Expression of Mcr-1. J. Cyst. Fibros. 2017, 1, S98. [Google Scholar] [CrossRef] [Scilit]
- Wi, Y.M.; Choi, J.Y.; Lee, J.Y.; Kang, C.I.; Chung, D.R.; Peck, K.R.; Song, J.H.; Ko, K.S. Emergence of Colistin Resistance in Pseudomonas aeruginosa ST235 Clone in South Korea. Int. J. Antimicrob. Agents 2017, 49, 767–769. [Google Scholar] [CrossRef] [Scilit]
- Elfadadny, A.; Ragab, R.F.; AlHarbi, M.; Badshah, F.; Ibáñez-Arancibia, E.; Farag, A.; Hendawy, A.O.; De los Ríos-Escalante, P.R.; Aboubakr, M.; Zakai, S.A.; et al. Antimicrobial resistance of Pseudomonas aeruginosa: Navigating clinical impacts, current resistance trends, and innovations in breaking therapies. Front. Microbiol. 2024, 15, 1374466. [Google Scholar] [CrossRef] [Scilit]
- Erdem, H.; Yilmaz-Tehli, G. Colistin Resistance: From Laboratory Research to Modern Clinical Management. Antibiotics 2026, 15, 259. [Google Scholar] [CrossRef] [Scilit]
- Yu, Z.; Qin, W.; Lin, J.; Fang, S.; Qiu, J. Antibacterial Mechanisms of Polymyxin and Bacterial Resistance. BioMed Res. Int. 2015, 2015, 679109. [Google Scholar] [CrossRef] [Scilit]
- Trimble, M.J.; Mlynárčik, P.; Kolář, M.; Hancock, R.E. Polymyxin: Alternative Mechanisms of Action and Resistance. Cold Spring Harb. Perspect. Med. 2016, 6, a025288. [Google Scholar] [CrossRef] [Scilit]
- Han, M.L.; Velkov, T.; Zhu, Y.; Roberts, K.D.; Le Brun, A.P.; Chow, S.H.; Gutu, A.D.; Moskowitz, S.M.; Shen, H.H.; Li, J. Polymyxin-Induced Lipid A Deacylation in Pseudomonas aeruginosa Perturbs Polymyxin Penetration and Confers High-Level Resistance. ACS Chem. Biol. 2018, 13, 121–130. [Google Scholar] [CrossRef] [Scilit]
- Hussein, M.; Han, M.L.; Zhu, Y.; Zhou, Q.; Lin, Y.W.; Hancock, R.E.; Hoyer, D.; Creek, D.J.; Li, J.; Velkov, T. Metabolomics Study of the Synergistic Killing of Polymyxin B in Combination with Amikacin against Polymyxin-Susceptible and-Resistant Pseudomonas aeruginosa. Antimicrob. Agents Chemother. 2019, 64, e01587-19. [Google Scholar] [CrossRef] [Scilit]
- Klockgether, J.; Cramer, N.; Wiehlmann, L.; Davenport, C.F.; Tümmler, B. Pseudomonas aeruginosa Genomic Structure and Diversity. Front. Microbiol. 2011, 2, 150. [Google Scholar] [CrossRef] [Scilit]
- Ramos, J.L.; Filloux, A. Pseudomonas: Volume 5: A Model System in Biology; Springer Dordrecht: Dordrecht, Netherlands, 2007; Volume 5. [Google Scholar]
- Raetz, C.R.; Reynolds, C.M.; Trent, M.S.; Bishop, R.E. Lipid A Modification Systems in Gram-Negative Bacteria. Annu. Rev. Biochem. 2007, 76, 295–329. [Google Scholar] [CrossRef] [Scilit]
- Zhu, Y.; Czauderna, T.; Zhao, J.; Klapperstueck, M.; Maifiah, M.-L.H.M.; Han, M.L.; Lu, J.; Sommer, B.; Velkov, T.; Lithgow, T.; et al. Genome-Scale Metabolic Modeling of Responses to Polymyxins in Pseudomonas aeruginosa. GigaScience 2018, 7, giy021. [Google Scholar] [CrossRef] [Scilit]
- Velkov, T.; Thompson, P.E.; Nation, R.L.; Li, J. Structure-Activity Relationships of Polymyxin Antibiotics. J. Med. Chem. 2010, 53, 1898–1916. [Google Scholar] [CrossRef] [Scilit]
- Bosch, A.; Minan, A.; Vescina, C.; Degrossi, J.; Gatti, B.; Montanaro, P.; Messina, M.; Franco, M.; Vay, C.; Schmitt, J. Fourier Transform Infrared Spectroscopy for Rapid Identification of Nonfermenting Gram-Negative Bacteria Isolated from Sputum Samples from Cystic Fibrosis Patients. J. Clin. Microbiol. 2008, 46, 2535–2546. [Google Scholar] [CrossRef] [Scilit]
- Arora, A.; Abildgaard, F.; Bushweller, J.H.; Tamm, L.K. Structure of Outer Membrane Protein A Transmembrane Domain by NMR Spectroscopy. Nat. Struct. Biol. 2001, 8, 334–338. [Google Scholar] [CrossRef] [Scilit]
- Jo, H.; Jeong, E.Y.; Jeon, J.; Ban, C. Structural Insights into Escherichia Coli Polymyxin B Resistance Protein D with X-Ray Crystallography and Small-Angle X-Ray Scattering. BMC Struct. Biol. 2014, 14, 24. [Google Scholar] [CrossRef][Green Version]
- Hughes, A.V.; Patel, D.S.; Widmalm, G.; Klauda, J.B.; Clifton, L.A.; Im, W. Physical Properties of Bacterial Outer Membrane Models: Neutron Reflectometry & Molecular Simulation. Biophys. J. 2019, 116, 1095–1104. [Google Scholar] [CrossRef] [Scilit]
- Marrink, S.J.; Corradi, V.; Souza, P.C.; I, I.H.; Tieleman, D.P.; Sansom, M.S. Computational Modeling of Realistic Cell Membranes. Chem. Rev. 2019, 119, 6184–6226. [Google Scholar] [CrossRef] [Scilit]
- Gutishvili, G.; Yang, L.; Gumbart, J.C. Seeing is believing: Illuminating the Gram-negative outer membrane with molecular dynamics simulations. Curr. Opin. Struct. Biol. 2024, 87, 102828. [Google Scholar] [CrossRef] [Scilit]
- Karthigeyan, D.; Siddhanta, S.; Kishore, A.H.; Perumal, S.S.; Agren, H.; Sudevan, S.; Bhat, A.V.; Balasubramanyam, K.; Subbegowda, R.K.; Kundu, T.K. SERS and MD Simulation Studies of a Kinase Inhibitor Demonstrate the Emergence of a Potential Drug Discovery Tool. Proc. Natl. Acad. Sci. USA 2014, 111, 10416–10421. [Google Scholar] [CrossRef] [Scilit]
- Suomivuori, C.M.; Latorraca, N.R.; Wingler, L.M.; Eismann, S.; King, M.C.; Kleinhenz, A.L.W.; Skiba, M.A.; Staus, D.P.; Kruse, A.C.; Lefkowitz, R.J.; et al. Molecular Mechanism of Biased Signaling in a Prototypical G Protein-Coupled Receptor. Science 2020, 367, 881–887. [Google Scholar] [CrossRef] [Scilit]
- Li, A.; Schertzer, J.W.; Yong, X. Molecular Dynamics Modeling of Pseudomonas aeruginosa Outer Membranes. Phys. Chem. Chem. Phys. 2018, 20, 23635–23648. [Google Scholar] [CrossRef] [Scilit]
- López, C.A.; Zgurskaya, H.; Gnanakaran, S. Molecular Characterization of the Outer Membrane of Pseudomonas aeruginosa. Biochim. Biophys. Acta Biomembr. 2020, 1862, 183151. [Google Scholar] [CrossRef] [Scilit]
- Santos, D.E.S.; Pol-Fachin, L.; Lins, R.D.; Soares, T.A. Polymyxin Binding to the Bacterial Outer Membrane Reveals Cation Displacement and Increasing Membrane Curvature in Susceptible but Not in Resistant Lipopolysaccharide Chemotypes. J. Chem. Inf. Model. 2017, 57, 2181–2193. [Google Scholar] [CrossRef] [Scilit]
- Jiang, X.; Patil, N.A.; Azad, M.A.K.; Wickremasinghe, H.; Yu, H.; Zhao, J.; Zhang, X.; Li, M.; Gong, B.; Wan, L.; et al. A Novel Chemical Biology and Computational Approach to Expedite the Discovery of New-Generation Polymyxins against Life-Threatening Acinetobacter Baumannii. Chem. Sci. 2021, 12, 12211–12220. [Google Scholar] [CrossRef] [Scilit]
- Jiang, X.; Sun, Y.; Yang, K.; Yuan, B.; Velkov, T.; Wang, L.; Li, J. Coarse-grained simulations uncover Gram-negative bacterial defense against polymyxins by the outer membrane. Comput. Struct. Biotechnol. J. 2021, 19, 3885–3891. [Google Scholar] [CrossRef] [Scilit]
- Sun, Y.; Deng, Z.; Jiang, X.; Yuan, B.; Yang, K. Interactions between polymyxin B and various bacterial membrane mimics: A molecular dynamics study. Colloids Surf. B 2022, 211, 112288. [Google Scholar] [CrossRef] [Scilit]
- Fu, L.; Li, X.; Zhang, S.; Dong, Y.; Fang, W.; Gao, L. Polymyxins induce lipid scrambling and disrupt the homeostasis of Gram-negative bacteria membrane. Biophys. J. 2022, 121, 3486–3498. [Google Scholar] [CrossRef] [Scilit]
- Jiang, X.; Yang, K.; Yuan, B.; Han, M.; Zhu, Y.; Roberts, K.D.; Patil, N.A.; Li, J.; Gong, B.; Hancock, R.E.W.; et al. Molecular Dynamics Simulations Informed by Membrane Lipidomics Reveal the Structure–Interaction Relationship of Polymyxins with the Lipid A-Based Outer Membrane of Acinetobacter Baumannii. J. Antimicrob. Chemother. 2020, 75, 3534–3543. [Google Scholar] [CrossRef] [Scilit]
- Jiang, X.; Yang, K.; Han, M.L.; Yuan, B.; Li, J.; Gong, B.; Velkov, T.; Schreiber, F.; Wang, L.; Li, J. Outer Membranes of Polymyxin-Resistant Acinetobacter baumannii with Phosphoethanolamine-Modified Lipid A and Lipopolysaccharide Loss Display Different Atomic-Scale Interactions with Polymyxins. ACS Infect. Dis. 2020, 6, 2698–2708. [Google Scholar] [CrossRef] [Scilit]
- Ma, W.; Jiang, X.; Mu, K.; Tian, S.; Yu, H.H.; Wickremasinghe, H.; Velkov, T.; Roberts, K.D.; Patil, N.A.; Li, J. Structure–Activity Relationship of the Diaminobutyric Acid Residues in Polymyxins. JACS Au 2025, 5, 4714–4727. [Google Scholar] [CrossRef] [Scilit]
- Prakaash, D.; Khalid, S. Polymyxins slow down lateral diffusion of proteins and lipopolysaccharide in the E. coli outer membrane. Commun. Biol. 2025, 8, 1751. [Google Scholar] [CrossRef] [Scilit]
- Cutarella, L.; Temprano, A.G.; Tafi, A.; Mori, M. Protonation State-dependent Interaction of Polycationic Polymyxins with the Pseudomonas aeruginosa Outer Membrane Using Colistin A as a Model. J. Chem. Inf. Mod. 2026, 66, 2857–2870. [Google Scholar] [CrossRef] [Scilit]
- Han, M.L.; Zhu, Y.; Creek, D.J.; Lin, Y.W.; Anderson, D.; Shen, H.H.; Tsuji, B.; Gutu, A.D.; Moskowitz, S.M.; Velkov, T.; et al. Alterations of Metabolic and Lipid Profiles in Polymyxin-Resistant Pseudomonas aeruginosa. Antimicrob. Agents Chemother. 2018, 62, 10–1128. [Google Scholar] [CrossRef] [Scilit]
- Sommer, B.; Dingersen, T.; Gamroth, C.; Schneider, S.E.; Rubert, S.; Krüger, J.; Dietz, K.J. CELLmicrocosmos 2.2 MembraneEditor: A Modular Interactive Shape-Based Software Approach to Solve Heterogeneous Membrane Packing Problems. J. Chem. Inf. Model. 2011, 5, 1165–1182. [Google Scholar] [CrossRef] [Scilit]
- Bernstein, F.C.; Koetzle, T.F.; Williams, G.J.; Meyer, E.F.; Brice, M.D.; Rodgers, J.R.; Kennard, O.; Shimanouchi, T.; Tasumi, M. The Protein Data Bank: A Computer-Based Archival File for Macromolecular Structures. J. Mol. Biol. 1977, 112, 535–542. [Google Scholar] [CrossRef] [Scilit]
- Pettersen, E.F.; Goddard, T.D.; Huang, C.C.; Couch, G.S.; Greenblatt, D.M.; Meng, E.C.; Ferrin, T.E. UCSF Chimera—A visualization system for exploratory research and analysis. J. Comput. Chem. 2004, 25, 1605–1612. [Google Scholar] [CrossRef] [Scilit]
- Bekker, H.; Berendsen, H.; Dijkstra, E.; Achterop, S.; Vondrumen, R.; Vanderspoel, D.; Sijbers, A.; Keegstra, H.; Renardus, M. GROMACS—A Parallel Computer for Molecular-Dynamics Simulation. In Proceedings of the PHYSICS COMPUTING ’92; DeGroot, R., Nadrchal, J., Eds.; World Scientific Publishing: Singapore, 1993; pp. 252–256. [Google Scholar]
- Abraham, M.J.; Murtola, T.; Schulz, R.; Páll, S.; Smith, J.C.; Hess, B.; Lindahl, E. GROMACS: High Performance Molecular Simulations through Multi-Level Parallelism from Laptops to Supercomputers. SoftwareX 2015, 1, 19–25. [Google Scholar] [CrossRef] [Scilit]
- Lindahl; Abraham; Hess; van der Spoel. GROMACS 2021.2 Manual; GROMACS Development Team: Uppsala, Sweden, 2021. [Google Scholar] [CrossRef]
- Humphrey, W.; Dalke, A.; Schulten, K. VMD—Visual Molecular Dynamics. J. Mol. Graph. 14, 33–38. [Google Scholar] [CrossRef] [Scilit]
- Pontes, F.J.S.; Rusu, V.H.; Soares, T.A.; Lins, R.D. The Effect of Temperature, Cations, and Number of Acyl Chains on the Lamellar to Non-Lamellar Transition in Lipid-A Membranes: A Microscopic View. J. Chem. Theory Comput. 2012, 8, 3830–3838. [Google Scholar] [CrossRef] [Scilit]
- Hanwell, M.D.; Curtis, D.E.; Lonie, D.C.; Vandermeersch, T.; Zurek, E.; Hutchison, G.R. Avogadro: An Advanced Semantic Chemical Editor, Visualization, and Analysis Platform. J. Cheminf. 2012, 4, 17. [Google Scholar] [CrossRef] [Scilit]
- Malde, A.K.; Zuo, L.; Breeze, M.; Stroet, M.; Poger, D.; Nair, P.C.; Oostenbrink, C.; Mark, A.E. An Automated Force Field Topology Builder (ATB) and Repository: Version 1.0. J. Chem. Theory Comput. 2011, 7, 4026–4037. [Google Scholar] [CrossRef] [Scilit]
- Huang, W.; Lin, Z.; van Gunsteren, W.F. Validation of the GROMOS 54A7 Force Field with Respect to β-Peptide Folding. J. Chem. Theory Comput. 2011, 7, 1237–1243. [Google Scholar] [CrossRef] [Scilit]
- Jaeger-Honz, S.; Sommer, B.; Kern, M.; Borlinghaus, H.; Han, M.L.; Zhu, Y.; Jiang, X.; Li, J.; Schreiber, F. Molecular Dynamics Simulations of four Pseudomonas aeruginosa membranes with and without Polymyxin B1; Zenodo: Geneve, Switzerland, 2026. [Google Scholar] [CrossRef]
- Berendsen, H.J.C.; Postma, J.P.M.; Van Gunsteren, W.F.; Hermans, J. Interaction Models for Water in Relation to Protein Hydration. In Intermolecular Forces; Pullman, B., Ed.; The Jerusalem Symposia on Quantum Chemistry and Biochemistry; Springer: Dordrecht, The Netherlands, 1981; Volume 14, pp. 331–342. [Google Scholar] [CrossRef] [Scilit]
- Páll, S.; Hess, B. A Flexible Algorithm for Calculating Pair Interactions on SIMD Architectures. Comput. Phys. Commun. 2013, 184, 2641–2650. [Google Scholar] [CrossRef] [Scilit]
- Hess, B.; Bekker, H.; Berendsen, H.J.C.; Fraaije, J.G.E.M. LINCS: A Linear Constraint Solver for Molecular Simulations. J. Comput. Chem. 1997, 18, 1463–1472. [Google Scholar] [CrossRef]
- Bussi, G.; Donadio, D.; Parrinello, M. Canonical Sampling through Velocity Rescaling. J. Chem. Phys. 2007, 126, 014101. [Google Scholar] [CrossRef] [Scilit]
- Berendsen, H.J.C.; Postma, J.P.M.; van Gunsteren, W.F.; DiNola, A.; Haak, J.R. Molecular Dynamics with Coupling to an External Bath. J. Chem. Phys. 1984, 81, 3684–3690. [Google Scholar] [CrossRef] [Scilit]
- Buchoux, S. FATSLiM: A Fast and Robust Software to Analyze MD Simulations of Membranes. Bioinformatics 2016, 33, 133–134. [Google Scholar] [CrossRef] [Scilit]
- Gapsys, V.; de Groot, B.L.; Briones, R. Computational Analysis of Local Membrane Properties. J. Comput. Aided. Mol. Des. 2013, 27, 845–858. [Google Scholar] [CrossRef] [Scilit]
- DeLano, W.L. The PyMOL Molecular Graphics System; Version 0.99; DeLano Scientific LLC: Palo Alto, CA, USA, 2006. [Google Scholar]
- Lukat, G.; Krüger, J.; Sommer, B. APL@Voro: A Voronoi-Based Membrane Analysis Tool for GROMACS Trajectories. J. Chem. Inf. Model. 2013, 53, 2908–2925. [Google Scholar] [CrossRef] [Scilit]
- Kern, M.; Jaeger-Honz, S.; Schreiber, F.; Sommer, B. APL@voro—Interactive visualization and analysis of cell membrane simulations. Bioinformatics 2023, 39, btad083. [Google Scholar] [CrossRef] [Scilit]
- Green-Armytage, P. A Colour Alphabet and the Limits of Colour Coding. JAIC 2010, 5, 1–23. [Google Scholar]
- Schmid, N.; Eichenberger, A.P.; Choutko, A.; Riniker, S.; Winger, M.; Mark, A.E.; van Gunsteren, W.F. Definition and Testing of the GROMOS Force-Field Versions 54A7 and 54B7. Eur. Biophys. J. 2011, 40, 843–856. [Google Scholar] [CrossRef] [Scilit]
- Kirschner, K.N.; Lins, R.D.; Maass, A.; Soares, T.A. A Glycam-Based Force Field for Simulations of Lipopolysaccharide Membranes: Parametrization and Validation. J. Chem. Theory Comput. 2012, 8, 4719–4731. [Google Scholar] [CrossRef] [Scilit]
- Levkowitz, H. Color Theory and Modeling for Computer Graphics, Visualization, and Multimedia Applications; Springer: New York, NY, USA, 1997. [Google Scholar] [CrossRef] [Scilit]
- Moradi, S.; Nowroozi, A.; Shahlaei, M. Shedding Light on the Structural Properties of Lipid Bilayers using Molecular Dynamics Simulation: A Review Study. RSC Adv. 2019, 9, 4644–4658. [Google Scholar] [CrossRef] [Scilit]
- Berglund, N.A.; Piggot, T.J.; Jefferies, D.; Sessions, R.B.; Bond, P.J.; Khalid, S. Interaction of the Antimicrobial Peptide Polymyxin B1 with Both Membranes of E. coli: A Molecular Dynamics Study. PLoS Comput. Biol. 2015, 11, e1004180. [Google Scholar] [CrossRef] [Scilit]
- Wei, T.; Huang, T.; Qiao, B.; Zhang, M.; Ma, H.; Zhang, L. Structures, Dynamics, and Water Permeation Free Energy across Bilayers of Lipid A and Its Analog Studied with Molecular Dynamics Simulation. J. Phys. Chem. B. 2014, 118, 13202–13209. [Google Scholar] [CrossRef] [Scilit]
- Heringa, J.; Argos, P. Side-Chain Clusters in Protein Structures and their Role in Protein Folding. J. Mol. Biol. 1991, 220, 151–171. [Google Scholar] [CrossRef] [Scilit]
- da Silveira, C.H.; Pires, D.E.V.; Minardi, R.C.; Ribeiro, C.; Veloso, C.J.M.; Lopes, J.C.D.; Meira, W., Jr.; Neshich, G.; Ramos, C.H.I.; Habesch, R.; et al. Protein Cutoff Scanning: A Comparative Analysis of Cutoff Dependent and Cutoff Free Methods for Prospecting Contacts in Proteins. Proteins Struct. Funct. Bioinf. 2009, 74, 727–743. [Google Scholar] [CrossRef] [Scilit]
- Ayoub Moubareck, C. Polymyxins and Bacterial Membranes: A Review of Antibacterial Activity and Mechanisms of Resistance. Membranes 2020, 10, 181. [Google Scholar] [CrossRef] [Scilit]
- Giuliari, B.; Kösters, M.; Zhou, J.; Dingersen, T.; Heissmann, A.; Rotzoll, R.; Krüger, J.; Giorgetti, A.; Sommer, B. The Vesicle Builder—A Membrane Packing Algorithm for the CELLmicrocosmos MembraneEditor. In Proceedings of the Workshop on Molecular Graphics and Visual Analysis of Molecular Data; Byška, J., Krone, M., Sommer, B., Eds.; The Eurographics Association: Eindhoven, The Netherlands, 2020. [Google Scholar] [CrossRef]
- European Organization for Nuclear Research. OpenAIRE. Zenodo. 2013. Available online: https://zenodo.org/ (accessed on 20 October 2026).
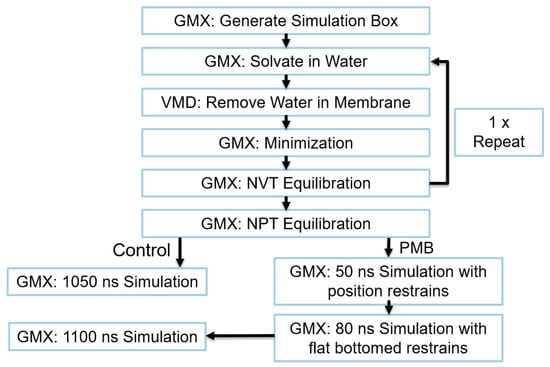
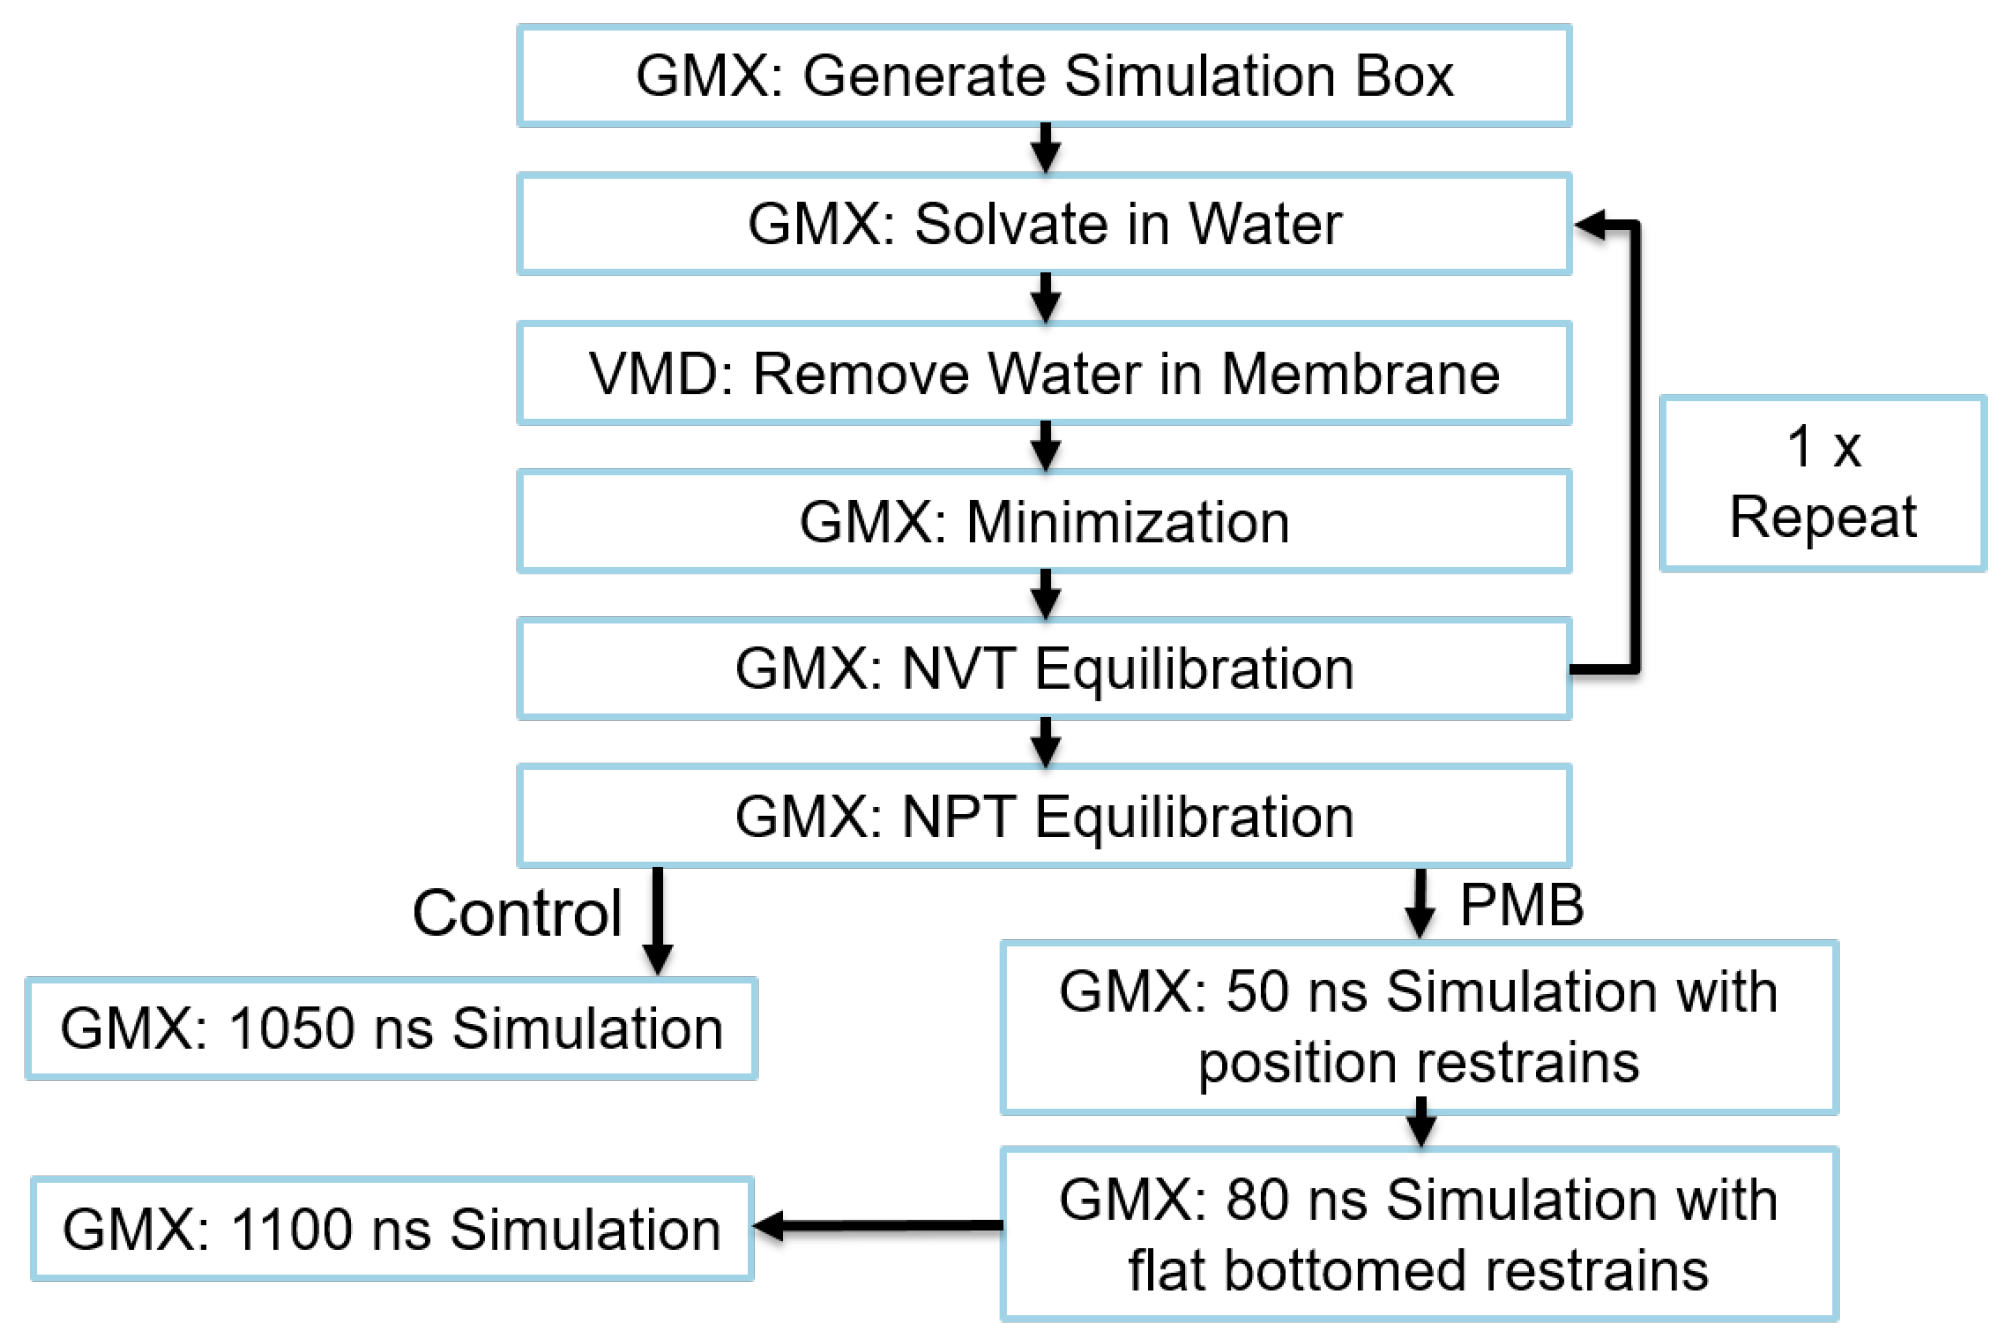
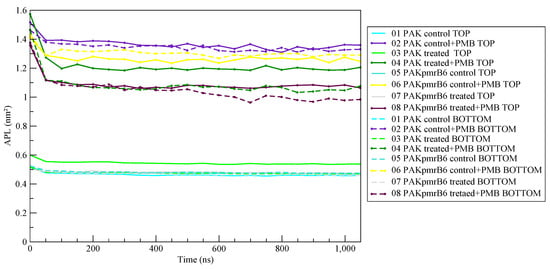
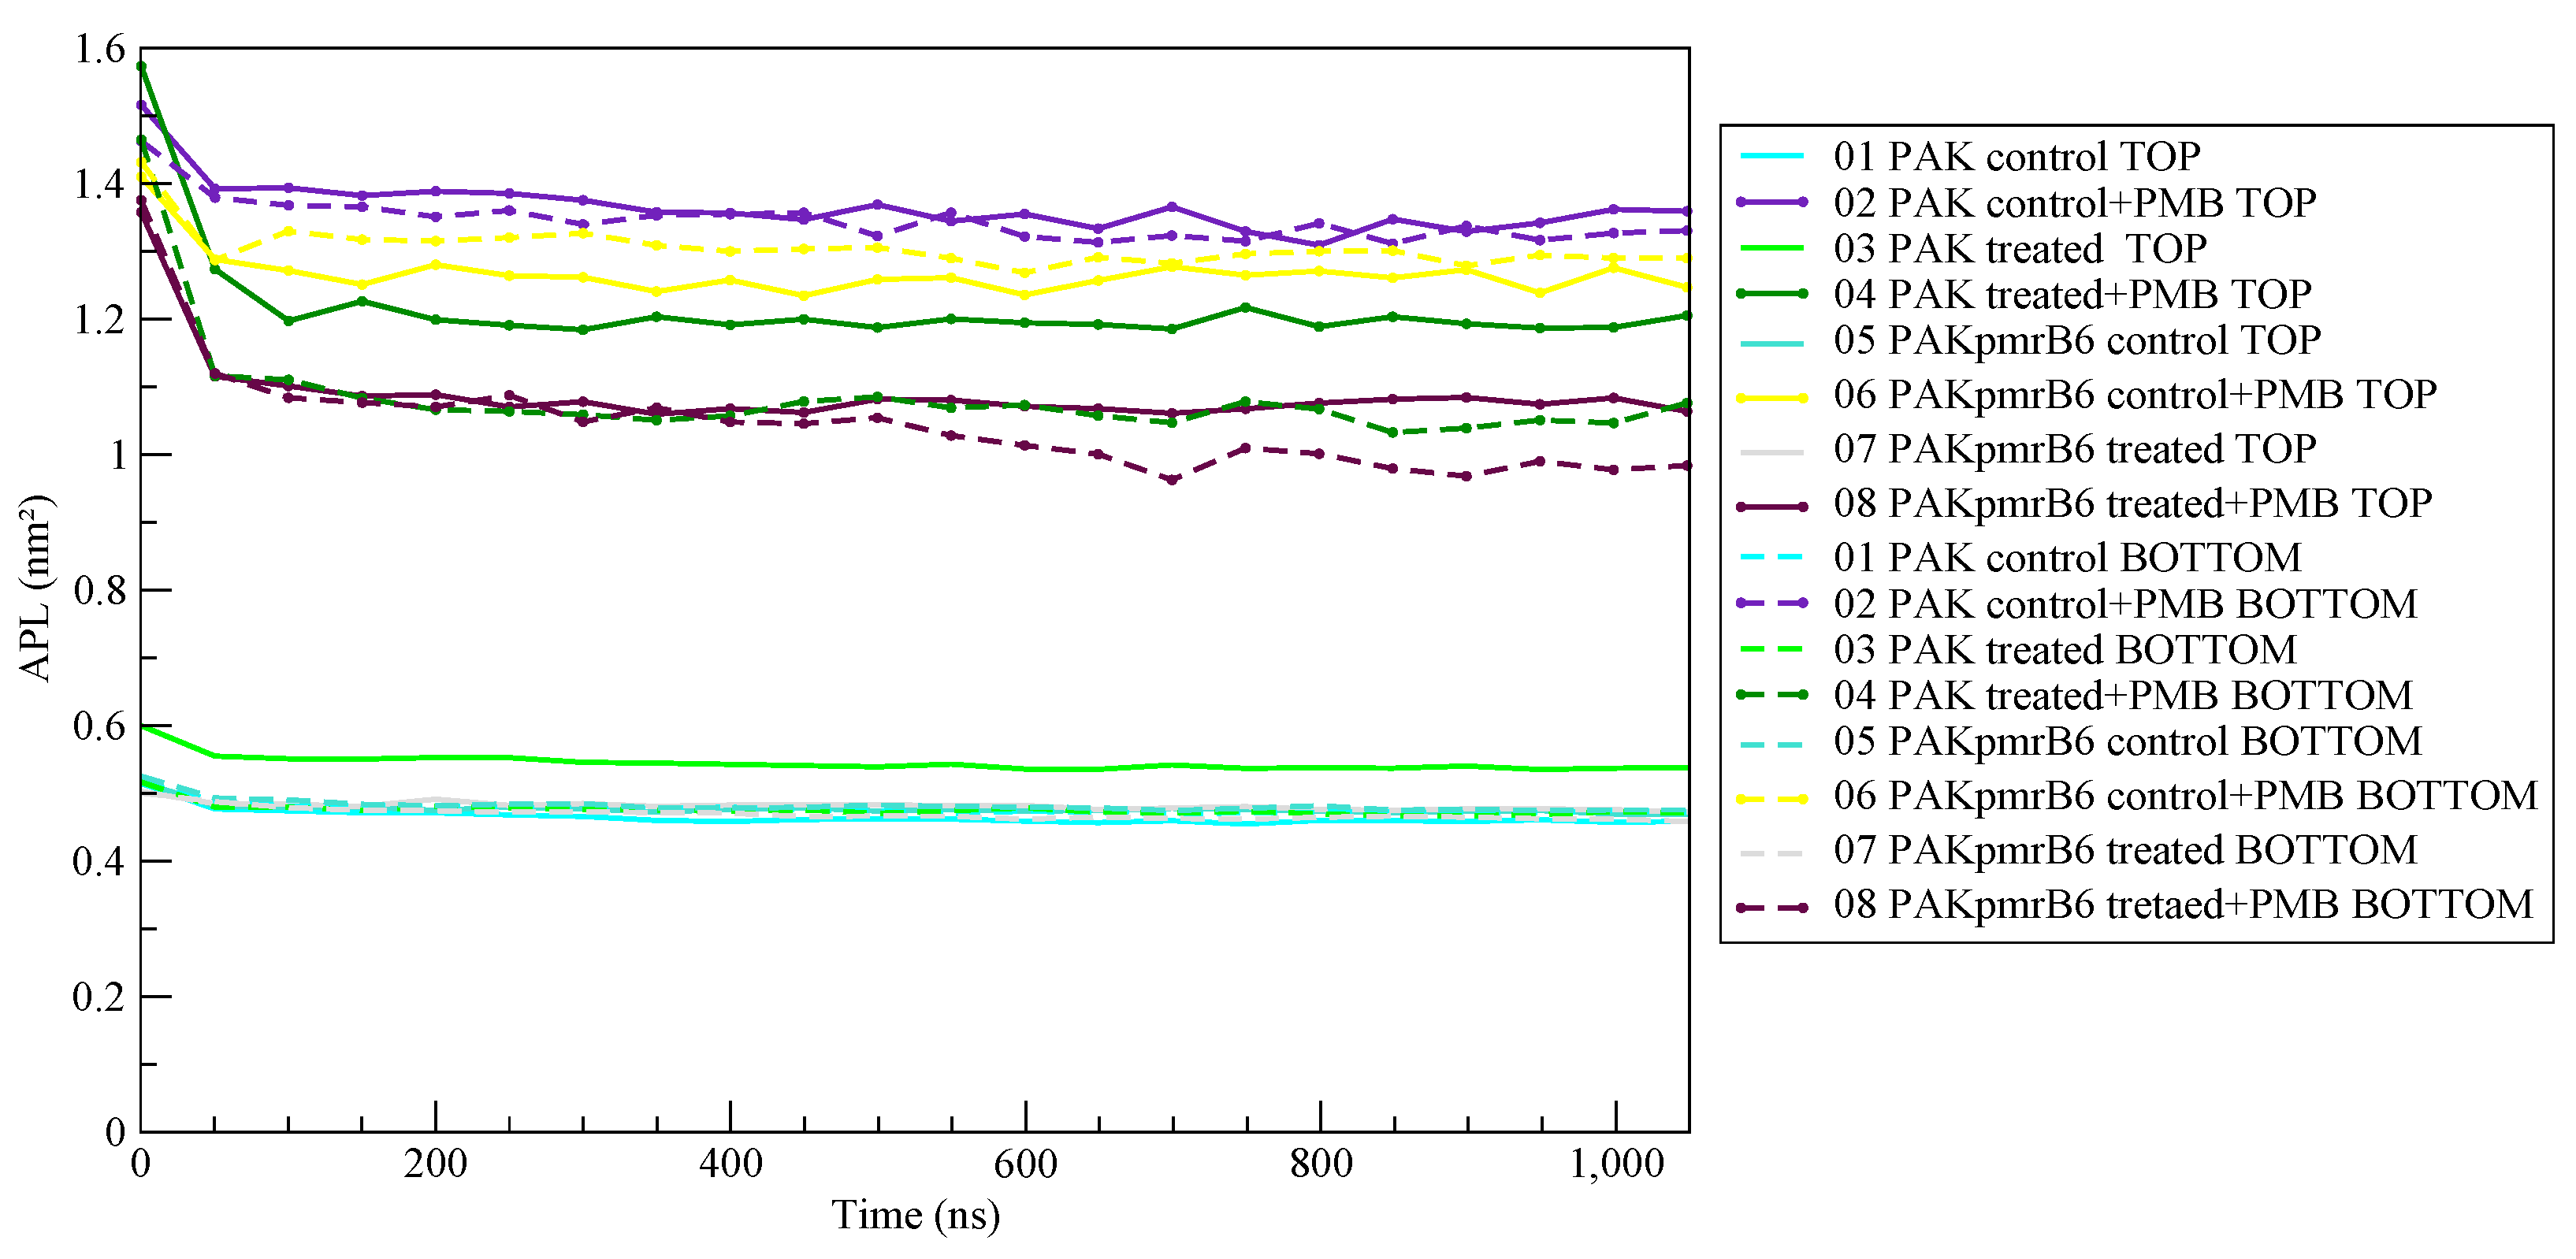
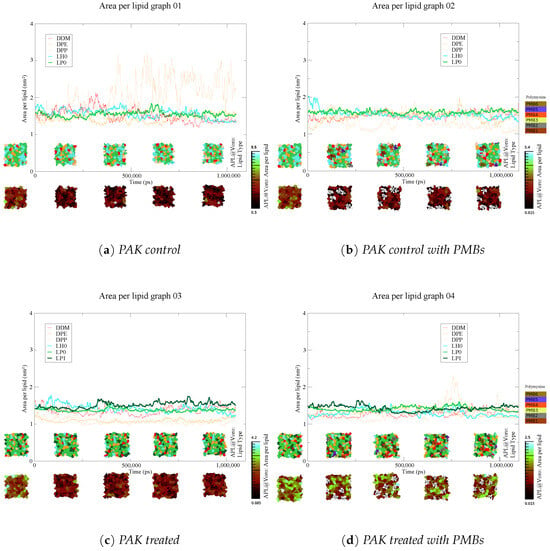
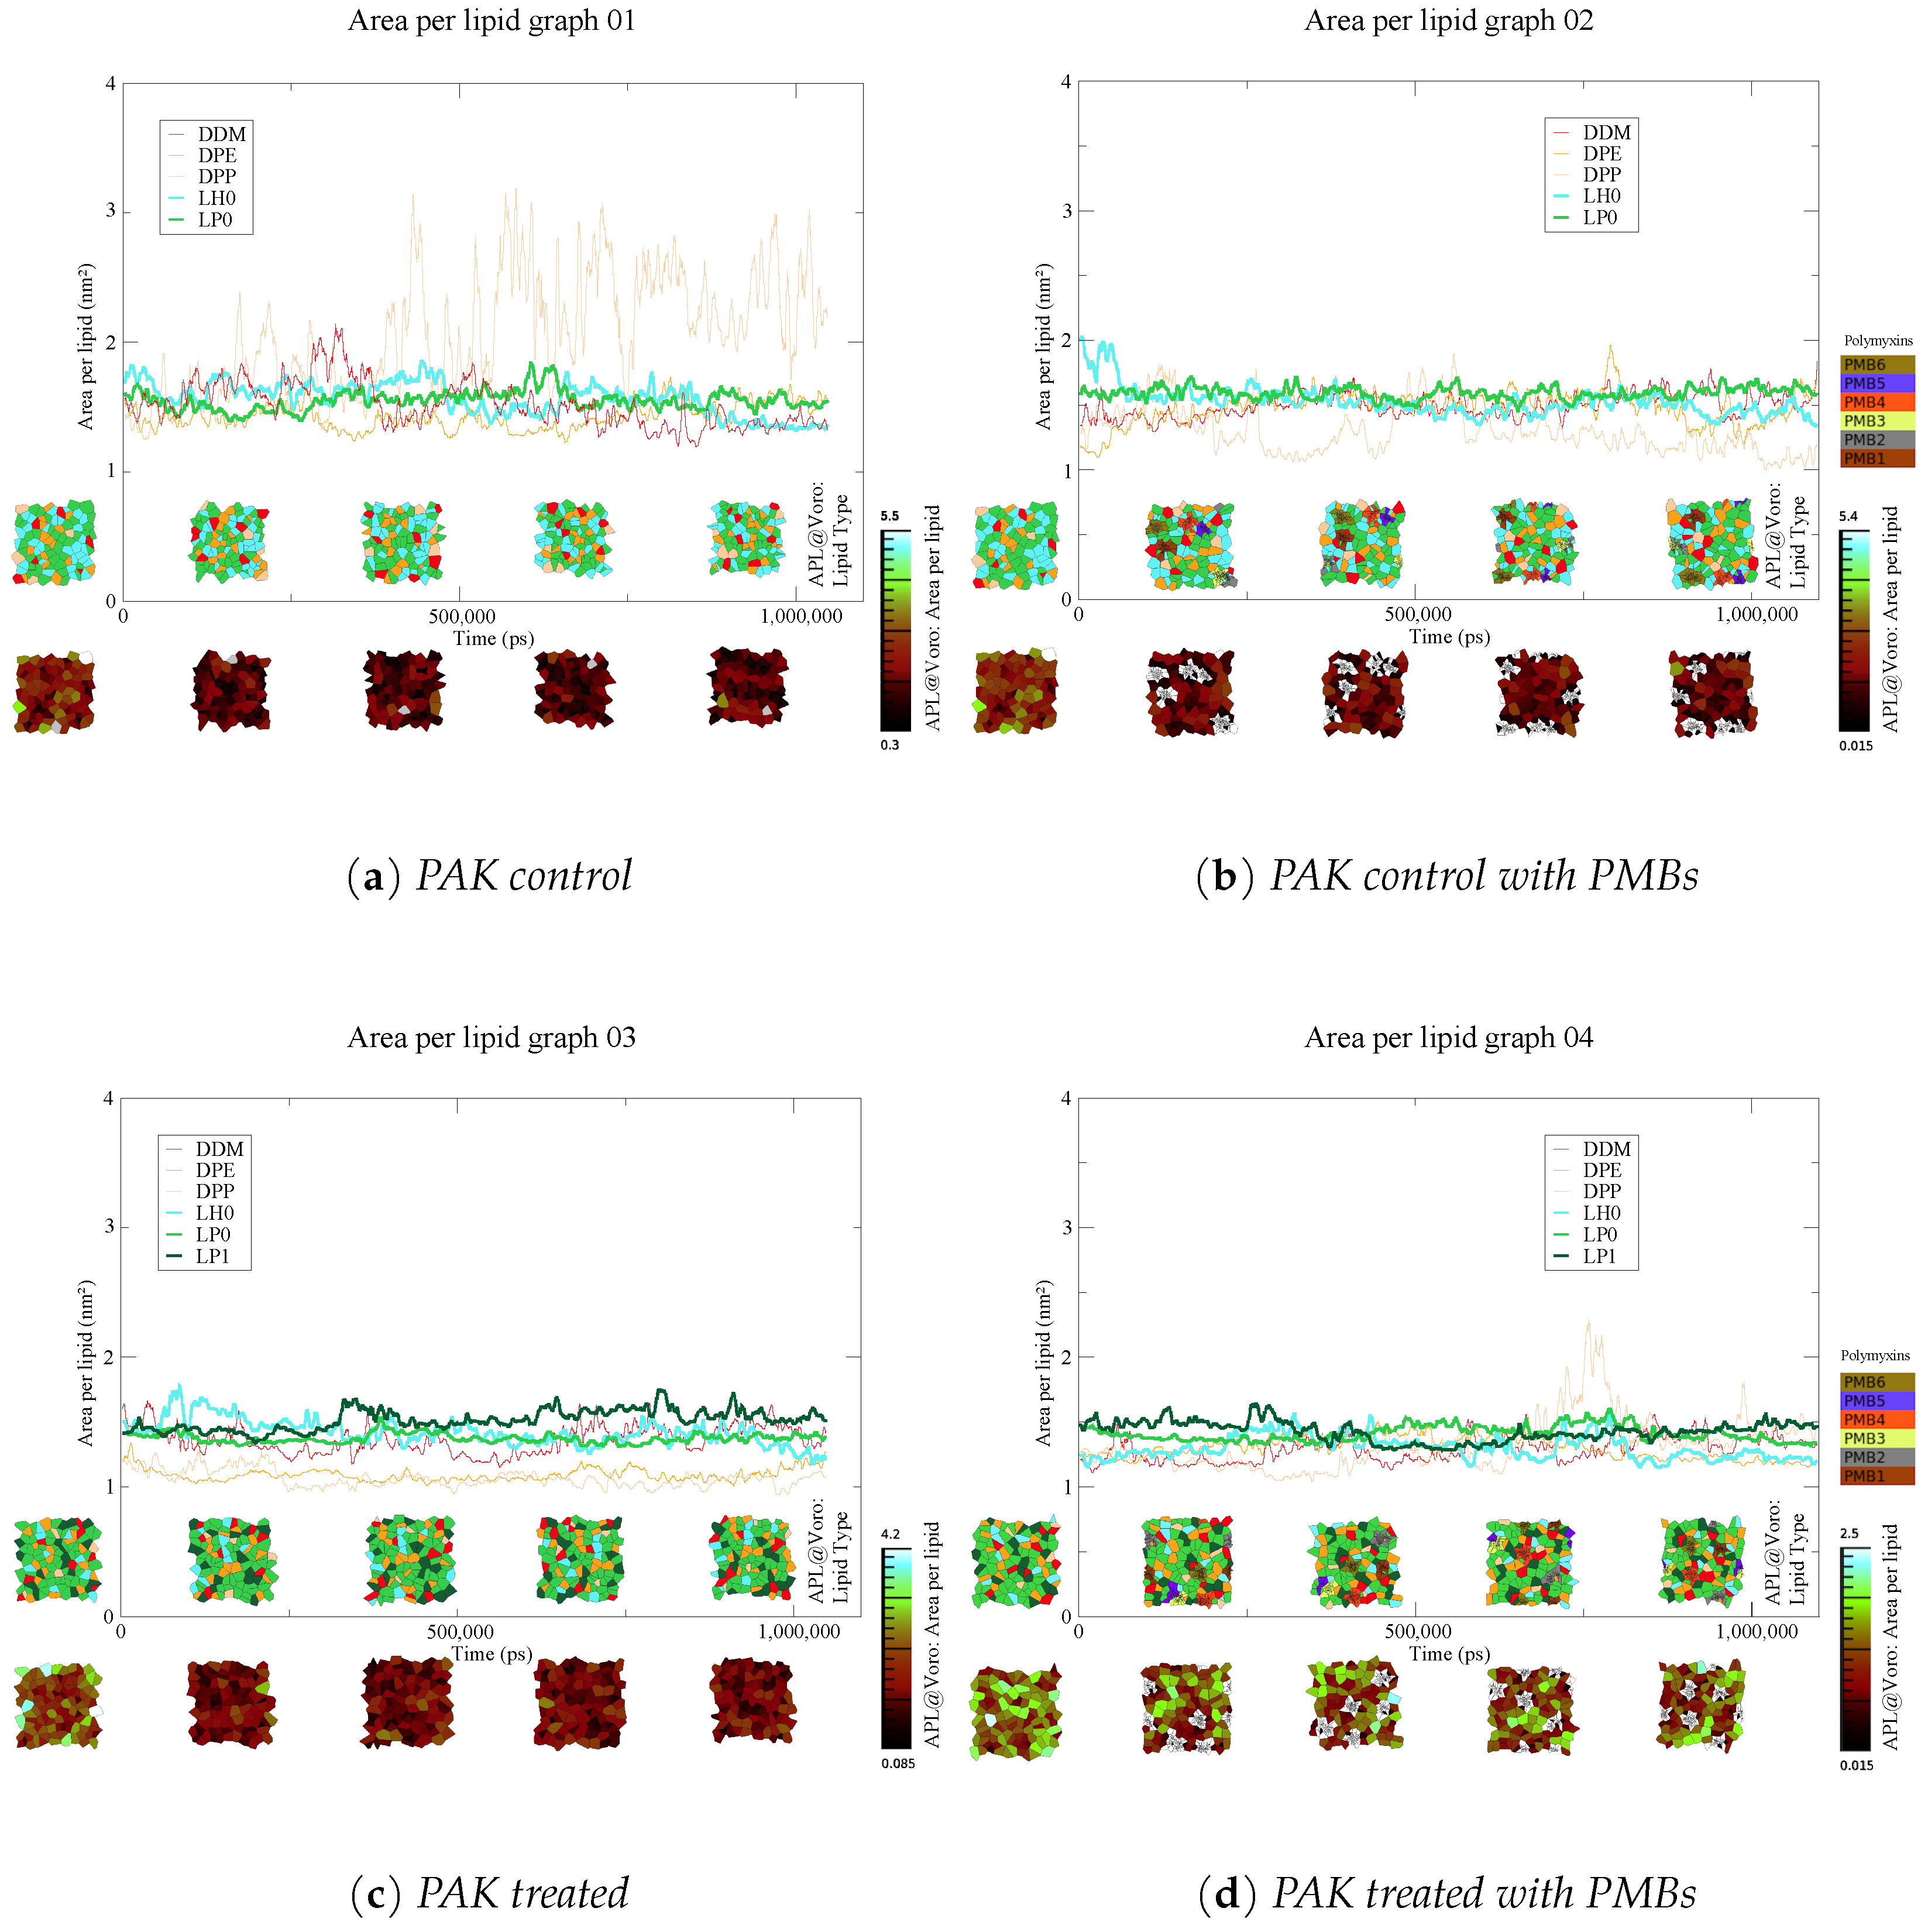
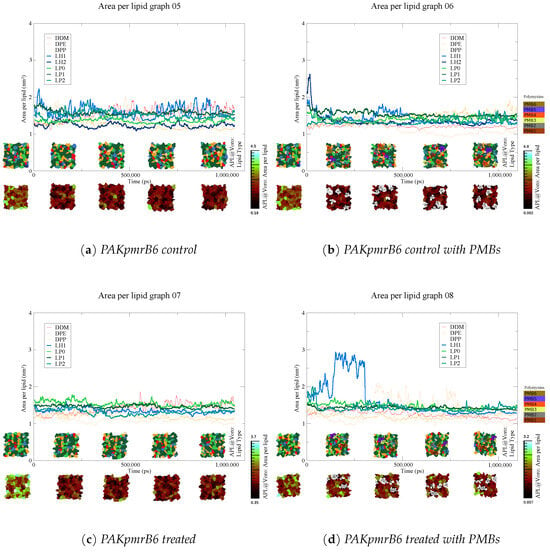
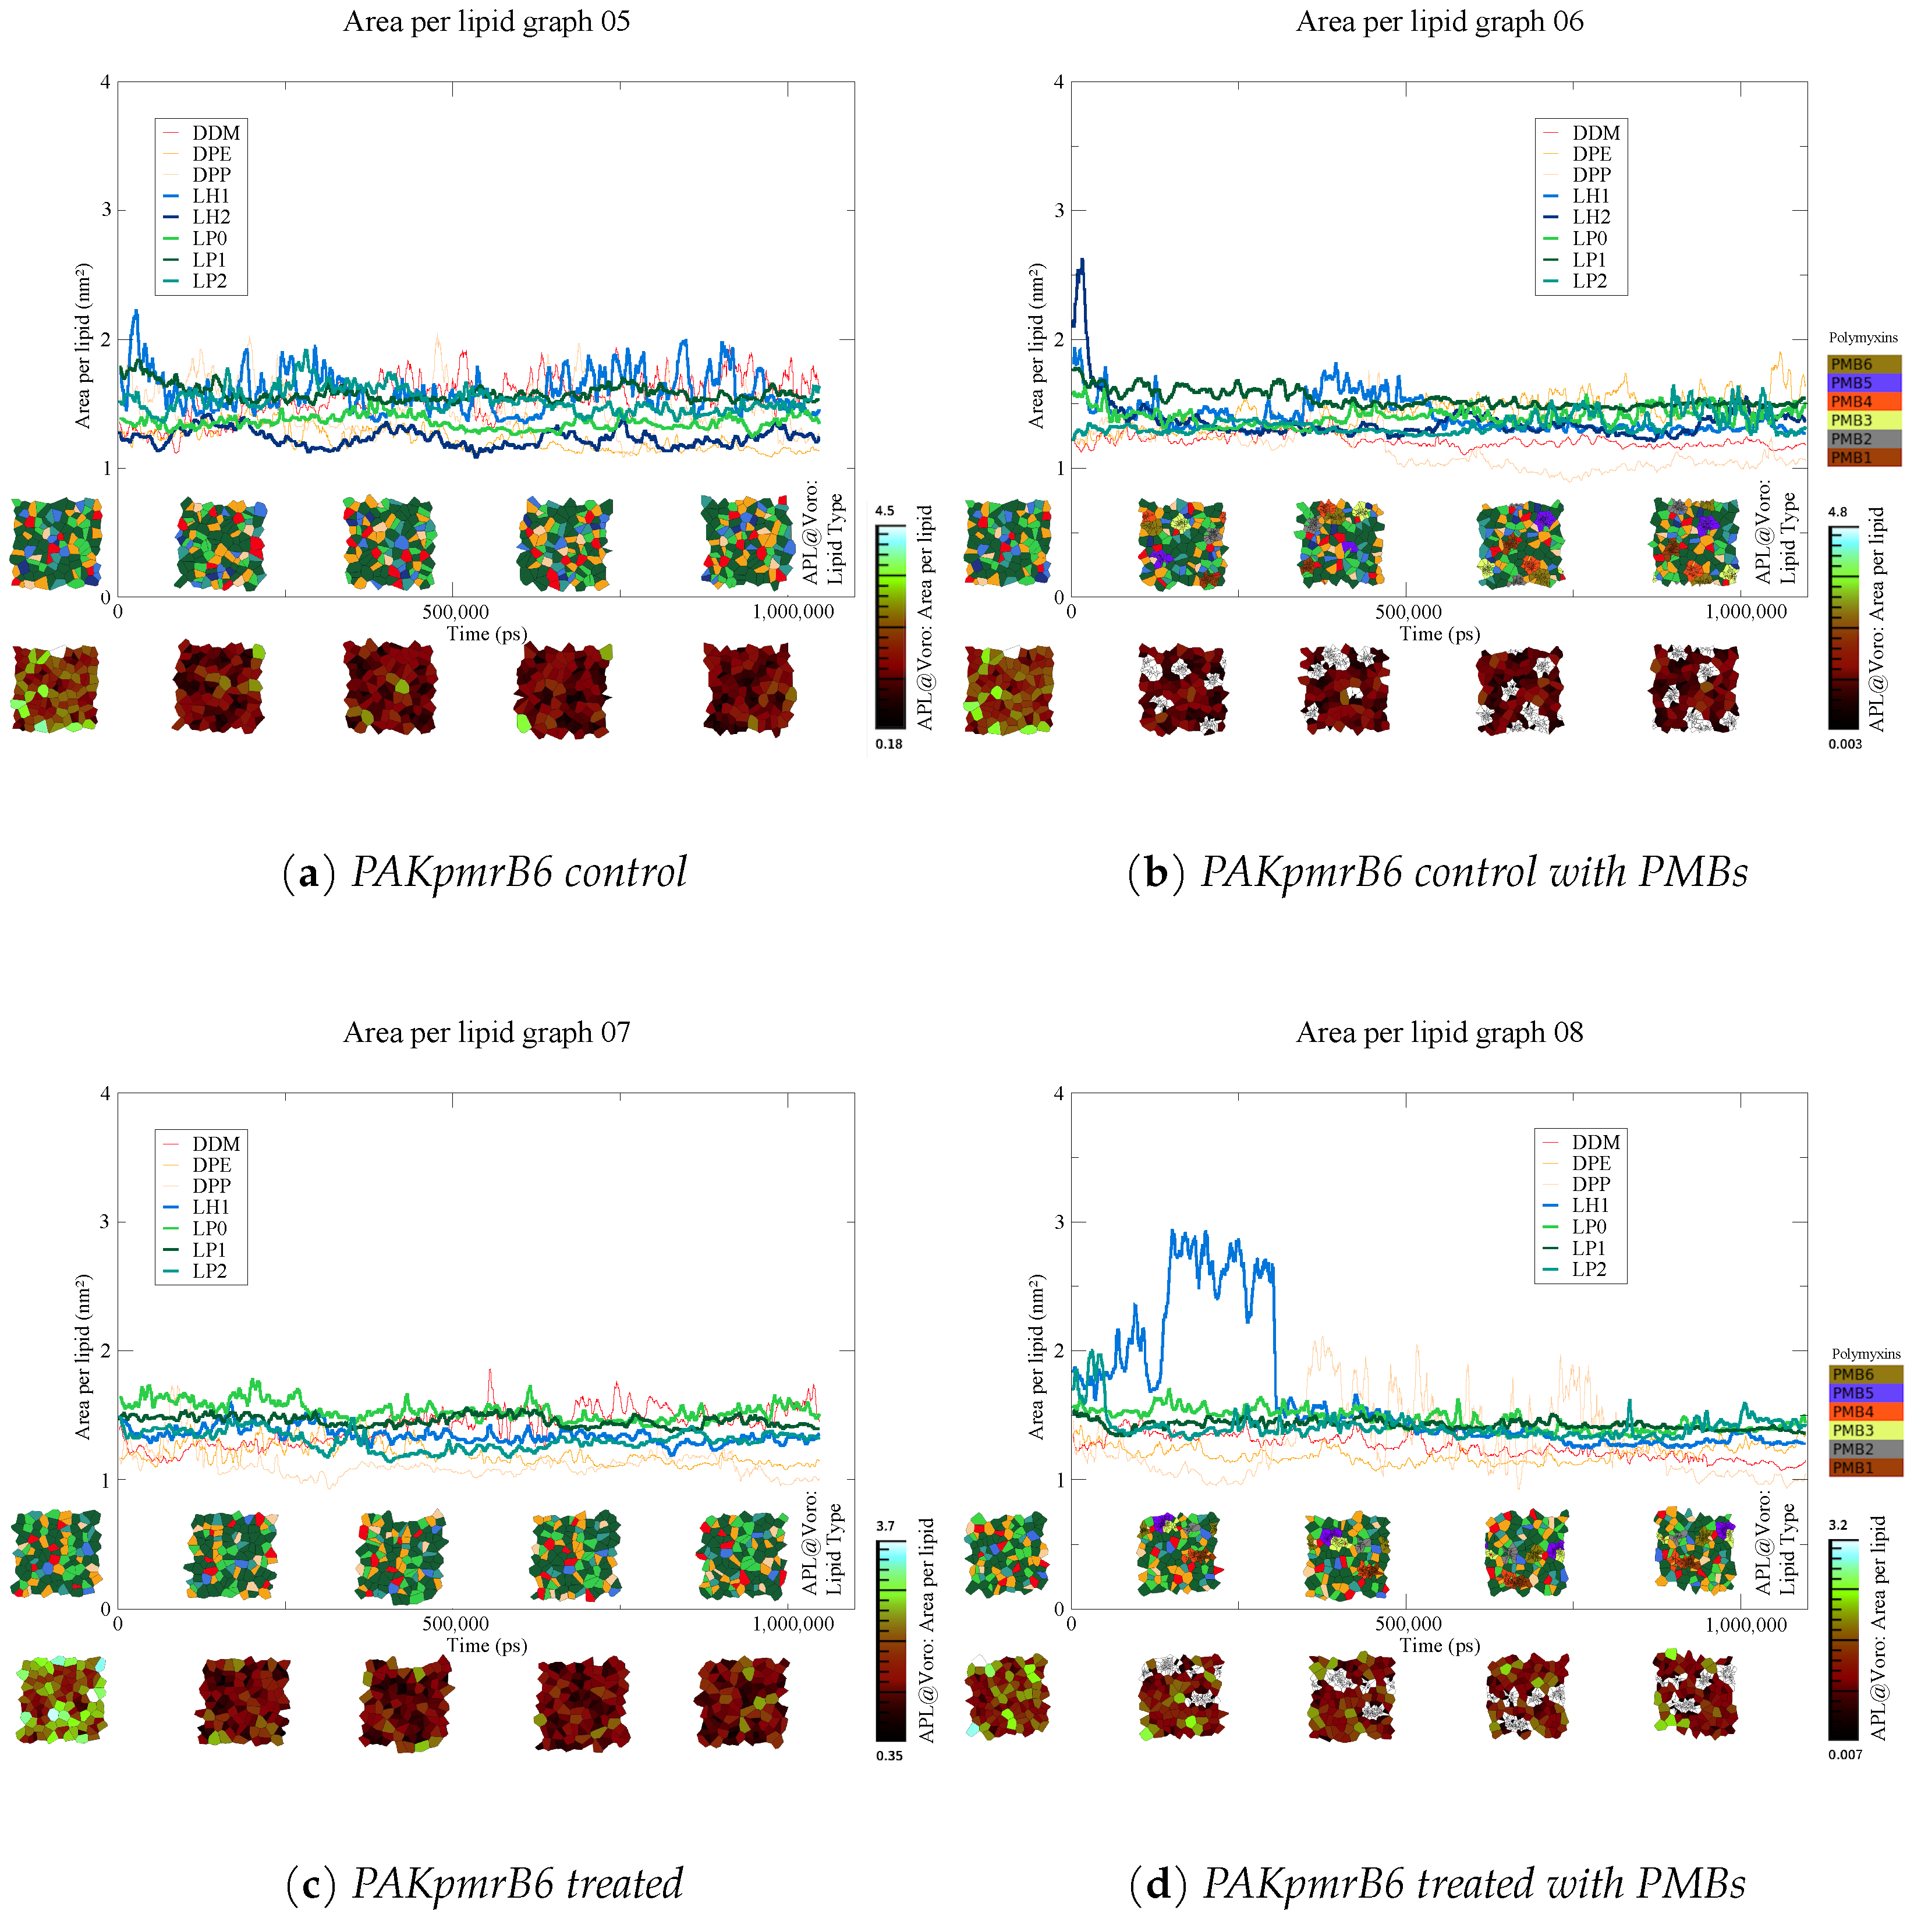
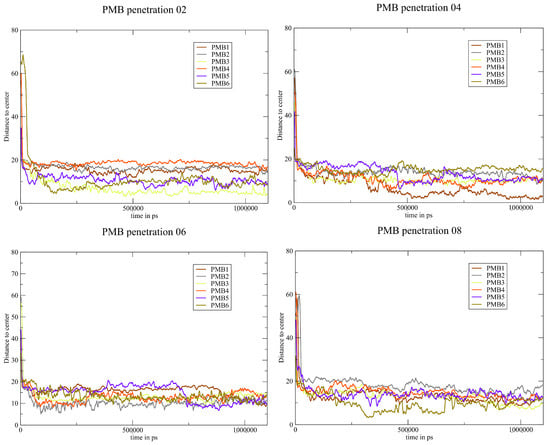
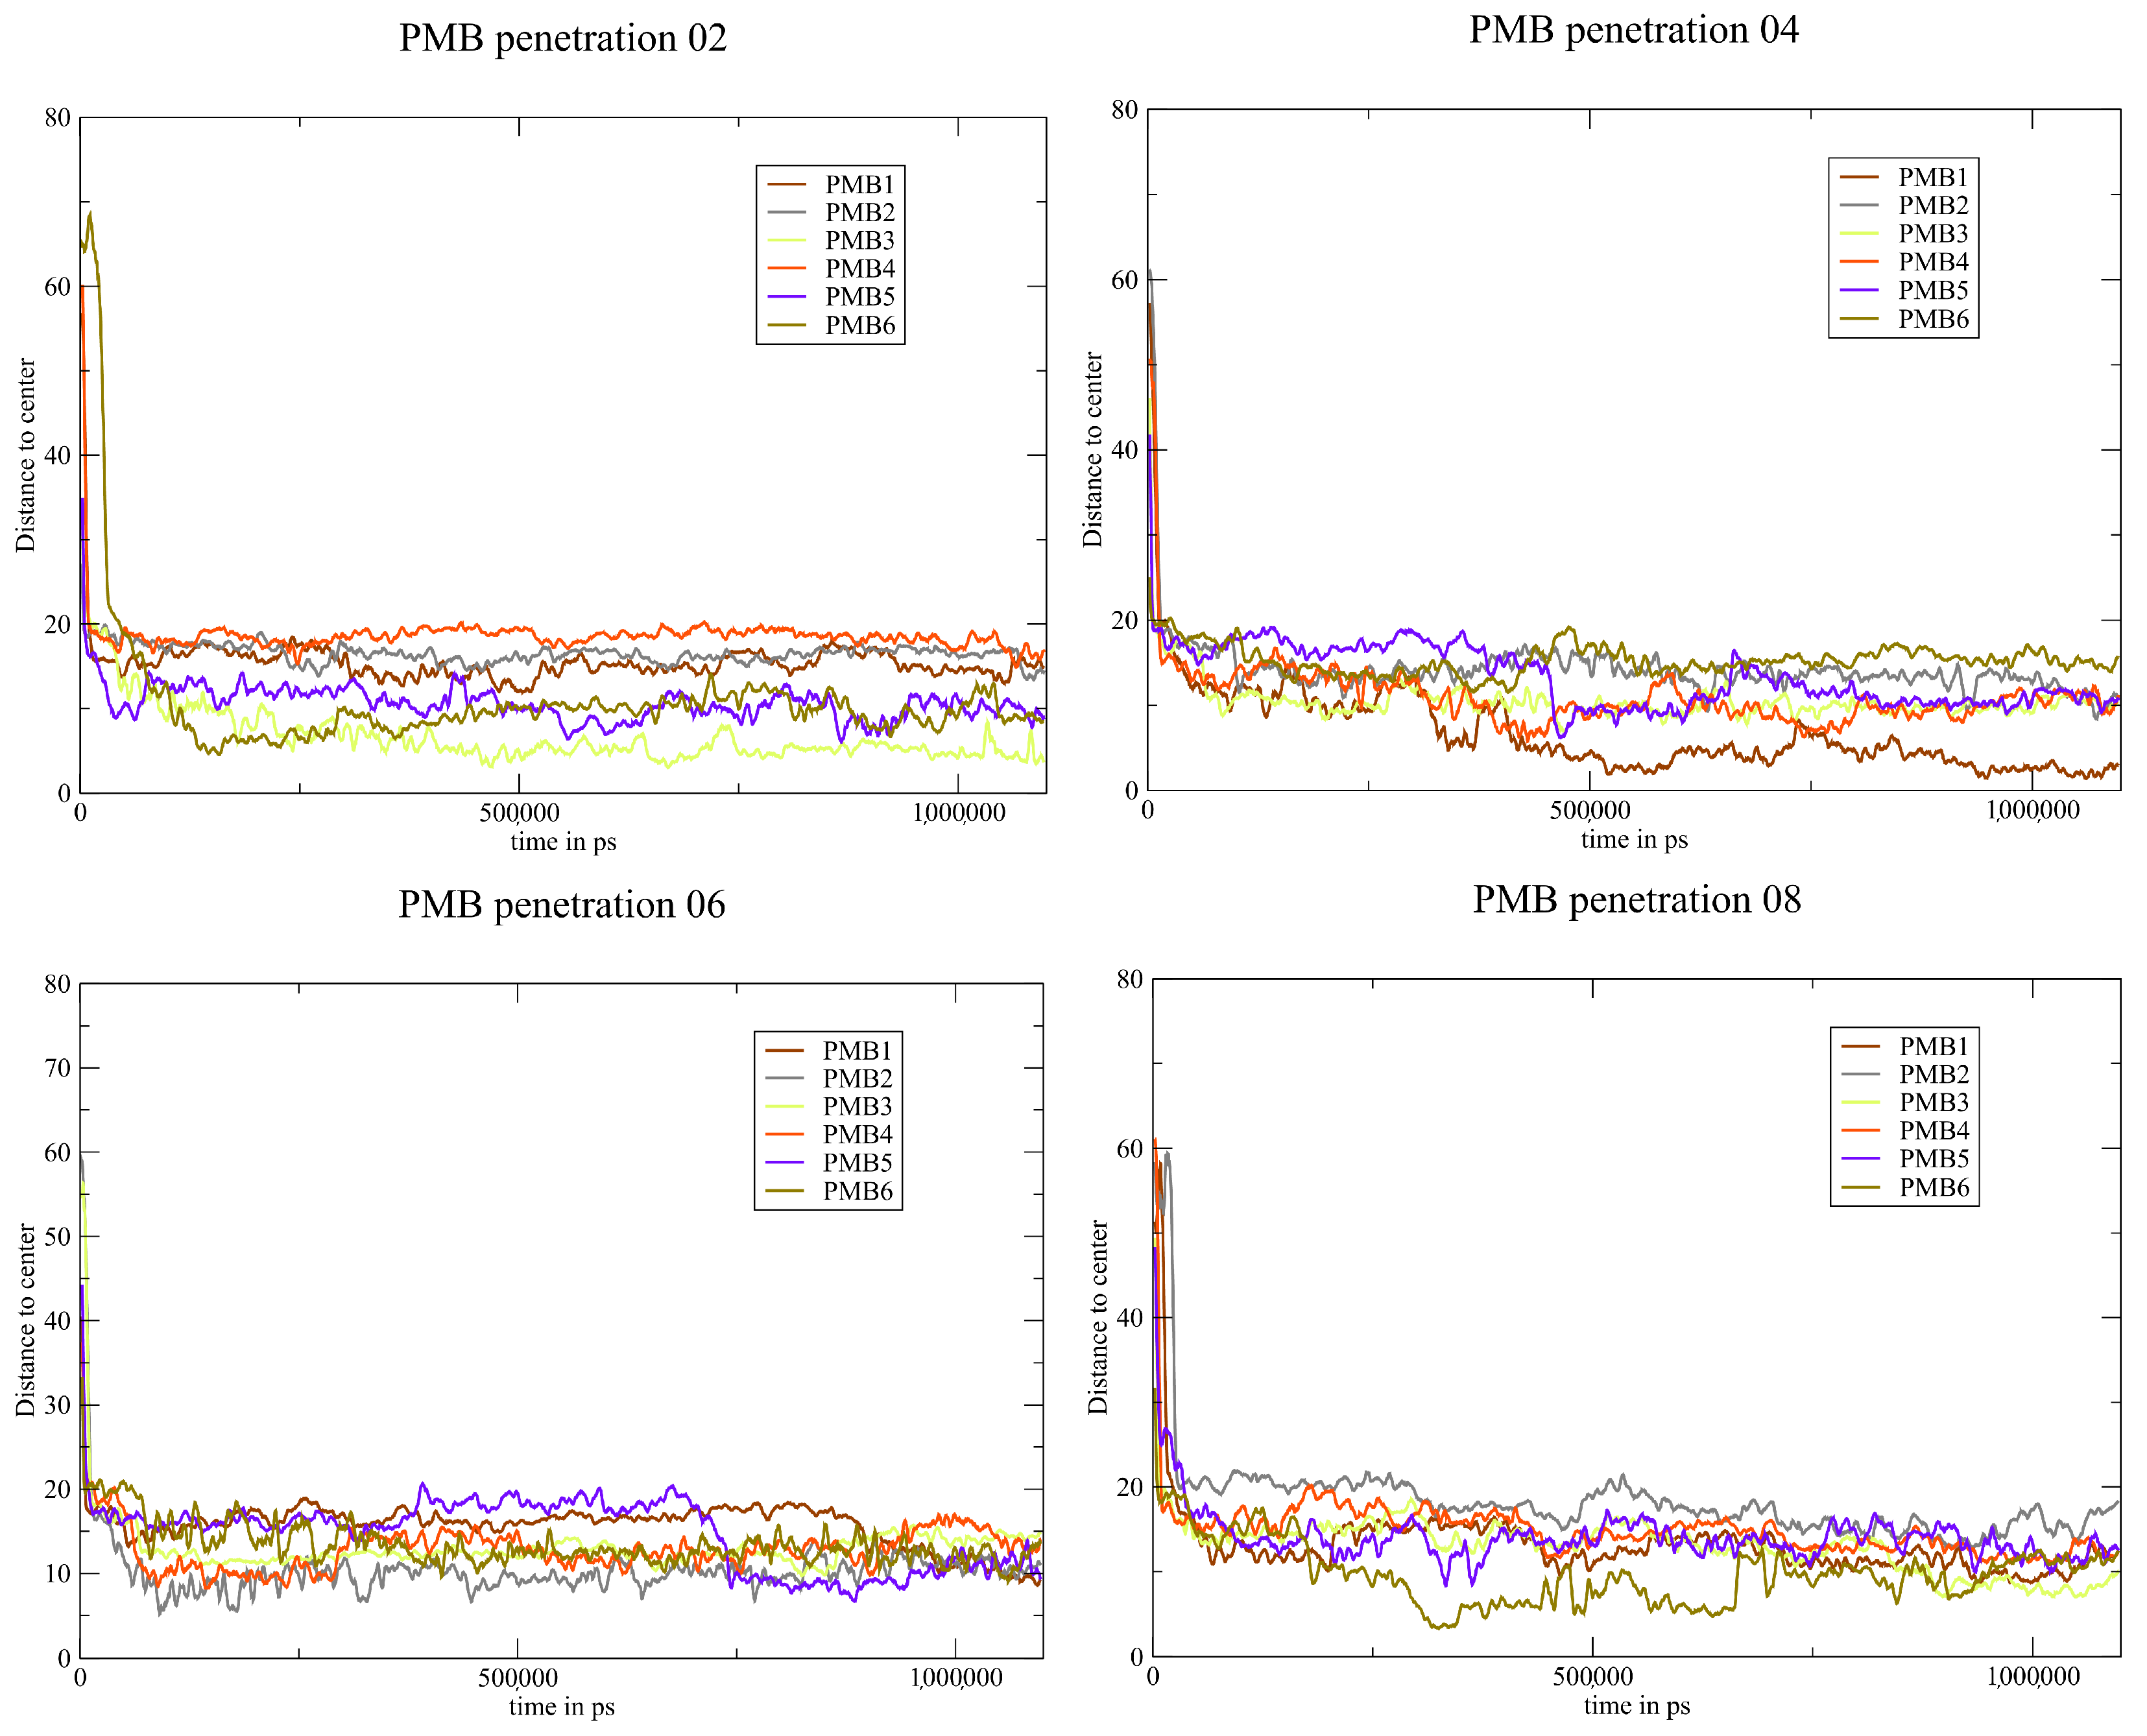
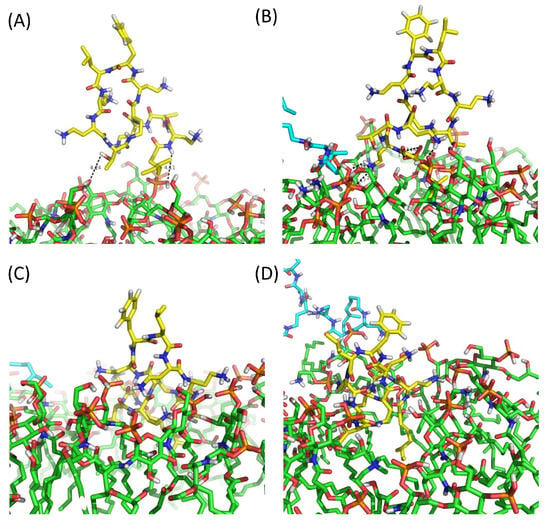
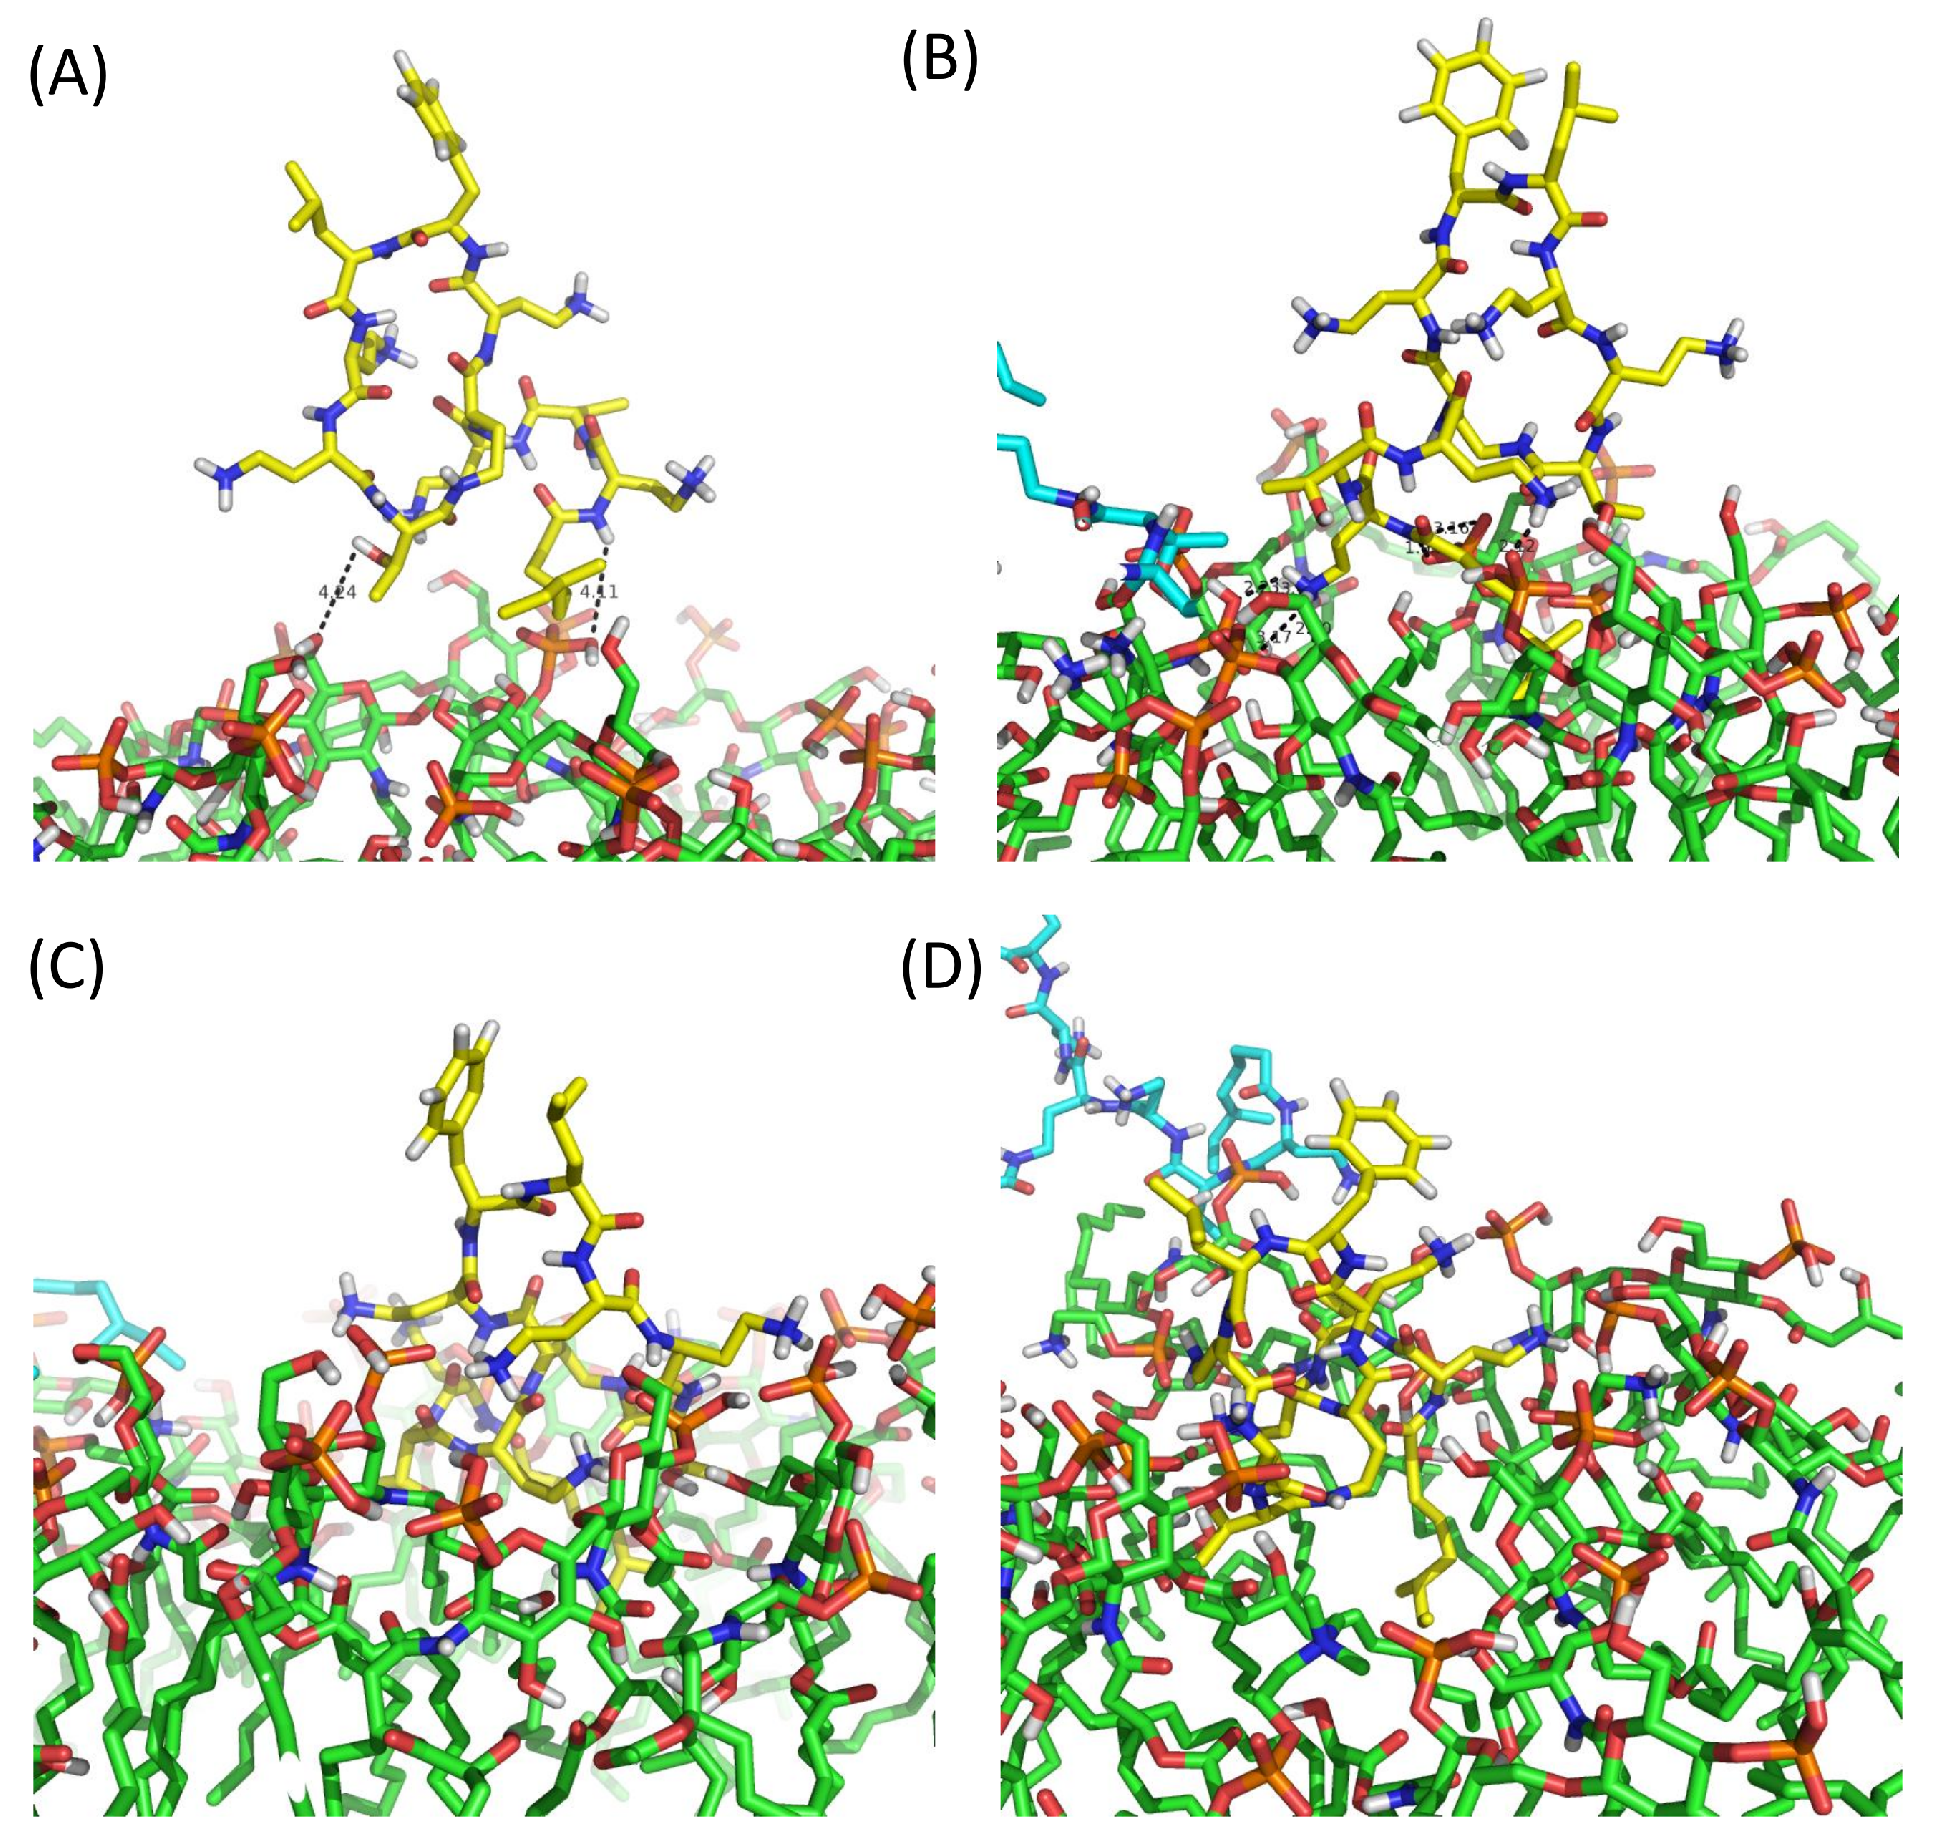
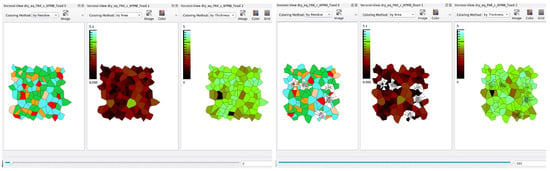
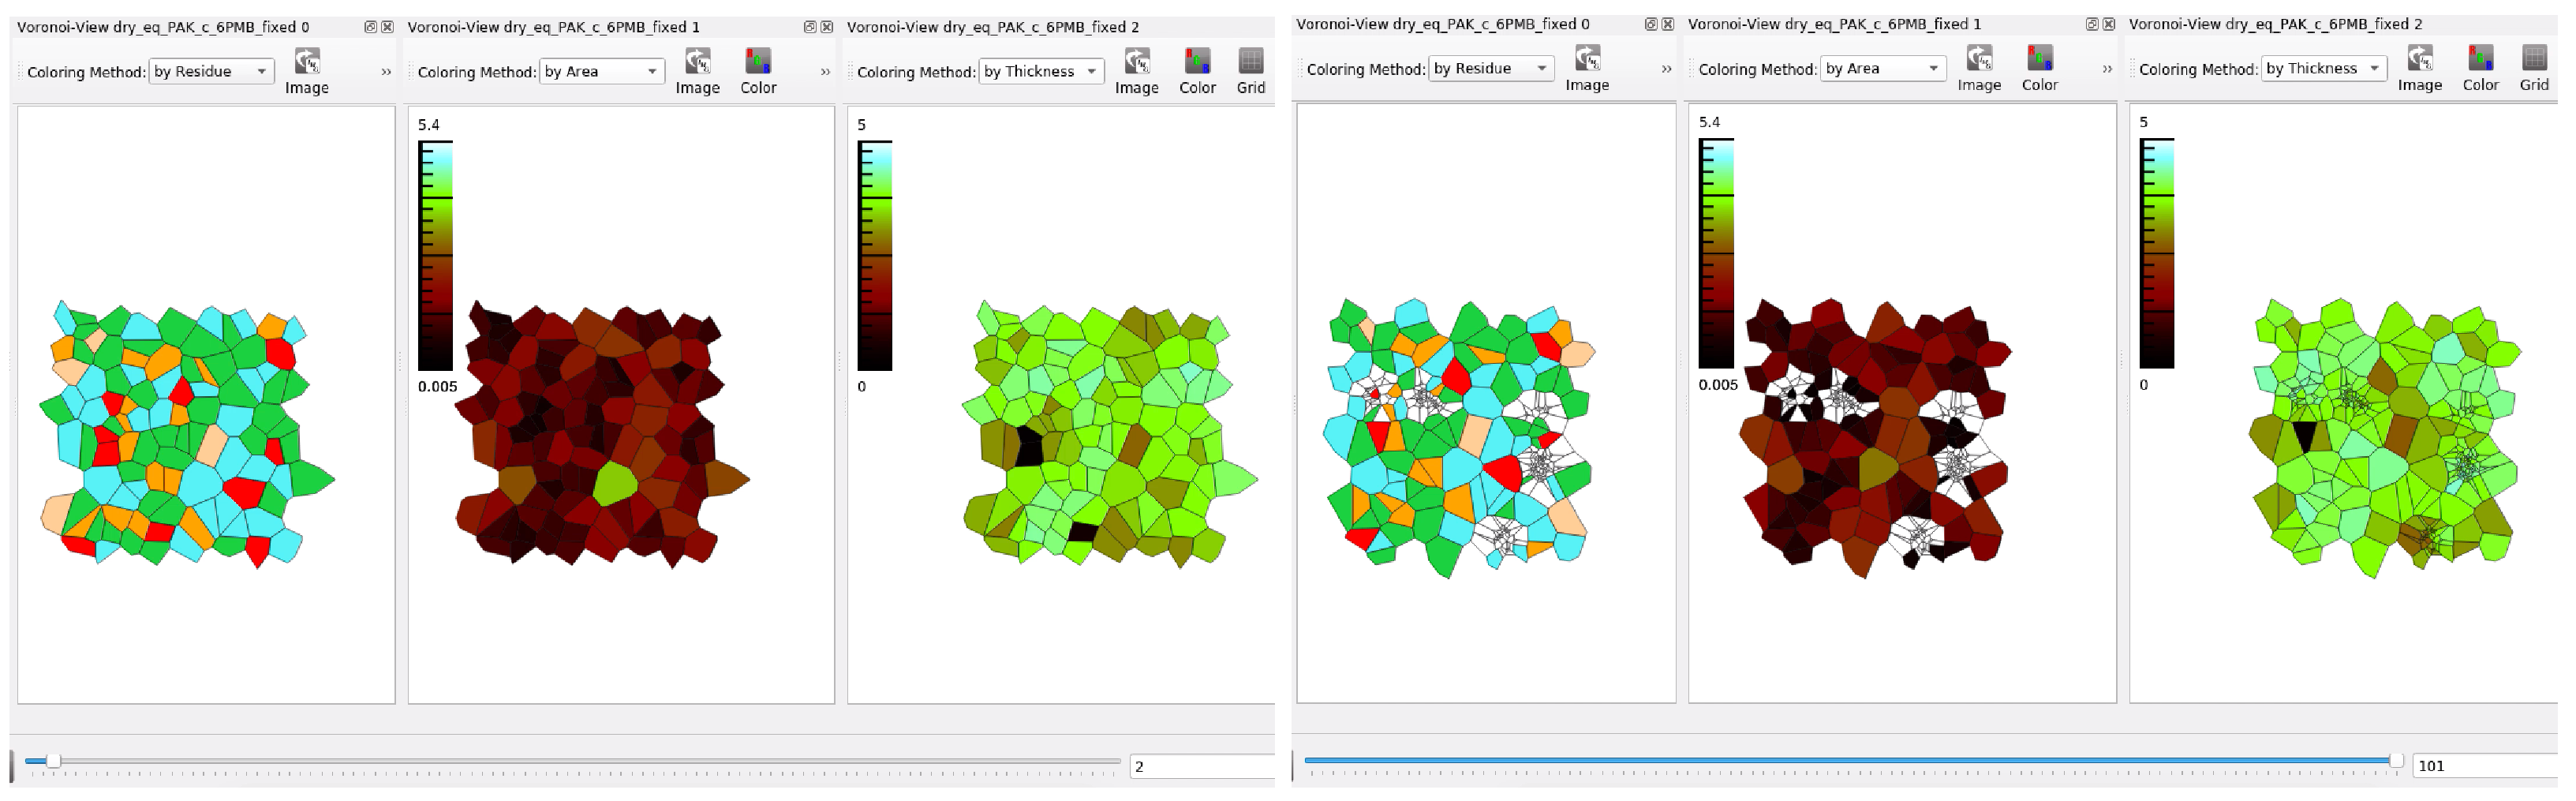
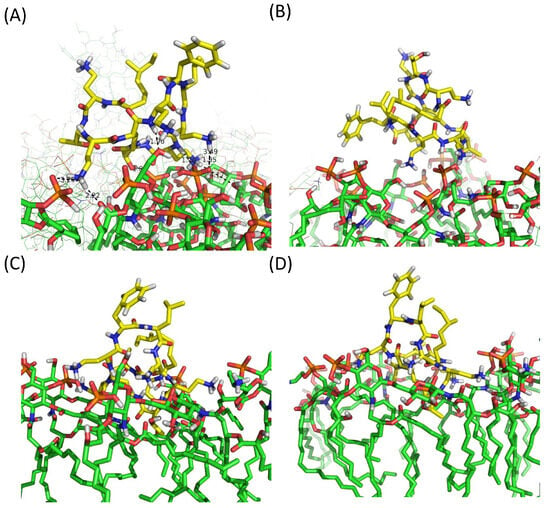
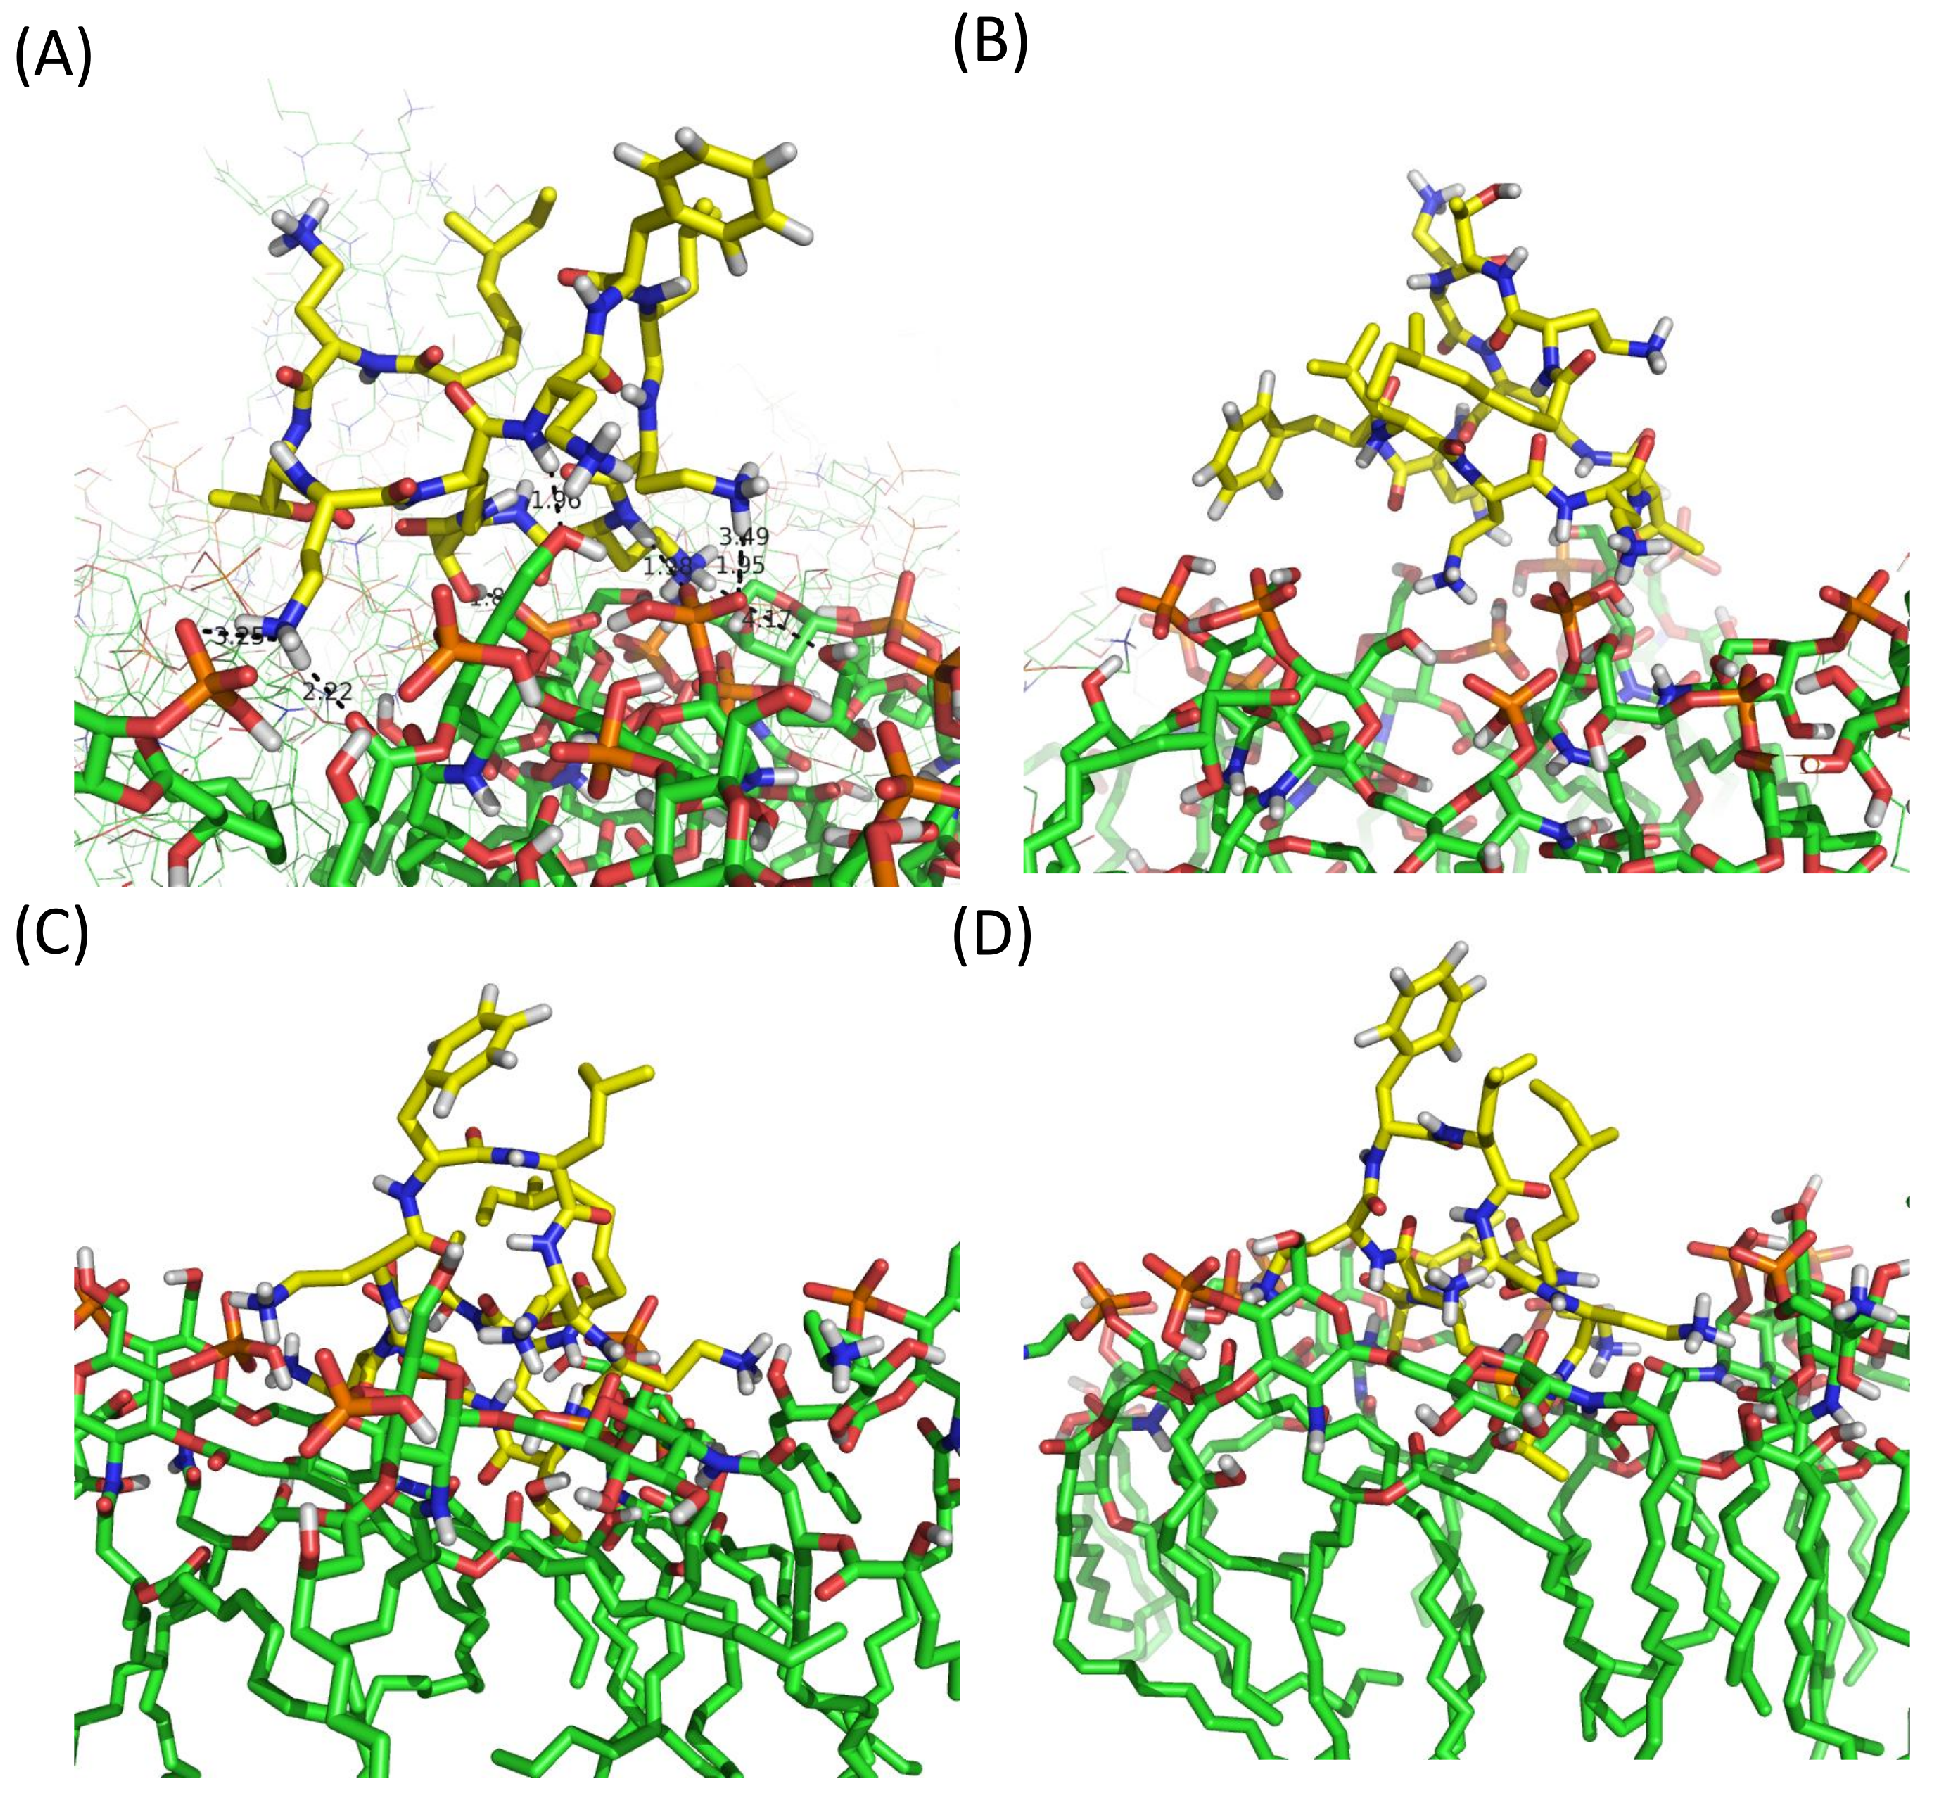
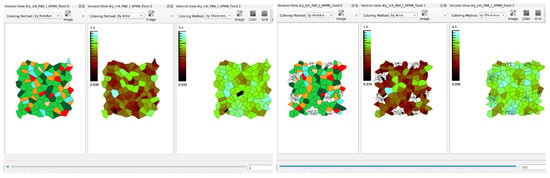
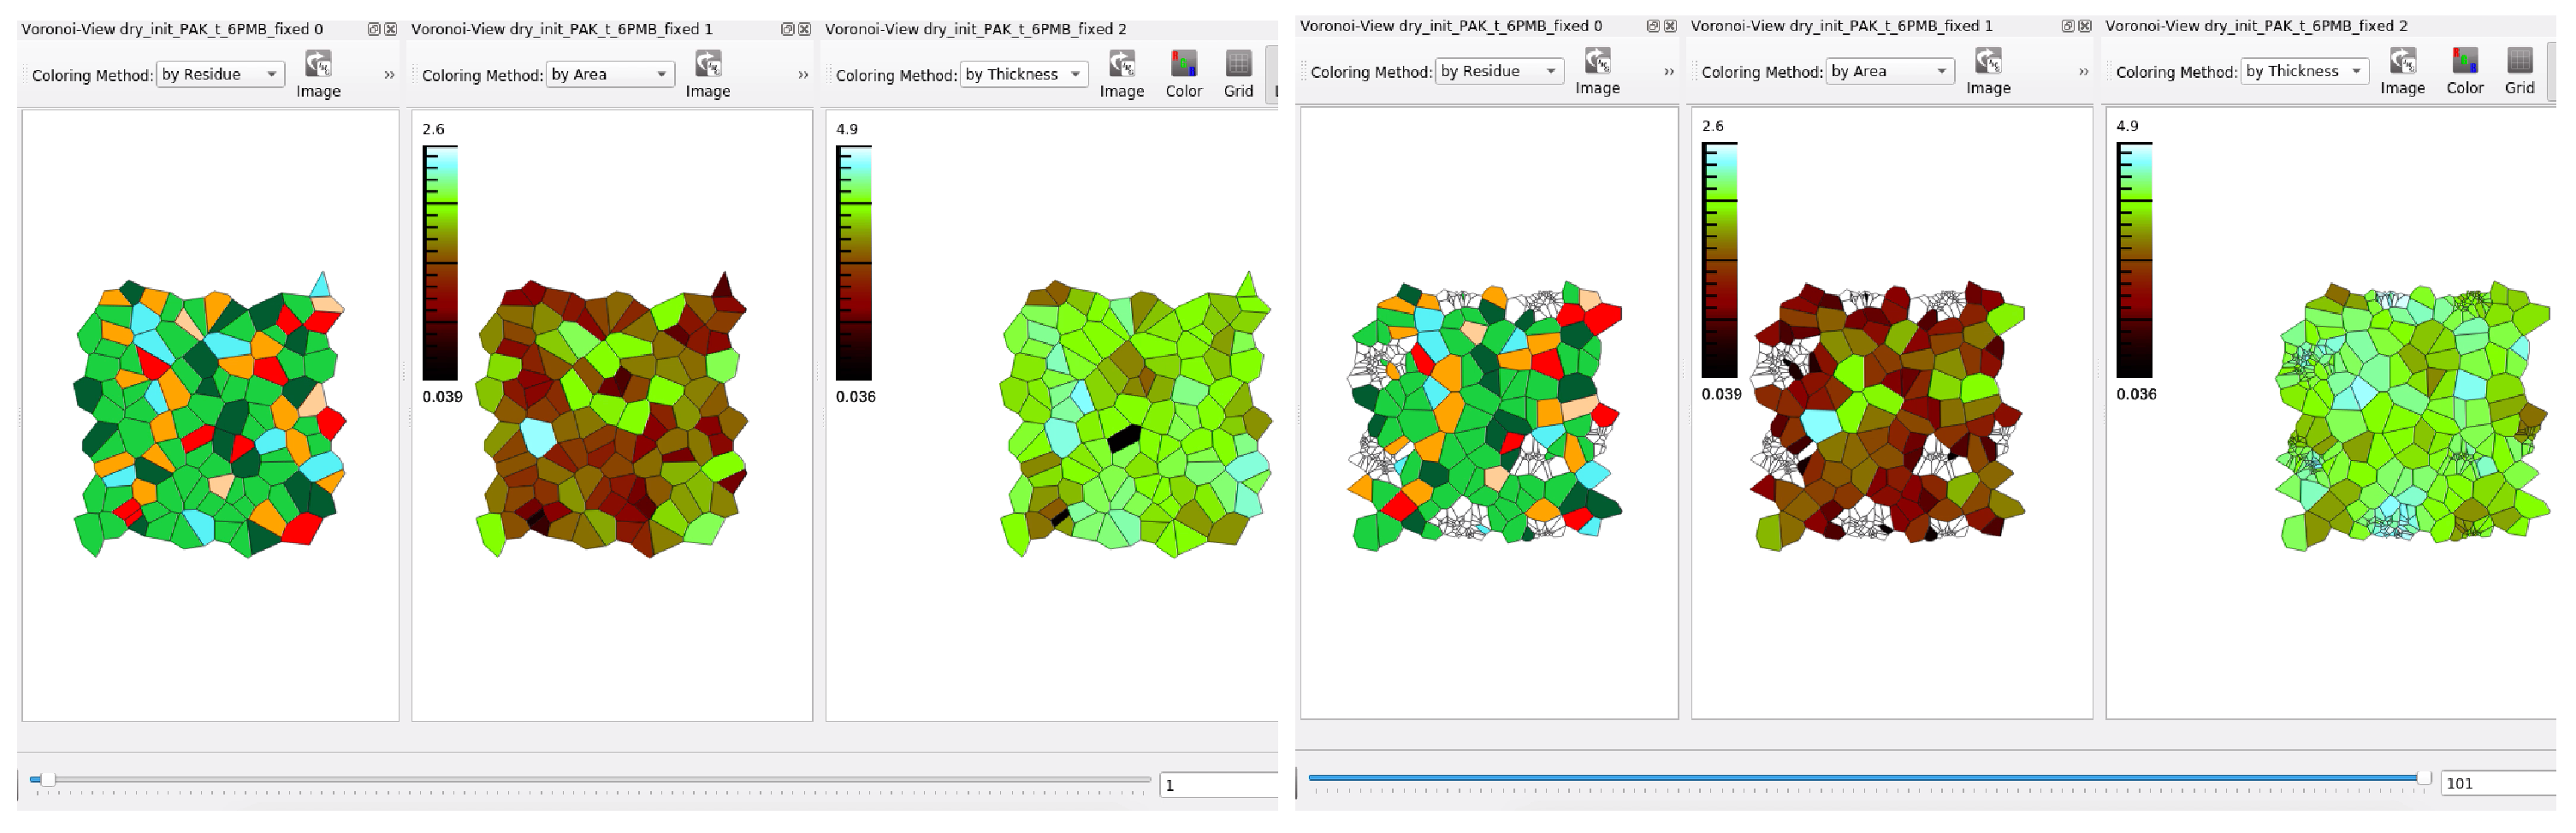
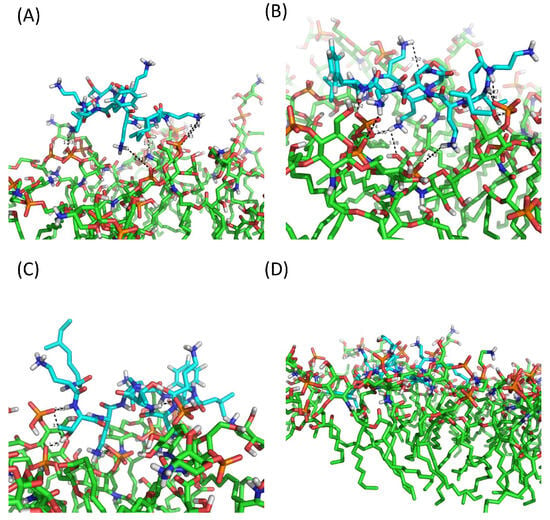
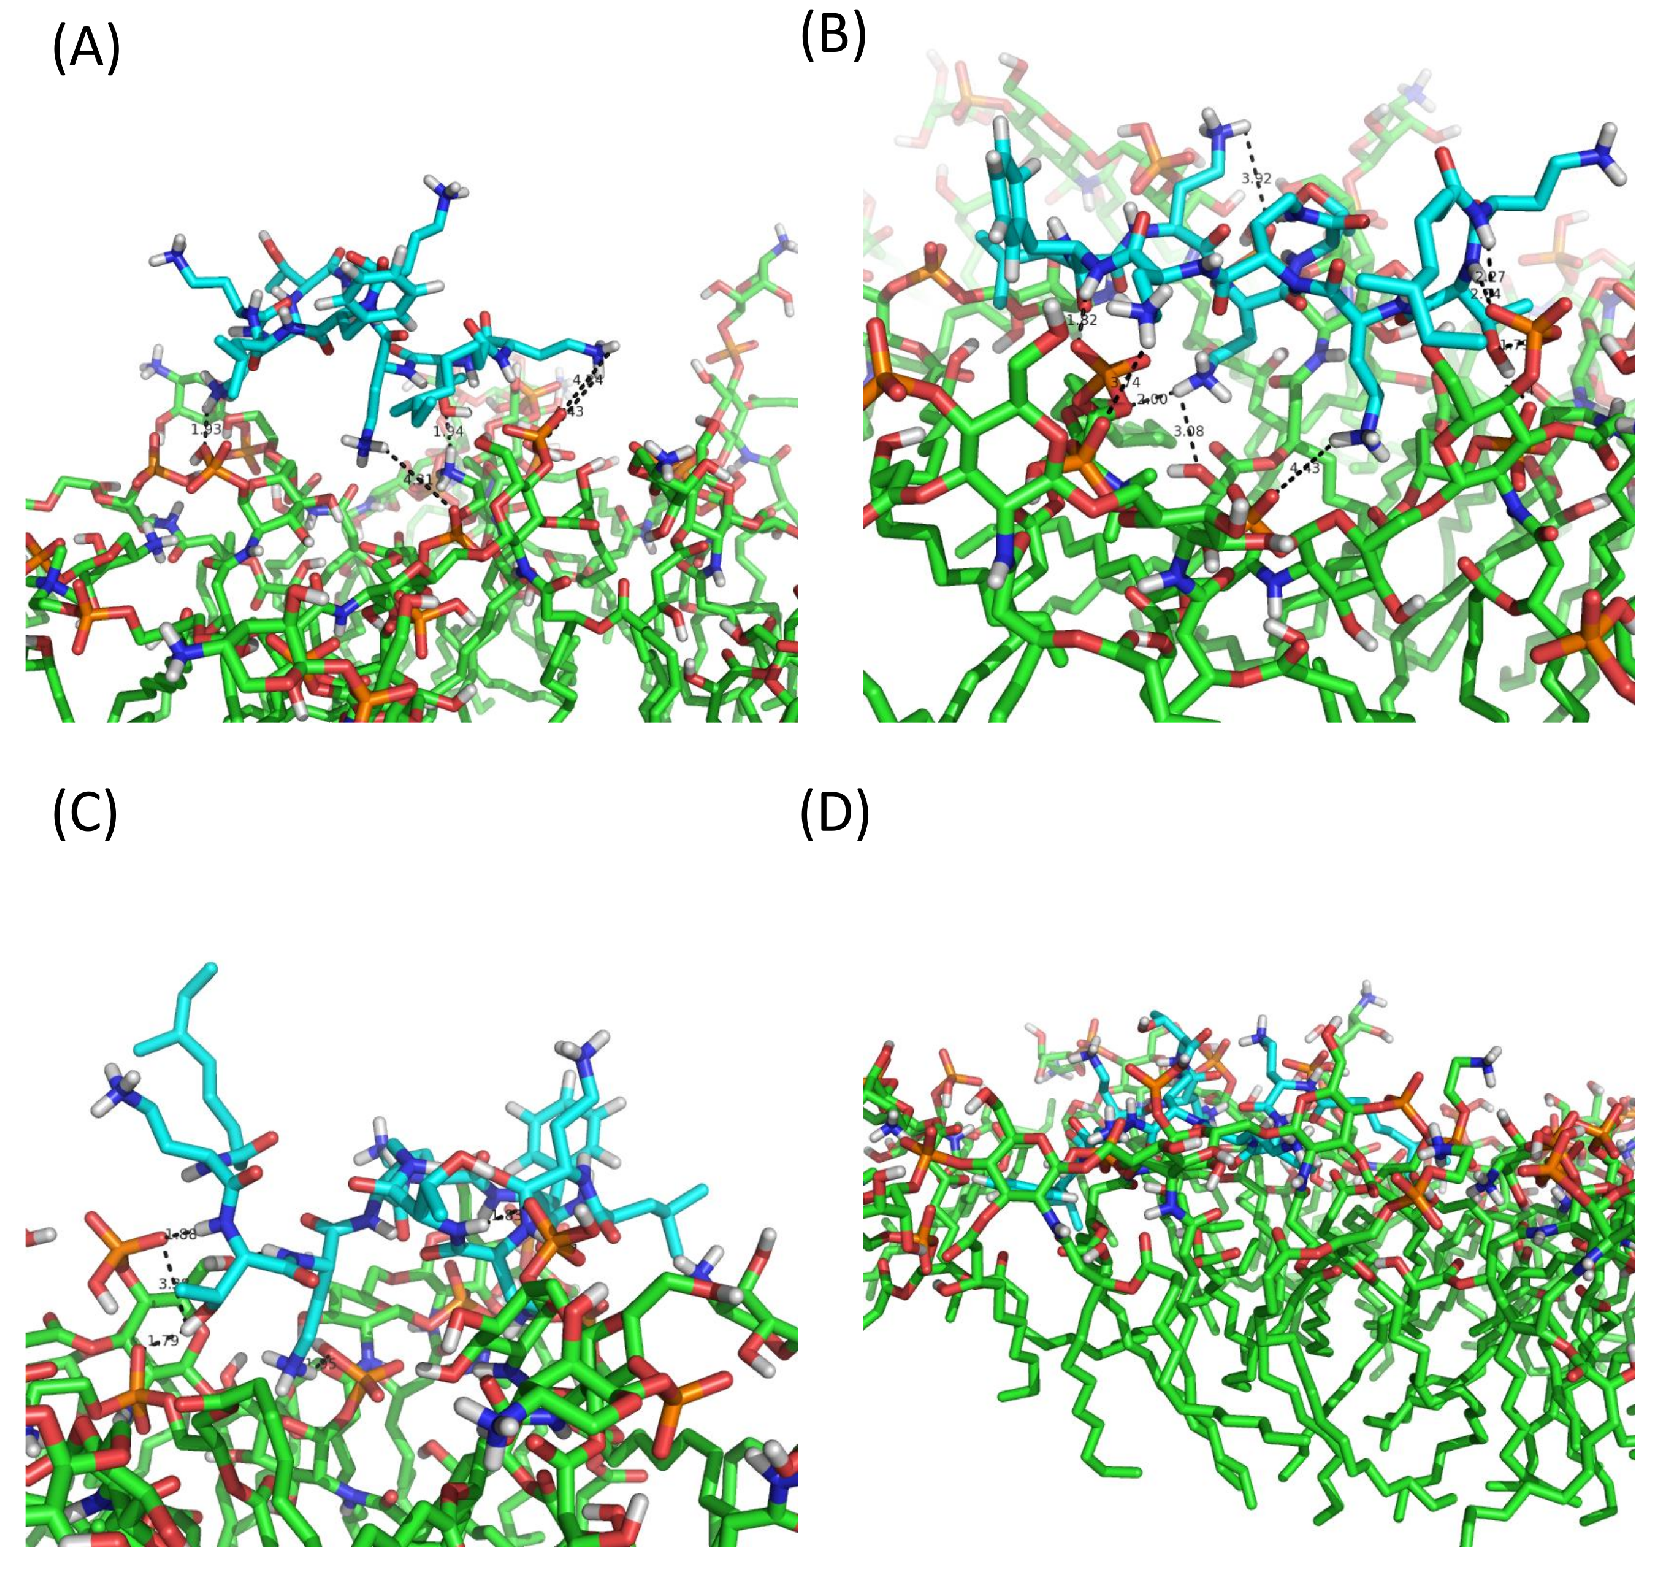
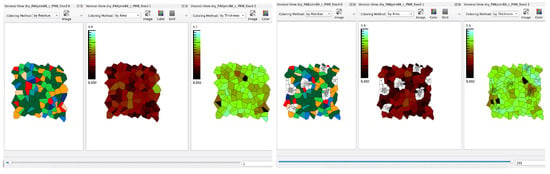
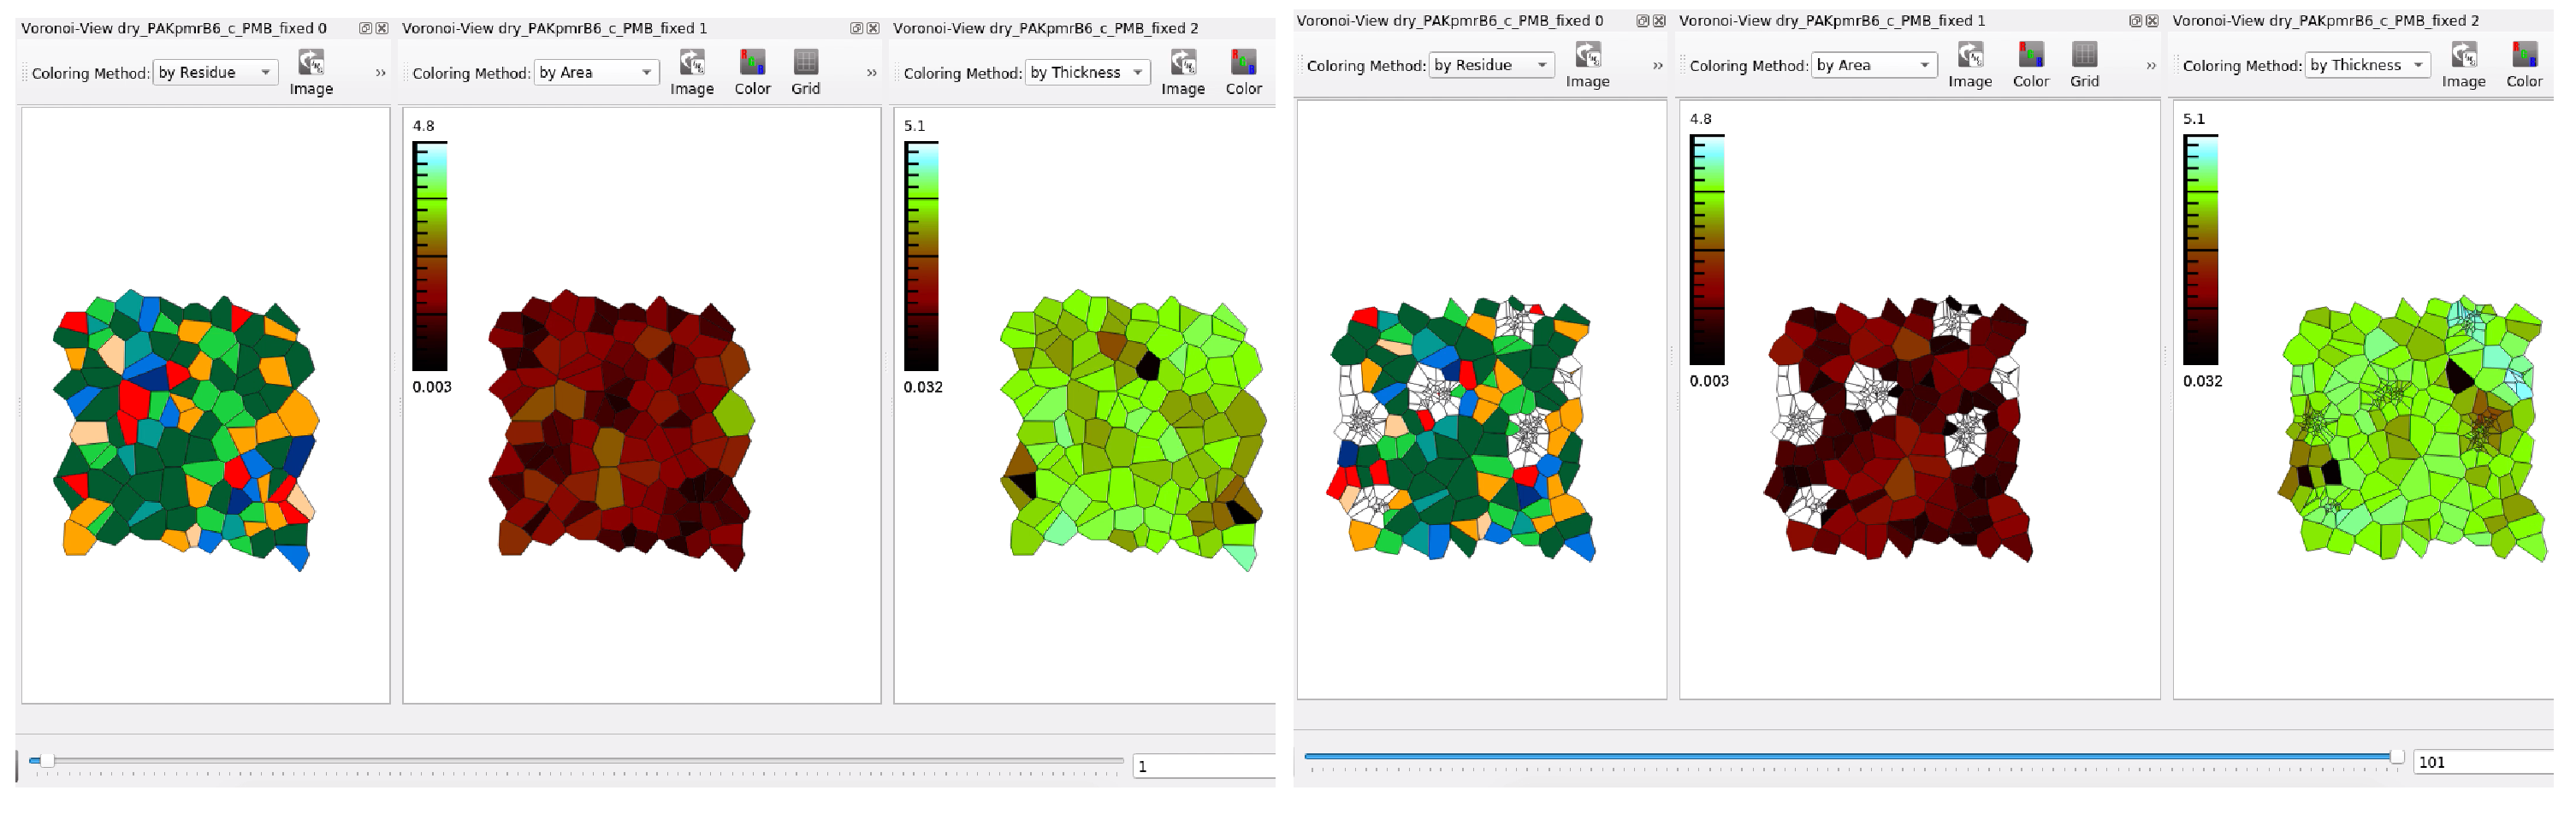
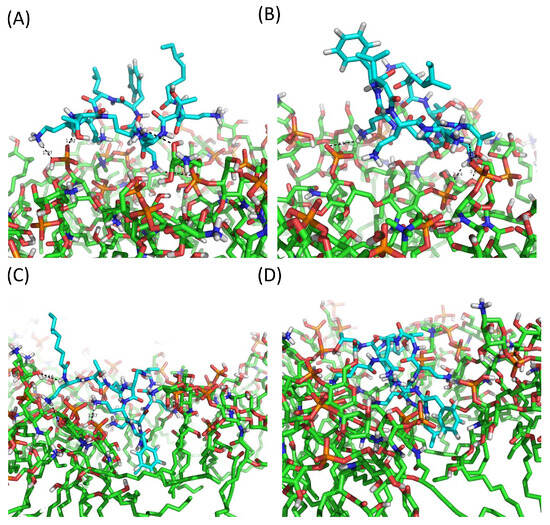
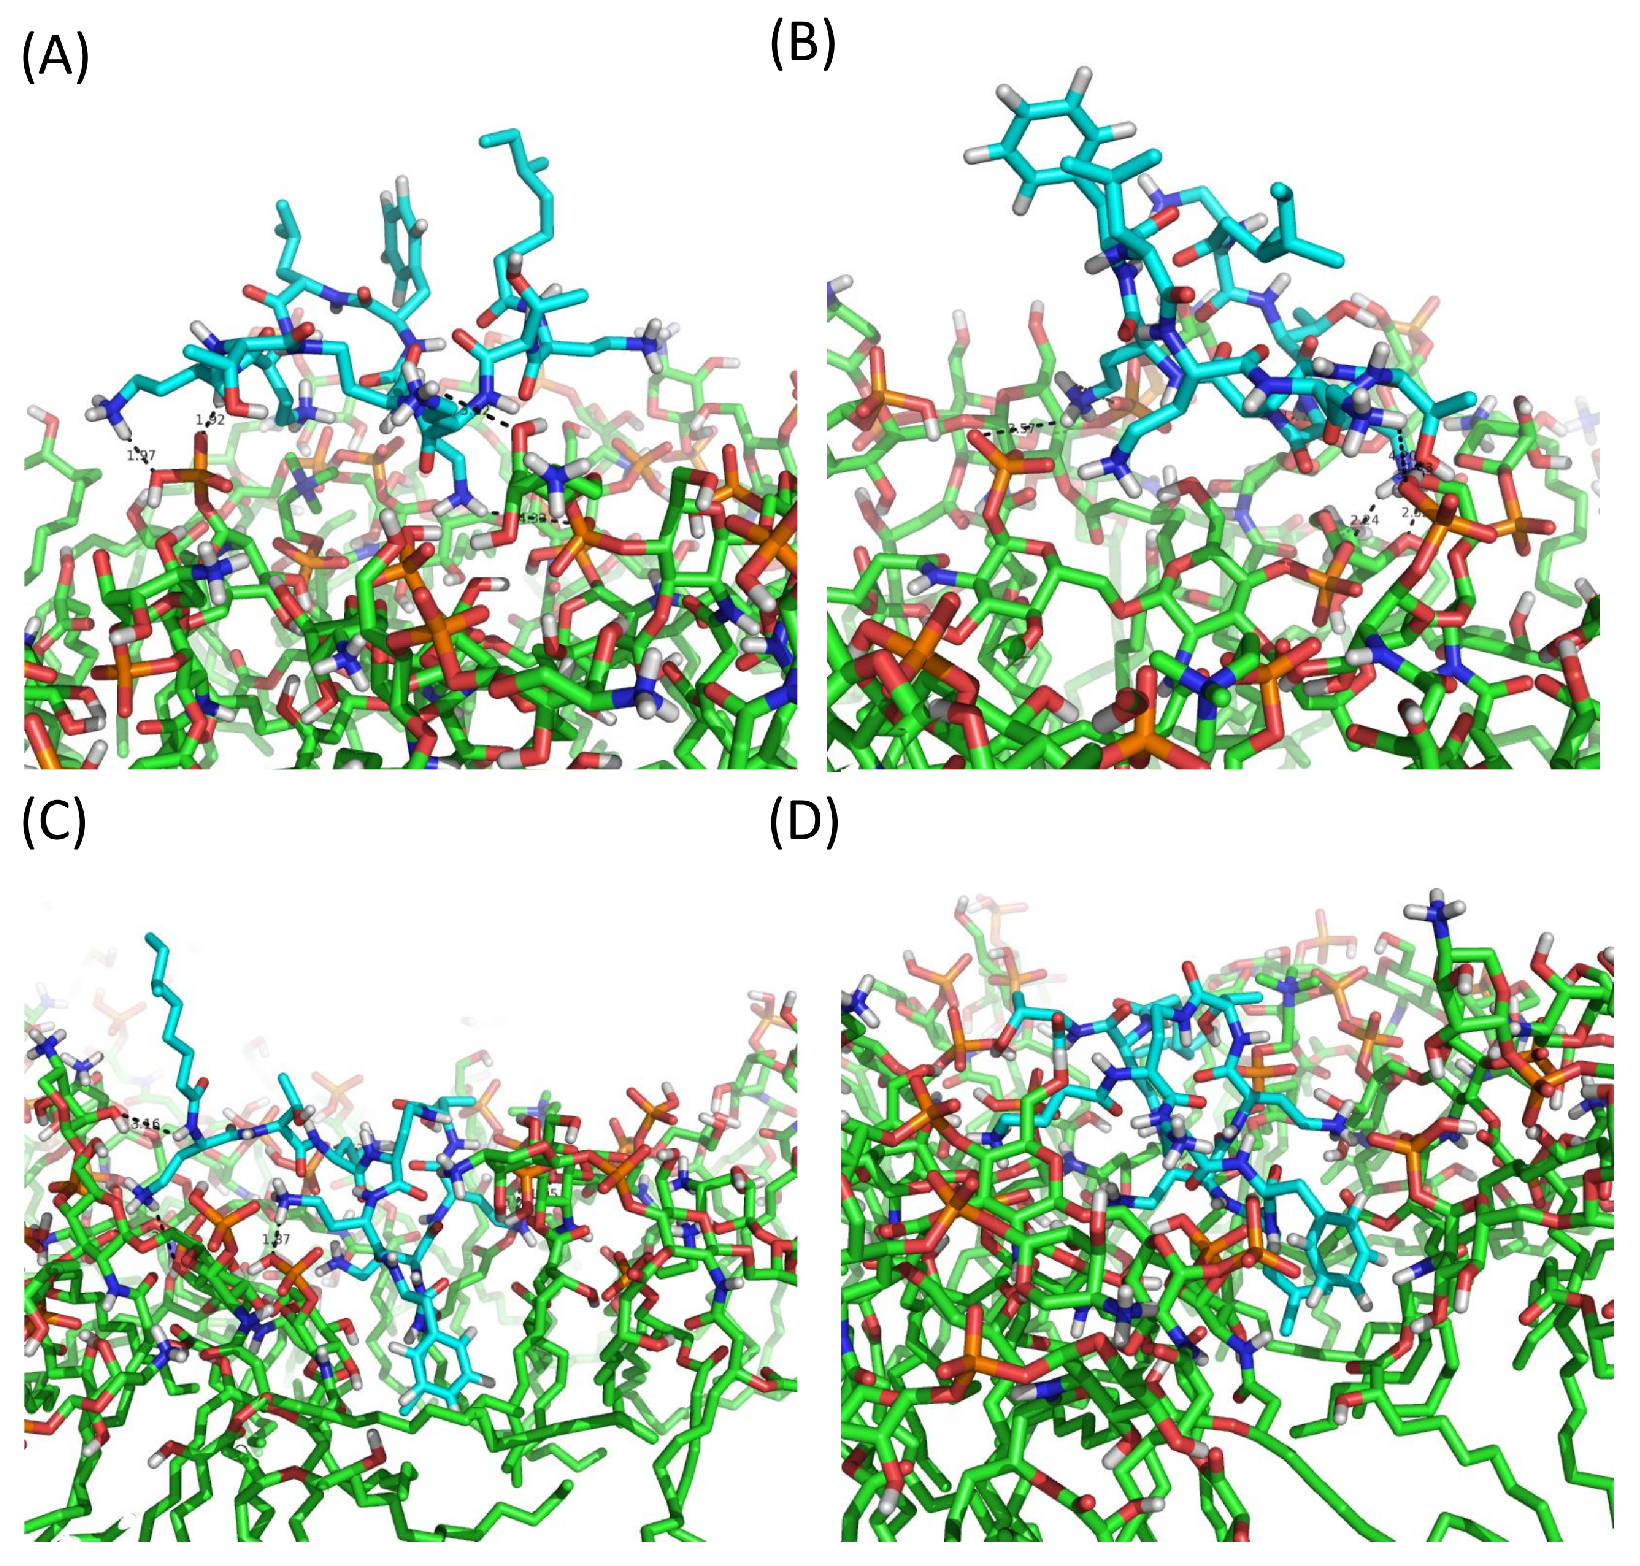
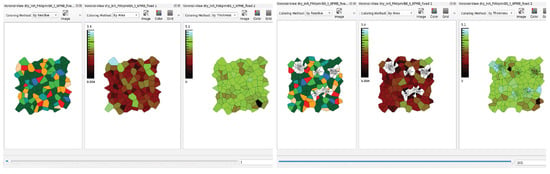
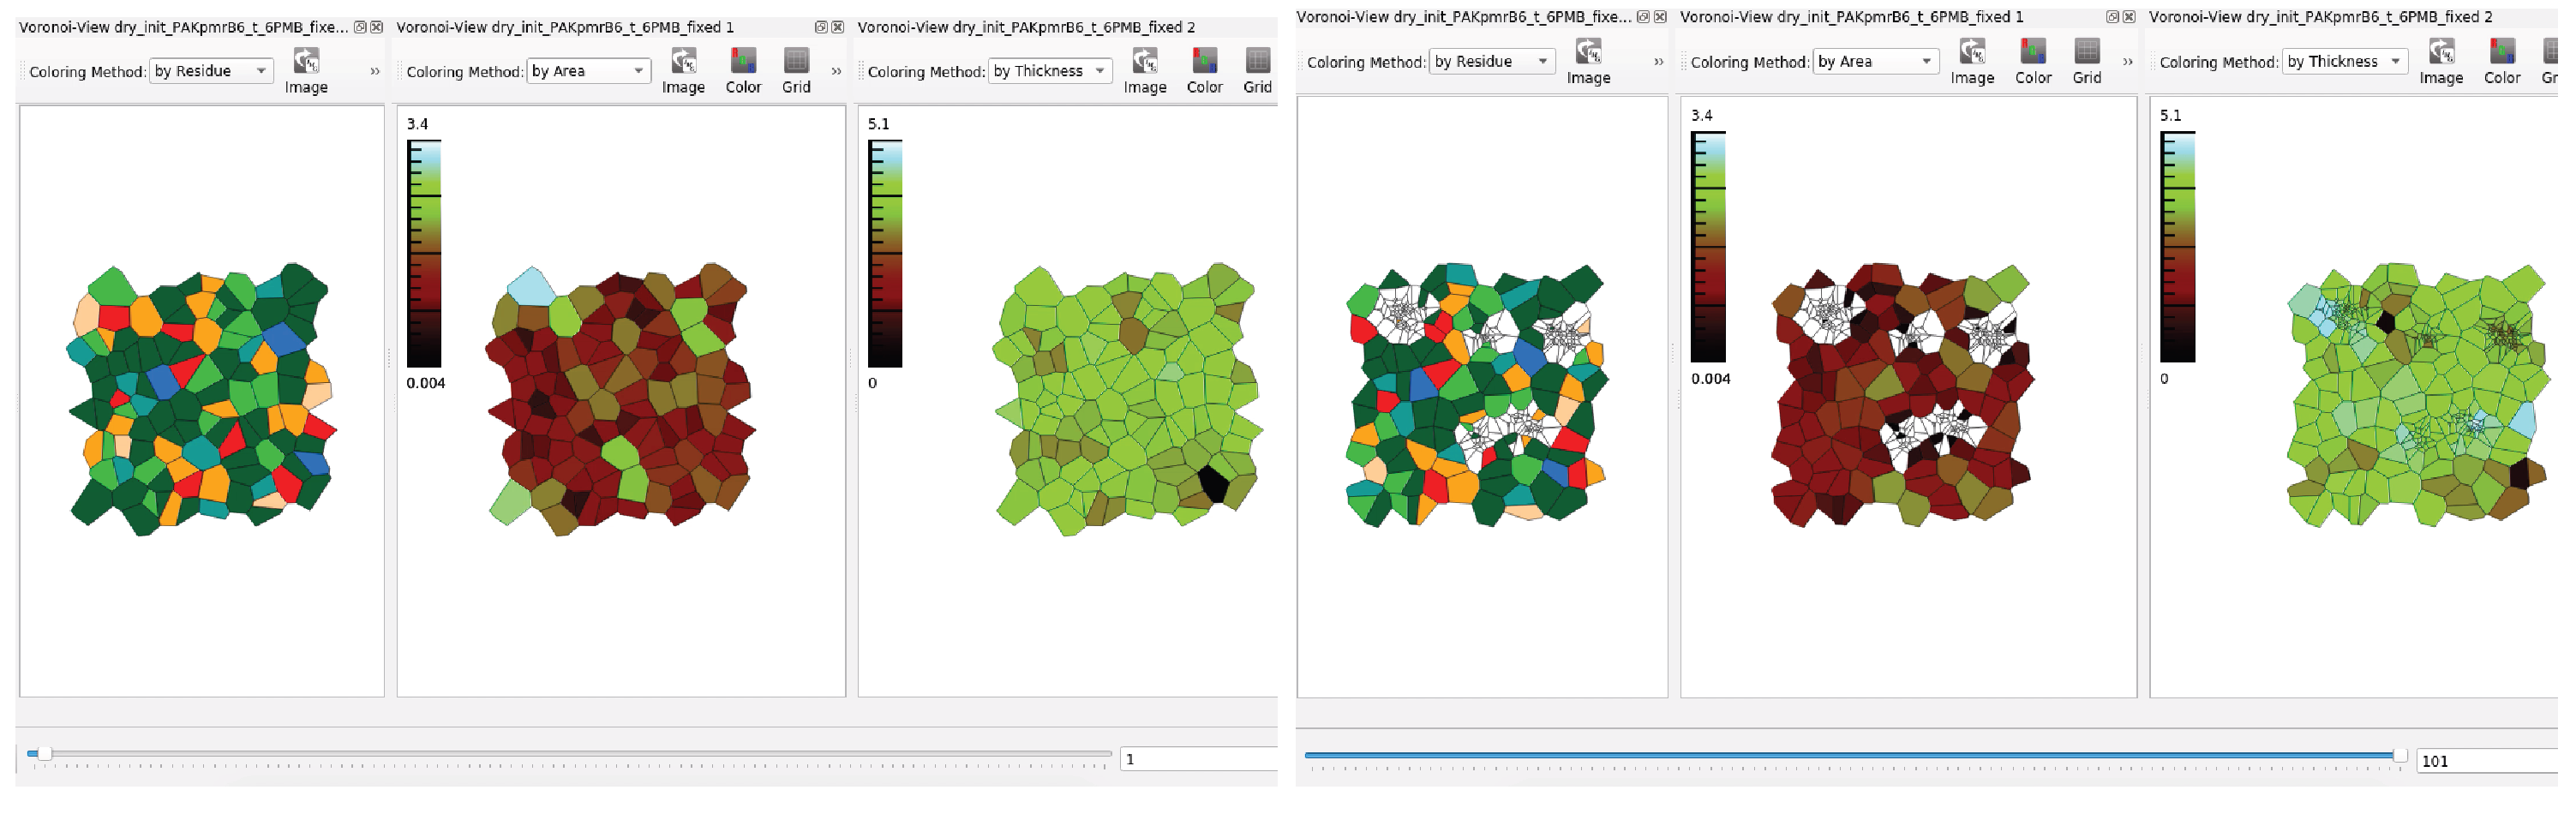

Disclaimer/Publisher’s Note: The statements, opinions and data contained in all publications are solely those of the individual author(s) and contributor(s) and not of MDPI and/or the editor(s). MDPI and/or the editor(s) disclaim responsibility for any injury to people or property resulting from any ideas, methods, instructions or products referred to in the content. |
© 2026 by the authors. Licensee MDPI, Basel, Switzerland. This article is an open access article distributed under the terms and conditions of the Creative Commons Attribution (CC BY) license.