


Abstract
Early permeability decline integrates both recoverable hydraulic effects and persistent membrane impairment, which limits its interpretation as a stand-alone fouling indicator. In this study, we evaluated whether pairing initial permeability loss (IPL) with post-exposure residual permeability loss could distinguish the magnitude and persistence of early hydraulic responses during ceramic nanofiltration. Six water matrices—drinking water, river water, reservoir water, secondary effluent, sodium alginate (SA), and sodium alginate supplemented with calcium (SA+Ca)—were examined using a 60 min early-response window, a defined deionized-water recovery procedure, and 8 h filtration trajectories. Apparent IPL ranged from 2.05% to 76.04%, whereas residual IPL ranged from 1.26% to 41.38%. Across the six matrix means, apparent and residual IPL were strongly associated (R2 = 0.948), while dissolved organic carbon was associated with apparent IPL (R2 = 0.871). Despite nearly identical measured organic carbon concentrations, the SA+Ca formulation showed apparent and residual losses that were 20.28 and 16.34 percentage points higher, respectively, than those of SA. Residual loss also increased progressively with exposure time, indicating that persistent impairment developed within the initial filtration period. Together, paired apparent and residual IPL provide an operational means of comparing early hydraulic-response magnitude and post-recovery persistence across water matrices under fixed membrane and operating conditions.
1. Introduction
Ceramic nanofiltration membranes can undergo rapid permeability loss during filtration, yet this loss may either be largely recovered after a defined recovery intervention or persist after the feed is removed. Recent studies on calcium carbonate precoating and cleaning strategies have shown that the membrane–foulant interface governs this reversibility [1,2]. However, it remains unclear whether a short filtration test can distinguish a matrix that produces a large but recoverable initial response from one that rapidly leads to persistent impairment. This distinction matters when screening feeds, comparing pretreatments, or deciding when to interrupt a filtration cycle.
Ceramic membranes offer chemical and thermal stability and can accommodate cleaning conditions that are unsuitable for polymeric materials [3,4]. Developments in their preparation and application have broadened their relevance to wastewater treatment [5]. Recent studies have documented advances in ceramic nanofiltration materials [6], pressure-driven ceramic membranes for saline wastewater treatment and desalination [7], and industrial-scale applications [8]. Recent advances in sol–gel processing have expanded fabrication strategies for zirconia nanofiltration membranes [9]. Nevertheless, membrane robustness does not eliminate fouling. Reviews of ceramic membrane fouling [10] and pretreatment for ceramic ultrafiltration [11] emphasize the importance of feed composition and deposit control, although findings cannot be transferred uncritically between different pore-size classes. The performance of a membrane material therefore cannot be separated from the chemistry of the water that it treats.
Organic fouling emerges from transport to the membrane, interactions with its surface, and subsequent interactions within the accumulating deposit [12]. Differences between ceramic and polymeric membranes have been documented for both natural organic matter and modeled filtration behavior [13,14]. Surface modification can alter these interactions [15,16], while precoat filtration can introduce a sacrificial interface [17]. Although these approaches are relevant to fouling mitigation, the response of an unmodified membrane remains operationally informative because it integrates the combined influence of the water matrix under defined hydraulic conditions. Critical-flux and sustainable-flux concepts emphasize that this response depends on operating conditions and observation time [18,19]. An early-loss metric should consequently be defined by a fixed test window, rather than treated as an intrinsic property of a water sample.
Bulk organic carbon concentration alone cannot describe the fouling potential of a complex feed. Natural organic matter affects rejection and permeability through multiple pathways [20], including concentration polarization, osmotic effects and deposited material [21]. Chemical interactions with divalent cations and the balance between permeation drag and cross-flow transport influence nanofiltration fouling [22,23]. Polysaccharides provide a useful model for examining these interactions. Alginate can form ionically cross-linked networks [24], and calcium-dependent gel formation and intermolecular adhesion have been measured in membrane-related systems [25,26]. However, the direction and magnitude of an ionic-strength effect depend on the accompanying calcium and organic conditions [27]. A calcium-rich feed is not necessarily the most strongly fouling feed when the concentration and character of organics differ. A large early permeability loss is therefore ambiguous: it may represent a transient hydraulic response, a readily recoverable deposit, or the early establishment of persistent resistance.
The distinction between loss during filtration and loss after recovery is equally important. Studies of alginate filtration and backwashing, organic-fouled membrane cleaning, and salt-induced cleaning demonstrate that the apparent reversibility of a deposit depends on the recovery intervention [28,29,30]. A residual loss after deionized-water exposure is an operational measure of persistence under that intervention; it is not proof that further hydraulic or chemical cleaning would fail. Reviews of nanofiltration cleaning and membrane-fouling control reinforce the need to specify both the fouling and the recovery procedure [31,32].
In this study, six matrices spanning drinking water, two natural waters, secondary effluent and two alginate-based model waters were compared using one ceramic nanofiltration configuration. We examined the first 60 min of permeability decline, the remaining impairment after deionized-water recovery, and the development of residual loss with exposure time. The analysis addresses three questions: (i) how strongly early loss differs among matrices; (ii) whether its magnitude is associated with subsequent residual loss; and (iii) whether the SA+Ca formulation produces different apparent and residual responses from the SA formulation. Eight-hour trajectories provide a longer-term reference, while water-quality correlations are treated as exploratory associations rather than causal predictors. Conventional fouling-assessment methods, including resistance-in-series analysis and flux- or permeability-recovery measurements, provide established means of characterizing hydraulic deterioration and recovery. However, early-exposure magnitude and post-recovery persistence are not always reported together under matched exposure and recovery conditions. The present study therefore examines the comparative value of pairing these responses within a defined early filtration window, rather than proposing a new physical separation of fouling resistance. The study therefore focuses on a comparative question: whether apparent early loss and post-recovery residual loss provide complementary information when contrasting water matrices are tested using the same ceramic membrane and hydraulic conditions. Because only one ceramic nanofiltration configuration was examined, the numerical relationships reported here should be regarded as membrane- and condition-specific. The distinction between apparent and residual permeability loss may also be applicable to membranes with different MWCOs, but the magnitude and ranking of these responses require independent validation across membrane pore-size ranges.
2. Materials and Methods
2.1. Ceramic Nanofiltration Membrane and Filtration System
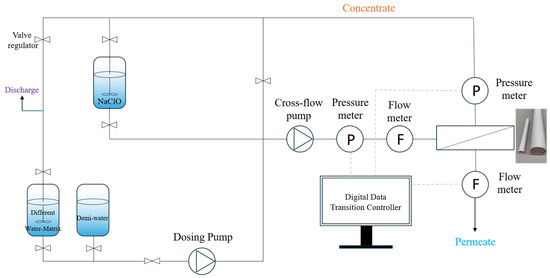
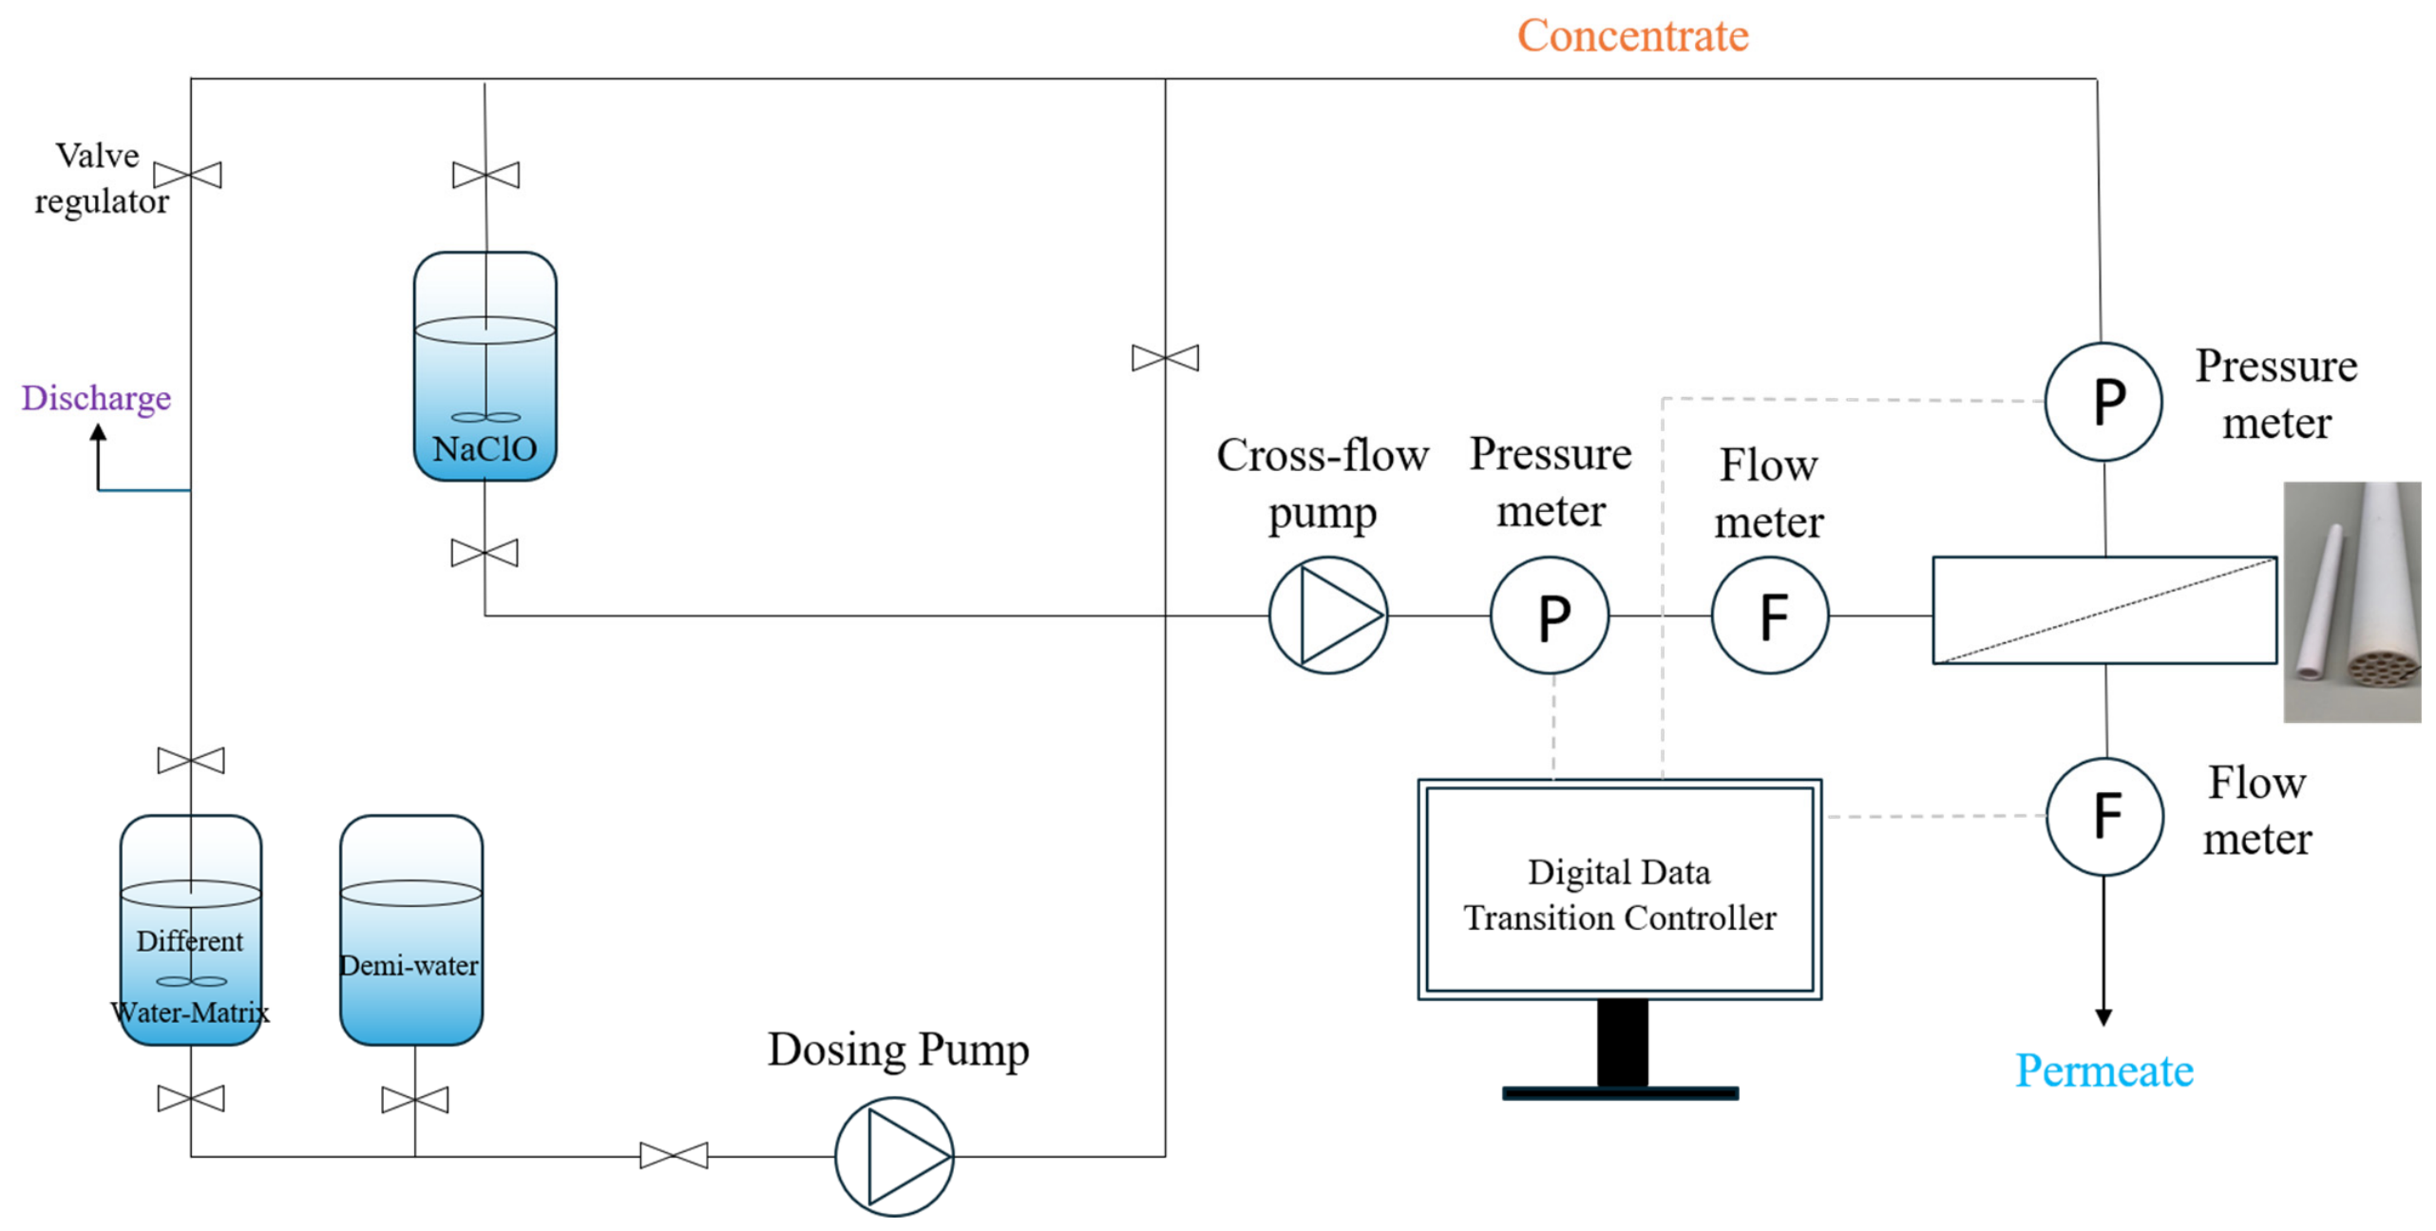
A commercial tubular ceramic nanofiltration membrane (Inopor GmbH, Veilsdorf, Germany) was used. It comprised an α-Al2O3 support and a TiO2 selective layer, with 19 parallel channels of 3.5 mm internal diameter and a module length of 0.5 m. The effective filtration area was 0.1045 m2. The manufacturer-specified molecular weight cut-off was 450 Da, the porosity was 30–40%, and the mean pore diameter was approximately 0.9 nm. Polyethylene glycol characterization of the same membrane configuration indicated an experimental molecular weight cut-off of approximately 591 Da [2]. The filtration arrangement is shown in Figure 1. The same 19-channel tubular membrane module was used for all water matrices and replication experiments. The individual channels were not treated as independent membrane replicates.
Figure 1.
Schematic of the cross-flow ceramic nanofiltration system used for permeability-loss experiments. (Adapted from Ref. [1] under the terms of the Creative Commons CC BY 4.0 license).
Before each experiment, DI water was circulated until the measured permeability varied by less than 3% over 30 min, and the resulting mean permeability was taken as L0. Experiments were conducted in cross-flow mode at 0.65 m s−1 with a target permeate flux of approximately 20 L m−2 h−1. Under constant-flux operation, declining permeability requires an increase in transmembrane pressure (TMP). TMP was evaluated from the mean feed- and concentrate-side pressure relative to the permeate-side pressure. Thus, the arithmetic mean of the two recorded pressures represents TMP when the permeate pressure is taken as the atmospheric reference. Permeability was expressed as permeate flux divided by TMP. The test conditions describe the hydraulic response of this configuration and were not varied to determine a critical flux. The initial feed volume for the 8 h filtration experiments was 20 L, and the experiments were conducted at 25 °C. Both the concentrate and permeate streams were continuously returned to the feed reservoir, maintaining a total-recirculation configuration. Measurements conducted before and after the 8 h filtration period showed that the monitored feedwater-quality parameters changed by less than 10%.
2.2. Water Matrices and Water-Quality Characterization
The six matrices were drinking water (DW), river water (RW), reservoir water (RS), secondary effluent (SE), sodium alginate solution (SA), and sodium alginate with added calcium (SA+Ca). RW was collected from the Schie Canal, RS from De Grote Plas, and SE from the Harnaschpolder wastewater treatment plant in Den Hoorn, the Netherlands. DW denotes drinking water and must be distinguished from the deionized water used for baseline and recovery measurements.
Sodium alginate (SA; Sigma-Aldrich, Singapore) was prepared in deionized water at a nominal concentration of 0.05 g L−1. For the SA+Ca matrix, CaCl2 was added to obtain 3 mM Ca2+, and 1 mM NaHCO3 was used to adjust the solution pH to approximately 7.0. No NaHCO3 was added to the SA formulation. The pH adjustment was intended to establish near-neutral conditions during filtration rather than to promote permeability recovery. Because CaCl2 and NaHCO3 were added only to the SA+Ca formulation, the two alginate matrices differed in calcium content and ionic composition, with associated differences in conductivity and turbidity. As no calcium-free control matched for ionic strength was included, the comparison reflects the combined effects of these formulation changes rather than an isolated calcium-specific effect. DOC was measured using a Shimadzu TOC-VPH analyzer (Kyoto, Japan) with oxidative combustion and infrared detection. Major ions were determined by suppressed-conductivity ion chromatography. Ultraviolet absorbance at 254 nm (UV254), conductivity, turbidity and alkalinity were characterized by spectrophotometric, conductivity, nephelometric and titrimetric methods, respectively. The measured matrix characteristics are summarized in Table 1. Specific ultraviolet absorbance was calculated as SUVA254 = 100 × UV254/DOC, with UV254 in cm−1 and DOC in mg C L−1, giving units of L mg C−1 m−1. SUVA254 was included as a comparative descriptor of bulk organic character across the six matrices. It was not used as evidence of aromatic foulants in the alginate model solutions or as a direct measure of membrane-fouling propensity [33].
Table 1.
Measured physicochemical characteristics of the six water matrices.
2.3. Filtration Response and Recovery Metrics
Permeability was normalized to the initial deionized-water permeability, L0, to give ℓ(t) = L(t)/L0. Filtration trajectories were followed for 8 h, with 0–60 min designated as the early-response window. Apparent initial permeability loss (IPL) was defined as IPL = 1 − L60/L0, where L60 represents the membrane permeability after 60 min of exposure to the test matrix and L0 represents the initial clean-membrane permeability measured using DI water. Multiplication by 100 expresses the loss as a percentage. This normalization measures the overall hydraulic response and does not independently separate deposited resistance from concentration polarization or osmotic effects. The 30 min period described above was used only to establish a stable clean-water baseline, whereas the 60 min interval was selected as the comparative early-exposure window. Residual impairment continued to develop between 30 and 60 min for the more responsive matrices, while 60 min remained short relative to the complete 8 h filtration trajectory. The 30 min DI-water recovery period was adopted as a fixed operational endpoint for comparison across the tested matrices. Because longer recovery durations were not systematically evaluated, the resulting residual IPL values should not be interpreted as a time-independent or universally irreversible fraction of the observed permeability loss.
Following each prescribed exposure period, the remaining feed was drained from the filtration loop and replaced with deionized (DI) water. DI water was then introduced to sufficiently displace the residual test solution from the hydraulic circuit. During recovery, the water leaving the system was continuously discharged and was not returned to the DI-water reservoir, thereby avoiding recirculation of residual feed components. Recovery filtration was conducted under the same permeate flux, cross-flow velocity, and temperature as the preceding filtration step, while TMP was allowed to vary under constant-flux control. Permeability progressively approached a stable plateau during the DI-water recovery stage. After 30 min of DI-water recovery, the measured permeability was denoted Lrec(te), where te represents the preceding exposure duration. Recovered normalized permeability was expressed as Lrec(te)/L0. Residual permeability loss, IPLres(te), was defined as IPLres(te) = 1 − Lrec(te)/L0. Thus, recovered normalized permeability describes the fraction of the initial permeability retained after recovery, whereas residual IPL represents the remaining permeability impairment relative to the initial clean-water baseline. Exposure durations of 5, 15, 30 and 60 min were examined. Figure 3b presents DW, RS, SE and SA+Ca as representative matrices, while the 60 min values were used for comparisons across all six matrices. Residual loss therefore represents the impairment remaining after the specified DI-water recovery procedure and should not be interpreted as chemically irreversible fouling.
At the end of each complete experimental cycle, the membrane was cleaned for 60 min with a NaClO solution containing 0.2% available chlorine. Cleaning was considered satisfactory when the subsequent DI-water permeability reached at least 98% of the initial clean-membrane value under the same measurement conditions. Water exchange, DI-water hydraulic recovery, and chemical cleaning were treated as distinct operations. Water exchange removed the original test solution from the filtration circuit, DI-water recovery quantified the remaining hydraulic impairment after a fixed 30 min intervention, and subsequent NaClO cleaning was used to restore the membrane before the next experimental cycle. The DI-water recovery result was not interpreted as a universal separation between reversible and irreversible fouling.
For the 60 min exposure comparison, the recovered loss component was calculated as IPLrev = IPL − IPLres, and the reversibility ratio was defined as RR = IPLrev/IPL. IPLrev represents the absolute portion of the initial permeability loss recovered during the specified DI-water intervention, whereas RR represents that recovered portion relative to the apparent initial loss. Consequently, a high recovered permeability, Lrec/L0, and a high RR are different quantities: the former describes proximity to the clean-water baseline, whereas the latter is the fraction of the observed initial loss that was recovered. The early decline index, kearly, was obtained as the negative slope of a linear least-squares fit of ln[L(t)/L0] versus time over the 0–60 min window. It was treated as a descriptive trajectory index rather than a mechanistic rate constant. Throughout this study, apparent IPL refers specifically to the permeability loss after 60 min of feed exposure. Residual losses measured after shorter exposure periods are identified separately using the exposure-duration-dependent notation IPLres(te).
2.4. Statistical Analysis
Apparent and residual losses are presented as means with standard deviations from three independent experiments, as specified for the recovery dataset. Correlations were calculated across the six water-matrix means, not by treating three replicates as independent water types. Eight water-quality descriptors were compared with IPL, kearly, IPLres and RR using Pearson correlation. Ordinary least-squares regressions with an intercept were used for IPLres versus IPL and for IPL versus DOC. For these six-point regressions, R2 equals the squared Pearson correlation coefficient; two-sided p values for zero correlation were calculated with four degrees of freedom [34].
The correlation matrix was treated as exploratory. No individual cell was used to declare a causal determinant or to select a multivariable predictive model. The 32 descriptor–response comparisons were not assigned confirmatory significance labels; any future inferential screening should address multiplicity, for example, using false-discovery-rate control [35]. Sensitivity was examined by omitting each matrix in turn from the two reported regressions. Group-level comparisons were interpreted descriptively rather than assigned new pairwise significance tests from summary values. This distinction between measurement uncertainty, biological or experimental replication, and between-matrix variation is important in membrane studies [36]. Three independent filtration–recovery experiments were performed for each reported recovery condition. Each experiment involved a separate filtration and DI-water recovery sequence, rather than repeated measurements from a single filtration trajectory. The three replicates represent independent filtration–recovery runs conducted using the same reusable ceramic membrane module, rather than independent membrane preparations. Recovery of the initial DI-water permeability after chemical cleaning was used as a hydraulic acceptance criterion but does not independently verify restoration of the original membrane-surface chemistry.
3. Results and Discussion
3.1. Water Matrices Exhibit Distinct Organic and Inorganic Characteristics
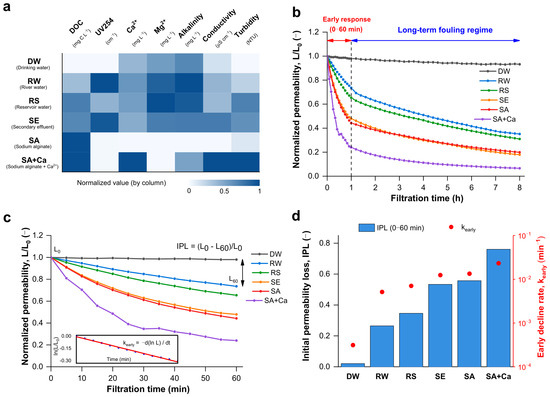
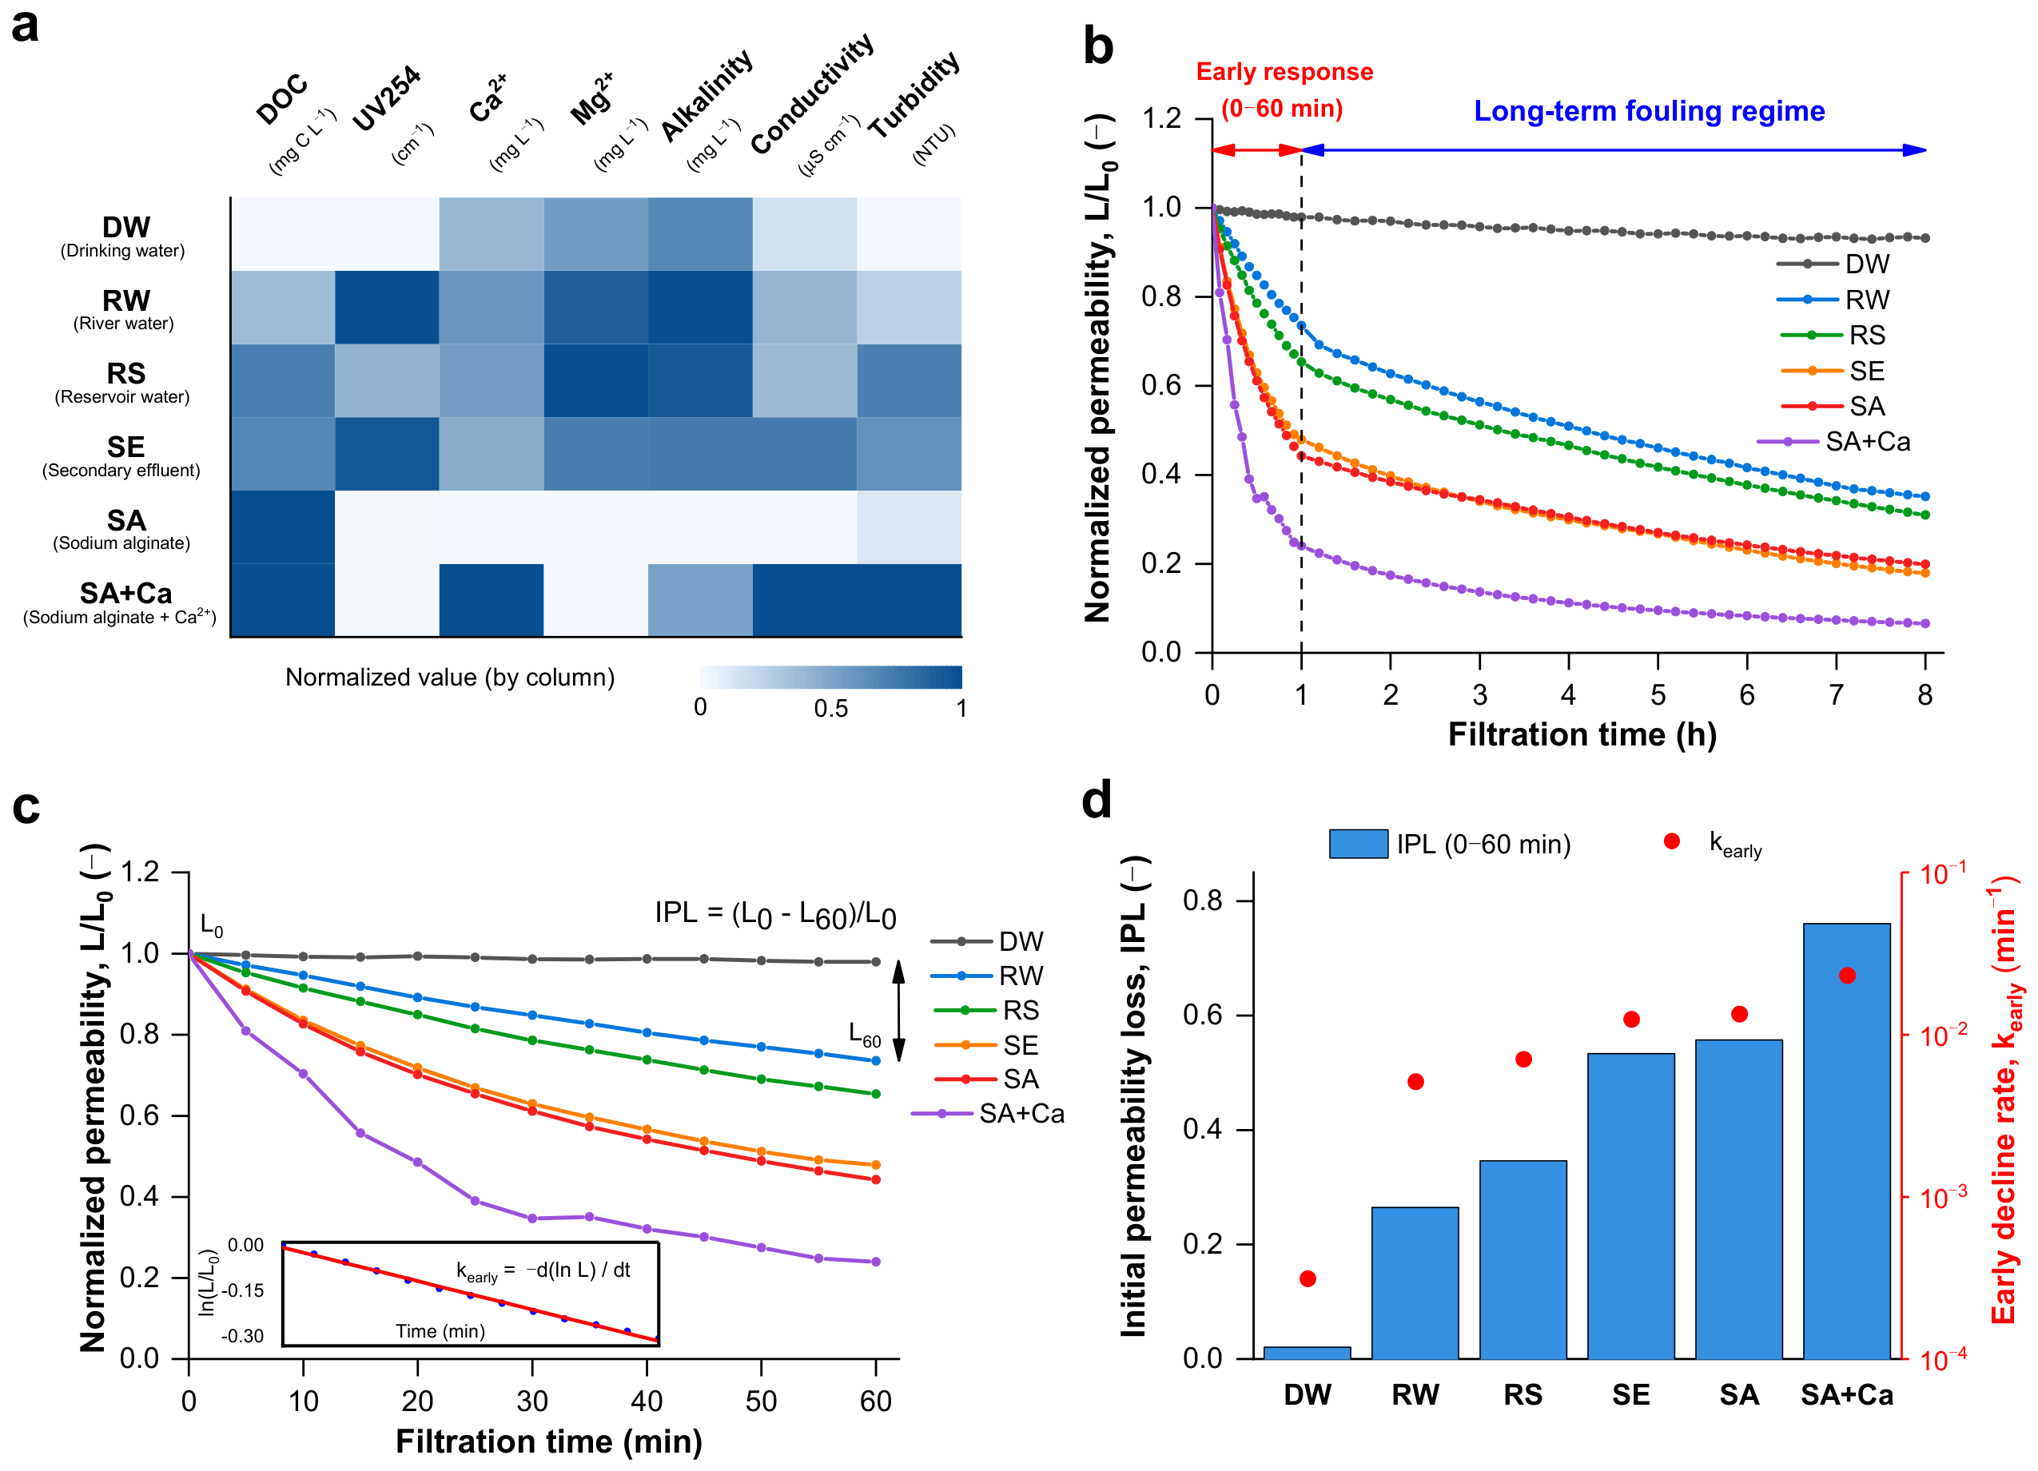
The matrices differed in organic concentration, ultraviolet absorption, and mineral composition (Table 1; Figure 2a). DW contained 0.46 mg C L−1 DOC and had a turbidity of 0.02 NTU. DOC concentrations were 6.43 mg C L−1 in RW, 12.39 mg C L−1 in RS, and 11.56 mg C L−1 in SE. The corresponding UV254 values were 0.18, 0.08, and 0.17 cm−1, respectively. Thus, RW contained less DOC than RS but exhibited more than twice its ultraviolet absorbance. Calculated SUVA254 values were 2.80, 0.65, and 1.47 L mg C−1 m−1 for RW, RS, and SE, respectively. These differences highlight that organic concentration and optical character are not interchangeable proxies for one another.
Figure 2.
Water-matrix-dependent early permeability responses during ceramic nanofiltration: (a) Normalized physicochemical characteristics of the six water matrices, including drinking water (DW), river water (RW), reservoir water (RS), secondary effluent (SE), sodium alginate solution (SA), and sodium alginate supplemented with Ca2+ (SA+Ca); (b) evolution of normalized permeability (L/L0) during 8 h of filtration, with the first 60 min defined as the early-response regime; (c) magnified permeability evolution during the first 60 min, illustrating the definition of apparent initial permeability loss (IPL) and the early decline index (kearly); (d) comparison of apparent IPL and the descriptive early decline index (kearly) across the six matrices.
The measured DOC concentrations of SA and SA+Ca were 16.97 and 17.02 mg C L−1, respectively, indicating nearly identical bulk organic carbon concentrations. Both formulations also exhibited very low SUVA254 values of approximately 0.059 L mg C−1 m−1. Calcium increased from approximately 0.001 to 121.022 mg L−1 between these two matrices. Conductivity also increased from 244 to 1087 μS cm−1, and turbidity from 0.3 to 2.4 NTU. The comparison therefore tests the consequences of calcium addition to the alginate preparation, including associated changes in solution chemistry and aggregation. It does not isolate a single calcium-binding pathway at otherwise identical ionic strength. In the environmental waters, calcium ranged from 48.673 to 71.277 mg L−1 and did not follow the DOC ranking.
No single bulk water-quality descriptor captured these compositional contrasts. For example, SE had less DOC than RS but higher conductivity, whereas SA had high DOC and low ultraviolet absorption. Organic fractionation can distinguish biopolymers, humic substances and lower-molecular-weight material that bulk DOC combines [37]. Previous work on low-pressure membrane fouling similarly emphasizes that organic characteristics, not concentration alone, affect the response [38]. The chemistry measurements define distinct test conditions, while the filtration and recovery measurements determine their hydraulic consequences.
3.2. Initial Loss Differentiates Matrices but Does Not Fully Rank Longer-Term Performance
Apparent IPL after 60 min increased in the order DW < RW < RS < SE < SA < SA+Ca (Figure 2c,d). The corresponding losses were 2.05 ± 0.32%, 26.46 ± 3.88%, 34.63 ± 4.02%, 52.12 ± 4.22%, 55.76 ± 4.32%, and 76.04 ± 2.89%. DW therefore retained approximately 98% of its initial permeability during the early window, whereas SA+Ca retained approximately 24%. This wide spread was observed with the same membrane configuration and nominal operating conditions, demonstrating a strong matrix dependence on the initial hydraulic response.
The early decline index followed the same overall progression: approximately 3.12 × 10⁻⁴ min−1 for DW, 5.12 × 10⁻³ for RW, 7.04 × 10⁻³ for RS, 1.24 × 10⁻² for SE, 1.34 × 10⁻² for SA, and 2.31 × 10⁻² for SA+Ca. The early decline index was approximately 73% higher for SA+Ca than for SA. The rate and endpoint loss summarize related features of the same trajectory and should not be considered independent mechanistic evidence. Departures from a straight logarithmic decline, especially for SA+Ca, also caution against extrapolating an early rate coefficient throughout a longer filtration cycle.
After 8 h, normalized permeability was approximately 0.932 for DW, 0.351 for RW, 0.310 for RS, 0.179 for SE, 0.199 for SA, and 0.066 for SA+Ca (Figure 2b). The lowest- and highest-loss matrices remained clearly separated. However, SE ultimately had lower permeability than SA despite its slightly smaller initial loss. Thus, the early response identifies broad differences in susceptibility but does not preserve every pairwise ranking over time. This is consistent with the evolution of fouling observed in model extracellular polymer filtration [39]: initial interactions and later deposit development need not contribute in fixed proportions.
A loss in J/TMP should be termed apparent when the individual contributions to the driving force and resistance have not been resolved. Accumulating organics can generate a deposit while simultaneously changing near-surface concentration and osmotic conditions. The influence of these effects in nanofiltration has been documented by Kilduff and co-workers [21]. Consequently, the present IPL comparison is operationally informative without requiring every unit of early loss to be assigned to a permanent deposit. Under the constant-flux conditions used, the hydraulic signature of decreasing permeability is increasing TMP.
3.3. Residual Permeability Loss Reveals Persistence Established During Early Filtration
Residual IPL after the 60 min exposure was 1.26 ± 0.42% for DW, 10.77 ± 2.88% for RW, 14.77 ± 3.83% for RS, 20.13 ± 2.24% for SE, 25.04 ± 3.14% for SA, and 41.38 ± 4.58% for SA+Ca (Figure 3a). The recovered portions of the initial permeability loss (IPLrev = IPL − IPLres) were therefore 0.79, 15.69, 19.86, 31.99, 30.72, and 34.66 percentage points, respectively. Although SA+Ca recovered a large absolute amount, it also retained the greatest impairment. Recovery magnitude alone would therefore give an incomplete assessment of this matrix.
RR values were approximately 0.385, 0.593, 0.573, 0.614, 0.551 and 0.456 for DW, RW, RS, SE, SA and SA+Ca, respectively. SE recovered the largest fraction of its initial loss, whereas SA+Ca had a smaller recovery than SA. DW illustrates the sensitivity of a ratio when the initial loss is small: its recovered permeability was close to the baseline, approximately 98.74%, but RR was only about 0.39 because the denominator was a loss of just 2.05%. DW should therefore be described as showing little absolute persistent impairment, rather than the highest fractional reversibility. Direct comparison of RR across very small and large losses warrants caution.
Figure 3.
Apparent and residual permeability losses across water matrices and their dependence on exposure duration: (a) Apparent initial permeability loss (IPL) after 60 min of filtration and residual permeability loss (IPLres) following 30 min of DI-water recovery for all six matrices. (b) Residual permeability loss measured after separate exposure periods of 5, 15, 30, and 60 min, each followed by the same 30 min DI-water recovery procedure, for DW, RS, SE, and SA+Ca. Values are expressed relative to the initial clean-membrane DI-water permeability (L0) and presented as mean ± SD from three independent experiments (n = 3).
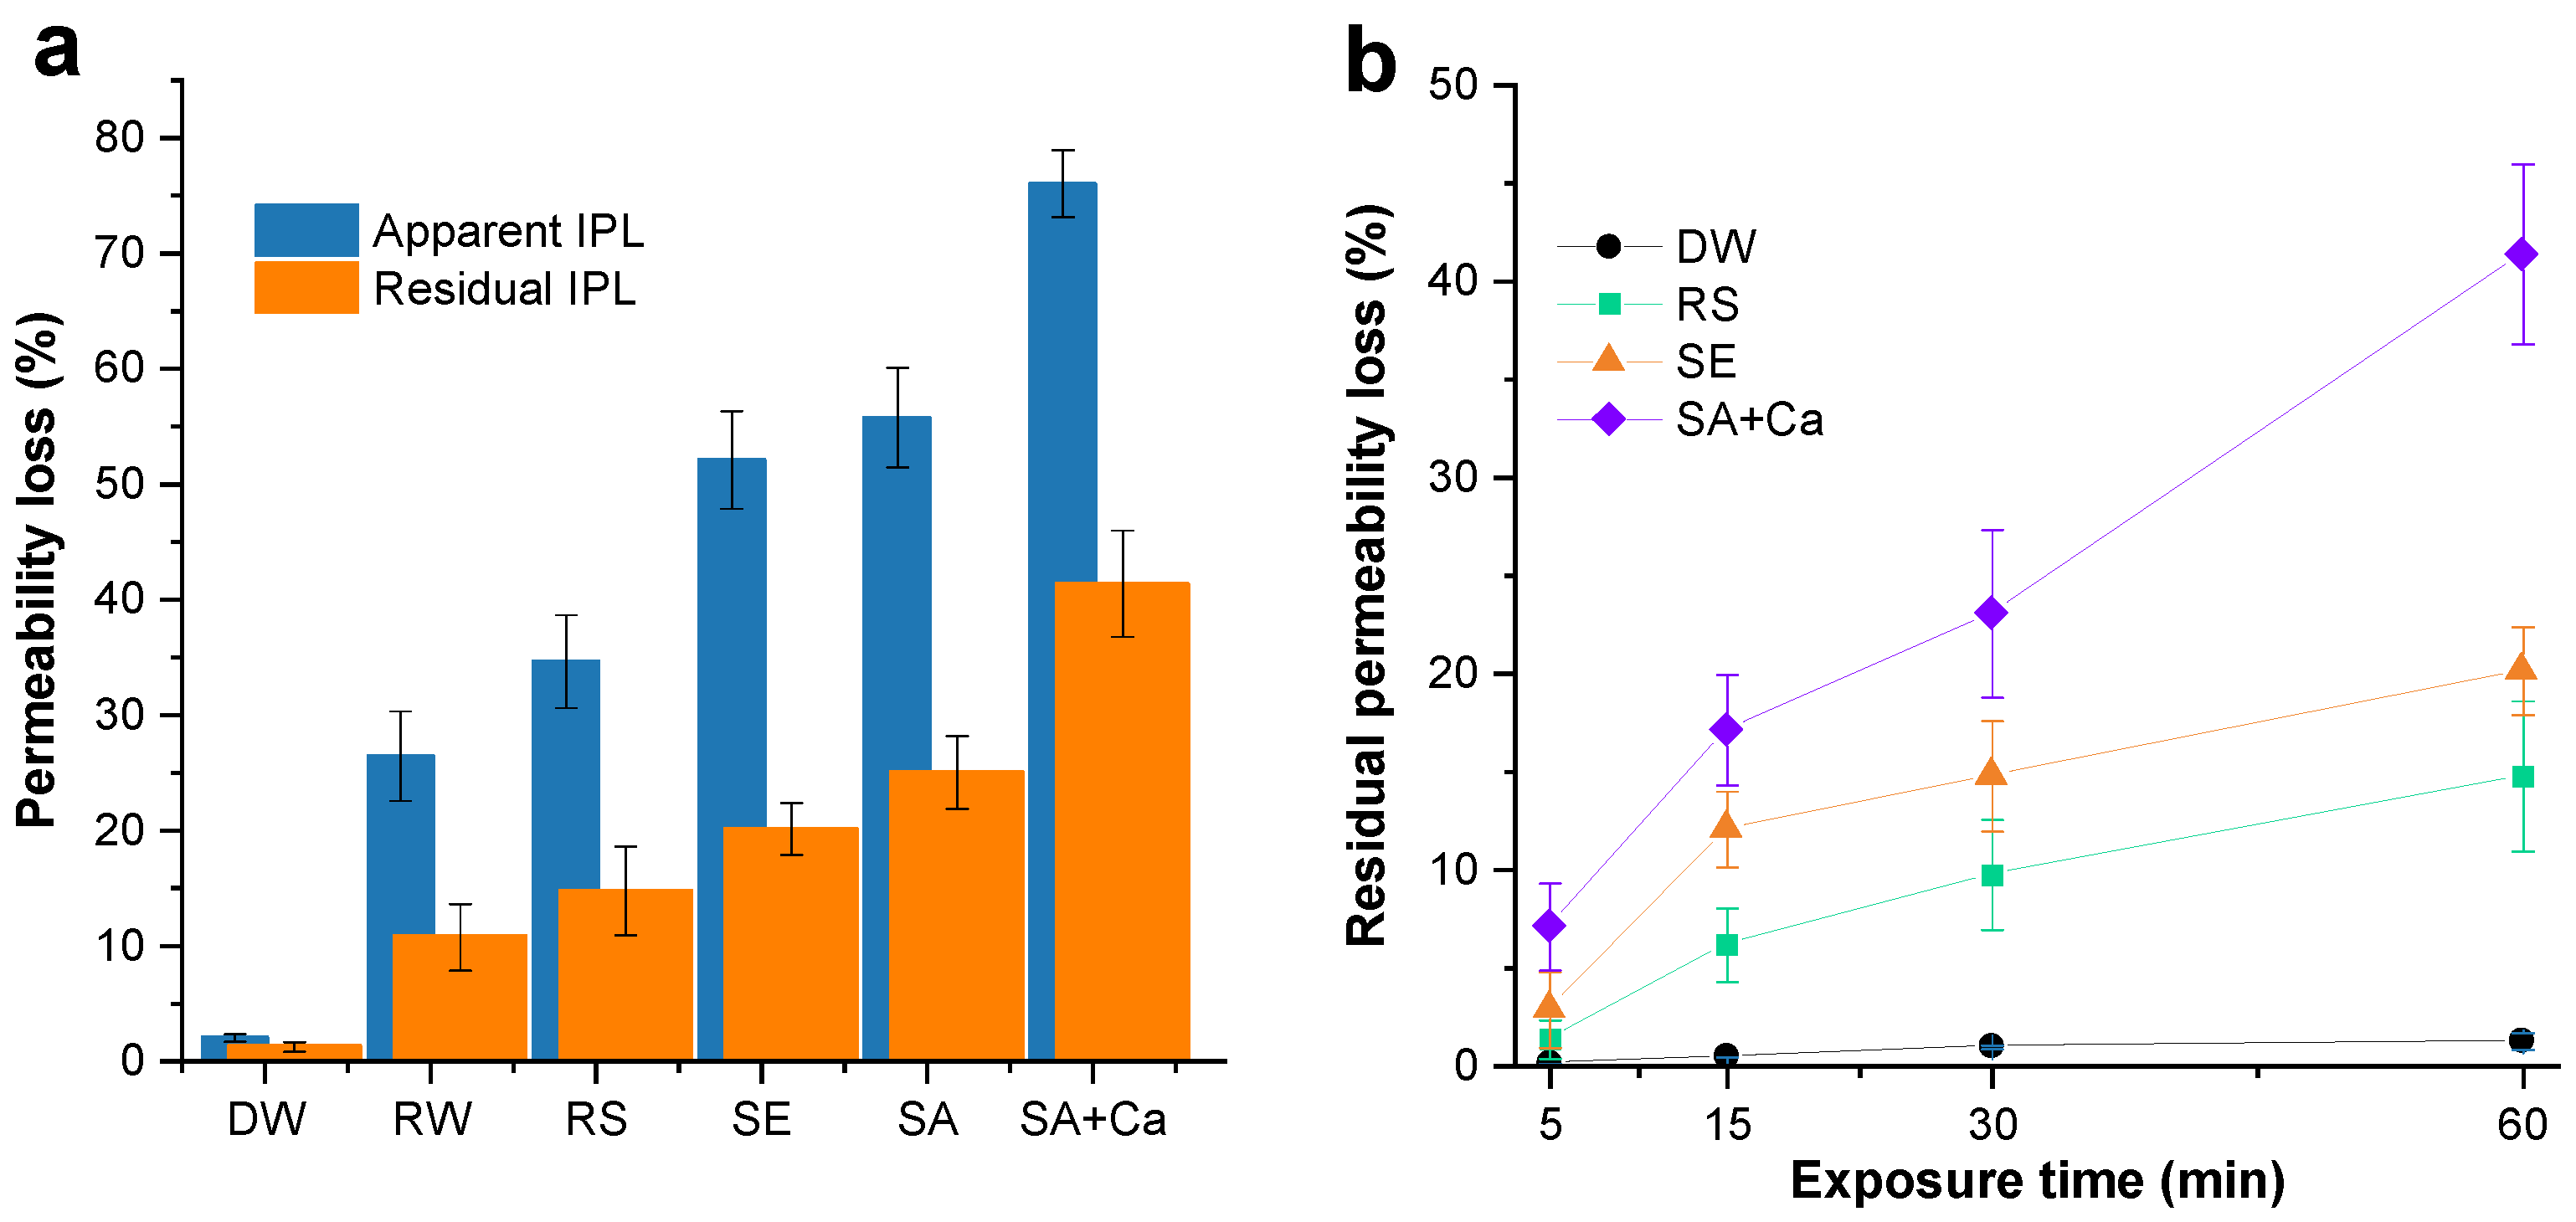
Residual impairment became detectable well before the end of the first hour and increased progressively with exposure time (Figure 3b). For DW, residual loss increased from approximately 0.13% after 5 min of exposure to 1.26% after 60 min. The corresponding changes were 1.37% to 14.77% for RS, 2.87% to 20.13% for SE, and 7.10% to 41.38% for SA+Ca. At 15 min, SA+Ca already showed 17.12% residual loss; at 30 min, the value was 23.07%. These are exposure-time responses followed by recovery, not measurements taken at successive times during one recovery step. Their practical implication is that waiting until a long filtration period has elapsed may miss a substantial early accumulation of persistent loss.
Studies of natural organic matter fouling in ceramic and polymeric ultrafiltration have distinguished reversible and irreversible fouling contributions [40]. Cleaning experiments with ceramic ultrafiltration membranes also show that recovery depends on the cleaning chemistry and the foulant mixture, including alginate–calcium combinations [41]. These observations provide context rather than direct validation for nanofiltration, which has a different pore-size range. The present recovery measurements are consistent with a persistent component but do not discriminate among adsorption, pore-related effects, retained surface deposits and incompletely relaxed concentration effects. In particular, a DI-water recovery result cannot establish the efficiency of chemical cleaning, which was not compared as an outcome in this analysis.
3.4. Exploratory Associations Between Water-Matrix Characteristics and Permeability Responses
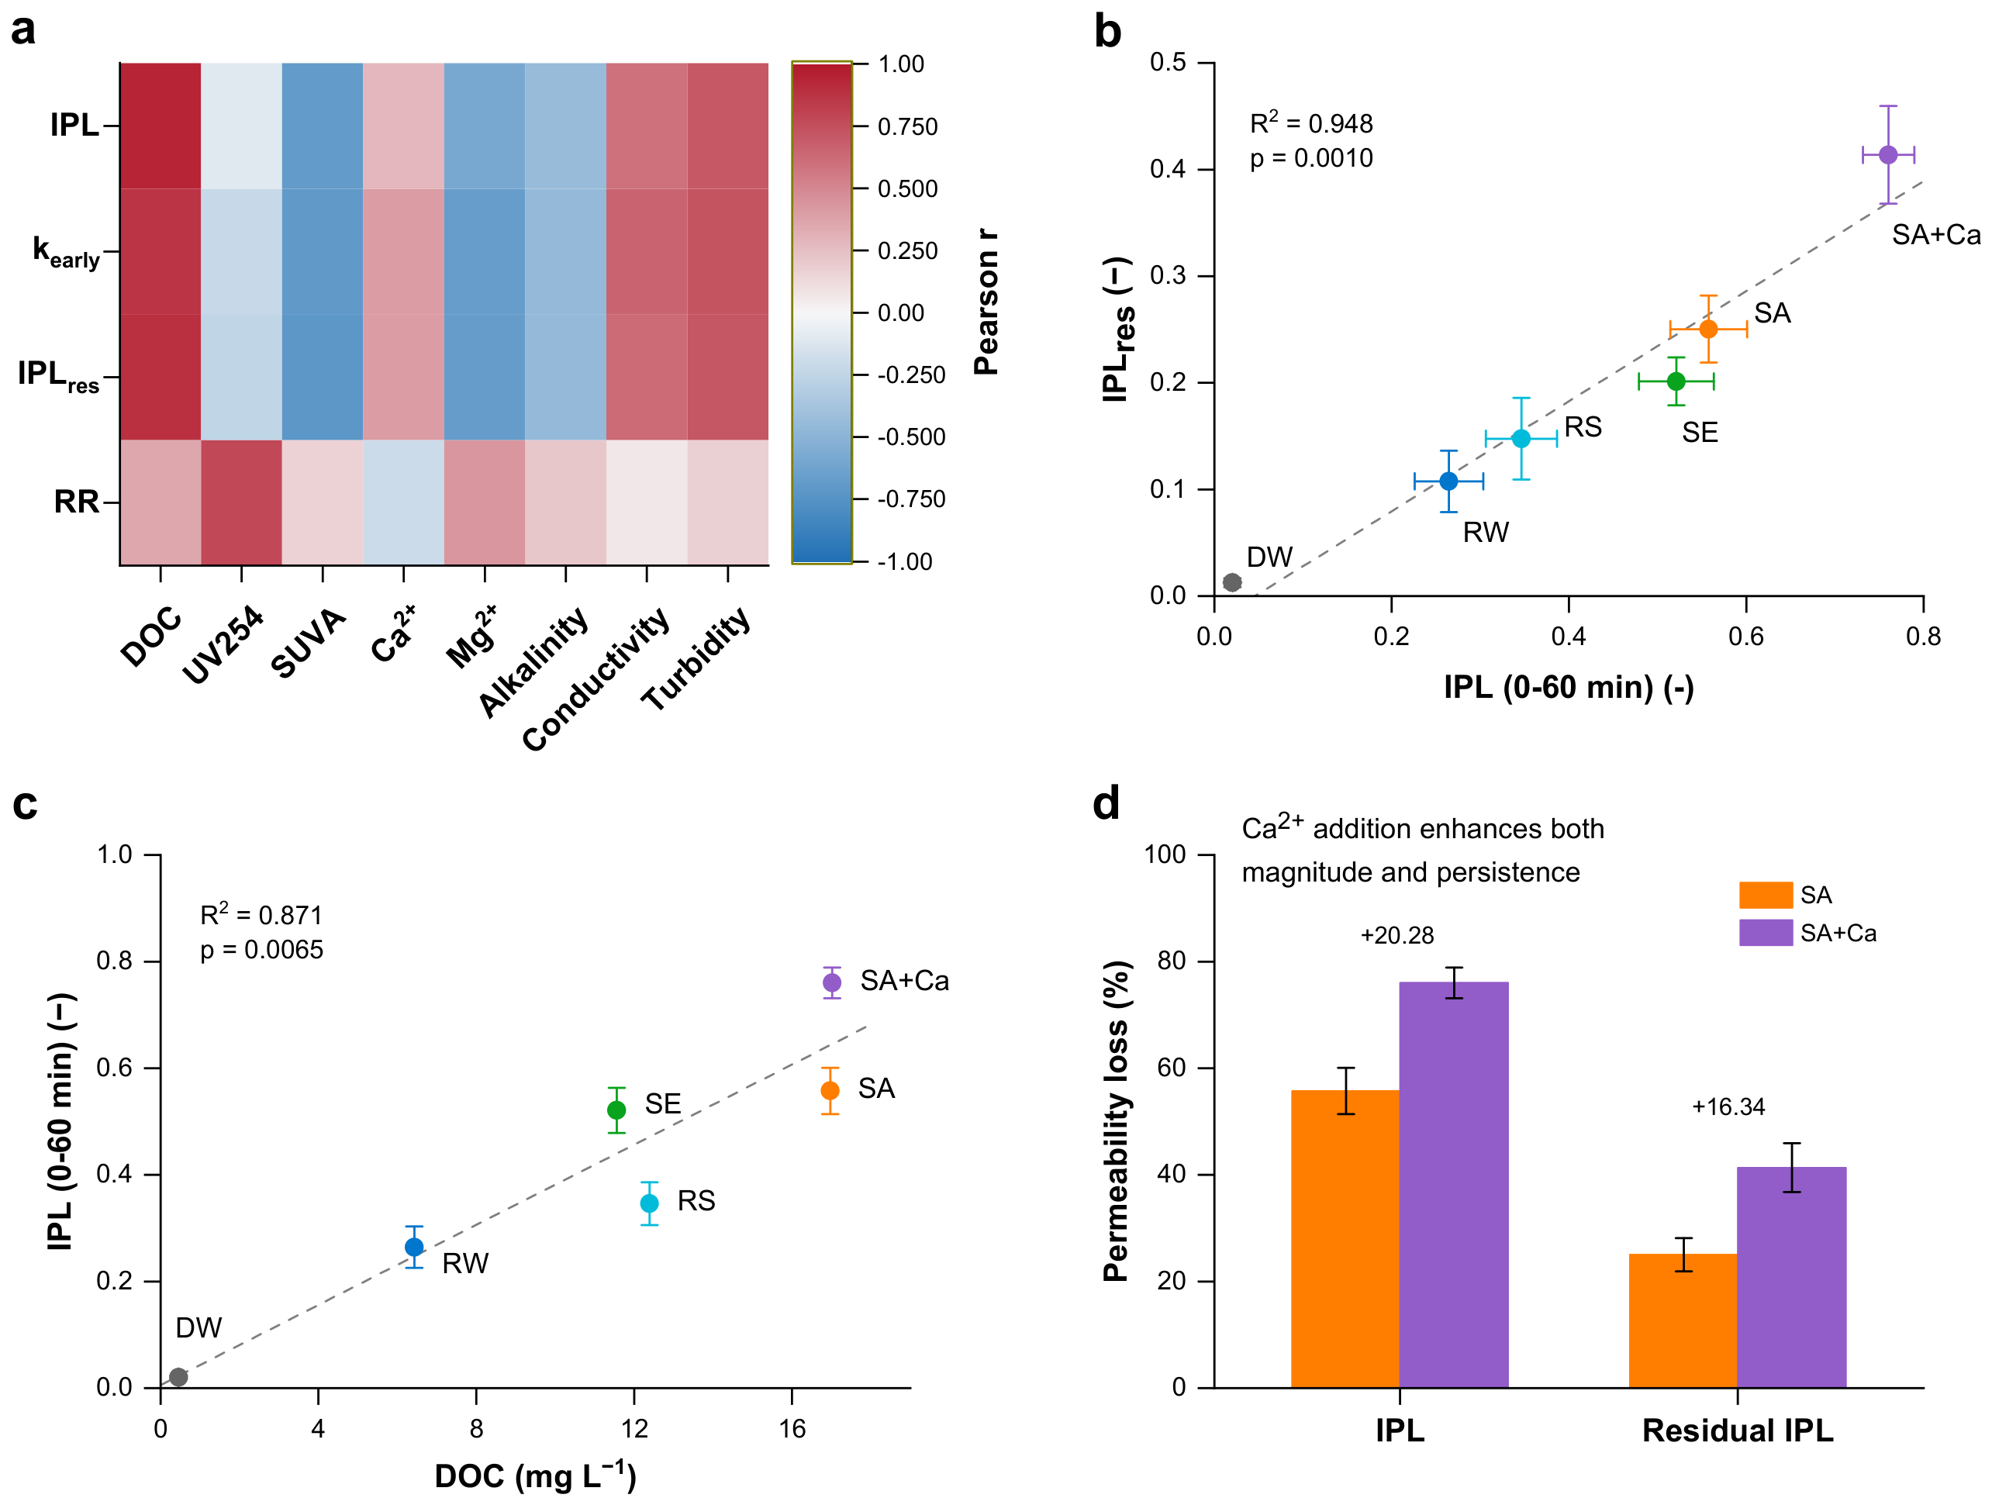
Across the six matrix means, residual and apparent IPL were strongly positively associated (Figure 4b). The fitted relation was IPLres = 0.516 × IPL − 0.0237, with R2 = 0.948 and p = 0.0010. Omitting one matrix at a time gave R2 values of approximately 0.943–0.982, indicating that the association was not produced solely by one endpoint matrix. Nevertheless, the equation is a descriptive fit within the observed range. Its negative intercept is not physically meaningful as a prediction of negative residual loss, and the shared normalization by L0 may contribute to correlated uncertainty. Neither the regression nor the omission analysis constitutes independent predictive validation. The high association does not make residual IPL redundant: two matrices with similar initial losses may retain different amounts of impairment after an identical recovery intervention. Importantly, the six water matrices were selected to represent contrasting physicochemical conditions rather than randomly sampled from a common source-water population. The reported correlations therefore describe between-matrix associations within this particular experimental set and should not be generalized to arbitrary water matrices. The shared normalization by initial clean-membrane permeability may also contribute to mathematical coupling and correlated measurement uncertainty between apparent and residual IPL.
Figure 4.
Water-matrix associations with the magnitude and persistence of early permeability loss: (a) Pearson correlation matrix between water-quality descriptors (DOC, UV254, SUVA254, Ca2+, Mg2+, alkalinity, conductivity, and turbidity) and early permeability-response metrics, including IPL, kearly, IPLres, and the recovery-related metric reversibility ratio (RR); (b) relationship between apparent IPL and residual IPL across the six water matrices; (c) relationship between DOC concentration and apparent IPL; and (d) comparison of apparent and residual IPL between the SA and SA+Ca formulations, reflecting the combined effects of calcium addition and associated changes in solution chemistry. [Correlations in panels (a–c) are descriptive across the six matrix means and should not be interpreted as causal relationships or independently validated predictive models. RR denotes the reversibility ratio, RR = (IPL − IPLres)/IPL, rather than recovered permeability. A low RR does not necessarily indicate a large absolute residual loss, particularly when apparent IPL is small].
Measured DOC was positively associated with apparent IPL (Figure 4c): IPL = 0.0376 × DOC + 0.0058, with DOC in mg C L−1, R2 = 0.871, and p = 0.0065. The corresponding Pearson coefficient was 0.933. Leave-one-matrix-out R2 values ranged from 0.713 to 0.927, showing greater sensitivity than the apparent–residual relationship. The environmental and model matrices jointly define this association; it must not be interpreted as a calibrated dose–response curve for changing DOC within any one source water.
The heatmap provides additional context (Figure 4a). DOC correlated positively with kearly and residual IPL, with r approximately 0.87 and 0.89, respectively. Turbidity and conductivity also showed positive associations with the loss metrics, whereas Mg2+, alkalinity and SUVA254 showed negative associations in this set. UV254 was only weakly negatively associated with apparent IPL (r ~ 0.11). These signs primarily describe the contrast among the selected matrices, including the low-UV, high-DOC alginate waters; they do not demonstrate that increasing magnesium, alkalinity or aromaticity would suppress fouling in a controlled experiment.
The SA–SA+Ca comparison is particularly instructive. Although the pooled correlation between measured calcium concentration and apparent IPL was modest (r ~ 0.29), the SA+Ca formulation showed greater loss than SA. Pooling water types with different organic composition can therefore obscure an interaction apparent within a paired preparation. Co-existing ions can also affect ceramic nanofiltration behavior beyond their individual concentrations [42]. Furthermore, SUVA contains DOC in its denominator, so associations involving both descriptors are not independent. With six matrices and eight chemical descriptors, mechanistic interpretation should rely on controlled comparisons and established chemistry, not the color or sign of a single heatmap cell. Accordingly, DOC should be interpreted as a matrix-associated descriptor rather than an independent quantitative predictor of fouling severity.
3.5. The SA+Ca Formulation Exhibits Greater Hydraulic Loss and Persistence
Compared with SA, the SA+Ca formulation exhibited a higher apparent IPL (76.04% versus 55.76%), corresponding to a difference of 20.28 percentage points, or approximately 36% in relative terms. Residual IPL also increased from 25.04% to 41.38%, representing a difference of 16.34 percentage points, or approximately 65% in relative terms (Figure 4d). The larger relative difference in residual IPL indicates that the SA+Ca formulation was associated with greater impairment remaining after DI-water recovery. The fraction remaining after recovery (IPLres/IPL) also increased from approximately 0.449 to 0.544. These observations indicate a stronger and more persistent hydraulic response in the SA+Ca formulation, but do not independently establish the contribution of calcium-specific interactions.
One plausible explanation is the association of alginate chains through calcium binding, promoting a retained, hydraulically restrictive organic layer. Calcium-dependent polysaccharide gel formation and stronger foulant–foulant adhesion have been directly demonstrated elsewhere [25,26]. Severe alginate fouling under calcium-containing conditions has also been reported for reverse osmosis [43], while analyses of organic gel layers show why deposit structure and hydraulic response must be considered together [44]. These studies support calcium-mediated alginate association as a plausible explanation for the observed behavior, although its individual contribution cannot be distinguished from the accompanying changes in ionic strength and aggregation behavior in the present experiments.
Several alternatives remain coupled to calcium addition. The accompanying rise in conductivity changes electrostatic screening, and the increase in turbidity indicates a change in suspended or aggregated material. Free calcium activity was not separately resolved from total measured calcium. Calcium carbonate scaling cannot be diagnosed from calcium and alkalinity values alone: solution speciation, saturation conditions and deposit characterization would be needed [45]. Thus, the results establish an enhanced loss associated with adding calcium to this alginate preparation, but not the exclusive contribution of molecular bridging, aggregation, mineral deposition or a change in osmotic conditions.
3.6. Comparative Interpretation and Practical Implications
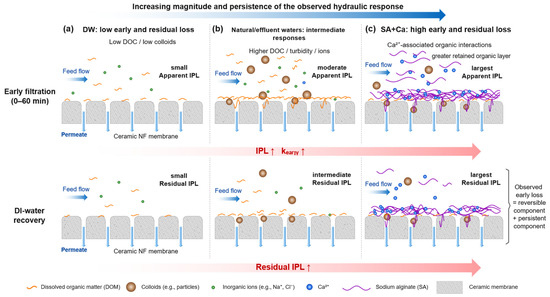
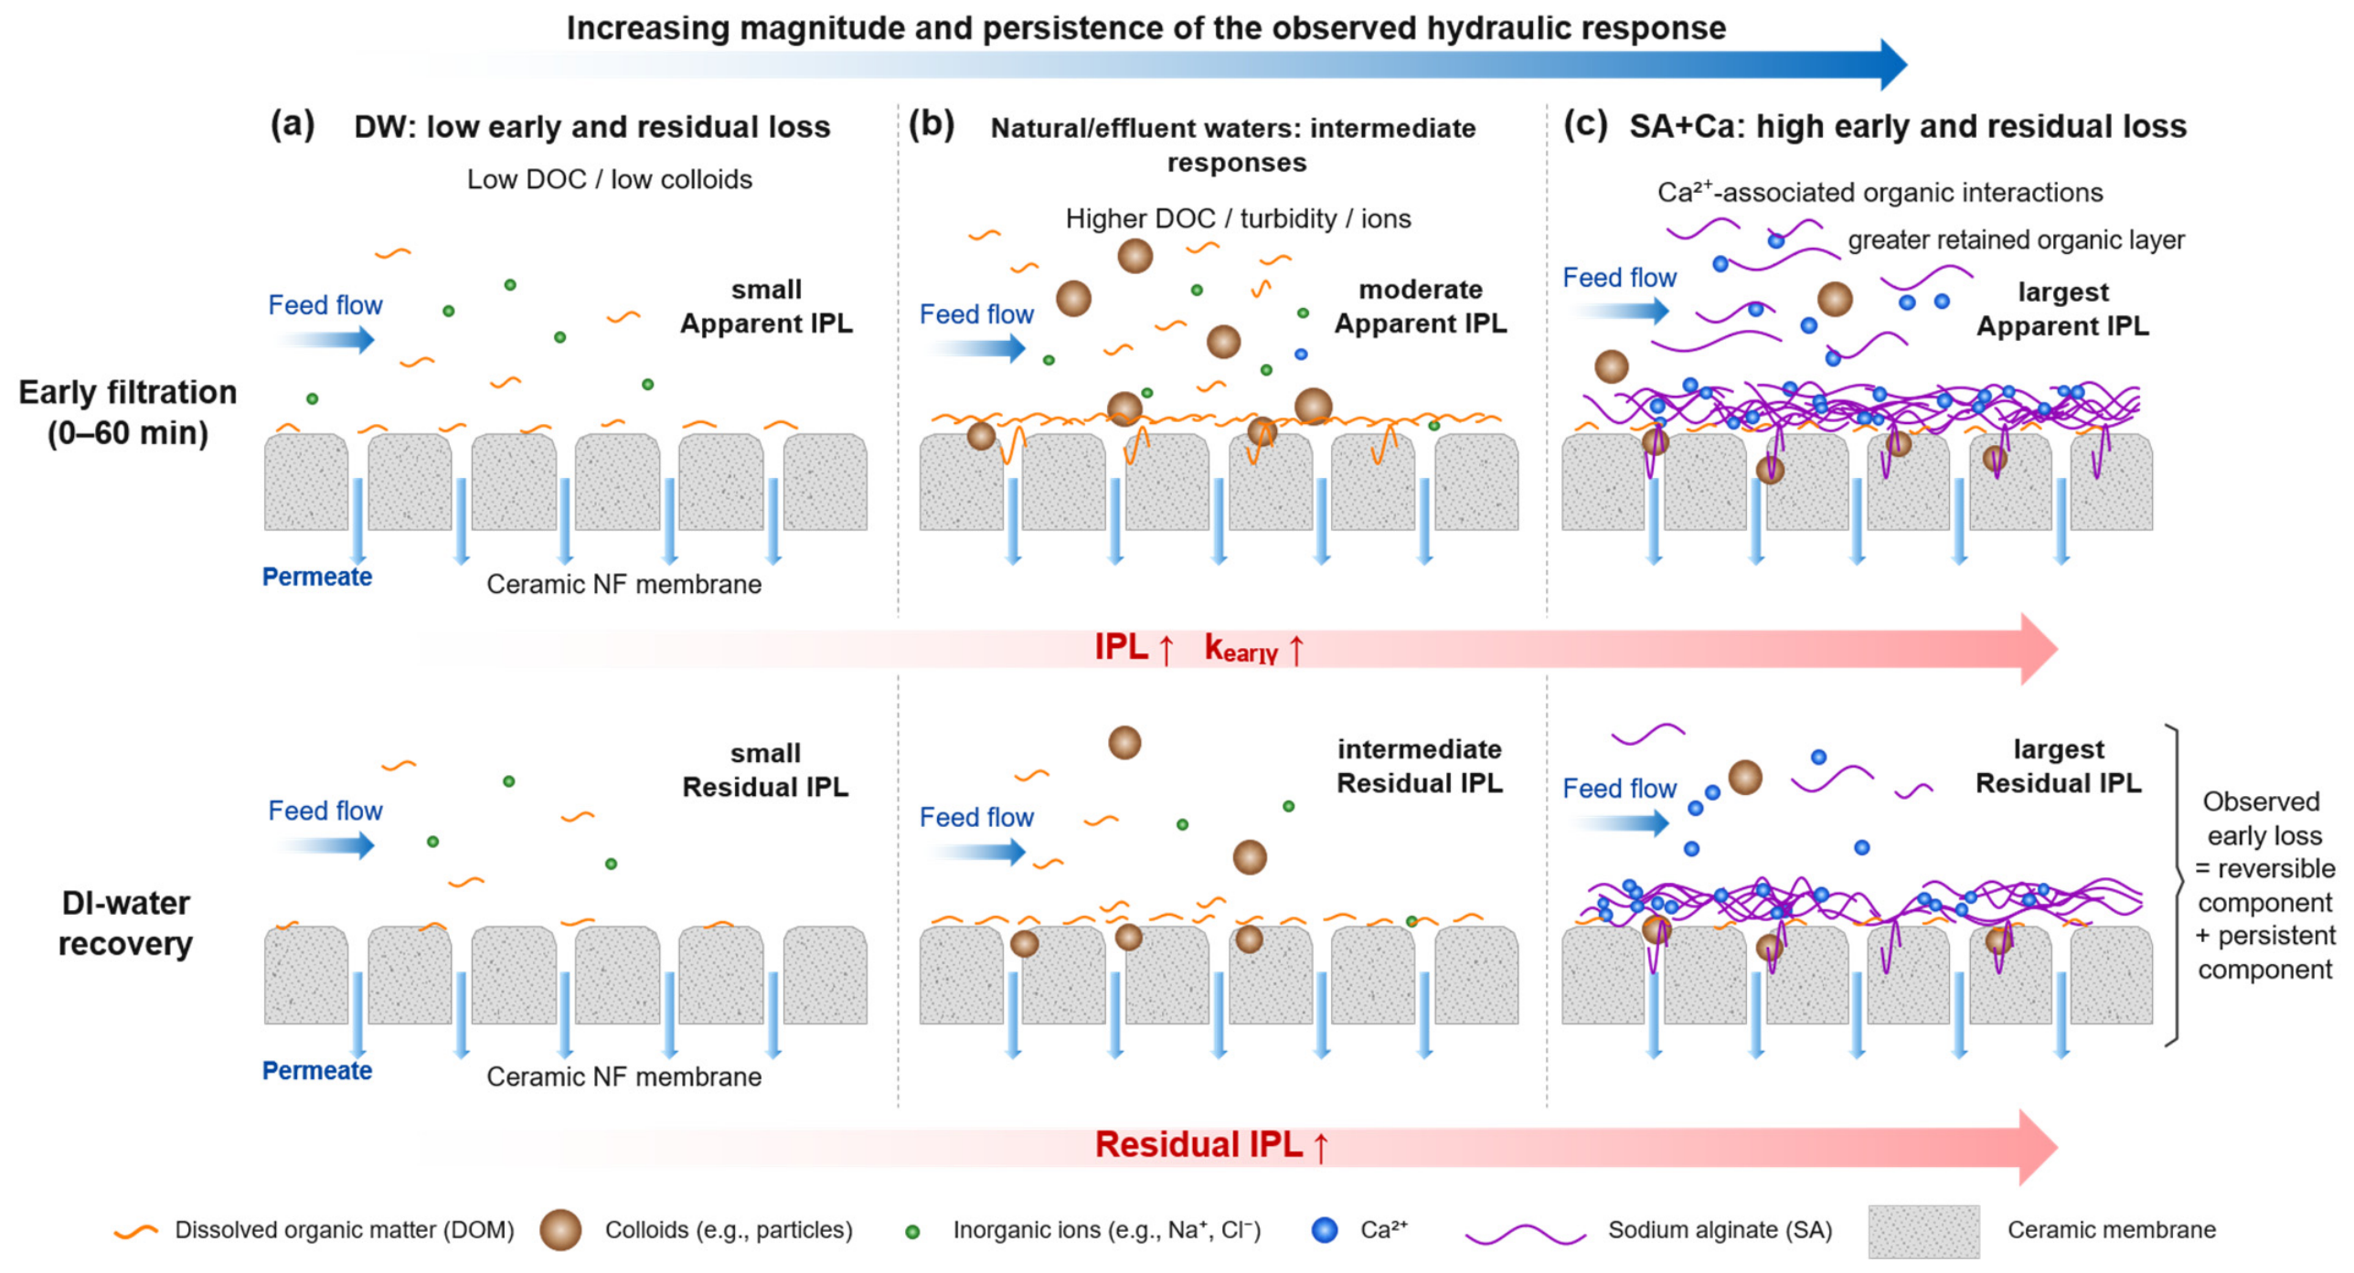
Figure 5 presents a conceptual progression from little absolute impairment in DW to larger and more persistent losses in organic-rich and calcium-containing matrices. The evidence supporting this progression is hydraulic: the early trajectories, the post-recovery losses and their exposure-time dependence. Adsorption at the selective layer, deposition at the interface and consolidation within an organic layer are candidate processes. Observations of early cake-layer growth in ultrafiltration show that deposit microstructure can evolve during the initial period [46], but the present dataset contains no direct microscopic measurement of cake thickness, compaction or pore penetration. The drawing should consequently be interpreted as a mechanistic hypothesis rather than a characterization result, and direct SEM/EDS characterization will be required to verify the nature and composition of the retained layer.
Figure 5.
Conceptual framework linking water-matrix conditions to the magnitude and persistence of early hydraulic impairment.
Operationally, pairing apparent IPL with residual IPL enables comparison of the magnitude of early hydraulic responses and the impairment remaining after DI-water recovery. For example, SA and SE exhibited relatively similar apparent IPL values (55.76% and 52.12%, respectively), but different residual IPL values (25.04% and 20.13%) and reversibility ratios (0.551 and 0.614). This comparison demonstrates that apparent IPL alone does not fully describe the post-recovery response. Nevertheless, the paired approach remains an operational screening method rather than a physical separation of fouling resistance or a substitute for long-term filtration assessment. Establishing practical cleaning thresholds would require further validation of energy consumption, recovery-water use, cleaning effectiveness, and repeated-cycle performance.
This interpretation complements, rather than replaces, existing approaches to membrane-fouling management. Ceramic membrane–nanofiltration treatment trains have been studied for production wastewater from water-treatment plants [47]; their performance depends on the treatment sequence and feed characteristics. The paired IPL–IPLres approach is intended as an early comparative screen rather than a substitute for long-term fouling tests. It does not capture biological growth, repeated-cycle accumulation, chemical cleaning demand, or changes arising from long-term deposit restructuring [48]. Its value therefore lies in identifying matrix-dependent early responses that warrant more extensive validation.
The main limitations are the small number of matrix types, the single membrane configuration and operating regime, and the lack of independent validation of the observed correlations. Future work should therefore include ceramic nanofiltration membranes with different MWCOs, vary calcium and organic concentration independently, compare matched ionic-strength controls, characterize retained material using SEM/EDS and complementary surface-analysis methods, and test whether early response metrics predict cleaning demand over repeated cycles. Although hydraulic permeability was used to characterize the filtration response under constant-flux operation, time-resolved TMP profiles were not available for further analysis. Future investigations should incorporate detailed pressure monitoring to better characterize hydraulic deterioration and operating-condition variability.
4. Conclusions
- Pairing apparent initial permeability loss with post-exposure residual permeability loss provided a condition-specific distinction between early hydraulic-response magnitude and impairment remaining after DI-water recovery.
- Across six water matrices, apparent IPL ranged from 2.05% to 76.04% and residual IPL from 1.26% to 41.38%, with residual loss increasing progressively with exposure time. The two metrics were strongly associated across matrix means (R2 = 0.948), while the SA+Ca formulation showed greater apparent and residual loss than SA despite nearly identical measured DOC concentrations.
- Paired IPL–residual IPL reporting provides a condition-specific approach for comparing early hydraulic responses and post-recovery impairment. However, both metrics share the same initial permeability reference, which may contribute to mathematical coupling and correlated uncertainty. The observed relationships are descriptive and limited to the tested membrane configuration, water matrices, and recovery protocol. Further validation across different membrane MWCOs, feedwater compositions, operating conditions, and recovery durations is necessary before broader application.
Author Contributions
Conceptualization, Y.L. and X.X.; methodology, Y.L. and X.X.; investigation, Y.L.; data curation, Y.L.; formal analysis, Y.L.; writing—original draft preparation, Y.L. and X.X.; writing—review and editing, Y.L. and X.X.; supervision, Y.L. All authors have read and agreed to the published version of the manuscript.
Funding
This research was funded by the China Scholarship Council (CSC) (grant number: 201907720010).
Institutional Review Board Statement
Not applicable.
Informed Consent Statement
Not applicable.
Data Availability Statement
The data presented in this study are available from the corresponding author upon reasonable request.
Conflicts of Interest
The authors declare no conflicts of interest.
References
- Li, Y.; Xu, Y.; Rietveld, L.C.; Heijman, S.G.J. Calcium carbonate precoating/acid cleaning method for fouling control in ceramic nanofiltration membranes. Sep. Purif. Technol. 2025, 356, 130002. [Google Scholar] [CrossRef] [Scilit]
- Li, Y.; Rietveld, L.C.; Heijman, S.G.J. Analysis of fouling control strategies in ceramic nanofiltration membranes: CaCO3 precoating versus continuous dosing. Desalination 2026, 637, 120502. [Google Scholar] [CrossRef] [Scilit]
- Goh, P.S.; Ismail, A.F. A review on inorganic membranes for desalination and wastewater treatment. Desalination 2018, 434, 60–80. [Google Scholar] [CrossRef] [Scilit]
- Asif, M.B.; Zhang, Z. Ceramic membrane technology for water and wastewater treatment: A critical review of performance, full-scale applications, membrane fouling and prospects. Chem. Eng. J. 2021, 418, 129481. [Google Scholar] [CrossRef] [Scilit]
- Jarrar, R.; Abbas, M.K.G.; Al-Ejji, M. Environmental remediation and the efficacy of ceramic membranes in wastewater treatment—A review. Emergent Mater. 2024, 7, 1295–1327. [Google Scholar] [CrossRef] [Scilit]
- Choi, S.; Kim, D.; Lee, J.; Park, C.; Kim, M.; Jun, B.-M.; Rho, H. Recent advances and future perspectives in ceramic-based nanofiltration membranes: Material innovations, applications, and sustainability challenges. Environ. Res. 2026, 293, 123754. [Google Scholar] [CrossRef] [Scilit] [PubMed]
- Zhang, Y.; Chen, T.; Chen, X.; Fu, K.; Qiu, M.; Fan, Y. The application of pressure-driven ceramic-based membrane for the treatment of saline wastewater and desalination—A review. Desalination 2025, 597, 118327. [Google Scholar] [CrossRef] [Scilit]
- Cabrera, S.M.; Winnubst, L.; Richter, H.; Voigt, I.; McCutcheon, J.; Nijmeijer, A. Performance evaluation of an industrial ceramic nanofiltration unit for wastewater treatment in oil production. Water Res. 2022, 220, 118593. [Google Scholar] [CrossRef] [Scilit] [PubMed]
- Bortot Coelho, F.E.; Magnacca, G.; Boffa, V.; Candelario, V.M.; Luiten-Olieman, M.; Zhang, W. From ultra to nanofiltration: A review on the fabrication of ZrO2 membranes. Ceram. Int. 2023, 49, 8683–8708. [Google Scholar] [CrossRef] [Scilit]
- Cai, C.; Sun, W.; He, S.; Zhang, Y.; Wang, X. Ceramic membrane fouling mechanisms and control for water treatment. Front. Environ. Sci. Eng. 2023, 17, 126. [Google Scholar] [CrossRef] [Scilit]
- Qiao, Y.; Han, X.; Chen, F.; Sun, C.; Xu, L.; Yao, J.; Wu, Y.; Qi, Z.; Liu, R.; Shen, X. Fouling control of different pretreatments on ceramic fouling ultrafiltration: A review. Environ. Sci. Water Res. Technol. 2024, 10, 2273–2281. [Google Scholar] [CrossRef] [Scilit]
- Qiao, Y.; Han, X.; Chen, F.; Sun, C.; Xu, L.; Liu, R.; Shen, X. Control behavior of pretreatment on ceramic membrane fouling caused by different organic substances. J. Environ. Chem. Eng. 2024, 12, 111884. [Google Scholar] [CrossRef] [Scilit]
- Lee, S.-J.; Kim, J.-H. Differential natural organic matter fouling of ceramic versus polymeric ultrafiltration membranes. Water Res. 2014, 48, 43–51. [Google Scholar] [CrossRef] [Scilit] [PubMed]
- Lee, S.-J.; Dilaver, M.; Park, P.-K.; Kim, J.-H. Comparative analysis of fouling characteristics of ceramic and polymeric microfiltration membranes using filtration models. J. Membr. Sci. 2013, 432, 97–105. [Google Scholar] [CrossRef] [Scilit]
- Li, A.; Wang, M.; Sang, H.; Ke, W.; Qiu, M.; Zhang, Q.; Chen, X.; Fan, Y. Enhancing anti-fouling performance of ceramic membranes through iron oxide modification for the separation of oil-containing fermentation broth. Ceram. Int. 2024, 50, 35993–36003. [Google Scholar] [CrossRef] [Scilit]
- Tawalbeh, M.; Aljaghoub, H.; Qasim, M.; Al-Othman, A. Surface modification techniques of membranes to improve their antifouling characteristics: Recent advancements and developments. Front. Chem. Sci. Eng. 2023, 17, 1837–1865. [Google Scholar] [CrossRef] [Scilit]
- Lin, B.; Heijman, S.G.J.; Rietveld, L.C. Catalytic pre-coat on ceramic nanofiltration membranes for segregation and Fenton cleaning of high-resistance colloids in direct surface water treatment. J. Membr. Sci. 2024, 694, 122401. [Google Scholar] [CrossRef] [Scilit]
- Field, R.W.; Wu, D.; Howell, J.A.; Gupta, B.B. Critical flux concept for microfiltration fouling. J. Membr. Sci. 1995, 100, 259–272. [Google Scholar] [CrossRef] [Scilit]
- Bacchin, P.; Aimar, P.; Field, R.W. Critical and sustainable fluxes: Theory, experiments and applications. J. Membr. Sci. 2006, 281, 42–69. [Google Scholar] [CrossRef] [Scilit]
- Guo, Y.; Yao, J.-L.; Yan, W.-F.; Du, Y.-C.; Yu, K.-C.; Wang, X.-M.; Xiao, K.; Huang, X. Membrane fouling in engineering nanofiltration process for drinking water treatment: The spatial and chemical aspects. J. Membr. Sci. 2024, 695, 122491. [Google Scholar] [CrossRef] [Scilit]
- Kilduff, J.E.; Mattaraj, S.; Belfort, G. Flux decline during nanofiltration of naturally-occurring dissolved organic matter: Effects of osmotic pressure, membrane permeability, and cake formation. J. Membr. Sci. 2004, 239, 39–53. [Google Scholar] [CrossRef] [Scilit]
- Hong, S.; Elimelech, M. Chemical and physical aspects of natural organic matter (NOM) fouling of nanofiltration membranes. J. Membr. Sci. 1997, 132, 159–181. [Google Scholar] [CrossRef] [Scilit]
- Seidel, A.; Elimelech, M. Coupling between chemical and physical interactions in natural organic matter (NOM) fouling of nanofiltration membranes: Implications for fouling control. J. Membr. Sci. 2002, 203, 245–255. [Google Scholar] [CrossRef] [Scilit]
- Lee, K.Y.; Mooney, D.J. Alginate: Properties and biomedical applications. Prog. Polym. Sci. 2012, 37, 106–126. [Google Scholar] [CrossRef] [Scilit] [PubMed]
- de Kerchove, A.J.; Elimelech, M. Formation of Polysaccharide Gel Layers in the Presence of Ca2+ and K+ Ions: Measurements and Mechanisms. Biomacromolecules 2007, 8, 113–121. [Google Scholar] [CrossRef] [Scilit] [PubMed]
- Lee, S.; Elimelech, M. Relating Organic Fouling of Reverse Osmosis Membranes to Intermolecular Adhesion Forces. Environ. Sci. Technol. 2006, 40, 980–987. [Google Scholar] [CrossRef] [Scilit] [PubMed]
- Malkoske, T.A.; Cai, Y.-H.; Bone, S.E.; Schäfer, A.I. Calcium-organic matter fouling in nanofiltration: Synchrotron-based X-ray fluorescence and absorption near-edge structure spectroscopy for speciation. Water Res. 2025, 272, 122938. [Google Scholar] [CrossRef] [Scilit] [PubMed]
- Katsoufidou, K.; Yiantsios, S.G.; Karabelas, A.J. Experimental study of ultrafiltration membrane fouling by sodium alginate and flux recovery by backwashing. J. Membr. Sci. 2007, 300, 137–146. [Google Scholar] [CrossRef] [Scilit]
- Ang, W.S.; Lee, S.; Elimelech, M. Chemical and physical aspects of cleaning of organic-fouled reverse osmosis membranes. J. Membr. Sci. 2006, 272, 198–210. [Google Scholar] [CrossRef] [Scilit]
- Lee, S.; Elimelech, M. Salt cleaning of organic-fouled reverse osmosis membranes. Water Res. 2007, 41, 1134–1142. [Google Scholar] [CrossRef] [Scilit] [PubMed]
- Xie, Y.; Fan, C.; Fang, Y.; Zhu, X.; Yan, J.; Liu, H.; Liu, H. Ceramic ultrafiltration membrane as pretreatment for drinking water nanofiltration treatment: Performance, cleaning, and costs based on an engineering case. J. Clean. Prod. 2025, 506, 145527. [Google Scholar] [CrossRef] [Scilit]
- Xiao, T.; Zhu, Z.; Li, L.; Shi, J.; Li, Z.; Zuo, X. Membrane fouling and cleaning strategies in microfiltration/ultrafiltration and dynamic membrane. Sep. Purif. Technol. 2023, 318, 123977. [Google Scholar] [CrossRef] [Scilit]
- Weishaar, J.L.; Aiken, G.R.; Bergamaschi, B.A.; Fram, M.S.; Fujii, R.; Mopper, K. Evaluation of Specific Ultraviolet Absorbance as an Indicator of the Chemical Composition and Reactivity of Dissolved Organic Carbon. Environ. Sci. Technol. 2003, 37, 4702–4708. [Google Scholar] [CrossRef] [Scilit] [PubMed]
- Schober, P.; Boer, C.; Schwarte, L.A. Correlation Coefficients: Appropriate Use and Interpretation. Anesth. Analg. 2018, 126, 1763–1768. [Google Scholar] [CrossRef] [Scilit] [PubMed]
- Benjamini, Y.; Hochberg, Y. Controlling the False Discovery Rate: A Practical and Powerful Approach to Multiple Testing. J. R. Stat. Soc. Ser. B (Methodol.) 1995, 57, 289–300. [Google Scholar] [CrossRef] [Scilit]
- Imbrogno, A.; Nguyen, M.N.; Schäfer, A.I. Tutorial review of error evaluation in experimental water research at the example of membrane filtration. Chemosphere 2024, 357, 141833. [Google Scholar] [CrossRef] [Scilit] [PubMed]
- Huber, S.A.; Balz, A.; Abert, M.; Pronk, W. Characterisation of aquatic humic and non-humic matter with size-exclusion chromatography—Organic carbon detection—Organic nitrogen detection (LC-OCD-OND). Water Res. 2011, 45, 879–885. [Google Scholar] [CrossRef] [Scilit] [PubMed]
- Xiao, F.; Xiao, P.; Zhang, W.J.; Wang, D.S. Identification of key factors affecting the organic fouling on low-pressure ultrafiltration membranes. J. Membr. Sci. 2013, 447, 144–152. [Google Scholar] [CrossRef] [Scilit]
- Ye, Y.; Clech, P.L.; Chen, V.; Fane, A.G. Evolution of fouling during crossflow filtration of model EPS solutions. J. Membr. Sci. 2005, 264, 190–199. [Google Scholar] [CrossRef] [Scilit]
- Alresheedi, M.T.; Barbeau, B.; Basu, O.D. Comparisons of NOM fouling and cleaning of ceramic and polymeric membranes during water treatment. Sep. Purif. Technol. 2019, 209, 452–460. [Google Scholar] [CrossRef] [Scilit]
- Alresheedi, M.T.; Basu, O.D.; Barbeau, B. Chemical cleaning of ceramic ultrafiltration membranes—Ozone versus conventional cleaning chemicals. Chemosphere 2019, 226, 668–677. [Google Scholar] [CrossRef] [Scilit] [PubMed]
- So, Y.; Lee, Y.; Kim, S.; Lee, J.; Park, C. Role of co-existing ions in the removal of dissolved silica by ceramic nanofiltration membrane. J. Water Process Eng. 2023, 53, 103873. [Google Scholar] [CrossRef] [Scilit]
- Lee, S.; Ang, W.S.; Elimelech, M. Fouling of reverse osmosis membranes by hydrophilic organic matter: Implications for water reuse. Desalination 2006, 187, 313–321. [Google Scholar] [CrossRef] [Scilit]
- Karabelas, A.J.; Sioutopoulos, D.C. New insights into organic gel fouling of reverse osmosis desalination membranes. Desalination 2015, 368, 114–126. [Google Scholar] [CrossRef] [Scilit]
- Philibert, M.; Villacorte, L.O.; Ekowati, Y.; Abushaban, A.; Salinas-Rodriguez, S.G. Fouling and scaling in reverse osmosis desalination plants: A critical review of membrane autopsies, feedwater quality guidelines and assessment methods. Desalination 2024, 592, 118188. [Google Scholar] [CrossRef] [Scilit]
- Ozofor, I.H.; Tarabara, V.V.; Da Costa, A.R.; Morse, A.N. Analysis of microstructural properties of ultrafiltration cake layer during its early stage formation and growth. J. Membr. Sci. 2021, 620, 118903. [Google Scholar] [CrossRef] [Scilit]
- Xie, Y.; Liu, Z.; Yu, J.; Shan, Z.; Liu, H.; Zhang, Y. Water Purification Efficiency and Membrane Fouling Behavior of Ceramic Membrane-Nanofiltration in Treating Water Treatment Plant Production Wastewater. Membranes 2025, 15, 387. [Google Scholar] [CrossRef] [Scilit] [PubMed]
- Le-Clech, P.; Chen, V.; Fane, T.A.G. Fouling in membrane bioreactors used in wastewater treatment. J. Membr. Sci. 2006, 284, 17–53. [Google Scholar] [CrossRef] [Scilit]

Disclaimer/Publisher’s Note: The statements, opinions and data contained in all publications are solely those of the individual author(s) and contributor(s) and not of MDPI and/or the editor(s). MDPI and/or the editor(s) disclaim responsibility for any injury to people or property resulting from any ideas, methods, instructions or products referred to in the content. |
© 2026 by the authors. Licensee MDPI, Basel, Switzerland. This article is an open access article distributed under the terms and conditions of the Creative Commons Attribution (CC BY) license.