


Abstract
This study established an activity-oriented analysis method based on offline two-dimensional liquid chromatography–electrochemical detection (2D-LC-ECD) combined with ultra-high-performance liquid chromatography–Orbitrap-MS/MS (UHPLC-Orbitrap-MS/MS), which was used to comprehensively characterize the antioxidant components of Polygonum multiflorum Thunb. leaves (PML) and screen for differential compounds in samples from different origins. Antioxidant components were screened using 2D-LC-ECD combined with in vitro radical scavenging experiments; structure identification was conducted via UHPLC-Orbitrap-MS/MS, and chemometric analysis alongside quantitative determination of 19 major components was carried out across 31 batches of samples. A total of 43 potential antioxidant compounds were identified from PML, including 11 phenolic acids, 29 flavonoids, 2 stilbene glycosides, and 1 amino acid; phenolic acids and their derivatives, along with flavonoids, were identified as major contributors to antioxidant activity. Hierarchical clustering analysis and principal component analysis both grouped samples into four categories by origin; the orthogonal partial least squares discriminant analysis model (R2X = 0.933, R2Y = 0.941, Q2 = 0.846) screened 10 key markers (VIP > 1). The quantitative results showed that polygonacetophenoside had the highest content in PML. In summary, the 2D-LC-ECD coupled with LC-Orbitrap-MS/MS strategy confirmed that phenolic acids and flavonoids are the core material basis for PML’s antioxidant capacity, providing scientific evidence for the industrial development of PML as a natural antioxidant.
1. Introduction
Polygonum multiflorum Thunb. (P. multiflorum) is a traditional tonic Chinese medicinal herb belonging to the Polygonaceae family [1]. In modern pharmacological studies, the root of P. multiflorum has been demonstrated to possess antioxidant, neuroprotective, and anti-hair loss effects [2,3,4,5]. Guizhou is the primary production area for P. multiflorum. Modern pharmacological studies have confirmed that the tuberous root of P. multiflorum possesses various pharmacological activities, including antioxidant, anti-aging, lipid-regulating, and anti-atherosclerotic effects [6,7]. Among these, its excellent antioxidant capacity serves as the core material basis for its multifaceted health-promoting and therapeutic effects. Chemical composition studies indicate that the tuberous root primarily contains active components such as diphenylstyryl glycosides, anthraquinones [8], phenolic acids, and flavonoids [9]. Among these, 2,3,5,4′-tetrahydroxydiphenylstyryl-2-O-β-D-glucoside has the highest content and exhibits the most significant activity [10].
Unlike the well-studied root tuber, P. multiflorum leaves (PML) have long been neglected in terms of their medicinal potential. Systematic investigations on PML remain limited, and the corresponding chemical composition and pharmacological mechanisms warrant further elucidation. In regions such as Jiangxi and Taiwan, there is a folk tradition of drying the leaves and using them as a herbal tea [11]. Modern pharmacological research has confirmed that PML extract possesses multiple bioactivities, including antioxidant, anti-inflammatory, lipid-regulating, hypoglycemic, and neuroprotective effects [11,12]. Its mechanisms involve scavenging free radicals, inhibiting α-glucosidase and acetylcholinesterase, and regulating the NF-κB pathway [13]. Unlike that of the root tuber, the chemical composition of PML is dominated by flavonoids, phenolics, and polysaccharides, with extremely low levels of stilbene glycosides and anthraquinones [14,15,16]. The unique composition and developmental potential make PML a natural antioxidant resource with significant application prospects. However, systematic analysis and fundamental research on the active antioxidant components in PML remain relatively limited.
The chemical constituents of natural plants are complex and diverse. Due to limited peak capacity, conventional one-dimensional liquid chromatography (1D-LC) is prone to severe peak co-elution during separation [17,18]. Two-dimensional liquid chromatography (2D-LC), by employing an orthogonal separation mode, can significantly increase peak capacity and resolution, thereby enabling the efficient separation and analysis of complex samples [19,20,21]. The electrochemical detector detects compounds by measuring the current generated from redox reactions occurring on the electrode [22]. During the oxidation or reduction of electroactive substances, the current generated at the working electrode is directly proportional to the concentration of the analyte [23]. Therefore, electrochemical detection (ECD), with its high sensitivity and specificity, has become a powerful tool for the targeted screening of antioxidants. Given ECD’s excellent selectivity for redox-active compounds such as phenols and flavonoids, this technique offers significant advantages in the evaluation of antioxidant activity [24]. Its further coupling with UHPLC-Orbitrap-MS/MS enables rapid screening and identification of antioxidant components. Previous studies have successfully employed offline 2D-LC-ECD coupled with LC-MS/MS to screen and identify antioxidant active constituents from the leaves of various plants, validating the feasibility of this strategy [25,26].
The antioxidant efficacy of natural plants results from the synergistic action of multiple components. Additionally, the geographical origins and ecological conditions of Chinese herbal medicines significantly regulate the synthesis of plant secondary metabolites [27], directly influencing the chemical composition, content, and pharmacological quality of the herbs, and serving as the core factors driving quality variations in Chinese herbal medicines.
In the present study, offline 2D-LC-ECD, UHPLC-Orbitrap-MS/MS and in vitro radical scavenging assays were integrated to rapidly screen and identify antioxidants in PML. LC-HRMS profiling of multiple batches of samples, combined with chemometric models including hierarchical cluster analysis (HCA), principal component analysis (PCA), and orthogonal partial least squares discriminant analysis (OPLS-DA), was performed to explore crucial differential compounds associated with antioxidant discrepancies among geographical populations. Quantitative analysis of the major antioxidant-related components was also performed to elucidate the molecular basis of the antioxidant activity in PML, thereby providing a scientific basis for its quality control and further development and utilization.
2. Materials and Methods
2.1. Materials
Quercitrin, rutin, isoquercitrin, chlorogenic acid, epicatechin, catechin, nicotiflorin, trifolin, isoschaftoside, schaftoside, isovitexin, and hyperoside were purchased from Pufei De Biotechnology Co., Ltd. (Chengdu, Sichuan, China). Gallocatechin, caffeic acid, tryptophan, gallic acid, epicatechin gallate, quercetin-7-glucoside, and methyl gallate were obtained from Aladdin Biochemical Technology Co., Ltd. (Shanghai, China). LC-MS grade formic acid (>98%), HPLC grade methanol (>98%), and LC-MS grade acetonitrile (>99.9%) were purchased from Aladdin Biochemical Technology Co., Ltd.; all reference standards had a purity of ≥98%, while the remaining reagents were analytical grade. The water used in the experiment was ultrapure water prepared by an Elix Advantage ultrapure water system (Merck Millipore, Billerica, MA, USA).
A total of 31 fresh PML samples were collected from major traditional production areas within Guizhou Province. The plant material was authenticated by Dr. Meng Lingjie from Zunyi Medical University (Zunyi, China). Detailed sample information is listed in Table 1. Samples were dried at 40 °C, pulverized using a BJ-800A high-speed pulverizer (Baijie, Shanghai, China), passed through a 60-mesh sieve, and then stored at 4 °C.
Table 1.
Collection sites for the 31 batches of PML samples.
2.2. Preparation of PML Extract
Approximately 1.0 g of PML powder was accurately weighed and extracted with 5 mL of 80% (v/v) methanol aqueous solution under ultrasonication (40 kHz, 60 min) for 2D-LC separation. For UHPLC-Q-Orbitrap-HRMS analysis, 1.0 g of the powder was extracted with 20 mL of the identical solvent system under the same ultrasonication conditions. Each extract was centrifuged at 9000 rpm for 5 min using a Microfuge-20 high-speed centrifuge (Thermo Fisher Scientific, Waltham, MA, USA), and the supernatant was filtered through a 0.22 μm filter membrane. The extract prepared for UHPLC-Q-Orbitrap-HRMS was further diluted 10-fold prior to injection.
For 2D-LC-ECD, a high concentration is necessary because the collected fractions undergo further dilution during the first-dimension separation. For UHPLC-Orbitrap-HRMS analysis, a considerably more dilute extract is used to avoid signal saturation and minimize matrix effects.
2.3. Preparation of the Reference Standard Solutions
An appropriate amount of each reference standard was accurately weighed and dissolved in methanol to prepare individual stock solutions (1 mg/mL), which were stored at −20 °C. Immediately before use, the stock solutions were mixed and diluted with 80% methanol to the required concentrations to prepare the mixed standard working solutions.
2.4. 2D-LC Separation of PML
2.4.1. Conditions for the First-Dimension Liquid Chromatography
A 2695 HPLC system (Waters, Milford, MA, USA) equipped with a diode array detector (DAD) was used for the first-dimension liquid chromatography (1D-LC). The stationary phase was an RD-Phenyl-Hexyl column (10 mm × 150 mm, 5 µm, Zhongpu, Fujian, China). The mobile phase consisted of methanol (A) and an aqueous solution of 0.1% formic acid (B). The elution gradient was as follows: 0–25 min, 20–30% A; 25–50 min, 30–50% A; 50–60 min, 50–99% A; 60–65 min, 99% A; 65–67 min, 99–20% A; 67–75 min, 20% A. Chromatographic separation was performed under the following conditions: flow rate of 2.5 mL/min, injection volume of 100 µL, column temperature of 35 °C, and detection at 280 nm. During the 3.0–52.5 min gradient elution, 100 fractions were collected at 0.5 min intervals (each 1.25 mL). All fractions were stored at −20 °C until analysis, after which aliquots were taken for the second-dimension liquid chromatography (2D-LC) and antioxidant activity evaluation.
2.4.2. Second-Dimension Liquid Chromatography Conditions
For the 2D-LC, an Ultimate 3000 bio-RS high-performance liquid chromatograph (Thermo Fisher Scientific, Waltham, MA, USA) was used with an ACQUITY HSS T3 (2.1 mm × 100 mm, 1.8 μm, Waters, Milford, MA, USA) as the stationary phase, with acetonitrile (A) and a 50 mmol/L citrate buffer (citric acid–potassium citrate buffer, pH = 2.59) (B) as the mobile phase. The detailed gradient elution program is shown in Table 2. The detection potential was set to 600 mV, the flow rate to 0.4 mL/min, the column temperature to 45 °C, the autosampler temperature to 15 °C, and the injection volume to 5 µL.
Table 2.
Second-dimension liquid chromatography elution gradient.
2.4.3. UHPLC-Orbitrap-MS/MS Conditions for Fraction Identification
The fractions collected from the 1D-LC were analyzed using a Vanquish-F UHPLC system (Thermo Fisher Scientific, Waltham, MA, USA) under the following conditions. An ACQUITY HSS T3 column (2.1 mm × 100 mm, 1.8 µm, Milford, MA, USA) was used as the stationary phase, with acetonitrile (A) and an aqueous solution of 0.1% formic acid (B) as the mobile phase. The specific elution gradient is the same as that in 2D-LC, as shown in Table 2. The flow rate was 0.3 mL/min, the injection volume was 10 µL, the column temperature was 45 °C, and the sample temperature was 12 °C.
Mass spectrometry was performed using an Orbitrap Exploris 120 high-resolution mass spectrometer (Thermo Fisher Scientific, Waltham, MA, USA) under the following conditions: the ion source was heated electrospray ionization (HESI) in negative ion mode; the spray voltage was 2.5 kV; sheath gas flow was 35 Arb; auxiliary gas flow was 10 Arb; evaporator temperature was 350 °C; and ion transfer tube temperature was 320 °C. The scanning mode was full scan MS/dd-MS2. The full scan range was m/z 150–1500, with a resolution of 60,000. MS/MS resolution was 15,000, and high-energy collision-induced dissociation was set to stepwise mode (20%, 40%, and 60%). Data acquisition and processing were performed using TraceFinder 4.1.
2.5. Antioxidant Activity Evaluation of the 1D-LC Fractions
2.5.1. DPPH Radical Scavenging Capacity Assay
The 1,1-diphenyl-2-picrylhydrazyl (DPPH) radical scavenging assay was employed, with slight modifications to the established method [28]. A 200 µL aliquot of 1D-LC fraction of PML (fractions collected at 3.0, 3.5, 9.0, 9.5, 10.0, 24.0, and 24.5 min were further diluted 5-fold with 80% methanol) was taken, and 100 µL of DPPH (0.1 mmol/L in methanol) reagent was added. The mixture was incubated in the dark at room temperature for 30 min before the absorbance was measured at 517 nm using a microplate reader (Thermo Fisher Scientific, Waltham, MA, USA). Eighty percent methanol was used as the blank, and Trolox served as the positive control. A standard curve was plotted, the DPPH radical scavenging capacity was calculated as Trolox equivalents, and the results were expressed as μg of Trolox equivalents per mL of fraction (µg TE/mL).
2.5.2. ABTS Radical Scavenging Capacity Assay
The 2,2′-azobis-3-ethylbenzothiazoline-6-sulfonic acid diammonium salt (ABTS) radical scavenging assay was employed, with slight modifications to the established method [29]. Briefly, 200 µL of PML fractions (with fractions collected at 3.0, 3.5, 9.0, 9.5, 10.0, 24.0, and 24.5 min further diluted 5-fold with 80% methanol) were mixed with 100 µL ABTS working solution, whose absorbance was adjusted to 0.70 ± 0.1 at 734 nm. After reacting in the dark for 30 min, the absorbance was measured at 734 nm. The blank and positive control settings were identical to those of the DPPH assay. The ABTS scavenging activity was quantified as Trolox equivalents, and the results were expressed as µg of Trolox equivalents per mL of fraction (µg TE/mL).
2.6. Analysis and Quantitative Determination of Major Antioxidant Components in PML from Different Regions
2.6.1. UHPLC-Orbitrap-MS/MS Analytical Conditions
The Vanquish-F UHPLC-Orbitrap Exploris 120 high-resolution mass spectrometer was used to analyze 31 batches of PML extracts. The stationary phase was XBridge BEH C18 (2.1 × 150 mm, 2.5 μm, Waters, Milford, MA, USA), and the mobile phase was acetonitrile (A) and 0.1% formic acid (B). The elution gradient was as follows: 0–18 min, 95–50% B; 18–20 min, 50–30% B; 20–21 min, 30–2% B; 21–25 min, 2% B; 25–27 min, 2–95% B; 27–34 min, 95% B. The flow rate was 0.3 mL/min, the column temperature was 45 °C, the sample temperature was 15 °C, and the injection volume was 1 µL. Mass spectrometry conditions were the same as those used for mass spectrometry in 2D-LC fraction identification.
2.6.2. Method Validation
Intra-day precision was evaluated by six consecutive injections of sample S1 within one day, and inter-day precision was determined by continuous detection for three days. Relative standard deviation (RSD) of peak areas was calculated. Linear regression was established by plotting the peak area on the y-axis against the concentration on the x-axis, using mixed standard solutions at a series of concentrations. The LOD and LOQ were determined based on signal-to-noise ratios (S/N), where the LOD and LOQ correspond to S/N ≥ 3 and S/N ≥ 10, respectively, using serial dilutions of the mixed standard solutions. The recovery test was performed by adding standard compounds to leaf samples with known component contents. Six parallel samples were prepared and analyzed to calculate average recovery. Matrix effects were assessed by comparing the slopes of solvent calibration curves and PML matrix-matched calibration curves.
2.7. Data Processing and Statistical Analysis
Compound Discoverer 3.4 and SIRIUS CSI:FingerID 6.3 [30] were applied for peak picking and compound identification via database matching. The peak areas of the 43 identified antioxidants were extracted using Compound Discoverer 3.4. The resulting data matrix was normalized by the total peak area of each sample to correct for minor injection volume deviations and instrumental response drift, followed by Pareto scaling prior to multivariate analysis. Multivariate statistical analysis including HCA and PCA was performed using Origin 2021, while OPLS-DA was conducted using SIMCA 14.1 software.
3. Results
3.1. Separation and Identification of Antioxidant Compounds in PML Using 2D-LC-ECD
3.1.1. 2D-LC-ECD Separation of PML
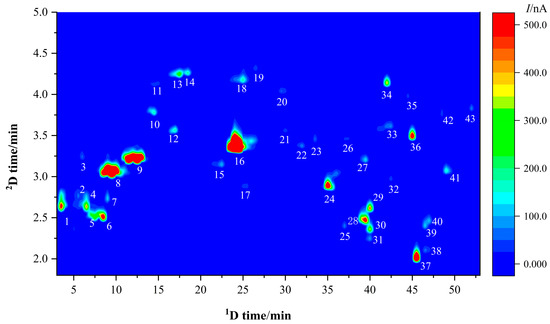
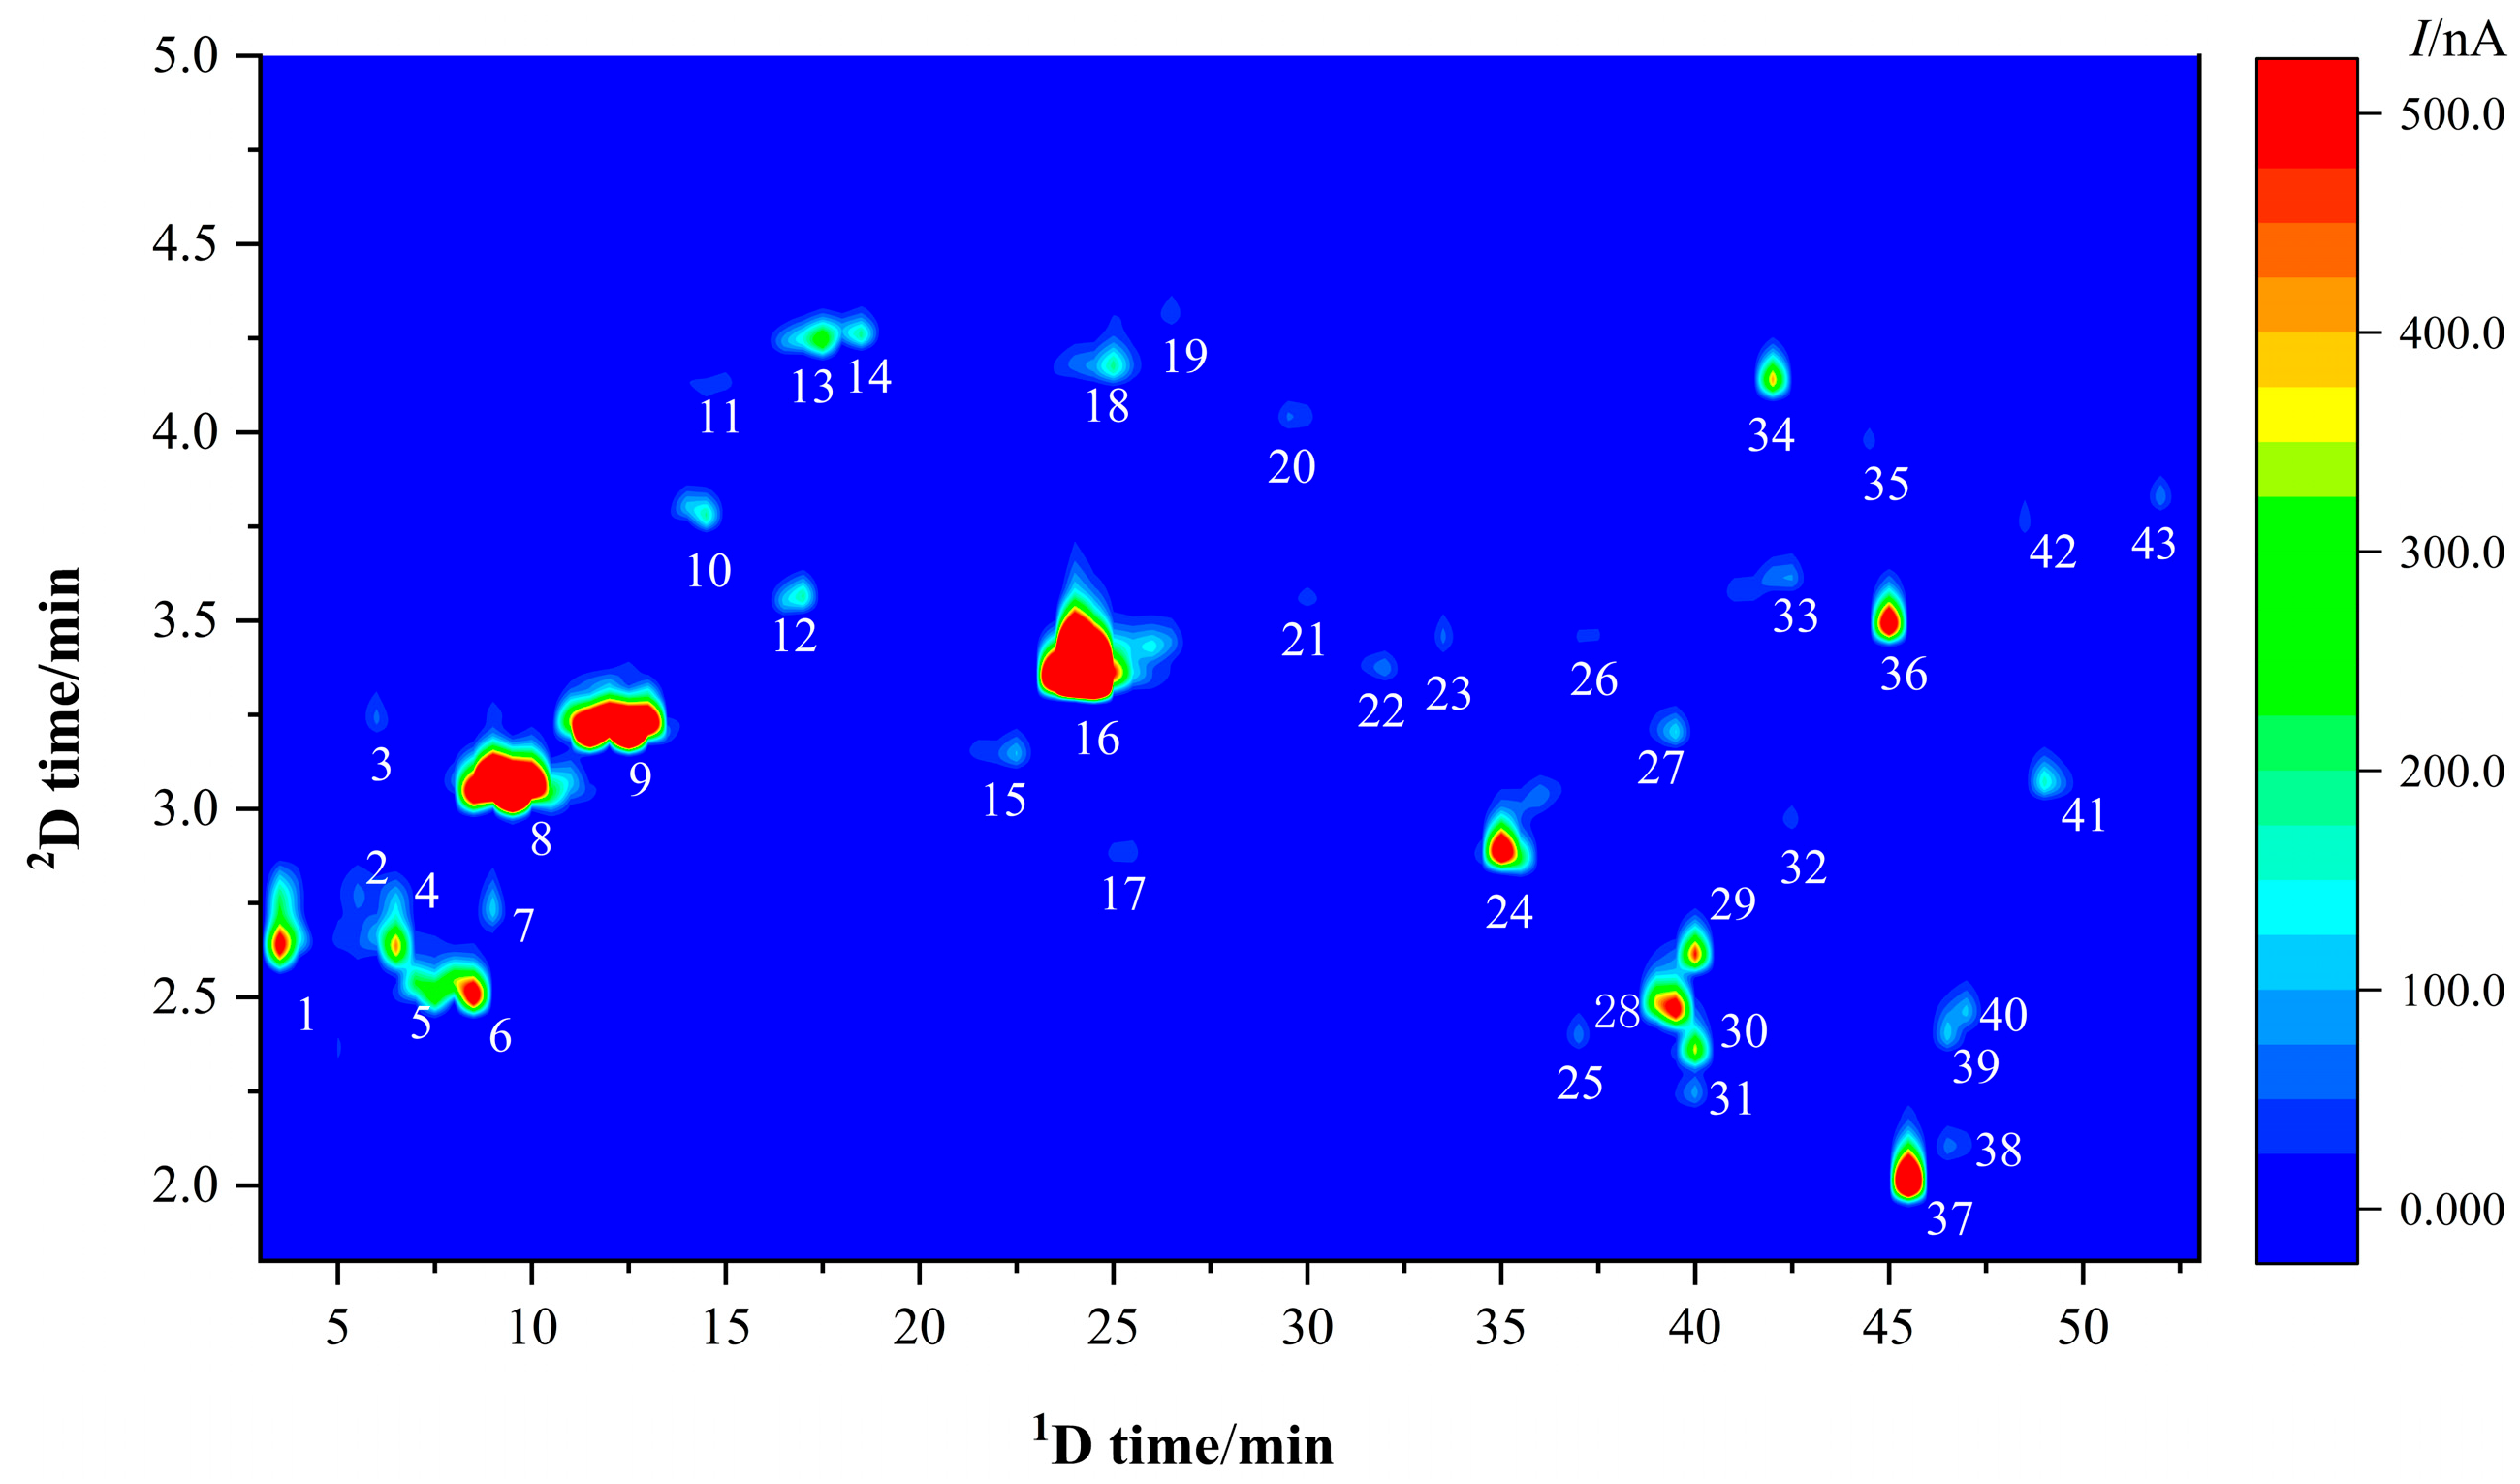
Compared with 1D-LC, 2D-LC significantly improves both peak resolution and separation efficiency. In this study, an offline reversed-phase × reversed-phase (RP × RP) two-dimensional mode was employed. In the first dimension, a Phenyl-Hexyl column was used as the stationary phase, and methanol-0.1% formic acid aqueous solution was used as the mobile phase for gradient elution, with fractions collected in segments. In the second dimension, since ECD typically requires a higher buffer salt concentration to ensure baseline stability [31], an acetonitrile-citrate solution was selected as the mobile phase and an HSS T3 column as the stationary phase. The stationary and mobile phases of the two-dimensional system exhibit different selectivities, ensuring orthogonality of separation. Furthermore, this mode has been successfully applied to the separation of flavonoids and phenolic compounds in medicinal and edible plants such as Zanthoxylum bungeanum leaves and licorice [32,33]. The 2D-LC-ECD chromatogram of PML is shown in Figure 1. The peaks with higher responses are labeled 1–43, visually indicating the chemical components in PML that exhibit strong reducing properties on the ECD electrode surface. The 43 major peaks are evenly distributed, representing a significant improvement in resolution compared to simple 1D-LC.
Figure 1.
2D-LC-ECD chromatogram of PML.
3.1.2. Antioxidant Activity Evaluation of First-Dimension Fractions
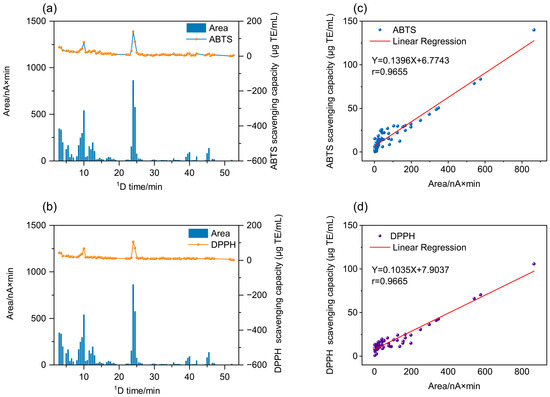
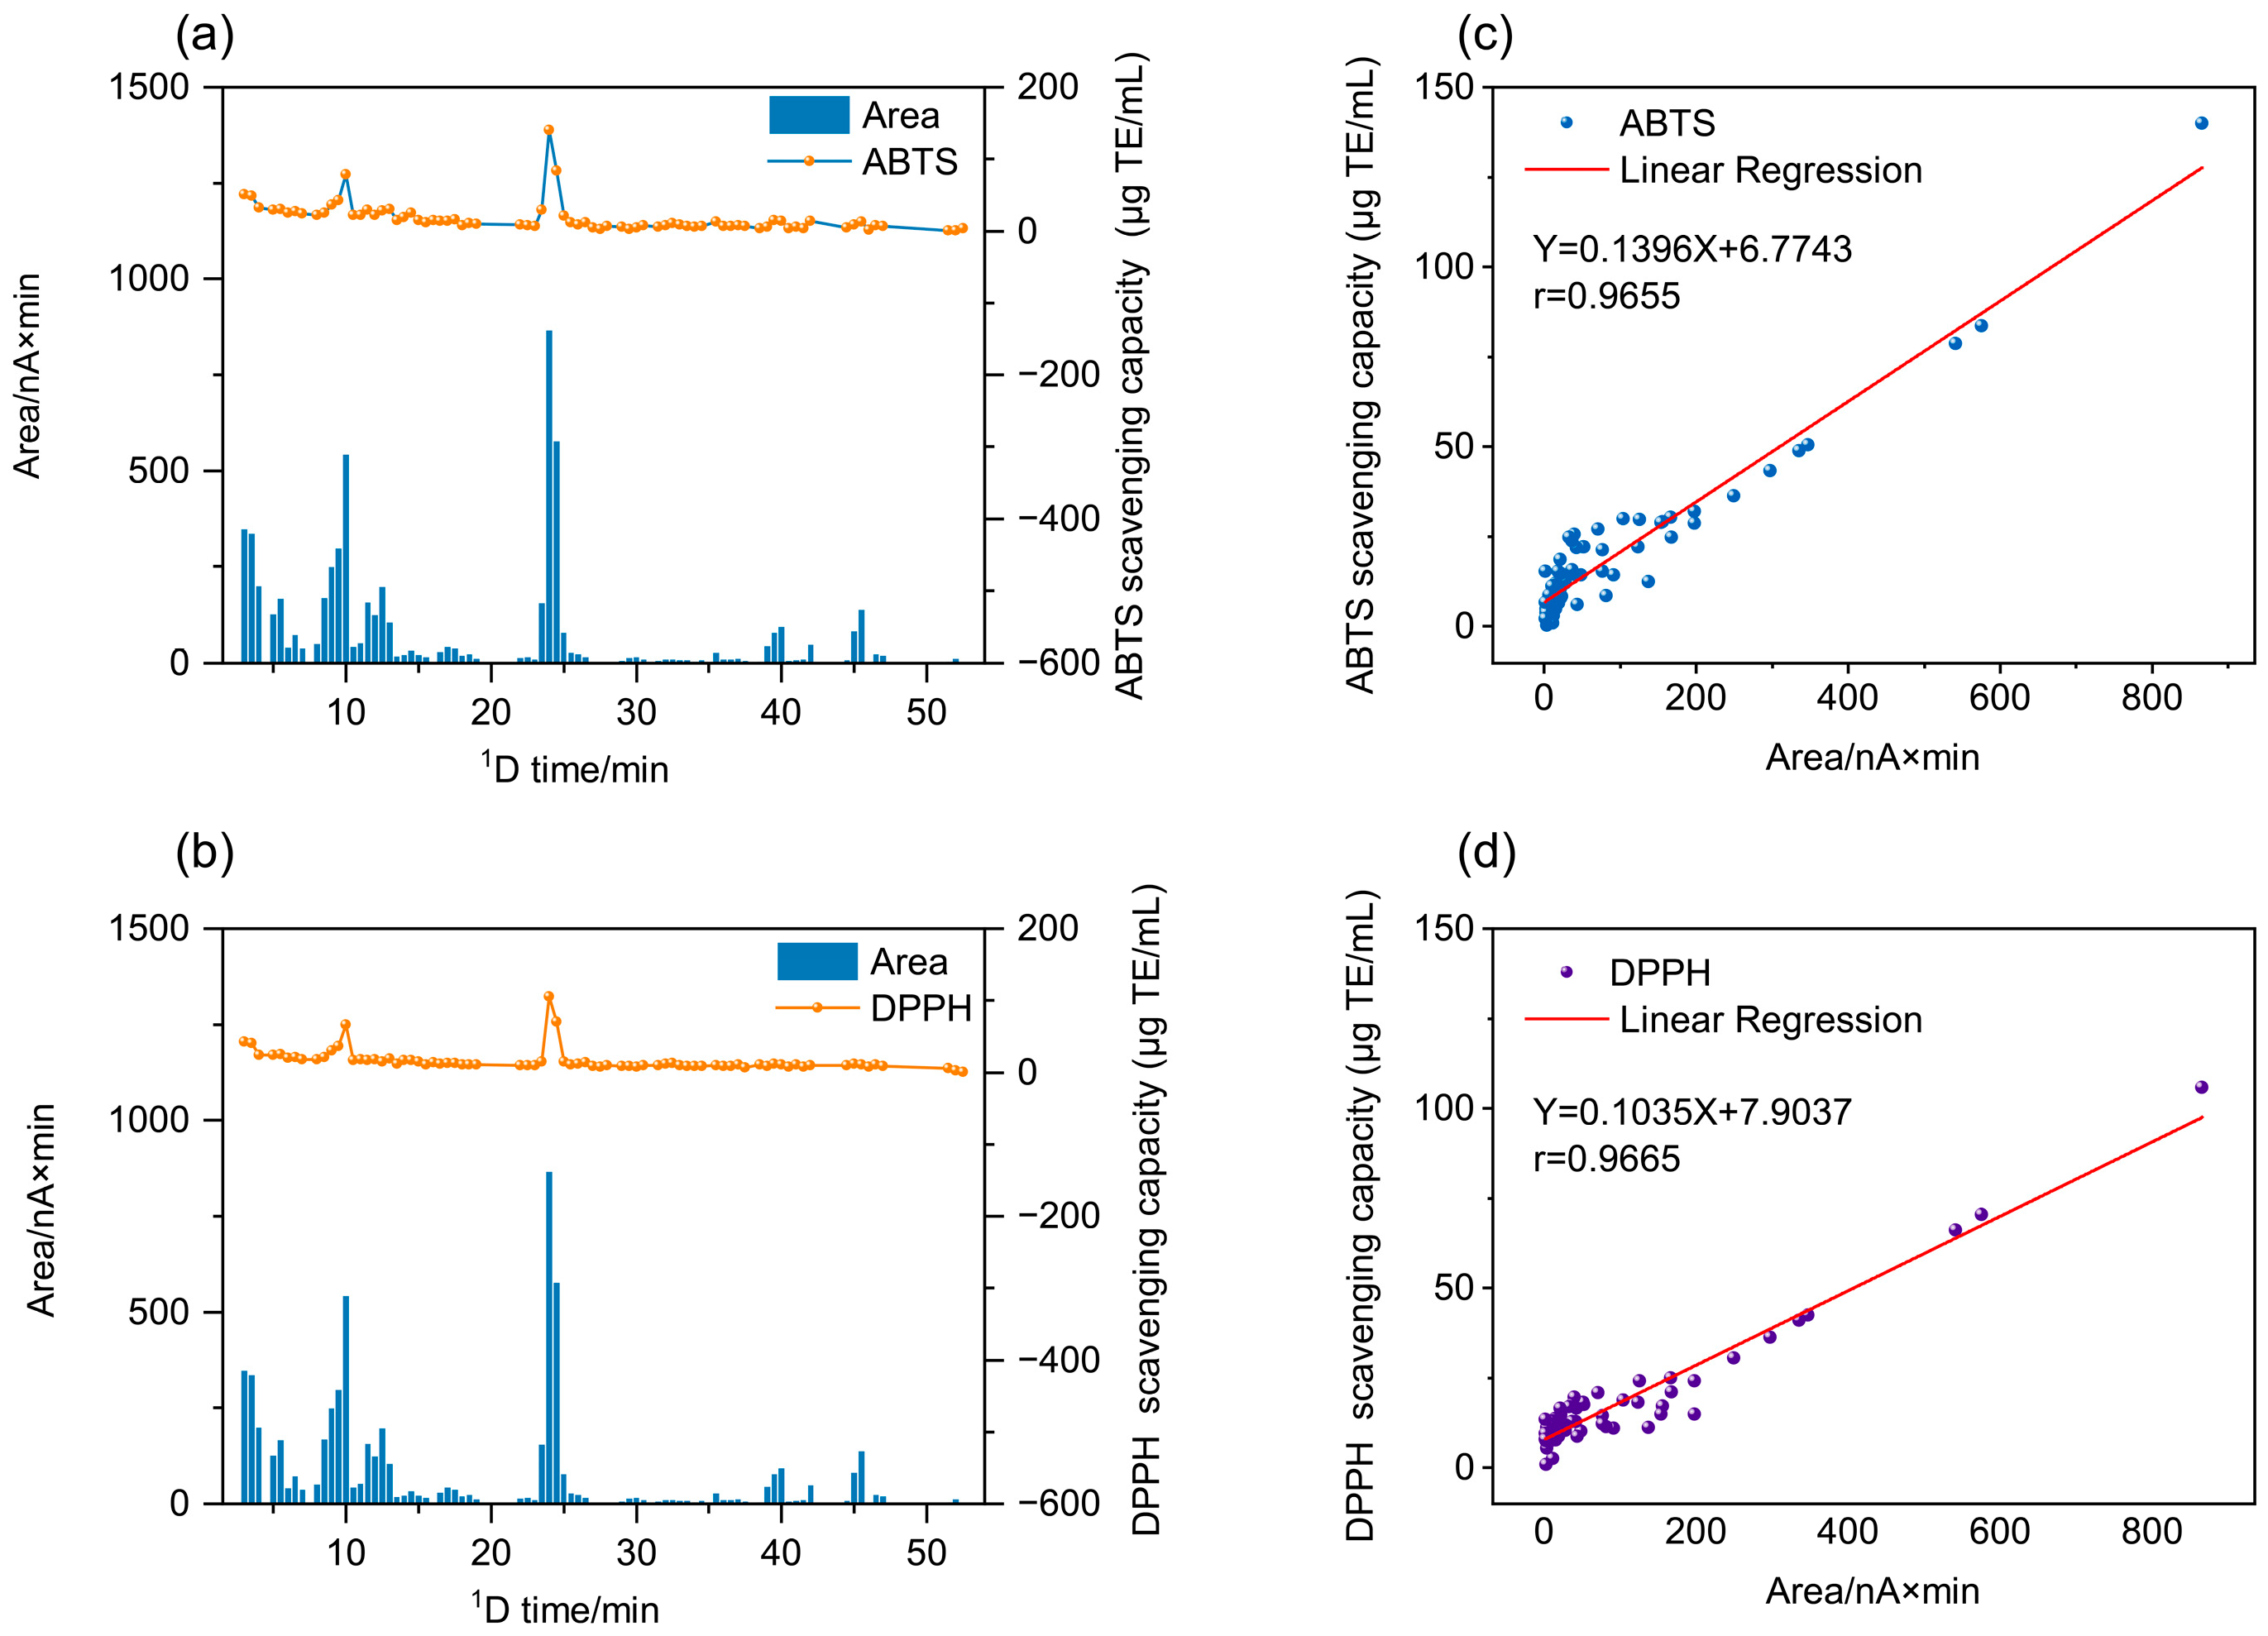
To validate the use of LC-ECD as a reliable tool for antioxidant screening, the radical scavenging activities of the first-dimension fractions were assessed via ABTS and DPPH assays. The obtained data, calculated as radical scavenging capacity (µg TE/mL) to enable direct quantitative comparison across fractions, are depicted in Figure 2.
Figure 2.
Peak areas and antioxidant activities of different first-dimension fractions. (a) ABTS radical scavenging capacity; (b) DPPH radical scavenging capacity; (c) linear correlation between peak areas and their ABTS radical scavenging capacity of different fractions; (d) linear correlation between peak areas and their DPPH radical scavenging capacity of different fractions.
The results indicated that the fractions collected at different elution times exhibited varying degrees of antioxidant activity. Among them, fractions collected within the first 30 min demonstrated significantly stronger free radical scavenging capacity than those collected between 30 and 52 min. It is worth noting that fractions with larger peak areas, such as those collected at 3.0, 3.5, 9.0, 9.5, 10.0, 24.0, and 24.5 min, exhibited stronger radical scavenging capacity. These active fractions corresponded exactly to Peak 1, Peak 8, and Peak 16 in Figure 1, suggesting that these components may be the major antioxidant compounds in PML. The above results indicate that the major antioxidant components in PML are concentrated in the hydrophilic fractions; this finding provides a theoretical basis for the efficient extraction of natural water-soluble antioxidants.
Fraction-based antioxidant assessment is more convenient, rapid and efficient than traditional single-component separation and activity verification. Conventional methods are limited by low constituent content and unstable separation performance, restricting research on antioxidant bioactivity. Figure 2c,d demonstrate a significant positive correlation between the peak areas of 2D-LC-ECD fractions and their corresponding radical scavenging equivalents, with correlation coefficients of 0.9559 for ABTS assay and 0.9336 for DPPH assay. The favorable response of ECD towards antioxidants ensured a strong correlation between electrochemical signals and in vitro antioxidant capacity, validating the offline 2D-LC-ECD combined with radical scavenging assay as a precise screening approach for leaf antioxidants [34]. The ECD response originates from oxidation of electroactive groups; for phenolic antioxidants, it primarily depends on the number and activity of phenolic hydroxyl groups. In this study, the key antioxidants in PML—phenolic acids, flavonoids, and stilbenes—are all phenolic derivatives with similar molecular weight, polarity, and electroactive groups, ensuring a relatively uniform ECD response. Accordingly, peak areas correlated strongly with antioxidant capacity, further validating offline 2D-LC-ECD coupled with radical scavenging assays as a reliable screening approach. However, for plant systems with greater structural diversity—such as those containing thiols, heterocycles, or alkaloids—the ECD response may vary markedly with compound structure, potentially weakening the peak area-antioxidant capacity correlation. Therefore, using ECD peak area as a quantitative antioxidant indicator requires evaluation of the structural features of antioxidants in the specific sample.
3.1.3. UHPLC-Orbitrap-MS/MS Identification of the Fractions
As shown in Figure 1, multiple chromatographic peaks with distinct electrochemical responses were observed in the PML extract, suggesting a potential abundance of chemically active components with antioxidant properties.
To further identify the chemical components corresponding to each response peak, this study selected the time interval from 3 to 52.5 min, where electrochemical responses were relatively concentrated, and conducted UHPLC-Orbitrap-MS/MS analysis. Using Compound Discoverer combined with SIRIUS CSI:FingerID, the main chemical components corresponding to the 43 peaks were identified. The names, molecular formulas, and MS/MS data of each compound are shown in Table 3. Based on the structural characteristics of the parent compounds, the 43 identified compounds were classified into four major categories: phenolic acids and their derivatives, primarily centered on gallic acid and caffeic acid derivatives; flavonoids, mainly including flavanols and their derivatives, such as quercetin, apigenin, kaempferol, and their derivatives; stilbene glycosides, which feature a stilbene parent nucleus and are characteristic components of PML; and amino acids. The chromatographic peaks with the highest responses in Figure 1 were caffeic acid (6), catechin (8), chlorogenic acid (9), methyl 4,6-di-O-galloyl-β-D-glucopyranoside (24), hyperoside (28), kaempferol glucoside (36), and quercetin (37). All compounds were initially identified by fragment analysis using LC-HRMS; except for peaks 24 and 36, the rest of the substances were further confirmed by comparison with standard samples. The above compounds are the main antioxidant components of PML.
Table 3.
Identification of compounds in PML using UHPLC-Orbitrap-MS/MS.
Among them, there are 11 phenolic acids and their derivatives, which are further classified into three subclasses based on parent nucleus structures and substituent types. Specifically, gallic acid and its derivatives represent the dominant subclass, encompassing 8 compounds in total: gallic acid, galloyl-glucoside, methyl 4,6-di-O-galloyl-β-D-glucopyranoside, polygoacetophenoside, polygoacetophenoside-glucoside, two isomers of polygoacetophenoside-glucoside, and feruloyl-homogalloyl-glucose. These compounds contain the galloyl structural unit and represent a class of phenolic acid structures known for their strong free radical scavenging capacity. There are three compounds in the caffeic acid group, namely caffeic acid, caffeoylglucoside, and chlorogenic acid. In addition, another phenolic acid derivative, ferulic acid glucoside, was identified.
Flavonoids were the most abundant class of compounds identified in this study, comprising a total of 29 compounds and accounting for the majority of all identified compounds. Based on differences in their parent ring structures, the flavanols comprised 9 compounds, including gallocatechin, catechin, epicatechin, epicatechin gallate, gallocatechin-O-β-D-glucuronide, procyanidin B, epigallocatechin-epicatechin, epigallocatechin-epicatechin isomer, and procyanidin B dimer monoglucoside. Notably, the fractions containing catechin exhibited significant free radical scavenging activity, indicating that the flavonoid antioxidant potential in PML also merits attention. Quercetin and its derivatives included seven compounds: hyperoside, isoquercitrin, rutin, quercitrin, quercetin-7-glucoside, quercetin-3-O-neohesperidoside, and quercetin-3-O-(6″-O-caffeoyl)-β-D-glucoside. Apigenin and its derivatives totalled eight compounds, including apigenin-O-glucoside, isovitexin, carlinoside, schaftoside, isoschaftoside, caffeoyl apigenin-7,4′-di-O-β-D-glucoside, and caffeoyl apigenin-O-glucose-O-arabinoside. Kaempferol and its derivatives consisted of three compounds, namely trifolin, kaempferol glucoside, and kaempferol diglucoside. One structurally unique polymethoxyflavonol was classified as other flavonoids: 5,7,3′,6′-tetrahydroxy-8,2′-dimethoxyflavone 6′-O-glucoside. Two stilbene glycosides were identified: pentahydroxystilbene diglucoside and an acylated stilbene glycoside. This class represents a characteristic group of compounds that distinguishes PML from other plant sources; while they are widely present in the roots and vines of P. multiflorum, fewer compounds of this class have been identified in the leaves. One amino acid was identified: tryptophan.
The antioxidant activity of PML is primarily attributed to phenolic acids and flavonoids. Phenolic acids such as gallic acid and caffeic acid derivatives, and galloylated procyanidins scavenge free radicals via hydrogen atom transfer and single electron transfer mechanisms, with multiple galloyl groups providing abundant phenolic hydroxyls that stabilize phenoxyl radicals and enhance reducing capacity [35]. Flavonoids, particularly flavan-3-ols such as catechin, epicatechin, and gallocatechin, and flavonol glycosides such as hyperoside, isoquercitrin, quercitrin, and rutin, exert antioxidant effects through the catechol moiety in the B-ring and the 3-OH substituent in the C-ring, which are essential for metal chelation and DPPH/ABTS radical scavenging [36]. These findings are consistent with previous pharmacological reports demonstrating that PML extracts modulate oxidative stress via NF-κB pathway regulation and free radical neutralization [12], and that the tuberous root’s antioxidant and anti-aging effects are linked to similar polyphenolic scaffolds [6,10]. Thus, the phenolic acids and flavonoids identified in the present study constitute the core material basis for the documented antioxidant activity of PML.
Currently, analytical methods for antioxidant components in medicinal and edible plants such as PML primarily rely on HPLC coupled with UV or LC-MS. These methods are widely used due to their high sensitivity and ability to identify a wide range of compounds [37,38,39]. However, the separation of complex mixtures with similar polarity or low concentrations, as well as certain unstable antioxidants and those present in trace amounts, remains a significant challenge. 2D-LC effectively addresses these shortcomings by significantly improving separation efficiency and peak capacity, making it particularly suitable for the separation of complex matrices such as plant extracts [40,41]. Targeted antioxidant screening via ECD greatly accelerates the discovery of bioactive components and lays a foundation for leaf quality evaluation.
3.2. Comparison of Antioxidant Components in PML from Different Regions
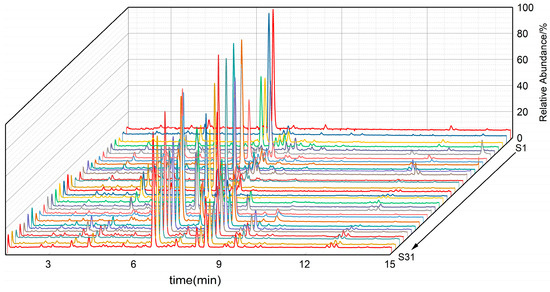
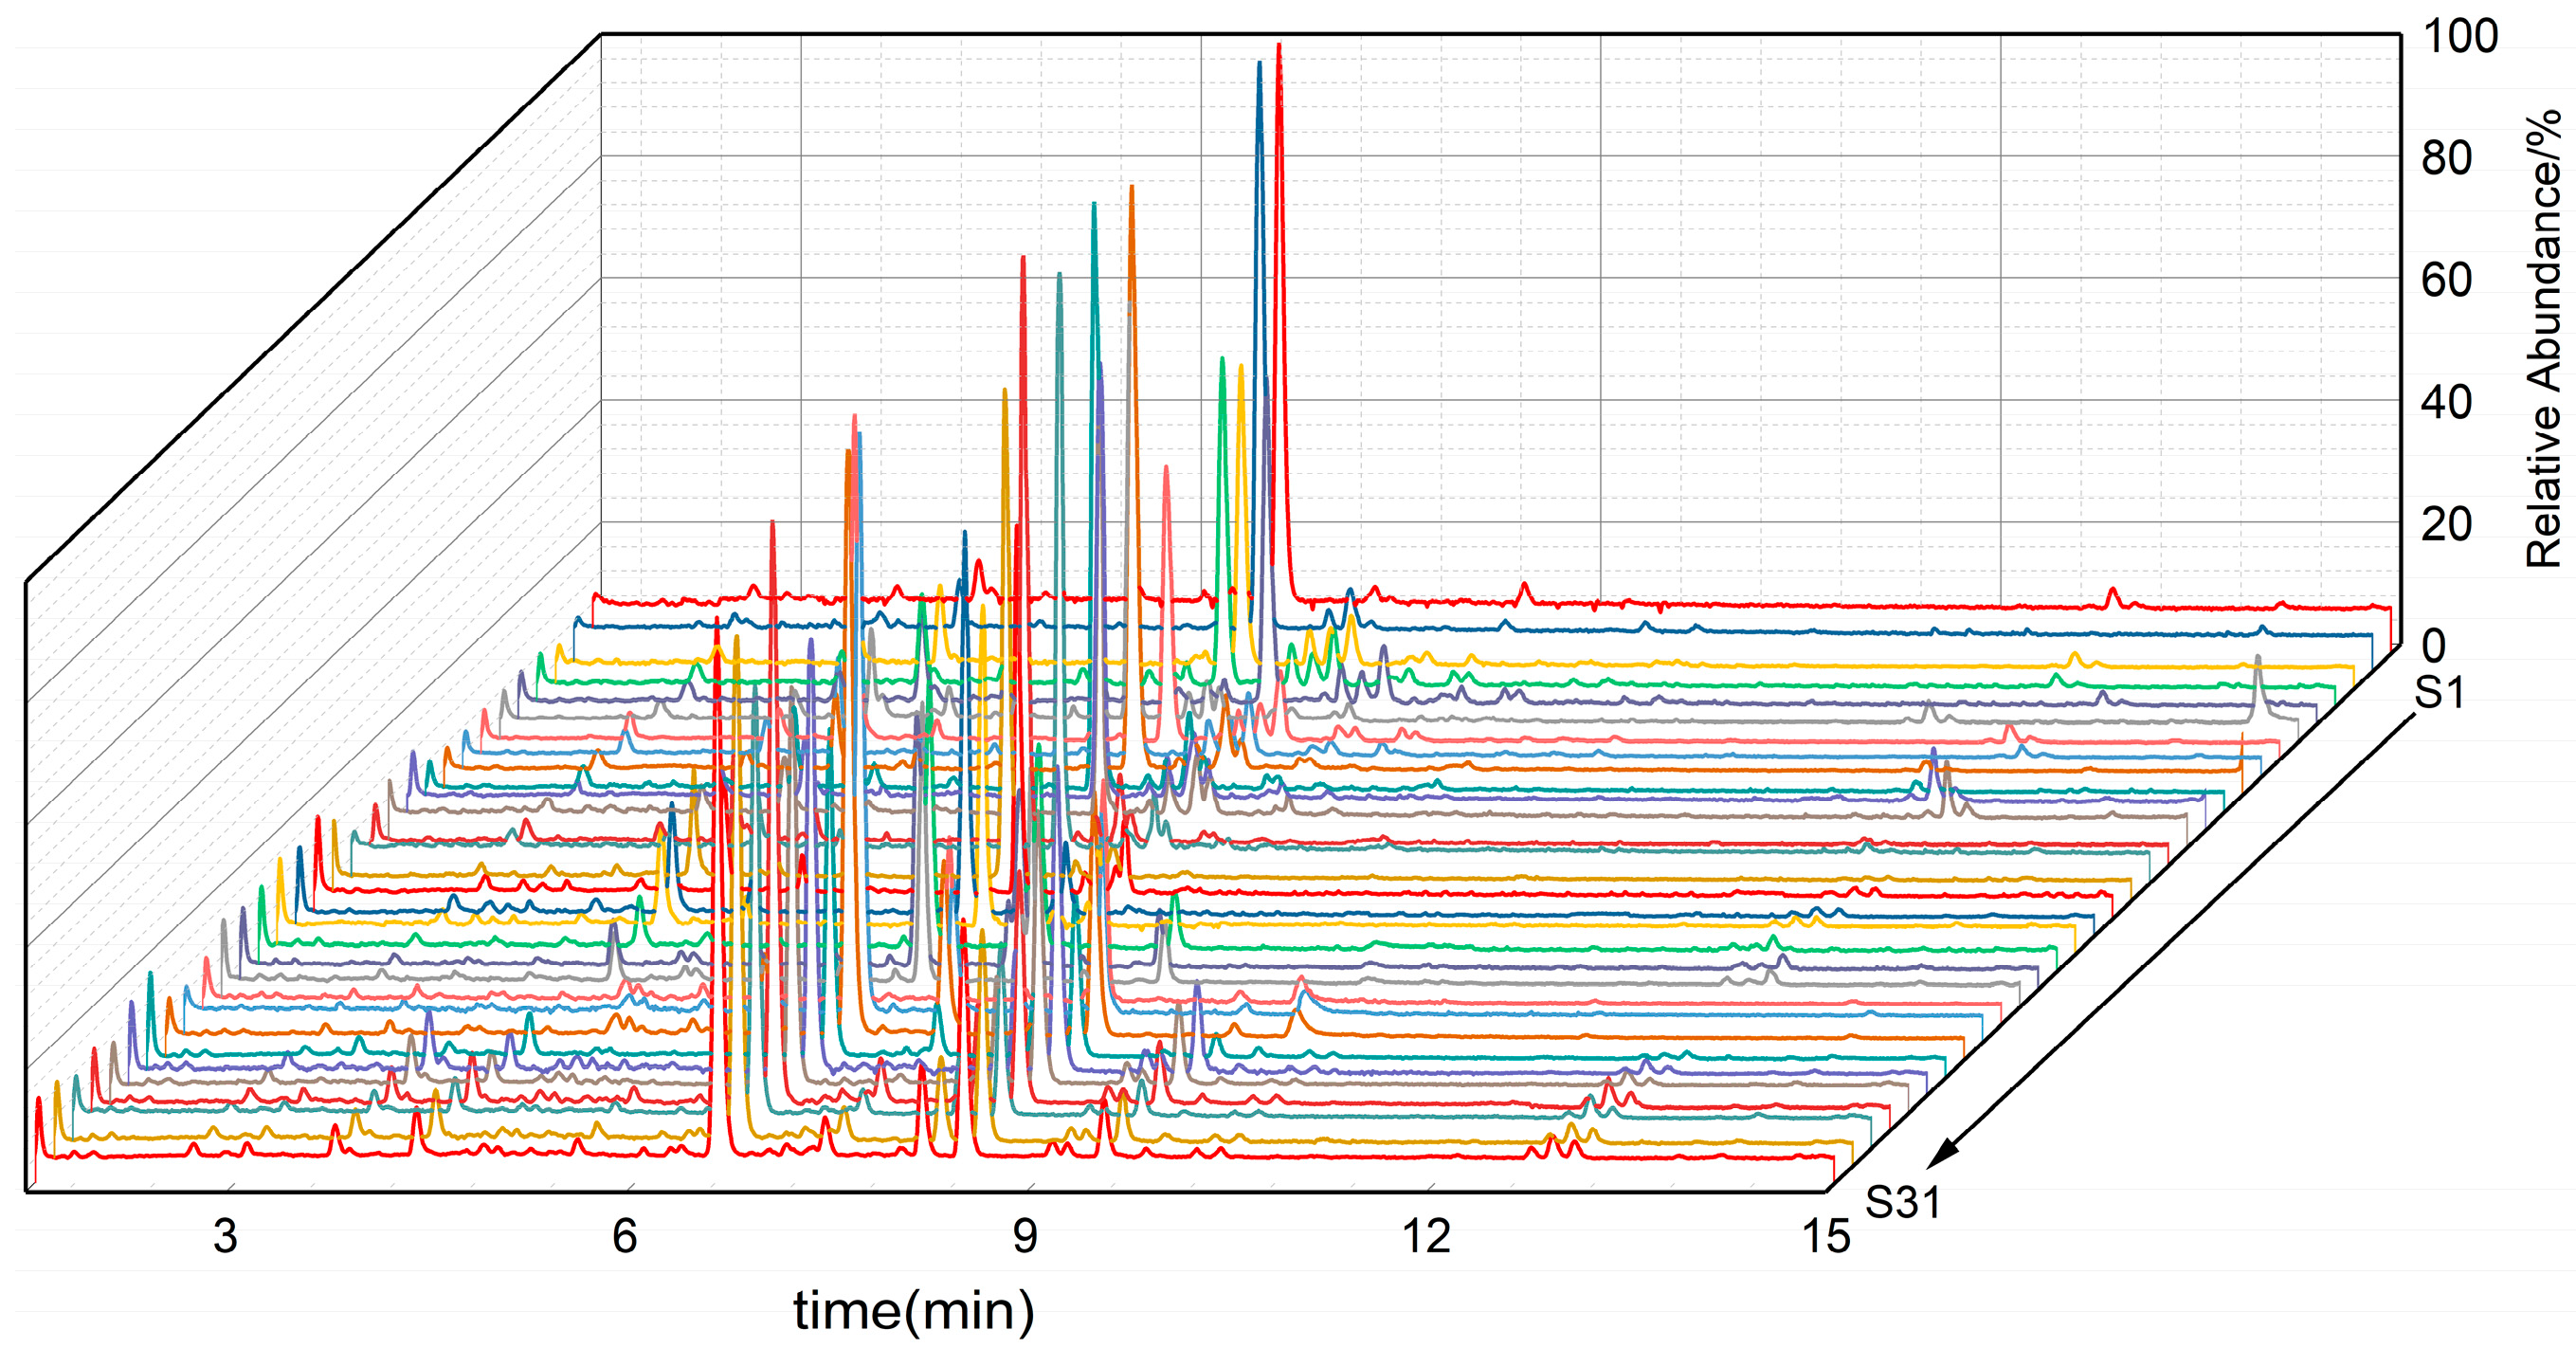
To compare their antioxidant profiles, 31 batches of PML samples collected from different regions in Guizhou Province were analyzed by LC-HRMS with a focus on the 43 previously identified antioxidant compounds. The total ion chromatograms of the samples are shown in Figure 3. The peak areas of the 43 identified antioxidants were extracted using Compound Discoverer 3.4 for multivariate statistical analysis including HCA, PCA, and OPLS-DA.
Figure 3.
Total ion current chromatogram of the quality profile for 31 batches of PML.
3.2.1. HCA
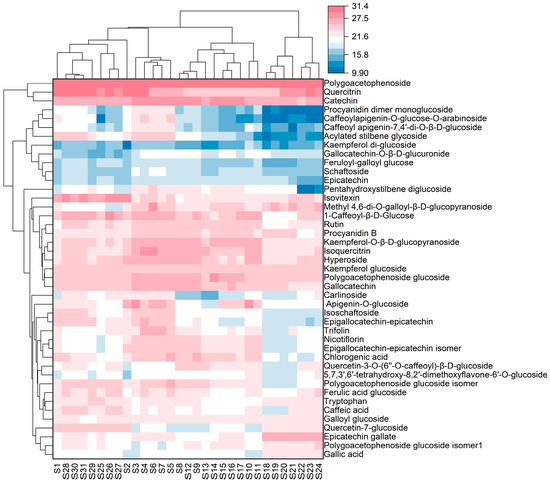
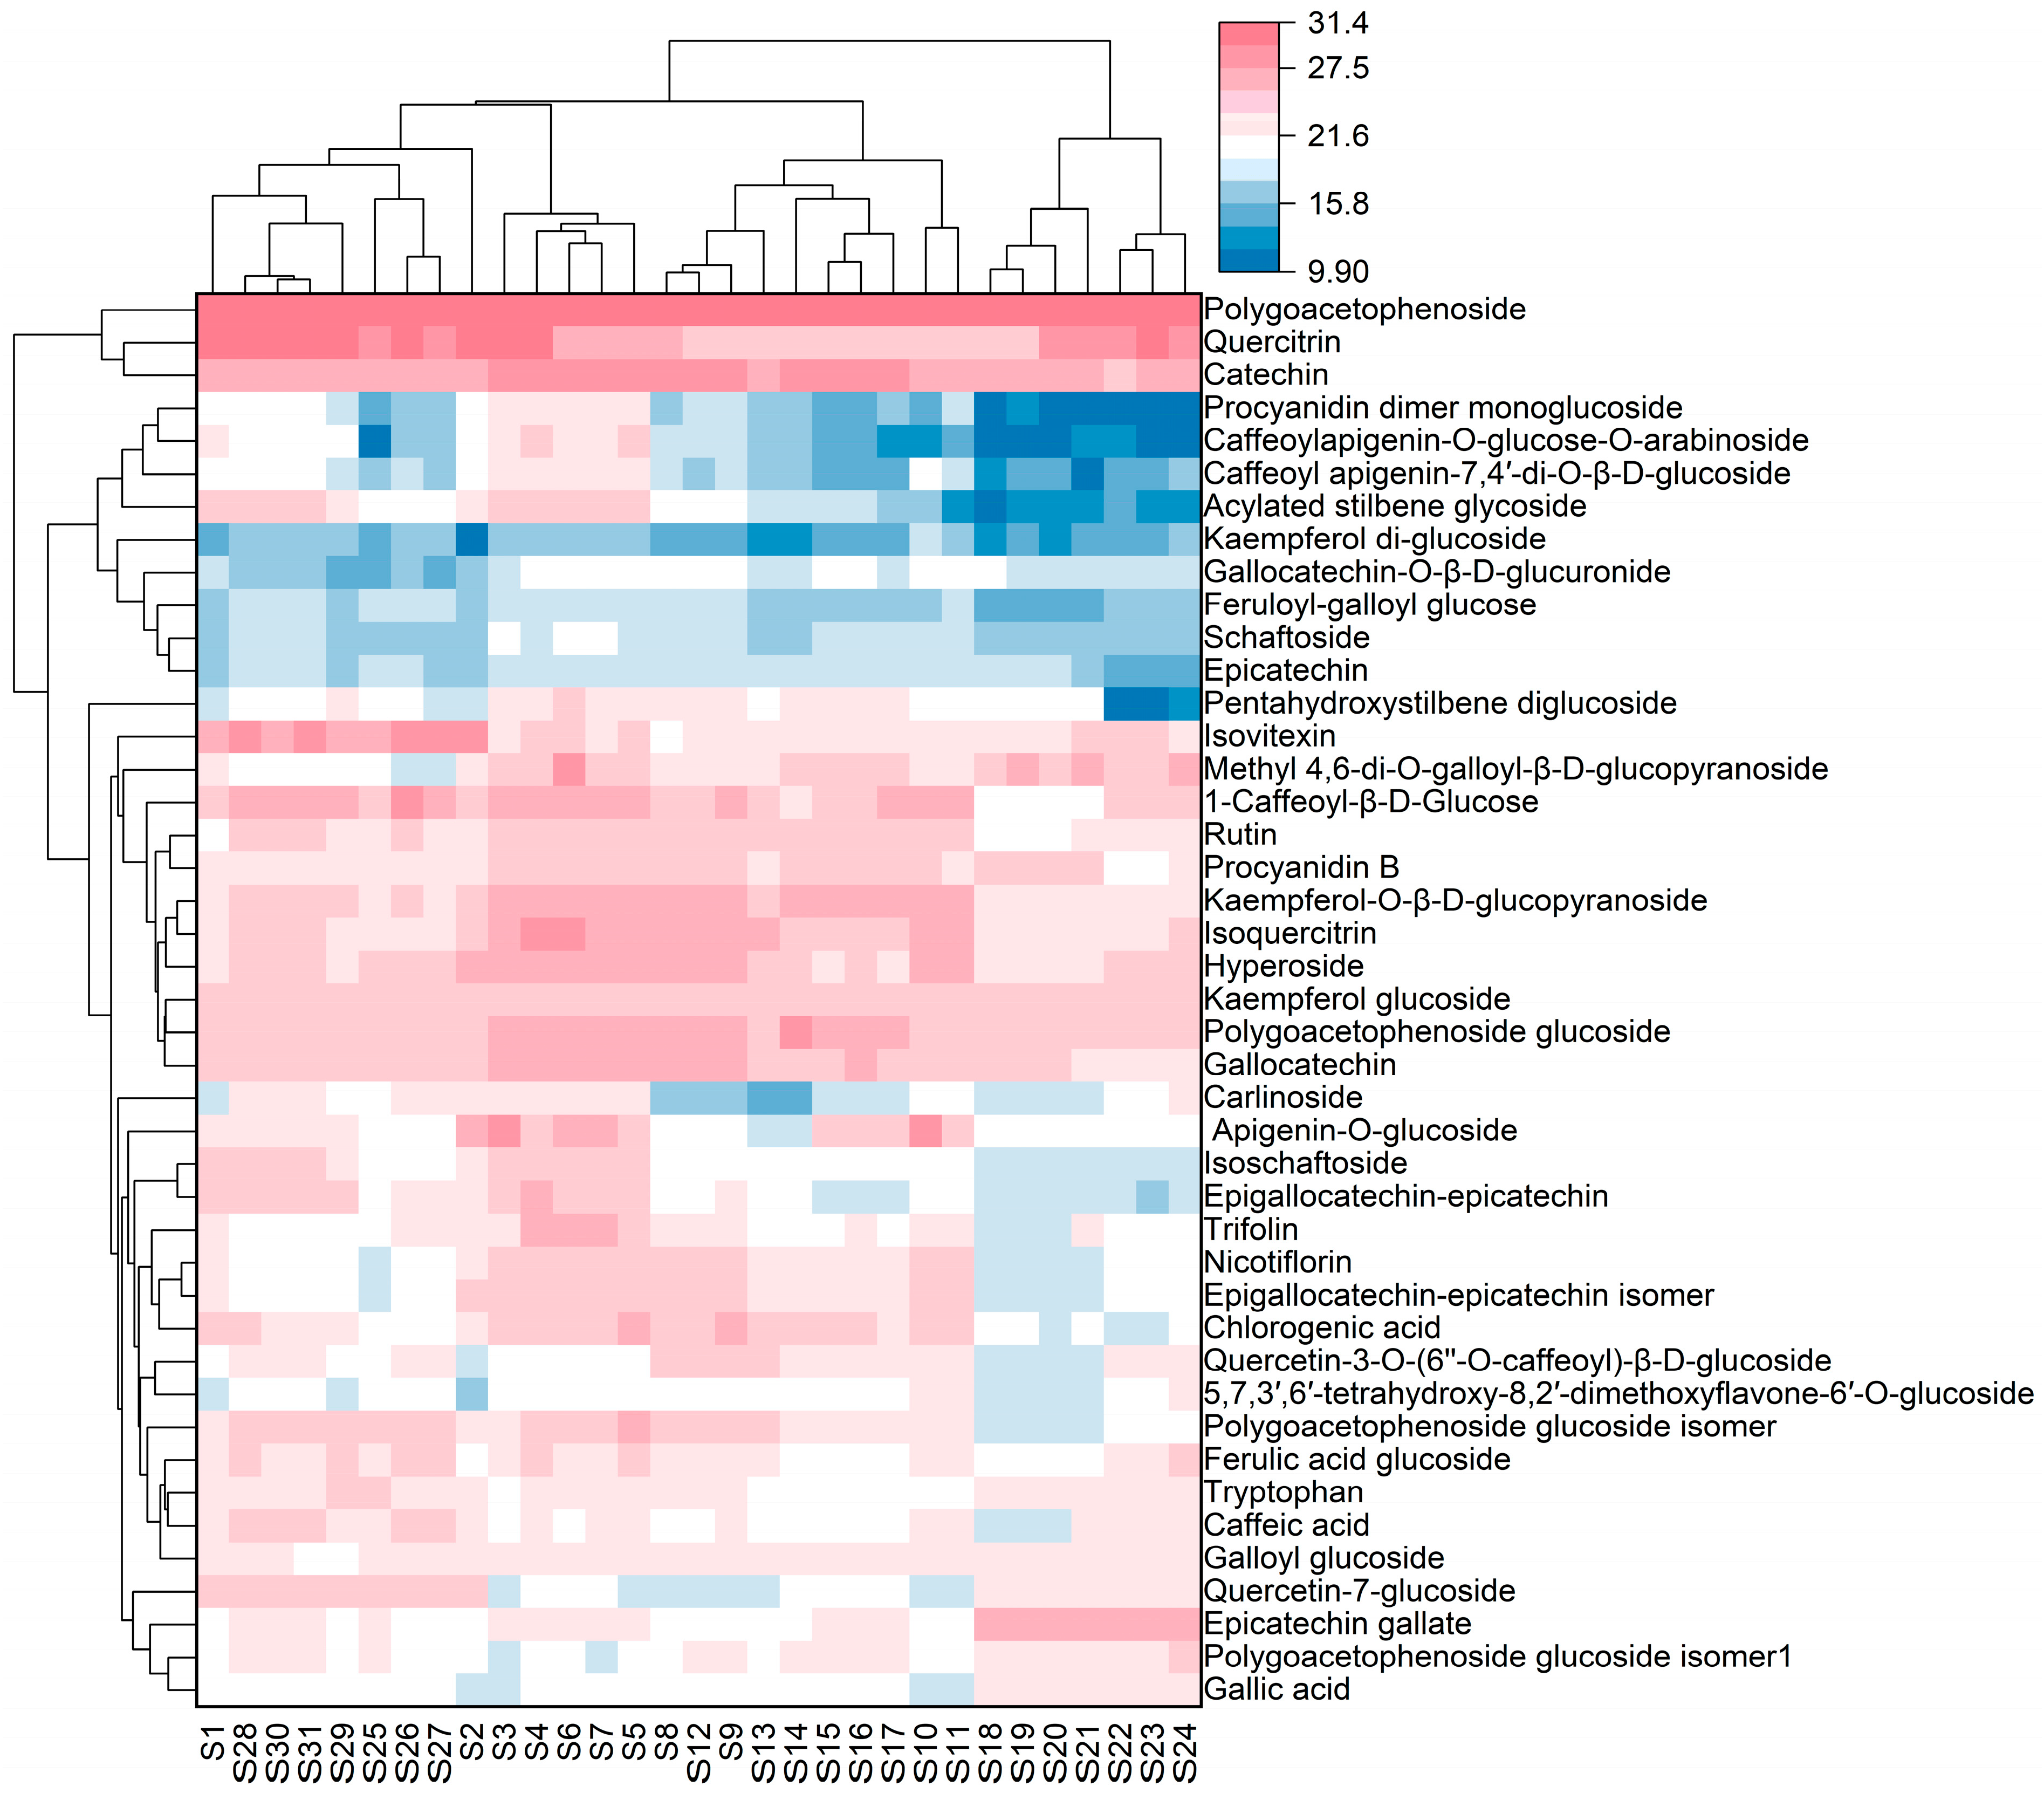
To systematically evaluate the overall chemical similarities and differences in PML from different geographical origins, hierarchical cluster analysis based on Euclidean distance was performed on the standardized peak areas of 43 main antioxidant compounds from 31 batches of samples. The clustering algorithm used was the between-groups average linkage method, and the results are shown in Figure 4.
Figure 4.
Heat map of cluster analysis results for 31 batches of PML samples.
The clustering dendrogram clearly shows that the 31 batches of PML samples exhibit a highly origin-specific clustering pattern. At a Euclidean distance of 30, they cluster into one category, indicating similarity among samples. All samples are clearly divided into four independent clusters, with each cluster corresponding exactly to a single geographical origin; no cross-clustering of samples across origins was observed. Systematic cluster analysis based on the 43 compounds enables effective differentiation of the 31 batches of PML samples. This classification more precisely reflects the chemotaxonomic relationships among samples, with samples within the same group exhibiting higher homogeneity in overall characteristics. Furthermore, this study found significant differences in intra-group homogeneity among PML samples from different regions, with the Congjiang group showing the highest internal homogeneity, while the Qinglong group exhibited relatively greater internal variation. This phenomenon may be related to the microenvironmental heterogeneity of the sampling sites. The clustering results perfectly matched the collection regions, providing a chemotaxonomic basis for subsequent group validation and the screening of characteristic indicators.
3.2.2. PCA
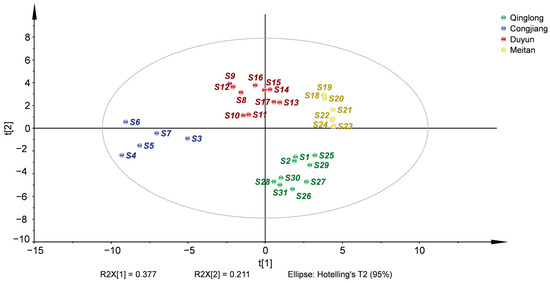
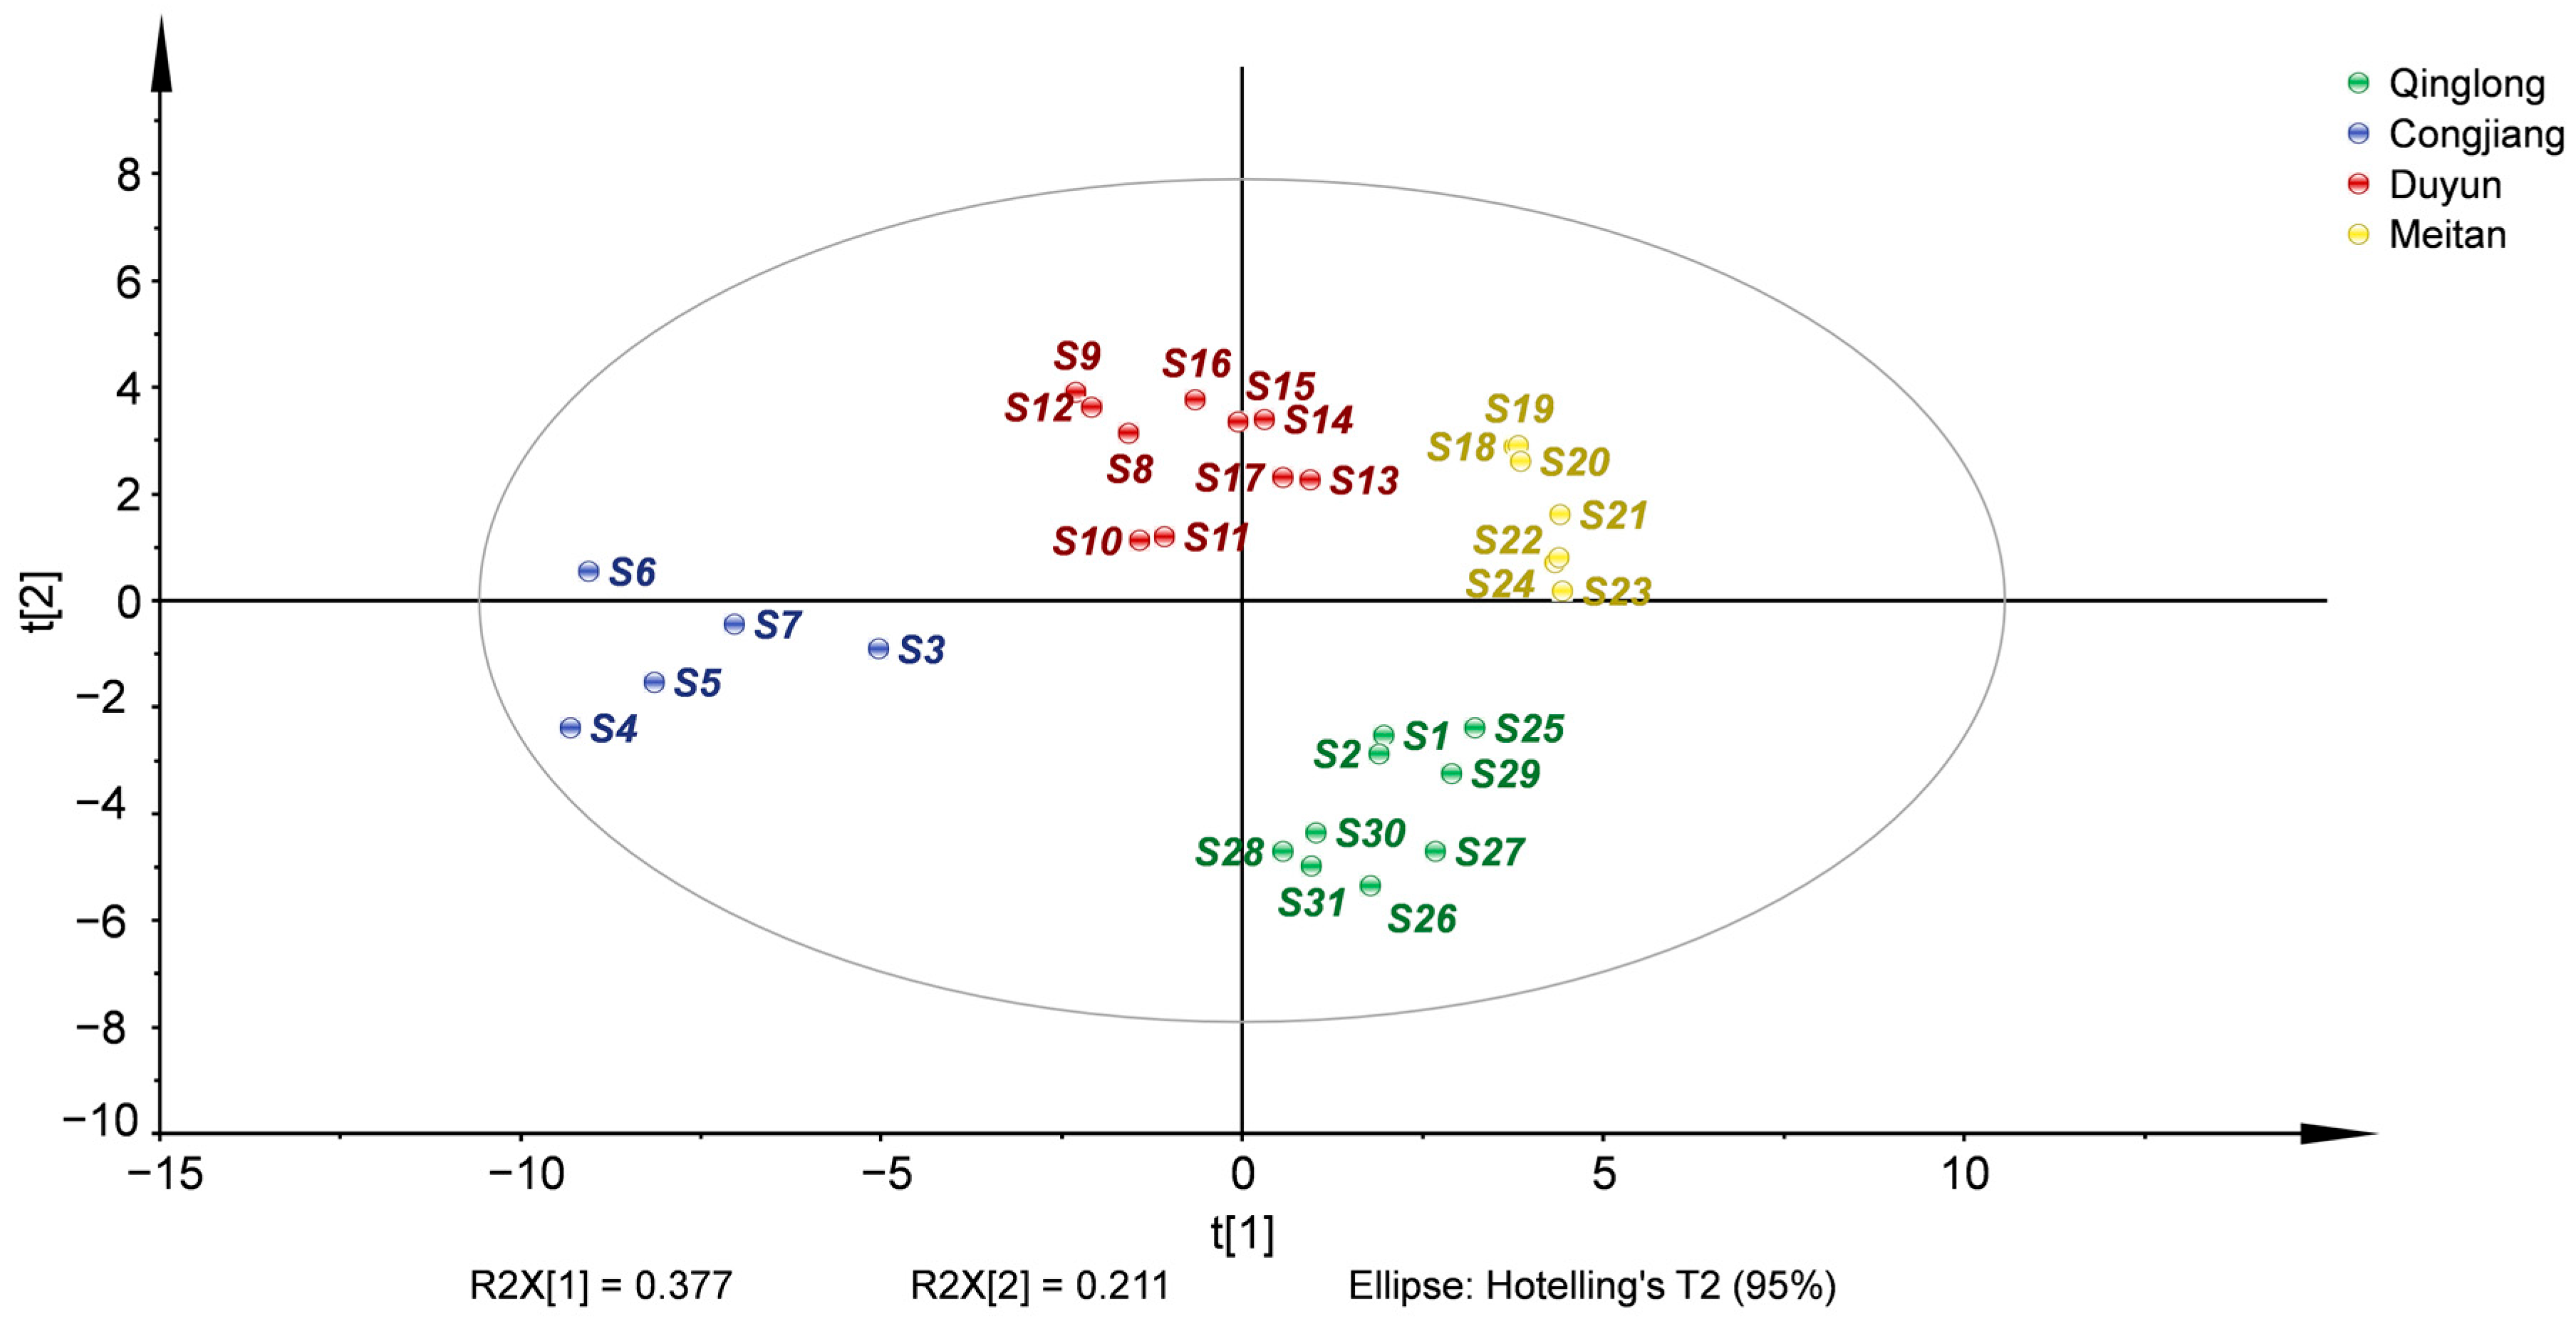
PCA is the most widely used unsupervised multivariate statistical dimensionality reduction method in natural product research [42,43,44,45]. It can reduce high-dimensional variables to a few core principal components while retaining as much of the original data information as possible, objectively reflecting the natural grouping patterns of samples and overall intergroup differences, and avoiding the subjective grouping bias of supervised models. Therefore, this study also performed the unsupervised principal component analysis, with the results shown in Figure 5. The analysis revealed that the first principal component explains 37.7% of the total variance in the original data (R2X[1]), while the second principal component explains 21.1% (R2X[2]), with the cumulative explanatory power of the first two principal components reaching 58.8%. In multivariate statistical analysis of complex natural product systems, this cumulative explanation rate adequately represents the overall characteristic information of the samples, indicating good model fit and reliable analytical results [46]. All 31 samples fell completely within the 95% confidence ellipse without any outliers, indicating good data quality, reproducibility, and stability in this analysis, with no abnormal data interfering with the results.
Figure 5.
PCA scores plot of the 31 batches of PML samples (R2X = 0.824, Q2 = 0.610).
Regarding the spatial distribution, samples from the four origins exhibited clear classification patterns with tight intra-group clustering and significant inter-group separation. This intuitively revealed the overall differences in chemical composition among samples from different origins. Specifically, samples from the Congjiang origin were exclusively concentrated along the negative axis of PC1, achieving complete spatial separation from the other three origins. This indicates that the Congjiang group possesses the most distinct chemical composition. Samples from the Duyun origin were entirely concentrated in the lower half of the positive PC2 axis and near the origin of PC1, achieving complete vertical separation from the Qinglong samples along the PC2 axis and forming a significant horizontal distinction from both the Congjiang and Qinglong origin samples along the PC1 axis. Samples from the Meitan origin were primarily clustered in the intermediate region between the positive axis of PC1 and the origin, exhibiting the highest intra-group clustering. This indicates that samples from this origin demonstrate the best chemical composition homogeneity and stability. Samples from Qinglong were distributed along the positive PC2 axis, showing a clear separation trend from the Duyun samples on the PC2 axis; the overall characteristics of these two groups were relatively close but still effectively distinguishable. The PCA results clearly confirm that there are significant regional differences in the overall chemical composition of PML from the four origins (Qinglong, Congjiang, Duyun, and Meitan), and that origin is the key factor influencing the accumulation of their chemical components.
Furthermore, these natural clustering results are fully consistent with the classification results of hierarchical cluster analysis based on Euclidean distance. The mutual corroboration of these two unsupervised multivariate statistical methods further enhances the reliability and robustness of the analysis results, laying a solid foundation for subsequent supervised pattern recognition analysis, the screening of region-specific marker compounds, and the establishment of a quality evaluation system.
3.2.3. OPLS-DA
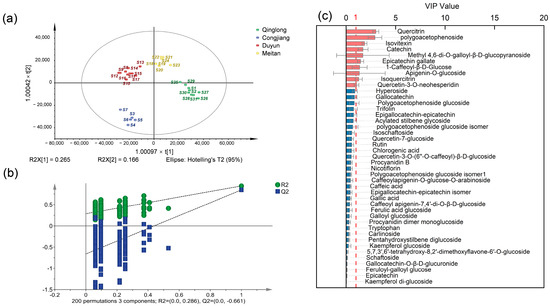
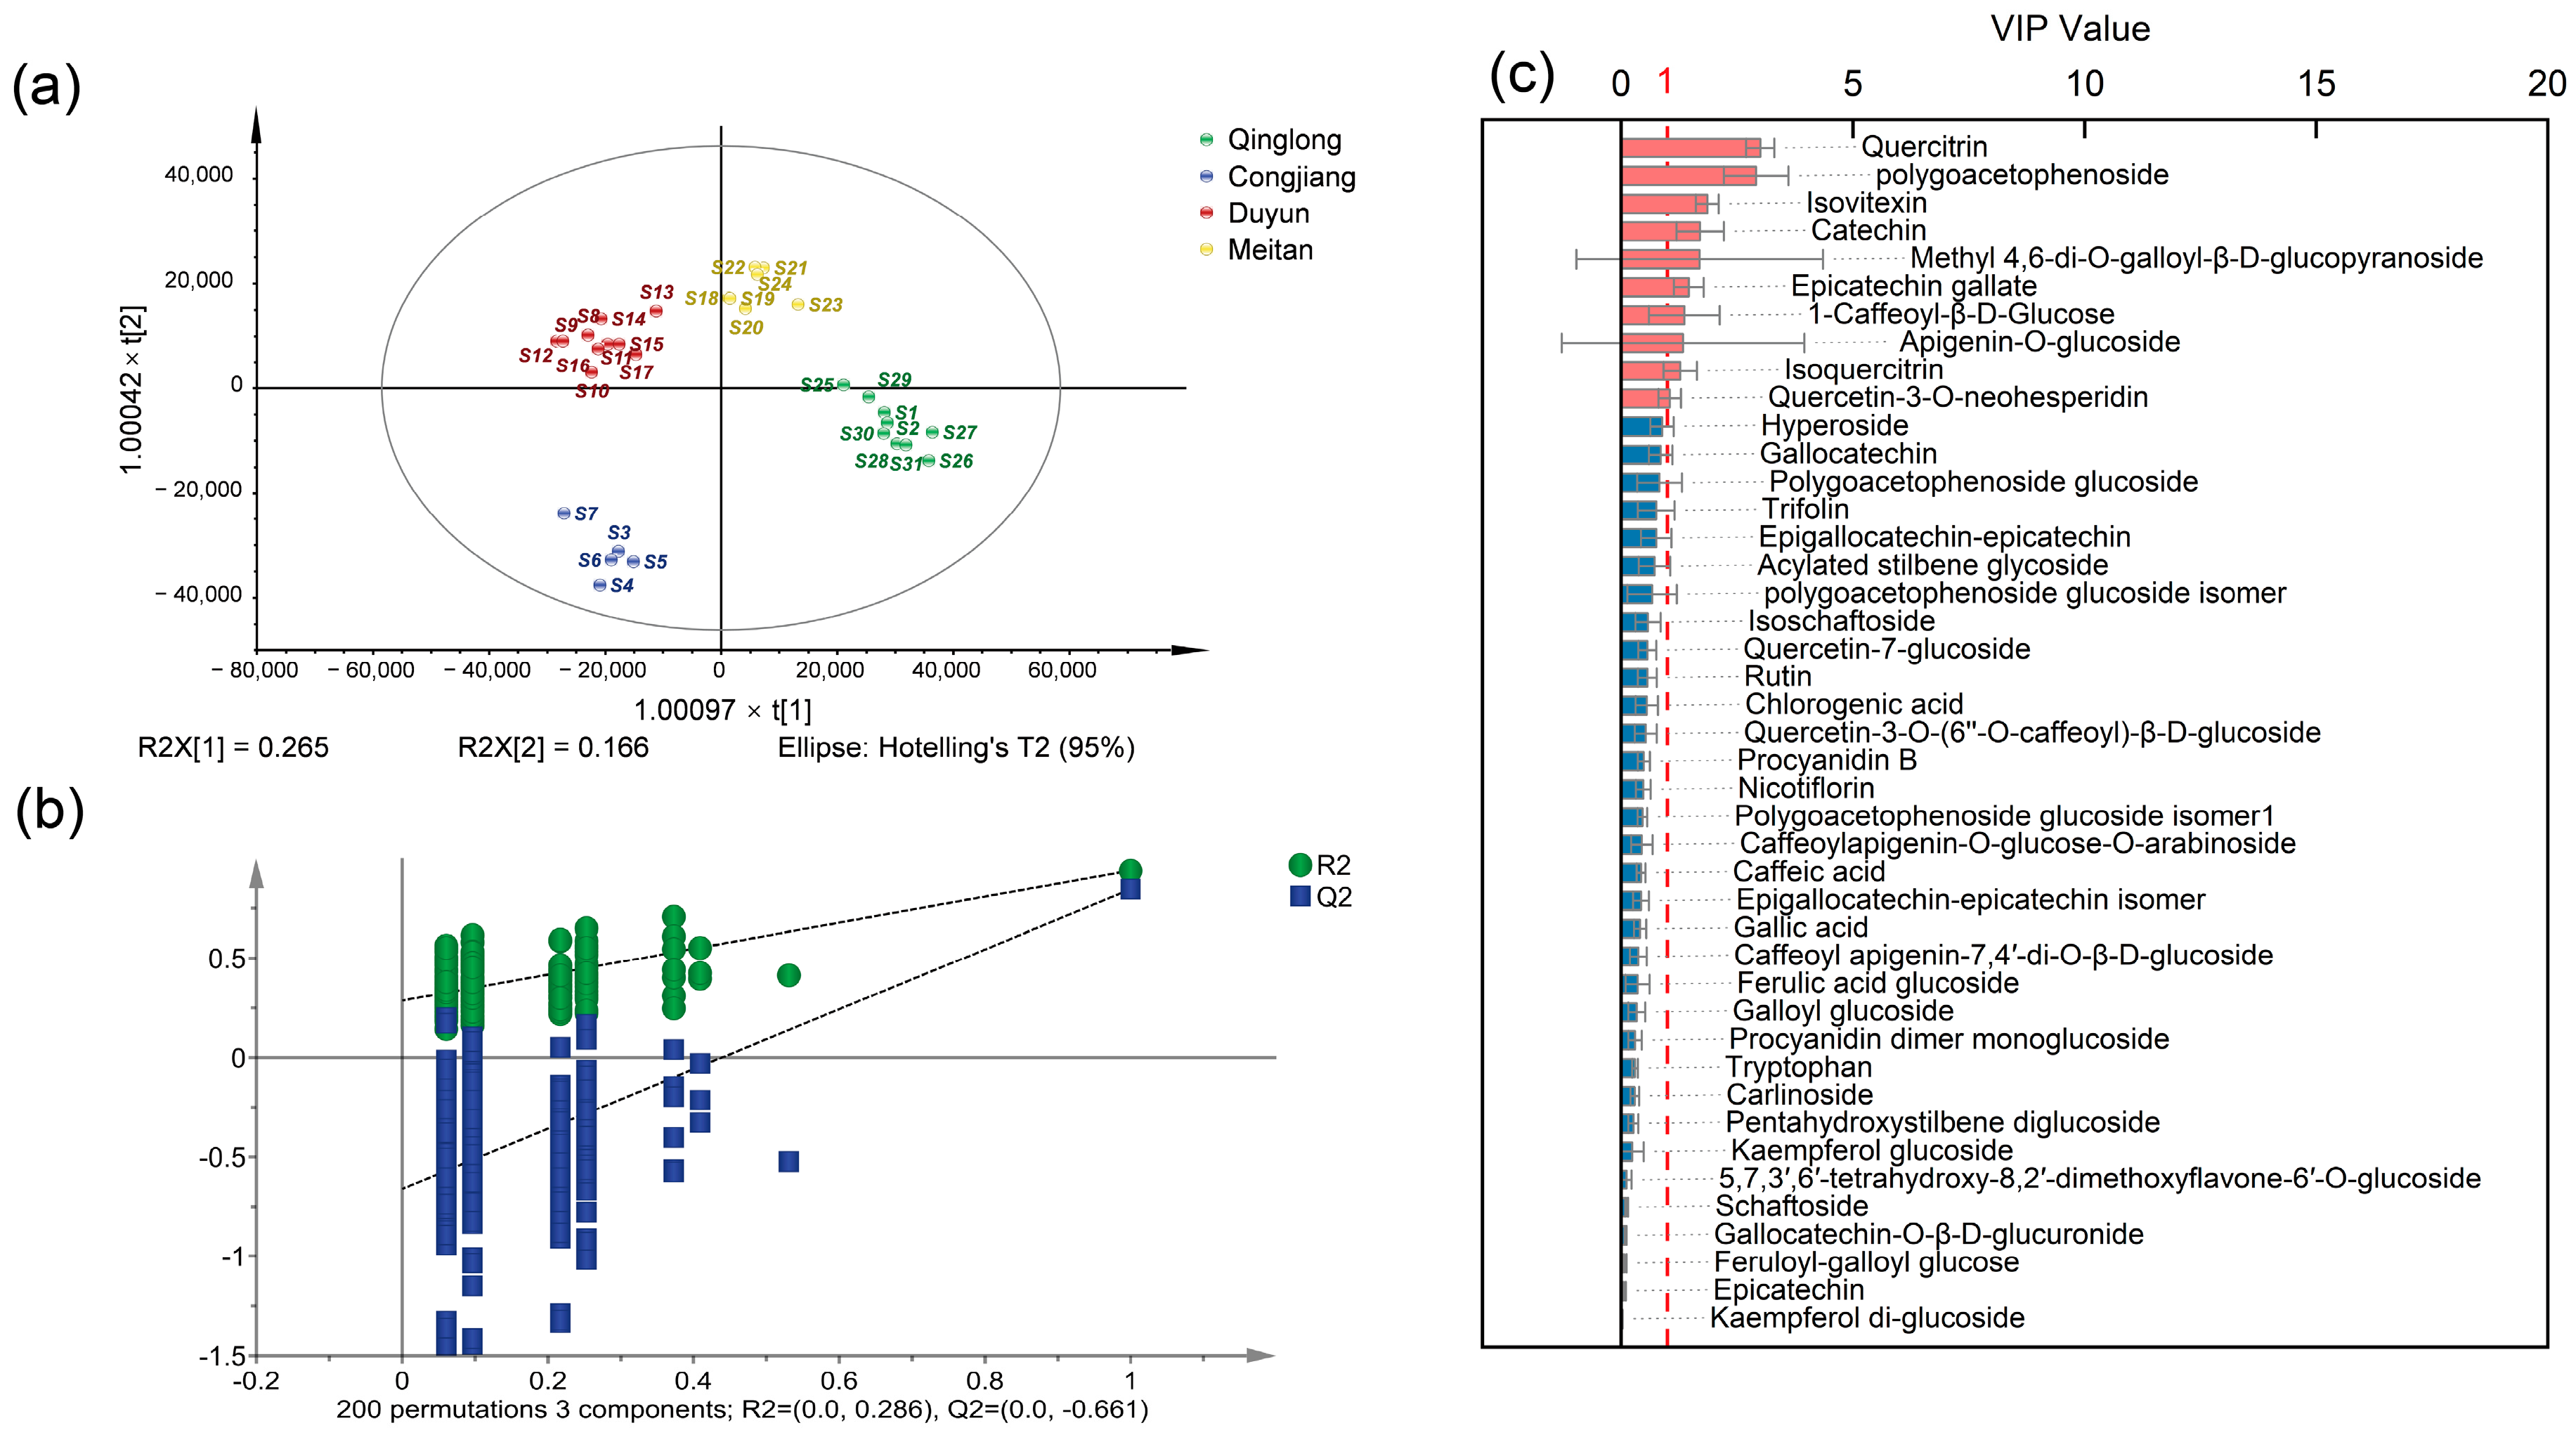
To identify the marker compounds responsible for the differences in the chemical composition of PML samples from different origins, this study used the peak areas of the 43 compounds as independent variables and sample origin as the classification dependent variable. An OPLS-DA model was constructed using SIMCA software, and the results are shown in Figure 6. The model parameters R2X, R2Y, and Q2 describe the goodness of fit and predictive ability of the model, respectively. An R2X value closer to 1 indicates a more stable model, while a higher R2Y reflects stronger explanatory power. All samples fell within the 95% confidence ellipse, and a Q2 value greater than 0.5 indicates good predictive ability.
Figure 6.
Results of the OPLS-DA model analysis for 31 batches of PML samples: (a) OPLS-DA score plot with R2X = 0.933, R2Y = 0.941, Q2 = 0.846; (b) Results from 200 random permutations [R2 = (0.0, 0.286); Q2 = (0.0, −0.661)]; (c) VIP values of OPLS-DA. Note: “×” indicates the multiplication sign.
The model fit and predictive performance parameters show that the cumulative explanatory power of the OPLS-DA model for the independent variable matrix is R2X = 0.933, and for the dependent variable is R2Y = 0.941. The model’s predictive performance parameter obtained from cross-validation is Q2 = 0.846. All three core parameters are greater than 0.5, indicating that the model possesses excellent explanatory power for sample classification, good fit, and stable and reliable predictive capability. The OPLS-DA scatter plot Figure 6a shows that PML samples from the four origins (Qinglong, Congjiang, Duyun, and Meitan) exhibit significant trends of tight intra-group clustering and clear inter-group separation. All samples are distributed within the 95% confidence ellipse without any outlier samples, indicating good stability of the chemical profiles of samples from different origins and that the geographic origin is the core driving factor for chemical differences in PML.
To validate the robustness of the model and rule out the risk of overfitting, a permutation test with 200 permutations was performed on the dependent variable (sample origin) (Figure 6b). The intercept values of R2 = (0.0, 0.286) and Q2 = (0.0, −0.661) confirmed that the model was not overfitted. All randomly permuted Q2 values were negative and substantially lower than the original Q2 (0.846). A Q2 > 0.5 combined with a negative Q2 intercept is widely accepted as evidence of a valid and predictive OPLS-DA model. This confirms that the OPLS-DA model exhibits no overfitting, possesses strong statistical reliability, and can be used for the subsequent screening of differential marker compounds in PML from different origins.
To identify the components that contribute most significantly to the classification of PML, a VIP analysis was performed on the OPLS-DA model (Figure 6c), where VIP > 1 indicates that the component makes a significant contribution to the model.
Ten differential markers with VIP values above 1.0 were identified, namely quercitrin, polygoacetophenoside, catechin, isovitexin, methyl 4,6-di-O-galloyl-β-D-glucopyranoside, epicatechin gallate, apigenin-O-glucoside, isoquercitrin, 1-caffeoyl-β-D-glucose, and quercetin-3-O-neohesperidin. These compounds can serve as potential chemical indicators for antioxidant quality assessment and geographical traceability of PML.
Unlike previous studies that primarily relied on conventional 1D-LC-UV or 1D-LC-MS for profiling phenolic compounds in PML [15,16,47], the present study integrates offline 2D-LC-ECD with UHPLC-Orbitrap-MS/MS. This analytical strategy exhibits multiple remarkable advantages. The application of ECD enables activity-guided, highly sensitive screening of electrochemically active antioxidants. The RP × RP 2D-LC system effectively overcomes the co-elution bottleneck of structurally analogous flavonoids and phenolic acids by substantially enhancing peak capacity and separation resolution. Furthermore, the synergistic integration of high-resolution tandem mass spectrometric analysis and in vitro free radical scavenging activity validation further ensures the comprehensiveness and reliability of active compound identification.
Accordingly, the present study developed a hyphenated analytical platform coupling 2D-LC, ECD, and UHPLC-Orbitrap-MS/MS, which was employed for the elucidation of the antioxidant profile and geographical origin traceability of PML.
3.3. Quantitative Analysis of Major Antioxidant Components in PML from Different Regions
3.3.1. Method Validation
The established UHPLC-Orbitrap-MS/MS quantification method was systematically validated in terms of linearity, LOD, LOQ, precision and recovery (Table A1). All 19 target compounds exhibited good linear relationships within their respective linear ranges, with R2 values all greater than 0.9900. The LOD and LOQ ranged from 0.01 to 0.57 μg/mL and 0.03 to 1.9 μg/mL, respectively. The RSD for intra-day precision ranged from 1.41% to 2.23%, and that for inter-day precision ranged from 0.87% to 1.45%, with both values below 5%. This indicates that the method exhibits good repeatability and reliable long-term stability.
The average spike recoveries ranged from 93.04% to 105.29%, with associated RSDs of 1.56–12.33%. The matrix effect values for all 19 target compounds fell within 92.05–109.98%, well inside the acceptable range of 80–120%, indicating minimal matrix interference. This finding demonstrates that solvent dilution can effectively mitigate matrix effects in complex plant samples. Overall, the validation parameters met the standard requirements for the simultaneous quantification of multiple constituents in natural medicinal plants, confirming the satisfactory accuracy of the established UHPLC-Orbitrap-MS/MS method.
3.3.2. Quantification of 19 Components in 31 Batches of PML
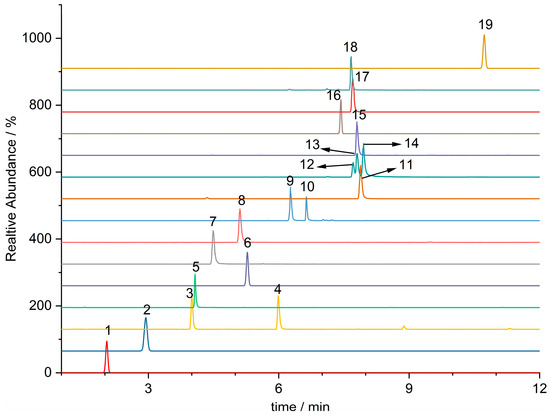
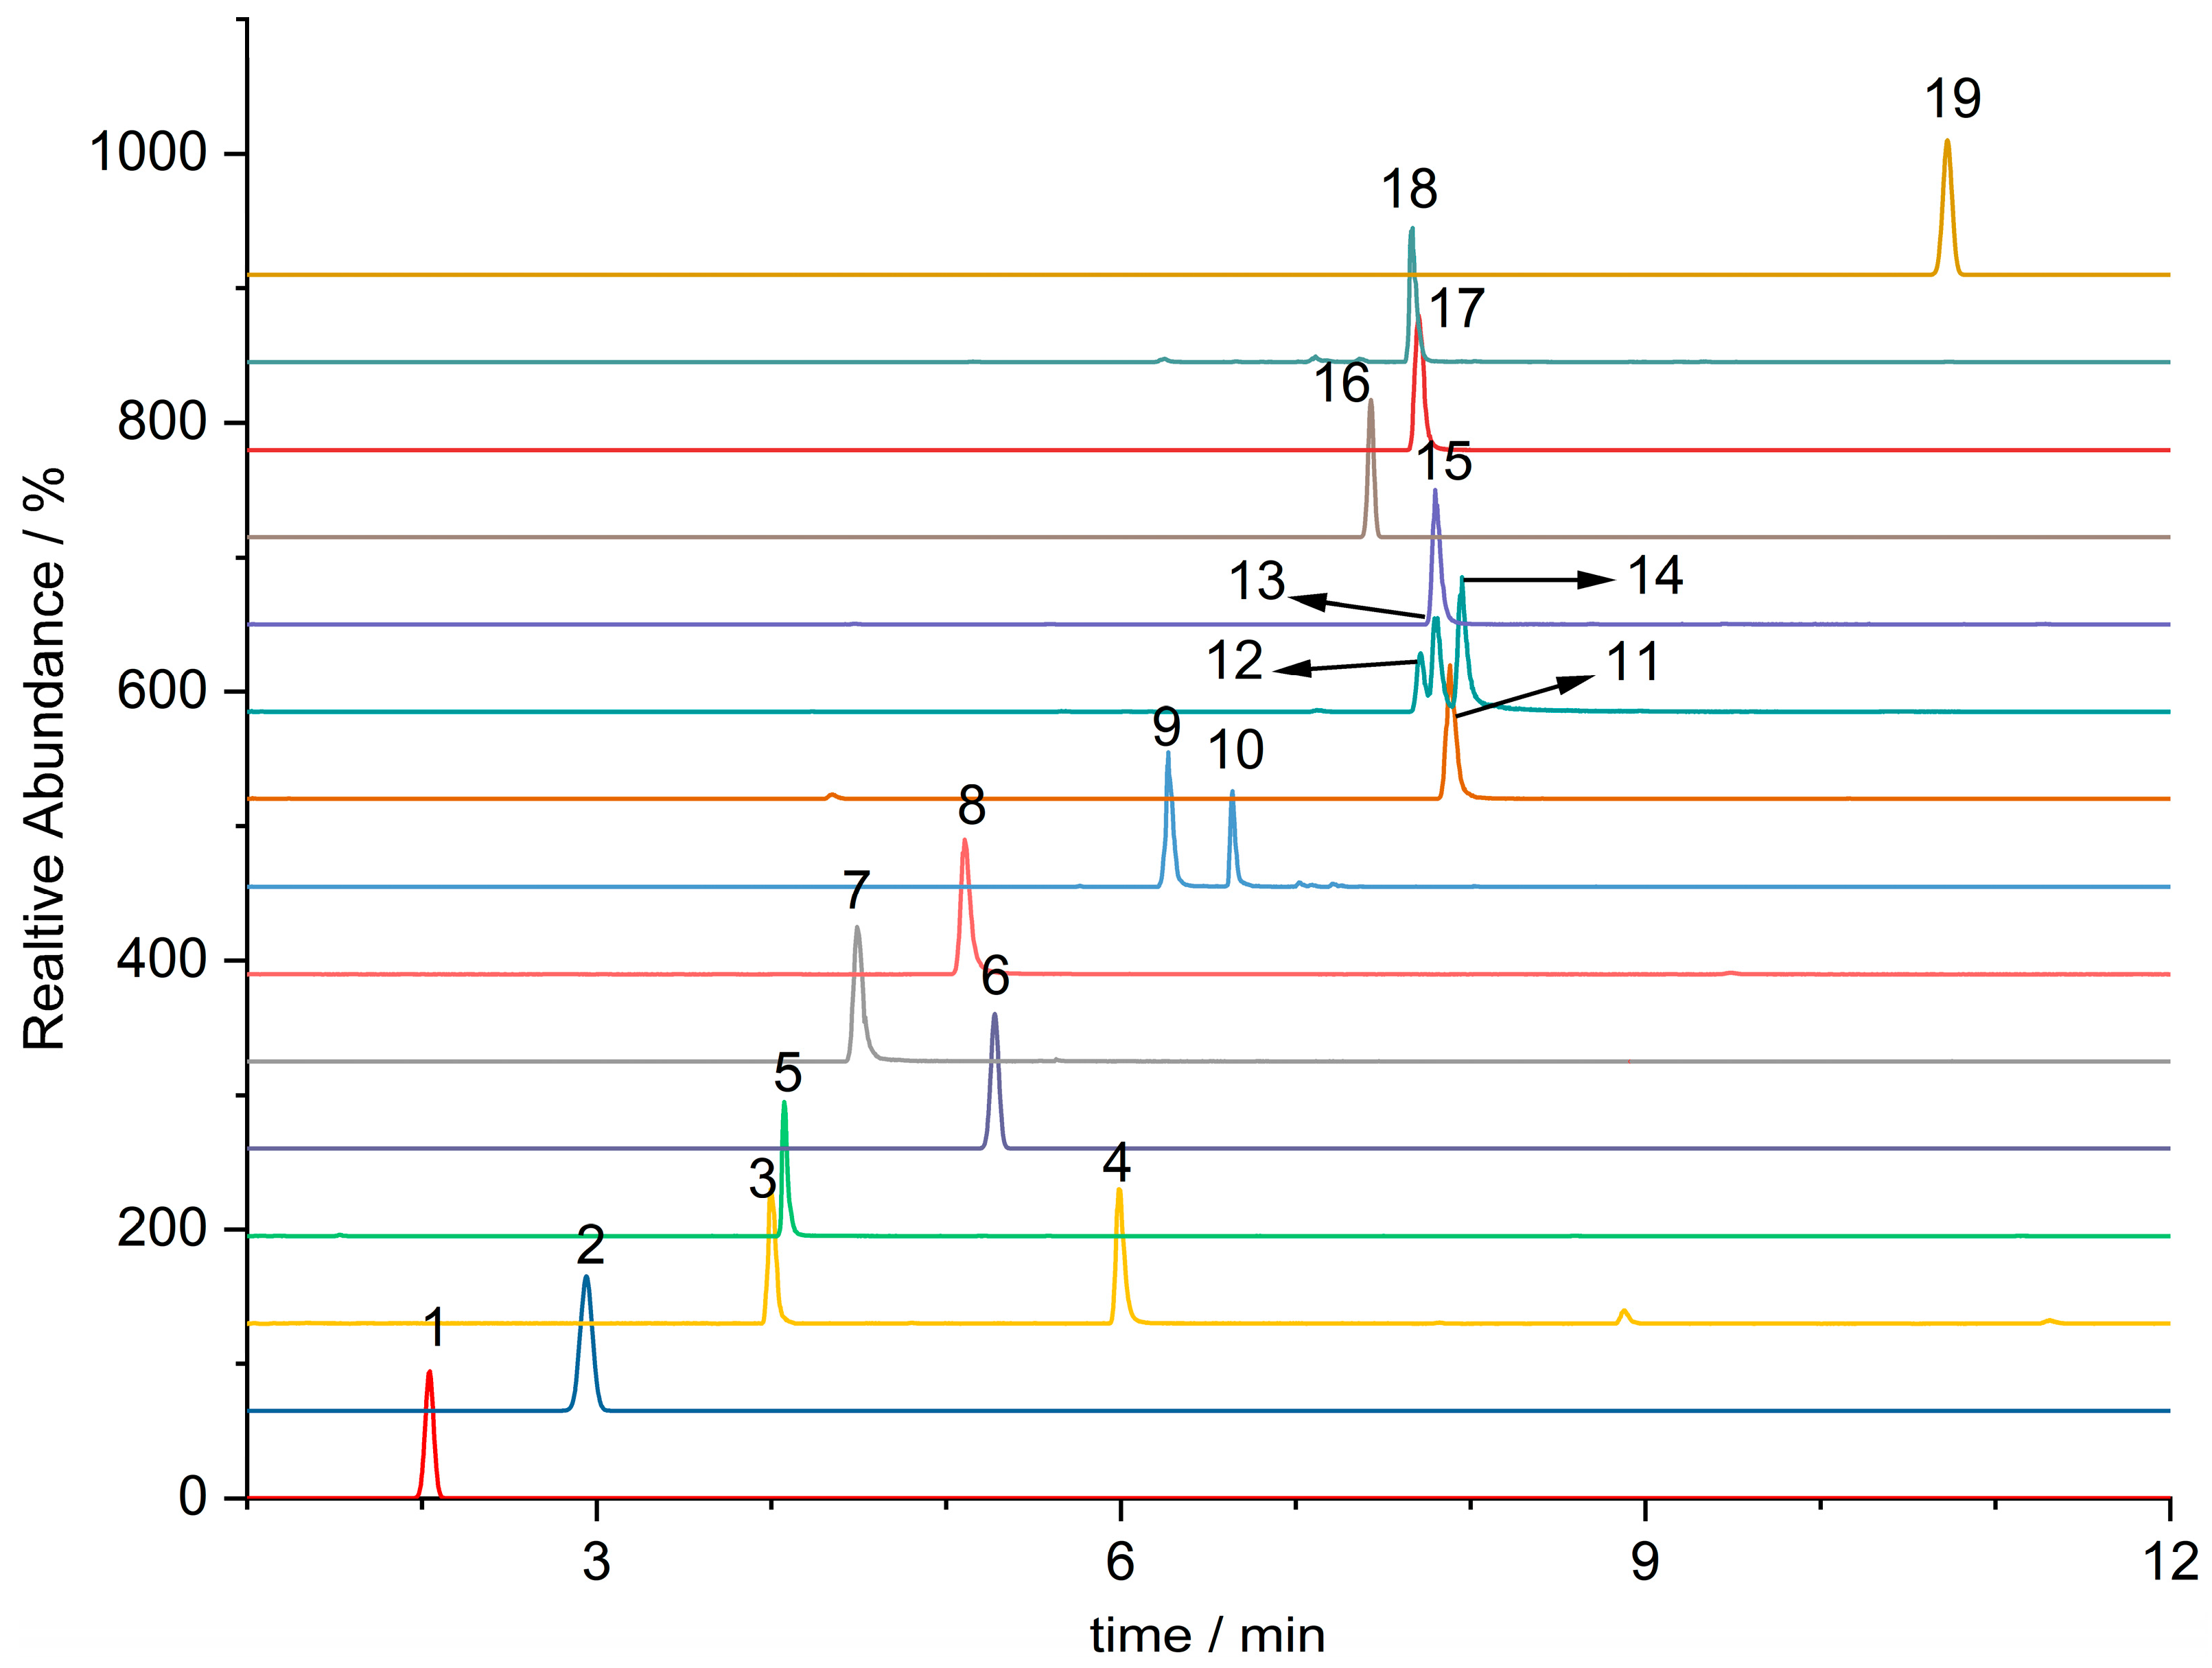
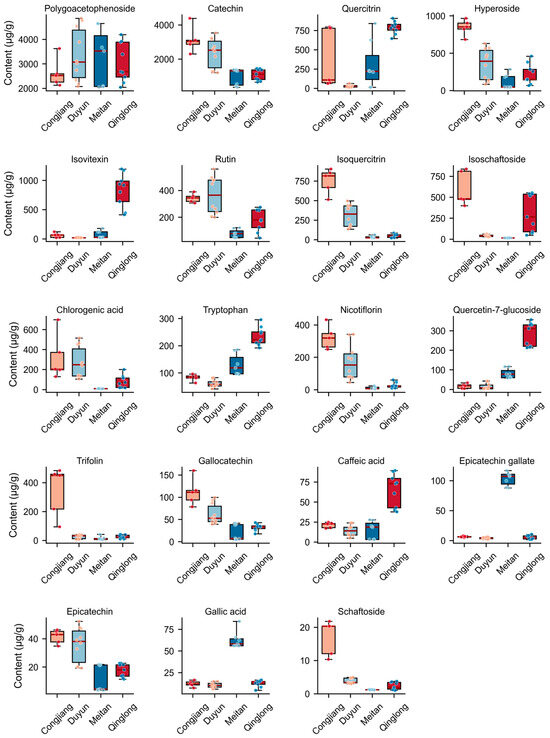
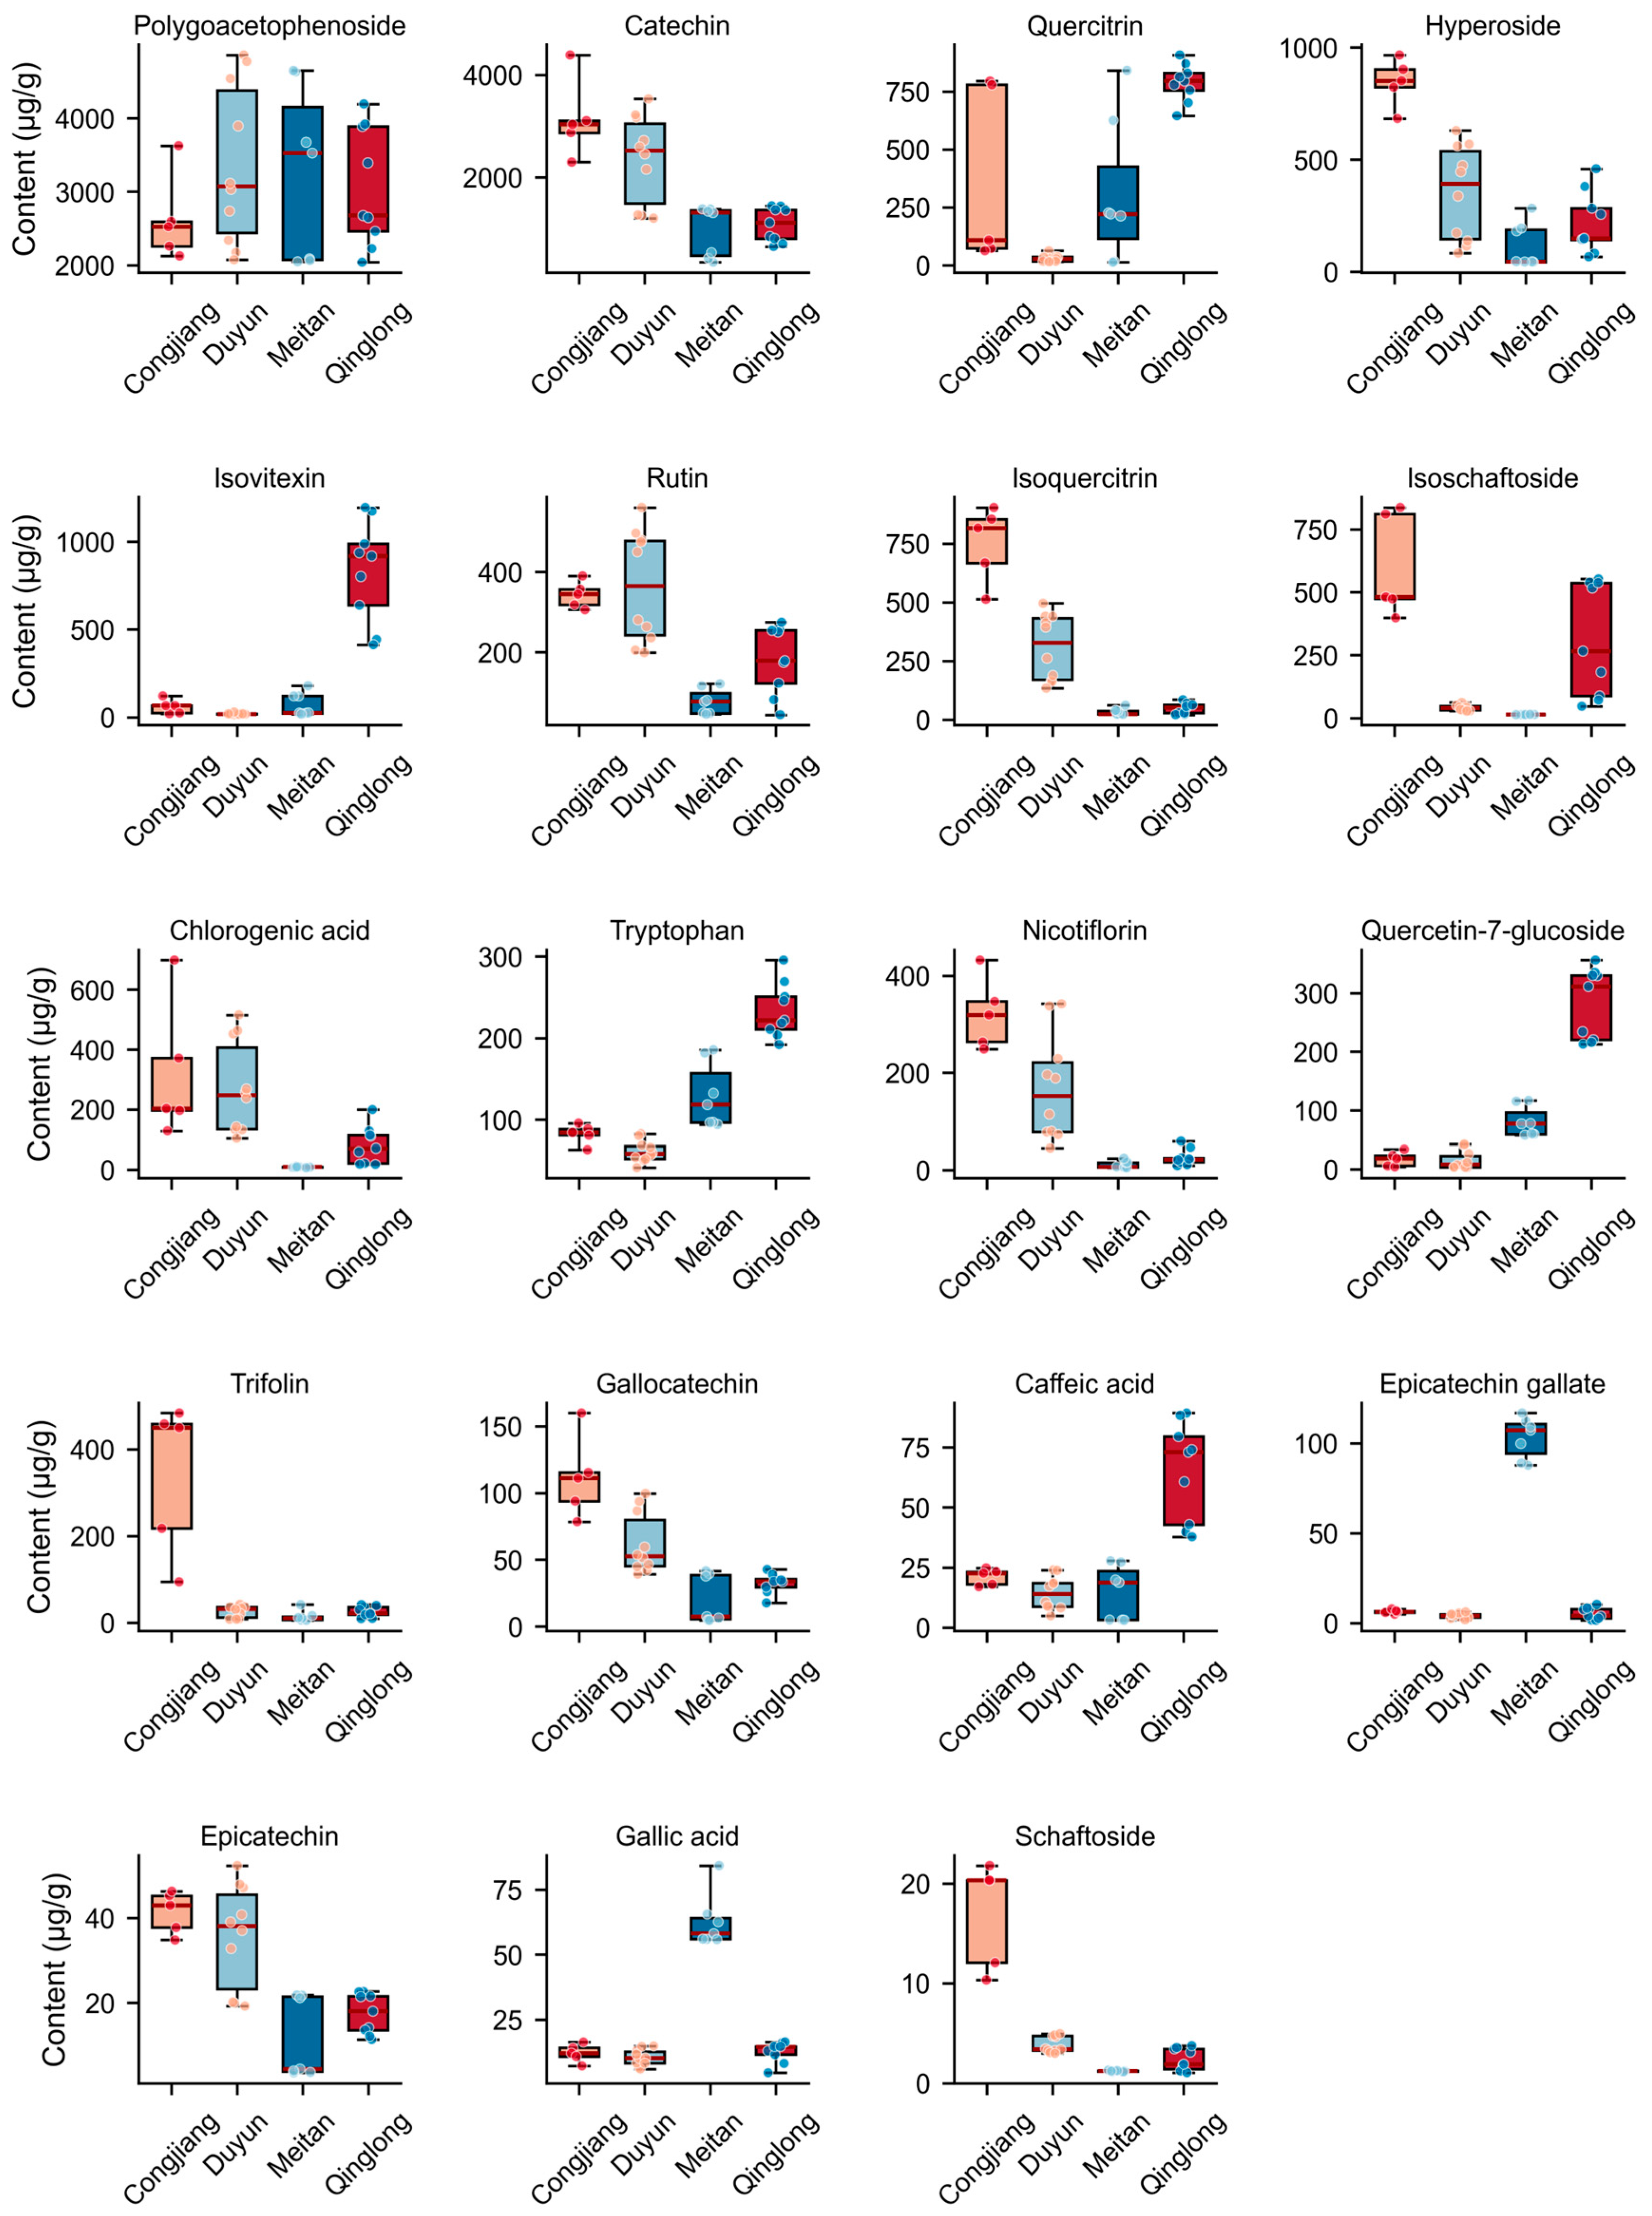
The validated method was applied to quantify the 19 target compounds in 31 batches of PML samples. The chromatogram of the standards is shown in Figure 7. The results showed that all 19 target components were detected across all batches, but the content levels of each component exhibited significant inter-batch differences. The statistical results of the average content for each component in the 31 batches of samples are shown in Table A2 and Figure 8.
Figure 7.
Standard reference solutions for 19 compounds in PML. Note: 1. Gallic acid, 2. Gallocatechin, 3. Catechin, 4. Epicatechin, 5. Tryptophan, 6. Caffeic acid, 7. Chlorogenic acid, 8. Polygoacetophenoside, 9. Isoschaftoside, 10. Schaftoside, 11. Epicatechin gallate, 12. Hyperoside, 13. Isoquercitrin, 14. Quercetin-7-glucoside, 15. Isovitexin, 16. Rutin, 17. Quercitrin, 18. Nicotiflorin, 19. Trifolin.
Figure 8.
Content of 19 major antioxidants in PML from four regions.
In terms of overall content distribution, polygoacetophenoside was the most abundant characteristic component in the samples, with an average content of 3121.23 μg/g across the 31 batches. It was consistently detected in all batches and served as the dominant component in the samples. Among them, sample S9 from Duyun had the highest content, reaching 4856.79 μg/g, while sample S1 from Qinglong had the lowest content at 2041.87 μg/g. This indicates large quality differences in PML from these regions, which may be related to the micro-environment (light, humidity, soil conditions, etc.) at the collection sites. Flavonoids constitute the primary group of bioactive compounds in the samples. Catechin, quercitrin, and hyperoside were the most abundant flavonoids, exhibiting average concentrations of 1798.10 μg/g, 366.79 μg/g, and 340.69 μg/g, respectively.
The highest quercitrin content was found in the S29 sample from Qinglong, reaching 907.94 μg/g; moreover, samples from Meitan had higher average contents of epicatechin gallate and gallic acid than samples from the other three regions. Hyperoside was most abundant in sample S4 from Congjiang, at 966.86 μg/g. In addition, components such as isovitexin, rutin, isoquercitrin, isoschaftoside, chlorogenic acid, tryptophan, nicotiflorin, and quercetin-7-glucoside were also detected at relatively high levels in the samples, with average concentrations all exceeding 90 μg/g. Among them, isovitexin reached 1194.85 μg/g in sample S27 from Qinglong, far exceeding other batches, suggesting significant differences in the accumulation of this component among different batches. Other components, such as trifolin, gallocatechin, caffeic acid, epicatechin, gallic acid, and schaftoside, were consistently detected in the samples, but their overall concentrations were low, with average levels below 80 μg/g. Significant variations in the content of characteristic constituents were observed among different geographic origins, which are likely closely associated with local light intensity, humidity, and soil conditions.
In summary, the composition of phenolic acids, flavonoids, and stilbenoid glycosides in the 31 batches of samples was generally consistent, but there were significant batch-to-batch differences in the content of each component. Among them, polygoacetophenoside was the characteristic high-content component in the samples, and flavonol glycosides and flavanols were the main flavonoid active substances. The results of this study provide comprehensive quantitative data to support subsequent sample quality grade evaluation, active substance screening, and pharmacodynamic material basis research.
4. Conclusions
In this study, a 2D-LC-ECD coupled with an UHPLC-Orbitrap-MS/MS platform was used as a robust activity-guided strategy to systematically elucidate the antioxidant constituents of PML and their geographical variation characteristics. The primary constituents with antioxidant activity of PML were identified. In vitro free radical scavenging assays demonstrated that the antioxidant activity of PML was predominantly attributed to its phenolic acids and flavonoids. Notably, 10 key biomarkers were identified using multivariate statistical analysis. Quantitative analysis revealed that geographical origin significantly affected the accumulation of these phytochemicals. Collectively, these findings not only clarify the material basis underlying the antioxidant activity of PML but also establish the identified geographical markers as a solid scientific foundation for quality control, traceability, and the rational development of PML and other medicinal plants.
Author Contributions
Z.T.: Conceptualization; investigation; methodology; visualization; writing—original draft. P.X. and D.W.: Conceptualization; investigation; resources; formal analysis. Z.H. and H.C.: Investigation; software; data curation; resources. W.P. and Q.Z.: Methodology; validation. Y.Y. and P.W.: Data curation; validation. R.C.: Supervision; funding acquisition; project administration; writing—review and editing. All authors have read and agreed to the published version of the manuscript.
Funding
This research was supported by the Natural Science Foundation of Guizhou (ZK [2024]-277), Natural Science Foundation of China (81760652), Graduate Research Innovation Fund (YJSKYJJ 2025033).
Data Availability Statement
The original contributions presented in this study are included in the article. Further inquiries can be directed to the corresponding author.
Acknowledgments
The author sincerely thanks all members of the Analytical and Testing Center of Zunyi Medical University.
Conflicts of Interest
The authors declare no conflicts of interest. The funders had no role in the design of the study; in the collection, analyses, or interpretation of data; in the writing of the manuscript; or in the decision to publish the results.
Appendix A
Table A1.
Linear equations for 19 major antioxidants in PML.
Table A2.
Specific concentrations (μg/g) of 19 major antioxidants in 31 batches of PML samples.
Table A3.
Sample collection site information (altitude, annual average temperature, and coordinates).
References
- Han, L.; Zhi, M. Kaibao Materia Medica (Kaibao Bencao); China Publishing House of Ancient Chinese Medical Books: Beijing, China, 1998. [Google Scholar]
- Qian, J.W.; Feng, C.H.; Wu, Z.Y.; Yang, Y.M.; Gao, X.F.; Zhu, L.Y.; Liu, Y.; Gao, Y.C. Phytochemistry, pharmacology, toxicology and detoxification of Polygonum multiflorum Thunb.: A comprehensive review. Front. Pharmacol. 2024, 15, 1427019. [Google Scholar] [CrossRef] [Scilit]
- Song, Y.F.; Yang, J.B.; Wang, X.T.; Chen, J.M.; Si, D.D.; Gao, H.Y.; Sun, M.Y.; Cheng, X.L.; Wei, F.; Ma, S.C. Pharmacokinetics and metabolism of trans-emodin dianthrones in rats. J. Ethnopharmacol. 2022, 290, 115123. [Google Scholar] [CrossRef] [Scilit] [PubMed]
- Zhao, Y.K.; Guo, R.X.; Li, R.S.; Shi, W.; Gong, H.Y.; Ma, R.R.; Gao, H.; Li, Z.; Hu, K.J.; Bai, Z.F.; et al. Investigation on the Therapeutic Effect of Polygonum multiflorum Thunb. in Chronic Stress-Induced Hair Loss in Mice Coupled with Metabolomics and Proteomics. World J. Tradit. Chin. Med. 2025, 11, 134–147. [Google Scholar] [CrossRef] [Scilit] [PubMed]
- Huang, T.-Y.; Chang, M.-C.; Su, W.-T. Optimization and Characterization of TSG-Enriched Polygonum multiflorum Extract and Its Dual Mechanism Against Androgenetic Alopecia via 5α-Reductase Inhibition and Wnt/β-Catenin Activation. Int. J. Mol. Sci. 2026, 27, 6648. [Google Scholar] [CrossRef] [Scilit]
- Huang, P.H.; Cheng, Y.T.; Chan, Y.J.; Chen, S.J.; Ciou, J.Y.; Lu, W.C.; Hsu, W.J.; Wang, C.C.R.; Li, P.H. Anti-hyperlipidemic and antioxidant ability of HeShouWu (roots of Polygonum multiflorum Thunb.) and its complex formula. Arab. J. Chem. 2023, 16, 105280. [Google Scholar] [CrossRef] [Scilit]
- Zhang, Z.L.; Li, Y.Z.; Wu, G.Q.; Zhang, D.D.; Deng, C.; Wang, Z.M.; Song, X.M.; Wang, W. A comprehensive review of traditional uses, phytochemistry and pharmacology of Reynoutria genus. J. Pharm. Pharmacol. 2022, 74, 1718–1742. [Google Scholar] [CrossRef] [Scilit] [PubMed]
- Li, W.F.; Wang, Y.; Qiu, C.X.; Li, J.; Bao, J.; Yang, J.B.; Jin, H.T. Processing-induced reduction in dianthrones content and toxicity of Polygonum multiflorum: Insights from ultra-high performance liquid chromatography triple quadrupole mass spectrometry analysis and toxicological assessment. Anim. Models Exp. Med. 2024, 8, 685–695. [Google Scholar] [CrossRef] [Scilit] [PubMed]
- Pukhrambam, P.; Khomdram, K.; Maibam, C.; Mutum, R.; Lakshmipriyari, M.; Das, S. Phenolics and flavonoids from Polygonum posumbu and comparision of flavonoid compounds content in different tissues (leaves, stems and roots). Fitoterapia 2024, 174, 105864. [Google Scholar] [CrossRef] [Scilit] [PubMed]
- Zhu, C.; Li, J.H.; Tang, W.C.; Li, Y.F.; Lin, C.; Peng, D.H.; Yang, C.F. 2,3,5,4′-Tetrahydroxystilbene-2-O-β-D-glucoside (TSG) from Polygonum multiflorum Thunb.: A Systematic Review on Anti-Aging. Int. J. Mol. Sci. 2025, 26, 3381. [Google Scholar] [CrossRef] [Scilit] [PubMed]
- Yang, F.; Jing, W.; Qi, X.C.; Lei, W.; Zhen, X.G.; Wei, X.; Yan, W.L. Chemical Constituents of Polygonum multiflorum Leaves. Chem. Nat. Compd. 2023, 59, 932–934. [Google Scholar] [CrossRef] [Scilit]
- Cao, M.Y.; Wu, J.; Wu, L.; Gu, Z.; Xie, C.; Wu, L.; Hu, J.; Xu, G. Separation of three flavonoid glycosides from Polygonum multiflorum Thunb. leaves using HSCCC and their antioxidant activities. Eur. Food Res. Technol. 2022, 248, 129–139. [Google Scholar] [CrossRef] [Scilit]
- Osman, A.G.; Avula, B.; Katragunta, K.; Ali, Z.; Chittiboyina, A.G.; Khan, I.A. Elderberry Extracts: Characterization of the Polyphenolic Chemical Composition, Quality Consistency, Safety, Adulteration, and Attenuation of Oxidative Stress- and Inflammation-Induced Health Disorders. Molecules 2023, 28, 3148. [Google Scholar] [CrossRef] [Scilit] [PubMed]
- Xu, Y.D.; Liu, X.J.; Gao, Y.Y.; Liu, Y.; Chen, S.; Chen, C.; Cheng, J.T.; Guo, C.; Xu, Q.X.; Di, J.P.; et al. Metabolomic analysis revealed the edible and extended-application potential of specific Polygonum multiflorum tissues. Heliyon 2024, 10, e25990. [Google Scholar] [CrossRef] [Scilit] [PubMed]
- Wang, J.; Zhao, Y.J.; Peng, H.S. Widely targeted metabolomics reveals differential metabolites between root tuber and leaf of Fallopia multiflora. Zhongguo Zhong Yao Za Zhi 2024, 49, 3484–3492. [Google Scholar] [CrossRef] [Scilit] [PubMed]
- Rui, W.; Xia, W.X.; Zhao, W.; Li, B.L.; Li, J.; Feng, Y.F.; Chen, H.Y.; Zhao, S.J. Differential Constituents in Roots, Stems and Leaves of Polygonum multiflorum Thunb. Screened by UPLC/ESI-Q-TOF-MS and Multivariate Statistical Analysis. J. Chromatogr. Sci. 2020, 58, 136–143. [Google Scholar] [CrossRef] [Scilit] [PubMed]
- Papadopoulos Lambidis, S.; Schramm, T.; Steuer-Lodd, K.; Farrell, S.; Stincone, P.; Schmid, R.; Koester, I.; Torres, R.; Aluwihare, L.; Simon, C.; et al. Two-Dimensional Liquid Chromatography Tandem Mass Spectrometry Untangles the Deep Metabolome of Marine Dissolved Organic Matter. Environ. Sci. Technol. 2024, 58, 19289–19304. [Google Scholar] [CrossRef] [Scilit] [PubMed]
- Tammekivi, E.; Geantet, C.; Lorentz, C.; Faure, K. Two-dimensional chromatography for the analysis of valorisable biowaste: A review. Anal. Chim. Acta 2023, 1283, 341855. [Google Scholar] [CrossRef] [Scilit] [PubMed]
- Vanhinsbergh, C.; Hook, E.; Oxby, N.; Dickman, M. Optimization of orthogonal separations for the analysis of oligonucleotides using 2D-LC. J. Chromatogr. B 2023, 1227, 123812. [Google Scholar] [CrossRef] [Scilit] [PubMed]
- Caño-Carrillo, I.; Gilbert López, B.; Montero, L.; Martinez Piernas, A.B.; Garcia-Reyes, J.F.; Molina-Díaz, A. Comprehensive and heart-cutting multidimensional liquid chromatography–mass spectrometry and its applications in food analysis. Mass. Spectrom. Rev. 2024, 43, 936–976. [Google Scholar] [CrossRef] [Scilit] [PubMed]
- Souza, A.; Ali, I.; Goor, T.; Dewil, R.; Cabooter, D. Comprehensive two-dimensional liquid chromatography with high resolution mass spectrometry to investigate the photoelectrochemical degradation of environmentally relevant pharmaceuticals and their degradation products in water. J. Environ. Manag. 2024, 351, 120023. [Google Scholar] [CrossRef] [Scilit] [PubMed]
- Platzer, M.; Kiese, S.; Herfellner, T.; Schweiggert-Weisz, U.; Miesbauer, O.; Eisner, P. Common Trends and Differences in Antioxidant Activity Analysis of Phenolic Substances Using Single Electron Transfer Based Assays. Molecules 2021, 26, 1244. [Google Scholar] [CrossRef] [Scilit] [PubMed]
- Yang, X.J.; Li, Y.; Shao, Q.J.; Li, Z.R.; Chun, Z.L.; Wang, Y.; Zhou, Y.P.; Chen, R.X. Screening, fingerprinting, and identification of phenolic antioxidants in Persicaria chinensis (L.) H. Gross by liquid chromatography—Electrochemical detection and liquid chromatography—Tandem mass spectrometry. J. Chromatogr. B 2025, 1250, 124387. [Google Scholar] [CrossRef] [Scilit] [PubMed]
- Miličević, A. Flavonoid Oxidation Potentials and Antioxidant Activities-Theoretical Models Based on Oxidation Mechanisms and Related Changes in Electronic Structure. Int. J. Mol. Sci. 2024, 25, 5011. [Google Scholar] [CrossRef] [Scilit] [PubMed]
- Zheng, J.F.; Pan, W.; Liu, M.X.; Yu, Y.; Zhao, Y.Y.; Su, K.; Du, J.; Li, J.; Zhou, Y.P.; Chen, R.X. Antioxidant profiling and quality assessment of Lithocarpus polystachyus sweet tea using LC-ECD and LC-MS/MS. Sci. Rep. 2025, 15, 13163. [Google Scholar] [CrossRef] [Scilit] [PubMed]
- Kuang, W.; Wang, Y.; Huang, Y.X.; Wu, W.L.; Zhang, M. Rapid identification of the compounds of Bushen Huoxue Prescription based on offline two-dimensional liquid chromatography with high-resolution mass spectrometry and molecular network technology. J. Sep. Sci. 2024, 47, e2300624. [Google Scholar] [CrossRef] [Scilit] [PubMed]
- Wang, Z.X.; Li, P.P.; Jia, Y.J.; Wen, L.X.; Tang, Z.S.; Wang, Y.P.; Cui, F.; Hu, F.D. Integrated metabolomic and transcriptomic analysis of triterpenoid accumulation in the roots of Codonopsis pilosula var. modesta (Nannf.) L.T.Shen at different altitudes. Phytochem. Anal. 2025, 36, 358–368. [Google Scholar] [CrossRef] [Scilit] [PubMed]
- Baliyan, S.; Mukherjee, R.; Priyadarshini, A.; Vibhuti, A.; Gupta, A.; Pandey, R.P.; Chang, C.M. Determination of Antioxidants by DPPH Radical Scavenging Activity and Quantitative Phytochemical Analysis of Ficus religiosa. Molecules 2022, 27, 1326. [Google Scholar] [CrossRef] [Scilit] [PubMed]
- Vargas-Ruiz, R.; Montiel-Ruiz, R.M.; Zamilpa, A.; Gonzalez-Cortazar, M.; Herrera-Ruiz, M.L.; Molina-Cabrera, J.; Juárez-Aragón, M.C.; Flores-Murrieta, F.J. Bio-guided study of the antinociceptive, anti-inflammatory, and free-radical scavenging capacity of the leaves of Rhus virens Lindh. ex A. Gray and its possible mechanism of antinociception. J. Ethnopharmacol. 2023, 300, 115756. [Google Scholar] [CrossRef] [Scilit] [PubMed]
- Hoffmann, M.A.; Nothias, L.-F.; Ludwig, M.; Fleischauer, M.; Gentry, E.C.; Witting, M.; Dorrestein, P.C.; Dührkop, K.; Böcker, S. High-confidence structural annotation of metabolites absents from spectral libraries. Nat. Biotechnol. 2022, 40, 411–421. [Google Scholar] [CrossRef] [Scilit] [PubMed]
- Guiard, B.P.; Gotti, G. The High-Precision Liquid Chromatography with Electrochemical Detection (HPLC-ECD) for Monoamines Neurotransmitters and Their Metabolites: A Review. Molecules 2024, 29, 496. [Google Scholar] [CrossRef] [Scilit] [PubMed]
- Zhang, L.P.; Shen, L.L.; Zhong, Q.S.; Zhou, T. Diluting modulation-based two dimensional-liquid chromatography coupled with mass spectrometry for simultaneously determining multiclass prohibited substances in cosmetics. J. Chromatogr. A 2023, 1695, 463954. [Google Scholar] [CrossRef] [Scilit] [PubMed]
- Liu, M.; Zhao, Y.; Li, X.; Zhang, T.; Xu, X.; Jiang, M.; Tian, X.; Zhang, P.; Wu, H.; Gao, X.; et al. Two Multidimensional Chromatography/High-Resolution Mass Spectrometry Approaches Enabling the In-Depth Metabolite Characterization Simultaneously from Three Glycyrrhiza Species: Method Development, Comparison, and Integration. J. Agric. Food Chem. 2024, 72, 1339–1353. [Google Scholar] [CrossRef] [Scilit] [PubMed]
- Wang, Y.; Shao, Q.J.; Yang, X.J.; Su, K.; Li, Z.R.; Yang, Y.Y.; Yuan, X.Y.; Chen, R.X. Diversity in Pyracantha fortuneana fruits maturity stages enables discrepancy in the phenolic compounds, antioxidant activity, and tyrosinase inhibitory activity. J. Food Sci. 2024, 89, 3469–3483. [Google Scholar] [CrossRef] [Scilit] [PubMed]
- Latos-Brozio, M.; Masek, A.; Chrzescijanska, E.; Podsędek, A.; Kajszczak, D. Characteristics of the Polyphenolic Profile and Antioxidant Activity of Cone Extracts from Conifers Determined Using Electrochemical and Spectrophotometric Methods. Antioxidants 2021, 10, 1723. [Google Scholar] [CrossRef] [Scilit] [PubMed]
- Lungu, I.I.; Cioanca, O.; Mircea, C.; Tuchilus, C.; Stefanache, A.; Huzum, R.; Hancianu, M. Insights into Catechin–Copper Complex Structure and Biologic Activity Modulation. Molecules 2024, 29, 4969. [Google Scholar] [CrossRef] [Scilit] [PubMed]
- Yeasmen, N.; Orsat, V. Phenolic mapping and associated antioxidant activities through the annual growth cycle of sugar maple leaves. Food Chem. 2023, 428, 136882. [Google Scholar] [CrossRef] [Scilit] [PubMed]
- Al Kamaly, O.; Drioiche, A.; Remok, F.; Saidi, S.; El Imache, A.; El Makhoukhi, F.; Alsfouk, B.A.; Zair, T. Identification of compounds from Origanum compactum and Origanum elongatum using HPLC/UV-ESI-MS and comparative analysis of their antioxidant, antimicrobial, anticoagulant, and antidiabetic properties. Saudi Pharm. J. 2024, 32, 102184. [Google Scholar] [CrossRef] [Scilit] [PubMed]
- Kalogiouri, N.P.; Mitsikaris, P.D.; Klaoudatos, D.; Papadopoulos, A.N.; Samanidou, V.F. A Rapid HPLC-UV Protocol Coupled to Chemometric Analysis for the Determination of the Major Phenolic Constituents and Tocopherol Content in Almonds and the Discrimination of the Geographical Origin. Molecules 2021, 26, 5433. [Google Scholar] [CrossRef] [Scilit] [PubMed]
- Aly, A.A.; Górecki, T. Two-dimensional liquid chromatography with reversed phase in both dimensions: A review. J. Chromatogr. A 2024, 1721, 464824. [Google Scholar] [CrossRef] [Scilit] [PubMed]
- Häßler, M.; Wetzel, K.; Tishakova, T.; Dimitrova, N.; Niedenthal, T.; Montero, L.; Ayala-Cabrera, J.F.; Schmitz, O.J. Comparison of the phenolic and antioxidant potential of five European herbal remedies by effect-directed analysis using offline two-dimensional liquid chromatography-high resolution mass spectrometry. Anal. Bioanal. Chem. 2026, 418, 1569–1584. [Google Scholar] [CrossRef] [Scilit] [PubMed]
- Jafari Khorsand, G.; Morshedloo, M.R.; Mumivand, H.; Emami Bistgani, Z.; Maggi, F.; Khademi, A. Natural diversity in phenolic components and antioxidant properties of oregano (Origanum vulgare L.) accessions, grown under the same conditions. Sci. Rep. 2022, 12, 5813. [Google Scholar] [CrossRef] [Scilit] [PubMed]
- Ratha, J.; Yongram, C.; Panyatip, P.; Powijitkul, P.; Siriparu, P.; Datham, S.; Priprem, A.; Srisongkram, T.; Puthongking, P. Polyphenol and Tryptophan Contents of Purple Corn (Zea mays L.) Variety KND and Butterfly Pea (Clitoria ternatea) Aqueous Extracts: Insights into Phytochemical Profiles with Antioxidant Activities and PCA Analysis. Plants 2023, 12, 603. [Google Scholar] [CrossRef] [Scilit] [PubMed]
- Wang, W.W.; Le, T.; Wang, W.; Yu, L.T.; Yang, L.J.; Jiang, H.Y. Effects of Key Components on the Antioxidant Activity of Black Tea. Foods 2023, 12, 3134. [Google Scholar] [CrossRef] [Scilit] [PubMed]
- Gıdık, B. Antioxidant, Antimicrobial Activities and Fatty Acid Compositions of Wild Berberis spp. by Different Techniques Combined with Chemometrics (PCA and HCA). Molecules 2021, 26, 7448. [Google Scholar] [CrossRef] [Scilit] [PubMed]
- Pozzo, L.; Grande, T.; Raffaelli, A.; Longo, V.; Weidner, S.; Amarowicz, R.; Karamać, M. Characterization of Antioxidant and Antimicrobial Activity and Phenolic Compound Profile of Extracts from Seeds of Different Vitis Species. Molecules 2023, 28, 4924. [Google Scholar] [CrossRef] [Scilit] [PubMed]
- Jing, W.; Qi, X.C.; Yong, X.Z.; Lei, W.; Fei, L.Y.; Wei, X.; Zhen, X.G. The Anti-inflammatory Activity and Chemical Composition Identification of Different Extracted Parts of Polygonum multiflorum Leaves. J. Chin. Inst. Food Sci. Technol. 2024, 24, 411–419. [Google Scholar] [CrossRef]

Disclaimer/Publisher’s Note: The statements, opinions and data contained in all publications are solely those of the individual author(s) and contributor(s) and not of MDPI and/or the editor(s). MDPI and/or the editor(s) disclaim responsibility for any injury to people or property resulting from any ideas, methods, instructions or products referred to in the content. |
© 2026 by the authors. Licensee MDPI, Basel, Switzerland. This article is an open access article distributed under the terms and conditions of the Creative Commons Attribution (CC BY) license.