


Abstract
Neutrophils are increasingly recognized as functionally heterogeneous regulators of inflammation in systemic lupus erythematosus (SLE), yet whether their major effector responses represent coordinated functions or distinct activation programs remains unclear. In the present study, we examined B-cell activating factor (BAFF) expression, neutrophil extracellular trap (NET)-associated responses, reactive oxygen species (ROS) production, and selected intracellular signaling molecules in density-separated neutrophil and peripheral blood mononuclear cell (PBMC) fractions from healthy donors and patients with SLE. Type I interferon (IFN-I) preferentially induced BAFF expression, whereas Phorbol 12-myristate 13-acetate (PMA) markedly induced NET-associated extracellular dsDNA release, indicating different stimulus requirements. Confocal microscopy showed intracellular BAFF accumulation following IFNα stimulation and altered BAFF localization after subsequent PMA stimulation. Pharmacological analyses showed that ROS scavenging attenuated IFNα-induced BAFF mRNA expression, whereas diphenyleneiodonium chloride (DPI) reduced PMA-induced ROS production and extracellular dsDNA release. MEK inhibition reduced ROS production, but its effect on extracellular dsDNA release was not statistically significant. Furthermore, serum BAFF (sBAFF) concentrations, NET-forming capacity, ROS production, and clinical parameters showed no consistent pattern of associations across patients with SLE, although exploratory PAD4-based stratification suggested possible subgroup-specific relationships. Collectively, our findings indicate that BAFF expression and NET-associated responses differ in their stimulus requirements and pharmacological sensitivities. These findings provide a basis for further investigation of functional neutrophil heterogeneity in SLE and highlight the need for single-cell and mechanistic studies to clarify the relationship between BAFF expression and NET-associated responses.
1. Introduction
SLE is a systemic autoimmune disease characterized by dysregulated innate and adaptive immune responses, leading to autoantibody production and multi-organ inflammation [1]. Plasmacytoid dendritic cells (pDCs)—a type of dendritic cells that acts as a bridge between the two immune responses—produce IFN-I in response to stimuli such as viral infection [2]. A hallmark feature of SLE is the sustained activation of IFN-I signaling (commonly referred to as the “interferon signature”). This signaling pathway promotes both innate immune activation and B-cell differentiation, creating a feedback loop that is closely linked to disease activity [3]. This underscores the involvement of both innate and adaptive immune responses in SLE.
Over the past two decades, substantial progress has been made in the development of biologic therapies targeting key immunological pathways in SLE. Among these, belimumab, a monoclonal antibody targeting BAFF [4], and anifrolumab, a monoclonal antibody against the IFN-I receptor subunit 1 [5], have demonstrated significant clinical benefit and are now established therapeutic options for patients with SLE. Nevertheless, a considerable proportion of patients fail to achieve sustained remission or adequate disease control despite these targeted therapies. These clinical findings suggest that conventional models do not fully capture the complexity of the immunopathological network underlying SLE and highlight the need to elucidate additional regulatory mechanisms involving other immune components.
Neutrophils have traditionally been regarded as short-lived effector cells of the innate immune system [6,7]. However, accumulating evidence has established their active role in the pathogenesis of SLE [8]. Neutrophils have been recognized as contributing to conditions such as autoimmune diseases through multiple effector mechanisms, including the production of ROS, the secretion of inflammatory mediators, and the formation of NETs [9,10]. In fact, neutrophils make a significant contribution as a source of BAFF [11,12] and are also known to be cells that receive IFN-I signals [13]. Despite these advances, it remains unclear whether these effector functions are coordinately executed by individual neutrophils or represent distinct functional programs within heterogeneous neutrophil populations.
It has been reported that a specific subset of neutrophils—low-density granulocytes (LDGs)—is increased in patients with SLE [14]. These cells are known to possess high pro-inflammatory and NET-forming capabilities [14,15]. NETs are extracellular structures composed of chromatin fibers associated with antimicrobial proteins; they are known to activate pDCs—acting as a source of immunostimulatory DNA and autoantigens—and to amplify IFN-I responses [16,17]. NET formation is thought to play a crucial role in sustaining chronic inflammation and autoimmune responses in SLE [9]. However, since conventional neutrophils (normal-density neutrophils, NDNs)—not just LDGs—also form NETs, both groups likely contribute to this response, and the full picture remains a subject of debate.
Increasing evidence suggests that ROS play a crucial role in neutrophil activation and the formation of NETs [18]. In SLE as well, it has been shown that excessive ROS production promotes NET formation and exacerbates inflammatory responses and tissue damage [16,19]. Consequently, dysregulated ROS production is considered a key pathogenic mechanism leading to abnormal neutrophil activation. Previous studies have demonstrated that mitochondrial dysfunction in neutrophils from SLE patients manifests as increased mitochondrial ROS (mtROS) production and spontaneous NET formation. Furthermore, it has been reported that IFN-α links the IFN-I signaling pathway to mitochondrial oxidative stress and neutrophil activation by inducing mtROS production and the release of oxidized mitochondrial DNA [19,20]. This suggests that ROS could be a key element linking the IFN-I signaling pathway to neutrophil activation. As PMA is a potent activator of NADPH oxidase-dependent ROS production and NET formation, it is widely used as a stimulus to study ROS-dependent NETosis in neutrophils [21]. However, it remains unknown whether ROS are involved in regulating BAFF expression, or what the functional relationships are among ROS, BAFF, and NET formation in neutrophils.
Importantly, although both BAFF elevation and NET formation are associated with neutrophil activation and IFN-I-rich environments in SLE [22,23], whether these processes are mechanistically linked or independently regulated remains incompletely understood. Specifically, it remains unclear whether IFNα-induced BAFF expression represents a general inflammatory response or a stimulus-specific pathway in neutrophils; whether BAFF expression and NET formation occur within the same neutrophils or reflect distinct functional responses; and how ROS, a central mediator of neutrophil activation and NETosis, influence BAFF expression and NET formation. Addressing these questions is critical to understanding whether therapeutic targeting of oxidative stress or IFN signaling would uniformly modulate neutrophil effector functions in SLE.
Collectively, these studies highlight the complexity of the pathophysiological mechanisms underlying SLE. Multiple inflammatory pathways, including those involving BAFF, NETs, and ROS, contribute to disease pathogenesis. Recent studies have also highlighted the remarkable functional heterogeneity of neutrophils in inflammatory diseases [24], suggesting that distinct neutrophil subsets or activation states may differentially regulate these inflammatory pathways. While clinical outcomes have improved with therapies targeting individual pathways, the fact that some patients fail to respond may reflect, at least in part, this biological heterogeneity. Therefore, elucidating how BAFF expression, NET-associated responses, and ROS signaling are related in neutrophils will deepen our understanding of SLE pathophysiology and may provide a basis for developing more personalized therapeutic strategies in the future.
In this study, we examined BAFF expression, NET-associated responses, and ROS production in density-separated neutrophil and PBMC fractions isolated from healthy donors and patients with SLE. The PBMC fractions may contain low-density granulocytes but were not purified LDG populations. We investigated whether BAFF expression and NET-associated responses differ in their stimulus requirements and how ROS contributes to their regulation, providing a basis for further investigation of functional neutrophil heterogeneity in SLE.
2. Materials and Methods
2.1. Study Population
The study population included 20 patients diagnosed with SLE based on the revised criteria of the American College of Rheumatology [25]. The 9 healthy controls had no history of autoimmune diseases or infectious diseases. Disease activity was assessed using the “National Evaluation of Estrogen Safety in Lupus (SELENA)–Systemic Lupus Erythematosus Disease Activity Index (SLEDAI)” [26]. Details of the patients’ clinical characteristics [including SLEDAI, C-reactive protein (CRP), erythrocyte sedimentation rate (ESR), Immunoglobulin G (IgG), and total hemolytic complement activity (CH50)] are presented in Supplementary Table S1. The ethics committee of the University of Occupational and Environmental Health, Japan approved the study (UOEHCRB21-089). All participants signed a written informed consent form.
2.2. Neutrophil and PBMC Isolation
Neutrophils and PBMCs were isolated from peripheral blood using a PolymorphprepTM (Cat: 1895, Cosmo Bio, Carlsbad, CA, USA) density gradient. Approximately 5 mL of whole blood was carefully layered onto 5 mL of Polymorphprep and centrifuged at 500× g for 30 min at room temperature. After centrifugation, the neutrophil layer and PBMC layer were collected separately and transferred to new tubes. Cells were washed with PBS and centrifuged at 1500 rpm for 5 min, and the supernatant was discarded. Cells were resuspended in culture medium for subsequent experiments.
2.3. Materials
Human IFNα (CYT-205, ProSpec-Tany TechnoGene Ltd., Rehovot, Israel), IFNβ, IFNγ, IL-1α, IL-1β, IL-4, IL-6, IL-17A were purchased from Thermo Fisher Scientific (Waltham, MA, USA). Recombinant human IL-22, IL-27, TGF-β1 protein were purchased from RayBiotech (Peachtree Corners, GA, USA), Biolegend (San Diego, CA, USA), and FUJIFILM Wako Pure Chemical Corporation (Osaka, Japan), respectively. Recombinant human soluble BAFF (60-mer) (Cat: AG-40B-0112) was purchased from AdipoGen Life Sciences (San Diego, CA, USA). Phorbol 12-myristate 13-acetate (PMA; BML-PE160), N-Acetyl-L-cysteine (NAC, Cat: A8199), and diphenyleneiodonium chloride (DPI; Cat: 81050) were purchased from Enzo Life Sciences (Farmingdale, NY, USA), SIGMA-ALDRICH (St. Louis, MI, USA), and Cayman (St. Louis, MI, USA), respectively. The MEK inhibitor U0126 (Cat: 662005) was purchased from Calbiochem (Darmstadt, Germany). The pH of the NAC solution was adjusted to 7.0 before use.
2.4. Flow Cytometry
Brilliant Violet 421-conjugated anti-human CD10 (Cat: 312218), PerCP Cy5.5-conjugated anti-human CD14 (Cat: 325622), APC anti-mouse/human CD15 (Cat: SSEA-1) Antibody (Cat: 125618), and PerCP/Cyanine5.5 anti-human CD16 (Cat: 302027) were purchased from Biolegend. APC-conjugated anti-CD11b (Cat: 20-0112-U100) and PE-conjugated Anti-CEACAM-8/CD66b (Cat: 11729-MM04-P) were purchased from Cytek (Fremont, CA, USA) and Sinobiological (Beijing, China), respectively. BV421 Mouse IgG1, κ Isotype Control (Cat: 562438) and PE Mouse IgG1, κ Isotype Control (Cat: 555749) were purchased from BD biosciences (San Jose, CA, USA), Rat IgG2b Isotype Control APC (Cat: 20-4031-U100) and PerCP/Cyanine5.5 Mouse IgG1, κ Isotype Ctrl Antibody (Cat: 400150) were purchased from TONBO bioscience (San Diego, CA, USA) and Biolegend respectively.
Isolated neutrophils and PBMCs were first incubated with Fc block (Tonbo Biosciences, Cat: 70-0161-M001) for 15 min at 4 °C. Cells were then stained with antibody mix and incubated for 30 min at 4 °C. The cells were washed and analyzed using a CytoFLEX flow cytometer (Beckman Coulter, Brea, CA, USA).
2.5. Cell Culture and Stimulation
Neutrophils and PBMCs (1 × 10⁵ cells/well/200 µL, in a 48-well plate for RT-qPCR and ACCU assay, 5 × 10⁴ cells/well/100 µL in a 96-well plate with clear bottom for measurement of ROS production, and 2.5 × 10⁵ cells/well/500 µL, in a 24-well plate for Western blotting) were spread, and cultured with Roswell Park Memorial Institute (RPMI) 1640 medium (Nissui, Tokyo, Japan) including 10% fetal bovine serum (Serana Europe GmbH, Brandenburg, Germany), L-glutamine (2 mM, Wako Pure Chemical Industries, Tokyo, Japan), and a penicillin–streptomycin solution (Gibco, New York, NY, USA) in a humidified incubator with 5% CO2 at 37 °C. After treatment with PBS, IFNα, PMA (100 nM), or NETs (3 ng/µL), with or without NAC (10 mM) or inhibitors (pretreatment for 30 min), supernatants were collected for ACCU assay, and the cells were collected for RT-qPCR or Western blotting.
2.6. RT-qPCR
The cells were lysed using RLT buffer (Qiagen, Hilden, Germany), and total RNA was extracted using the RNeasy Mini Kit (Qiagen). cDNA was then synthesized using the High-Capacity cDNA Reverse Transcription Kit (Thermo Fisher Scientific) according to the manufacturer’s instructions. Quantitative PCR was performed using the Applied Biosystems QuantStudioTM system 3 or 5 (Thermo Fisher Scientific). Relative transcript abundance was analyzed using the 2−△△Ct method and normalized to glyceraldehyde-3-phosphate dehydrogenase (GAPDH) expression. BAFF and GAPDH primers were purchased from Thermo Fisher Scientific.
2.7. Enzyme-Linked Immunosorbent Assay (ELISA)
ELISA kit for BAFF (BLyS/TNFSF13B DuoSet, Cat: DY124-05) was purchased from R&D SYSTEMS (Minneapolis, MN, USA). ELISA kits for human IL-1β, IL-6, and TNF-α were purchased from Biolegend. Cytokine levels in serum or cell lysates were measured as previously described [27].
For preparation of cell lysates, cells were lysed using lysis buffer containing 50 mM Tris–HCl (pH 8.0), 150 mM NaCl, and 1% Nonidet P-40, supplemented with a protease inhibitor cocktail (ITSI Biosciences, Johnstown, PA, USA, Cat: A-0014–20). The lysates were then used for BAFF quantification according to the manufacturer’s instructions.
2.8. Elastase and Myeloperoxidase (MPO) Activity Assay
Elastase activity and myeloperoxidase activity in serum were measured using Neutrophil Elastase Activity Kit (Cayman chemical, Cat: 600610) and Neutrophil Myeloperoxidase Activity Assay Kit (Cayman chemical, Cat: 600620) according to the manufacturer’s instructions. Elastase activity was calculated based on a standard curve generated from the provided standards.
2.9. Quantification of Double-Stranded DNA (dsDNA) (ACCU Assay)
dsDNA in the cell culture supernatants was quantified using AccuClear® Ultra High Sensitivity dsDNA Quantitation Solution (Biotium, Fremont, CA, USA, Cat: 31027-T) according to the manufacturer’s instructions. Briefly, culture supernatants were mixed with the AccuClear working solution and incubated for the recommended time. Fluorescence intensity was measured using a plate reader, and dsDNA concentrations were calculated based on a standard curve generated with dsDNA standards.
2.10. Measurement of ROS Production
The level of ROS production was measured using DCFH (Dojindo, Kumamoto, Japan) according to the manufacturer’s instructions. Briefly, the cells were incubated with photo-oxidation-resistant DCFH-DA working solution for 30 min. After incubation, the cells were centrifuged, and the supernatant was removed. The cells were then resuspended in culture medium and seeded into culture plates. After 4 h of stimulation, the fluorescence intensity was measured using a plate reader.
2.11. Preparation of NET Components
Neutrophils (1 × 10⁷) were stimulated with PMA (100 nM) for 4 h to induce NET formation. After stimulation, gently remove the supernatant and rinse the dishes with cold PBS (PMA and PMA-induced soluble factors were removed). The wash solution was collected and centrifuged at 400× g for 10 min at 4 °C to remove unruptured cells and cell debris. Subsequently, the supernatants were centrifuged at 18,000× g for 10 min at 4 °C. The supernatant was discarded, and the resulting pellets were resuspended in PBS. The concentration of NET-associated DNA was measured using a NanoDrop spectrophotometer (Thermo Fisher Scientific).
2.12. Confocal Imaging
Neutrophils were seeded onto glass-based dishes (AGC TECHNO GLASS CO., Ltd., Shizuoka, Japan) and stimulated under the indicated conditions. After 4 h of stimulation, cells were stained with anti-BAFF antibody, SYTOX Green nucleic acid stain (Invitrogen, Cat: S7020), and 4′,6-diamidino-2-phenylindole (DAPI, 1:1000; Dojindo, Cat: D523). Cells were stained directly without fixation, and fluorescence images were acquired using the ZEISS LSM 880 Confocal Laser Scanning Microscope (Carl Zeiss Meditec AG, Jena, Germany).
2.13. Western Blotting
Whole-cell extracts were prepared as stated in Section 2.7. Equal amounts of protein (5 µg) were separated by electrophoresis and immunoblotted as previously reported [28]. Antibody for PAD4 (Cat: AB128086) was purchased from Abcam (Cambridge, UK). Anti-GAPDH (Cat: 2118S) and anti-phospho-ERK (Cat: 4370S) were purchased from Cell Signaling Technology (Danvers, MA, USA).
2.14. Statistics
Statistical analyses were performed using Student’s t-test for Figure 1B and Figure 7. Mann–Whitney U test was used for predefined pairwise comparisons. P values were adjusted using the Bonferroni method to account for multiple testing for Figures 3A,B (HD vs. PA), 4, 5A,B (HD vs. PA), 8A,D,E, 9C,D. The Wilcoxon matched-pairs signed-rank test was used for Figures 3A (vs. Ct), 5A (vs. Ct), 8B,C, all tests were two-sided. Fisher’s exact test was used for Figure 9A.
Figure 1.
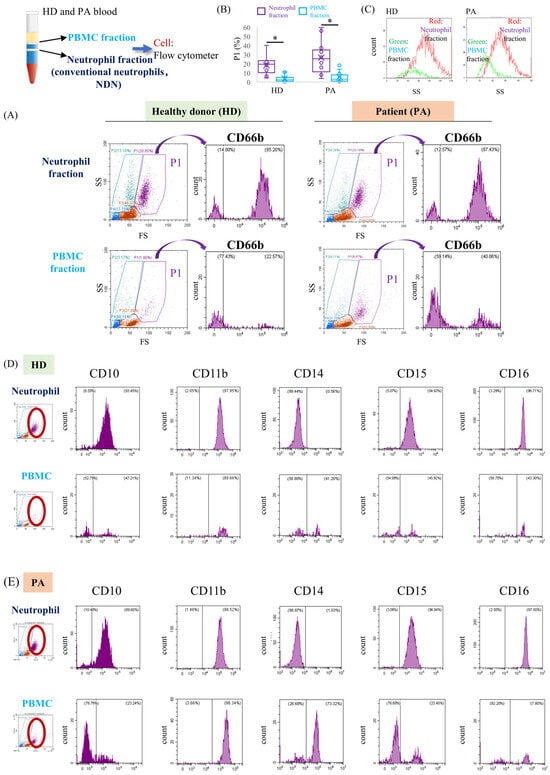
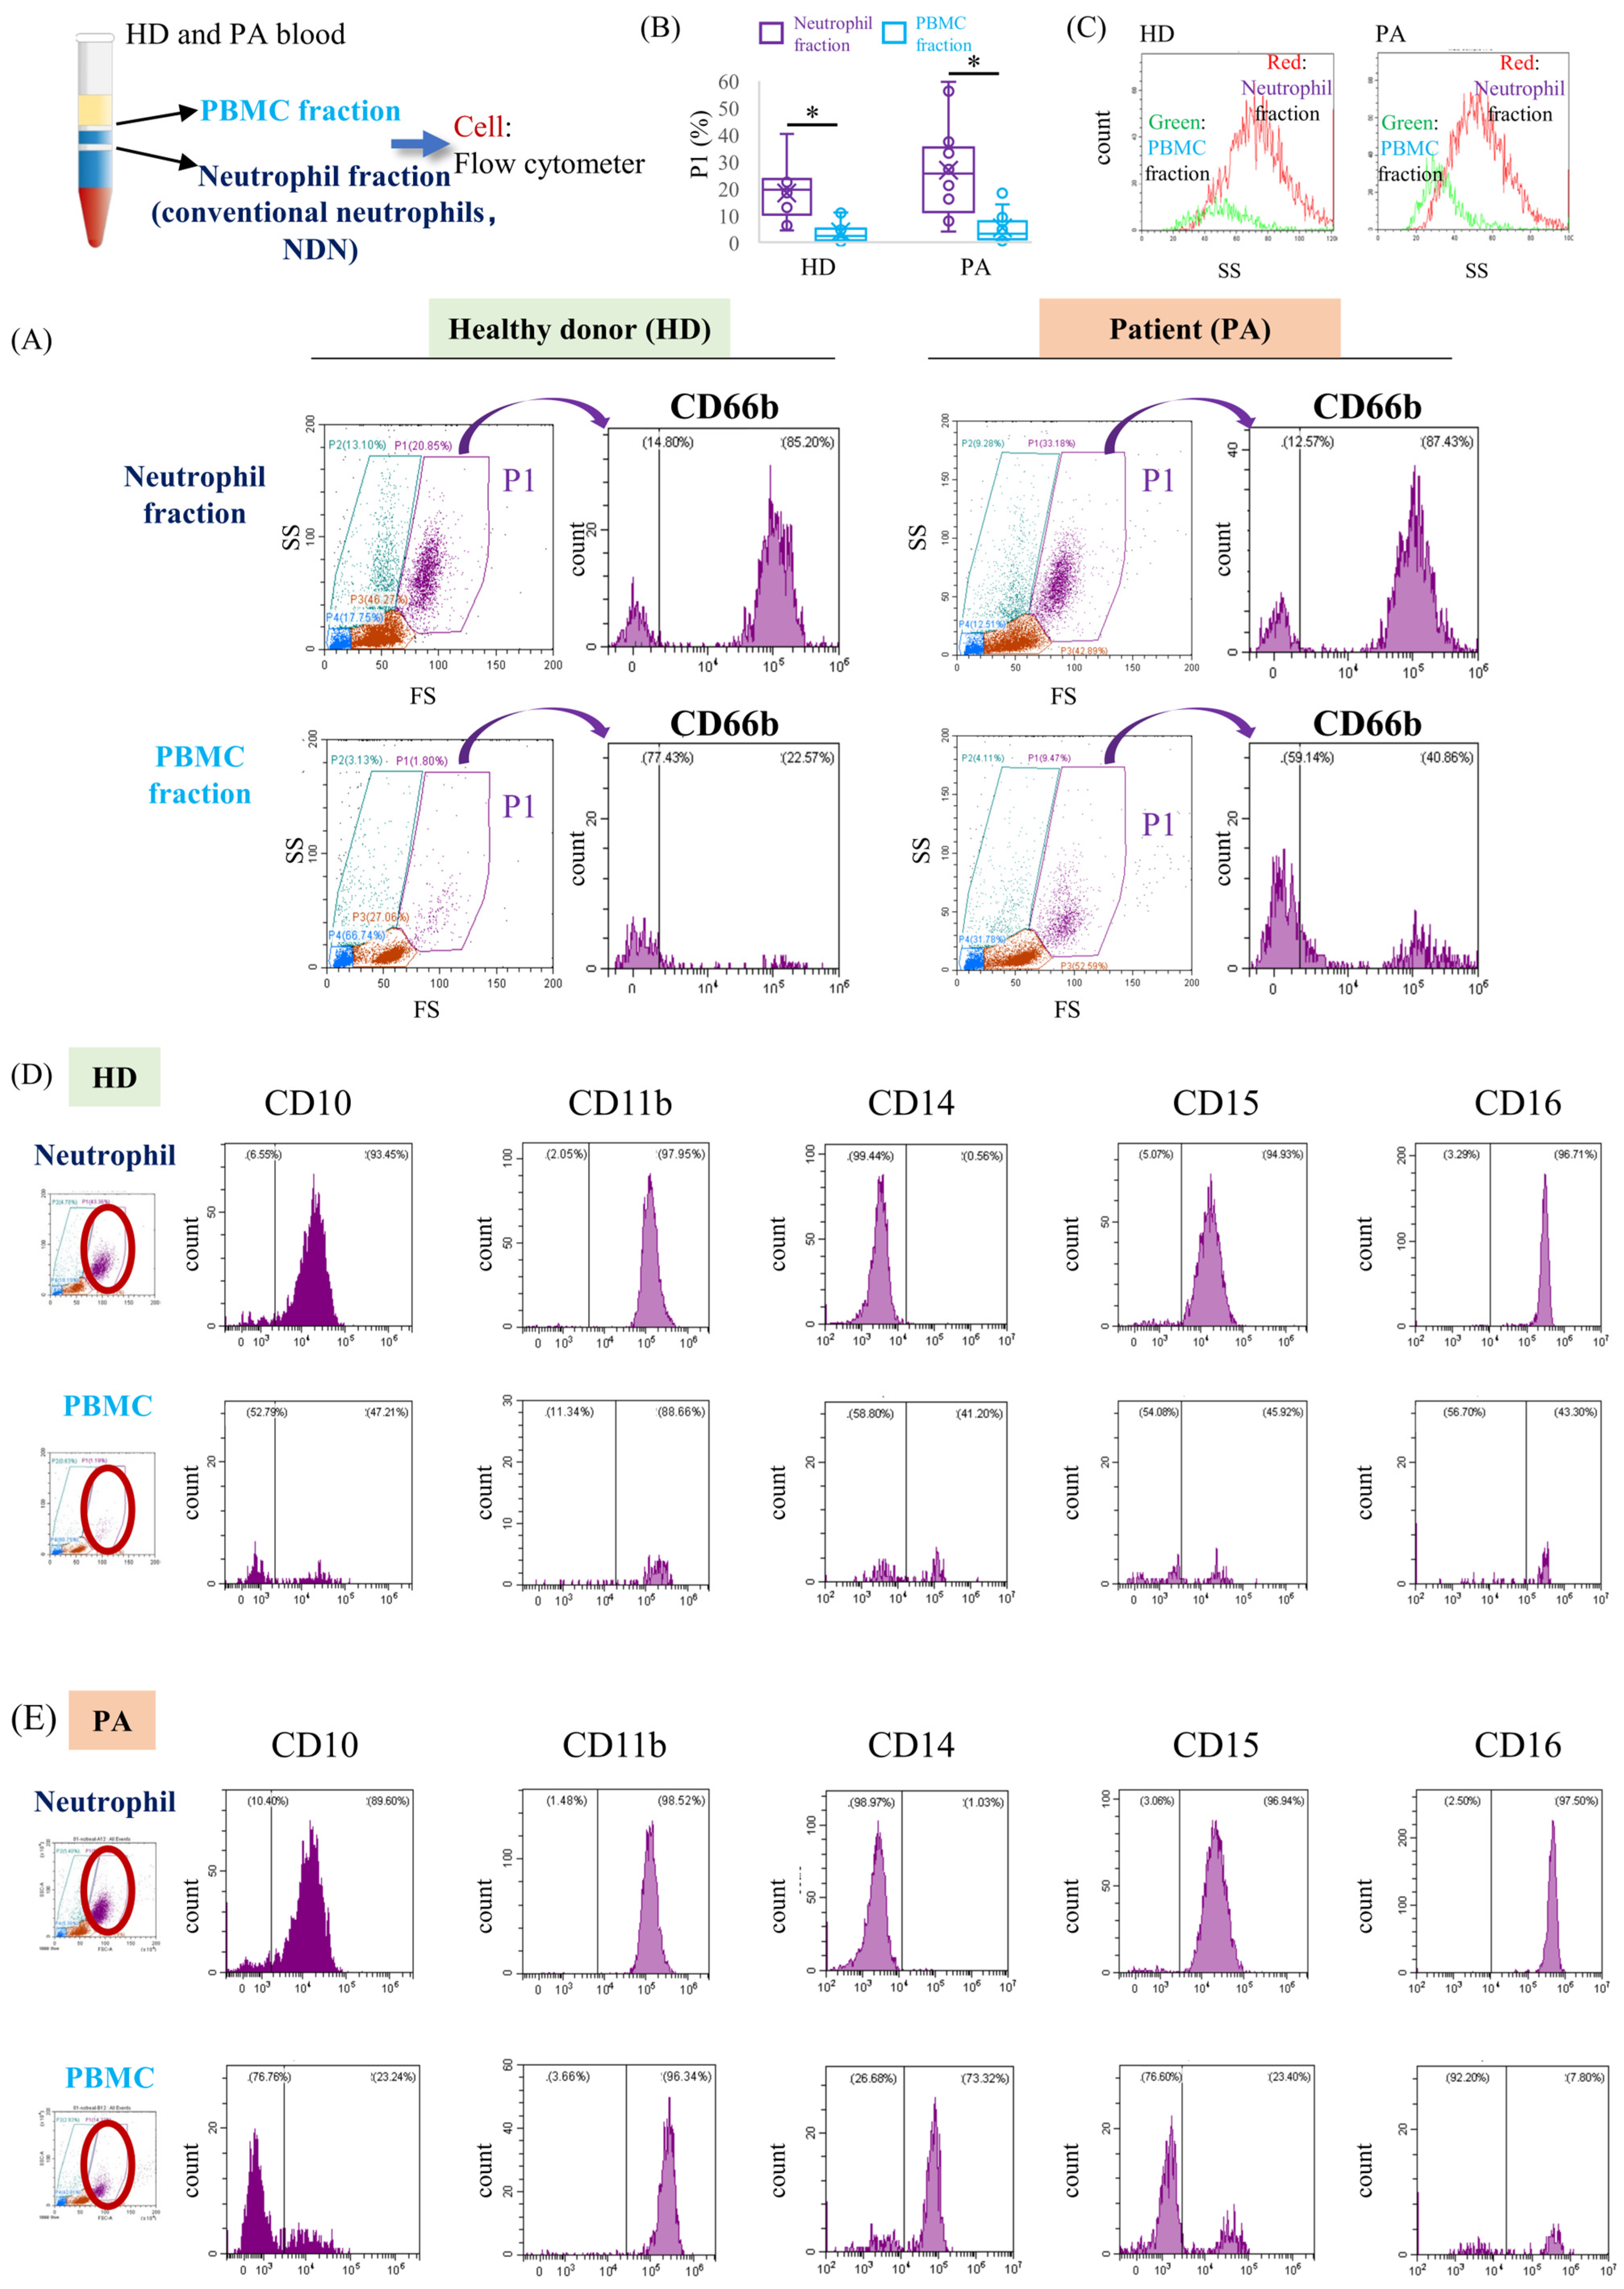
Peripheral blood from healthy donors (HD) and patients with SLE (PA) was separated into conventional neutrophil (NDN) and PBMC fractions by density gradient centrifugation, followed by flow cytometric analysis. Peripheral blood from HD and PA was separated by density gradient centrifugation into a neutrophil fraction (NDN) and a PBMC fraction by density gradient centrifugation and analyzed by flow cytometry. Each histogram shows fluorescence intensity on the x-axis and cell count on the y-axis. (A) Representative FS/SS profiles and CD66b expression histograms in the two fractions. The P1 region was defined on the FSC/SSC plots to encompass cells with scatter characteristics typically associated with granulocytes. A separate population located in the lower-left region of the plots exhibited relatively high CD14 expression, consistent with a monocyte-associated population. CD66b expression was assessed within the P1-gated population (purple arrow). (B) Percentage of cells within the P1 region relative to the total number of cells analyzed in each fraction (HD, n = 10; PA, n = 14). * p < 0.05. (C) Representative SSC distributions of P1-gated cells in the conventional neutrophil (red) and PBMC (green) fractions from HD and PA samples. The vertical axis represents cell counts, and the horizontal axis represents SSC intensity, reflecting differences in cellular internal complexity and granularity. (D,E) Representative expression profiles of CD10, CD11b, CD14, CD15, and CD16 in the conventional neutrophil and PBMC fractions from HD (D) and PA (E). Analyses were performed within the P1-gated population. Representative analyses from 2 persons are shown.
2.15. Use of Generative Artificial Intelligence
During the preparation of this manuscript, the author used Generative artificial intelligence (ChatGPT–6, OpenAI) for language editing to improve the clarity and readability of the text.
3. Results
3.1. CD66b-Positive Cells Are Detected in Both Conventional Neutrophil and PBMC Fractions
To characterize neutrophil-associated cell populations in SLE, peripheral blood cells from healthy donors (HD) and SLE patients (PA) were separated into conventional neutrophil (normal density neutrophil, NDN) and PBMC fractions using density gradient centrifugation (Figure 1A). CD66b, a neutrophil-associated marker, together with CD10 and CD16 (neutrophil maturation markers), CD11b (a myeloid cell adhesion and activation marker), CD14 (a monocyte-associated marker), and CD15 (a granulocytic marker), was used to characterize the cell populations. Flow cytometric analysis revealed that CD66b-positive cells were enriched in the conventional neutrophil fraction but were also detectable in the PBMC fraction (Figure 1A). The proportion of cells within the P1-gated region, defined by forward and side scatter characteristics, was higher in the conventional neutrophil fraction than in the PBMC fraction (Figure 1B). Furthermore, P1-gated cells in the two fractions exhibited different side-scatter distributions, suggesting differences in cellular granularity or internal complexity (Figure 1C). Cells in the conventional neutrophil fraction exhibited a CD10+ CD11b+ CD15+ CD16high phenotype consistent with mature neutrophils. In contrast, cells in the PBMC fraction showed different surface marker distributions, with detectable CD14 expression (Figure 1D,E). To further characterize these fractions, we compared the proportions of CD11b+, CD14+, and CD15+ cells within the P1-gated populations (Supplementary Figure S1). The proportion of CD15+ cells was significantly higher in the conventional neutrophil fraction than in the PBMC fraction in both HD and PA. The proportion of CD14+ cells also differed significantly between the two fractions in PA, with higher values in the PBMC fraction, whereas no significant difference was observed in HD. No statistically significant differences in these markers were detected between HD and PA within either fraction after correction for multiple comparisons. In particular, the difference in CD11b+ cells in the PBMC fraction did not reach statistical significance (adjusted p = 0.084). Because the P1-gated population in the PBMC fraction contained relatively few cells, these measurements may be subject to greater variability. Together, these findings indicate differences in the distribution and surface marker profiles of cells between the two density fractions, although further characterization is required to determine whether they represent distinct neutrophil subsets.
3.2. Type I Interferons Preferentially Induce BAFF mRNA Expression in Neutrophil Fractions
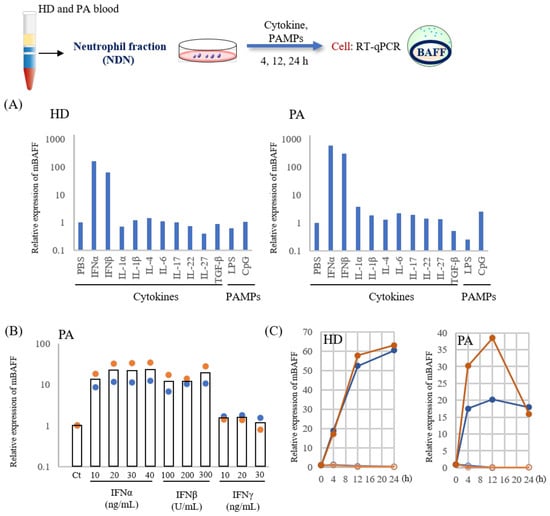
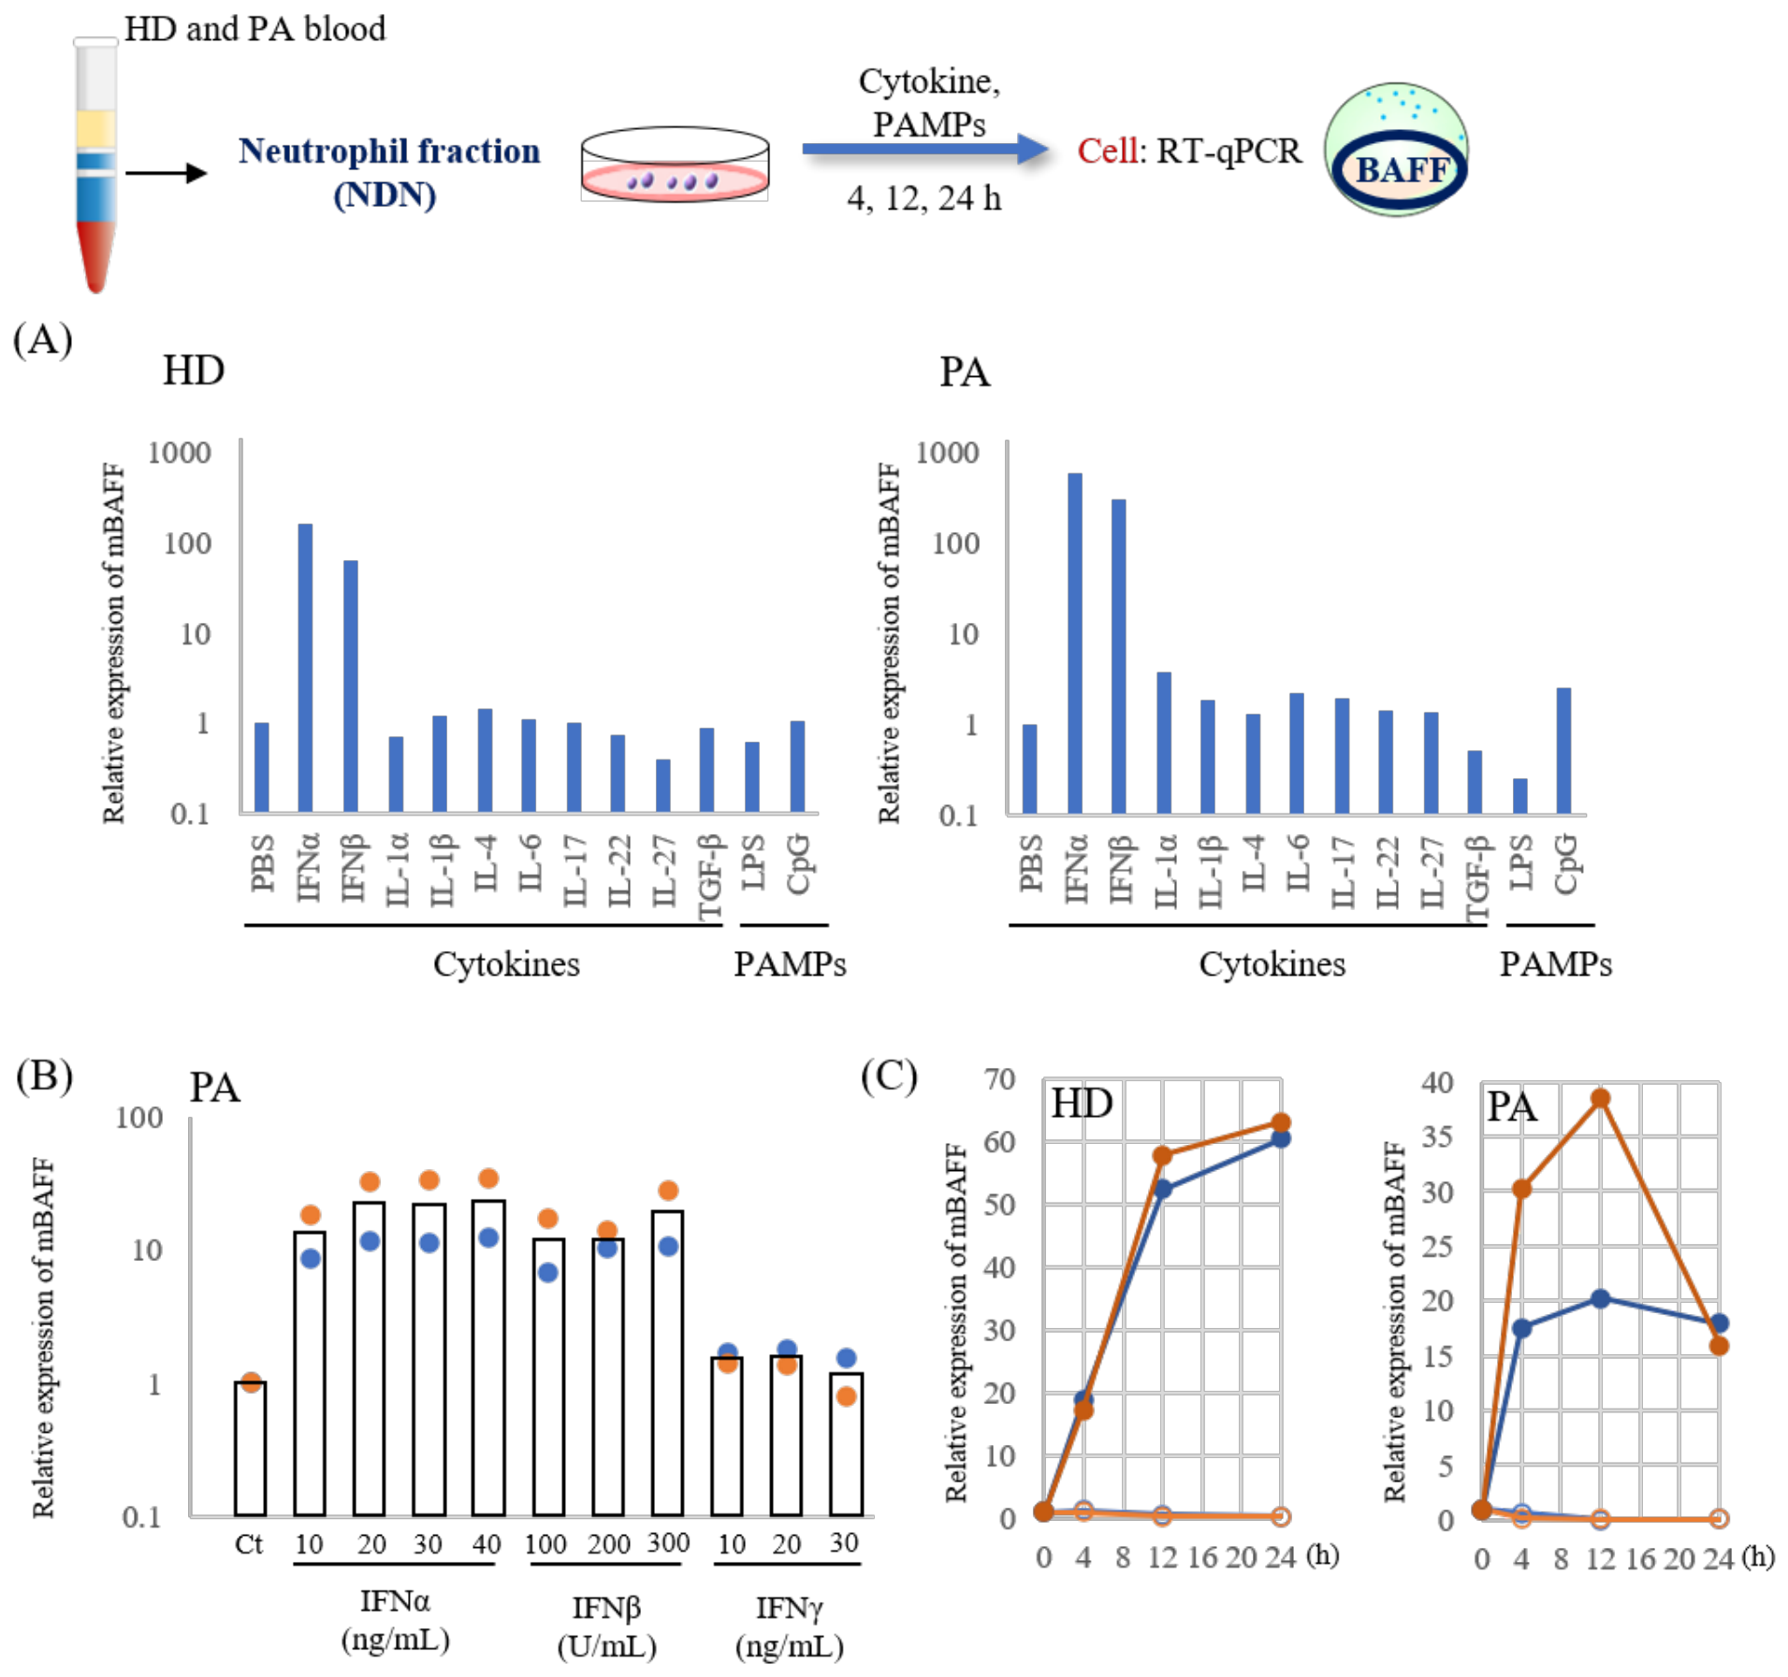
To determine whether the induction of BAFF mRNA induction represents a general inflammatory response or a stimulus-specific phenomenon, cells from the conventional neutrophil fraction of HD and PA were stimulated with various cytokines and pathogen-associated molecular patterns (PAMPs). Screening experiments showed that IFNα markedly induced BAFF mRNA expression in both HD and PA samples, whereas most other cytokines and PAMPs elicited little or no induction (Figure 2A). A similar response pattern was observed in an independent HD sample (Supplementary Figure S2). Dose-response analysis using neutrophil fractions from PA further demonstrated that both IFNα and IFNβ induced BAFF mRNA expression, whereas IFNγ had little effect under the conditions examined (Figure 2B). IFNα-induced BAFF mRNA expression increased with concentration and appeared to approach a plateau at approximately 20–30 ng/mL. Time-course analysis showed that BAFF mRNA induction was detectable as early as 4 h after IFNα stimulation in both HD and PA samples (Figure 2C). We also examined BAFF mRNA responses to cytokines and PAMPs in the PBMC fractions from HD and PA. IFNα induced BAFF mRNA expression in both groups, whereas most other tested stimuli elicited relatively small responses (Supplementary Figure S2). Based on these screening results, we selected IFNα at 30 ng/mL was selected for subsequent experiments.
Figure 2.
Effects of cytokine stimulation on BAFF mRNA expression in conventional neutrophil fractions. Neutrophils were separated from peripheral blood of HD and PA as described in Figure 1. Cells were stimulated with various cytokines or PAMPs for the indicated times, and BAFF mRNA expression was quantified by RT–qPCR. (A) IFNα (30 ng/mL), IFNβ (100 U/mL), 10 ng/mL of IL-1α, IL-1β, IL-6, IL-17, IL-22, IL-27, and IL-4 (100 ng/mL), TGFβ (10 ng/mL), and PAMPs (LPS and CpG 1 µg/mL) were used for BAFF mRNA induction screening in neutrophils from HD (Representative analyses from 2 independent experiments are shown) and PA. BAFF mRNA levels at 24 h were normalized to GAPDH expression and are presented as relative expression levels. Data are expressed as relative levels, with each PBS-treated group set to 1. The y-axis is presented on a logarithmic scale. Additional screening data from another HD sample are shown in Supplementary Figure S2. (B) Dose-dependent analysis of BAFF mRNA at 4 h by IFNα, IFNβ, and IFNγ stimulation in PA neutrophils (n = 2 independent donors). Bars represent the arithmetic means, and blue and orange dots indicate individual donors. Expression levels were normalized to GAPDH and expressed relative to the corresponding PBS-treated controls (Ct = 1). The y-axis is presented on a logarithmic scale. (C) Time-course analysis of BAFF mRNA expression following IFNα (30 ng/mL) stimulation in HD and PA neutrophils. This graph shows data from two individuals (orange and blue). BAFF mRNA expression at 0 h was set to 1 for each donor. Closed circles indicate IFNα-stimulated samples, and open circles indicate unstimulated samples.
3.3. IFNα Preferentially Induces BAFF mRNA Expression in Neutrophil Populations
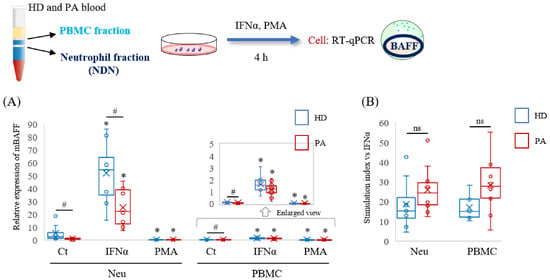
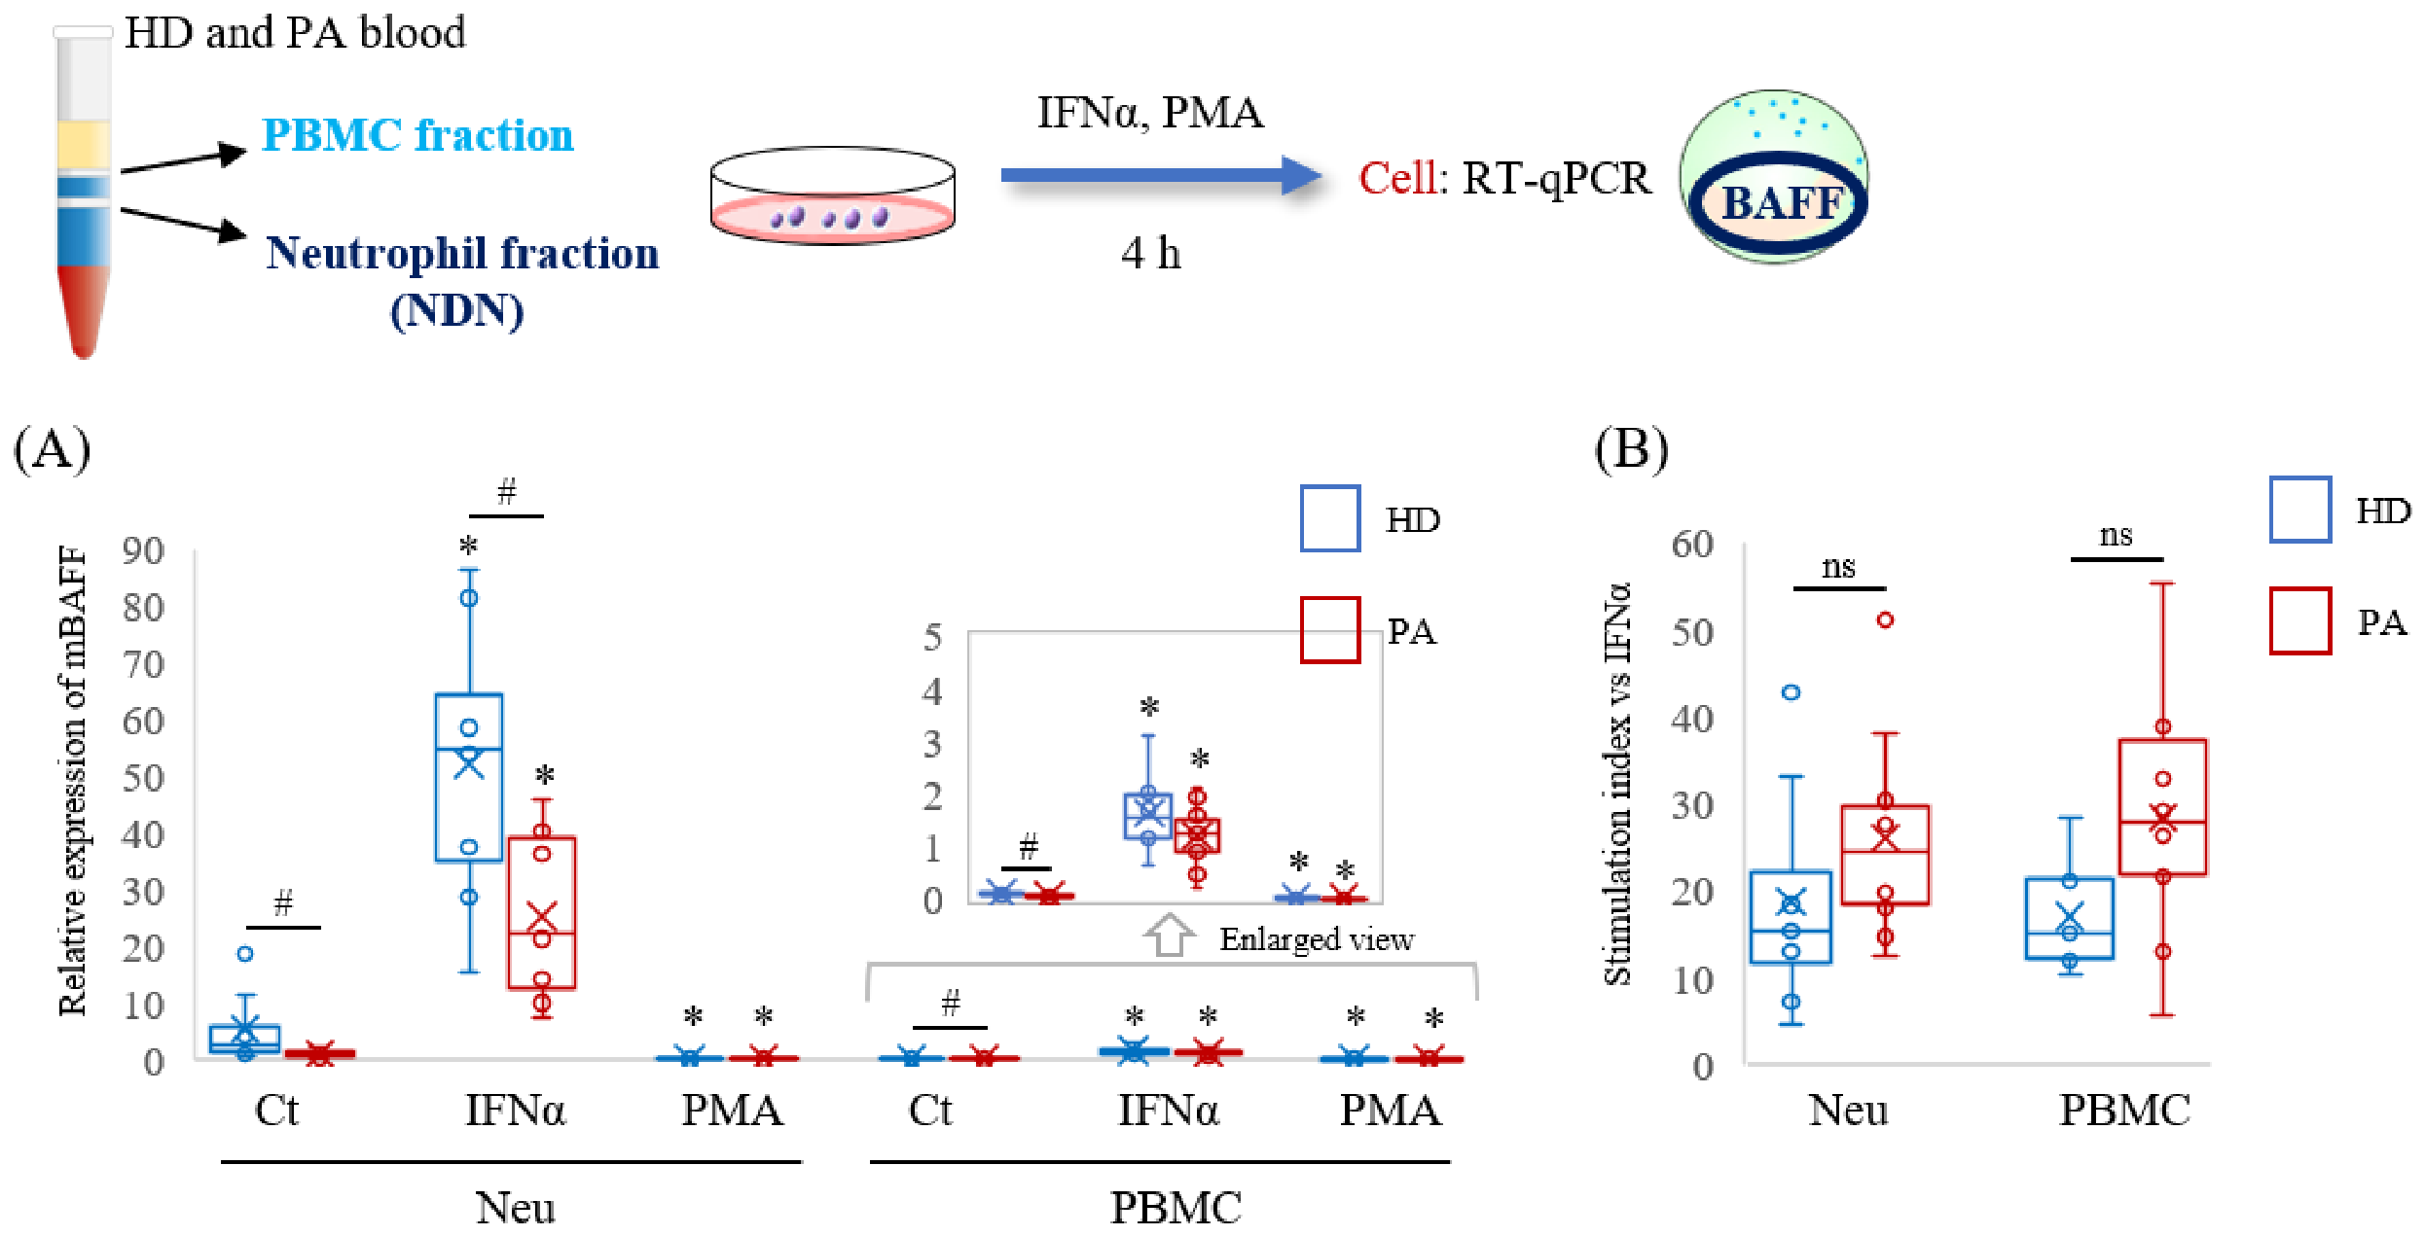
To further examine stimulus-dependent BAFF mRNA expression, conventional neutrophil and PBMC fractions from HD and PA were stimulated with IFNα or PMA, a commonly used inducer of NET formation. In the conventional neutrophil fraction, IFNα significantly increased BAFF mRNA levels in both HD and PA groups, whereas PMA did not induce BAFF expression (Figure 3A). Although IFNα also induced BAFF mRNA expression in the PBMC fraction, the expression levels remained substantially lower than those observed in the neutrophil fraction. Notably, BAFF mRNA expression in the PA neutrophil fraction differed significantly from that in HD under both control and IFNα-stimulated conditions. In the PBMC fraction, IFNα also induced BAFF mRNA expression, although the expression levels in the PBMC fraction were considerably lower than those observed in the conventional neutrophil fraction (Figure 3A). When the IFNα stimulation index was calculated, no statistically significant differences were observed between HD and PA in either the conventional neutrophil or PBMC fraction (Figure 3B). These results suggest that BAFF mRNA expression and its responses to stimulation differ between density-separated cell fractions, while the relative response to IFNα did not differ significantly between HD and PA.
Figure 3.
Analysis of BAFF mRNA expression in neutrophil and PBMC fractions following IFNα and PMA stimulation. Peripheral blood from HD and PA were separated into neutrophils and PBMC fractions as described in Figure 1. Cells (1 × 10⁵) were stimulated with IFNα or PMA (100 nM) for 4 h, and BAFF mRNA levels were analyzed by RT–qPCR. (A) Relative BAFF mRNA expression in HD (n = 8) and PA (n = 10). Expression levels were normalized to GAPDH, with one HD control sample set to 1. The inset shows an enlarged view of the PBMC data (y-axis range, 0–5). * p < 0.05, vs. control (Ct) of each group. # p < 0.05, HD vs. PA of each group. (B) IFNα stimulation indices in the neutrophil and PBMC fractions, calculated relative to the corresponding PBS-treated controls. Individual donor values are shown. ns: no statistically significant difference.
3.4. Serum BAFF Tends to Increase, Whereas Cellular BAFF Remains Low in SLE
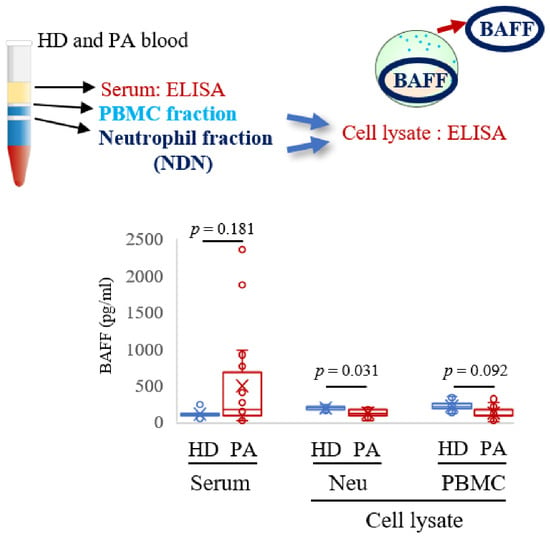
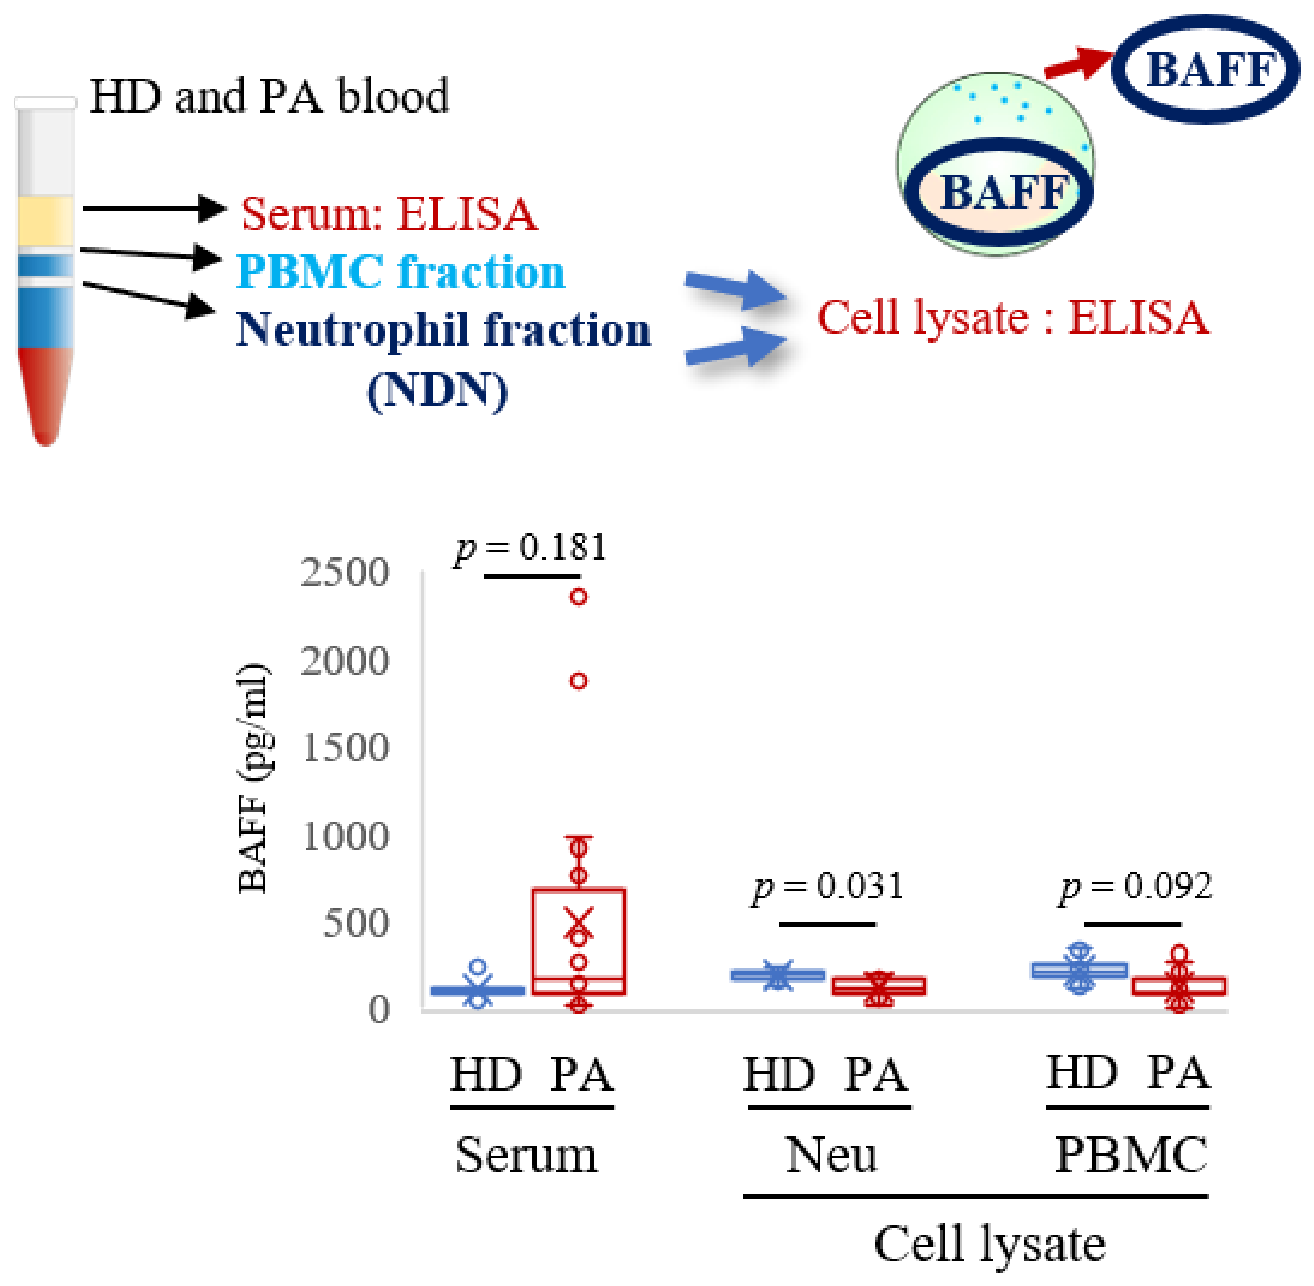
To evaluate BAFF protein levels in the circulation and cellular fractions, BAFF concentrations were measured in serum and in cell lysates prepared from conventional neutrophil and PBMC fractions (Figure 4). Serum BAFF concentrations tended to be higher in PA than in HD, although the difference was not statistically significant (p = 0.181), consistent with the results of previous studies [29]. In contrast, BAFF protein levels in cell lysates from both the conventional neutrophil and PBMC fractions were low and generally tended to be lower in PA samples, with a statistically significant difference observed only in the conventional neutrophil fraction. These findings demonstrate that serum and cellular BAFF levels do not necessarily show parallel changes, although the cellular sources of circulating BAFF cannot be determined from these measurements. Serum MPO and neutrophil elastase (NE) activities were also examined, but no significant difference was observed between HD and PA (Supplementary Figure S3).
Figure 4.
Measurement of BAFF protein levels in serum and cell lysates from HD and PA. Peripheral blood from HD (serum: n = 9, cell lysate: neu, n = 7; PBMC, n = 8) and PA (serum: n = 18, cell lysate: neu, n = 9; PBMC, n = 17) was separated into neutrophils and PBMC fractions as described in Figure 1. BAFF protein levels in serum (left) and cell lysates (right) were measured by ELISA.
3.5. PMA Markedly Induces dsDNA Release in Neutrophil Fractions Independent of IFNα
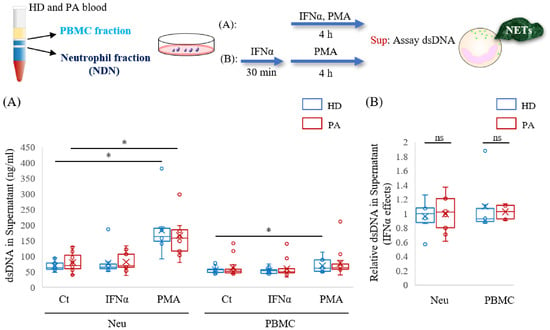
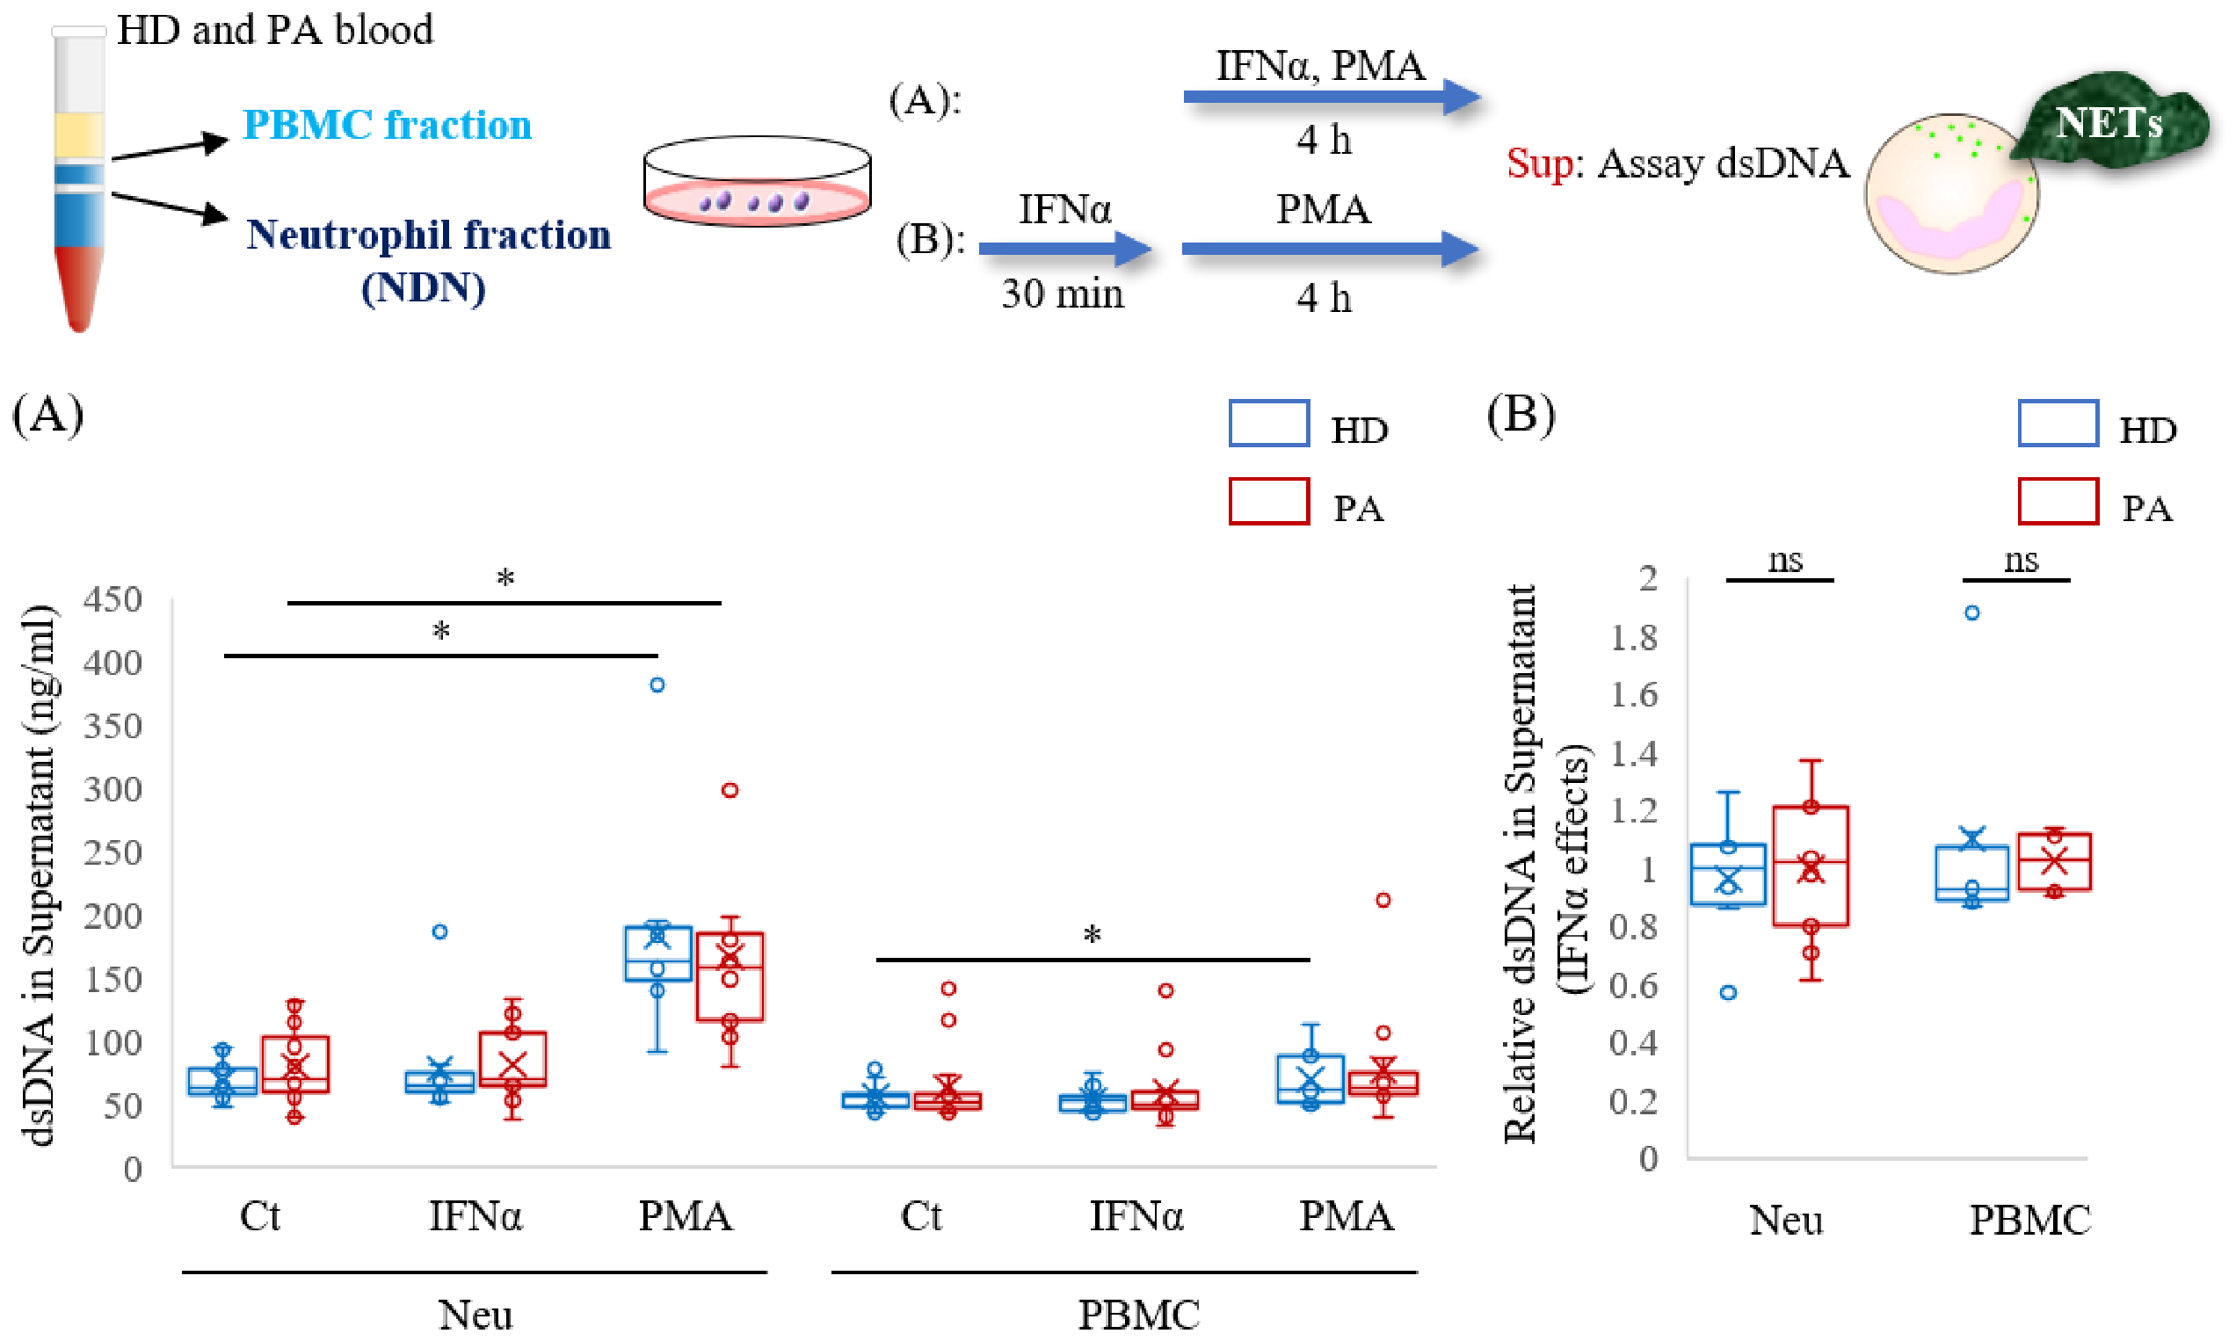
To assess NET-associated extracellular DNA release, dsDNA concentrations in the supernatant were measured following stimulation with IFNα or PMA (Figure 5). Even under unstimulated conditions, the neutrophil fraction from PA tended to release more dsDNA compared to HD (Figure 5A). PMA markedly increased extracellular dsDNA release in the neutrophil fraction, whereas IFNα alone had little effect. Extracellular dsDNA was also detected in the PBMC fraction, and PMA induced a statistically significant increase in the HD PBMC fraction, although the overall levels were lower than those observed in the neutrophil fraction (Figure 5A). When dsDNA release following PMA stimulation was compared in the presence and absence of IFNα, no significant effect of IFNα was detected (Figure 5B).
Figure 5.
Assessment of extracellular dsDNA release following IFNα and PMA stimulation in neutrophil and PBMC fractions. Peripheral blood was separated into neutrophil and PBMC fractions as described in Figure 1. Cells (1 × 10⁵) were stimulated with PMA and/or IFNα for 4 h. Extracellular dsDNA levels in culture supernatants were measured using the ACCU assay as an indicator of NET-associated DNA release. (A) Absolute dsDNA concentrations in supernatants under control (Ct), IFNα, and PMA stimulation conditions. HD, n = 9. PA, n = 14 for Neu, and n = 13 for PBMC. (B) Relative dsDNA release (normalized to PMA stimulation alone, set to 1.0) following PMA stimulation with or without IFNα pretreatment. HD, n = 6; PA, n = 9 for Neu, and n = 6 for PBMC. * p < 0.05 vs. Ct within the indicated group; ns: no statistically significant difference.
3.6. Sequential IFNα and PMA Stimulation Reveals BAFF Redistribution Associated with NET Formation in Neutrophils
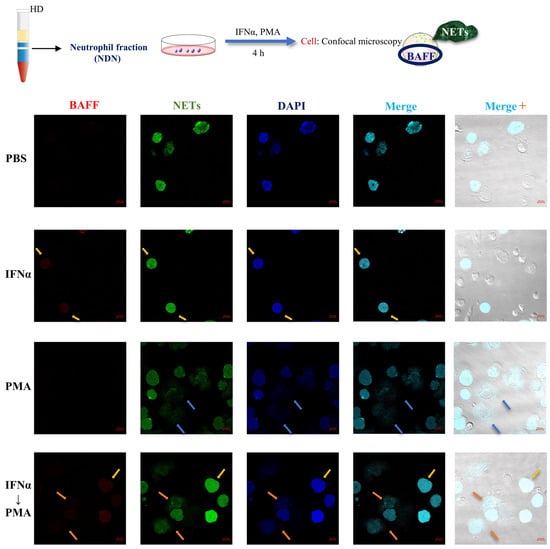
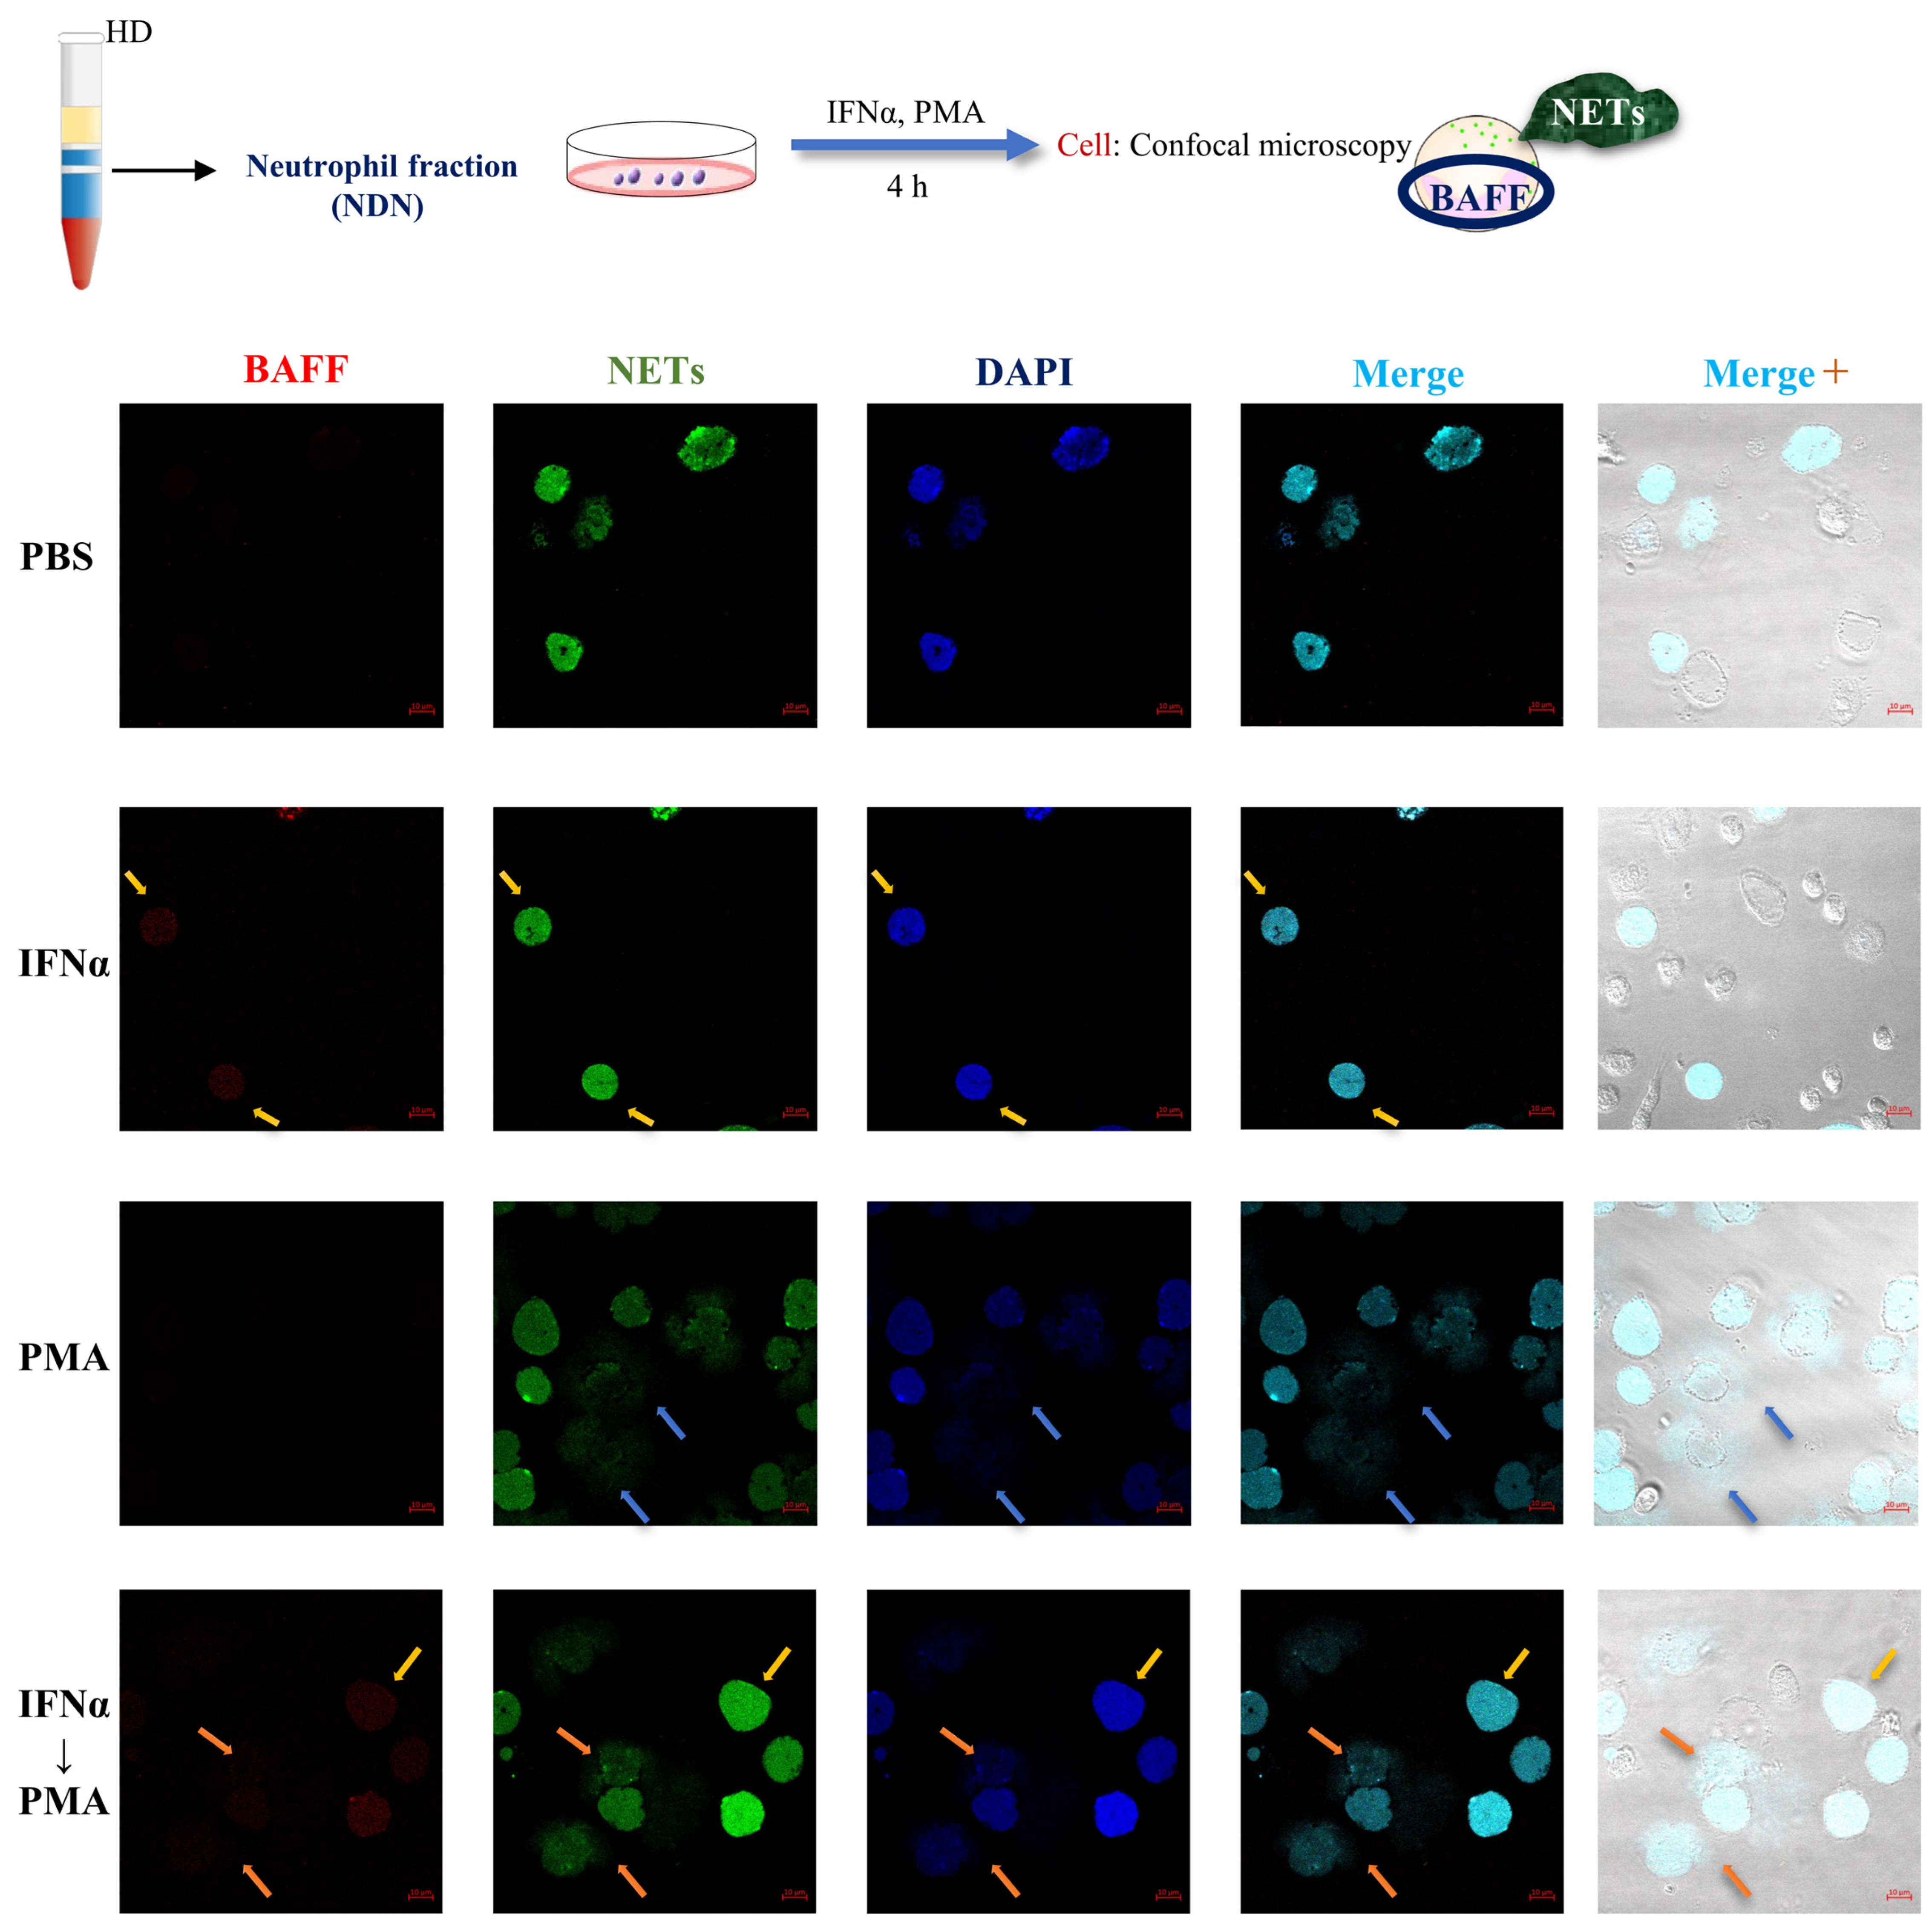
To examine the cellular localization of BAFF in relation to NET formation, neutrophils were analyzed using a confocal microscope under a series of stimulation conditions (Figure 6). Under unstimulated conditions (PBS), BAFF expression (red fluorescence) was barely detectable, and although nuclear staining (blue fluorescence, DAPI) was observed, NETs (green fluorescence) were not detected. IFNα stimulation induced marked intracellular BAFF expression in some neutrophils, but no NET formation was induced (yellow arrows). A similar staining pattern was observed in an additional HD sample (Supplementary Figure S4). In contrast, PMA stimulation was associated with the appearance of NET-forming cells (blue arrows). Following sequential IFNα and PMA stimulation, extracellular BAFF-associated fluorescence was observed in regions of NET formation (orange arrows). These imaging observations are consistent with a redistribution of BAFF-associated signals during NET formation, but do not by themselves establish the mechanism or extent of BAFF release.
Figure 6.
Confocal microscopic analysis of BAFF localization and NET formation following IFNα and PMA stimulation in neutrophils. Neutrophil fractions were isolated from HD as described in Figure 1 and stimulated with PBS, IFNα, or PMA for 4 h, or stimulated sequentially with IFNα followed by PMA during the final 1 h (IFNα → PMA). Representative confocal images are shown in the following order: BAFF immunofluorescence (red), Sytox Green staining (green), DAPI nuclear staining (blue), merged fluorescence, and merged fluorescence with bright-field images. Yellow arrows indicate BAFF-positive cells without NET formation; blue arrows indicate cells showing NET formation; orange arrows indicate NET-associated regions with diffuse extracellular BAFF-associated fluorescence. Scale bar indicates 10 µm.
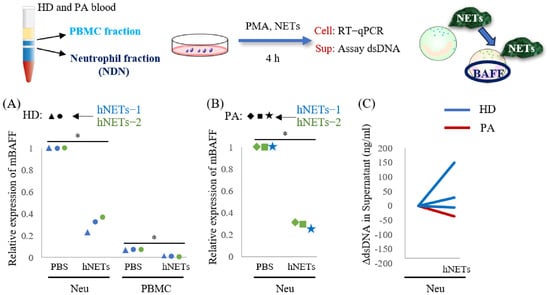
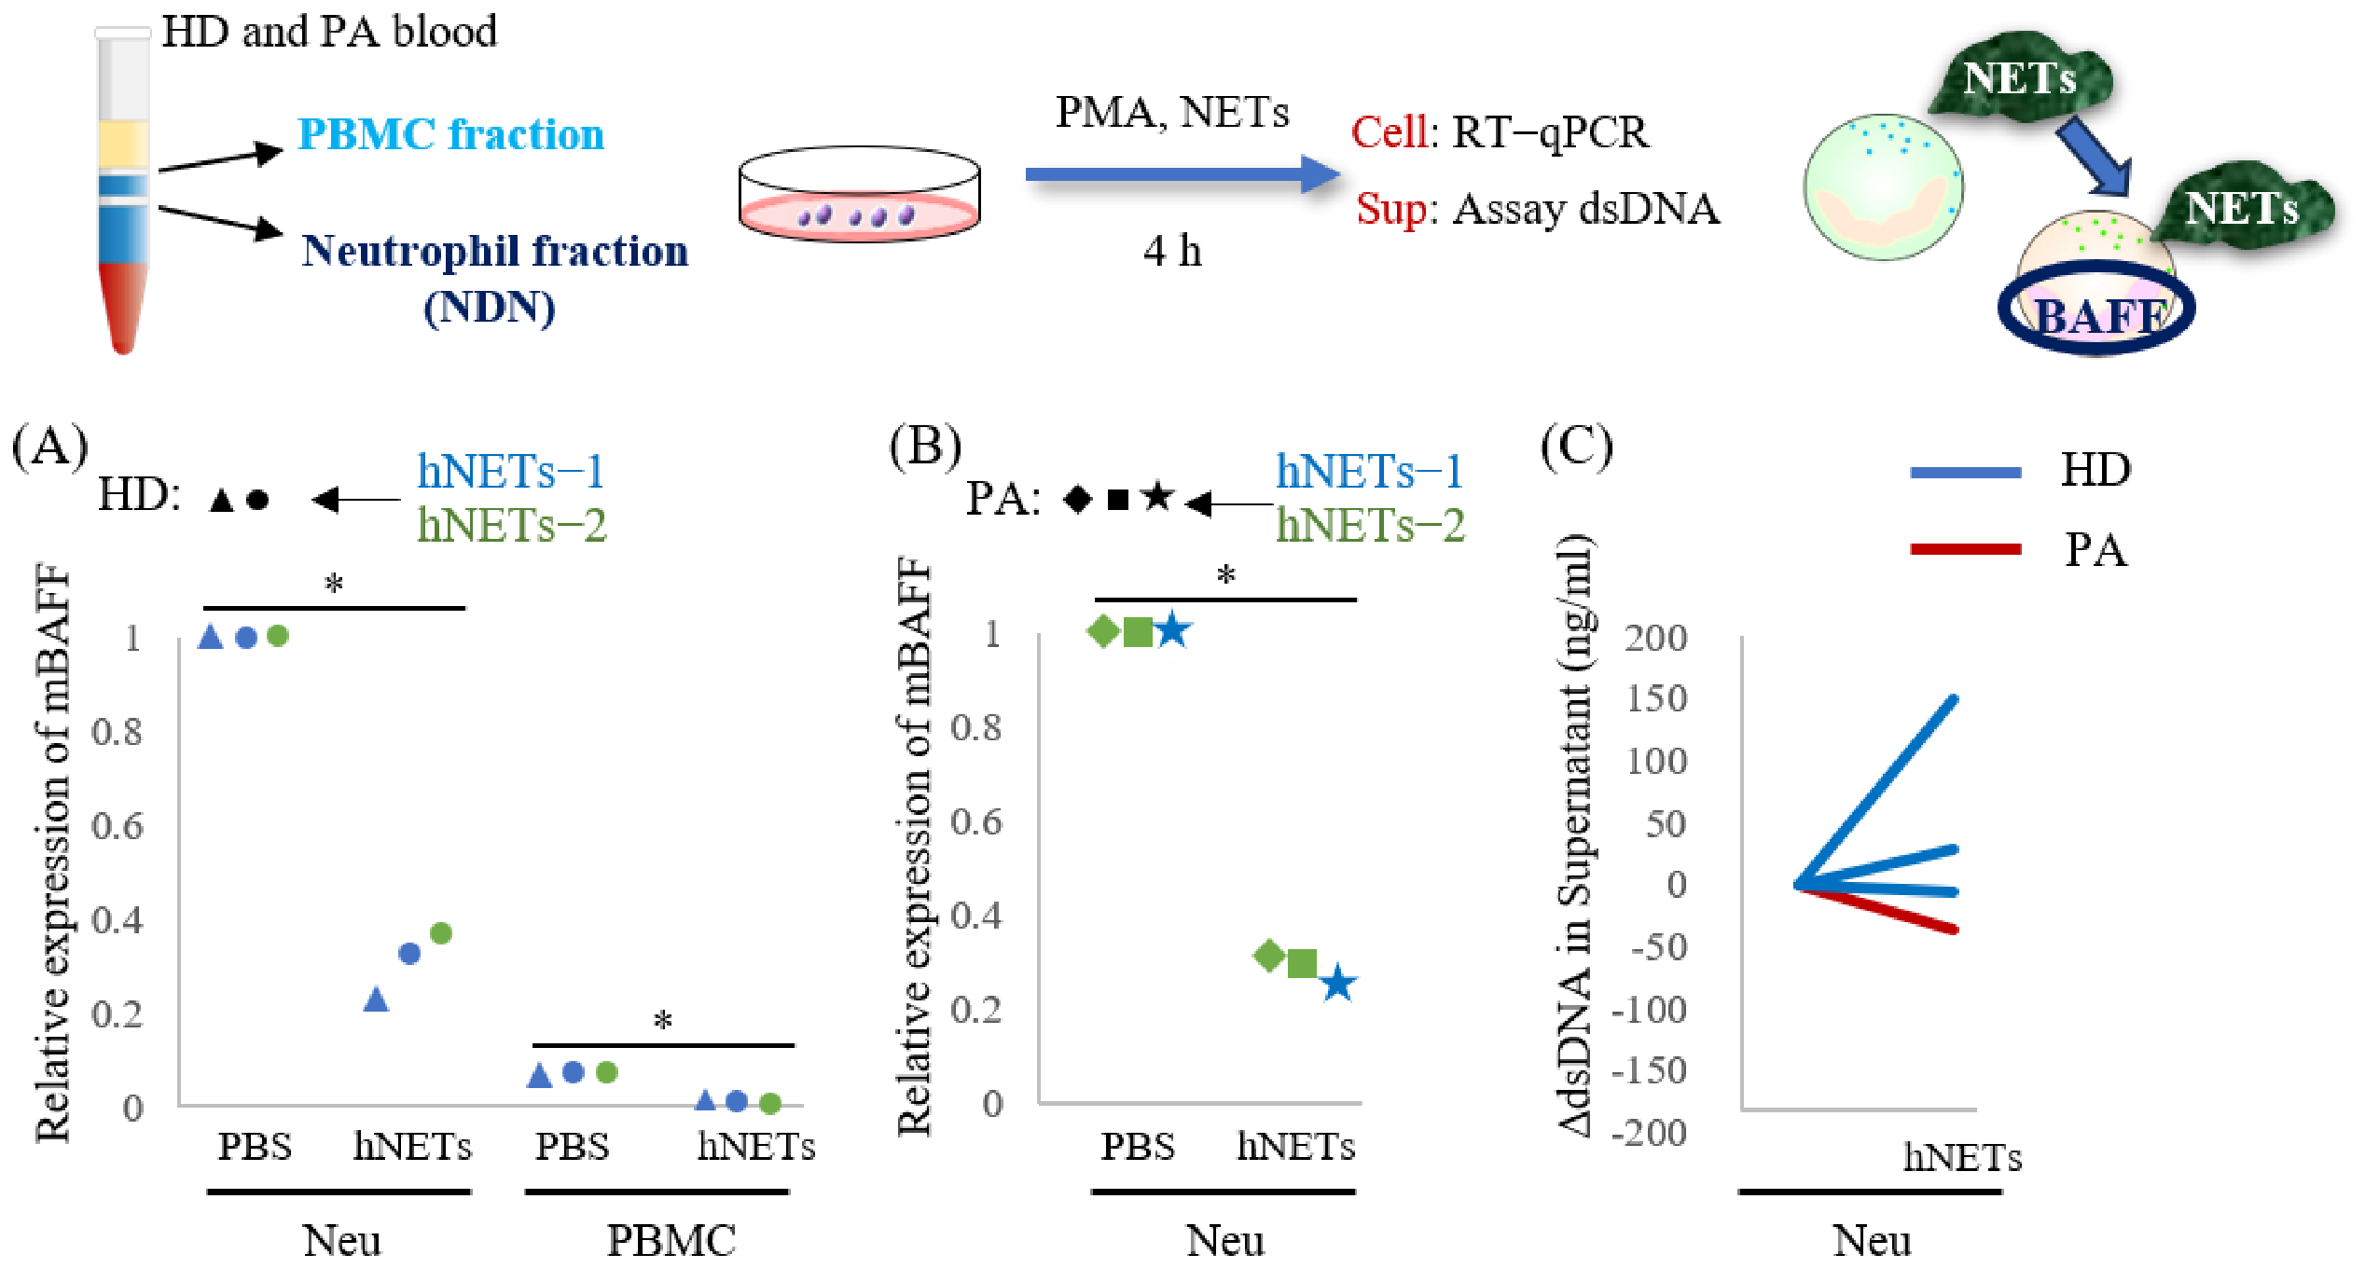
3.7. HD-Derived NET Material Reduces BAFF mRNA Expression in Neutrophil Fractions
To examine whether extracellular NET-derived material influences BAFF mRNA expression, conventional neutrophil and PBMC fractions from HD and PA were exposed to NET-derived preparations (Figure 7A,B). Exposure to HD-derived NET material was associated with reduced BAFF mRNA expression in HD neutrophils (Figure 7A), with a similar pattern observed in PA neutrophils (Figure 7B). This response was observed with preparations obtained from two HD donors, although its magnitude varied among recipient samples. In contrast, PA-derived NET preparations showed heterogeneous effects: one preparation increased BAFF mRNA expression in recipient neutrophils, whereas two others were associated with lower expression (Supplementary Figure S5A). Thus, the direction of the BAFF mRNA response was not consistent across all NET preparations. We also assessed extracellular dsDNA after exposure to HD-derived NET material. Changes in dsDNA levels varied among the samples examined, without a consistent increase attributable to the added material (Figure 7C). Exposure to the same three PA-derived NET preparations used in the BAFF mRNA analysis increased extracellular dsDNA release from neutrophils of both HD and PA (Supplementary Figure S5B). Together, these observations suggest that NET-derived material can modulate BAFF mRNA expression under the experimental conditions, but do not establish a uniform effect or identify the responsible components.
Figure 7.
Effects of NET-derived materials on BAFF mRNA expression and extracellular dsDNA levels. Neutrophil and PBMC fractions were isolated as described in Figure 1. (A,B) Conventional neutrophils (1 × 10⁵ cells) from HD (A) or PA (B), and PBMC fractions (A), were exposed to NET-derived material (3 ng/µl dsDNA equivalents; prepared as described in Section 2.11). BAFF mRNA expression was assessed by RT–qPCR and normalized to the corresponding PBS-treated neutrophil control. Symbols represent individual donors; blue and green indicate NET preparations from two different HDs. In (A), circles identify samples from the same recipient exposed to different NET preparations. * p < 0.05, vs. PBS in each group. (C) Conventional neutrophils (1 × 10⁵ cells) from HD (blue) or PA (red) were exposed to HD-derived NET material for 4 h. Extracellular dsDNA was measured using the Accu assay; changes relative to the prestimulation baseline (ΔdsDNA) are shown. The dsDNA level prior to each stimulation was set to zero. The NET preparations used for stimulation were free of PMA and PMA-induced soluble factors. Statistical symbols, where shown, denote the comparisons indicated in the figure.
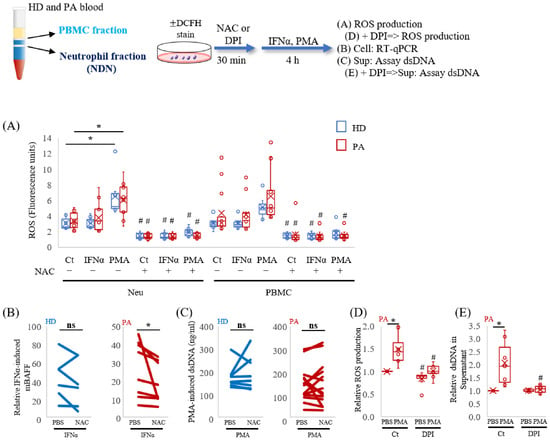
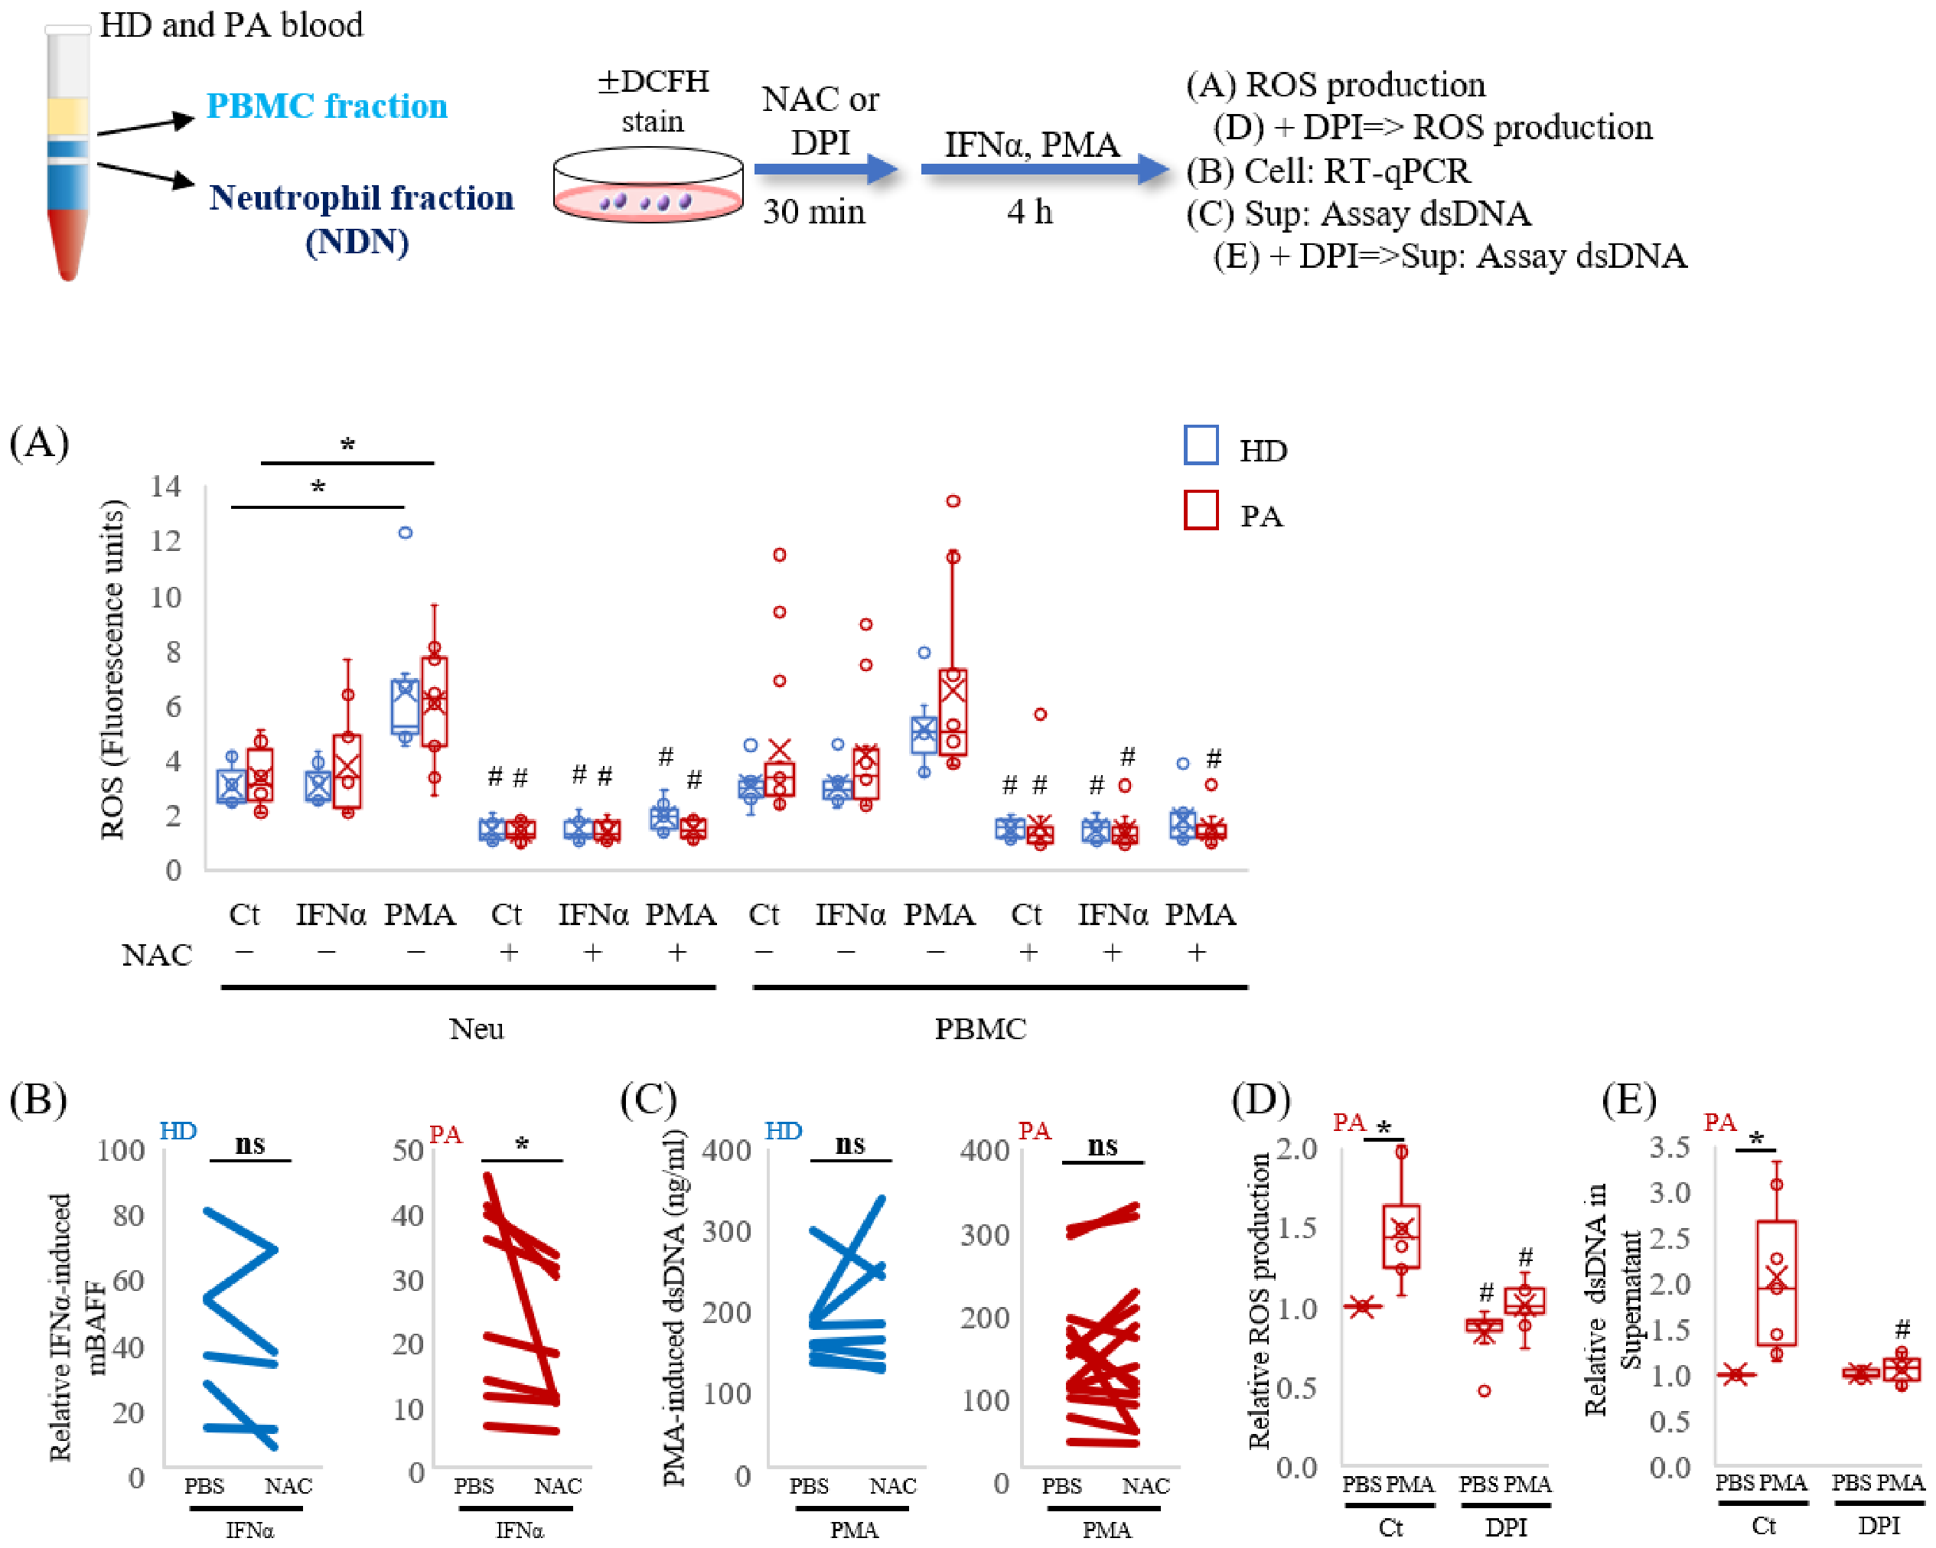
3.8. Differential Effects of ROS Modulation on BAFF Expression and Extracellular dsDNA Release
To investigate the involvement of ROS in BAFF expression and NET-associated responses, intracellular ROS production was measured, and the effects of ROS scavenging by NAC were examined (Figure 8). Compared with HD, some neutrophil samples derived from PA exhibit higher basal ROS levels, although no statistically significant difference was observed (Figure 8A). A similar tendency was observed in the PBMC fraction. PMA stimulation increased ROS production, particularly in the conventional neutrophils; NAC pretreatment markedly reduced ROS levels in both the conventional neutrophil and PBMC fractions under the examined stimulation conditions. The reduction in ROS was not attributable to decreased cell viability (Supplementary Figure S6, using the trypan blue dye exclusion method and Cell Titer-Glo luminescent cell viability assay as previously reported [30,31]). Next, we investigated the effect of NAC on BAFF mRNA expression and extracellular dsDNA release. NAC pretreatment significantly reduced IFNα-induced BAFF mRNA expression in neutrophils from PA, whereas the reduction in HD did not reach statistical significance (Figure 8B). In contrast, NAC did not significantly reduce PMA-induced extracellular dsDNA release in either HD or PA neutrophils (Figure 8C). It is well known that NADPH oxidase is one of the main sources of intracellular ROS [32,33]. Therefore, cells were treated with DPI, an inhibitor of NADPH oxidase. DPI significantly suppressed PMA-induced ROS production (Figure 8D) and extracellular dsDNA release (Figure 8E). These findings indicate that NAC and DPI exert different effects on the measured responses, while supporting the involvement of DPI-sensitive ROS production in PMA-induced dsDNA release.
Figure 8.
ROS responses and differential effects of NAC and DPI on BAFF mRNA expression and extracellular dsDNA release. Neutrophil and PBMC fractions were prepared as described in Figure 1. (A) Cells were stained with DCFH first, then stimulated with IFNα or PMA for 4 h, with or without NAC pretreatment (30 min). Fluorescence was measured using a fluorescence plate reader (HD, n = 7; PA, n = 14). (B) Neutrophils were stimulated with IFNα for 4 h with or without NAC pretreatment, and BAFF mRNA was quantified by RT–qPCR (HD, n = 6; PA, n = 8), while relative expression was calculated by setting one healthy donor control to 1. (C) Neutrophils were stimulated with PMA for 4 h with or without NAC pretreatment, and extracellular dsDNA in culture supernatants was measured using the Accu assay (HD, n = 8; PA, n = 14). (D) Cells were stained with DCFH first, then stimulated with PMA for 4 h, with or without DPI pretreatment (12.5 µM), and the production of ROS was measured using a fluorescence plate reader. Relative fluorescence units are shown for SLE patients (n = 8). (E) Extracellular dsDNA release after PMA stimulation for 4 h with or without DPI pretreatment was measured using the Accu assay (n = 7). * p < 0.05, vs. Ct of each group for (A), vs. PBS of each group for (D,E). # p < 0.05, vs. without NAC or without DPI of each group for (A,D,E). * p < 0.05, vs. PBS of each group for (B,C). ns: no statistically significant difference.
3.9. PAD4 Expression and MEK/ERK-Associated Responses in SLE Neutrophils
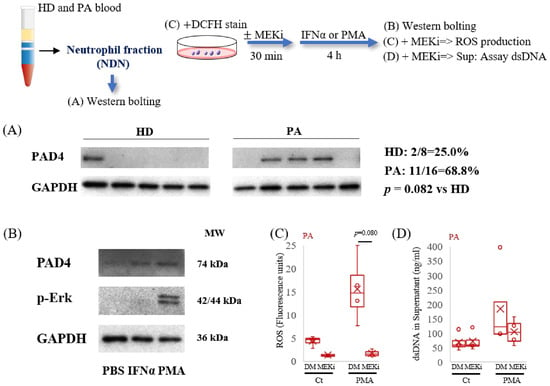
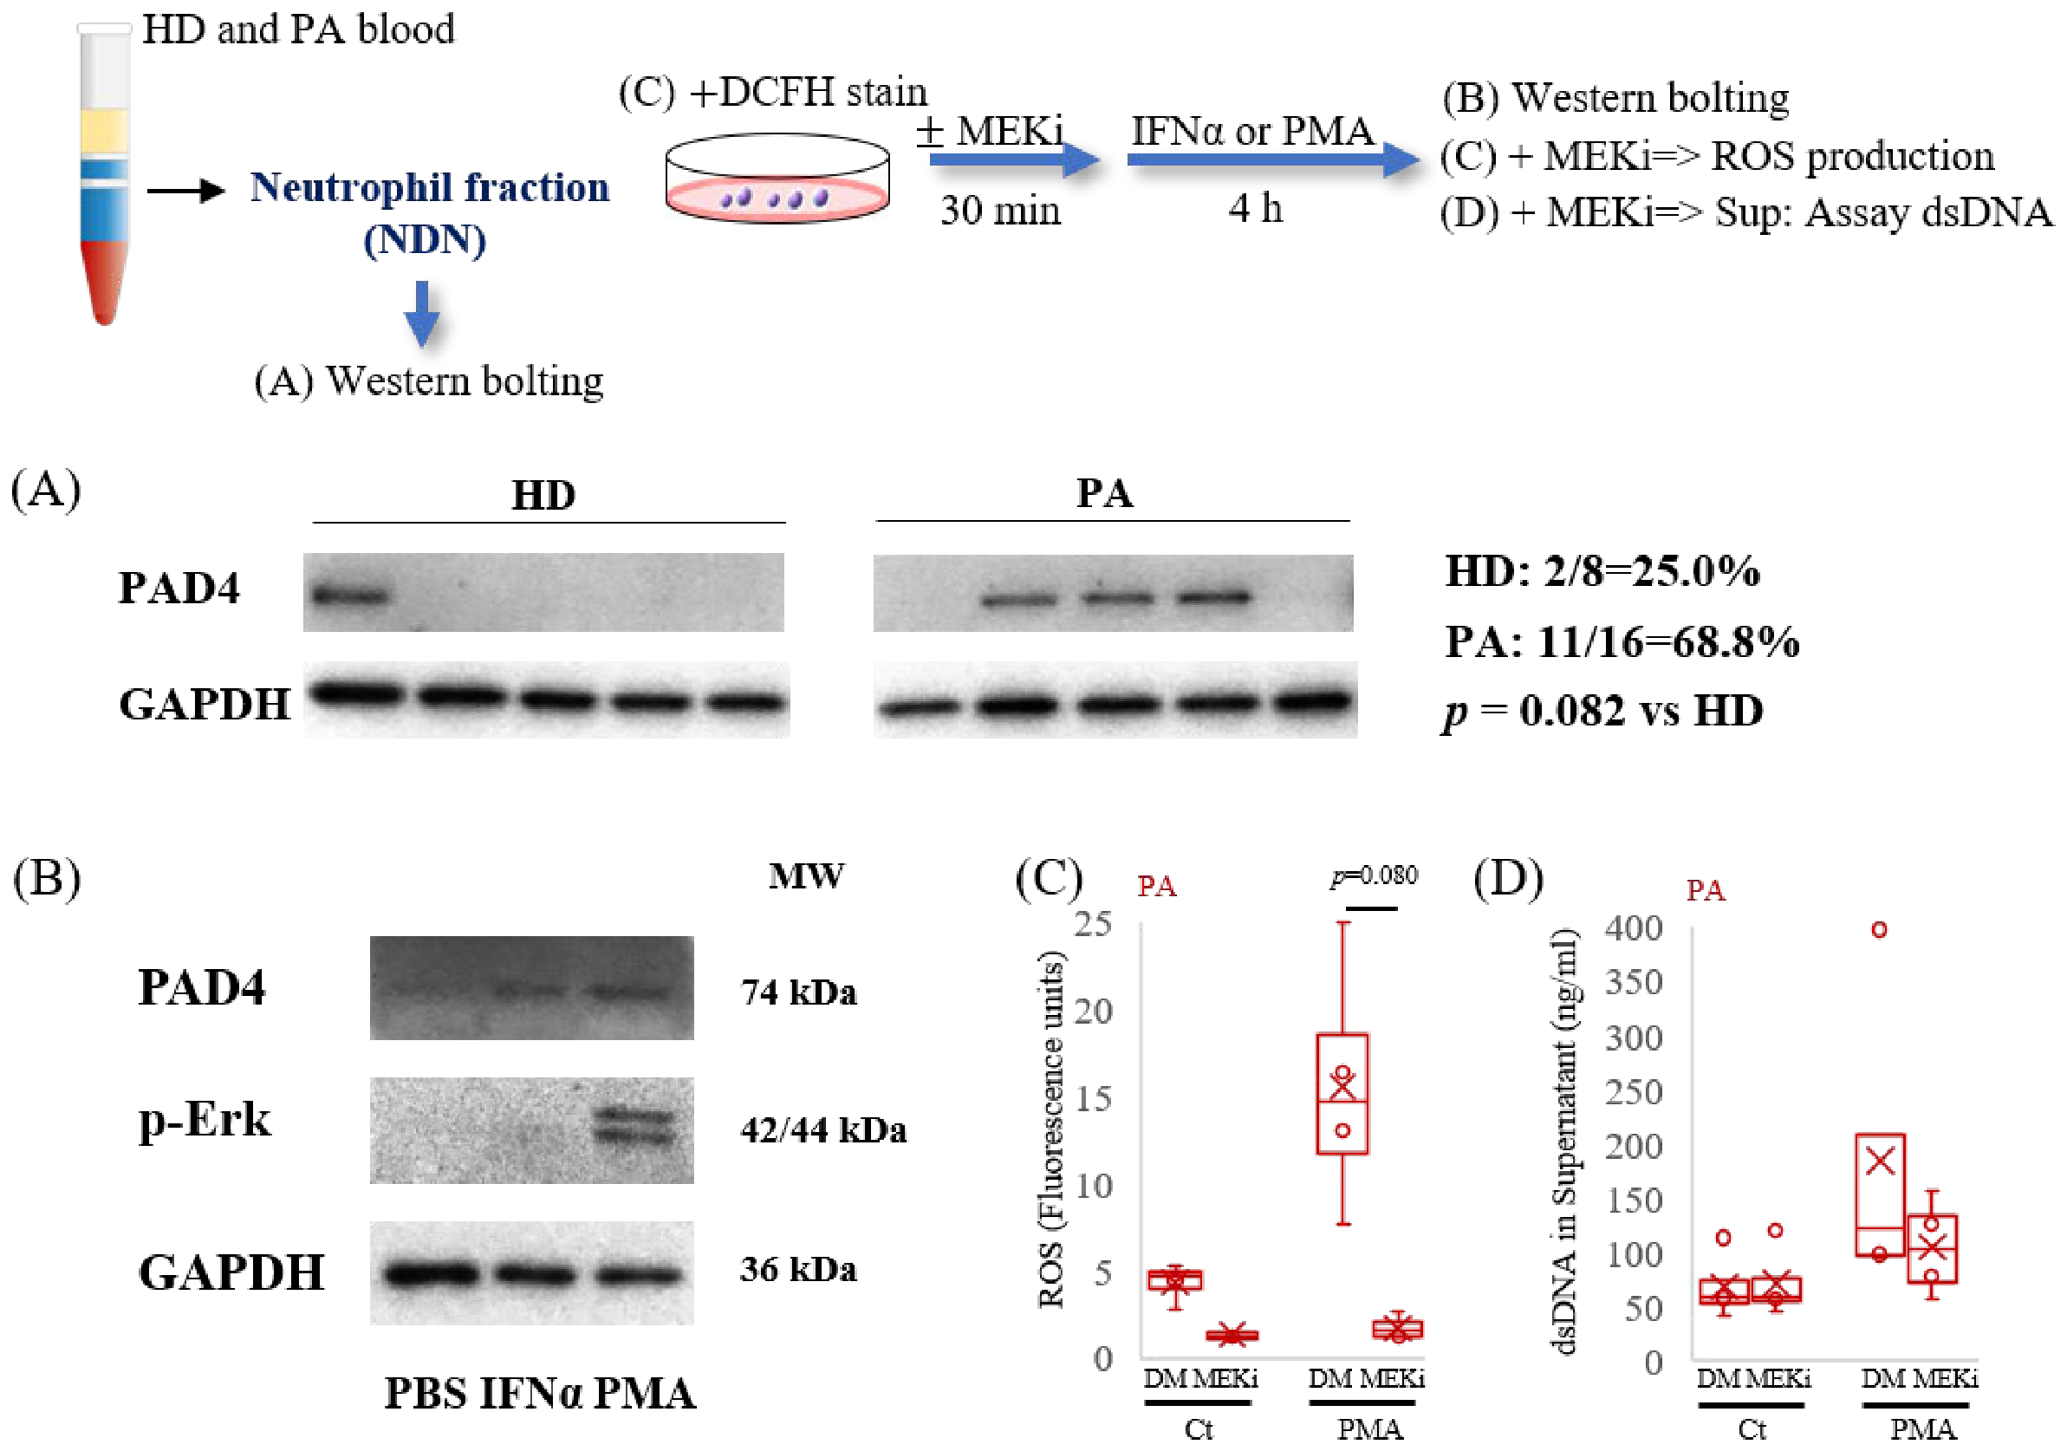
Previous studies have demonstrated a link between PAD4 and NET formation [34]. Next, the expression of PAD4 in neutrophils was examined by Western blotting. PAD4 was detected more frequently in neutrophil lysates prepared immediately after isolation from PA than from HD, although the difference in detection frequency was not statistically significant (Figure 9A, Supplementary Figure S7). In addition, PAD4 expression was further increased in patient neutrophils stimulated with PMA ex vivo (Figure 9B). MEK/ERK signaling has been implicated in PMA-induced NET formation [35,36]. Consistent with this, ERK phosphorylation increased following PMA stimulation. We next examined the effect of MEK inhibition on ROS production and NET formation. MEK inhibition reduced PMA-induced ROS production (Figure 9C). PMA-induced extracellular dsDNA release also tended to be reduced by MEK inhibition, although the difference did not reach statistical significance (Figure 9D). These findings suggest that the MEK/ERK signaling pathway contributes to PMA-induced ROS production and may also be involved in NET-associated responses.
Figure 9.
Analysis of PAD4 expression, ERK phosphorylation, and the effects of MEK inhibition on ROS production and extracellular dsDNA release in neutrophils. Neutrophil fractions were prepared as described in Figure 1. (A) Cell lysates from HD and PA were used for Western blotting. PAD4 and GAPDH expression were detected by immunoblotting. GAPDH was used as the loading control. “n” indicates PAD4-negative samples. Data from five representative cases from the HD group (n = 8) and the PA group (n = 16) are shown. The positive rates for each group are indicated on the right side of the images, and the p-value represents the comparison of PAD4 positive rates between the HD and PA groups. (B) Cells from PA were stimulated with IFNα or PMA for 4 h. PAD4, phosphor-Erk (p-Erk), and GAPDH expression were detected by immunoblotting. (C) Neutrophils from PA were stained with DCFH first, then stimulated with PMA for 4 h, with or without pre-treated MEK inhibitor (MEKi, 30 min, 10 µM), and the production of ROS was measured using a fluorescence plate reader. Fluorescence units are shown (n = 4). DMSO, dimethyl sulfoxide (solvent control for MEKi). (D) Neutrophils from PA were stimulated with PMA for 4 h, with or without pre-treated MEKi (30 min, 10 µM) (n = 4). Extracellular dsDNA release was assessed by measuring dsDNA levels in the supernatant.
4. Discussion
The present study investigated the regulation of BAFF expression and NET formation in conventional neutrophil and PBMC fractions from HD and PA. Our findings revealed distinct stimulus-dependent responses: type I interferons preferentially induced BAFF mRNA expression, whereas PMA strongly promoted extracellular dsDNA release associated with NET formation. These responses also differed in their sensitivity to ROS-modulating agents. Although these observations suggest that BAFF expression and NET formation are regulated differently, they do not establish whether the two responses occur in separate neutrophil subsets or within the same cells.
BAFF is an important regulator of B-cell survival and differentiation and has been implicated in SLE pathogenesis [37,38]. Consistent with previous reports, IFNα and IFNβ induced BAFF mRNA expression in conventional neutrophils [39,40], whereas most other inflammatory stimuli examined had relatively limited effects. IFNα also induced BAFF mRNA expression in the PBMC fraction, although the measured expression levels were substantially lower than those in the conventional neutrophil fraction. Serum BAFF concentrations tended to be higher in PA than in HD, without reaching statistical significance, as previously reported [41,42], whereas BAFF protein levels in cellular lysates were generally low. These findings do not identify the cellular sources of circulating BAFF. Confocal microscopy showed intracellular BAFF signals following IFNα stimulation and altered BAFF localization during subsequent PMA-induced NET formation. These observations raise the possibility that BAFF expression and extracellular redistribution are regulated by different activation signals. However, direct BAFF secretion was not demonstrated, and the proposed relationship between intracellular BAFF accumulation and extracellular release requires further investigation.
NET formation showed a different response pattern. PMA markedly increased extracellular dsDNA release, whereas IFNα alone had little effect. Neutrophils from some PA samples also showed relatively high dsDNA release under unstimulated conditions, although this observation does not by itself establish a primed cellular state. Recombinant BAFF did not significantly enhance acute dsDNA release during the 4-h observation period (Supplementary Figure S8), suggesting that BAFF is not a major direct stimulus for this response under the conditions examined. Nevertheless, effects of prolonged BAFF exposure cannot be excluded.
Experiments using NET-derived materials further suggested that their effects on BAFF expression are not uniform. HD-derived NET materials generally reduced BAFF mRNA expression in recipient neutrophils (Figure 7). In contrast, preliminary experiments using three PA-derived NET preparations showed variable responses: one preparation increased BAFF mRNA expression in neutrophils from both HD and PA, whereas two other preparations were associated with decreased expression (Supplementary Figure S5). These observations indicate that some NET-derived materials may enhance BAFF mRNA expression, but the available data do not establish whether this property is specific to PA-derived NETs. Interestingly, the same three PA-derived NET preparations increased extracellular dsDNA release from neutrophils of both HD and PA (Supplementary Figure S5B), despite their variable effects on BAFF mRNA expression. These findings suggest that the effects of NET-derived materials on BAFF expression and NET-associated responses may be differentially regulated. Differences in NET composition or recipient-cell responsiveness may contribute to these variations.
ROS-dependent signaling has been implicated in neutrophil activation and inflammatory responses [28,43]. In the present study, NAC reduced intracellular ROS levels in both conventional neutrophil and PBMC fractions and significantly attenuated IFNα-induced BAFF mRNA expression in PA neutrophils. These findings suggest that ROS may contribute to the regulation of BAFF expression under the conditions examined. However, NAC did not consistently suppress PMA-induced extracellular dsDNA release. In contrast, DPI markedly reduced both PMA-induced ROS production and dsDNA release. Because DPI is not entirely specific for NADPH oxidase, these findings suggest that reducing intracellular ROS levels by scavenging is not necessarily sufficient to inhibit NET formation. Further molecular investigations are required to clarify the mechanisms underlying the different effects of NAC and DPI on extracellular dsDNA release.
Additional analyses implicated PAD4 and MEK/ERK signaling in the responses associated with NET formation. PAD4 protein was detected more frequently in PA than in HD neutrophil samples, although the difference in detection frequency was not statistically significant. PMA stimulation was associated with increased PAD4 expression and ERK phosphorylation, consistent with previous studies linking these molecules to NET formation [8,34]. MEK inhibition reduced PMA-induced ROS production, while its effect on extracellular dsDNA release showed a nonsignificant tendency toward reduction. Together, these results suggest that MEK/ERK signaling contributes to PMA-induced ROS generation and may participate in NET-associated responses. Further stratification of neutrophils according to PAD4 expression status may provide additional insight into the relationship between ROS production, intracellular signaling, and NET formation. However, the present experiments do not establish a complete signaling pathway linking ERK activation, ROS production, PAD4, and NET formation.
The analysis of density-separated fractions also revealed differences in cellular composition and stimulus responsiveness. CD66b-positive cells were detected in both the conventional neutrophil and PBMC fractions, but the PBMC fraction contained heterogeneous cell populations and was not further subdivided. Therefore, the observed responses cannot be attributed specifically to LDGs or other individual cell types. Although BAFF mRNA expression and extracellular dsDNA release were generally lower in the PBMC fraction, the additional PBMC data indicate that this fraction also responds to inflammatory stimulation. Further phenotypic and functional characterization will be necessary to determine the contributions of its constituent cell populations to SLE pathophysiology.
We also examined relationships among serum BAFF, NET-forming capacity, ROS production, and clinical parameters, including SLEDAI, CRP, ESR, IgG, and CH50 (Supplementary Figures S9 and S10). No consistent pattern of associations was identified across the overall PA population. These findings suggest that circulating BAFF levels and neutrophil NET-forming capacity do not necessarily reflect a common inflammatory state in SLE. Interestingly, stratification according to PAD4 expression revealed a more consistent pattern of associations between serum BAFF and disease-related parameters in PAD4-positive patients (n = 9). Serum BAFF showed positive associations with SLEDAI, CRP, and ESR and an inverse association with CH50, whereas NET-forming capacity and ROS production showed weaker relationships with disease activity (Supplementary Table S2). These observations raise the possibility that PAD4-based stratification may help identify relationships between BAFF-associated responses and clinical disease activity that are less apparent in the overall patient population. However, the exploratory nature of this analysis requires further validation in independent cohorts. In addition, the elevated serum IL-6 and TNFα levels observed in PA (Supplementary Figure S11) suggest the presence of a systemic inflammatory environment, although their direct contribution to BAFF expression or NET formation remains unclear.
Several limitations should be acknowledged. The number of samples was limited for some experiments, particularly those involving NET-derived materials and pharmacological inhibitors. Extracellular dsDNA was used as a measure of NET-associated responses, but this assay alone cannot distinguish NET formation from other sources of extracellular DNA. The PBMC fraction was not separated into defined cellular subsets, and BAFF expression and NET formation were not assessed simultaneously at the single-cell level. Consequently, our findings demonstrate stimulus-dependent differences at the population level rather than the existence of distinct BAFF-producing and NET-forming neutrophil subsets. Multiparameter single-cell analyses, direct measurements of BAFF secretion, and further characterization of NET-derived materials will be required to resolve these questions.
In conclusion, our findings indicate that IFNα-induced BAFF mRNA expression and PMA-induced NET-associated responses in human neutrophils exhibit different stimulus requirements and pharmacological sensitivities. These observations provide a basis for further investigation of how BAFF-related and NET-related responses are regulated in SLE, while highlighting the need for single-cell and mechanistic studies to establish their cellular relationships.
Supplementary Materials
The following supporting information can be downloaded at: https://www.mdpi.com/article/10.3390/antiox15111507/s1, Figure S1: Comparison of CD11b, CD14, and CD15 expression between neutrophil and PBMC fractions from HD and PA. Figure S2: Screening of cytokines and PAMPs for induction of BAFF mRNA in neutrophils and PBMCs. Figure S3: Comparison of serum MPO and NE activities between HD and PA. Figure S4: Confocal microscopic analysis of BAFF localization and NET formation following IFNα and PMA stimulation in neutrophils. Figure S5: Effects of PA-derived NET materials on BAFF mRNA expression and extracellular dsDNA release in neutrophil and PBMC fractions. Figure S6: Assessment of cell viability following NAC treatment. Figure S7: Analysis of PAD4 expression in neutrophils from HD and PA under basal and PMA-stimulated conditions. Figure S8: Effects of recombinant BAFF on extracellular dsDNA release in neutrophil fractions. Figure S9: Correlation analyses of BAFF-related and NET-associated parameters in HD and PA. Figure S10: Correlation analyses of sBAFF levels, NET-associated responses, ROS production, and clinical parameters in patients with SLE. Figure S11: Comparison of serum IL-6, TNF-α, and IL-1β levels between HD and PA.; Table S1: Demographic and clinical characteristics of study subjects. Table S2: Correlation matrices between sBAFF, NET formation, ROS production, and conventional clinical parameters in PAD4-positive PA groups.
Author Contributions
Conceptualization, Z.Z., Y.Y. and S.I.; methodology, Z.Z., D.W., K.Y. and S.K.; validation, S.N. and Y.T.; formal analysis, Z.Z.; investigation, Z.Z., N.O. and S.S.; data curation, N.O. and Y.Y.; writing—original draft preparation, Z.Z.; writing—review and editing, Y.Y.; supervision, K.S., K.Y., S. K. and S.N. and funding acquisition, D.W. and Y.Y. All authors have read and agreed to the published version of the manuscript.
Funding
This research was funded by a Grant-in-Aid for Challenging Research (Exploratory) (grant number 23K18395 to Y. Yoshida).
Institutional Review Board Statement
The study was conducted in accordance with the Declaration of Helsinki and approved by the ethics committee of the University of Occupational and Environmental Health, Japan (UOEHCRB21-089, 30 August 2021).
Informed Consent Statement
Informed consent was obtained from all subjects involved in the study.
Data Availability Statement
Data is contained within the article or Supplementary Materials.
Acknowledgments
During the preparation of this manuscript, the authors used ChatGPT (OpenAI) to assist with language refinement, organization of the manuscript, and the generation of an initial illustration for the graphical abstract. All scientific interpretations, conclusions, and final content were determined, reviewed, and approved by the authors, who take full responsibility for the content of the publication. We appreciate the help of all laboratory members in the management of laboratory and teaching technologies. We especially thank the medical staff at the University of Occupational and Environmental Health, Japan, Kahoru Noda-Sugitani, for her excellent technical assistance.
Conflicts of Interest
The authors declare no conflicts of interest.
Abbreviations
The following abbreviations are used in this manuscript:
| BAFF | B-cell activating factor |
| CRP | C-reactive protein |
| CH50 | total hemolytic complement activity |
| dsDNA | double-stranded DNA |
| DPI | diphenyleneiodonium chloride |
| DM | dimethyl sulfoxide |
| ELISA | Enzyme-Linked Immunosorbent Assay |
| ESR | erythrocyte sedimentation rate |
| GAPDH | glyceraldehyde-3-phosphate dehydrogenase |
| HD | healthy donors |
| IFN-I | Type I interferon |
| IgG | Immunoglobulin G |
| LDGs | low-density granulocytes |
| mtROS | mitochondrial ROS |
| MEKi | MEK inhibitor |
| MPO | Myeloperoxidase |
| NETs | neutrophil extracellular traps |
| NDNs | normal-density neutrophils |
| NAC | N-Acetyl-L-cysteine |
| NE | neutrophil elastase |
| PMA | Phorbol 12-myristate 13-acetate |
| pDCs | Plasmacytoid dendritic cells |
| PBMCs | peripheral blood mononuclear cells |
| PA | SLE patients |
| PAMPs | pathogen-associated molecular patterns |
| ROS | reactive oxygen species |
| SLE | systemic lupus erythematosus |
| sBAFF | serum BAFF |
| SLEDAI | Systemic Lupus Erythematosus Disease Activity Index |
References
- Tsokos, G.C. Systemic lupus erythematosus. N. Engl. J. Med. 2011, 365, 2110–2121. [Google Scholar] [CrossRef] [Scilit] [PubMed]
- Ngo, C.; Garrec, C.; Tomasello, E.; Dalod, M. The role of plasmacytoid dendritic cells (pDCs) in immunity during viral infections and beyond. Cell Mol. Immunol. 2024, 21, 1008–1035. [Google Scholar] [CrossRef] [Scilit] [PubMed]
- Baechler, E.C.; Batliwalla, F.M.; Karypis, G.; Gaffney, P.M.; Ortmann, W.A.; Espe, K.J.; Shark, K.B.; Grande, W.J.; Hughes, K.M.; Kapur, V.; et al. Interferon-inducible gene expression signature in peripheral blood cells of patients with severe lupus. Proc. Natl. Acad. Sci. USA 2003, 100, 2610–2615. [Google Scholar] [CrossRef] [Scilit] [PubMed]
- Navarra, S.V.; Guzman, R.M.; Gallacher, A.E.; Hall, S.; Levy, R.A.; Jimenez, R.E.; Li, E.K.; Thomas, M.; Kim, H.Y.; Leon, M.G.; et al. Efficacy and safety of belimumab in patients with active systemic lupus erythematosus: A randomised, placebo-controlled, phase 3 trial. Lancet 2011, 377, 721–731. [Google Scholar] [CrossRef] [Scilit] [PubMed]
- Morand, E.F.; Furie, R.; Tanaka, Y.; Bruce, I.N.; Askanase, A.D.; Richez, C.; Bae, S.C.; Brohawn, P.Z.; Pineda, L.; Berglind, A.; et al. Trial of Anifrolumab in Active Systemic Lupus Erythematosus. N. Engl. J. Med. 2020, 382, 211–221. [Google Scholar] [CrossRef] [Scilit] [PubMed]
- Ng, L.G.; Ostuni, R.; Hidalgo, A. Heterogeneity of neutrophils. Nat. Rev. Immunol. 2019, 19, 255–265. [Google Scholar] [CrossRef] [Scilit] [PubMed]
- Mantovani, A.; Cassatella, M.A.; Costantini, C.; Jaillon, S. Neutrophils in the activation and regulation of innate and adaptive immunity. Nat. Rev. Immunol. 2011, 11, 519–531. [Google Scholar] [CrossRef] [Scilit] [PubMed]
- Kaplan, M.J. Neutrophils in the pathogenesis and manifestations of SLE. Nat. Rev. Rheumatol. 2011, 7, 691–699. [Google Scholar] [CrossRef] [Scilit] [PubMed]
- Wigerblad, G.; Kaplan, M.J. Neutrophil extracellular traps in systemic autoimmune and autoinflammatory diseases. Nat. Rev. Immunol. 2023, 23, 274–288. [Google Scholar] [CrossRef] [Scilit] [PubMed]
- Papayannopoulos, V. Neutrophil extracellular traps in immunity and disease. Nat. Rev. Immunol. 2018, 18, 134–147. [Google Scholar] [CrossRef] [Scilit] [PubMed]
- Scapini, P.; Nardelli, B.; Nadali, G.; Calzetti, F.; Pizzolo, G.; Montecucco, C.; Cassatella, M.A. G-CSF-stimulated neutrophils are a prominent source of functional BLyS. J. Exp. Med. 2003, 197, 297–302. [Google Scholar] [CrossRef] [Scilit] [PubMed]
- Mackay, F.; Schneider, P. Cracking the BAFF code. Nat. Rev. Immunol. 2009, 9, 491–502. [Google Scholar] [CrossRef] [Scilit] [PubMed]
- Sjostrand, M.; Johansson, A.; Aqrawi, L.; Olsson, T.; Wahren-Herlenius, M.; Espinosa, A. The Expression of BAFF Is Controlled by IRF Transcription Factors. J. Immunol. 2016, 196, 91–96. [Google Scholar] [CrossRef] [Scilit] [PubMed]
- Denny, M.F.; Yalavarthi, S.; Zhao, W.; Thacker, S.G.; Anderson, M.; Sandy, A.R.; McCune, W.J.; Kaplan, M.J. A distinct subset of proinflammatory neutrophils isolated from patients with systemic lupus erythematosus induces vascular damage and synthesizes type I IFNs. J. Immunol. 2010, 184, 3284–3297. [Google Scholar] [CrossRef] [Scilit] [PubMed]
- Blanco, L.P.; Wang, X.; Carlucci, P.M.; Torres-Ruiz, J.J.; Romo-Tena, J.; Sun, H.W.; Hafner, M.; Kaplan, M.J. RNA Externalized by Neutrophil Extracellular Traps Promotes Inflammatory Pathways in Endothelial Cells. Arthritis Rheumatol. 2021, 73, 2282–2292. [Google Scholar] [CrossRef] [Scilit] [PubMed]
- Lande, R.; Ganguly, D.; Facchinetti, V.; Frasca, L.; Conrad, C.; Gregorio, J.; Meller, S.; Chamilos, G.; Sebasigari, R.; Riccieri, V.; et al. Neutrophils activate plasmacytoid dendritic cells by releasing self-DNA-peptide complexes in systemic lupus erythematosus. Sci. Transl. Med. 2011, 3, 73ra19. [Google Scholar] [CrossRef] [Scilit] [PubMed]
- Hakkim, A.; Furnrohr, B.G.; Amann, K.; Laube, B.; Abed, U.A.; Brinkmann, V.; Herrmann, M.; Voll, R.E.; Zychlinsky, A. Impairment of neutrophil extracellular trap degradation is associated with lupus nephritis. Proc. Natl. Acad. Sci. USA 2010, 107, 9813–9818. [Google Scholar] [CrossRef] [Scilit] [PubMed]
- Wei, Y.; Fu, W.; Liu, Y.; Zhen, R.; Deng, H.; Huang, S.; Li, S.; Peng, D. Interferon regulatory factor 1 mediates ROS-dependent release of NETs in LPS-induced mouse pneumonia by interacting with matrix metalloproteinase 9. Autoimmunity 2026, 59, 2701075. [Google Scholar] [CrossRef] [Scilit] [PubMed]
- Lood, C.; Blanco, L.P.; Purmalek, M.M.; Carmona-Rivera, C.; De Ravin, S.S.; Smith, C.K.; Malech, H.L.; Ledbetter, J.A.; Elkon, K.B.; Kaplan, M.J. Neutrophil extracellular traps enriched in oxidized mitochondrial DNA are interferogenic and contribute to lupus-like disease. Nat. Med. 2016, 22, 146–153. [Google Scholar] [CrossRef] [Scilit] [PubMed]
- Caielli, S.; Athale, S.; Domic, B.; Murat, E.; Chandra, M.; Banchereau, R.; Baisch, J.; Phelps, K.; Clayton, S.; Gong, M.; et al. Oxidized mitochondrial nucleoids released by neutrophils drive type I interferon production in human lupus. J. Exp. Med. 2016, 213, 697–713. [Google Scholar] [CrossRef] [Scilit] [PubMed]
- Fuchs, T.A.; Abed, U.; Goosmann, C.; Hurwitz, R.; Schulze, I.; Wahn, V.; Weinrauch, Y.; Brinkmann, V.; Zychlinsky, A. Novel cell death program leads to neutrophil extracellular traps. J. Cell Biol. 2007, 176, 231–241. [Google Scholar] [CrossRef] [Scilit] [PubMed]
- Wilkinson, C.; Henderson, R.B.; Jones-Leone, A.R.; Flint, S.M.; Lennon, M.; Levy, R.A.; Ji, B.; Bass, D.L.; Roth, D. The role of baseline BLyS levels and type 1 interferon-inducible gene signature status in determining belimumab response in systemic lupus erythematosus: A post hoc meta-analysis. Arthritis Res. Ther. 2020, 22, 102. [Google Scholar] [CrossRef] [Scilit] [PubMed]
- Garcia-Romo, G.S.; Caielli, S.; Vega, B.; Connolly, J.; Allantaz, F.; Xu, Z.; Punaro, M.; Baisch, J.; Guiducci, C.; Coffman, R.L.; et al. Netting neutrophils are major inducers of type I IFN production in pediatric systemic lupus erythematosus. Sci. Transl. Med. 2011, 3, 73ra20. [Google Scholar] [CrossRef] [Scilit] [PubMed]
- Zhou, W.; Cao, X.; Xu, Q.; Qu, J.; Sun, Y. The double-edged role of neutrophil heterogeneity in inflammatory diseases and cancers. MedComm (2020) 2023, 4, e325. [Google Scholar] [CrossRef] [Scilit] [PubMed]
- Aringer, M.; Costenbader, K.; Daikh, D.; Brinks, R.; Mosca, M.; Ramsey-Goldman, R.; Smolen, J.S.; Wofsy, D.; Boumpas, D.T.; Kamen, D.L.; et al. 2019 European League Against Rheumatism/American College of Rheumatology classification criteria for systemic lupus erythematosus. Ann. Rheum. Dis. 2019, 78, 1151–1159. [Google Scholar] [CrossRef] [Scilit] [PubMed]
- Bombardier, C.; Gladman, D.D.; Urowitz, M.B.; Caron, D.; Chang, C.H. Derivation of the SLEDAI. A disease activity index for lupus patients. The Committee on Prognosis Studies in SLE. Arthritis Rheum. 1992, 35, 630–640. [Google Scholar] [CrossRef] [Scilit] [PubMed]
- Song, Y.; Okazaki, R.; Yoshida, Y. Senescence-associated secretory phenotype and activation of NF-kappaB in splenocytes of old mice exposed to irradiation at a young age. Dev. Comp. Immunol. 2021, 122, 104124. [Google Scholar] [CrossRef] [Scilit] [PubMed]
- Zeng, Z.; Yoshida, Y.; Wang, D.; Fujii, Y.; Shen, M.; Mimura, T.; Tanaka, Y. Inflammatory Cytokines and Chemokines Are Synergistically Induced in a ROS-Dependent Manner by a Co-Culture of Corneal Epithelial Cells and Neutrophil-like Cells in the Presence of Particulate Matter. Antioxidants 2024, 13, 467. [Google Scholar] [CrossRef] [Scilit] [PubMed]
- Pers, J.O.; Daridon, C.; Devauchelle, V.; Jousse, S.; Saraux, A.; Jamin, C.; Youinou, P. BAFF overexpression is associated with autoantibody production in autoimmune diseases. Ann. N. Y. Acad. Sci. 2005, 1050, 34–39. [Google Scholar] [CrossRef] [Scilit] [PubMed]
- Shen, M.; Wang, D.; Sennari, Y.; Zeng, Z.; Baba, R.; Morimoto, H.; Kitamura, N.; Nakanishi, T.; Tsukada, J.; Ueno, M.; et al. Pentacyclic triterpenoid ursolic acid induces apoptosis with mitochondrial dysfunction in adult T-cell leukemia MT-4 cells to promote surrounding cell growth. Med. Oncol. 2022, 39, 118. [Google Scholar] [CrossRef] [Scilit] [PubMed]
- Wang, D.; Shen, M.; Kitamura, N.; Sennari, Y.; Morita, K.; Tsukada, J.; Kanazawa, T.; Yoshida, Y. Mitogen-activated protein kinases are involved in cucurbitacin D-induced antitumor effects on adult T-cell leukemia cells. Investig. New Drugs 2021, 39, 122–130. [Google Scholar] [CrossRef] [Scilit] [PubMed]
- Becatti, M.; Emmi, G.; Bettiol, A.; Mannucci, A.; Argento, F.R.; Fini, E.; Borghi, S.; Nencini, F.; Nicastro, M.; Mattioli, I.; et al. Reactive Oxygen Species-Induced Modifications of Fibrin Clots as a Link Between Immune Responses and Atherothrombosis in Systemic Lupus Erythematosus. Arthritis Rheumatol. 2026, 78, 344–356. [Google Scholar] [CrossRef] [Scilit] [PubMed]
- Lambeth, J.D. NOX enzymes and the biology of reactive oxygen. Nat. Rev. Immunol. 2004, 4, 181–189. [Google Scholar] [CrossRef] [Scilit] [PubMed]
- Rohrbach, A.S.; Slade, D.J.; Thompson, P.R.; Mowen, K.A. Activation of PAD4 in NET formation. Front. Immunol. 2012, 3, 360. [Google Scholar] [CrossRef] [Scilit] [PubMed]
- Hakkim, A.; Fuchs, T.A.; Martinez, N.E.; Hess, S.; Prinz, H.; Zychlinsky, A.; Waldmann, H. Activation of the Raf-MEK-ERK pathway is required for neutrophil extracellular trap formation. Nat. Chem. Biol. 2011, 7, 75–77. [Google Scholar] [CrossRef] [Scilit] [PubMed]
- Keshari, R.S.; Verma, A.; Barthwal, M.K.; Dikshit, M. Reactive oxygen species-induced activation of ERK and p38 MAPK mediates PMA-induced NETs release from human neutrophils. J. Cell Biochem. 2013, 114, 532–540. [Google Scholar] [CrossRef] [Scilit] [PubMed]
- Rawlings, D.J.; Metzler, G.; Wray-Dutra, M.; Jackson, S.W. Altered B cell signalling in autoimmunity. Nat. Rev. Immunol. 2017, 17, 421–436. [Google Scholar] [CrossRef] [Scilit] [PubMed]
- Vincent, F.B.; Morand, E.F.; Schneider, P.; Mackay, F. The BAFF/APRIL system in SLE pathogenesis. Nat. Rev. Rheumatol. 2014, 10, 365–373. [Google Scholar] [CrossRef] [Scilit] [PubMed]
- Crow, M.K. Type I interferon in the pathogenesis of lupus. J. Immunol. 2014, 192, 5459–5468. [Google Scholar] [CrossRef] [Scilit] [PubMed]
- Mockel, T.; Basta, F.; Weinmann-Menke, J.; Schwarting, A. B cell activating factor (BAFF): Structure, functions, autoimmunity and clinical implications in Systemic Lupus Erythematosus (SLE). Autoimmun. Rev. 2021, 20, 102736. [Google Scholar] [CrossRef] [Scilit] [PubMed]
- Giordano, D.; Kuley, R.; Draves, K.E.; Elkon, K.B.; Giltiay, N.V.; Clark, E.A. B cell-activating factor (BAFF) from dendritic cells, monocytes and neutrophils is required for B cell maturation and autoantibody production in SLE-like autoimmune disease. Front. Immunol. 2023, 14, 1050528. [Google Scholar] [CrossRef] [Scilit] [PubMed]
- Wang, T.; Vasconcellos, A.; Marken, J.; Skopelja-Gardner, S.; Lood, C.; Giltiay, N.V. Immune complex-driven neutrophil activation and BAFF release: A link to B cell responses in SLE. Lupus Sci. Med. 2022, 9, e000709. [Google Scholar] [CrossRef] [Scilit] [PubMed]
- Wang, D.; Zeng, Z.; Shen, M.; Okazaki, R.; Miyata, H.; Yonezawa, T.; Yoshida, Y. ATP Consumption Is Coupled with Endocytosis in Exudated Neutrophils. Int. J. Mol. Sci. 2023, 24, 9039. [Google Scholar] [CrossRef] [Scilit] [PubMed]
Disclaimer/Publisher’s Note: The statements, opinions and data contained in all publications are solely those of the individual author(s) and contributor(s) and not of MDPI and/or the editor(s). MDPI and/or the editor(s) disclaim responsibility for any injury to people or property resulting from any ideas, methods, instructions or products referred to in the content. |
© 2026 by the authors. Licensee MDPI, Basel, Switzerland. This article is an open access article distributed under the terms and conditions of the Creative Commons Attribution (CC BY) license.