


Abstract
Conifer needles are a renewable forestry biomass and a potential source of bioactive phenolic compounds. In this study, ultrasound-assisted extraction of polyphenols from Pinus banksiana needles was optimized, and the validated conditions were subsequently applied to six conifer species for comparative evaluation of phenolic composition, antioxidant capacity, and digestive enzyme inhibitory activity. Under the optimal conditions of 53% (v/v) ethanol, a liquid-to-solid ratio of 29 mL/g, 21 min, and 45 °C, the total phenolic content of P. banksiana reached 36.13 ± 0.89 mg GAE/g DW. Significant interspecific differences were observed in phenolic composition and bioactivity. Nine phenolic compounds were quantified by targeted HPLC-DAD analysis, with (+)-catechin being the most abundant among these analytes in all six extracts (1.523–9.974 mg/g DW). P. banksiana exhibited the strongest ABTS+ radical-scavenging activity (IC50 = 0.306 ± 0.010 mg/mL) and the strongest inhibition of both α-glucosidase (IC50 = 5.352 ± 0.113 μg/mL) and α-amylase (IC50 = 0.374 ± 0.003 mg/mL). Kinetic analysis suggested an apparent mixed-type inhibition pattern of α-glucosidase by P. banksiana extract, although a pure noncompetitive inhibition model could not be conclusively excluded. Mantel analysis revealed that (+)-catechin showed the strongest association with α-glucosidase inhibition, while molecular docking predicted favorable interactions of (+)-catechin with both human digestive enzyme models. These findings identify (+)-catechin as a potential contributor to α-glucosidase inhibition and highlight P. banksiana as a promising source of antioxidant phenolics with carbohydrate digestion-modulating potential.
1. Introduction
Conifer needles represent a significant category of forestry biomass that is constantly generated through the growth cycles and regeneration processes of coniferous species. Despite this continuous availability, comprehensive utilization remains constrained, with accumulated litterfall contributing to elevated forest fuel loads in certain pine ecosystems [1,2]. While currently employed in niche applications including herbal teas, beverage formulations, and food supplements, these resources exhibit substantial untapped potential for expanded industrial implementation [3]. Conifer needles are rich in secondary metabolites, particularly phenolic compounds such as flavonoids, phenolic acids, and proanthocyanidins, which exhibit antioxidant activity and inhibitory effects against carbohydrate-digesting enzymes [4,5,6]. Systematic characterization of phenolic profiles in conifer needles could therefore facilitate the identification of novel natural functional ingredients while advancing sustainable valorization strategies for forestry-derived biomass resources [7].
Phenolic compounds exhibit the capacity to inhibit free radical formation and attenuate lipid oxidation processes, with their efficacy being determined by factors including the quantity of phenolic hydroxyl groups, substituent characteristics, and molecular architecture [8]. Certain phenolic acids demonstrate the ability to interact with α-amylase and α-glucosidase enzymes in vitro through multiple mechanisms encompassing hydrogen bonding, hydrophobic interactions, π–π stacking phenomena, and salt bridge formation, consequently suppressing enzymatic activity and retarding starch digestion kinetics [9,10]. These findings suggest that botanical extracts enriched in phenolic constituents hold significant promise as natural antioxidants and functional food components with regulatory implications for carbohydrate metabolic processes [11]. Empirical evidence supports this potential, as demonstrated by phenolic-enriched cookie formulations incorporating diverse plant-derived extracts, which exhibited measurable antioxidant capacities alongside in vitro inhibitory activities against key digestive enzymes, thereby validating the feasibility of integrating plant polyphenols into functional food systems [12].
Conifer species exhibit variations in taxonomy, genetic profiles, and secondary metabolite production; consequently, phenolic compound accumulation and biological activities in needles demonstrate interspecific variation. A comprehensive analysis of fresh needles from 54 taxa encompassing 46 Pinus species revealed significant interspecific differences in antioxidant capacity, with the most potent activities observed in species-specific patterns dependent on the extraction solvent employed [13]. Quantitative assessments further demonstrated that total phenolic and flavonoid contents, along with individual phenolic profiles, in five Pinus species were modulated by both species identity and extraction methodology [14]. Previous studies have demonstrated substantial variation in phenolic composition and antioxidant activity among conifer species. However, the extent to which variations in individual phenolic constituents are associated with antioxidant and carbohydrate-digesting enzyme inhibitory activities has not been sufficiently examined within a unified comparative framework. The efficiency of phenolic recovery is critically influenced by extraction techniques and operational parameters, with variations in extraction protocols complicating cross-species comparisons. Ultrasound-assisted extraction (UAE) has emerged as a preferred technique for bioactive compound isolation due to its capacity to reduce extraction duration, minimize solvent requirements, and enhance extraction efficiency [15]. Standardizing optimized UAE protocols across multiple conifer species could mitigate methodological variability while improving the reliability of comparative analyses.
The biological activity of plant extracts may depend on both their total phenolic content and specific phenolic profiles. While quantitative metrics such as total phenolic content, total flavonoid content, and related indices provide insights into overall component levels, these parameters do not consistently correlate with observed bioactivities. Thus, identifying major active compounds based solely on total content measurements is insufficient [16]. Individual phenolic constituents demonstrate variable contributions to biological activity, necessitating investigations into extract efficacy relative to specific phenolic constituents [17]. Elucidating species-specific variations in phenolic composition and their correlations with antioxidant capacities and digestive enzyme inhibitory effects remains crucial for pinpointing bioactive compounds and assessing the functional potential of conifer needle resources.
Considering the variation in phenolic composition among conifer species, it is of interest to determine whether these compositional differences are associated with variations in antioxidant and digestive enzyme inhibitory activities. In particular, the extent to which individual phenolic constituents are associated with these activities, beyond the information provided by total phenolic indices, warrants further investigation. Building upon previous findings, Pinus banksiana needles exhibiting elevated total phenolic content and bioactivity during preliminary screening served as the raw material for optimizing the extraction process. UAE was employed with parameter optimization conducted through single-factor experiments combined with response surface methodology. The extraction conditions optimized for P. banksiana were subsequently applied to six conifer species, including Pinus banksiana, Pinus koraiensis, Abies holophylla, Thuja sutchuenensis, Pinus tabuliformis, and Pinus sylvestris, to facilitate interspecific comparisons under consistent experimental conditions. Total phenolic, flavonoid, and proanthocyanidin contents were determined, and nine individual phenolic compounds were identified and quantified using HPLC-DAD. Antioxidant activities and inhibitory effects against α-amylase and α-glucosidase were evaluated to determine whether differences in phenolic composition were associated with variations in these biological activities. Correlation analyses were further conducted to identify phenolic constituents potentially associated with the observed activities. Enzyme inhibition kinetics was used to assess the inhibition pattern of P. banksiana needle extract toward α-glucosidase, while molecular docking simulations explored potential interactions between selected phenolic compounds and human digestive enzyme models. By integrating standardized extraction procedures, targeted phenolic analysis, and biological activity evaluation, this study provides a systematic comparison of the recoverable phenolic constituents and in vitro bioactivities of six conifer species, while offering further insights into the associations between phenolic composition and digestive enzyme inhibition.
2. Materials and Methods
2.1. Materials and Reagents
Needle samples were collected from an experimental site at Jilin Agricultural University, Changchun, Jilin Province, China (43°48′27.5″ N, 125°24′49.6″ E; elevation 230–260 m). The collected materials comprised needles from six conifer species: P. koraiensis, P. tabuliformis, P. banksiana, A. holophylla, T. sutchuenensis, and P. sylvestris. The botanical identities of the six species were confirmed by Prof. Xiyang Zhao (Jilin Agricultural University, Changchun, China). For each species, needles were collected from three independent individual trees approximately 60–70 years old, with each tree serving as one biological replicate. One-year-old needles were collected from the middle portion of the crown, and only healthy needles without visible signs of disease, pest infestation, or mechanical damage were selected. Samples from each tree were separately processed throughout all subsequent experimental procedures. Needles from all six species were collected during the same period in June 2026. The collected needles were rinsed with distilled water to remove surface contaminants and dried in a ventilated oven at 45 °C for approximately 24–48 h until constant weight. The same drying procedure was applied to all six species to maintain consistent sample preparation conditions. Dried materials were ground into homogeneous fine powder and stored in sterile airtight glass containers at −20 °C in the dark to prevent oxidative degradation prior to analysis. Chromatographic standards, namely (+)-catechin (≥98%), gallic acid (≥98%), caffeic acid (≥98%), chlorogenic acid (≥98%), ferulic acid (≥98%), p-coumaric acid (≥98%), protocatechuic acid (≥98%), rutin (≥98%), and taxifolin (≥98%), were obtained from Shanghai Yuanye Bio-Technology Co., Ltd. (Shanghai, China). Reagents including p-nitrophenyl-α-D-glucopyranoside (pNPG), acarbose, and 3,5-dinitrosalicylic acid (DNS) were purchased from Shanghai Macklin Biochemical Co., Ltd. (Shanghai, China). α-Glucosidase (recombinant, from Saccharomyces cerevisiae, catalog No. A875218) was also obtained from Shanghai Macklin Biochemical Co., Ltd., whereas α-amylase (from porcine pancreas, catalog No. A8755) was purchased from Beijing Solarbio Science & Technology Co., Ltd. (Beijing, China). HPLC-grade acetonitrile, ABTS+, DPPH, Folin–Ciocalteu reagent, and vanillin were purchased from Aladdin Reagent (Shanghai) Co., Ltd. (Shanghai, China).
2.2. Preparation of Conifer Needle Extracts
Preliminary screening of the six conifer species was conducted under identical extraction conditions (60% ethanol, a liquid-to-solid ratio of 25 mL/g, 45 °C, and 20 min of ultrasonication). Total phenolic content (TPC), DPPH radical-scavenging activity, α-glucosidase inhibitory activity, and α-amylase inhibitory activity were evaluated. Based on its high TPC and strong inhibitory activities against both digestive enzymes in the preliminary screening (Table S8), P. banksiana was selected for subsequent extraction optimization. In brief, 1.0 g samples of dried needle powder were combined with ethanol–water solutions at the specified liquid-to-solid ratio (mL/g) in 50 mL polypropylene centrifuge tubes and processed via ultrasound-assisted extraction. Ultrasonication was performed using a bath-type ultrasonic cleaner (KQ-250DE, Kunshan Ultrasonic Instrument Co., Ltd., Kunshan, Jiangsu, China) operating at a fixed frequency of 40 kHz and a nominal ultrasonic power of 250 W. The mixtures underwent centrifugation at 10,000× g for 10 min, after which supernatants were stored at 4 °C in the dark until analysis. The collected supernatants were used directly for subsequent analyses after appropriate dilution, without drying or reconstitution. For each species, the three biological replicates derived from independent individual trees were extracted and analyzed separately. The optimized extraction parameters determined for P. banksiana were subsequently applied to all six species to enable comparative analysis.
2.3. Single-Factor Experiments and Response Surface Methodology Design
Single-factor experiments were performed to assess the influence of ethanol concentration (40–80%, v/v), liquid-to-solid ratio (10–30 mL/g), ultrasonication temperature (25–65 °C), and ultrasonication duration (10–30 min) on TPC of P. banksiana needle extracts. Each parameter was evaluated at five distinct levels while maintaining constant conditions for all other variables.
Based on these preliminary findings, selected factors were further optimized through response surface methodology. A three-factor, three-level Box–Behnken experimental design was established using Design-Expert software (version 8.0.5), with TPC designated as the response variable. The experimental data were analyzed using a second-order polynomial model, and the model’s statistical significance and adequacy were rigorously examined through analysis of variance. The theoretical optimal conditions derived from the model were experimentally validated through triplicate independent trials.
2.4. Determination of Total Phenolic, Flavonoid, and Proanthocyanidin Contents
TPC was quantified via the Folin–Ciocalteu assay with minor adaptations [18]. In a 96-well microplate, 20 μL aliquots of 10-fold diluted extracts or gallic acid standards were combined with 100 μL of Folin–Ciocalteu reagent. Following a 5 min reaction period, 80 μL of 10% Na2CO3 solution was introduced, and the mixture was incubated in darkness at ambient temperature for 30 min prior to absorbance measurement at 765 nm. TPC values were derived from a gallic acid calibration curve and expressed as milligrams of gallic acid equivalents per gram of dry weight (mg GAE/g DW).
Total flavonoid content (TFC) was determined using the NaNO2–Al(NO3)3–NaOH colorimetric method with slight modifications [19]. In 96-well plates, 20 μL aliquots of 10-fold diluted extracts or rutin standards were initially mixed with 60 μL of distilled water and 10 μL of 5% NaNO2 solution. After 6 min, 10 μL of 10% Al(NO3)3 solution was added, followed by 80 μL of 4% NaOH solution after an additional 6 min incubation. The final mixture was maintained at room temperature for 10 min before spectrophotometric analysis at 510 nm. TFC concentrations were calculated against a rutin standard curve and reported as milligrams of rutin equivalents per gram of dry weight (mg RE/g DW).
The total proanthocyanidin content (TPAC) was quantified through the vanillin–HCl colorimetric assay with minor modifications [20]. In this procedure, 50 μL aliquots of 10-fold diluted extracts or catechin standards were combined with 150 μL portions of freshly prepared vanillin-HCl reagent within 96-well microplate wells. The reaction mixture comprised equal volumes of 1% vanillin in methanol and 8% HCl in methanol (v/v). Following a 15–20 min incubation period under ambient conditions in the dark, absorbance measurements were recorded at 500 nm. Background correction was applied using corresponding vanillin-free blanks. Quantitative analysis was conducted by interpolation from a catechin reference curve, with results expressed as milligrams of catechin equivalents per gram of dry weight (mg CE/g DW). Triplicate analyses were executed using automated microplate spectrophotometry.
2.5. Determination of Antioxidant Activity
Extract concentrations were expressed as dry needle mass equivalents, and concentrations used for IC50 determination refer to those in the final assay mixtures.
2.5.1. DPPH Scavenging Activity
The DPPH radical scavenging activity of conifer needle extracts (CNEs) was evaluated through a 96-well microplate assay with minor modifications [21]. Specifically, 100 μL aliquots of diluted CNEs were combined with 100 μL of 0.1 mM DPPH ethanol solution in each well of a 96-well microplate. For the single-factor experiments, extracts obtained under different extraction conditions were adjusted to the same concentration of 1.25 mg dry needle equivalents/mL before mixing. After incubation in the dark at room temperature for 30 min, absorbance measurements were obtained at 517 nm using a microplate spectrophotometer. The experimental design incorporated ethanol as the negative control (replacing CNE) and an ethanol blank (substituting DPPH solution), with ascorbic acid serving as the reference standard for antioxidant activity. Radical scavenging efficacy was quantified according to the established formula:
where A0, A1, and A2 represent the absorbance of the control, reaction mixture, and sample blank, respectively. All measurements were performed in triplicate.
2.5.2. ABTS+ Scavenging Ability
The ABTS+ radical scavenging activity of CNEs was evaluated following a modified protocol [22]. An ABTS+ stock solution was prepared by combining 7.40 mM ABTS solution with 2.45 mM potassium persulfate solution, followed by incubation in darkness at ambient temperature for 14 h. Prior to analysis, the ABTS+ stock solution was diluted with absolute ethanol to achieve an absorbance of 0.70 ± 0.02 at 734 nm. Subsequently, 1 mL of appropriately diluted CNE sample was mixed with 3 mL of ABTS+ working solution. Following a 10 min incubation period in darkness at room temperature, absorbance measurements were recorded at 734 nm. Ascorbic acid served as the positive control. The ABTS+ radical scavenging capacity was quantified using the following equation:
where A0 is the absorbance of the ABTS+ working solution without CNE, A1 denotes the absorbance of the sample reaction mixture, and A2 is the absorbance of the CNE blank without ABTS+ working solution. All measurements were performed in triplicate.
2.5.3. Total Reducing Power Assay
The total reducing power (TRP) of CNEs was assessed using the potassium ferricyanide method with minor modifications [23]. In brief, 200 μL aliquots of extract at varying concentrations were combined with 200 μL of phosphate buffer (0.2 mol/L, pH 6.6) and 200 μL of 1% (w/v) potassium ferricyanide solution, followed by incubation at 50 °C for 20 min. The reaction was terminated through addition of 200 μL of 10% trichloroacetic acid, and subsequent centrifugation at 4000 rpm for 10 min yielded supernatant fractions. For colorimetric analysis, 100 μL of supernatant was reacted with 100 μL of distilled water and 20 μL of 0.1% ferric chloride solution. After a 10 min incubation at room temperature, absorbance was measured at 700 nm. Reducing power was evaluated based on the absorbance at 700 nm. At an extract concentration of 10 mg/mL, the absorbance values were converted into vitamin C equivalents (mg VCE/g DW) using an ascorbic acid calibration curve. All measurements were performed in triplicate, with higher absorbance values indicating greater reducing power.
2.6. Digestive Enzyme Inhibition Assays
The concentrations of CNEs were expressed as dry needle mass equivalents, calculated from the initial dry needle mass, extraction solvent volume, and subsequent dilution factors. All concentrations used for IC50 determination refer to the final concentrations in the enzyme reaction mixtures before the addition of reaction-terminating reagents.
2.6.1. α-Glucosidase Inhibitory Activity Assay
The α-glucosidase inhibitory activity of CNEs was evaluated using the p-nitrophenyl-α-D-glucopyranoside (pNPG) assay with minor modifications [24]. In brief, 80 μL aliquots of appropriately diluted CNE or acarbose solutions were combined with 20 μL α-glucosidase solution (2 U/mL in 0.1 mol/L phosphate-buffered saline, pH 6.8) in a 96-well microplate and preincubated at 37 °C for 10 min. Following this incubation period, 100 μL of 8 mmol/L pNPG substrate solution was introduced to initiate the enzymatic reaction, which proceeded at 37 °C for 20 min. The enzymatic reaction was quenched by adding 100 μL of 1 mol/L Na2CO3 solution, and the resulting yellow colorimetric product was quantified spectrophotometrically at 405 nm. Acarbose served as the positive control, and all experimental determinations were conducted in triplicate. The percentage inhibition was calculated according to the formula:
where A1, A2, A3, and A4 represent the absorbances of the sample, sample blank, control, and control blank, respectively. In the sample blank, the enzyme was replaced with buffer; in the control, the extract was replaced with buffer; and in the control blank, both were replaced with buffer.
2.6.2. α-Amylase Inhibitory Activity Assay
The α-amylase inhibitory activity of CNEs was evaluated using the DNS colorimetric method with modifications [25]. Briefly, 100 μL aliquots of appropriately diluted CNE or acarbose solutions were mixed with 100 μL of α-amylase solution (1 U/mL) prepared in 0.1 mol/L phosphate buffer (pH 6.8), followed by preincubation at 30 °C for 30 min. Subsequently, 100 μL of 1% soluble starch solution was introduced, and the mixture underwent a 10 min incubation at 37 °C. The enzymatic reaction was terminated through the addition of 100 μL of DNS reagent, followed by dilution with 3.6 mL of distilled water and thermal development at 95 °C for 10 min. After cooling to ambient temperature, the absorbance was spectrophotometrically measured at 540 nm. Acarbose served as the positive control, with all experimental determinations conducted in triplicate. Inhibition percentage was calculated according to the formula:
where A1, A2, A3, and A4 represent the absorbances of the sample, sample blank, control, and control blank, respectively. The blank and control groups were prepared as described in Section 2.6.1, with all other procedures, including DNS color development, kept unchanged.
2.6.3. α-Glucosidase Inhibition Kinetics
The inhibition kinetics of α-glucosidase by the optimized P. banksiana extracts were evaluated following minor modifications to the standard protocol. Enzymatic reactions were conducted according to Section 2.6.1 methodology, with the exception of varying pNPG concentrations (0.5, 1, 2 and 4 mmol/L) employed as substrate across experimental conditions. Enzyme activity measurements were performed in the presence of escalating extract concentrations, with reaction rates determined spectrophotometrically at 405 nm absorbance readings. Kinetic parameters including maximum reaction velocity (Vmax), Michaelis–Menten constant (Km), competitive inhibition constant (Ki), and uncompetitive inhibition constant (Ku) were derived from the double-reciprocal plots through linear regression analysis:
where V is the reaction rate, [S] is the substrate concentration, [I] is the inhibitor concentration, Km is the Michaelis–Menten constant, Vmax is the maximum reaction rate, Ki is the competitive inhibition constant, and Ku is the uncompetitive inhibition constant. To further evaluate the inhibition pattern, nonlinear regression analysis was performed using the untransformed kinetic data. Competitive, uncompetitive, pure noncompetitive, and mixed-inhibition models were fitted by unweighted nonlinear least squares using R software (version 4.5.2). Model performance was compared using the coefficient of determination (R2) and the corrected Akaike information criterion (AICc).
2.7. HPLC Analysis of Selected Phenolic Compounds
Nine phenolic compounds, including phenolic acids and flavonoids, were selected for targeted HPLC-DAD analysis based on their reported occurrence in conifer-derived materials and the availability of authentic standards. Selected phenolic compounds in CNEs were identified and quantified by HPLC-DAD according to a modified method [26]. Chromatographic separation was conducted on a Hitachi Chromaster HPLC system fitted with a diode array detector and a C18 column (250 mm × 4.6 mm, 5 μm) maintained at 25 °C. The binary mobile phase comprised 0.1% phosphoric acid in water (A) and acetonitrile (B), delivered under the following gradient program: 0–3 min, 5% B; 3–10 min, linear increase to 15% B; 10–18 min, gradual rise to 25% B; 18–25 min, a progressive increase to 40% B; 25–35 min, a linear decrease from 40% to 5% B. Operating parameters included a constant flow rate of 0.8 mL/min and an injection volume of 10 μL. Prior to analysis, both standards and CNEs underwent filtration through 0.22 μm membrane filters. Detection wavelengths were specifically optimized for different compound classes: gallic acid, (+)-catechin, protocatechuic acid, and taxifolin were monitored at 280 nm; caffeic acid, chlorogenic acid, ferulic acid, and p-coumaric acid at 320 nm; and rutin at 360 nm. Compound identification was achieved through comparative analysis of retention times and UV spectral data against authentic references, while quantification relied on external calibration curves established by correlating peak areas with corresponding standard concentrations. The content of each phenolic compound was calculated as X = C × V × D/(1000 × m), where X is the compound content (mg/g DW), C is the concentration determined from the calibration curve (μg/mL), V is the extraction solvent volume used for calculation (mL), D is the dilution factor, and m is the initial dry needle mass (g). Representative HPLC chromatograms of the authentic phenolic standards at the corresponding detection wavelengths are shown in Figure S3. Calibration curves were constructed by plotting peak area (Y) against the concentration of each authentic standard (X). The retention time, detection wavelength, calibration range, regression equation, limit of detection (LOD), limit of quantification (LOQ), and coefficient of determination (R2) for each analyte are summarized in Table S5. All nine target compounds showed good linearity within their respective calibration ranges, with R2 values greater than 0.999. The precision and recovery of the HPLC-DAD method were evaluated using spike-recovery experiments with P. banksiana needle extract as the representative sample matrix. Nine phenolic standards were added at three concentration levels (20, 40, and 80 μg/mL), with three replicate determinations performed at each level. Precision was expressed as the relative standard deviation (RSD) of the measured amounts. Recovery was calculated as follows:
2.8. Molecular Docking
Molecular docking simulations were conducted to explore potential interactions between eight selected phenolic compounds and human digestive enzyme targets. The analyzed ligands comprised (+)-catechin, caffeic acid, chlorogenic acid, ferulic acid, p-coumaric acid, protocatechuic acid, rutin, and taxifolin. The crystal structures of the N-terminal catalytic subunit of human intestinal maltase-glucoamylase (NtMGAM; PDB ID: 2QMJ) and human pancreatic α-amylase (PDB ID: 1B2Y) were retrieved from the Protein Data Bank. Preprocessing of protein structures involved removal of water molecules and native ligands, followed by addition of polar hydrogen atoms and assignment of Gasteiger charges using AutoDockTools software (version 1.5.7). Ligand molecular structures obtained from the PubChem database underwent energy minimization and subsequent conversion to PDBQT format. Docking calculations were executed with AutoDock Vina, wherein all ligands were docked into the acarbose-binding pocket of each enzyme using identical grid box parameters. Grid centers were defined at coordinates x = −20.838, y = −6.550, and z = −5.003 for α-glucosidase and x = 18.872, y = 5.784, and z = 46.974 for α-amylase. Uniform grid dimensions of 22.5 × 22.5 × 22.5 Å were applied for both α-glucosidase (PDB ID: 2QMJ) and α-amylase (PDB ID: 1B2Y). Computational parameters included an exhaustiveness value of 16, up to 20 binding modes, and an energy range of 5 kcal/mol. The docking protocol was validated by re-docking the co-crystallized inhibitor, and RMSD values < 2.0 Å were considered acceptable (Figure S2). The lowest-energy binding poses were selected for structural analysis and visualized using PyMOL (version 3.1.7.2) and Discovery Studio Visualizer (version 2021) software platforms.
2.9. Statistical Analysis
All statistical analyses were based on three independent biological replicates (n = 3) for each species, with each biological replicate derived from a different individual tree. Data are presented as mean ± standard deviation (SD). The experimental design, model fitting, and analysis of variance for response surface methodology (RSM) were conducted using Design-Expert 8.0.5 software (Stat-Ease Inc., Minneapolis, MN, USA). Statistical comparisons among different samples were analyzed with SPSS 20.0 software (IBM Corp., Armonk, NY, USA). One-way ANOVA with Duncan’s multiple range test was used for multiple comparisons. Differences were considered significant at p < 0.05. Principal component analysis (PCA), Pearson correlation analysis, and Mantel tests were performed using the 18 independent biological samples (six species × three individual trees per species) in R (version 4.5.2). Before PCA, variables were mean-centered and scaled to unit variance. Non-detected phenolic compounds were assigned a value of zero for PCA, Pearson correlation, and Mantel analyses. Gallic acid was excluded from these analyses because it was detected only in T. sutchuenensis. Figures were prepared using Origin 2024.
3. Results
3.1. Optimization of Polyphenol Extraction from P. banksiana Needles
3.1.1. Results of the Single-Factor Experiments
The effects of ultrasonication duration, temperature, liquid-to-solid ratio (mL/g), and ethanol concentration on the TPC and DPPH radical scavenging activity of P. banksiana needle extracts are presented in Figure 1. Both TPC and DPPH radical scavenging activity exhibited an increasing trend with prolonged ultrasonication duration (10–20 min), peaking at 20 min with values of 34.84 ± 0.74 mg GAE/g DW and 76.62 ± 0.70%, respectively, followed by a decline upon further extension of extraction time (Figure 1A). Regarding temperature variation, TPC initially increased from 25 to 45 °C (reaching 35.39 ± 0.68 mg GAE/g DW), maintained relative stability at 55 °C, and subsequently declined markedly at 65 °C. In contrast, DPPH radical scavenging activity demonstrated minimal temperature dependence, achieving maximum activity around 45 °C (Figure 1B).
Figure 1.
Effects of different extraction conditions on the TPC and DPPH radical-scavenging activity of P. banksiana needle extracts. (A) Ultrasonication time; (B) ultrasonication temperature; (C) liquid-to-solid ratio; and (D) ethanol concentration. Unless otherwise varied, extraction conditions were maintained at 60% (v/v) ethanol, a liquid-to-solid ratio of 25 mL/g, an ultrasonication temperature of 45 °C, and an ultrasonication time of 20 min. For DPPH measurements, extracts were adjusted to 1.25 mg dry needle equivalents/mL before mixing with an equal volume of 0.1 mM DPPH solution, corresponding to a final extract concentration of 0.625 mg/mL. Data are presented as mean ± SD (n = 3 independent extractions).
The liquid-to-solid ratio demonstrated significant influence on extraction efficiency, with increasing ratios from 10 to 25 resulting in elevated TPC (35.00 ± 0.15 mg GAE/g DW) and DPPH radical scavenging activity (76.78 ± 0.64%). However, these parameters exhibited slight reductions at a 1:30 ratio (Figure 1C). Ethanol concentration similarly exerted pronounced effects, as evidenced by progressive enhancement of TPC and DPPH radical scavenging activity when escalating ethanol concentration from 40% to 60%. Optimal extraction performance was achieved at 60% ethanol concentration, yielding peak values of 36.10 ± 0.51 mg GAE/g DW for TPC and 76.23 ± 1.25% for DPPH radical scavenging activity, followed by subsequent decline at higher ethanol concentrations (Figure 1D).
3.1.2. Results of the Response Surface Analysis
Based on the single-factor experiments, ethanol concentration, ultrasonication time, and liquid-to-solid ratio were selected for RSM optimization, with TPC as the response variable. The ultrasonication temperature was fixed at 45 °C. The selected factors and their levels are listed in Table S1.
A Box–Behnken experimental design was implemented to systematically optimize the ultrasound-assisted extraction conditions for polyphenol recovery from P. banksiana needles. The factorial arrangement comprised 17 experimental trials, with corresponding TPC measurements detailed in Table S2. Experimental data were subsequently analyzed, leading to the development of a second-order polynomial regression model. The derived quadratic polynomial regression equation, formulated in terms of coded independent variables, is presented as follows:
where Y is TPC, A is ethanol concentration, B is solid–liquid ratio, and C is ultrasonication time.
Y = 36.158 − 0.9875A + 0.61875B + 0.33125C − 0.255AB − 0.47AC − 0.0825BC − 1.00525A2 − 0.49275B2 − 1.01275C2
As shown in Table S3, analysis of variance (ANOVA) was employed to evaluate the statistical significance and adequacy of the response surface quadratic regression model. The model demonstrated high significance with an F-value of 38.39 (p < 0.0001), effectively characterizing the combined effects of ethanol concentration, liquid-to-solid ratio, and ultrasonication time on the TPC of P. banksiana needle extracts. The model’s coefficient of determination, R2, reached 0.9801, while the adjusted coefficient of determination (adjusted R2) was 0.9546. The predicted coefficient of determination (predicted R2) was 0.8623, with their difference remaining below 0.2. The lack-of-fit test yielded non-significant results (F = 0.7903, p = 0.5592). Additionally, the minimal coefficient of variation (C.V. = 0.7458%) confirmed excellent experimental reproducibility and high data reliability.
A comprehensive analysis of the effects of various factors on the TPC of P. banksiana needle extract demonstrates that the ethanol concentration exerts the most pronounced influence (p < 0.0001), followed by the liquid-to-solid ratio (p = 0.0003) and ultrasonication time (p = 0.0088). All three parameters exhibit statistically significant effects on TPC. To better visualize the interactive effects among these variables, response surface methodology was employed to construct three-dimensional response surfaces and corresponding contour plots presented in Figure 2. The response surface plot in Figure 2A, which examines the combined effects of ethanol concentration and liquid-to-solid ratio at a constant ultrasonication time, displays minimal curvature with nearly circular contour lines, suggesting a non-significant interaction between these two factors (p = 0.0915). In contrast, Figure 2B illustrates the interaction between ethanol concentration and ultrasonication time under fixed liquid-to-solid ratio, revealing distinct surface curvature and contour patterns that indicate a significant interactive effect (p = 0.0087). The third response surface shown in Figure 2C evaluates the relationship between liquid-to-solid ratio and ultrasonication time at constant ethanol concentration, where the relatively flat surface topography and circular contour lines corroborate the absence of significant interaction between these variables, as confirmed by the non-significant BC interaction term in the analysis of variance (p = 0.5472).
Figure 2.
Response surface and contour plots for optimizing total phenolic extraction from P. banksiana needles. (A) Effects of ethanol concentration and liquid-to-solid ratio at a fixed ultrasonication time of 20 min; (B) effects of ethanol concentration and ultrasonication time at a fixed liquid-to-solid ratio of 25 mL/g; and (C) effects of liquid-to-solid ratio and ultrasonication time at a fixed ethanol concentration of 60% (v/v). The number “5” adjacent to the central design point indicates five replicated center-point runs in the Box–Behnken design. The extraction temperature was maintained at 45 °C throughout the experiments. The coded factor levels and corresponding experimental values are provided in Table S1.
3.1.3. Verification of the Model
To validate the precision and dependability of the optimal parameters predicted by response surface methodology (RSM), verification experiments were performed. The RSM-predicted optimal extraction conditions comprised an ethanol concentration of 53.49%, a liquid-to-solid ratio of 28.62 mL/g, and an ultrasonication time of 21.34 min, with a corresponding predicted TPC of 36.77 mg GAE/g DW. For practical implementation, these parameters were adjusted to an ethanol concentration of 53%, a liquid-to-solid ratio of 29 mL/g, and an ultrasonication time of 21 min. Three independent replicates under these modified conditions yielded a mean TPC value of 36.13 ± 0.89 mg GAE/g DW. The minimal discrepancy between the experimental and predicted values confirmed that the model was valid and reliable. These optimized extraction parameters were subsequently applied to additional conifer needle samples to evaluate comparative phenolic profiles and bioactive properties under standardized processing conditions.
3.2. Total Phenolic, Flavonoid, and Proanthocyanidin Contents of Six CNEs
The TPC, TFC, and TPAC of each sample were determined, with results presented in Figure 3. As illustrated in Figure 3A, P. banksiana exhibited the highest TPC value at 36.06 ± 0.52 mg GAE/g DW, followed by P. sylvestris. No significant difference was observed between these two species (p > 0.05), while both demonstrated significantly higher TPC levels compared to the remaining species. A. holophylla exhibited the lowest TPC (21.63 ± 0.95 mg GAE/g DW). Regarding TFC (Figure 3B), P. koraiensis displayed the maximum value of 36.95 ± 2.85 mg RE/g DW, which was significantly superior to all other species (p < 0.05). Conversely, A. holophylla recorded the minimum TFC level at 14.00 ± 1.07 mg RE/g DW, confirming substantial interspecific variation in flavonoid content among the six conifer needle extracts. In terms of TPAC (Figure 3C), P. banksiana achieved the peak value of 72.36 ± 1.75 mg CE/g DW, markedly exceeding all other species. A. holophylla exhibited the lowest TPAC concentration at 10.75 ± 0.38 mg CE/g DW. Comparative analysis revealed that P. banksiana possessed elevated TPC and TPAC levels, whereas P. koraiensis demonstrated predominant TFC characteristics.
Figure 3.
Phenolic contents and antioxidant activities of six conifer needle extracts. (A) Total phenolic content (TPC, mg GAE/g DW); (B) total flavonoid content (TFC, mg RE/g DW); (C) total proanthocyanidin content (TPAC, mg CE/g DW); (D) ABTS+ radical-scavenging activity; (E) DPPH radical-scavenging activity; and (F) total reducing power, measured as absorbance at 700 nm. GAE, gallic acid equivalents; RE, rutin equivalents; CE, catechin equivalents; DW, dry needle weight. TPC, TFC, and TPAC were determined using different reference standards. The vanillin–HCl assay used for TPAC also responds to monomeric catechins. Ascorbic acid served as the positive control in the ABTS+ and DPPH assays. Data are presented as mean ± SD (n = 3). Different lowercase letters indicate significant differences among species (p < 0.05). At an extract concentration of 10 mg/mL, total reducing power was additionally expressed as vitamin C equivalents (mg VCE/g DW), as reported in Table S4.
3.3. HPLC Analysis of Phenolic Compounds in Six Conifer Needle Extracts
Significant variations in phenolic composition and concentration were noted across the six species (Table 1). Protocatechuic acid, caffeic acid, ferulic acid, (+)-catechin, and taxifolin were consistently identified in all needle extracts. Among the nine quantified phenolic compounds, (+)-catechin was the most abundant in all six conifer needle extracts, with concentrations ranging from 1.523 to 9.974 mg/g DW. Chlorogenic acid was detected in five species but not in T. sutchuenensis. p-Coumaric acid was detected only in P. banksiana, A. holophylla, P. tabuliformis, and P. sylvestris. Rutin was detected only in P. banksiana, A. holophylla, and T. sutchuenensis, whereas gallic acid was detected exclusively in T. sutchuenensis.
Table 1.
Contents of nine target phenolic compounds in six conifer needle extracts.
P. banksiana exhibited the highest (+)-catechin concentration at 9.974 ± 0.314 mg/g DW, significantly exceeding those of other species (p < 0.05), followed by P. tabuliformis with 7.934 ± 0.431 mg/g DW. T. sutchuenensis demonstrated a distinct flavonoid profile, containing the highest taxifolin (0.986 ± 0.031 mg/g DW) and rutin (0.584 ± 0.010 mg/g DW) concentrations among the six species. Notably, gallic acid was exclusively detected in T. sutchuenensis, which also displayed the maximum ferulic acid content level (0.393 ± 0.013 mg/g DW). P. tabuliformis showed the highest protocatechuic acid content (2.519 ± 0.033 mg/g DW), significantly surpassing other species (p < 0.05). A. holophylla contained the greatest concentrations of chlorogenic acid, caffeic acid, and p-coumaric acid, at 0.3860 ± 0.0085, 0.2642 ± 0.0018, and 0.05295 ± 0.00054 mg/g DW, respectively. These findings reveal pronounced species-specific variations in phenolic composition: P. banksiana and P. tabuliformis were characterized by elevated (+)-catechin levels; T. sutchuenensis had the highest taxifolin and rutin contents; P. tabuliformis had the highest protocatechuic acid content; and A. holophylla demonstrated the highest chlorogenic acid, caffeic acid, and p-coumaric acid contents. The relatively large variation in taxifolin concentrations observed in P. banksiana and P. koraiensis may reflect differences among individual trees, as the reported standard deviations were based on three independent biological replicates.
3.4. Antioxidant Activity
The results are summarized in Table S4 and Figure 3. The ABTS+ and DPPH radical scavenging activities of all six CNEs demonstrated concentration-dependent trends, increasing progressively before reaching saturation at elevated concentrations. In the ABTS+ scavenging assay, P. banksiana exhibited the strongest activity, with the lowest IC50 value of 0.306 ± 0.01 mg/mL, followed by T. sutchuenensis (0.316 ± 0.017 mg/mL). In contrast, A. holophylla showed the weakest activity, with the highest IC50 value of 1.317 ± 0.083 mg/mL. For DPPH radical scavenging capacity, P. sylvestris displayed superior activity with an IC50 of 0.319 ± 0.031 mg/mL, indicating the strongest DPPH radical scavenging activity; P. banksiana ranked second, with an IC50 of 0.407 ± 0.018 mg/mL; A. holophylla had the highest IC50 value, at 0.868 ± 0.064 mg/mL. Total reducing power increased with extract concentration, as reflected by the absorbance at 700 nm (Figure 3F). At an extract concentration of 10 mg/mL, the reducing power was further expressed as vitamin C equivalents using the ascorbic acid calibration curve, with P. banksiana showing the highest value (18.430 ± 0.980 mg VCE/g DW) and A. holophylla the lowest (5.790 ± 0.910 mg VCE/g DW) (Table S4). Overall, P. banksiana exhibited the strongest ABTS+ radical-scavenging activity and total reducing power, whereas P. sylvestris showed the strongest DPPH radical-scavenging activity. A. holophylla exhibited the weakest activity across all three antioxidant assays.
3.5. Inhibitory Effects of Six CNEs on α-Glucosidase and α-Amylase
The six CNEs demonstrated concentration-dependent inhibitory effects on both α-glucosidase and α-amylase activities, with significant interspecies variations (Figure 4A,B and Figure S1). The IC50 values against α-glucosidase ranged from 5.352 to 33.973 μg/mL for the six CNEs, while those against α-amylase ranged from 0.374 to 0.719 mg/mL. Regarding α-glucosidase inhibition, P. banksiana exhibited the most potent activity with an IC50 value of 5.352 ± 0.113 μg/mL, followed by P. tabuliformis, P. koraiensis, P. sylvestris, T. sutchuenensis, and A. holophylla in descending order of potency (Figure 4A). For α-amylase inhibition, P. banksiana also showed the strongest inhibitory effect with the lowest IC50 value of 0.374 ± 0.003 mg/mL, followed by P. sylvestris and P. tabuliformis (Figure 4B). In contrast, A. holophylla displayed the weakest inhibition with the highest IC50 value of 0.719 ± 0.017 mg/mL. Based on these findings, P. banksiana needle extract was selected for subsequent kinetic analysis of α-glucosidase inhibition.
Figure 4.
Inhibitory effects of six CNEs on carbohydrate hydrolases and kinetic analysis of α-glucosidase inhibition by P. banksiana extract. Concentration-dependent inhibition of α-glucosidase (A) and α-amylase (B) by the six CNEs, with acarbose as the positive control. Lineweaver–Burk double-reciprocal plot for α-glucosidase inhibition by P. banksiana extract (C), along with secondary plots of 1/Vmax (D) and slope (E) versus inhibitor concentration. Data are expressed as the mean ± standard deviation (n = 3). Extract concentrations are expressed as dry needle mass equivalents in the final enzyme reaction mixtures.
3.6. Kinetic Analysis of α-Glucosidase Inhibition by P. banksiana Needle Extract
To further elucidate the inhibitory mechanism of P. banksiana needle extract on α-glucosidase, the Lineweaver–Burk double-reciprocal plot analysis was employed to characterize enzymatic kinetics across varying extract concentrations, as presented in Figure 4C. Within the concentration range of 0–20 μg/mL, progressive alterations in kinetic parameters were observed: both the slopes and y-intercepts of the double-reciprocal plots exhibited concentration-dependent increases, with multiple fitted lines converging leftward of the y-axis. These findings suggest that the extract decreases the maximum reaction velocity (Vmax) while altering the Michaelis constant (Km), consistent with an apparent mixed-type inhibition pattern. Secondary plots constructed by correlating Lineweaver–Burk slopes and reciprocal Vmax values with extract concentration yielded linear fittings (Figure 4D,E). Based on the secondary plots, the apparent competitive inhibition constant (Ki) for P. banksiana needle extract was determined as 22.39 μg/mL (Figure 4E), while the apparent uncompetitive inhibition constant (Ku) was 18.64 μg/mL (Figure 4D). To further assess the inhibition pattern, nonlinear regression analysis was performed using the untransformed reaction rate data (Figure S4 and Table S6). Among the four inhibition models evaluated, the mixed-inhibition model showed the highest R2 (0.9991) and the lowest AICc (−268.52), with estimated Ki and Ku values of 22.18 and 17.09 μg/mL, respectively. Although the mixed model provided a better fit than the pure noncompetitive model (ΔAICc = 2.85), the difference was modest. These results favored an apparent mixed-type inhibition pattern of the P. banksiana needle extract, although the pure noncompetitive model could not be conclusively excluded.
3.7. Multivariate Analysis and Correlations Between Phenolic Components and Bioactivities
3.7.1. Principal Component Analysis
This study conducted principal component analysis (PCA) on total phenolic indices, target phenolic compounds, and bioactivity indicators to compare overall differences among six CNEs and preliminarily analyze co-variation patterns between phenolic indicators and bioactivity variables. To enable positive interpretation of bioactivity indicators, DPPH and ABTS+ radical scavenging activities as well as α-glucosidase and α-amylase inhibitory activities were expressed as 1/IC50 values, where higher numerical values represent stronger corresponding biological activities. The PCA score plot demonstrated that the first principal component accounted for 42.3% of the total variance, while the second principal component explained 28.2%, resulting in a cumulative variance contribution of 70.5% (Figure 5A). T. sutchuenensis and A. holophylla samples were predominantly distributed in the positive region of PC1 with differentiation along the PC2 axis, whereas P. banksiana, P. sylvestris, P. koraiensis, and P. tabuliformis clustered together in the negative region of PC1. Key parameters including TPC, TFC, TPAC, TRP, α-glucosidase and α-amylase inhibitory activities exhibited consistent variation trends as indicated by their concentration in the negative region of PC1 (Figure 5B). DPPH and ABTS+ radical scavenging activities occupied the second quadrant, with ABTS+ activity showing loading direction proximity to TPAC. Among individual phenolic compounds, ferulic acid, (+)-catechin, taxifolin, and rutin displayed preferential distribution in the positive PC1 region, while chlorogenic acid, caffeic acid, and p-coumaric acid localized primarily in the fourth quadrant, demonstrating differential contributions of specific phenolic components to sample separation across the six conifer species.
Figure 5.
PCA and correlation analyses of needle extracts from six conifer species. (A) PCA score plot; (B) PCA loading plot; (C) Pearson correlation matrix and Mantel test. Red and blue indicate positive and negative correlations, respectively. *, **, and *** indicate p < 0.05, p < 0.01, and p < 0.001, respectively. Mantel line color and thickness represent statistical significance and correlation strength, respectively. DPPH, ABTS+, α-glucosidase, and α-amylase activities were expressed as 1/IC50. Only significant Mantel associations (p < 0.05) are displayed, all of which have positive Mantel r values.
3.7.2. Pearson Correlation Analysis and Mantel Test
To further evaluate the relationships between phenolic components and bioactivities in the six CNEs, Pearson correlation analysis was employed to assess correlations between total phenolic indices and major individual phenolic compounds, while the Mantel test was applied to analyze associations between phenolic composition and antioxidant/digestive enzyme inhibitory activities (Figure 5C). TPC demonstrated significant positive correlations with TFC (r = 0.732, p < 0.001) and TPAC (r = 0.657, p < 0.01), with TFC and TPAC also exhibiting a strong positive correlation (r = 0.728, p < 0.001). Among dominant individual phenolic acids, chlorogenic acid showed a highly significant positive correlation with caffeic acid (r = 0.941, p < 0.001). The compound pair of (+)-catechin and TPAC, along with taxifolin and rutin, demonstrated relatively strong positive correlations (r = 0.651 and 0.856, with p < 0.01 and p < 0.001, respectively). Conversely, TPC exhibited a significant negative correlation with taxifolin (r = −0.793, p < 0.001), while TPAC displayed significant negative correlations with both caffeic acid and chlorogenic acid.
Mantel analysis revealed significant associations between the dissimilarity patterns of bioactivities and phenolic variables across the samples. DPPH radical-scavenging activity showed a significant Mantel association with TPC (r = 0.250, p = 0.007). For ABTS+ radical-scavenging activity, the strongest association was observed with chlorogenic acid (r = 0.473, p = 0.001), followed by significant associations with TPAC, caffeic acid, protocatechuic acid, TPC, rutin, and ferulic acid. Total reducing power showed the strongest association with TPC (r = 0.759, p = 0.001), followed by taxifolin (r = 0.643, p = 0.001), TFC, TPAC, chlorogenic acid, and rutin. For α-glucosidase inhibitory activity, the strongest association was observed with (+)-catechin (r = 0.810, p = 0.001), with additional significant associations involving TPAC, chlorogenic acid, caffeic acid, TPC, and taxifolin. α-Amylase inhibitory activity showed the strongest association with TPC (r = 0.467, p = 0.006), followed by (+)-catechin (r = 0.452, p = 0.003), p-coumaric acid, taxifolin, and rutin. These Mantel associations reflect similarities in sample dissimilarity patterns rather than direct compound–activity relationships.
3.8. Molecular Docking of Selected Phenolic Compounds with α-Glucosidase and α-Amylase
To explore potential interactions between selected conifer needle phenolics and human digestive enzyme structures, eight target compounds from the HPLC analysis were docked against human NtMGAM (PDB ID: 2QMJ) and human pancreatic α-amylase (PDB ID: 1B2Y). The docking analysis revealed binding energies ranging from −9.3 to −5.9 kcal/mol for 2QMJ and from −9.3 to −5.7 kcal/mol for 1B2Y (Table 2). Rutin showed the most favorable predicted docking scores for both enzyme models (−9.3 kcal/mol), followed by taxifolin (−9.1 kcal/mol) for human pancreatic α-amylase, while (+)-catechin exhibited predicted docking scores of −7.6 and −8.9 kcal/mol against human NtMGAM and pancreatic α-amylase, respectively. Chlorogenic acid also displayed favorable interactions with binding energies of −7.6 and −8.0 kcal/mol for α-glucosidase and α-amylase, respectively. Four representative ligand–enzyme complexes were selected to characterize the predicted binding modes: rutin and (+)-catechin complexes with α-glucosidase, and rutin and taxifolin complexes with α-amylase (Figure 6). In the rutin–1B2Y complex, rutin occupied the α-amylase active site, forming hydrogen bonds with GLU233, LYS200, HIS201, HIS305, THR163, and GLN63 (Figure 6A), accompanied by π-σ or π-alkyl interactions with ILE235, ALA307, and GLY306. In the (+)-catechin–2QMJ complex, (+)-catechin formed hydrogen bonds with ASP542, ARG526, and GLN603 (Figure 6B). The ligand also formed predicted π-π T-shaped interactions with TYR299 and TRP406, as well as a π-alkyl interaction with PHE575. Taxifolin was located within the α-amylase binding site and formed conventional hydrogen bonds with GLN63, GLU233, and ASP197 (Figure 6C). Its aromatic ring formed a π–π stacking interaction with TRP59 and a π–anion interaction with ASP300. In the rutin-2QMJ complex, rutin formed multiple hydrogen bonds with ASP542, THR205, TRP406, ASP443, ASP327, ARG526, and ASP203 (Figure 6D). In addition, π-alkyl or hydrophobic interactions were observed with TRP441, TRP539, MET444, and HIS600.
Table 2.
Molecular docking binding energies of selected phenolic compounds against α-glucosidase and α-amylase.
Figure 6.
Molecular interactions between representative phenolic compounds and α-amylase and α-glucosidase. (A) Rutin–α-amylase; (B) (+)-catechin–α-glucosidase; (C) taxifolin–α-amylase; (D) rutin-α-glucosidase. Each subfigure sequentially shows the overall binding conformation, a close-up of the binding pocket, and a two-dimensional interaction diagram.
4. Discussion
4.1. Optimization and Validation of Ultrasound-Assisted Extraction Conditions for Polyphenols from P. banksiana Needles
Under optimal conditions, this method can simultaneously shorten extraction time and reduce solvent consumption while enhancing polyphenol extraction efficiency and maintaining their bioactive properties [27,28,29], thereby explaining its widespread application in plant polyphenol extraction. The single-factor experimental results demonstrated that ethanol concentration, liquid-to-solid ratio, and ultrasonication time all had significant influences on polyphenol extraction from P. banksiana needles, with ethanol concentration exhibiting the most pronounced effect. Both TPC values and DPPH radical scavenging activity initially increased before declining with elevated ethanol concentrations, a pattern consistent with the observations from ultrasound-assisted extraction in P. elliottii needles. An appropriate ethanol–water ratio facilitates plant tissue swelling and phenolic compound dissolution, promoting solvent penetration and polyphenol diffusion; however, excessive ethanol proportions alter solvent polarity and solubility parameters, which may hinder the release of weakly polar phenolic compounds [30,31]. The liquid-to-solid ratio demonstrated analogous effects on TPC and DPPH radical scavenging activity: moderate solvent volume increases enhanced phenolic compound recovery, while excess solvent failed to improve extraction efficiency further [28,32]. Prolonged ultrasonication duration, however, showed potential to diminish extraction effectiveness. The ultrasound-assisted extraction of polyphenols from Phyllanthus emblica exhibited comparable trends, potentially attributable to prolonged ultrasonication-induced thermal and mechanical effects that may increase degradation risks for certain phenolic compounds [33]. The response surface analysis revealed ethanol concentration as a critical determinant of TPC in P. banksiana needle extracts, with significant interaction effects between ethanol concentration and ultrasonication time, indicating that polyphenol extraction efficiency was jointly affected by solvent composition and ultrasonication time. RSM has been widely applied to characterize multivariable effects and optimize UAE conditions for phenolic recovery [34,35]. Following appropriate rounding of parameter values, the optimized conditions were standardized across all six conifer species to establish methodological consistency. This standardized protocol effectively minimized variability arising from differential extraction conditions during interspecific comparisons, thereby enhancing cross-species comparability. It should be emphasized that these standardized conditions served as a common reference framework rather than representing species-specific optimal extraction parameters.
4.2. Differences in Phenolic Contents and Composition Among CNEs
Under identical extraction conditions, the six CNEs exhibited significant interspecific differences in TPC, TFC, and TPAC. As these indices were determined using different colorimetric assays and reference standards, their absolute values should be interpreted separately. It should be noted that TPC values obtained using the Folin–Ciocalteu assay may also reflect contributions from nonphenolic reducing substances and therefore represent an estimate of phenolic content rather than an absolute measure. These findings are consistent with the comparative analysis by Kurtiš et al., who reported species-specific differences in total phenolic content, total flavonoid content, and individual phenolic profiles among five pine species [14]. (+)-Catechin was the most abundant of the nine quantified phenolic compounds across all six CNEs. This finding is consistent with Popescu et al., who reported relatively high (+)-catechin levels in most conifer samples [26]. Saber et al. demonstrated that needles from different Pinus species can be differentiated through their characteristic metabolic profiles, where interspecific chemical variations arise from proportional differences across multiple compounds rather than singular biomarkers [36]. In this investigation, needle samples representing six conifer species were systematically collected from identical experimental plots and underwent standardized pretreatment and extraction protocols, thereby minimizing potential confounding factors associated with environmental heterogeneity and methodological inconsistencies. The observed differences in phenolic composition may reflect both species-related variation and differences in phenolic recovery under the standardized extraction conditions. As all samples were collected from a single site during one sampling period, these findings should be interpreted within the specific sampling conditions and may not fully represent seasonal, interannual, or geographical variation in phenolic composition. However, the effects of drying at 45 °C on the stability of individual phenolic compounds were not directly evaluated, and potential compound-specific changes during sample preparation cannot be excluded. Notably, the quantitative analysis focused exclusively on nine target compounds, which necessarily confines the interpretive scope to the compositional traits of these specific phenolic markers. Comprehensive characterization of phenolic diversity patterns would necessitate subsequent investigations employing either broadly targeted or untargeted metabolomic approaches.
4.3. Antioxidant Activity and Its Relationship with Phenolic Composition
P. banksiana exhibited the highest ABTS+ radical scavenging activity and total reducing power, while demonstrating notable performance in the DPPH assay; P. sylvestris displayed superior DPPH radical scavenging capacity, whereas A. holophylla showed consistently lower activity across all three antioxidant assays. Methodological variations in antioxidant evaluation were evidenced by inter-species activity discrepancies reported in existing literature. Koutsaviti et al., employing luminol chemiluminescence detection, determined IC50 values of 0.44, 0.55, 0.37, and 0.22 μg/mL for the hydroalcoholic extracts of P. banksiana, P. koraiensis, P. sylvestris, and P. tabuliformis, respectively—measurements that, due to inherent methodological differences, remain incomparable with the DPPH and ABTS IC50 parameters employed in this investigation. These comparisons highlight the assay-dependent nature of antioxidant responses, which reflect in vitro chemical reactivity rather than direct antioxidant effects in vivo [13]. Following enzyme-assisted ultrasonic extraction and purification of P. koraiensis needle litterfall, the DPPH and ABTS IC50 values for the flavonoid fraction were determined as 0.07182 and 0.02893 mg/mL, respectively, demonstrating lower concentrations compared to the crude P. koraiensis extract obtained in this study. This discrepancy could be attributed to variations in flavonoid enrichment levels and extraction methodologies [5]. Comparative analysis revealed that DPPH activity of P. sylvestris needle extracts prepared through different methods ranged from 249.22 to 278.48 mg TE/100 g DW, with DPPH and FRAP assays demonstrating distinct responses to interspecies variations [14]. These findings suggest that differences in phenolic composition, extraction conditions, and assay-specific reaction mechanisms may contribute to the varying antioxidant activity rankings observed across different methods [37]. Notably, while P. koraiensis displayed the highest TFC in this investigation, it did not consistently demonstrate superior performance across all antioxidant assays, highlighting the limitation of relying solely on total content measurements for explaining complex extract behaviors. This observation aligns with the findings of Yahia et al., who reported that higher total phenolic and flavonoid contents did not necessarily correspond to stronger DPPH and ABTS+ radical-scavenging activities [16].
DPPH radical scavenging activity demonstrated significant correlation with TPC, while total reducing power showed the strongest association with TPC and additional significant correlations with both TFC and TPAC. These findings indicate that overall phenolic content likely influences inter-sample variations in DPPH radical scavenging capacity and electron-donating ability, particularly evident in TRP measurements. ABTS+ radical scavenging activity showed marked correlation with TPAC. Notably, ABTS+ scavenging activity correlated most strongly with chlorogenic acid and secondarily with caffeic acid, whereas total reducing power displayed prominent association with taxifolin along with significant correlations involving chlorogenic acid and rutin. Caffeic acid exhibited significant correlations with both ABTS+ radical-scavenging activity and total reducing power, consistent with findings by Deng et al. linking caffeic acid to multiple antioxidant indices, including DPPH, ABTS+, and FRAP [38]. These compositional differences likely account for the observed variations in antioxidant performance among species across different assay systems. Based on compound quantification and correlation analyses, chlorogenic acid showed the strongest association with ABTS+ scavenging activity and may therefore be considered a candidate phenolic compound associated with ABTS+ scavenging activity. Caffeic acid appears to participate in both ABTS+ scavenging and reducing activity, while taxifolin and rutin may primarily contribute to total reducing power. The cumulative antioxidant effects observed in the six CNEs probably arise from synergistic interactions among diverse phenolic acids, flavonoids, proanthocyanidins, and other bioactive compounds.
4.4. Digestive Enzyme Inhibitory Activity and α-Glucosidase Inhibition Kinetics
Reducing α-amylase and α-glucosidase activities represents a critical strategy for regulating postprandial blood glucose levels by slowing dietary carbohydrate breakdown and subsequent glucose release [39,40]. While previous studies demonstrate that Pinus species extracts exhibit inhibitory effects against both enzymes, the efficacy varies depending on tree species, plant parts utilized, and extraction methodologies. In this investigation, six coniferous needle extracts displayed IC50 values ranging from 5.352 to 33.973 μg/mL for α-glucosidase inhibition and 0.374 to 0.719 mg/mL for α-amylase inhibition, expressed as dry needle mass equivalents, with P. banksiana exhibiting the most potent inhibition for both enzymes under the same experimental conditions. For P. koraiensis, the flavonoid fraction from fallen needles, purified after enzyme-assisted ultrasonic extraction, exhibited IC50 values of 79.52 and 793.9 μg/mL for α-glucosidase and α-amylase, respectively [5]. Furthermore, the crude ethanol extract of P. nigra subsp. laricio shoot tips demonstrated an IC50 value of 139.00 μg/mL against α-amylase, while its ethyl acetate fraction exhibited enhanced inhibitory potency with an IC50 reduction to 22.05 μg/mL [41]. In parallel investigations, aqueous extracts of P. halepensis pine cone scales displayed notable α-glucosidase inhibition at 24.70 μg/mL, whereas analogous preparations from P. brutia and P. pinea failed to produce significant enzyme inhibitory effects [42]. These findings suggest that the digestive enzyme inhibitory activities of pine-derived preparations vary with plant materials, extraction procedures, and assay conditions. However, direct comparisons of IC50 values across studies should be made cautiously, particularly when concentrations are expressed on different mass bases.
The Mantel test showed that differences in α-glucosidase inhibitory activity among samples were most strongly associated with differences in (+)-catechin content, followed by TPAC, TPC, chlorogenic acid, caffeic acid, and taxifolin. For α-amylase inhibitory activity, the strongest association was observed with TPC, followed by (+)-catechin, p-coumaric acid, taxifolin, and rutin. Procyanidin B2 demonstrates strong α-glucosidase inhibitory activity and represents a potentially important enzyme-inhibitory component within plant polyphenol fractions [43]. TPAC also showed a significant association with α-glucosidase inhibitory activity in this study. Furthermore, the established relationship between TPC and α-amylase inhibitory activity aligns with previous observations where phenol-rich materials exhibit enhanced α-amylase inhibitory effects [44]. In addition, p-coumaric acid exhibits competitive inhibition against α-amylase, whereas taxifolin demonstrates competitive inhibition toward both α-amylase and α-glucosidase [45,46]. Notably, (+)-catechin was the most abundant among the nine quantified phenolic compounds, and variations in its content showed significant Mantel associations with differences in the inhibitory activities of both enzymes. These findings suggest a possible association between (+)-catechin content and digestive enzyme inhibitory activity. However, biological replicates from the same species may share similar phenolic profiles and bioactivity characteristics, meaning that correlations across the 18 samples could partly reflect interspecific variation rather than direct compound–activity relationships. Previous studies have established that catechin competitively inhibits α-glucosidase through hydrogen bonding and hydrophobic interactions with the enzyme’s active site [47].
Given the relatively potent inhibition of α-glucosidase by P. banksiana needle extract, its kinetic characteristics were systematically evaluated. The P. banksiana needle extract exhibited an apparent mixed-type inhibition pattern toward α-glucosidase, with a lower Ku than Ki, reflecting the overall inhibitory behavior of the extract. Ren et al. previously documented that apigenin, quercetin, and phloretin exerted reversible mixed-type inhibition of α-glucosidase, mainly through hydrophobic interactions and van der Waals interactions, and could alter the conformation of the enzyme [48,49,50].
4.5. Molecular Docking of Major Phenolic Compounds with Digestive Enzymes and Potential Mechanisms of Action
Under identical docking conditions, more negative Vina scores indicate more favorable predicted ligand–receptor interactions. In this study, all eight selected phenolic compounds exhibited binding energies below −5.0 kcal/mol against both digestive enzymes. Notably, rutin, taxifolin, (+)-catechin, and chlorogenic acid demonstrated binding energies more negative than −7.0 kcal/mol for both target enzymes, reflecting their superior predicted binding affinities. Among the nine quantified phenolic compounds, (+)-catechin was the most abundant in all six needle samples and showed a significant association with α-glucosidase inhibitory activity in the Mantel analysis. It also showed a relatively favorable predicted binding energy with α-glucosidase and multiple predicted interactions within the binding site, suggesting that (+)-catechin may be one of the potential contributors to the observed inhibitory activity. Previous studies have similarly documented the α-glucosidase inhibitory capacity of catechin and other plant-derived phenolics, with molecular docking supporting their potential interactions with α-glucosidase [47,51]. Taxifolin showed associations with the inhibitory activities of both digestive enzymes and a favorable predicted docking score for α-amylase, suggesting its potential contribution to the dual-enzyme inhibitory activity of CNEs. Comparable interactions between taxifolin and α-glucosidase/α-amylase have been documented previously [46]. Recent experimental–computational analyses further showed that phenolic hydroxyl groups and aromatic moieties contribute to α-amylase binding through hydrogen bonding and hydrophobic interactions, while the location of these interactions at active or non-active sites can influence the observed inhibition mode [52]. Chlorogenic acid showed a strong association with α-glucosidase inhibitory activity and favorable predicted interactions with both enzyme models, suggesting a possible contribution of phenolic acids to digestive enzyme inhibition. Experimental evidence confirms that chlorogenic acid and its acylated derivatives exert mixed-type inhibition against both α-glucosidase and α-amylase [53]. Although rutin exhibited the most negative predicted binding energy toward both enzyme targets, this did not correspond directly to the strongest inhibitory activity of the crude extracts, and rutin was undetectable in several species. Thus, docking results obtained with human digestive enzyme structures should be interpreted as exploratory predictions rather than direct mechanistic evidence for the inhibition observed with the yeast and porcine enzymes or as quantitative measures of the contributions of individual compounds to the activities of the complex extracts. Experimental studies have shown that ligand–enzyme binding affinity can correlate with α-amylase inhibition within defined compound classes and assay systems; however, such relationships depend on inhibitor structure, inhibition mechanism, substrate properties, and experimental conditions [54,55].
5. Conclusions
This study optimized the ultrasound-assisted extraction parameters for polyphenol recovery from P. banksiana needles and systematically evaluated phenolic profiles, antioxidant capacities, and digestive enzyme inhibitory activities across six CNEs prepared under standardized conditions. The six CNEs exhibited significant interspecific variations in TPC, TFC, TPAC, and specific phenolic compositions, while (+)-catechin was the most abundant among the nine quantified phenolic compounds in all six conifer species. P. banksiana exhibited relatively high TPC, the highest TPAC, and strong antioxidant activity in the ABTS+ and reducing power assays. All CNEs displayed inhibitory effects against α-glucosidase and α-amylase, with P. banksiana exhibiting superior dual-enzyme inhibition characterized by an apparent mixed-type inhibition pattern toward α-glucosidase. Correlation and molecular docking analyses suggested that (+)-catechin may be one of the contributors to α-glucosidase inhibition, although this proposed role requires further experimental verification. These findings highlight the potential of P. banksiana needles as a source of phenolic compounds with in vitro antioxidant and digestive enzyme inhibitory activities, although further studies on bioavailability, safety, and in vivo efficacy are needed to establish their physiological relevance and suitability for food-related applications.
Supplementary Materials
The following supporting information can be downloaded at: https://www.mdpi.com/article/10.3390/antiox15111428/s1. Figure S1. Inhibitory activities of polyphenol-rich needle extracts from six conifer species against α-amylase (A) and α-glucosidase (B), expressed as IC50 values. Figure S2. Re-docking validation of the molecular docking protocol. Figure S3: HPLC Chromatogram of the used standard phenolic compounds. Figure S4. Nonlinear regression analysis of α-glucosidase inhibition by Pinus banksiana needle extract. Figure S5. Representative HPLC chromatograms of six conifer needle extracts recorded at 280 nm. Figure S6. Representative HPLC chromatograms of six conifer needle extracts recorded at 320 nm. Figure S7. Representative HPLC chromatograms of six conifer needle extracts recorded at 360 nm. Table S1. Independent variables and coded levels for extraction optimization. Table S2. BBD with responses of the dependent variables to extraction conditions. Table S3. ANOVA for fitted second-order polynomial model. Table S4. In vitro antioxidant activities of needle extracts from six conifer species. Table S5. HPLC-DAD calibration parameters for the nine target phenolic compounds. Table S6. Comparison of nonlinear kinetic models for α-glucosidase inhibition by Pinus banksiana needle extract. Table S7. Precision and spike recovery of nine phenolic compounds determined by HPLC-DAD. Table S8. Preliminary screening of six conifer species under identical extraction conditions.
Author Contributions
S.Z.: Methodology, Investigation, Formal Analysis, Data Curation, Writing—Original Draft. J.W.: Conceptualization, Investigation, Formal Analysis, Writing—Review & Editing. H.H.: Data Curation, Visualization. X.P.: Resources, Project Administration, Funding Acquisition. M.L.: Investigation, Data Curation. X.X.: Methodology, Investigation. H.L.: Validation, Writing—Review & Editing. X.Z.: Supervision, Writing—Review & Editing. All authors have read and agreed to the published version of the manuscript.
Funding
This research was funded by the Jilin Provincial Forestry and Grassland Bureau, grant number JLLC-2026-15.
Institutional Review Board Statement
Not applicable.
Informed Consent Statement
Not applicable.
Data Availability Statement
The original contributions presented in this study are included in the article/Supplementary Material. Further inquiries can be directed to the corresponding authors.
Acknowledgments
During the preparation of this manuscript and the graphical abstract, the authors used ChatGPT (GPT-5.6, OpenAI) to assist with English-language polishing, text refinement, and layout optimization. The tool was not used to generate experimental data, perform statistical analyses, interpret the results, or directly generate scientific images. The authors reviewed and edited all outputs and take full responsibility for the content of this publication.
Conflicts of Interest
Xiyang Zhao is currently employed by Jilin Changbaishan Forest Industry Group Co., Ltd. (Changchun, China). This affiliation did not influence the design, execution, interpretation, or writing of the study. The authors declare that they have no known competing financial interests or personal relationships that could have appeared to influence the work reported in this paper.
Abbreviations
The following abbreviations are used in this manuscript:
| ABTS | 2,2′-Azino-bis(3-ethylbenzothiazoline-6-sulfonic acid) |
| ANOVA | Analysis of variance |
| BBD | Box–Behnken design |
| CE | Catechin equivalents |
| CNEs | Conifer needle extracts |
| DNS | 3,5-Dinitrosalicylic acid |
| DPPH | 2,2-Diphenyl-1-picrylhydrazyl |
| DW | Dry weight |
| GAE | Gallic acid equivalents |
| HPLC-DAD | High-performance liquid chromatography with diode-array detection |
| IC50 | Half-maximal inhibitory concentration |
| PCA | Principal component analysis |
| PDB | Protein Data Bank |
| pNPG | p-Nitrophenyl-α-D-glucopyranoside |
| RE | Rutin equivalents |
| RSM | Response surface methodology |
| SD | Standard deviation |
| TFC | Total flavonoid content |
| TPAC | Total proanthocyanidin content |
| TPC | Total phenolic content |
| TRP | Total reducing power |
| UAE | Ultrasound-assisted extraction |
| VCE | Vitamin C equivalents |
References
- Sharma, V.; Kamal Sharma, R. Pine Needle Energy Potential in Conifer Forest of Western Himalayan. Environ. Nat. Resour. J. 2019, 18, 55–65. [Google Scholar] [CrossRef] [Scilit]
- Tian, Y.; Gong, W.; Li, S.; Li, M.; Zhao, F. High-resolution monthly estimation of disturbance-induced tropical forest carbon flux in the state of Rondônia, Brazilian Amazon. For. Ecosyst. 2026, 17, 100534. [Google Scholar] [CrossRef] [Scilit]
- Dziedziński, M.; Kobus-Cisowska, J.; Stachowiak, B. Pinus Species as Prospective Reserves of Bioactive Compounds with Potential Use in Functional Food—Current State of Knowledge. Plants 2021, 10, 1306. [Google Scholar] [CrossRef] [Scilit] [PubMed]
- Lang, Y.; Gao, N.; Zang, Z.; Meng, X.; Lin, Y.; Yang, S.; Yang, Y.; Jin, Z.; Li, B. Classification and antioxidant assays of polyphenols: A review. J. Future Foods 2024, 4, 193–204. [Google Scholar] [CrossRef] [Scilit]
- Liang, W.; Ouyang, L.; Bian, C.; Shan, Y.; Xia, X. Enzyme-Assisted Ultrasonic Extraction of Flavonoids from Pinus koraiensis Needle Litterfall: Process Optimization, Component Identification, and In Vitro Bioactivity Evaluation. Antioxidants 2026, 15, 712. [Google Scholar] [CrossRef] [Scilit] [PubMed]
- Tbatou, W.; Laaroussi, H.; Ishagh, B.; El Yagoubi, K.; Louis Evariste, A.Z.; Eto, B.; Lyoussi, B.; Benziane Ouaritini, Z. Chemical Composition, Antioxidant, Analgesic, and Wound-Healing Effects of Pinus pinaster Aiton and Pinus halepensis Mill Needles: A Natural Approach to Pain and Oxidative Stress Management. Processes 2026, 14, 369. [Google Scholar] [CrossRef] [Scilit]
- Lu, M.; Lai, Q.Q.T.; Wang, X.; Chen, S.; Li, S.; Liu, Y.; Ren, Z.; Yan, H.; Zhao, Q.; Bao, H.; et al. Transcriptome analysis reveals regulatory processes of transcription factors on anthocyanin accumulation in the bark of Populus simonii × P. nigra. Plant Cell Tissue Organ Cult. (PCTOC) 2025, 163, 107. [Google Scholar] [CrossRef] [Scilit]
- Gao, H.-X.; Chen, N.; He, Q.; Shi, B.; Zeng, W.-C. Effects of structural characteristics of phenolic compounds on oxidation of glycerol trioleate: Action rule and mechanism. Food Chem. 2024, 433, 137361. [Google Scholar] [CrossRef] [Scilit] [PubMed]
- Yu, M.; Zhu, S.; Huang, D.; Tao, X.; Li, Y. Inhibition of starch digestion by phenolic acids with a cinnamic acid backbone: Structural requirements for the inhibition of α-amylase and α-glucosidase. Food Chem. 2024, 435, 137499. [Google Scholar] [CrossRef] [Scilit] [PubMed]
- Tsai, C.-H.; Liou, Y.-L.; Li, S.-M.; Liao, H.-R.; Chen, J.-J. Antioxidant, Anti-α-Glucosidase, Anti-Tyrosinase, and Anti-Acetylcholinesterase Components from Stem of Rhamnus formosana with Molecular Docking Study. Antioxidants 2025, 14, 8. [Google Scholar] [CrossRef] [Scilit] [PubMed]
- Sunagar, R.R.; Sreerama, Y.N. Implication of solvent polarities on browntop millet (Urochloa ramosa) phenolic antioxidants and their ability to protect oxidative DNA damage and inhibit α-amylase and α-glucosidase enzymes. Food Chem. 2023, 411, 135474. [Google Scholar] [CrossRef] [Scilit] [PubMed]
- Pędziwiatr, D.; Lamadrid, M.C.; Wojdyło, A. Cookies Fortified with Polyphenols Extracts: Impact on Phenolic Content, Antioxidant Activity, Inhibition of α-Amylase and α-Glucosidase Enzyme, Colour and Sensory Attractiveness. Antioxidants 2024, 13, 1108. [Google Scholar] [CrossRef] [Scilit] [PubMed]
- Koutsaviti, A.; Toutoungy, S.; Saliba, R.; Loupassaki, S.; Tzakou, O.; Roussis, V.; Ioannou, E. Antioxidant Potential of Pine Needles: A Systematic Study on the Essential Oils and Extracts of 46 Species of the Genus Pinus. Foods 2021, 10, 142. [Google Scholar] [CrossRef] [Scilit] [PubMed]
- Kurtiš, A.; Antić-Stanković, J.; Bufan, B.; Božić, D.D.; Krivokapić, S.; Damjanović-Vratnica, B.; Perović, S. Quantitative Analysis of Polyphenols and In Vitro Antioxidant, Antimicrobial and Toxicity Assessments in Needles of Five Pinus Species from Montenegro. Microorganisms 2026, 14, 170. [Google Scholar] [CrossRef] [Scilit] [PubMed]
- Yusoff, I.M.; Mat Taher, Z.; Rahmat, Z.; Chua, L.S. A review of ultrasound-assisted extraction for plant bioactive compounds: Phenolics, flavonoids, thymols, saponins and proteins. Food Res. Int. 2022, 157, 111268. [Google Scholar] [CrossRef] [Scilit] [PubMed]
- Yahia, Y.; Zaghdoud, C.; Tlahig, S.; Bouzidi, A.; Boufahja, F.; Elfalleh, W. Phenolic profiling and antioxidant-antimicrobial activity of spontaneous plants naturally grown in Tunisia. Food Biosci. 2025, 72, 107470. [Google Scholar] [CrossRef] [Scilit]
- Lai, M.; Chen, H.; Liu, X.; Li, F.; Liu, F.; Li, Y.; Yan, J.; Lin, L. Exploration of phenolic profile from mangosteen (Garcinia mangostana L.) pericarp and their contribution to inhibitory effects on α-amylase and α-glucosidase. LWT 2024, 203, 116350. [Google Scholar] [CrossRef] [Scilit]
- Hossain, R.; Noonong, K.; Nuinoon, M.; Majima, H.J.; Eawsakul, K.; Sompol, P.; Rahman, M.A.; Tangpong, J. Network Pharmacology, Molecular Docking, and In Vitro Insights into the Potential of Mitragyna speciosa for Alzheimer’s Disease. Int. J. Mol. Sci. 2024, 25, 13201. [Google Scholar] [CrossRef] [Scilit] [PubMed]
- He, Q.; Wang, J.; Li, J.; Yang, W. Polyphenol Profile and Antioxidant, Antityrosinase, and Anti-Melanogenesis Activities of Ethanol Extract of Bee Pollen. Pharmaceuticals 2024, 17, 1634. [Google Scholar] [CrossRef] [Scilit] [PubMed]
- Li, X.; Li, W.; Chen, F.; Xiao, J.; Liao, X.; Hu, X.; Ji, J.; Ma, L. Guideline for measurement of condensed tannin. Food Front. 2023, 4, 533–541. [Google Scholar] [CrossRef] [Scilit]
- Ma, Y.-L.; Wang, Z.-T.; Yang, D.-M.; Li, Z.; Wu, Q.-L.; Guo, X.; Shang, Y.-F.; Thakur, K.; Wei, Z.-J. Effect of processing and simulated digestion on phenolics, antioxidant and hypoglycemic potential of winter jujube. LWT 2024, 211, 116944. [Google Scholar] [CrossRef] [Scilit]
- Peng, Q.; Huang, Z.; Liang, G.; Bi, Y.; Kong, F.; Wang, Z.; Tan, S.; Zhang, J. Preparation of protein-stabilized Litsea cubeba essential oil nano-emulsion by ultrasonication: Bioactivity, stability, in vitro digestion, and safety evaluation. Ultrason. Sonochemistry 2024, 107, 106892. [Google Scholar] [CrossRef] [Scilit] [PubMed]
- Xie, R.; Ponnampalam, E.N.; Ahmadi, F.; Dunshea, F.R.; Suleria, H.A.R. Antioxidant Potential and Characterization of Polyphenol Compounds in Moringa oleifera Pods. Food Sci. Nutr. 2024, 12, 10881–10902. [Google Scholar] [CrossRef] [Scilit] [PubMed]
- Fan, S.-J.; Qian, W.-Z.; Xiao, Y.-X.; Hu, Y.-Y.; Jiang, M.-L.; Chen, J.-C.; Zhang, D.-J.; Gao, S. Comparative analysis of Zanthoxylum armatum essential oils from four cultivars: Chemical compositions, antioxidant activities, and antibacterial activities. Food Chem. X 2025, 30, 103005. [Google Scholar] [CrossRef] [Scilit] [PubMed]
- Zhu, X.; Yan, K.; Ye, X.; Xiang, X.; Ru, Y.; Niu, Y.; Liu, Y.; Xi, J.; Liu, K. Polyphenols from Flos Trollii inhibit α-amylase and α-glucosidase: Kinetic analysis and mechanistic insights. LWT 2025, 225, 117940. [Google Scholar] [CrossRef] [Scilit]
- Popescu, D.I.; Frum, A.; Dobrea, C.M.; Cristea, R.; Gligor, F.G.; Vicas, L.G.; Ionete, R.E.; Sutan, N.A.; Georgescu, C. Comparative Antioxidant and Antimicrobial Activities of Several Conifer Needles and Bark Extracts. Pharmaceutics 2024, 16, 52. [Google Scholar] [CrossRef] [Scilit] [PubMed]
- Dzah, C.S.; Duan, Y.; Zhang, H.; Wen, C.; Zhang, J.; Chen, G.; Ma, H. The effects of ultrasound assisted extraction on yield, antioxidant, anticancer and antimicrobial activity of polyphenol extracts: A review. Food Biosci. 2020, 35, 100547. [Google Scholar] [CrossRef] [Scilit]
- Huo, H.; Bao, H.; Li, J.; Li, H. Optimization and antioxidant evaluation of clean and efficient recovery of polyphenols from Phellodendron amurense waste leaves via ultrasound-assisted extraction. Ultrason. Sonochem. 2025, 120, 107512. [Google Scholar] [CrossRef] [Scilit] [PubMed]
- Huynh, H.D.; Nargotra, P.; Wang, H.-M.D.; Tsai, Y.-H.; Chiu, C.-C.; Shieh, C.-J.; Liu, Y.-C.; Kuo, C.-H. Unveiling the mechanism of ultrasound-assisted phenolic extraction from Psidium cattleianum leaves: Kinetic, mass transfer, and thermodynamic insights. Ultrason. Sonochem. 2025, 123, 107675. [Google Scholar] [CrossRef] [Scilit] [PubMed]
- Olawuyi, I.F.; Park, J.J.; Lee, W.Y. Effect of extraction conditions on ultrasonic-assisted extraction of polyphenolic compounds from okra (Abelmoschus esculentus L.) leaves. Korean J. Food Preserv. 2020, 27, 476–486. [Google Scholar] [CrossRef] [Scilit]
- Zhang, S.; Xie, H.; Huang, J.; Chen, Q.; Li, X.; Chen, X.; Liang, J.; Wang, L. Ultrasound-assisted extraction of polyphenols from pine needles (Pinus elliottii): Comprehensive insights from RSM optimization, antioxidant activity, UHPLC-Q-Exactive Orbitrap MS/MS analysis and kinetic model. Ultrason. Sonochem. 2024, 102, 106742. [Google Scholar] [CrossRef] [Scilit] [PubMed]
- Hou, M.; Lin, C.; Zhu, L.; Bian, Z. Phenolics from Chaenomeles speciosa leaves: Ionic liquid-based ultrasound-assisted extraction, adsorptive purification, UPLC–QqQ–MS/MS quantification, and bioactivity assessment. Ultrason. Sonochem. 2025, 114, 107282. [Google Scholar] [CrossRef] [Scilit] [PubMed]
- Che, H.; Zhang, R.; Wang, X.; Yu, H.; Shi, X.; Yi, J.; Li, J.; Qi, Q.; Dong, R.; Li, Q. Ultrasound-assisted extraction of polyphenols from Phyllanthi Fructus: Comprehensive insights from extraction optimization and antioxidant activity. Ultrason. Sonochem. 2024, 111, 107083. [Google Scholar] [CrossRef] [Scilit] [PubMed]
- Hasnaoui, N.; Hamdi, A.; Rodríguez-Arcos, R.; Guillén-Bejarano, R.; Jiménez-Araujo, A. Direct vs indirect ultrasound-assisted extraction of phenolics from wild sumac (Rhus tripartita): Optimization by Response Surface Methodology (RSM) and LC-MS profiling. Ultrason. Sonochem. 2026, 124, 107604. [Google Scholar] [CrossRef] [Scilit] [PubMed]
- Baltrusch, K.L.; Torres, M.D.; Domínguez, H. Optimizing ultrasound-assisted extraction with custom design and response surface methodology: A case study using Ulva spp. Ultrason. Sonochem. 2025, 120, 107443. [Google Scholar] [CrossRef] [Scilit] [PubMed]
- Saber, F.R.; Mohsen, E.; El-Hawary, S.; Eltanany, B.M.; Elimam, H.; Sobeh, M.; Elmotayam, A.K. Chemometric-enhanced metabolic profiling of five Pinus species using HPLC-MS/MS spectrometry: Correlation to in vitro anti-aging, anti-Alzheimer and antidiabetic activities. J. Chromatogr. B 2021, 1177, 122759. [Google Scholar] [CrossRef] [Scilit] [PubMed]
- Sonno, K.; Ebrahimi, F.; Lou, Z.; Nguyen, H.C.; Barrow, C.J.; Suleria, H.A.R. Phenolic Characterization and Comparative Antioxidant Profiling of Australian Asparagopsis armata and A. taxiformis Across Their Developmental Stages. Antioxidants 2026, 15, 273. [Google Scholar] [CrossRef] [Scilit] [PubMed]
- Deng, W.; Yang, Q.-N.; Liu, H.-Y.; Xia, Y.; Yan, H.; Huang, J.-W.; Hu, Y.-C.; Zou, L.; Gan, R.-Y.; Wu, D.-T. Comparative analysis of phenolic compounds in different thinned unripe kiwifruits and their biological functions. Food Chem. X 2024, 24, 101815. [Google Scholar] [CrossRef] [Scilit] [PubMed]
- Chen, L.; Pu, Y.; Xu, Y.; He, X.; Cao, J.; Ma, Y.; Jiang, W. Anti-diabetic and anti-obesity: Efficacy evaluation and exploitation of polyphenols in fruits and vegetables. Food Res. Int. 2022, 157, 111202. [Google Scholar] [CrossRef] [Scilit] [PubMed]
- Rutkowska, M.; Olszewska, M.A. Anti-Diabetic Potential of Polyphenol-Rich Fruits from the Maleae Tribe—A Review of In Vitro and In Vivo Animal and Human Trials. Nutrients 2023, 15, 3756. [Google Scholar] [CrossRef] [Scilit] [PubMed]
- Fucile, M.; Lupia, C.; Armentano, M.; Marrelli, M.; Zicarelli, L.; Toma, C.-C.; Statti, G.; Conforti, F. Anti-Obesity and Weight Management-Related Antioxidant Potential Properties of Calabrian Pine Extracts: Pinus nigra Subsp. laricio (Poir.) Maire. Plants 2025, 14, 851. [Google Scholar] [CrossRef] [Scilit] [PubMed]
- Chammam, A.; Romdhane, M.; Fillaudeau, L.; Bouajila, J. Phytochemical Composition and Characterization of In Vitro Bioactivities from Pinus Using Green Process. Molecules 2024, 29, 5295. [Google Scholar] [CrossRef] [Scilit] [PubMed]
- Ma, Y.; Sun, J.; Xiao, B.-L. A study of the mechanism of α-glucosidase inhibition by rapeseed polyphenols. LWT 2025, 223, 117716. [Google Scholar] [CrossRef] [Scilit]
- Baccari, W.; Saidi, I.; Znati, M.; Mustafa, A.M.; Caprioli, G.; Harrath, A.H.; Ben Jannet, H. HPLC-MS/MS analysis, antioxidant and α-amylase inhibitory activities of the endemic plant Ferula tunetana using in vitro and in silico methods. Process Biochem. 2023, 129, 230–240. [Google Scholar] [CrossRef] [Scilit]
- Huang, Y.; Condict, L.; Richardson, S.J.; Brennan, C.S.; Kasapis, S. Exploring the inhibitory mechanism of p-coumaric acid on α-amylase via multi-spectroscopic analysis, enzymatic inhibition assay and molecular docking. Food Hydrocoll. 2023, 139, 108524. [Google Scholar] [CrossRef] [Scilit]
- Su, H.; Ruan, Y.-T.; Li, Y.; Chen, J.-G.; Yin, Z.-P.; Zhang, Q.-F. In vitro and in vivo inhibitory activity of taxifolin on three digestive enzymes. Int. J. Biol. Macromol. 2020, 150, 31–37. [Google Scholar] [CrossRef] [Scilit] [PubMed]
- Shen, H.; Wang, J.; Ao, J.; Cai, Y.; Xi, M.; Hou, Y.; Li, M.; Luo, A. Inhibitory kinetics and mechanism of active compounds in green walnut husk against α-glucosidase: Spectroscopy and molecular docking analyses. LWT 2022, 172, 114179. [Google Scholar] [CrossRef] [Scilit]
- Ren, X.; Liu, X.; Wang, B.z.; Zhang, M.; Wang, L.x. Inhibitory mechanism of apigenin, quercetin, and phloretin on α-glucosidase. Food Biosci. 2024, 62, 105398. [Google Scholar] [CrossRef] [Scilit]
- Zhou, Q.; Wei, Y.; Liao, Y.; Hu, X.; Gong, D.; Zhang, G. Inhibitory mechanism of α-glucosidase by liquiritigenin and its combined effect with acarbose: Multi-spectroscopic analyses and molecular docking simulation. Food Biosci. 2025, 63, 105659. [Google Scholar] [CrossRef] [Scilit]
- Zhang, H.; Liu, S.; Zheng, L.; Huang, H.; Ma, Z.; Li, J.; Chen, Y.; Tian, Y.; Zhong, Q.; Zhang, Y. Synergistic α-glucosidase inhibition mechanism of phenolic compounds from fermented qingjinju (Citrus microcarpa): Inhibition kinetics, conformational changes, and binding sites. LWT 2025, 236, 118685. [Google Scholar] [CrossRef] [Scilit]
- Lee, Y.-S.; Li, S.-M.; Chen, H.-J.; Chen, J.-J. Comprehensive Phytopharmacological Profiling of Polygonum aviculare L.: Antioxidant, Anti-Inflammatory, and α-Glucosidase Inhibitory Activities of Bioactive Constituents with Molecular Docking and In Silico Drug-Likeness Analysis. Antioxidants 2026, 15, 947. [Google Scholar] [CrossRef] [Scilit] [PubMed]
- Le, D.T.; Hooper, J.F.; Gidley, M.J.; Williamson, G.; Devkota, L.; Dhital, S. Structure-activity relationship of (poly)phenols on human salivary α-amylase: A stepwise in vitro/in silico analysis of interfacial inhibition. Food Chem. 2025, 492, 145384. [Google Scholar] [CrossRef] [Scilit] [PubMed]
- Wang, S.; Li, Y.; Huang, D.; Chen, S.; Xia, Y.; Zhu, S. The inhibitory mechanism of chlorogenic acid and its acylated derivatives on α-amylase and α-glucosidase. Food Chem. 2022, 372, 131334. [Google Scholar] [CrossRef] [Scilit] [PubMed]
- Shi, H.; Zhou, T.; Wang, X.; Shi, N.; Wang, H.; Wu, Y.; He, Y.; Lv, J. Mechanistic study of phenolic acid inhibition of α-amylase: Combining enzyme assays, spectroscopy, and molecular docking. J. Funct. Foods 2025, 134, 107044. [Google Scholar] [CrossRef] [Scilit]
- Zhang, J.; Cao, J.; Zhang, B.; Yang, X.; Miao, M.; Liu, X.; Sun, L. Ligand-enzyme thermodynamic bindings provide an efficient and microscale evaluating approach for α-amylase inhibition of polyphenols. Food Chem. 2025, 496, 146815. [Google Scholar] [CrossRef] [Scilit] [PubMed]
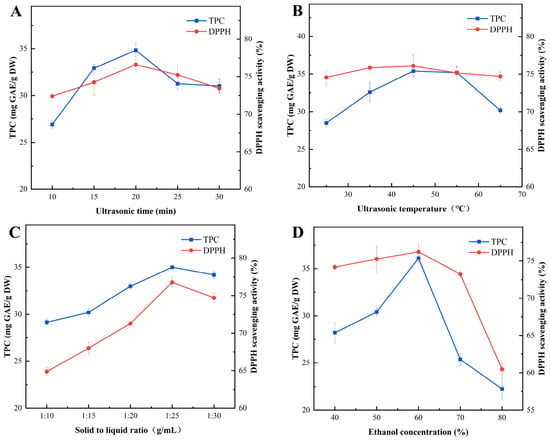
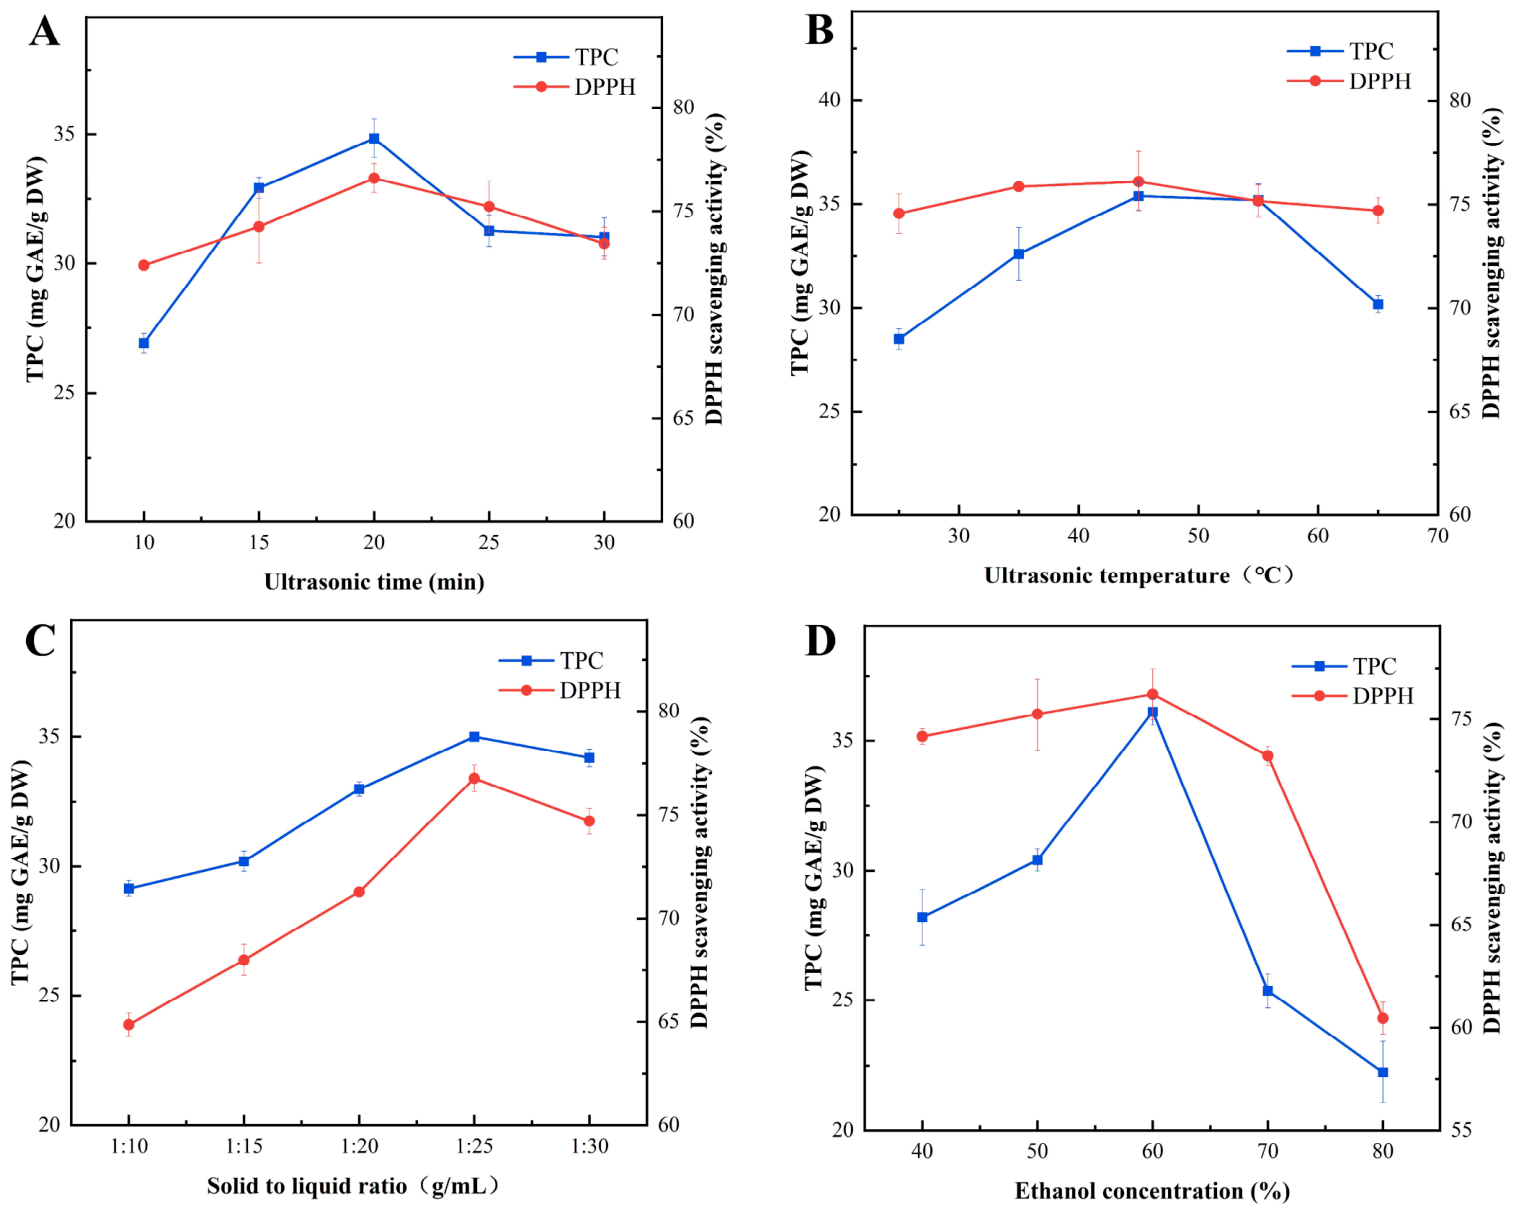
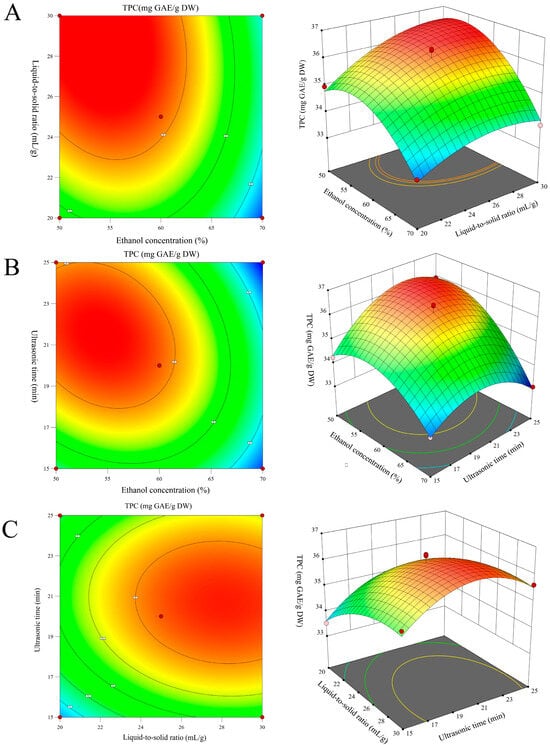
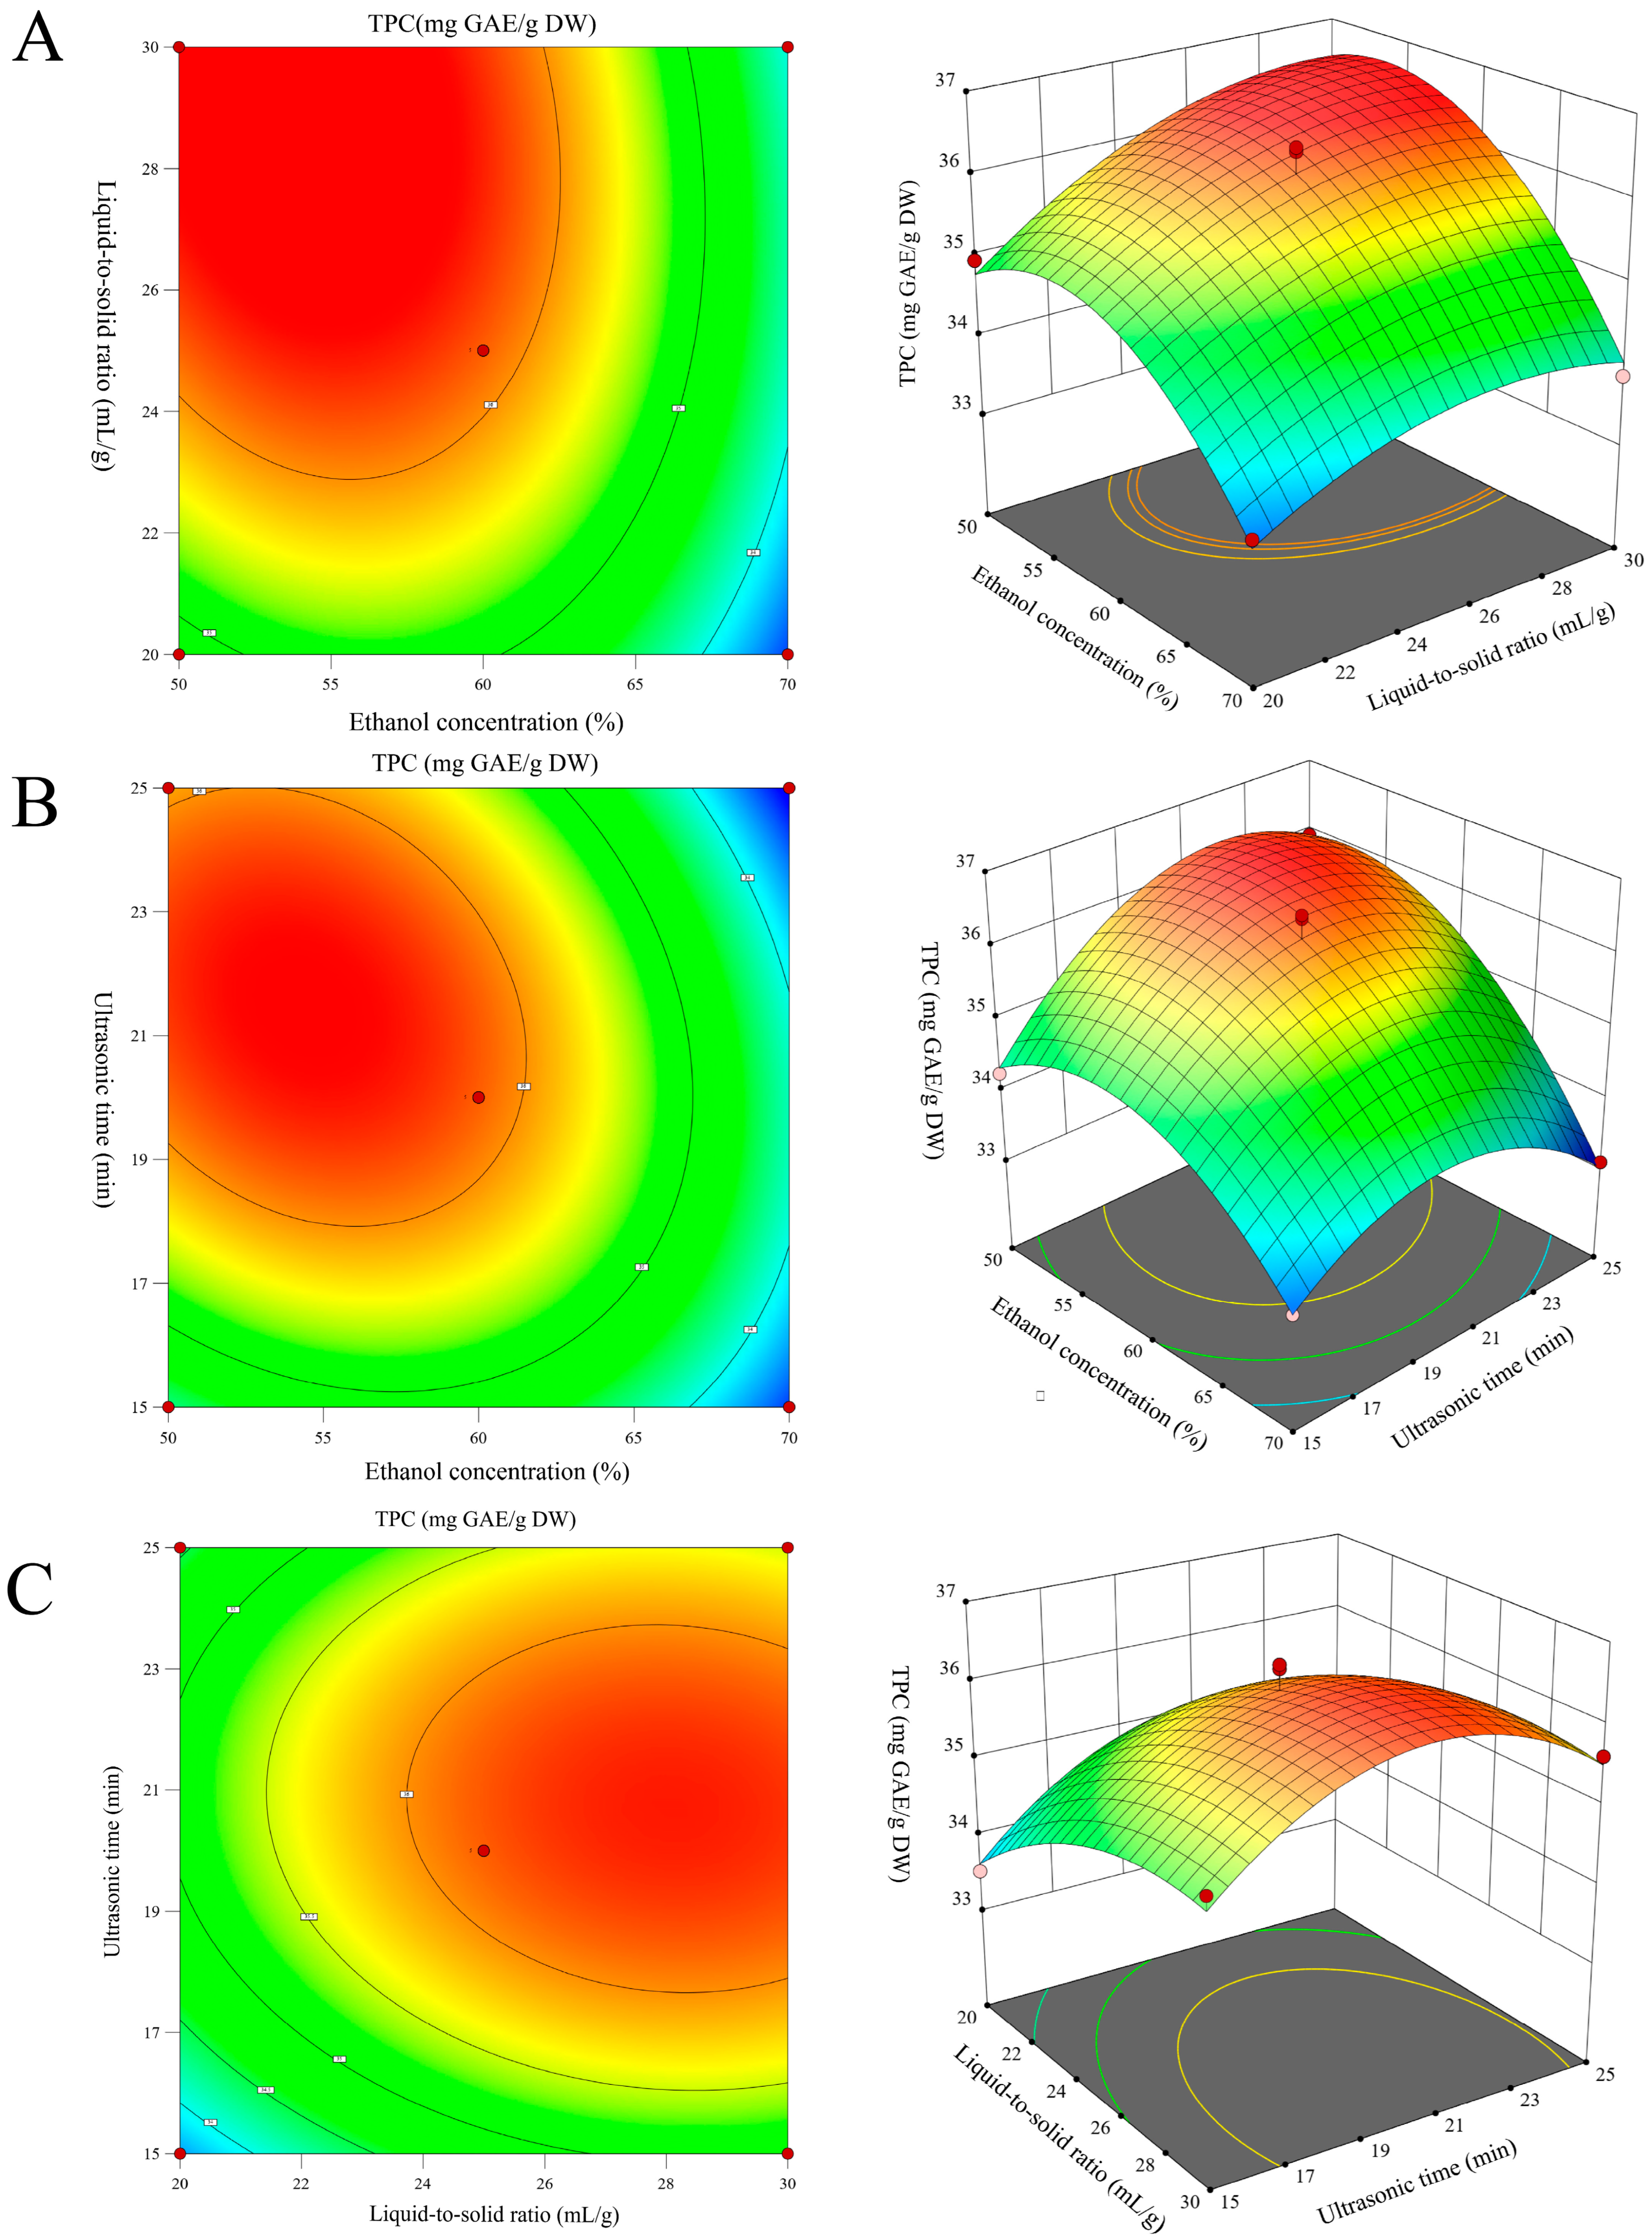
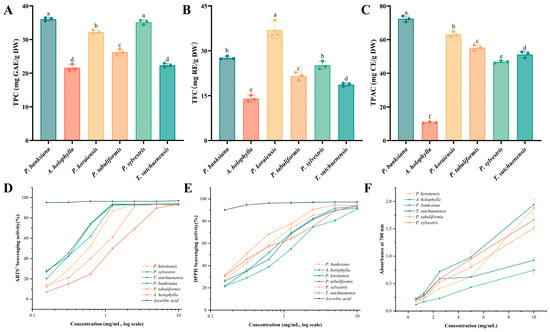
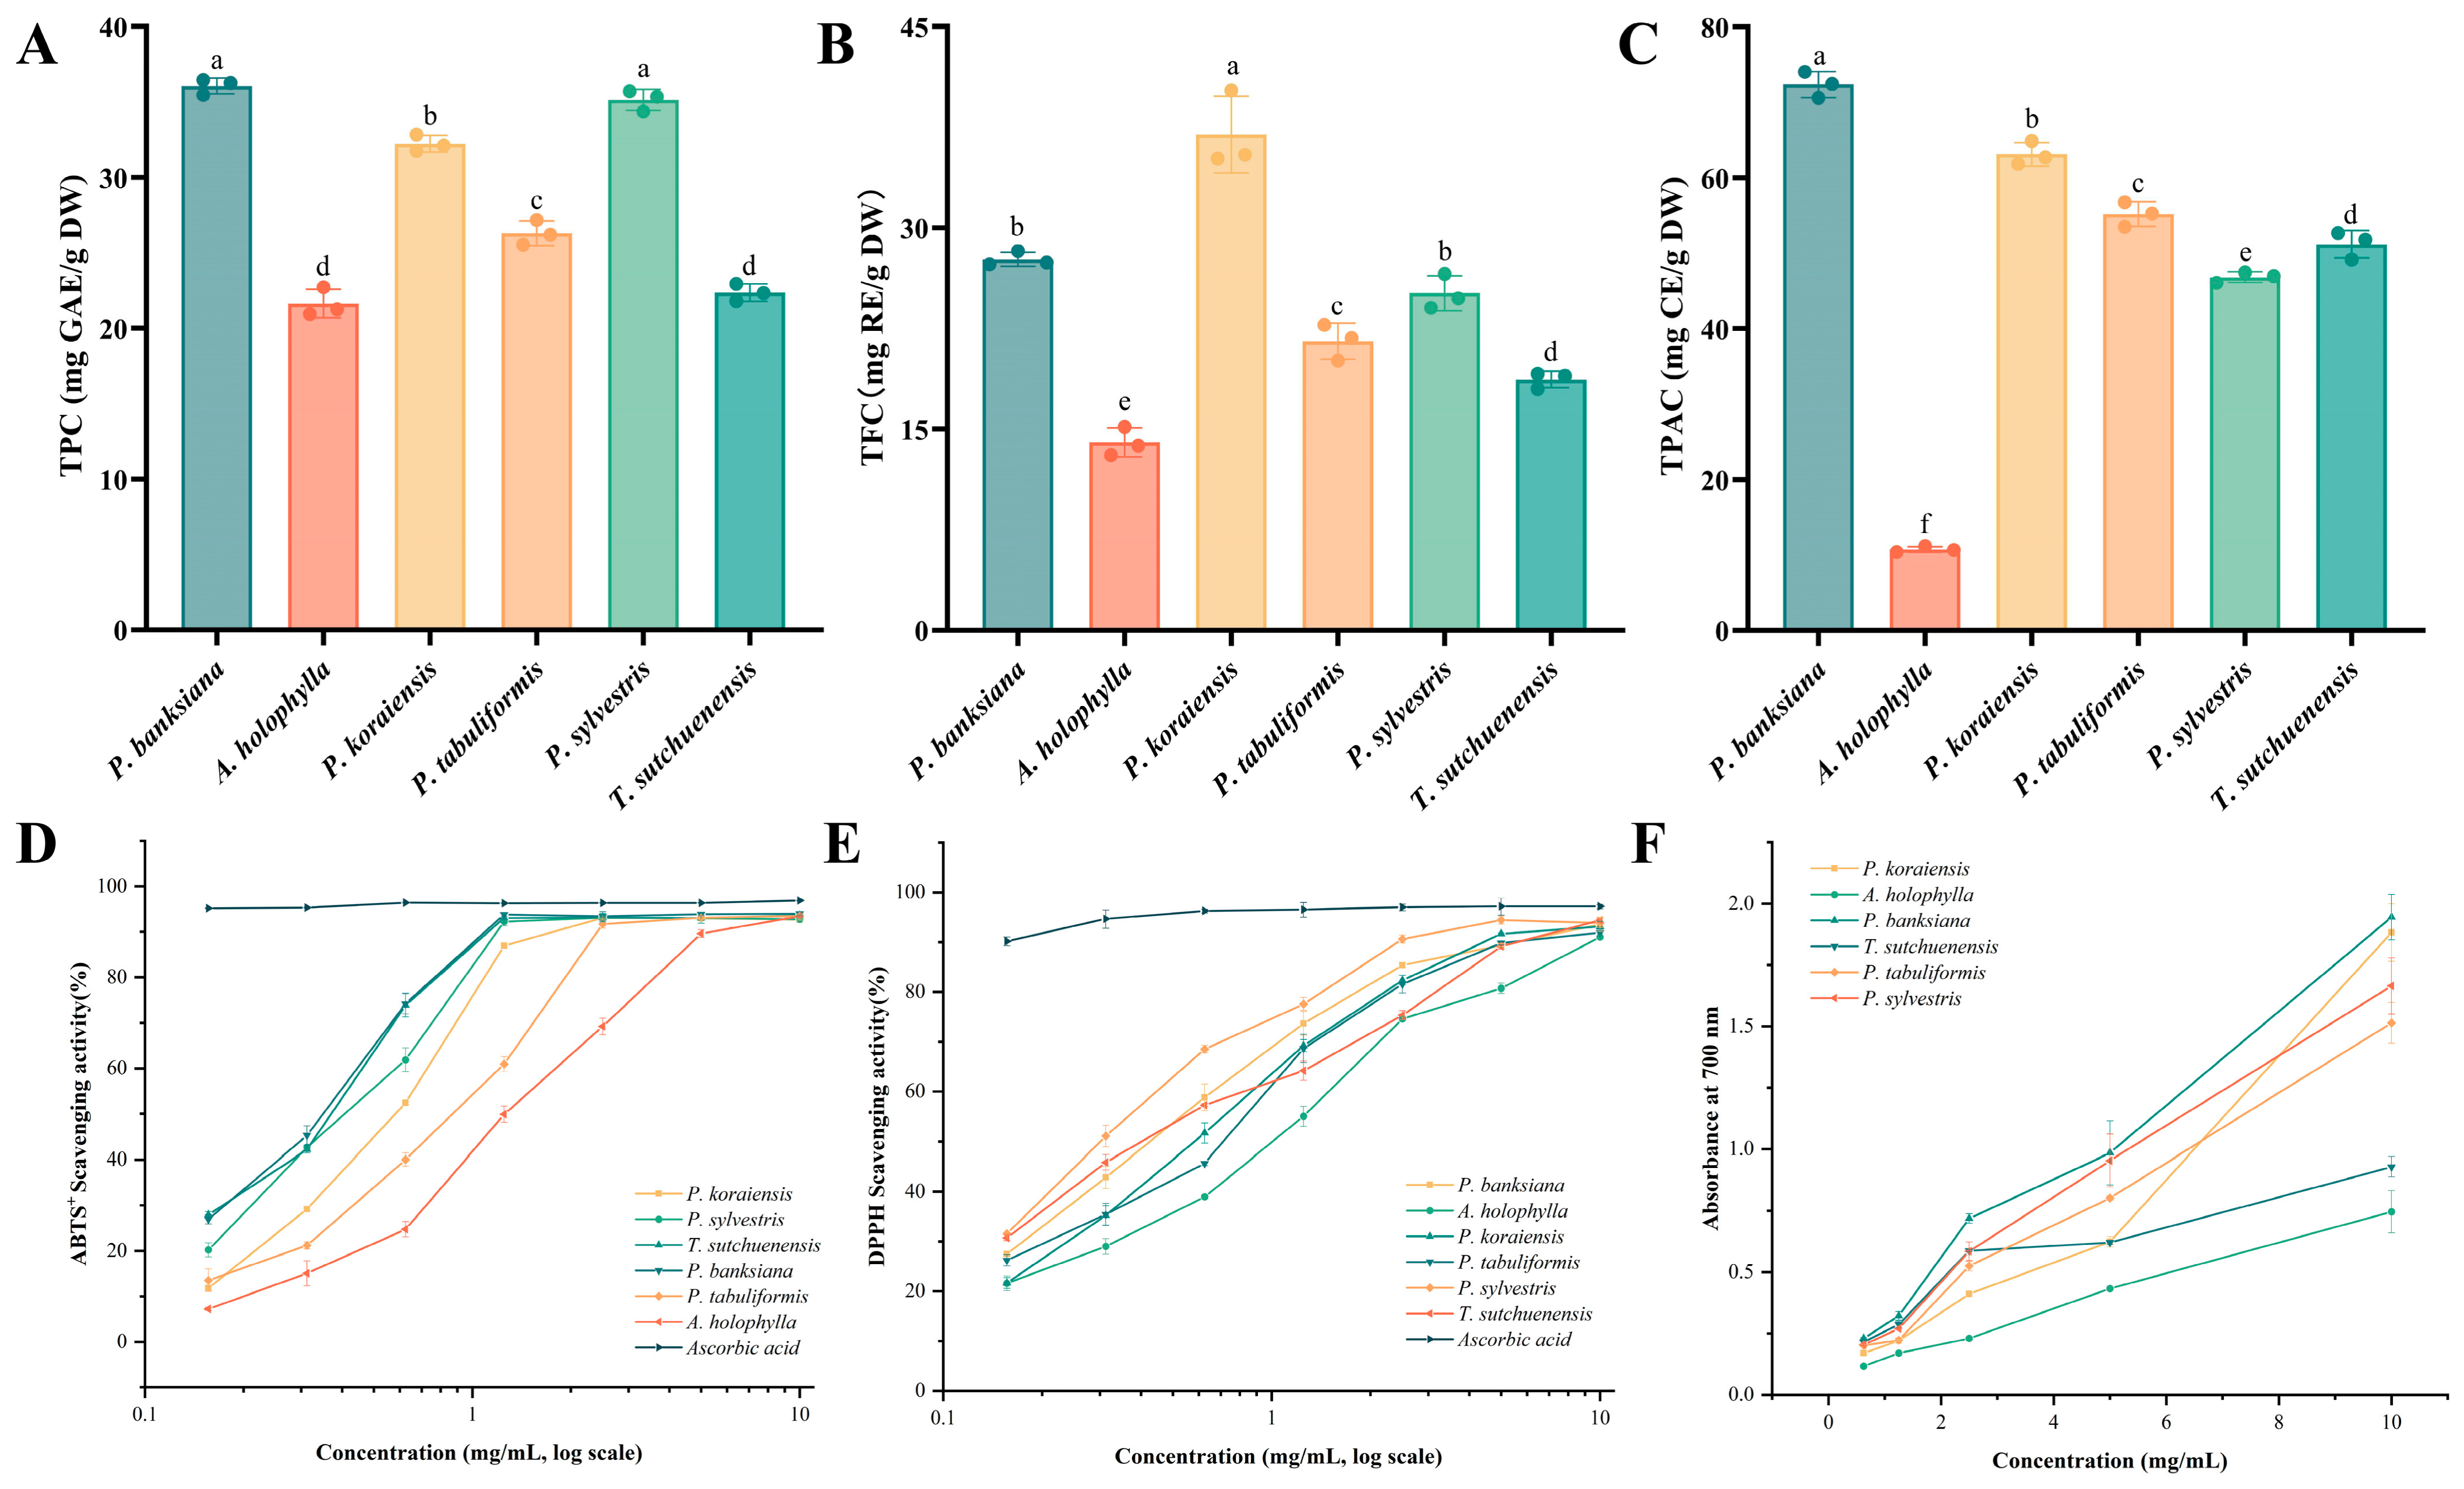
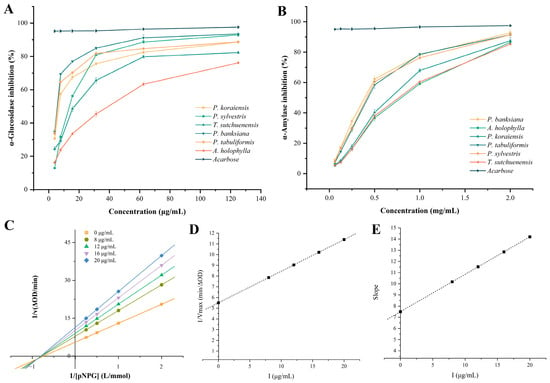
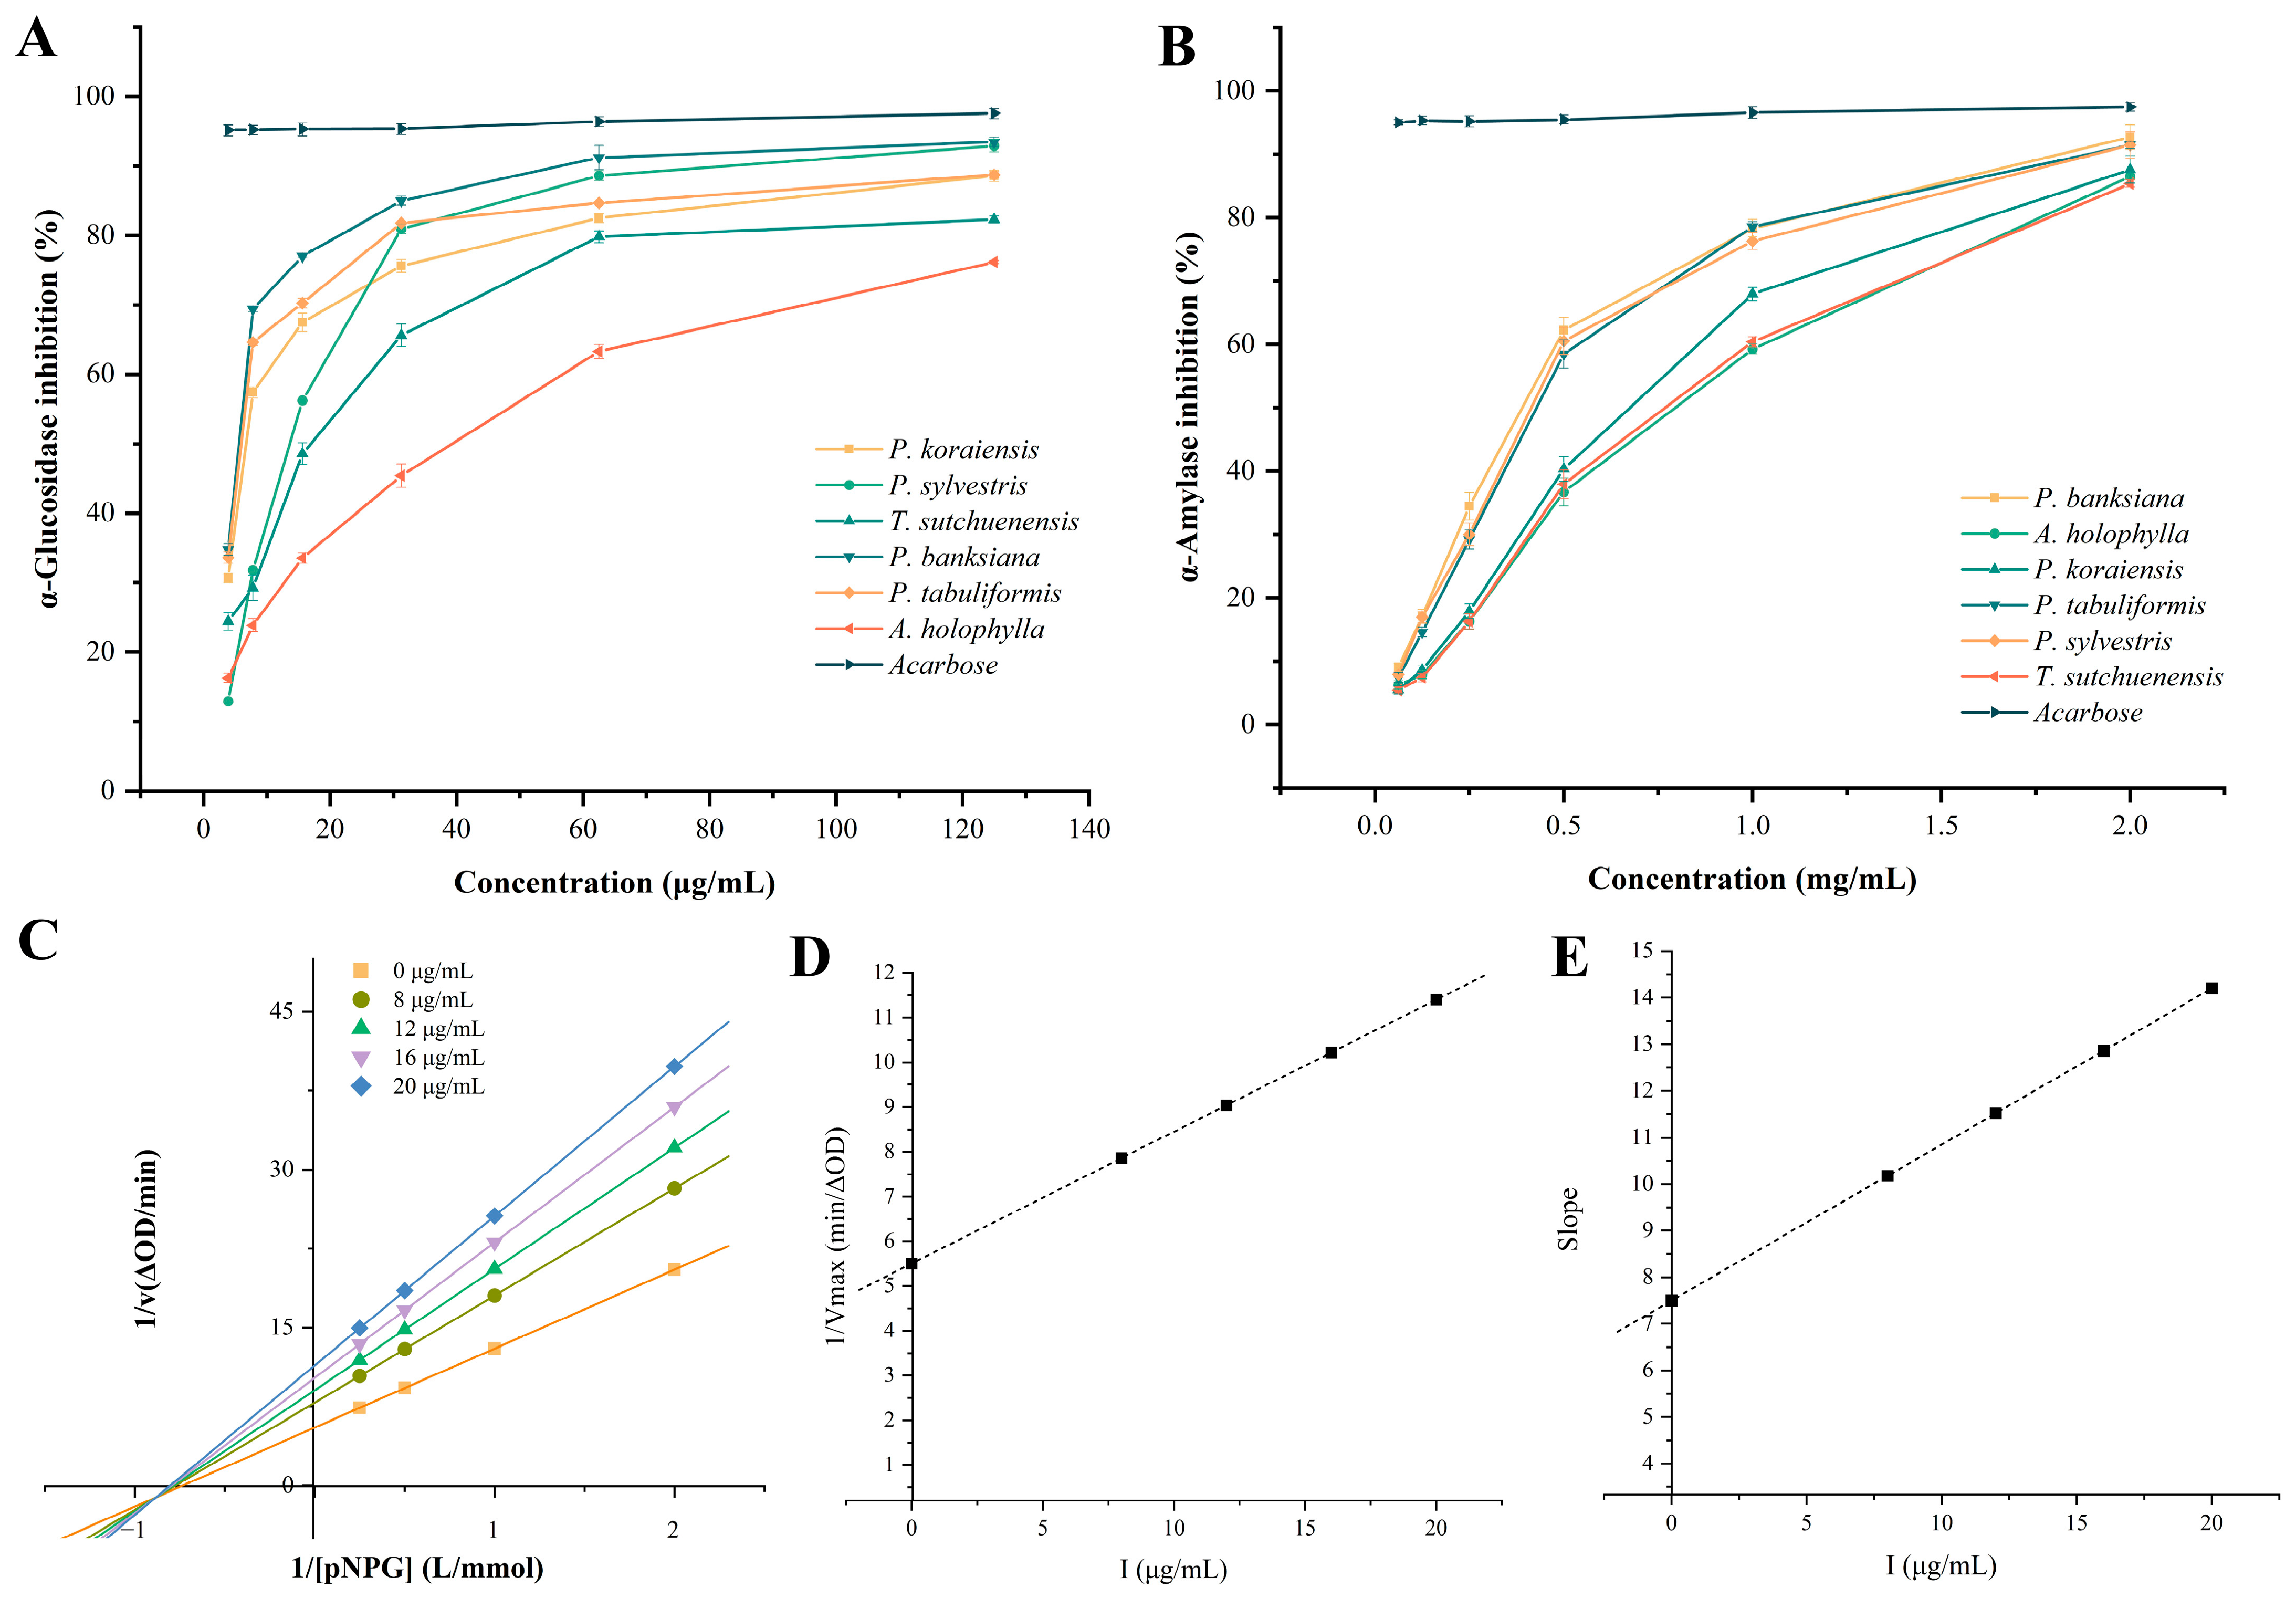
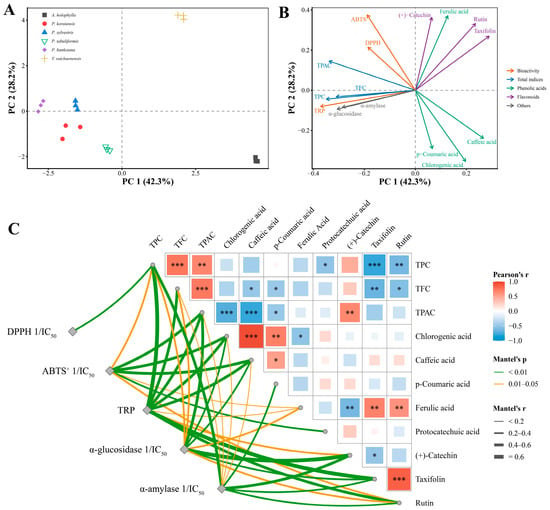
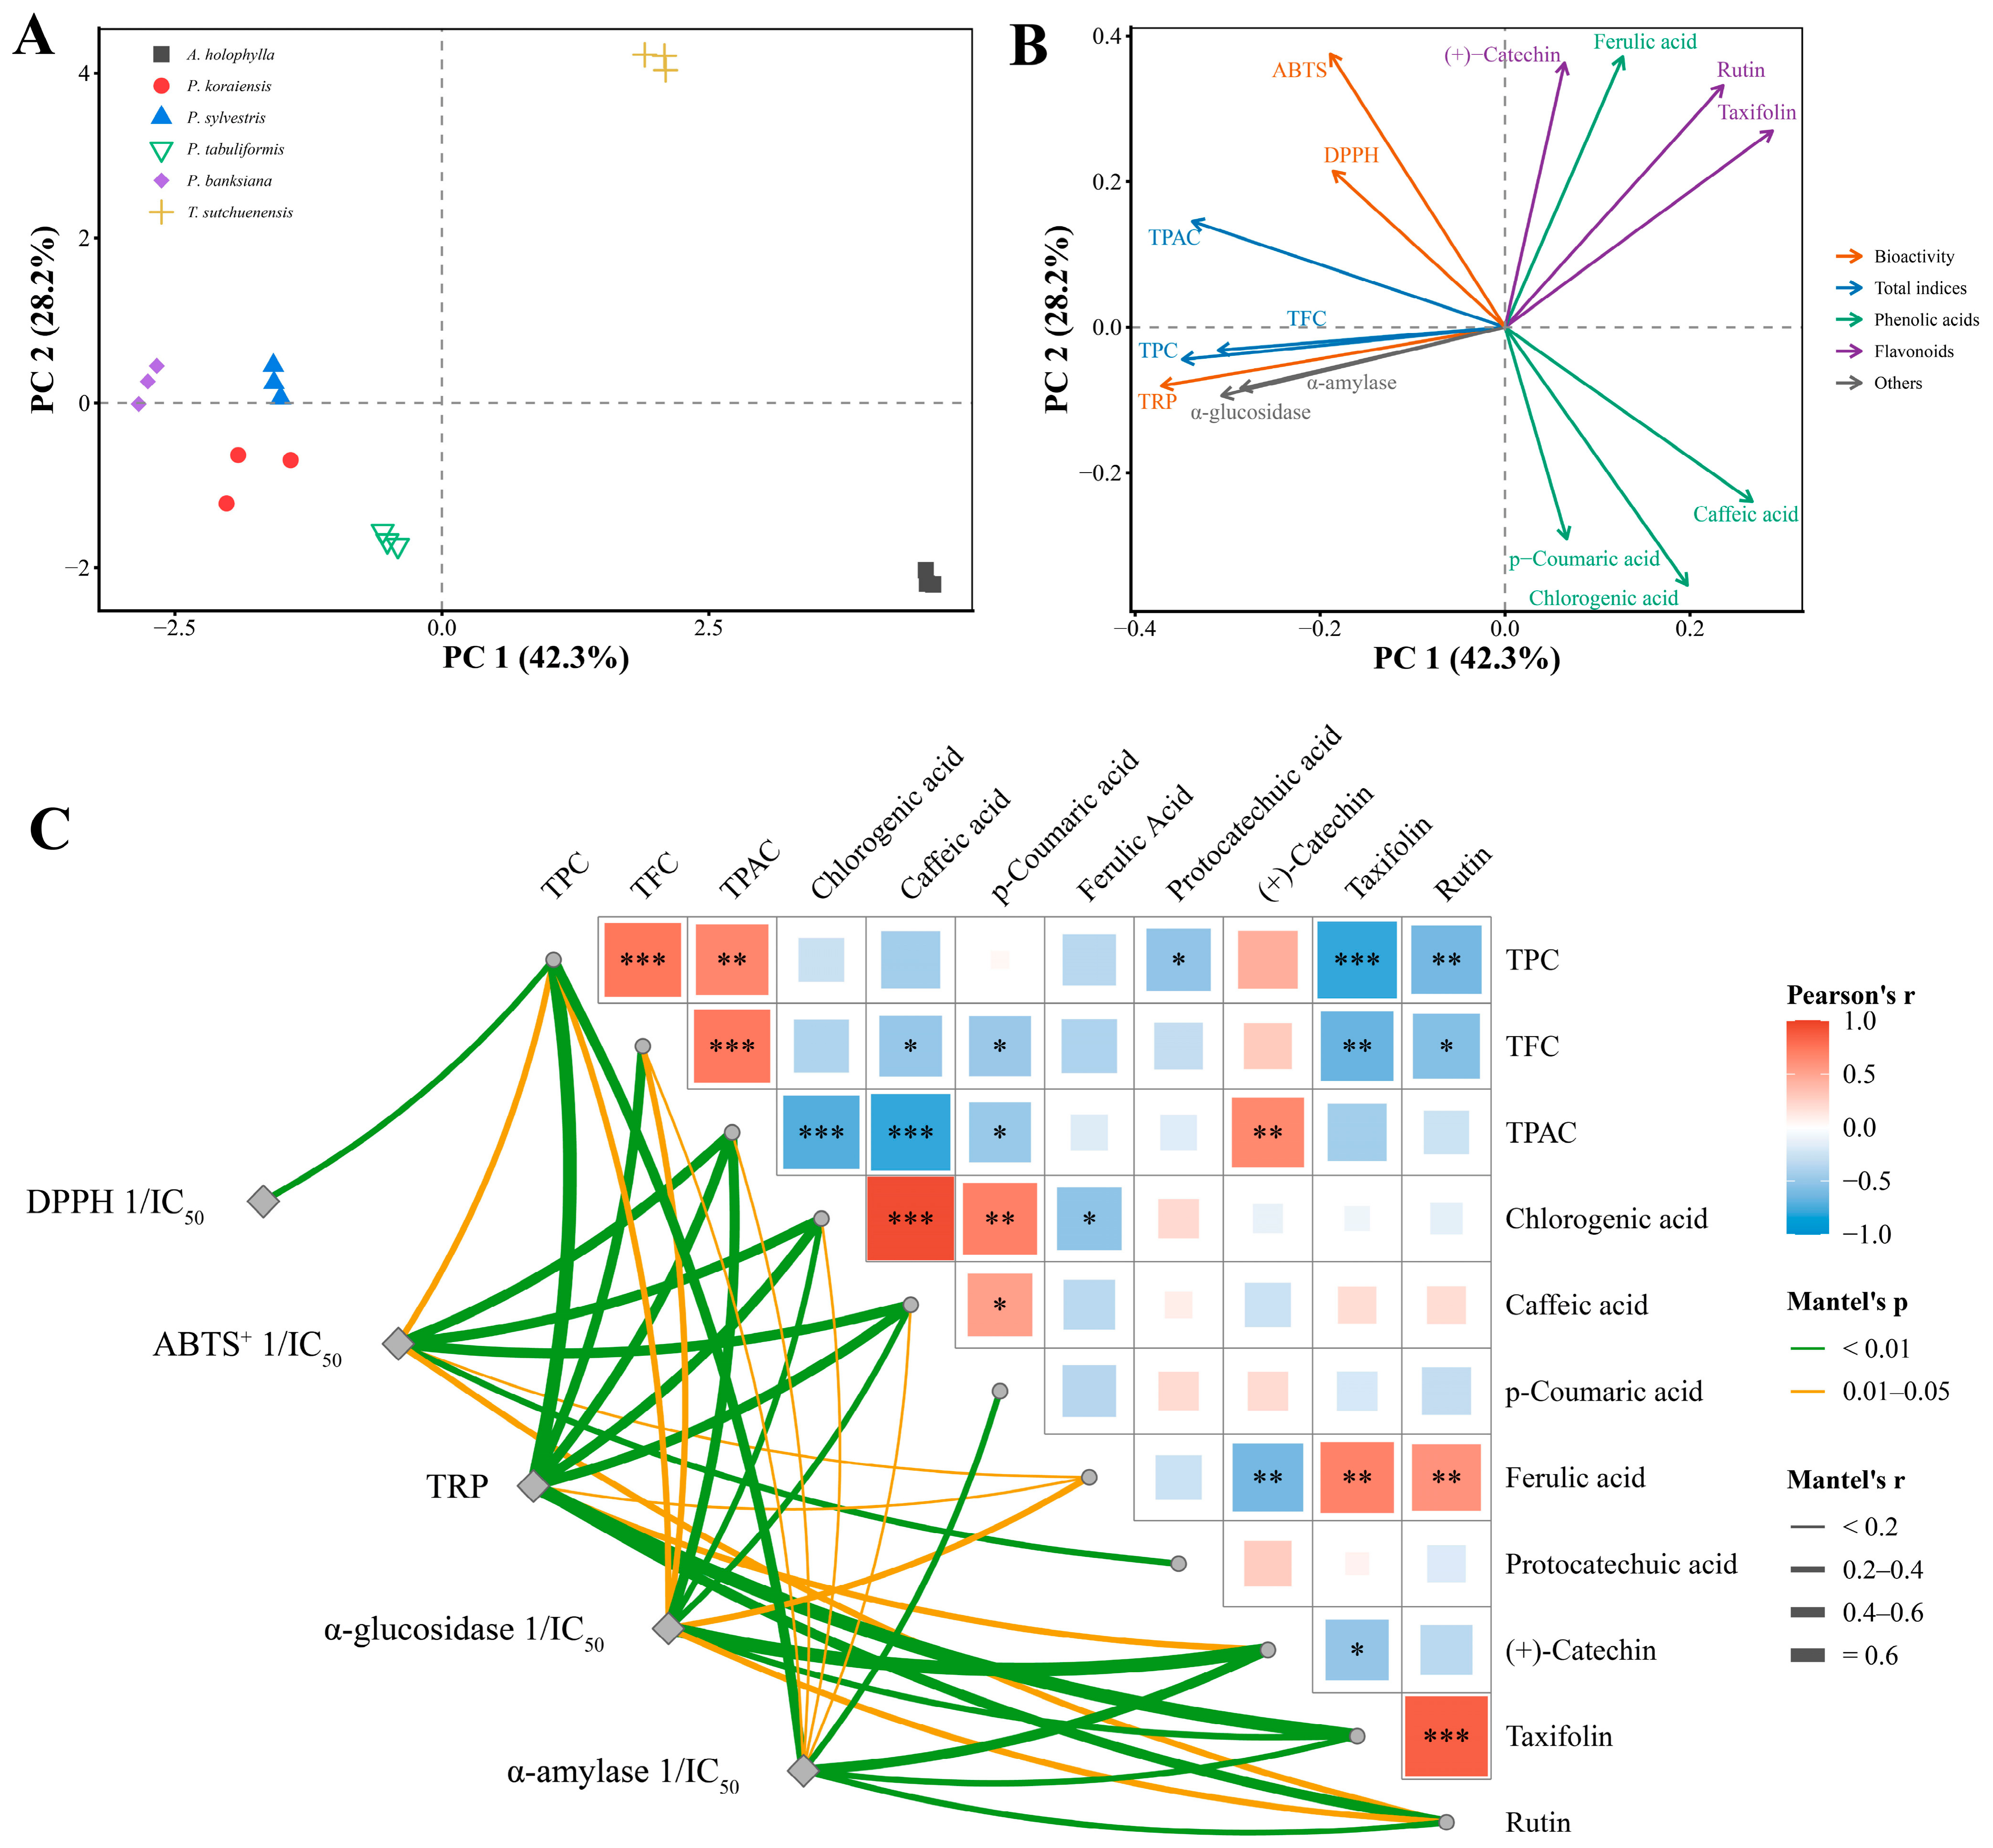
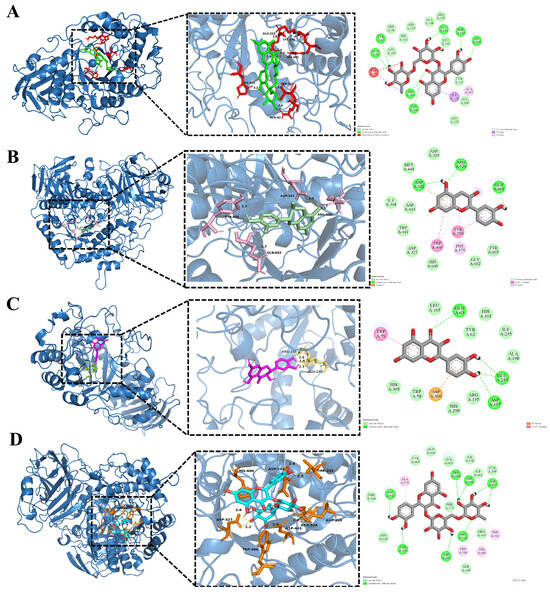
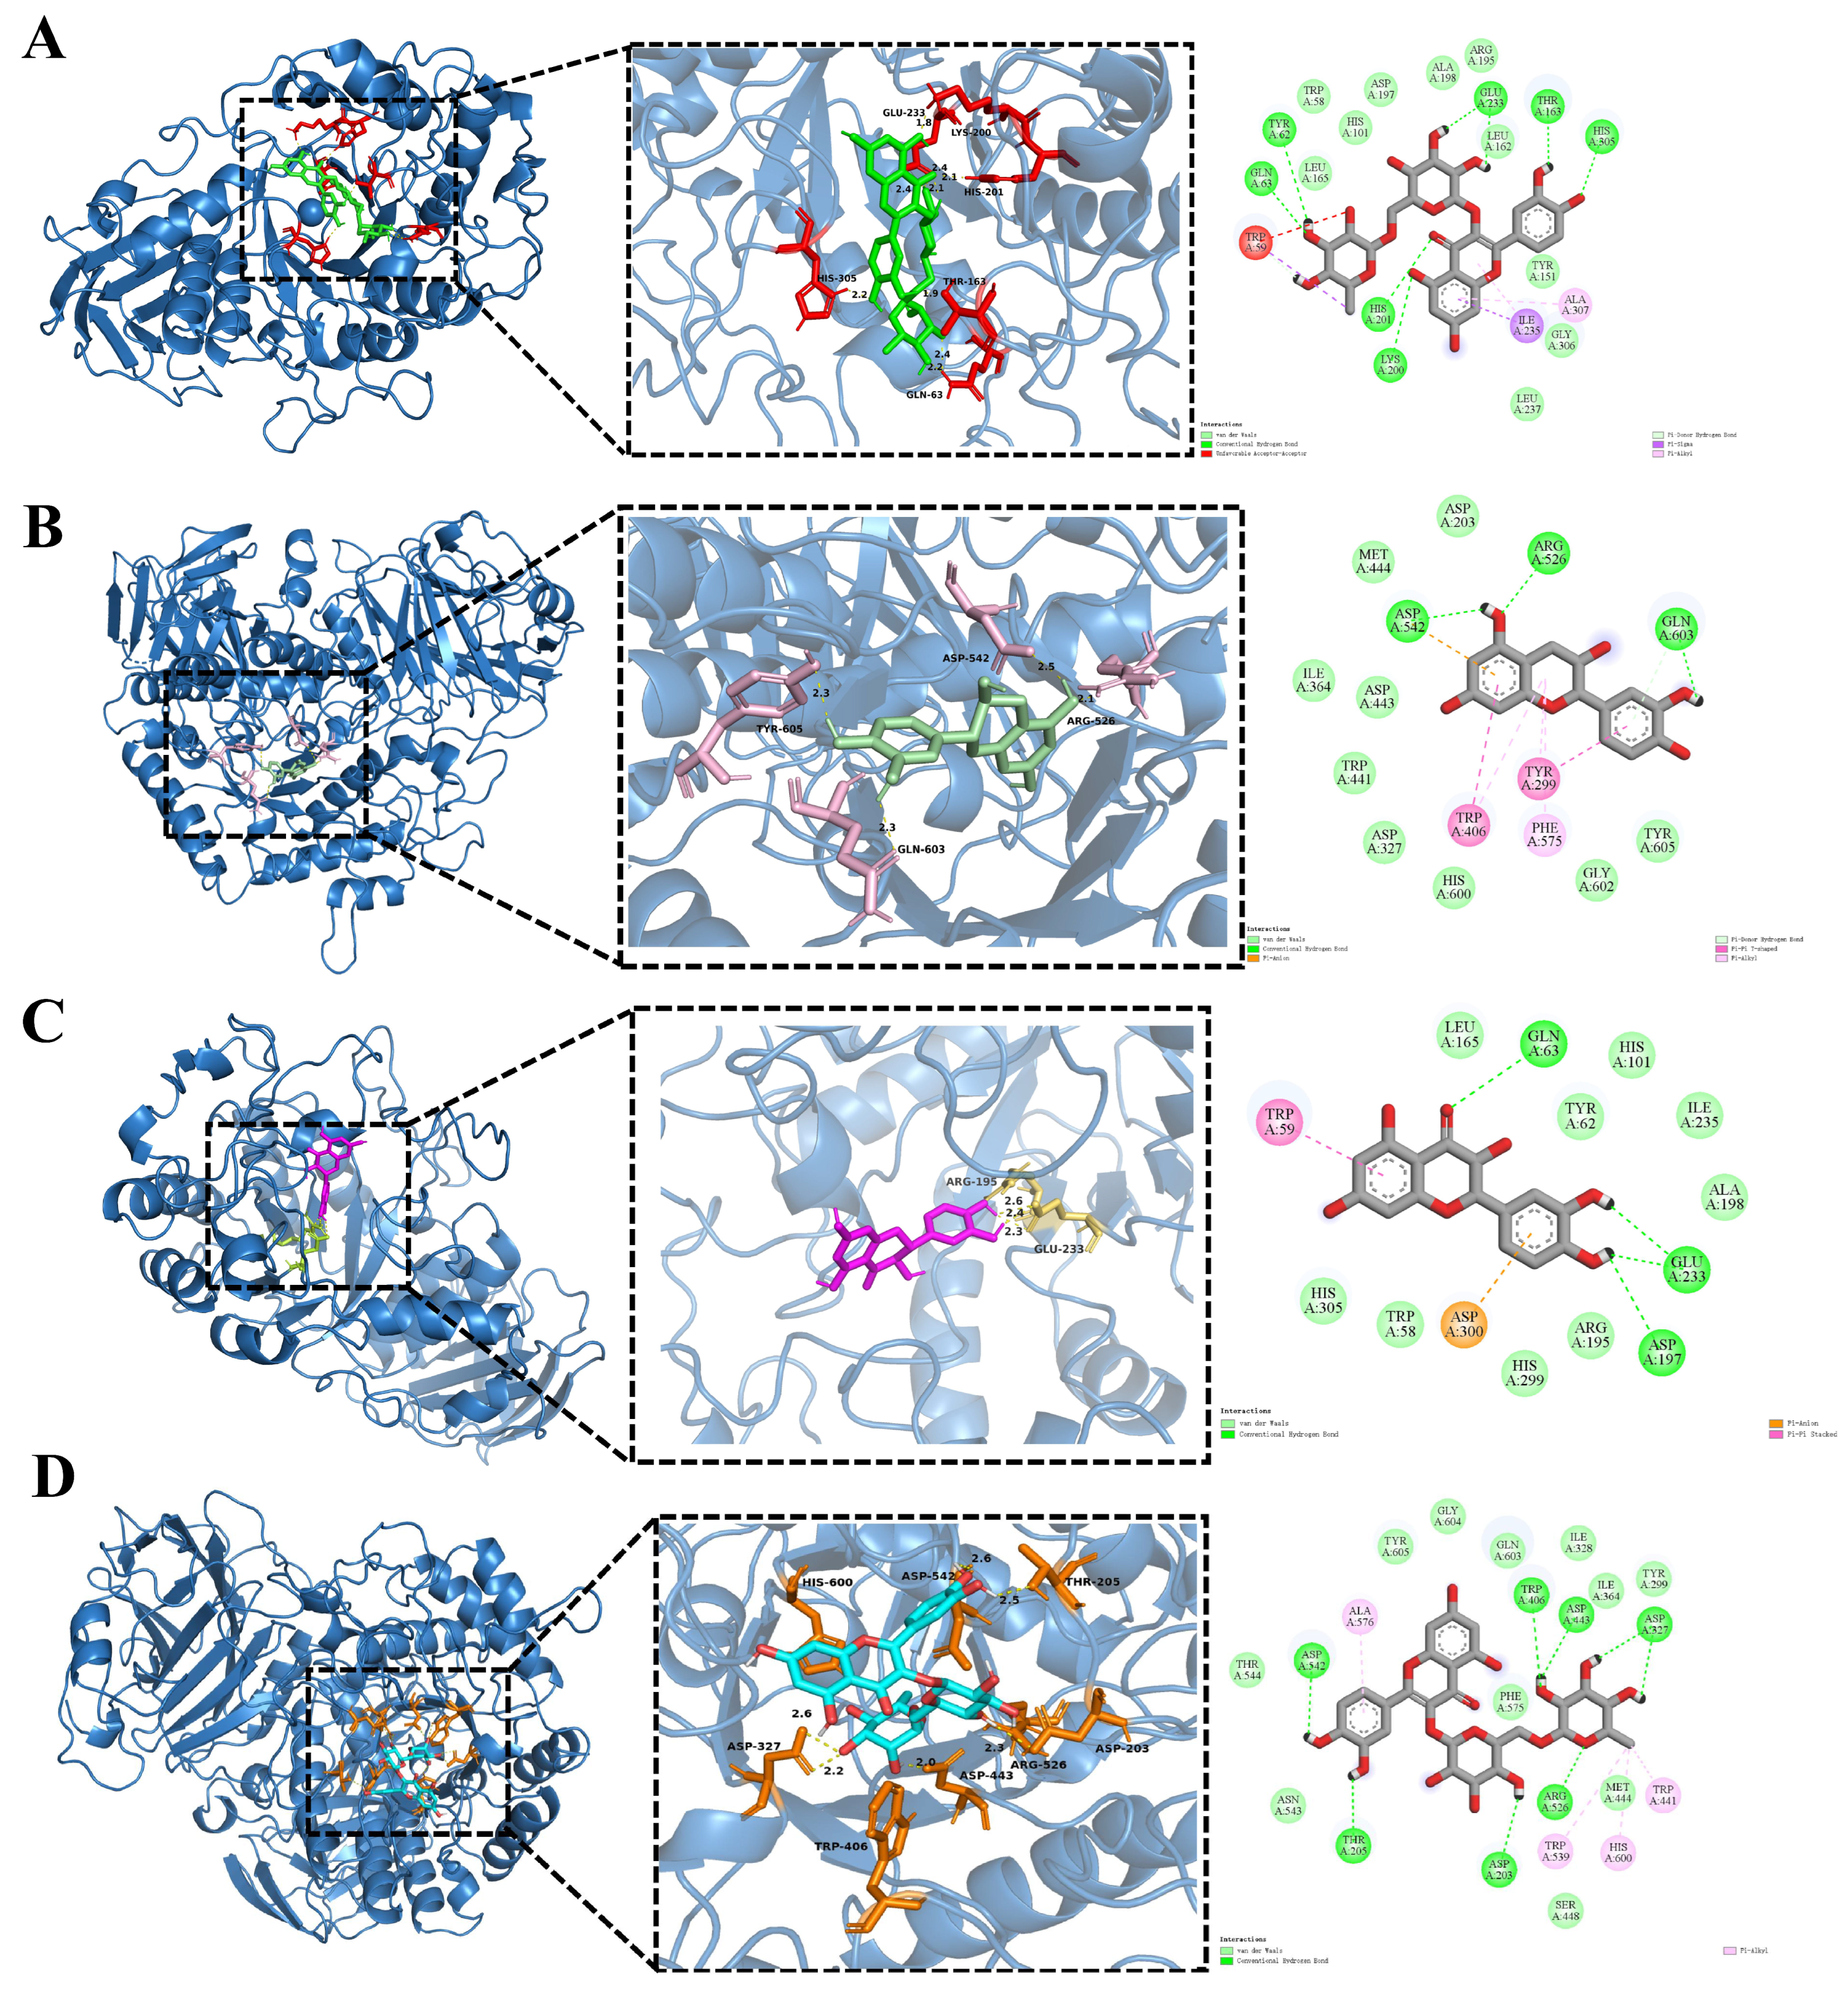

Disclaimer/Publisher’s Note: The statements, opinions and data contained in all publications are solely those of the individual author(s) and contributor(s) and not of MDPI and/or the editor(s). MDPI and/or the editor(s) disclaim responsibility for any injury to people or property resulting from any ideas, methods, instructions or products referred to in the content. |
© 2026 by the authors. Licensee MDPI, Basel, Switzerland. This article is an open access article distributed under the terms and conditions of the Creative Commons Attribution (CC BY) license.