


Abstract
Iron overload induces oxidative stress, lipid peroxidation, and inflammatory responses, collectively contributing to cellular and tissue injury. Although synthetic iron chelators are widely used in clinical practice, their associated adverse effects and treatment-related costs highlight the need to investigate naturally derived compounds as potential alternative therapeutic agents. This study comprehensively evaluated the iron-chelating, antioxidant, and anti-inflammatory properties of hazelnut samples encompassing Giresun-quality (Beşikdüzü, Vakfıkebir, and Çarşıbaşı), Levant-quality (Araklı, Arsin, and Yomra), and Pikola-type varieties, alongside extracts derived from defatted hazelnut pulp. Following qualitative and quantitative phytochemical characterization, antioxidant capacity was assessed using DPPH, CUPRAC, FRAP, and TOAC assays, while iron-binding capacity was evaluated under simulated gastric (pH 2) and intestinal (pH 6) conditions using atomic absorption spectroscopy and the ferrozine assay. To investigate hepatic protection, the iron-chelating potential of the extracts was examined in Hep3B cells exposed to iron overload. Extract C (80% ethanolic extract of ground hazelnuts) exhibited the most pronounced iron-chelating activity, achieving iron-binding efficiencies of 77–88% under simulated gastrointestinal conditions and 90% in the ferrozine assay, while decreasing intracellular iron accumulation in Hep3B cells by approximately 83–84%. Furthermore, Extract C effectively mitigated iron-induced oxidative stress, as evidenced by reduced malondialdehyde (MDA) levels and the restoration of glutathione (GSH), superoxide dismutase (SOD), and catalase (CAT). In lipopolysaccharide (LPS)-stimulated RAW 264.7 macrophages, the extracts additionally suppressed nitrite accumulation and decreased prostaglandin E2 (PGE2), interleukin-6 (IL-6), and tumor necrosis factor-α (TNF-α) levels. Our findings highlight the potential of hazelnut-based extracts as therapeutic candidates for the management of iron overload owing to their iron-chelating, antioxidant, and anti-inflammatory properties.
1. Introduction
Metals are essential to biological systems, serving as structural components and participating in a wide range of biochemical processes. Among these, iron plays a pivotal role in maintaining physiological homeostasis through its involvement in oxygen transport, DNA synthesis and repair, cellular metabolism, and numerous enzymatic reactions [1,2]. The total iron content in a normal adult is approximately 3–4 g; most is in hemoglobin, with the remaining part stored in transferrin, ferritin, and hemosiderin [3]. Iron absorption and systemic distribution are tightly controlled by the hepcidin–ferroportin regulatory axis, which plays a central role in maintaining iron homeostasis. Dysregulation of this pathway can disrupt iron balance, potentially leading to pathological conditions associated with iron deficiency or overload [4,5].
Iron deficiency and iron deficiency anemia (IDA) are the most common micronutrient disturbances worldwide, affecting more than a quarter of the population. They contribute considerably to reduced quality of life in the form of fatigue, cognitive impairment, loss of productivity, and worsening of comorbidities [6]. The World Health Organization (WHO) recommends food-based interventions such as intake of iron-rich foods, fortification with absorption promoters, and reduction in inhibitors as a primary preventive measure [7]. In clinical practice, oral iron salts (ferrous sulfate, ferrous fumarate, ferrous gluconate) are used as first-line therapy; however, parenteral preparations must be used in malabsorption, non-compliance, or severe anemia [8,9]. Disturbance of iron homeostasis, however, is not only a matter of deficiency; excessive intake and accumulation can also lead to serious health conditions. Excessive iron burden triggers oxidative stress, lipid peroxidation, and cellular injury, resulting in toxicity [10,11,12].
Acute iron poisoning occurs predominantly in children younger than six years of age, in whom the ingestion of even a small number of iron-containing tablets can result in clinically significant toxicity [13]. In adults, it usually occurs because of suicide attempts, while in pregnancy, excessive supplementation and transfusion-dependent hematological diseases increase the risk [14]. The severity of acute iron toxicity is primarily determined by the dose of ingested elemental iron, with doses below 20 mg/kg generally considered nontoxic, doses of 20–40 mg/kg associated with mild to moderate toxicity, and doses of 60 mg/kg or higher posing a substantial risk of severe poisoning [15]. Pathophysiologically, iron toxicity exerts direct corrosive effects on the gastrointestinal tract and causes metabolic damage at the cellular level. Hemorrhagic necrosis of the mucosa, vomiting, diarrhea, hypovolemia, and perforation may occur, while mitochondrial oxidative phosphorylation is impaired, ATP synthesis decreases, reactive oxygen species (ROS) increase, and multi-organ damage develops [14]. Chronic conditions such as hereditary hemochromatosis and multiple transfusions are characterized by progressive parenchymal iron accumulation [3,16].
The aim of iron toxicity treatment is to reduce absorption, bind circulating iron, and decrease tissue load [17]. Chelation therapy commonly involves parenteral desferrioxamine (DFO) and oral agents such as deferiprone (DFP) and deferasirox (DFX) [16]. Nevertheless, the clinical use of these agents is associated with several limitations, including the risk of serious adverse effects, high treatment costs, potential depletion of essential minerals due to nonselective chelation, and the need for regular clinical monitoring [18,19,20,21]. Phlebotomy is effective especially in hereditary hemochromatosis, but it cannot be applied in patients prone to anemia or dependent on transfusions, and it carries the risk of intolerance due to blood volume changes [3,16].
Achieving optimal therapeutic outcomes with iron chelation therapy requires regular monitoring of treatment efficacy and potential adverse effects. However, the clinical application of existing iron chelation therapies is associated with several limitations. The clinical application of certain iron chelators is limited by the need for parenteral administration under medical supervision, which may reduce treatment accessibility and patient convenience. Furthermore, concerns regarding the safety and tolerability of available oral chelation therapies highlight the need for alternative treatment strategies. Furthermore, the rapid and effective elimination of toxic metals from both the bloodstream and soft tissues remains a significant therapeutic challenge. Taken together, these challenges emphasize the need for novel therapeutic approaches that combine efficacy, safety, affordability, and oral administration in the management of iron toxicity.
At this point, natural compounds stand out for their chelating capacity as well as antioxidant properties. Compounds such as phytic acid and polyphenols have been shown to inhibit iron absorption [22,23,24]. Hazelnuts contain a diverse range of bioactive compounds, some of which may contribute to their potential iron-chelating properties. Hazelnut (Corylus avellana L.), one of Turkey’s strategic agricultural products, is particularly noteworthy in this context. Turkey accounts for 64% of global hazelnut production [25]. Hazelnuts are not only nutritionally rich but also pharmaceutically valuable due to their content of bioactive compounds with potential chelating properties.
Hazelnuts contain an oleic acid–rich lipid fraction, vitamins such as tocopherols, folic acid, and ascorbic acid, amino acids including arginine and leucine, and minerals such as K, Mg, Ca, Zn, and Fe [26]. In addition, hazelnuts are a strong source of phytic acid and various phenolic compounds, which can form insoluble complexes with multivalent cations like iron, thereby reducing absorption [27]. Beyond phytic acid, hazelnut polyphenols including quercetin, chlorogenic acid, catechin, epicatechin, and tannins exhibit strong antioxidant activity and are also capable of binding Fe (II) and Cu (II) ions [28,29]. Thus, hazelnut constituents have the dual ability to both reduce iron absorption and suppress iron-induced oxidative stress.
Recent in vitro and in vivo studies have shown that phytic acid chelates iron, reduces lipid peroxidation and free radical production, and exerts hepatoprotective effects in animal models exposed to high doses of iron [30,31,32]. Similarly, the tocopherol and phenolic content of hazelnut extract have been reported to provide protective effects against oxidative DNA damage [33]. These findings suggest that hazelnuts should be considered not only as a food but also as a natural source of chelators and antioxidants.
In this study, hazelnut and defatted hazelnut pulp samples from different regions were mainly evaluated for their iron-binding capacity. Different extraction methods, including water and hydroalcoholic extraction, were applied to obtain various extracts from whole and ground hazelnuts. The chemical composition of the extracts was analyzed by focusing on phenolic compounds and flavonoids. The iron-binding activity of the extracts was determined using the ferrozine method and a simulated gastrointestinal model representing stomach and intestinal conditions. In addition, antioxidant activity was evaluated using common in vitro assays such as FRAP, DPPH, TOAC, and CUPRAC. The intracellular iron-binding activity and protective effects against oxidative stress were also tested in Hep3B cells. Finally, the anti-inflammatory effects were evaluated in LPS-stimulated RAW264.7 cells by measuring nitrite and cytokine levels. Overall, these findings provide a comprehensive evaluation of hazelnut extracts, highlighting their potential as natural agents for iron chelation and related biological effects.
2. Materials and Methods
2.1. Collection of Hazelnuts and Hazelnut By-Products/Plant Materials
Fresh in-shell hazelnuts (Giresun, Levant quality, and Pikola type) were obtained directly from local producers in August 2021. The Giresun and Levant varieties were supplied by Trabzon Tarım A.Ş. (Trabzon, Türkiye). Samples were identified by Prof. Dr. Erdem Yeşilada. Hazelnut specimens collected from Araklı (Herbarium No. 2021-021), Arsin (Herbarium No. 2021-022), Yomra (Herbarium No. 2021-023), Beşikdüzü (Herbarium No. 2021-024), Vakfıkebir (Herbarium No. 2021-025), and Çarşıbaşı (Herbarium No. 2021-026) in Trabzon, Türkiye were prepared as voucher specimens and deposited in the Herbarium of the Faculty of Pharmacy, Yeditepe University. In addition, defatted hazelnut pulp was obtained from a regional hazelnut oil producer as a by-product of hazelnut oil extraction. Since Pikola-type hazelnuts and defatted hazelnut pulp originated from materials collected at different locations across the Black Sea Region rather than from a specific collection site, voucher specimens were not prepared, and no herbarium numbers were assigned to these samples. Therefore, these samples can be considered botanically representative of the Black Sea Region.
All samples were stored at +4 °C until further analyses. Prior to extraction, shells were removed and either whole hazelnut samples composed of kernel and testa or grounded samples were subjected to the extraction procedure. In addition, defatted hazelnut pulp was directly extracted according to the described method in Section 2.2.
2.2. Extraction Methods
For the hydroalcoholic extract (Extract A1), 30 g of each whole hazelnut (kernel with testa) variety was extracted with 150 mL of 80% ethanol using a sonicator for 2 h. After sonication, it was filtered through a single layer of filter paper, and the filtrates were concentrated using a rotary evaporator under reduced pressure at 40 °C (330 to 70 mbar, 40 rpm). The concentrated extracts were stored at −20 °C overnight and subsequently lyophilized.
The whole hazelnut samples, which were subjected to hydroalcoholic extraction, were first air-dried. Then, these samples were ground and re-extracted with pre-heated distilled water (80–83 °C) (Extract A2) using the same procedure as described before. In addition, defatted hazelnut pulp was subjected to the same procedure.
To obtain aqueous extracts of whole hazelnut variety (kernel with testa) named as Extract B, 30 g of hazelnut was extracted with 150 mL of water (80–83 °C) using a sonicator for 2 h. Then, it was filtered and lyophilized.
An additional hydroalcoholic extract, named Extract C, was prepared as Extract A1. However, in this extraction, ground hazelnut samples and defatted hazelnut pulp were used rather than whole hazelnuts. After filtration and evaporation, the rest was lyophilized. Figure 1 provides a summary of the extraction methods.
Figure 1.
Summary of extraction methods.
2.3. HPTLC-Based Qualitative Phytochemical Analysis
Each lyophilized aqueous hazelnut extract (Extract A2 and B) was dissolved in distilled water, filtered through a 0.45 µm PTFE syringe filter to prepare a final concentration of 50 mg/mL. Similarly, hydroalcoholic extracts (Extract A1 and C) were dissolved in methanol to obtain a concentration of 50 mg/mL. These samples were used for chemical profiling by high-performance thin-layer chromatography (HPTLC).
Standard compounds used for HPTLC analyses included phytic acid, gallic acid, protocatechuic acid, chlorogenic acid, neochlorogenic acid, quercetin, quercitrin, rutin, catechin, epicatechin, epigallocatechin gallate, epicatechin gallate, and procyanidin B2. Each standard was prepared individually in methanol at 1 mg/mL or 200 µg/mL. All standard solutions were stored at 4 °C and diluted prior to use.
For the HPTLC analysis of phytic acid, standard solution (5 and 8 µL) and each sample test solution (2 µL) were applied onto cellulose HPTLC plates (20 cm × 10 cm, Merck, Darmstadt, Germany) using a semi-automatic Linomat 5 applicator (Camag, Muttenz, Switzerland) equipped with a 100 µL Hamilton syringe. A mixture of 1-propanol:acetic acid:formic acid:water (16:4:18:2, v/v/v/v) was utilized as the developing solvent system for the separation of phytic acid in sample solutions [34].
Regarding flavonoids, a standard mixture containing rutin, quercetin, and quercitrin was applied to HPTLC silica gel 60 F254 glass plates under the same conditions. Samples were applied in duplicate at volumes of 5 and 10 µL, respectively. To achieve the chromatographic separation, an ethyl acetate:formic acid:water (40:4:4, v/v/v) solvent system was employed [35].
For the analysis of phenolic acids, gallic acid, protocatechuic acid, chlorogenic acid, and neochlorogenic acid were applied both individually (2 µL) and as a standard mixture (5 and 10 µL). Furthermore, each sample test solution (10 µL) was applied onto HPTLC silica gel 60 F254 glass plates (20 cm × 10 cm, Merck, Darmstadt, Germany). A mixture of ethyl acetate:dichloromethane:formic acid:acetic acid:water (100:25:10:10:11, v/v/v/v/v) was used as the developing solvent system for the separation of these phenolic compounds [36].
Lastly, for catechin derivatives and procyanidin B2, standard solutions of catechin, epicatechin, epicatechin gallate, epigallocatechin gallate, and procyanidin B2 were applied both individually (2 µL) and as a standard mixture (2, 5, and 8 µL). Additionally, each sample test solution (10 µL) was applied onto HPTLC silica gel 60 F254 glass plates. To obtain the chromatographic separation, the upper phase of an ethyl acetate:formic acid:water (10:1:4, v/v/v) mixture was utilized [37]. Plates were developed up to a distance of 70 mm from their lower edge in saturated twin-trough chambers (20 cm × 10 cm, Camag) with related developing solvent system. After development, the plates were dried using cold air and then derivatized as follows:
- (a)
- For phytic acid investigation, plates were dipped into a methanolic solution containing 8 mM ammonium heptamolybdate, 0.1 M HCl, and 0.5 M HClO4. Following immersion, the plates were exposed to 366 nm UV light for 5 min [34].
- (b)
- For phenolic acids and flavonoids, plates were heated on a TLC heater (Camag) at 100 °C for 3 min and then dipped into natural products (NP) and polyethylene glycol (PEG) 400 derivatization reagents, respectively [36].
- (c)
- For catechin derivatives and procyanidin B2, plates were dipped in 4-dimethylaminocinnamaldehyde (DMACA) reagent. To prepare DMACA reagent, 0.0600 g of DMACA was accurately weighed and dissolved in 13 mL of HCl, and the solution was subsequently diluted to a final volume of 200 mL with MeOH [38].
Finally, the plates were documented at 366 nm for the visualization of the investigated phenolic compounds and under white light for phytic acid and proanthocyanidins. All instruments were operated via winCATS software (Camag, Version 1.4.8.2031).
2.4. Quantitative Analysis (In Vitro Methods)
2.4.1. Phytic Acid Quantification
Phytic acid content was determined using a commercial kit (Megazyme, K-PHYT, Bray, Ireland), based on the colorimetric molybdenum blue method, where released phosphate forms a measurable complex [39]. Extracts were treated with 0.66 M HCl and incubated overnight at room temperature under constant rotation. After centrifugation and neutralization with NaOH, total and free phosphorus levels were determined following the kit protocol. Absorbance was measured at 655 nm using a UV-Vis spectrophotometer (Agilent 8453, Agilent Technologies, Santa Clara, CA, USA). All samples were analyzed in triplicate to ensure reproducibility. Phytic acid content was expressed as g phytic acid per 100 g dry extract.
2.4.2. Total Phenolic Content (TPC) Assay
TPC was measured using the Folin–Ciocalteu method. Gallic acid was used as the calibration standard. In a 96-well plate, 20 µL of sample or standard, 100 µL of diluted Folin–Ciocalteu reagent, and 75 µL of 20% Na2CO3 were added. After 30 min of incubation in the dark at room temperature, absorbance was read at 690 nm. Results were expressed as mg gallic acid equivalent (GAE)/g extract [40]. Each extract was tested in at least three independent wells.
2.4.3. Total Flavonoid Content (TFC) Assay
TFC was determined colorimetrically using quercetin as the reference compound. In a 96-well plate, sample or standard, ethanol, sodium acetate, and AlCl3 were sequentially added. After incubation at room temperature for 30 min in the dark, absorbance was recorded at 405 nm [41]. Results were expressed as mg quercetin equivalent (QE)/g extract. All measurements were performed in triplicate and averaged.
2.4.4. Total Condensed Tannins (Proanthocyanidins; PA) Assay
Proanthocyanidin content was measured using the vanillin-HCl method with catechin hydrate as standard. In a 12-well plate, 250 µL of 1% vanillin solution, 250 µL of methanol-HCl, and 100 µL of sample or standard were added and incubated at 30 °C for 20 min. Afterwards, 300 µL of the reaction mixture was transferred to a 96-well plate, and absorbance was measured at 492 nm [42]. The results were expressed as mg catechin equivalent (CE)/g extract. Proper controls and blank solutions were included in each assay.
2.4.5. Quantification of Oxalic Acid Content
Oxalic acid was extracted by boiling 0.5 g of sample with 0.25 N HCl and quantified using a colorimetric method based on indole-sulfuric acid reaction. The resulting pink-purple complex was formed by reacting oxalic acid with freshly prepared indole reagent, followed by incubation at 90 °C for 45 min. Absorbance was measured at 525 nm. Standard curves were prepared using known concentrations of oxalic acid. All procedures were carried out under identical conditions to minimize variability [43].
2.4.6. Total Protein Determination
Protein content in the extracts was assessed by the Lowry method using BSA (Bovine Serum Albumin) as the standard [44]. In a 96-well plate, 50 µL of sample or standard was mixed with 50 µL of freshly prepared copper reagent. After 10 min of incubation at 25 °C, 150 µL of diluted Folin–Ciocalteu phenol reagent was added and the plate was incubated at 50 °C for another 10 min. Absorbance was read at 660 nm, and protein concentration was calculated using a standard curve [45]. All experiments were conducted in triplicate for statistical accuracy.
2.5. In Vitro Evaluation of Antioxidant Activity
2.5.1. Ferric Reducing Antioxidant Power (FRAP) Assay
This method evaluates the electron-donating ability of antioxidants by reducing ferric (Fe3+) to ferrous (Fe2+) ions, providing insight into reductive antioxidant potential. The FRAP assay was performed using a reagent prepared from acetate buffer, TPTZ (2,4,6-tripyridyl-s-triazine) in HCl, and FeCl3·6H2O. After mixing extract or standard with dH2O and FRAP reagent in a 96-well plate, the mixture was incubated at 37 °C for 30 min. Absorbance was measured at 595 nm using a spectrophotometer (Thermo Fisher Scientific™, Waltham, MA, USA). Results were expressed as mM FeSO4 equivalents per gram of extract [46].
2.5.2. DPPH (2,2-Diphenyl-1-picrylhydrazyl) Radical-Scavenging Activity Assay
The assay is based on the ability of antioxidants to quench stable DPPH free radicals, resulting in a measurable decrease in absorbance. The antioxidant capacity was also assessed by the DPPH radical scavenging method. BHT was used as a reference standard [47]. In a 96-well plate, 50 µL of extract or standard was mixed with 250 µL of DPPH solution. After incubation for 50 min at 25 °C in the dark, absorbance was measured at 517 nm. Results were expressed as % inhibition and IC50 values (mg/mL).
2.5.3. Cupric Ion Reducing Antioxidant Capacity (CUPRAC) Assay
This assay evaluates the reduction of Cu2+ to Cu+ by antioxidants, which forms a colored complex with neocuproine, allowing quantitative measurement of reducing power. CUPRAC reagent was prepared using CuSO4, neocuproine, and ammonium acetate. In a 96-well plate, CuSO4, neocuproine and ammonium acetate were mixed with 43 µL of extract or standard, and dH2O [48]. After incubation at 50 °C for 20 min, absorbance was measured at 450 nm. Results were expressed as mg ascorbic acid equivalent (AAE)/g extract.
2.5.4. Total Antioxidant Capacity (TOAC) Assay
The method estimates the total antioxidant content based on the reduction of Mo (VI) to Mo(V), reflecting the cumulative antioxidant effect of all redox-active compounds in the extract. TOAC was assessed based on the phosphomolybdate method. Extracts were incubated with 300 µL of reagent containing sulfuric acid, sodium phosphate, and ammonium molybdate in a 96-well plate [46]. After incubation at 95 °C for 90 min, the plate was cooled, and absorbance was measured at 695 nm. Ascorbic acid was used as a standard, and results were expressed as mg AAE/g extract.
2.6. In Vitro Evaluation of Iron-Binding Properties
2.6.1. Assessment of Iron-Binding Capacity Under Simulated Gastric and Intestinal Conditions
Iron absorption primarily occurs in the duodenum and proximal jejunum, where iron is absorbed mainly in its ferrous (Fe2+) form. This process is regulated by iron-binding proteins such as ferritin and transferrin, which maintain systemic iron homeostasis [49,50]. Therefore, the iron-binding capacity of hazelnut extracts was evaluated under simulated gastric (pH 2) and intestinal (pH 6) conditions to investigate their potential effects on iron bioavailability. Sorenson phosphate buffers were prepared using 0.667 M NaH2PO4 and 0.667 M Na2HPO4 and adjusted to the desired pH with HCl. Iron (II) sulfate heptahydrate (FeSO4·7H2O) was added to each buffer. Briefly, 150 mg of extract was incubated with 10 mL of buffer at 37 °C and 125 rpm for 2 h [51,52]. Control groups consisted of buffer solutions with and without iron. After incubation, samples were filtered and the filtrates were collected for analysis. For iron quantification, filtrate was digested with concentrated HNO3 using a Multiwave GO Plus microwave digestion system (Anton Paar, Graz, Austria). Iron concentrations were determined by flame atomic absorption spectrophotometry (Zeenit 700, Analytik Jena, Jena, Germany) using external calibration with iron standards prepared from a 1000 µg/mL stock solution [53].
2.6.2. Ferrozine-Based Metal Chelation Assay
A 2 mM FeCl2·4H2O solution was prepared in methanol, and ferrozine solution was prepared in distilled water [54]. EDTA disodium was used as a standard at concentrations of 0.125–2 mg/mL. For hydroalcoholic extracts, samples were mixed with FeCl2 and methanol; for aqueous extracts, distilled water was used. After 5 min of incubation at 25 °C, ferrozine reagent was added and the mixture was incubated for 10 min at room temperature. Absorbance was measured at 570 nm in a 96-well plate, and results were expressed as percent metal chelation.
2.6.3. Cell Culture Studies
To further evaluate the in vitro antioxidant and anti-inflammatory activities of the hazelnut extracts, cell culture studies were conducted using Extract C, which demonstrated the highest iron-binding capacity in preliminary assays. Two different cell lines were selected for these studies: RAW264.7 murine macrophages were employed to investigate the anti-inflammatory effects, while Hep3B human hepatocyte carcinoma cells were used to assess the protective effects against oxidative stress.
2.7. Evaluation of the Protective Effect Against LPS-Induced Inflammation
2.7.1. Cell Viability in the RAW264.7 Cell Line
The RAW264.7 murine macrophage cell line was obtained from the American Type Culture Collection (ATCC, TIB-71, Manassas, VA, USA) and cultured in high-glucose DMEM supplemented with 10% fetal bovine serum (FBS) and 1% penicillin-streptomycin (10,000 U/mL and 10,000 µg/mL, respectively) [55]. Cells were maintained at 37 °C in a humidified incubator with 5% CO2. The cytotoxicity of hazelnut Extract C was evaluated using the MTT [3-(4,5-dimethylthiazol-2-yl)-2,5-diphenyltetrazolium bromide] assay. Cells were seeded in 96-well plates (5 × 10⁴ cells/well) and incubated for 24 h, followed by exposure to the extract at the maximum non-cytotoxic concentration of 1 mg/mL for an additional 24 h. After incubation with MTT solution for 2 h, formazan crystals were dissolved in isopropanol, and absorbance was measured at 570 nm (Thermo Fisher Scientific™, USA) [56]. Cell viability was calculated relative to untreated controls, and concentrations reducing viability below 70% were considered cytotoxic. The safe dose was used in subsequent anti-inflammatory and analgesic studies. The percentage of cell viability was calculated using the following equation:
Cell viability% = (AbsTreatment group)/(AbsControl group) × 100%
2.7.2. Determination of Nitrite and Inflammatory Cytokines
The anti-inflammatory activity of the extracts was evaluated in LPS-stimulated RAW264.7 macrophages by measuring nitrite (NO), TNF-α, IL-6, and PGE2 levels. RAW264.7 cells were seeded into 96-well plates at a density of 5 × 10⁴ cells/well and incubated for 24 h at 37 °C in a humidified atmosphere containing 5% CO2 [57]. Cells were pretreated with different concentrations of the extracts for 2 h and then stimulated with lipopolysaccharide (LPS, 1 µg/mL, Escherichia coli 0111:B4) for an additional 22 h. Indomethacin (100 µM) and L-NAME (100 µM) were included as positive controls [58]. Following incubation, culture supernatants were collected for the determination of inflammatory mediators. Nitrite production, as an indicator of nitric oxide (NO) generation, was determined using the Griess reaction, and absorbance was measured at 540 nm. Nitrite concentrations were calculated from a sodium nitrite standard curve. TNF-α and IL-6 levels were quantified using commercial ELISA kits (Invitrogen, Bender MedSystems GmbH, Vienna, Austria; catalog nos. BMS622 and BMS625, respectively) according to the manufacturer’s instructions [56,58], while PGE2 levels were measured using a commercial ELISA kit (Abcam, ab287802, Cambridge, UK) following the manufacturer’s protocol [59].
2.8. Evaluation of the Protective Effect of Extracts Against Oxidative Stress
The protective effect of the extracts against iron-induced liver damage was assessed using the Hep3B human hepatocyte cell line. Hep3B cells (ATCC, HB-8064, VA, USA) were cultured in high-glucose DMEM supplemented with 10% FBS and 1% penicillin-streptomycin (10,000 U/mL and 10,000 µg/mL, respectively) at 37 °C in a humidified incubator with 5% CO2.
2.8.1. Effects of Hazelnut C Extracts and Iron (II) Sulfate Heptahydrate on Cell Viability
The effects of hazelnut extracts on Hep3B cells were evaluated using the MTT colorimetric assay. Cells were seeded in 48-well plates at a density of 3 × 10⁴ cells/well and incubated for 24 h at 37 °C with 5% CO2 to allow cell adhesion [60]. Extracts were dissolved in DMSO, diluted in culture medium to a final concentration of 1 mg/mL, and applied to the cells. Iron (II) sulfate heptahydrate was tested in a concentration range of 2.5–50 mM to assess cytotoxicity. After 24 h of incubation, the MTT assay was performed as described above.
2.8.2. Determination of Malondialdehyde (MDA) Level
MDA, a marker of lipid peroxidation, was quantified using the thiobarbituric acid (TBA) assay. Hep3B cells were seeded in T-75 flasks and incubated at 37 °C until reaching 90% confluence. Cells were pretreated with 80% ethanolic hazelnut extracts for 2 h, followed by exposure to 15 mM FeSO4·7H2O for 22 h to induce oxidative stress. After exposure, cells were harvested, homogenized in PBS, and centrifuged for 15 min at 4 °C. The supernatant was mixed with TBA reagent, incubated at 90 °C for 30 min, cooled, and absorbance was read at 532 nm [61,62]. MDA levels were expressed as nmol/g protein.
2.8.3. Glutathione (GSH) Determination
Cellular glutathione levels were determined using Ellman’s reagent (DTNB), which reacts with thiol groups to form a yellow-colored product measurable at 412 nm. Supernatants from the MDA assay were used directly. Samples or GSH standards were mixed with Tris-EDTA buffer (pH = 8.2) and freshly prepared DTNB in a 96-well plate. After 5 min of incubation at room temperature, absorbance was recorded at 412 nm. GSH levels were calculated from a standard curve and expressed as µmol/g protein [63,64].
2.8.4. Determination of Catalase (CAT) Activity
Catalase activity was quantified using the carbonatocobaltate (III) complex formation method described by Hadwan [65]. Briefly, 50 μL of cell lysate was incubated with 10 mM hydrogen peroxide (H2O2) at 37 °C for 2 min to allow enzymatic decomposition of H2O2. The reaction was terminated by the addition of working solution containing phosphate buffer (pH 7.4), sodium bicarbonate, and cobalt (II) nitrate hexahydrate. The reaction mixtures were incubated in the dark for 10 min to enable formation of the carbonatocobaltate (III) complex. Subsequently, 250 μL aliquots were transferred to 96-well microplates, and absorbance was measured spectrophotometrically at 440 nm [64]. CAT activity was normalized to total protein content and expressed as U/mg protein. All measurements were performed in triplicate.
2.8.5. Determination of Superoxide Dismutase (SOD) Activity
Superoxide dismutase activity was determined according to a modified Marklund and Marklund method based on the inhibition of pyrogallol autooxidation [66]. Cell lysates were added to 150 μL of reaction mixture containing Tris–HCl buffer (pH 8.2) and EDTA in 96-well microplates. The reaction was initiated by the addition of 2 mM pyrogallol, and changes in absorbance were monitored at 420 nm for 450 s using a microplate reader. Absorbance values were recorded at 30 s intervals, yielding 15 sequential measurements. The initial reading obtained immediately after pyrogallol addition was considered as time zero. One unit of SOD activity was defined as the amount of enzyme required to inhibit 50% of pyrogallol autooxidation under assay conditions. Results were expressed as U/mL [67], and all experiments were conducted in triplicate.
2.8.6. Protein Determination (Lowry Method)
Protein concentrations of hazelnut extracts were determined according to the Lowry method [44], as described above, using a BSA standard curve, and were used to normalize MDA, GSH, SOD, and CAT results.
2.8.7. Assessment of Intracellular Iron Accumulation
To evaluate the effect of the extracts on intracellular iron accumulation, total iron content in Hep3B cells was measured using the ferrozine-based colorimetric method described by Riemer et al. (2004) [68]. Cells were cultured to 90% confluence, pretreated with hazelnut Extract C for 2 h, and then incubated with 15 mM iron sulfate heptahydrate (FeSO4·7H2O) for 22 h. After exposure, cells were washed with cold PBS containing 1 mM deferoxamine, homogenized in PBS, frozen overnight, and re-homogenized. Lysates were centrifuged, and the supernatant was treated with iron release reagent (HCl/KMnO4), incubated at 60 °C, and then reacted with an iron detection reagent containing ferrozine. Absorbance was measured at 550 nm in a 96-well plate. Iron concentrations were calculated using FeSO4·7H2O standard solutions and normalized to protein content determined by the Lowry method. Results were expressed as µmol iron per gram of protein.
2.9. Statistical Analysis
All experiments were performed in triplicate, and the results are presented as mean ± standard deviation (SD). Statistical analyses were conducted using GraphPad Prism software (version 8.0.1; GraphPad Software, San Diego, CA, USA). Differences among groups were analyzed using one-way analysis of variance (ANOVA) followed by Tukey’s multiple comparison test.
Pearson correlation analysis was performed to evaluate the relationships among phytochemical composition, antioxidant properties, iron-related activities, inflammatory mediators, and oxidative stress parameters. Correlation coefficients (r) and corresponding p values were calculated, and statistically significant correlations (p < 0.05) were visualized using a heatmap.
3. Results
3.1. Extraction Yield
The extraction yields obtained from different hazelnut types are presented comparatively in Supplementary Table S1. The results demonstrated that extraction yields varied depending on both the extraction method and the hazelnut variety.
3.2. Qualitative and Quantitative Analysis by HPTLC
3.2.1. Phytic Acid Content Analysis
The HPTLC chromatograms of the hazelnut extracts revealed that the phytic acid standard exhibited two distinct bands corresponding to the intact molecule and its phosphate groups (Supplementary Figure S1). Although phytic acid itself was not directly detected in the extracts, bands corresponding to phosphate groups were observed in all tested samples (Extract A1, A2, B, and C), showing similar retention behavior to the phosphate region of the standard. Differences in band intensity suggested variations in the amounts of phosphate groups among hazelnut varieties and collection regions. This finding is important for iron-binding capacity, since phytic acid contains phosphate groups and chelates iron ions mainly through these functional groups. Therefore, the detection of phosphate groups suggests that phytic acid-related compounds may play a role in iron metabolism and iron-binding activity.
3.2.2. Flavonoid Content Analysis
The HPTLC flavonoid profiles of the hazelnut extracts are given in Supplementary Figure S2. Mainly found flavonoids in hazelnut as quercetin and quercetin derivatives such as rutin (quercetin-3-O-rutinoside), quercitrin (quercetin-3-O-rhamnoside) [69,70,71] was analyzed in this study. According to the literature review, testa of the hazelnut mainly contains flavonoids compared to its kernel. In parallel, the results showed that quercitrin was predominantly found in Extract A1, which was obtained from the hydroalcoholic extract of hazelnut testa, compared to the other extracts. Furthermore, quercitrin was not detected in Extract A2, as expected, since these extracts were obtained from pre-extracted hazelnuts (Extract A1). Although Extracts A1 and B were prepared from whole hazelnuts, the higher abundance of quercitrin in Extract A1 can be attributed to the solvent used during extraction. While 80% ethanol was used in Extract A1, water was used in Extract B. Although both Extract A1 and C were obtained by hydroalcoholic extraction, dominant quercitrin content in Extract A1 can refer to the samples not being ground, allowing the solvent to come into direct contact with the testa surface.
Considering the iron-binding sites of quercetin, the quercitrin–iron chelation may occur between the 5-hydroxy-4-oxo group in the A and C rings and the catechol moiety in the B ring [72]. In terms of Extract A1, it may exhibit a stronger chelating effect compared to other extracts.
3.2.3. Phenolic Acid Content Analysis
In terms of phenolic content, gallic acid, protocatechuic acid, chlorogenic acid, and neochlorogenic acid, which have previously been reported in hazelnut samples [71,73] were investigated in Extracts A1, B, and C (Supplementary Figure S3). Moreover, due to the affinity of polar compounds during the initial extraction step in the preparation of hydroalcoholic extracts (A1), samples subjected to pre-extraction were not evaluated by HPTLC analysis, except for defatted hazelnut pulp (A2). Navy blue zones belonging to protocatechuic acid and gallic acid were determined dominantly in Extract A1. Regarding Extract B, all samples were found to contain protocatechuic acid whereas gallic acid was determined in some samples. Except from defatted hazelnut pulp (C), protocatechuic acid and gallic acid were mainly observed in Extract A1 and this could be because of testa which was more subjected to hydroalcoholic solvent. On the contrary, light blue zones could be a sign of chlorogenic acid presence in Extract C. Finally, extracts contained mainly gallic acid and protocatechuic acid may have potential to form chelates with iron ions because of bearing catechol or galloyl groups [74].
3.2.4. Catechin Derivatives and Procyanidin B2 Analysis
All extracts except those from re-extracted samples (A2) were analyzed to investigate catechin derivatives and procyanidin B2 (Supplementary Figure S4). In Extract A1, catechin derivatives and proanthocyanidins as procyanidin B2 were dominantly found. In addition, these compounds were found to be more intense in testa as in Extract A1 compared to grounded hazelnut as in Extract C. In particular, catechol groups in these compounds might tend to form iron chelates [75].
3.2.5. Phytic Acid Content of Hazelnut Extracts
Extract A2 exhibited the highest phytic acid content among the tested extracts, with the defatted hazelnut pulp sample consistently showing the greatest levels across all hazelnut types. Extract B showed moderate phytic acid levels, whereas Extracts A1 and C generally presented lower values (Table 1). Among the varieties, comparatively higher phytic acid contents were observed in Pikola and Çarşıbaşı samples.
Table 1.
Comparative phytochemical and biochemical characterization of different hazelnut extracts.
3.2.6. Total Phenolic, Flavonoid, and Proanthocyanidin Contents
Among the extraction methods evaluated, Extract C consistently exhibited the highest total phenolic content, with the Yomra sample yielding the greatest concentration (854.93 mg GAE/g dry extract), followed by Çarşıbaşı (599.75 mg GAE/g) and Beşikdüzü (577.61 mg GAE/g). Extract A1 also demonstrated notably high phenolic levels, particularly in Çarşıbaşı (532.07 mg GAE/g) and Beşikdüzü (493.32 mg GAE/g), whereas Extract B produced moderate values, and Extract A2 resulted in the lowest phenolic yields (Table 1). These results suggest that hydroalcoholic extraction, especially from ground samples, enhances the recovery of phenolic constituents.
With respect to total flavonoid content, Extract A1 presented the highest concentrations, notably in Beşikdüzü and Çarşıbaşı. Interestingly, whole hazelnut extracts (Extracts A1 and B) provided greater flavonoid yields than ground counterparts (Extracts A2 and C), implying that structural integrity of the sample may play a critical role in the retention of flavonoid compounds (Table 1).
Regarding condensed tannins (proanthocyanidins), Extract A1 again yielded the most pronounced results, with Beşikdüzü (2045.80 mg catechin hydrate/g), Çarşıbaşı (1449.80 mg/g), and Vakfıkebir (1349.80 mg/g) being particularly prominent. Extract B displayed intermediate tannin levels, while Extracts A2 and C exhibited substantially lower values.
3.2.7. Oxalic Acid Quantification
Quantitative analysis further revealed that the oxalic acid content (mg/g extract) differed markedly among hazelnut samples, with the Beşikdüzü variety consistently exhibiting the highest concentrations across nearly all extraction types, as demonstrated in Table 1.
3.2.8. Determination of Total Protein in Extracts
Proteins play a pivotal role in iron metabolism, particularly through the activity of iron-binding proteins such as ferritin and transferrin, which are essential for the transport, storage, and utilization of iron within the body. Proteins present in hazelnut extracts may interact with iron, thereby exhibiting iron-binding properties that could contribute to the attenuation of iron toxicity. The relatively high protein content of hazelnuts may enhance their capacity to interact with iron and, in combination with established iron-chelating agents, potentially provide a more effective therapeutic strategy. Total protein content of the extracts varied considerably depending on the solvent system and the hazelnut variety. Among the extraction methods, Extract A1 yielded the highest levels of protein, as shown in Table 1. Moreover, Çarşıbaşı, Beşikdüzü, and Vakfıkebir consistently demonstrated elevated protein concentrations across all extract types.
3.3. Antioxidant Activity of Hazelnut Extracts
The ferric reducing antioxidant power (FRAP) values of hazelnut extracts are presented in Table 2. The results showed that ferric reducing capacity varied considerably depending on extraction method and variety origin. Among the extract types, Extract A1 generally exhibited the highest ferric reducing activity across most varieties, with values ranging from 81.60 to 94.71 mM FeSO4 equivalents/g extract. The strongest activity was observed in the Beşikdüzü variety, followed by Çarşıbaşı and Vakfıkebir. Extract B also demonstrated considerable reducing capacity, particularly in Çarşıbaşı and Vakfıkebir varieties, although its activity remained lower than that of Extract A1. Extract C exhibited moderate ferric reducing activity across most varieties, while Extract A2 generally showed the lowest FRAP values. However, in the defatted hazelnut pulp sample, Extract C demonstrated the highest reducing activity compared with the other extract types. Overall, the findings indicate that ferric reducing antioxidant capacity is influenced by both extraction method and variety origin, with the 80% ethanolic extract of whole hazelnuts (Extract A1) generally providing the highest reducing activity.
Table 2.
Antioxidant properties of different hazelnut extracts.
The DPPH radical scavenging activities of hazelnut extracts varied markedly depending on both the extraction type and hazelnut origin (Table 2). Among all extract groups, Extract A2 consistently exhibited the highest antioxidant activity across all samples, indicating its superior efficiency in recovering radical scavenging compounds. Extract A1 showed considerably lower inhibition levels compared to other extract types. In contrast, Extract B and Extract C demonstrated moderate antioxidant activity with substantial variation depending on the hazelnut origin. The defatted hazelnut pulp extract displayed moderate radical scavenging activity compared to other samples. Overall, the findings indicate that extraction type plays a critical role in determining antioxidant capacity, with Extract A2 providing the most effective radical scavenging activity among the tested extracts.
When the copper-reducing antioxidant capacity of the extracts was evaluated (Table 2), Extract A1 generally exhibited the highest antioxidant capacity. In particular, hazelnut samples from Beşikdüzü (281.11 mg AAE/g) and Vakfikebir (288.30 mg AAE/g) showed the highest values. High antioxidant capacity was also observed in samples from Çarşıbaşı (276.15 mg AAE/g) and Yomra (189.74 mg AAE/g). Among the other extracts, Extract B demonstrated a moderate level of antioxidant capacity, with the highest values recorded for Çarşıbaşı (202.77 mg AAE/g) and Vakfikebir (194.39 mg AAE/g). In contrast, analyses performed with Extracts A2 and C revealed relatively lower antioxidant capacities.
As shown in Table 2, a dose-dependent increase was observed in all extracts. When the total antioxidant capacity of the extracts was evaluated, Extract A1 generally exhibited the highest overall antioxidant capacity. In particular, samples from Besikdüzü (197.18 mg AAE/g) and Carşıbaşı (159.12 mg AAE/g) showed the highest values. In addition, Yomra (104.94 mg AAE/g) and Pikola (83.92 mg AAE/g) also demonstrated high antioxidant capacity. Among the other extract types, Extract B displayed moderate antioxidant capacity, with Çarşıbaşı (99.22 mg AAE/g) and Beşikdüzü (52.18 mg AAE/g) standing out. In analyses performed with Extract C, Vakfıkebir (64.22 mg AAE/g) and Pikola (58.41 mg AAE/g) showed moderate levels, whereas no detectable antioxidant capacity (ND) was observed in pomace and some hazelnut samples. Results obtained with Extract A2 were generally low, exhibiting lower antioxidant capacity compared with the other extraction methods.
3.4. Iron-Binding Capacity of Extracts Under Simulated Gastric and Intestinal Conditions
The iron-binding capacity of hazelnut extracts was evaluated under simulated gastric (pH 2) and intestinal (pH 6) conditions using atomic absorption spectroscopy. Prior to experimentation, the intrinsic iron content of the extracts was confirmed in an iron-free medium to ensure analytical reliability. Control solutions containing 40 µg Fe/g, prepared from iron (II) sulfate heptahydrate in Sorensen phosphate buffer, served as reference standards. The measured values of 40.56 ± 0.82 µg Fe/g at pH 2 and 40.32 ± 0.57 µg Fe/g at pH 6 were in close agreement with theoretical expectations, further validating the accuracy and reproducibility of the method. As reported in Supplementary Table S3, iron concentrations across the extracts ranged from 2.31 to 6.23 µg Fe/g, with experimental outcomes aligning well with calculated values.
The iron-chelating effects of the extracts are presented in Supplementary Table S4. The iron binding capacity of different hazelnut extracts was investigated under simulated gastric (pH 2) and duodenal (pH 6) conditions using 10 mg iron (II) sulfate heptahydrate (FeSO4·7H2O) as the iron source. The iron control groups showed iron concentrations of 40.56 ± 0.82 µg Fe/g at pH 2 and 40.32 ± 0.57 µg Fe/g at pH 6. Comparable iron levels were also obtained in Sorenson phosphate buffer (SPB) (40.49 ± 0.74 µg Fe/g at pH 2 and 41.08 ± 0.63 µg Fe/g at pH 6), indicating the reproducibility and stability of the experimental conditions. The reference iron chelator deferoxamine (150 mg) significantly reduced iron levels to 5.29 ± 0.91 µg Fe/g at pH 2 and 3.92 ± 0.63 µg Fe/g at pH 6, corresponding to approximately 87% and 90% reduction in iron concentration, respectively, compared to control. Similarly, Deferasirox demonstrated strong iron chelation efficiency, decreasing iron levels to 4.78 ± 0.10 µg Fe/g at pH 2 and 2.57 ± 0.35 µg Fe/g at pH 6, corresponding to reductions of approximately 88% and 94%, respectively.
Among the tested formulations, Extract C consistently demonstrated the highest iron-binding efficiency under both gastric (pH 2) and duodenal (pH 6) conditions, outperforming Extracts A1 and A2 (Figure 2). Extract B also exhibited notable iron binding effects, particularly under duodenal conditions (Figure 3). Conversely, Extracts A1 and A2 exhibited lower inhibition percentages and weaker iron-chelating capacity compared to Extracts B and C, despite still achieving a significant reduction in iron levels relative to the control. Beşikdüzü C extract exhibited the most pronounced chelating effect, with residual iron concentrations of 9.35 ± 0.83 µg Fe/g at pH 2 and 4.79 ± 0.76 µg Fe/g at pH 6 (Figure 3). These correspond to reductions of approximately 77% and 88%, respectively, thereby highlighting the strong affinity of this extract for iron under both acidic and near-neutral conditions. Collectively, these findings indicate that the Beşikdüzü C extract exhibits substantial iron-chelating activity.
Figure 2.
Comparison of iron-chelating activity (%) of hazelnut extracts (150 mg) under simulated gastric (pH 2) and duodenal (pH 6) conditions. (A) Extract A1 is the 80% ethanolic extract of whole hazelnuts, (B) Extract A2 is the 100% water extract of the ground hazelnut residue remaining from Extract A1, (C) Extract B is the 100% water extract of whole hazelnuts, and (D) Extract C is the 80% ethanolic extract of ground hazelnuts. * As the pulp was available only as a ground by-product, only extracts A2 and C were prepared from the pulp. ** 10 mg of iron (II) sulfate heptahydrate was tested at different pH levels. The iron concentrations at pH = 2 and pH = 6 were measured as 40.56 ± 0.82 µg Fe/g and 40.32 ± 0.57 µg Fe/g, respectively. In Sorenson phosphate buffer, these values were recorded as 40.49 ± 0.74 µg Fe/g at pH = 2 and 41.08 ± 0.63 µg Fe/g at pH = 6. For the reference dose of 150 mg Deferoxamine, the values obtained were 5.29 ± 0.91 µg Fe/g at pH = 2 and 3.92 ± 0.63 µg Fe/g at pH = 6. Similarly, Deferasirox showed values of 4.78 ± 0.10 µg Fe/g at pH = 2 and 2.57 ± 0.35 µg Fe/g at pH= 6.
Figure 3.
Reduction of iron levels by reference drugs and hazelnut extracts (Extract C) under different pH conditions: pH 2 and pH 6. Extract C represents the 80% ethanolic extract of ground hazelnuts. SPB: Sørensen phosphate buffer. Statistical significance was determined for each group compared with the Fe group (* p < 0.05). Fe: 10 mg iron (II) sulfate heptahydrate (FeSO4·7H2O). Deferoxamine (DFO) and deferasirox (DFX) were used as reference iron chelators.
A clear pH-dependent trend was observed for several extracts, with higher iron-chelating activity generally detected under duodenal conditions (pH 6) compared to gastric conditions (pH 2). This increase in chelation efficiency at near-neutral pH may be attributed to enhanced ionization and metal-binding capacity of bioactive constituents present in hazelnut extracts.
Ferrous Ion Chelating Activity
As presented in Supplementary Table S5, evaluation of Deferoxamine, deferasirox, and the hazelnut extracts across four different concentrations demonstrated a clear dose-dependent increase in iron-binding activity. The reference chelators demonstrated the highest iron-binding capacity, with Deferoxamine and deferasirox exhibiting activities of 97% and 82%, respectively. All hazelnut extracts showed measurable iron-binding activity; however, substantial differences were observed depending on extraction method and variety origin. Among the extract types, Extract C exhibited the strongest iron-binding capacity across all hazelnut samples. In the defatted hazelnut pulp sample, Extract C showed a markedly higher activity (81%) compared with Extract A2 (21%), indicating the superior efficacy of ethanol extraction from ground hazelnuts (Table 3).
Table 3.
Comparison of iron-binding activity (%) of different hazelnut extracts obtained from various hazelnut samples.
Variety-based analysis further revealed significant variability in iron-binding activity. Notably, the Çarşıbaşı variety exhibited the highest iron-binding activity with Extract C (90%), followed by Pikola (85%) and Beşikdüzü (81%). Vakfıkebir also demonstrated considerable activity (68%), whereas Arsin and Yomra showed comparatively lower binding capacities, ranging from 36% to 39% (Figure 4). In contrast, Extract A1 and Extract B generally exhibited weaker iron-binding activity across most varieties, while Extract A2 showed moderate activity. Overall, iron-binding capacity was strongly influenced by extraction method and variety origin, with ethanol-based extraction of ground hazelnuts (Extract C) exhibiting the highest chelating activity among all tested extracts.
Figure 4.
Iron-binding activity (%) of Extract C samples compared with the reference iron chelators deferoxamine (DFO) and deferasirox (DFX). Extract A1 is the 80% ethanolic extract of whole hazelnuts, Extract A2 is the 100% water extract of the ground hazelnut residue remaining from Extract A1, Extract B is the 100% water extract of whole hazelnuts, and Extract C is the 80% ethanolic extract of ground hazelnuts. All extracts were tested at a concentration of 1 mg/mL.
3.5. Protective Effect of Extracts Against LPS-Induced Inflammation
3.5.1. Cytotoxicity Studies on RAW264.7 Cells
Following 24 h incubation of hazelnut extracts at concentrations of 0.125, 0.25, 0.5, and 1 mg/mL with RAW264.7 cells, no cytotoxic effects were observed. All extracts maintained cell viability above 70% compared to the untreated control group, indicating acceptable biocompatibility (Supplementary Figure S5).
3.5.2. Evaluation of Anti-Inflammatory Activity
The anti-inflammatory potential of hazelnut extracts was evaluated via Griess assay by measuring nitrite levels (a stable NO metabolite) in RAW264.7 cells treated with LPS. In the control group, the nitrite concentration was measured as 1.57 ± 0.48 µM, whereas exposure to 1 µg/mL LPS markedly elevated nitrite levels to 52.55 ± 0.71 µM, confirming the pro-inflammatory effect of LPS stimulation. Indomethacin, used as the positive control, significantly attenuated this increase and reduced nitrite levels to 21.49 ± 0.66 µM.
The hazelnut extracts similarly decreased LPS-induced nitrite production in a dose-dependent manner (Table 4), with the most pronounced reductions observed at 1 mg/mL concentrations. Indomethacin reduced nitrite levels by 59%. When compared to this reference, only the defatted hazelnut pulp C extract at 1 mg/mL demonstrated superior activity, achieving a 64% reduction, thereby surpassing the anti-inflammatory effect of indomethacin. In addition, the Vakfıkebir C extract reduced nitrite levels by 54%, while the Yomra C extract produced a reduction of 46% at the same concentration.
Table 4.
Effects of hazelnut C extracts on RAW264.7 cell viability, nitrite levels and % nitrite inhibition.
3.5.3. PGE2 Evaluation of Analgesic Activity
PGE2, a principal metabolite of the arachidonic acid cascade, is widely recognized as a critical biomarker of analgesic activity. In the present study, LPS stimulation markedly increased PGE2 production to 304.94 ± 15.87 pg/mL, compared with 20.10 ± 2.15 pg/mL in the control group, confirming the pro-inflammatory response (Supplementary Table S6). Exposure to hazelnut extracts resulted in a significant attenuation of PGE2 levels, thereby suggesting their potential analgesic efficacy. The reference drug indomethacin produced the most pronounced effect, reducing PGE2 by approximately 89%. Among the extracts, the defatted hazelnut pulp C extract demonstrated the strongest inhibitory activity, lowering PGE2 concentrations to 114.18 ± 11.34 pg/mL, corresponding to a 62% reduction. Yomra and Beşikdüzü extracts also exhibited substantial activity, achieving reductions of 53% and 51%, respectively (Figure 5A).
Figure 5.
Effects of hazelnut C extracts on inflammatory mediator levels. (A) PGE2, (B) IL-6, and (C) TNF-α levels in LPS-stimulated cells following exposure to hazelnut C extracts. LPS: Lipopolysaccharide, Eschrechia coli 0111:B4; IND: Indomethacin. Control: Medium control; LPS: 1 µg/mL LPS-induced control group. Statistical significance was shown for each group against LPS (* p < 0.05). IND was applied at a concentration of 100 µM, while the extracts were administered at 1 mg/mL.
3.5.4. Evaluation of IL-6 Inhibition
LPS stimulation markedly increased IL-6 production in macrophages (6110.91 ± 42.05 pg/mL) compared to the control (587.73 ± 14.70 pg/mL), confirming the activation of a strong inflammatory response (Supplementary Table S6). All hazelnut extracts significantly suppressed this elevation. Indomethacin, used as a positive control, reduced IL-6 levels by 59%. Among the tested extracts, the defatted hazelnut pulp extract demonstrated the highest efficacy with a 50% reduction, followed by Yomra and Çarşıbaşı extracts, which decreased IL-6 levels by 47% and 44%, respectively (Figure 5B).
3.5.5. Evaluation of TNF-α Levels
LPS stimulation markedly increased TNF-α production in macrophages (6631.63 ± 58.97 pg/mL) compared to the control group (587.73 ± 14.70 pg/mL), confirming an inflammatory response (Supplementary Table S6). All hazelnut extracts significantly reduced LPS-induced TNF-α levels. Indomethacin reduced TNF-α by 55%, while Beşikdüzü and defatted hazelnut pulp extracts showed comparable efficacy with reductions of 53% and 52%, respectively (Figure 5C).
3.6. Determination of Protective Properties Against Oxidative Stress in Hep3B Cell Line
3.6.1. Effect of Hazelnut Extracts on Cell Viability
The effect of hazelnut C extracts on Hep3B cell viability at 1 mg/mL concentration is shown in Figure 6A. Compared to the control group, cell viability of all extracts was above 70%. As a result; it was observed that the extracts were not cytotoxic in Hep3B cell line at 1 mg/mL.
Figure 6.
(A) Effects of hazelnut C extracts (1 mg/mL) on the viability of Hep3B cells following 24 h exposure. (B) Concentration-dependent cytotoxic effects of iron (II) sulfate heptahydrate (2.5–50 mM) on Hep3B cell viability. The red line indicates 50% cell viability.
3.6.2. Iron (II) Sulfate Heptahydrate Cytotoxicity
Iron (II) sulfate heptahydrate (FeSO4·7H2O) was employed to model oxidative stress-induced cytotoxicity in Hep3B cells. As shown in Figure 6B, no significant cytotoxicity was observed between 2.5 and 10 mM; however, cell viability dropped to 50% at 15 mM, indicating substantial cytotoxicity. The IC50 was determined to be 15.03 ± 0.12 mM. Accordingly, a concentration of 15 mM iron (II) sulfate heptahydrate was selected as the reference dose for oxidative damage modeling in the Hep3B cell line, as it represents a reproducible and physiologically relevant level for inducing significant yet quantifiable cellular stress.
3.6.3. Determination of MDA Level
Iron (II) sulfate heptahydrate (FeSO4·7H2O) (15 mM) was used to induce lipid peroxidation in Hep3B cells. Iron exposure significantly elevated MDA levels, increasing from 7.60 ± 0.28 nmol/g protein in the control group to 27.27 ± 0.86 nmol/g protein, indicating pronounced oxidative stress. All hazelnut extracts significantly reduced iron-induced MDA levels (p < 0.05), demonstrating protective effects against lipid peroxidation.
Among the tested extracts, Yomra exhibited the strongest inhibitory effect, reducing lipid peroxidation by approximately 72%, followed by defatted hazelnut pulp (63%), Vakfıkebir (62%), Araklı (59%), Çarşıbaşı (58%), and Pikola (58%). Beşikdüzü showed moderate inhibition (50%), whereas Arsin demonstrated the lowest protective effect (40%) against iron-induced lipid peroxidation. These findings further support the antioxidant potential of hazelnut extracts in mitigating iron-induced oxidative damage (Figure 7A).
Figure 7.
Effect of hazelnut C extracts on iron-induced oxidative stress markers in Hep3B cells. (A) malondialdehyde (MDA) levels, (B) glutathione (GSH) levels, (C) catalase (CAT) activity, and (D) superoxide dismutase (SOD) activity. Data are presented as mean ± SD (n = 3). Fe: Fe (II) Sulfate heptahydrate. Statistical significance was shown for each group against FeSO4·7H2O (* p < 0.05).
3.6.4. Determination of GSH Level
As illustrated in Figure 7B, exposure to FeSO4·7H2O significantly reduced intracellular GSH levels compared to the control group, with GSH concentrations decreasing from 472.59 ± 28.12 µmol/g protein to 191.78 ± 3.95 µmol/g protein, indicating depletion of cellular antioxidant capacity. However, exposure to hazelnut extracts significantly restored GSH levels in Hep3B cells (p < 0.05), demonstrating their antioxidant potential.
Among the tested samples, the Yomra extract produced the most pronounced increase in GSH levels (486.39 µmol/g protein), corresponding to approximately 154% elevation compared to the Fe group and restoring GSH levels beyond the control value. Similarly, Araklı (482.82 µmol/g protein) and Arsin (411.83 µmol/g protein) markedly increased intracellular GSH levels, showing 152% and 115% increases, respectively. Beşikdüzü (390.90 µmol/g protein) and Çarşıbaşı (366.35 µmol/g protein) also significantly enhanced GSH levels (104% and 91% increases vs. Fe), whereas defatted hazelnut pulp (337.13 µmol/g protein), Pikola (307.50 µmol/g protein), and Vakfıkebir (276.20 µmol/g protein) exhibited moderate recovery, with increases of 76%, 60%, and 44%, respectively.
3.6.5. Determination of CAT Level
Iron exposure markedly reduced CAT activity in Hep3B cells (3.51 ± 0.14 U/mg protein) compared with the control group (7.63 ± 0.12 U/mg protein), corresponding to an approximately 54% decrease (Figure 7C). Exposure to hazelnut extracts attenuated the iron-induced suppression of CAT activity, with the most pronounced restoration observed in Beşikdüzü, Pikola, and Vakfıkebir extracts. Pikola increased CAT activity to 5.85 ± 0.12 U/mg protein (67% increase vs. Fe), while Beşikdüzü and Vakfıkebir extracts restored CAT levels to 5.19 ± 0.16 and 5.23 ± 0.19 U/mg protein, corresponding to 48% and 49% increases compared to iron-treated cells, respectively. Defatted hazelnut pulp extract moderately increased CAT activity to 4.92 ± 0.25 U/mg protein (40% increase vs. Fe). More limited improvements were observed in the Çarşıbaşı (4.02 ± 0.34 U/mg protein; 15% increase) and Yomra (3.97 ± 0.15 U/mg protein; 13% increase) groups. In contrast, Araklı (3.76 ± 0.17 U/mg protein) and Arsin (3.79 ± 0.57 U/mg protein) extracts showed minimal recovery, producing only 7–8% increases relative to the Fe group.
3.6.6. Determination of SOD Level
Iron exposure reduced SOD activity in Hep3B cells compared with the control group, indicating impaired antioxidant defense (Figure 7D). Exposure to hazelnut extracts partially restored SOD activity to varying extents. The most pronounced recovery was observed in the Vakfıkebir and Beşikdüzü groups, followed by the defatted hazelnut pulp group. Araklı, Çarşıbaşı, and Pikola extracts showed moderate improvements, whereas Arsin and Yomra exhibited relatively limited effects on SOD activity.
3.6.7. Reduction in Intracellular Iron Accumulation by Hazelnut Extracts
Exposure to FeSO4·7H2O caused a marked and statistically significant increase in intracellular iron levels compared with the untreated control group, confirming the successful establishment of the iron overload model. While the control group exhibited basal intracellular iron levels of 140.84 ± 2.45 µmol/g protein, FeSO4·7H2O exposure increased intracellular iron concentration approximately 20-fold to 2881.82 ± 6.12 µmol/g protein. Exposure to the reference iron-chelating agents, Deferoxamine and deferasirox, significantly reduced intracellular iron accumulation in a concentration-dependent manner. Deferoxamine reduced intracellular iron levels progressively from 1048.99 ± 3.11 µmol/g protein at 0.125 mg/mL to 276.57 ± 2.01 µmol/g protein at 1 mg/mL, corresponding to an approximate 90% reduction relative to the FeSO4·7H2O treated group. Similarly, deferasirox significantly attenuated intracellular iron levels from 1132.75 ± 1.38 µmol/g protein at 0.125 mg/mL to 385.29 ± 1.93 µmol/g protein at 1 mg/mL. (Figure 8).
Figure 8.
Effects of reference iron chelators on the reduction in intracellular iron accumulation in Hep3B cells. C: Control group; Fe: FeSO4·7H2O: iron (II) sulfate heptahydrate. DFO: Deferoxamine; DFX: Deferasirox. Statistical significance was shown for each group against FeSO4·7H2O (* p < 0.05).
The iron-reducing capacities of hazelnut extracts prepared using different extraction methods are presented in Table 5. All tested extracts significantly decreased intracellular iron levels compared with the FeSO4·7H2O-treated group (* p < 0.05). Extract C exhibited the strongest capacity to attenuate intracellular iron accumulation, reducing intracellular iron levels to 454.61–1191.49 µmol/g protein. In contrast, Extracts A1, A2, and B generally showed weaker effects, resulting in higher residual intracellular iron levels. Notably, among all tested extracts, Extract C derived from the Beşikdüzü, Çarşıbaşı, and Vakfıkebir varieties exhibited the most pronounced reductions in intracellular iron levels, with residual iron concentrations ranging from 454.61 to 479.13 µmol/g protein. These values corresponded to approximately 83–84% reductions in intracellular iron levels compared with the FeSO4·7H2O-treated group and approached those of the untreated control group, representing the strongest attenuation among all tested varieties.
Table 5.
Effects of hazelnut extracts on the reduction in intracellular iron accumulation in Hep3B cells.
3.7. Correlation Analysis
Correlation analysis revealed strong associations between iron-related activities, inflammatory mediators, and oxidative stress parameters (Figure 9). Among the iron-related parameters, residual iron levels measured under simulated gastric and intestinal conditions showed significant positive correlations with PGE2, IL-6, and TNF-α production. The strongest correlations were observed for iron levels measured under simulated gastric conditions, which were positively correlated with PGE2 (r = 0.841, p < 0.001), IL-6 (r = 0.859, p < 0.001), and TNF-α (r = 0.837, p < 0.001) (Supplementary Tables S7 and S8). Similarly, iron levels measured under simulated intestinal conditions were positively correlated with PGE2 (r = 0.522, p = 0.018), IL-6 (r = 0.536, p = 0.015), and TNF-α (r = 0.694, p = 0.001). These findings indicate that higher iron levels were associated with increased inflammatory responses.
Figure 9.
Integrated correlation heatmap highlighting the relationships between iron-chelating activity, intracellular iron levels, antioxidant capacity, oxidative stress biomarkers, and inflammatory mediators in Extract C. Positive correlations are indicated by red color intensity, whereas negative correlations are represented by blue color intensity. Stronger color intensity corresponds to higher correlation coefficients. Abbreviations: PA, protein amount; TPC, total phenolic content; TFC, total flavonoid content; OA, oxalic acid; FRAP, ferric reducing antioxidant power; DPPH, 2,2-diphenyl-1-picrylhydrazyl radical scavenging activity; CUPRAC, cupric reducing antioxidant capacity; TOAC, total antioxidant capacity; PGE2, prostaglandin E2; IL-6, interleukin-6; TNF-α, tumor necrosis factor-α; MDA, malondialdehyde; GSH, reduced glutathione; SOD, superoxide dismutase; CAT, catalase.
Ferrous ion chelating activity was negatively correlated with MDA levels (r = −0.498, p = 0.026) and positively correlated with GSH (r = 0.571, p = 0.008) and SOD activities (r = 0.687, p = 0.001), suggesting that enhanced iron-chelating activity was associated with reduced oxidative stress and improved antioxidant defense. In addition, intracellular iron reduction showed strong positive correlations with protein content (r = 0.941, p < 0.001) and FRAP values (r = 0.799, p < 0.001), indicating a close relationship between intracellular iron-lowering activity and antioxidant potential. Furthermore, ferrous ion chelating activity was positively correlated with intracellular iron reduction (r = 0.724, p < 0.001), suggesting that extracts with greater iron-chelating capacity were more effective in reducing cellular iron accumulation.
4. Discussion
Acute iron poisoning remains a significant clinical concern, particularly among children younger than six years of age following accidental ingestion of iron-containing preparations and among adults following intentional overdose, including suicide attempts. Excessive iron supplementation during pregnancy may also increase the risk of iron toxicity. It may also develop after the treatment of chronic diseases or following multiple blood transfusions. Prompt diagnosis and early intervention are essential, and chelation therapy represents the standard of care, aiming to remove accumulated iron, restore physiological balance, and prevent complications. Deferoxamine, deferiprone, and deferasirox are the principal iron-chelating agents currently used in clinical practice [3,16]. However, the clinical use of these agents is associated with safety concerns that have encouraged the exploration of naturally derived compounds with potential iron-chelating properties.
The present study investigated the potential protective effects of hazelnut and defatted hazelnut pulp extracts against iron-induced toxicity, with particular emphasis on their iron-binding and antioxidant properties. Hazelnuts are characterized by a complex composition of nutritional and bioactive constituents, including lipids, carbohydrates, proteins, phenolic compounds, minerals, vitamins, dietary fiber, organic acids, and phytic acid [22], which may collectively contribute to their antioxidant and iron-binding properties.
The antioxidant potential of the extracts was confirmed through DPPH, TOAC, FRAP, and CUPRAC assays. The DPPH radical scavenging activity observed in our study was consistent with previously reported findings, supporting the robust antioxidant properties of hazelnut-derived extracts. Delgado et al. reported an IC50 value of 1.12 mg/mL for an 80% aqueous acetone extract [76], while Pelvan et al. reported a value of 1.01 mg/mL for roasted hazelnut shells [77]. In the present study, the 80% hydroalcoholic extract of whole hazelnuts exhibited the highest antioxidant activity, with an IC50 value below 1 mg/mL. This comparatively lower IC50 value suggests greater radical-scavenging potency, potentially reflecting variations in extraction conditions, solvent polarity, and phytochemical composition. CUPRAC values ranged between 117 and 288 mg AAE/g and FRAP between 3 and 95 mM/g FeSO4. Although Di Michele et al. (2021) [78] reported much lower CUPRAC (3–11 mg TE/g) and FRAP (0.19–0.68 mg TE/g) values for hazelnut shells using trolox equivalents, our results demonstrated superior activity, supporting the strong antioxidant profile of hazelnut.
The substantial antioxidant capacity of the extracts provides further support for their potential protective effects against iron-overload-induced oxidative damage. Excessive iron accumulation increases ROS generation and lipid peroxidation, ultimately contributing to cellular and tissue damage. Previous studies have demonstrated that combinations of chelating agents with antioxidants such as N-acetylcysteine, taurine, vitamins E and C, or micronutrients such as zinc and selenium exhibit synergistic protective effects by reducing oxidative stress and preventing membrane damage in poisoning conditions [17]. In this context, the strong antioxidant activity observed in hazelnut extracts suggests that they may serve as supportive agents in iron poisoning management by providing additional antioxidant protection alongside chelation mechanisms.
To further investigate the contribution of bioactive constituents to the antioxidant activity of the extracts, total phenolic and flavonoid contents were determined, given their established association with antioxidant capacity. Phenolic compounds, including flavonoids and proanthocyanidins, are widely recognized for their antioxidant properties, which are attributed, in part, to their ability to scavenge free radicals and chelate metal ions. In the present study, the extracts exhibited remarkably high phenolic and flavonoid contents, with TPC values ranging from 36.54 to 855 mg GAE/g. These values are substantially higher than those reported in previous studies, where Delgado (2010) reported 36–44 mg GAE/g [76] and Pelvan et al. (2018) reported 72 mg GAE/g in roasted hazelnut testa [77]. Of the extraction approaches evaluated, Extract C consistently demonstrated the greatest abundance of total phenolic compounds.
Beyond their antioxidant properties, phenolic compounds, flavonoids, and tannins are known to influence iron metabolism by forming insoluble complexes with iron, thereby reducing its intestinal bioavailability [79,80]. Our results further confirmed that hazelnut extracts contain considerable amounts of phytic acid, oxalic acid, and polyphenols, all of which contribute to their iron-chelating potential. These findings are consistent with the study of Brune, Rossander, and Hallberg (1989) [79], which demonstrated that phenolic compounds reduce intestinal iron absorption through complex formation, ultimately decreasing iron bioavailability.
To assess the iron-binding capacity of hazelnut extracts under physiologically relevant conditions, in vitro experimental models mimicking the gastric (pH 2) and duodenal (pH 6) environments were employed, reflecting the predominant physiological sites of iron solubilization and absorption, respectively. Iron absorption is strongly influenced by gastrointestinal pH, as dietary iron is initially converted to the more soluble ferrous (Fe2+) form in the acidic gastric environment, facilitating its subsequent uptake in the small intestine. While the stomach promotes the chemical transformation of iron, absorption primarily occurs in the duodenum and proximal jejunum through transporter-mediated mechanisms, and this process plays a critical role in maintaining systemic iron homeostasis [50]. Among the extracts tested, Beşikdüzü C exhibited the highest iron-binding capacity under simulated gastric (pH 2) and intestinal (pH 6) conditions, binding 77% and 88% of the available iron, respectively. Deferoxamine, used as the reference iron chelator, exhibited iron-binding capacities of 87% and 90% at pH 2 and pH 6, respectively. Notably, the higher iron-binding capacity observed at pH 6 suggests that the extracts may exhibit greater chelating activity under intestinal pH conditions, potentially influencing iron availability at the primary site of dietary iron absorption. This finding is particularly relevant, as reducing free iron availability in the duodenum may directly limit intestinal iron uptake and contribute to the regulation of iron overload.
To further investigate the iron-binding potential of hazelnut extracts independent of cellular mechanisms, their free iron ion binding capacity was evaluated using a cell-free ferrozine assay. This approach enabled the direct assessment of the ability of the extracts to bind free iron ions and provided additional evidence supporting their antioxidant and iron-chelating properties. Evaluating iron-binding activity under cell-free conditions allowed a broader understanding of the potential role of hazelnut extracts in iron-related oxidative stress. The results demonstrated that hazelnut extracts exhibited considerable iron-binding capacity when compared with conventional iron chelators. Among the reference compounds, Deferoxamine showed the strongest chelating activity, with 97% iron binding at a concentration of 1 mg/mL, while deferasirox exhibited 82% binding capacity at the same concentration. Notably, hazelnut extracts also demonstrated substantial iron-binding activity. Among the tested samples, Extract C showed the highest binding capacity, reaching 90% iron binding, particularly in the Çarşıbaşı C sample. Similarly, high binding activity was observed in other samples, with defatted hazelnut pulp C extract and Beşikdüzü C extract exhibiting approximately 81% iron binding capacity. These findings indicate that Extract C possesses strong metal-chelating properties and may effectively reduce free iron availability.
Although Extract A1 generally demonstrated superior antioxidant activity in the TOAC and CUPRAC assays, Extract C exhibited the most pronounced iron-binding activity in both cell-free and cellular experimental models, suggesting that antioxidant capacity and iron-chelating activity do not necessarily exhibit a direct correlation. When the phytic acid content and other chemical constituents of the extracts were evaluated together with their antioxidant effects, Extract C was found to exhibit a higher level only in terms of total phenolic content. However, despite not being the richest extract in terms of overall content level or total antioxidant activity, Extract C demonstrated the highest iron-binding capacity among all tested samples. Importantly, these findings suggest that iron-binding activity may depend not only on the total amount of polyphenols, flavonoids, or condensed tannins, but also on their chemical structures. In particular, catechol and galloyl groups may play an important role in iron complexation. The grinding process may also have increased the extraction or accessibility of these iron-binding compounds in Extract C. However, further compound-specific analyses are needed to confirm this explanation.
Consistently, in the experiments conducted prior to cell culture studies, Extract C exhibited the highest iron-binding activity regardless of its overall content level. Based on these findings, although Extract C was not the most compositionally enriched extract, it showed the highest activity in terms of iron-binding capacity. Therefore, subsequent cell culture studies were carried out using Extract C.
Excessive iron accumulation not only promotes oxidative stress but also triggers inflammatory processes via NF-κB and MAPK pathways, leading to increased production of IL-6, TNF-α, and IL-1β [81,82]. The anti-inflammatory potential of hazelnut extracts was evaluated in LPS-stimulated RAW264.7 macrophages. Extracts at 0.125–1 mg/mL were non-cytotoxic and significantly reduced nitrite levels, with inhibition rates between 31% and 64%, compared to 59% with indomethacin. Defatted hazelnut pulp extract reduced PGE2 levels by 62%, while Yomra and Beşikdüzü extracts achieved 53% and 51% reductions, respectively. For IL-6, defatted hazelnut pulp extract provided 50% inhibition, while Yomra and Çarşıbaşı extracts decreased levels by 47% and 44%, respectively. TNF-α was reduced by 53% with Beşikdüzü and 52% with defatted hazelnut pulp extract. These results are in line with literature: hazelnut testa polyphenols suppressed TNF-α and IL-1β expression in THP-1 cells [83]; hazelnut leaf extracts reduced NO, IL-1β, and IL-6 [84]; hazelnut peptide LDAPGHR inhibited NF-κB/MAPK signaling and cytokine production [85]. Additionally, oleic acid, the predominant fatty acid in hazelnuts, reduced inflammatory mediators including iNOS, COX-2, TNF-α, and IL-6 [86,87]. Human studies confirmed that regular hazelnut consumption reduced CRP, IL-6, oxidized LDL, and MDA [33]. These findings collectively support the strong anti-inflammatory role of hazelnut extracts.
To investigate the protective effects of hazelnut extracts against iron-induced cellular damage, an oxidative stress model was established in Hep3B liver cells using FeSO4·7H2O. Within the tested concentration range, 15 mM FeSO4·7H2O reduced cell viability by approximately 50% and was therefore selected as the reference concentration to induce oxidative damage. Both HepG2 and Hep3B cells are hepatocellular carcinoma-derived cell lines and have been used in previous studies to investigate iron-related effects in hepatic models. In the present study, we preferred Hep3B cells because they have been reported to accumulate more iron than HepG2 cells after exposure to non-transferrin-bound iron [88]. This made Hep3B a suitable model for evaluating intracellular iron accumulation and the iron-binding effects of the extracts.
In the present study, iron loading significantly increased MDA levels, indicating enhanced lipid peroxidation. Hazelnut extracts reduced MDA accumulation and partially restored GSH, SOD, and CAT levels, suggesting an improvement in cellular antioxidant defense. These effects are consistent with the protective actions reported for iron chelators such as DFO and 2,2′-dipyridyl, which reduce iron-mediated oxidative damage by limiting the availability of redox-active intracellular iron [89,90]. Although the effects of hazelnut extracts have not previously been investigated in this specific model, related studies have shown that hazelnut oil can reduce MDA levels and increase GSH and SOD activities in animal models [91], while hazelnut-enriched diets may improve the resistance of lipoproteins to oxidative modification in humans [92]. Taken together, these findings suggest that the antioxidant effects of hazelnut extracts may contribute to reducing iron-induced oxidative damage and maintaining cellular redox homeostasis.
Intracellular iron levels in Hep3B cells were quantified using the ferrozine colorimetric assay, a commonly used method for iron determination in biological samples. The assay detects Fe2+ and, following reduction of Fe3+ to Fe2+, provides an estimate of total cellular iron [68]. In the present study, this method was used to assess whether hazelnut extracts could reduce intracellular iron accumulation in iron-loaded Hep3B cells. Iron loading was induced with 15 mM FeSO4·7H2O, and the effects of the extracts were compared with those of the reference chelators deferoxamine and deferasirox. Deferoxamine and deferasirox reduced intracellular iron levels by 90% and 87%, respectively. Notably, all hazelnut extracts significantly decreased intracellular iron content, demonstrating their potential iron-chelating activity. Among the tested extracts, Extract C exhibited the strongest effect, particularly in the Beşikdüzü, Çarşıbaşı, and Vakfıkebir samples, where intracellular iron levels were reduced by approximately 83–84%. This superior performance of Extract C suggests that differences in extraction conditions and phytochemical composition may influence iron-binding efficiency.
The bioactivity observed in hazelnuts can be attributed to the combined effects of phenolic acids, flavonoids, tannins, phytic acid, and unsaturated fatty acids. Whole extracts often demonstrate greater biological activity than isolated compounds, likely due to synergistic interactions among their bioactive constituents. In the present study, minimum levels for major bioactive compound groups were determined, providing reference values for future standardized formulations [34]. Such standardization may facilitate the incorporation of hazelnut-based products into pharmacopoeial monographs and support their potential use in therapeutic applications.
The correlation analysis provided further insight into the mechanisms underlying the biological activities of hazelnut extracts. Extracts with higher phenolic, flavonoid, and protein contents generally exhibited stronger antioxidant and iron-modulating activities. In particular, the positive associations between antioxidant capacity and iron-chelating activity suggest that the phytochemicals responsible for the reducing power of the extracts may also contribute to their ability to interact with iron.
Correlation analysis revealed that extracts with higher phenolic, flavonoid, and protein contents generally exhibited enhanced antioxidant and iron-related activities. In particular, positive correlations between FRAP values, iron-chelating activity, and intracellular iron reduction suggest that compounds contributing to the antioxidant capacity of the extracts may also play a role in iron binding and chelation. Extracts with stronger iron-binding and iron-chelating activities were more effective in reducing residual and intracellular iron levels. Moreover, stronger iron-related activities were associated with lower levels of pro-inflammatory mediators, including PGE2, IL-6, and TNF-α. These findings support the role of iron in promoting inflammation and suggest that reducing iron levels may help suppress inflammatory responses. A clear relationship was also observed between iron chelation and oxidative stress. Extracts with stronger iron-chelating activity showed lower MDA levels and higher GSH and SOD activities, indicating reduced oxidative damage and improved antioxidant defense. Since excess iron promotes the formation of reactive oxygen species through Fenton reactions, reducing iron levels may help protect cells from oxidative stress and its inflammatory consequences. Nevertheless, certain limitations should be considered when interpreting these findings. Cell-free and in vitro experimental models do not fully reflect the complexity of in vivo physiological conditions, particularly regarding bioavailability, gastrointestinal metabolism, and systemic interactions. Furthermore, cytotoxicity was evaluated only at concentrations up to 1 mg/mL, leaving the potential effects of higher concentrations undetermined. Additional in vivo studies are therefore warranted to further establish the safety and iron-chelating efficacy of these extracts, followed by clinical investigations to assess their potential applicability in humans. Collectively, these findings suggest a close interrelationship among the antioxidant, anti-inflammatory, and iron-chelating activities of hazelnut extracts. Furthermore, the observed associations highlight the complex interplay among phytochemical composition, antioxidant capacity, iron chelation, oxidative stress, and inflammatory responses, suggesting that these interconnected factors may collectively contribute to the beneficial biological effects of hazelnut-derived extracts.
5. Conclusions
Overall, hazelnut extracts exhibited notable antioxidant, iron-binding, anti-inflammatory, and cytoprotective activities across complementary cell-free and cellular models. Among the tested extracts, Extract C consistently showed the strongest overall performance, achieving 77–88% iron binding under simulated gastrointestinal conditions, 90% iron binding in the ferrozine assay, and an approximately 83–84% reduction in intracellular iron accumulation in Hep3B cells. Beşikdüzü Extract C was among the most active samples and may provide a useful reference for future standardization studies. Collectively, these findings provide a strong experimental basis for the further investigation of hazelnut-derived extracts as standardized bioactive formulations with potential relevance to iron-associated oxidative stress and inflammation.
Supplementary Materials
The following supporting information can be downloaded at: https://www.mdpi.com/article/10.3390/antiox15111396/s1, Table S1: Geographic origin, quality classification, and herbarium information of hazelnut samples, including pulp supply; Table S2: Yield of hazelnut extracts (%); Table S3: Iron content of extracts; Table S4: Comparison of iron binding capacities of hazelnut extracts in gastric pH = 2 and duodenal conditions pH = 6; Table S5: Iron-binding activity (%); Table S6: Effects of hazelnut Extract C on PGE2, IL-6, and TNF-α levels; Table S7: Pearson correlation coefficients (r) of the analyzed parameters; Table S8: Corresponding p values of the Pearson correlation analysis; Figure S1: HPTLC chromatogram of Extract A1, A2, B, and C illustrating the presence of phosphate groups of phytic acid; Figure S2: HPTLC chromatogram of Extract A1, A2, B, and C illustrating the flavonoid composition; Figure S3: HPTLC chromatogram of Extract A1, B, C, and defatted pulp (A2) demonstrating phenolic acid composition; Figure S4: HPTLC chromatogram of Extract A1, B, C, and defatted pulp (A2) highlighting catechin derivatives and procyanidin B2; Figure S5: Effects of hazelnut Extract C on RAW264.7 cells: cell viability (A), nitrite production levels (B), and percentage inhibition of nitrite production (C).
Author Contributions
Conceptualization, H.S.; Methodology, H.S., E.G. and Y.Ö.; Validation, Y.Ö., E.G. and H.S.; Formal Analysis, H.S.; Investigation, Y.Ö., D.G., E.B.Y., R.R., M.H., E.G. and H.S.; Resources, H.S. and A.A.; Data Curation, H.S. and Y.Ö.; Writing—Original Draft Preparation, Y.Ö., D.G., E.G. and H.S.; Writing—Review and Editing, Y.Ö., D.G., E.B.Y., R.R., M.H., E.G., A.A. and H.S.; Visualization, Y.Ö. and H.S.; Supervision, H.S.; Project Administration, H.S.; Funding Acquisition, H.S. All authors have read and agreed to the published version of the manuscript.
Funding
This research was funded by the Scientific and Technological Research Council of Türkiye (TÜBİTAK) under the 1001 Program, grant number 121S922.
Institutional Review Board Statement
Not applicable.
Informed Consent Statement
Not applicable.
Data Availability Statement
The original contributions presented in this study are included in the article/Supplementary Material. Further inquiries can be directed to the corresponding author.
Acknowledgments
This study was supported by the Scientific and Technological Research Council of Türkiye (TÜBİTAK) within the scope of the 1001 Program (Project No. 121S922) led by Hande Sipahi. The authors gratefully acknowledge Erdem Yeşilada for his valuable contributions to the conception and development of this project. The authors gratefully acknowledge the Trabzon Provincial Directorate of Agriculture and Forestry for their valuable assistance in the collection of hazelnut samples and for providing geographical coordinate information for the sampling locations.
Conflicts of Interest
The authors declare no conflicts of interest. The funder had no role in the design of the study; in the collection, analyses, or interpretation of data; in the writing of the manuscript; or in the decision to publish the results.
References
- Katsarou, A.; Pantopoulos, K. Basics and principles of cellular and systemic iron homeostasis. Mol. Asp. Med. 2020, 75, 100866. [Google Scholar] [CrossRef] [Scilit] [PubMed]
- Piskin, E.; Cianciosi, D.; Gulec, S.; Tomas, M.; Capanoglu, E. Iron absorption: Factors, limitations, and improvement methods. ACS Omega 2022, 7, 20441–20456. [Google Scholar] [CrossRef] [Scilit] [PubMed]
- Bayram, Y.; Türkay, C. Herediter hemokromatozis tanı ve tedavi. Güncel Gastroenteroloji 2010, 14, 3–7. [Google Scholar]
- Theil, E.C.; Chen, H.; Miranda, C.; Janser, H.; Elsenhans, B.; Núñez, M.T.; Pizarro, F.; Schümann, K. Absorption of iron from ferritin is independent of heme iron and ferrous salts in women and rat intestinal segments. J. Nutr. 2012, 142, 478–486. [Google Scholar] [CrossRef] [Scilit] [PubMed]
- Arosio, P.; Elia, L.; Poli, M. Ferritin, cellular iron storage and regulation. IUBMB Life 2017, 69, 414–422. [Google Scholar] [CrossRef] [Scilit] [PubMed]
- Yıldız, A.; Albayrak, M. Erişkinlerde demir eksikliği anemisi tedavisi. Turk. Klin. Hematol.-Spec. Top. 2017, 10, 182–187. [Google Scholar]
- World Health Organization. Iron Deficiency Anemia: Assessment, Prevention, and Control: A Guide for Programme Managers. Available online: https://cdn.who.int/media/docs/default-source/2021-dha-docs/ida_assessment_prevention_control.pdf (accessed on 5 October 2026).
- Goddard, A.F.; McIntyre, A.S.; Scott, B.B. Guidelines for the management of iron deficiency anaemia. Gut 2000, 46, IV1–IV5. [Google Scholar] [CrossRef] [Scilit] [PubMed]
- Cook, J.D. Diagnosis and management of iron-deficiency anaemia. Best Pract. Res. Clin. Haematol. 2005, 18, 319–332. [Google Scholar] [CrossRef] [Scilit] [PubMed]
- Porter, J.B. Deferasirox—Current knowledge and future challenges. Ann. N. Y. Acad. Sci. 2010, 1202, 87–93. [Google Scholar] [CrossRef] [Scilit] [PubMed]
- Calabrese, E.J.; Mattson, M.P. How does hormesis impact biology, toxicology, and medicine? npj Aging Mech. Dis. 2017, 3, 13. [Google Scholar] [CrossRef] [Scilit] [PubMed]
- Swaminathan, S. Iron, hormesis, and protection in acute kidney injury. Kidney Int. 2016, 89, 268–270. [Google Scholar] [CrossRef] [Scilit] [PubMed]
- Turkish Society of Hematology. Diagnosis and Treatment Guidelines for Iron Deficiency Anemia (IDA) in Adults. Available online: http://www.thd.org.tr/thdData/userfiles/file/Demir%20eks%2026_04_2011%5B1%5D.pdf (accessed on 5 October 2026).
- Yuen, H.W.; Becker, W. Iron toxicity. In StatPearls; StatPearls Publishing: Treasure Island, FL, USA, 2020. [Google Scholar]
- Baranwal, A.K.; Singhi, S.C. Acute iron poisoning: Management guidelines. Indian Pediatr. 2003, 40, 534–540. [Google Scholar] [PubMed]
- Bacon, B.R.; Adams, P.C.; Kowdley, K.V.; Powell, L.W.; Tavill, A.S.; American Association for the Study of Liver Diseases. Diagnosis and management of hemochromatosis: 2011 practice guideline by the American Association for the Study of Liver Diseases. Hepatology 2011, 54, 328–343. [Google Scholar] [CrossRef] [Scilit] [PubMed]
- Flora, S.J.; Pachauri, V. Chelation in metal intoxication. Int. J. Environ. Res. Public Health 2010, 7, 2745–2788. [Google Scholar] [CrossRef] [Scilit] [PubMed]
- Türkiye İlaç ve Tıbbi Cihaz Kurumu. Desferal 0.5 g Flakon. Available online: https://titck.gov.tr/storage/kubKtAttachments/b8efb6af41215.pdf (accessed on 5 October 2026).
- Türkiye İlaç ve Tıbbi Cihaz Kurumu. Ferriprox® 100 mg/mL Şurup. Available online: https://titck.gov.tr/storage/kubKtAttachments/dcc33a7d12980.pdf (accessed on 5 October 2026).
- Türkiye İlaç ve Tıbbi Cihaz Kurumu. Exjade 125 mg Suda Dağılabilen Tablet. Available online: https://www.novartis.com/tr-tr/sites/novartis_tr/files/Exjade125mgSDT-KT.pdf (accessed on 5 October 2026).
- Porter, J.; Viprakasit, V.; Kattamis, A. Iron Overload and Chelation; Thalassaemia International Federation: Strovolos, Cyprus, 2014. [Google Scholar]
- Schlemmer, U.; Frølich, W.; Prieto, R.M.; Grases, F. Phytate in foods and significance for humans: Food sources, intake, processing, bioavailability, protective role, and analysis. Mol. Nutr. Food Res. 2009, 53, S330–S375. [Google Scholar] [CrossRef] [Scilit] [PubMed]
- Moretti, D. Plant-based diets and iron status. In Vegetarian and Plant-Based Diets in Health and Disease Prevention; Academic Press: Cambridge, MA, USA, 2017. [Google Scholar]
- Marolt, G.; Gričar, E.; Pihlar, B.; Kolar, M. Complex formation of phytic acid with selected monovalent and divalent metals. Front. Chem. 2020, 8, 582746. [Google Scholar] [CrossRef] [Scilit] [PubMed]
- Agricultural Economics and Policy Development Institute. Product Report: Hazelnut. Available online: https://www.istib.org.tr/resim/siteici/files/217_F%C4%B1nd%C4%B1k%20%C3%9Cr%C3%BCn%20Raporu%202023-%20TEPGE.pdf (accessed on 5 October 2026).
- Köksal, A.İ.; Artik, N.; Şimşek, A.; Güneş, N. Nutrient composition of hazelnut (Corylus avellana L.) varieties cultivated in Turkey. Food Chem. 2006, 99, 509–515. [Google Scholar] [CrossRef] [Scilit]
- Taş, N.G.; Gökmen, V. Profiling triacylglycerols, fatty acids and tocopherols in hazelnut varieties grown in Turkey. J. Food Compos. Anal. 2015, 44, 115–121. [Google Scholar] [CrossRef] [Scilit]
- Karamać, M. Chelation of Cu(II), Zn(II), and Fe(II) by tannin constituents of selected edible nuts. Int. J. Mol. Sci. 2009, 10, 5485–5497. [Google Scholar] [CrossRef] [Scilit] [PubMed]
- Contini, M.; Frangipane, M.T.; Massantini, R. Antioxidants in hazelnuts (Corylus avellana L.). In Nuts and Seeds in Health and Disease Prevention; Academic Press: Cambridge, MA, USA, 2011. [Google Scholar]
- Bhowmik, A.; Ojha, D.; Goswami, D.; Das, R.; Chandra, N.; Chatterjee, T.; Chakravarty, A.; Chakravarty, S.; Chattopadhyay, D. Inositol hexa-phosphoric acid (phytic acid), a nutraceutical, attenuates iron-induced oxidative stress and alleviates liver injury in iron-overloaded mice. Biomed. Pharmacother. 2017, 87, 443–450. [Google Scholar] [CrossRef] [Scilit] [PubMed]
- Minihane, A.M.; Rimbach, G. Iron absorption and the iron binding and anti-oxidant properties of phytic acid. Int. J. Food Sci. Technol. 2002, 37, 741–748. [Google Scholar] [CrossRef] [Scilit]
- Okazaki, Y.; Sekita, A.; Katayama, T. Intake of phytic acid and myo-inositol lowers hepatic lipogenic gene expression and modulates gut microbiota in rats fed a high-sucrose diet. Biomed. Rep. 2018, 8, 466–474. [Google Scholar] [CrossRef] [Scilit] [PubMed]
- Ros, E. Health benefits of nut consumption. Nutrients 2010, 2, 652–682. [Google Scholar] [CrossRef] [Scilit] [PubMed]
- Parra-González, L.; Udall, J.A.; Maureira-Butler, I.J. Assessing phytic acid variability using high-performance thin-layer chromatography (HPTLC) on a diverse sample of Lupinus luteus L. (Fabaceae). Agro Sur 2018, 46, 9–16. [Google Scholar]
- Güzelmeriç, E.; Yüksel, P.İ.; Bulut, G.; Yeşilada, E. Gümüşi ıhlamur çiçek durumu. Türk Farmakop. Derg. 2020, 5, 10–15. [Google Scholar]
- Guzelmeric, E.; Ugurlu, P.; Celik, C.; Sen, N.B.; Helvacıoğlu, S.; Charehsaz, M.; Erdogan, M.; Ockun, M.A.; Kırmızıbekmez, H.; Aydın, A.; et al. Myrtus communis L. (myrtle) plant parts: Comparative assessment of their chemical compositions and antioxidant, anticancer, and antimutagenic activities. S. Afr. J. Bot. 2022, 150, 711–720. [Google Scholar] [CrossRef] [Scilit]
- Oçkun, M.A.; Turnalar Ülger, T.; Güzelmeriç, E.; Kan, Y.; Yeşilada, E. Crataegus turcicus (Türk alıcı) meyvelerinin Avrupa Farmakopesi’ne göre uygunluğunun değerlendirilmesi. Türk Farmakop. Derg. 2020, 5, 14–24. [Google Scholar]
- Glavnik, V.; Simonovska, B.; Vovk, I. Densitometric determination of (+)-catechin and (−)-epicatechin by 4-dimethylaminocinnamaldehyde reagent. J. Chromatogr. A 2009, 1216, 4485–4491. [Google Scholar] [CrossRef] [Scilit] [PubMed]
- Reason, D.; Watts, M.J.; Devez, A. Quantification of phytic acid in grains. In Proceedings of the Nutrition Society; Broadley, M.R., Ed.; Cambridge University Press: Cambridge, UK, 2015; Volume 74, p. 11. [Google Scholar]
- Turnalar Ülger, T.; Oçkun, M.A.; Guzelmeric, E.; Sen, N.B.; Sipahi, H.; Özhan, Y.; Kan, Y.; Yesilada, E. Comprehensive analysis of the chemical and bioactivity profiles of endemic Crataegus turcicus Dönmez in comparison with other Crataegus species. Molecules 2023, 28, 6520. [Google Scholar] [CrossRef] [Scilit] [PubMed]
- Jia, Z.; Tang, M.; Wu, J. The determination of flavonoid contents in mulberry and their scavenging effects on superoxide radicals. Food Chem. 1999, 64, 555–559. [Google Scholar] [CrossRef] [Scilit]
- Ariffin, F.; Chew, S.H.; Kaur, B.; Karim, A.A.; Huda, N. Antioxidant capacity and phenolic composition of fermented Centella asiatica herbal teas. J. Sci. Food Agric. 2011, 91, 2731–2739. [Google Scholar] [CrossRef] [Scilit] [PubMed]
- Holman, W.L.; Gonzales, F.L. A test for indol based on the oxalic acid reaction of Gnezda. J. Bacteriol. 1923, 8, 577–583. [Google Scholar] [CrossRef] [Scilit] [PubMed]
- Lowry, O.H.; Rosebrough, N.J.; Farr, A.L.; Randall, R.J. Protein measurement with the Folin phenol reagent. J. Biol. Chem. 1951, 193, 265–275. [Google Scholar] [CrossRef] [Scilit]
- Naghdi, S.; Rezaei, M.; Tabarsa, M.; Abdollahi, M. Expanding the pH-Shift Technique for Sequential Extraction of Intact Proteins and Sulfated Polysaccharide From Fish Heads: A Novel Biorefinery Approach. Food Sci. Nutr. 2025, 13, e70673. [Google Scholar] [CrossRef] [Scilit] [PubMed]
- Sipahi, H.; Orak, D.; Reis, R.; Yalman, K.; Şenol, O.; Palabıyık-Yücelik, S.S.; Deniz, İ.; Algül, D.; Guzelmeric, E.; Çelep, M.E.; et al. A comprehensive study to evaluate the wound healing potential of okra (Abelmoschus esculentus) fruit. J. Ethnopharmacol. 2022, 287, 114843. [Google Scholar] [CrossRef] [Scilit] [PubMed]
- Gülçin, İ.; Alwasel, S.H. DPPH Radical Scavenging Assay. Processes 2023, 11, 2248. [Google Scholar] [CrossRef] [Scilit]
- Apak, R.; Güçlü, K.; Özyürek, M.; Karademir, S.E. Novel total antioxidant capacity index for dietary polyphenols and vitamins C and E, using their cupric ion reducing capability in the presence of neocuproine: CUPRAC method. J. Agric. Food Chem. 2004, 52, 7970–7981. [Google Scholar] [CrossRef] [Scilit] [PubMed]
- Fuqua, B.K.; Lu, Y.; Darshan, D.; Frazer, D.M.; Wilkins, S.J.; Wolkow, N.; Vulpe, C.D.; Anderson, G.J. The multicopper ferroxidase hephaestin enhances intestinal iron absorption in mice. PLoS ONE 2014, 9, e98792. [Google Scholar] [CrossRef] [Scilit] [PubMed]
- Gulec, S.; Anderson, G.J.; Collins, J.F. Mechanistic and regulatory aspects of intestinal iron absorption. Am. J. Physiol. Gastrointest. Liver Physiol. 2014, 307, G397–G409. [Google Scholar] [CrossRef] [Scilit] [PubMed]
- Parrish, C.R.; Yoshida, C.M. Nutrition intervention for the patient with gastroparesis: An update. Pract. Gastroenterol. 2005, 29, 29–66. [Google Scholar]
- Bennett, P.; Oza, U.D.; Trout, A.T.; Mintz, A. Gastric emptying. In Diagnostic Imaging: Nuclear Medicine; Elsevier: Amsterdam, The Netherlands, 2016; pp. 96–99. [Google Scholar]
- López, A.R.; Ortega-Caneda, E.; Espada-Bellido, E.; Taracena-Zepeda, O.R.; Palma, M.; Fernández-Barbero, G. Quantification of Minerals in Edible Mushrooms via Optimized Microwave-Assisted Digestion: Nutritional Contributions of Fe, Mg, Na, K, and Ca. Foods 2024, 13, 4051. [Google Scholar] [CrossRef] [Scilit] [PubMed]
- Gulcin, İ.; Alwasel, S.H. Metal ions, metal chelators, and metal chelating assay as antioxidant method. Processes 2022, 10, 132. [Google Scholar] [CrossRef] [Scilit]
- Yu, C.; Qiu, G.; Liu, X.; Xie, Q.; Lin, Z.; Wang, F.; Cai, L. Anti-inflammatory effect and mechanism of stytontriterpene D on RAW264.7 cells and zebrafish. Front. Pharmacol. 2025, 16, 1559022. [Google Scholar] [CrossRef] [Scilit] [PubMed]
- Konya, R.; Reis, R.; Sipahi, H.; Barta, A.; Hohmann, J.; Kırmızıbekmez, H. Secondary metabolites from Gentiana cruciata L. and their anti-inflammatory and analgesic activities. Nat. Prod. Res. 2023, 37, 3025–3032. [Google Scholar] [CrossRef] [Scilit] [PubMed]
- Sezen, E.; Reis, R.; Özhan, Y.; Sipahi, H.; Gimatdin, R.; Gören, A.C.; Guzelmeric, E. Phytochemical characterization and evaluation of anti-inflammatory and anticancer activities of Cistus laurifolius originated propolis. Eur. Food Res. Technol. 2025, 251, 151–164. [Google Scholar] [CrossRef] [Scilit]
- Erdoğan, M.; Konya, R.; Özhan, Y.; Sipahi, H.; Çinbilgel, İ.; Masullo, M.; Kırmızıbekmez, H. Secondary metabolites from Scutellaria brevibracteata subsp. subvelutina and their in vitro anti-inflammatory activities. S. Afr. J. Bot. 2021, 139, 12–18. [Google Scholar] [CrossRef] [Scilit]
- Erdoğan, A.; Özhan, Y.; Sipahi, H.; Gürdal, E.E.; Sippl, W.; Köksal, M. iNOS/PGE2 inhibitors as a novel template for analgesic/anti-inflammatory activity: Design, synthesis, in vitro biological activity, and docking studies. Arch. Pharm. 2024, 357, e2400238. [Google Scholar] [CrossRef] [Scilit] [PubMed]
- Sahin, Z.; Özhan, Y.; Sipahi, H.; Biltekin, S.N.; Yurttaş, L.; Berk, B.; Demirayak, Ş. Novel benzofurane-pyrazole derivatives with anti-inflammatory, cyclooxygenase inhibitory, and cytotoxicity evaluation. Z. Naturforsch. C 2022, 77, 279–285. [Google Scholar] [CrossRef] [Scilit] [PubMed]
- Daraie, B.; Pourahmad, J.; Hamidi-Pour, N.; Hosseini, M.J.; Shaki, F.; Soleimani, M. Uranyl acetate induces oxidative stress and mitochondrial membrane potential collapse in the human dermal fibroblast primary cells. Iran. J. Pharm. Res. 2012, 11, 495–501. [Google Scholar] [PubMed]
- Reilly, C.A.; Aust, S.D. Measurement of lipid peroxidation. In Current Protocols in Toxicology; John Wiley & Sons: New York, NY, USA, 1999; pp. 2.4.1–2.4.13. [Google Scholar]
- Sedlak, J.; Lindsay, R.H. Estimation of total, protein-bound, and nonprotein sulfhydryl groups in tissue with Ellman’s reagent. Anal. Biochem. 1968, 25, 192–198. [Google Scholar] [CrossRef] [Scilit] [PubMed]
- Reis, R.; Orak, D.; Yılmaz, D.; Çimen, H.; Sipahi, H. Modulation of cigarette smoke extract-induced human bronchial epithelial damage by eucalyptol and curcumin. Hum. Exp. Toxicol. 2021, 40, 1445–1462. [Google Scholar] [CrossRef] [Scilit] [PubMed]
- Hadwan, M.H. Simple spectrophotometric assay for measuring catalase activity in biological tissues. BMC Biochem. 2018, 19, 7. [Google Scholar] [CrossRef] [Scilit] [PubMed]
- Marklund, S.; Marklund, G. Involvement of the superoxide anion radical in the autoxidation of pyrogallol and a convenient assay for superoxide dismutase. Eur. J. Biochem. 1974, 47, 469–474. [Google Scholar] [CrossRef] [Scilit] [PubMed]
- Özhan, Y.; Güzelmeriç, E.; Çokçeken, Z.; Reis, R.; Hamitoğlu, M.; Tuğcu, G.; Kan, Y.; Aydın, A.; Sipahi, H. Exploring the cytoprotective potential of Sideritis congesta extracts in APAP-induced hepatotoxicity: In vitro and in silico approaches. Food Chem. Toxicol. 2025, 207, 115825. [Google Scholar] [CrossRef] [Scilit] [PubMed]
- Riemer, J.; Hoepken, H.H.; Czerwińska, H.; Robinson, S.R.; Dringen, R. Colorimetric ferrozine-based assay for the quantitation of iron in cultured cells. Anal. Biochem. 2004, 331, 370–375. [Google Scholar] [CrossRef] [Scilit] [PubMed]
- Jakopic, J.; Petkovsek, M.M.; Likozar, A.; Solar, A.; Štampar, F.; Veberic, R. HPLC–MS identification of phenols in hazelnut (Corylus avellana L.) kernels. Food Chem. 2011, 124, 1100–1106. [Google Scholar] [CrossRef] [Scilit]
- Lelli, V.; Molinari, R.; Merendino, N.; Timperio, A.M. Detection and comparison of bioactive compounds in different extracts of two hazelnut skin varieties, Tonda gentile romana and Tonda di Giffoni, using a metabolomics approach. Metabolites 2021, 11, 296. [Google Scholar] [CrossRef] [Scilit] [PubMed]
- Pfeil, J.A.; Zhao, Y.; McGorrin, R.J. Chemical composition, phytochemical content, and antioxidant activity of hazelnut (Corylus avellana L.) skins from Oregon. LWT 2024, 201, 116204. [Google Scholar] [CrossRef] [Scilit]
- Bardestani, A.; Ebrahimpour, S.; Esmaeili, A.; Esmaeili, A. Quercetin attenuates neurotoxicity induced by iron oxide nanoparticles. J. Nanobiotechnol. 2021, 19, 327. [Google Scholar] [CrossRef] [Scilit] [PubMed]
- Gülsoy, E.; Kaya, E.D.; Türkhan, A.; Bulut, M.; Koyuncu, M.; Güler, E.; Muradoğlu, F. The effect of altitude on phenolic, antioxidant and fatty acid compositions of some Turkish hazelnut (Corylus avellana L.) cultivars. Molecules 2023, 28, 5067. [Google Scholar] [CrossRef] [Scilit] [PubMed]
- Andjelković, M.; Van Camp, J.; De Meulenaer, B.; Depaemelaere, G.; Socaciu, C.; Verloo, M.; Verhe, R. Iron-chelation properties of phenolic acids bearing catechol and galloyl groups. Food Chem. 2006, 98, 23–31. [Google Scholar] [CrossRef] [Scilit]
- Elhabiri, M.; Carrèr, C.; Marmolle, F.; Traboulsi, H. Complexation of iron (III) by catecholate-type polyphenols. Inorg. Chim. Acta 2007, 360, 353–359. [Google Scholar] [CrossRef] [Scilit]
- Delgado, T.; Malheiro, R.; Pereira, J.A.; Ramalhosa, E. Hazelnut (Corylus avellana L.) kernels as a source of antioxidants and their potential in relation to other nuts. Ind. Crops Prod. 2010, 32, 621–626. [Google Scholar] [CrossRef] [Scilit]
- Pelvan, E.; Öktem Olgun, E.; Karadağ, A.; Alasalvar, C. Phenolic profiles and antioxidant activity of Turkish Tombul hazelnut samples (natural, roasted, and roasted hazelnut skin). Food Chem. 2018, 244, 102–108. [Google Scholar] [CrossRef] [Scilit] [PubMed]
- Di Michele, A.; Pagano, C.; Allegrini, A.; Blasi, F.; Cossignani, L.; Di Raimo, E.; Faieta, M.; Oliva, E.; Pittia, P.; Primavilla, S.; et al. Hazelnut shells as source of active ingredients: Extracts preparation and characterization. Molecules 2021, 26, 6607. [Google Scholar] [CrossRef] [Scilit] [PubMed]
- Brune, M.; Rossander, L.; Hallberg, L. Iron absorption and phenolic compounds: Importance of different phenolic structures. Eur. J. Clin. Nutr. 1989, 43, 547–557. [Google Scholar] [PubMed]
- Khokhar, S.; Apenten, R.K.O. Iron binding characteristics of phenolic compounds: Some tentative structure–activity relations. Food Chem. 2003, 81, 133–140. [Google Scholar] [CrossRef] [Scilit]
- Wessling-Resnick, M. Iron homeostasis and the inflammatory response. Annu. Rev. Nutr. 2010, 30, 105–122. [Google Scholar] [CrossRef] [Scilit] [PubMed]
- Rajaram, S.; Damasceno, N.R.T.; Braga, R.A.M.; Martinez, R.; Kris-Etherton, P.; Sala-Vila, A. Effect of nuts on markers of inflammation and oxidative stress: A narrative review. Nutrients 2023, 15, 1099. [Google Scholar] [CrossRef] [Scilit] [PubMed]
- Spagnuolo, L.; Della Posta, S.; Fanali, C.; Dugo, L.; De Gara, L. Chemical composition of hazelnut skin food waste and protective role against advanced glycation end-products (AGEs) damage in THP-1-derived macrophages. Molecules 2023, 28, 6280. [Google Scholar] [CrossRef] [Scilit] [PubMed]
- Zhao, J.; Wang, X.; Lin, H.; Lin, Z. Hazelnut and its by-products: A comprehensive review of nutrition, phytochemical profile, extraction, bioactivities and applications. Food Chem. 2023, 413, 135576. [Google Scholar] [CrossRef] [Scilit] [PubMed]
- Ren, D.; Wang, P.; Liu, C.; Wang, J.; Liu, X.; Liu, J.; Min, W. Hazelnut protein-derived peptide LDAPGHR shows anti-inflammatory activity on LPS-induced RAW264.7 macrophage. J. Funct. Foods 2018, 46, 449–455. [Google Scholar] [CrossRef] [Scilit]
- Müller, A.K.; Schmölz, L.; Wallert, M.; Schubert, M.; Schlörmann, W.; Glei, M.; Lorkowski, S. In vitro digested nut oils attenuate the lipopolysaccharide-induced inflammatory response in macrophages. Nutrients 2019, 11, 503. [Google Scholar] [CrossRef] [Scilit] [PubMed]
- Santa-María, C.; López-Enríquez, S.; Montserrat-de la Paz, S.; Geniz, I.; Reyes-Quiroz, M.E.; Moreno, M.; Palomares, F.; Sobrino, F.; Alba, G. Update on anti-inflammatory molecular mechanisms induced by oleic acid. Nutrients 2023, 15, 224. [Google Scholar] [CrossRef] [Scilit] [PubMed]
- Chen, H.J.; Sugiyama, M.; Shimokawa, F.; Murakami, M.; Hashimoto, O.; Matsui, T.; Funaba, M. Response to iron overload in cultured hepatocytes. Sci. Rep. 2020, 10, 21184. [Google Scholar] [CrossRef] [Scilit] [PubMed]
- Gaweł, S.; Wardas, M.; Niedworok, E.; Wardas, P. Dialdehyde malonowy (MDA) jako wskaźnik procesów peroksydacji lipidów w organizmie [Malondialdehyde (MDA) as a lipid peroxidation marker]. Wiad. Lek. 2004, 57, 453–455. [Google Scholar] [PubMed]
- Kumar, C.; Igbaria, A.; D’Autreaux, B.; Planson, A.-G.; Junot, C.; Godat, E.; Bachhawat, A.K.; Delaunay-Moisan, A.; Toledano, M.B. Glutathione revisited: A vital function in iron metabolism and ancillary role in thiol-redox control. EMBO J. 2011, 30, 2044–2056. [Google Scholar] [CrossRef] [Scilit] [PubMed]
- Hatipoğlu, A.; Kanbağlı, Ö.; Balkan, J.; Küçük, M.; Çevikbaş, U.; Aykaç-Toker, G.; Berkkan, H.; Uysal, M. Hazelnut oil administration reduces aortic cholesterol accumulation and lipid peroxides in the plasma, liver, and aorta of rabbits fed a high-cholesterol diet. Biosci. Biotechnol. Biochem. 2004, 68, 2050–2057. [Google Scholar] [CrossRef] [Scilit] [PubMed]
- Akcan, B.; Örem, A.; Kural, B.; Yücesan, F.; Örem, C. Hazelnut-enriched diet effectively increases lipoproteins’ resistance to oxidation in hypercholesterolemic subjects. Food Health 2023, 9, 201–211. [Google Scholar] [CrossRef] [Scilit]
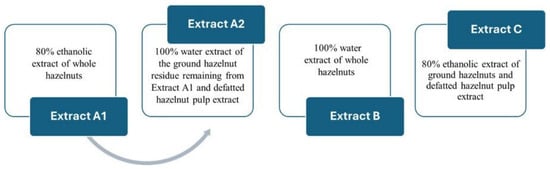
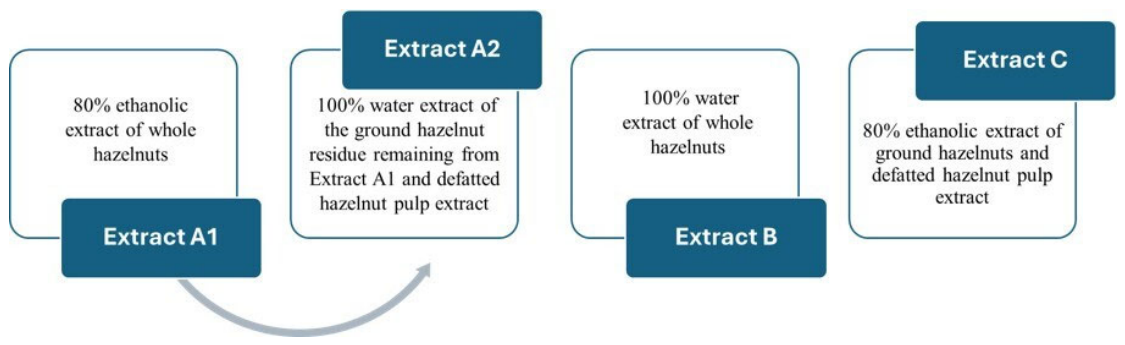
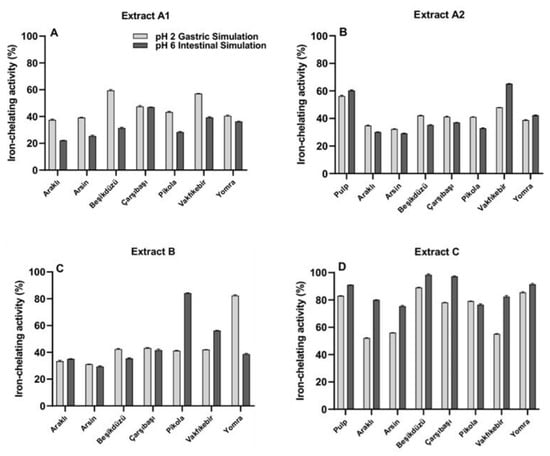
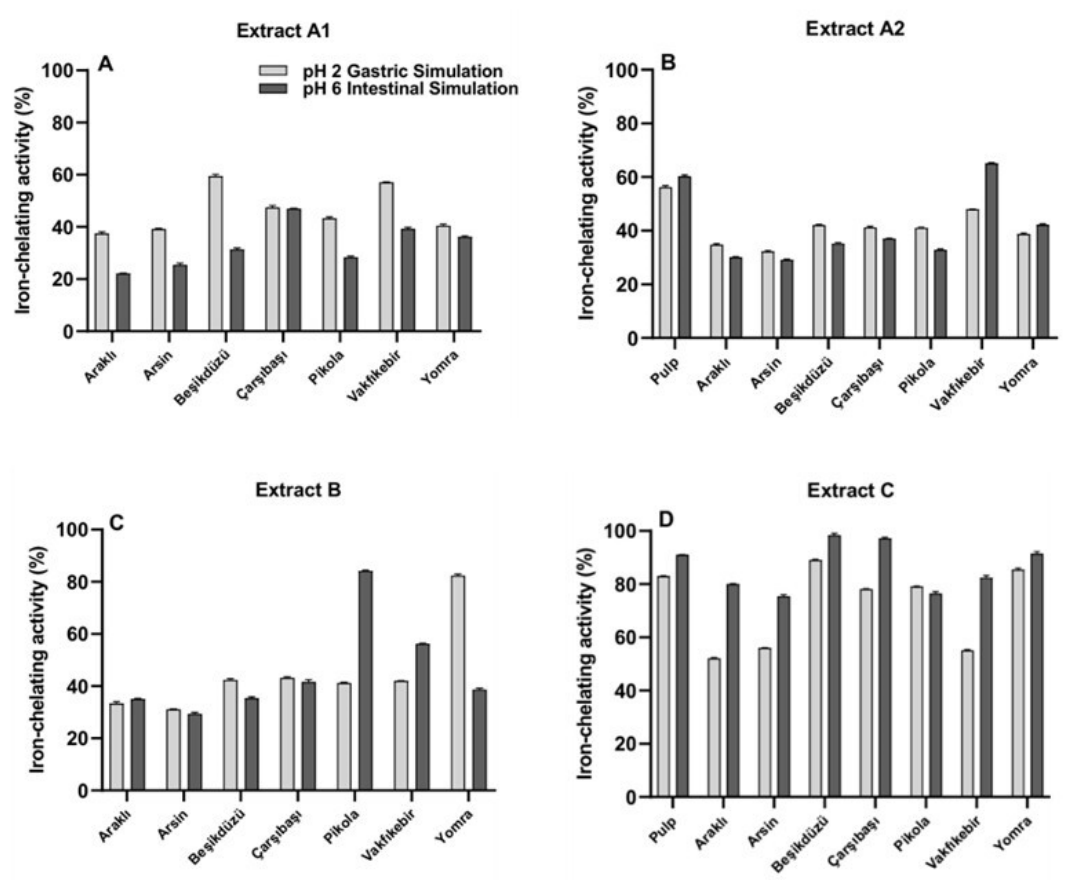
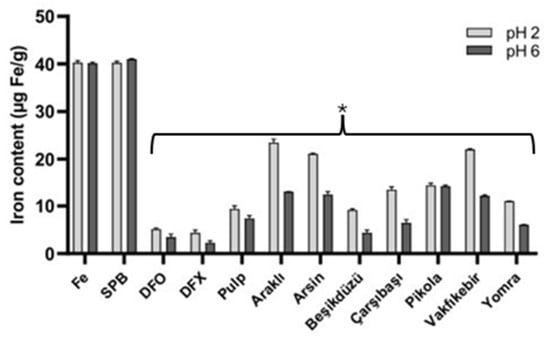
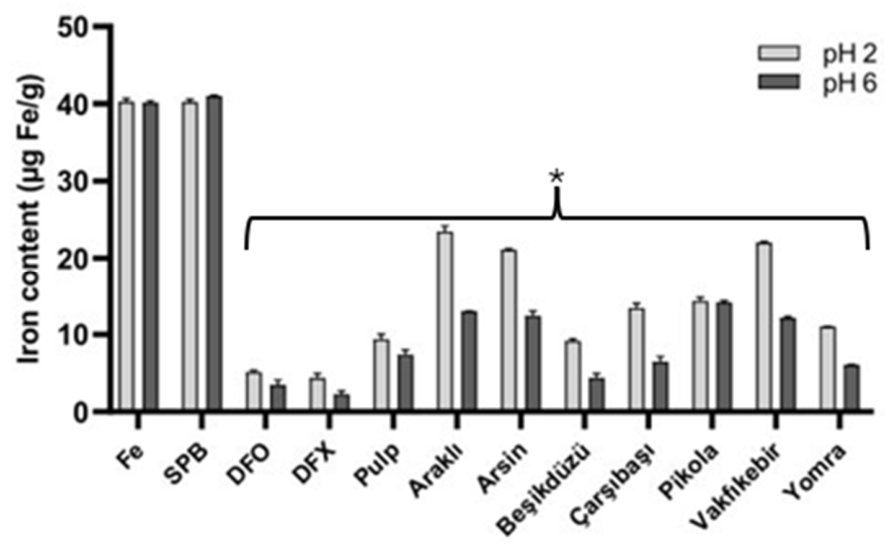
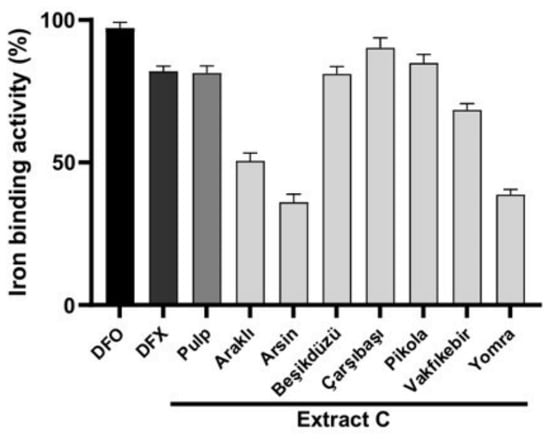
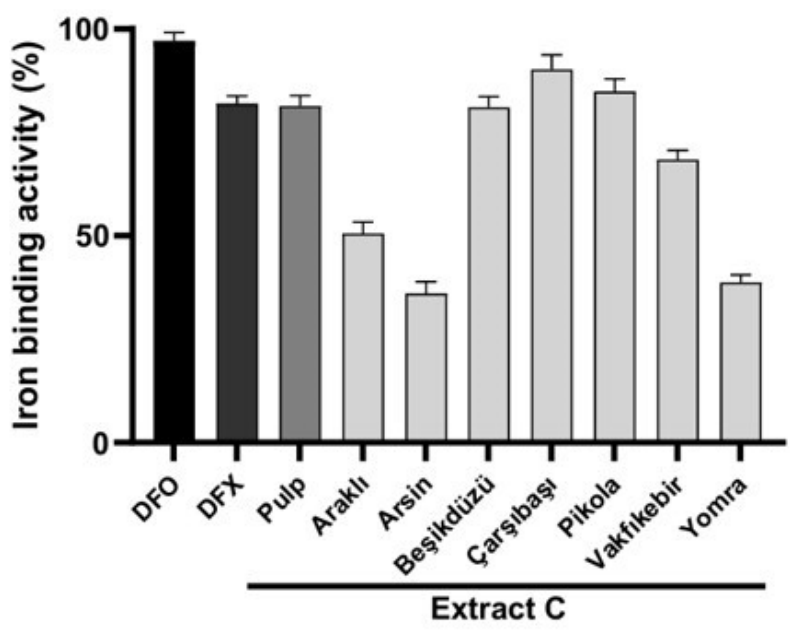
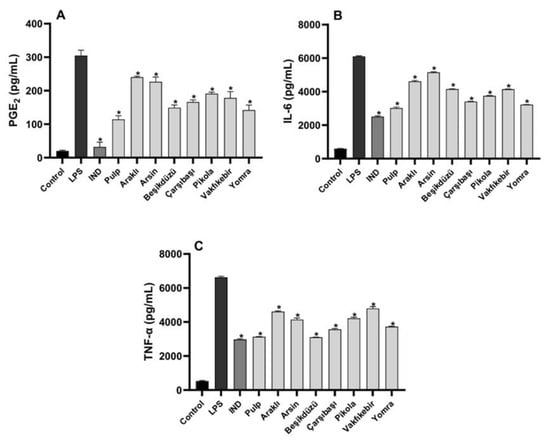
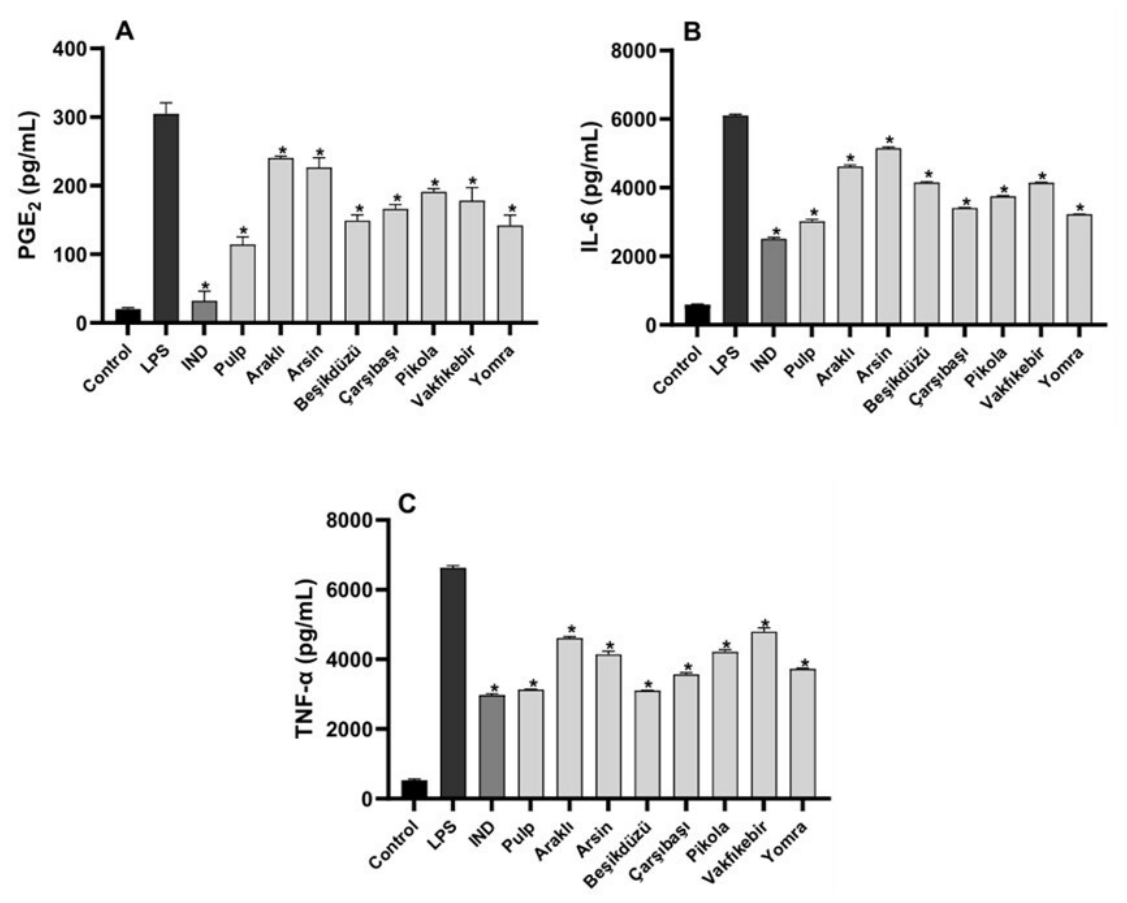
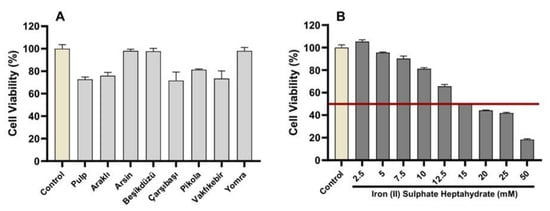
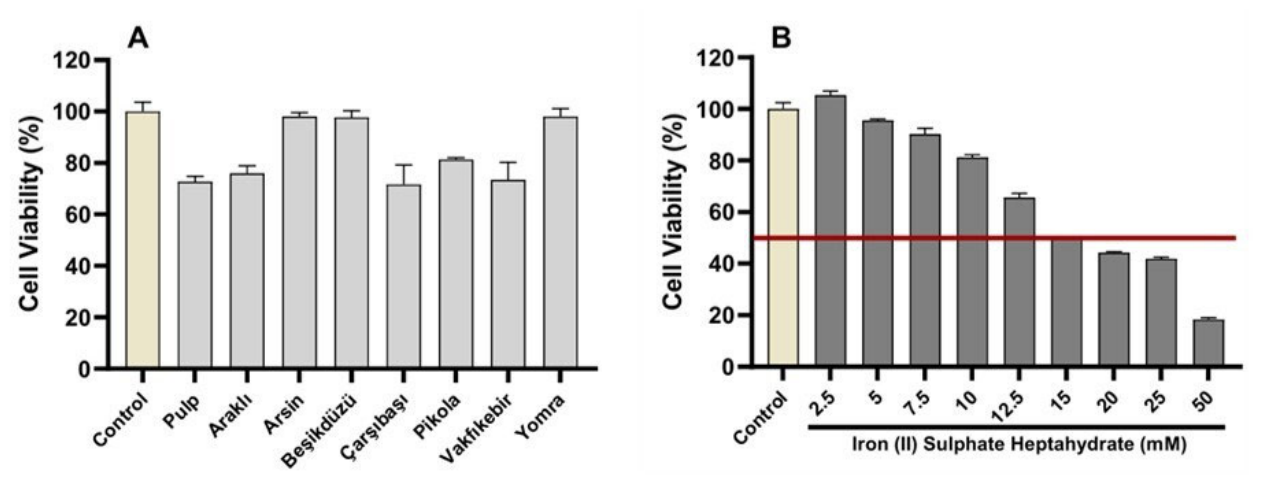
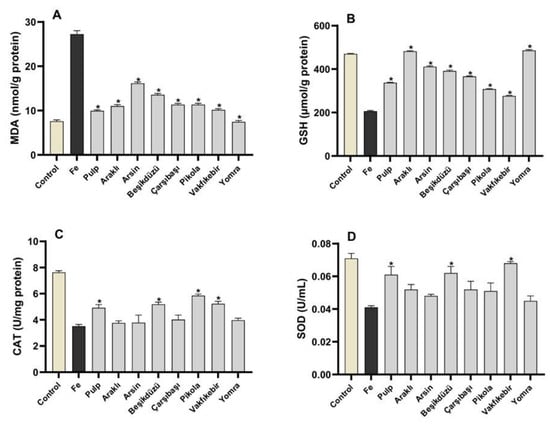
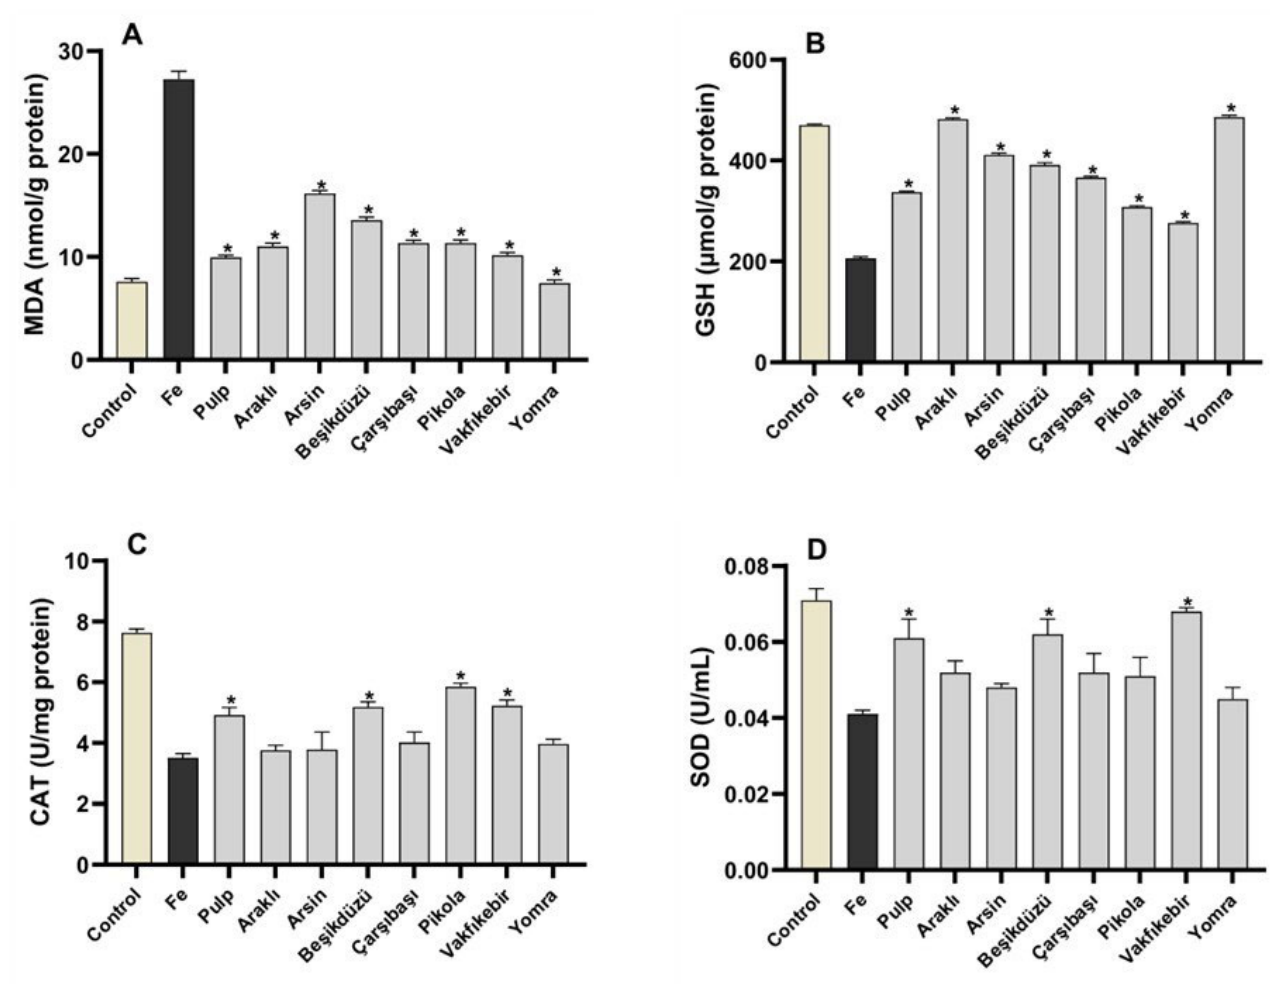
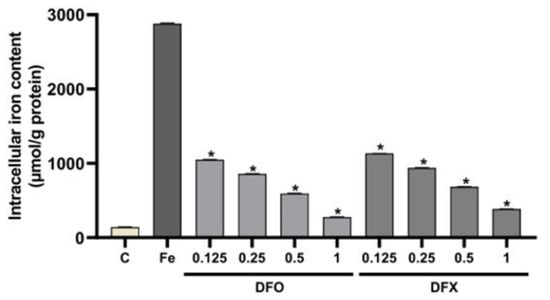
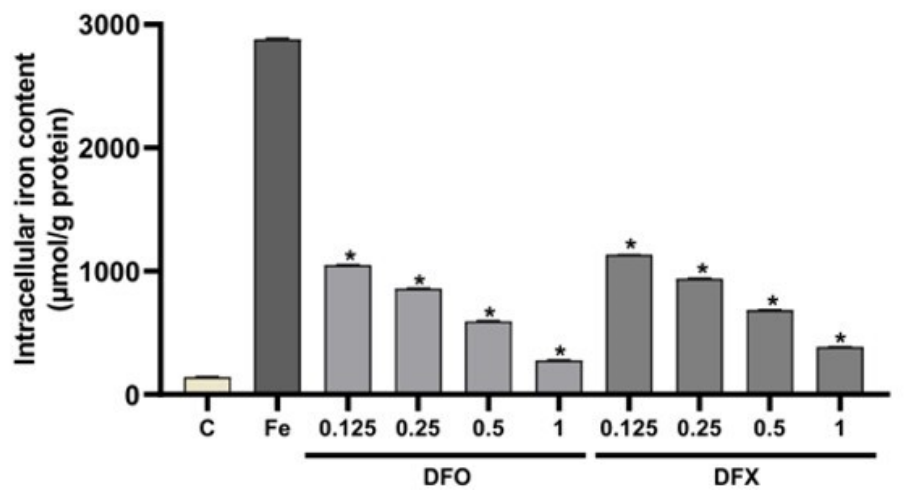
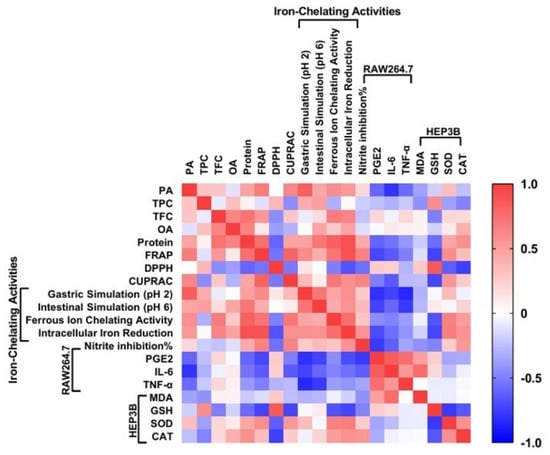
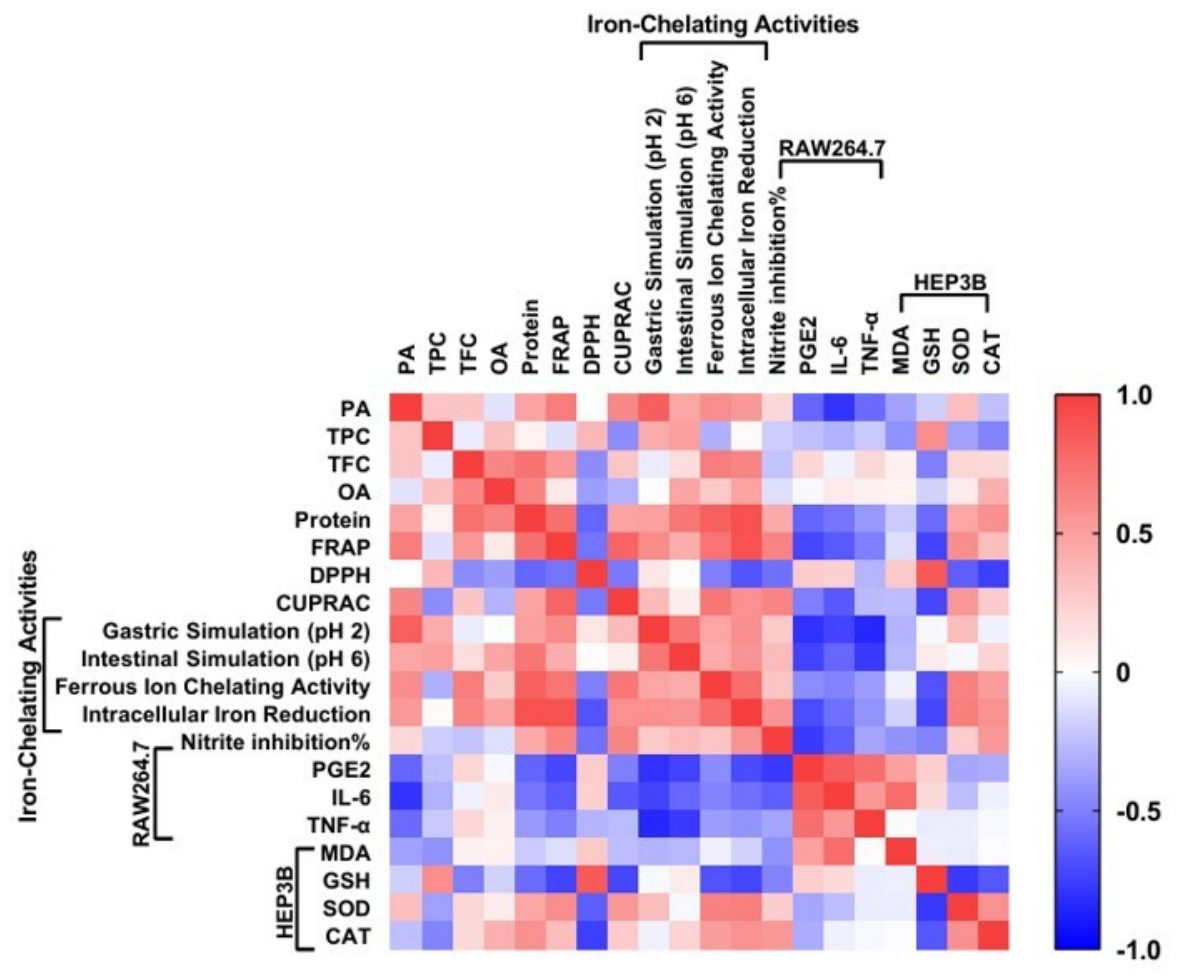

Disclaimer/Publisher’s Note: The statements, opinions and data contained in all publications are solely those of the individual author(s) and contributor(s) and not of MDPI and/or the editor(s). MDPI and/or the editor(s) disclaim responsibility for any injury to people or property resulting from any ideas, methods, instructions or products referred to in the content. |
© 2026 by the authors. Licensee MDPI, Basel, Switzerland. This article is an open access article distributed under the terms and conditions of the Creative Commons Attribution (CC BY) license.