


Abstract
Background: With its steadily rising global prevalence posing a profound public health challenge, obesity represents a complex disorder sustained by reciprocal disturbances in energy partitioning, glycemic control, adipokine–neuroendocrine signaling, cellular redox equilibrium, and organ integrity. The aim of this study was to evaluate the dose-dependent therapeutic effects of Garcinia mangostana pericarp extract (GME) in a high-fat-diet (HFD)-induced obesity model, focusing on adipokine patterns, redox balance, organ injury, and hepatic Nrf2/HO-1 levels. Methods: Sixty-four male Wistar albino rats were allocated into a 16-week 2 × 4 factorial design (n = 8/group): standard basal diet or 60%-kcal fat HFD, each concurrently administered vehicle or GME via daily oral gavage at 100, 200, or 300 mg/kg. Somatic growth parameters and fasting glycometabolic indices (glucose, insulin, HOMA-IR) were quantified. Circulating lipids, hepatorenal injury enzymes, regulatory peptides (spexin, asprosin, adiponectin, BDNF, irisin, GLP-1), and systemic/tissue redox markers (TAS, TOS, OSI, MDA, 4-HNE, 8-OHdG, enzymatic antioxidants) were determined via automated clinical chemistry analyzers, spectrophotometry, and specific ELISA kits. Hepatorenal histopathology, epididymal adipocyte morphometry, and hepatic nuclear Nrf2 and HO-1 abundance were quantitatively analyzed. Statistical evaluations were conducted using two-way factorial ANOVA assessing diet, treatment, and diet-by-treatment interactions, followed by Tukey’s post hoc test for multiplicity-adjusted comparisons (p < 0.05). Results: HFD feeding significantly increased final body weight, energy intake, fasting glucose, and marked insulin resistance (HOMA-IR: 7.89 vs. 1.69; p < 0.001), precipitating atherogenic dyslipidemia and hepatorenal injury relative to controls. This pathophysiology coincided with elevated circulating asprosin, alongside marked depletion of spexin, adiponectin, BDNF, enzymatic antioxidant defenses (SOD, CAT, GPx; all p < 0.001), and Nrf2/HO-1 levels. GME produced dose-dependent improvements across these metabolic disturbances (diet × treatment interaction: p < 0.001 for all primary outcomes). Relative to HFD controls, the 300 mg/kg dose reduced final body weight by 15.3% (p < 0.05), HOMA-IR by 69.5% (p < 0.001), triglycerides by 47.6% (p < 0.001), serum MDA by 55.4% (p < 0.001), and adipocyte diameter by 49.1% (p < 0.001), providing the most prominent improvements in hepatic steatosis, renal injury scores, and upregulation of nuclear Nrf2 (3.81-fold) and liver HO-1 (4.74-fold). Conversely, the 200 mg/kg dose was distinguished by maximizing neurotrophic support (peak BDNF elevation, +84.8% vs. HFD controls; p < 0.05) and effectively restoring circulating metabolic peptides (spexin and adiponectin) toward physiological levels. Conclusions: These findings indicate that GME supplementation dose-dependently attenuates high-fat-diet-induced metabolic dysfunction, a response accompanied in part by a concomitant reduction in daily energy intake. Among the evaluated regimens, the 300 mg/kg dose exhibited the most potent efficacy in improving glycemic control (HOMA-IR), circulating lipid profiles (triglycerides, total cholesterol, LDL-C), and parenchymal organ injury (hepatic steatosis and renal vacuolation). In contrast, the 200 mg/kg dose was distinguished by optimizing neurotrophic support and restoring suppressed adipokines toward physiological concentrations. Consequently, GME is anticipated and considered to provide valuable support to medical nutrition therapy and clinical dietetic management as a promising functional nutraceutical for counteracting diet-induced metabolic abnormalities; prospective clinical trials remain necessary to establish safety, bioavailability, and therapeutic dosing.
1. Introduction
Obesity is not simply excess body mass but a systems-level disorder in which chronic positive energy balance drives adipocyte hypertrophy, ectopic lipid deposition, impaired insulin signaling, low-grade inflammation, and progressive organ injury. Expansion of visceral adipose tissue promotes immune-cell recruitment and the secretion of cytokines and chemokines that interfere with insulin receptor signaling, while excessive lipid flux toward the liver and skeletal muscle reinforces lipotoxicity and dysglycemia [1,2,3,4,5,6]. High-fat-diet models reproduce several of these interacting features and remain useful for testing mechanistically plausible nutritional interventions, provided that species, diet composition, exposure duration, and dose are considered when interpreting translational relevance [7,8,9].
Oxidative stress is a central amplifier of obesity-associated metabolic dysfunction. Nutrient excess increases mitochondrial reducing pressure, reactive oxygen species production, lipid peroxidation, and oxidative DNA injury. When antioxidant systems such as superoxide dismutase (SOD), catalase (CAT), glutathione peroxidase (GPx), and reduced glutathione (GSH) are insufficient, oxidative products including malondialdehyde (MDA), 4-hydroxynonenal (4-HNE), and 8-hydroxy-2′-deoxyguanosine (8-OHdG) accumulate [10,11,12,13]. Nuclear factor erythroid 2-related factor 2 (Nrf2) coordinates an adaptive transcriptional program that includes heme oxygenase-1 (HO-1) and enzymes involved in glutathione metabolism. The role of Nrf2 in obesity is context-dependent, but failure of this defense network can aggravate insulin resistance, steatosis, and tissue damage [14,15,16].
Metabolic homeostasis is also governed by an endocrine network extending beyond insulin and classical adipokines. Adiponectin supports fatty-acid oxidation and insulin sensitivity, whereas asprosin promotes hepatic glucose release and has been linked to appetite and insulin resistance [17,18]. Spexin has emerged as a regulator of food intake, lipid metabolism, and insulin sensitivity and is frequently reduced in obesity [19,20]. Irisin has been associated with energy expenditure and adipose browning, although circulating responses vary with species, metabolic state, assay platform, and compensatory physiology [21,22]. Nesfatin-1 and glucagon-like peptide-1 (GLP-1) participate in satiation and glycemic regulation, while brain-derived neurotrophic factor (BDNF) links neuronal plasticity to hypothalamic energy balance [23,24,25,26]. Simultaneous evaluation of these signals may therefore reveal treatment effects that body weight alone cannot capture.
Mangosteen (Garcinia mangostana L.) is a tropical fruit whose pericarp contains xanthones, particularly alpha-mangostin, together with gamma-mangostin, gartanin, and polyphenolic constituents. Experimental work attributes antioxidant, anti-inflammatory, anti-adipogenic, and insulin-sensitizing actions to mangosteen-derived preparations [27,28,29,30]. Alpha-mangostin can inhibit adipocyte differentiation and fatty-acid synthase in vitro, while studies in HFD-fed rodents have reported improvements in adiposity, glucose handling, hepatic lipid accumulation, inflammatory recruitment, and antioxidant status [31,32,33,34]. Human evidence remains limited: small trials suggest possible improvements in insulin sensitivity or inflammatory status, but heterogeneity of formulations and modest sample sizes preclude therapeutic claims [35,36].
Important uncertainties remain. Published studies use fruit flesh, crude pericarp extracts, or purified alpha-mangostin at widely different doses and durations; consequently, apparently inconsistent effects may reflect preparation-specific bioavailability rather than biological contradiction. Moreover, few experiments have integrated energy intake, glycemic control, hepatorenal safety, emerging metabolic peptides, systemic and tissue oxidative injury, histology, and the Nrf2/HO-1 axis within one factorial design. The present study therefore examined the dose-dependent effects of GME (100, 200, and 300 mg/kg/day) in rats receiving a standard diet or 60%-kcal HFD. We hypothesized that GME would exert limited effects under basal conditions but would attenuate HFD-induced metabolic dysfunction through coordinated improvement of redox defense, adipose-endocrine signaling, and tissue integrity.
2. Materials and Methods
2.1. Animals, Ethical Approval, and Experimental Design
This study was designed as a randomized, controlled 2 × 4 factorial experiment utilizing 64 adult male Wistar albino rats (initial body weight: 195–215 g) to elucidate the dose-dependent therapeutic efficacy of Garcinia mangostana pericarp extract (GME) against high-fat-diet (HFD)-induced metabolic pathophysiology. Following a 7-day acclimatization period, animals were stratified into eight experimental groups (n = 8/group): standard basal diet receiving vehicle (C); standard diet supplemented with GME at 100, 200, or 300 mg/kg/day (GME100, GME200, and GME300); 60% kcal fat HFD receiving vehicle (HFD-C); and HFD co-administered with GME at 100, 200, or 300 mg/kg/day (HFD-GME100, HFD-GME200, and HFD-GME300). GME was freshly suspended in 0.5% (w/v) sodium carboxymethylcellulose (CMC-Na; Sigma-Aldrich, St. Louis, MO, USA), and corresponding vehicle cohorts received an identical volume of 0.5% CMC-Na alone via daily oral gavage (10 mL/kg body weight) continuously for 16 weeks.
Animals were housed in standard polycarbonate cages (4 rats per cage, yielding 2 independent cages per experimental group and 16 cages in total across the 8 cohorts) within environmentally controlled facilities maintained at 22 ± 2 °C, 50 ± 10% relative humidity, and an automated 12:12 h light–dark photoperiod, with ad libitum access to fresh drinking water and designated regimens. Group assignment was performed via computer-generated randomization sequences, and outcome assessors remained strictly blinded to group allocations throughout all biochemical, molecular, and histopathological evaluations. Humane endpoints were pre-established to minimize animal distress. At the conclusion of week 16, following a 12 h overnight fast, rats were deeply anesthetized with intraperitoneal ketamine hydrochloride (90 mg/kg; Ketalar, Pfizer Inc., New York, NY, USA) and xylazine hydrochloride (10 mg/kg; Rompun, Bayer AG, Leverkusen, Germany), followed by prompt terminal cardiac exsanguination for simultaneous whole-blood harvesting and systemic parenchymal tissue dissection.
All experimental procedures received formal ethical approval from the Local Ethics Committee for Animal Experiments of the Veterinary Control Central Research Institute (approval date: 1 November 2024; decision/protocol no: 2024/86) and strictly complied with ARRIVE 2.0 reporting guidelines [37]. The schematic overview of the experimental design and study workflow is illustrated in Figure 1.
Figure 1.
Schematic flowchart of the experimental design and 16-week study workflow. Adult male Wistar albino rats (N = 64) were acclimatized and randomly allocated into eight parallel dietary cohorts (n = 8 per group) receiving standard basal diet or high-fat diet (HFD, 60% kcal fat) with or without graded doses of Garcinia mangostana pericarp extract (GME; 100, 200, or 300 mg/kg BW/day suspended in 0.5% CMC-Na) via daily oral gavage (10 mL/kg) for 16 consecutive weeks. Longitudinal body weight and feed intake were monitored weekly. Terminal endpoint sample collection was performed at Week 16 under deep anesthesia (ketamine/xylazine) for comprehensive somatic, glycemic, lipidemic, redox, endocrine (adipokines, BDNF), histopathological, and hepatic Nrf2/HO-1 molecular characterization.
2.2. Experimental Diets and GME Administration
The ingredient composition and proximate nutritional profiles of the experimental diets are presented in Table 1. The standard basal diet was formulated in accordance with the AIN-93M mature rodent guideline, yielding an energy density of 3.85 kcal/g with 20% kcal protein, 70% kcal carbohydrate, and 10% kcal fat derived exclusively from refined soybean oil. The high-fat diet (HFD) was custom-formulated to establish sustained diet-induced metabolic dysfunction, delivering 60% of total metabolizable energy from lipids (caloric density: 5.24 kcal/g; 20% kcal protein, 20% kcal carbohydrate, and 60% kcal fat). Purified pork lard served as the primary rich source of saturated fatty acids, complemented with soybean oil (25.0 g/kg diet) to fulfill essential polyunsaturated fatty acid requirements. Diets were prepared in uniform pelleted forms, vacuum-packaged in nitrogen-flushed batches, and maintained at 4 °C in light-shielded containers throughout the experimental period to prevent auto-oxidative rancidity. Daily feed allowance and clean drinking water were provided ad libitum, with consumption monitored at scheduled intervals.
Table 1.
Ingredient composition and proximate characteristics of the experimental diets.
Standardized Garcinia mangostana pericarp extract (GME) was suspended freshly each morning in an aqueous vehicle of 0.5% (w/v) sodium carboxymethylcellulose (CMC-Na) to obtain homogeneous dispersions. Oral administration was carried out by intragastric gavage once daily between 09:00 and 10:00 AM at predetermined doses of 100, 200, or 300 mg/kg body weight, using a fixed dosing volume of 10 mL/kg body weight. The corresponding vehicle control groups (C and HFD-C cohorts) received equivalent volumes of 0.5% CMC-Na alone via the identical oral route. Individual body weights were documented weekly on a calibrated precision balance, and gavage delivery volumes were adjusted dynamically on a per-animal basis to ensure strict dose adherence over the 16-week intervention.
2.3. Plant Material, Extraction, and Standardization Procedure
Standardized dry pericarp extract of Garcinia mangostana L. was procured from Naturalya (Antalya, Türkiye). The botanical material was extracted using an aqueous ethanol solution (80% v/v, solid-to-solvent ratio 1:10 w/v) under controlled extraction conditions, followed by filtration, low-temperature vacuum evaporation, and spray-drying/lyophilization to yield a standardized fine dry powder. Chromatographic profiling, batch-to-batch consistency, and quality control of the extract were evaluated using high-performance liquid chromatography coupled with a diode array detector (HPLC-DAD). Chromatographic separation was achieved on a reversed-phase C18 analytical column (250 mm × 4.6 mm, 5 µm particle size) maintained at 30 °C. The mobile phase comprised 0.1% (v/v) aqueous formic acid (solvent A) and HPLC-grade acetonitrile (solvent B) delivered under an optimized linear gradient program at a constant flow rate of 1.0 mL/min. Ultraviolet absorbance was monitored simultaneously across 210–400 nm, with quantification performed at the maximum absorption wavelength of major bioactive xanthones (λ = 317 nm).
Individual xanthone constituents—predominantly α-mangostin and γ-mangostin—were identified by matching retention times and UV spectral overlays against authenticated analytical reference standards (≥98% purity). Quantitative content was calculated from multi-point external calibration curves exhibiting rigorous linearity (r2 > 0.999). The detailed chemical fingerprint, active marker contents, and elemental-purity parameters are summarized in Table 1, while the representative, uncropped HPLC-DAD chromatogram is displayed in Figure 2. All analytical procedures complied with standard validation guidelines for botanical pharmaceuticals to guarantee batch uniformity throughout the 16-week intervention.
Figure 2.
Representative HPLC-DAD Chromatogram and Phytochemical Characterization of Standardized Garcinia mangostana Pericarp Extract (GME). (A) Overlay of authenticated reference standards (≥98% purity) and (B) standardized GME monitored at λ = 280 nm. Peak 1: γ-mangostin (tR = 11.62 min; quantitative content: 8.4% w/w dry extract); Peak 2: α-mangostin (tR = 16.85 min; quantitative content: 32.6% w/w dry extract; total quantified xanthones: 41.0% w/w; overall extraction yield: 18.4% w/w). Calibration curves exhibited rigorous linearity across 10–500 µg/mL (r2 > 0.999) with relative standard deviations for intra-day and inter-day precision below 2.5%. Inset displays diode-array UV spectral overlays confirming chemical identity and peak purity. Abbreviations: HPLC-DAD, high-performance liquid chromatography with diode-array detection; mAU, milli-absorbance units; GME, Garcinia mangostana extract; tR, retention time.
2.4. Body Weight, Feed Intake, and Glycometabolic Profiling
Feed consumption was monitored weekly on a per-cage basis by quantifying feed disappearance (accounting for spillage). To avoid pseudoreplication artifacts arising from group-housing, the cage was defined as the independent experimental unit for dietary consumption (N = 2 cages per group). Daily energy intake (kcal/day) was determined by multiplying the mean cage daily feed consumption by the caloric density of the respective diets (3.85 kcal/g for basal diet and 5.24 kcal/g for HFD). Feed efficiency ratio (FER, %) was computed using the standardized formula: FER (%) = [Body Weight Gain (g)/Total Energy Intake (kcal)] × 100.
Following a terminal 12 h overnight fast, rats were deeply anesthetized with intraperitoneal ketamine hydrochloride (90 mg/kg) and xylazine hydrochloride (10 mg/kg). Whole-blood samples were harvested via prompt cardiac exsanguination and collected into serum separator tubes containing clot activator. Following complete coagulation at room temperature for 30 min, samples were centrifuged at 3000× g for 15 min at 4 °C to separate the serum, which was subsequently aliquoted and stored at −80 °C until biochemical analysis.
Fasting serum glucose concentrations were determined using an automated clinical chemistry analyzer via the enzymatic glucose oxidase–peroxidase (GOD-POD) method. Fasting serum insulin concentrations were quantified using a rat-specific, high-sensitivity enzyme-linked immunosorbent assay (ELISA) kit in accordance with the manufacturer’s protocol (intra-assay coefficient of variation [CV] < 5.0%; inter-assay CV < 8.0%). Whole-body systemic insulin resistance was evaluated through the homeostatic model assessment of insulin resistance (HOMA-IR), calculated according to the validated equation: HOMA-IR = [Fasting Insulin (μIU/mL) × Fasting Glucose (mg/dL)]/405.
2.5. Serum Biochemistry and Metabolic Peptide Measurements
Serum lipid fractions—comprising triglycerides, total cholesterol, low-density lipoprotein cholesterol, and high-density lipoprotein cholesterol—along with enzymatic and non-enzymatic indicators of hepatorenal structural and functional integrity, including alanine aminotransferase, aspartate aminotransferase, serum creatinine, and blood urea nitrogen, were quantitatively analyzed on an automated clinical chemistry analyzer using standardized commercial enzymatic and colorimetric diagnostic reagent kits in accordance with the manufacturer’s validated protocols. Circulating appetite- and metabolism-regulating peptide hormones were measured using species-specific, solid-phase sandwich enzyme-linked immunosorbent assay kits in strict compliance with the respective manufacturers’ technical guidelines, specifically employing a Rat Asprosin ELISA Kit (Cat. No: SG-21412; SinoGeneClon Biotech Co., Ltd., Hangzhou, China; range: 7.80–500 ng/mL, sensitivity: 2.1 ng/mL), a Rat Apelin ELISA Kit (Cat. No: SG-20252; SinoGeneClon Biotech; range: 200–6000 ng/L, sensitivity: 50 ng/L), a Rat Adiponectin ELISA Kit (Cat. No: SG-20421; SinoGeneClon Biotech; range: 2–90 ng/mL, sensitivity: 0.2 ng/mL), a Rat Irisin ELISA Kit (Cat. No: SG-20179; SinoGeneClon Biotech; range: 2–90 ng/mL, sensitivity: 0.2 ng/mL), a Rat BDNF ELISA Kit (Cat. No: SG-20200; SinoGeneClon Biotech; range: 3–100 ng/L, sensitivity: 1 ng/L), a Rat Nesfatin-1 ELISA Kit (Cat. No: E0878Ra; Bioassay Technology Laboratory/Shanghai Korain Biotech Co., Ltd., Shanghai, China; range: 30–9000 ng/L, sensitivity: 16.23 ng/L), a Rat GLP-1 ELISA Kit (Cat. No: E0918Ra; Bioassay Technology Laboratory; range: 15–3000 ng/L, sensitivity: 7.11 ng/L), and a Rat Spexin ELISA Kit (Cat. No: E2567Ra; Bioassay Technology Laboratory), with all assays maintaining high analytical precision characterized by intra- and inter-assay coefficients of variation of less than 8.0% and 10.0%, respectively. For the SinoGeneClon assay panels, serum aliquots were pre-diluted 5-fold (10 µL serum combined with 40 µL diluent per well) and incubated at 37 °C for 30 min, followed by five automated washing cycles with 1× wash buffer, horseradish peroxidase-conjugated secondary antibody incubation, and light-protected chromogenic development using 3,3′,5,5′-tetramethylbenzidine substrate solutions, whereas the BT Lab assays were processed through standardized biotinylated antibody and streptavidin-horseradish peroxidase incubation steps. Following the addition of sulfuric acid stop solution to terminate all enzymatic reactions, optical densities were immediately determined at 450 nm on a calibrated microplate spectrophotometer within 10 to 15 min, and absolute serum analyte concentrations were interpolated from multi-point standard calibration curves with sample dilution factors incorporated into final calculations from duplicate determinations across all experimental batches.
2.6. Systemic and Tissue Redox Biomarker Measurements
Serum total antioxidant status (TAS, mmol Trolox Equiv./L) and total oxidant status (TOS, μmol H2O2 Equiv./L) were quantified spectrophotometrically using automated commercial colorimetric assay kits (Rel Assay Diagnostics, Gaziantep, Türkiye) according to Erel’s standardized methods. To evaluate the systemic net redox state, the oxidative stress index (OSI, arbitrary units [AU]) was determined through unit harmonization by converting the millimolar unit of TAS to micromolar concentrations, calculated as follows:
OSI (AU) = [TOS (μmol H2O2 Equiv./L)/(TAS (mmol Trolox Equiv./L) × 10)] × 100
Circulating lipid peroxidation was evaluated by measuring serum thiobarbituric acid reactive substances (TBARS, expressed as malondialdehyde equivalents, μmol MDA Equiv./L) via colorimetric assay monitoring chromogen absorbance at 532 nm. Enzymatic antioxidant activities, including superoxide dismutase (SOD, U/mL), catalase (CAT, kU/L), and glutathione peroxidase (GPx, U/L), were determined in serum using standardized enzymatic assay kits in compliance with the manufacturer’s technical protocols. Circulating 8-hydroxy-2′-deoxyguanosine (8-OHdG, ng/mL), an established hallmark of oxidative DNA damage, was determined using a competitive species-specific ELISA kit.
For parenchymal tissue evaluations, isolated liver and kidney specimens harvested at necropsy were promptly snap-frozen in liquid nitrogen and stored at −80 °C until tissue processing. Weighed liver samples were homogenized in ice-cold 50 mM phosphate-buffered saline (PBS, pH 7.4, 1:10 w/v) containing protease inhibitor cocktails using a motorized tissue homogenizer. Homogenates were centrifuged at 12,000× g for 15 min at 4 °C, and the resulting supernatants were collected for lipid peroxidation analysis; hepatic 4-hydroxynonenal (4-HNE, pg/mg protein) concentrations were quantified via solid-phase ELISA and normalized against total soluble protein concentrations determined by the Bradford assay. Renal tissue samples were homogenized in 5% (w/v) meta-phosphoric acid buffer to prevent auto-oxidation of sulfhydryl groups, centrifuged at 3000× g for 10 min at 4 °C, and renal reduced glutathione (GSH, μmol/g wet tissue) content was determined colorimetrically through the reduction of 5,5′-dithiobis-(2-nitrobenzoic acid) (DTNB, Ellman’s reagent) at 412 nm. All spectrophotometric readings, calibration standards, and experimental samples were analyzed in duplicate.
2.7. Histopathological Examination, Adipose Morphometry, and Hepatic Nrf2/HO-1 Signaling Analysis
Representative specimens of hepatic, renal, and epididymal white adipose tissues were promptly excised following terminal exsanguination, rinsed in ice-cold phosphate-buffered saline, fixed in 10% neutral buffered formalin for 48 h, routinely dehydrated through an ascending ethanol series, cleared in xylene, and embedded in paraffin wax. Serial sections (4–5 μm thickness) were stained with hematoxylin and eosin (H&E) for structural light microscopic evaluation (BX53 light microscope; Olympus Corp., Tokyo, Japan) by two certified veterinary pathologists who remained strictly blinded to dietary and treatment allocations. For each animal, 5 non-consecutive sections were evaluated across 10 randomly selected non-overlapping fields at 200× and 400× magnification. Structural lesions were semiquantitatively graded using prespecified 0-to-3 severity scales: (a) hepatic steatosis was scored based on the parenchymal distribution of macro- and microvesicular lipid filling and hepatocellular ballooning (0 = absent, <5% hepatocytes; 1 = mild, 5–33%; 2 = moderate, 33–66%; 3 = severe, >66% panacinar involvement); (b) renal tubular vacuolation was staged according to hydropic swelling and cytoplasmic degeneration within proximal and distal convoluted tubules (0 = intact morphology; 1 = mild, <25% tubules affected; 2 = moderate, 25–50%; 3 = severe, >50% diffuse vacuolar degeneration and luminal sloughing); (c) glomerular injury was evaluated based on the degree of mesangial expansion, hypercellularity, and Bowman space distortion (0 = normal architecture; 1 = mild, <25% of glomeruli; 2 = moderate, 25–50%; 3 = severe, >50% showing marked capillary obliteration and sclerosis). For epididymal adipose tissue morphometry, digital photomicrographs were captured at 200× magnification across 10 non-overlapping fields per rat using calibrated image-analysis software (ImageJ, Version 1.53k; National Institutes of Health, Bethesda, MD, USA) to measure mean adipocyte diameter from at least 100 contiguous cells per animal, alongside enumerating infiltrative macrophage-associated crown-like structures normalized per square millimeter of adipose area. Representative high-resolution photomicrographs illustrating these characteristic histological features across cohorts are shown in Figure 3. Hepatic nuclear Nrf2 translocation and total HO-1 abundance were quantitatively analyzed by immunoblotting, wherein subcellular nuclear and cytoplasmic fractions were resolved by 10% SDS-PAGE, electroblotted onto PVDF membranes, blocked with non-fat dry milk, probed overnight at 4 °C with primary antibodies against Nrf2 and HO-1 alongside Histone H3 and β-actin loading controls, incubated with horseradish peroxidase-conjugated secondary antibodies, detected via enhanced chemiluminescence, and quantified densitometrically to express protein expression as fold-change relative to the basal control cohort.
Figure 3.
Representative histopathological photomicrographs of liver, kidney, and epididymal white adipose tissue across experimental groups. Liver sections stained with hematoxylin and eosin (H&E) demonstrate preserved parenchymal cord architecture in standard-diet cohorts (C, GME100, GME200, GME300), marked panacinar macro- and microvesicular steatosis with hepatocellular ballooning in the untreated high-fat-diet control (HFD-C, arrows), and dose-dependent resolution of lipid vacuoles in GME-treated cohorts (HFD-GME100, HFD-GME200, HFD-GME300). Kidney H&E sections reveal normal glomeruli and tubules under basal conditions, pronounced tubular epithelial vacuolation, hydropic swelling, and glomerular mesangial alterations in HFD-C (arrows), which were progressively restored toward physiological morphology with GME supplementation. Epididymal adipose sections show uniform adipocyte morphometry in controls, prominent adipocyte hypertrophy and inflammatory macrophage-associated crown-like structures in HFD-C (arrows), and a dose-dependent reduction in adipocyte diameter and crown-like structure infiltration following GME co-administration. Scale bars = 100 µm.
2.8. Statistical Analysis
All quantitative experimental data were subjected to formal distribution diagnostics, wherein the normality of model residuals was evaluated using the Shapiro–Wilk test alongside visual inspection of normal Q–Q plots, and homoscedasticity across dietary and treatment cohorts was verified via Levene’s test of equality of error variances, with log-transformed variables employed in instances of heteroscedasticity to ensure mathematical compliance prior to inferential testing. Quantitative findings are expressed as mean ± standard error of the mean (SEM) based on an effective sample size of n = 8 biological replicates per experimental cohort, with cage-level mean consumption designated as the experimental unit for feed disappearance and caloric intake calculations to prevent pseudoreplication artifacts arising from group-housing conditions.
Inferential statistical evaluations were conducted through two-way factorial analysis of variance (ANOVA) incorporating dietary regimen (standard basal diet vs. 60%-kcal fat HFD), pharmacological GME intervention dose (vehicle, 100, 200, or 300 mg/kg/day), and their bidirectional interaction term (diet × treatment) as fixed categorical factors. Upon identification of statistically significant omnibus main effects or significant interaction dynamics, post hoc multiplicity-adjusted pairwise comparisons across all eight factorial arms were performed using Tukey’s honestly significant difference (HSD) test to control family-wise error rates. Non-parametric semiquantitative histopathological injury scores were comparatively analyzed via the Kruskal–Wallis test followed by Dunn’s post hoc pairwise test with Bonferroni correction for multiple hypothesis testing. All computational statistical procedures were implemented using SPSS software (Version 26.0; IBM Corp., Armonk, NY, USA) and GraphPad Prism (Version 9.0; GraphPad Software, San Diego, CA, USA), and a two-tailed probability value of p < 0.05 was universally set as the threshold for statistical significance across all primary and secondary endpoints.
3. Results
3.1. Somatic Growth, Energy Intake, and Glycemic Control
Baseline body weights did not differ significantly among the experimental cohorts (diet effect, p = 0.892; treatment effect, p = 0.945; interaction, p = 0.978), demonstrating strict initial randomization and phenotypic homogeneity across all groups (Table 2). Following the 16-week dietary protocol, non-treated high-fat-diet-fed rats (HFD-C) displayed substantial somatic and metabolic disturbances relative to basal controls (C), characterized by a 22.7% increase in terminal body weight (378.4 ± 5.8 g vs. 308.5 ± 4.5 g, p < 0.001), 37.4% higher mean daily energy intake (88.6 ± 2.5 kcal/day vs. 64.5 ± 1.8 kcal/day, p < 0.001), and a 79.9% elevation in feed efficiency ratio (FER: 9.75 ± 0.32% vs. 5.42 ± 0.18%, p < 0.001) (Table 2). Concomitantly, the HFD-C group manifested severe systemic insulin resistance and dysglycemia, as evidenced by marked elevations in fasting serum glucose (+67.2%; 144.5 ± 3.9 mg/dL vs. 86.4 ± 2.1 mg/dL, p < 0.001), hyperinsulinemia (+178.6%; 22.15 ± 0.85 μIU/mL vs. 7.95 ± 0.32 μIU/mL, p < 0.001), and a 4.67-fold induction in the calculated HOMA-IR index (7.89 ± 0.35 vs. 1.69 ± 0.08, p < 0.001) (Table 2).
Table 2.
Effects of Garcinia mangostana pericarp extract (GME) on somatic growth, energy intake, feed efficiency, and glycometabolic indices in rats fed a standard or high-fat diet.
Oral administration of Garcinia mangostana extract (GME) dose-dependently mitigated diet-induced somatic expansion and glycometabolic deterioration without causing adverse behavioral or toxic manifestations (Table 2). Among obese animals, treatment with GME at 300 mg/kg (HFD-GME300) yielded the most pronounced therapeutic efficacy, significantly curbing final body weight by 15.3% (320.4 ± 4.2 g vs. 378.4 ± 5.8 g, p < 0.001), energy consumption by 15.2% (75.1 ± 1.8 kcal/day vs. 88.6 ± 2.5 kcal/day), and FER by 31.8% (6.65 ± 0.19% vs. 9.75 ± 0.32%, p < 0.001) in comparison to the untreated HFD-C cohort (Table 2). In parallel, GME co-administration dose-dependently restored glucose homeostasis, with the 300 mg/kg regimen eliciting robust reductions in fasting glucose (−34.0%; 95.4 ± 2.4 mg/dL vs. 144.5 ± 3.9 mg/dL, p < 0.001) and circulating insulin concentrations (−53.7%; 10.25 ± 0.42 μIU/mL vs. 22.15 ± 0.85 μIU/mL, p < 0.001), thereby driving a 69.5% recovery in systemic insulin sensitivity (HOMA-IR: 2.41 ± 0.12 vs. 7.89 ± 0.35, p < 0.001) (Table 2).
Factorial two-way ANOVA revealed statistically significant bidirectional interaction effects (diet × treatment) across all terminal somatic, energetic, and glycemic endpoints (p < 0.001 for body weight, FER, glucose, insulin, and HOMA-IR; p = 0.015 for energy intake), confirming that the bioactivity of GME was selectively conditioned upon dietary context and metabolic distress (Table 2). Under basal normocaloric dietary conditions, GME supplementation across all evaluated doses produced negligible shifts in body weight, caloric intake, or glycemic parameters compared with vehicle-treated controls (Table 2).
3.2. Lipid Profile and Hepatorenal Biomarkers
Chronic consumption of the high-fat diet induced a profound and comprehensive dyslipidemic state in the non-treated obese control group (HFD-C) relative to standard-diet controls (C) (Table 3). Specifically, the HFD-C cohort displayed marked elevations in serum triglycerides (+126.0%; 168.4 ± 6.2 mg/dL vs. 74.5 ± 2.8 mg/dL, p < 0.001), total cholesterol (+97.2%; 162.5 ± 5.8 mg/dL vs. 82.4 ± 3.1 mg/dL, p < 0.001), and atherogenic LDL-C (+292.9%; 88.4 ± 3.4 mg/dL vs. 22.5 ± 1.1 mg/dL, p < 0.001), accompanied by a 36.9% depletion in anti-atherogenic HDL-C concentrations (28.5 ± 1.1 mg/dL vs. 45.2 ± 1.6 mg/dL, p < 0.001) (Table 3). Supplementation with Garcinia mangostana extract (GME) effectively reversed these lipid derangements in a dose-dependent fashion (Table 3). Relative to the untreated HFD-C rats, the high-dose GME intervention (HFD-GME300) yielded substantial reductions in triglycerides (−47.6%; 88.2 ± 3.4 mg/dL vs. 168.4 ± 6.2 mg/dL, p < 0.001), total cholesterol (−41.8%; 94.5 ± 3.5 mg/dL vs. 162.5 ± 5.8 mg/dL, p < 0.001), and LDL-C (−60.9%; 34.6 ± 1.4 mg/dL vs. 88.4 ± 3.4 mg/dL, p < 0.001), while restoring circulating HDL-C by 51.2% (43.1 ± 1.7 mg/dL vs. 28.5 ± 1.1 mg/dL, p < 0.001) to levels comparable with standard-diet controls (Table 3).
Table 3.
Effects of Garcinia mangostana pericarp extract (GME) on serum lipid profile in rats fed a standard or high-fat diet.
In parallel, dietary fat overload elicited severe hepatic and renal cellular stress, as reflected by pronounced circulating elevations in liver transaminases and nitrogenous retention metabolites in the HFD-C cohort (Table 4). Serum activities of ALT and AST in HFD-C rats increased by 178.4% (78.5 ± 3.4 U/L vs. 28.2 ± 1.2 U/L, p < 0.001) and 126.6% (148.2 ± 5.8 U/L vs. 65.4 ± 2.5 U/L, p < 0.001), respectively, while serum creatinine and BUN rose by 95.6% (0.88 ± 0.04 mg/dL vs. 0.45 ± 0.02 mg/dL, p < 0.001) and 86.9% (31.4 ± 1.2 mg/dL vs. 16.8 ± 0.7 mg/dL, p < 0.001) (Table 4). GME treatment dose-dependently mitigated this hepatorenal burden, with HFD-GME300 bringing circulating injury biomarkers down by 56.9% for ALT (33.8 ± 1.5 U/L), 50.2% for AST (73.8 ± 2.9 U/L), 44.3% for creatinine (0.49 ± 0.02 mg/dL), and 43.3% for BUN (17.8 ± 0.7 mg/dL), thereby reducing conventional renal retention indices toward baseline levels and attenuating circulating transaminase leakage (Table 4).
Table 4.
Effects of Garcinia mangostana pericarp extract (GME) on hepatic and renal biochemical markers in rats fed a standard or high-fat diet.
Factorial two-way ANOVA revealed statistically significant main effects for diet and treatment, as well as robust bidirectional diet-by-treatment interactions (diet × treatment, p < 0.001 for all parameters in Table 3 and Table 4). These interactions confirm that GME possessed pronounced therapeutic efficacy specifically under high-fat dietary stress, whereas administration across all GME doses in standard-diet cohorts produced negligible biological perturbations, reinforcing the safety profile and selectively targeted bioactivity of the extract (Table 3 and Table 4).
Values are expressed as mean ± SEM (n = 8 rats per group). Within each outcome column, means bearing different superscript letters (a–d) denote statistically significant differences among groups as determined by two-way factorial ANOVA followed by Tukey’s post hoc honestly significant difference (HSD) test (p < 0.05). Rows labeled Diet, Treatment, and Diet × Treatment report factorial ANOVA main and interaction p values. C, standard diet vehicle control; GME100, GME200, and GME300, standard diet supplemented with Garcinia mangostana extract at 100, 200, and 300 mg/kg/day, respectively; HFD-C, high-fat-diet vehicle control; HFD-GME, high-fat diet supplemented with corresponding GME doses; Total Chol., total cholesterol; LDL-C, low-density lipoprotein cholesterol; HDL-C, high-density lipoprotein cholesterol.
Values are expressed as mean ± SEM (n = 8 rats per group). Within each outcome column, means bearing different superscript letters (a–c) denote statistically significant differences among groups as determined by two-way factorial ANOVA followed by Tukey’s post hoc honestly significant difference (HSD) test (p < 0.05). Rows labeled Diet, Treatment, and Diet × Treatment report factorial ANOVA main and interaction p values. C, standard diet vehicle control; GME100, GME200, and GME300, standard diet supplemented with Garcinia mangostana extract at 100, 200, and 300 mg/kg/day, respectively; HFD-C, high-fat-diet vehicle control; HFD-GME, high-fat diet supplemented with corresponding GME doses; ALT, alanine aminotransferase; AST, aspartate aminotransferase; BUN, blood urea nitrogen.
3.3. Metabolic Peptides and Neurotrophic Support
High-fat-diet consumption elicited comprehensive endocrine disruption, shifting circulating peptide profiles toward an orexigenic, insulin-resistant, and neurotrophically depleted phenotype (Table 5 and Table 6). Non-treated obese rats (HFD-C) exhibited severe suppression of spexin (−58.1%; 104.2 ± 4.5 pg/mL vs. 248.5 ± 8.4 pg/mL, p < 0.001), BDNF (−50.3%; 0.145 ± 0.008 ng/mL vs. 0.292 ± 0.012 ng/mL, p < 0.001) and adiponectin (−37.2%; 3.88 ± 0.14 μg/mL vs. 6.18 ± 0.20 μg/mL, p < 0.001) compared with standard-diet controls (C) (Table 5). Conversely, circulating asprosin underwent a 5.06-fold surge (71.8 ± 3.0 ng/mL vs. 14.2 ± 0.6 ng/mL, p < 0.001) (Table 5), alongside pronounced elevations in apelin, nesfatin-1, irisin, and GLP-1 (Table 6).
Table 5.
Effects of Garcinia mangostana pericarp extract (GME) on circulating spexin, asprosin, BDNF, and adiponectin in rats fed a standard or high-fat diet.
Table 6.
Effects of Garcinia mangostana pericarp extract (GME) on circulating apelin, nesfatin-1, irisin, and GLP-1 in rats fed a standard or high-fat diet.
Intervention with Garcinia mangostana extract (GME) effectively realigned most of these dysregulated endocrine pathways toward standard baseline physiological levels (Table 5). In HFD-fed animals, supplementation with 300 mg/kg GME (HFD-GME300) yielded a 123.0% restorative increase in spexin (232.4 ± 8.1 pg/mL vs. 104.2 ± 4.5 pg/mL, p < 0.001) and a 51.5% recovery in adiponectin (5.88 ± 0.19 μg/mL vs. 3.88 ± 0.14 μg/mL, p < 0.001), achieving parity with standard control values (Table 5). In parallel, HFD-GME300 suppressed circulating asprosin concentrations by 62.1% (27.2 ± 1.2 ng/mL vs. 71.8 ± 3.0 ng/mL, p < 0.001) (Table 5), while reducing apelin by 32.8%, nesfatin-1 by 38.7%, and GLP-1 by 49.5% relative to the HFD-C group (Table 6).
In contrast to these monotonic trajectories, circulating BDNF exhibited a distinct, non-linear dose–response profile under dietary stress (Table 5). Within HFD cohorts, maximal circulating BDNF levels were attained at the intermediate dose of 200 mg/kg GME (HFD-GME200; +84.8% vs. HFD-C; 0.268 ± 0.012 ng/mL vs. 0.145 ± 0.008 ng/mL, p < 0.001), whereas the 300 mg/kg dose maintained an elevated level (+62.1% vs. HFD-C; 0.235 ± 0.011 ng/mL) that was comparatively lower than HFD-GME200 (Table 5). In standard-diet rats, however, GME produced a dose-dependent upward shift in circulating BDNF, peaking in the GME300 group (0.418 ± 0.018 ng/mL vs. 0.292 ± 0.012 ng/mL, p < 0.05) (Table 5). Factorial two-way ANOVA demonstrated significant main effects of diet and treatment, as well as significant diet-by-treatment interactions for spexin, asprosin, adiponectin (p < 0.001), and BDNF (p = 0.006), demonstrating that endocrine modulation by GME was dictated by underlying metabolic status (Table 5).
Values are expressed as mean ± SEM (n = 8 rats per group). Within each outcome column, means bearing different superscript letters (a–d) denote statistically significant differences among cohorts as determined by two-way factorial ANOVA followed by Tukey’s post hoc honestly significant difference (HSD) test (p < 0.05). Rows labeled Diet, Treatment, and Diet × Treatment report factorial ANOVA main and interaction p values. C, standard diet vehicle control; GME100, GME200, and GME300, standard diet supplemented with Garcinia mangostana extract at 100, 200, and 300 mg/kg/day, respectively; HFD-C, high-fat-diet vehicle control; HFD-GME, high-fat diet supplemented with corresponding GME doses; BDNF, brain-derived neurotrophic factor.
Values are expressed as mean ± SEM (n = 8 rats per group). Within each column, values bearing different superscript letters (a–c) denote statistically significant differences among cohorts as determined by two-way factorial ANOVA followed by Tukey’s post hoc honestly significant difference (HSD) test (p < 0.05). Rows labeled Diet, Treatment, and Diet × Treatment report factorial ANOVA main and interaction p values. C, standard diet vehicle control; GME100, GME200, and GME300, standard diet supplemented with Garcinia mangostana extract at 100, 200, and 300 mg/kg/day, respectively; HFD-C, high-fat-diet vehicle control; HFD-GME, high-fat diet supplemented with corresponding GME doses; GLP-1, glucagon-like peptide-1.
3.4. Systemic and Tissue Redox Homeostasis
Chronic high-fat-diet feeding imposed substantial systemic and tissue-level oxidative stress in untreated obese rats (HFD-C) relative to standard-diet controls (C), characterized by severe pro-oxidant accumulation and failure of enzymatic and non-enzymatic antioxidant defenses (Table 7 and Table 8). At the systemic level, the HFD-C cohort exhibited a 49.0% depletion in serum TAS (0.73 ± 0.03 mmol/L vs. 1.43 ± 0.04 mmol/L, p < 0.001) alongside a 175.4% surge in TOS (33.6 ± 0.9 μmol/L vs. 12.2 ± 0.4 μmol/L, p < 0.001), driving a 5.41-fold expansion in the systemic oxidative stress index (OSI: 4.60 ± 0.21 AU vs. 0.85 ± 0.04 AU, p < 0.001) (Table 7). In concert with this net oxidative shift, circulating lipid peroxidation rose precipitously, as reflected by a 224.3% increase in serum MDA (6.68 ± 0.23 μmol/L vs. 2.06 ± 0.08 μmol/L, p < 0.001), while key first-line enzymatic antioxidant activities collapsed, with SOD, CAT, and GPx declining by 52.5% (5.8 ± 0.2 U/mL vs. 12.2 ± 0.4 U/mL, p < 0.001), 50.6% (16.4 ± 0.7 kU/L vs. 33.2 ± 1.1 kU/L, p < 0.001), and 49.5% (70.2 ± 2.6 U/L vs. 139.0 ± 3.6 U/L, p < 0.001), respectively (Table 7).
Table 7.
Effects of Garcinia mangostana pericarp extract (GME) on systemic redox balance and antioxidant enzyme activities in rats fed a standard or high-fat diet.
Table 8.
Effects of Garcinia mangostana pericarp extract (GME) on tissue oxidative injury markers and renal glutathione in rats fed a standard or high-fat diet.
Treatment with Garcinia mangostana extract (GME) dose-dependently mitigated systemic oxidative burden and restored endogenous antioxidant capacity in HFD-fed rats (Table 7). In obese animals receiving the 300 mg/kg regimen (HFD-GME300), serum TAS doubled relative to HFD-C (1.47 ± 0.04 mmol/L vs. 0.73 ± 0.03 mmol/L, p < 0.001), while TOS, OSI, and MDA dropped by 56.0% (14.8 ± 0.5 μmol/L), 78.0% (1.01 ± 0.05 AU), and 55.4% (2.98 ± 0.10 μmol/L), respectively, effectively restoring systemic redox parameters to levels comparable with standard controls (Table 7). Concurrently, HFD-GME300 administration robustly augmented endogenous enzymatic machinery, eliciting increases of 119.0% in SOD (12.7 ± 0.4 U/mL), 111.0% in CAT (34.6 ± 1.1 kU/L), and 106.8% in GPx (145.2 ± 3.8 U/L) in comparison with untreated HFD-C rats (Table 7). In standard-diet animals, GME monotherapy promoted a progressive, dose-dependent induction of antioxidant defenses, with GME300 producing significant gains in TAS (+23.8%), SOD (+23.8%), CAT (+28.9%), and GPx (+21.4%) relative to basal controls (Table 7).
Tissue-specific oxidative injury and endogenous thiol reserves exhibited concordant pathological derangements and therapeutic recovery (Table 8). In the HFD-C group, hepatic lipid peroxidation and systemic oxidative DNA damage escalated dramatically, evidenced by a 262.8% elevation in liver 4-HNE adducts (87.8 ± 3.2 pg/mg protein vs. 24.2 ± 1.1 pg/mg protein, p < 0.001) and a 185.1% rise in circulating 8-OHdG (9.75 ± 0.36 ng/mL vs. 3.42 ± 0.14 ng/mL, p < 0.001), accompanied by a 54.7% loss in renal reduced glutathione content (GSH: 2.65 ± 0.11 μmol/g tissue vs. 5.85 ± 0.20 μmol/g tissue, p < 0.001) (Table 8). GME co-administration dose-dependently suppressed tissue macromolecular oxidation; the 300 mg/kg dose reduced hepatic 4-HNE by 61.5% (33.8 ± 1.4 pg/mg protein) and 8-OHdG by 58.5% (4.05 ± 0.16 ng/mL), while more than doubling renal GSH content (+105.7%; 5.45 ± 0.19 μmol/g tissue, p < 0.001) toward normocaloric control values (Table 8). Factorial two-way ANOVA demonstrated significant main effects for diet and treatment, as well as highly significant diet-by-treatment interactions across all systemic and tissue redox indices (p < 0.001 for all parameters in Table 7 and Table 8), underscoring that the antioxidant efficacy of GME was selectively accentuated under high-fat dietary challenge.
Values are expressed as mean ± SEM (n = 8 rats per group). Within each outcome column, means bearing different superscript letters (a–d) denote statistically significant differences among cohorts as determined by two-way factorial ANOVA followed by Tukey’s post hoc honestly significant difference (HSD) test (p < 0.05). Rows labeled Diet, Treatment, and Diet × Treatment report factorial ANOVA main and interaction p values. C, standard diet vehicle control; GME100, GME200, and GME300, standard diet supplemented with Garcinia mangostana extract at 100, 200, and 300 mg/kg/day, respectively; HFD-C, high-fat-diet vehicle control; HFD-GME, high-fat diet supplemented with corresponding GME doses; TAS, total antioxidant status; TOS, total oxidant status; OSI, oxidative stress index; MDA, malondialdehyde; SOD, superoxide dismutase; CAT, catalase; GPx, glutathione peroxidase.
Values are expressed as mean ± SEM (n = 8 rats per group). Within each outcome column, means bearing different superscript letters (a–d) denote statistically significant differences among cohorts as determined by two-way factorial ANOVA followed by Tukey’s post hoc honestly significant difference (HSD) test (p < 0.05). Rows labeled Diet, Treatment, and Diet × Treatment report factorial ANOVA main and interaction p values. C, standard diet vehicle control; GME100, GME200, and GME300, standard diet supplemented with Garcinia mangostana extract at 100, 200, and 300 mg/kg/day, respectively; HFD-C, high-fat-diet vehicle control; HFD-GME, high-fat diet supplemented with corresponding GME doses; 4-HNE, 4-hydroxynonenal; prot, protein; 8-OHdG, 8-hydroxy-2′-deoxyguanosine; GSH, reduced glutathione.
3.5. Histopathology, Adipose Morphometry, and Nrf2/HO-1 Signaling
Prolonged high-fat-diet feeding caused pronounced multiorgan cytoarchitectural damage and severe adipose tissue inflammation in untreated obese rats (HFD-C) relative to standard-diet controls (C) (Table 9). Renal and hepatic parenchymal evaluations revealed markedly elevated structural lesion scores in HFD-C animals, characterized by glomerular injury (2.82 ± 0.11 vs. 0.12 ± 0.04, p < 0.001), tubular vacuolation (2.75 ± 0.10 vs. 0.15 ± 0.05, p < 0.001), and diffuse hepatic steatosis (2.88 ± 0.12 vs. 0.10 ± 0.04, p < 0.001) marked by extensive macro- and microvesicular lipid filling (Table 9). In epididymal white adipose tissue, the HFD-C group exhibited severe adipocyte hypertrophy, with mean adipocyte diameter expanding by 127.4% (119.4 ± 4.4 μm vs. 52.5 ± 1.8 μm, p < 0.001), accompanied by a 15.4-fold proliferation of pro-inflammatory macrophage-associated crown-like structures (18.5 ± 1.2/mm2 vs. 1.2 ± 0.3/mm2, p < 0.001) (Table 9). Concurrently, dietary lipid excess suppressed endogenous cytoprotective machinery, as evidenced by significant depletion of nuclear Nrf2 translocation (0.52 ± 0.03-fold vs. 1.00 ± 0.05-fold, p < 0.001) and hepatic HO-1 protein abundance (0.46 ± 0.03-fold vs. 1.00 ± 0.04-fold, p < 0.001) relative to basal controls (Table 9).
Table 9.
Multiorgan histopathology, adipose morphometry, and Nrf2/HO-1 signaling.
Intervention with Garcinia mangostana extract (GME) dose-dependently mitigated histopathological lesion severity and adipose remodeling in obese cohorts (Table 9). Among animals receiving the 300 mg/kg GME regimen (HFD-GME300), glomerular injury, tubular vacuolation, and steatosis scores decreased by 75.2% (0.70 ± 0.05), 76.4% (0.65 ± 0.04), and 75.0% (0.72 ± 0.05), respectively, compared with HFD-C rats, restoring parenchymal integrity toward physiological ranges (Table 9). Furthermore, HFD-GME300 effectively reversed adipose hypertrophy and inflammatory infiltration, driving a 49.1% reduction in mean adipocyte diameter (60.8 ± 2.0 μm) and an 81.6% clearance of crown-like structures (3.4 ± 0.4/mm2) (Table 9).
In contrast to the downregulation observed in untreated obesity, GME treatment robustly stimulated cytoprotective signaling under dietary challenge, with HFD-GME300 elevating nuclear Nrf2 to 1.98 ± 0.09-fold (a 3.81-fold induction relative to HFD-C) and hepatic HO-1 to 2.18 ± 0.10-fold (a 4.74-fold induction relative to HFD-C) of standard control values (Table 9). In standard-diet rats, GME monotherapy also exerted a dose-dependent induction of nuclear Nrf2 (+54.0% at 300 mg/kg) and HO-1 (+70.0% at 300 mg/kg), confirming intrinsic electrophilic and phase II enzyme-inducing capacity even in the absence of exogenous metabolic stress (Table 9). Factorial two-way ANOVA established significant main effects for diet and treatment, alongside highly significant diet-by-treatment interactions across all histological, morphometric, and molecular signaling endpoints (p < 0.001 for all parameters in Table 9). This parallel restoration of redox equilibrium, cytoprotective protein abundance, and tissue architecture indicates that GME supplementation was accompanied by the upregulation of hepatic Nrf2/HO-1 signaling; however, in the absence of functional knockdown or pathway inhibition, these findings reflect a strong association rather than definitive causal mediation (Table 9).
Values are expressed as mean ± SEM (n = 8 rats per group). Within each outcome column, means bearing different superscript letters (a–d) denote statistically significant differences among cohorts as determined by two-way factorial ANOVA followed by Tukey’s post hoc honestly significant difference (HSD) test (p < 0.05). Histopathological injury scores were semiquantitatively graded on 0–3 severity scales (0 = absent/normal, 1 = mild, 2 = moderate, 3 = severe). Morphometric measurements of epididymal adipose tissue were quantified from 10 non-overlapping 200× fields per animal. Protein expression of nuclear Nrf2 and total hepatic HO-1 was quantified by immunoblotting, normalized against Histone H3 and β-actin loading controls, respectively, and expressed as fold-change relative to the basal control group (C = 1.00). Rows labeled Diet, Treatment, and Diet × Treatment report factorial ANOVA main and interaction p values. C, standard diet vehicle control; GME100, GME200, and GME300, standard diet supplemented with Garcinia mangostana extract at 100, 200, and 300 mg/kg/day, respectively; HFD-C, high-fat-diet vehicle control; HFD-GME, high-fat diet supplemented with corresponding GME doses; Nrf2, nuclear factor erythroid 2-related factor 2; HO-1, heme oxygenase-1.
Light microscopic examination of hepatic tissue from control cohorts (C and GME alone) revealed intact hepatic parenchyma with preserved lobular architecture and radiating hepatocyte cords (Figure 3, left panels). Conversely, HFD feeding precipitated extensive panacinar macro- and microvesicular steatosis accompanied by marked hepatocellular ballooning degeneration and cytoplasmic rarefaction (Figure 3, arrows). Supplementation with GME dose-dependently ameliorated these hepatic structural abnormalities; the 300 mg/kg dose restored hepatic cord organization and substantially suppressed intracellular lipid droplet accumulation (Figure 3).
Renal parenchyma in normocaloric control groups exhibited preserved cortical and medullary architecture, with intact glomerular tufts and patent tubular lumina (Figure 3, middle panels). In the untreated obese group (HFD-C), marked hydropic swelling and widespread vacuolar degeneration of the tubular epithelium were observed, alongside mesangial matrix expansion and Bowman’s space narrowing (Figure 3, arrows). GME co-administration mitigated these nephropathic changes in a dose-dependent manner, preserving tubular integrity and glomerular architecture (Figure 3).
In epididymal white adipose tissue, standard-diet rats displayed uniform, small adipocyte morphology (Figure 3, right panels). Chronic HFD consumption induced marked adipocyte hypertrophy and frequent inflammatory infiltration characterized by macrophage-associated crown-like structures surrounding degenerating adipocytes (Figure 3, arrows). GME treatment, particularly at 200 and 300 mg/kg, dose-dependently reduced adipocyte diameter and suppressed macrophage cluster formation toward standard control architecture (Figure 3).
4. Discussion
The present factorial study provides an integrated assessment of GME across metabolic, endocrine, oxidative, and structural domains. The principal finding was not an isolated change in body weight but a coordinated, diet-dependent response: GME attenuated HFD-associated weight gain and insulin resistance, improved dyslipidemia and hepatorenal indices, reorganized appetite- and metabolism-related peptide profiles, reinforced systemic and tissue antioxidant defenses, and reduced histological injury. Most endpoints showed significant diet-by-treatment interactions, whereas changes under the control diet were smaller. This pattern is biologically relevant because it suggests that the magnitude of the response was greatest in the setting of metabolic stress. Nevertheless, the data demonstrate association under the experimental conditions and do not alone establish one molecular target as the causal mediator.
Positive energy balance and adipocyte expansion are early drivers of HFD-induced metabolic disease. Enlarged adipocytes exhibit impaired lipid buffering, increased lipolysis, altered adipokine secretion, and recruitment of macrophages that form crown-like structures around damaged adipocytes [3,4,5,6]. In our experiment, HFD increased final weight, energy intake, FER, adipocyte diameter, and crown-like structures, whereas GME reduced all five outcomes, with the strongest numerical response at 300 mg/kg. These results agree with Kim et al., who reported that alpha-mangostin reduced body and adipose-tissue weight, adipocyte size, hepatic lipid deposition, and macrophage infiltration in HFD-fed mice [31]. They also parallel the rat study of Muhamad Adyab et al., in which mangosteen flesh at 200–600 mg/kg lowered body weight and attenuated hepatic and renal abnormalities [33]. In contrast, not all mangosteen trials or preparations produce robust weight loss, and some clinical studies primarily report changes in insulin sensitivity or inflammation [35,36]. Differences in xanthone exposure, food matrix, treatment timing, species, baseline adiposity, and energy-intake measurement can explain the discrepancy. Because our HFD-GME groups also consumed less energy, direct effects on adipogenesis or oxidation cannot be separated from intake-mediated effects without pair-fed controls and indirect calorimetry.
Insulin resistance emerges when lipid oversupply, inflammatory signaling, and oxidative stress converge on insulin receptor substrates and downstream AKT signaling [2,4,5]. The HFD-induced increases in glucose, insulin, and HOMA-IR in this study were accompanied by dyslipidemia and hepatic injury, whereas GME produced graded improvement. The magnitude was largest at 300 mg/kg, which reduced HOMA-IR by approximately 70% relative to HFD-C. This is consistent with alpha-mangostin-mediated improvement of IRS-1/AKT signaling and suppression of lipogenic programs in HFD-fed mice [31], as well as a randomized pilot trial reporting an insulin-sensitizing signal in obese women receiving mangosteen extract [35]. However, a calculated HOMA-IR value in rodents is a surrogate rather than a direct measure of insulin action, and species-specific constants are not universally standardized. Studies using glucose or insulin tolerance testing, hyperinsulinemic-euglycemic clamps, or tissue phosphoproteomics may yield effects of different magnitude. Thus, the present glycemic findings should be interpreted as internally consistent biochemical evidence, not definitive proof of restored whole-body insulin sensitivity.
Obesity-associated dyslipidemia reflects increased fatty-acid delivery, hepatic triglyceride synthesis, altered lipoprotein production, and impaired clearance [5,39]. Our HFD group showed higher triglycerides, cholesterol, and LDL-C and lower HDL-C, while GME shifted each toward the control profile. This agrees with experimental observations that alpha-mangostin suppresses fatty-acid synthase and adipocyte differentiation [30], reduces hepatic triglyceride accumulation [31,32], and improves circulating lipids in obese rats [33,34]. By contrast, some investigations have found stronger effects on triglycerides than on total cholesterol or HDL-C. Such divergence is expected when studies differ in diet lipid source, fasting duration, treatment incorporated into feed versus gavage, use of purified alpha-mangostin versus complex extract, and analytical calculation of LDL-C. The present improvement across multiple lipid fractions is persuasive as a pattern, but lipoprotein particle number, hepatic lipid content, fecal fat excretion, and expression of SREBP-1c, FASN, ACC, CPT1, and PPAR pathways would be required to distinguish decreased absorption, reduced synthesis, and enhanced oxidation.
The liver and kidney are major targets of obesity-related oxidative and hemodynamic stress. Steatosis can progress through lipotoxicity, mitochondrial dysfunction, inflammation, and fibrosis, whereas obesity-related kidney injury involves hyperfiltration, glomerular enlargement, tubular stress, and ectopic lipid exposure [6,40,41,42]. In the current study, GME lowered ALT, AST, creatinine, and BUN alongside marked reductions in hepatic steatosis, glomerular injury, and tubular vacuolation. Comparable structural protection has been described after mangosteen flesh supplementation in HFD-fed rats [33], and alpha-mangostin has shown renoprotection in a cisplatin model through attenuation of oxidative/nitrosative stress [43]. A potentially different result was reported by Kim et al., who observed an ALT reduction but no significant AST difference between HFD and alpha-mangostin-treated mice [31]. AST is less liver-specific than ALT and is influenced by muscle, cardiac tissue, hemolysis, dose, and sampling time; these factors, together with our higher extract doses and complex phytochemical matrix, may explain the broader enzyme response. Creatinine and BUN are also insensitive early renal markers, so future work should include measured filtration, urinary albumin, kidney injury molecule-1, and neutrophil gelatinase-associated lipocalin.
Oxidative stress is generated when oxidant production exceeds antioxidant buffering and repair. The combined assessment of TAS, TOS, OSI, MDA, SOD, CAT, GPx, 4-HNE, 8-OHdG, and GSH is a strength because it captures overall balance, enzyme activity, lipid peroxidation, DNA oxidation, and tissue thiol status rather than relying on a single marker [10,11,12,13]. Our HFD-C group displayed deterioration across this entire network, while GME produced concordant recovery. These findings support earlier demonstrations of antioxidant xanthones in mangosteen pericarp [29] and protection by mangosteen or alpha-mangostin in HFD, cardiac injury, and renal injury models [32,33,34,43,44]. Conversely, antioxidant responses in botanical studies are sometimes modest or assay dependent. TAS and TOS integrate many circulating constituents and can be influenced by urate, bilirubin, diet, and sample storage; MDA assays can lack specificity if thiobarbituric-acid methods are used. Differences in extraction, xanthone bioavailability, redox assay chemistry, and timing relative to the last dose can therefore explain variable findings. Verification with targeted LC-MS lipidomics, protein carbonyls, F2-isoprostanes, and oxidized/reduced glutathione ratios would strengthen mechanistic interpretation.
Nrf2 is held under basal conditions by KEAP1 and, during electrophilic or oxidative challenge, translocates to the nucleus to promote antioxidant and cytoprotective genes, including HO-1 [14,15,16]. In this study, HFD suppressed nuclear Nrf2 and hepatic HO-1, whereas GME increased both in parallel with improved antioxidant enzyme activities and reduced oxidative products. This alignment is compatible with Nrf2/HO-1 engagement and with experimental evidence that alpha-mangostin can activate antioxidant signaling in stressed cells and tissues [45]. However, Nrf2 biology in obesity is not uniformly beneficial: activation may be tissue-, time-, and dose-dependent, and increased abundance does not necessarily prove transcriptional activity. Our design did not use an Nrf2 inhibitor, knockout model, KEAP1 measurement, or downstream transcript panel. Therefore, claims of pathway-dependent protection have been strictly avoided. The appropriate conclusion is that GME-associated metabolic and redox benefits were accompanied by the modulation of Nrf2/HO-1 signaling, an association that requires targeted genetic silencing or pharmacological inhibition studies to establish direct mechanistic causality.
Adipokines and metabolic peptides reflect compensatory as well as pathogenic responses. Adiponectin generally falls with visceral adiposity and supports insulin sensitivity, whereas asprosin can increase hepatic glucose output and appetite [17,18]. Spexin is commonly reduced in obesity and has been linked to lipid handling and insulin action [19,20]. Our HFD pattern of low adiponectin and spexin with high asprosin was therefore directionally coherent with metabolic impairment, and GME shifted these markers toward control values. This agrees with the higher adiponectin reported in alpha-mangostin-treated HFD mice [31] and with human/experimental associations linking low spexin and high asprosin to obesity or insulin resistance [17,18,19,20]. Yet asprosin studies are not completely consistent; lower concentrations have also been reported in some pediatric obesity cohorts [46]. Such disagreement may arise from age, pubertal stage, fasting duration, diabetes medication, renal clearance, biological matrix, epitope specificity, and ELISA performance. Accordingly, these peptides should be treated as exploratory mechanistic correlates until assays are validated against orthogonal methods.
The circulating profiles of BDNF, irisin, GLP-1, and nesfatin-1 highlight complex, non-linear endocrine adaptations that preclude characterizing the highest dose (300 mg/kg) as uniformly optimal across all biological domains. In HFD-fed rats, circulating BDNF exhibited a biphasic trajectory, peaking at 200 mg/kg (+84.8% vs. HFD-C) before displaying an attenuated increment at 300 mg/kg (+62.1%). While speculative hypotheses such as a hormetic inverted U-shaped response, counter-regulatory negative feedback, or tropomyosin receptor kinase B (TrkB) receptor downregulation could be considered, neither mechanism is directly established by the present circulating measurements. Concurrently, untreated obese rats displayed elevated circulating levels of GLP-1, nesfatin-1, and irisin, which progressively decreased following GME administration. Although elevated baseline peptide levels in obesity have traditionally been attributed to central or peripheral hormone resistance, circulating immunoassays alone cannot distinguish between genuine hormone resistance and compensatory hypersecretion. Alternative physiological mechanisms—including extract-mediated reductions in food consumption, modulated nutrient transit kinetics, altered enteroendocrine/adipose secretion rates, or shifts in renal and hepatic peptide clearance—must be considered. Therefore, these findings represent coordinated endocrine realignment rather than definitive proof of receptor resensitization.
For preliminary translational context, allometric conversion based on body surface area (using the standard Reagan-Shaw scaling factor of 0.162) yields theoretical human-equivalent doses (HEDs) of 16.2, 32.4, and 48.6 mg/kg for rat doses of 100, 200, and 300 mg/kg, respectively, corresponding to approximately 1.13, 2.27, and 3.40 g/day for a 70 kg human [47,48]. Critically, these calculations represent mathematical conversions based strictly on body surface area assumptions; they do not constitute evidence of clinical efficacy, systemic tolerability, or recommended human therapeutic dosages. In the absence of rodent and clinical pharmacokinetic data evaluating systemic xanthone exposure, peak plasma concentrations (Cmax), clearance, and extensive phase II glucuronidation/sulfation, direct translational extrapolation remains constrained. Consequently, rigorous phase I human pharmacokinetic, bioavailability, and safety trials are mandatory before evaluating clinical utility.
This study has several strengths: a balanced factorial design, three GME doses, control-diet treatment groups, and concurrent assessment of metabolic, endocrine, redox, and tissue outcomes. Limitations must be explicit. Individual-level raw data and original statistical outputs were not available during manuscript reconstruction, preventing independent verification of distributional assumptions, exact p values, and effect sizes. The reported dispersion measure requires confirmation as SD or SEM. Feed intake may be pseudoreplicated if measured by cage but analyzed by animal. Extract identity and HPLC values, assay kits, ethics information, randomization/blinding, histological reproducibility, and primary outcome must be confirmed from original records. Critically, daily energy intake in the HFD-GME300 group was reduced by 15.2% relative to untreated obese controls (75.1 vs. 88.6 kcal/day). In the absence of an isocaloric pair-fed control group, the direct pharmacological and biochemical actions of GME cannot be decoupled from the metabolic improvements secondary to reduced caloric intake. Furthermore, the lack of indirect calorimetry precludes assessment of potential alterations in energy expenditure, basal metabolic rate, and substrate oxidation. Third, HOMA-IR serves as a static fasting surrogate index rather than a direct measure of dynamic insulin sensitivity, as dynamic tolerance tests or clamps were not performed. Fourth, while serum creatinine and BUN were significantly reduced, these conventional markers cannot exclude mild or subclinical tubular injury in the absence of urinary albumin-to-creatinine ratio or sensitive early nephromarkers (such as KIM-1 and NGAL). Finally, circulating lipid peroxidation was evaluated by the spectrophotometric TBARS assay, which has analytical cross-reactivity limitations at 532 nm compared to chromatographic methods, although tissue lipoperoxidation was independently supported by hepatic 4-HNE quantification. Additionally, the multiple-outcome burden raises false-positive risk, and without functional knockdown experiments, the design cannot establish causal Nrf2 dependency.
5. Conclusions
These experimental findings clearly demonstrate that Garcinia mangostana pericarp extract (GME) supplementation dose-dependently attenuates high-fat-diet-induced systemic metabolic dysfunction. Among the evaluated dosage regimens, the 300 mg/kg dose demonstrated superior efficacy for glycemic control (HOMA-IR), atherogenic dyslipidemia, and parenchymal steatosis, whereas the 200 mg/kg regimen was uniquely characterized by maximizing neurotrophic BDNF induction and restoring metabolic regulatory peptides. Consequently, no single dose can be considered universally optimal across all physiological systems. In contrast, the 200 mg/kg regimen exhibited a distinctive pharmacodynamic profile characterized by the optimization of neurotrophic support (BDNF) and the restoration of the suppressed circulating adipokine pool toward physiological concentrations. Importantly, these phenotypic benefits coincided with a significant reduction in caloric intake at the highest dose, indicating that appetite suppression and metabolic modulation collectively contribute to GME-mediated therapeutic outcomes.
Ultimately, this study establishes GME as a promising functional nutraceutical for counteracting the pathogenesis of diet-induced metabolic abnormalities, presenting it as an evidence-based complementary adjunct to medical nutrition therapy protocols for clinical dietitians managing obesity and associated metabolic syndrome. Nevertheless, to enable dietitians and multidisciplinary clinical teams to translate and safely integrate this nutraceutical into therapeutic dietary algorithms, prospective randomized, placebo-controlled clinical trials remain imperative to define human pharmacokinetics, bioavailability, systemic safety profiles, and optimal clinical dosing regimens.
Author Contributions
Conceptualization, S.Ç.T. and B.B.; methodology, S.Ç.T. and B.B.; validation, S.Ç.T. and B.B.; formal analysis, B.B. and S.Ç.T.; investigation, S.Ç.T. and B.B.; resources, S.Ç.T. and B.B.; data curation, S.Ç.T. and B.B.; writing—original draft preparation, S.Ç.T. and B.B.; writing—review and editing, B.B. and S.Ç.T.; visualization, B.B. and S.Ç.T.; supervision, B.B.; project administration, S.Ç.T. All authors have read and agreed to the published version of the manuscript.
Funding
This research received no external funding.
Institutional Review Board Statement
The animal study protocol was approved by the Local Ethics Committee for Animal Experiments of the Veterinary Control Central Research Institute (approval date: 1 November 2024; decision/protocol no.: 2024/86). All procedures were conducted in accordance with the relevant national and institutional guidelines for the care and use of laboratory animals.
Informed Consent Statement
Not applicable.
Data Availability Statement
The data supporting the findings of this study are available from the corresponding author upon reasonable request.
Acknowledgments
The authors thank the staff of the animal experimental laboratory for their technical assistance. During the preparation of this manuscript, generative artificial intelligence was used for language editing and formatting support. The authors reviewed and edited the output and take full responsibility for the content of this publication.
Conflicts of Interest
The authors declare no conflicts of interest.
Abbreviations
ALT, alanine aminotransferase; AST, aspartate aminotransferase; BDNF, brain-derived neurotrophic factor; BUN, blood urea nitrogen; CAT, catalase; FER, feed efficiency ratio; GME, Garcinia mangostana pericarp extract; GLP-1, glucagon-like peptide-1; GPx, glutathione peroxidase; GSH, reduced glutathione; HED, human-equivalent dose; HFD, high-fat diet; HOMA-IR, homeostatic model assessment of insulin resistance; 4-HNE, 4-hydroxynonenal; HO-1, heme oxygenase-1; MDA, malondialdehyde; Nrf2, nuclear factor erythroid 2-related factor 2; 8-OHdG, 8-hydroxy-2′-deoxyguanosine; OSI, oxidative stress index; SOD, superoxide dismutase; TAS, total antioxidant status; TOS, total oxidant status.
References
- World Health Organization. Obesity and Overweight. Available online: https://www.who.int/news-room/fact-sheets/detail/obesity-and-overweight (accessed on 4 September 2026).
- Saltiel, A.R.; Olefsky, J.M. Inflammatory mechanisms linking obesity and metabolic disease. J. Clin. Investig. 2017, 127, 1–4. [Google Scholar] [CrossRef] [Scilit] [PubMed]
- Hotamisligil, G.S. Inflammation and metabolic disorders. Nature 2006, 444, 860–867. [Google Scholar] [CrossRef] [Scilit] [PubMed]
- Xu, H.; Barnes, G.T.; Yang, Q.; Tan, G.; Yang, D.; Chou, C.J.; Sole, J.; Nichols, A.; Ross, J.S.; Tartaglia, L.A.; et al. Chronic inflammation in fat plays a crucial role in the development of obesity-related insulin resistance. J. Clin. Investig. 2003, 112, 1821–1830. [Google Scholar] [CrossRef] [Scilit] [PubMed]
- Shoelson, S.E.; Lee, J.; Goldfine, A.B. Inflammation and insulin resistance. J. Clin. Investig. 2006, 116, 1793–1801. [Google Scholar] [CrossRef] [Scilit] [PubMed]
- Birkenfeld, A.L.; Shulman, G.I. Nonalcoholic fatty liver disease, hepatic insulin resistance, and type 2 diabetes. Hepatology 2014, 59, 713–723. [Google Scholar] [CrossRef] [Scilit] [PubMed]
- Lutz, T.A.; Woods, S.C. Overview of animal models of obesity. Curr. Protoc. Pharmacol. 2012, 58, 5–61. [Google Scholar] [CrossRef] [Scilit] [PubMed]
- Nilsson, C.; Raun, K.; Yan, F.F.; Larsen, M.O.; Tang-Christensen, M. Laboratory animals as surrogate models of human obesity. Acta Pharmacol. Sin. 2012, 33, 173–181. [Google Scholar] [CrossRef] [Scilit] [PubMed]
- Lackey, D.E.; Lazaro, R.G.; Li, P.; Johnson, A.; Hernandez-Carretero, A.; Weber, N.; Osborn, O. The role of dietary fat in obesity-induced insulin resistance. Am. J. Physiol. Endocrinol. Metab. 2016, 311, E989–E997. [Google Scholar] [CrossRef] [Scilit] [PubMed]
- Furukawa, S.; Fujita, T.; Shimabukuro, M.; Iwaki, M.; Yamada, Y.; Nakajima, Y.; Nakayama, O.; Makishima, M.; Matsuda, M.; Shimomura, I. Increased oxidative stress in obesity and its impact on metabolic syndrome. J. Clin. Investig. 2004, 114, 1752–1761. [Google Scholar] [CrossRef] [PubMed]
- Birben, E.; Sahiner, U.M.; Sackesen, C.; Erzurum, S.; Kalayci, O. Oxidative stress and antioxidant defense. World Allergy Organ. J. 2012, 5, 9–19. [Google Scholar] [CrossRef] [Scilit] [PubMed]
- Ayala, A.; Muñoz, M.F.; Argüelles, S. Lipid peroxidation: Production, metabolism, and signaling mechanisms of malondialdehyde and 4-hydroxy-2-nonenal. Oxid. Med. Cell. Longev. 2014, 2014, 360438. [Google Scholar] [CrossRef] [Scilit] [PubMed]
- Valavanidis, A.; Vlachogianni, T.; Fiotakis, C. 8-Hydroxy-2′-deoxyguanosine: A critical biomarker of oxidative stress and carcinogenesis. J. Environ. Sci. Health C 2009, 27, 120–139. [Google Scholar] [CrossRef] [Scilit] [PubMed]
- Ma, Q. Role of Nrf2 in oxidative stress and toxicity. Annu. Rev. Pharmacol. Toxicol. 2013, 53, 401–426. [Google Scholar] [CrossRef] [Scilit] [PubMed]
- Uruno, A.; Yagishita, Y.; Yamamoto, M. The Keap1-Nrf2 system and diabetes mellitus. Arch. Biochem. Biophys. 2015, 566, 76–84. [Google Scholar] [CrossRef] [Scilit] [PubMed]
- Li, S.; Eguchi, N.; Lau, H.; Ichii, H. The role of the Nrf2 signaling in obesity and insulin resistance. Int. J. Mol. Sci. 2020, 21, 6973. [Google Scholar] [CrossRef] [Scilit] [PubMed]
- Romere, C.; Duerrschmid, C.; Bournat, J.; Constable, P.; Jain, M.; Xia, F.; Saha, P.K.; Del Solar, M.; Zhu, B.; York, B.; et al. Asprosin, a fasting-induced glucogenic protein hormone. Cell 2016, 165, 566–579. [Google Scholar] [CrossRef] [Scilit] [PubMed]
- Mazur-Bialy, A.I. Asprosin—A fasting-induced, glucogenic, and orexigenic adipokine as a new promising player. Nutrients 2021, 13, 620. [Google Scholar] [CrossRef] [Scilit] [PubMed]
- Walewski, J.L.; Ge, F.; Lobdell, H., IV; Levin, N.; Schwartz, G.J.; Vasselli, J.R.; Pomp, A.; Dakin, G.; Berk, P.D. Spexin is a novel human peptide that reduces adipocyte uptake of long chain fatty acids and causes weight loss in rodents with diet-induced obesity. Obesity 2014, 22, 1643–1652. [Google Scholar] [CrossRef] [Scilit] [PubMed]
- Behrooz, M.; Vaghef-Mehrabany, E.; Ostadrahimi, A. Different spexin level in obese vs normal weight children and its relationship with obesity related risk factors. Nutr. Metab. Cardiovasc. Dis. 2020, 30, 674–682. [Google Scholar] [CrossRef] [Scilit] [PubMed]
- Boström, P.; Wu, J.; Jedrychowski, M.P.; Korde, A.; Ye, L.; Lo, J.C.; Rasbach, K.A.; Boström, E.A.; Choi, J.H.; Long, J.Z.; et al. A PGC1-alpha-dependent myokine that drives brown-fat-like development of white fat and thermogenesis. Nature 2012, 481, 463–468. [Google Scholar] [CrossRef] [Scilit] [PubMed]
- Maak, S.; Norheim, F.; Drevon, C.A.; Erickson, H.P. Progress and challenges in the biology of FNDC5 and irisin. Endocr. Rev. 2021, 42, 436–456. [Google Scholar] [CrossRef] [Scilit] [PubMed]
- Oh-I, S.; Shimizu, H.; Satoh, T.; Okada, S.; Adachi, S.; Inoue, K.; Eguchi, H.; Yamamoto, M.; Imaki, T.; Hashimoto, K.; et al. Identification of nesfatin-1 as a satiety molecule in the hypothalamus. Nature 2006, 443, 709–712. [Google Scholar] [CrossRef] [Scilit] [PubMed]
- Dailey, M.J.; Moran, T.H. Glucagon-like peptide 1 and appetite. Trends Endocrinol. Metab. 2013, 24, 85–91. [Google Scholar] [CrossRef] [Scilit] [PubMed]
- Rios, M. BDNF and the central control of feeding: Accidental bystander or essential player? Trends Neurosci. 2013, 36, 83–90. [Google Scholar] [CrossRef] [Scilit] [PubMed]
- Castan-Laurell, I.; Dray, C.; Knauf, C.; Kunduzova, O.; Valet, P. Apelin, a promising target for type 2 diabetes treatment? Trends Endocrinol. Metab. 2012, 23, 234–241. [Google Scholar] [CrossRef] [Scilit] [PubMed]
- Pedraza-Chaverri, J.; Cárdenas-Rodríguez, N.; Orozco-Ibarra, M.; Pérez-Rojas, J.M. Medicinal properties of mangosteen (Garcinia mangostana). Food Chem. Toxicol. 2008, 46, 3227–3239. [Google Scholar] [CrossRef] [Scilit] [PubMed]
- Obolskiy, D.; Pischel, I.; Siriwatanametanon, N.; Heinrich, M. Garcinia mangostana L.: A phytochemical and pharmacological review. Phytother. Res. 2009, 23, 1047–1065. [Google Scholar] [CrossRef] [Scilit] [PubMed]
- Jung, H.A.; Su, B.N.; Keller, W.J.; Mehta, R.G.; Kinghorn, A.D. Antioxidant xanthones from the pericarp of Garcinia mangostana. J. Agric. Food Chem. 2006, 54, 2077–2082. [Google Scholar] [CrossRef] [Scilit] [PubMed]
- Quan, X.; Wang, Y.; Ma, X.; Liang, Y.; Tian, W.; Ma, Q.; Jiang, H.; Zhao, Y. Alpha-mangostin induces apoptosis and suppresses differentiation of 3T3-L1 cells via inhibiting fatty acid synthase. PLoS ONE 2012, 7, e33376. [Google Scholar] [CrossRef] [Scilit] [PubMed]
- Kim, H.M.; Kim, Y.M.; Huh, J.H.; Lee, E.S.; Kwon, M.H.; Lee, B.R.; Ko, H.J.; Chung, C.H. Alpha-mangostin ameliorates hepatic steatosis and insulin resistance by inhibition of C-C chemokine receptor 2. PLoS ONE 2017, 12, e0179204. [Google Scholar] [CrossRef] [Scilit] [PubMed]
- Chae, H.S.; Kim, Y.M.; Bae, J.K.; Sorchhann, S.; Yim, S.; Han, L.; Paik, J.H.; Choi, Y.H.; Chin, Y.W. Mangosteen extract attenuates the metabolic disorders of high-fat-fed mice by activating AMPK. J. Med. Food 2016, 19, 148–154. [Google Scholar] [CrossRef] [Scilit] [PubMed]
- Muhamad Adyab, N.S.; Rahmat, A.; Abdul Kadir, N.A.A.; Jaafar, H.; Shukri, R.; Ramli, N.S. Mangosteen flesh supplementation attenuates biochemical and morphological changes in the liver and kidney of high fat diet-induced obese rats. BMC Complement. Altern. Med. 2019, 19, 344. [Google Scholar] [CrossRef] [Scilit] [PubMed]
- Abuzaid, A.S.; Iskandar, E.Y.; Kurniati, N.F.; Adnyana, I.K. Preventive effect on obesity of mangosteen pericarp ethanolic extract by reduction of fatty acid synthase level in monosodium glutamate and high-calorie diet-induced male Wistar rats. Asian J. Pharm. Clin. Res. 2016, 9, 257–260. [Google Scholar]
- Watanabe, M.; Gangitano, E.; Francomano, D.; Addessi, E.; Toscano, R.; Costantini, D.; Tuccinardi, D.; Mariani, S.; Basciani, S.; Spera, G.; et al. Mangosteen extract shows a potent insulin sensitizing effect in obese female patients: A prospective randomized controlled pilot study. Nutrients 2018, 10, 586. [Google Scholar] [CrossRef] [Scilit] [PubMed]
- Xie, Z.; Sintara, M.; Chang, T.; Ou, B. Daily consumption of a mangosteen-based drink improves in vivo antioxidant and anti-inflammatory biomarkers in healthy adults: A randomized, double-blind, placebo-controlled clinical trial. Food Sci. Nutr. 2015, 3, 342–348. [Google Scholar] [CrossRef] [Scilit] [PubMed]
- Percie du Sert, N.; Hurst, V.; Ahluwalia, A.; Alam, S.; Avey, M.T.; Baker, M.; Browne, W.J.; Clark, A.; Cuthill, I.C.; Dirnagl, U. The ARRIVE guidelines 2.0: Updated guidelines for reporting animal research. PLoS Biol. 2020, 18, e3000410. [Google Scholar] [CrossRef] [Scilit] [PubMed]
- Reeves, P.G.; Nielsen, F.H.; Fahey, G.C., Jr. AIN-93 purified diets for laboratory rodents: Final report of the American Institute of Nutrition ad hoc writing committee on the reformulation of the AIN-76A rodent diet. J. Nutr. 1993, 123, 1939–1951. [Google Scholar] [CrossRef] [Scilit]
- Klop, B.; Elte, J.W.F.; Cabezas, M.C. Dyslipidemia in obesity: Mechanisms and potential targets. Nutrients 2013, 5, 1218–1240. [Google Scholar] [CrossRef] [Scilit] [PubMed]
- Tsuboi, N.; Okabayashi, Y.; Shimizu, A.; Yokoo, T. The renal pathology of obesity. Kidney Int. Rep. 2017, 2, 251–260. [Google Scholar] [CrossRef] [Scilit] [PubMed]
- Henegar, J.R.; Bigler, S.A.; Henegar, L.K.; Tyagi, S.C.; Hall, J.E. Functional and structural changes in the kidney in the early stages of obesity. J. Am. Soc. Nephrol. 2001, 12, 1211–1217. [Google Scholar] [CrossRef] [Scilit] [PubMed]
- Chagnac, A.; Weinstein, T.; Korzets, A.; Ramadan, E.; Hirsch, J.; Gafter, U. Glomerular hemodynamics in severe obesity. Am. J. Physiol. Ren. Physiol. 2000, 278, F817–F822. [Google Scholar] [CrossRef] [Scilit] [PubMed]
- Pérez-Rojas, J.M.; Cruz, C.; García-López, P.; Sánchez-González, D.J.; Martínez-Martínez, C.M.; Ceballos, G.; Espinosa, M.; Meléndez-Zajgla, J.; Pedraza-Chaverri, J. Renoprotection by alpha-mangostin is related to attenuation in renal oxidative/nitrosative stress induced by cisplatin nephrotoxicity. Free Radic. Res. 2009, 43, 1122–1132. [Google Scholar] [CrossRef] [Scilit] [PubMed]
- Sampath, P.D.; Vijayaraghavan, K. Cardioprotective effect of alpha-mangostin, a xanthone derivative from mangosteen, on tissue defense system against isoproterenol-induced myocardial infarction in rats. J. Biochem. Mol. Toxicol. 2007, 21, 336–339. [Google Scholar] [CrossRef] [Scilit] [PubMed]
- Bai, X.; Zhang, Z.; Zhang, M.; Xu, J.; Dong, K.; Du, Q.; Chen, L.; Ma, P.; Yang, J. α-Mangostin prevents diabetic cardiomyopathy by inhibiting oxidative damage and lipotoxicity through the AKT–FOXO1–CD36 pathway. Front. Pharmacol. 2025, 16, 1566311. [Google Scholar] [CrossRef] [Scilit] [PubMed]
- Corica, D.; Aversa, T.; Currò, M.; Tropeano, A.; Pepe, G.; Alibrandi, A.; Ientile, R.; Wasniewska, M. Asprosin serum levels and glucose homeostasis in children with obesity. Cytokine 2021, 142, 155477. [Google Scholar] [CrossRef] [Scilit] [PubMed]
- Reagan-Shaw, S.; Nihal, M.; Ahmad, N. Dose translation from animal to human studies revisited. FASEB J. 2008, 22, 659–661. [Google Scholar] [CrossRef] [Scilit] [PubMed]
- Nair, A.B.; Jacob, S. A simple practice guide for dose conversion between animals and human. J. Basic Clin. Pharm. 2016, 7, 27–31. [Google Scholar] [CrossRef] [Scilit] [PubMed]
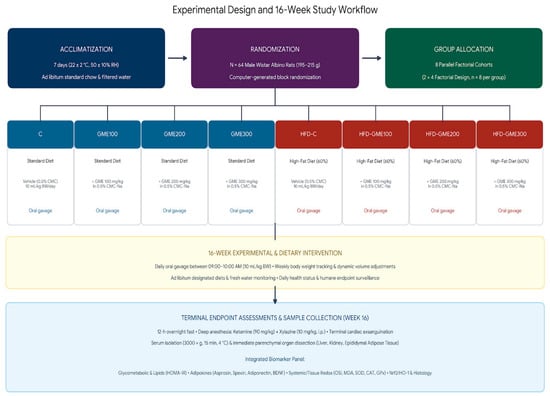
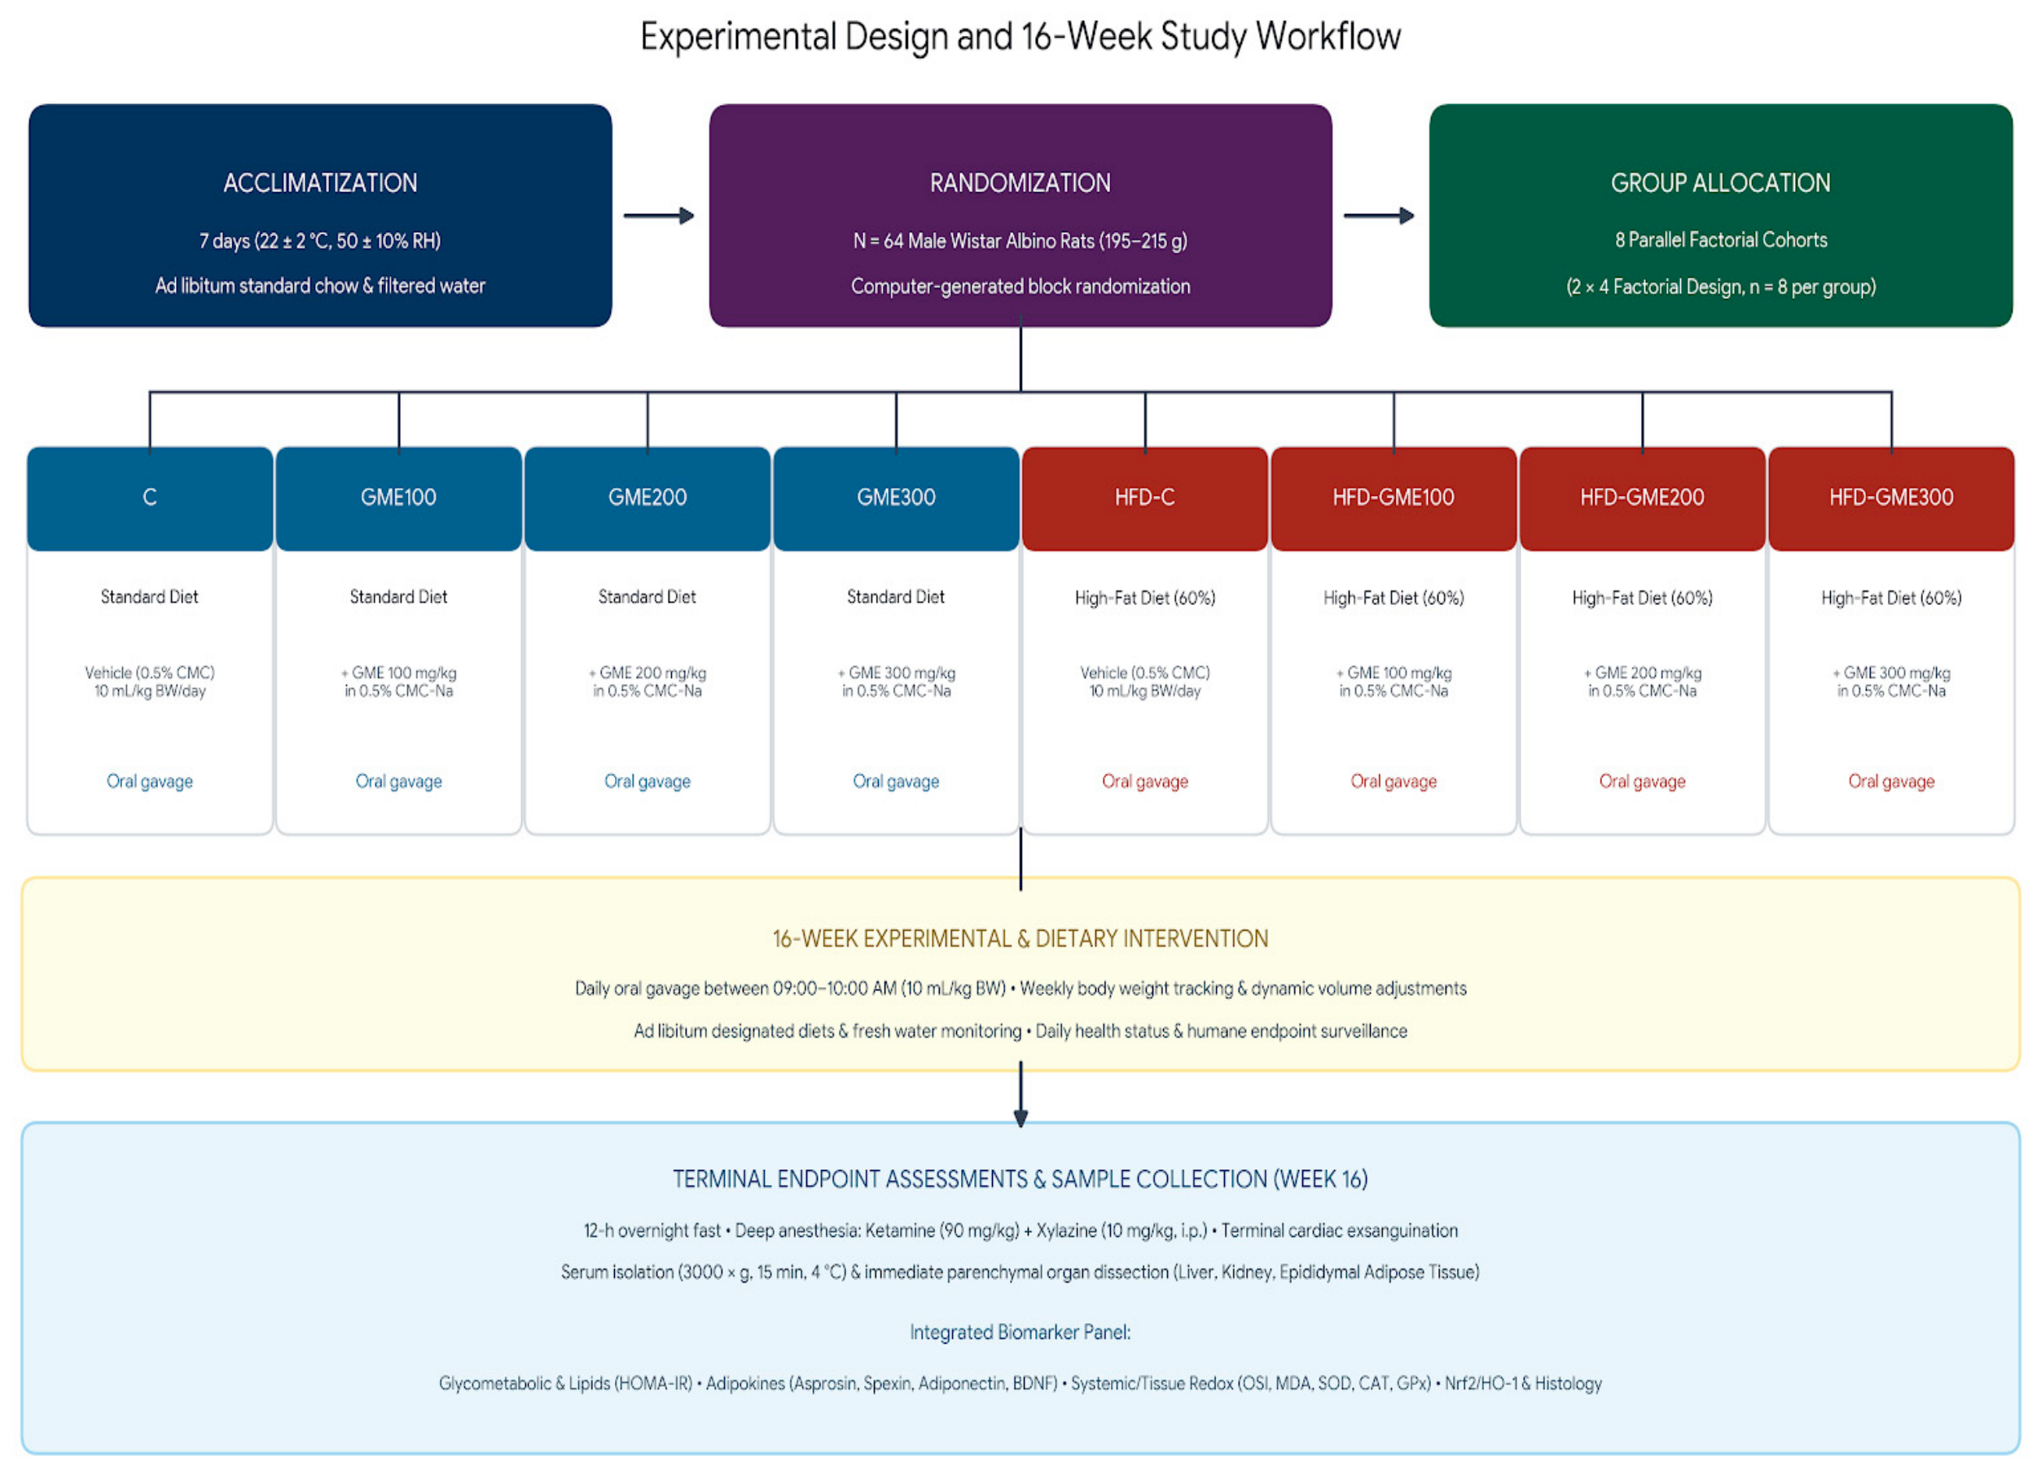
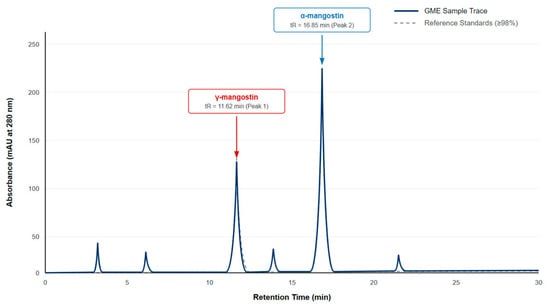
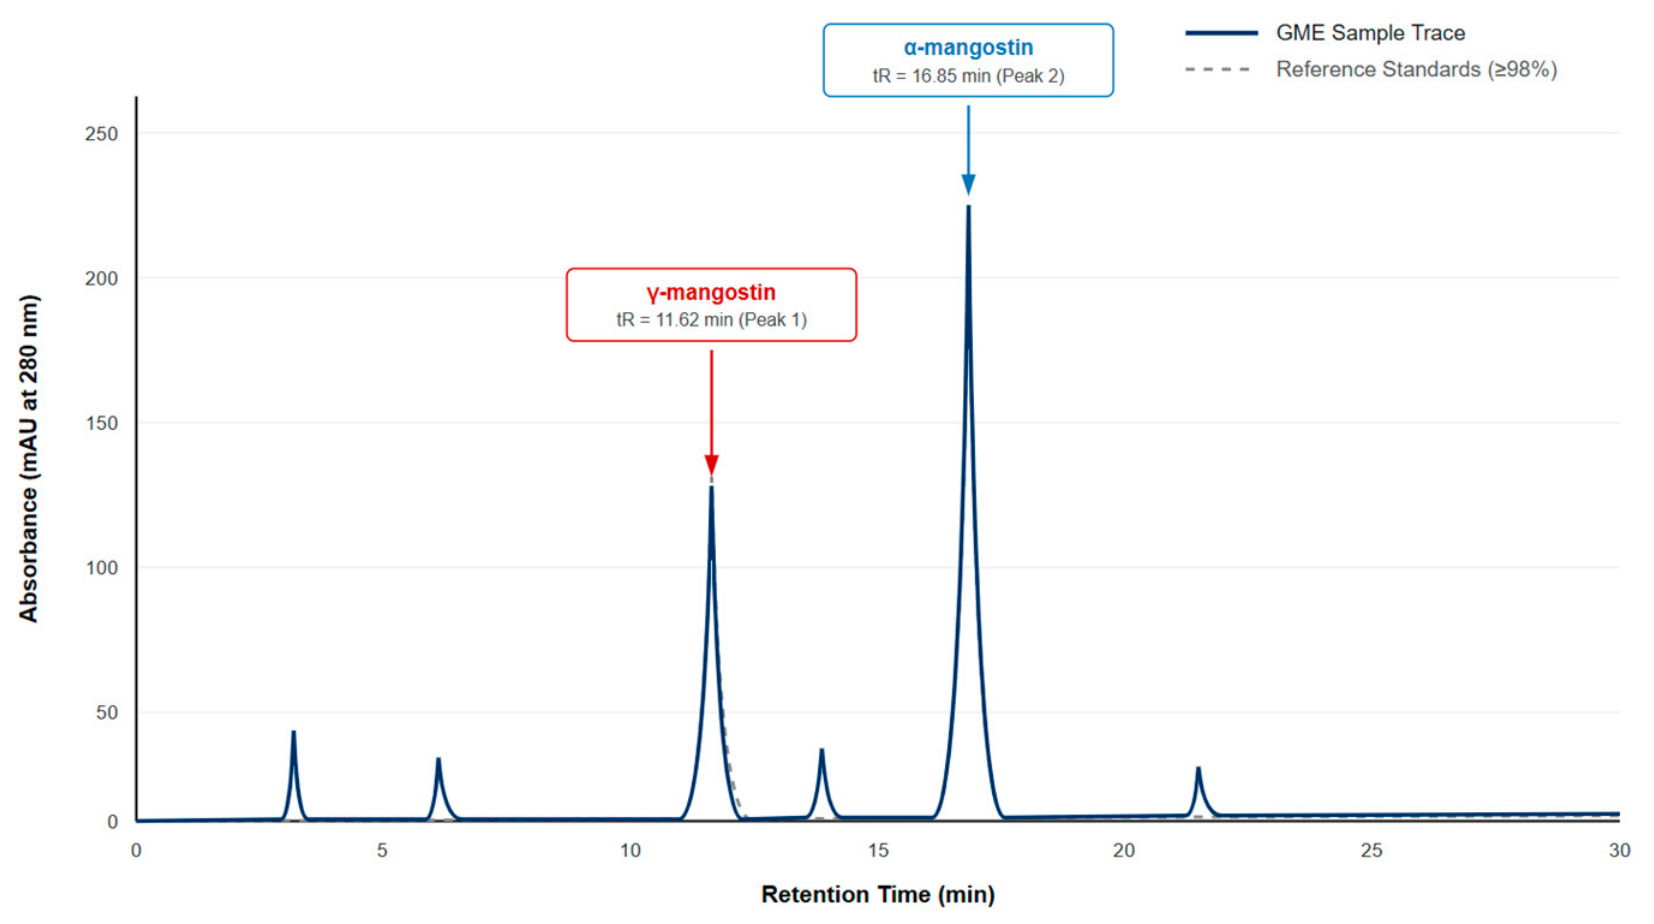
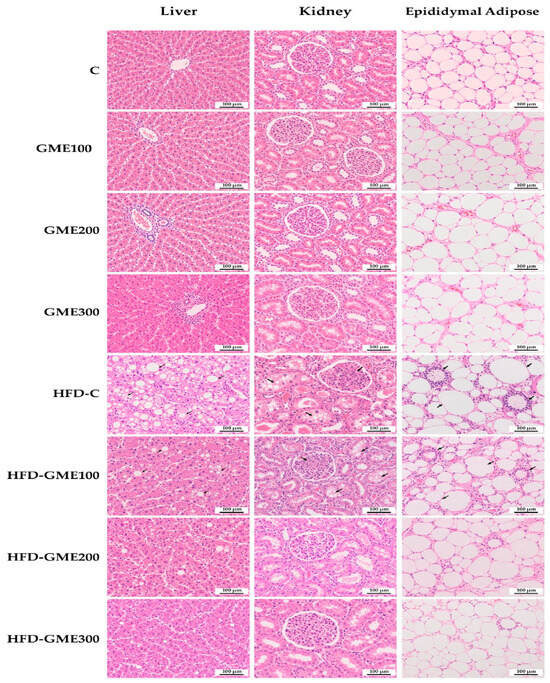
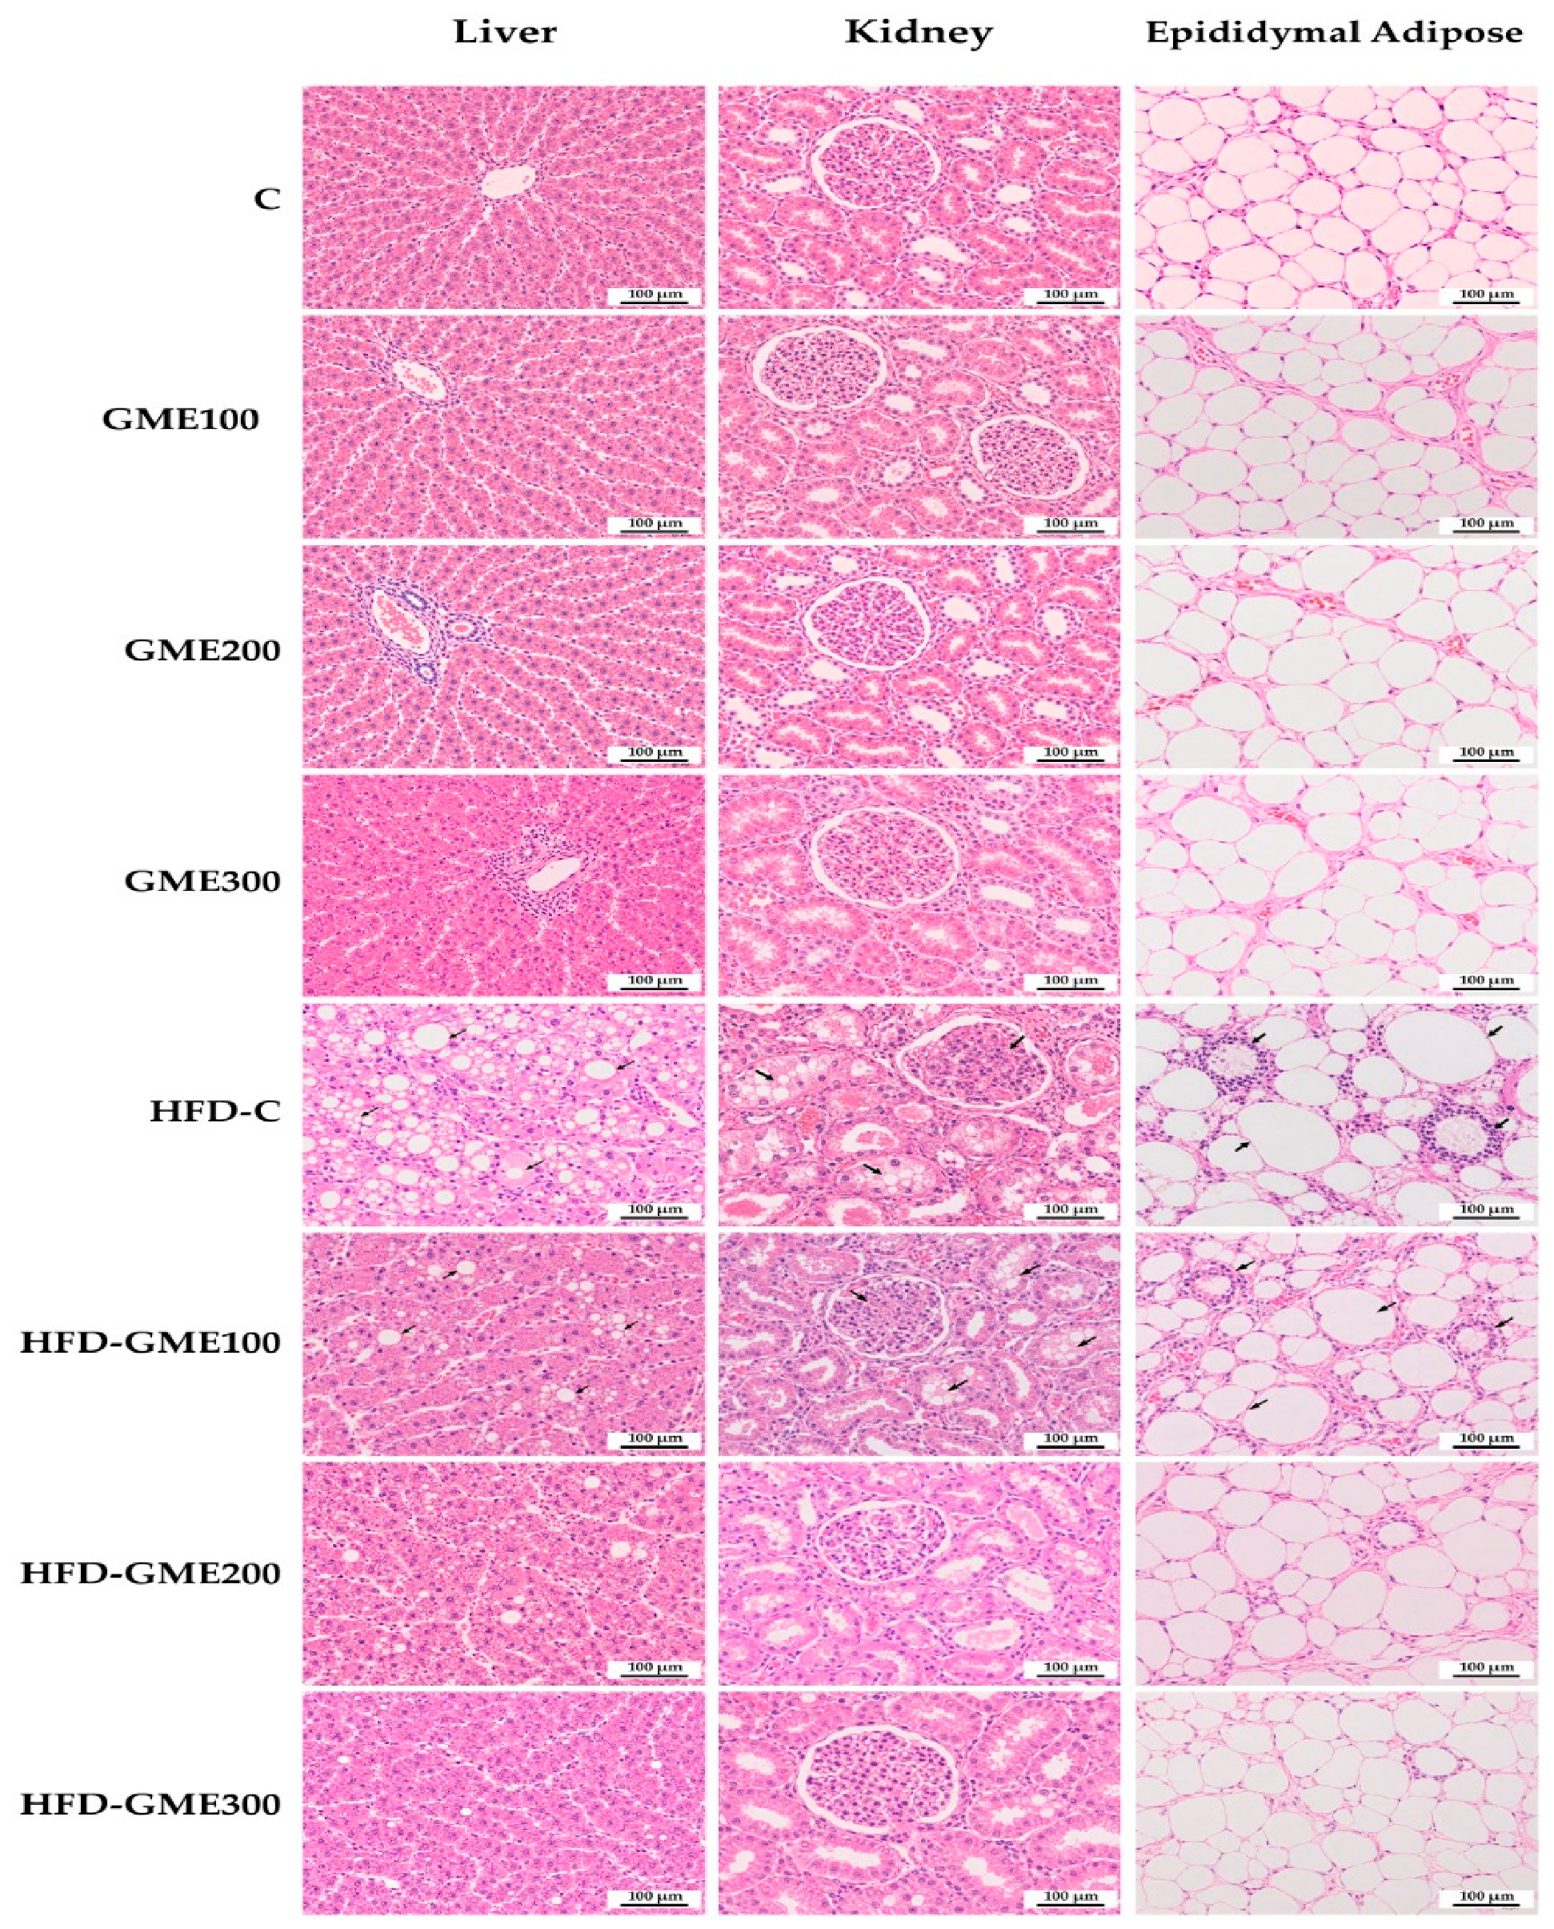

Disclaimer/Publisher’s Note: The statements, opinions and data contained in all publications are solely those of the individual author(s) and contributor(s) and not of MDPI and/or the editor(s). MDPI and/or the editor(s) disclaim responsibility for any injury to people or property resulting from any ideas, methods, instructions or products referred to in the content. |
© 2026 by the authors. Licensee MDPI, Basel, Switzerland. This article is an open access article distributed under the terms and conditions of the Creative Commons Attribution (CC BY) license.