


Highlights
What are the main findings?
- Source-level multiscale Granger causality of preictal scalp EEG identified clinically plausible candidate seizure-onset zones (SOZs).
- Beta-band net-flow mapping was concordant with clinical localization in six of seven resected participants and three of five clinically assessable prospective participants.
- Three left mesial temporal epilepsy cases showed consistent parahippocampal dominance across beta, gamma, and high-gamma bands, with variable entorhinal co-involvement.
- Top-ranked candidate SOZ regions showed net causal inflow, supporting a receiver-like role within preictal brain networks.
What are the implications of the main findings?
- Preictal network interactions from EEG source waveforms may provide complementary information for identifying candidate SOZ regions beyond conventional EEG source imaging.
- The consistent inflow-dominant pattern suggests a potentially distinctive preictal network signature associated with candidate SOZ regions.
- These findings suggest that multiscale Granger causality could complement noninvasive presurgical SOZ evaluation.
Abstract
Background/Objectives: Precise localization of seizure-onset zones (SOZs) from noninvasive electroencephalography (EEG) remains challenging in the presurgical evaluation of drug-resistant focal epilepsy. We investigated whether cortical source reconstruction combined with multiscale spectral Granger causality (GC) analysis of preictal scalp EEG could identify candidate SOZ regions. Methods: Sixteen participants underwent presurgical evaluation; two were excluded for excessive EEG artifacts, leaving 14 participants (seven resected with Engel class I outcomes and seven unresected). A clinically representative 20 s preictal EEG segment was cleaned using independent component analysis, EEG source solutions were reconstructed with sLORETA on a template head model, and the EEG source activities were then parcellated into 68 Desikan–Killiany cortical regions. Nonparametric GC using Janashia–Lagvilava spectral matrix factorization was estimated in four bands (1–12, 13–30, 30–45, and 55–95 Hz). Regional causal inflow, outflow, and net flow were calculated. Candidate SOZ regions were defined as those exceeding the 95th percentile of absolute net-flow values. Concordance was assessed against clinically determined SOZ localization and, in resected cases, postoperative surgical outcome. Results: Using beta (13–30 Hz) as the primary band, we found that candidate SOZ regions were concordant with clinical localization in 6/7 resected participants (85.7%; exact 95% CI, 42.1–99.6%) and 3/5 scorable prospective participants (60.0%; 14.7–94.7%), yielding 9/12 overall (75.0%; 42.8–94.5%). Two prospective participants lacked sufficient clinical localization for assessment. Three resected participants with left mesial temporal epilepsy showed reproducible left parahippocampal dominance across beta, gamma, and high-gamma bands, with variable entorhinal co-involvement. Top-ranked candidate SOZ regions consistently exhibited net causal inflow. Conclusions: In this small, heterogeneous cohort, source-level net-flow mapping of preictal scalp EEG identified clinically plausible candidate SOZ regions; these exploratory findings suggest a potential noninvasive adjunct to presurgical evaluation. The inflow-dominant pattern supports a receiver-like role of the SOZ. Larger prospective studies with individualized head models, multiple seizures, and intracranial EEG validation will help establish robustness and clinical utility.
1. Introduction
Drug-resistant epilepsy is commonly defined as failure of adequate trials of two tolerated, appropriately chosen, and appropriately used antiseizure medication schedules to achieve sustained seizure freedom [1]. Focal epilepsies account for a substantial proportion of these cases [2], and for people with drug-resistant focal epilepsy, resective or ablative surgery can achieve seizure freedom more often than continued medical therapy [3,4]. Once drug resistance is established, timely referral for epilepsy surgery evaluation is recommended because successful resection or ablation depends critically on accurate delineation of the epileptogenic network and the seizure-onset zone (SOZ) [5,6].
Noninvasive presurgical evaluation integrates semiology, scalp video-EEG, structural MRI, metabolic and functional imaging, and neuropsychological data [7]. Scalp EEG remains widely available and clinically central, but visual interpretation alone is limited by volume conduction, deep or mesial sources, sparse electrode coverage, and the fact that the earliest scalp-visible rhythm may reflect propagation rather than the true cortical onset. EEG source imaging (ESI) addresses part of this problem by projecting scalp potentials to cortical sources and is increasingly recognized as a practical phase-I tool for localizing epileptiform activity [8,9,10,11]. Recent studies further show that scalp EEG-derived source imaging, seizure-source reconstruction, and epileptogenic network mapping can be concordant with intracranial EEG and may predict surgical outcome [12,13,14,15,16,17,18].
Source localization, however, provides primarily spatial information. Epileptic seizures emerge from dynamic networks rather than isolated foci [8,19], and the direction of information flow among nodes may carry additional localizing value. Directed functional connectivity approaches, including Granger causality (GC) and other related directed-connectivity measures, have been used to characterize seizure initiation and propagation in intracranial EEG [20,21,22,23,24], to interrogate directed interactions from scalp EEG in focal epilepsy [25,26,27,28], and, when combined with noninvasive electromagnetic source imaging, to define an electrophysiological connectome framework [29,30]. Recent intracranial EEG work suggests that preictal SOZ dynamics are not uniformly characterized by simple outflow from a driver region; in some people, the SOZ receives increased network influence before seizure onset [22,23,24,25,26,27,28,29,30,31].
Here we revise and extend a fully noninvasive pipeline combining scalp EEG preprocessing, sLORETA source reconstruction, Desikan–Killiany cortical parcellation, and nonparametric multiscale spectral GC based on spectral density matrix factorization via the Janashia–Lagvilava algorithm (JLA) [32]. GC quantifies directed statistical dependence between time series [33,34], and its nonparametric spectral formulation estimates frequency-resolved directed influence without fitting an explicit autoregressive model [35]. In parallel, machine-learning and foundation-model approaches are increasingly being explored for epileptogenic-zone identification from intracranial recordings, reflecting broad interest in data-driven localization [36]. We asked whether preictal source-level net information flow can identify candidate SOZ regions in patients with drug-resistant focal epilepsy. We focused on four clinically relevant frequency ranges (1–12 Hz, 13–30 Hz, 30–45 Hz, 55–95 Hz). We selected the beta band (13–30 Hz) for primary reporting as a conservative intermediate-frequency range with established relevance to network interactions in focal epilepsy, including connectivity within and beyond the seizure-onset region. Frequencies of 1–12 Hz were not used for primary inference because ocular, movement, and drift artifacts and shared 1/f trends can inflate source-level activity in this range. Frequencies >30 Hz were treated as secondary because unparalyzed scalp recordings in this range are often dominated by cranial EMG and true cortical gamma is attenuated by the skull.
2. Materials and Methods
2.1. Study Design and Participants
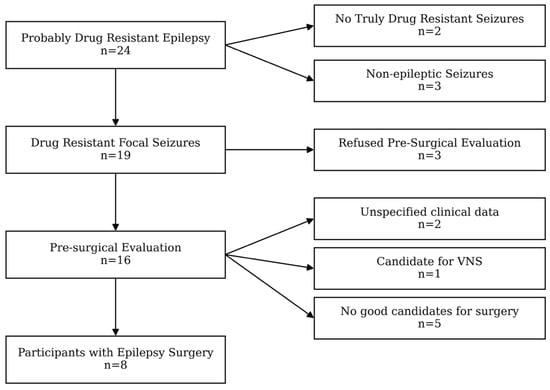
This observational study included sixteen people with drug-resistant focal epilepsy evaluated as likely candidates for epilepsy surgery at the Epilepsy Center of the Institute of Neurology and Neuropsychology (NN), Tbilisi, Georgia, during the years 2024–2025. The data of participants who had undergone epilepsy surgery and had documented postoperative outcomes were analyzed retrospectively. Recruitment of the study participants is given in a flowchart (Figure 1).
Figure 1.
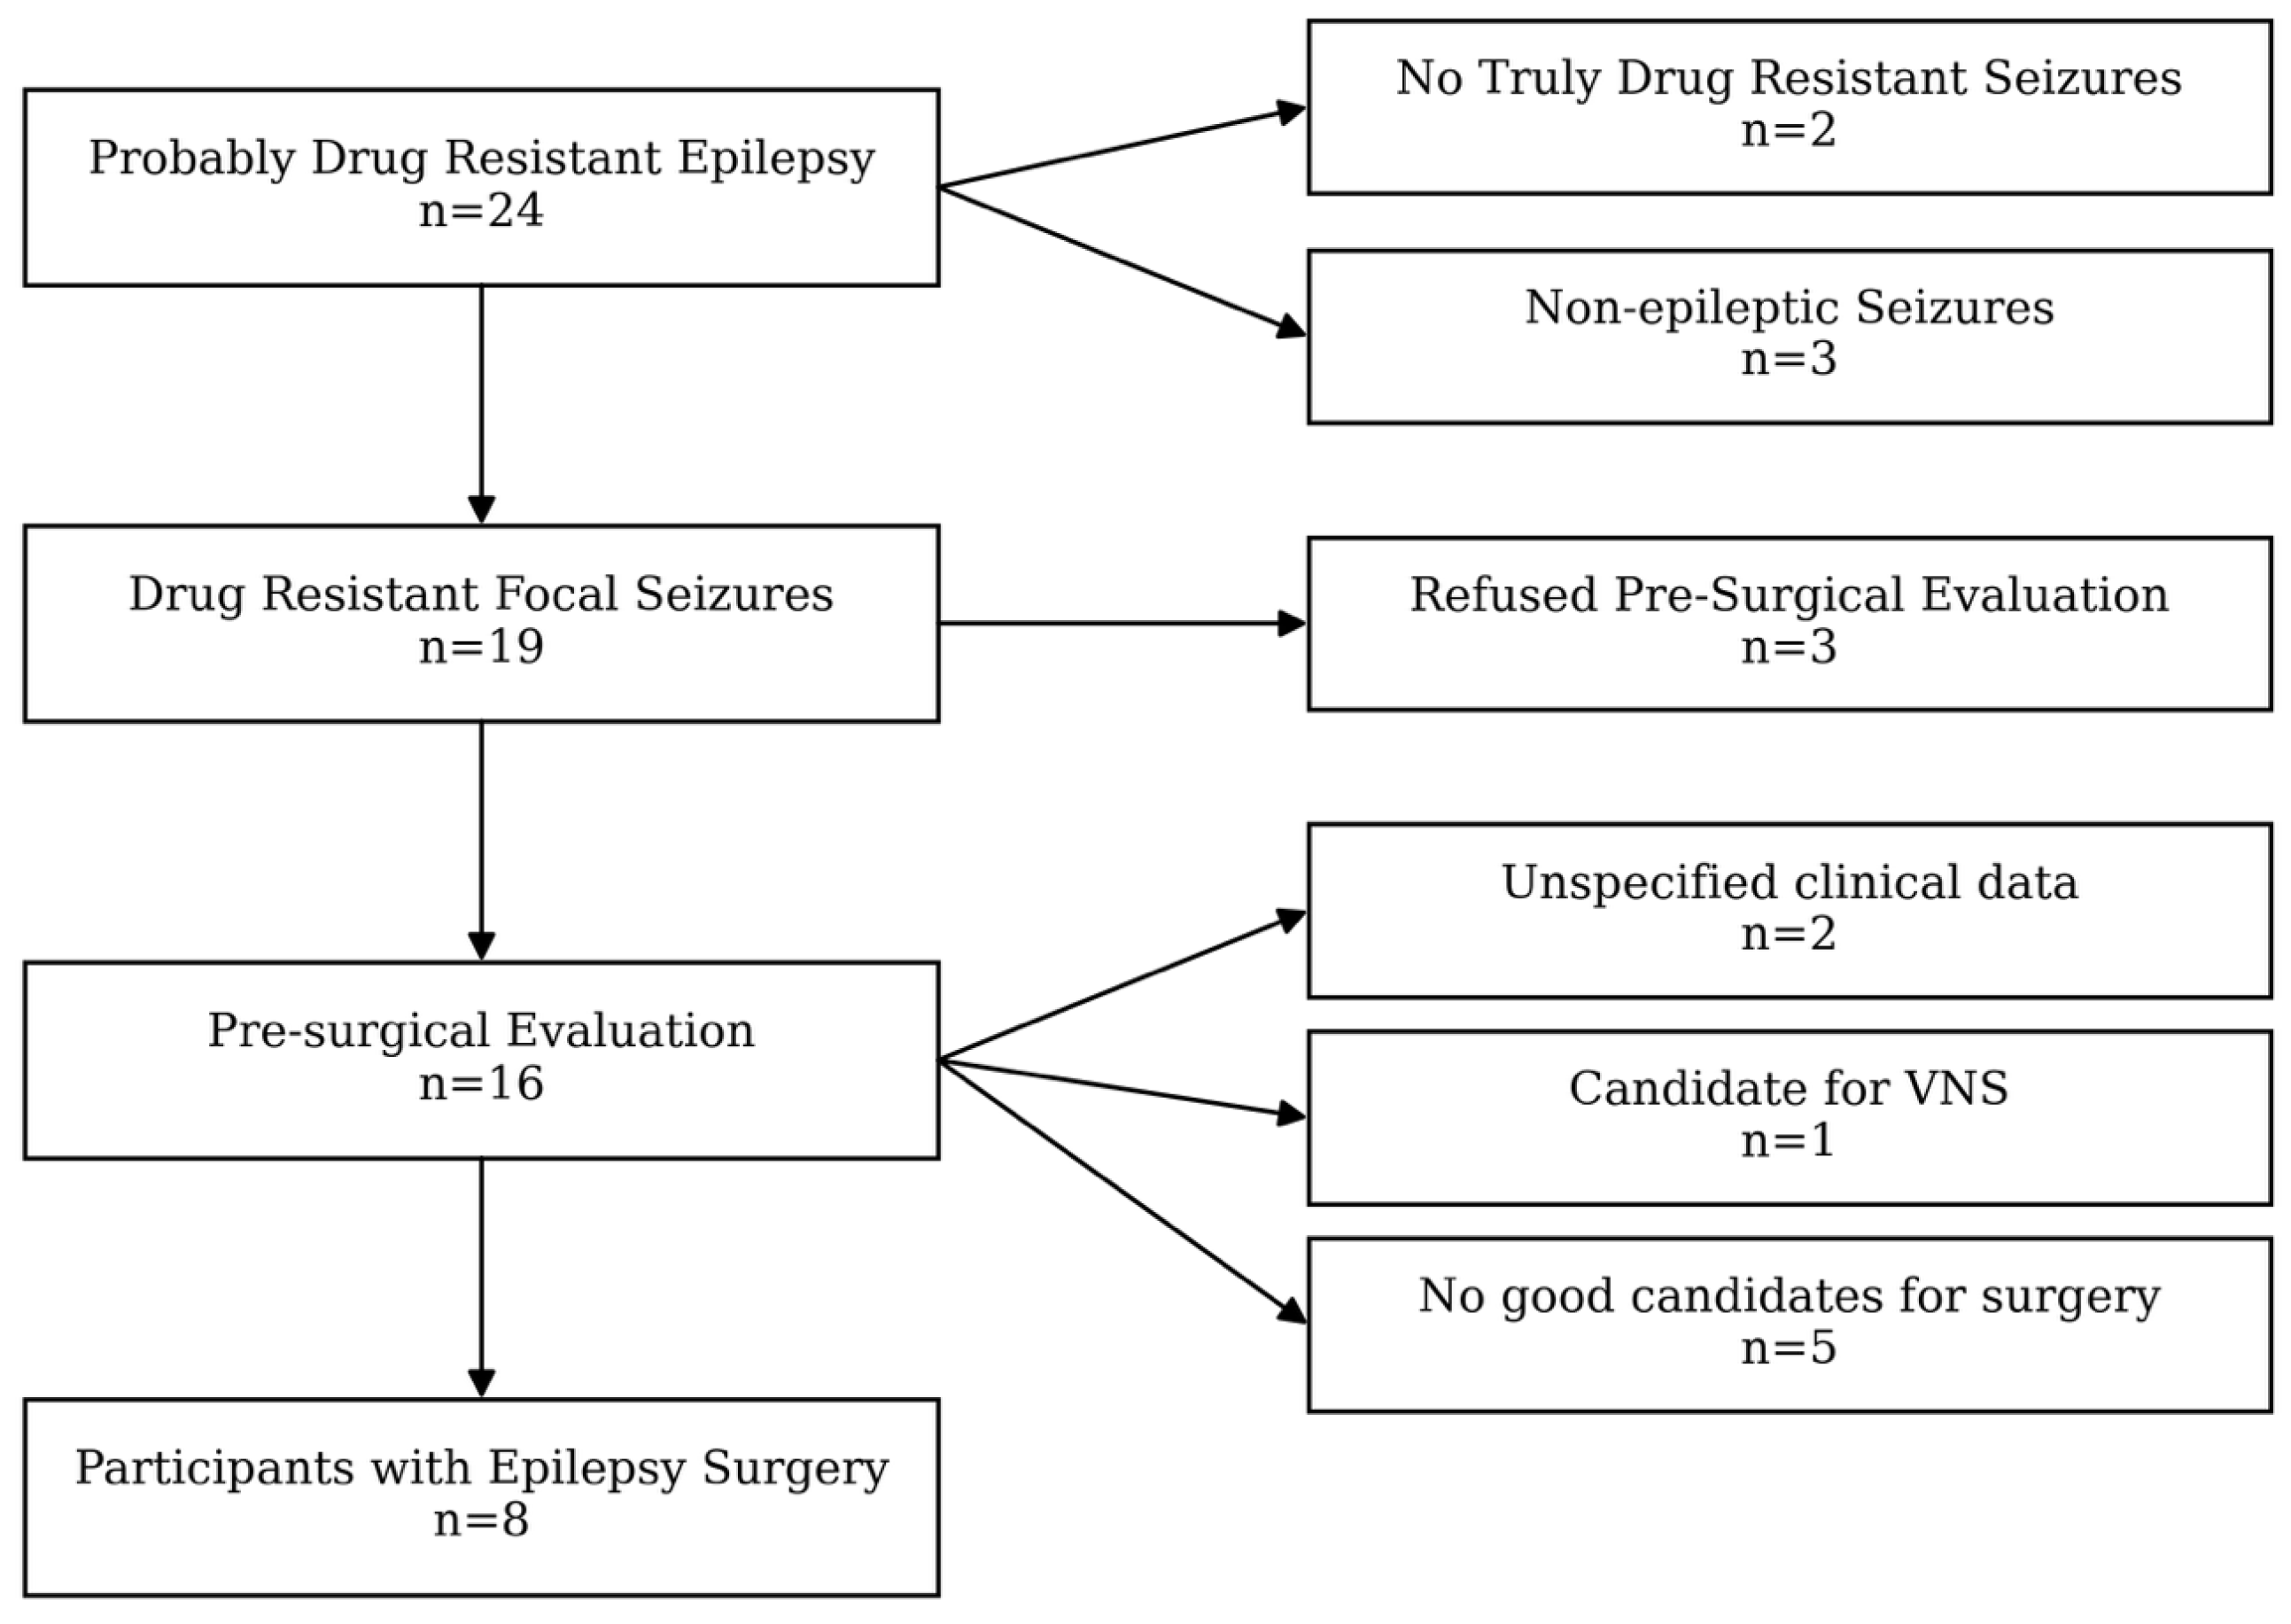
Flowchart of study participant recruitment and selection. Of 24 individuals initially evaluated for probable drug-resistant epilepsy, 2 were found not to have truly drug-resistant seizures and 3 had non-epileptic seizures, leaving 19 participants with drug-resistant focal seizures. Three participants declined presurgical evaluation, and 16 underwent presurgical assessment. Of these, 2 had insufficient clinical data, 1 was considered a candidate for vagus nerve stimulation (VNS), and 5 were not considered suitable candidates for surgery. The remaining 8 participants underwent epilepsy surgery.
Clinical SOZ localization was determined by multidisciplinary presurgical evaluation, including clinical semiology of seizures, noninvasive video-EEG monitoring, structural MRI, and available surgical/pathological information. Postoperative seizure outcome was classified according to Engel criteria [37].
2.2. Ethics
The project was approved by the Ethics Committee of the Institute of Neurology and Neuropsychology (INN-005/2023). The study was conducted in accordance with the principles of the World Medical Association Declaration of Helsinki. All participants provided written informed consent before enrollment.
2.3. Seizure Semiology
The semiology of seizures was evaluated using the ILAE (2017) classification of seizures [38]. All study participants were clinically assessed to have focal seizures.
2.4. Neuropsychological Assessment
Neuropsychological evaluation, namely the assessment of intellectual and memory functioning, was performed as a part of the presurgical investigations. The Wechsler Adult Intelligence Scale-IV (WAIS-IV) and Wechsler Memory Scale-IV (WMS-IV) were used for the neuropsychological analysis of preoperative status.
Ten subtests across four indices of the WAIS-IV were used, specifically the following: The Verbal Comprehension Index reflects an individual’s ability to understand, use, and think with spoken language. It demonstrates the individual’s acquired knowledge. It measures the retrieval of semantic information from long-term memory. The Perceptual Reasoning Index reflects an individual’s ability to accurately interpret, organize, and think with visual information. It measures nonverbal reasoning skills that require visual perceptual abilities. The Working Memory Index reflects an individual’s ability to take in and hold information during performance and then perform a mental operation on that information. It also measures the mental manipulation of number operations. The Processing Speed Index reflects an individual’s ability to process simple or routine visual information at high speed and in a detailed and efficient way. It measures visual and motor speed and attention.
In addition, the ten main subtests of the five indices of the WMS-IV and the Brief Cognitive Status Examination subtest for adults aged 16–69 years were used. In particular, the following were used: the Auditory Memory Index (measures immediate and delayed memory for the auditory modality, which comprises encoding, active and passive recognition of logical and semantic content, and also word associations); the Visual Memory Index (measures immediate and delayed memory for the visual–spatial modality, which comprises encoding, active and passive recognition of designs that are difficult to verbalize, and copying of geometrical figures of different levels of difficulty); the Visual Working Memory Index (measures manipulation of visual–spatial information during performance); the Immediate Memory Index (measures auditory and visual immediate retrieval of encoded information); and the Delayed Memory Index (measures auditory and visual delayed retrieval of encoded information).
For the analysis and interpretation of results, index scaled scores, subtest-level differences within indices, subtest-level contrast scaled scores, and index-level contrast scaled scores were calculated. Also, ability–memory and contrast scaled score analyses were performed by comparing WAIS-IV and WMS-IV index scores.
2.5. MRI
High-resolution T1-weighted MR images were acquired from all study participants using a 3-Tesla scanner (Siemens Healthineer, Erlangen, Germany) as part of the standard epilepsy imaging protocol [39], which allows for improved sensitivity and specificity in identifying possible structural abnormalities underlying epilepsy (e.g., mesial temporal sclerosis and cortical developmental malformations). In line with modern epilepsy protocols and to ensure high-quality visualization, whole-brain imaging was performed using 3D T1 MPRAGE, axial FLAIR (3 mm), and DIR (1.5 mm, 3D isotropic) and hippocampal imaging using high-resolution coronal FLAIR and T2 sequences perpendicular to the hippocampus. The study results were analyzed by two independent, qualified neuroimaging experts and were reviewed during the presurgical multidisciplinary discussion.
2.6. EEG Recording and Preprocessing
Long-term (72 h) noninvasive video-EEG was recorded with 25 electrodes placed according to the international 10–20 system and all relevant technical requirements. Recordings were obtained on a Micromed electroencephalogram machine (Micromed BQ 3200 ACQDV/LTM32 EXPRESS PCI -32- CHANNELS LTM DIGITAL VIDEO EEG SYSTEM; Mogliano Veneto, Italy), with a sampling rate of up to 1000 Hz depending on the recording session. All technical requirements were fully met during the video-EEG recording process, which allowed us to record the purest possible clinical or subclinical findings. For each participant, one seizure with a clinically and electrographically stereotyped ictal pattern was selected, and a 20 s preictal segment immediately preceding electrographic seizure onset was extracted for analysis. Interictal/ictal epileptiform visual features (spike and slow wave complexes) and background slowing (rhythmic delta or theta activity) were defined according to the IFCN glossary of terms [40]. Raw EEG was visually inspected, and channels with persistent artifacts were excluded. Independent component analysis was used to identify and remove components reflecting ocular, muscle, and cardiac artifacts, using established EEGLAB procedures [41]. Cleaned scalp EEG time series were prepared for source modeling in Brainstorm [42].
2.7. Source Localization and ROI Extraction
Cortical source activity was estimated using standardized low-resolution electromagnetic tomography (sLORETA) [43]. A boundary element forward model was computed with OpenMEEG within Brainstorm on a standard template anatomy because individualized structural MRI scans were not available for source modeling [42,44]. The inverse operator produced time-resolved cortical current-density estimates across the cortical surface.
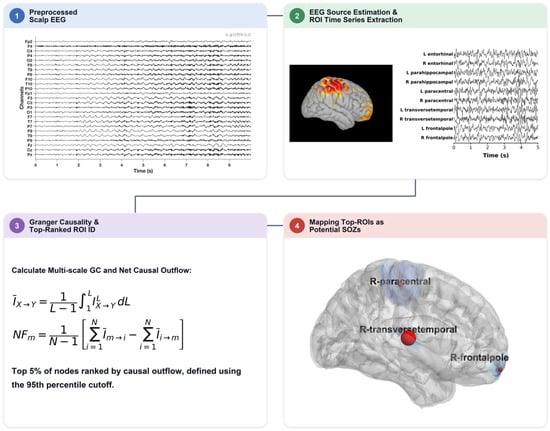
The cortical surface was parcellated into 68 regions of interest (ROIs) using the Desikan–Killiany atlas [45]. A representative source time series was extracted for each ROI, yielding a 68-region cortical time series for each participant and preictal segment. The algorithm of the EEG data processing (or the analysis pipeline) is presented in Figure 2.
Figure 2.
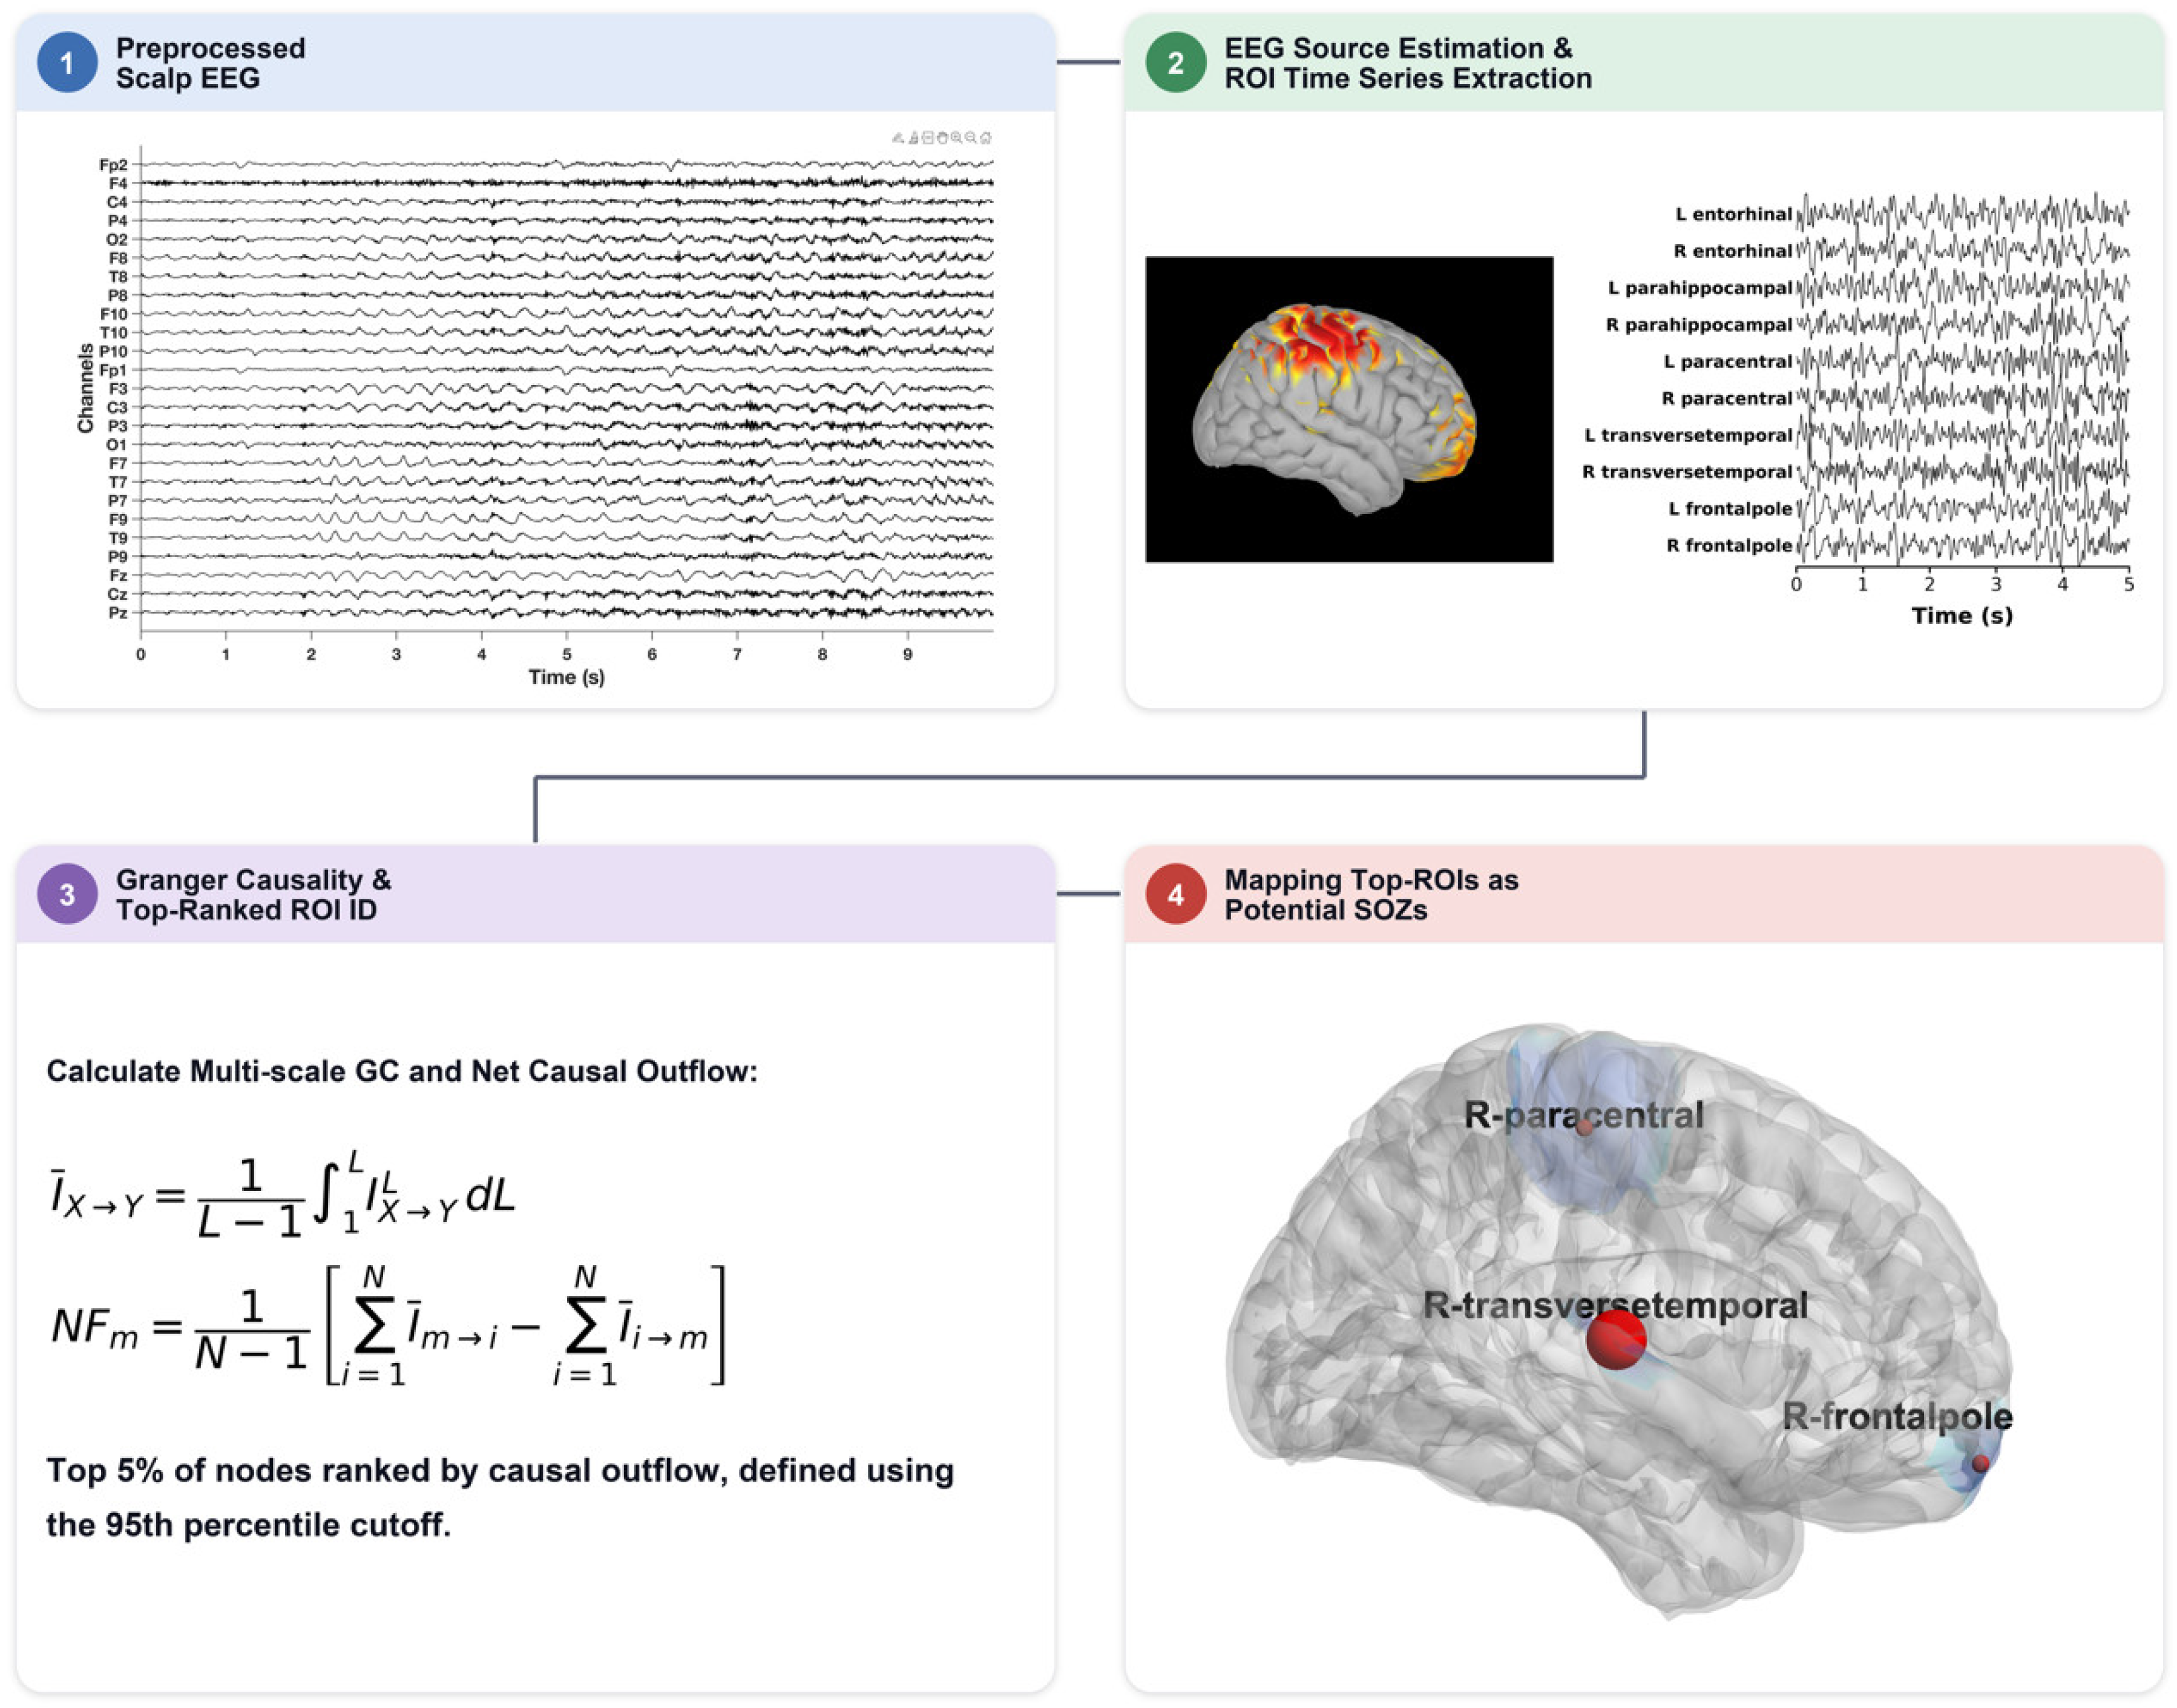
Schematic overview of the EEG analysis pipeline with main steps from 1 to 4. Preictal scalp EEG was first preprocessed to reduce noise and physiological artifacts. Cortical source activity was then reconstructed using standardized low-resolution electromagnetic tomography (sLORETA), and representative time series were extracted from cortical regions of interest (ROIs) defined by the Desikan–Killiany atlas. Pairwise multiscale spectral Granger causality was calculated across ROIs over predefined frequency bands, and regional inflow, outflow, and net flow were derived from the resulting directed-connectivity matrices. The 13–30 Hz beta-band analysis is presented here, while the results from the other frequency bands are included in the Supplementary Material. ROIs with absolute net-flow values at or above the 95th percentile were identified as top-ranked candidate regions and mapped onto the cortical surface as potential seizure-onset zones (SOZs).
2.8. Spectral Granger Causality and Net-Flow Metrics
Pairwise directed interactions among ROI time series were quantified using nonparametric spectral GC based on spectral matrix factorization [35,46]. Frequency-specific directed influence was computed in four bands: 1–12 Hz, 13–30 Hz, 30–45 Hz, and 55–95 Hz. Signals were filtered using zero-phase finite impulse response filters. Resampling was performed only after anti-alias filtering and at band-appropriate sampling rates that preserved a Nyquist frequency above the upper edge of each analyzed band.
Here, we use a multiscale formulation of Granger causality rather than the traditional single-lag measure. Conventional Granger causality is based on one-step-ahead prediction and summarizes directed influence at a single, fast timescale, whereas the interactions underlying seizure initiation and propagation span a range of temporal delays, from short- to longer-latency influences. For each ROI pair, the cross-spectral density matrix was estimated from the band-filtered signals and factorized with the Janashia–Lagvilava algorithm, and the univariate spectra were factorized in the same way, without fitting an autoregressive model. Directed influence was computed at successive prediction horizons in single-sample increments as the ratio of the prediction-error variance from the univariate factor to that from the bivariate factor, as defined previously [32]. The range of horizons was chosen to span short- to long-latency inter-regional interactions and to cover multiple oscillatory cycles within each frequency band. These values were integrated over lag with the trapezoidal rule and normalized by the total lag range to obtain a single multiscale value for each ROI pair and frequency band; the inflow, outflow, and net-flow metrics defined below are derived from this multiscale estimate. Averaging over prediction steps captures interactions that emerge only at longer horizons and reduces the estimate’s dependence on any single lag or model order.
For each frequency band and participant, a directed GC matrix was estimated across all ROI pairs. Total outflow for a region was defined as the mean directed influence from that ROI to all other ROIs. Total inflow was defined as the mean directed influence from all other ROIs into that ROI. Net flow was calculated as outflow minus inflow, such that positive values indicate net drivers and negative values indicate net receivers. Other directed-connectivity measures, such as partial directed coherence, provide alternative frequency-domain formulations of a similar concept of directed causal influence [47]. Candidate SOZ regions were defined as ROIs at or above the 95th percentile of absolute net flow, computed separately for each participant and frequency band. To assess the sensitivity of concordance to this threshold, beta-band scoring was repeated using the single top-ranked region (≈99th percentile) and the 90th percentile (≈7 regions), applying the same concordance criterion.
2.9. Concordance Assessment and Statistical Reporting
Candidate SOZ regions were compared with the clinically determined SOZ. A candidate was considered concordant if it localized to the same hemisphere and clinically implicated lobe or mesial temporal network. Agreement was scored at each level (hemisphere, lobe, region) as concordant if at least one candidate region in the 95th-percentile set matched the clinically implicated target at that level. For resected participants, candidate regions were also compared with the surgical target and Engel class outcome. Because of the small sample size, results are reported descriptively with exact (Clopper–Pearson) binomial 95% confidence intervals for concordance proportions [48,49]. No inferential claims of clinical accuracy are made. Outcome success rate and the confidence interval were calculated under the assumption of binomial distribution [48].
Concordance of the modalities was determined by the treating clinicians during multidisciplinary presurgical evaluation. Each of five components of the presurgical evaluation—seizure semiology, interictal EEG, ictal EEG, MRI, and neuropsychological testing—was scored as concordant if its localizing finding matched the side and region of the clinically determined seizure-onset zone, or discordant if the finding was bilateral, non-lateralizing, or otherwise inconsistent with that target.
3. Results
3.1. Cohort Overview
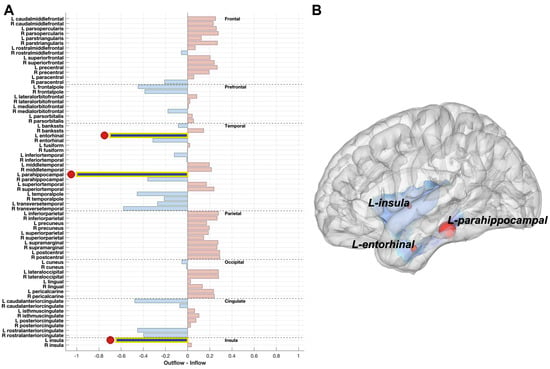
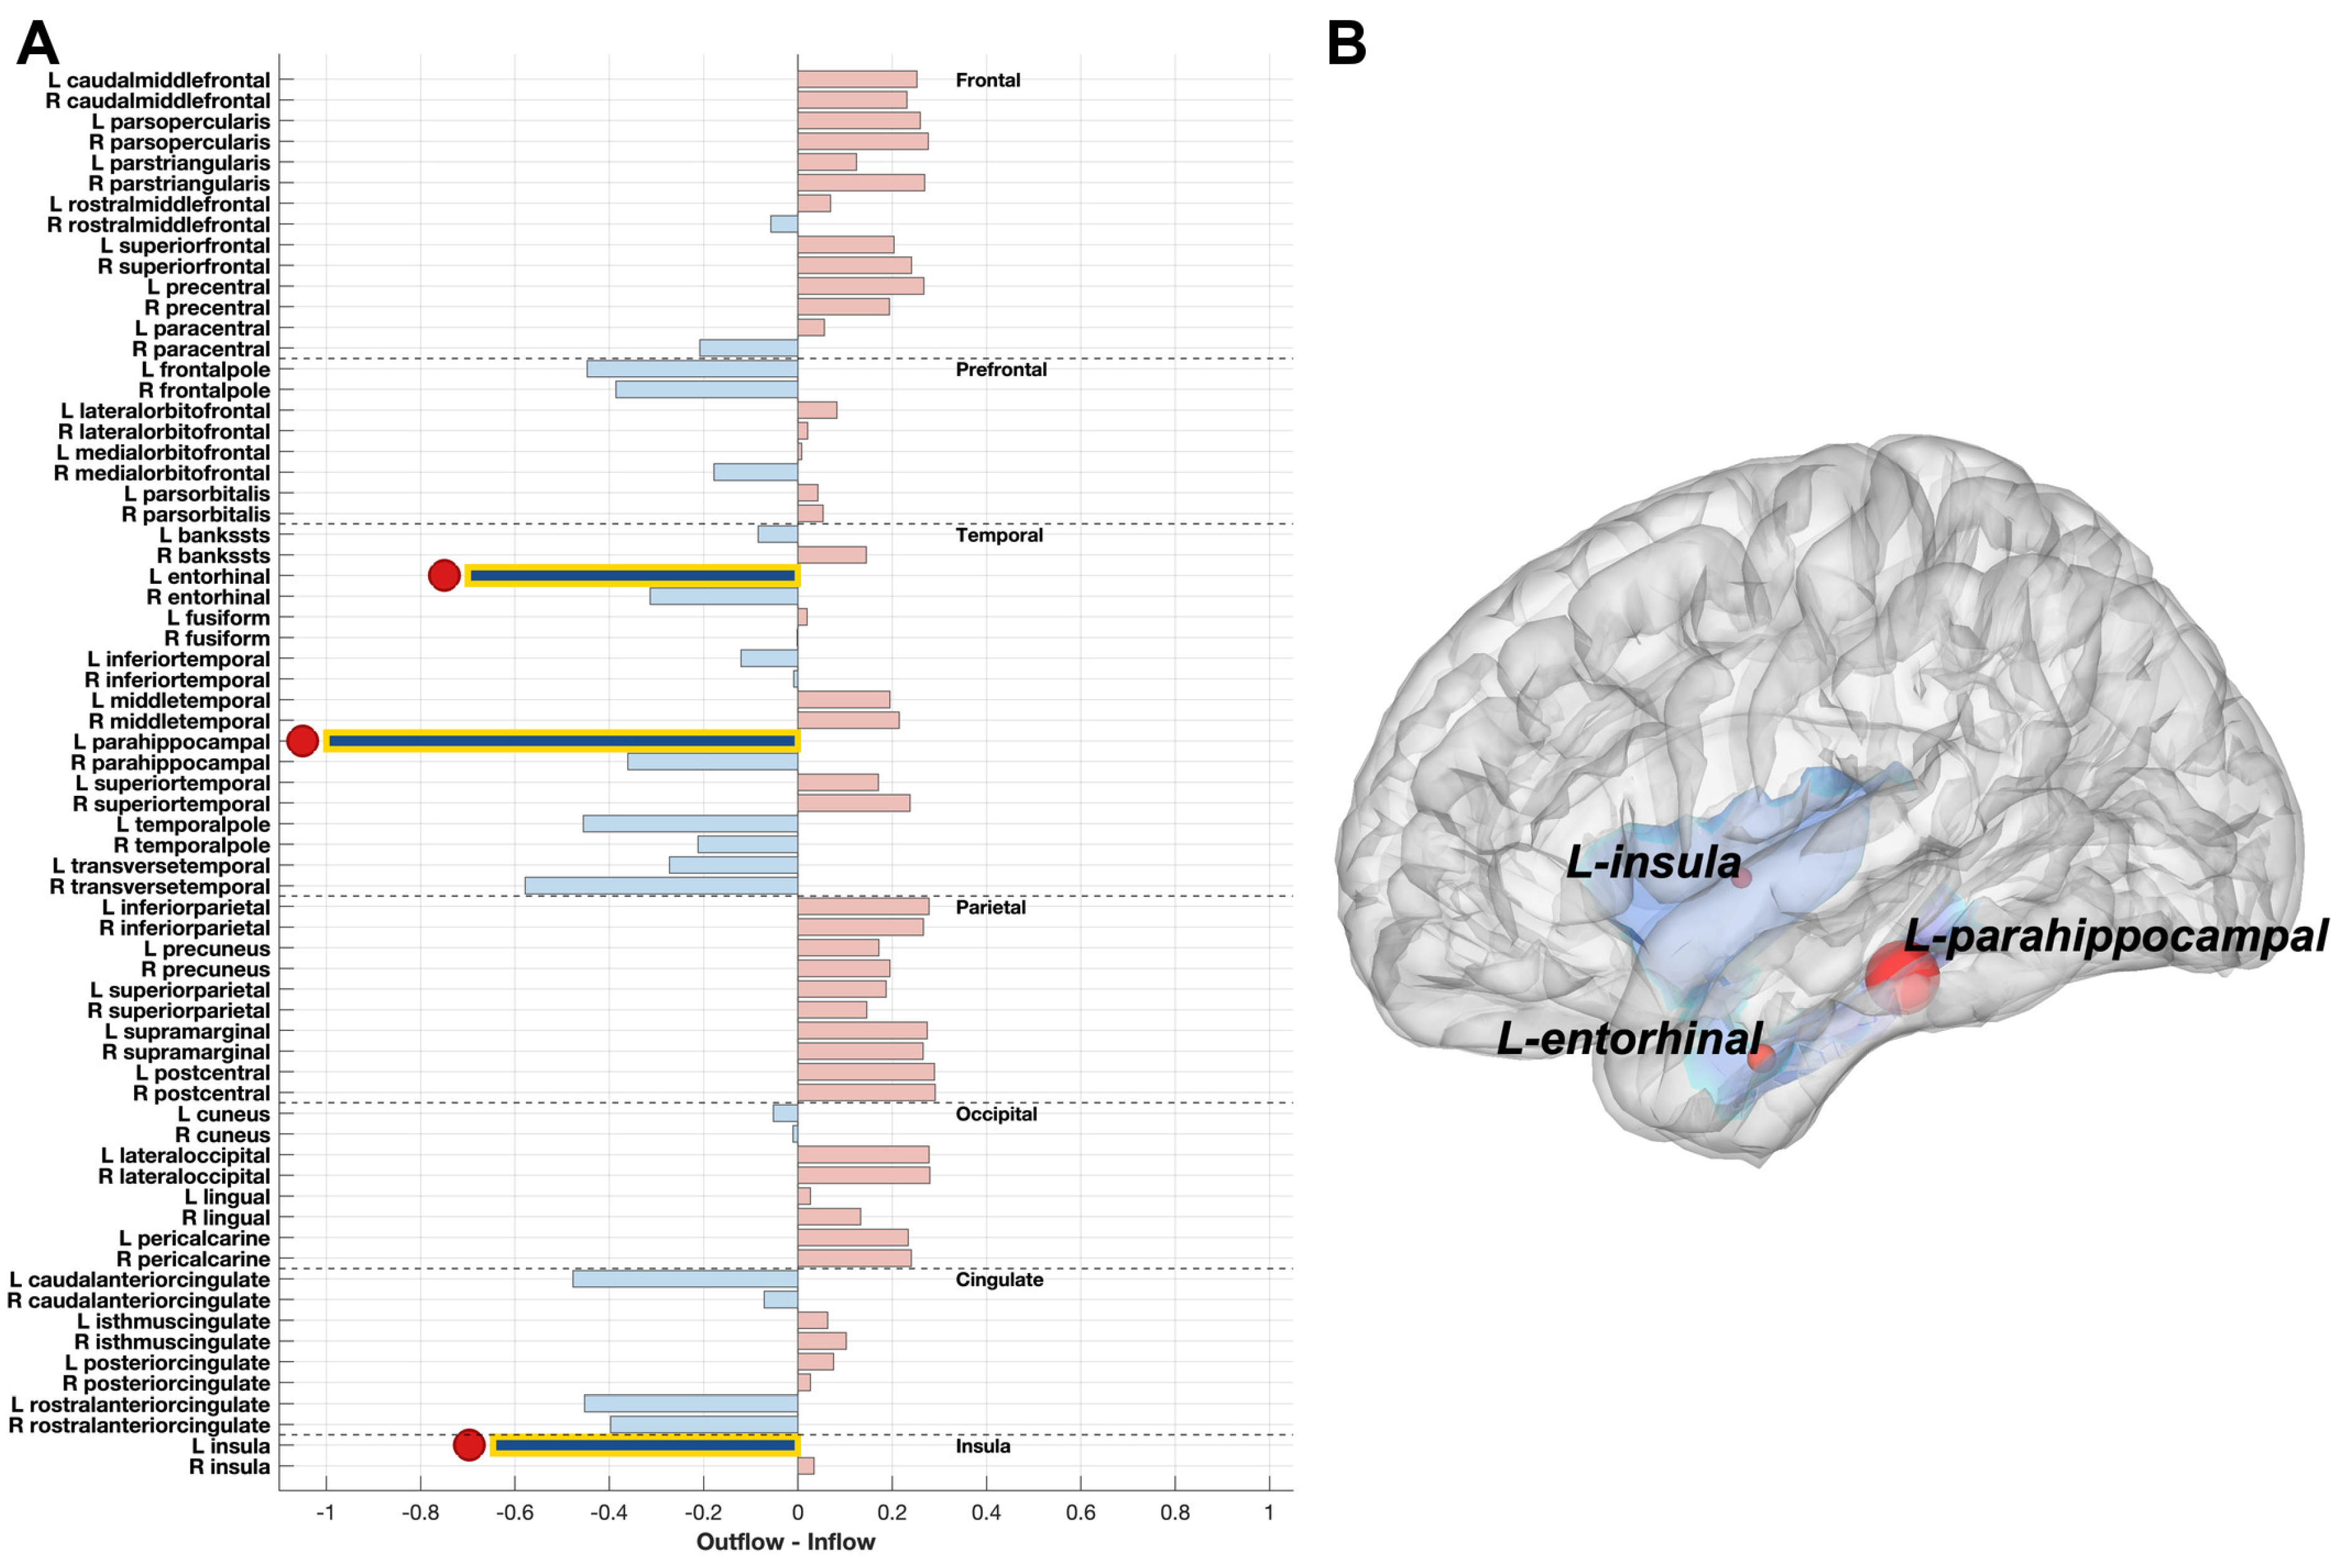
Sixteen people with drug-resistant focal epilepsy were evaluated. Eight participants had undergone epilepsy surgery with documented postoperative outcomes and were analyzed retrospectively; eight participants remained unresected and were evaluated prospectively. Data from two participants, one resected and one unresected, could not be analyzed due to excessive EEG artifacts/noise, leaving 14 participants with usable data. Two additional unresected participants were excluded from the concordance analysis due to a lack of concordance across the clinical modalities, precluding a reliable clinical reference standard for comparison. The final analytic cohort therefore comprised 12 participants: seven resected (M/F: 3/4) and five prospective (M/F: 2/3). In all 12 cases, MRI localization included left- or right-sided mesial temporal sclerosis (MTS), focal cortical dysplasia (FCD), gliosis, or periventricular heterotopia. Detailed demographic, clinical, interictal and ictal EEG, MRI, and neuropsychological data are presented in Table 1. A representative example of the beta-band GC net-flow map is shown in Figure 3.
Table 1.
Demographic, clinical, electrophysiological, neuroimaging, and neuropsychological characteristics and surgical outcomes of the study participants. Concordance analyses compared the multiscale Granger causality maps with the clinical assessments of seizure-onset zones (SOZs). Participants 14, 15, and 16 did not have definitive clinical SOZ assessments. Therefore, the absence of these assessments is indicated by a hyphen in the table. Abbreviations: M, male; F, female; R, right; L, left; T, temporal; O, occipital; F, frontal; P, parietal; C, central; BTCSs, bilateral tonic–clonic seizures; MTS, mesial temporal sclerosis; FCD, focal cortical dysplasia.
Figure 3.
Representative beta-band (13–30 Hz) Granger causality net-flow results from one resected participant. (A) Regional net causal flow, calculated as causal outflow minus causal inflow, is shown for all 68 cortical regions of interest (ROIs). Positive net-flow values indicate net drivers, whereas negative values indicate net receivers. The top-ranked candidate regions based on absolute net flow are highlighted. (B) Cortical surface representation of the corresponding candidate regions, including the left insula, left entorhinal cortex, and left parahippocampal cortex. These regions were identified as candidate seizure-onset zone (SOZ) regions for this participant.
3.2. Overall Concordance
Among the seven resected participants, the cause of drug resistance was left-sided MTS in four, right-sided MTS in two, and right frontal FCD Type II in one. Concordance of the five clinical modalities (seizure semiology, standard EEG, video-EEG monitoring, MRI, and neuropsychological testing) was high (5/5) in two participants, moderate (4/5) in three, and lower (3/5) in two (Table 1).
Using the beta band (13–30 Hz) as the primary, conservative band, candidate regions from resected participants were concordant with clinical localization in six of seven cases (85.7%; exact 95% CI, 42.1–99.6%); the single discordant case is discussed below. Among prospective participants, three of five showed concordance (60%; exact 95% CI, 14.7–94.7%). Combined across both groups, nine of 12 scored participants (75%; exact 95% CI, 42.8–94.5%) were concordant. Because the resected and prospective groups carry different levels of clinical validation (surgical outcome versus presurgical consensus alone), the subgroup results are reported as primary, and the pooled estimate should be interpreted with caution. All seven resected participants had Engel class I outcomes, regardless of concordance status (Table 1). One discordant resected participant also achieved seizure freedom, underscoring that this candidate-region mapping approach reflects network-level localization rather than being a direct predictor of surgical outcome in this small cohort [37].
In one concordant participant from the prospective group, epilepsy surgery was not performed because of the high risk of postoperative visual impairment. Concordance varied with threshold choice, from five of 12 (41.7%) using only the single top-ranked region, to nine of 12 (75%) at the 95th percentile used in the primary analysis, to 10 of 12 (83.3%) at the 90th percentile; the highest-ranked concordant region was ranked first or second in nine of 12 participants (Supplementary Table S1).
3.3. Resected Participants
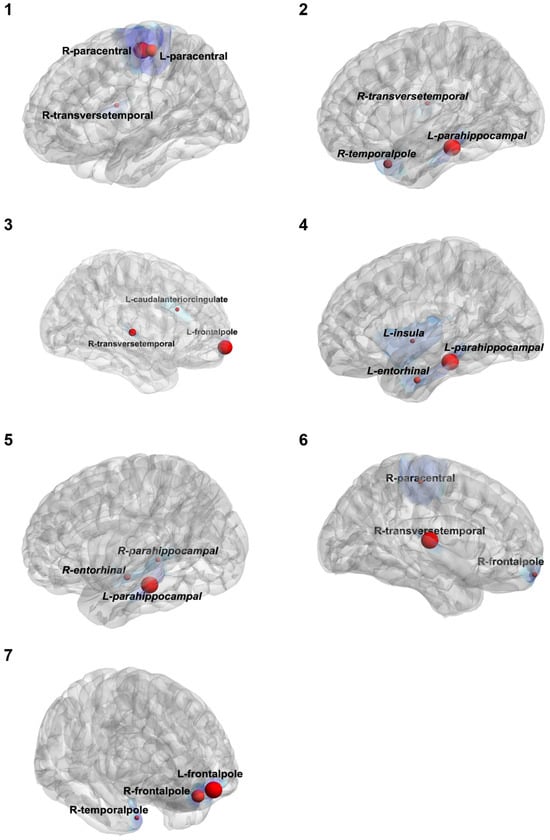
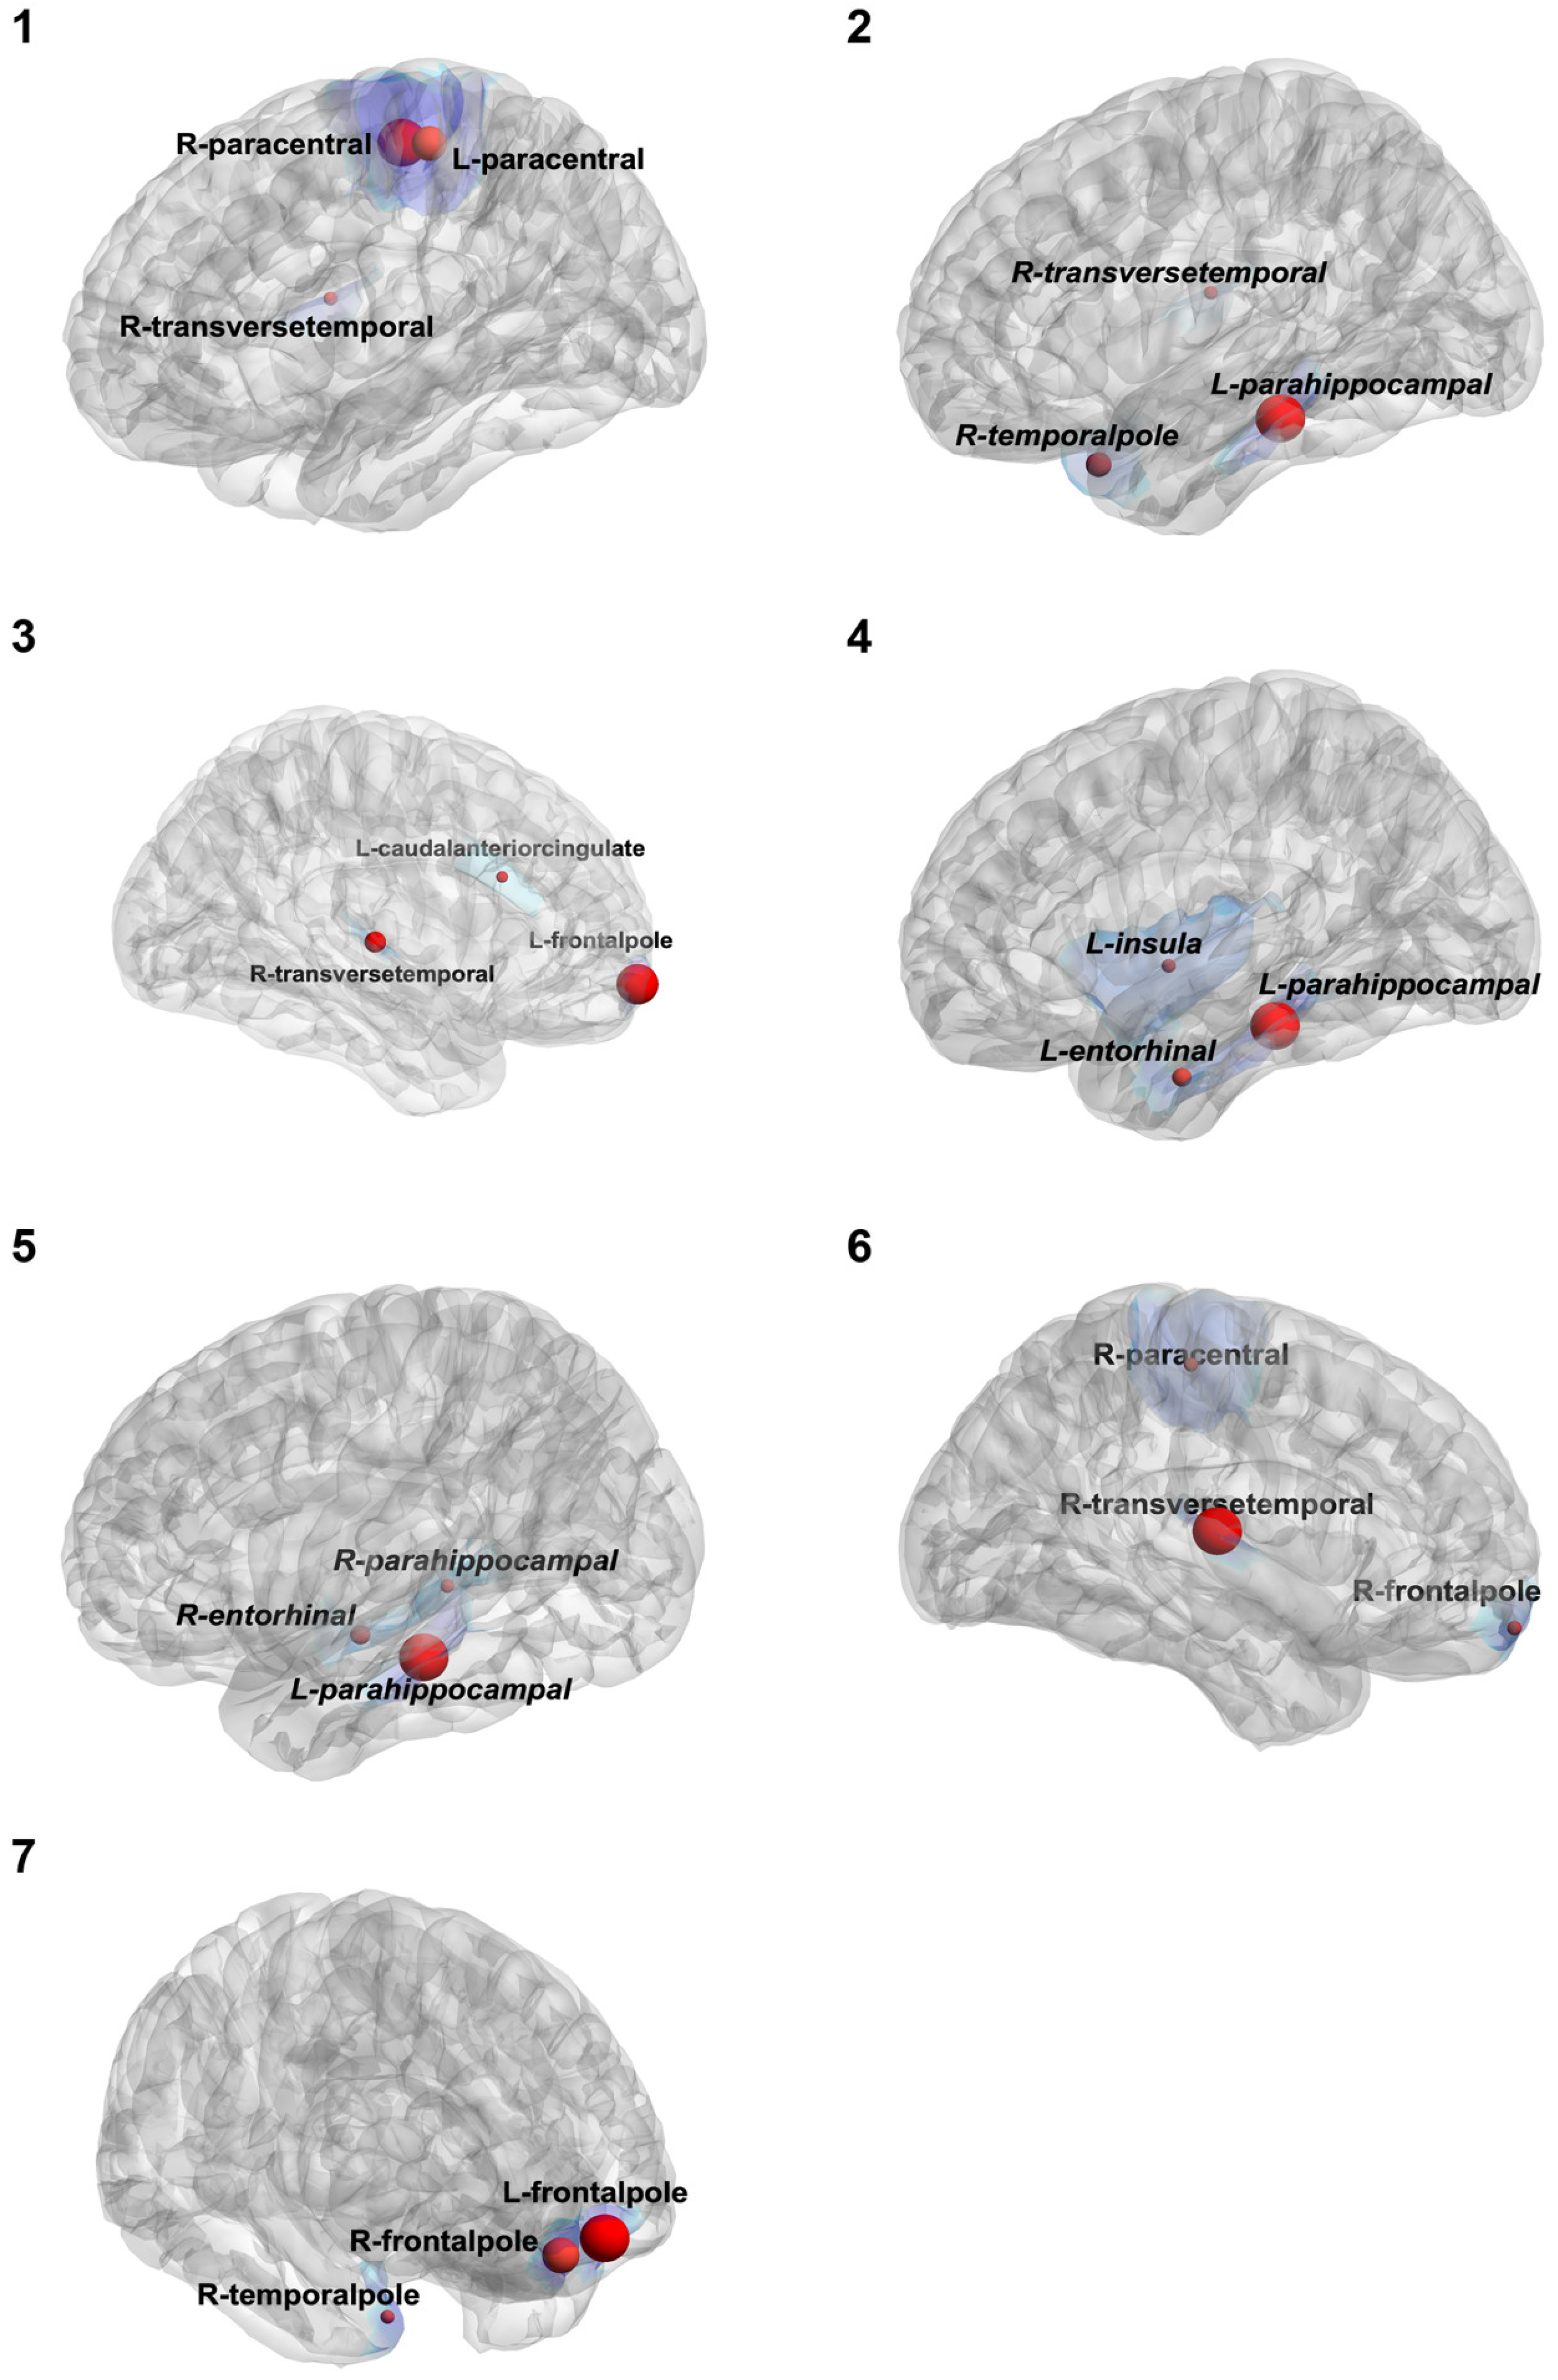
Among the seven operated participants, high or moderate modality concordance was observed in five cases: four with left-sided MTS (three at 4/5 concordance and one at 5/5) and one with right-sided MTS (5/5 concordance). Net-flow-based candidate SOZ localization matched the clinical target in three of the four participants with left-sided MTS. In the fourth participant, the top-ranked candidate regions (bilateral paracentral and right transverse temporal cortex) did not correspond to the left mesial temporal target, representing the single discordant case in the resected cohort.
Among the remaining three operated participants with right-sided MTS or right frontal FCD, high modality concordance (5/5) was observed in one, while the other two showed lower concordance (3/5). Net-flow-based candidate regions were concordant with the clinical target in all three participants.
Among the resected participants, left mesial temporal cases showed reproducible involvement of the left parahippocampal region, generally accompanied by the left entorhinal cortex, across most frequency bands (Table 1). The single discordant resected case, despite having a left mesial temporal clinical target, showed candidate regions centered on the bilateral paracentral and right transverse temporal cortices across all four frequency bands. Right-sided resected cases showed variable but generally concordant right-hemisphere candidate regions (Table 1; Figure 4).
Figure 4.
Beta-band (13–30 Hz) candidate seizure-onset zone (SOZ) regions for the seven resected participants. Cortical surface maps show the three regions of interest (ROIs) with the largest absolute net-flow values for each participant. Red spheres indicate candidate regions with negative net flow, and sphere size is proportional to the normalized magnitude of net flow. The blue shading shows the cortical extent of each candidate ROI. Participant numbers correspond to those reported in Table 1.
3.4. Prospective Participants
Among the five unresected participants scored for concordance, one had left-sided MTS, with an incidental right-sided lesion. Concordance of the clinical modalities was low in this participant (2/5) (Table 1). Net-flow-based candidate SOZ localization did not match the clinical target, with candidate regions localized to the right hemisphere despite a left-sided clinical target.
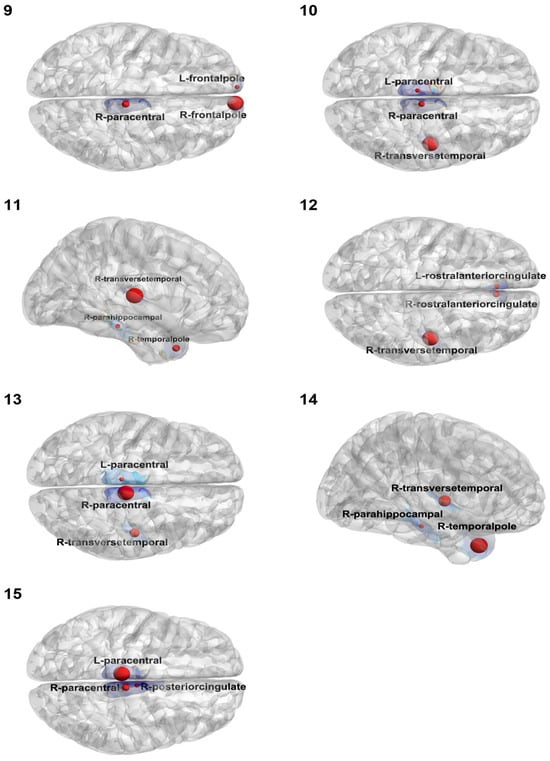
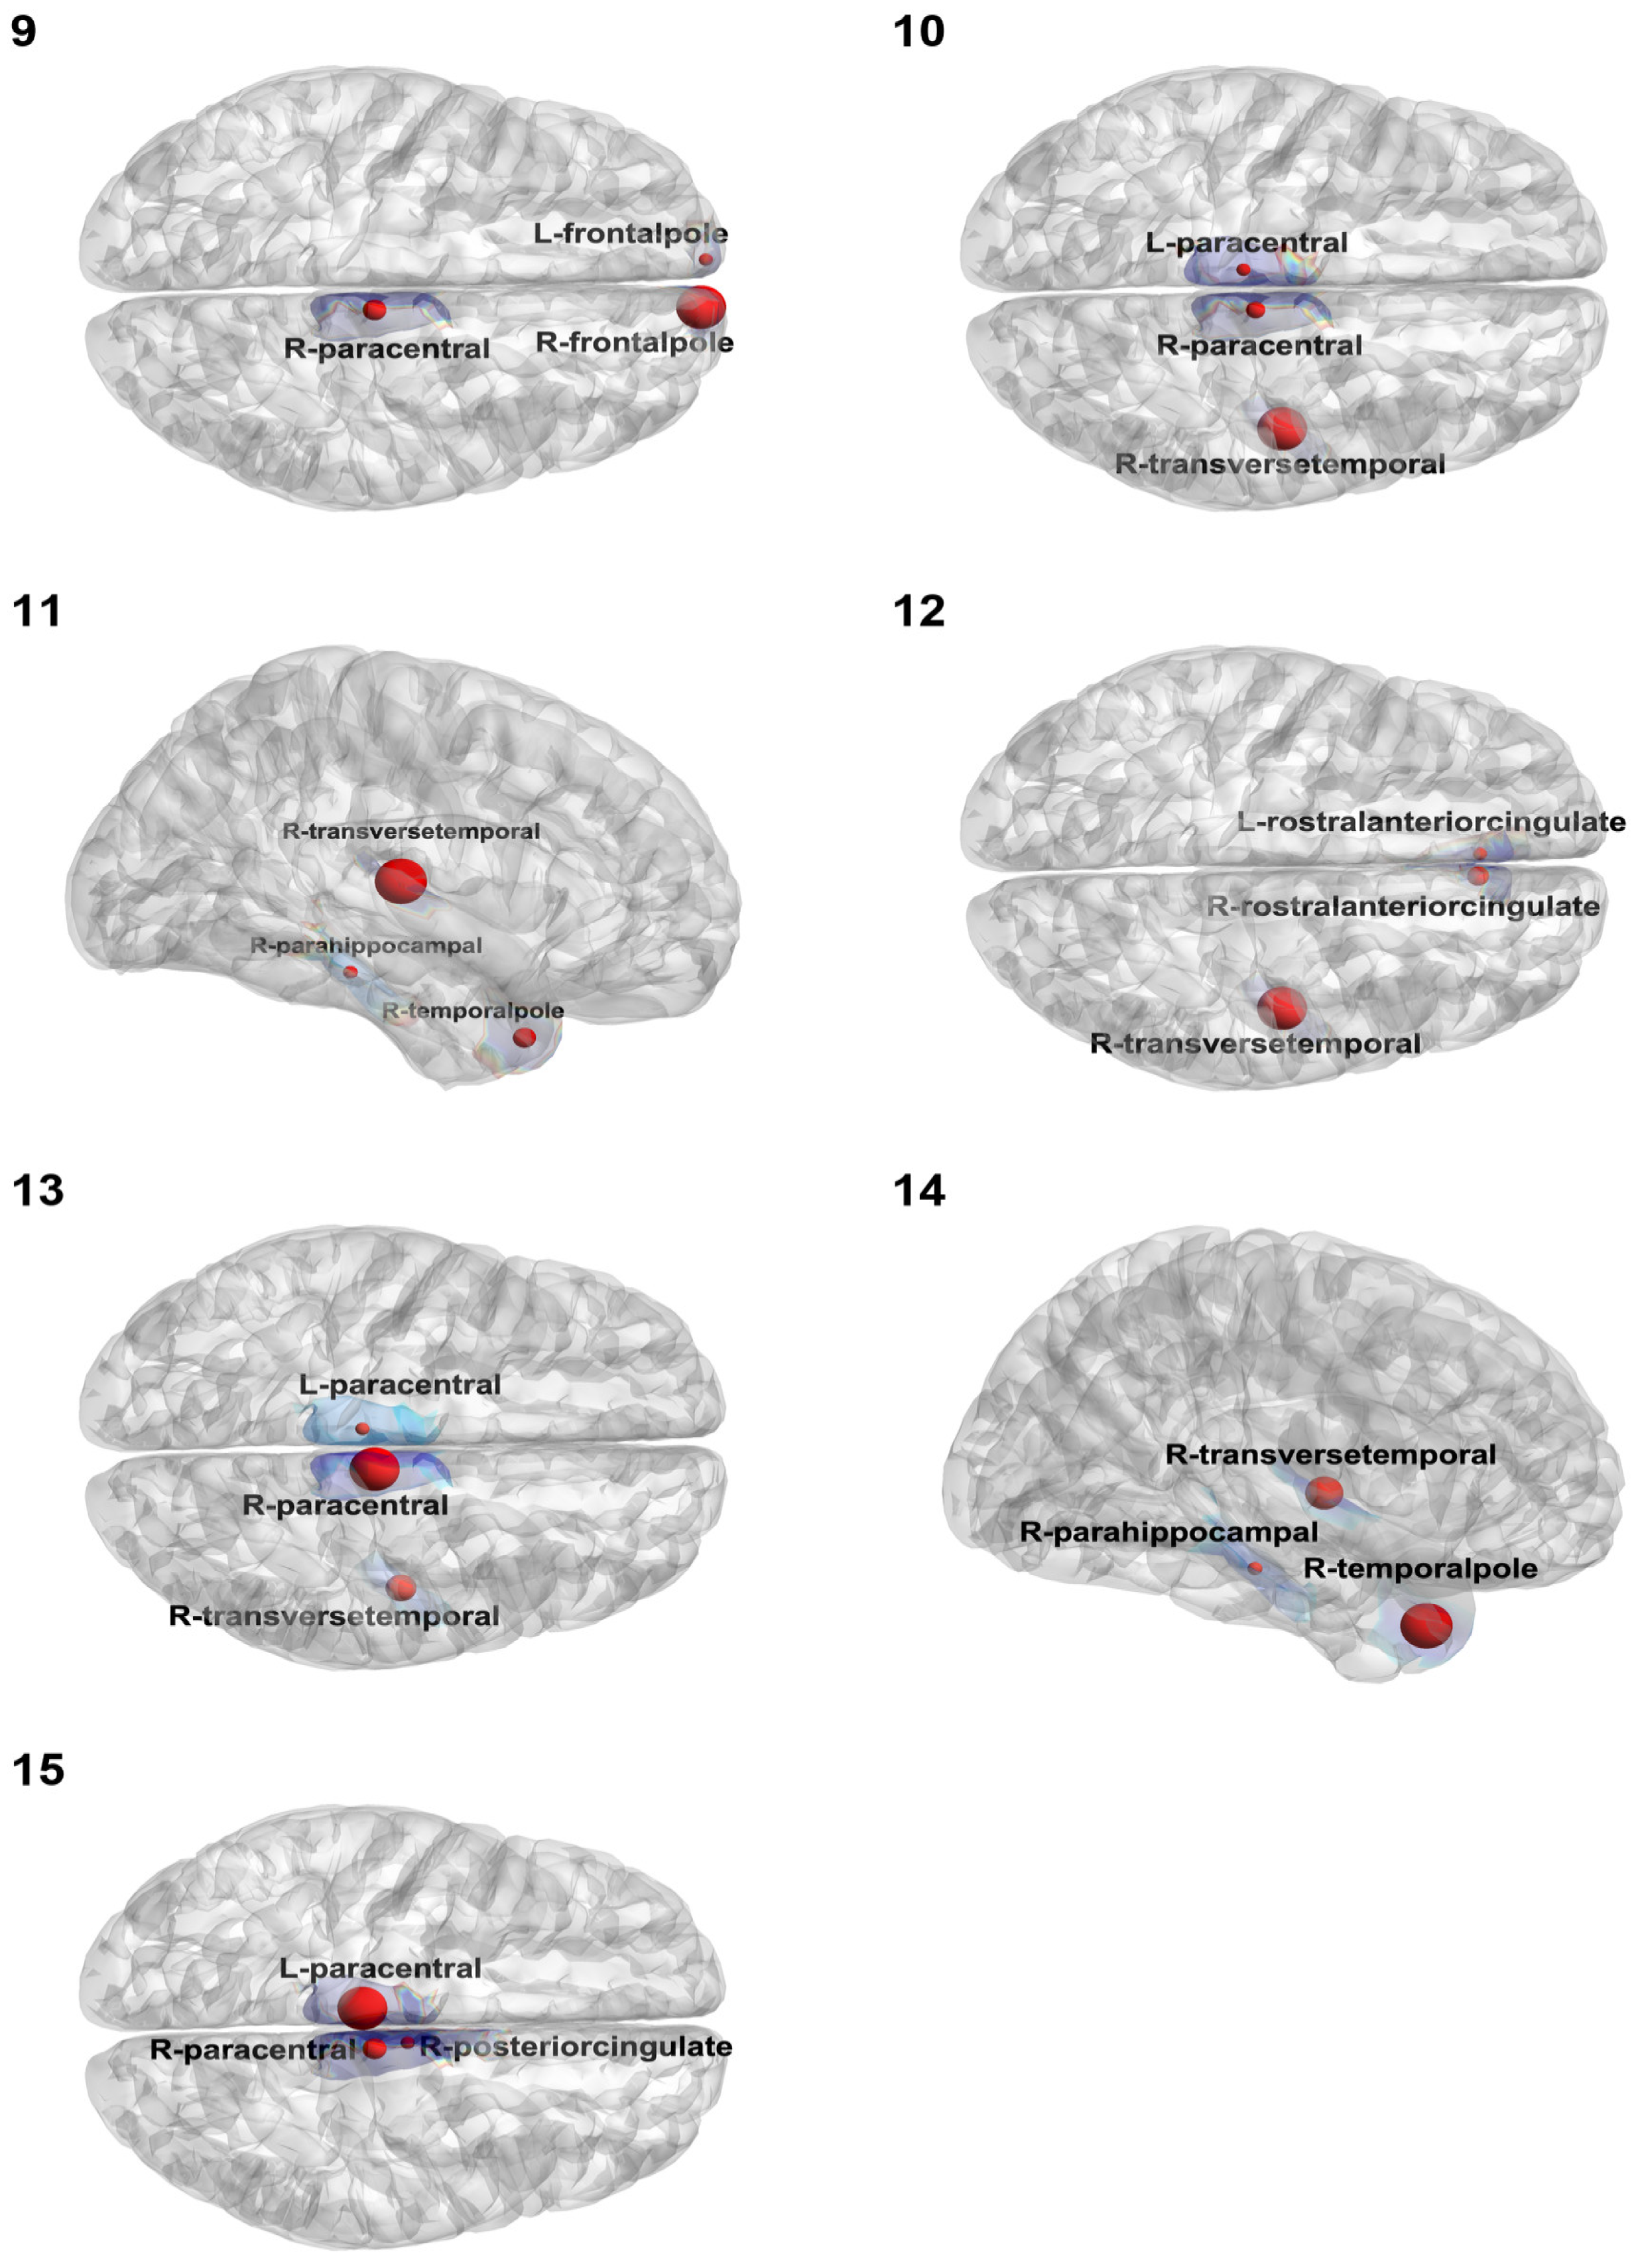
In the remaining four participants with right-sided MTS or periventricular heterotopia, modality concordance ranged from high (4/5) in one to moderate (3/5) in one and lower (2/5) in two (Table 1). Net-flow-based candidate SOZ localization matched the clinical target in three of these four participants; in the participant with high modality concordance, the top-ranked candidate region was localized to the frontal rather than the temporal cortex, representing the single discordant case within this subgroup (Table 1; Figure 5). Notably, although the top-ranked beta-band region was discordant in this participant, the right transverse temporal cortex was the leading candidate region in three of the four frequency bands and was concordant with the clinical right temporal target. This indicates that the beta-band discordance was frequency-specific rather than a broader localization failure (Table 1).
Figure 5.
Beta-band candidate seizure-onset zone (SOZ) regions for the seven prospective participants, displayed as in Figure 4. Participants 14 and 15 were excluded from the concordance analysis because they did not have definitive clinical SOZ assessments (see Table 1). Their maps are shown here for completeness but were not included in the scored analytic cohort.
Patients 14 and 15, whose clinical modalities lacked internal concordance and who were therefore excluded from scoring, are shown for completeness in Figure 5 but were not included in the concordance analysis above.
For all 14 patients with epilepsy, we present the complete set of results in Supplemental Figures S1–S14, including multiscale Granger causality (GC) net-flow activity and the corresponding brain maps of the top-ranked net-flow regions across four frequency bands: 1–12 Hz (low frequency), 13–30 Hz (beta), 30–45 Hz (gamma), and 55–95 Hz (high gamma).
3.5. Directionality of Candidate Regions
Across all participants and all four frequency bands, the dominant candidate region with the largest absolute net flow was a net receiver of causal influence, not a net driver. No participant showed a top-ranked net driver among the dominant candidate SOZ regions. This consistent inflow-dominant pattern is notable given recent intracranial EEG reports demonstrating both inflow- and outflow-dominant preictal subgroups [22,31].
4. Discussion
4.1. The Interaction Between Clinical Modalities and Beta Concordance
This study shows that preictal scalp EEG, when source-reconstructed and analyzed with multiscale spectral GC, can generate candidate SOZ regions concordant with clinical localization in most participants in this small drug-resistant focal epilepsy cohort. Among the operated individuals, considering all five modalities before surgery, there was full concordance (5/5) in two cases, moderate concordance (4/5) in three cases, and lower concordance (3/5) in the remaining two cases. Using the beta band as the primary, conservative measure, net-flow-based candidate regions were concordant with clinical localization in six of seven resected participants and in three of five prospective participants (nine of 12 combined). All resected participants had Engel class I outcomes. One prospective participant showed a beta-band mismatch, but the clinically correct region was still the top candidate in the other three frequency bands. These results support the feasibility of a fully noninvasive, source-level, directed-connectivity approach as an adjunct to conventional presurgical evaluation, while emphasizing the need for rigorous validation. The 95th-percentile threshold provided a reasonable balance between anatomical specificity and sensitivity. Restricting candidates to the single top-ranked region was overly stringent, particularly because spatial leakage limits the ability to distinguish neighboring source-reconstructed regions. Conversely, lowering the threshold to the 90th percentile approximately doubled the number of candidate regions among the 68 cortical ROIs while identifying only one additional concordant participant. Multiscale GC-based node activity is intended to complement, rather than replace, conventional source imaging by providing additional information about the directionality of network interactions. However, because pairwise Granger causality does not account for the influence of other regions, estimated interactions may include indirect pathways or shared inputs rather than direct neural connections. Thus, net-flow measures should be interpreted as reflecting aggregate directed statistical dependencies, rather than direct biological causation.
The findings build on the expanding clinical literature on EEG source imaging. Recent reviews and clinical studies indicate that ESI can contribute meaningfully to phase-I presurgical localization, can be concordant with intracranial EEG, and can predict surgical outcome in selected cohorts [9,10,11,12,13,14,15,16,17,18]. Our approach differs by adding directed functional interactions among source-localized cortical regions rather than relying only on the spatial distribution of source amplitude or interictal spike generators. In this respect, it extends earlier noninvasive connectome work and intracranial directed functional connectivity studies to a practical scalp EEG presurgical workflow [25,26,27,28,29,30], complementing quantitative intracranial markers of epileptogenicity such as the Epileptogenicity Index [20].
The most anatomically specific finding occurred in the left MTS cases: three of the four showed the left parahippocampal cortex as a candidate region in every frequency band, with the left entorhinal cortex identified in most bands. This repeated localization across independent participants and frequency bands argues against a purely idiosyncratic effect of atlas parcellation or a single recording. It is also anatomically plausible because parahippocampal and entorhinal cortices are core components of the mesial temporal epileptogenic network.
A striking result was the uniform net-receiver profile of the dominant candidate regions. Classical interpretations of seizure initiation often emphasize the SOZ as an abnormal driver that recruits surrounding tissue; consistent with this view, some noninvasive source-connectivity methods localize the SOZ as the region with the greatest outgoing influence [50]. However, recent intracranial EEG analyses indicate that preictal network dynamics can be heterogeneous and that, in some participants, the SOZ receives stronger directed influence before seizure onset [22,31]. The present scalp-based source analysis showed inflow dominance in every participant and frequency band. Because candidate regions were selected by absolute net flow, strong drivers were equally eligible for selection, and both positive and negative net-flow values were present in every participant (Figure 3; Supplemental Figures S1–S14); the dominance of receivers among the top-ranked regions therefore does not follow directly from the selection rule. It may reflect cohort composition, the selected preictal window, source-reconstruction effects, or the net-flow metric itself. The convergence between these results and recent intracranial observations suggests that inflow may need to be considered explicitly in future SOZ-mapping algorithms.
We reported beta-band concordance as the primary conservative result because scalp EEG activity at low frequencies (1–13 Hz) is strongly influenced by the aperiodic 1/f component and by nonspecific background slowing, which may complicate interpretation of frequency-specific directed connectivity [51]. Frequencies above 30 Hz were also not included in the primary analysis because scalp gamma activity is more susceptible to contamination from muscle and other high-frequency artifacts and generally has a lower signal-to-noise ratio. We therefore focused on the beta band (13–30 Hz) as a more conservative frequency range for evaluating preictal directed network interactions. Future studies could further examine the relative contributions of periodic oscillatory activity and aperiodic spectral structure and assess the consistency of beta-band net-flow findings across centers, recording systems, and participant populations.
The discordant participant (Table 1) warrants cautious interpretation. Despite a clinically defined left anterior/mesial temporal SOZ and an Engel IA postoperative outcome, the pipeline consistently identified bilateral paracentral and right transverse temporal regions across frequency bands. One possible explanation is that the preictal net-flow pattern captured contralateral network recruitment or propagation rather than the primary seizure-generating region. Focal epileptic activity can engage the opposite hemisphere through interhemispheric structural pathways, including commissural connections, and such propagation may produce prominent activity in regions remote from the primary SOZ [52]. Thus, the right-hemisphere findings in this participant could reflect a contralateral network expression of the left-sided epileptic process rather than an independent seizure-onset region. However, the present data cannot establish the pathway or mechanism underlying this pattern. Other contributing factors may include the limited sensitivity of low-density scalp EEG to deep mesial temporal generators, residual artifacts, use of a template head model, and analysis of a single seizure. The interpretation of ictal onset itself, even with intracranial EEG, also remains subject to uncertainty [53,54]. Further studies using individualized EEG recording coordinates and head models, multiple seizures per participant, and direct comparison with intracranial EEG will help clarify whether such contralateral patterns reflect propagation, broader network involvement, or limitations of noninvasive source localization.
4.2. Strengths and Limitations
Several considerations provide directions for future work. These findings should be regarded as exploratory and hypothesis-generating. The wide confidence intervals reflect the small sample size, and the concordance estimate should be viewed in the context of two excluded participants with differing clinical findings. The cohort was modest in size and clinically heterogeneous, and one representative seizure was analyzed per participant. Source modeling used template anatomy rather than individualized MRI-derived head models, and the 25-electrode montage may have limited spatial precision, particularly for deep or basal temporal sources. The prospective cases have not yet undergone surgical confirmation, and concordance was assessed primarily using descriptive measures. Despite these considerations, the agreement between net-flow-based candidate regions and clinically defined seizure-onset regions in most participants is encouraging. This approach may provide complementary noninvasive information alongside seizure semiology, scalp EEG, MRI, and neuropsychological findings during presurgical evaluation. Future studies using individualized head models, higher-density EEG, and multiple seizures per participant may further improve localization precision and clarify its role in guiding more focused evaluation and treatment planning. Volume conduction, source leakage, and inverse-model uncertainty associated with low-density EEG and the use of a template head model limit the anatomical specificity of our source estimates. Future studies should address these limitations using individualized head models, high-density EEG, and accurately digitized electrode positions. Additionally, the consistently observed net-receiver pattern was not evaluated using surrogate data. Phase-randomized surrogate analyses will be important for assessing whether the observed directional interactions reflect genuine predictive dependencies rather than analytical artifacts or biases. Granger causality measures predictive directional dependence between signals and should not be interpreted as evidence of direct biological causation. Furthermore, our analysis was limited to a single, uniform 20 s preictal segment per participant, preventing assessment of reproducibility across seizures or different preictal windows. Future studies should therefore examine the consistency of these findings across multiple seizures and preictal windows of varying durations. Despite these limitations, our findings provide encouraging preliminary evidence that source-level multiscale Granger causality analysis of preictal scalp EEG may help identify candidate seizure-onset zones noninvasively.
5. Conclusions
In summary, source-level multiscale Granger causality analysis of preictal scalp EEG identified clinically plausible candidate seizure-onset zone (SOZ) regions in most participants and revealed a consistent inflow-dominant network pattern. These encouraging findings highlight the potential of this noninvasive approach as a complementary, hypothesis-generating tool for prioritizing candidate SOZ regions and informing more targeted presurgical evaluation. Further validation in larger, prospective cohorts incorporating high-density EEG, accurately digitized electrode positions, individualized head models, and multiple seizures per participant will be essential. Such studies should also employ prespecified concordance criteria, direct comparisons with intracranial EEG and postoperative outcomes, and complementary electrophysiological markers such as fast ripples. With these advances, source-level multiscale Granger causality could become a valuable addition to the existing presurgical epilepsy evaluation toolbox, helping refine SOZ localization and guide clinical decision-making in patients with drug-resistant focal epilepsy.
Supplementary Materials
The following supporting information can be downloaded at https://www.mdpi.com/article/10.3390/brainsci16111176/s1: Figure S1. Multiscale GC net-flow activities and brain maps across four frequency bands for Participant 1. Net flow (outflow minus inflow) is shown for 68 cortical ROIs in (A, C, E, G) 1–12 Hz, 13–30 Hz (beta), 30–45 Hz (gamma), and 55–95 Hz (high-gamma) bands, respectively. Positive values indicate net drivers, and negative values indicate net receivers. Highlighted regions were the top-ranked candidate SOZ regions in each band. (B, D, F, H) Corresponding candidate SOZ regions displayed as red spheres, with sphere size proportional to normalized net-flow magnitude, for the respective bands. Figure S2. Multiscale GC net-flow activities and brain maps across four frequency bands for Participant 2. Net flow (outflow minus inflow) is shown for 68 cortical ROIs in (A, C, E, G) 1–12 Hz, 13–30 Hz (beta), 30–45 Hz (gamma), and 55–95 Hz (high-gamma) bands, respectively. Positive values indicate net drivers, and negative values indicate net receivers. Highlighted regions were the top-ranked candidate SOZ regions in each band. (B, D, F, H) Corresponding candidate SOZ regions displayed as red spheres, with sphere size proportional to normalized net-flow magnitude, for the respective bands. Figure S3. Multiscale GC net-flow activities and brain maps across four frequency bands for Participant 3. Net flow (outflow minus inflow) is shown for 68 cortical ROIs in (A, C, E, G) 1–12 Hz, 13–30 Hz (beta), 30–45 Hz (gamma), and 55–95 Hz (high-gamma) bands, respectively. Positive values indicate net drivers, and negative values indicate net receivers. Highlighted regions were the top-ranked candidate SOZ regions in each band. (B, D, F, H) Corresponding candidate SOZ regions displayed as red spheres, with sphere size proportional to normalized net-flow magnitude, for the respective bands. Figure S4. Multiscale GC net-flow activities and brain maps across four frequency bands for Participant 4. Net flow (outflow minus inflow) is shown for 68 cortical ROIs in (A, C, E, G) 1–12 Hz, 13–30 Hz (beta), 30–45 Hz (gamma), and 55–95 Hz (high-gamma) bands, respectively. Positive values indicate net drivers, and negative values indicate net receivers. Highlighted regions were the top-ranked candidate SOZ regions in each band. (B, D, F, H) Corresponding candidate SOZ regions displayed as red spheres, with sphere size proportional to normalized net-flow magnitude, for the respective bands. Figure S5. Multiscale GC net-flow activities and brain maps across four frequency bands for Participant 5. Net flow (outflow minus inflow) is shown for 68 cortical ROIs in (A, C, E, G) 1–12 Hz, 13–30 Hz (beta), 30–45 Hz (gamma), and 55–95 Hz (high-gamma) bands, respectively. Positive values indicate net drivers, and negative values indicate net receivers. Highlighted regions were the top-ranked candidate SOZ regions in each band. (B, D, F, H) Corresponding candidate SOZ regions displayed as red spheres, with sphere size proportional to normalized net-flow magnitude, for the respective bands. Figure S6. Multiscale GC net-flow activities and brain maps across four frequency bands for Participant 6. Net flow (outflow minus inflow) is shown for 68 cortical ROIs in (A, C, E, G) 1–12 Hz, 13–30 Hz (beta), 30–45 Hz (gamma), and 55–95 Hz (high-gamma) bands, respectively. Positive values indicate net drivers, and negative values indicate net receivers. Highlighted regions were the top-ranked candidate SOZ regions in each band. (B, D, F, H) Corresponding candidate SOZ regions displayed as red spheres, with sphere size proportional to normalized net-flow magnitude, for the respective bands. Figure S7. Multiscale GC net-flow activities and brain maps across four frequency bands for Participant 7. Net flow (outflow minus inflow) is shown for 68 cortical ROIs in (A, C, E, G) 1–12 Hz, 13–30 Hz (beta), 30–45 Hz (gamma), and 55–95 Hz (high-gamma) bands, respectively. Positive values indicate net drivers, and negative values indicate net receivers. Highlighted regions were the top-ranked candidate SOZ regions in each band. (B, D, F, H) Corresponding candidate SOZ regions displayed as red spheres, with sphere size proportional to normalized net-flow magnitude, for the respective bands. Figure S8. Multiscale GC net-flow activities and brain maps across four frequency bands for Participant 9. Net flow (outflow minus inflow) is shown for 68 cortical ROIs in (A, C, E, G) 1–12 Hz, 13–30 Hz (beta), 30–45 Hz (gamma), and 55–95 Hz (high-gamma) bands, respectively. Positive values indicate net drivers, and negative values indicate net receivers. Highlighted regions were the top-ranked candidate SOZ regions in each band. (B, D, F, H) Corresponding candidate SOZ regions displayed as red spheres, with sphere size proportional to normalized net-flow magnitude, for the respective bands. Figure S9. Multiscale GC net-flow activities and brain maps across four frequency bands for Participant 10. Net flow (outflow minus inflow) is shown for 68 cortical ROIs in (A, C, E, G) 1–12 Hz, 13–30 Hz (beta), 30–45 Hz (gamma), and 55–95 Hz (high-gamma) bands, respectively. Positive values indicate net drivers, and negative values indicate net receivers. Highlighted regions were the top-ranked candidate SOZ regions in each band. (B, D, F, H) Corresponding candidate SOZ regions displayed as red spheres, with sphere size proportional to normalized net-flow magnitude, for the respective bands. Figure S10. Multiscale GC net-flow activities and brain maps across four frequency bands for Participant 11. Net flow (outflow minus inflow) is shown for 68 cortical ROIs in (A, C, E, G) 1–12 Hz, 13–30 Hz (beta), 30–45 Hz (gamma), and 55–95 Hz (high-gamma) bands, respectively. Positive values indicate net drivers, and negative values indicate net receivers. Highlighted regions were the top-ranked candidate SOZ regions in each band. (B, D, F, H) Corresponding candidate SOZ regions displayed as red spheres, with sphere size proportional to normalized net-flow magnitude, for the respective bands. Figure S11. Multiscale GC net-flow activities and brain maps across four frequency bands for Participant 12. Net flow (outflow minus inflow) is shown for 68 cortical ROIs in (A, C, E, G) 1–12 Hz, 13–30 Hz (beta), 30–45 Hz (gamma), and 55–95 Hz (high-gamma) bands, respectively. Positive values indicate net drivers, and negative values indicate net receivers. Highlighted regions were the top-ranked candidate SOZ regions in each band. (B, D, F, H) Corresponding candidate SOZ regions displayed as red spheres, with sphere size proportional to normalized net-flow magnitude, for the respective bands. Figure S12. Multiscale GC net-flow activities and brain maps across four frequency bands for Participant 13. Net flow (outflow minus inflow) is shown for 68 cortical ROIs in (A, C, E, G) 1–12 Hz, 13–30 Hz (beta), 30–45 Hz (gamma), and 55–95 Hz (high-gamma) bands, respectively. Positive values indicate net drivers, and negative values indicate net receivers. Highlighted regions were the top-ranked candidate SOZ regions in each band. (B, D, F, H) Corresponding candidate SOZ regions displayed as red spheres, with sphere size proportional to normalized net-flow magnitude, for the respective bands. Figure S13. Multiscale GC net-flow activities and brain maps across four frequency bands for Participant 14. Net flow (outflow minus inflow) is shown for 68 cortical ROIs in (A, C, E, G) 1–12 Hz, 13–30 Hz (beta), 30–45 Hz (gamma), and 55–95 Hz (high-gamma) bands, respectively. Positive values indicate net drivers, and negative values indicate net receivers. Highlighted regions were the top-ranked candidate SOZ regions in each band. (B, D, F, H) Corresponding candidate SOZ regions displayed as red spheres, with sphere size proportional to normalized net-flow magnitude, for the respective bands. Figure S14. Multiscale GC net-flow activities and brain maps across four frequency bands for Participant 15. Net flow (outflow minus inflow) is shown for 68 cortical ROIs in (A, C, E, G) 1–12 Hz, 13–30 Hz (beta), 30–45 Hz (gamma), and 55–95 Hz (high-gamma) bands, respectively. Positive values indicate net drivers, and negative values indicate net receivers. Highlighted regions were the top-ranked candidate SOZ regions in each band. (B, D, F, H) Corresponding candidate SOZ regions displayed as red spheres, with sphere size proportional to normalized net-flow magnitude, for the respective bands. Table S1: Sensitivity of beta-band concordance to the candidate-region threshold.
Author Contributions
S.K.: Conceptualization; methodology; clinical investigation; resources; data curation; writing—original draft; writing—review and editing; project administration; supervision. R.P.: Conceptualization; methodology; formal analysis; writing—original draft; writing—review and editing. G.L.: Conceptualization; methodology; clinical investigation; EEG data analysis; writing—review and editing. L.E.: Conceptualization; methodology; mathematical analysis; writing—review and editing. M.D.: Conceptualization; methodology; mathematical analysis; data analysis supervision; writing—original draft; writing—review and editing. All authors have read and agreed to the published version of the manuscript.
Funding
This study was supported by a Fundamental Scientific Grant from the Shota Rustaveli National Science Foundation of Georgia (Grant No. FR-23-18000) and by a grant from Caucasus International University (Grant No. FR-01/69-2019), Tbilisi, Georgia. S.K., G.L., and L.E. received research support from the Shota Rustaveli National Science Foundation of Georgia, and M.D. received financial support for travel and accommodation.
Institutional Review Board Statement
The project was approved by the Ethics Committee of the Institute of Neurology and Neuropsychology (INN-005/2023). The study was conducted in accordance with the principles of the World Medical Association Declaration of Helsinki.
Informed Consent Statement
Informed consent was obtained from all subjects involved in the study.
Data Availability Statement
The de-identified data and analysis code supporting the findings of this study are available from the corresponding author upon reasonable request, subject to institutional requirements and applicable patient-consent restrictions.
Acknowledgments
We gratefully acknowledge the individuals who participated in this study. We also thank the physicians and clinical neurophysiologists at the Institute of Neurology and Neuropsychology, Tbilisi, Georgia—Maia Alkhidze, Tamar Jishkariani, Giorgi Japaridze, Gvantsa Museridze, and Natia Todua—as well as neuropsychologist Tamar Gagoshidze of Tbilisi State University and Vladimer Tsikarishvili, neurosurgeon, from Caucasian Medical Centre (Tbilisi, Georgia) for their contributions and support. We give a special thanks to our Austrian colleagues Ekaterina Pataraia, epileptologist, and Christian Dorfer, neurosurgeon, for their active support in presurgical discussions and epilepsy surgery on the study participants.
Conflicts of Interest
The authors declare no conflict of interest. The authors confirm that they have read the Journal’s position on issues involved in ethical publication and affirm that this report is consistent with those guidelines.
References
- Kwan, P.; Arzimanoglou, A.; Berg, A.T. Definition of drug resistant epilepsy: Consensus proposal by the ad hoc Task Force of the ILAE Commission on Therapeutic Strategies. Epilepsia 2010, 51, 1069–1077. [Google Scholar] [CrossRef] [Scilit] [PubMed]
- Scheffer, I.E.; Berkovic, S.; Capovilla, G. ILAE classification of the epilepsies: Position paper of the ILAE Commission for Classification and Terminology. Epilepsia 2017, 58, 512–521. [Google Scholar] [CrossRef] [Scilit] [PubMed]
- Wiebe, S.; Blume, W.T.; Girvin, J.P.; Eliasziw, M. A randomized, controlled trial of surgery for temporal-lobe epilepsy. N. Engl. J. Med. 2001, 345, 311–318. [Google Scholar] [CrossRef] [Scilit] [PubMed]
- Engel, J., Jr.; McDermott, M.P.; Wiebe, S. Early surgical therapy for drug-resistant temporal lobe epilepsy: A randomized trial. JAMA 2012, 307, 922–930. [Google Scholar] [CrossRef] [Scilit] [PubMed]
- Jehi, L.; Jette, N.; Kwon, C.S. Timing of referral to evaluate for epilepsy surgery: Expert Consensus Recommendations from the Surgical Therapies Commission of the International League Against Epilepsy. Epilepsia 2022, 63, 2491–2506. [Google Scholar] [CrossRef] [Scilit] [PubMed]
- de Tisi, J.; Bell, G.S.; Peacock, J.L. The long-term outcome of adult epilepsy surgery, patterns of seizure remission, and relapse: A cohort study. Lancet 2011, 378, 1388–1395. [Google Scholar] [CrossRef] [Scilit] [PubMed]
- Trinka, E.; Koepp, M.; Kalss, G.; Kobulashvili, T. Evidence based noninvasive presurgical evaluation for patients with drug resistant epilepsies. Curr. Opin. Neurol. 2024, 37, 141–151. [Google Scholar] [CrossRef] [Scilit] [PubMed]
- Spencer, S.S. Neural networks in human epilepsy: Evidence of and implications for treatment. Epilepsia 2002, 43, 219–227. [Google Scholar] [CrossRef] [Scilit] [PubMed]
- Singh, J.; Ebersole, J.S.; Brinkmann, B.H. From theory to practical fundamentals of electroencephalographic source imaging in localizing the epileptogenic zone. Epilepsia 2022, 63, 2476–2490. [Google Scholar] [CrossRef] [Scilit] [PubMed]
- Michel, C.M.; Brunet, D. EEG source imaging: A practical review of the analysis steps. Front. Neurol. 2019, 10, 325. [Google Scholar] [CrossRef] [Scilit] [PubMed]
- Michel, C.M.; Murray, M.M.; Lantz, G.; Gonzalez, S.; Spinelli, L.; Grave de Peralta, R. EEG source imaging. Clin. Neurophysiol. 2004, 115, 2195–2222. [Google Scholar] [CrossRef] [Scilit] [PubMed]
- Cox, B.C.; Danoun, O.A.; Lundstrom, B.N. EEG source imaging concordance with intracranial EEG and epileptologist review in focal epilepsy. Brain Commun. 2021, 3, fcab278. [Google Scholar] [CrossRef] [Scilit] [PubMed]
- Ricci, L.; Tamilia, E.; Alhilani, M. Source imaging of seizure onset predicts surgical outcome in pediatric epilepsy. Clin. Neurophysiol. 2021, 132, 1622–1635. [Google Scholar] [CrossRef] [Scilit] [PubMed]
- Corona, L.; Tamilia, E.; Perry, M.S. Non-invasive mapping of epileptogenic networks predicts surgical outcome. Brain 2023, 146, 1916–1931. [Google Scholar] [CrossRef] [Scilit] [PubMed]
- Matarrese, M.A.G.; Loppini, A.; Fabbri, L. Spike propagation mapping reveals effective connectivity and predicts surgical outcome in epilepsy. Brain 2023, 146, 3898–3912. [Google Scholar] [CrossRef] [Scilit] [PubMed]
- Sun, R.; Sohrabpour, A.; Joseph, B. Seizure sources can be imaged from scalp EEG by means of biophysically constrained deep neural networks. Adv. Sci. 2024, 11, e2405246. [Google Scholar] [CrossRef] [Scilit] [PubMed]
- Hyppönen, J.; Eronen, H.; Saarela, A. Clinical utility of semi-automated EEG electric source imaging of interictal discharges in presurgical evaluation and surgical treatment decision making. Front. Neurol. 2025, 16, 1598265. [Google Scholar] [CrossRef] [Scilit] [PubMed]
- Katlowitz, K.; Allam, A.; Laxpati, N. Predictive power of phase 1 studies for the identification of seizure onset zone in phase 2 in a pediatric epilepsy cohort. Epilepsia 2025, 66, 4667–4679. [Google Scholar] [CrossRef] [Scilit] [PubMed]
- Bartolomei, F.; Lagarde, S.; Wendling, F. Defining epileptogenic networks: Contribution of SEEG and signal analysis. Epilepsia 2017, 58, 1131–1147. [Google Scholar] [CrossRef] [Scilit] [PubMed]
- Bartolomei, F.; Chauvel, P.; Wendling, F. Epileptogenicity of brain structures in human temporal lobe epilepsy: A quantified study from intracerebral EEG. Brain 2008, 131, 1818–1830. [Google Scholar] [CrossRef] [Scilit] [PubMed]
- Almeida, J.; Cunha, J.P.S. Functional and effective connectivity methods from SEEG for characterizing epileptogenic networks in refractory epilepsy: A comprehensive review and future directions. J. Neural Eng. 2026, 23, 041001. [Google Scholar] [CrossRef] [Scilit] [PubMed]
- Ghimire, S.; Dhamala, M.; Epstein, C.M. A stable EEG epilepsy network spans from infraslow to ripple and from interictal to ictus. J. Clin. Neurophysiol. 2024, 41, 251–256. [Google Scholar] [CrossRef] [Scilit] [PubMed]
- Adhikari, B.M.; Epstein, C.M.; Dhamala, M. Localizing epileptic seizure onsets with Granger causality. Phys. Rev. E 2013, 88, 030701. [Google Scholar] [CrossRef] [Scilit] [PubMed]
- Epstein, C.M.; Adhikari, B.M.; Gross, R.; Willie, J.; Dhamala, M. Application of high-frequency Granger causality to analysis of epileptic seizures and surgical decision making. Epilepsia 2014, 55, 2038–2047. [Google Scholar] [CrossRef] [Scilit] [PubMed]
- van Mierlo, P.; Papadopoulou, M.; Carrette, E. Functional brain connectivity from EEG in epilepsy: Seizure prediction and epileptogenic focus localization. Prog. Neurobiol. 2014, 121, 19–35. [Google Scholar] [CrossRef] [Scilit] [PubMed]
- Coito, A.; Genetti, M.; Pittau, F. Altered directed functional connectivity in temporal lobe epilepsy in the absence of interictal spikes: A high density EEG study. Epilepsia 2016, 57, 402–411. [Google Scholar] [CrossRef] [Scilit] [PubMed]
- Coito, A.; Michel, C.M.; van Mierlo, P.; Vulliemoz, S.; Plomp, G. Directed functional brain connectivity based on EEG source imaging: Methodology and application to temporal lobe epilepsy. IEEE Trans. Biomed. Eng. 2016, 63, 2619–2628. [Google Scholar] [CrossRef] [Scilit] [PubMed]
- Staljanssens, W.; Strobbe, G.; Van Holen, R. EEG source connectivity to localize the seizure onset zone in patients with drug resistant epilepsy. NeuroImage Clin. 2017, 16, 689–698. [Google Scholar] [CrossRef] [Scilit] [PubMed]
- Sohrabpour, A.; Ye, S.; Worrell, G.A. Noninvasive electromagnetic source imaging and Granger causality analysis: An electrophysiological connectome (eConnectome) approach. IEEE Trans. Biomed. Eng. 2016, 63, 2474–2487. [Google Scholar] [CrossRef] [Scilit] [PubMed]
- Nahvi, M.; Ardeshir, G.; Ezoji, M. An application of dynamical directed connectivity of ictal intracranial EEG recordings in seizure onset zone localization. J. Neurosci. Methods 2023, 386, 109775. [Google Scholar] [CrossRef] [Scilit] [PubMed]
- Jahani, A.; Begin, C.; Toffa, D.H.; Obaid, S.; Nguyen, D.K.K.; Bou Assi, E. Preictal connectivity dynamics: Exploring inflow and outflow in iEEG networks. Front. Netw. Physiol. 2025, 5, 1539682. [Google Scholar] [CrossRef] [Scilit] [PubMed]
- Kasradze, S.; Lomidze, G.; Ephremidze, L.; Gagoshidze, T.; Japaridze, G.; Alkhidze, M.; Jishkariani, T.; Dhamala, M. Noninvasive Seizure Onset Zone Localization Using Janashia–Lagvilava Algorithm-Based Spectral Factorization in Granger Causality. Brain Sci. 2025, 15, 1334. [Google Scholar] [CrossRef] [Scilit] [PubMed]
- Granger, C.W.J. Investigating causal relations by econometric models and cross-spectral methods. Econometrica 1969, 37, 424–438. [Google Scholar] [CrossRef] [Scilit]
- Geweke, J. Measurement of linear dependence and feedback between multiple time series. J. Am. Stat. Assoc. 1982, 77, 304–313. [Google Scholar] [CrossRef]
- Dhamala, M.; Rangarajan, G.; Ding, M. Analyzing information flow in brain networks with nonparametric Granger causality. NeuroImage 2008, 41, 354–362. [Google Scholar] [CrossRef] [Scilit] [PubMed]
- Ho, T.K.K.; Lai, T.; Klimes, P. Foundation models for epileptogenic zone identification in drug-resistant epilepsy. arXiv 2026, arXiv:2606.22657. [Google Scholar] [CrossRef] [Scilit]
- Engel, J., Jr.; Van Ness, P.C.; Rasmussen, T.B.; Ojemann, L.M. Outcome with respect to epileptic seizures. In Surgical Treatment of the Epilepsies, 2nd ed.; Engel, J., Jr., Ed.; Raven Press: New York, NY, USA, 1993; pp. 609–621. [Google Scholar]
- Beniczky, S.; Trinka, E.; Wirrell, E.; Abdulla, F.; Al Baradie, R.; Alonso Vanegas, M.; Auvin, S.; Singh, M.B.; Blumenfeld, H.; Bogacz Fressola, A.; et al. Updated classification of epileptic seizures: Position paper of the International League Against Epilepsy. Epilepsia 2025, 66, 1804–1823. [Google Scholar] [CrossRef] [Scilit] [PubMed]
- Wang, I.; Bernasconi, A.; Bernhardt, B.; Blumenfeld, H.; Cendes, F.; Chinvarun, Y.; Jackson, G.; Morgan, V.; Rampp, S.; Vaudano, A.E.; et al. MRI essentials in epileptology: A review from the ILAE Imaging Taskforce. Epileptic Disord. 2020, 22, 421–437. [Google Scholar] [CrossRef] [Scilit] [PubMed]
- Kane, N.; Acharya, J.; Benickzy, S.; Caboclo, L.; Finnigan, S.; Kaplan, P.W.; Shibasaki, H.; Pressler, R.; van Putten, M. A revised glossary of terms most commonly used by clinical electroencephalographers and updated proposal for the report format of the EEG findings. Revision 2017. Clin. Neurophysiol. Pract. 2017, 2, 170–185, Correction in Clin. Neurophysiol. Pract. 2017, 4, 133. https://doi.org/10.1016/j.cnp.2019.06.001. [Google Scholar] [CrossRef] [Scilit] [PubMed]
- Delorme, A.; Makeig, S. EEGLAB: An open source toolbox for analysis of single-trial EEG dynamics including independent component analysis. J. Neurosci. Methods. 2004, 134, 9–21. [Google Scholar] [CrossRef] [Scilit] [PubMed]
- Tadel, F.; Baillet, S.; Mosher, J.C.; Pantazis, D.; Leahy, R.M. Brainstorm: A user-friendly application for MEG/EEG analysis. Comput. Intell. Neurosci. 2011, 2011, 879716. [Google Scholar] [CrossRef] [Scilit] [PubMed]
- Pascual-Marqui, R.D. Standardized low-resolution brain electromagnetic tomography (sLORETA): Technical details. Methods Find. Exp. Clin. Pharmacol. 2002, 24, 5–12. [Google Scholar] [PubMed]
- Gramfort, A.; Papadopoulo, T.; Olivi, E.; Clerc, M. OpenMEEG: Opensource software for quasistatic bioelectromagnetics. Biomed. Eng. OnLine 2010, 9, 45. [Google Scholar] [CrossRef] [Scilit] [PubMed]
- Desikan, R.S.; Ségonne, F.; Fischl, B. An automated labeling system for subdividing the human cerebral cortex on MRI scans into gyral-based regions of interest. NeuroImage 2006, 31, 968–980. [Google Scholar] [CrossRef] [Scilit] [PubMed]
- Seth, A.K.; Barrett, A.B.; Barnett, L. Granger causality analysis in neuroscience and neuroimaging. J. Neurosci. 2015, 35, 3293–3297. [Google Scholar] [CrossRef] [Scilit] [PubMed]
- Baccalá, L.A.; Sameshima, K. Partial directed coherence: A new concept in neural structure determination. Biol. Cybern. 2001, 84, 463–474. [Google Scholar] [CrossRef] [Scilit] [PubMed]
- Kemp, A.W. Univariate Discrete Distributions: Overview. In International Encyclopedia of Statistical Science; Lovric, M., Ed.; Springer: Berlin/Heidelberg, Germany, 2025; pp. 2841–2847. [Google Scholar]
- Clopper, C.J.; Pearson, E.S. The use of confidence or fiducial limits illustrated in the case of the binomial. Biometrika 1934, 26, 404–413. [Google Scholar] [CrossRef]
- Staljanssens, W.; Strobbe, G.; Van Holen, R. Seizure onset zone localization from ictal high-density EEG in refractory focal epilepsy. Brain Topogr. 2017, 30, 257–271. [Google Scholar] [CrossRef] [Scilit] [PubMed]
- Donoghue, T.; Haller, M.; Peterson, E.J. Parameterizing neural power spectra into periodic and aperiodic components. Nat. Neurosci. 2020, 23, 1655–1665. [Google Scholar] [CrossRef] [Scilit] [PubMed]
- Perucca, P.; Dubeau, F.; Gotman, J. Intracranial electroencephalographic seizure-onset patterns: Effect of underlying pathology. Brain 2014, 137, 183–196. [Google Scholar] [CrossRef] [Scilit] [PubMed]
- Grinenko, O.; Li, J.; Mosher, J.C. A fingerprint of the epileptogenic zone in human epilepsies. Brain 2018, 141, 117–131. [Google Scholar] [CrossRef] [Scilit] [PubMed]
- Singh, S.; Sandy, S.; Wiebe, S. Ictal onset on intracranial EEG: Do we know it when we see it? State of the evidence. Epilepsia 2015, 56, 1629–1638. [Google Scholar] [CrossRef] [Scilit] [PubMed]

Disclaimer/Publisher’s Note: The statements, opinions and data contained in all publications are solely those of the individual author(s) and contributor(s) and not of MDPI and/or the editor(s). MDPI and/or the editor(s) disclaim responsibility for any injury to people or property resulting from any ideas, methods, instructions or products referred to in the content. |
© 2026 by the authors. Licensee MDPI, Basel, Switzerland. This article is an open access article distributed under the terms and conditions of the Creative Commons Attribution (CC BY) license.