


Abstract
We proposed heterodyne angle deviation interferometry (HADI) for angle deviation measurements. The phase shift of an angular sensor (which can be a metal film or a surface plasmon resonance (SPR) prism) is proportional to the deviation angle of the test beam. The method has been demonstrated in bubble and speaker’s vibration measurements in this paper. In the speaker’s vibration measurement, the voltage from the phase channel of a lock-in amplifier includes the vibration level and frequency. In bubble measurement, we can count the number of bubbles passing through the cross section of the laser beam and measure the bubble size from the phase pulse signal.
1. Introduction
Heterodyne Interferometry has some merits, such as high accuracy, high stability, and real-time measurement for many optical measurement applications. It is the most popular non-contact measurement technology for interferometry [1,2,3,4,5,6,7,8]. However, most structures of heterodyne interferometers are not common-path configuration. Therefore, if high measurement stability needs to be maintained, the interferometer needs to be set up in a special laboratory with environmental controls to relieve all environmental interferences. If the interferometer is absolute in common-path configuration, it cannot measure anything except the extra phase shift between two polarizations in the optical path due to the birefringence or complex refractive index of the sample. To achieve the best resolution, we proposed Heterodyne Angle Deviation Interferometry (HADI) to measure the deviation angle in order to obtain some physical parameters in general fields. We used two AOM (acousto-optic modulation) devices and a laser to become the heterodyne light source and used the technique of the common-path heterodyne interferometry (CPHI) to measure the phase shift of an angular sensor for displacement measurement [9]. The angular sensor can be a pair of parallel metallic plane mirrors or a surface plasmon resonance (SPR) prism. When the test beam is reflected from the sample and then incident into the angular sensor, the phase shift of the angular sensor due to angle deviation can be represented as some parameters that we want to achieve. For example, the frequency of small vibrations can be led into the optical interference signal in the frequency domain. We could utilize a lock-in amplifier to compare the test signal with the reference signal of the same frequency to achieve the phase signal during the vibration measurement. The frequency and amplitude of the phase signal represent the frequency and amplitude of the vibration. The vibration level can be assessed from the Fourier frequency transformation. In this paper, we performed two experiments to demonstrate the proposed method; one is the vibration measurement, and the other is the water flow test. The phase resolution is 0.01. For the vibration measurement, the vibration frequency range is within 500 Hz for the beat frequency of 10 kHz. For the water flow measurement, the minimum bubble size is 0.2 mm and the maximum speed of water flow is about 0.6 m/s. The method has some merits, such as accuracy, anti-influence, simple structure, easy operation, and real-time measurement.
2. Materials and Methods
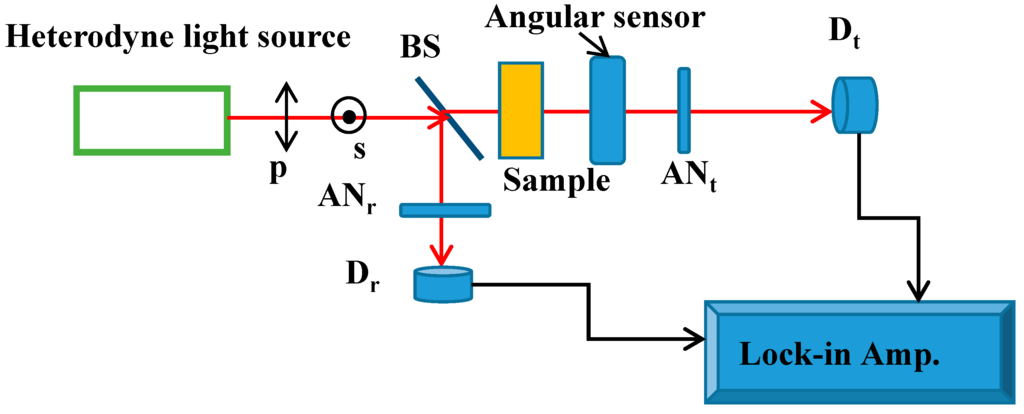
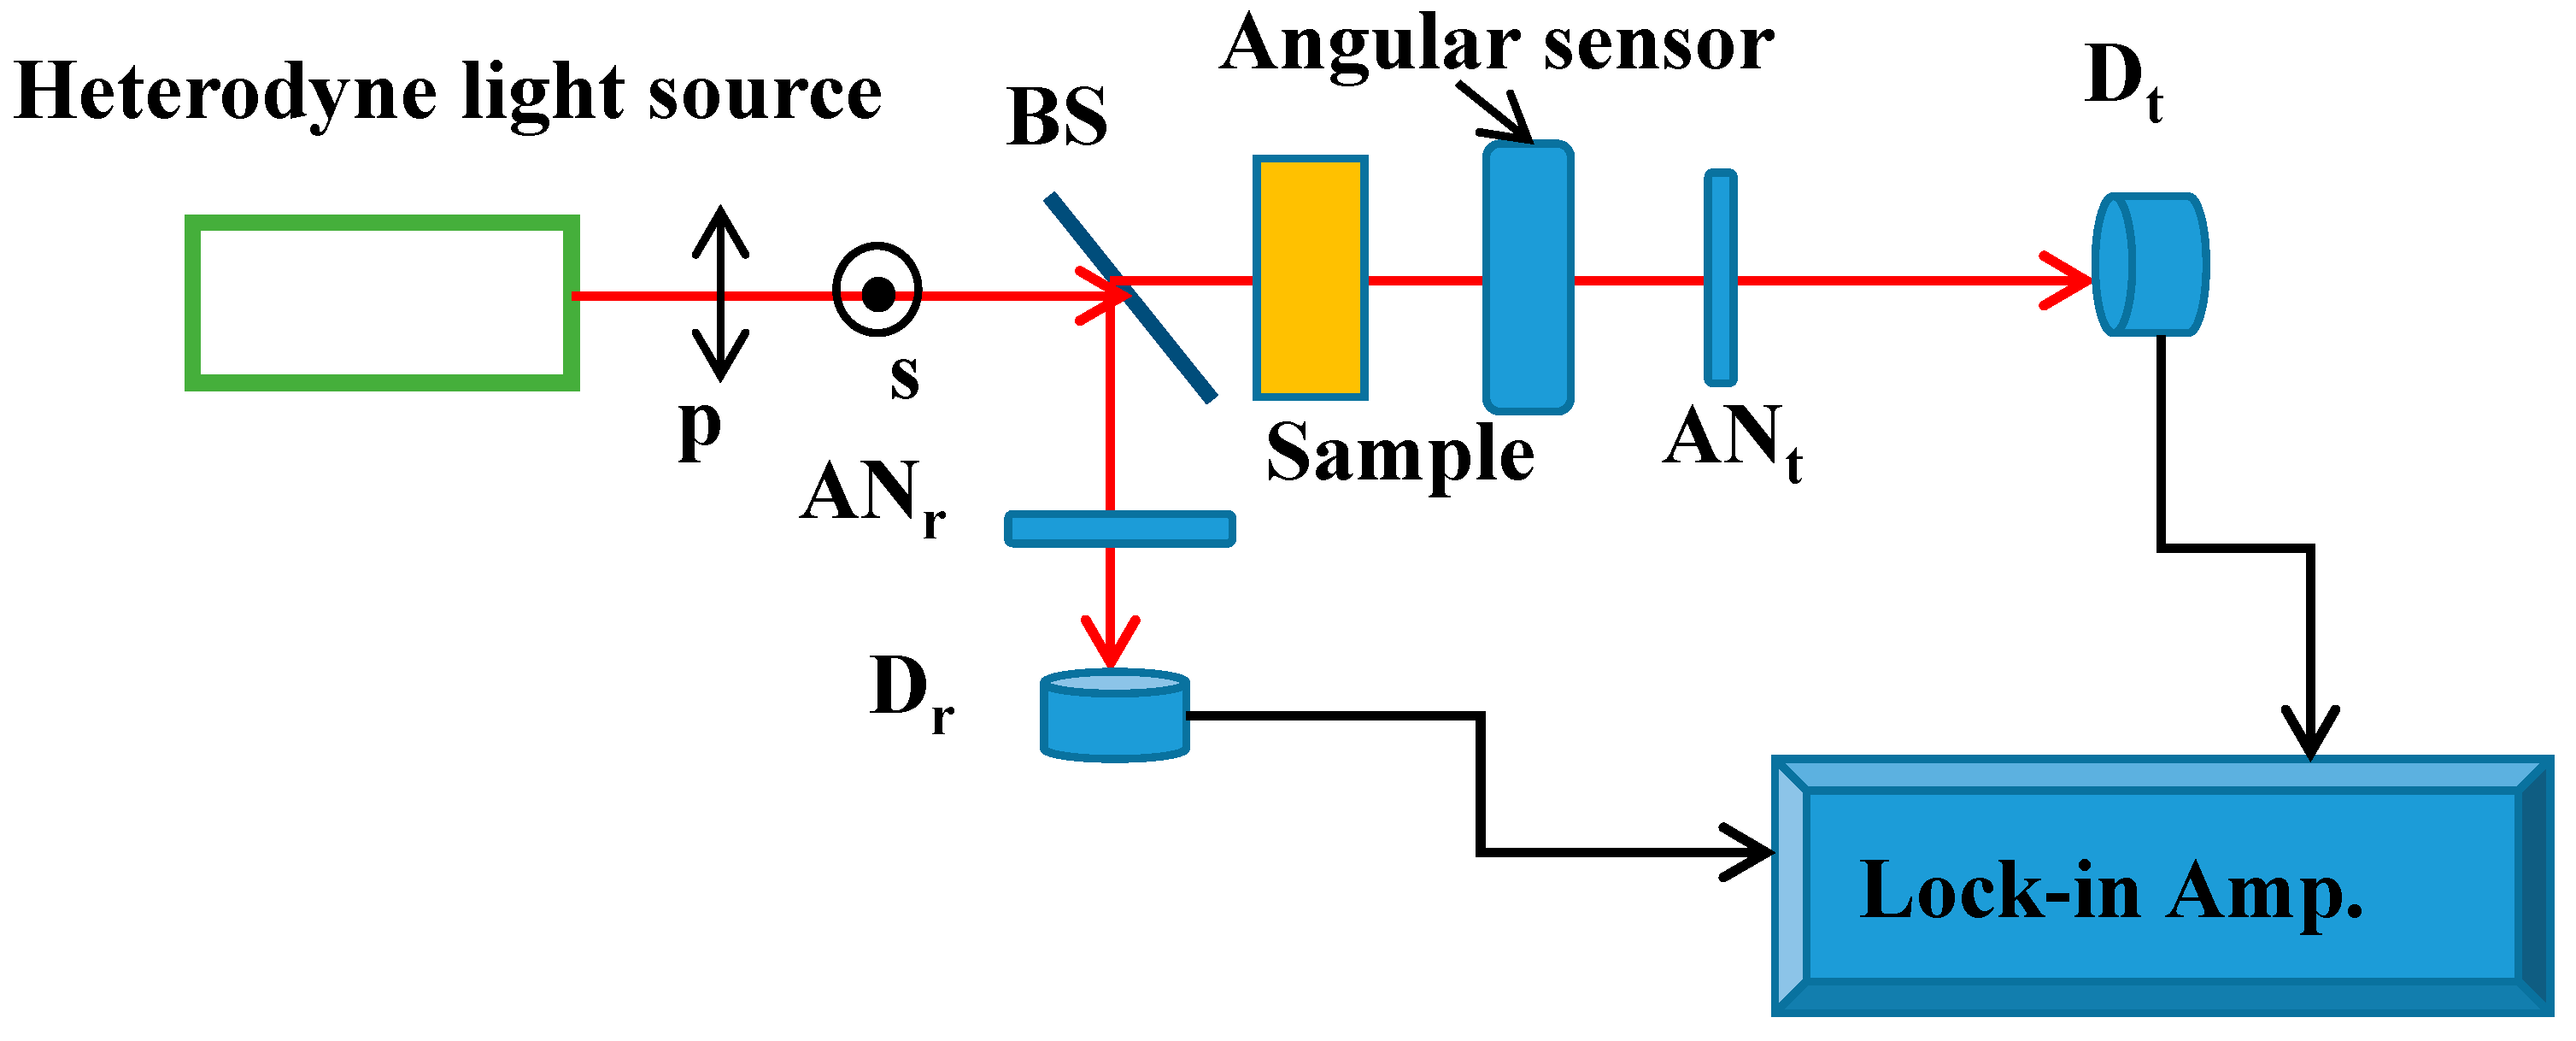
We use the common-path heterodyne interferometry (CPHI) to implement angle deviation measurements in order to obtain some parameters; for example, vibration frequency, the speed of water flow, and the bubble size, etc. The heterodyne light, with two orthogonal polarizations and a beat frequency, is produced by a laser and a two-frequency modulation system. The laser is divided into two polarizations and modulated with different frequencies by using two acousto-optic modulators (Intra Action Corp., Bellwood, IL, USA) (AOMs) and then combining these two beams to let them coincide with each other. Thus, these two polarizations with a beat frequency on the same path are in real anti-interference of the environment. The heterodyne light can be utilized to measure some parameters in the general environment. The base Heterodyne Angle Deviation Interferometry (HADI) [9] is shown in Figure 1. The frequencies of the s- and p-polarizations are f1 and f2, respectively. Thus, the beat frequency is . The reference signal from the analyzer ANr and photodetector Dr is given as and the test signal from the sample, angular sensor, analyzer ANt, and the other photodetector Dt, is given as where and are the DC bias voltages and and are the visibilities of and , respectively. The phase is only the phase shift of the angular sensor if the sample has no induced phase shift. Comparing these two signals by using a lock-in amplifier, the phase signal from the output of phase channel of the lock-in amplifier can be achieved, and it represents the variation of the sample in real-time.
Figure 1.
The base configuration of Heterodyne Angle Deviation Interferometry (HADI). ANr: reference signal from analyzer; ANt: test signal from analyzer; BS: beam splitter; Dr: detector.
Some angular sensors with high phase sensitivity can be used in the HADI; for example, the SPR sensor (self-made). The angle deviation of the test beam will induce a large phase shift when the beam passes through the SPR sensor at the resonant angle.
3. Experimental Results
We performed two experiments to demonstrate the proposed method. The vibration and bubble measurements are described below.
3.1. Vibration Measurement
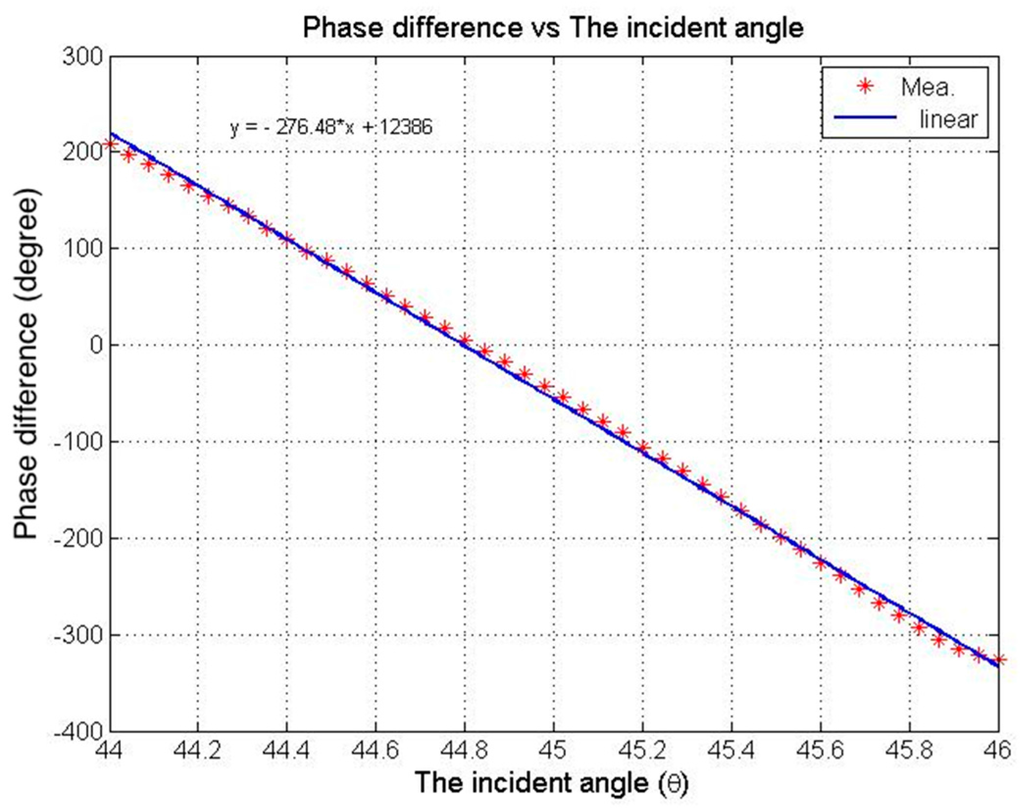
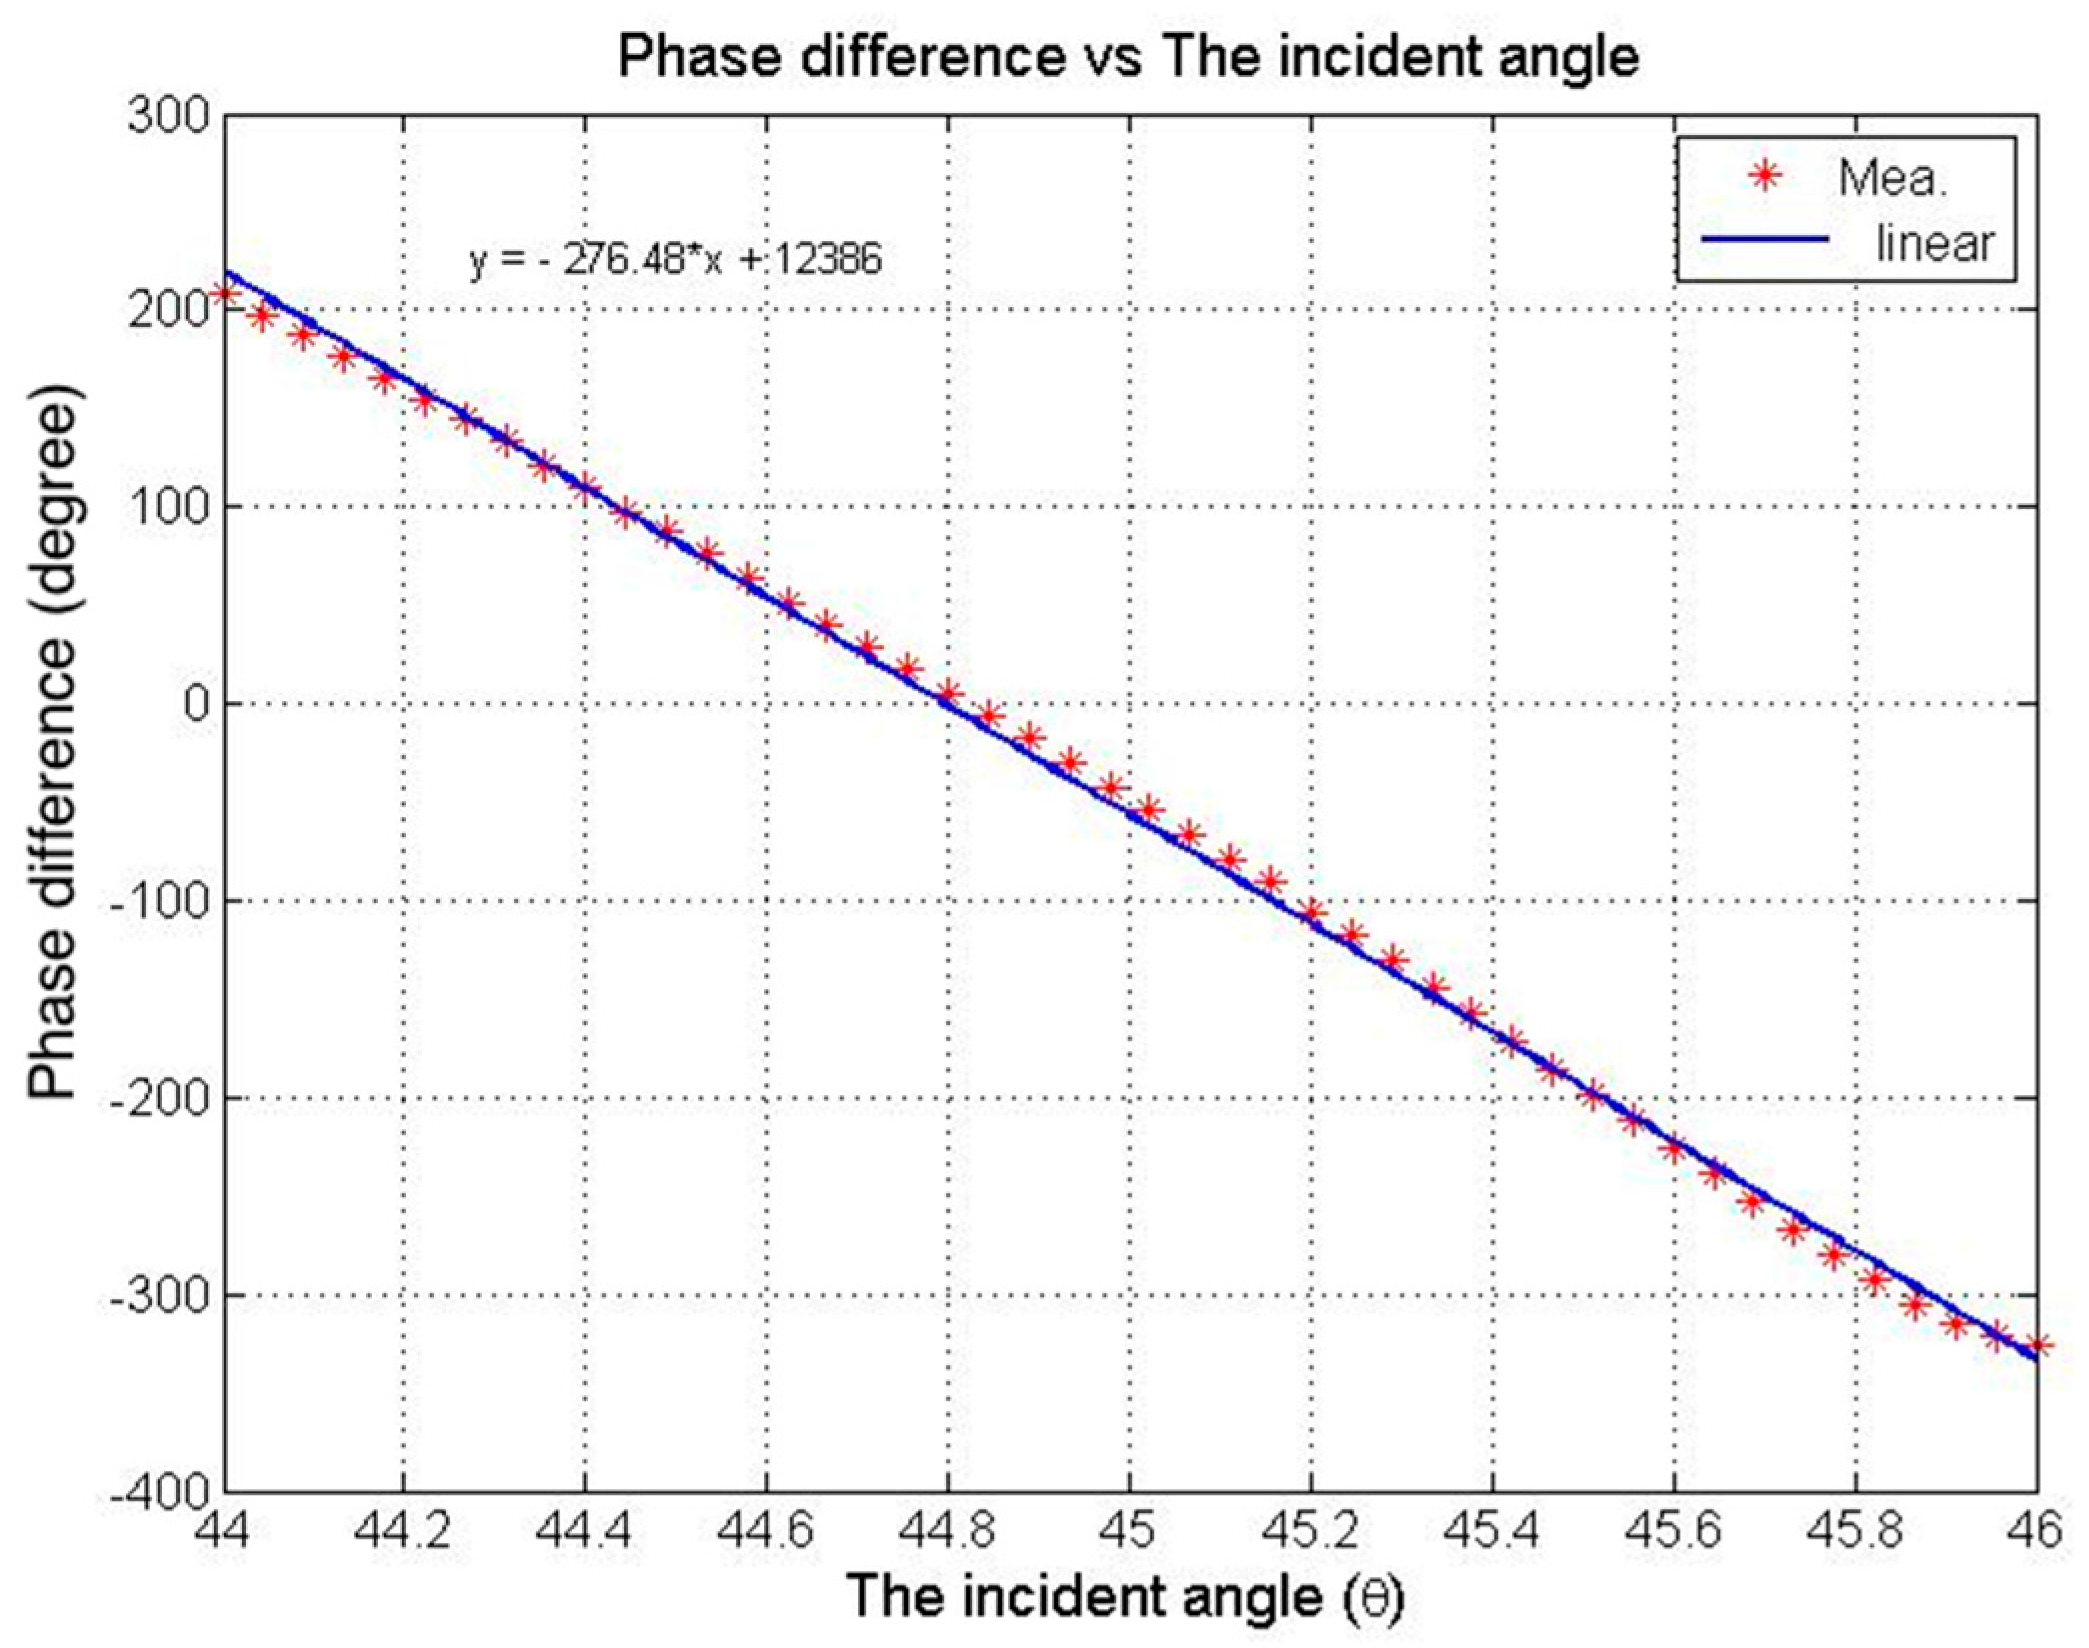
In order to obtain better sensitivity and larger phase variation, we design a face-to-face parallel metallic plane mirror pair as an angular sensor [9] and let the test light pass through it with twelve reflections for the purpose of magnifying the phase shift. The test light from a heterodyne light source has a beat frequency of 10 kHz (). The test light is reflected from a mirror which is stuck on a speaker, and then is incident into the angular sensor. The speaker is modulated by a sine wave generator with a specific frequency. The test signal is obtained by using an analyzer with a transmission axis of 45° to extract the partial components of the s- and p-polarizations on the axis and to obtain the interference signal detected by a photodetector (New Focus, Model 2051, Santa Clara, CA, USA). The signal is compared with the reference signal of the same frequency by a lock-in amplifier to achieve the phase difference between them. The change of deviation angle of the test beam (the change of incident angle of the mirror pair) is proportional to the phase shift of the test signal. These measurement results are shown in Figure 2, where the symbol “*“ represents the measurement result and the sold line represents the fitting result. The function of the fitting line is given as (degree). The linear slope is about −276.48 (degree/degree) for twelve times of reflection. From this curve, we could calculate the angle deviation of the light by using the phase curve.
Figure 2.
The phase shift characteristics curve of a parallel metallic plane mirror pair versus the incident angle in twelve reflections.
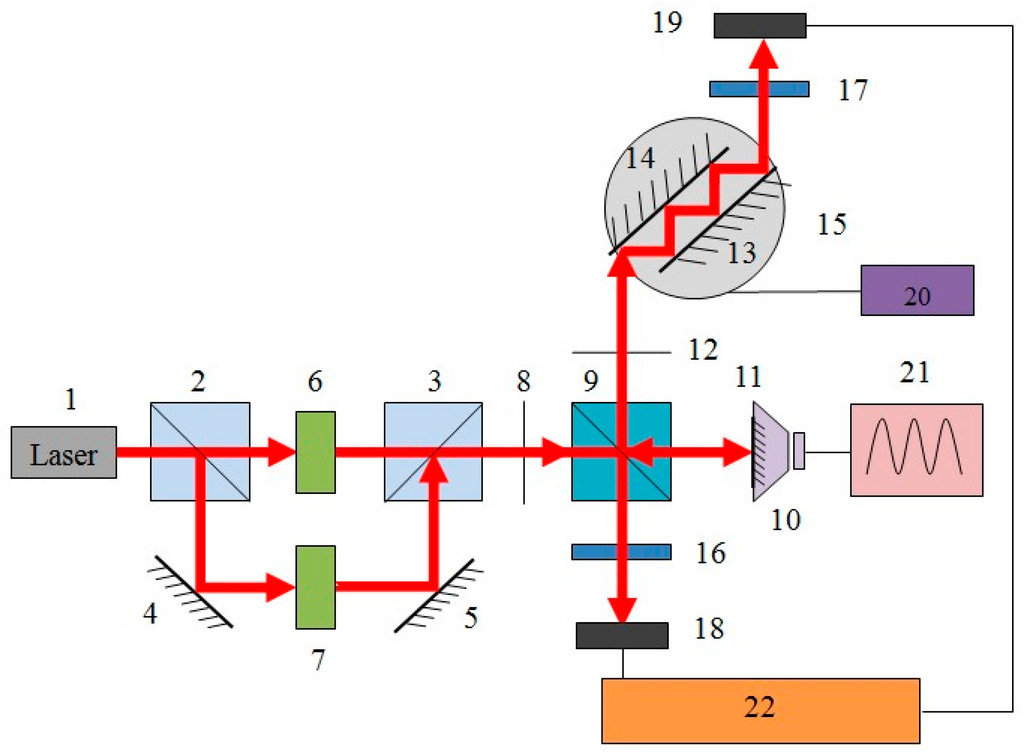
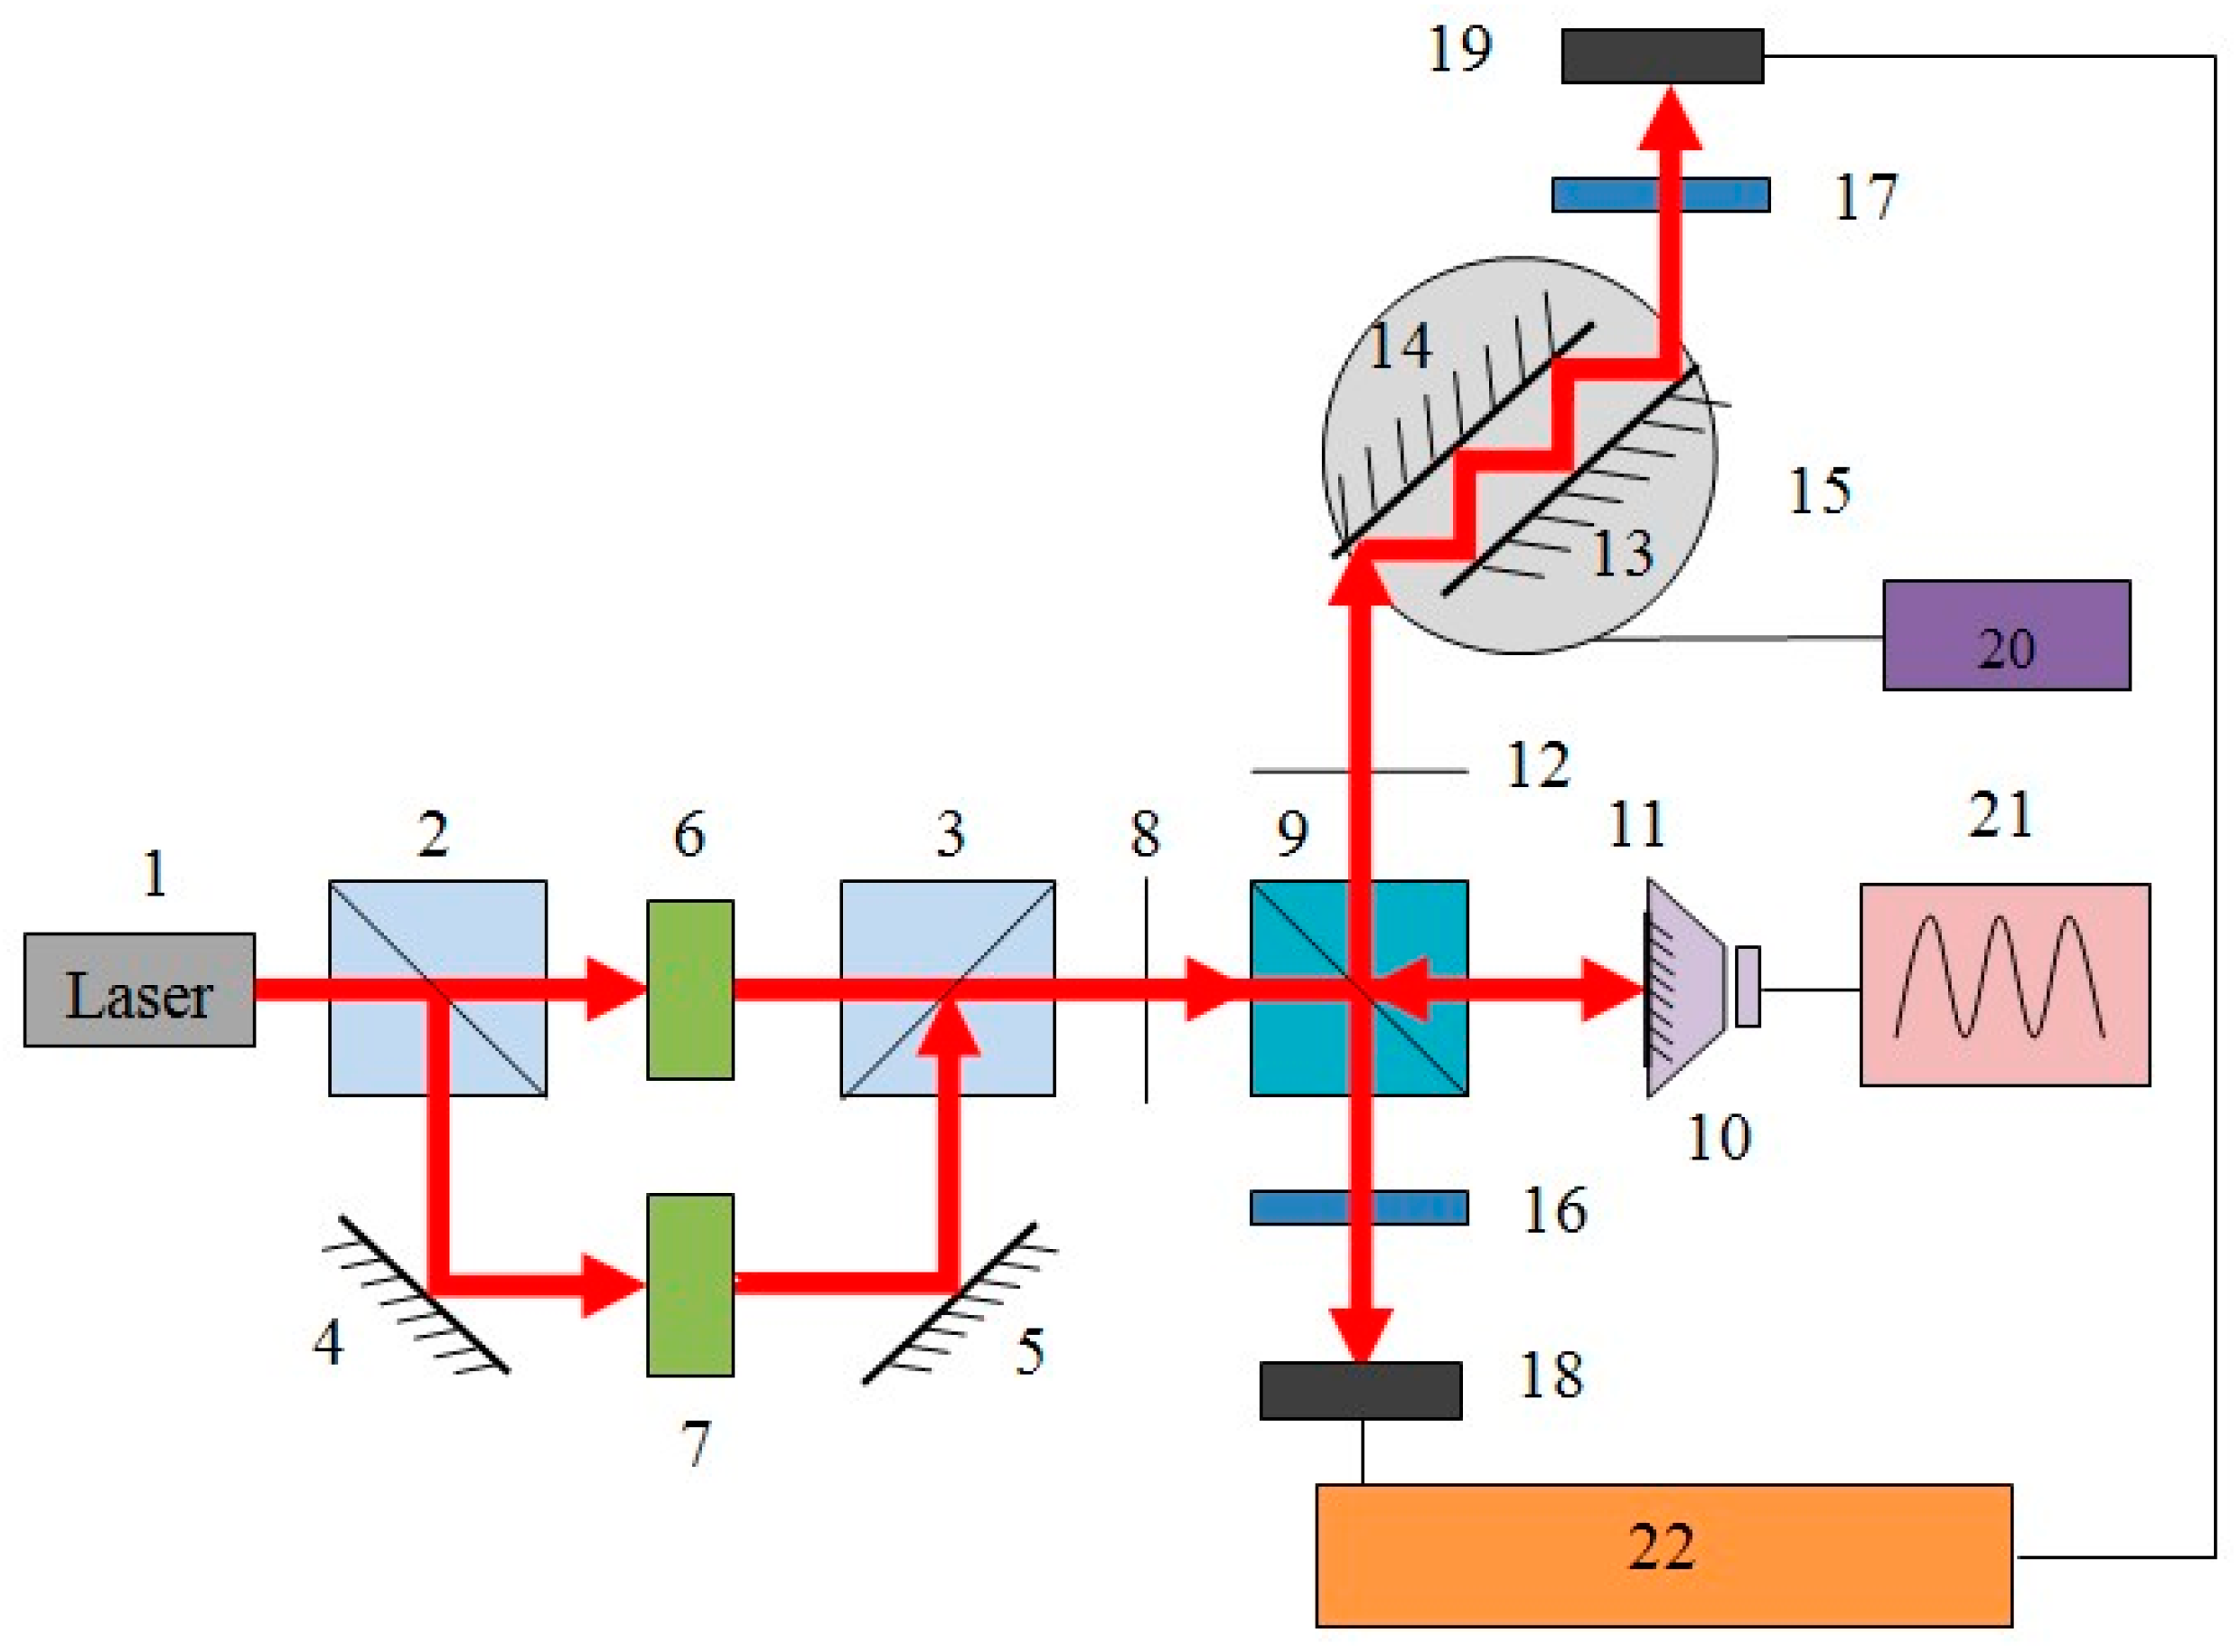
The experimental setup of the speaker’s vibration measurement is shown in Figure 3. A heterodyne light source is combined with a laser (1), two polarized beam-splitters (2 and 3), two mirrors (4 and 5), and two acousto-optic modulators (AOM) (6, 7). The modulated frequencies of the AOMs (6) and (7) are 80.00 MHz and 80.01 MHz, respectively. Thus, the beat frequency is 10 kHz.
Figure 3.
Experimental setup of speaker’s vibration measurement. 1: Laser; 2 and 3: Polarization beam splitters (PBS); 4, 5 and 11: Mirrors; 6 and 7: acousto-optic modulators (AOMs); 8 and 12: Irises; 9: Beam splitter (BS); 10: Speaker; 13 and 14: Mirrors; 15: Rotation stage; 16 and 17: Analyzers; 18 and 19: Photodetectors; 20: Controller; 21: Function generator; 22: Lock-in amplifier.
From Figure 3, a He-Ne Laser (1) with a wavelength of 632.8 nm is split into two beams by a polarization beam splitter (PBS) (2). Thus, the polarizations of the two beams are orthogonal to each others and the beams then passes through two AOMs (6 and 7), respectively. The selected outgoing lights are both diffraction lights of the first order. Adjusting mirrors (4 and 5) is used to make them coincide and another PBS (3) is used to exactly combine two orthogonal polarized lights on the same path. The iris (8) shelters the zero order and the other order of lights to prevent them from going through the optical system.
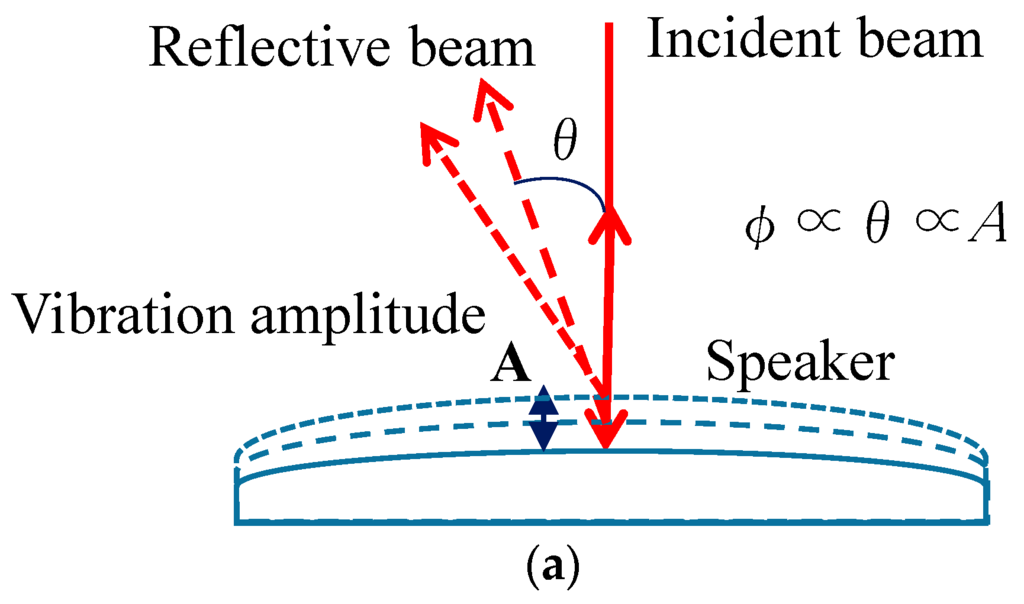
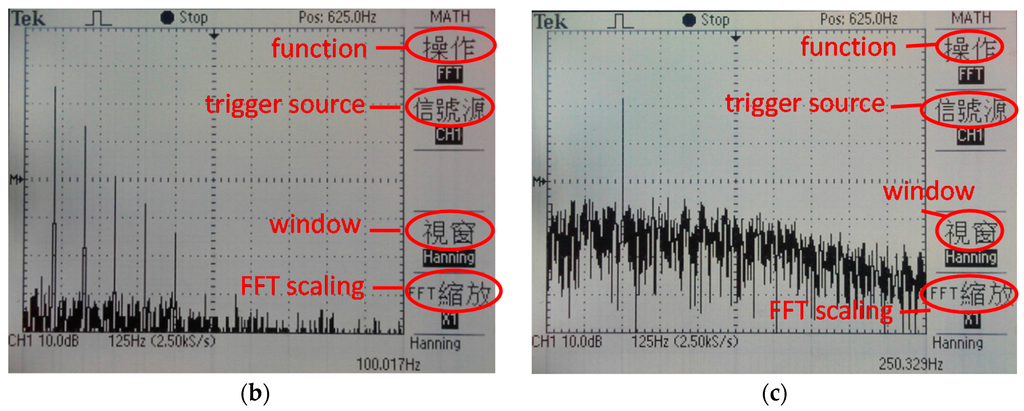
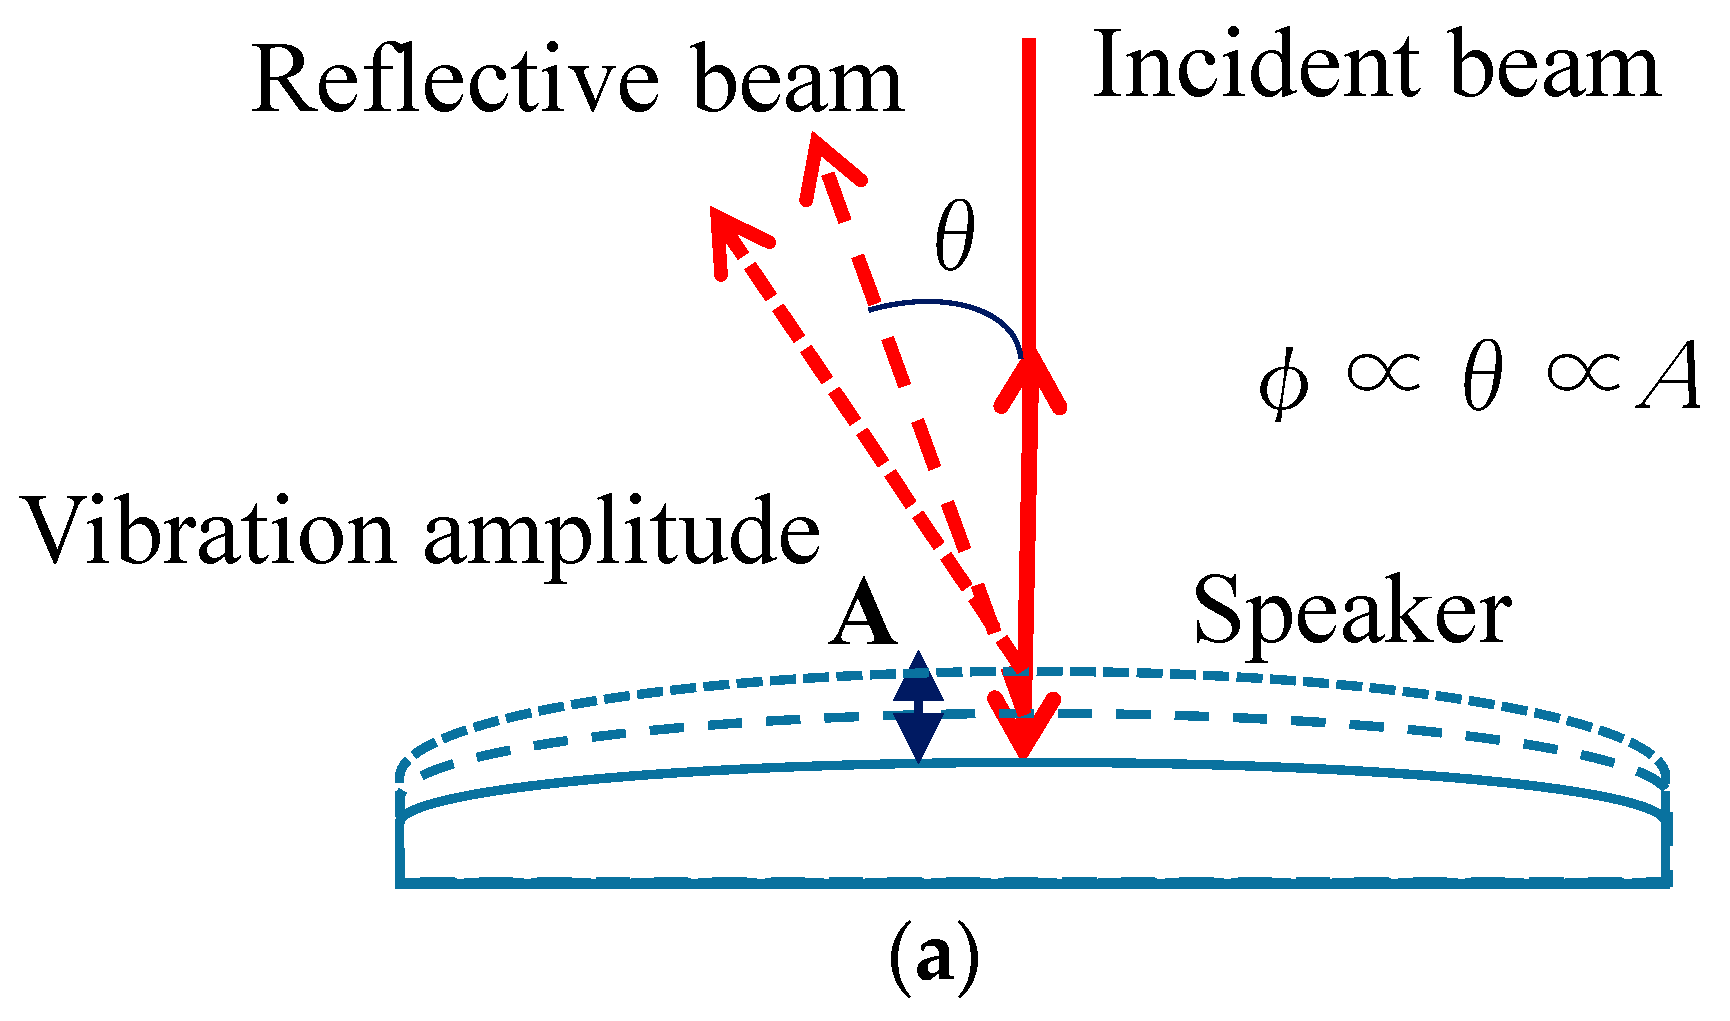
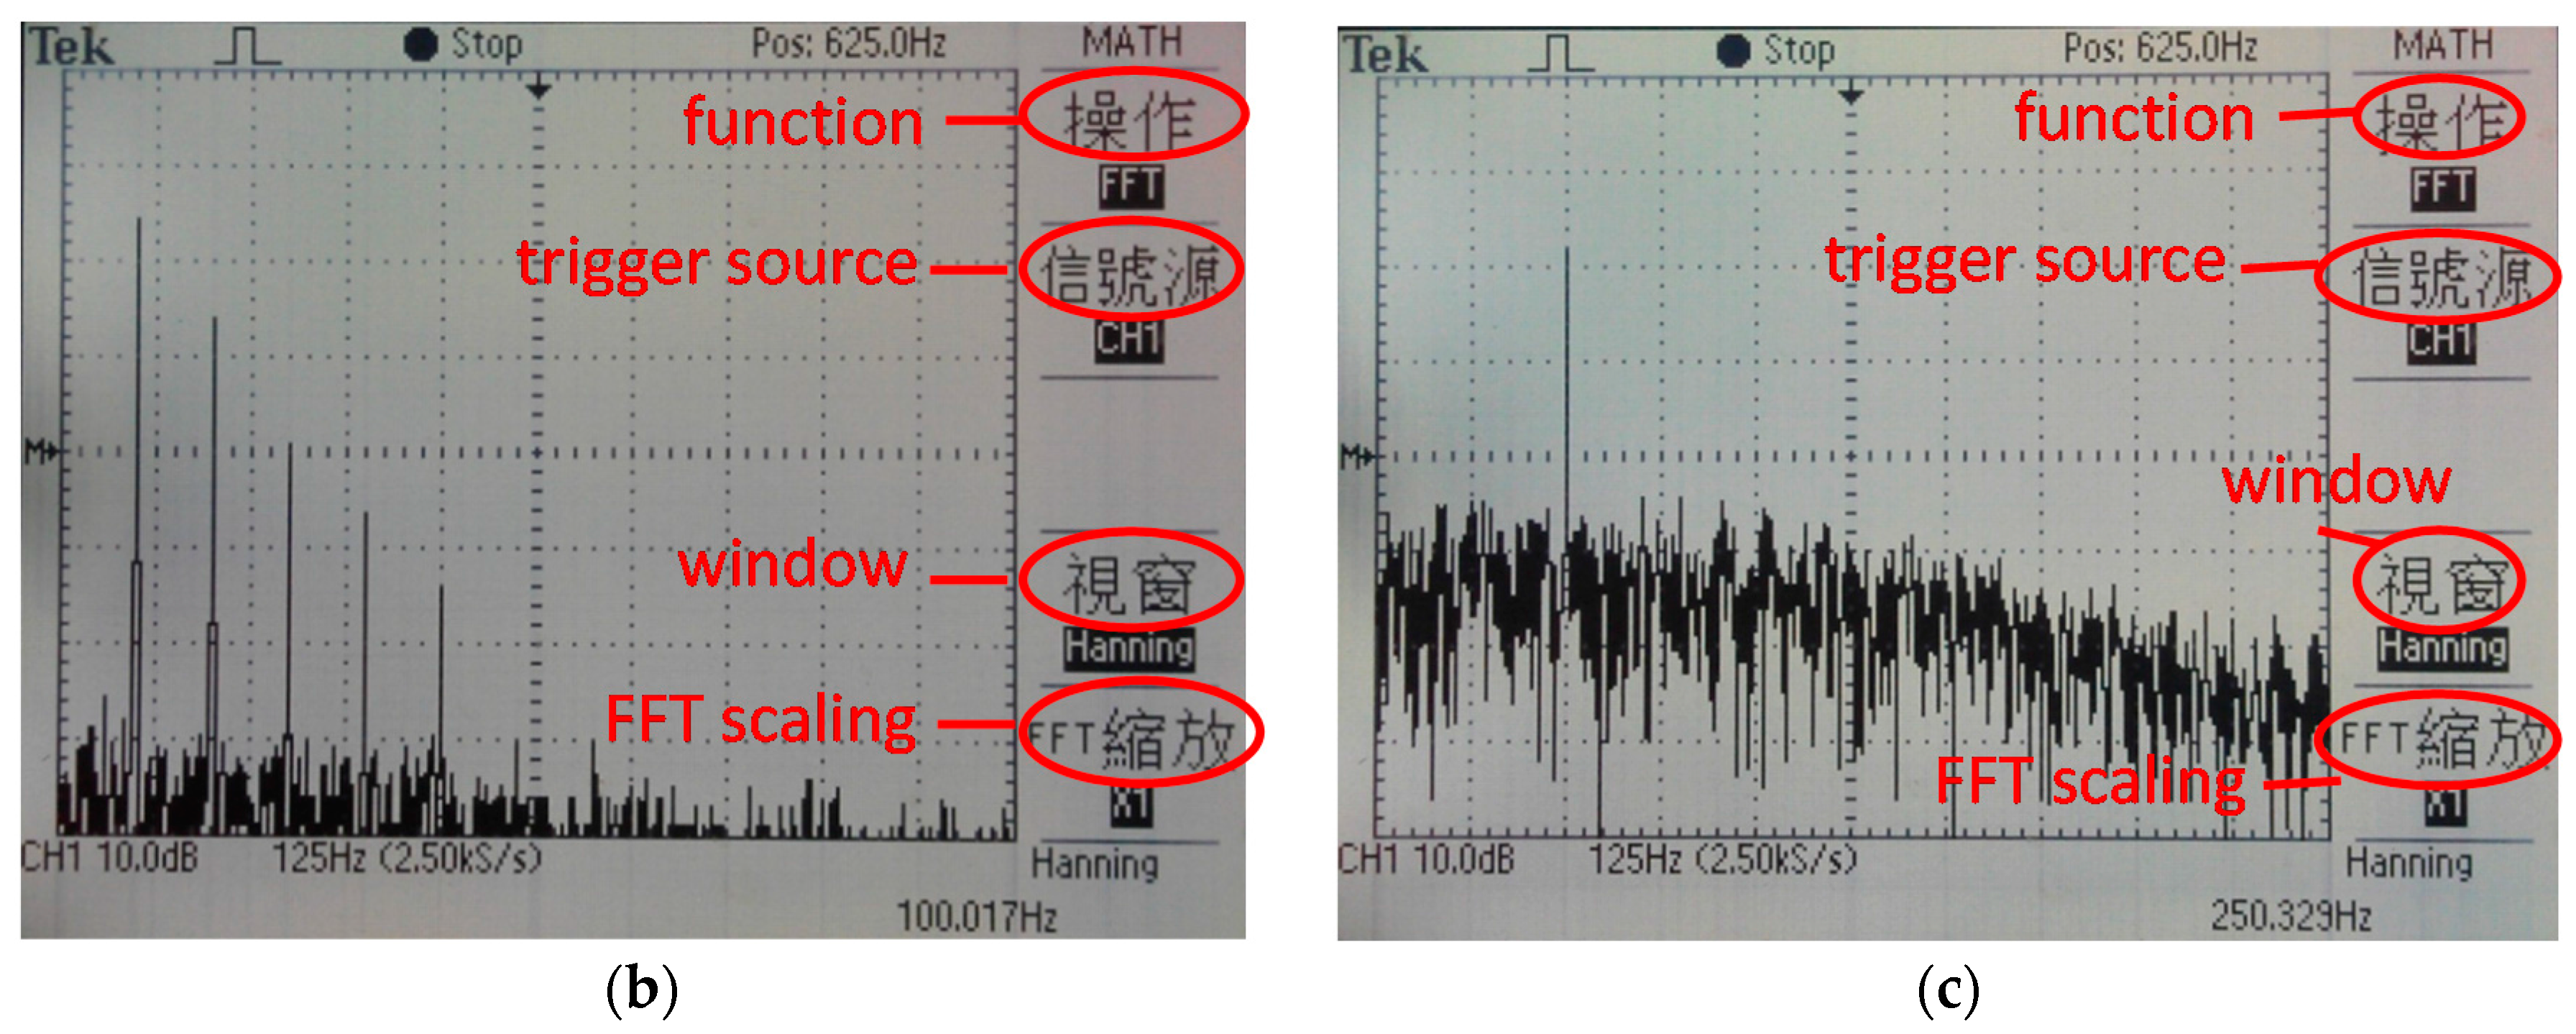
The CPHI is combined with a heterodyne light source, a beam splitter (9), two analyzers (16 and 17), two photodetectors (18 and 19), and a lock-in amplifier (22). The heterodyne light passing through the iris (8) and the beam splitter (9) is divided into the reflected light and the transmitted light. The reflected light will pass through the analyzer plate (16) with the transmission axis of 45° and be detected by the photodetector (18) to produce the interference signal with a beat frequency of 10 kHz, and then the electrical signal is connected to a lock-in amplifier (22) (Stanford Research Systems, model: SR830, phase resolution: 0.01°) as the reference signal Ir. The transmitted light is the test beam. The test beam incident on a mirror (11) stuck on the test speaker (10) is reflected back to the original path and reflected by the beam splitter (9) again, and then incident into a face-to-face parallel mirror pair (13 and 14), which plays the role of an angular sensor. The rotation stage (15) is used to rotate the mirror pair to a suitable azimuth angle. After passing through another analyzer (17) and being detected by a photodetector (19), another interference signal is generated, and the phase shift between the s- and p-polarizations of the light due to the vibration is involved in its phase. The test signal It is also connected to the lock-in amplifier (22). Comparing these two signals, the phase difference caused by the vibration is obtained. From Figure 4a, the amplitude of the vibration of the speaker caused by the driving signal from the function generation (21) is proportional to the deviation angle of the reflection beam. In addition (from Figure 2) it is also proportional to the phase shift of the mirror pair (13 and 14), i.e. . Therefore, the output of the phase channel of the lock-in amplifier (22), the frequency and amplitude of the signal, are proportional to the frequency and amplitude of the vibration, respectively. The level (or amplitude) of vibration can be measured via the Fourier frequency transform in real time. We should use the spectrum function of an oscilloscope (Tektronix China Ltd, TDS 1012, Shanghai, China) to observe and record the spectrum of the phase signal. For example, the spectrum of the signal from phase channel of SR830 for the speaker in the driving frequency of 100 Hz is shown in Figure 4b. This response frequency represents the vibration spectrum of the speaker. There are several harmonic frequencies in the spectrum of the speaker’s response. It shows that some resonance of the speaker occurred. The resonance will enhance the vibration level. If the driving frequency is below 210 Hz, the harmonic frequency generation occurs obviously. If the driving frequency range is within 210–500 Hz, the spectrum shows that there is no other harmonic frequency generation and no resonance (see Figure 4c), so the error percentage in frequency is about 0.24%.
Figure 4.
(a) Sketch of the speaker’s vibration; the speaker’s vibration responses at (b) 100 Hz and (c) 250 Hz driving frequencies.
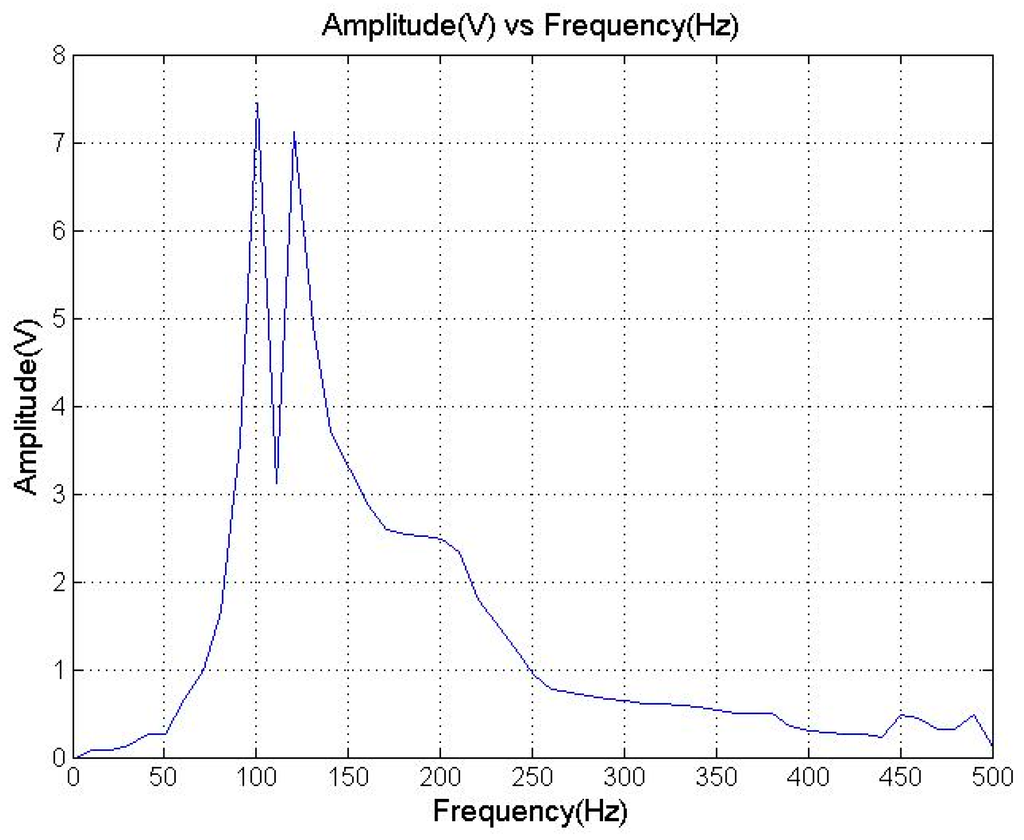
We measured the amplitude from the spectrum at the driving frequency when the input driving voltage is specified at 1 Vpp. In Figure 5, the speaker’s amplitude response versus the input driving frequency shows that a better response is in the range of 75–200 Hz. There are two peaks in the figure. These may be the resonance frequencies of the speaker. The vibration amplitude is more evident, but the harmonic frequencies are also generated. The more resonant phenomenon occurs within these two points. For the frequency range of 210–500 Hz, we can find that the amplitude response will decrease as the input frequency increases, but the harmonic frequencies are mostly absent. Thus, in our method, we could observe the vibration spectrum of the speaker response in real time.
Figure 5.
The amplitude response of speaker vibration versus input drive frequency.
3.2. Bubble Measurements
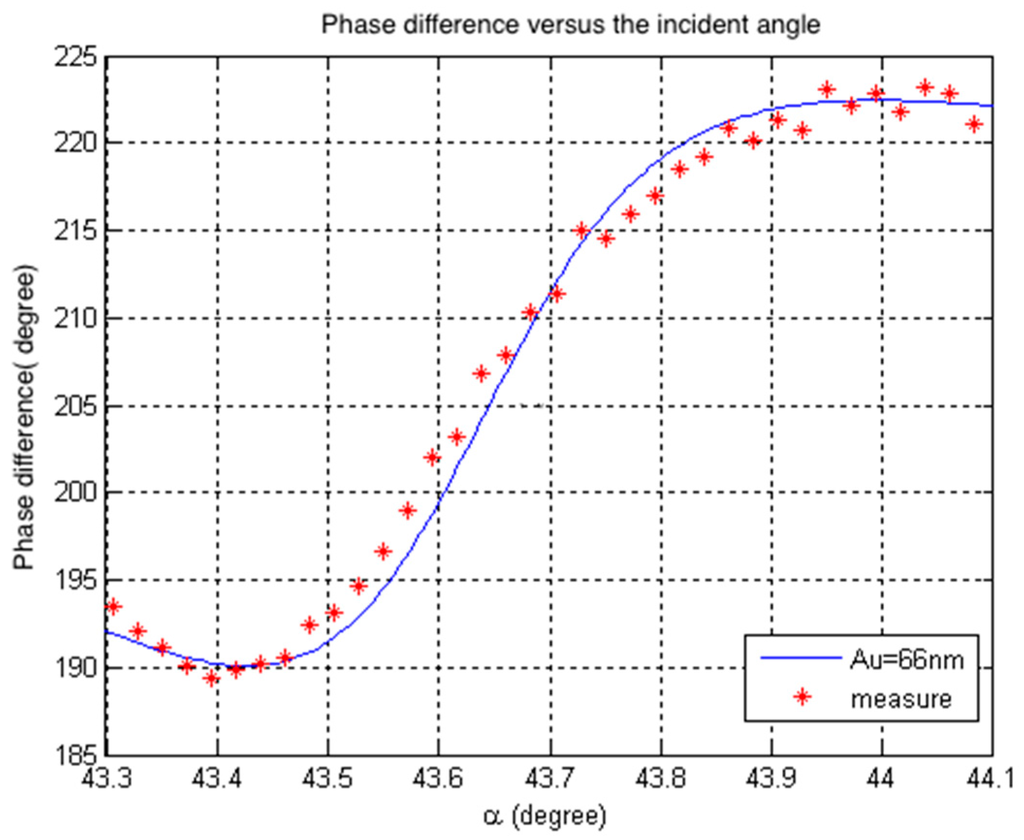
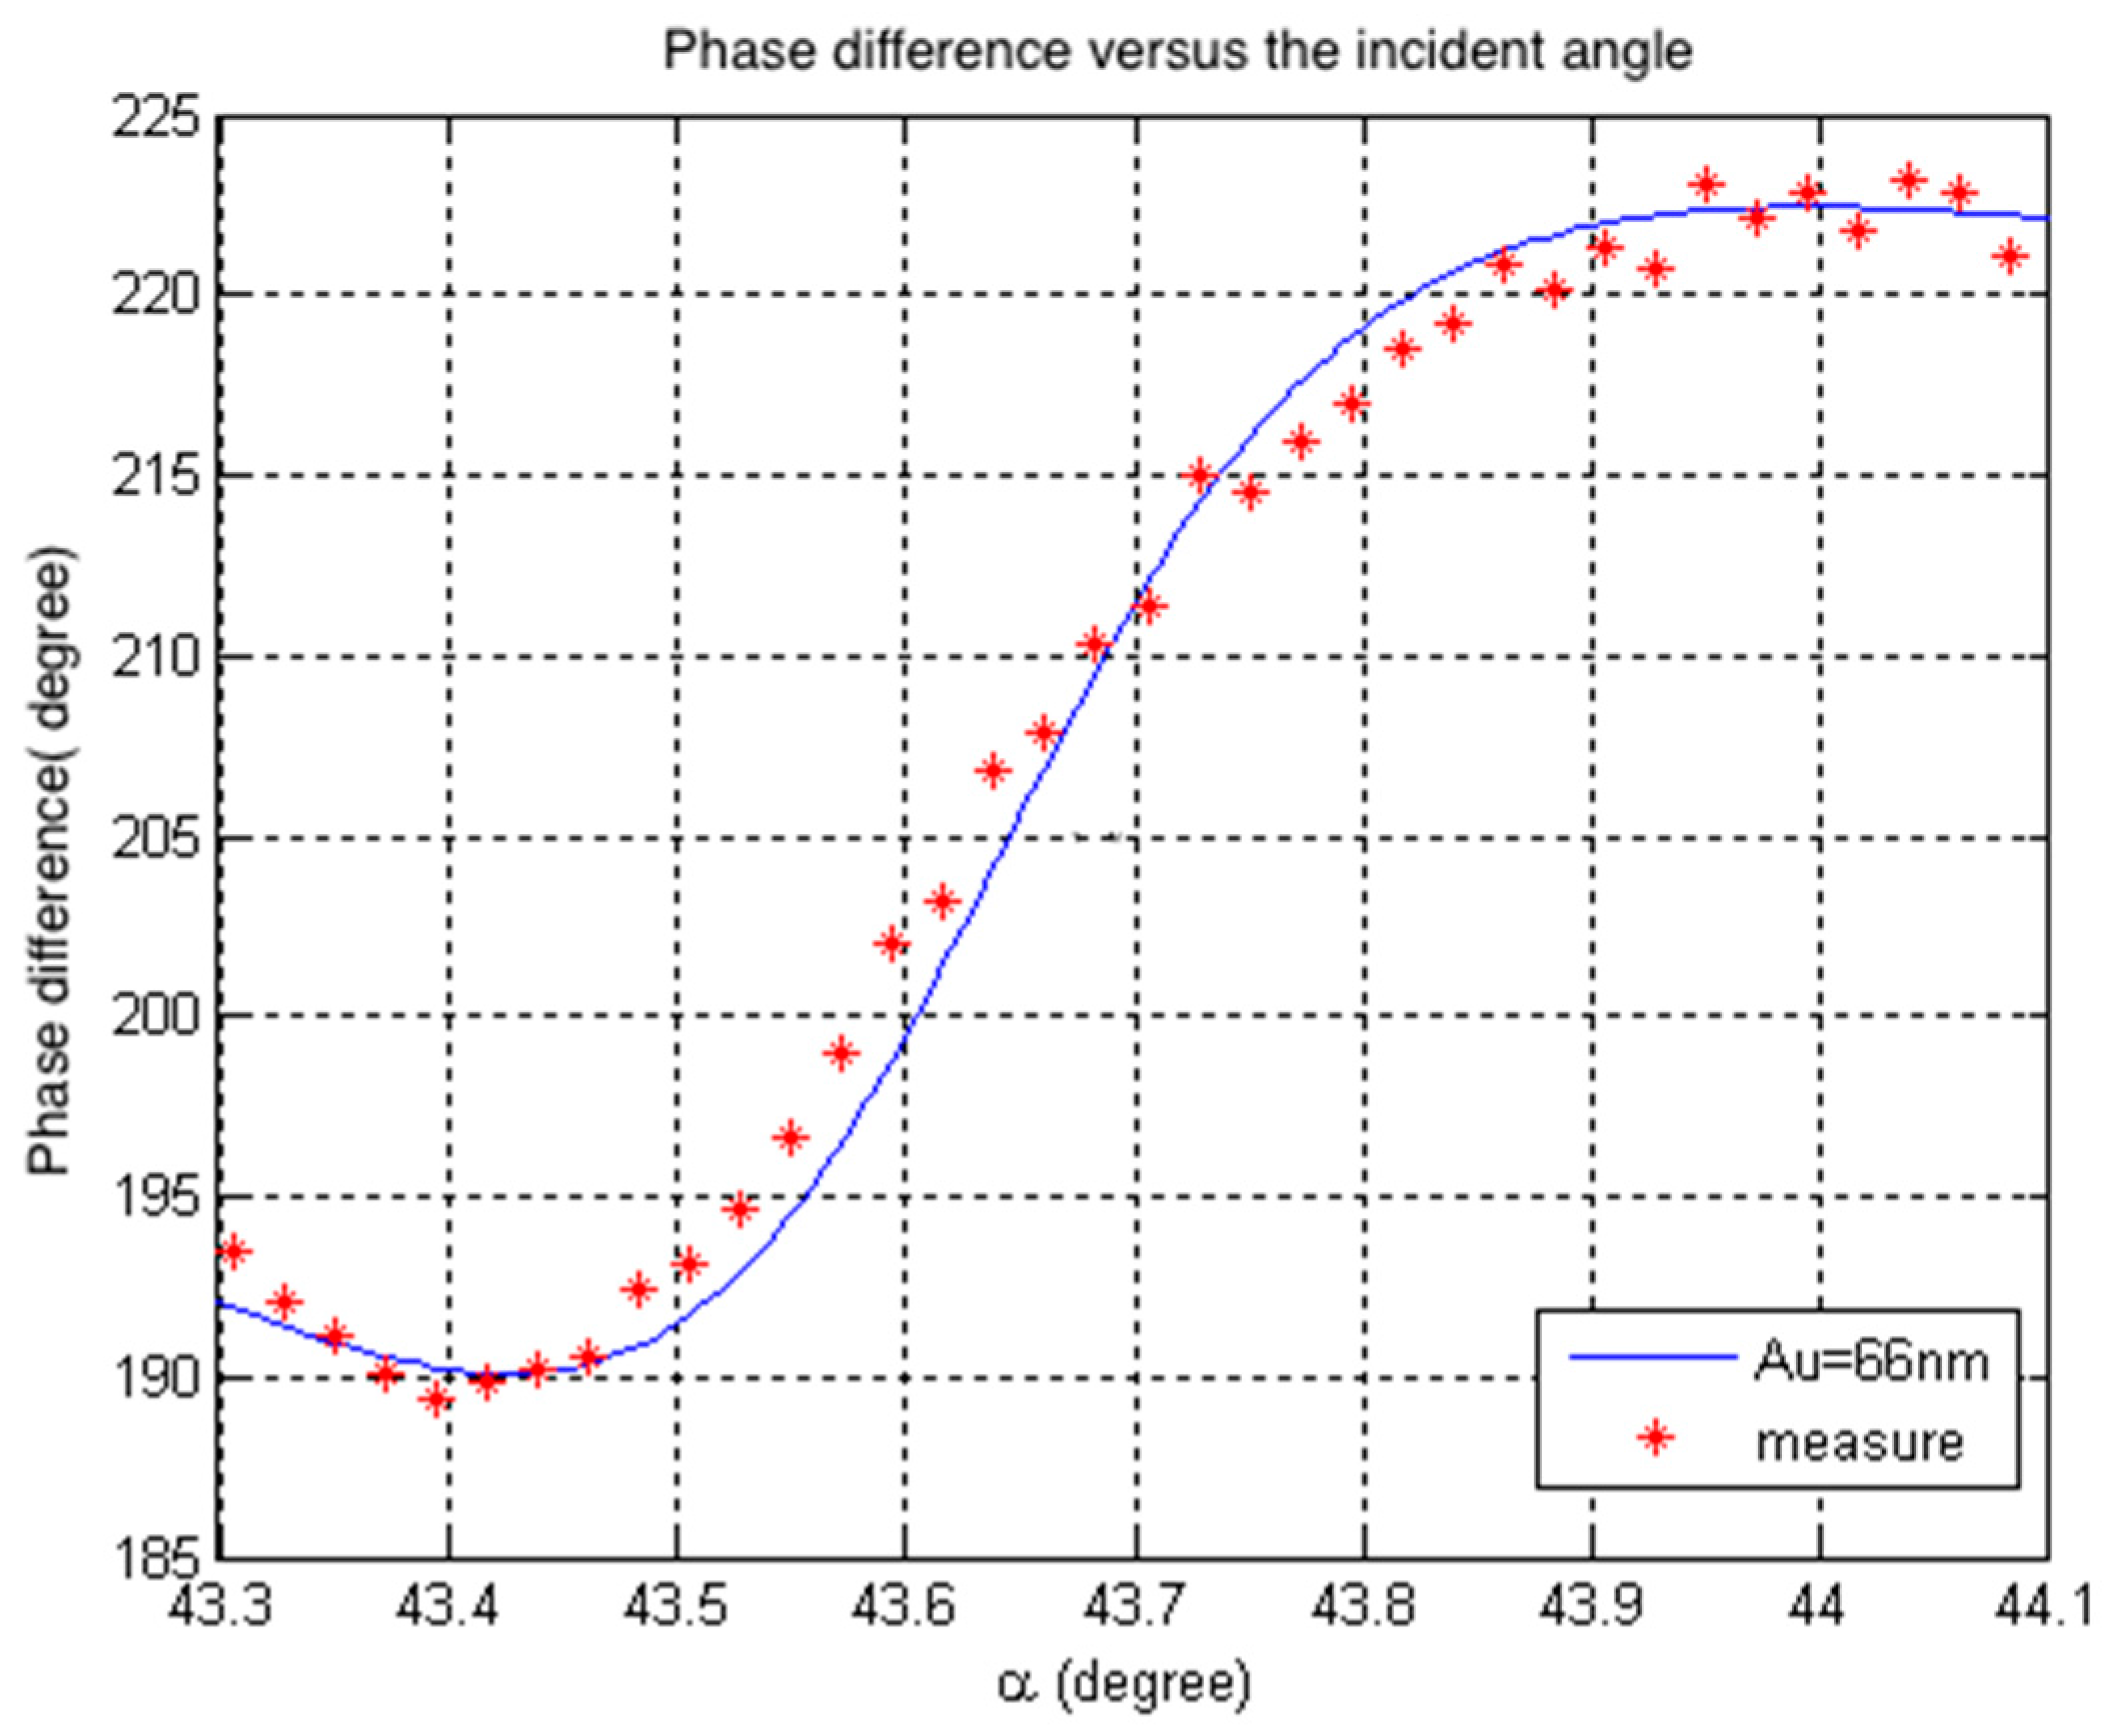
Another angular sensor is an SPR sensor. The phase shift between the s- and p-polarizations in a SPR sensor [10] (self-made)—which is a right-angle prism (made of BK7) coated with a thin gold film with a thickness of 66 nm—is shown in Figure 6. The phase sensitivity is about 100 (degree/degree) and the resonant angle is at 43.7° for the wavelength of 632.8 nm. It is also shown as element number 8 in Figure 7, which shows the structure of the bubble measurement system.
Figure 6.
The measurement and simulation results of a surface plasmon resonance (SPR) sensor with 66 nm thickness of gold.
Figure 7.
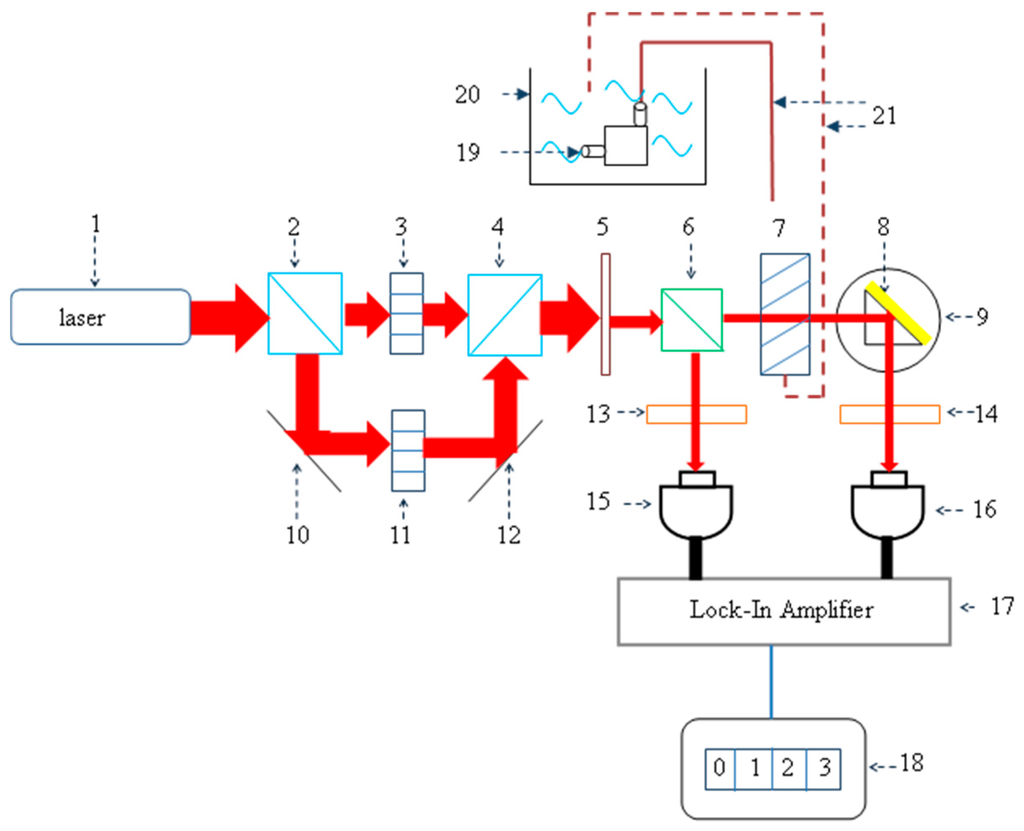
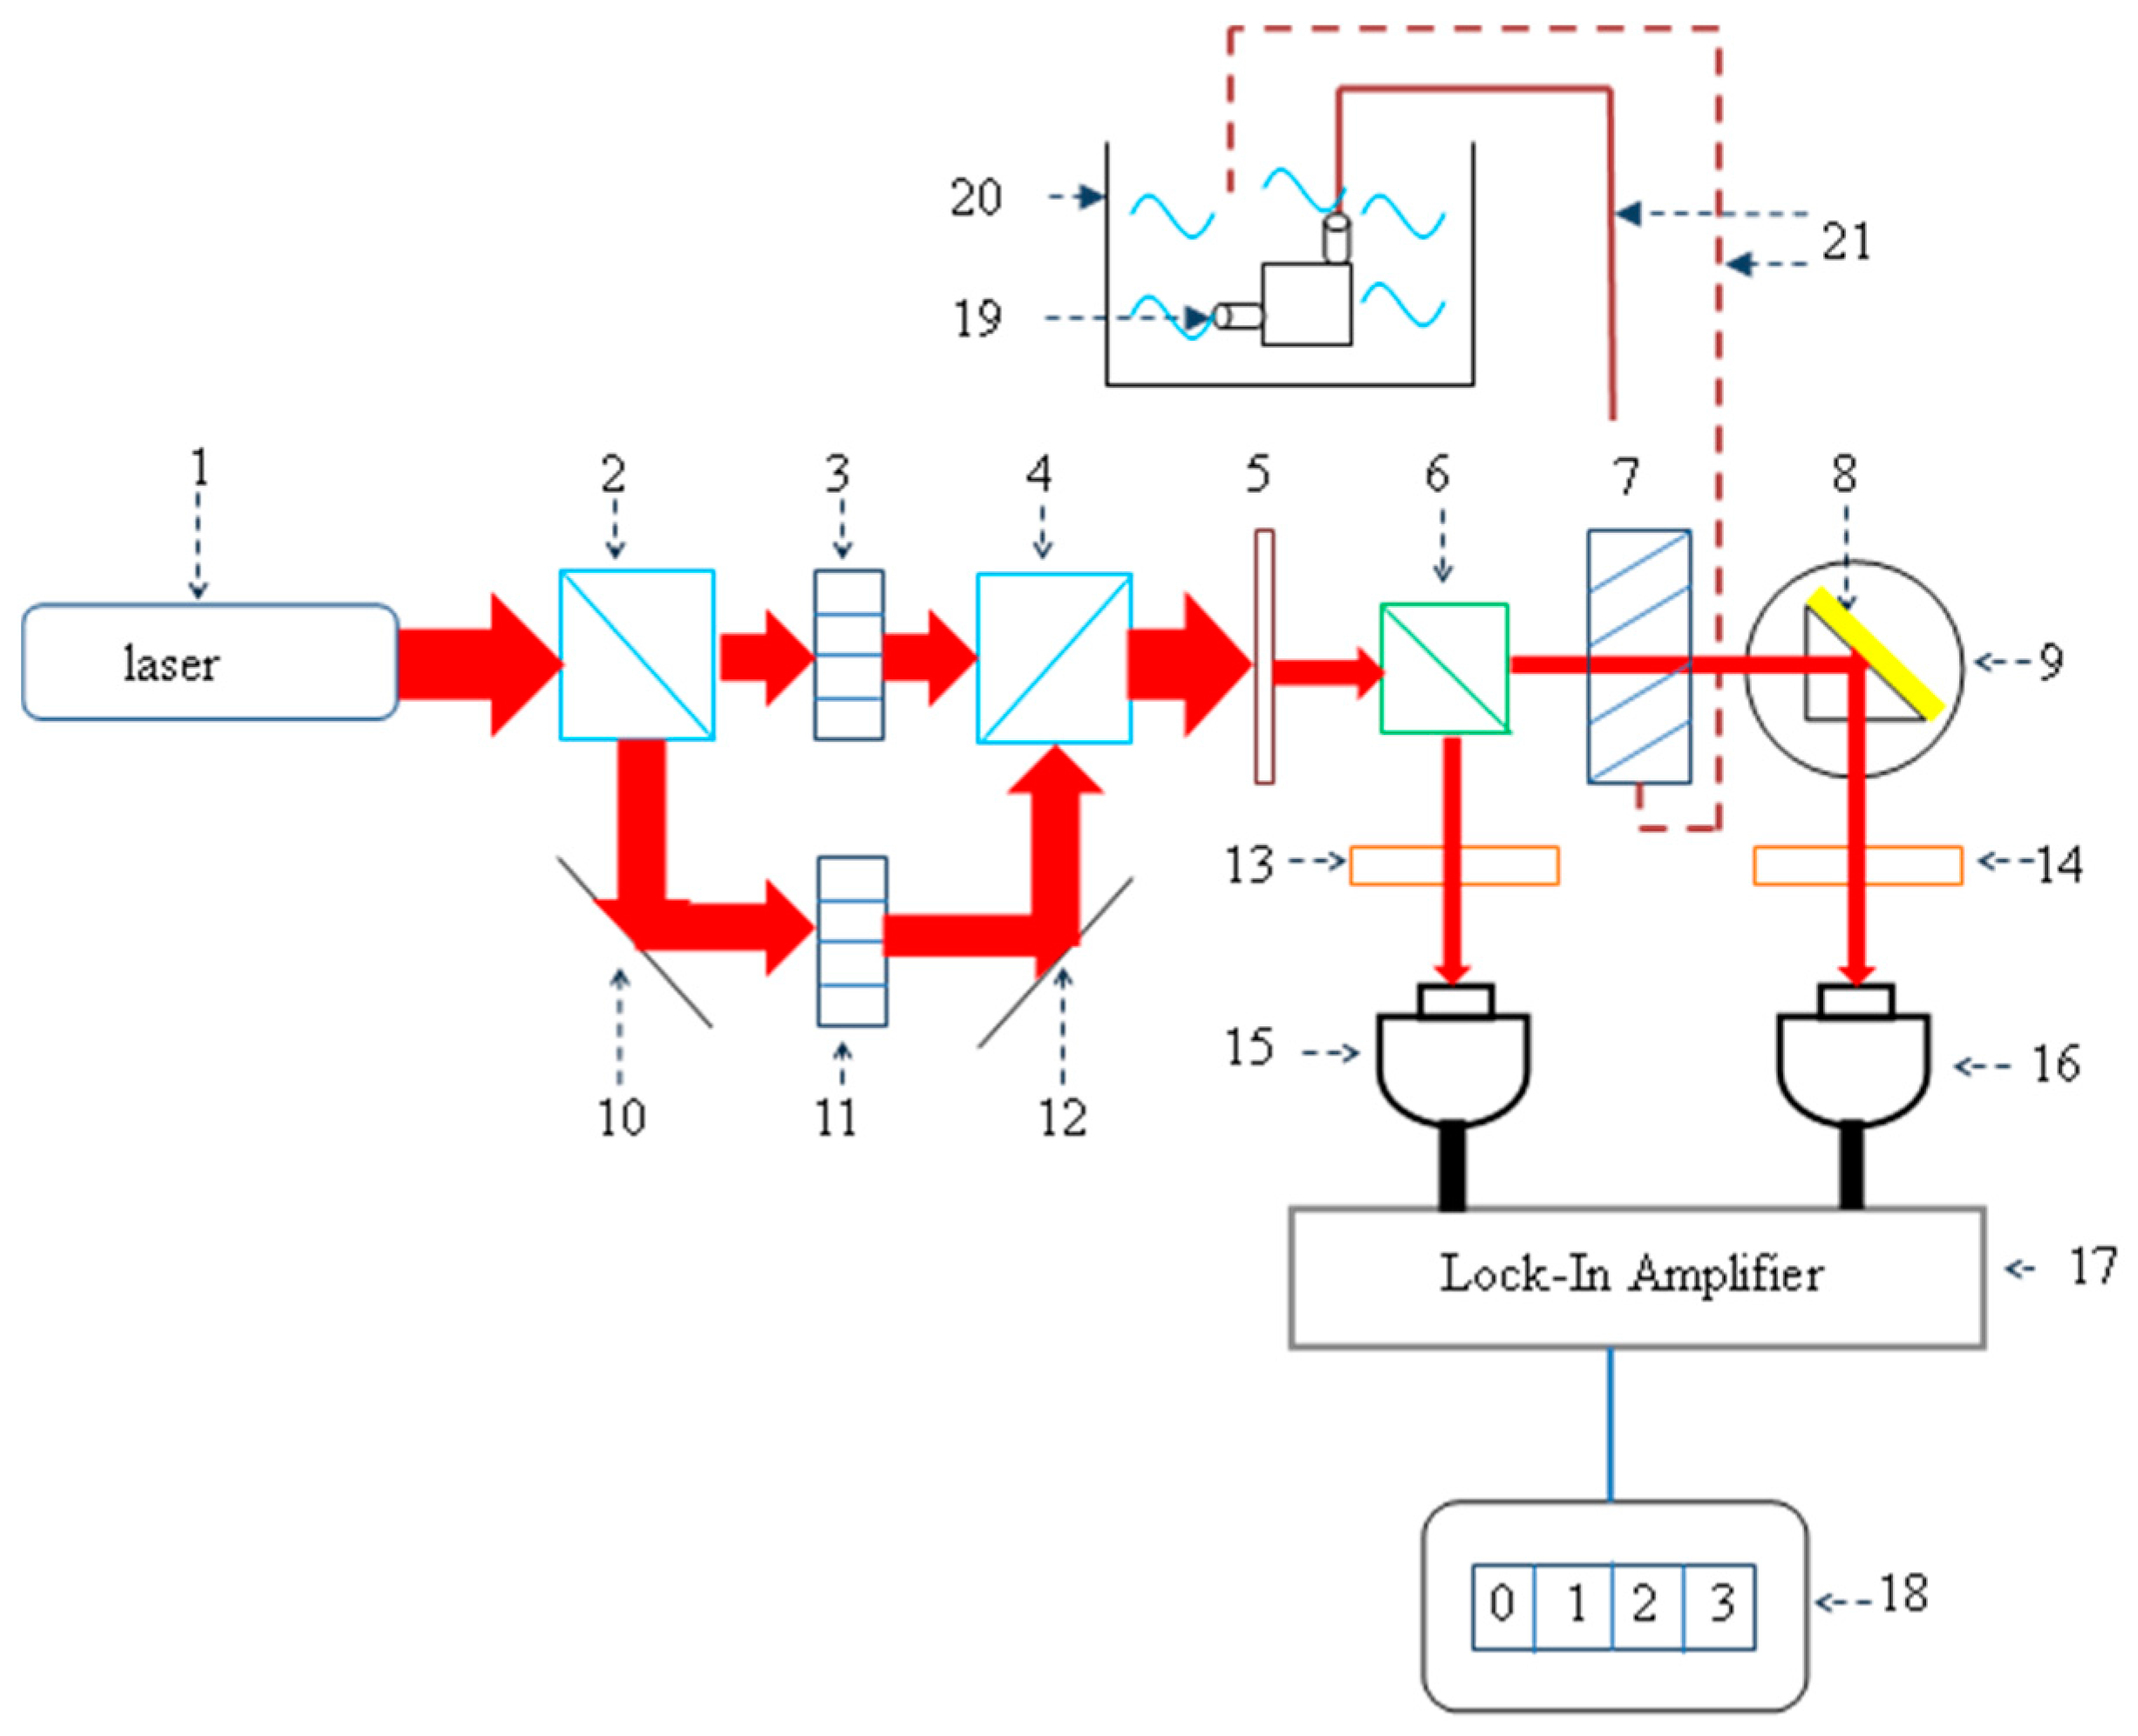
The bubble measurement system. 1: He-Ne laser; 2 and 4: Polarization beam splitters; 3 and 11: AOMs; 5: Iris; 6: Beam splitter; 7 and 21: Water pipes; 8: SPR sensor; 9: Rotation stage; 10 and 12: Mirrors; 13 and 14: Analyzers; 15 and 16: Photodetectors; 17: Lock-in amplifier; 18: Counter; 19: Water pump; 20: Water tank.
From Figure 7, the heterodyne light source is combined with a laser (1), two polarization beam-splitters (PBS) (2 and 4), two mirrors (10 and 12), and two acousto-optic modulators (AOM) (3, 11). The structure and the beat frequency are the same as in Figure 3. The iris (5) shelters the zero-order and the other-order diffraction lights to prevent their going through the optical system.
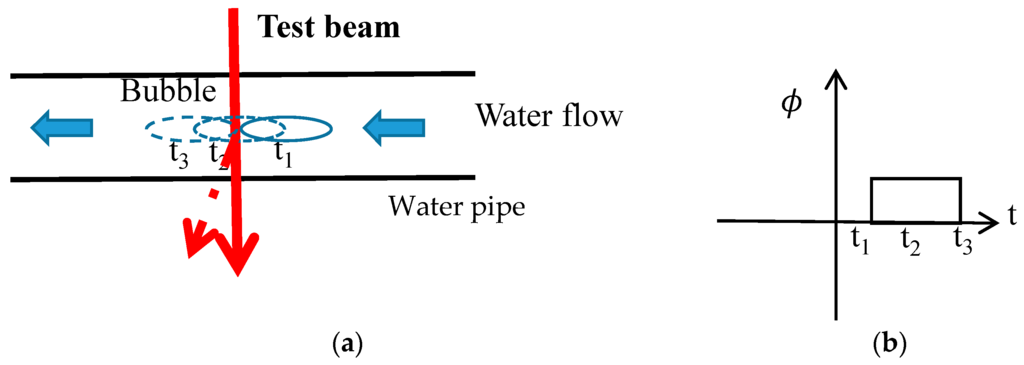
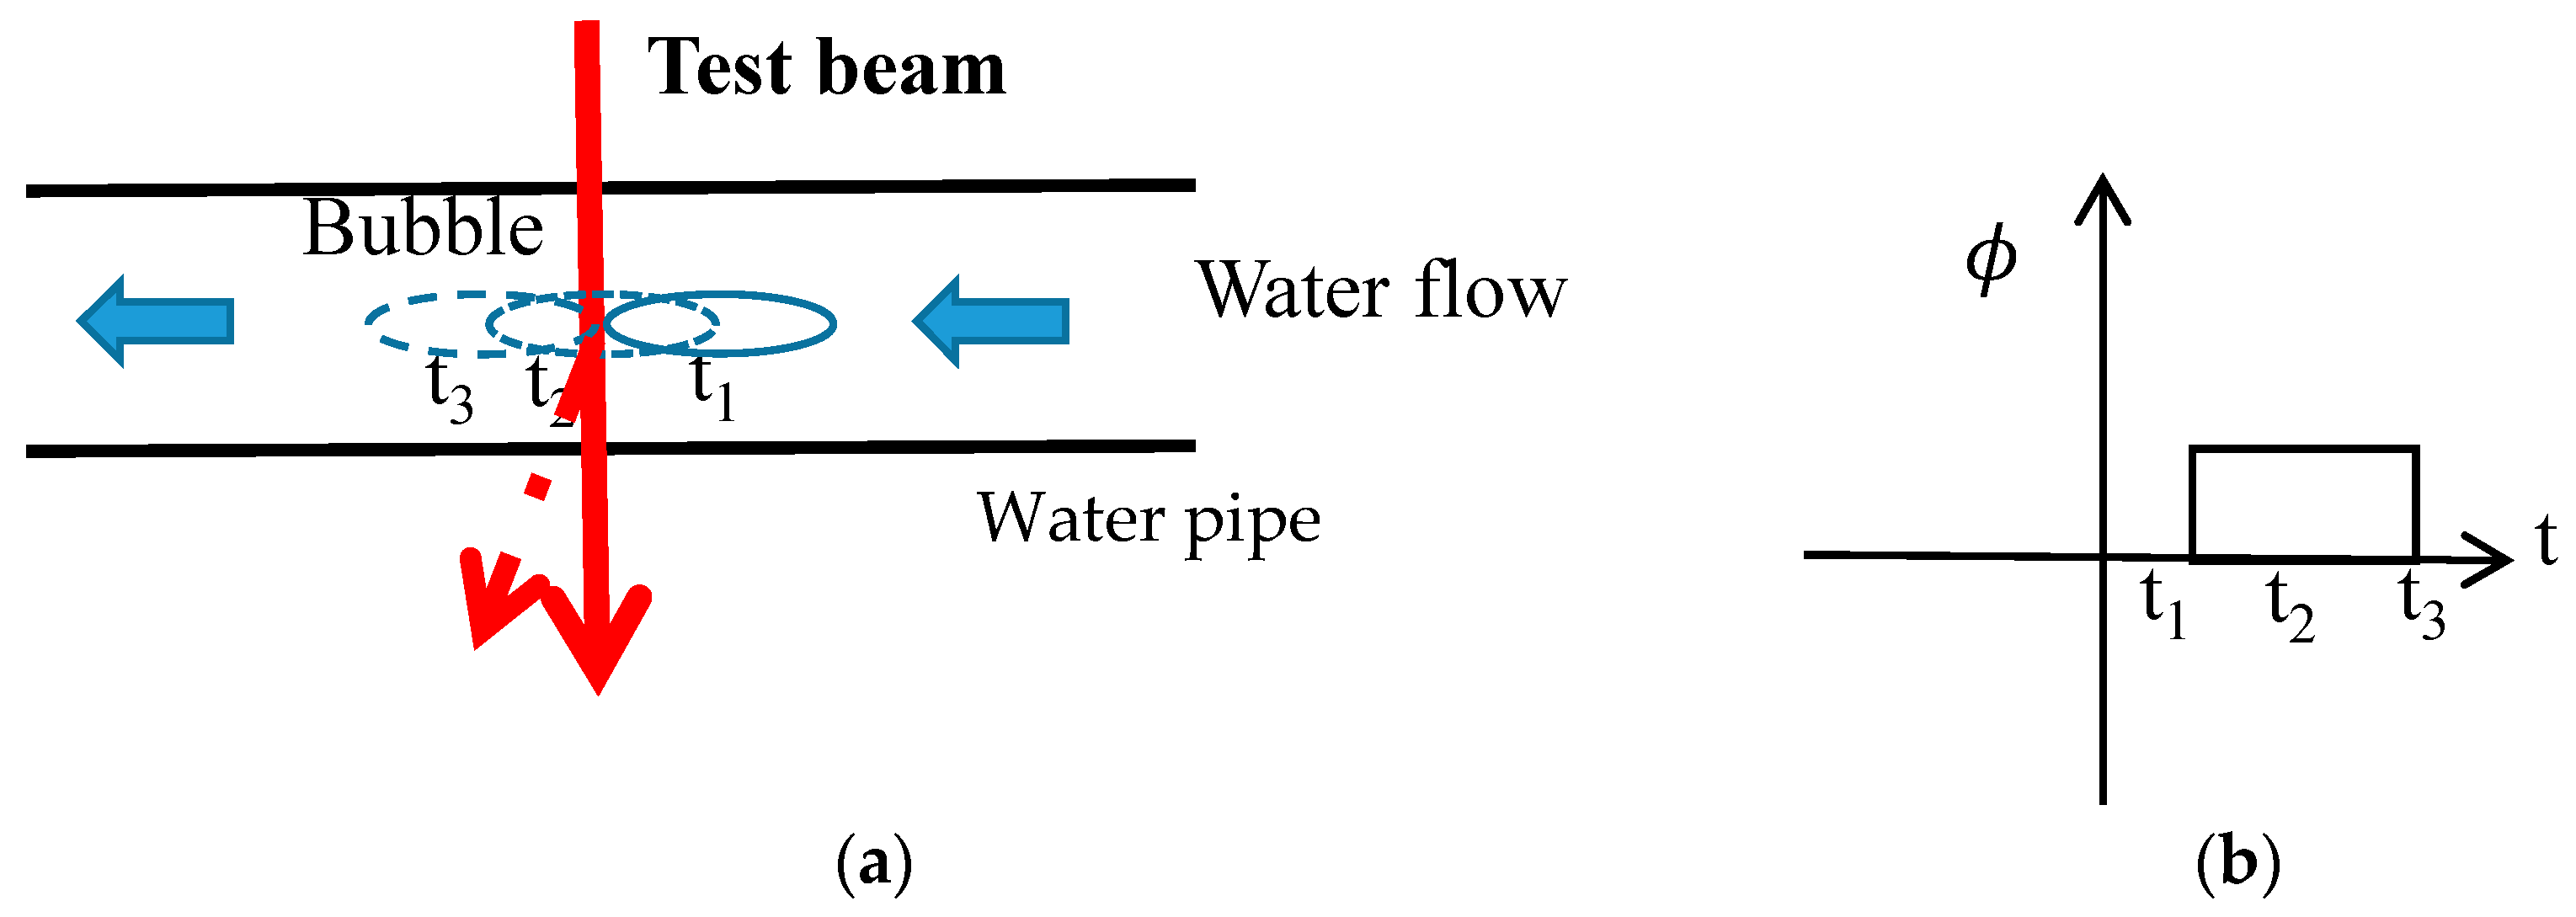
From Figure 7, the main structure of the CPHI is similar to Figure 3 and combines with a heterodyne light source, a beam splitter (6), two analyzers (13 and 14), two photodetectors (15 and 16), and a lock-in amplifier (17). The photodetectors (15) and (16) receive the reference signal Ir and the test signal It, respectively. The modulation signals and beat frequency are the same as before. The incident angle of the angular sensor is adjusted at the resonant angle (43.7°) by using the rotation stage (9). The lock-in amplifier (17) reads and transfers the phase difference between the reference signal Ir and the test signal It into a DC voltage when the phase difference is kept a constant. Thus, when the bubble passes through the cross-section of the test beam in the water pipe (7), the phase changes abruptly and the output signal is a pulse. From Figure 8a, a bubble is passing through the cross-section of the test beam, and the beam is deflected beginning at t1 and goes straight at t3. The phase signal from the output of the lock-in amplifier (17) generates a pulse signal due to the bubble transmitting (see Figure 8b). The pulse triggers a counter (18) to count the number of phase changes. Thus, the number of bubbles can be counted. The speed and size of bubbles are dependent on the driving voltage of the water pump (19). Along the water tank (20) and water pipe (21), the bubbles are in the loop moving in cycles.
Figure 8.
(a) The test beam deflects an angle when a bubble is transmitted through the cross section; (b) the pulse generation of the phase channel of lock-in amplifier during the beam is deflected.
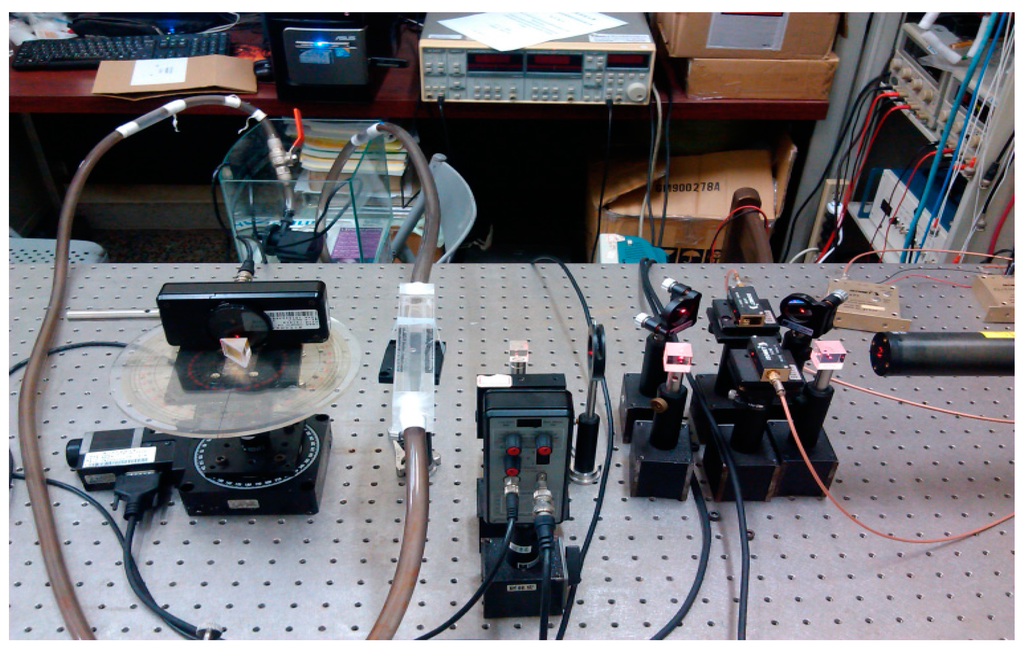
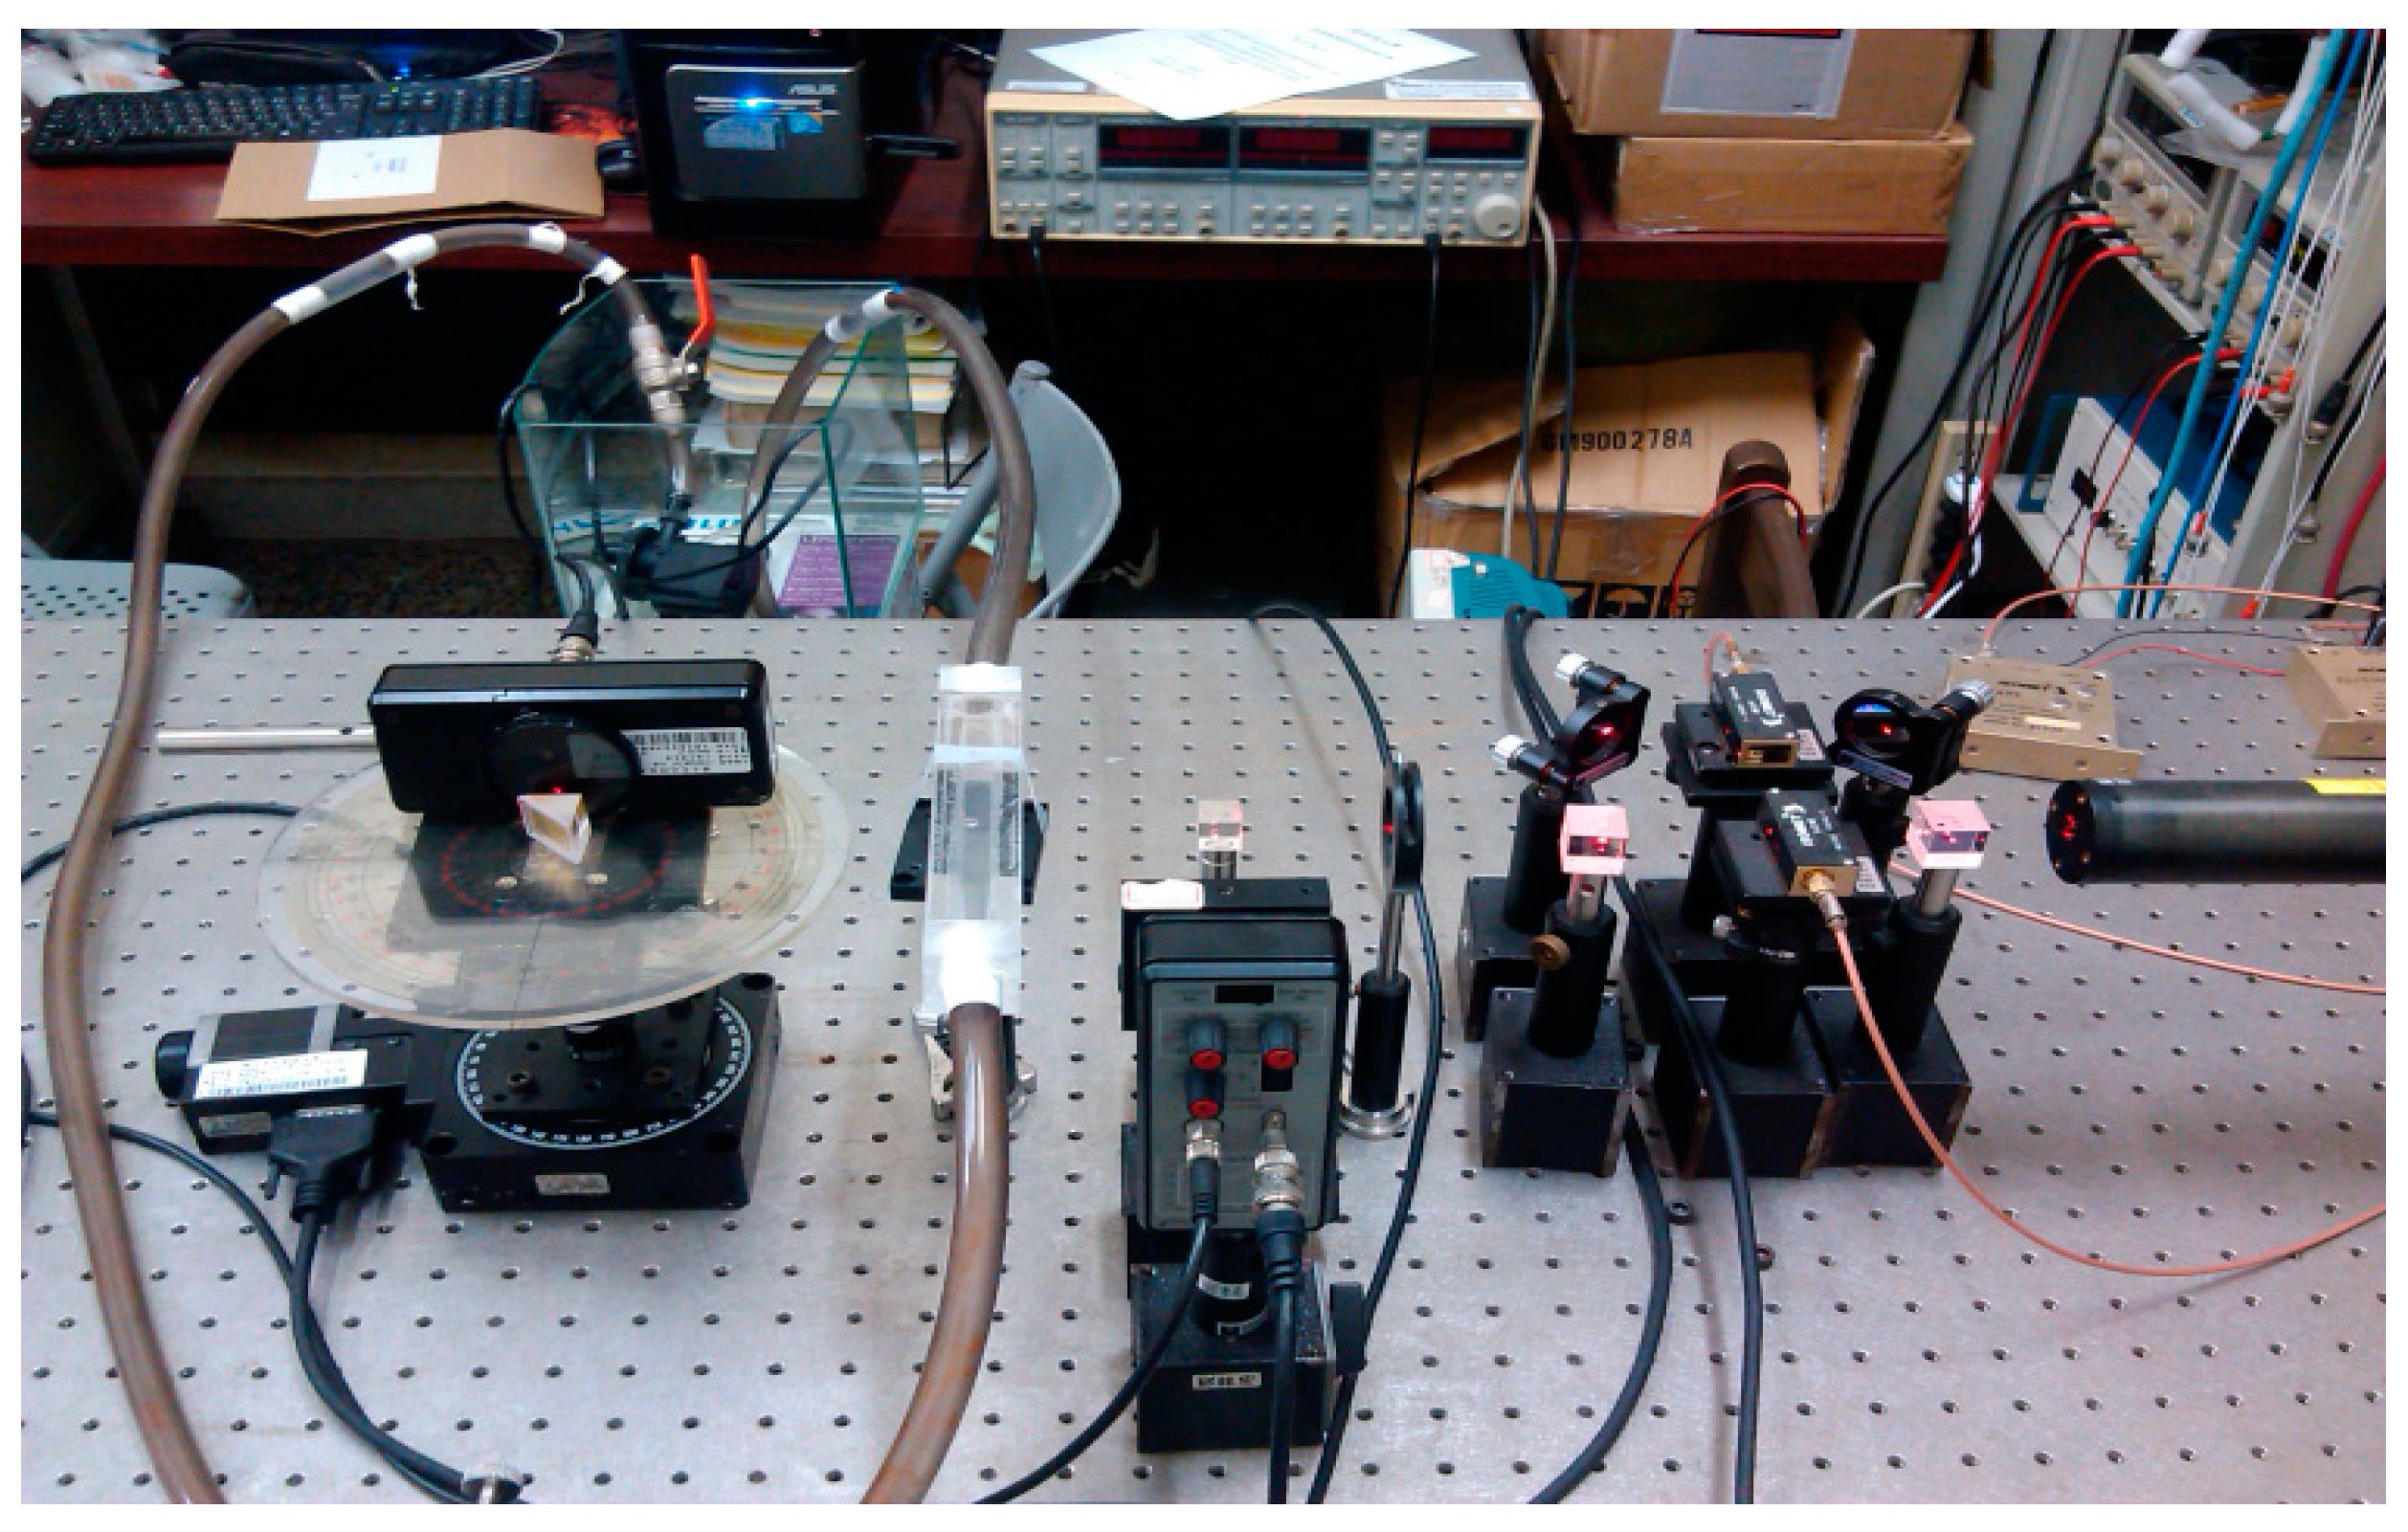
The measurement system sketch is shown in Figure 7 and the actual experimental setup is shown in Figure 9. The measurement results, including the velocity of water flow, relative percentage error between the counter and a digital camera, and the number of bubbles per minute are shown in Table 1. If the bubble sizes vary in the test tube with the velocity of water flow from 9 to 20.5 cm/s, the maximum relative error percentage is about 0.28%.
Figure 9.
The real experimental setup of bubble measurement.
Table 1.
The bubble measurement results.
To estimate the available minimum sizes of bubbles in different water flow velocities, we use transparent plastic particles instead of bubbles to measure and count.
The estimated minimum measurable bubble’s sizes of 0.2 and 0.6 mm water flow velocities of 2 and 60 (cm/s) are shown in Table 2. The maximum counter frequency is 1000 Hz for the beat frequency of 10 kHz.
Table 2.
The measurement results of the available minimum size.
4. Discussion
This method, named Heterodyne Angle Deviation Interferometry (HADI), is demonstrated in small vibration and bubble measurements. In the small vibration measurement, due to the common-path structure, the environmental disturbances from all vibrant sources will not influence the interference signal, but the vibration will change the angle deviation of the test beam. Therefore, the amplitude of the signal is not changed, but the vibration information is preserved in the phase of interference. The anti-influence characteristics of the common-path optical setup assists us in measuring the vibration level of the speaker either with the influence of environmental interference or not. In our experiment, we could observe the speaker’s vibration situation in real time. Therefore, the feasibility of this method for vibration measurement is demonstrated. In the bubble measurements, the bubble can deflect the test beam from the resonant angle of the SPR. The structure can minimize the effect of environmental disturbance and can be easily used to measure the phase shift due to the angle deviation. The minimum bubble size that can be detected is 0.2 mm, and the maximum counter frequency is 1 kHz.
5. Conclusions
HADI is based on CPHI, with an angular sensor for angle deviation measurements in industrial environment. The angular sensor senses the angle deviation according to its phase change. The angle deviation of the test beam due to sample deformation or a particle passing through the beam will induce a phase change of the angular sensor. The phase change can be measured by CPHI in real time. For example, small vibration, water flow, and refractive index change measurements, etc. Due to its anti-influence effect, air disturbance is eliminated. The phase change of the interference signal is only determined by the angle deviation. In the speaker’s vibration measurement, the spectrum of the phase can be represented as vibration situation, including the vibration level and frequency response. The better speaker response is within the frequency range of 70–200 Hz. In the water flow measurement, we could measure the bubble size and the speed of water flow in real time. The measurable minimum size of a bubble is 0.2 mm and the maximum speed of water flow is 0.6 m/s. We should increase the beat frequency to expand the measurement range in the future.
Acknowledgments
This study was supported in part by the MOST in Taiwan under contract number: MOST 104-2221-E-150-047.
Author Contributions
Ming-Hung Chiu, he contributed the idea, measurement method, and optical system design in this study; Jia-Ze Shen and Jian-Ming Huang contributed the experimental results and all of figures in the speaker’s vibration and water flow measurements, respectively.
Conflicts of Interest
The authors declare no conflict of interest.
References
- Massia, N.A.; Nelson, R.D.; Holly, S. High-performance real-time heterodyne interferometry. Appl. Opt. 1979, 18, 1797–1803. [Google Scholar] [CrossRef] [PubMed]
- Stetson, K.A. Method of vibration measurements in heterodyne interferometry. Opt. Lett. 1982, 7, 233–234. [Google Scholar] [CrossRef] [PubMed]
- Estler, W.T. High-accuracy displacement interferometry refin air. Appl. Opt. 1985, 24, 808–815. [Google Scholar] [CrossRef] [PubMed]
- Chien, P.Y. Two-frequency displacement measurement interferometer based on a double-heterodyne technique. Rev. Sci. Instrum. 1991, 62. [Google Scholar] [CrossRef]
- Charette, P.G.; Hunter, I.W.; Brenan, C.J.H. A complete high performance heterodyne interferometer displacement transducer for microactuator control. Rev. Sci. Instrum. 1992, 63. [Google Scholar] [CrossRef]
- Bobroff, N. Recent advances in displacement measuring interferometry. Meas. Sci. Technol. 1993, 4, 907–926. [Google Scholar] [CrossRef]
- Su, D.C.; Chen, C.D.; Chiu, M.H. Simple two-frequency laser. Prec. Eng. 1996, 18, 161–163. [Google Scholar] [CrossRef]
- Ngoi, B.K.A.; Venkatakrishnan, K.; Tan, B. Laser scanning heterodyne-interferometer for micro-components. Opt. Commun. 2000, 173, 291–301. [Google Scholar] [CrossRef]
- Chiu, M.H.; Chen, W.C.; Tan, C.T. Small displacement measurements based on an angular-deviation amplifier and interferometric phase detection. Appl. Opt. 2015, 54, 2885–2890. [Google Scholar] [CrossRef] [PubMed]
- Raether, H. Surface plasmons on smooth and rough surfaces and on gratings; Springer: Heidelberg, Germay, 1988; pp. 4–29. [Google Scholar]

© 2016 by the authors; licensee MDPI, Basel, Switzerland. This article is an open access article distributed under the terms and conditions of the Creative Commons Attribution (CC-BY) license (http://creativecommons.org/licenses/by/4.0/).