


Abstract
To explore the mechanical evolution and damage mechanisms of rock in cold regions under freeze–thaw cycles, this study selected white sandstone from mining areas in western China as the research object. Uniaxial compression tests were performed after different numbers of freeze–thaw cycles. Digital Image Correlation (DIC) was employed to analyze the deformation evolution and crack propagation characteristics, and the damage mechanisms were interpreted from the perspective of energy evolution. The results show that with an increasing number of freeze–thaw cycles, the peak stress and elastic modulus of the white sandstone decrease significantly, with the most substantial reduction occurring between the 15th and 30th cycles. The stress–strain curves exhibit a prolonged compaction stage and increased peak strain, indicating that freeze–thaw action exacerbates the accumulation of internal damage in the rock. DIC analysis reveals that freeze–thaw action causes rock deformation to concentrate at the specimen edges at an earlier stage, accelerates crack propagation, and leads to a gradual transition in failure mode from tensile failure to tensile-shear composite failure, with the degree of failure becoming more severe. Energy evolution analysis indicates that freeze–thaw cycles reduce the total input energy and the elastic strain energy at peak stress, while the proportion of dissipated energy increases, suggesting that freeze–thaw damage results in greater energy consumption through irreversible deformation. Finally, based on the Lemaitre strain equivalence hypothesis and the Weibull distribution, a damage constitutive model considering the coupled effects of freeze–thaw and mechanical loading was established by introducing correction factors, and its validity was verified.
1. Introduction
Cold regions are widely distributed across the globe, including northeastern and northwestern China, as well as parts of Japan and Europe. China, in particular, possesses one of the largest cold-region areas in the world [1]. With the ongoing development of infrastructure and resource exploitation in these regions, a growing number of engineering facilities will inevitably be constructed in cold environments. However, the unique climatic and geographical conditions of these areas pose long-term challenges related to frost damage. Subjected to seasonal and diurnal temperature variations, rock masses experience severe cyclic freeze–thaw action over extended periods. To ensure the smooth implementation of engineering projects in cold regions and to safeguard human life and property, it has become critically important to investigate the evolution of mechanical properties and the degradation mechanisms of rock under freeze–thaw damage.
The issue of freeze–thaw behavior in rocks from cold regions has been a subject of widespread concern since the last century. The physical and mechanical properties of rocks inevitably deteriorate under freeze–thaw cycles. In recent years, numerous scholars have conducted extensive research on freeze–thawed rocks using various methods and from multiple perspectives. Shen et al. [2] examined in detail the effects of freeze–thaw cycle temperature, duration, and number of cycles on the physical and mechanical parameters of rock, and established recommended test protocols for different rock types and porosity levels. Zhang et al. [3], Liu et al. [4], Gong et al. [5], Yang et al. [6], and Li et al. [7] conducted freeze–thaw cycle tests on red sandstone, local granite, natural gypsum rock, and dolomite, respectively, and investigated the physical and mechanical properties of the rocks after freeze–thaw treatment. They found significant deterioration in both physical and mechanical properties: physical changes included mass variation, increased porosity, and reduced P-wave velocity, while mechanical properties such as uniaxial compressive strength, elastic modulus, angle of internal friction, and cohesion also decreased with an increasing number of freeze–thaw cycles. Chen et al. [8] investigated the structural damage characteristics of red-bed sandstone at both macroscopic and microscopic scales under freeze–thaw cycles and found that, beyond a certain number of cycles, the rock matrix becomes the primary component subject to loss. Li et al. [9] investigated the degradation of rock materials subjected to freeze–thaw cycles and applied their findings to the assessment of slope stability. Chen et al. [10] investigated the mechanisms of freeze–thaw damage and degradation in fractured rock, elucidating the resulting failure behavior of fractured rock masses. Sun et al. [11] quantitatively investigated the influence of freeze–thaw cycles on the cracking behavior of rock under compressive loading. They found that freeze–thaw action promotes the formation of longitudinal flake-like cracks in three-dimensional space and that the fractal dimension of cracks in sandstone decreases with an increasing number of freeze–thaw cycles. In addition, Feng et al. [12] and Zhu et al. [13] conducted triaxial tests on freeze–thawed rock. Feng performed triaxial compression tests and found that, under the same confining pressure, the peak deviatoric stress and elastic modulus gradually decreased with increasing freeze–thaw cycles, but continued to increase with rising confining pressure. Zhu employed a combined approach of freeze–thaw cycling tests and triaxial unloading tests on sandstone; the results indicated that the failure characteristics of freeze–thawed rock changed as confining pressure increased. Huang et al. [14] investigated the relationships among freeze–thaw cycles, shear strength parameters, and freeze–thaw damage variables. They found that changes in the shear strength parameters are related to the degree of freeze–thaw damage, and that the reduction in shear strength under freeze–thaw conditions is attributable to the loss of cohesion. Abdolghanizadeh et al. [15] investigated the effects of freeze–thaw temperature and cycle number on the mode I and mode II fracture toughness of rock and found that both decrease nonlinearly with an increasing number of freeze–thaw cycles and rising freeze–thaw temperatures. Testing techniques have also continued to evolve in recent years. Microscopic methods such as CT scanning [16,17], acoustic emission [18], nuclear magnetic resonance [19], and scanning electron microscopy (SEM) [20] have been increasingly employed in rock mechanics research, revealing the damaging effects of freeze–thaw cycles on rock at a more microscopic scale.
In other studies, Kang et al. [21] analyzed the evolution of cracks on the surface of freeze–thawed sandstone using digital image correlation (DIC), revealing the influence of freeze–thaw cycles on crack propagation direction and rate. Ullah et al. [22] conducted three-point bending tests on freeze–thawed rock and employed DIC to elucidate the effects of freeze–thaw cycles on rock fracture mechanisms. Yue et al. [23] analyzed the total absorbed energy, elastic energy, and dissipated energy of rock under freeze–thaw cycles, elucidating the energy evolution mechanism of freeze–thawed rock. Meng et al. [24] utilized a Hopkinson bar to investigate the influence of freeze–thaw cycles on the dynamic splitting tensile strength and energy evolution patterns of rock. Xiao et al. [25] analyzed the effects of freeze–thaw cycles on different energy types and discussed the internal relationships between these energy parameters and freeze–thaw cycles. Ma et al. [26] investigated the effects of freeze–thaw cycles on the dynamic uniaxial compressive strength and energy distribution parameters of rock. The results indicate that the dynamic uniaxial compressive strength decreases logarithmically with an increasing number of freeze–thaw cycles, and that all energy distribution parameters are significantly influenced by freeze–thaw action. Zhang et al. [27,28] established and validated a damage model for freeze–thawed rock based on damage mechanics and the generalized principle of strain equivalence. Meng et al. [29] categorized rock into four distinct states—undamaged, initially damaged, load-damaged, and coupled-damaged—to simulate the deformation and failure processes under freeze–thaw cycles and mechanical loading, and subsequently established a damage-consistent constitutive model for freeze–thaw-damaged rock. Hou et al. [30] developed a segmented damage constitutive model that accounts for the compaction stage, thereby providing a more accurate description of the failure and deformation characteristics of freeze–thaw damaged rock.
In summary, although significant progress has been made in the study of freeze–thawed rock, research into the mechanical properties and damage mechanisms of white sandstone from mining areas in western China subjected to freeze–thaw cycles remains limited. Therefore, this study subjected white sandstone samples collected from mining areas in western China to varying numbers of freeze–thaw cycles followed by uniaxial compression tests. The resulting changes in physical and mechanical properties were analyzed. Specifically, DIC technology is employed to examine deformation evolution and crack propagation characteristics during the failure process, energy evolution patterns are analyzed, and a damage constitutive model based on the Lemaitre strain equivalence hypothesis and the Weibull distribution is established and validated, accounting for the coupled effects of freeze–thaw and mechanical loading. Through this integrated approach, a comprehensive investigation of the failure characteristics and damage mechanisms of white sandstone after freeze–thaw cycles was conducted.
2. Materials and Methods
Sample Preparation
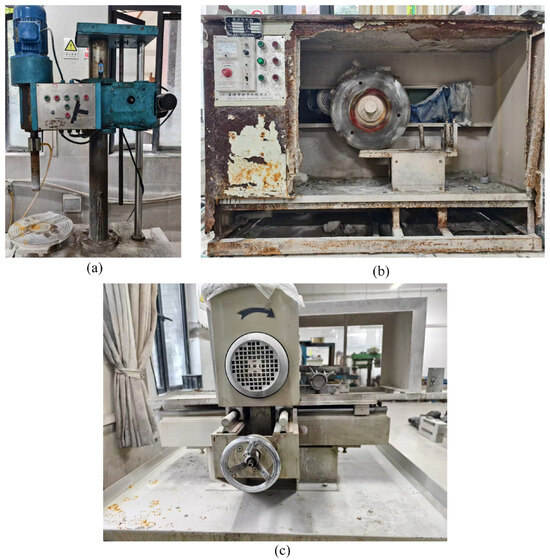
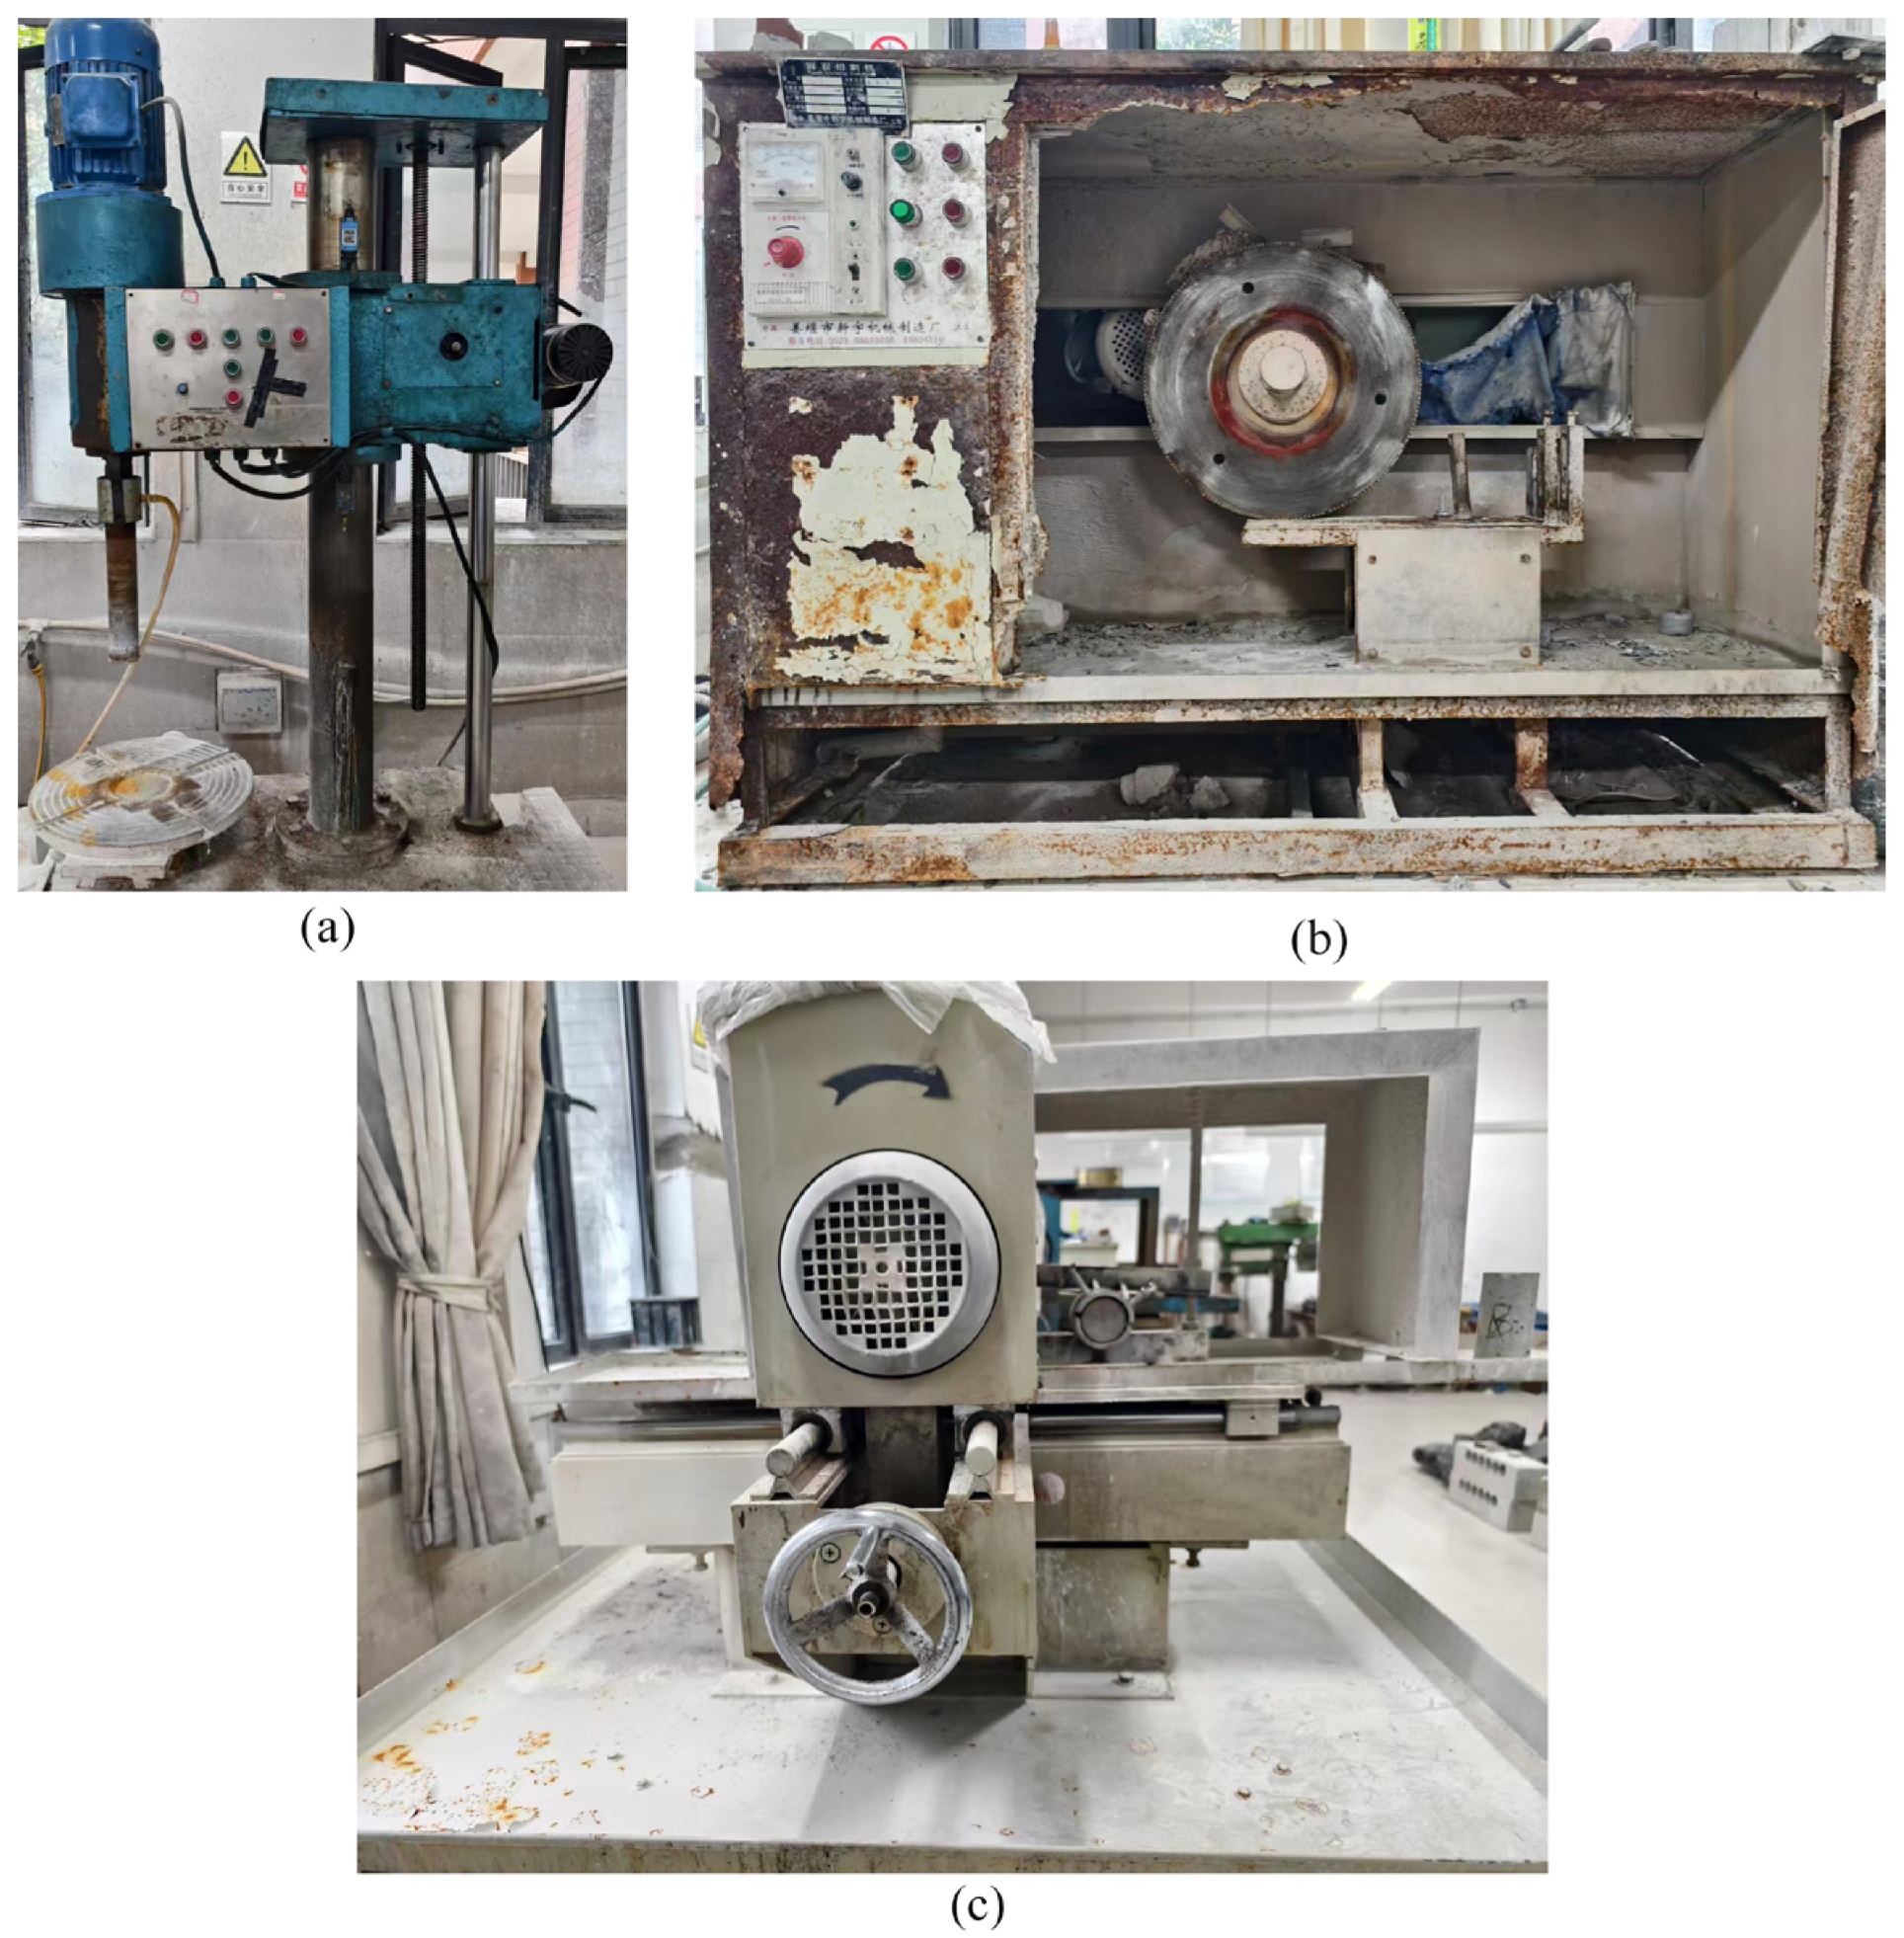
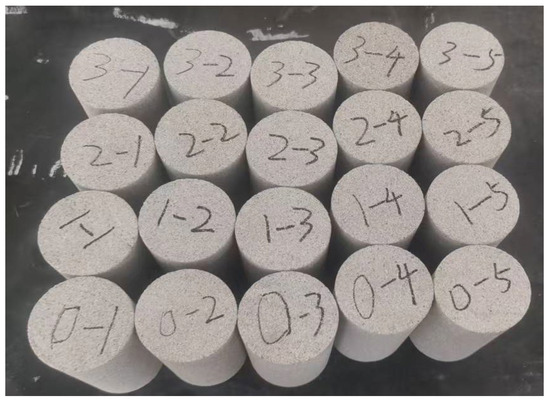
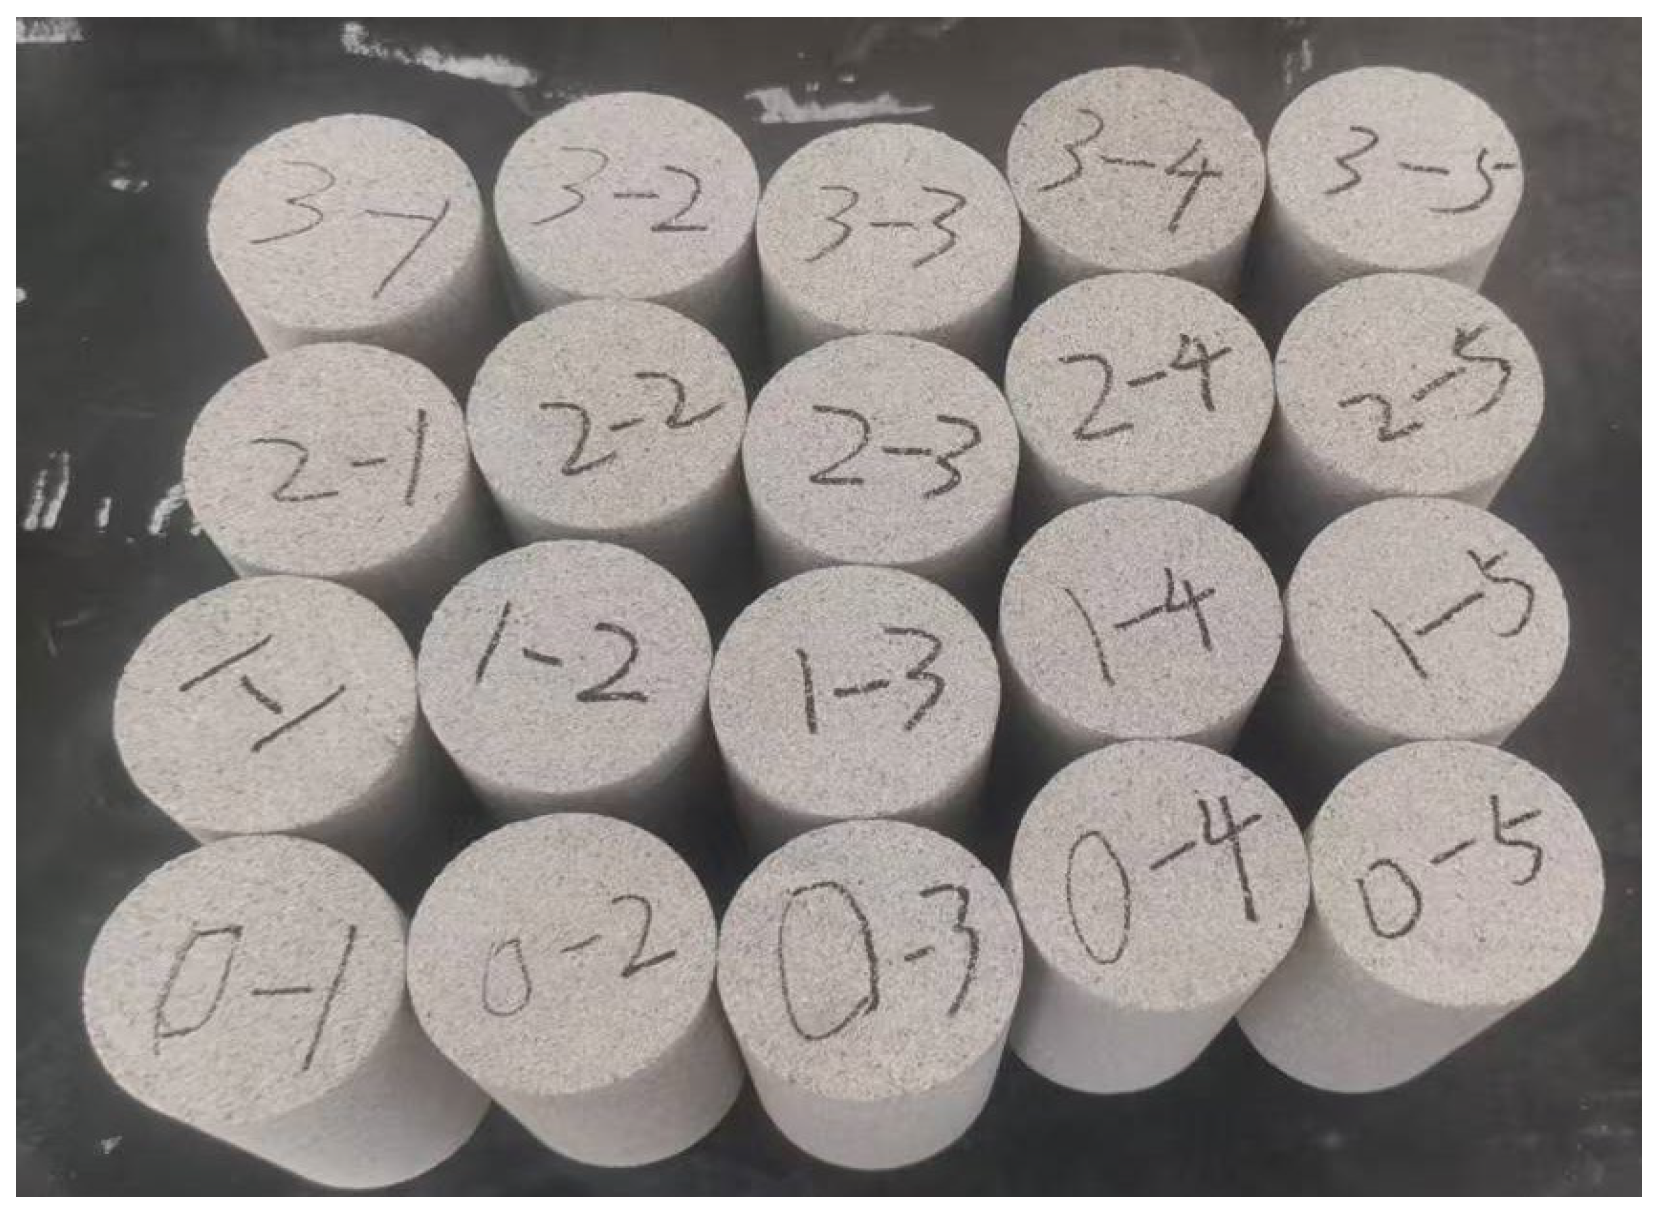
These rock samples were collected from the Yindonggou Coal Mine in Guyuan City, Ningxia Province, in western China. White sandstone with a uniform texture and free from cracks was selected. Using a Zs-100 core sampler (Jiangsu Jiangyan Xinyu Machinery Manufacturing Factory, Taizhou, China), a DJ-1 rock cutter (Jiangsu Jiangyan Xinyu Machinery Manufacturing Factory, China), and an SHM-200 double-end grinding machine (China Cangzhou Huayun Experimental Instrument Co., Ltd., Cangzhou, China) (see Figure 1), the samples were prepared into standard cylindrical specimens measuring 50 mm in diameter and 100 mm in height, following the ISRM suggested methods [31]. The prepared sandstone samples are shown in Figure 2. The samples were divided into four groups based on the number of freeze–thaw cycles, with five samples in each group.
Figure 1.
Sample preparation (a). Core Sampler (b). Rock Cutter (c). Grinding machine.
Figure 2.
Sandstone samples.
- (1)
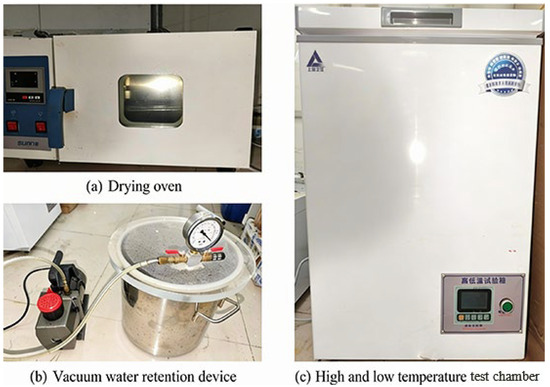
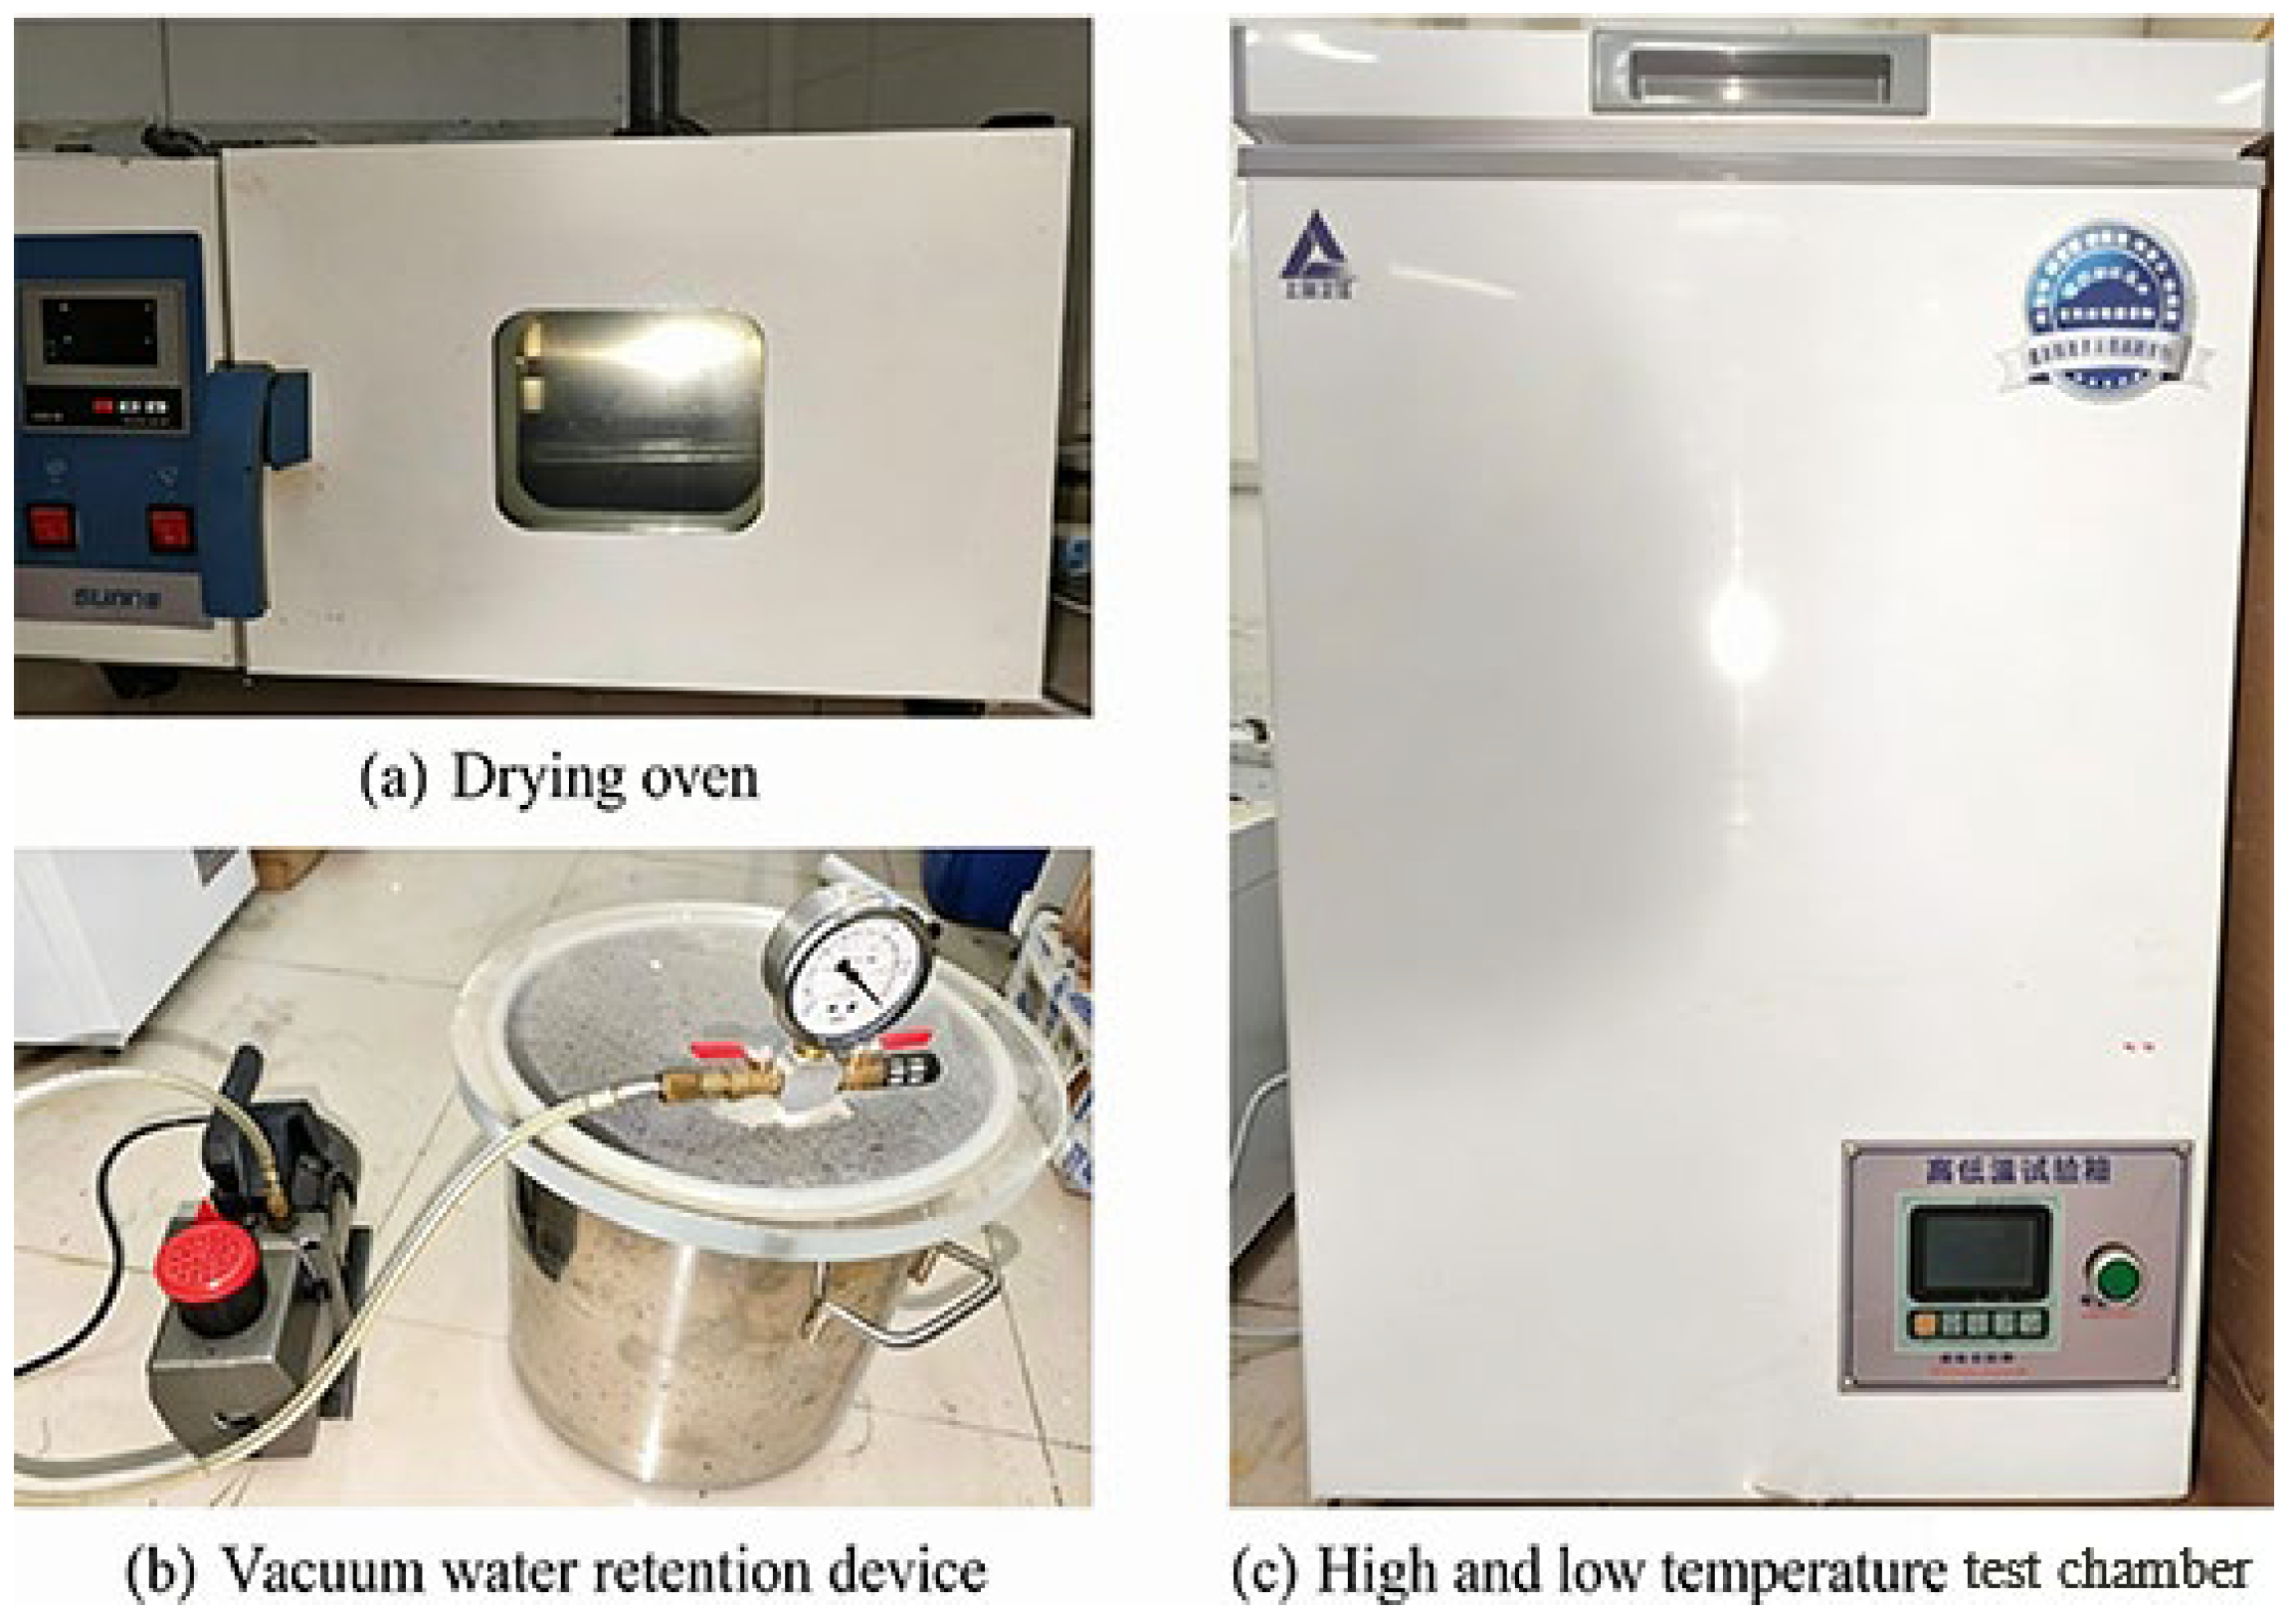
- The prepared samples were first placed in an oven at 105 °C to dry until their mass stabilized, as illustrated in Figure 3a.Figure 3. Schematic illustration of the experimental setup. (a) Dring oven (b) Vacuum water retention device (c) High low temperature test chamber.
- (2)
- The dried samples were then immersed in water and subjected to vacuum saturation using a vacuum saturation apparatus (see Figure 3b). The samples were initially exposed to a vacuum of −0.1 MPa for 1 h, followed by a 12 0 h rest period to ensure complete saturation.
- (3)
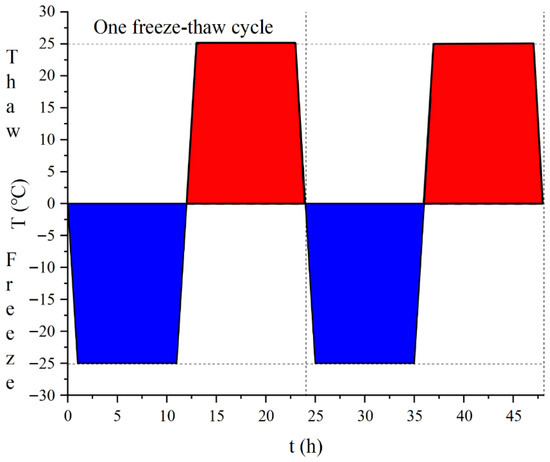
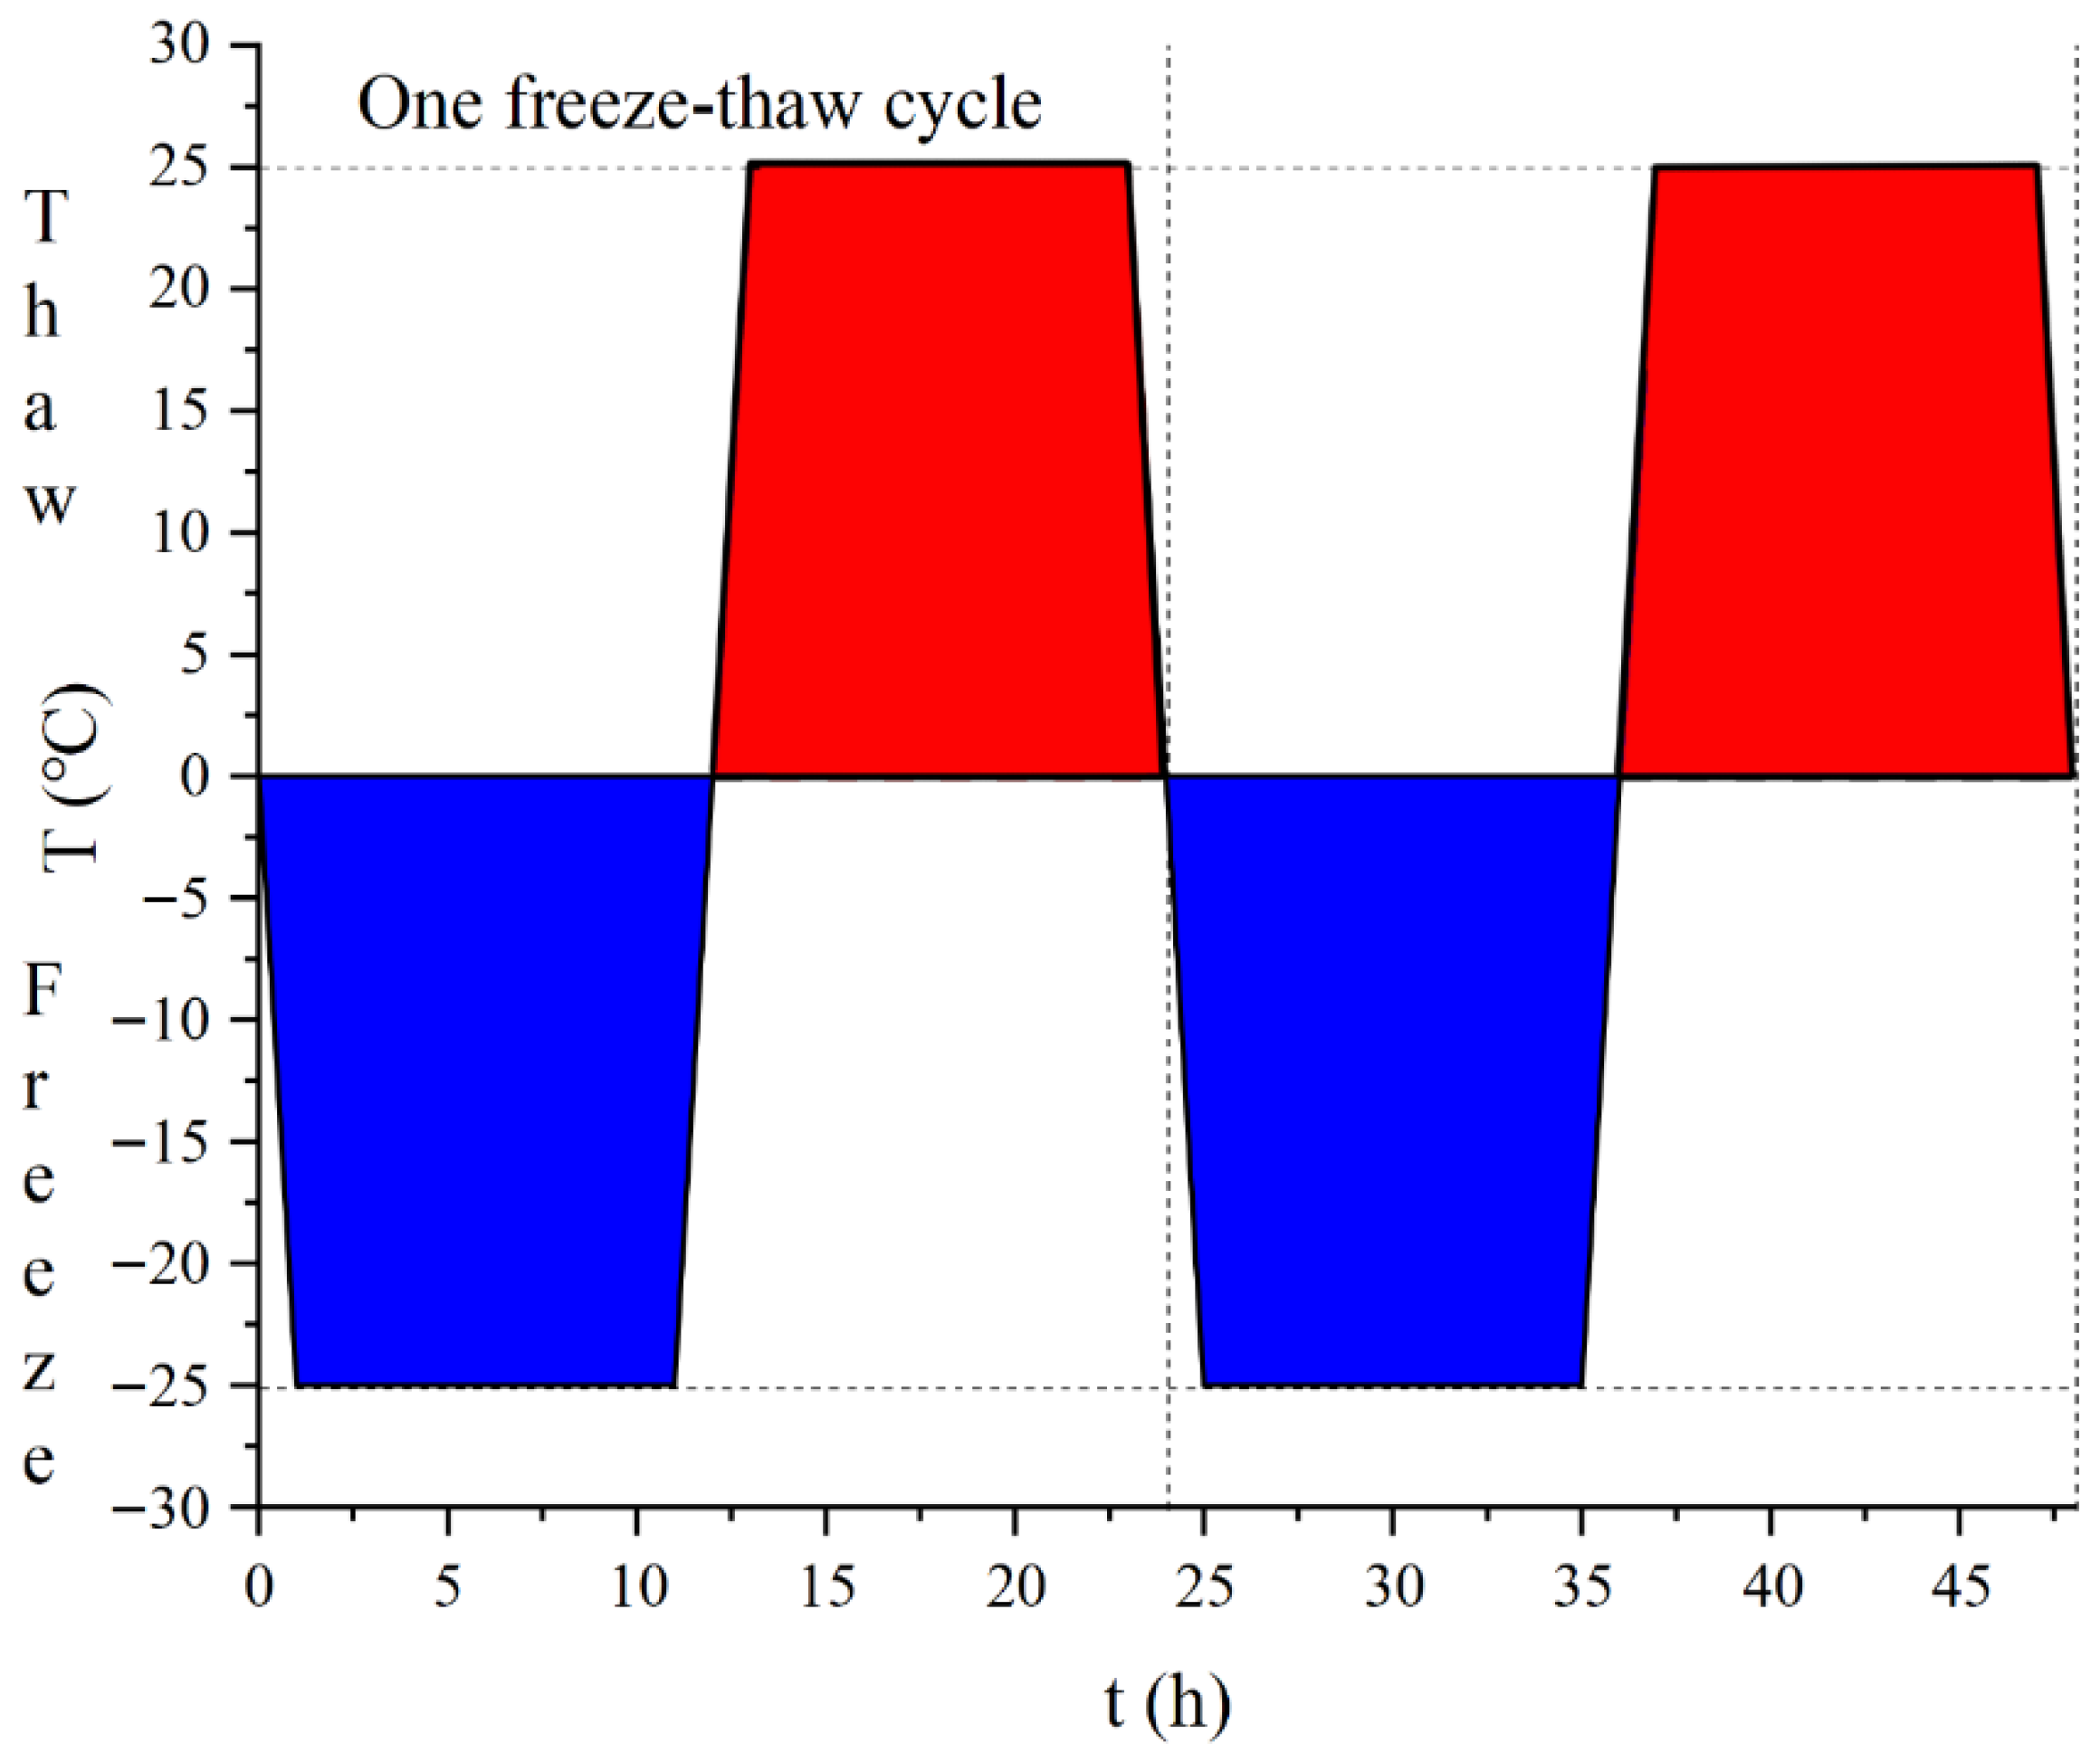
- The fully saturated samples were subsequently placed in a temperature-controlled cycling chamber (see Figure 3c), with the temperature varying between −25 °C and 25 °C. Each freeze–thaw cycle lasted 12 h. The samples were subjected to 15, 30, and 45 freeze–thaw cycles. Each test consists of five duplicate samples, respectively; the corresponding temperature variation curves during the cycling process are presented in Figure 4.Figure 4. Temperature variation during freeze–thaw cycles.
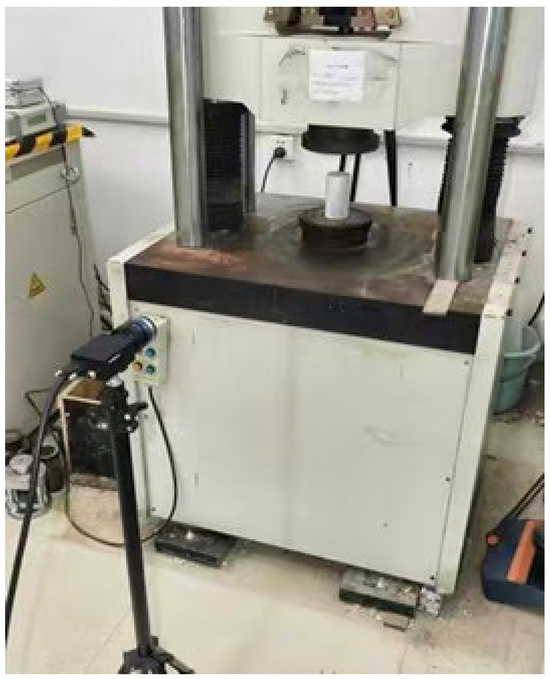
Mechanical testing was performed using a computer-controlled servo-hydraulic universal testing machine. Displacement-controlled loading was applied at a rate of 0.06 mm/min until specimen failure occurred. Prior to loading, a layer of white paint was sprayed onto the specimen surface. After the paint had dried, a black speckle pattern was applied by spraying black paint onto the surface. During the loading process, an industrial camera was used to capture images at a rate of two frames per second to record changes on the specimen surface, as shown in Figure 5.
Figure 5.
Experimental setup showing the universal testing machine and industrial camera.
3. Results
3.1. Mechanical Characterization
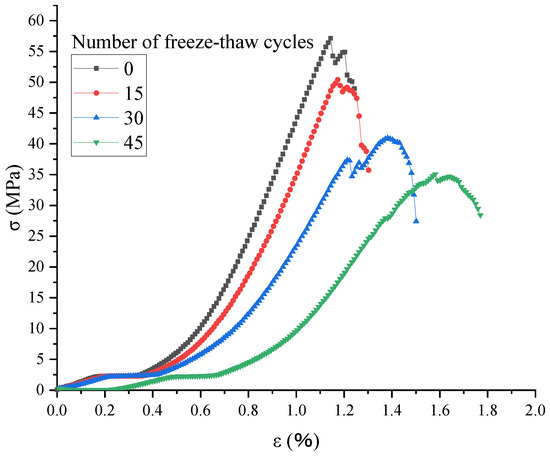
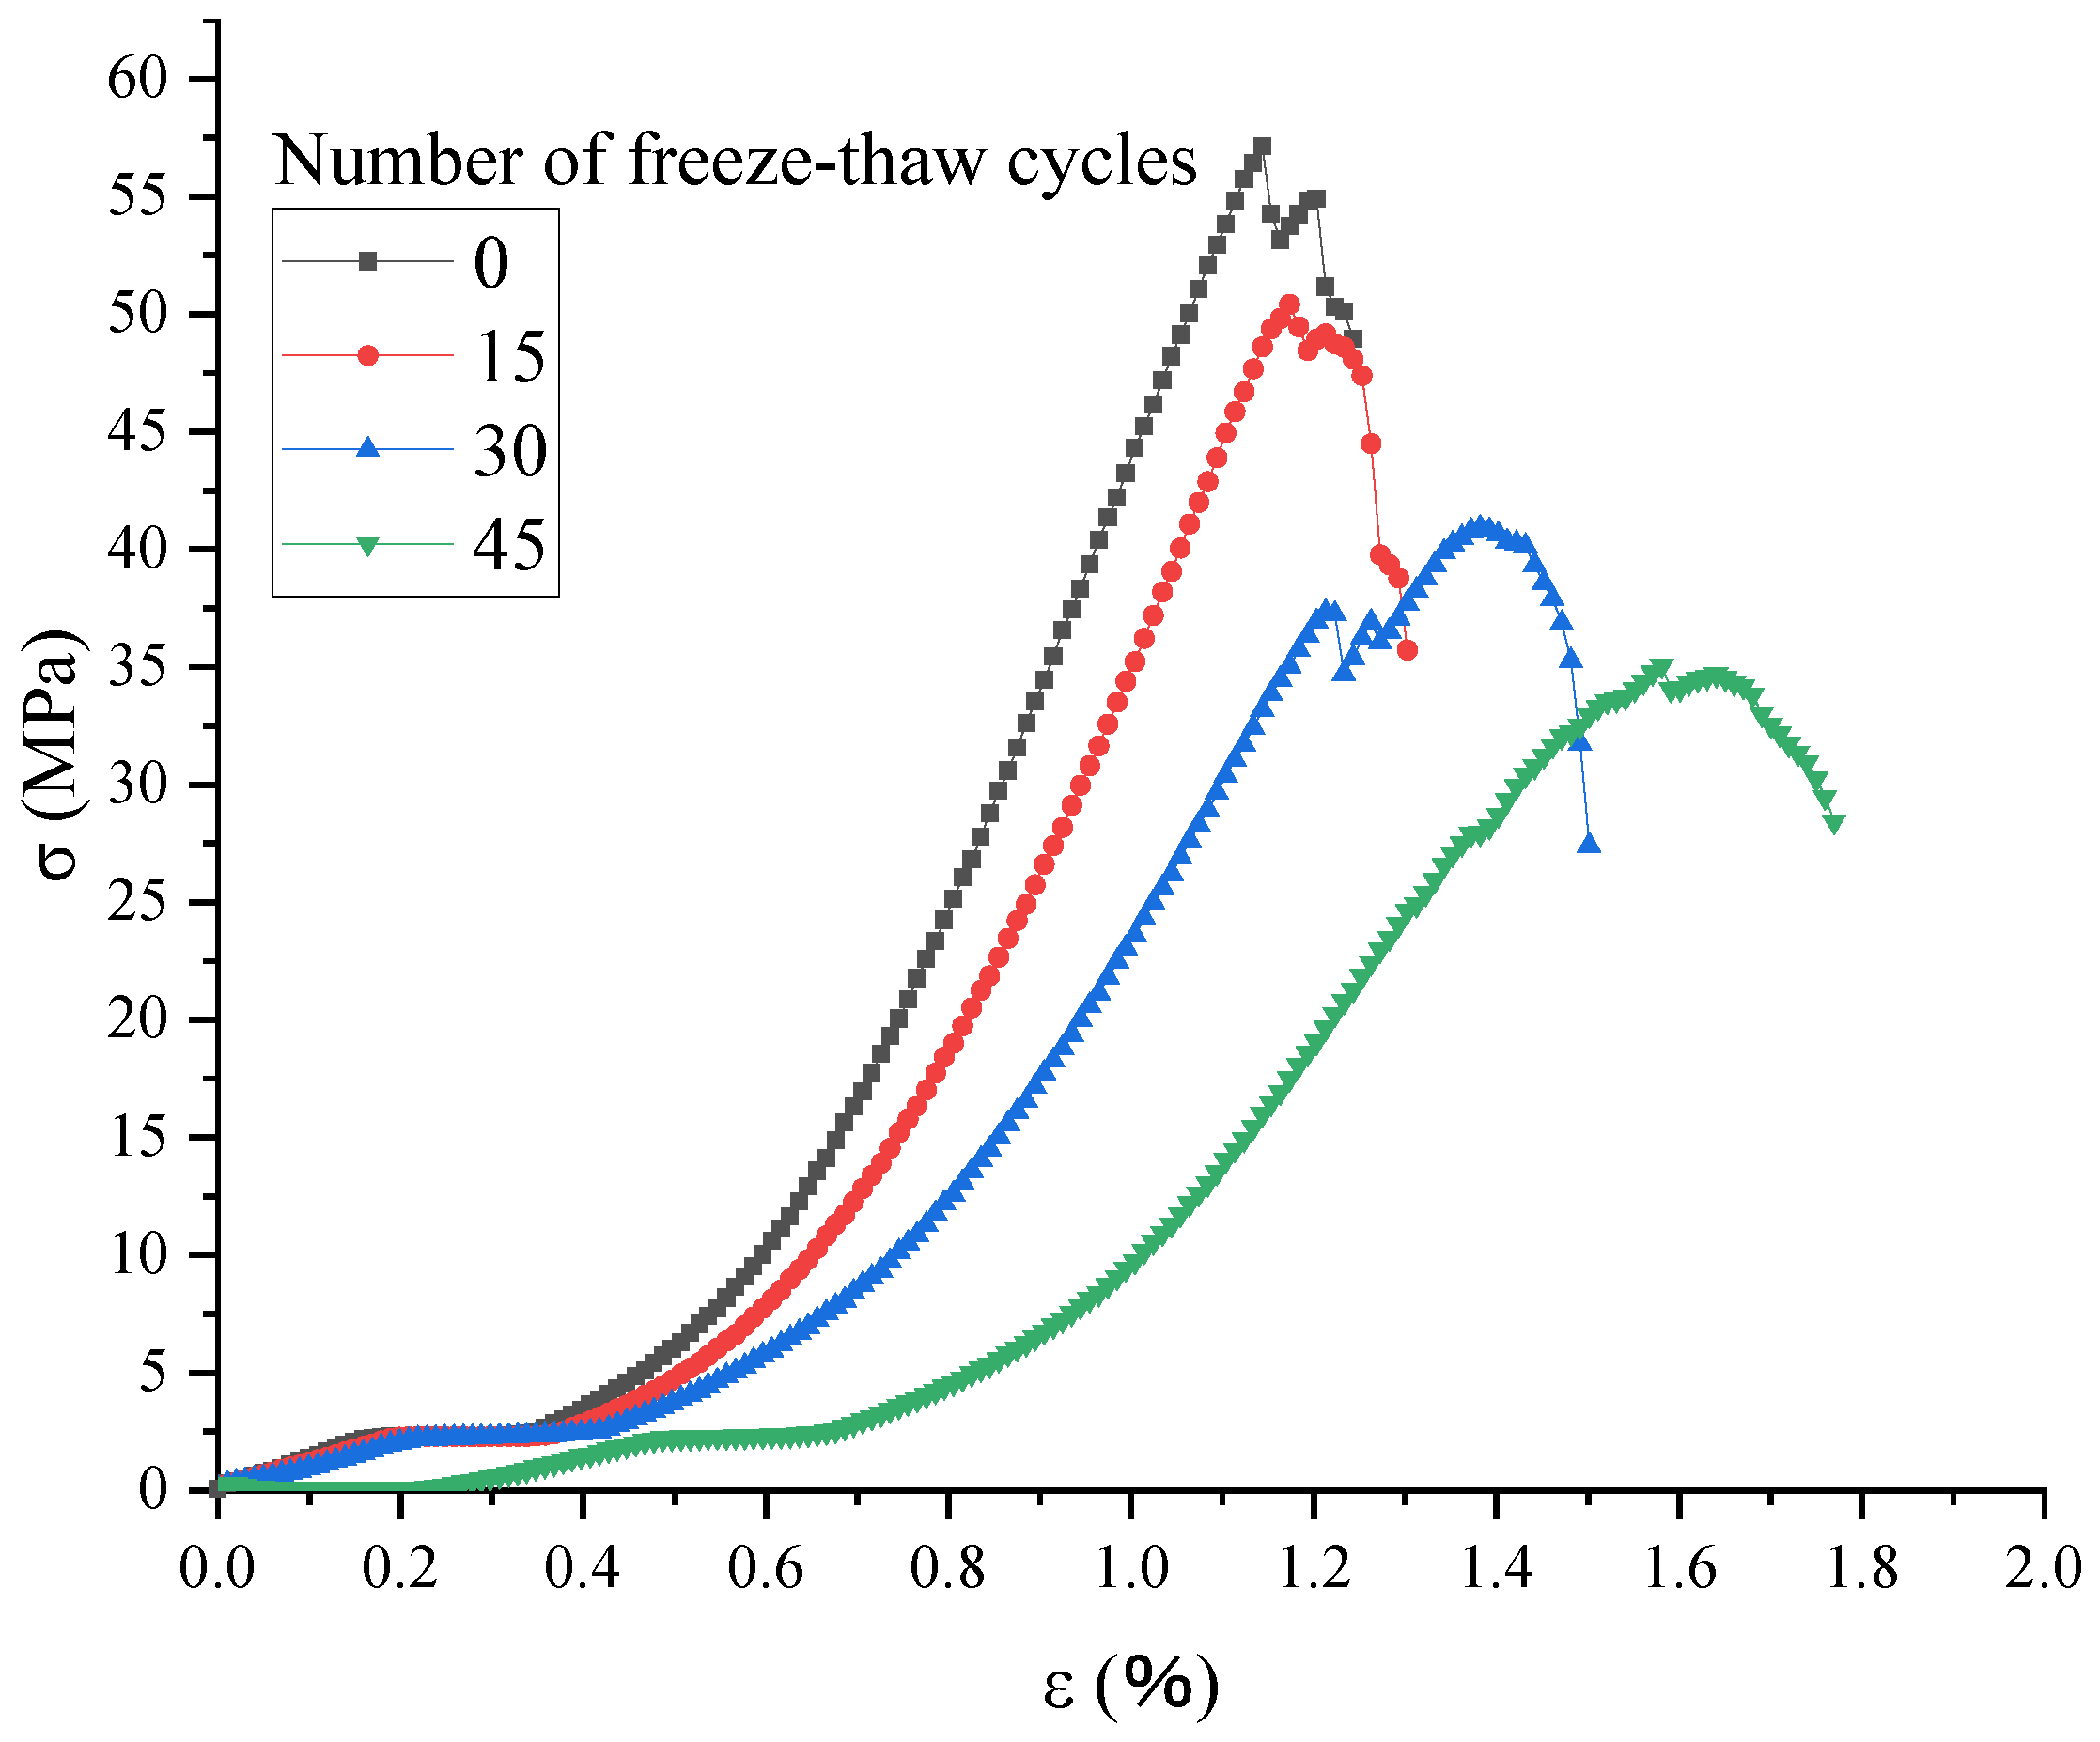
Figure 6 presents the uniaxial compressive stress–strain curves of white sandstone subjected to different numbers of freeze–thaw cycles. As illustrated, the stress–strain curves under varying freeze–thaw cycles exhibit similar trends and can be divided into four distinct stages from loading to failure: the compaction stage (characterized by a concave nonlinear increase), the elastic stage (characterized by an approximately linear increase), the plastic deformation stage (during which the curve slope gradually decreases and cracks begin to initiate within the specimen), and the failure stage (marked by a rapid stress drop and specimen failure). With an increasing number of freeze–thaw cycles, the compaction stage of the white sandstone extends progressively, the peak strain increases, and the peak stress exhibits a decreasing trend.
Figure 6.
Uniaxial compressive stress–strain curves.
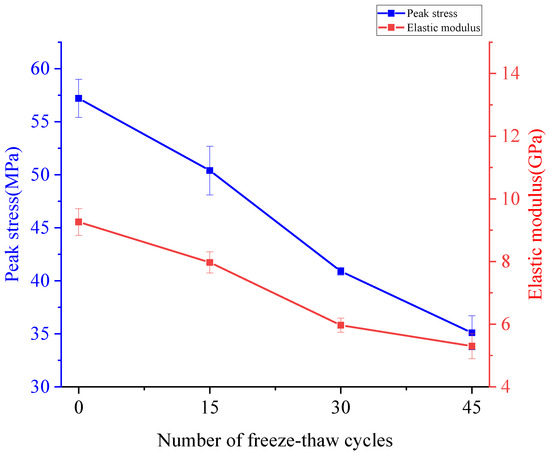
Figure 7 illustrates the variation in peak stress and elastic modulus of white sandstone with increasing numbers of freeze–thaw cycles. The elastic modulus was determined from the linear portion of the stress–strain curve. As shown in Figure 7, when the number of freeze–thaw cycles increased from 0 to 45, the peak stress decreased from 57.2 MPa to 35.1 MPa, representing a reduction of 38.6%, while the elastic modulus decreased from 9.2 GPa to 5.3 GPa, corresponding to a reduction of 42.3%. Notably, the most significant decreases in both peak stress and elastic modulus occurred between 15 and 30 freeze–thaw cycles: peak stress dropped from 50.4 MPa to 40.9 MPa (a reduction of 18.8%), while the elastic modulus declined from 8.0 GPa to 5.9 GPa (a reduction of 26.3%).
Figure 7.
Variation in peak stress and elastic modulus with freeze–thaw cycles.
In summary, freeze–thaw cycles exert a significant deteriorating effect on the mechanical properties of white sandstone, substantially reducing both its strength and deformation resistance. This degradation arises from two primary mechanisms: the volumetric expansion and contraction of the rock matrix due to temperature variations, and the frost heaving pressure generated when pore water freezes into ice. The combined action of these factors induces interparticle slippage within the rock, promoting the gradual propagation of existing cracks and the formation of new micropores and microcracks. During subsequent thawing, water infiltrates these newly formed discontinuities, further widening them in the following freezing cycle. As the number of freeze–thaw cycles increases, more water penetrates the micropores and microcracks, thereby exacerbating the progressive damage. However, after a certain number of cycles, the pore water within the rock undergoes repeated freezing and thawing, and the incremental damage per cycle becomes less pronounced as the internal structure reaches a more stable damage state.
3.2. Crack Propagation Analysis
Digital Image Correlation (DIC) is a non-contact optical measurement technique used to quantify surface deformation and displacement fields [32]. It enables full-field monitoring of deformation on the specimen surface. Compared with conventional displacement sensors, DIC provides a more intuitive means of observing minute deformations on the specimen surface. By analyzing changes in the deformation field, the onset of microscopic damage can be detected, and the entire process of crack propagation can be recorded and analyzed.
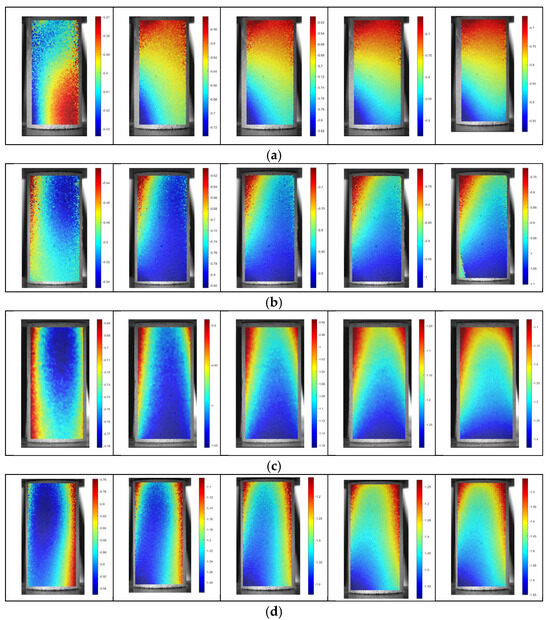
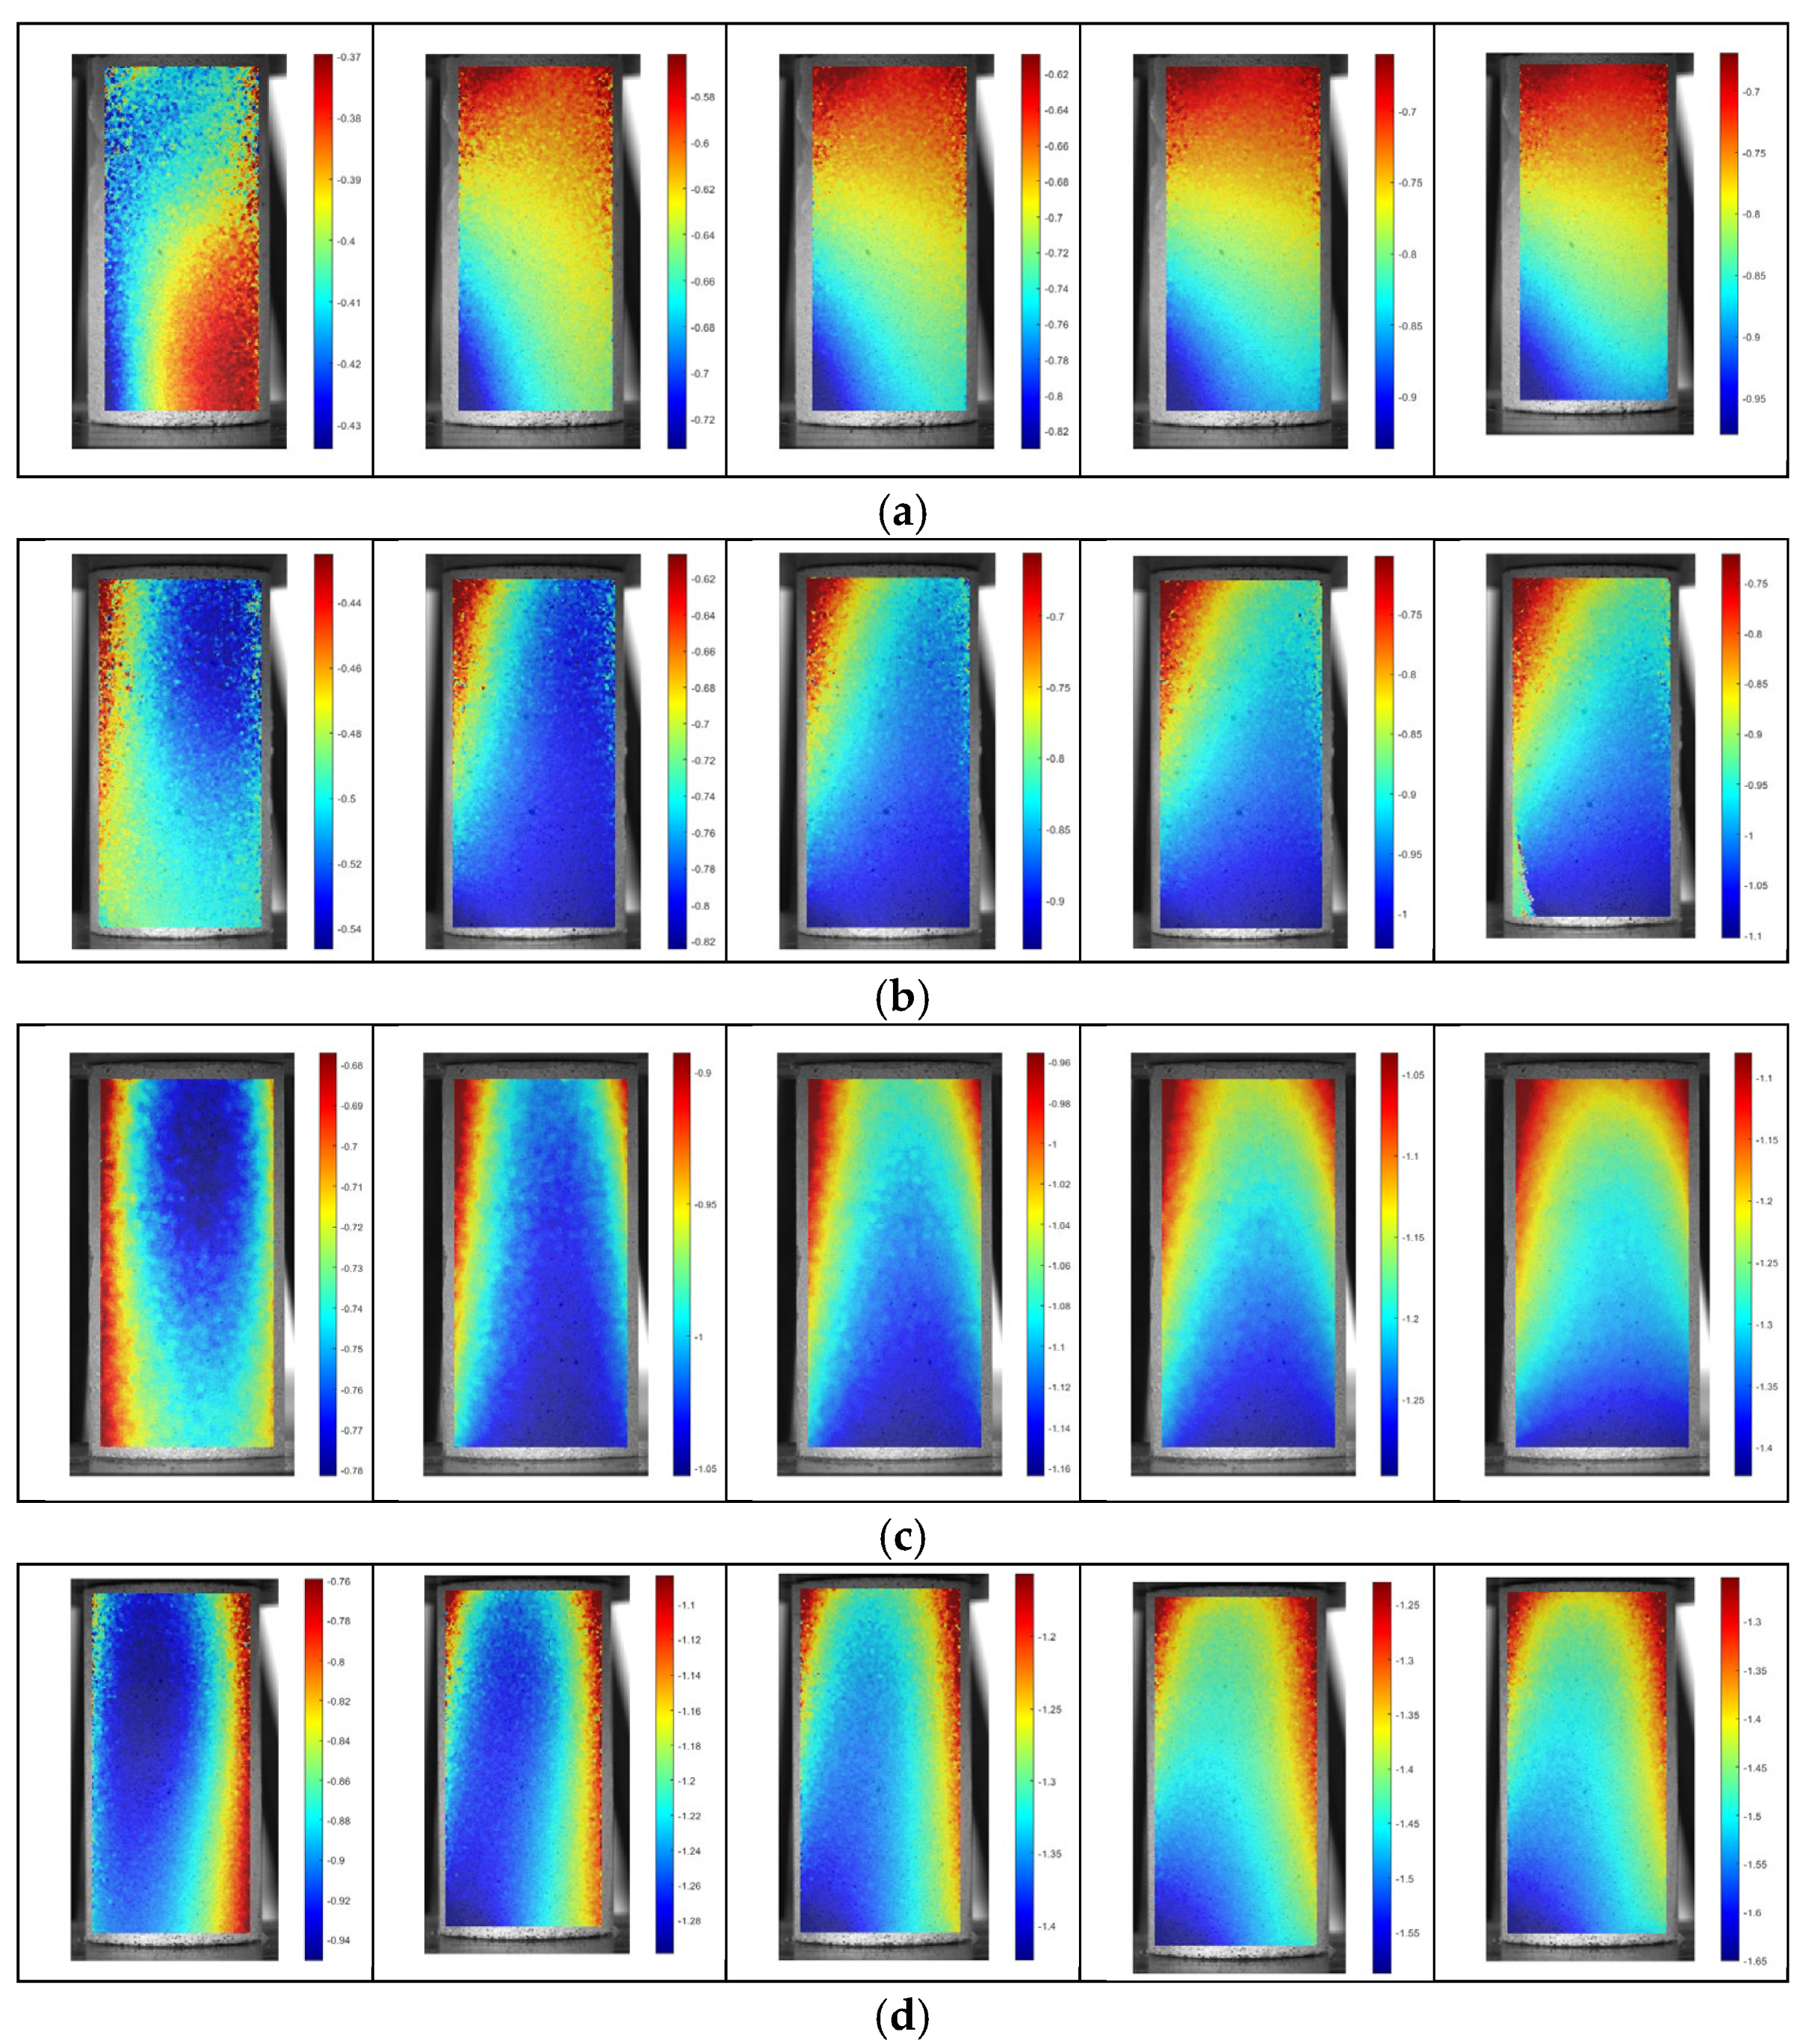
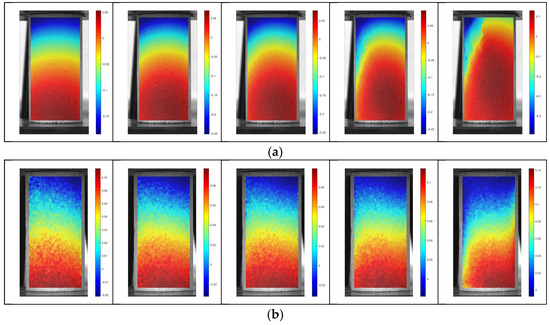
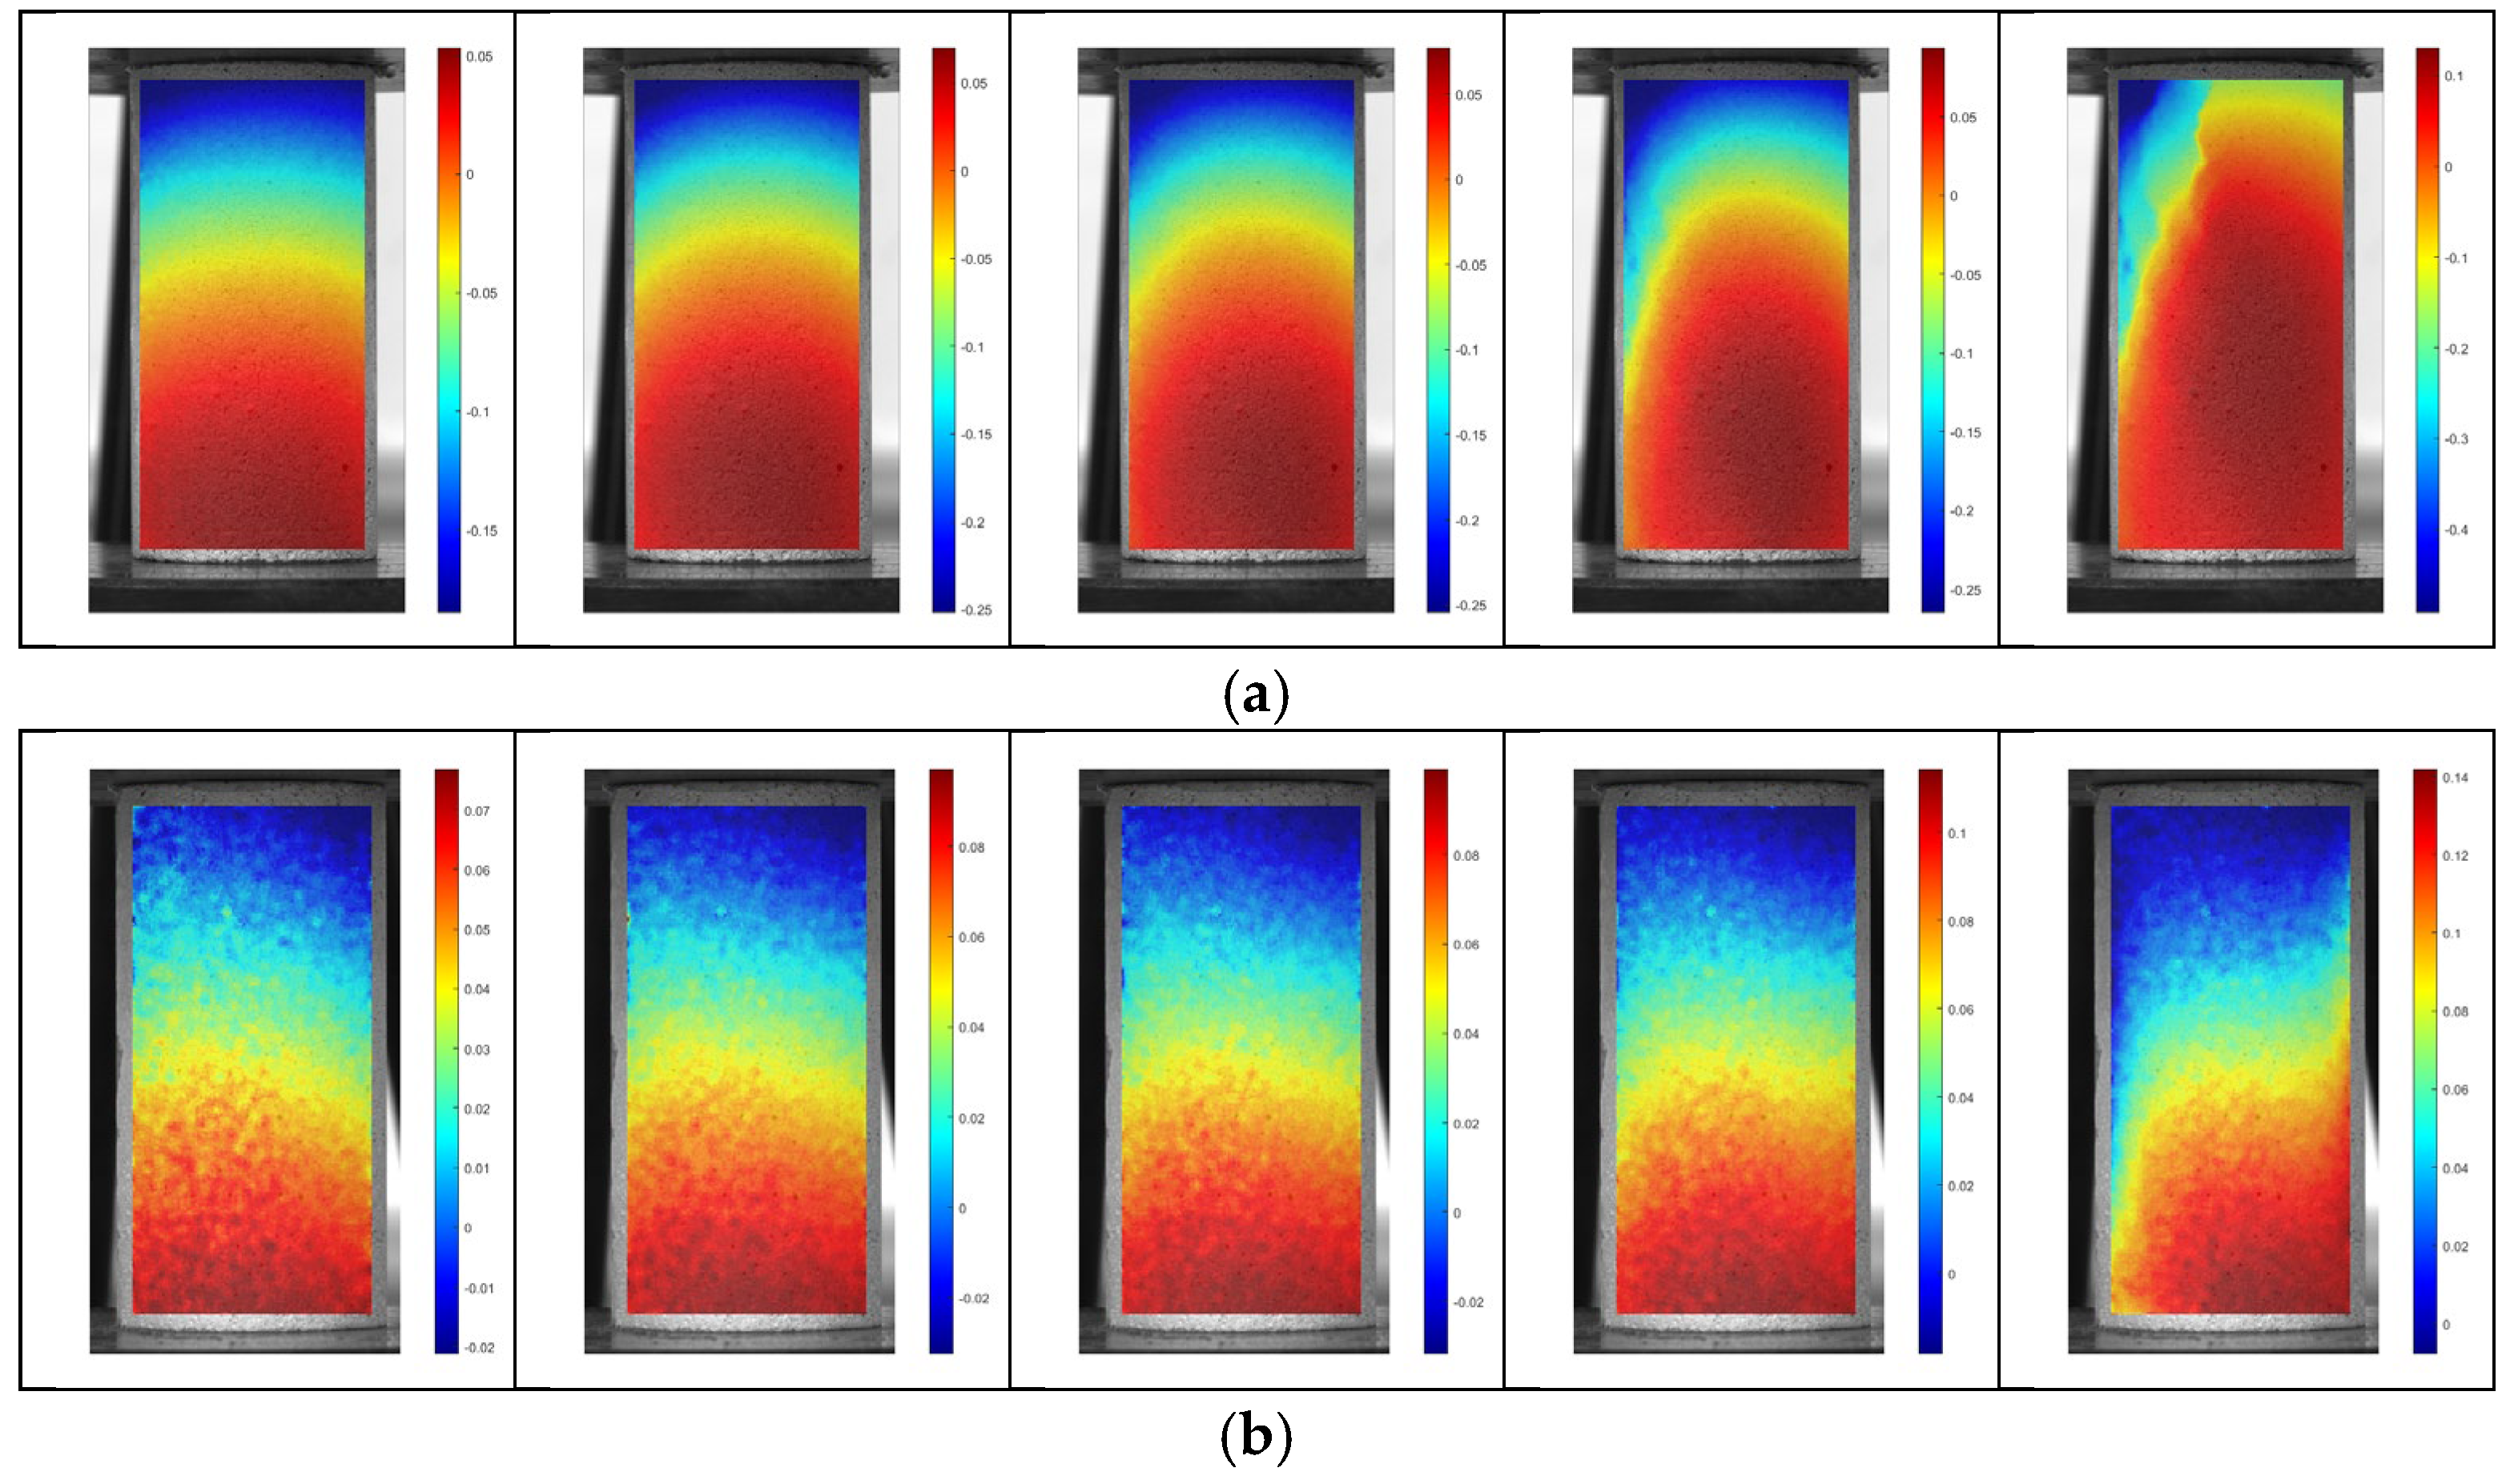
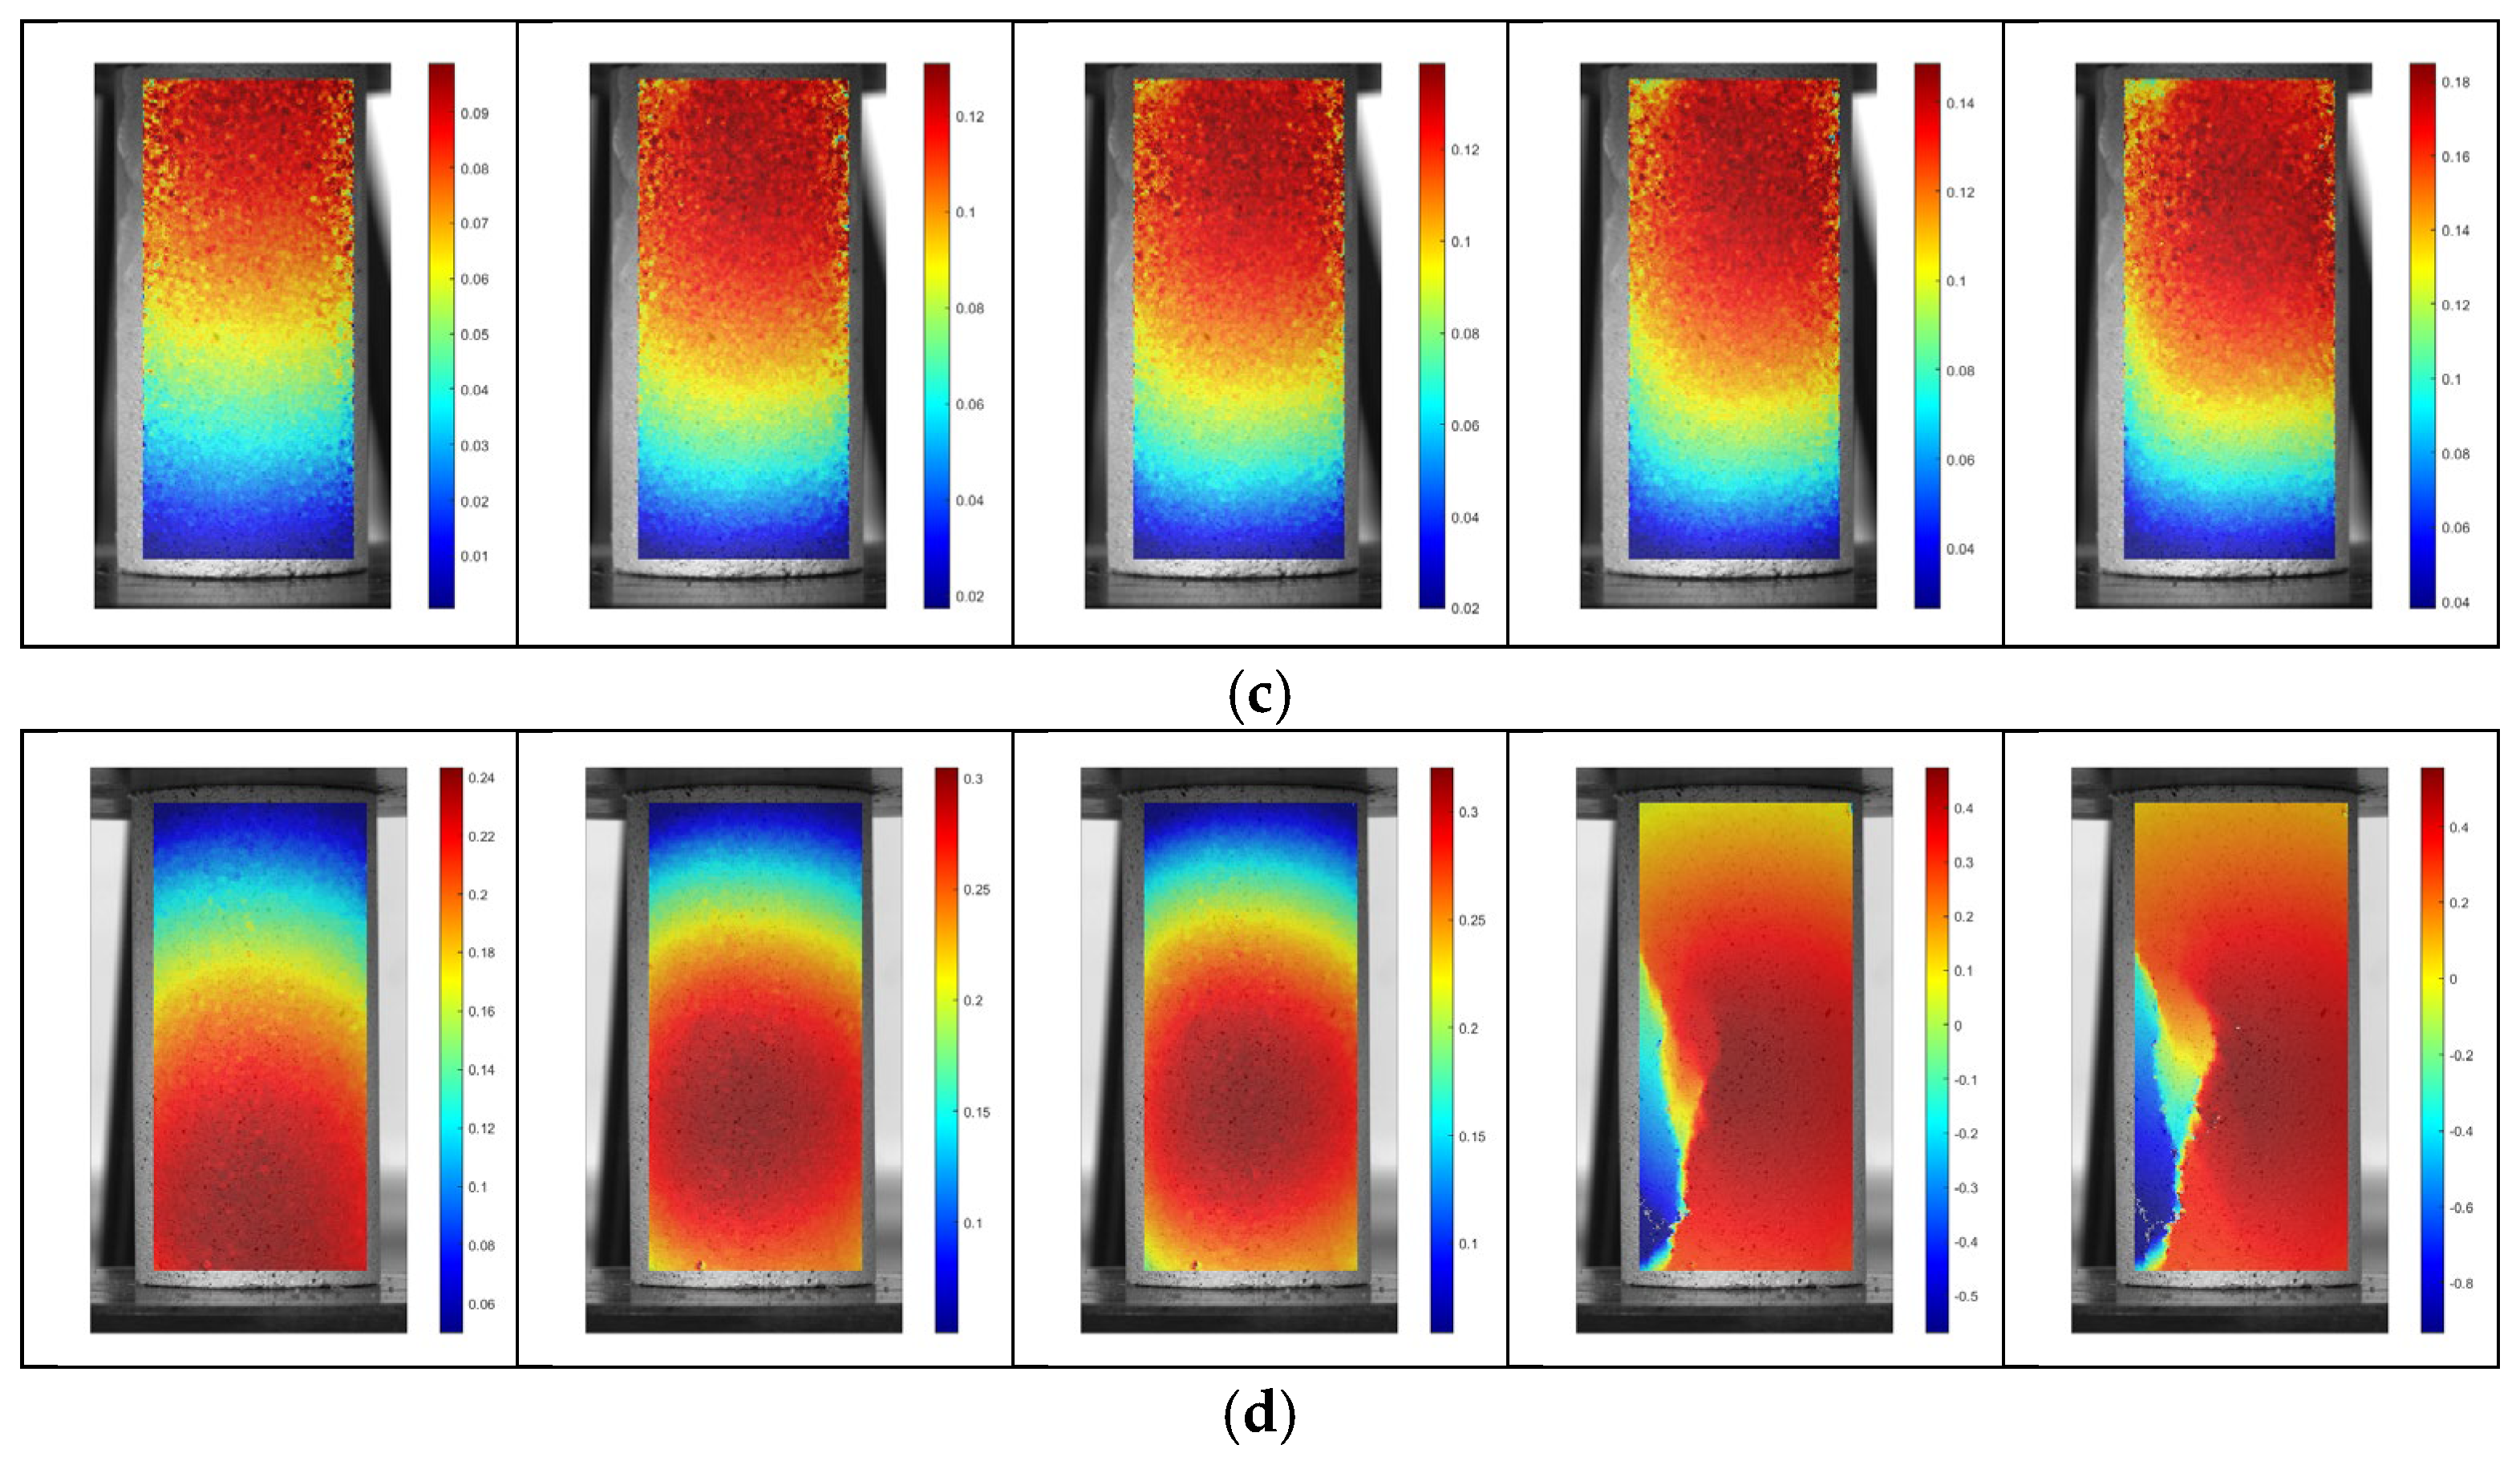
In this study, digital images of the speckled specimen surface were captured using an industrial camera. Digital image correlation (DIC) was employed to track displacement and strain fields throughout the uniaxial compression process, and the captured images were subsequently processed and analyzed using MATLAB R2023a to run Ncorr code. Horizontal strain, as well as horizontal and axial displacements, were analyzed at five stress levels prior to reaching the peak stress (σc): 10% σc, 50% σc, 70% σc, 90% σc, and 100% σc. After analyzing all samples, slight discrepancies were observed in the strain and displacement values for each group of samples; however, the overall trends were similar. One sample from each group is presented in this paper. In DIC analysis, displacement and strain follow the convention that tensile values are positive and compressive values are negative, as illustrated in Figure 8, Figure 9 and Figure 10.
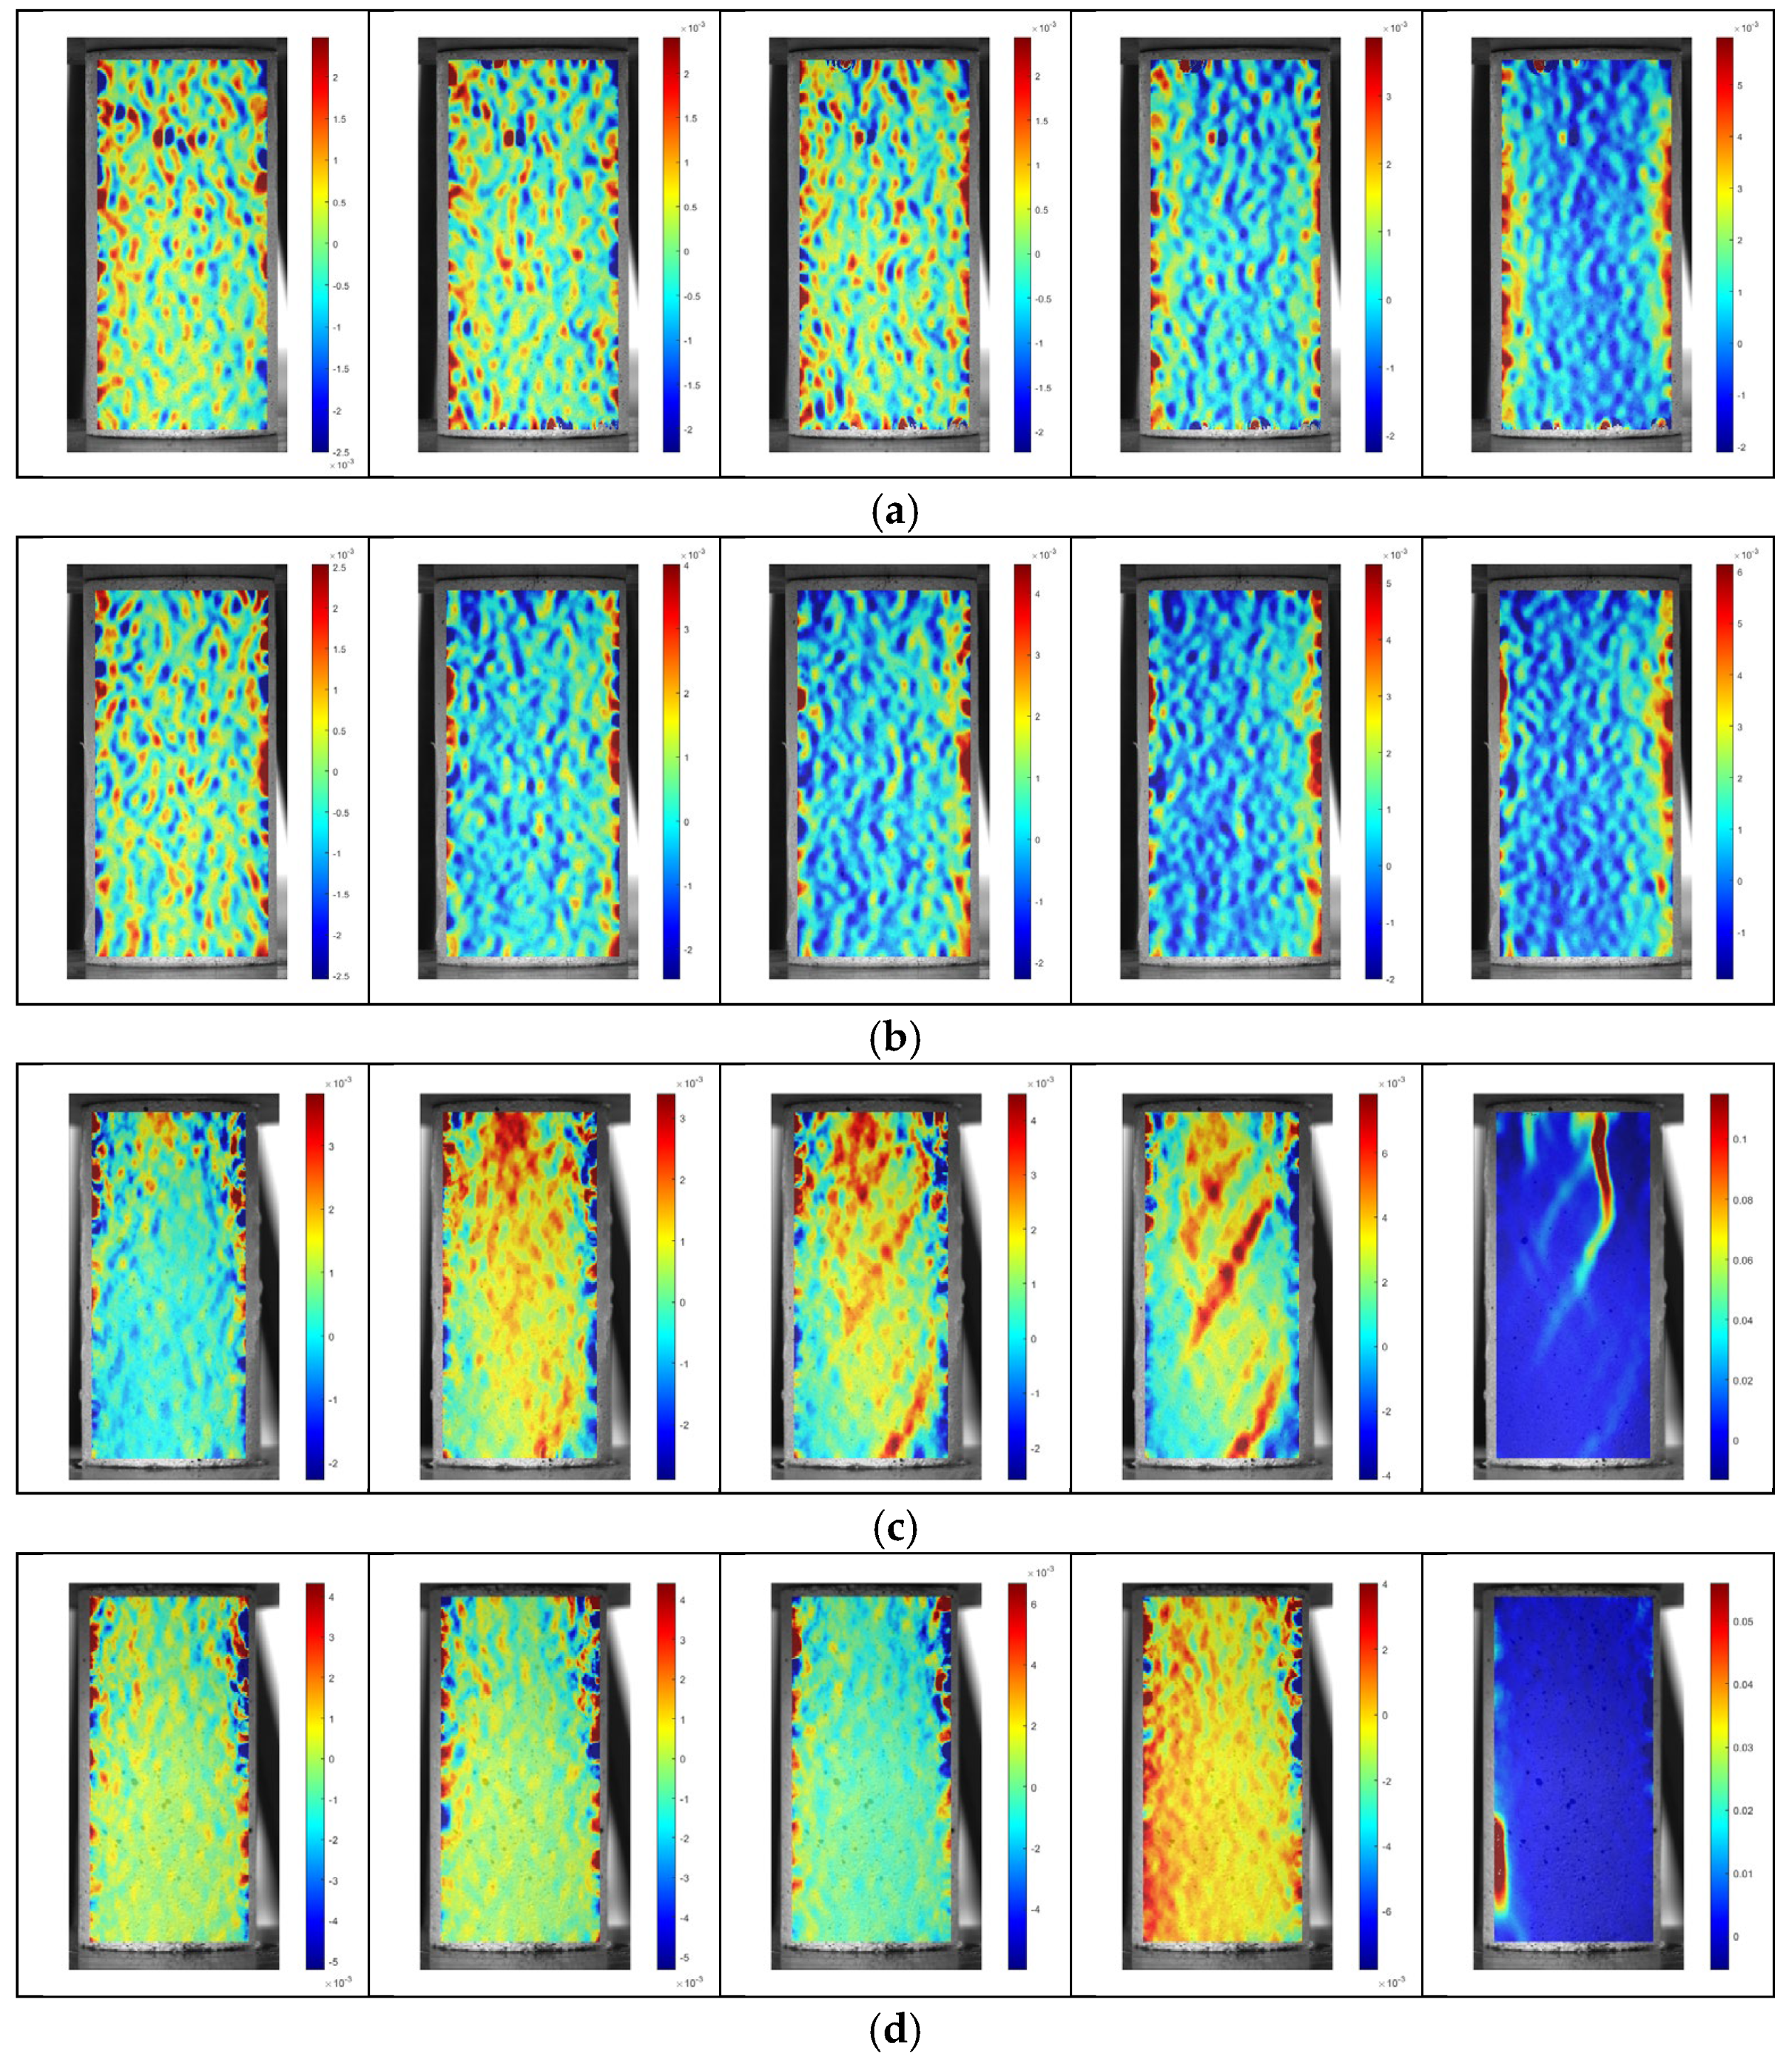
Figure 8.
Horizontal strain distribution contours of white sandstone samples subjected to different numbers of freeze–thaw cycles: (a) 0 cycles; (b) 15 cycles; (c) 30 cycles; (d) 45 cycles.
Figure 9.
Axial displacement distribution contours of white sandstone samples subjected to different numbers of freeze–thaw cycles: (a) 0 cycles; (b) 15 cycles; (c) 30 cycles; (d) 45 cycles.
Figure 10.
Horizontal displacement distribution contours of white sandstone samples subjected to different numbers of freeze–thaw cycles: (a) 0 cycles; (b) 15 cycles; (c) 30 cycles; (d) 45 cycles.
Figure 8 presents the horizontal strain distribution in white sandstone samples subjected to different numbers of freeze–thaw cycles. A comparison of the strain fields at various loading stages and freeze–thaw cycles reveals the following trends. As shown in Figure 8a, at 0 freeze–thaw cycles, during the early loading stage (10% σc), the specimen is in the compaction phase, characterized by low strain values and a disordered, random distribution of strain zones within the region of interest. At this stage, strain is primarily concentrated around internal defects and weak surfaces within the specimen. As the load increases to 50–70% σc, localized areas of elevated strain concentration begin to emerge, accompanied by the initiation of surface cracking. When the load further increases to 90% σc, the strain becomes more highly concentrated, and strain values continue to rise, indicating that cracks are propagating progressively with increasing strain. Notably, the regions of concentrated strain are predominantly distributed at the edges of the specimen, suggesting that microcracks at the edges converge and propagate first, subsequently leading to edge spalling. As the load approaches its peak, the strain becomes highly concentrated and strain values continue to rise, leading to continued crack propagation until failure occurs.
In Figure 8b the evolution of the strain field at 15 freeze–thaw cycles was generally similar to that observed at 0 cycles. However, as a result of freeze–thaw damage, the internal structure of the samples had been partially degraded, causing cracks at the edges to converge and propagate at an accelerated rate. Internal stress concentrations appeared earlier and became more pronounced, with higher stress values recorded. At 50% σc, stress concentration was observed on both sides of the specimen edges; as loading continued, the stress became increasingly concentrated and its magnitude increased further.
In samples subjected to 30 and 45 freeze–thaw cycles (Figure 8c,d), strain values were notably higher. Even under relatively low loads, strain concentration was evident at the specimen edges, and with increasing load, significant strain also developed in the central region. By the time the peak stress was reached, the samples had already experienced instability and failure. At this stage, after multiple freeze–thaw cycles, the internal structure of the rock had become more highly porous and its overall integrity had deteriorated substantially. The freeze–thaw cycles had severely compromised the load-bearing capacity of the rock.
Figure 9 and Figure 10 present the horizontal and axial displacement contour plots of the white sandstone samples. Image analysis reveals that during uniaxial compression, the axial displacement is predominantly distributed within the interior of the specimen, while the horizontal displacement is mainly concentrated at the upper and lower ends, exhibiting a distinct layered distribution. The magnitude of axial displacement is significantly greater than that of horizontal displacement. This is attributed to the fact that the axial stress applied to the specimen far exceeds the horizontal stress, and to the compaction of internal pores during loading.
As the number of freeze–thaw cycles increases, both axial and horizontal displacements at peak stress continue to rise. Axial displacement increases from a range of 0.7–0.95 mm to 1.3–1.65 mm, while horizontal displacement increases from a maximum of 0.1 mm to 0.4 mm. These observations indicate that freeze–thaw cycles exacerbate the deformation of the rock.
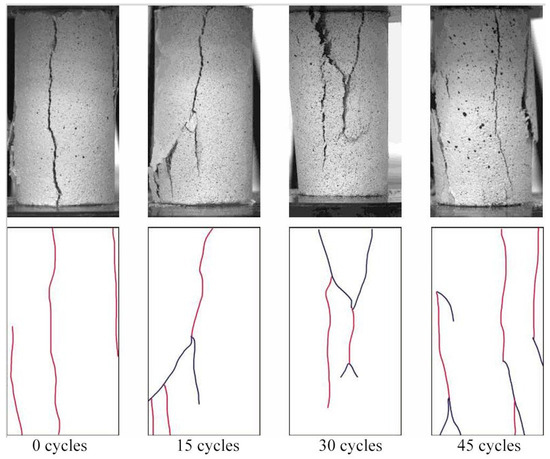
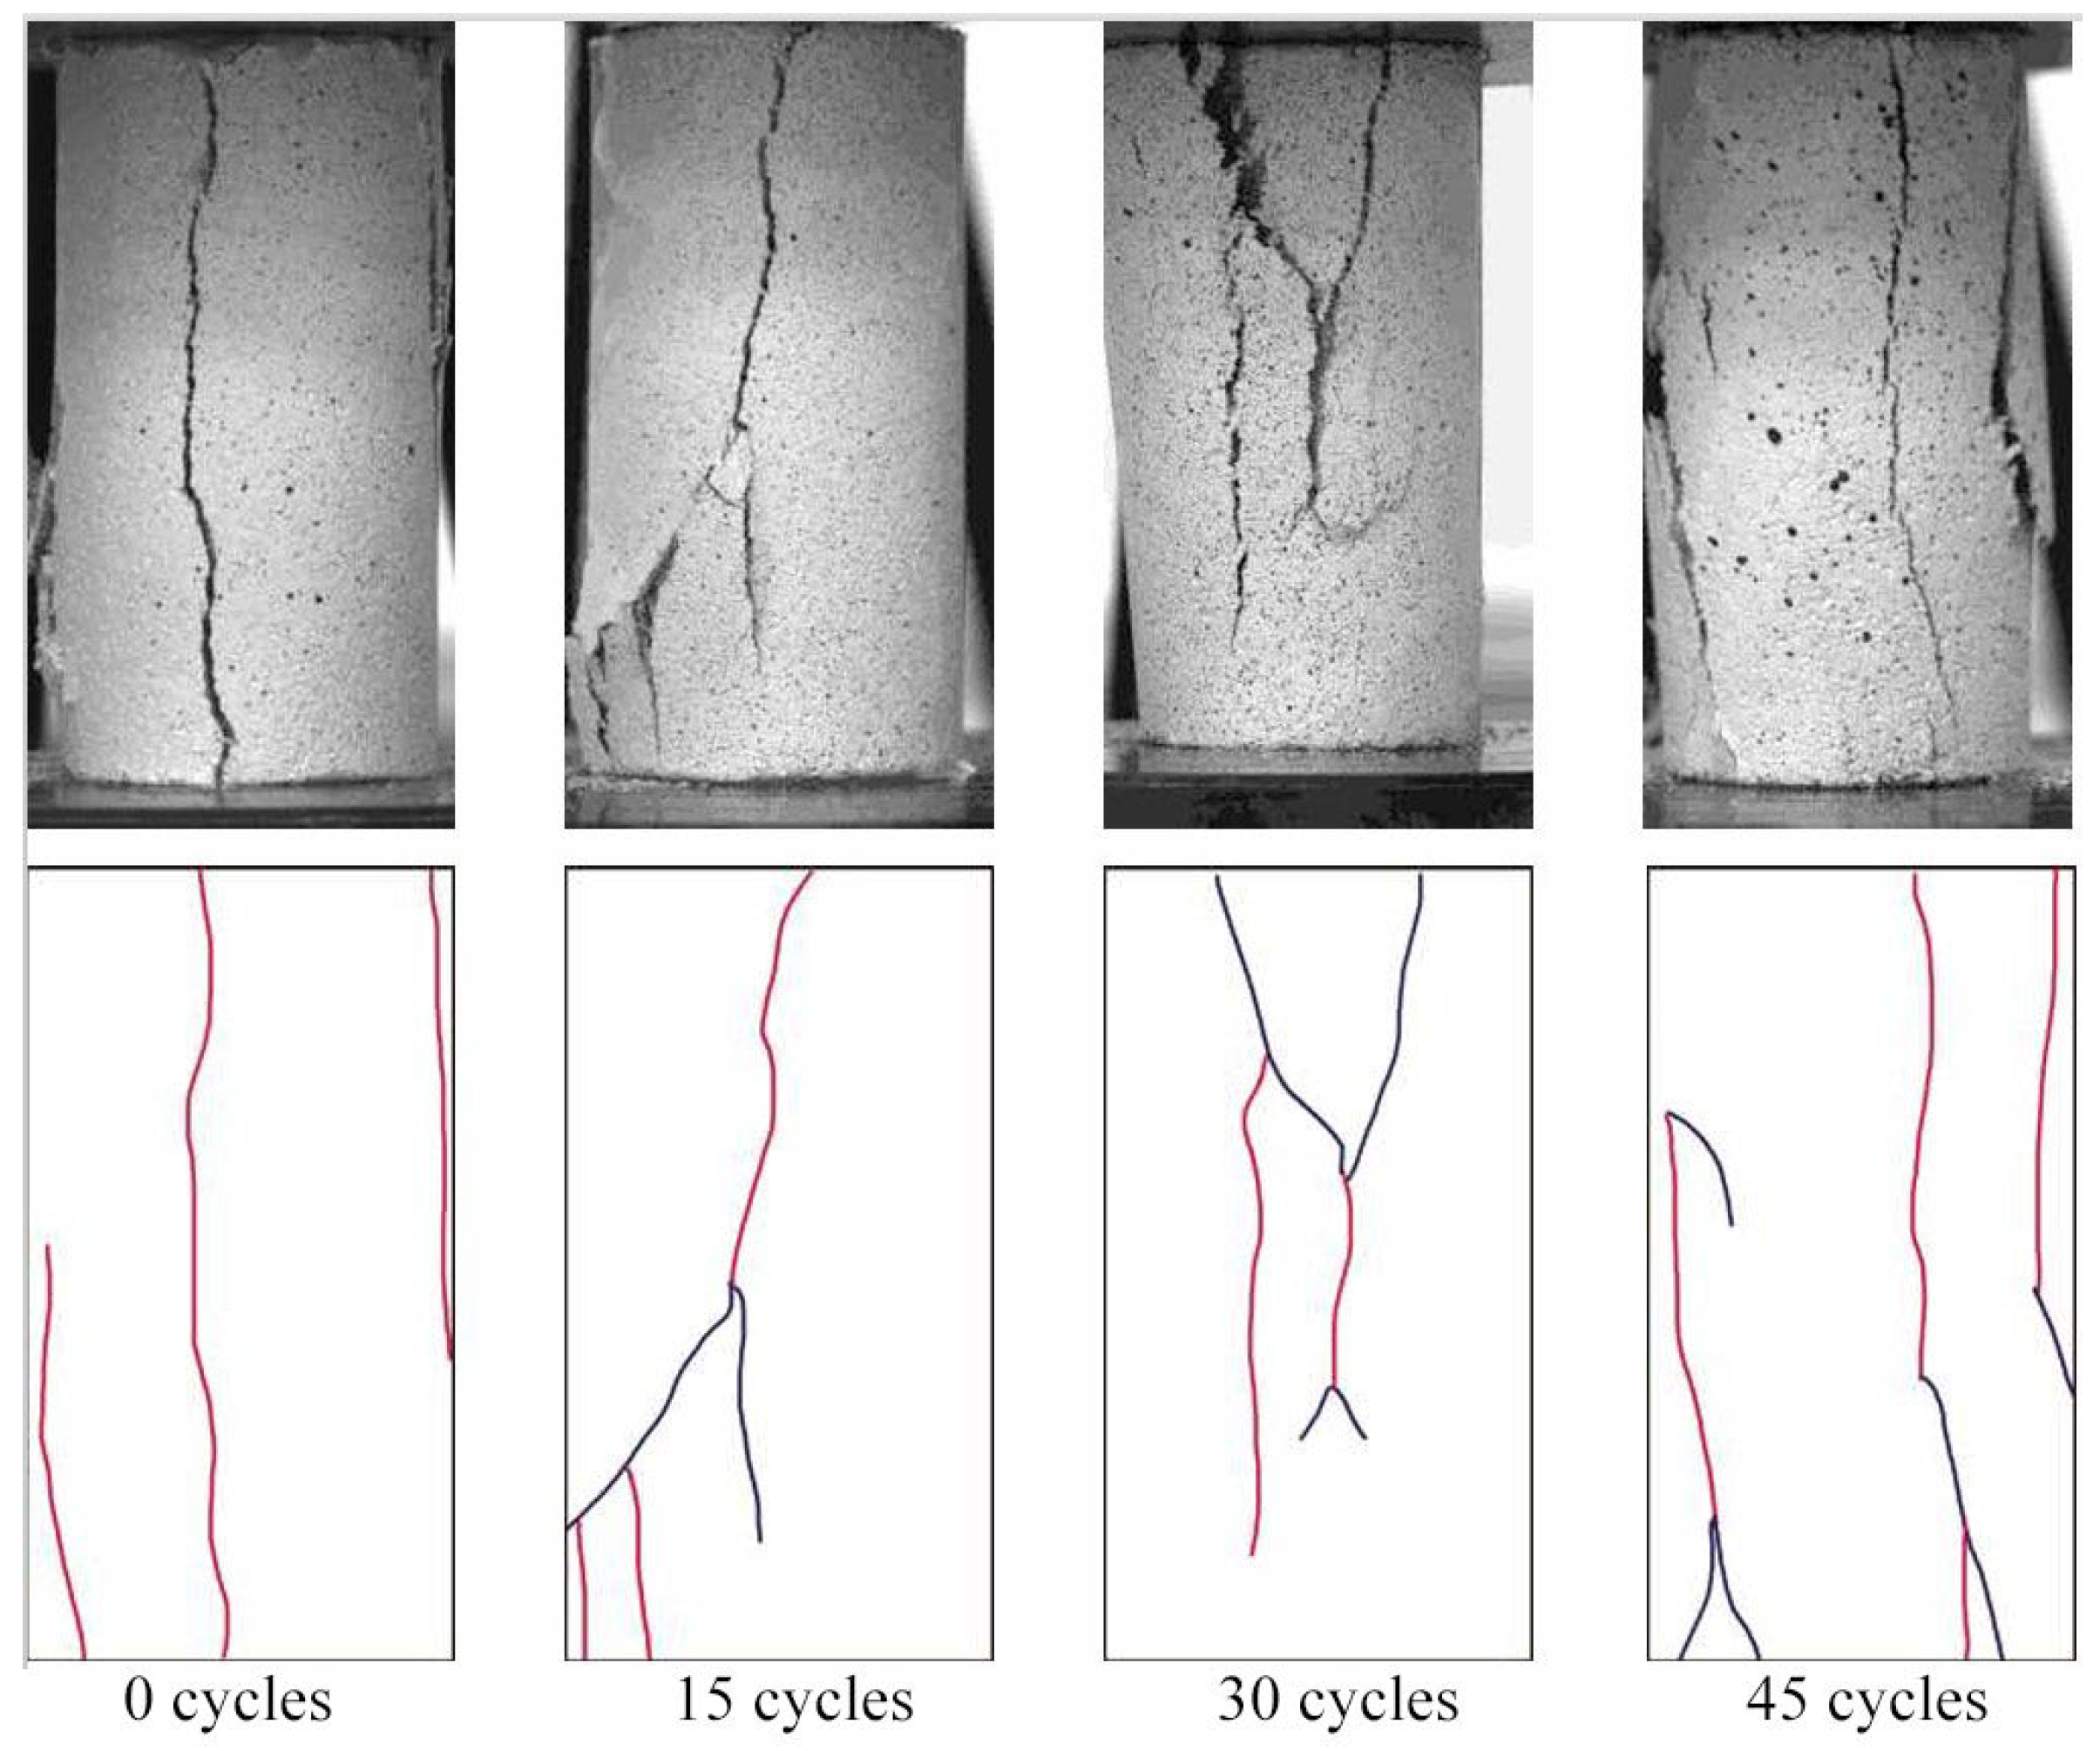
Figure 11 illustrates the failure modes of white sandstone samples subjected to different numbers of freeze–thaw cycles under uniaxial compression. As shown in Figure 11, with an increasing number of freeze–thaw cycles, the failure mode progressively transitions from tensile failure to combined tensile–shear failure.
Figure 11.
Failure modes of white sandstone subjected to freeze–thaw cycles under uniaxial compression.
At 0 freeze–thaw cycles, the cracks formed upon specimen failure consist primarily of a single dominant crack oriented roughly parallel to the axial direction, accompanied by secondary cracks developing at smaller angles to the axial direction. The resulting fragments are relatively large. After 15 freeze–thaw cycles, the number of cracks begins to increase, the inclination angle of the main crack becomes steeper, and Y-shaped cracks appear, indicating the development of a tensile–shear composite failure mode, with a small number of secondary tensile cracks accompanying the Y-shaped features. When the number of freeze–thaw cycles reaches 45, the crack density increases further, and the specimen becomes highly fragmented overall.
Zhang’s paper [33] classified the macroscopic cracks formed in freeze–thawed rock under uniaxial compression into five types: direct tensile crack (DT), relative tensile crack (RT), direct tensile–relative shear crack (TS1), relative tensile–direct shear crack (TS2), and relative tensile–relative shear crack (TS3). And he observed that the cracks on the sandstone specimens under lower freeze–thaw cycles are tensile cracks characterized by DT and RT. Under relatively high freeze–thaw cycles, the cracks of sandstone specimens are dominated by mixed tensile-shear cracks (i.e., TS1, TS2, and TS3).
This is consistent with the findings observed in this study. These observations indicate that freeze–thaw cycles progressively enhanced the development of internal pores within the rock, leading to more uniform damage distribution under applied loading.
4. Discussion
4.1. Estimation of Energy Distribution in the Freeze-Thawed White Sandstone Samples
According to the laws of thermodynamics, the process of rock deformation and failure is fundamentally governed by energy accumulation and dissipation. During deformation under stress, the rock undergoes four main types of energy conversion: absorption, accumulation, dissipation, and release. Energy dissipation reflects the development of damage within the rock, while energy release ultimately drives failure. If heat exchange with the external environment during testing is neglected, the total energy absorbed by the rock is partially converted into elastic strain energy stored within the material, and the remainder is converted into dissipated energy, consumed through irreversible plastic deformation, damage evolution, frictional sliding, and thermal radiation. This study involves uniaxial compression tests, and the relevant energy density formulation is given as follows [34]:
where U is the total energy absorbed by the rock (MJ/m3), Ue is the elastic strain energy stored within the rock (MJ/m3), Ud is the dissipated energy (MJ/m3), σ is the axial stress (MPa), ε is the axial strain, E is the elastic modulus (GPa).
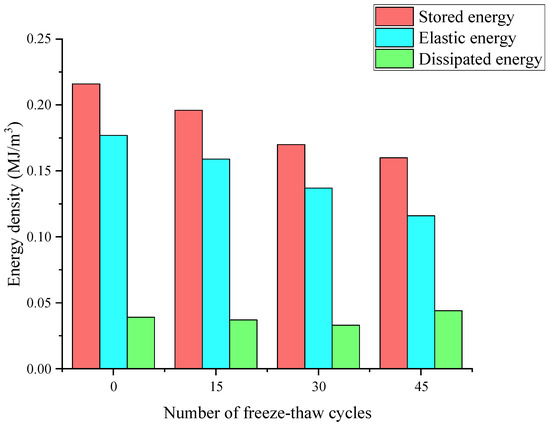
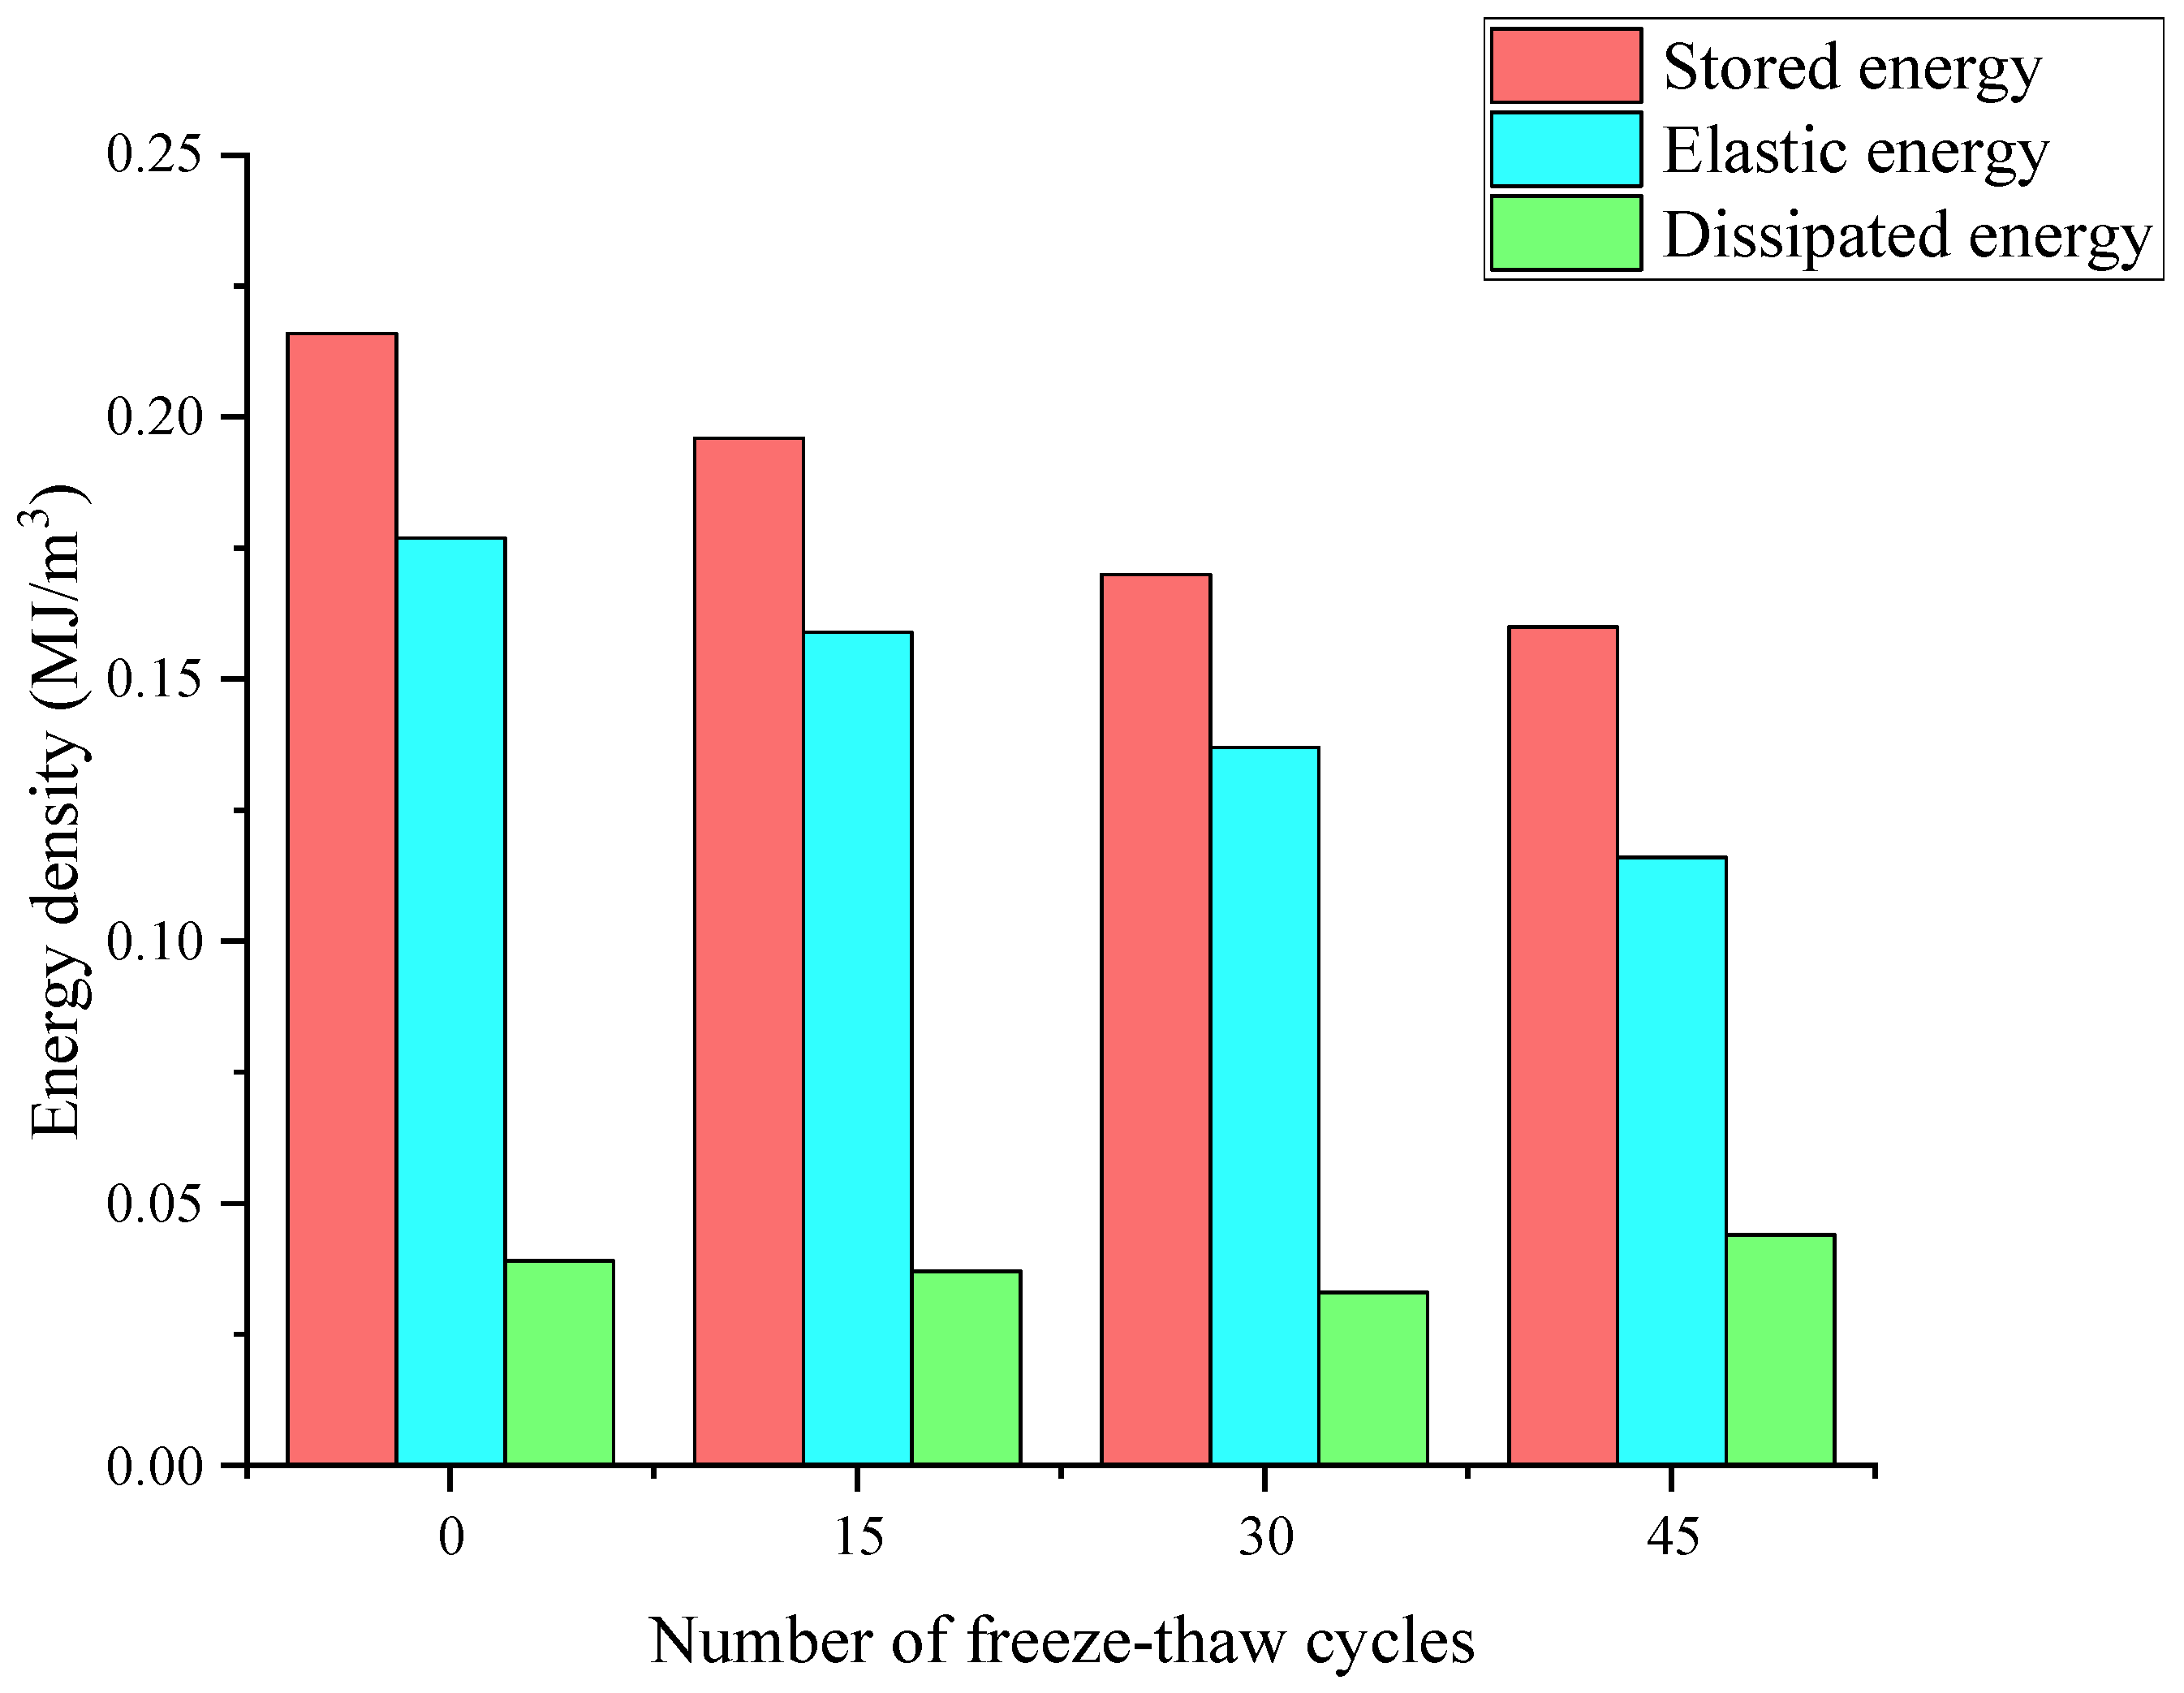
Based on the above formulation, the energy parameters at peak stress for white sandstone subjected to freeze–thaw damage were calculated, and the results are presented in Table 1 and Figure 12.
Table 1.
Energy parameters of white sandstone at peak stress after freeze–thaw cycles.
Figure 12.
Variation in energy parameters at peak stress with freeze–thaw cycles.
Table 1 and Figure 12 present the variation in energy parameters at peak stress for white sandstone samples under uniaxial compression. A comparison of the data reveals that with an increasing number of freeze–thaw cycles, the total input energy at peak stress exhibits a continuous decreasing trend. Compared with the value of 0.216 MJ/m3 at 0 cycles, the total energy decreased to 0.196 MJ/m3, 0.170 MJ/m3, and 0.160 MJ/m3 after 15, 30, and 45 cycles, respectively, corresponding to reductions of 9.3%, 13.3%, and 5.9%. The most substantial decline in total energy occurred between the 15th and 30th freeze–thaw cycles. These results indicate that freeze–thaw cycling progressively reduces the total energy input to the rock.
Meanwhile, the elastic strain energy stored in the samples at peak stress decreased progressively with increasing freeze–thaw cycles. At 0 cycles, the elastic strain energy at peak stress was 0.177 MJ/m3; after 45 freeze–thaw cycles, it decreased to 0.116 MJ/m3, corresponding to a reduction of 34.5%. The magnitude of elastic strain energy at peak stress reflects the maximum energy storage capacity of the rock and its resistance to failure. It is evident that freeze–thaw damage has substantially weakened the energy storage capability of the rock.
In contrast, the dissipated energy at peak stress initially decreased and then increased with increasing freeze–thaw cycles. This trend can be attributed to the progressive dissolution of cementing materials between rock grains during freeze–thaw cycling, which weakens the rock’s resistance to interparticle sliding and fracture. As a result, more frequent internal sliding and fracturing occurs within the specimen during loading.
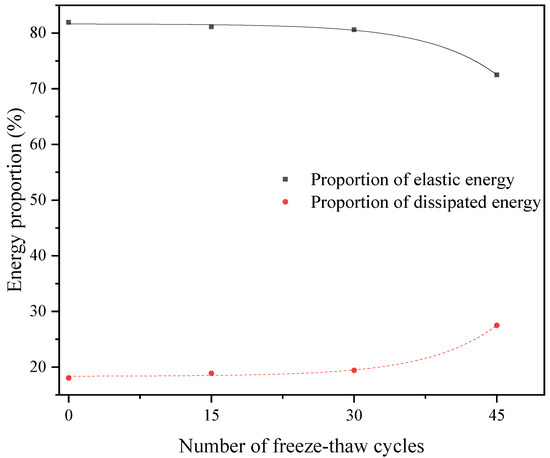
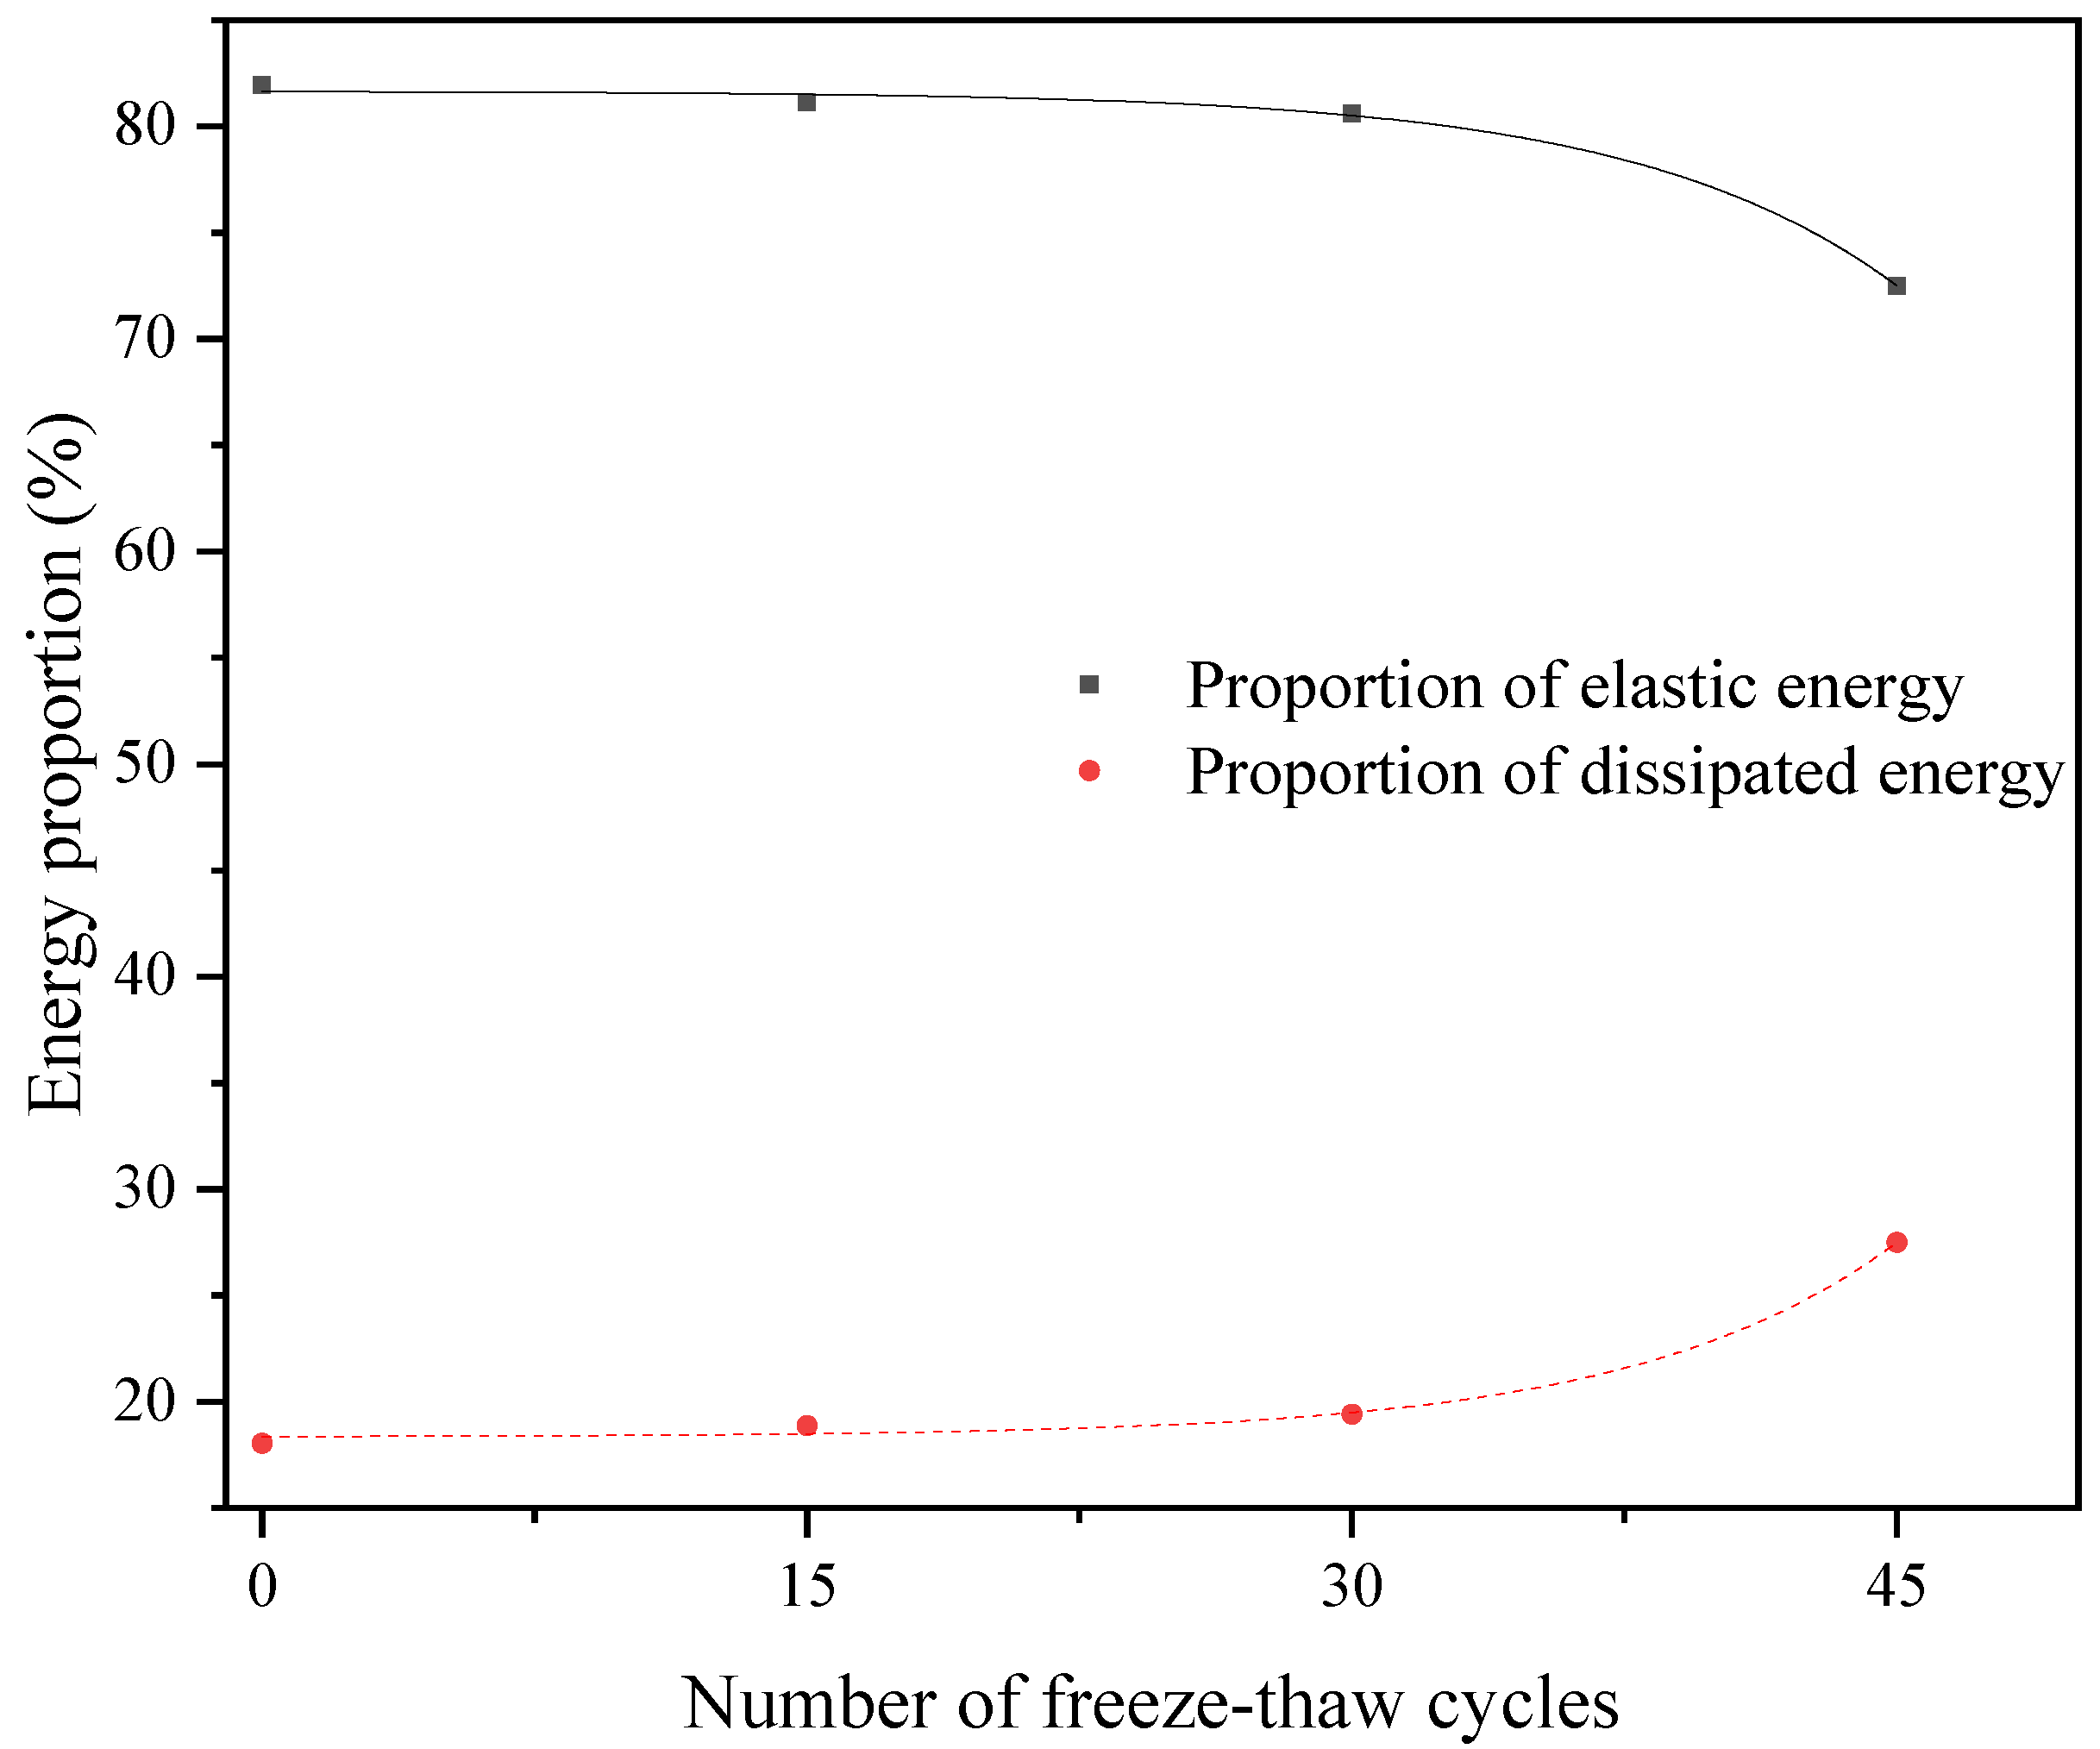
The total input energy at peak stress is not constant across different freeze–thaw conditions; therefore, directly comparing the magnitudes of elastic energy and dissipated energy under varying numbers of cycles does not fully capture the energy evolution characteristics of the rock during freeze–thaw deterioration. To address this, the ratio of elastic energy to total energy at peak stress is defined as Ke = Ue/U, and the ratio of dissipated energy to total energy as Kd = Ud/U. By analyzing these parameters, the energy evolution of white sandstone under loading after different numbers of freeze–thaw cycles is investigated, as illustrated in Figure 13.
Figure 13.
Fitted curves of elastic energy proportion and dissipated energy proportion at peak stress with freeze–thaw cycles.
The fitted equations describing the variation in the elastic energy proportion and dissipated energy proportion at peak stress with the number of freeze–thaw cycles are presented below.
As shown in Figure 13, the elastic energy proportion at peak stress decreases with increasing freeze–thaw cycles, while the dissipated energy proportion increases correspondingly; both follow an exponential trend with the number of cycles. Specifically, the elastic energy proportion decreased from 81.94% at 0 cycles to 72.5%, whereas the dissipated energy proportion increased from 18.06% to 27.5%. The increase in the dissipated energy proportion is attributed to the initiation and propagation of microcracks induced by freeze–thaw cycles, which progressively damage the rock. Consequently, internal deformation and cracking become more pronounced as the peak stress is approached. These results demonstrate that freeze–thaw cycles significantly influence the energy distribution characteristics of white sandstone under uniaxial compression.
4.2. Damage Constitutive Model for Freeze–Thawed Rock
4.2.1. Definition of Damage Variables
Freeze–thaw cycles lead to the deterioration of the mechanical properties of rock. The elastic modulus, which reflects the rock’s resistance to deformation, serves as a key mechanical parameter. Accordingly, the freeze–thaw damage variable is defined based on the elastic modulus, and its expression is given as follows:
where Dn is the freeze–thaw damage variable, En is the elastic modulus of the rock after freeze–thaw cycles, and E0 represents the initial elastic modulus prior to freeze–thaw cycling.
In cold regions, rock is subjected not only to freeze–thaw damage but also to the effects of external loading. Therefore, a two-parameter Weibull distribution function is introduced to describe the damage evolution of rock micro-units under load, and its mathematical expression is given as follows:
where f represents the strength of a rock micro-unit, and m and F are the Weibull distribution parameters, which are related to the mechanical properties of the rock material.
Integrating Equation (7) yields the distribution function for the stress-induced damage variable of the rock, which is given by:
The total damage in rock subjected to freeze–thaw action and external loading is not a simple linear superposition of the individual damage caused by freeze–thaw cycles and mechanical loading, but rather results from the coupled interaction of these two damage processes. Based on the freeze–thaw damage model proposed in the literature, the total damage variable Dm for rock under the combined effects of freeze–thaw and loading is given by [35]:
Substituting Equations (6) and (8) into Equation (9) yields the following expression:
4.2.2. Development of the Damage Model for the Freeze-Thawed White Sandstone Samples
Based on Lemaitre’s strain equivalence theory, the damage constitutive model can be expressed as:
where [σ] is the stress matrix, [σ*] is the effective stress matrix, [C] is the elastic matrix, [ε] is the strain matrix, and D is the damage variable.
Assuming that the strength of the rock micro-unit is governed by the maximum tensile strain criterion, i.e.,
where ε is the maximum axial strain of the rock.
Assuming that the rock obeys the generalized Hooke’s law, combining Equations (10)–(12) leads to the following expression for the freeze–thaw damage constitutive model of rock under uniaxial compression:
where σ is the axial stress, ε is the axial strain, and m and F are material parameters.
During uniaxial compression, the damaged elements of the rock retain residual load-bearing capacity; therefore, a correction factor k [36] is incorporated into Equation (13) to yield the following modified form:
where k takes the value of
where εi is the axial strain at an arbitrary point in the rock, and εc is the maximum axial strain.
Equations (14) and (15) constitute the freeze–thaw damage constitutive model developed in this study, which accounts for the coupled effects of freeze–thaw cycles and mechanical loading. It can be seen that the freeze–thaw damage variable Dm is governed by the elastic modulus of the rock, the material parameters m and F, and the correction factor k.
The parameters F and m can be determined using the peak stress method. At the peak point of the stress–strain curve, two conditions must be satisfied: (i) the stress and strain at the peak point satisfies the proposed damage constitutive equation, and (ii) the slope of the curve is zero, i.e., the partial derivative of stress with respect to strain at the peak point equals zero. Consequently, the following expressions are obtained:
Rearranging Equation (13) leads to the following expression:
From Equations (16)–(19), together with the definitions of the Weibull distribution parameters m and F, the following expressions can be derived:
Table 2 presents the model parameters of the uniaxial compression damage constitutive model for white sandstone subjected to different numbers of freeze–thaw cycles.
Table 2.
Model parameters of the damage constitutive model for white sandstone subjected to different numbers of freeze–thaw cycles.
4.2.3. Validation of the Developed Damage Model for the Freeze–Thawed White Sandstone Samples
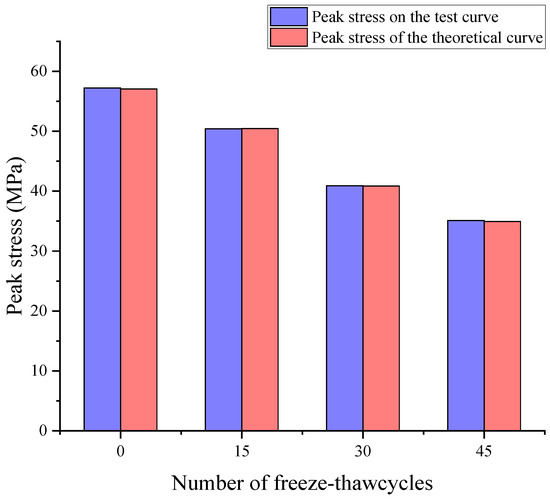
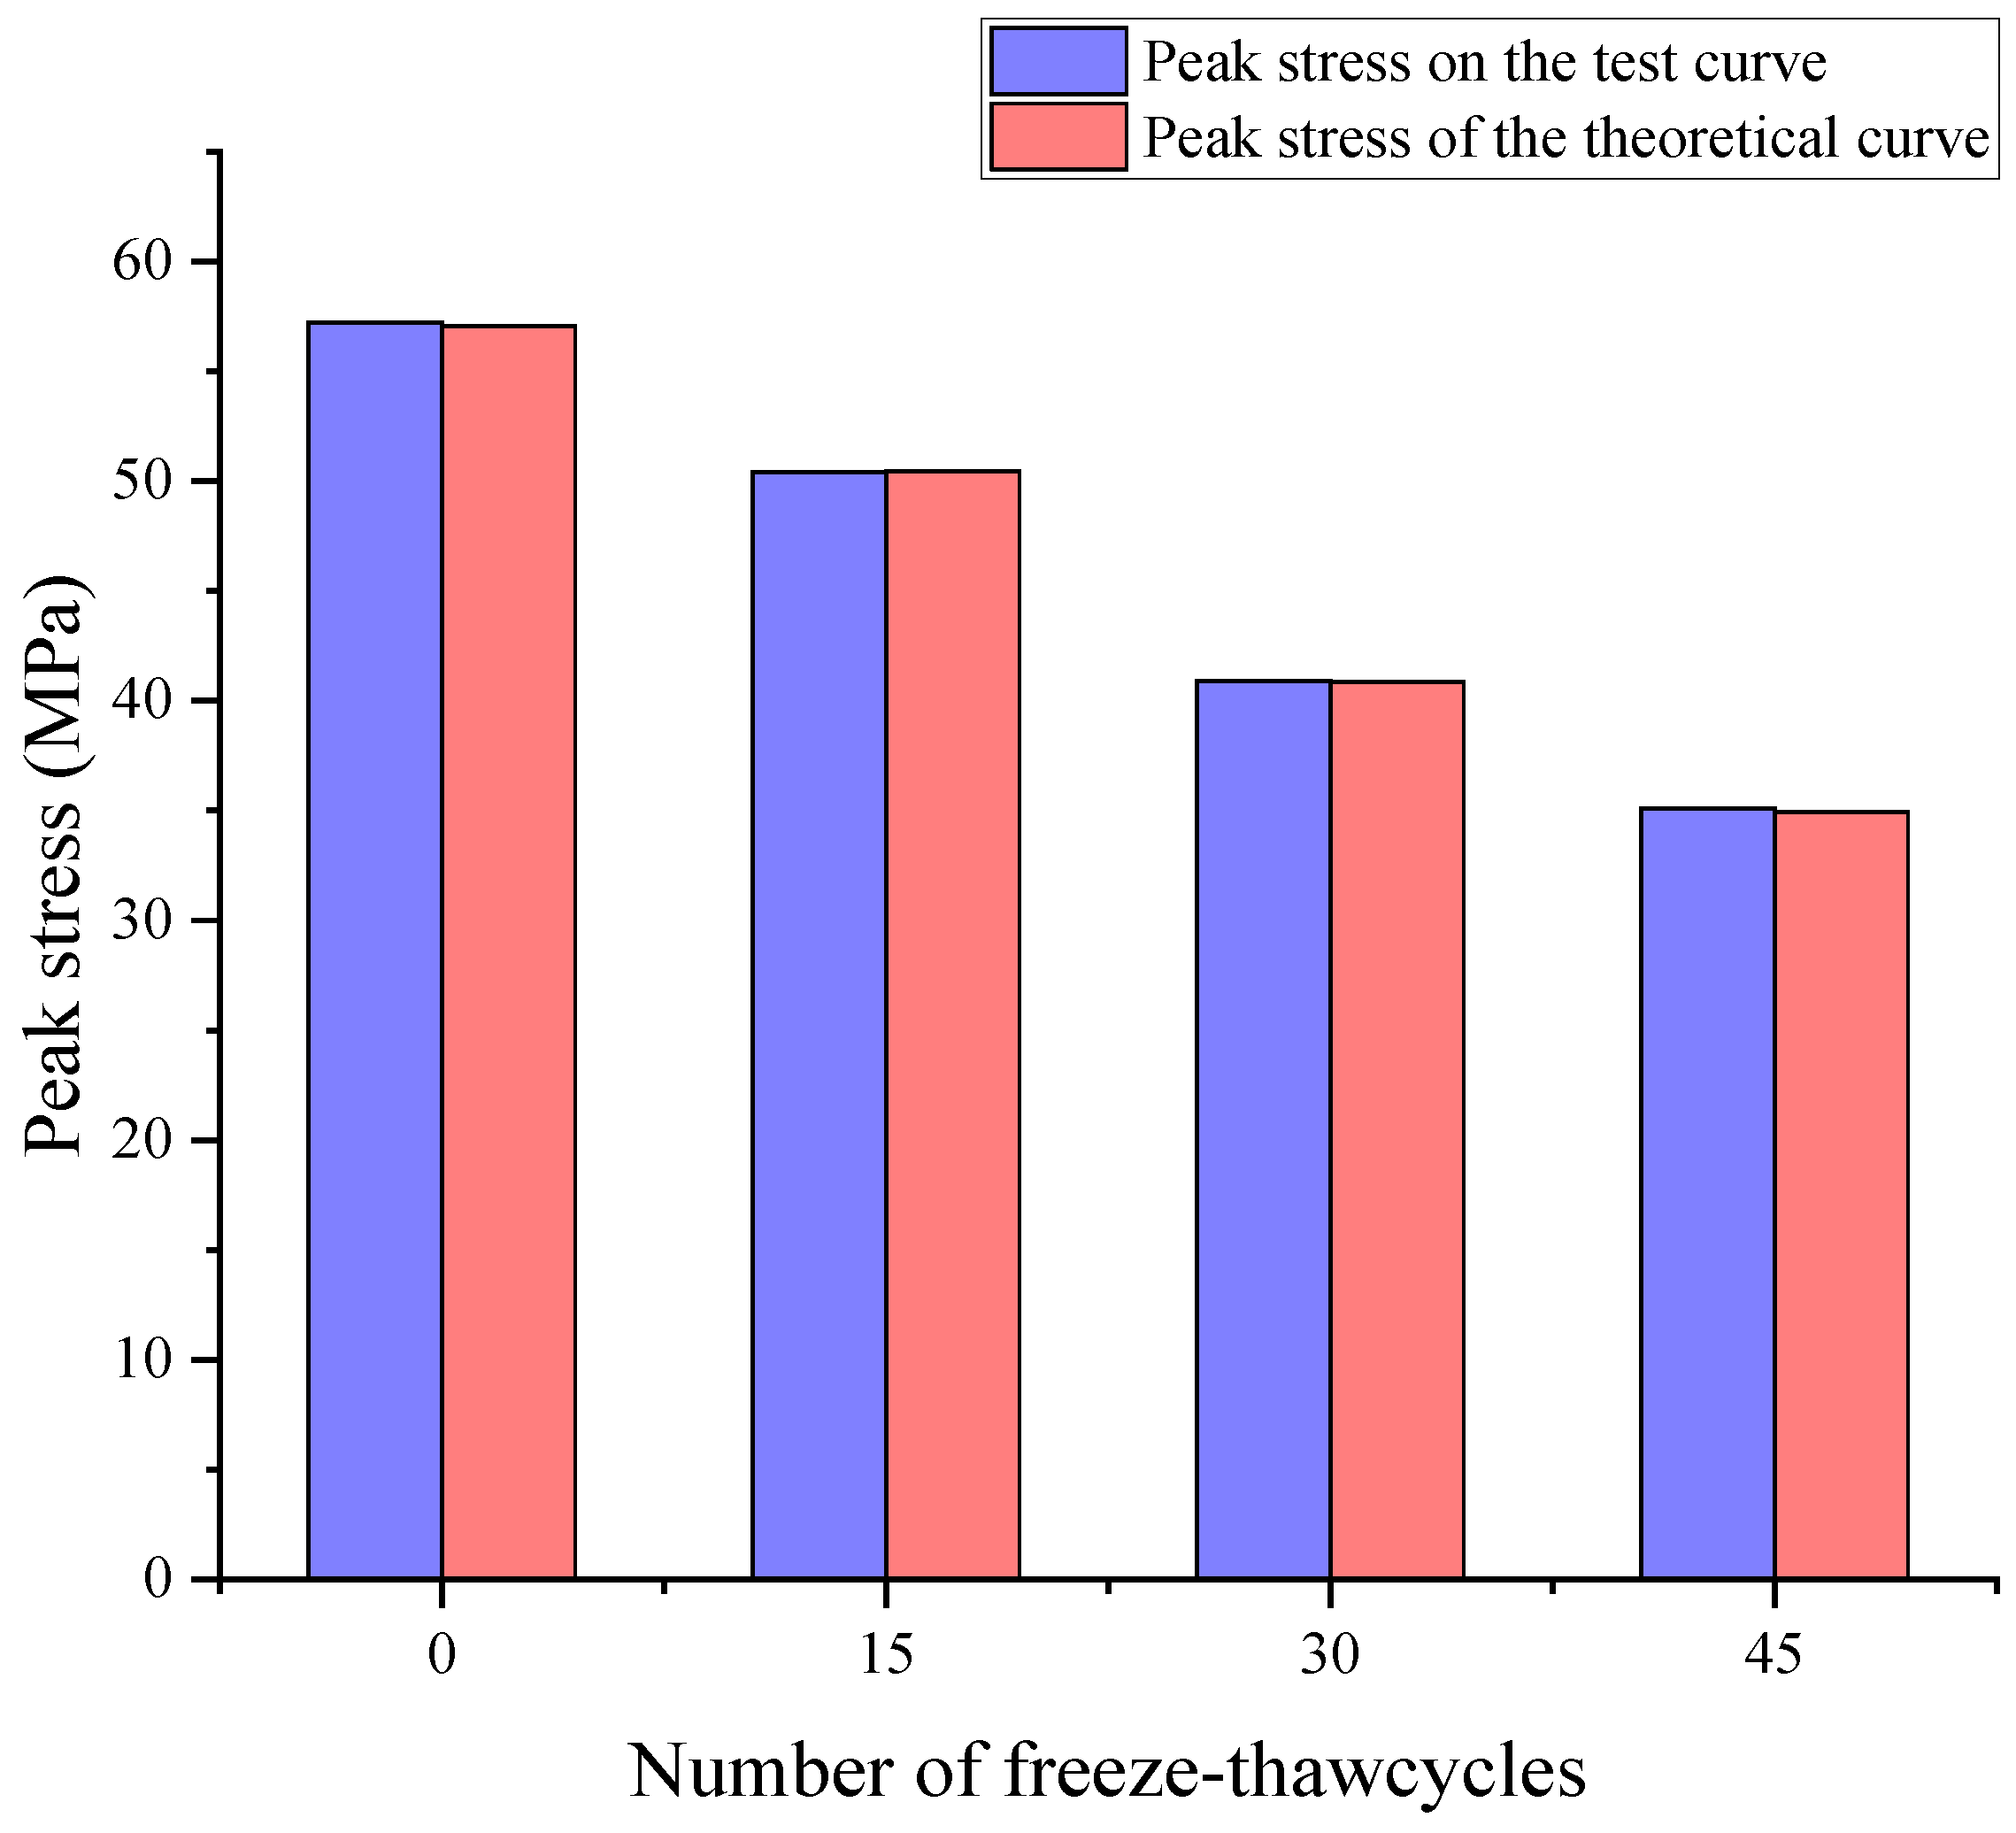
Substituting the above parameters into Equation (14) yields the theoretical compressive strength of rock under the coupled effects of freeze–thaw cycles and mechanical loading. To validate the proposed model, the peak compressive strengths obtained from the experimental stress–strain curves under different numbers of freeze–thaw cycles were compared with those calculated from the theoretical model curve, as illustrated in Figure 14.
Figure 14.
Comparison between experimental and theoretical peak strengths of rock samples subjected to different numbers of freeze–thaw cycles.
As shown in Figure 14, the peak strengths obtained from the experimental curves are in good agreement with those predicted by the theoretical model. Notably, the theoretical peak strengths at 15 and 30 freeze–thaw cycles are highly consistent with the experimental values, while only minor deviations are observed at 0 and 45 cycles. These results demonstrate that the proposed model can accurately capture the peak stress–strain behavior of white sandstone subjected to uniaxial compression after freeze–thaw cycles.
5. Conclusions
This study investigated the mechanical behavior of white sandstone sourced from mining areas in western China. Uniaxial compression tests were performed on samples subjected to varying numbers of freeze–thaw cycles. The evolution of mechanical properties under freeze–thaw deterioration, crack propagation mechanisms, and energy distribution characteristics were systematically analyzed, and a damage constitutive model was subsequently developed. The main conclusions are as follows:
- (1)
- Freeze–thaw cycles induce significant deterioration in the mechanical properties of white sandstone. With an increasing number of cycles, both the peak stress and elastic modulus exhibit a continuous decline, with the most substantial reduction occurring between the 15th and 30th cycles. The stress–strain curves reveal that, under uniaxial compression, the compaction stage progressively lengthens, and the peak strain increases as the number of freeze–thaw cycles rises. These observations indicate that freeze–thaw action promotes the accumulation of internal damage within the rock, resulting in a progressive deterioration of its integrity and load-bearing capacity.
- (2)
- Freeze–thaw cycles promote crack propagation and induce a transition in failure modes. DIC-based analysis of strain and displacement fields reveals that freeze–thaw action causes strain to concentrate at the specimen edges at an earlier stage, thus accelerating crack initiation and propagation. With an increasing number of freeze–thaw cycles, the failure mode progressively transitions from simple axial tensile failure to combined tensile–shear failure. The number of cracks increases, and the degree of specimen failure becomes more severe, indicating that freeze–thaw action enhances the uniformity of damage distribution and the complexity of fracture behavior within the rock.
- (3)
- Analysis of the energy evolution during loading provides insight into the damage mechanisms of freeze–thawed rock. Freeze–thaw cycles reduce the total input energy and the elastic strain energy stored at peak stress, while the proportion of dissipated energy increases with the number of cycles. This indicates that freeze–thaw damage results in greater energy dissipation through irreversible plastic deformation and internal damage. Consequently, freeze–thaw action significantly influences the processes of energy accumulation and dissipation in rock.
- (4)
- Based on Lemaitre’s strain equivalence hypothesis and the Weibull distribution, a correction factor k was introduced to modify the total damage variable, thereby establishing a damage constitutive model that accounts for the coupled effects of freeze–thaw cycles and mechanical loading. The validity of the proposed model was verified by comparing its predictions with experimental results obtained from uniaxial compression tests.
Author Contributions
P.L., validation, resources, funding acquisition; Y.P., software, validation, formal analysis, date curation, writing—original draft; S.L., writing—review and editing, supervision; C.P., software, validation, visualization; P.J., validation, data curation. All authors have read and agreed to the published version of the manuscript.
Funding
This research was funded by the National Natural Science Foundation of China (52304075).
Institutional Review Board Statement
Not applicable.
Informed Consent Statement
Not applicable.
Data Availability Statement
The data supporting the findings of this study are available from the corresponding author upon reasonable request.
Conflicts of Interest
Author Peijie Lou was affiliated with the Postdoctoral Research Station of Shandong Huaning Mining Group Co., Ltd. And all authors declare that the research was conducted in the absence of any commercial or financial relationships that could be construed as a potential conflict of interest.
References
- Wang, X.; Pan, L.; Lau, H.C. Reservoir volume of gas hydrate stability zones in permafrost regions of China. Appl. Energy 2018, 225, 486–500. [Google Scholar] [CrossRef] [Scilit]
- Shen, Y.J.; Yang, G.S.; Rong, T.L. Discussion on recommended scheme of rock freeze-thaw cycle test. Chin. J. Geotech. Eng. 2016, 38, 1775–1782. [Google Scholar]
- Zhang, X.W.; Xu, J.H.; Cao, Y. Experimental Investigation on Fracture Behavior and Mechanical Properties of Red Sandstone Subjected to Freeze–Thaw Cycles. Sustainability 2022, 14, 14155. [Google Scholar] [CrossRef] [Scilit]
- Liu, J.; Guo, C.; Deng, T. Investigation of the Deterioration of Basu Granite Mechanical Properties Caused by Freeze–Thaw Cycles in High-Altitude Mountains in the Eastern Part of the Tibetan Plateau, China. Sustainability 2024, 16, 319. [Google Scholar] [CrossRef] [Scilit]
- Gong, Y.; Wu, S.; Song, J. Pore characteristics and constitutive model of constrained granite under freeze-thaw cycles. Constr. Build. Mater. 2025, 491, 142706. [Google Scholar] [CrossRef] [Scilit]
- Yang, Y.S.; Wei, S.J.; Wang, S.Z. Study on the deterioration characteristics and mechanism of physical and mechanical properties of natural gypsum rock under freeze–thaw action. Phys. Fluids 2023, 35, 106606. [Google Scholar] [CrossRef] [Scilit]
- Li, J.X.; Yuan, W.; Wang, W. Physical and mechanical properties of dolomite under freeze-thaw cycles. Sci. Technol. 2020, 20, 755–762. [Google Scholar]
- Chen, L.; Chen, K.; Zhang, Z.; Zhang, Y.; Liu, Z.; Huang, Y. Macro and micro damage characteristics of Red-bed sandstone in Urumqi under freeze-thaw cycles. Sci. Rep. 2025, 15, 1785. [Google Scholar] [CrossRef] [Scilit]
- Li, J.; Zhou, K.; Liu, W.; Zhang, Y. Analysis of the effect of freeze-thaw cycles on the degradation of mechanical parameters and slope stability. Bull. Eng. Geol. Environ. 2018, 77, 573–580. [Google Scholar] [CrossRef] [Scilit]
- Chen, Y.; Lin, H.; Wang, Y.; Zhao, Y. Damage Statistical Empirical Model for Fractured Rock under Freezing-Thawing Cycle and Loading. Geofluids 2020, 2020, 8842471. [Google Scholar] [CrossRef] [Scilit]
- Sun, W.; Ma, J.; Jin, J.; Li, S.; Liu, Q.; Wang, H. Quantitative Study of the Failure Characteristics of Sandstone with Freeze-Thaw Damage: Insight into the Cracking Behavior. Rock Mech. Rock Eng. 2024, 57, 5843–5862. [Google Scholar] [CrossRef] [Scilit]
- Feng, Q.; Xu, J.; Cai, C. Damage constitutive model and meso-failure characteristics of freeze–thaw rock under triaxial compression. Bull. Eng. Geol. Environ. 2024, 83, 112. [Google Scholar] [CrossRef] [Scilit]
- Zhu, Z.D.; Fang, R.J. Experimental study on unloading strength characteristics and damage characteristics of sandstone under freeze-thaw cycles. J. Yangtze River Sci. Res. Inst. 2018, 35, 1–5+12. [Google Scholar]
- Huang, S.; Duan, L.; Zhen, L.; Yu, S.; Zhang, C. Study on the freeze-thaw damage degree and its influence on the shear strength parameters of sandstones. Cold Reg. Sci. Technol. 2024, 228, 104328. [Google Scholar] [CrossRef] [Scilit]
- Abdolghanizadeh, K.; Hosseini, M.; Saghafiyazdi, M. Effect of freezing temperature and number of freeze-thaw cycles on mode I and mode II fracture toughness of sandstone. Theor. Appl. Fract. Mech. 2020, 105, 102428. [Google Scholar] [CrossRef] [Scilit]
- Liu, H.; Yang, G.S.; Shen, Y.J. CT visual quantitative characterization of meso-damage evolution of sandstone under freeze-thaw-loading synergistic effect. Chin. J. Rock Mech. Eng. 2023, 42, 1136–1149. [Google Scholar]
- Qiu, B.; Fan, L.F.; Du, X.L. Microstructure deterioration of sandstone under freeze-thaw cycles using CT technology: The effects of different water immersion conditions. J. Rock Mech. Geotech. Eng. 2025, 17, 1599–1611. [Google Scholar] [CrossRef] [Scilit]
- Song, Y.Q.; Ma, H.F.; Liu, J.C. Experimental study on uniaxial acoustic emission damage characteristics of freeze-thaw limestone. Chin. J. Rock Mech. Eng. 2022, 41, 2603–2614. [Google Scholar]
- Xu, T.; Qiu, J.Y.; Yuan, Y. Damage evolution characteristics of saturated sandstone under freeze-thaw cycles. J. Northeast. Univ. (Nat. Sci. Ed.) 2025, 46, 132–142. [Google Scholar]
- Liu, X.Y.; Liu, Y.; Dai, F. Tensile mechanical behavior and fracture characteristics of sandstone exposed to freeze-thaw treatment and dynamic loading. Int. J. Mech. Sci. 2022, 226, 107405. [Google Scholar] [CrossRef] [Scilit]
- Kang, Z.; Wang, Z. Surface crack evolution patterns in freeze-thaw damage of fissured rock bodies. J. Mt. Sci. 2024, 21, 3094–3107. [Google Scholar] [CrossRef] [Scilit]
- Barkat, U.; Zhou, Z.L.; Cai, X. Effect of freezing and thawing process on fracturing mechanism and acoustic emission characteristics of notched semi-circular bend specimens of red sandstone. Theor. Appl. Fract. Mech. 2024, 129, 104238. [Google Scholar] [CrossRef] [Scilit]
- Yue, X.; Liu, T.; Wen, T. Mechanical Properties and Energy Evolution Laws of Rocks Under Freeze–Thaw. Water 2025, 17, 353. [Google Scholar] [CrossRef] [Scilit]
- Meng, F.D.; Zha, Y.; Li, Y.B. Experimental study on dynamic tensile properties and energy evolution of sandstone after freeze-thaw cycles. Chin. J. Rock Mech. Eng. 2021, 40, 2445–2453. [Google Scholar]
- Xiao, Y.; Deng, H.; Tian, G.; Yu, S. Analysis of Microscopic Pore Characteristics and Macroscopic Energy Evolution of Rock Materials under Freeze-Thaw Cycle Conditions. Mathematics 2023, 11, 710. [Google Scholar] [CrossRef] [Scilit]
- Ma, Q.; Ma, D.; Yao, Z. Influence of freeze-thaw cycles on dynamic compressive strength and energy distribution of soft rock specimen. Cold Reg. Sci. Technol. 2018, 153, 10–17. [Google Scholar] [CrossRef] [Scilit]
- Zhang, H.M.; Yang, G.S. Study on rock damage model under the coupling effect of freeze-thaw and load. Chin. J. Rock Mech. Eng. 2010, 29, 471–476. [Google Scholar]
- Zhang, H.M.; Xie, M.X.; Peng, C. Damage constitutive model of freeze-thaw rock under three-dimensional stress state. Chin. J. Geotech. Eng. 2017, 39, 1444–1452. [Google Scholar]
- Meng, X.; Zhang, H.; Yuan, C.; Li, Y.; Liu, X.; Chen, S.; Shen, Y. Damage constitutive prediction model for rock under freeze-thaw cycles based on mesoscopic damage definition. Eng. Fract. Mech. 2023, 293, 109685. [Google Scholar] [CrossRef] [Scilit]
- Hou, Z.X.; Liu, X.F.; Wang, T. Mechanical properties and damage constitutive model of freeze-thaw damage quartzite. J. Yangtze River Sci. Res. Inst. 2025, 42, 177–185. [Google Scholar]
- Culshaw, M.; Ulusay, R. (Eds.) The ISRM suggested methods for rock characterization, testing and monitoring: 2007–2014. In Bulletin of Engineering Geology and the Environment; Springer: Cham, Switzerland, 2015; Volume 74, pp. 1499–1500. [Google Scholar] [CrossRef] [Scilit]
- Deng, W.B.; Yang, L.; Sun, C.K. Damage identification of reinforced concrete beams after freeze-thaw based on DIC technology. Concrete 2025, 6, 48–53. [Google Scholar]
- Zhang, Q.; Liu, Y.; Dai, F.; Jiang, R. Experimental assessment on the fatigue mechanical properties and fracturing mechanism of sandstone exposed to freeze-thaw treatment and cyclic uniaxial compression. Eng. Geol. 2022, 306, 106724. [Google Scholar] [CrossRef] [Scilit]
- Jia, P.; Mao, S.Z.; Sun, Z.Y. Energy evolution and piecewise constitutive model of freeze-thaw damaged sandstone. J. Cent. S. Univ. (Nat. Sci. Ed.) 2023, 54, 908–919. [Google Scholar]
- Fang, W.; Jiang, N.; Luo, X. Establishment of damage statistical constitutive model of loaded rock and method for determining its parameters under freeze-thaw condition. Cold Reg. Sci. Technol. 2019, 160, 31–38. [Google Scholar] [CrossRef] [Scilit]
- Hou, C.; Jin, X.G.; He, J. Study on damage model of freeze-thaw rock based on maximum tensile strain criterion. J. Southwest Jiao Tong Univ. 2023, 58, 1045–1055. [Google Scholar]

Disclaimer/Publisher’s Note: The statements, opinions and data contained in all publications are solely those of the individual author(s) and contributor(s) and not of MDPI and/or the editor(s). MDPI and/or the editor(s) disclaim responsibility for any injury to people or property resulting from any ideas, methods, instructions or products referred to in the content. |
© 2026 by the authors. Licensee MDPI, Basel, Switzerland. This article is an open access article distributed under the terms and conditions of the Creative Commons Attribution (CC BY) license.