


Abstract
Reliable crack detection is essential for ensuring the safety, serviceability, and long-term performance of civil structures. Conventional manual inspections are labor-intensive and subjective, while existing computer vision models often exhibit reduced accuracy under variable field conditions. This study develops a computer vision-based automated crack detection framework utilizing a hybrid Transformer–CNN architecture to support infrastructure inspection and condition assessment. The proposed model leverages the global context modeling capability of Transformers and the local feature sensitivity of convolutional neural networks (CNNs) to enhance detection robustness. The optimized hybrid model achieved an Intersection over Union (IoU) of 91.8% and an accuracy of 98.7%, outperforming baseline CNN, Transformer-only, and LSTM architectures. Field validation on bridge inspection imagery demonstrated strong resilience to variations in illumination and texture. The developed approach contributes to digital inspection and intelligent lifecycle management of infrastructure assets by enabling reliable, automated, and non-intrusive structural condition evaluation under realistic field conditions.
1. Introduction
Accurate detection and quantification of cracks in civil infrastructure are vital for ensuring structural safety, serviceability, and long-term performance. Cracks can initiate and propagate under sustained or cyclic loading, environmental exposure, or material degradation. From a structural engineering perspective, while the appearance of minor cracks is often expected to activate the internal reinforcement, it should be emphasized that crack widths exceeding 0.3 mm are generally regarded as a significant concern for structure durability and serviceability. Such wider cracks facilitate the ingress of corrosive agents, potentially leading to reinforcement corrosion, a reduction in structural stiffness, and long-term safety hazards. However, undetected propagation beyond these limits can lead to a significant loss of stiffness, strength reduction, and costly repairs. Traditional inspection methods rely on visual surveys and manual measurements, which are labor-intensive and prone to human error. Non-destructive testing (NDT) methods, including ultrasonic testing [1], magnetic particle inspection [2], eddy current testing [3], and acoustic emission monitoring [4], offer improved detection capability, but are often constrained by high equipment costs and specialized operation.
Computer vision-based techniques have emerged as promising alternatives, enabling crack characterization directly from images captured via unmanned aerial vehicles (UAVs) or robotic platforms. This flexibility supports rapid, repeatable, and cost-effective condition assessment with minimal disruption to operations. Among existing visual measurement techniques, Digital Image Correlation (DIC) [5] has been a cornerstone for measuring surface displacement and strain fields in structural tests. However, DIC typically requires specific surface preparations (e.g., speckle patterns) and controlled lighting, which can be difficult to implement for large-scale field inspections. These limitations have driven the demand for automated, non-intrusive deep learning-based methods that can provide consistent evaluations across large systems without artificial markers.
Recent advances in artificial intelligence (AI) and deep learning have significantly enhanced computer vision-based crack detection. Early studies employing artificial neural networks (ANNs) [6] and (CNNs) [7,8] demonstrated significant progress. Kim et al. [6] achieved 92.3% accuracy, while Ali et al. [9] attained 95.2% using ResNet-50. Hybrid frameworks later integrated attention mechanisms (Lee et al. [10]) or sequence models like LSTM (Jang et al. [11]) to improve localization. Building on these foundations, scholars introduced specialized segmentation architectures; for instance, Chen et al. [12] proposed a SegNet with an encoder–decoder structure [13] for pixel-level end-to-end crack segmentation, while Huyan et al. [14] and Liu et al. [15] introduced CrackU-net and CrackFormer to suppress semantic artifacts [14]. Furthermore, Ren et al. [16] improved generalization through CrackSegNet. Despite these gains, purely convolutional or sequential models often struggle with long-range dependencies and edge continuity. The Transformer architecture, based on self-attention, has revolutionized global context modeling. The necessity for a hybrid Transformer–CNN architecture in crack detection arises from the complementary nature of their feature extraction. CNNs excel at capturing local textures and fine edges, which are essential for crack localization, while Transformers model global spatial relationships that ensure continuity across complex backgrounds. Integrating these mechanisms addresses the gaps in traditional deep learning approaches under varying field conditions.
To address these challenges in computational efficiency and robustness, this study evaluates a hybrid Transformer–CNN vision framework for automated assessment. Recognizing the practical constraints of field inspections, we adopt a simplified data-collection strategy utilizing individual images of cracked elements. While such simplification often raises questions regarding quantification reliability, our framework compensates by integrating pixel-to-millimeter calibration and robust feature fusion, ensuring that crack widths can be accurately determined without the need for fixed markers or multi-image setups. The model processes images into patch embeddings [17] and utilizes a composite loss function to handle class imbalance. Field validation using bridge inspection imagery further demonstrates the applicability and robustness of the proposed approach.
The contributions of this work are threefold. First, we propose a hybrid Transformer–CNN architecture that optimizes the balance between global context and local refinement. Second, results are visualized through predicted crack maps and overlay images, enabling both quantitative analysis and intuitive interpretation. Third, the proposed approach is rigorously validated through extensive comparisons across multiple conditions, including dataset size, brightness, background complexity, and different model architectures, as well as blind tests on field data, confirming its robustness and adaptability for civil infrastructure inspection. The remainder of this paper is structured as follows: Section 2 introduces the framework. Section 3 details the case study and scenario design. Section 4 and Section 5 present performance evaluation and field validation. And Section 6 concludes with findings and future directions.
2. Hybrid Transformer–Based Learning Framework for Computer Vision-Based Crack Detection
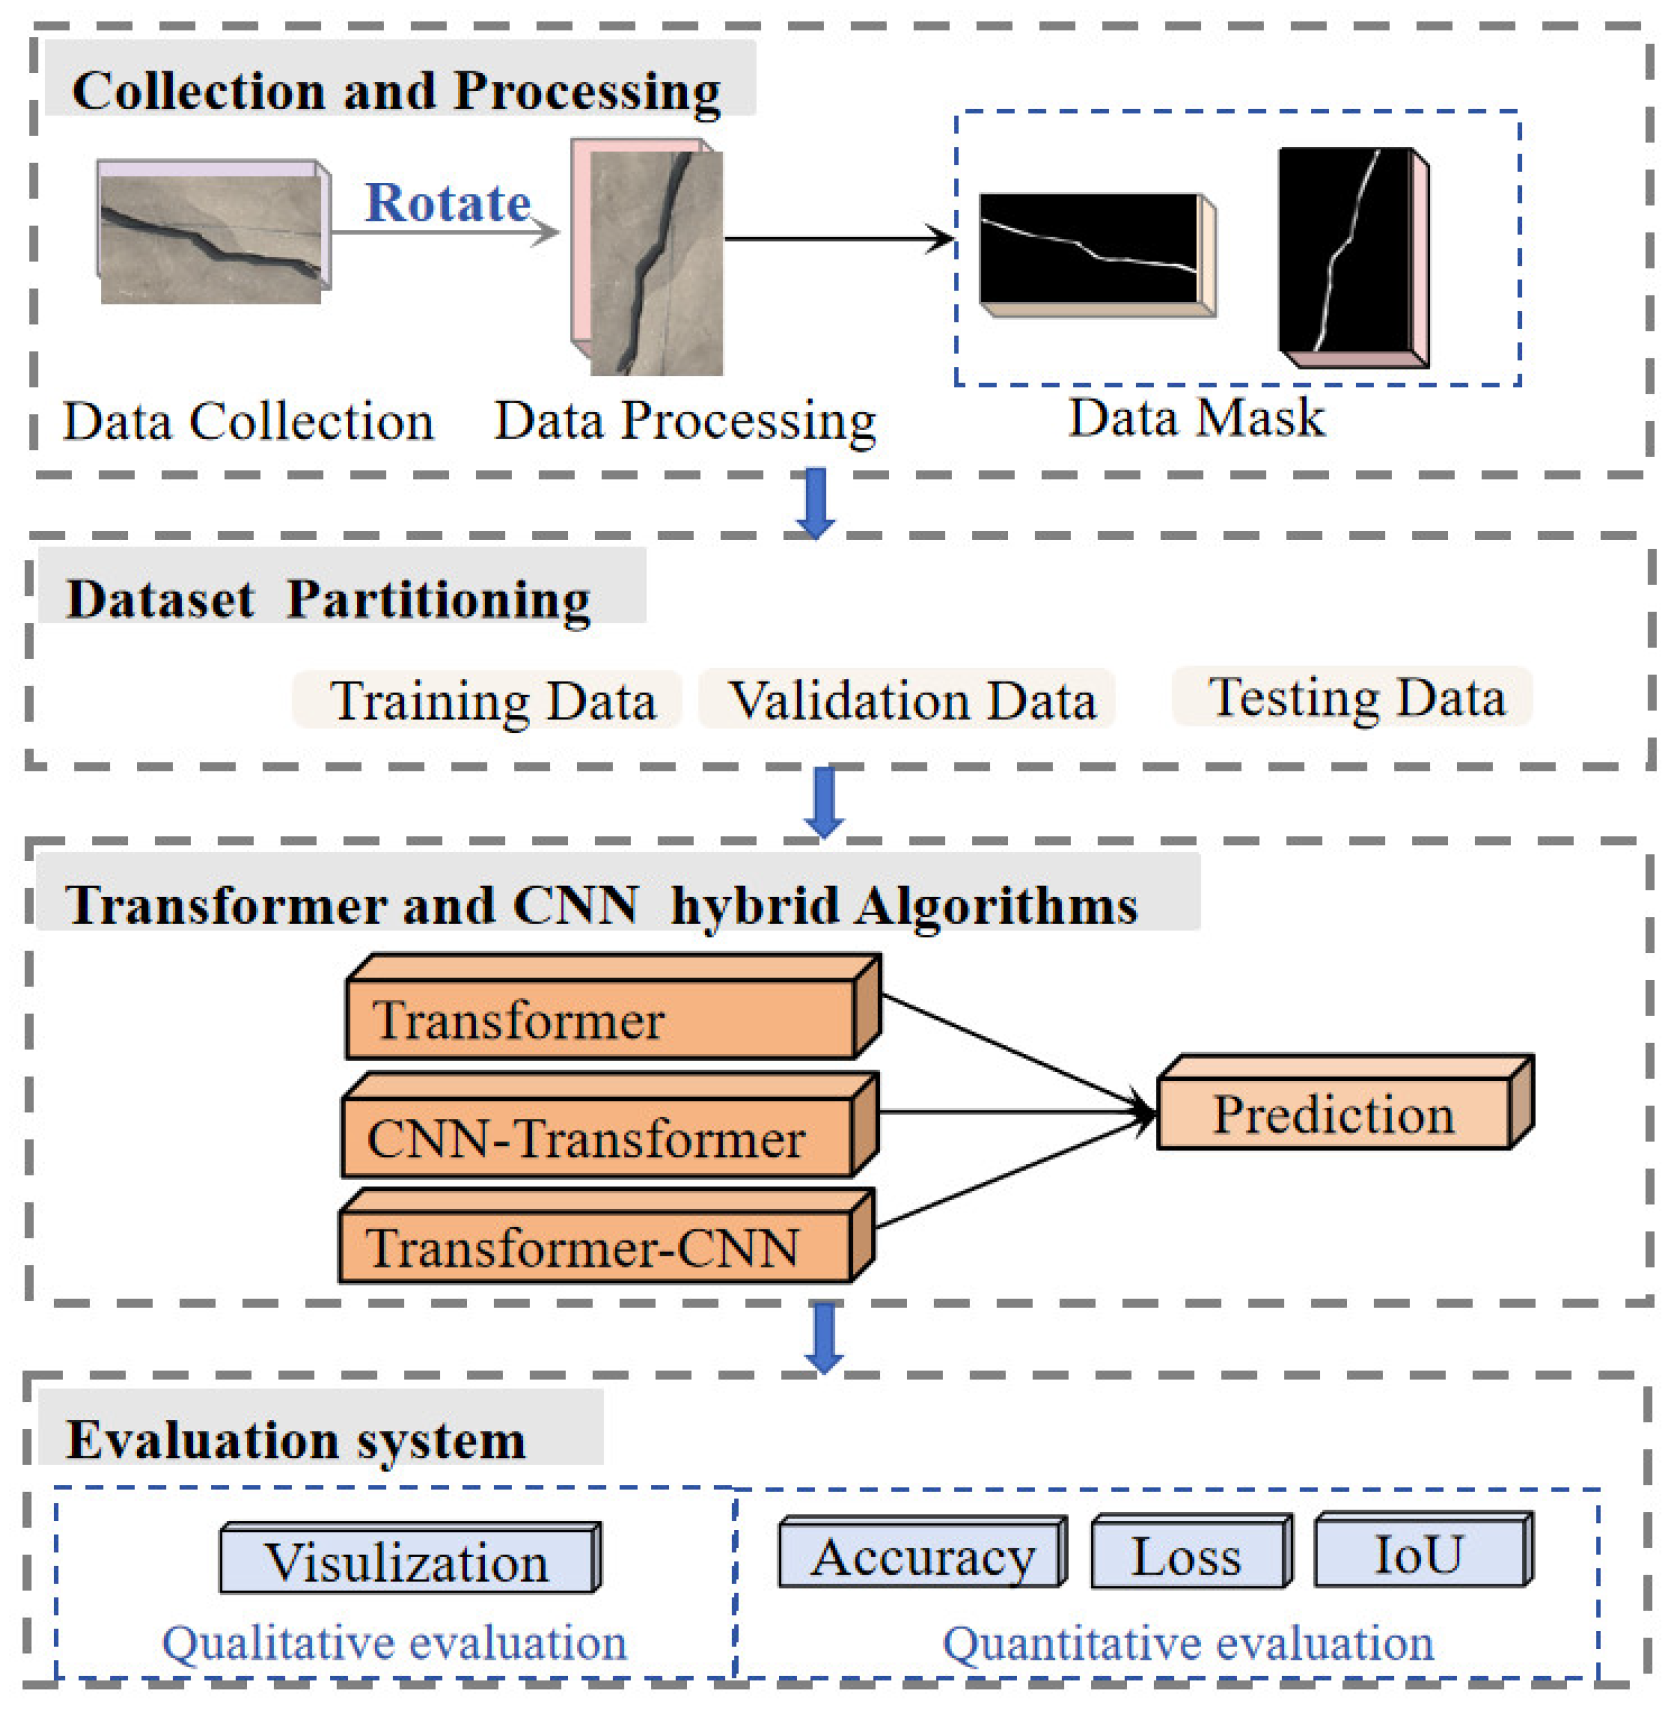
This study proposes a hybrid Transformer–CNN learning framework designed to automatically identify, segment, and quantify cracks in civil infrastructure, supporting data-driven inspection and condition assessment. The overall workflow is illustrated in Figure 1, consisting of four core layers: (a) data collection and processing, (b) dataset partitioning, (c) hybrid model architectures, and (d) evaluation and performance assessment, as stated in detail:
(a) Data Collection and Processing: The dataset for this study is assembled through a combination of on-site data acquisition and publicly available crack images from the internet (see Figure 1). While the use of individual images represents a simplified collection mode, it is a strategic choice designed to reflect the operational realities of automated bridge inspections (e.g., via UAVs), where rapid execution is prioritized. To bridge the gap between simplified acquisition and high-precision quantification, a physical calibration layer is integrated. By utilizing the specific shooting distance () and camera focal length ), the framework calculates a precise scale factor (), ensuring that pixel-level segmentation can be accurately converted into physical crack widths. To enhance diversity and robustness, data augmentation techniques, such as flipping, rotation, scaling, and intensity adjustment, are applied. These operations enable the model to better capture the variability in crack morphology, background textures, and lighting conditions. For ground-truth generation, the original images are converted into binary mask images with pixel values of 0 (non-crack) and 1 (crack). Manual labeling [18] is employed due to its superior accuracy over automated labeling, particularly in complex backgrounds, thereby ensuring higher data fidelity for model training. (b) Dataset Partitioning: The processed dataset is divided into training and testing subsets. The training set is used to learn characteristic features of cracks, such as texture, orientation, and propagation patterns, while the testing set evaluates generalization capability and supports final crack area calculation. Proper partitioning ensures that the model’s performance reflects both its learning ability and robustness to unseen data. (c) Transformer–CNN Hybrid Algorithms: The core of this study lies in systematically evaluating three architectural designs: Transformer-only, CNN–Transformer, and Transformer–CNN frameworks (see Figure 1). The Transformer module leverages a multi-head self-attention mechanism to capture global contextual information and long-range dependencies, which is particularly valuable for handling complex inspection scenarios and diverse crack geometries. The CNN component, on the other hand, excels at extracting localized spatial features, such as edges and fine textures, using convolutional kernels, enabling pixel-level segmentation. By integrating these complementary mechanisms, the hybrid models aim to combine global perception with local refinement. A comparative analysis of the three variants identifies the optimal balance of accuracy, computational efficiency, and robustness for automated crack detection in real-world infrastructure inspection. (d) Evaluation: To rigorously validate the framework, both qualitative and quantitative evaluation methods are employed. Qualitatively, predicted crack maps are overlaid on the original images to visually assess segmentation accuracy and edge coherence, providing an intuitive measure of recognition ability. Quantitatively, as illustrated in Figure 1, three key indicators are used: (i) classification accuracy, reflecting overall prediction correctness; (ii) the loss function, tracking training stability and convergence; and (iii) Intersection over Union (IoU), quantifying spatial overlap between predicted masks and ground-truth labels. Together, these metrics provide a holistic view of model performance, highlight algorithmic strengths and limitations, and offer guidance for further optimization toward field deployment in automated inspection workflows.
Under this framework, this study will systematically examine three crack detection models: Transformer-only, CNN–Transformer, and Transformer–CNN frameworks, as shown in Section 2.1, Section 2.2 and Section 2.3. To establish a clear understanding of their design principles, the sections below tend to provide a detailed overview of these architectures, including their hierarchical structures, parameter dimensions, and input–output specifications, and present the operational flow and design characteristics of each model.
Figure 1.
Flow chart of the hybrid Transformer–based learning framework.
2.1. Transformer Models
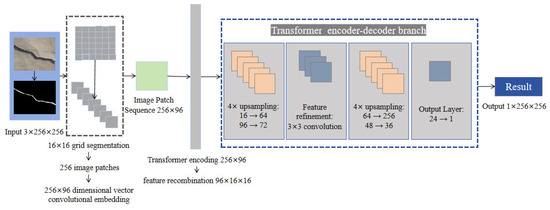
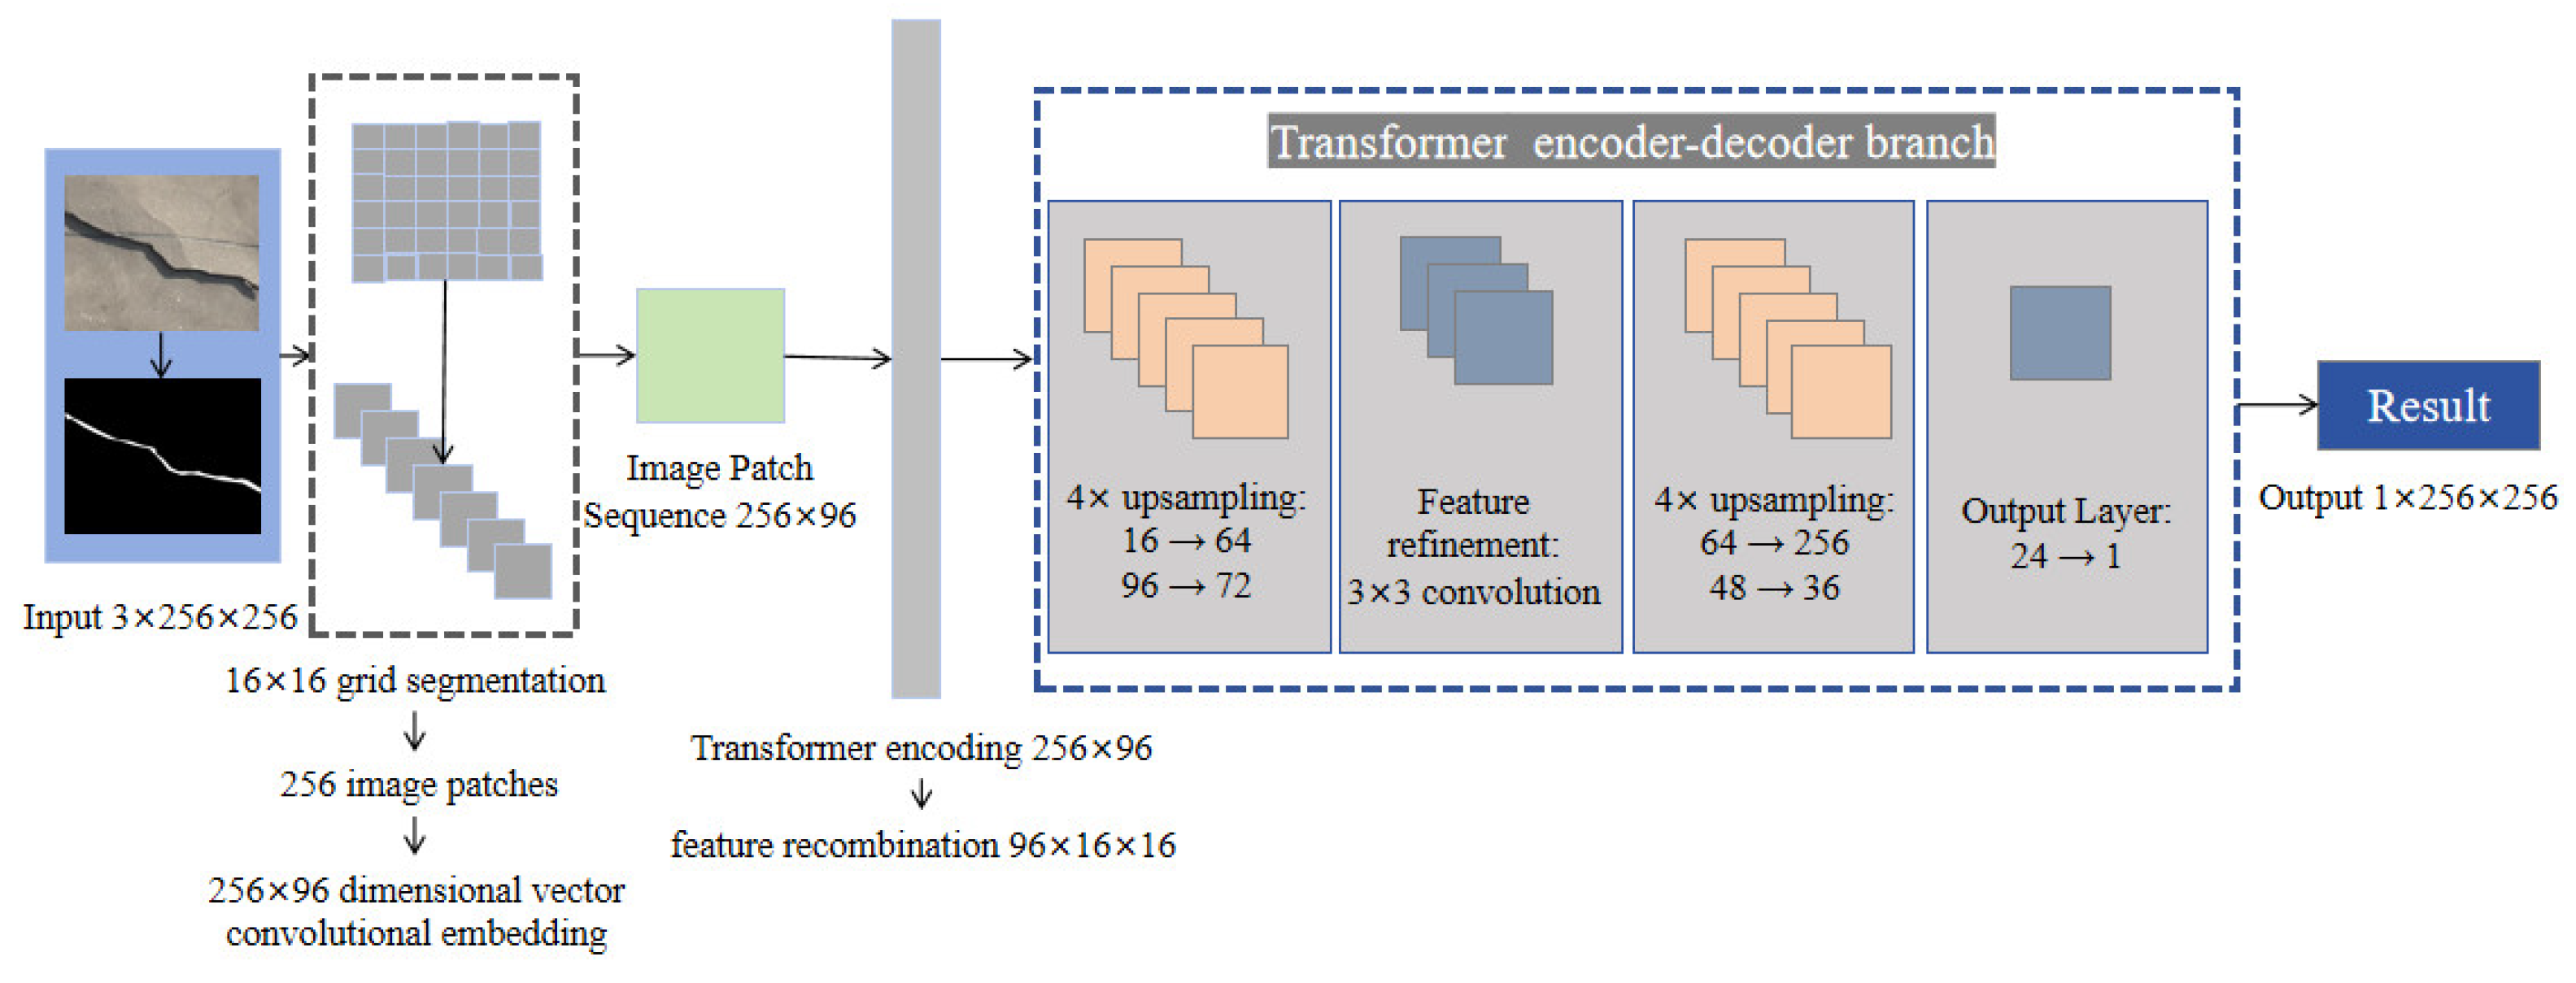
The core of this architecture is a Transformer-based encoder–decoder structure, as depicted in Figure 2. The encoder consists of a six-layer Transformer stack for global contextual modeling, while the decoder employs a series of transposed convolutions and convolutional layers for high-resolution mask reconstruction. Throughout this process, CNN components serve only for input embedding and output spatial restoration, rather than fulfilling the role of feature extractors.
Figure 2.
Transformer architecture model.
Firstly, the input image of size 3 × 256 × 256 is segmented into 256 patches of 16 × 16, which are projected via a convolutional embedding layer into a 256 × 96 sequence. Then these data step into positional encoding. Image calibration via 2D positional encoding. To enable reliable interpretation of crack spatial structures, a spatial calibration is performed by injecting 2D positional encodings into the Transformer. Each pixel/patch is assigned a coordinate (pos_h, pos_w). This calibration explicitly preserves the spatial layout of cracks, allowing the model to distinguish discontinuous cracks from continuous ones. The 2D positional encoding can be expressed as
where pos_h denotes the vertical row index (height), and pos_w denotes the horizontal column index (width). pos is the position in the sequence; i is the dimension index; dm is the dimensionality of the embedding vector. After adding positional embeddings of dimension [1, 256, 96], the sequence undergoes encoding through the six Transformer layers, each maintaining input and output dimensions of [B, 256, 96].
Next, the sequence from the previous layer Z0 is processed by the Transformer encoder. The encoder incorporates multi-head self-attention with 4 heads and a feed-forward network that expands the feature dimension to 384 (96 × 4). The equations can be listed as follows:
where k is the layer number; represents the output feature representation of layer , encoding global dependencies; denotes Layer Normalization, which stabilizes the internal covariate shift; is the Multi-head Self-Attention module that aggregates contextual information across parallel heads; and is the feed-forward network performing pixel-wise non-linear mapping.
The decoder progressively upsamples the feature map through two stages of 4× bilinear interpolation combined with 3 × 3 convolutions for refinement. The first transposed convolution uses 72 filters of size 4 × 4, transforming the feature map from [B, 96, 16, 16] to [B, 72, 64, 64]. This is followed by another convolution that reduces the number of channels to 48. A second transposed convolution layer with 36 filters of size 4 × 4 further upscales the feature map to [B, 36, 256, 256]. The final layers include two convolutional steps: one with 24 filters of size 3 × 3, and the other convolution that reduces the channel dimension to 1, resulting in a final output of size [B, 1, 256, 256]. The detailed parameter breakdown is provided in Table 1.
Table 1.
Transformer architecture design.
2.2. CNN–Transformer
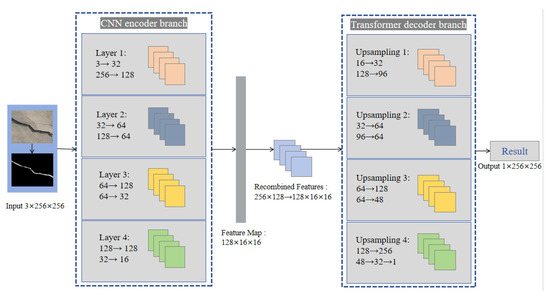
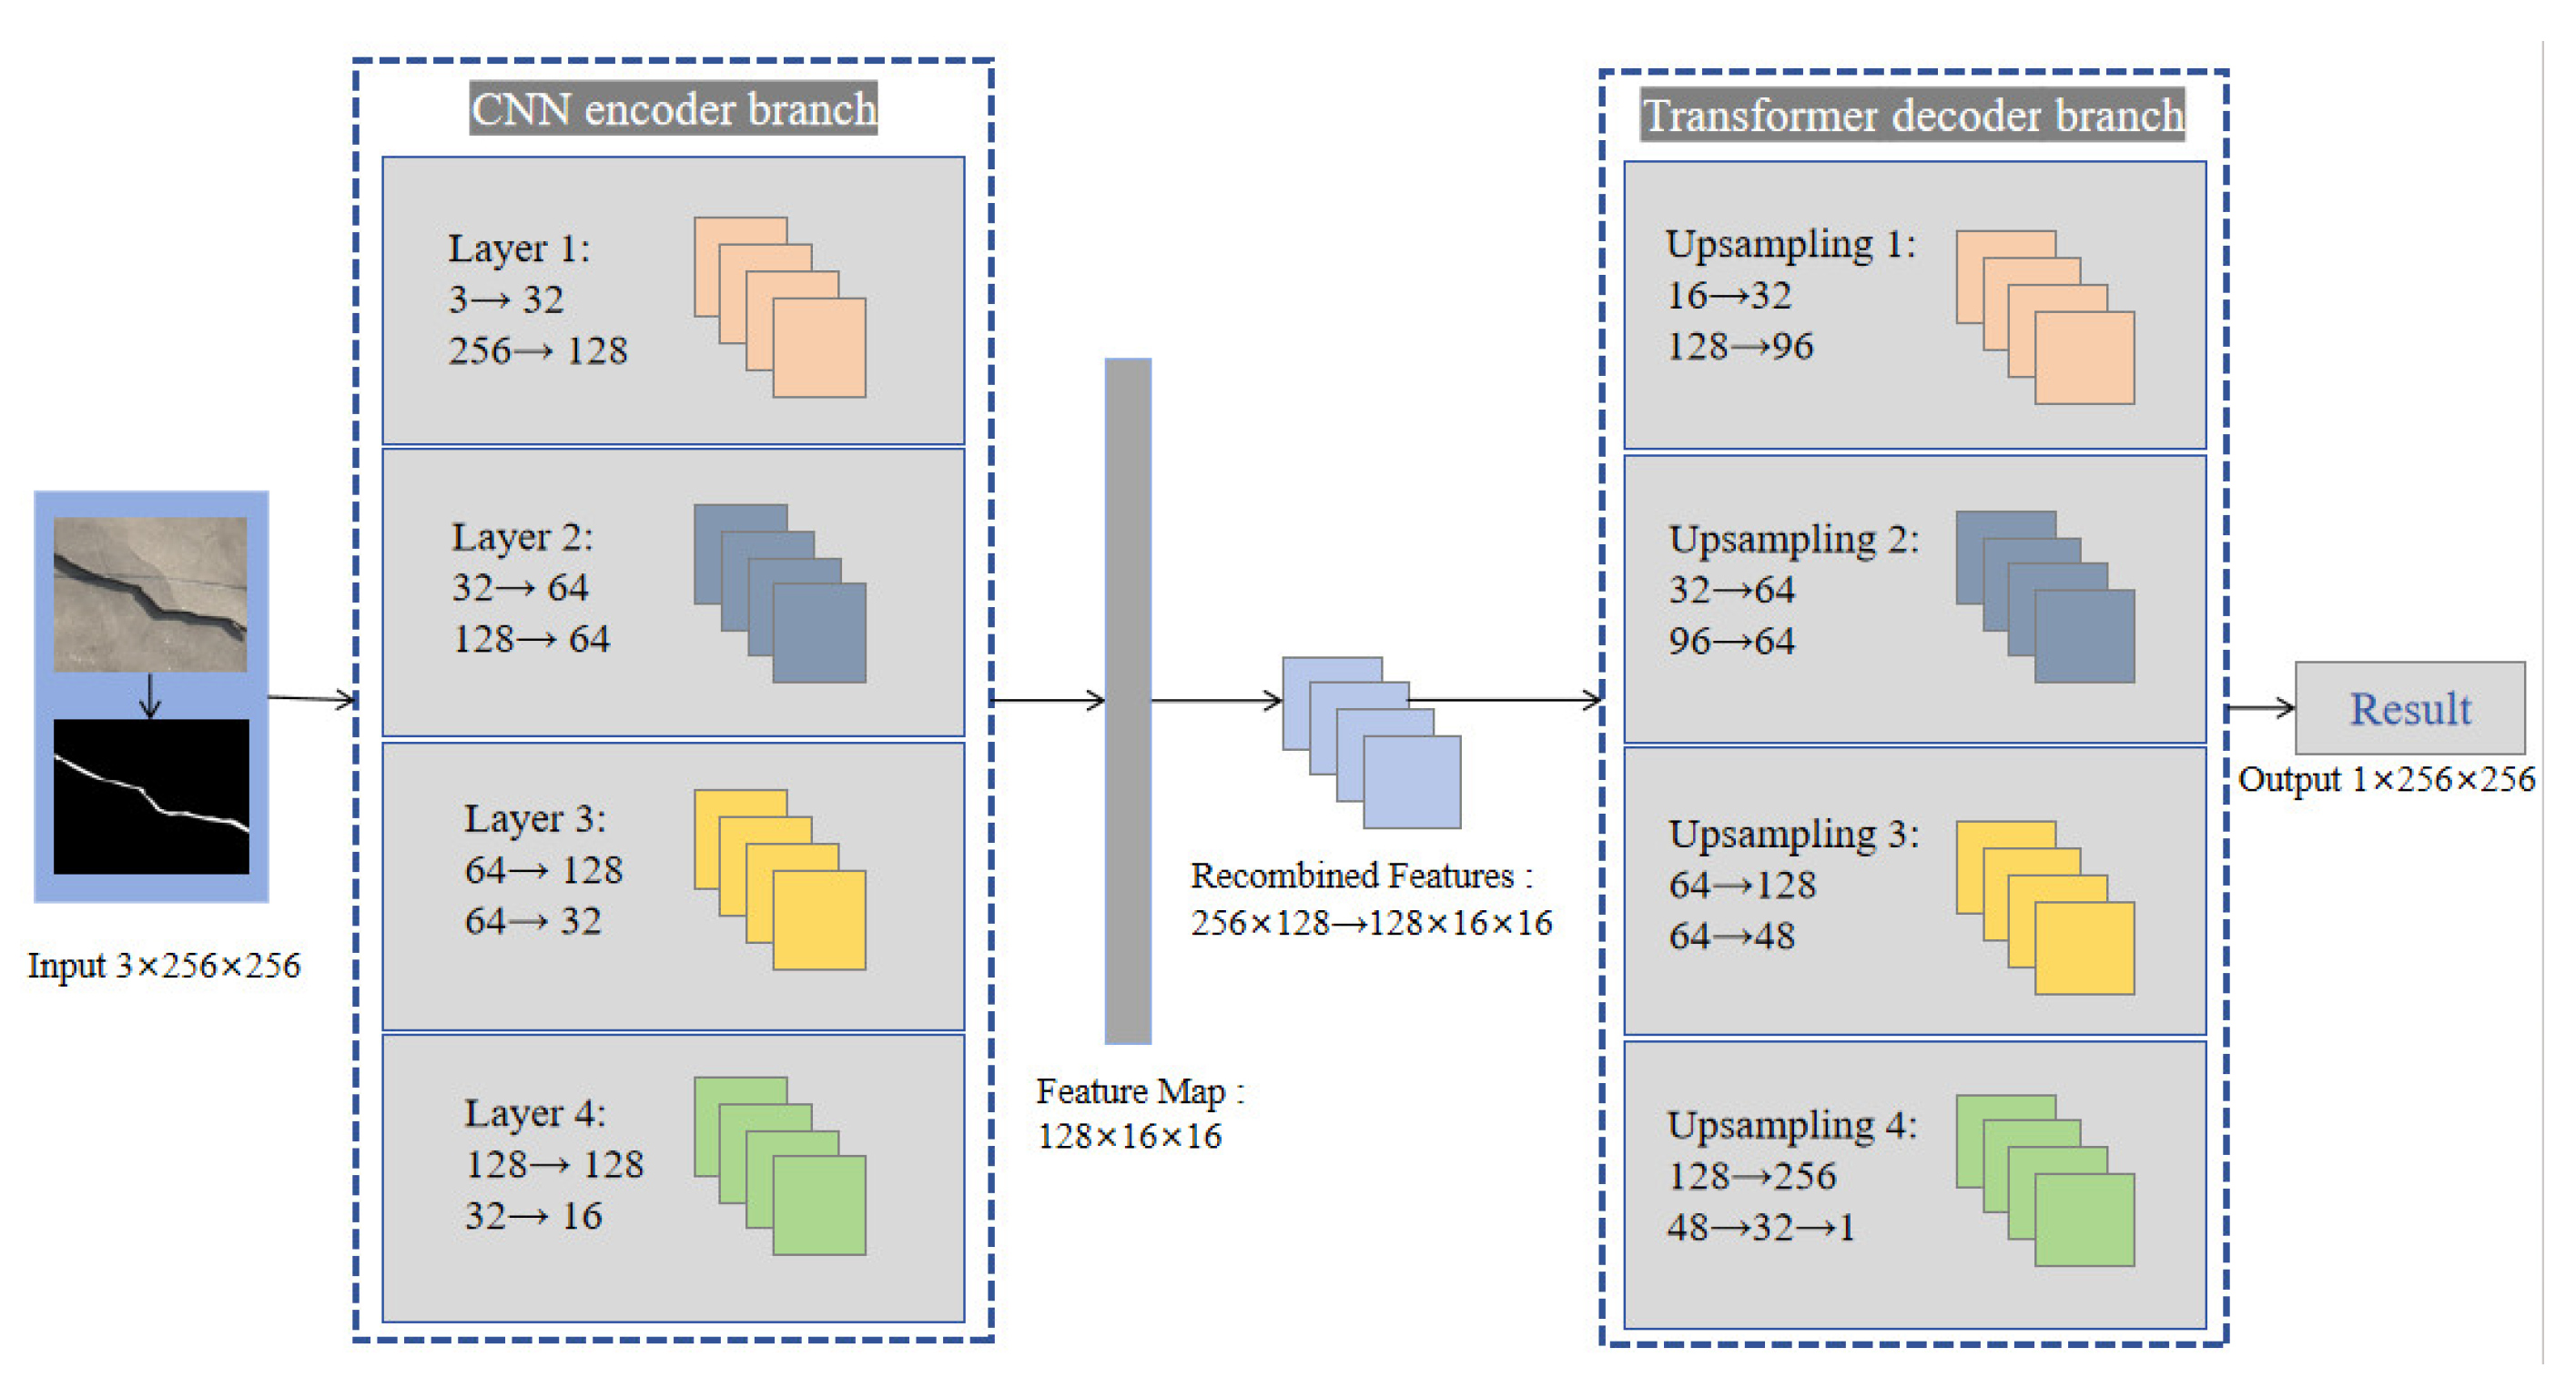
The architecture of this model, illustrated in Figure 3, employs a hybrid encoder–decoder structure consisting of a CNN encoder, a Transformer decoder, and a CNN-based upsampling decoder. With a total of 2.5 M parameters, the model processes a 3 × 256 × 256 input image and produces a 1 × 256 × 256 segmentation mask. It incorporates adaptive positional embedding and a mixed upsampling strategy to enhance feature representation and reconstruction accuracy. A detailed layer-by-layer breakdown is provided in Table 2.
Figure 3.
CNN–Transformer architecture model.
Table 2.
CNN–Transformer architecture design.
The encoder is a four-stage CNN that progressively reduces spatial resolution while increasing channel depth. Each CNN encoder block consists of convolutional layers (with BN and ReLU) followed by max pooling. Equations of the CNN encoder block are listed below:
where is the sequence in k stage and b block; k is from 1 to 4, b is from 1 to n. ReLU is the activation function, BN is the Batch Normalization layer; Conv is the convolution layer; and MP is the max pooling layer. Then, the input undergoes repeated feature extraction and downsampling, transitioning from [B, 3, 256, 256] to a compact feature map of size [B, 128, 16, 16].
The decoder first leverages a Transformer decoder module with 3 layers, 4 self-attention heads, and a feed-forward expansion ratio of 4 (hidden dimension 512). Query and positional embeddings of size [1, 256, 128] are incorporated to guide the decoding process. The feature sequence is flattened from [B, 128, 16, 16] to [B, 256, 128] for Transformer processing and then restored spatially.
Subsequently, the decoder performs four-step upsampling through transposed convolutions and bilinear interpolation. Detailed, transposed convolution increases the resolution of an image or feature map. The equation of transposed convolution is expressed as follows:
where refers to Transposed Convolution, a learnable operator that learns to reconstruct fine crack boundaries by increasing the spatial resolution of the feature map. Each upsampling stage increases spatial resolution while reducing the channel count, from [B, 128, 16, 16] to [B, 96, 32, 32], then to [B, 64, 64, 64], and [B, 48, 128, 128]. A final bilinear upsample scales the feature map to 256 × 256, followed by a pointwise convolution that outputs a single-channel mask.
2.3. Transformer–CNN Model
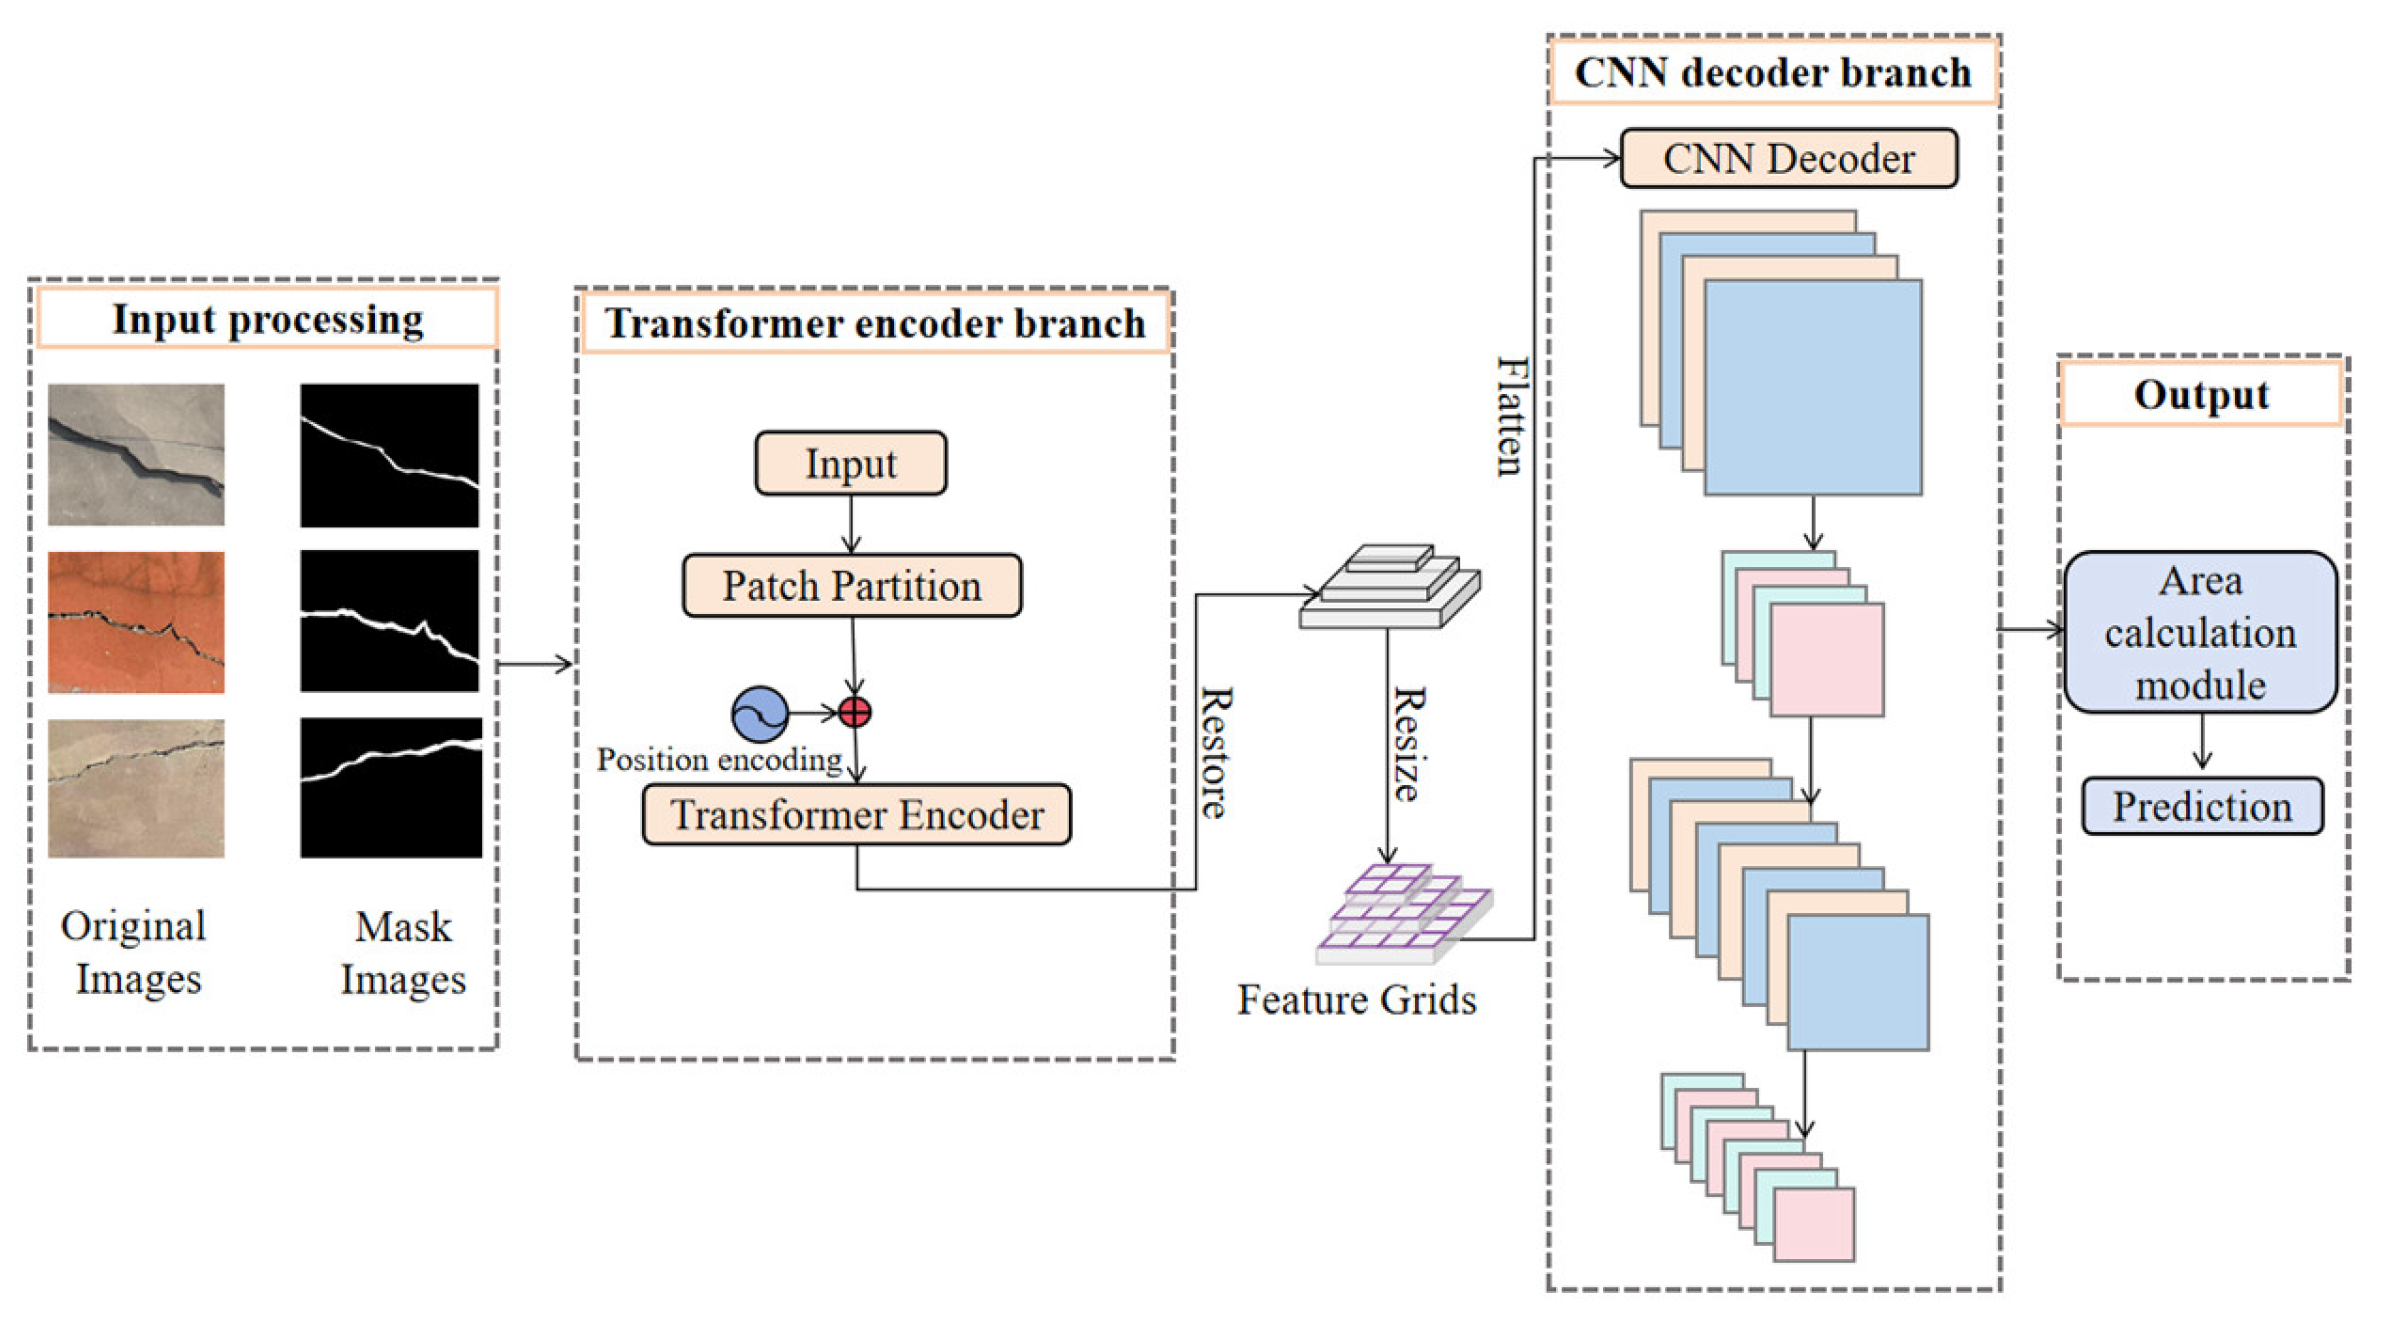
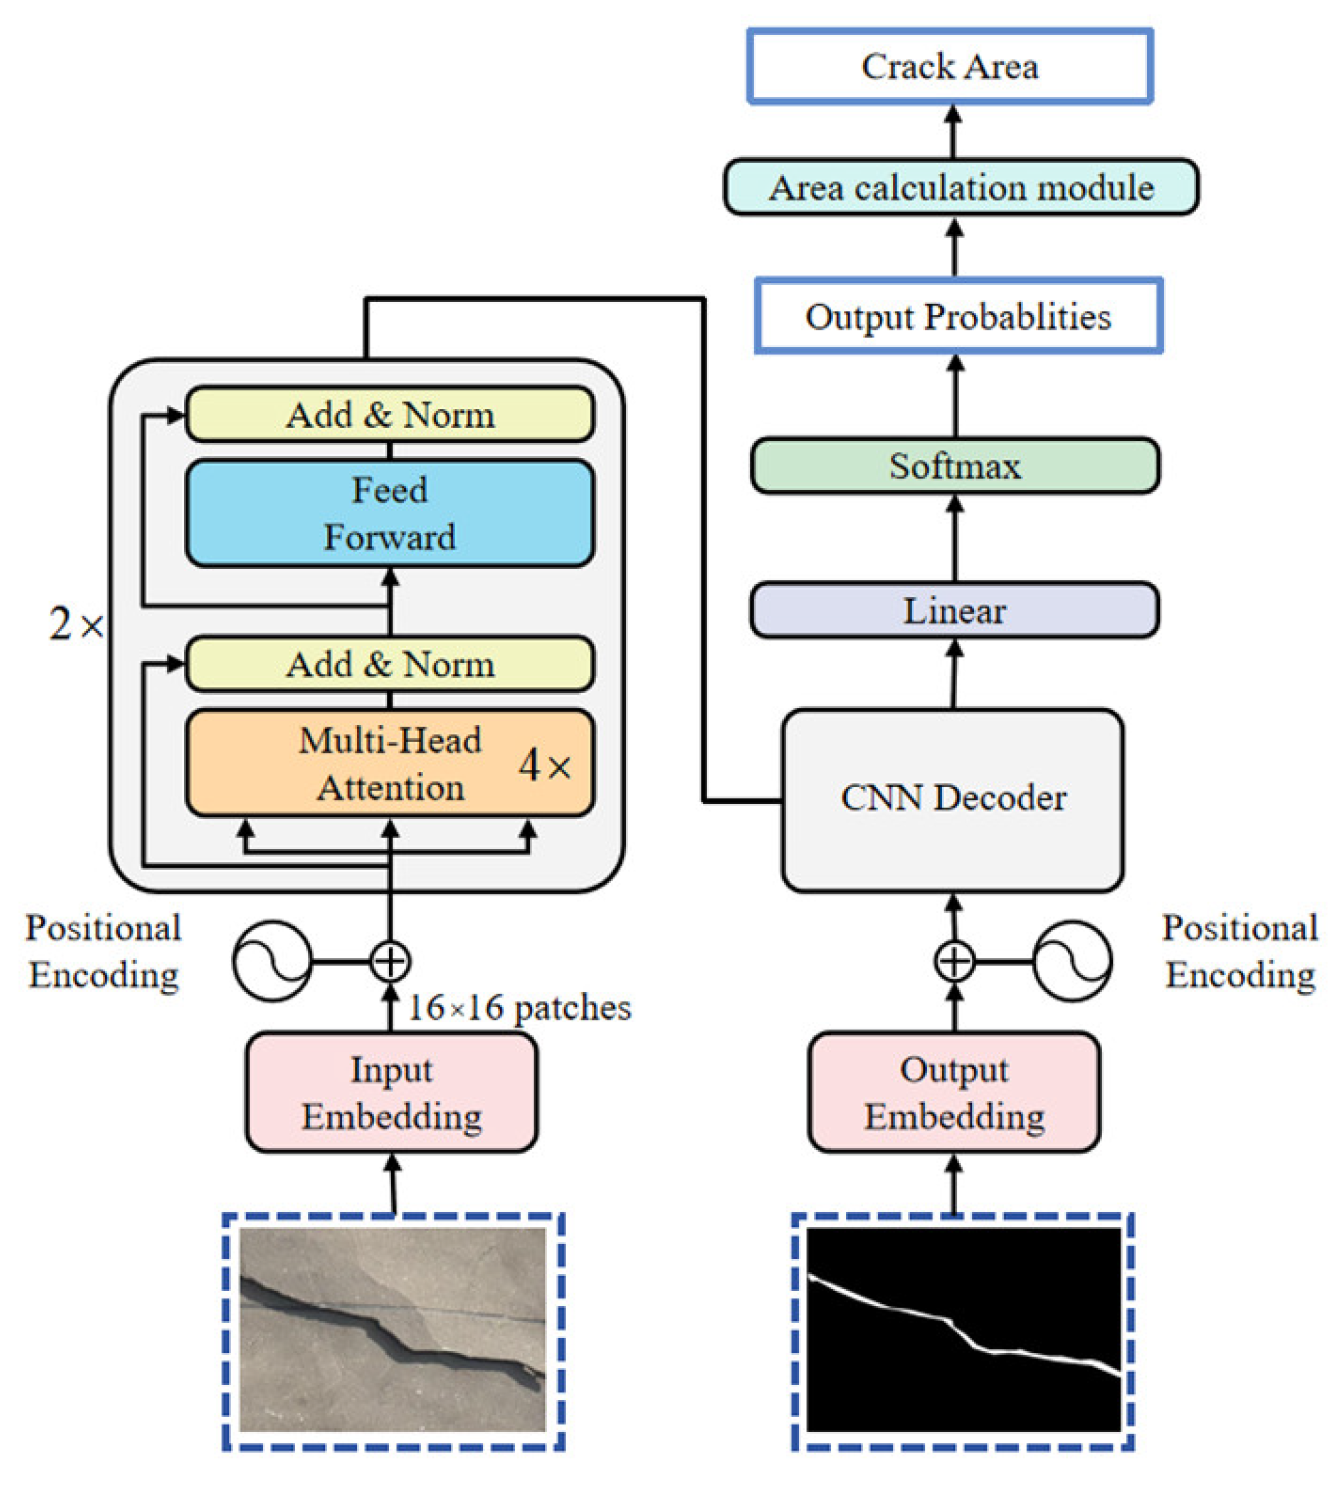
This study presents a Transformer–CNN hybrid architecture model for pixel-level crack detection in structural images, as illustrated in Figure 4. The model consists of four sequential stages. Firstly, dual-channel input, comprising raw structural images and corresponding binary segmentation masks, is integrated for position encoding to spatial relationships during feature extraction. Secondly, a two-layer transformer encoder stacks the extracted features through two main components. The first one is Multi-head Self-Attention, which captures global contextual dependencies, and the second one is a feed-forward neural network that transforms the feature representations. The output feature matrices are then restored and reshaped into spatially structured matrices. Thirdly, these matrix bringing the crack information are fed into the CNN decoder to extract low-level contour geometries and positional attributes [19]. Finally, the output probability is utilized to identify crack information through the Transformer–CNN hybrid network, and the crack area prediction is calculated via an area calculation module. The proposed Transformer–CNN hybrid architecture effectively integrates global contextual information and local feature extraction capabilities, enabling precise pixel-level crack detection in structural images. This innovative approach demonstrates significant potential for enhancing the accuracy and efficiency of structural health monitoring systems.
Figure 4.
Transformer–CNN hybrid architecture model.
2.3.1. Transformer Encoder Branch
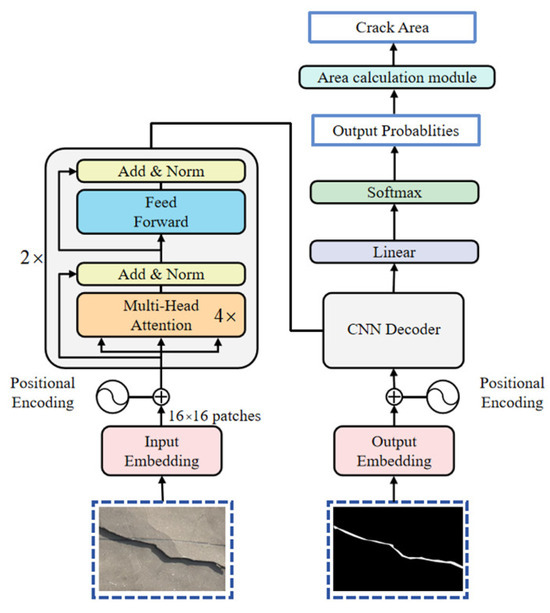
In the hybrid Transformer–CNN model, the transformer encoder branch plays an important role in accurately capturing detailed information, such as the edges and textures of structural cracks, modeling long-range dependencies in images, and enhancing the generalization ability of the model, enabling it to maintain stable detection performance across different environments. The details of the encoding stage are shown in Figure 5. The Patch Embedding and positional encoding stage is similar to the Transformer. The encoding part adopts a two-layer structure, with each layer consisting of 4 multi-head attention mechanisms and a Feed-Forward Network [20] to capture contextual dependencies and enrich the feature representations. This hierarchical encoding process effectively balances local structural details with global contextual awareness, providing essential feature representations for the subsequent decoding stage.
Figure 5.
Transformer branch.
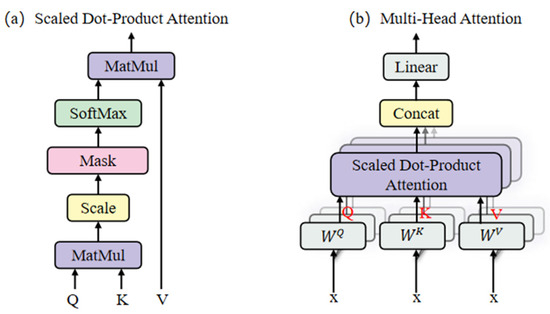
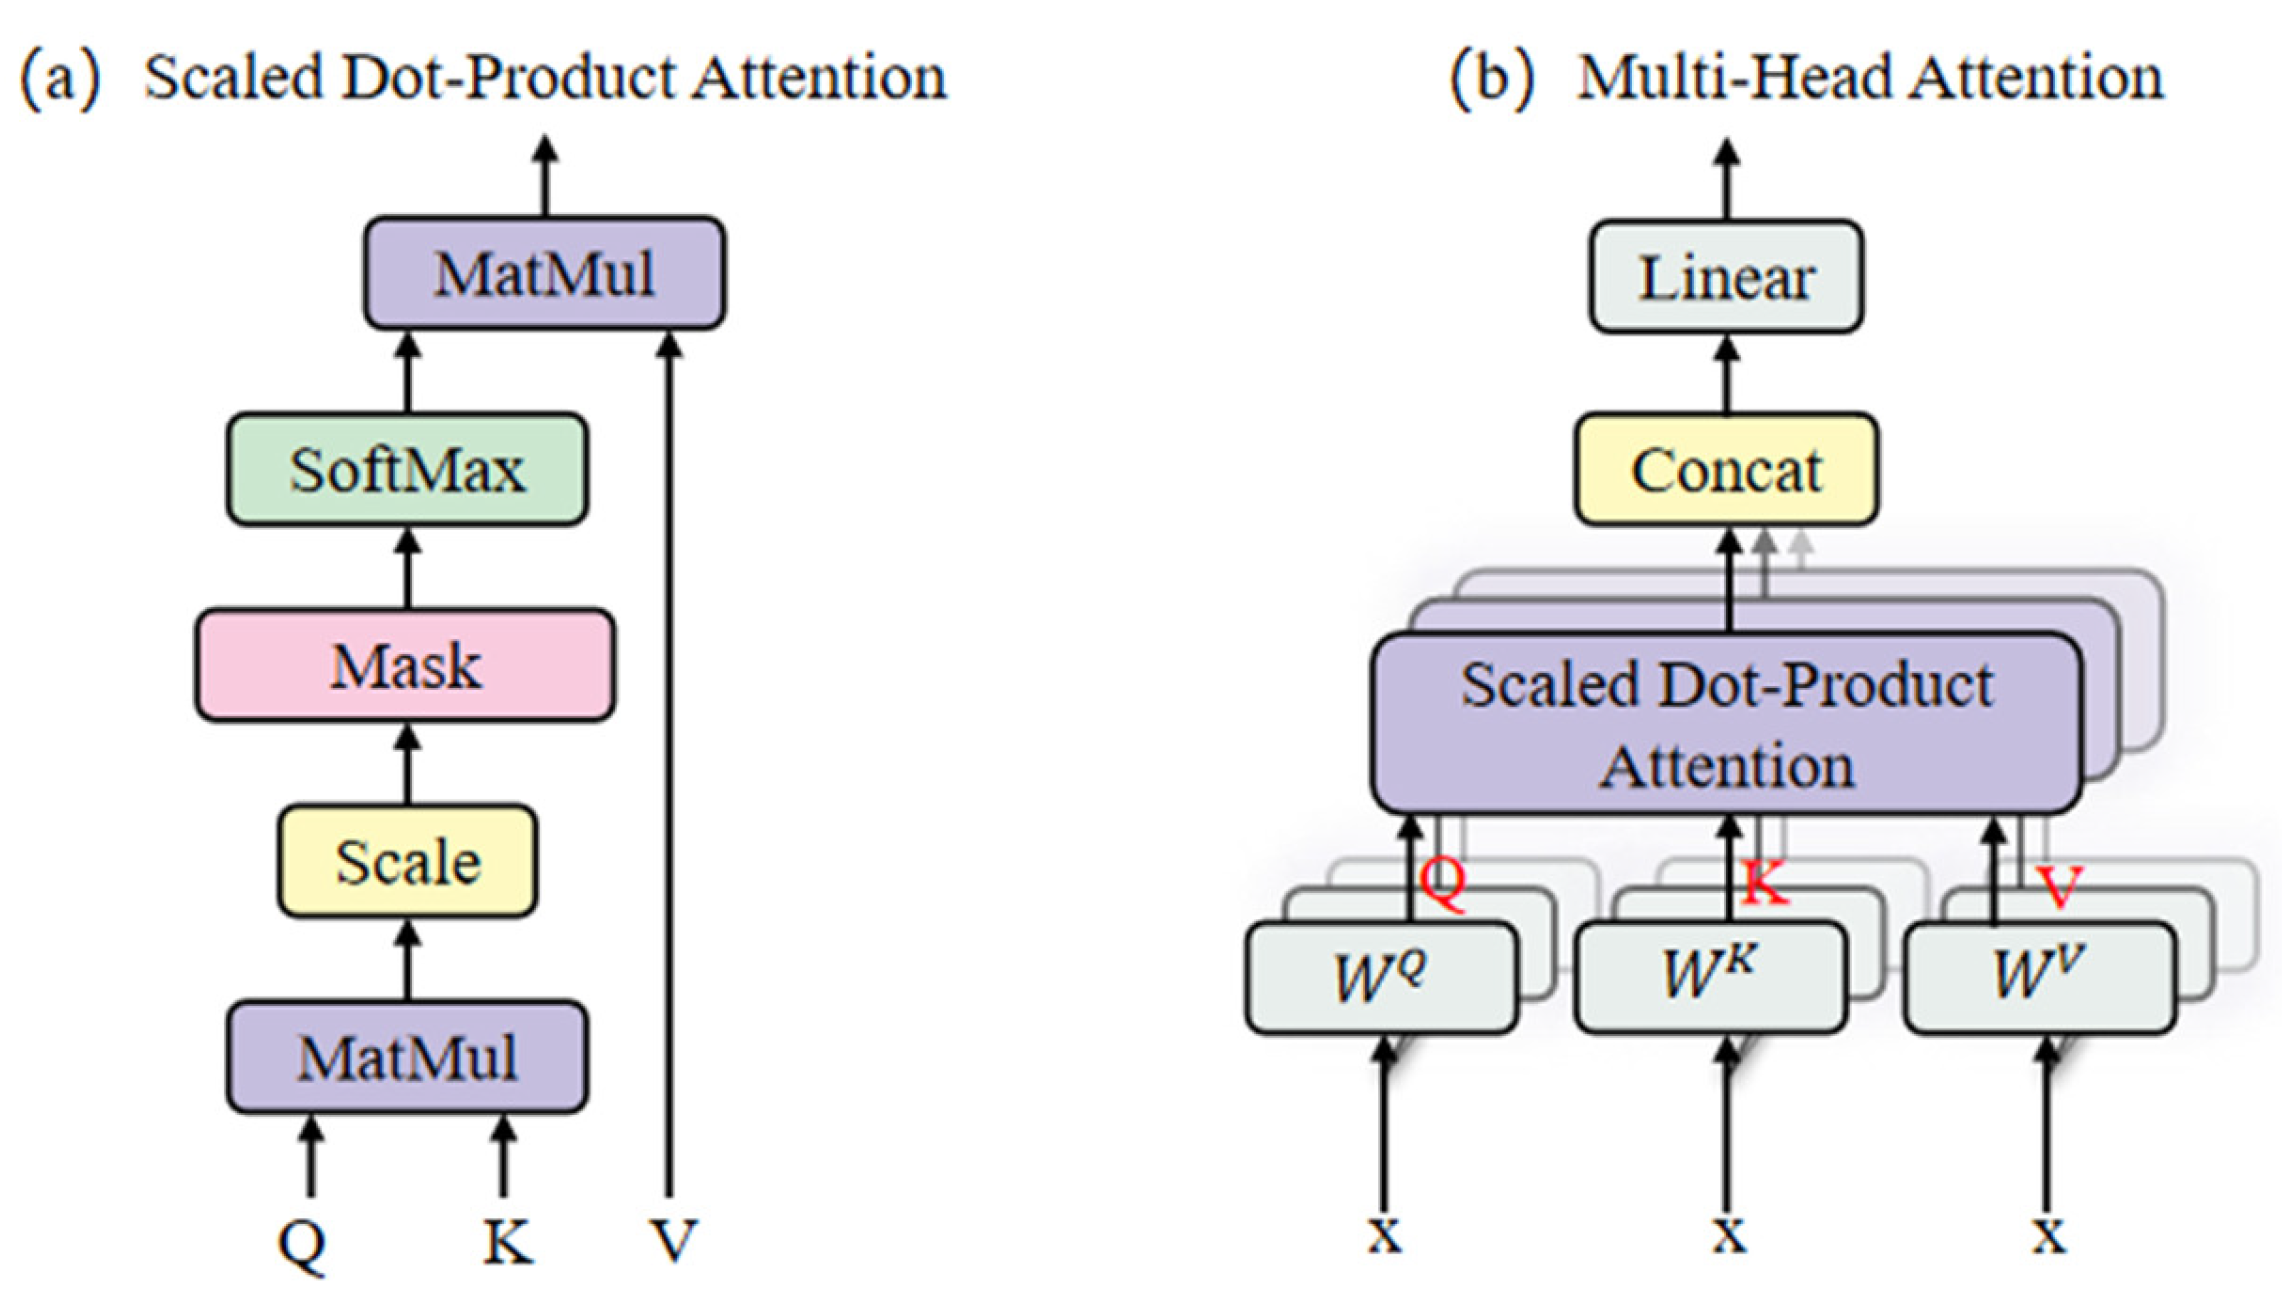
The structure of the multi-head self-attention mechanism [21] is shown in Figure 6, which includes two main attention mechanisms: Scaled Dot-Product Attention and Multi-Head Attention. As illustrated in Figure 6a, the matrix multiplication between the query (Q) and key (K) matrices yields similarity scores, which are then scaled. A SoftMax operation is subsequently used to convert these scores into attention weights ranging from 0 to 1. Finally, a weighted sum over the value (V) matrix is computed to better highlight the morphological characteristics of cracks.
Figure 6.
The structure of the multi-head self-attention mechanism.
As shown in Figure 6b, for an input vector x, the equations are expressed as follows:
where , , and denote learnable matrices. Using the same process shown in Figure 6a, multiple sets of distinct attention outputs are generated. These outputs are concatenated to fuse features from different perspectives, then processed by a linear layer to produce the corresponding output of the multi-head self-attention mechanism.
As a crucial component of the Transformer, the multi-head self-attention mechanism enables modeling of different image regions while capturing long-range dependencies within the sequence, thereby extracting contextual information [22] effectively. The equation for calculating the self-attention scores is shown below:
where T is the matrix transpose, and is the dimension of k [23].
2.3.2. CNN Decoder Branch
The decoder architecture incorporates three core components: An upsampling module, a convolutional processing module, and a multi-scale feature fusion module. During the decoding stage, the sequence output from the encoding stage, with dimensions [B, 256, 256] (where B denotes the batch size), is first restored into a spatial feature map of dimensions [B, 256, 16, 16]. As depicted in Figure 7, the initial upsampling step employs a 4 × 4 convolutional kernel with a stride of 4, resulting in an output feature map of dimensions 128 × 64 × 64. Then, feature refinement is performed using a 3 × 3 convolution layer, which further fuses local features and enhances non-linearity through the ReLU [24] activation function, while maintaining the spatial dimensions. A second upsampling step applies a 4× magnification transposed convolution [25], followed by a 1 × 1 convolution to reduce the number of channels to 1, thereby generating a prediction mask that matches the input size and outputting the detection result.
Figure 7.
Details of the CNN decoder branch.
By integrating the advantages of CNN’s local feature capture and Transformer’s global modeling capability, this approach enhances both crack detection performance and computational precision [26,27,28].
2.3.3. The Detailed Architecture of Transformer–CNN
The proposed Transformer–CNN architecture employs a distinctive encoder–decoder design that fundamentally differs from both the pure Transformer and CNN–Transformer models previously described. As detailed in Table 3, this model utilizes a Transformer-based encoder for feature extraction and a CNN-based decoder for spatial reconstruction, representing a balanced division of labor between global modeling and local detail recovery.
Table 3.
Transformer–CNN architecture design.
The encoder begins with a convolutional patch embedding layer that segments the input image into 16 × 16 patches, similar to the other two models. The embedded patches are then serialized into a token sequence and processed by two standard Transformer layers. Unlike the earlier pure Transformer model that used six layers, this architecture employs only two layers, reducing computational complexity while retaining global context capture through 4-head self-attention.
The decoder adopts a fully convolutional upsampling path. It consists of two transposed convolution blocks that progressively restore spatial resolution to 256 × 256. This design contrasts with the CNN–Transformer model, which incorporated Transformer components in the decoding stage. The final output is generated through a 1 × 1 convolution that produces a single-channel segmentation mask. This streamlined decoder architecture emphasizes efficiency while maintaining precise spatial reconstruction capabilities.
3. Case Study
This section systematically delineates the data preparation stage, including experimental design, dataset acquisition, and data augmentation. Subsequent subsections expound on the loss function, evaluation indicators, and visual-analysis methodologies.
3.1. Image Data Preparation
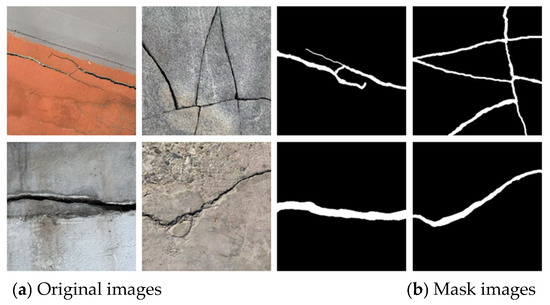
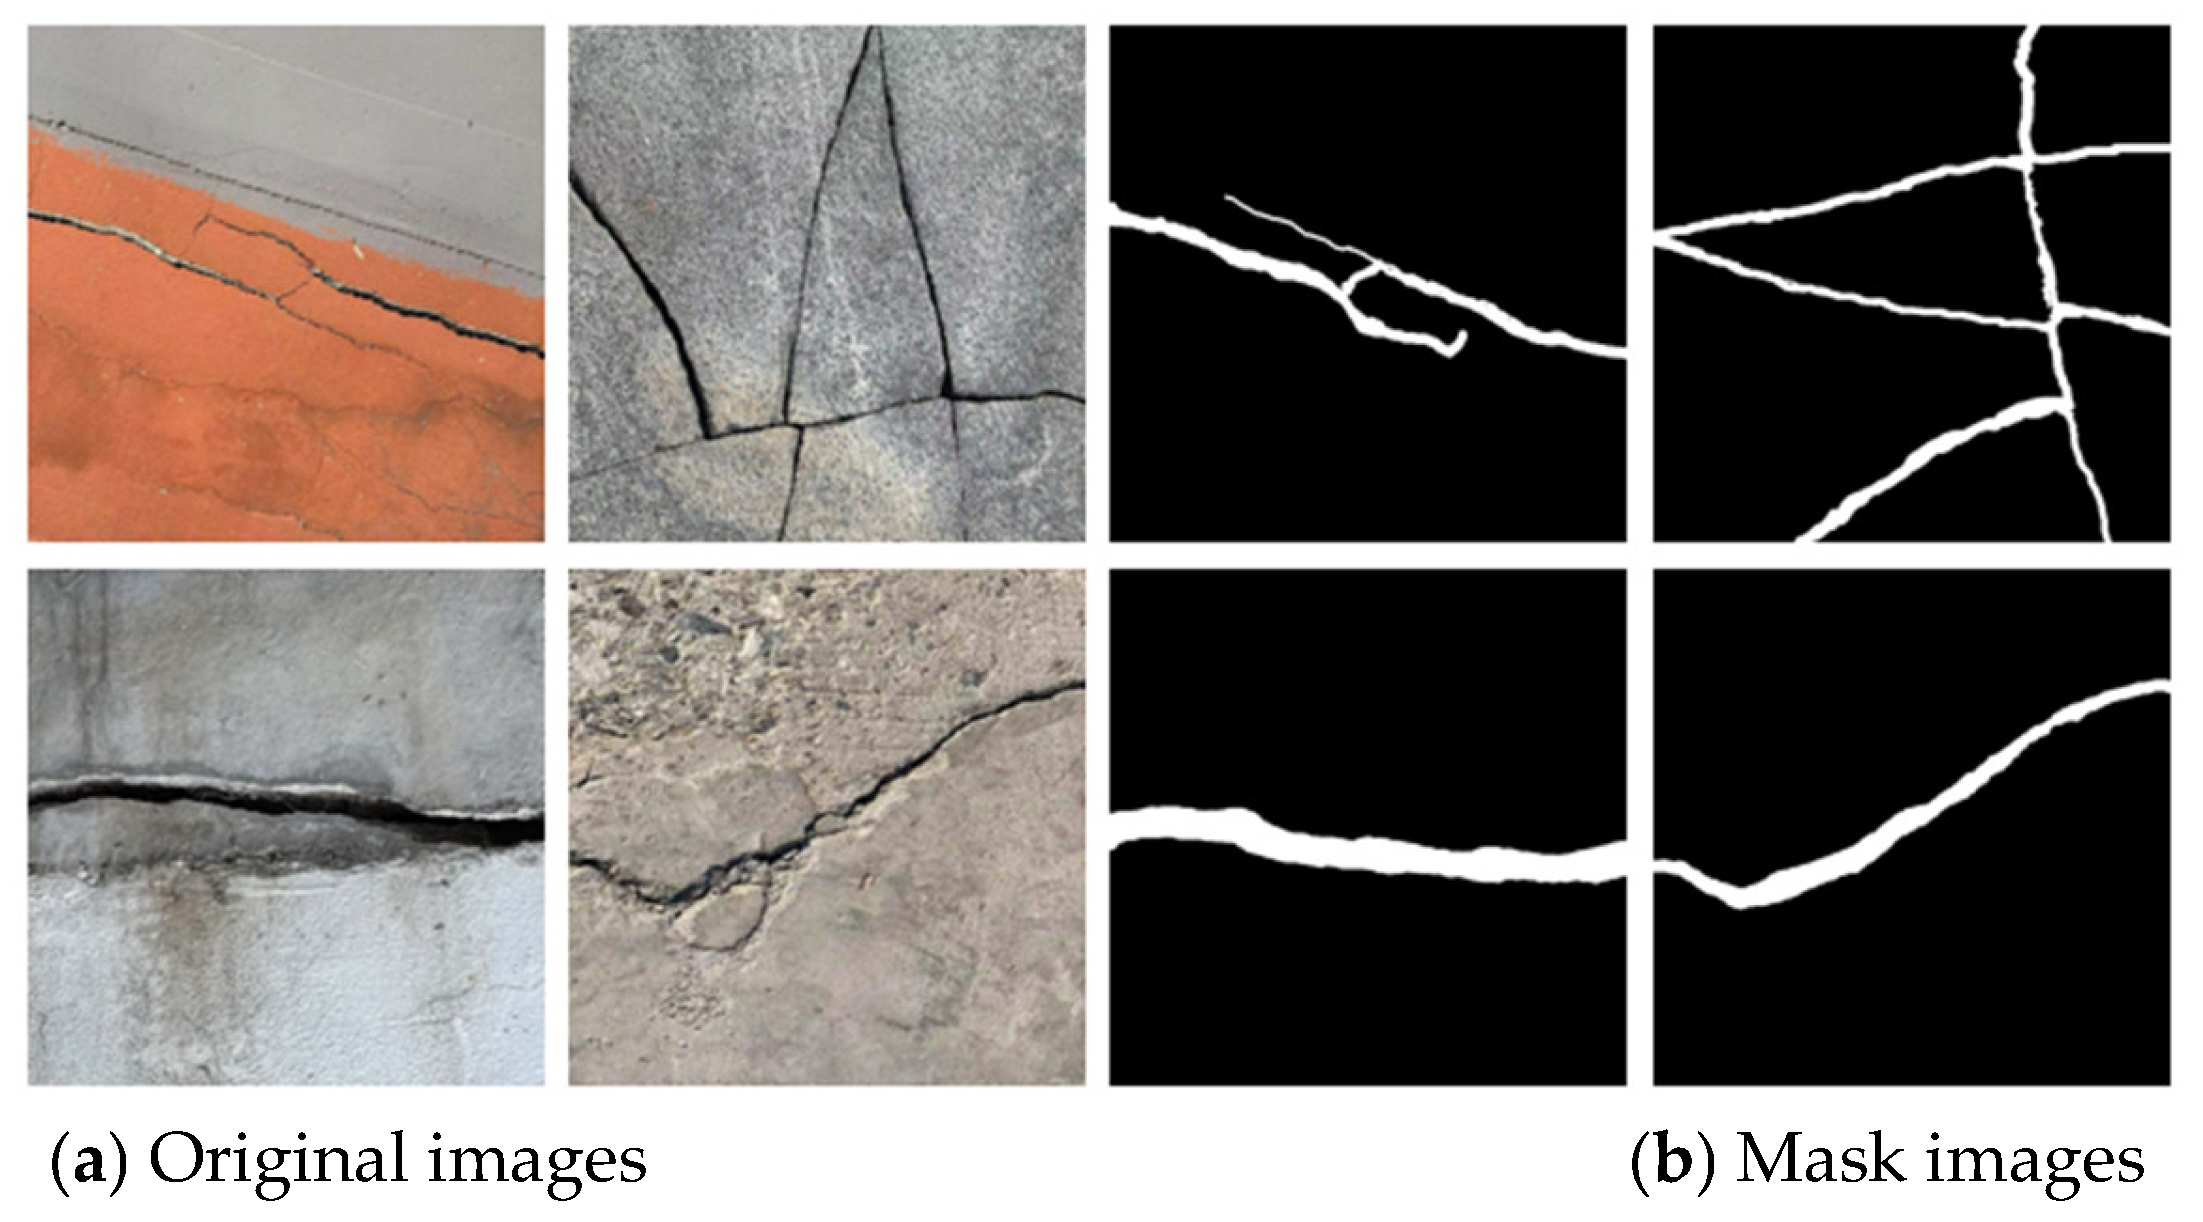
The training dataset consisted of 3000 RGB images in total, with a 1:1 ratio between real-world photographs and images selected from the internet. To optimize model training, these images were deliberately chosen to lack commonalities, including scenarios with complex backgrounds and images featuring single cracks. As shown in Figure 8, the image data can be observed more intuitively, with Figure 8a showing the original image and Figure 8b showing the mask image. Among the 1500 real-world images, 750 were original captures, while the other 750 were generated by rotating and cropping the original images (with non-uniform cropping sizes). The same approach was applied to the 1500 web-sourced images. To improve recognition, image enhancement was performed, and mask processing was applied to all 3000 images to ensure the accuracy of defect identification.
Figure 8.
The original data of crack images and the masks.
The test dataset included 1000 images. Similarly, the ratio of real-world captures to web-sourced images was 1:1. To better analyze and evaluate the model’s performance, during the testing phase, this study adjusted the brightness and darkness of the test data manually.
It should be noted that physical markers or reference scales were not employed in the original images (as shown in Figure 8a). This is primarily because, in practical infrastructure inspections, pre-deploying markers across large-scale structures is often logistically challenging and inefficient. The focus of this study is to develop a robust deep learning architecture capable of accurately segmenting cracks from complex backgrounds without relying on external references. For the quantification of crack development, numerical scaling can be achieved through camera calibration and known shooting distances (i.e., pixel-to-physical size conversion) in subsequent practical applications, rather than depending on manual markers.
In conclusion, the data ratio of the training set to the test set was 3:1. Training models with this type of data presented significant challenges for wall crack-detection models. This was mainly because of the issue of identifying crack and non-crack regions in each piece of data. Different texture conditions caused multiple interferences in the model’s feature extraction. Moreover, for real-world captured data, due to camera shake during shooting, the operation of photography was rather difficult. At the same time, this also greatly tested the performance of the model during both the training and testing processes.
3.2. Scenario Design
As shown in Table 4 below, the study sets up three parts of the experimental comparison: the LSTM model, the CNN, the Transformer, the CNN–Transformer, and the Transformer–CNN model used in this study were trained and compared under the same conditions. Case 2 By augmenting and multiplicatively reducing the original data, different results can be observed; Case 3 The images are post-processed by uniformly adjusting their brightness to the same level for effect comparison; Case 4 To train the model’s ability to recognize complex backgrounds, the data backgrounds are adjusted by adding brick textures and water stain textures; Furthermore, a specialized ablation analysis, designated as Case 5, is introduced to systematically dissect the specific contributions of key modules to the overall network efficiency. Next, a detailed elaboration will be provided.
Table 4.
The experimental design situation.
The overall research algorithm was primarily developed using PyTorch 2.1.1 [29] open-source framework, implemented in the Python 3.9.19 programming language within the PyCharm 2024 integrated development environment. In this study, all models were trained and tested on this framework, enabling the entire process from algorithm development to testing. This approach demonstrates certain prospects for applications in wall-crack detection.
3.3. Loss Function
Since the detected data all face the problem of the imbalance proportion between cracks and non-cracks, the Binary Cross Entropy Loss function (BCEWithLogitsLoss) [30] is introduced to calculate the test loss. However, this function may have errors.
Therefore, in this paper, represents the Binary Cross-Entropy loss, which evaluates the classification accuracy of individual pixels, and is the Dice loss [31], focusing on the spatial overlap between predicted crack regions and the manually labeled ground truth. Accordingly, the formula of Bce is defined as follows, where is the true label, is the predicted probability, and A is the total number of pixels. Dice is defined as follows, which can effectively alleviate the problem of data imbalance. The combined definition formula of the two is presented below [32]; and then, by adjusting the value of , the loss problem of crack detection by the function can be focused on.
3.4. Evaluation Indicators
To evaluate the performance of the proposed structure-crack detection framework, two complementary metrics were adopted: IoU and Accuracy. The equation of IoU [33] is shown as follows. It measures the spatial overlap between the predicted mask and the real mask.
where Fr represents the predicted result, and Rr represents the real result. By calculating the intersection and union successively, the ratio can intuitively reflect the accuracy of the obtained predicted values. The value of IoU ranges from 0 to 1. When the value is closer to 1, it means a higher degree of overlap. On the contrary, when it is closer to 0, it indicates a large difference between the predicted results and the true results.
While IoU primarily measures the spatial overlap between predicted and ground-truth regions, it offers limited insight into overall classification performance. To provide a more comprehensive evaluation of the detection model’s performance, this study incorporates both Intersection over Union (IoU) and accuracy metrics. The accuracy metric assesses the model’s global performance by quantifying the proportion of correctly classified pixels relative to the total number of samples. These complementary metrics enable a more rigorous and holistic assessment of the model’s detection capability and area calculation precision. The synergistic use of both evaluation criteria ensures a balanced analysis of both localization precision and classification reliability.
4. Results and Discussion
This section presents a comprehensive analysis of the experimental results derived from evaluating five proposed architectures, including LSTM, CNN, Transformer, CNN–Transformer, and Transformer–CNN, for crack detection in civil infrastructure. The performance of each model was thoroughly assessed in terms of training dynamics, convergence stability, and generalization ability across diverse operational conditions. Key aspects examined included comparative crack recognition effectiveness, sensitivity to training data volume, robustness under varying illumination conditions, and consistency of performance amid different background textures (Cases 1 to 4 in Table 4). By integrating quantitative metrics (such as IoU, accuracy, and loss) with qualitative observations (visualization of results), the discussion provided critical insights into the applicability and limitations of each model across multiple scenarios, aiming to identify the most efficient and optimized architecture for civil crack detection.
4.1. Comparison of Crack Recognition Capabilities of Different Methods
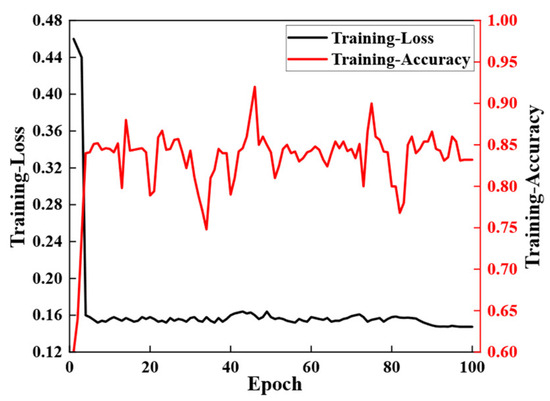
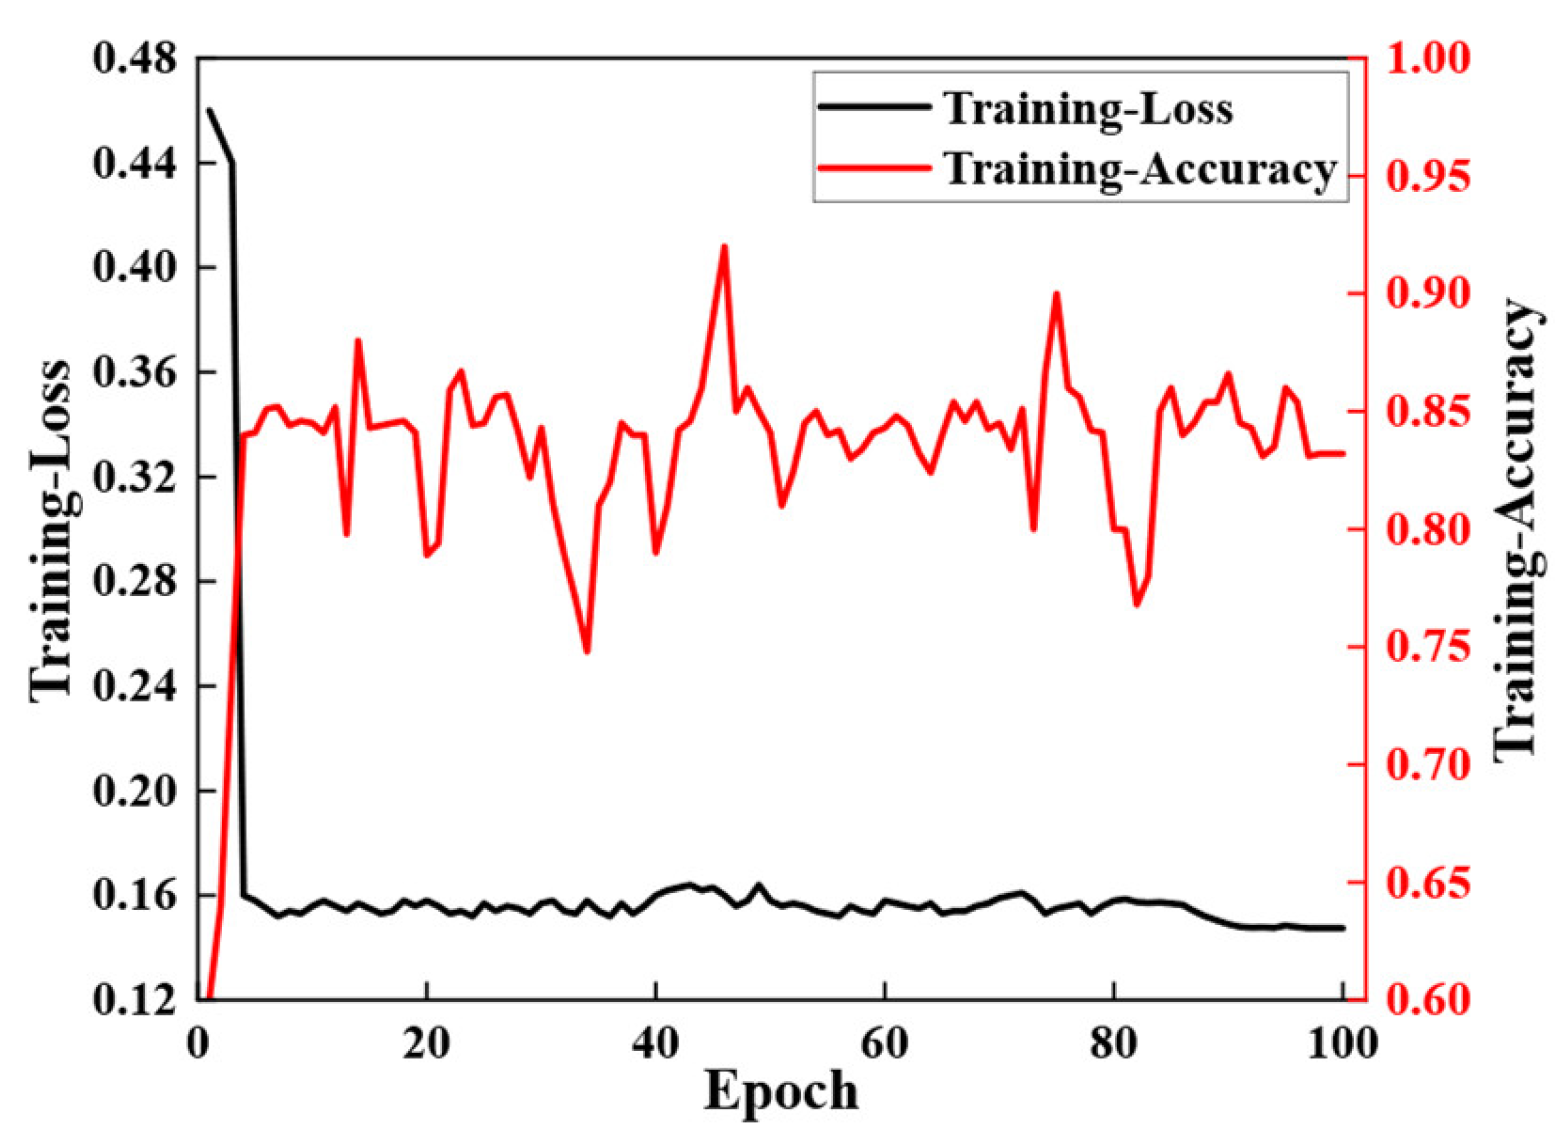
As shown in Figure 9, the model employed in this study is an LSTM. The loss value decreased significantly from 0.48 to approximately 0.2, while the accuracy increased rapidly to around 0.85. However, oscillations were observed during the training process, indicating a potential risk of severe overfitting. The model is likely memorizing noise and specific sample characteristics in the training set rather than learning generalizable patterns. Additionally, the training time of the LSTM is relatively longer compared to other models. To enhance generalization capability, strategies such as early stopping or regularization may need to be introduced in subsequent steps.
Figure 9.
The loss during the training of the LSTM model.
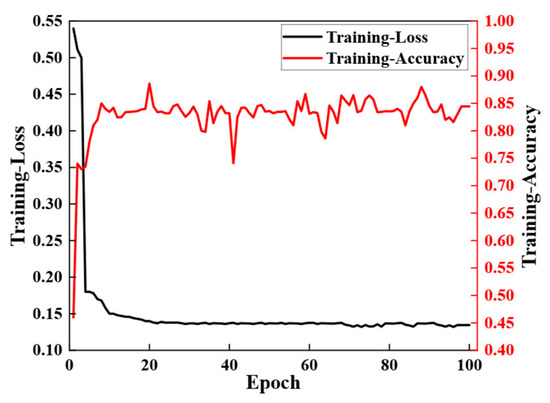
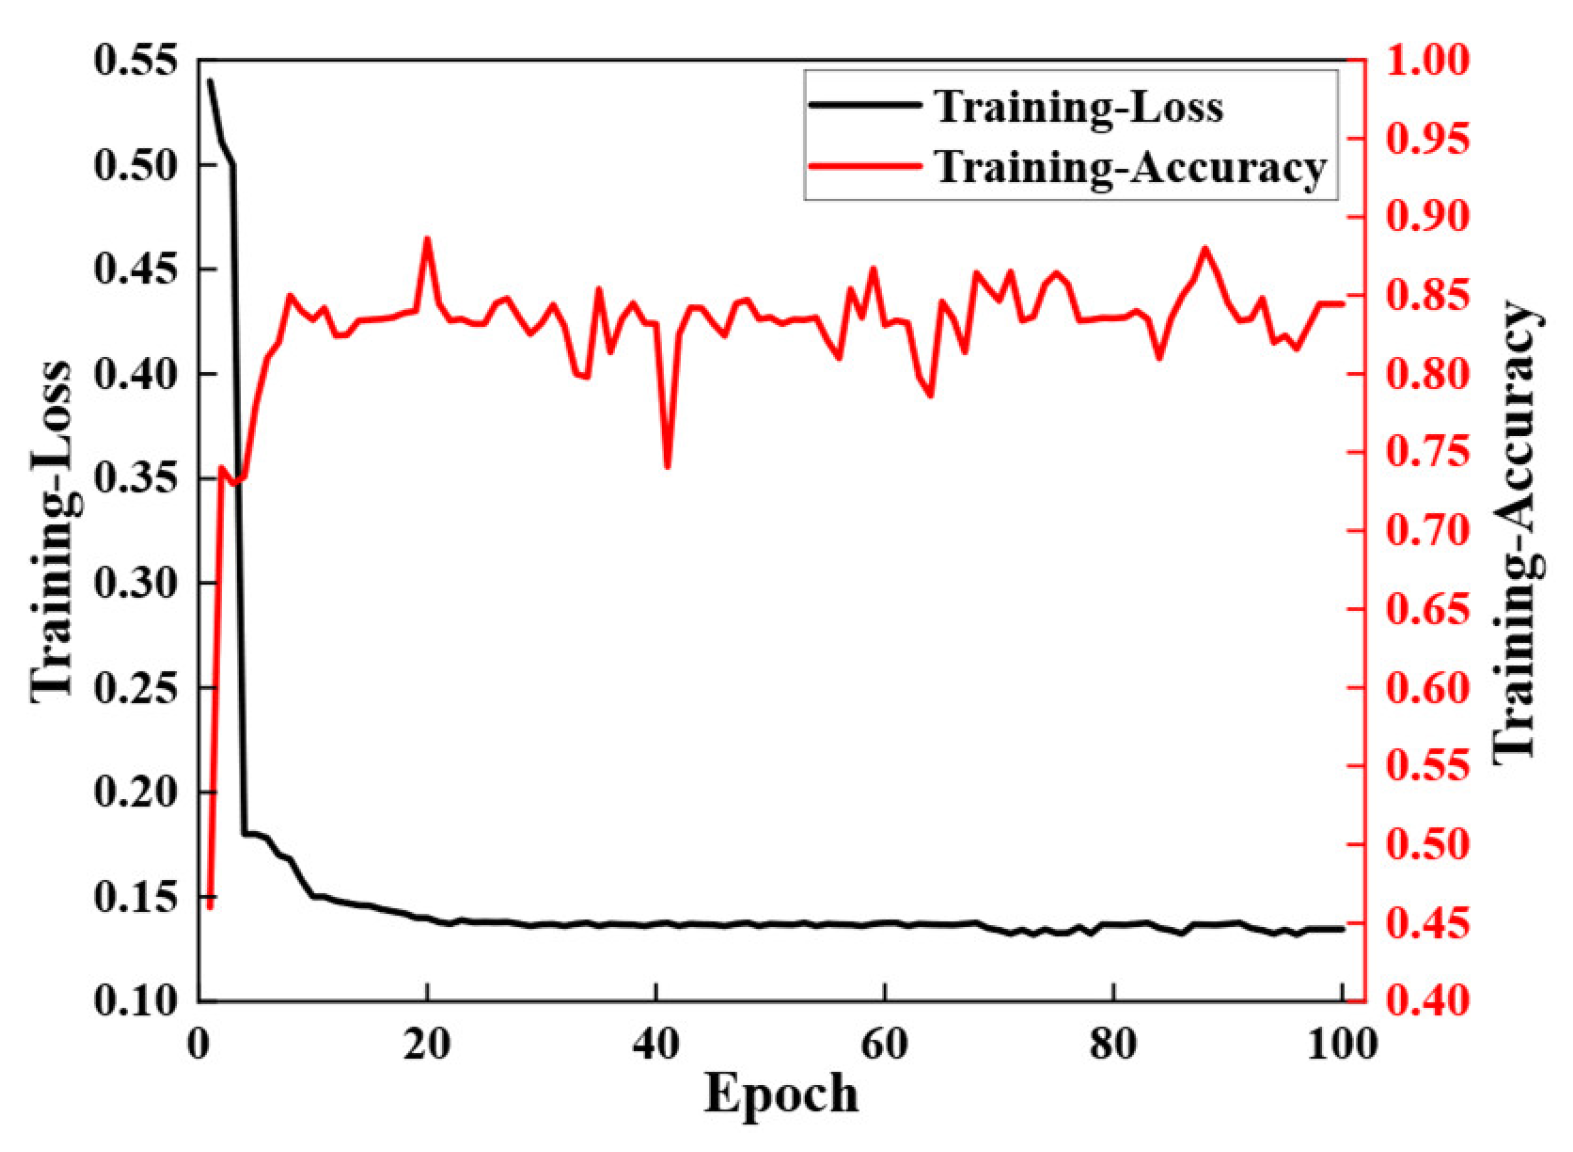
As shown in Figure 10, the model used is a CNN. The loss value drops rapidly from 0.55 and stabilizes at around 0.15, remaining stable subsequently. This shows that the model can quickly learn the basic features and patterns in the data in the early stage, but the model may be affected by the internal factors of the data during later training. The accuracy value increased markedly from 0.4 to 0.85 at a significant pace, then stabilized after reaching a specific threshold. Noticeable fluctuations were observed during the training process, suggesting further potential for improvement in subsequent phases.
Figure 10.
The loss during the training of the CNN model.
Figure 11 depicts the training behavior of the Transformer model. The loss value initially declined sharply from approximately 0.54 but subsequently fluctuated without converging stably. Concurrently, accuracy climbed rapidly to around 0.90 before stabilizing near 0.95. The Transformer model exhibited pronounced instability during training, with the loss curve oscillating persistently and failing to converge smoothly. This behavior can be attributed to the self-attention mechanism’s limited ability to capture local spatial features, such as edges and fine textures, which are critical for accurate crack detection.
Figure 11.
The loss during the training of the Transformer model.
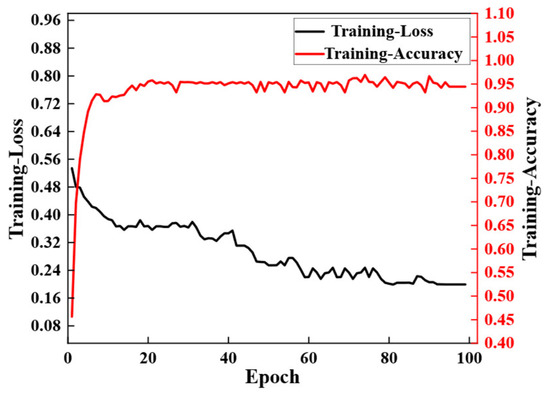
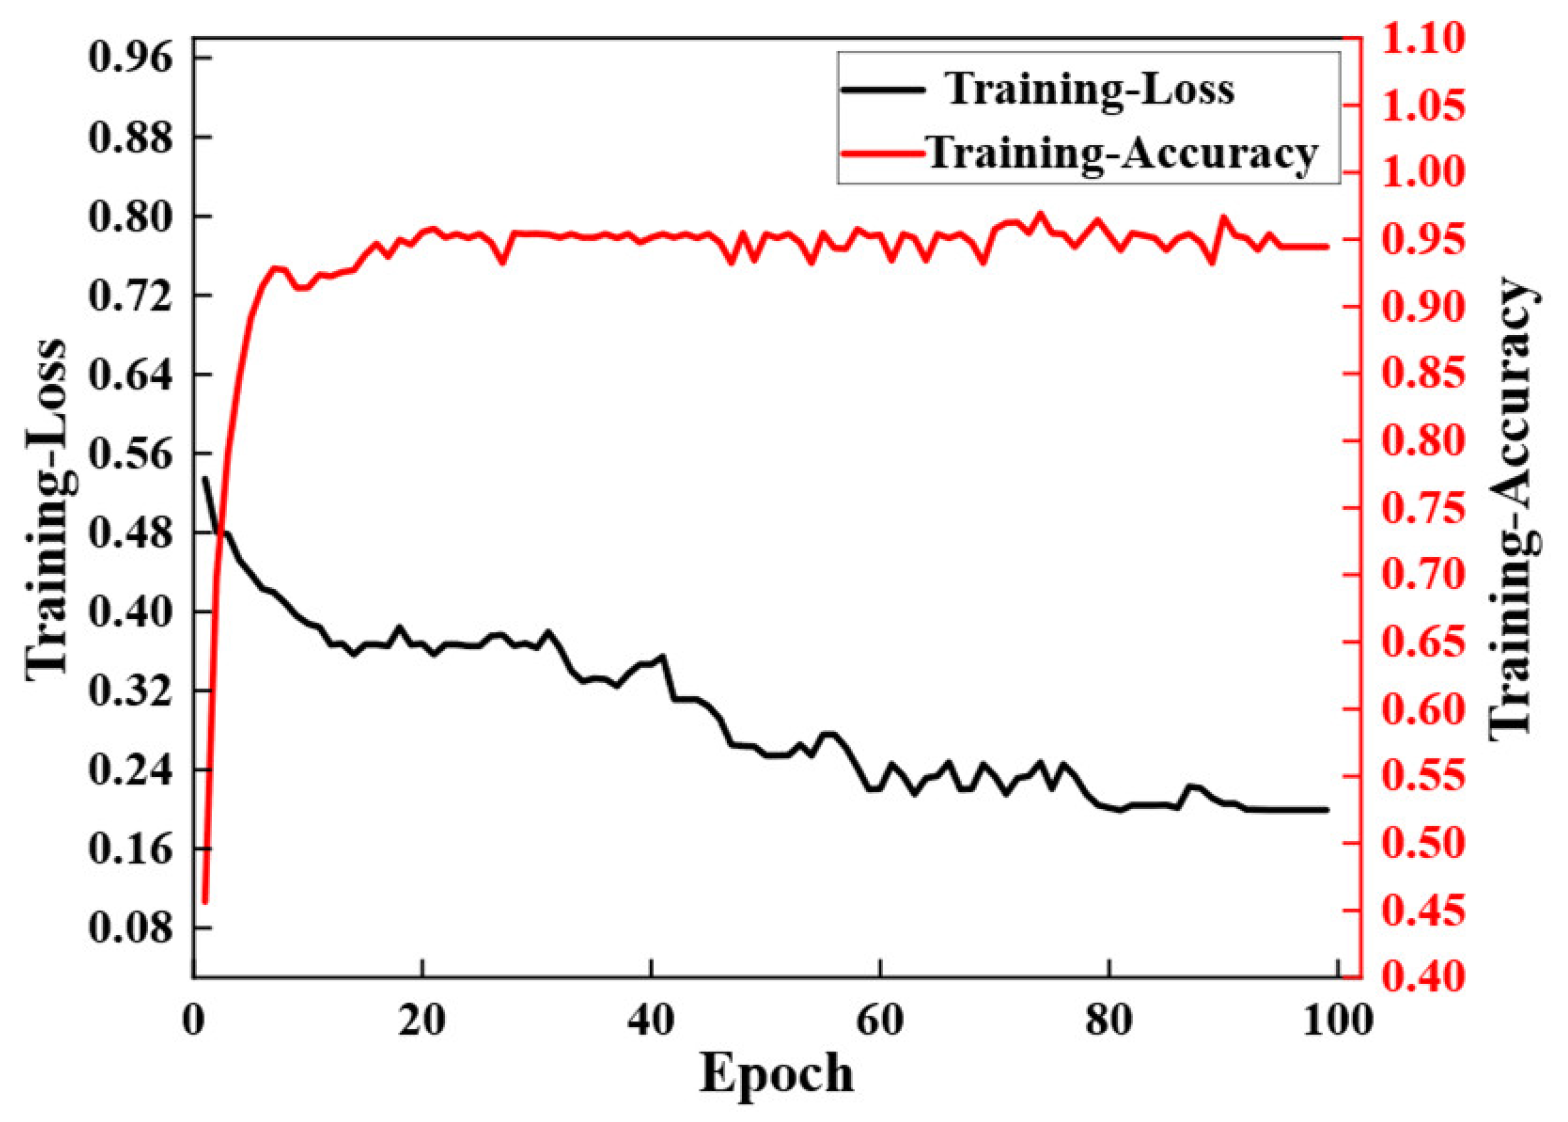
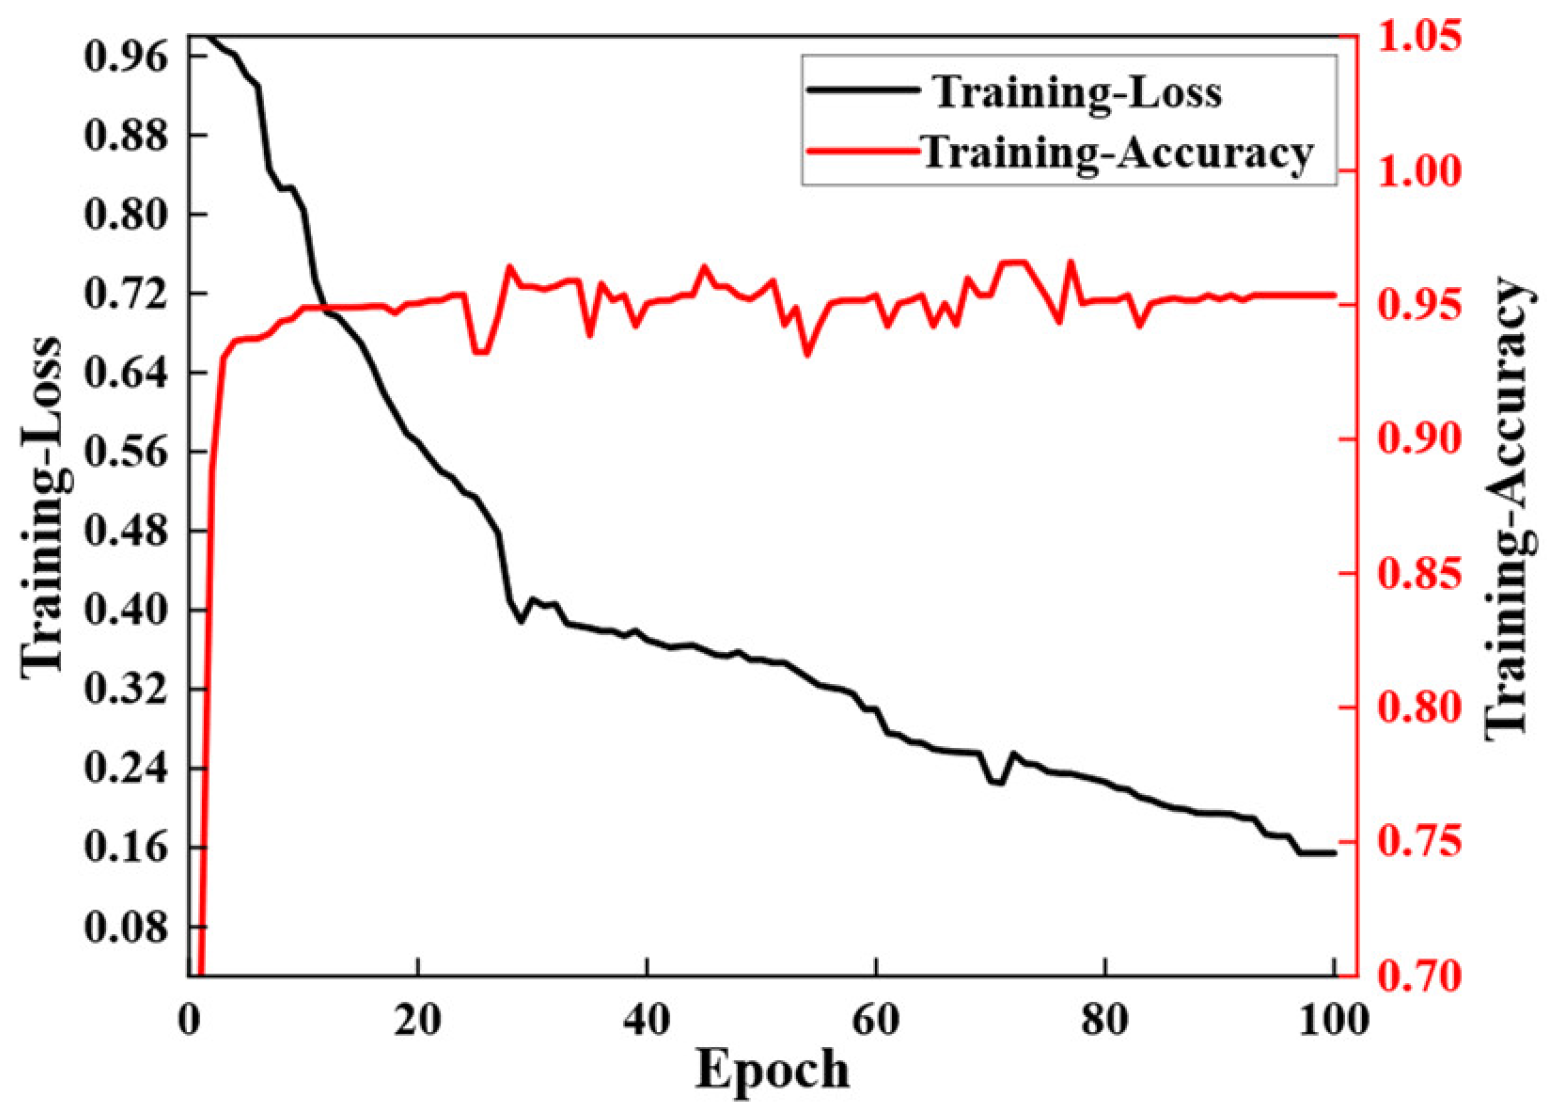
In contrast, the CNN–Transformer hybrid model (as shown in Figure 12) demonstrated improved convergence behavior. The loss decreased rapidly in the early epoch, demonstrating the effectiveness of the CNN encoder in extracting discriminative local features. However, the final loss plateaued at a relatively high value of 0.16, and the accuracy reached 0.95, suggesting that while the hybrid model converged faster than the pure Transformer, its representational capacity may still be limited. The CNN–Transformer leverages the convolutional inductive bias for local feature extraction. Nevertheless, the decoder, based on self-attention, might not fully reconstruct fine spatial details, leading to a compromise between convergence speed and final accuracy.
Figure 12.
The loss during the training of the CNN–Transformer model.
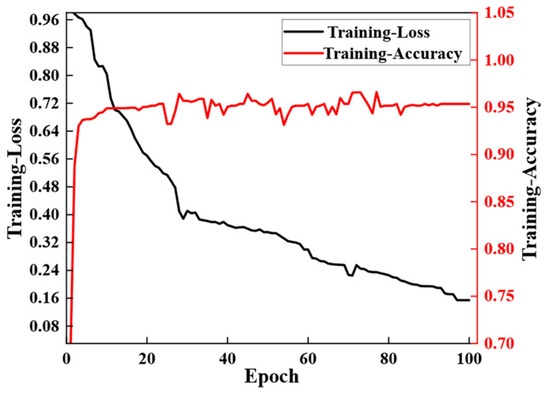
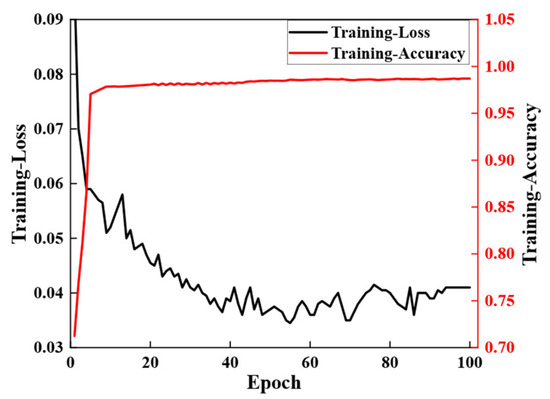
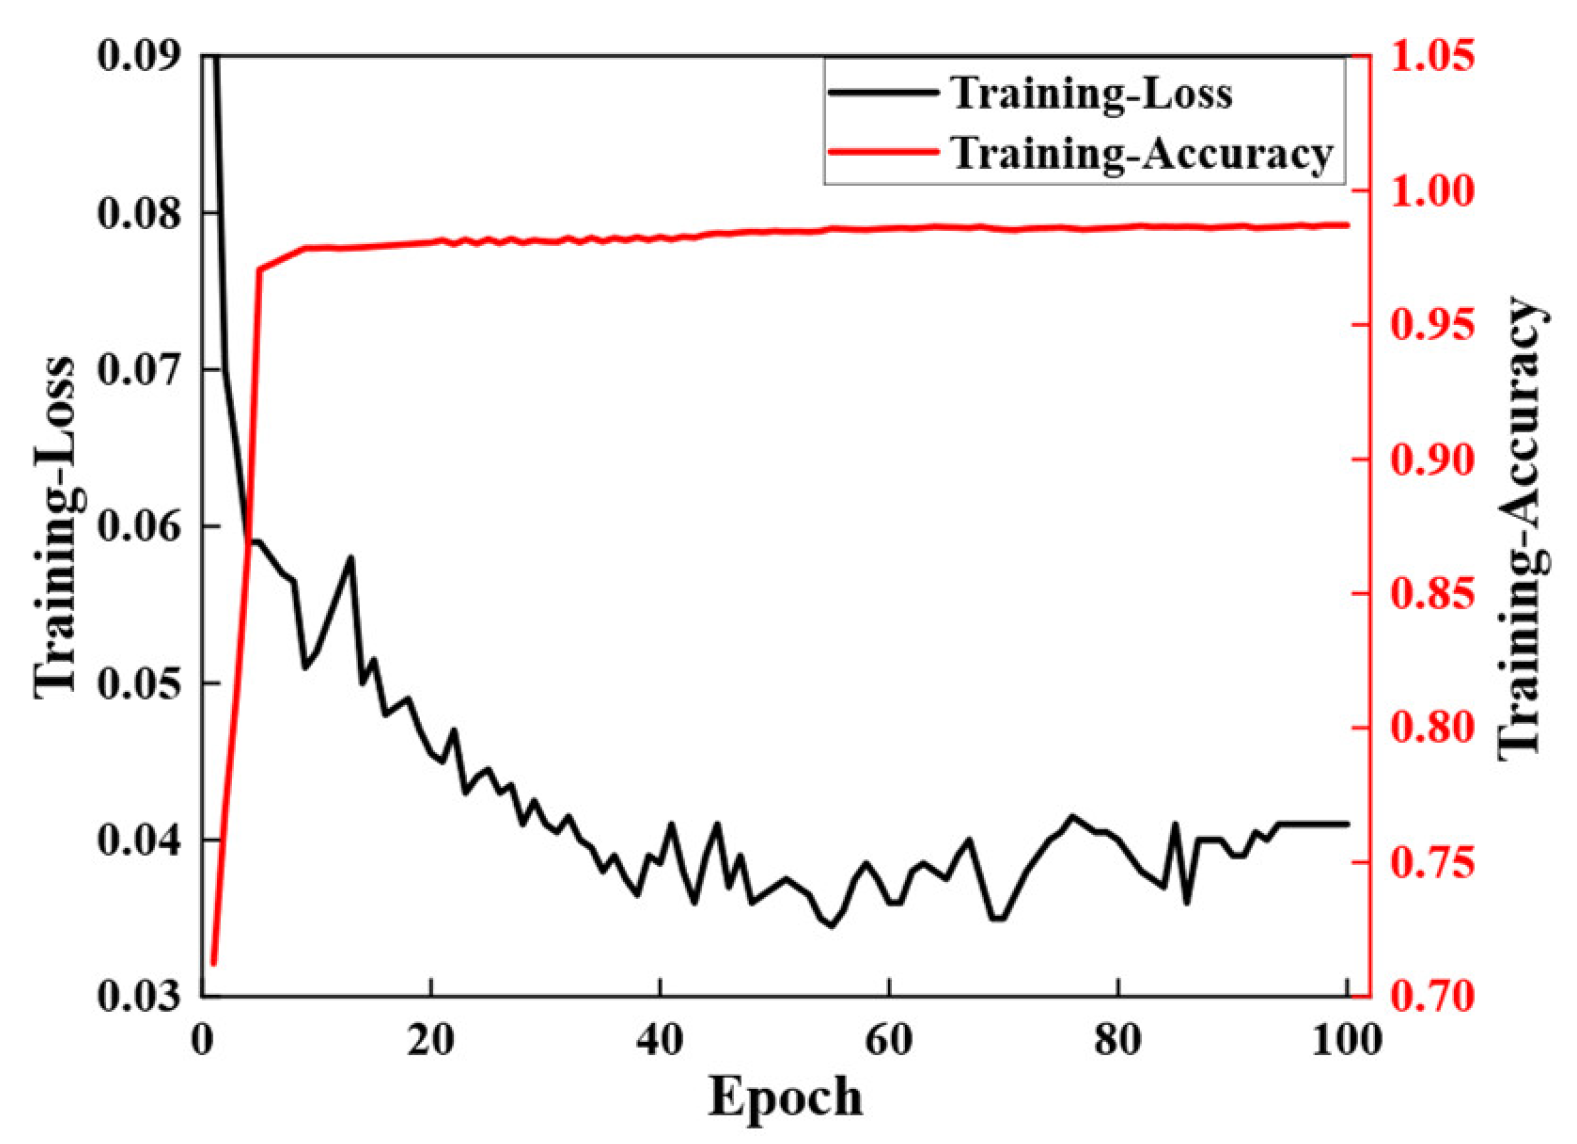
The Transformer–CNN model, as shown in Figure 13, displayed stable and effective training performance. The loss decreased steadily and converged to a low value, while the accuracy rose consistently to the highest level of 0.98 among all models. This performance can be explained by the model’s effective combination of a Transformer-based encoder, which captures long-range dependencies and global contextual information, and a CNN-based decoder, which progressively recovers spatial resolution and refines local details. The design allows the model to leverage the strengths of both architectures that the Transformer provides a rich global representation, and the CNN ensures precise localization and detailed output generation.
Figure 13.
The loss during the training of the Transformer–CNN model.
In summary, the Transformer–CNN model achieved the highest accuracy and the lowest loss, indicating its superior capability in balancing global context modeling and local feature refinement for crack detection tasks. Compared to other models, both LSTM and CNN demonstrate relatively weaker performance. While the Transformer model excels at global interaction modeling, it lacks the architectural inductive bias necessary for capturing local spatial features. The CNN–Transformer model offered a compromise with faster convergence but fell short in final performance compared to the Transformer–CNN, highlighting the importance of appropriately combining self-attention and convolutional mechanisms in architectural design.
To enable more comprehensive detection of civil cracks and more accurate calculation of crack areas, a visualization and comparative analysis of the detection results was conducted. The detection performance of each model for cracks was compared as follows, and this analysis provided a practical reference for selecting among different models.
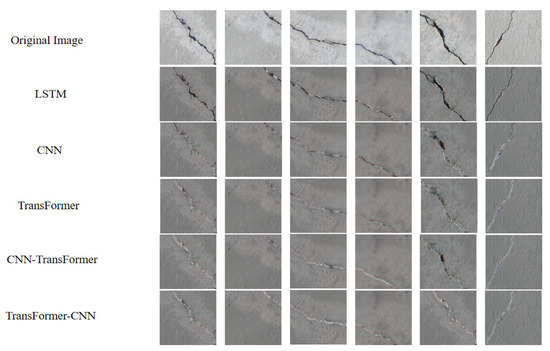
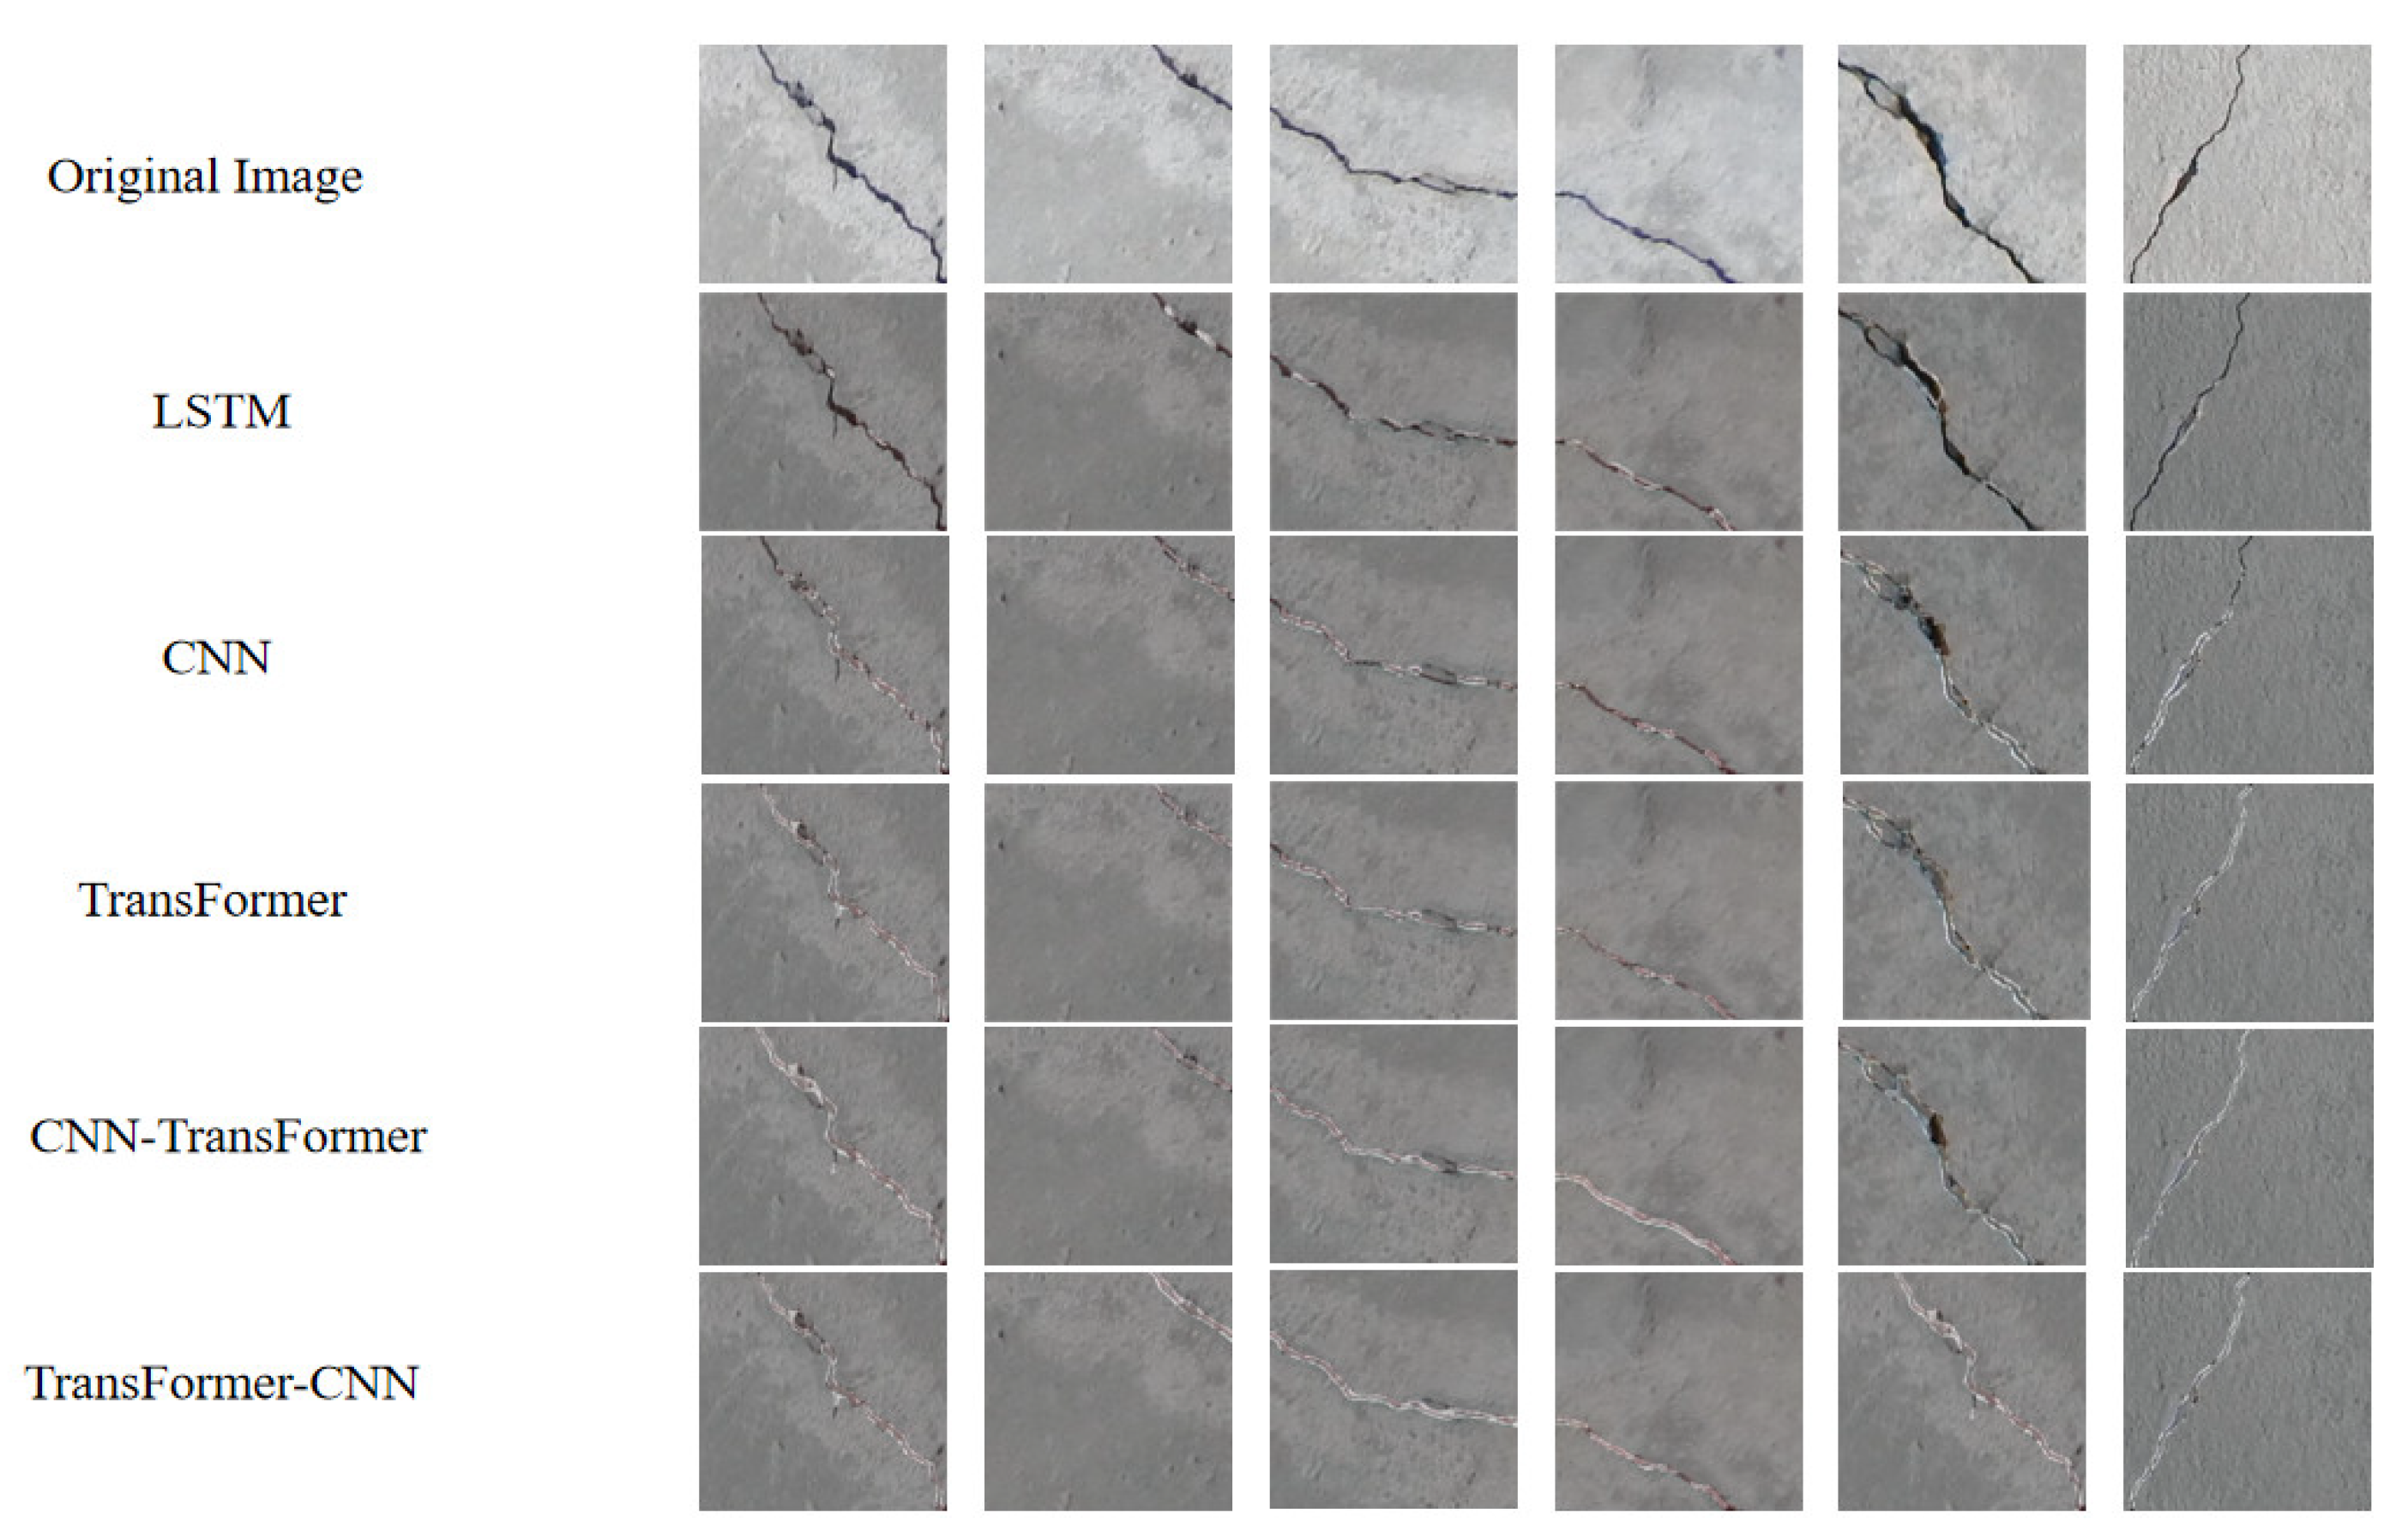
Figure 14 presents a comparison between the original images and the prediction results from the five models under specific conditions. Due to the diverse textures present in the original images, the detection task was particularly challenging. The single Transformer model, while effective at capturing long-range crack continuity and identifying crack propagation paths, tended to misclassify non-crack textures as cracks in highly textured regions, resulting in overall lower detection accuracy compared to hybrid models. The CNN–Transformer model produced relatively clear crack boundaries and demonstrated stable performance on moderately complex textures. However, in scenarios with high-density or interlaced background patterns, some fine cracks were obscured by background noise, leading to partial recognition ambiguity. In contrast, the Transformer–CNN model showed strong agreement between predicted cracks and ground truth. Even under complex background conditions, it accurately identified cracks, demonstrating notable anti-interference capability and stable performance.
Figure 14.
Comparison of the test results of different models with the original images.
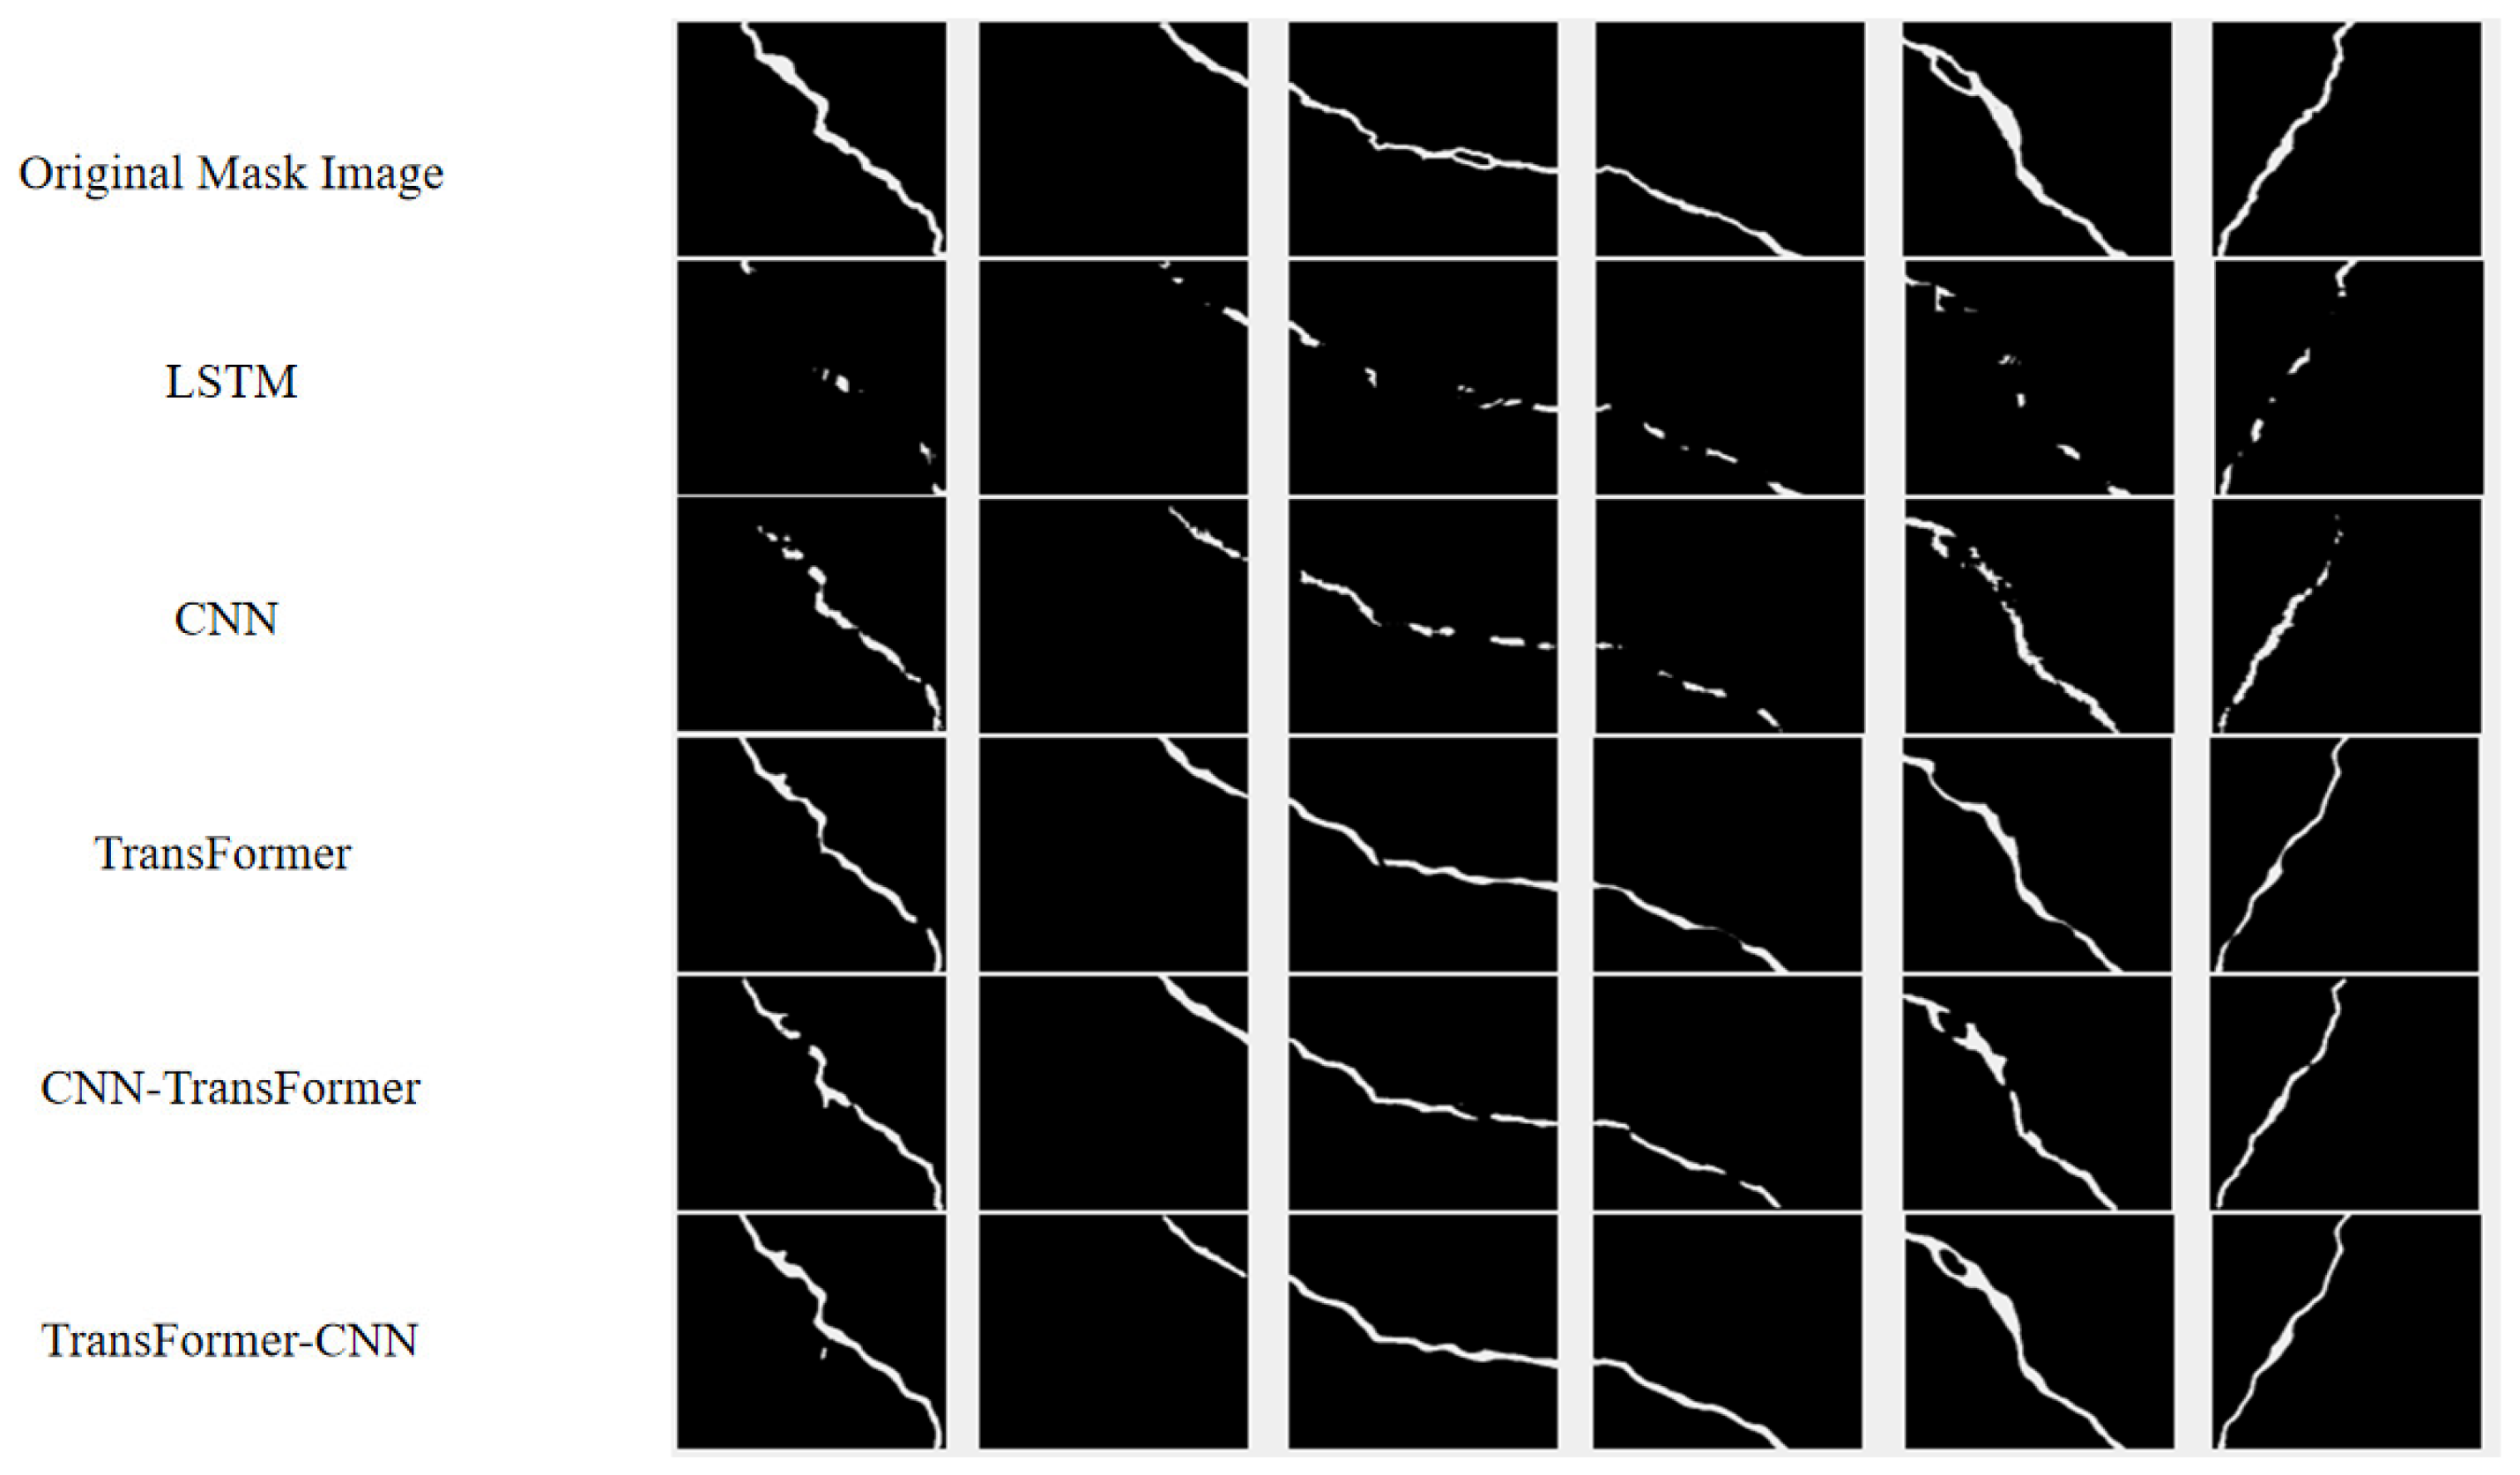
Figure 15 compares the testing results of the original mask image and the outputs of the other models. As a manually annotated reference, the mask image clearly indicated the location and morphology of cracks, providing a reliable basis for crack area calculation. The Transformer model, which relied on a global self-attention mechanism, performed well in recognizing long-range crack continuity but was prone to overfitting. The CNN–Transformer model, which combined local feature extraction with global context modeling, exhibited strong adaptability to textured backgrounds but sometimes lacked precision in boundary localization. Visual inspection revealed that predictions from the Transformer–CNN model aligned closely with the ground truth masks. This model effectively captured crack characteristics, delivered high-quality outputs, and accurately extracted critical spatial information for localization.
Figure 15.
Comparison of the test results of different models with the mask images.
The testing results showed that the Transformer–CNN model demonstrated significant advantages in crack detection tasks. It outperformed the other models across both original images and mask-based evaluations, proving to be the optimal choice for reliable crack identification in complex environments.
To further evaluate the stability of model performance, five samples were randomly selected from the test data for evaluation to observe their performance across different models. Due to the comparatively weaker performance of the LSTM and CNN models, they were excluded from this analysis. Table 5 presents the key metrics (IoU, Accuracy, Area) for Case 1. The measured crack area further validates the model’s performance. Obviously, when comparing the Transformer–CNN model proposed in this paper with other models, although all models achieve relatively good results, the Transformer–CNN model still leads in all metrics. This result further confirms the advantages of the proposed model.
Table 5.
Evaluate the same samples across different models.
4.2. Classification Performance for the Influence of Data Size
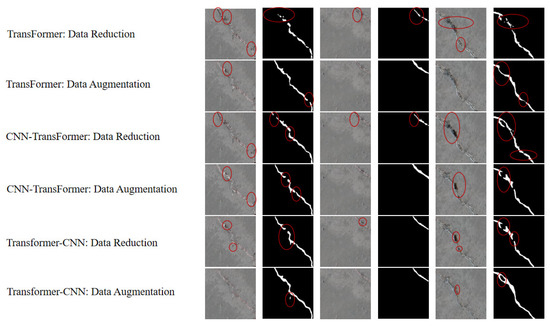
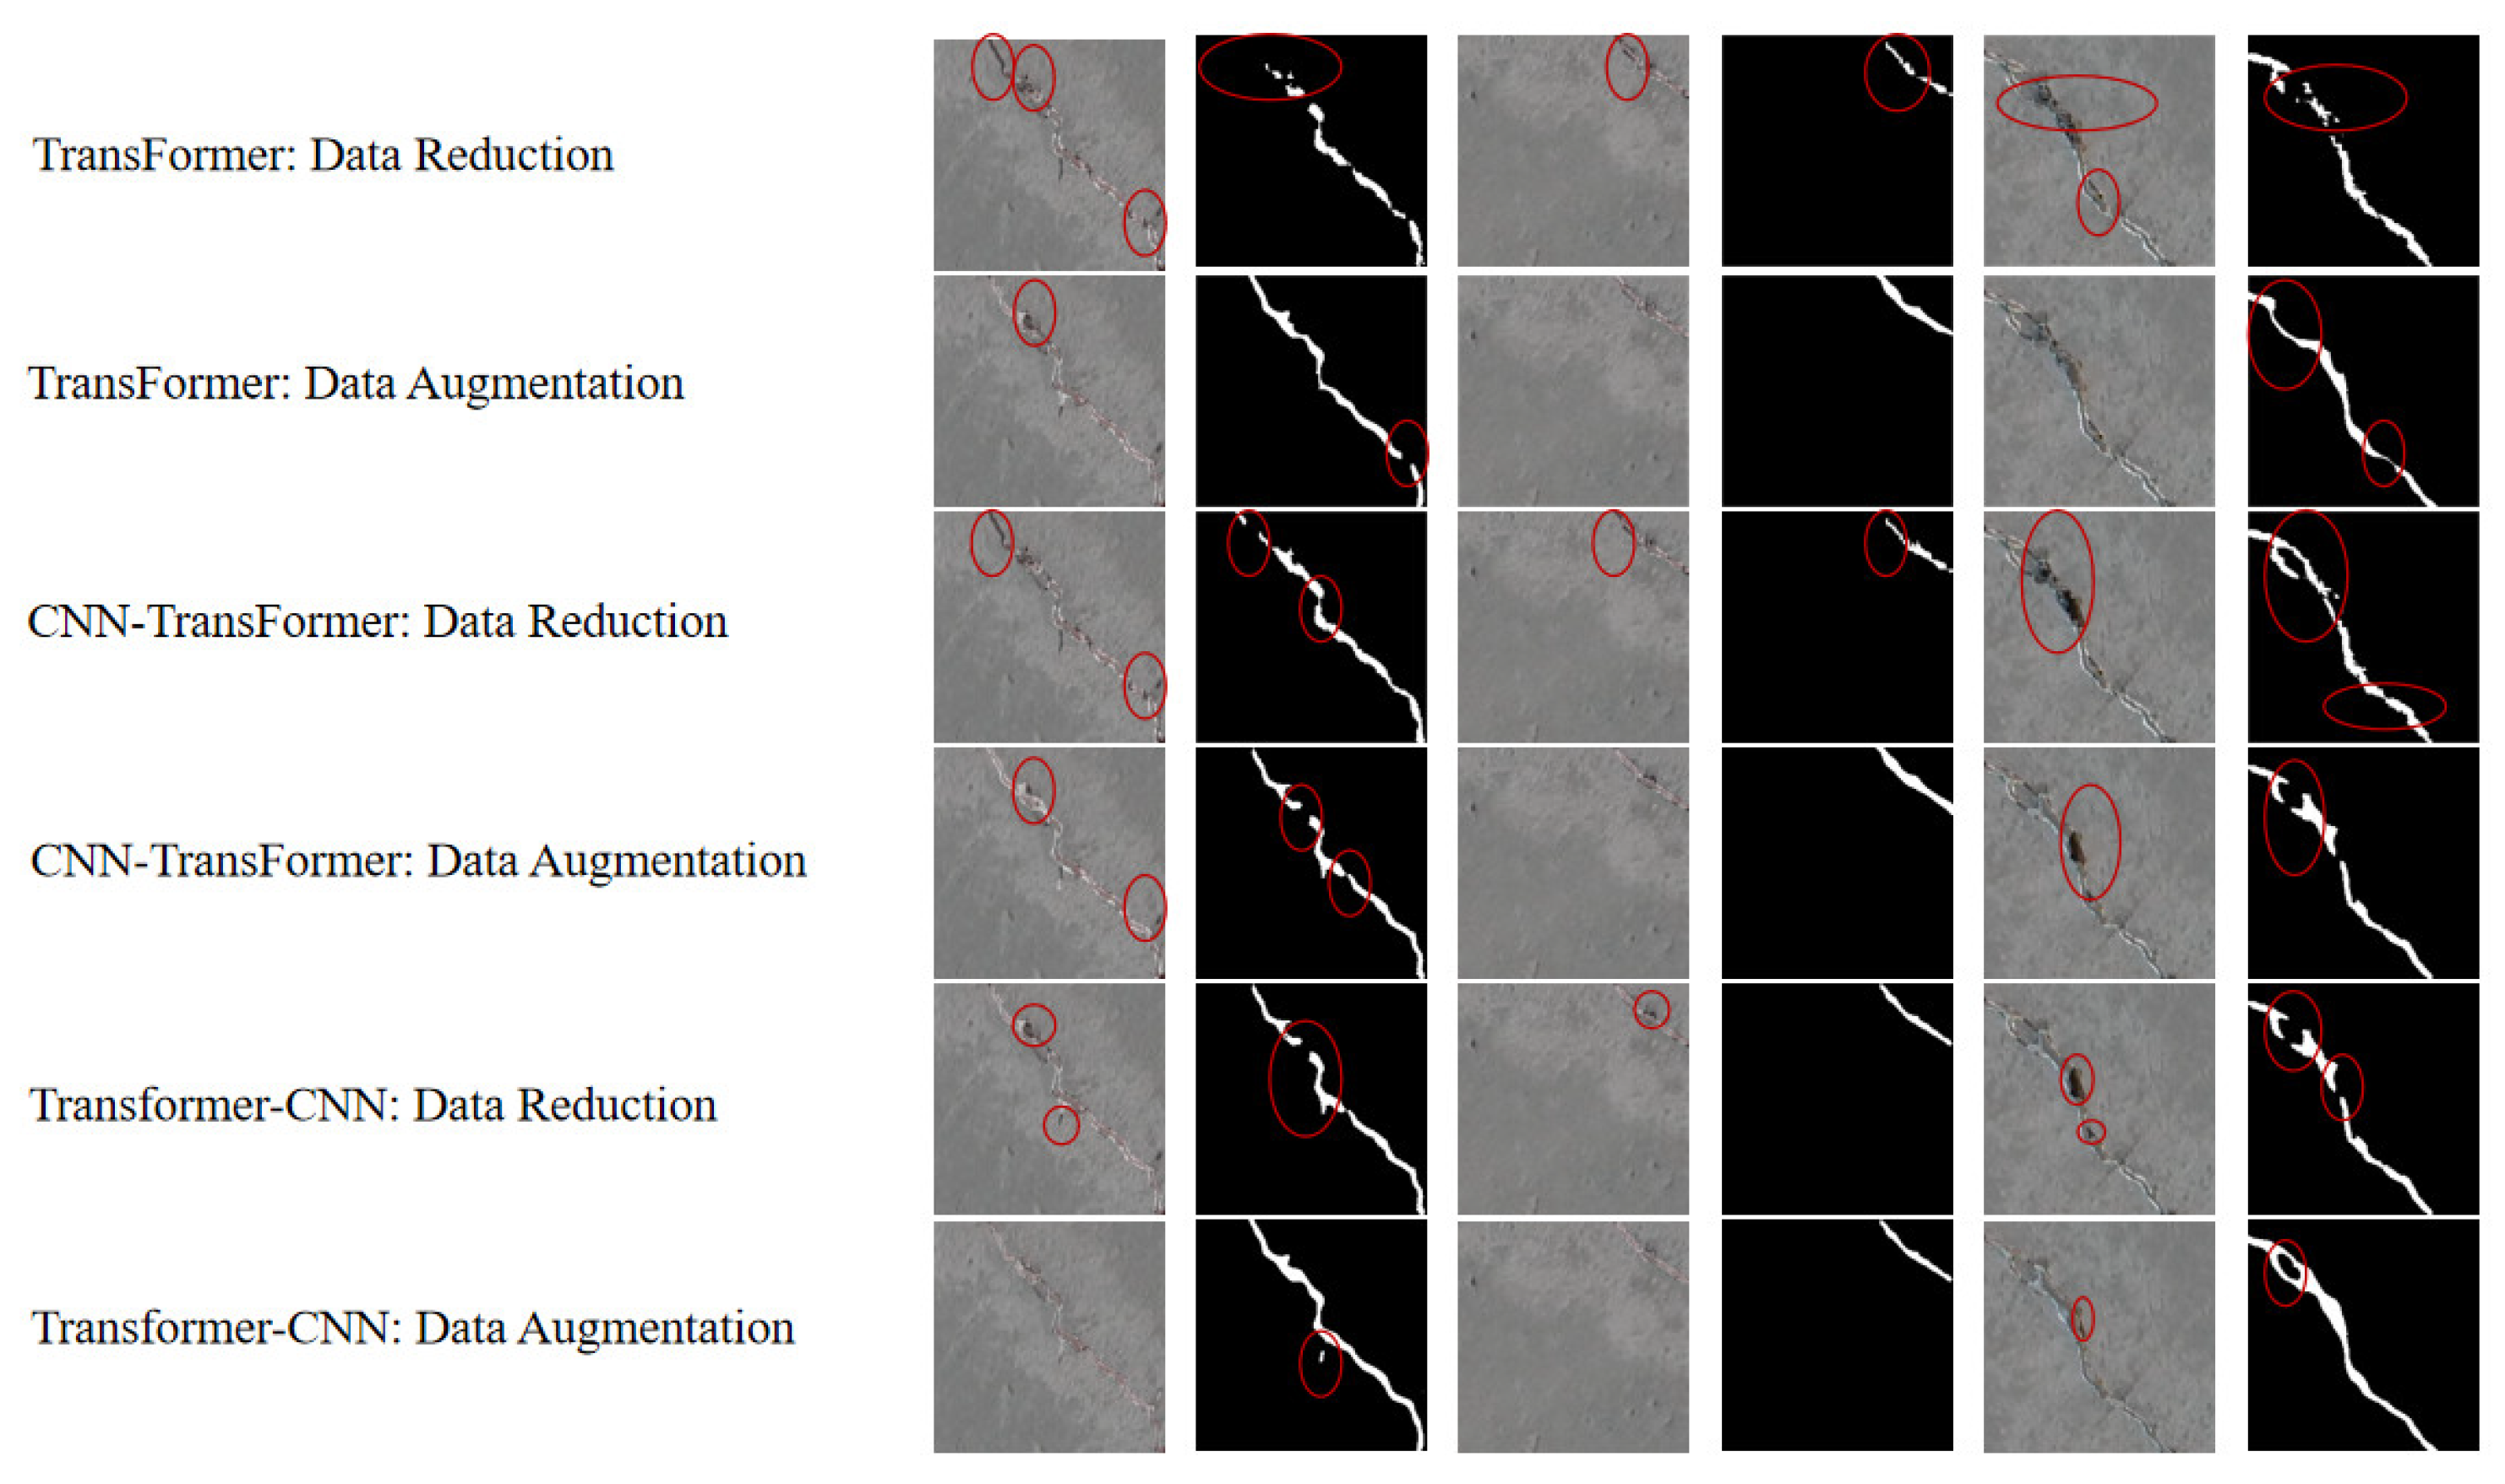
In this experiment, 3000 images from different environments were used as training data for the model. Down-sampled the original data to 300 images at a ratio of 10:1 and expanded the original data by 1000 images. Training with data augmentation and reduction was conducted from the perspective of three models, respectively. For the Transformer–CNN model, the data shows that, based on the original data, data augmentation increased the Intersection over Union (IoU) by 2.6%, whereas the IoU value decreased relatively with the down-sampled training data. As shown in Figure 16, the visualized images of data augmentation and reduction are presented, respectively. It can be observed that the recognition ability of more data is stronger than that of less data. The areas circled in red represent unidentified regions. For the visualization results with increased data, it can be seen that non-recognition may only occur at the edge parts of cracks.
Figure 16.
Comparison of visualized images for data augmentation and reduction.
Specific data are shown in Table 6. For the Transformer and CNN–Transformer models, the effect of data augmentation is better than that of data reduction. For the Transformer–CNN model, the difference in IoU values between data augmentation and data reduction is close to 16%. This significant difference stems from the model’s high dependence on the amount of data; the more data there is, the stronger the model’s learning ability. Nevertheless, the Transformer–CNN model stands out both when the data is increased and when the data is reduced.
Table 6.
Impact of data size on the effectiveness of the models.
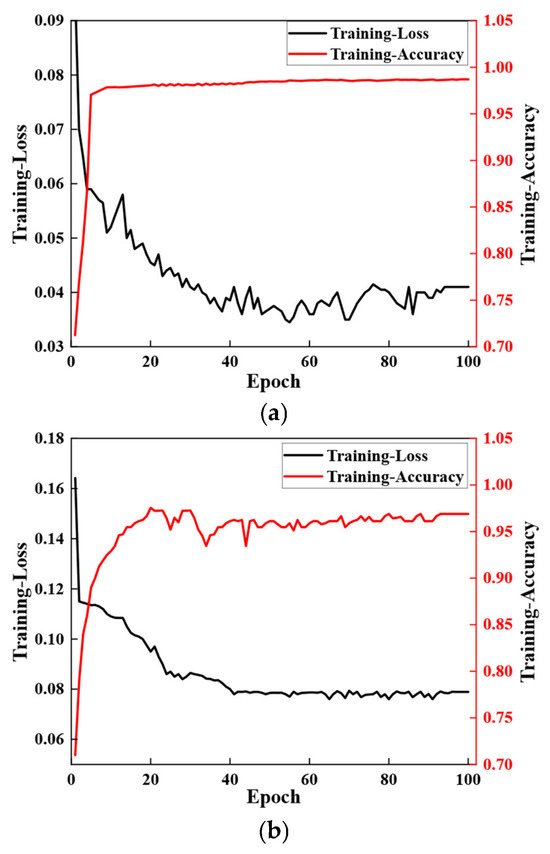
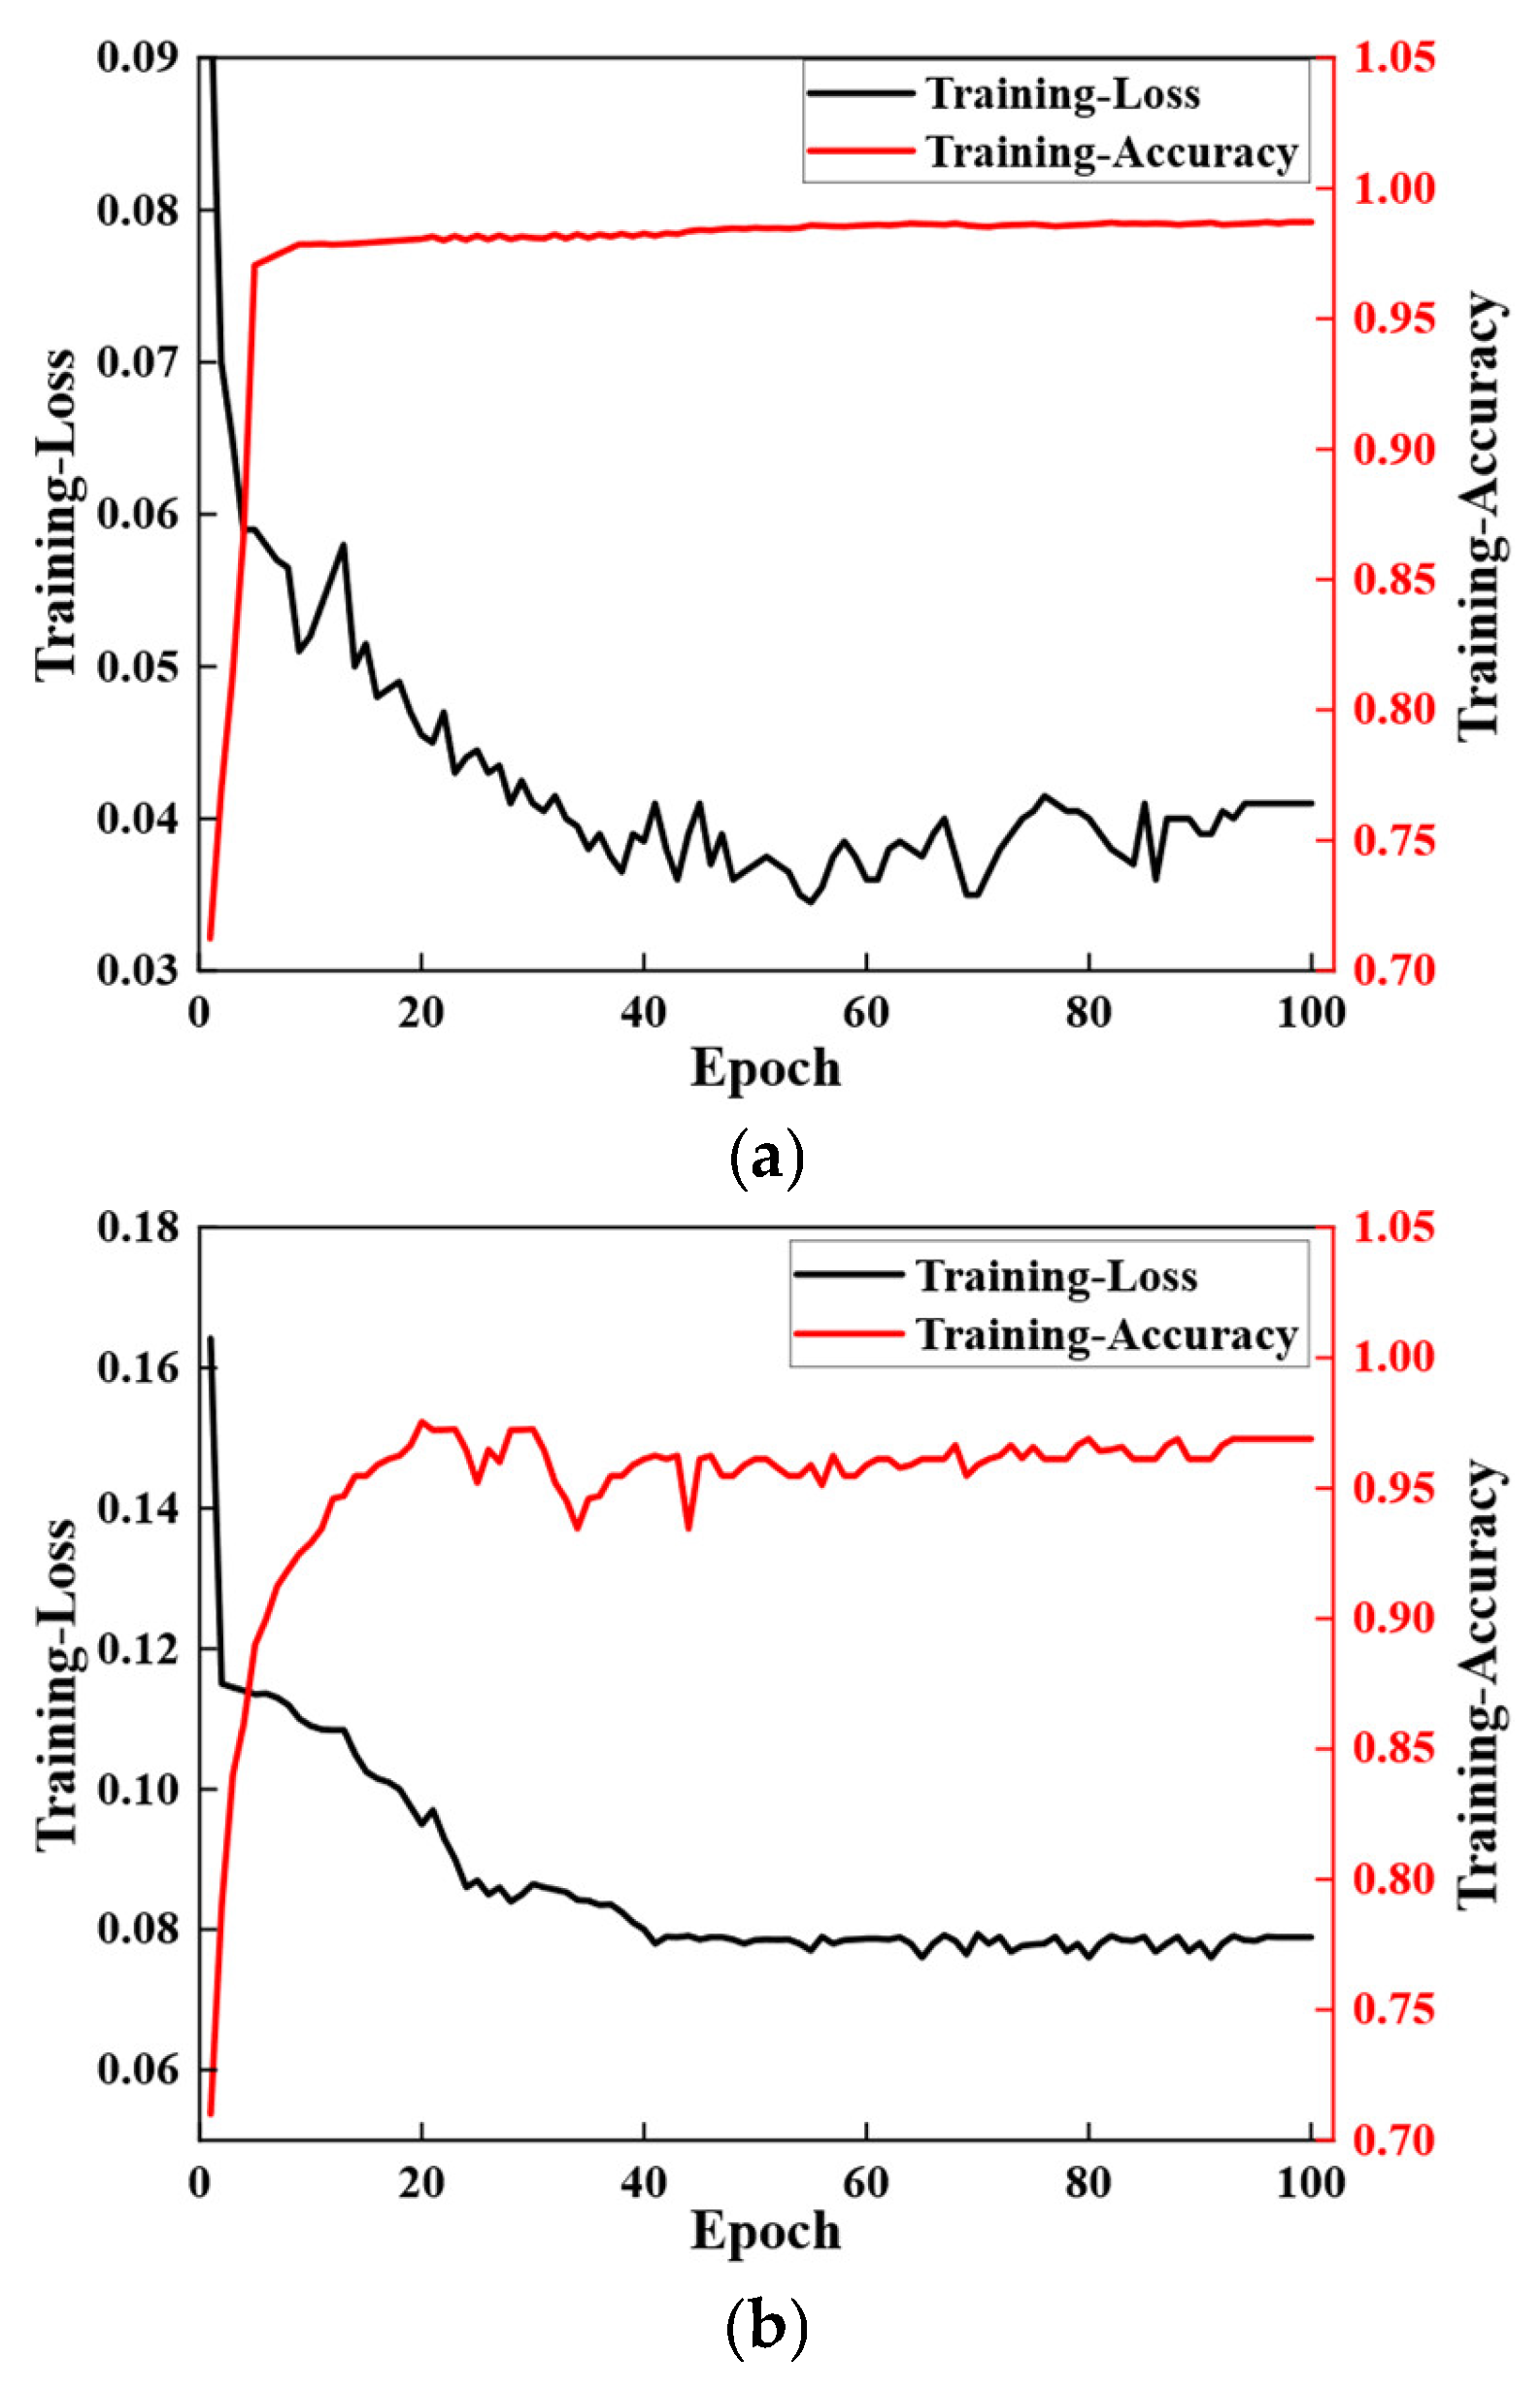
To further investigate the performance of the Transformer–CNN model in terms of data augmentation and reduction, as shown in Figure 17. The images of Loss and Accuracy during training further quantify the impact of data augmentation and reduction on the model’s training effect. From the perspective of the Loss curve, the Loss value drops rapidly in the early stage of training, gradually stabilizes as the number of Epochs increases, and finally, the Loss difference between the two approaches is close to 3%. Analyzing the Accuracy curve, both show a rapid initial increase, with the case of increased data finally stabilizing at 98.7%, still higher than that of reduced data.
Figure 17.
(a) Data augmentation and reduction. (b) Data reduction.
In conclusion, it is fully verified that data augmentation can effectively improve the model’s training performance and enable more accurate capture of cracks. Among the three models, the Transformer–CNN model has the least impact on the decrease in accuracy caused by the reduction in data.
4.3. Impact of Brightness and Darkness on the Model
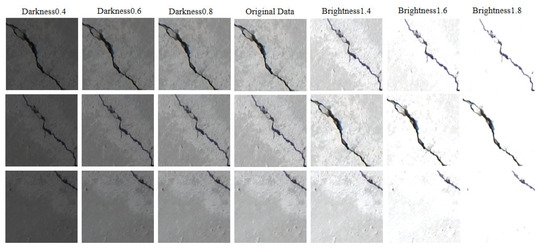
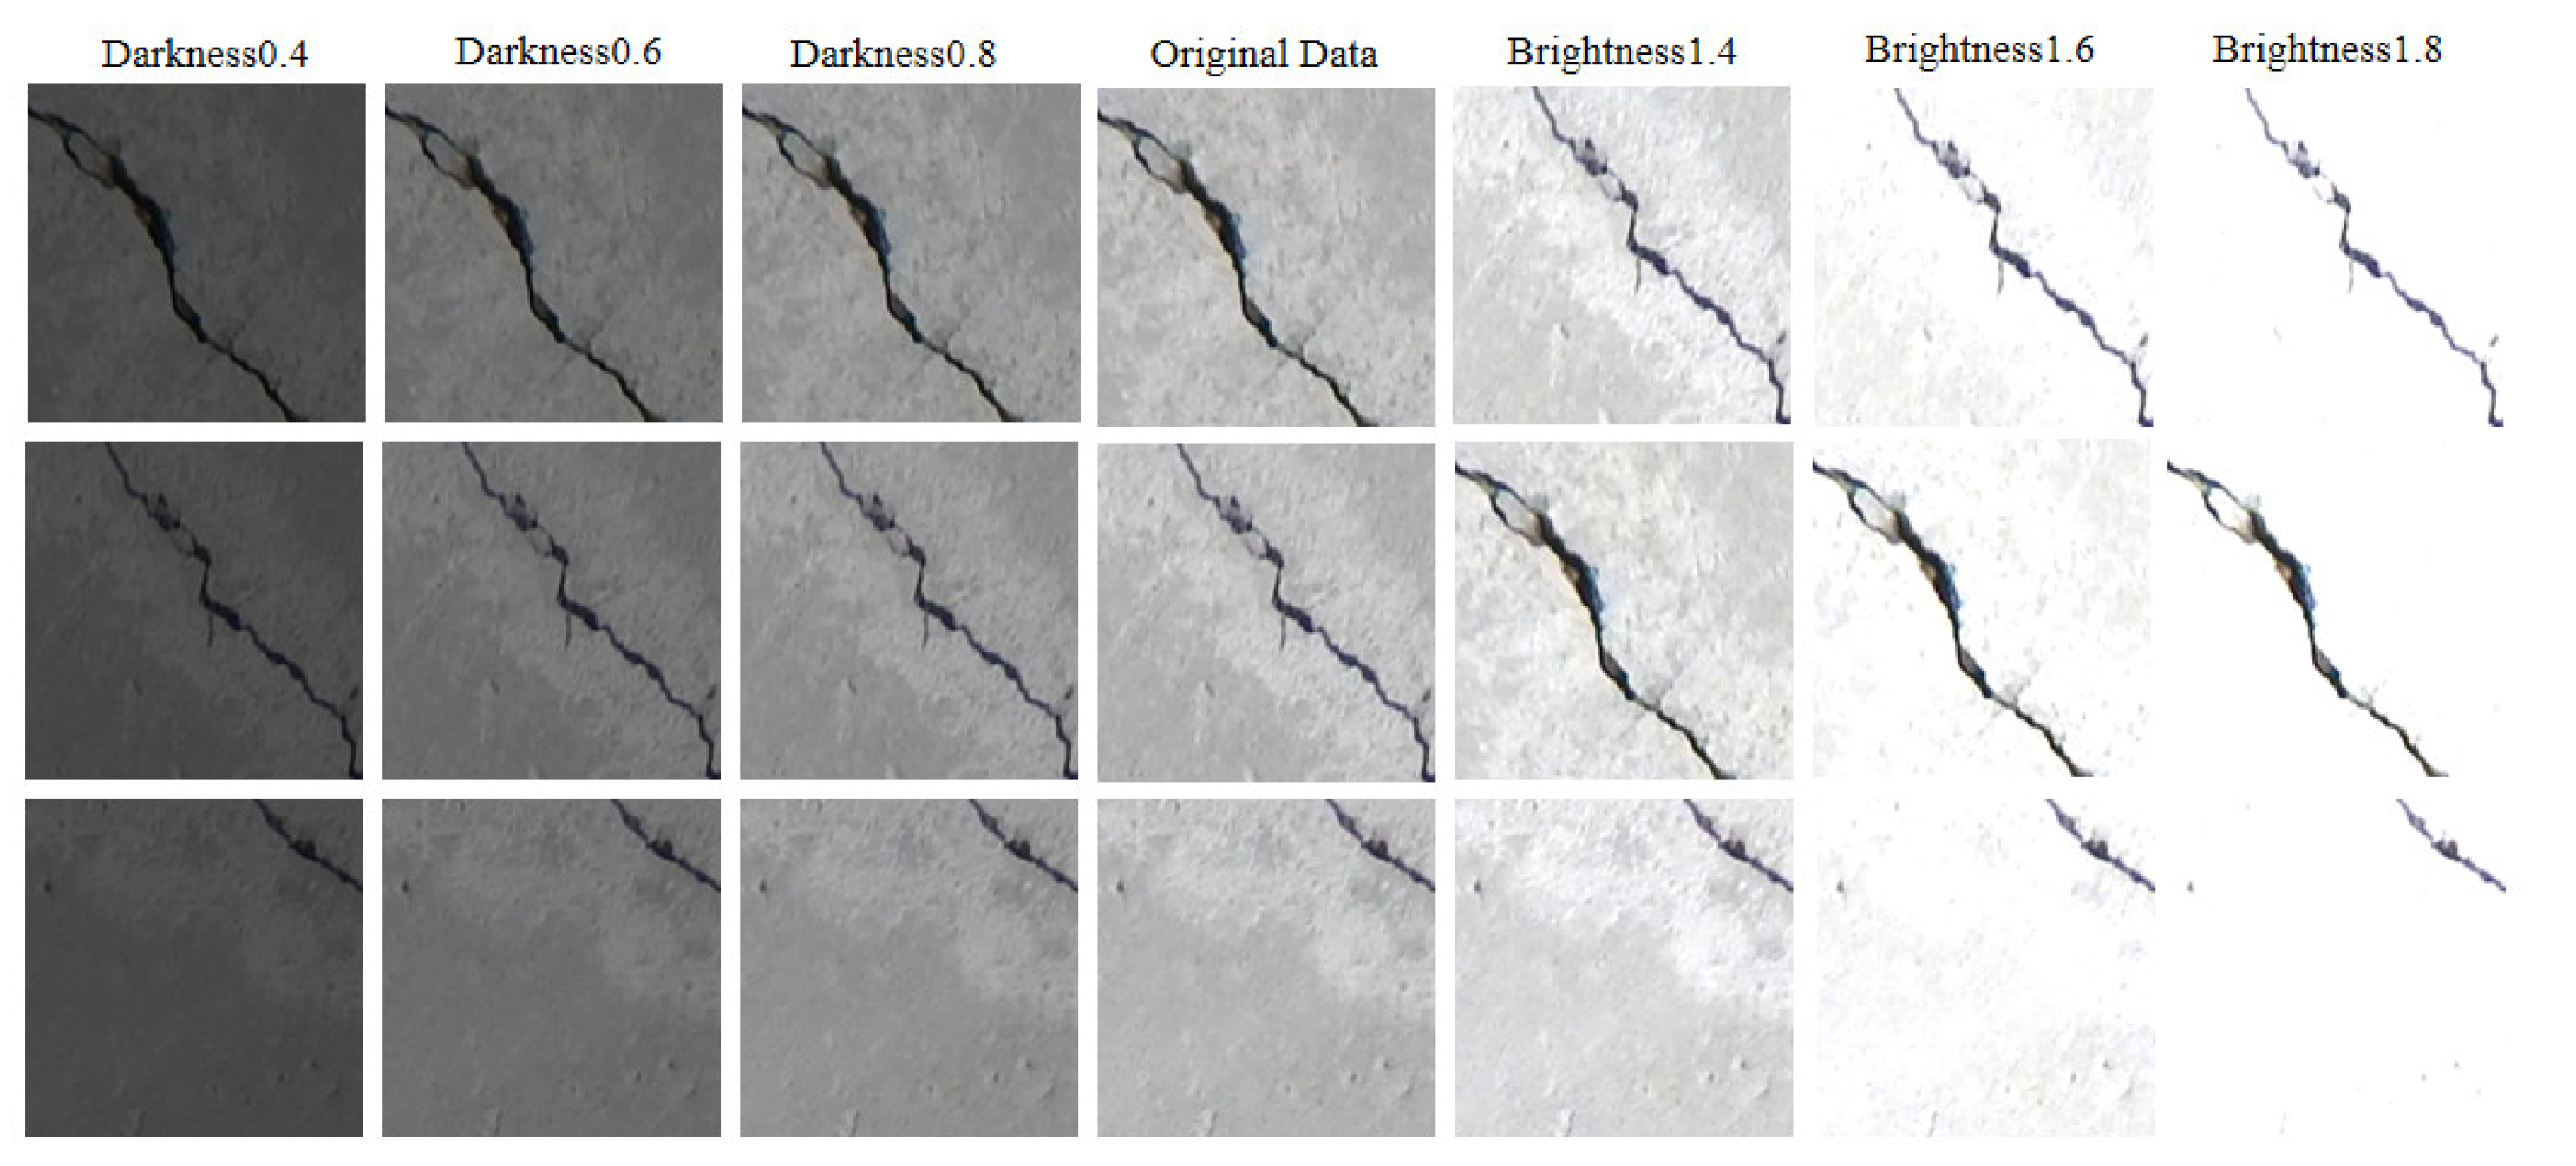
To adjust brightness and darkness, images were processed in a rigorous manner. As shown in Figure 18, the process from dark to bright is sequentially displayed from left to right, intuitively presenting variations in different brightness levels. Value 1 is set as the benchmark for the brightness of the original image. For darkening processing, the interval of 0–1 is used as the data for dimming the image, while the interval of 1–2 serves as the basis for brightening processing.
Figure 18.
Processing changes of data from dark to bright.
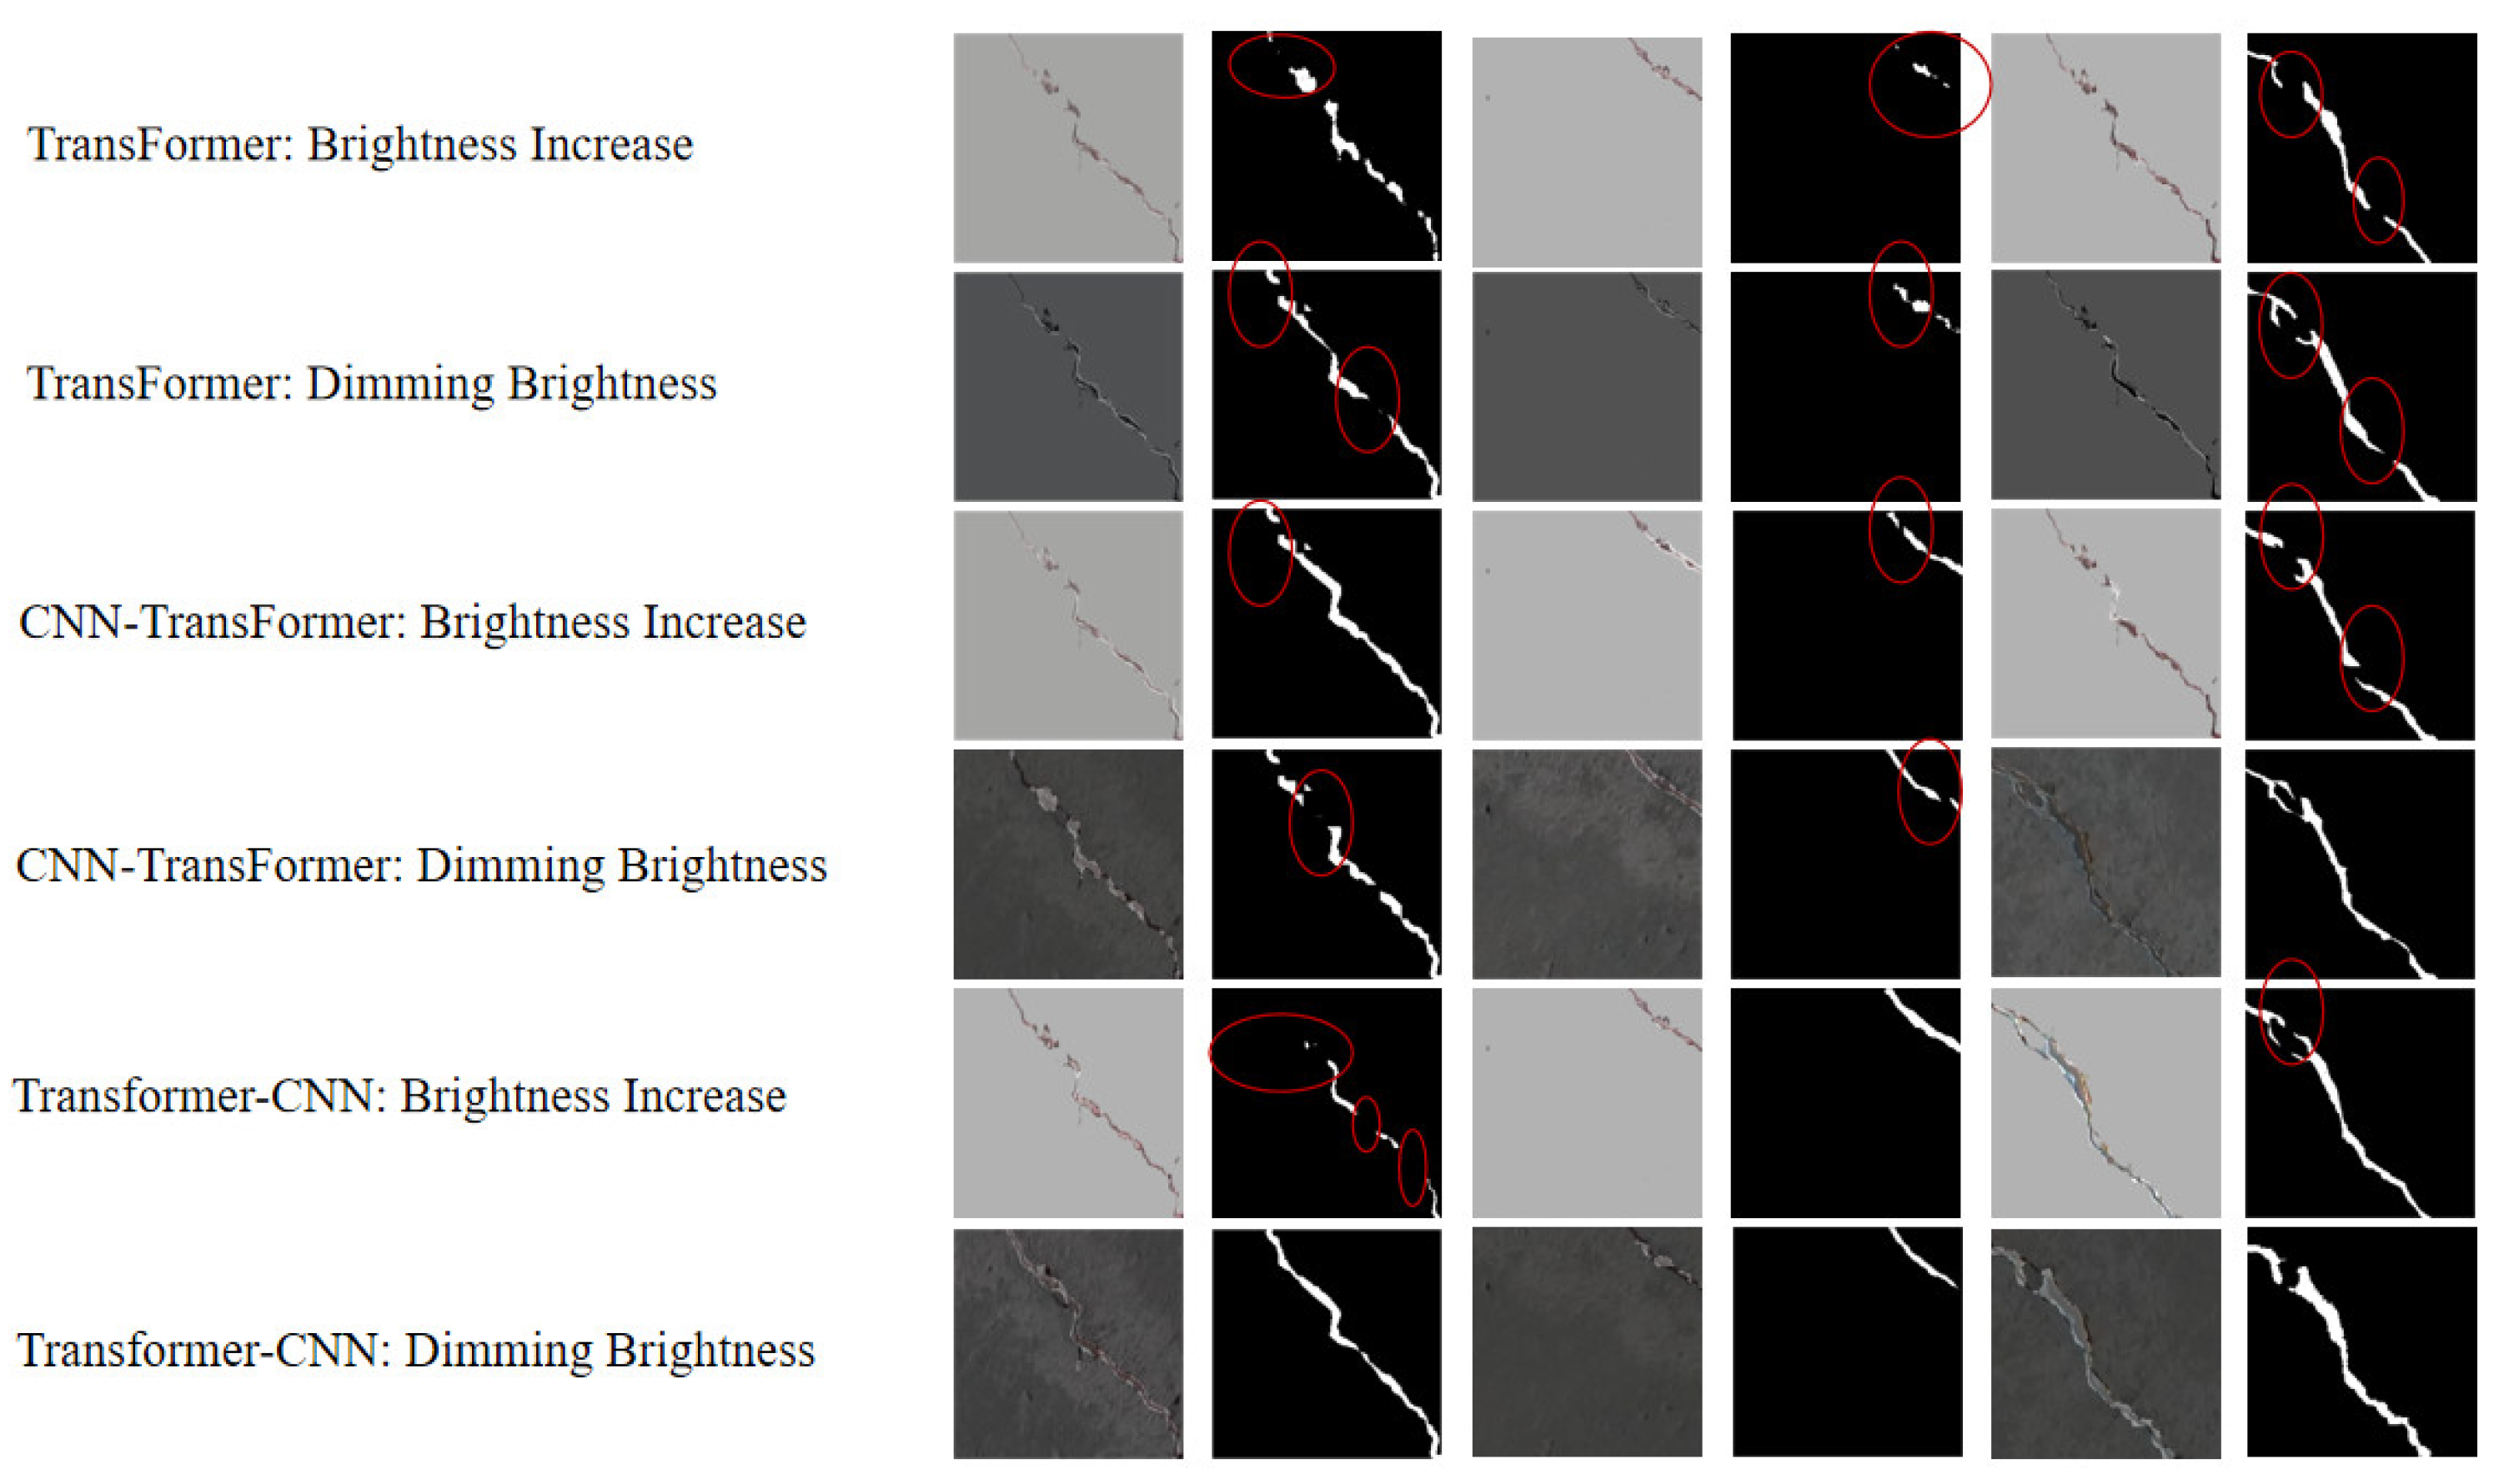
As shown in Figure 19, the visualized results under varying brightness levels were intuitively compared. The Transformer model was significantly affected by changes in illumination, particularly under darkened background conditions. Discontinuities observed in the predicted mask indicated that the model failed to identify certain crack segments in low-light scenarios. The misclassified area was circled in red, which had a large area. The CNN–Transformer model exhibited improved performance, although minor crack interruptions still occurred. In contrast, the Transformer–CNN model demonstrated the best performance, accurately capturing crack trajectories in well-lit regions and showing only minimal loss of detail in darker areas. Although darkening reduced the contrast between cracks and the background, the overall shape and details of the cracks remained discernible. Under brightened conditions, while cracks were clearly visible, recognition was interfered with by surface reflections and over-illuminated backgrounds, resulting in localized blurring in the model outputs.
Figure 19.
Visualized result comparison of brightness and darkness.
More detailed evaluation results under different bright conditions were presented in Table 7. After processing under varying illumination levels, contrast in low-light environments decreased significantly, and feature edges were considerably weakened, resulting in a notable decline in all models’ ability to recognize edge cracks. As shown in the table, both the Transformer and CNN–Transformer models exhibited IoU values below 65% and accuracy below 80% under dimmed brightness, with loss rates exceeding 16%. In contrast, under bright conditions, only the Transformer–CNN model maintained an IoU above 80% and an accuracy above 85%, while also achieving the lowest loss rate of 12.05%. These results indicate that while all models were affected by illumination variations, the Transformer–CNN demonstrated superior robustness. Nevertheless, there remains considerable room for improving model performance under challenging lighting conditions.
Table 7.
Impact of brightness and darkness of images on the effectiveness of the models.
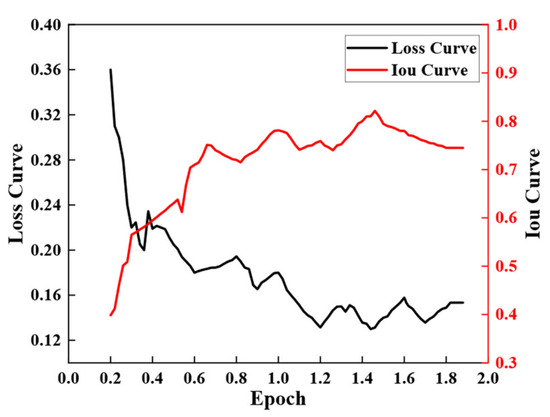
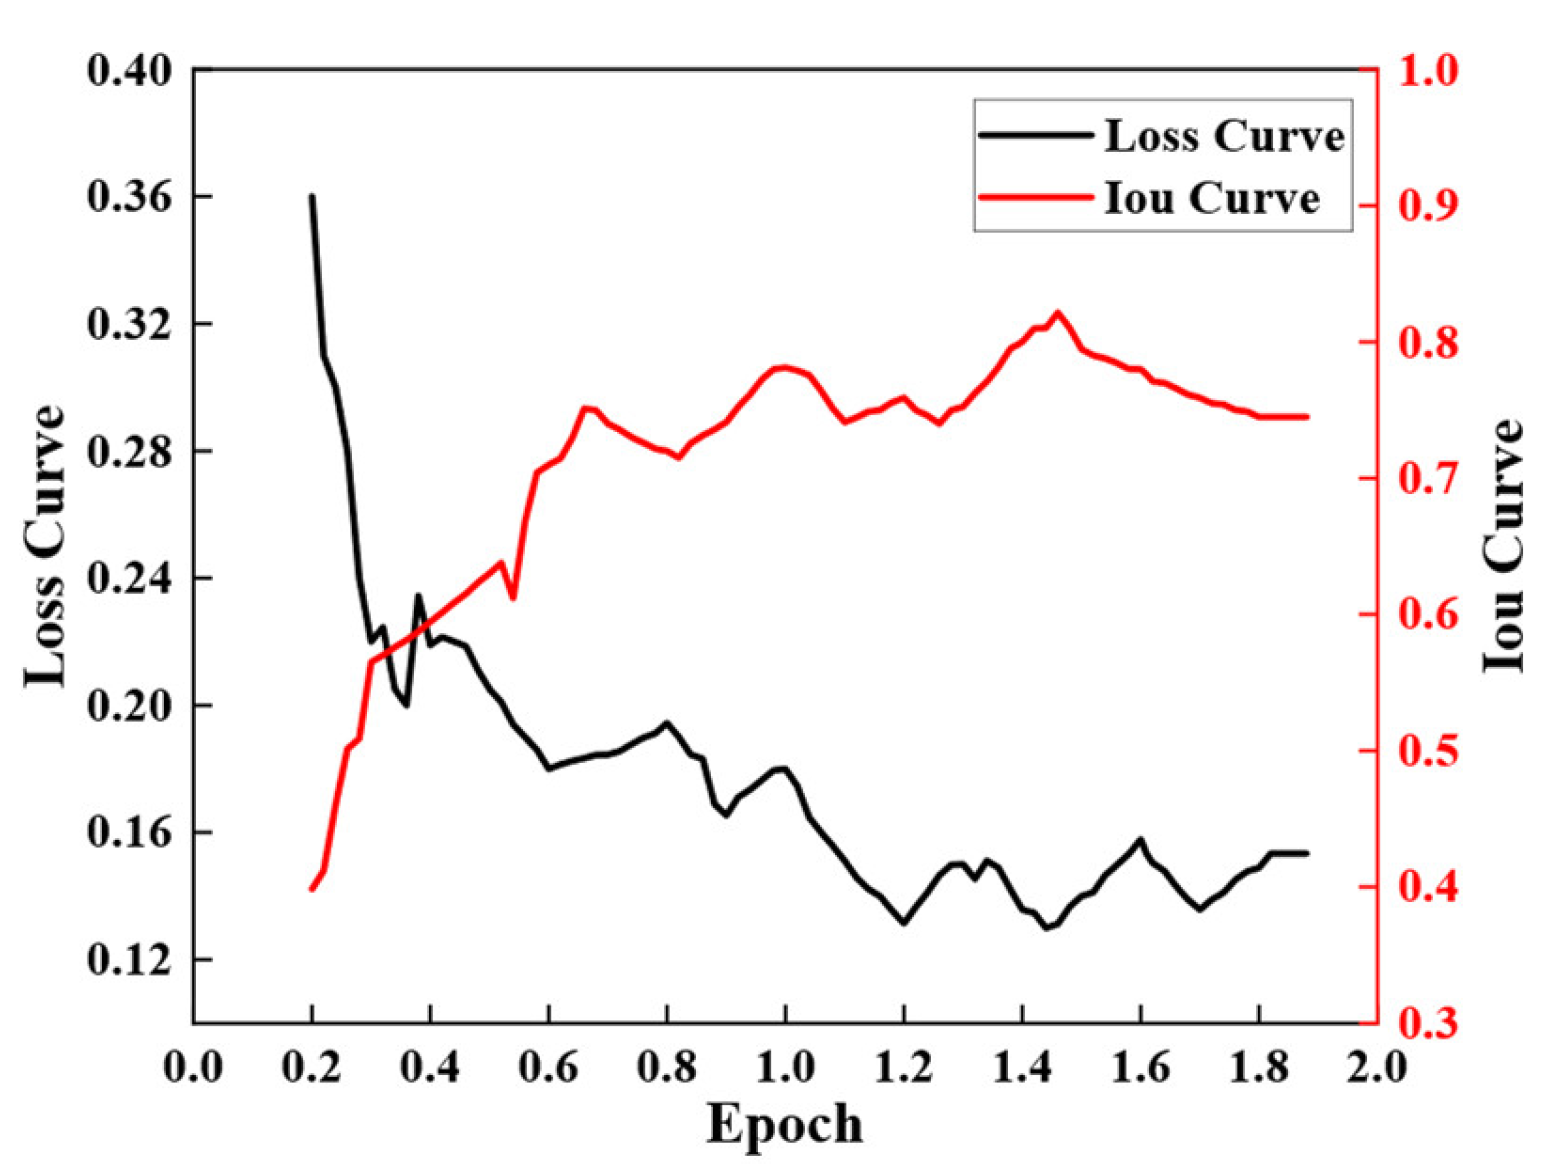
To further illustrate the performance of the Transformer–CNN model across different brightness levels, Figure 20 shows changes in the loss and IoU curves as brightness ranges from 0 to 2. During the training period, the IoU initially rose rapidly from around 0.4. When the brightness/darkness level was near 0.6, the IoU value approached to 80%, and reached the highest value of 83% when the brightness/darkness level was near 1 and 1.4. Although there were significant fluctuations in the image at some points, the data indicated that the image scenes were affected by multiple interferences, such as shadows or complex-shaped illumination. The loss dropped rapidly from 0.36 to around 0.2 and reached the lowest point of 0.12 when the brightness/darkness level was 1.2. In practical scenarios, any form of light would cause fluctuations in the brightness of the wall, and the model needed to adapt to various capabilities. At the same time, the model also reflected the challenge of the actual environment to the model’s robustness.
Figure 20.
Influence of brightness and darkness on training parameters.
4.4. Impact of Different Backgrounds on the Model
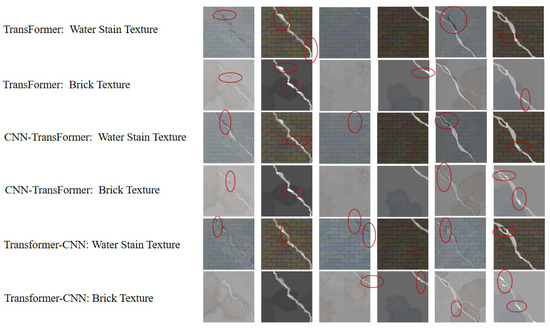
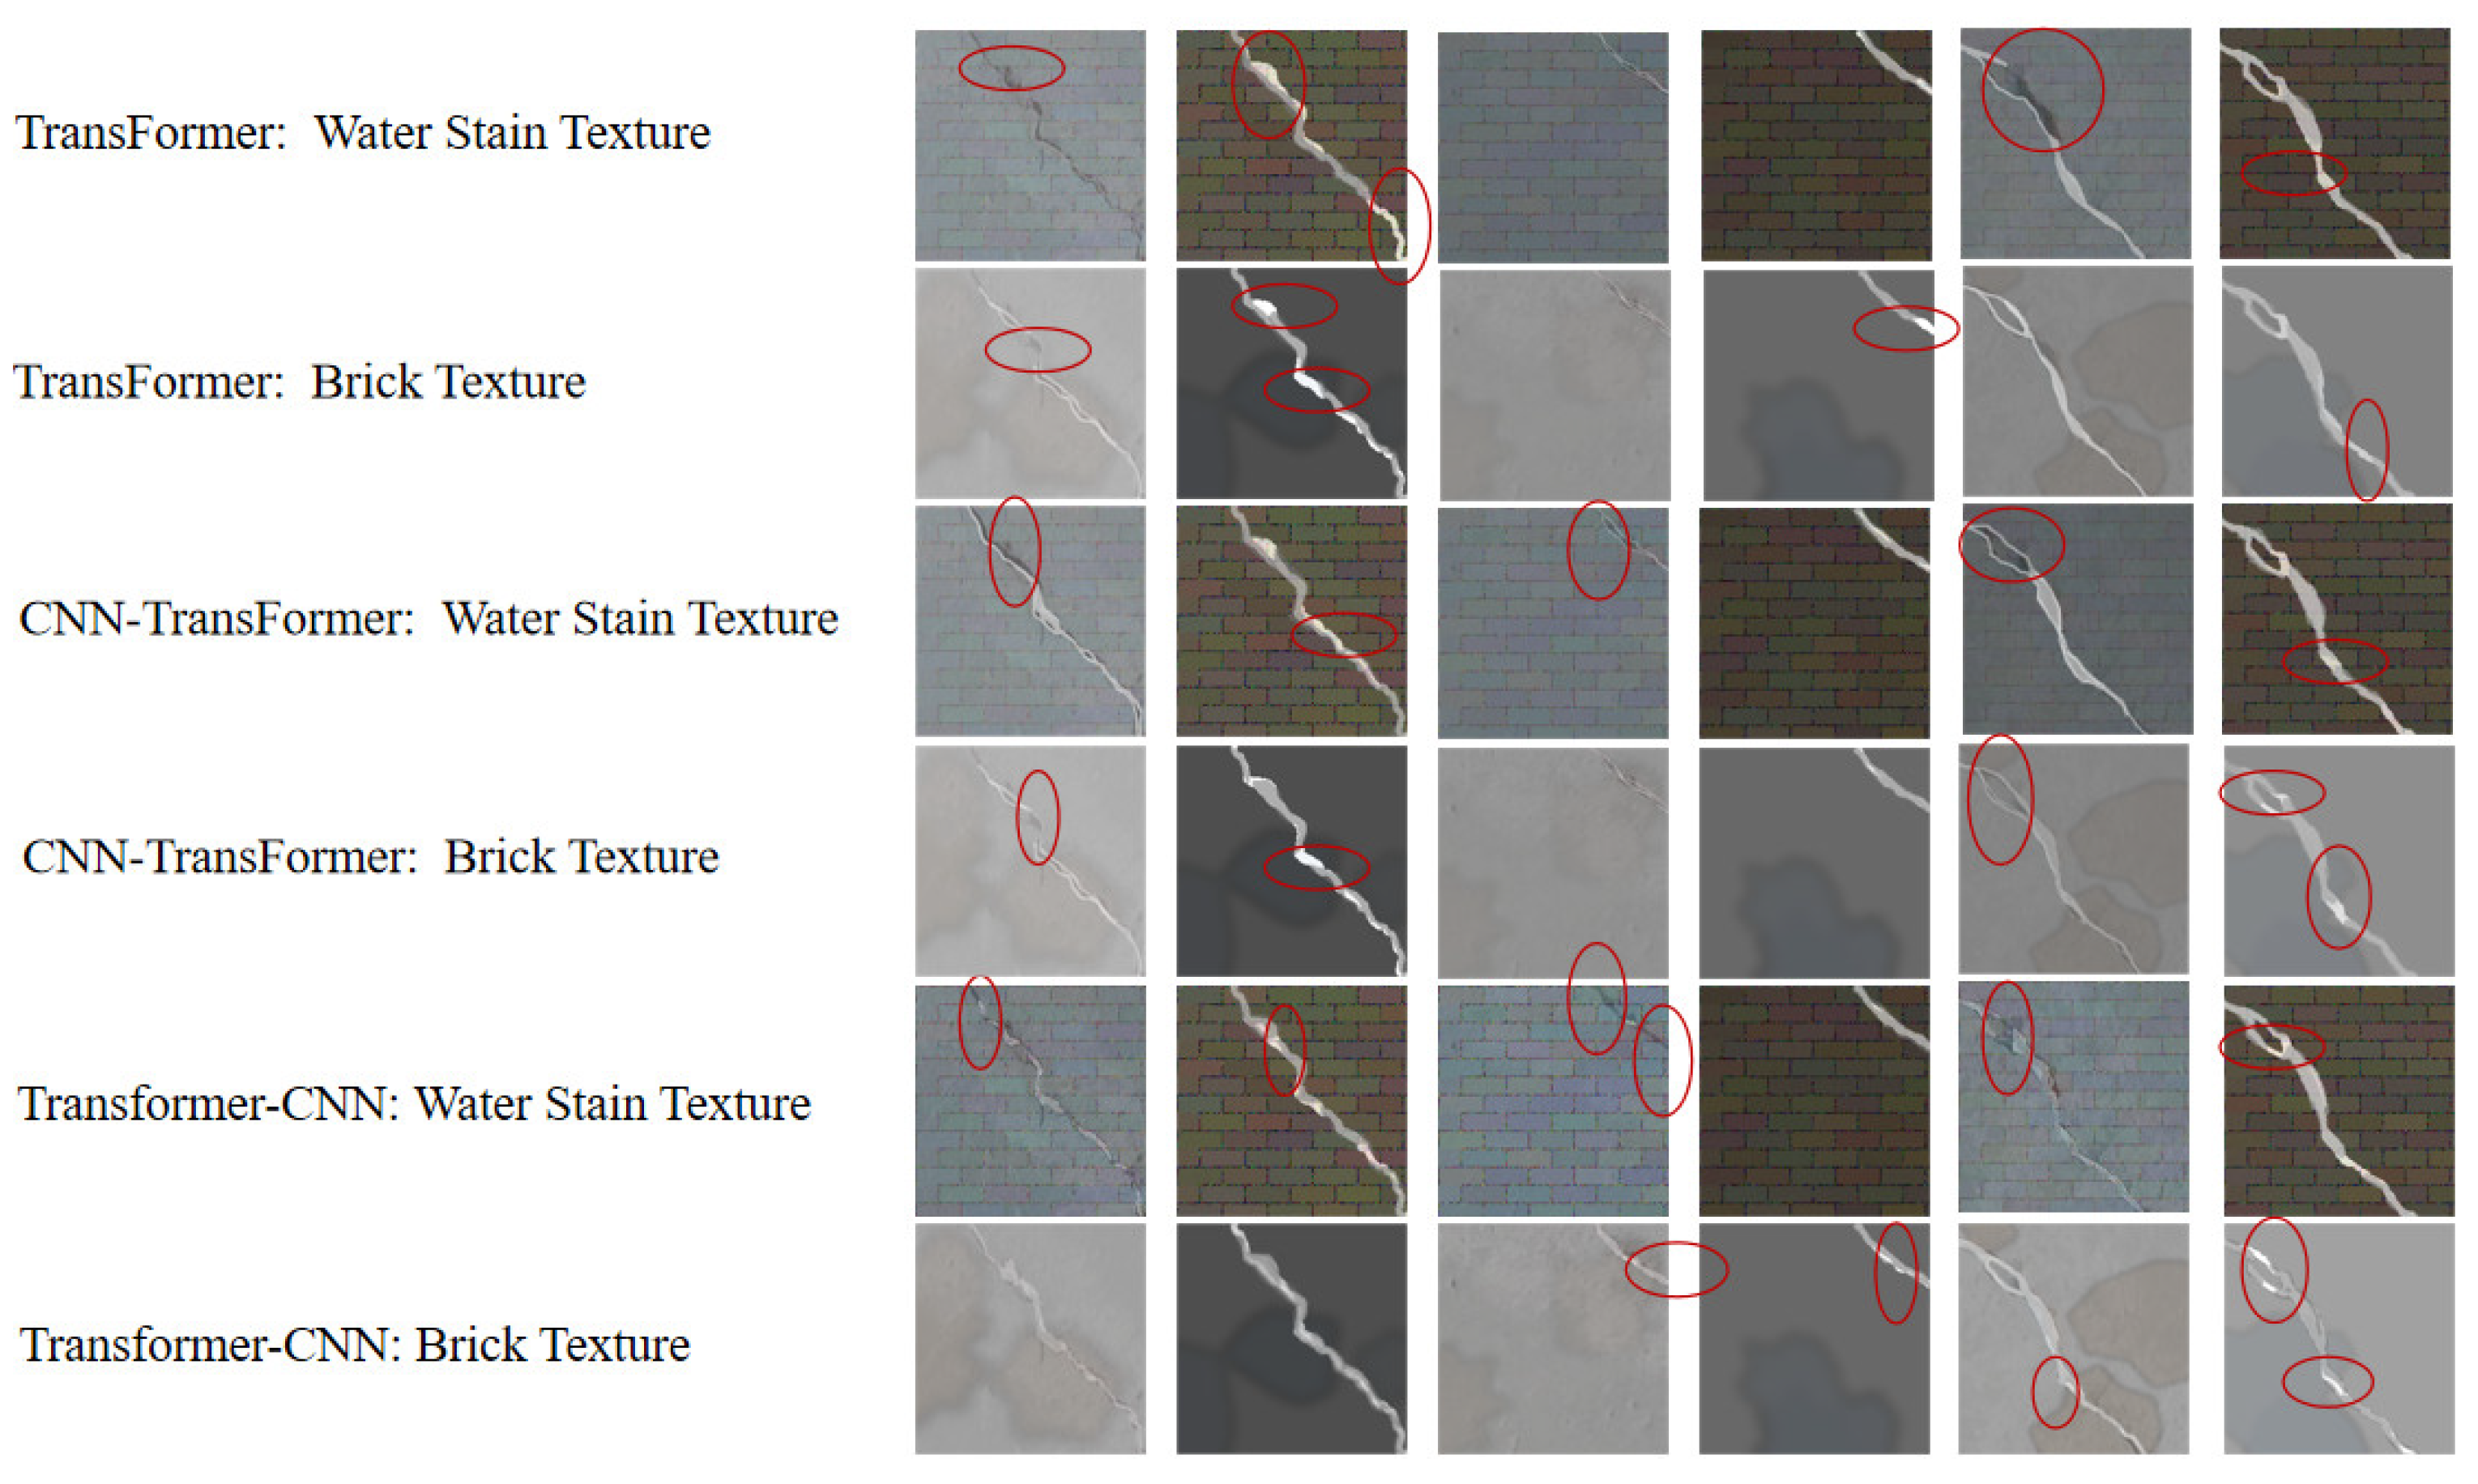
In crack detection for Civil structures, real-world application scenarios are complex and changeable. To evaluate the model’s adaptability across different environments, this study simulated various environments by adding brick textures and water-stain textures to explore the model’s training effect. Image fusion technology was adopted to add brick textures to the original data images for simulating real environments. The water-stain textures with different shapes, sizes, and positions form complex patterns to simulate the interference caused by rain on cracks.
As shown in Figure 21, the visual comparison allowed for intuitive observation of the varying impacts of three models on crack detection performance across different environments. In image detection, a large number of unrecognized regions marked in red exhibit omission. This is because the model struggles to distinguish between the normal textures of the wall and cracks due to different backgrounds. However, from the perspective of the mask image, the recognition is relatively complete, indicating that the model can fully learn the features of cracks when disturbed.
Figure 21.
Visualized results of different background textures.
Detailed specific data are shown in Table 8. By adding brick wall textures and water stain textures to simulate the impact of different environments on the models, the Transformer–CNN model achieves a loss rate of only about 5% and an IoU of over 80%. This is mainly due to the model’s hybrid architecture, which enables excellent feature extraction and localization capabilities. However, for other models, their performance still needs further improvement.
Table 8.
Impacts of different backgrounds on the effectiveness of the methods.
4.5. Ablation Analysis of Key Modules
A series of ablation studies was performed to rigorously quantify the structural contribution of each strategic module within the proposed Transformer–CNN framework. As summarized in Table 9, four configurations were evaluated: the full Transformer–CNN (baseline), and three derived variants. Specifically, V1 eliminates the spatial reconstruction process to assess its role in topology restoration; V2 serves as a Transformer-free version to isolate the impact of global dependency modeling; and V3 employs static bilinear interpolation instead of learnable transposed convolutions in the decoder. Through this incremental isolation and substitution, the influence of each component on both segmentation precision and the network’s convergence stability was meticulously evaluated.
Table 9.
Quantitative performance comparison of different model variants for ablation analysis.
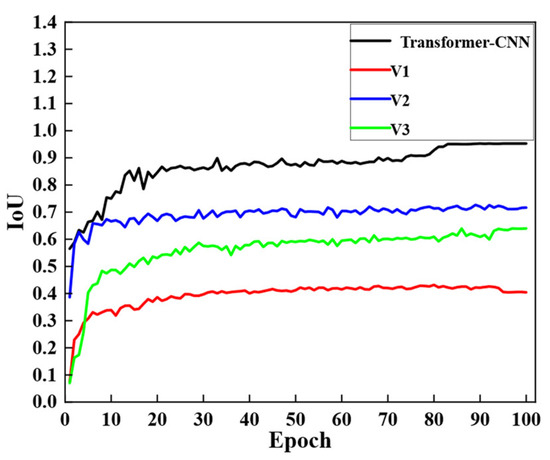
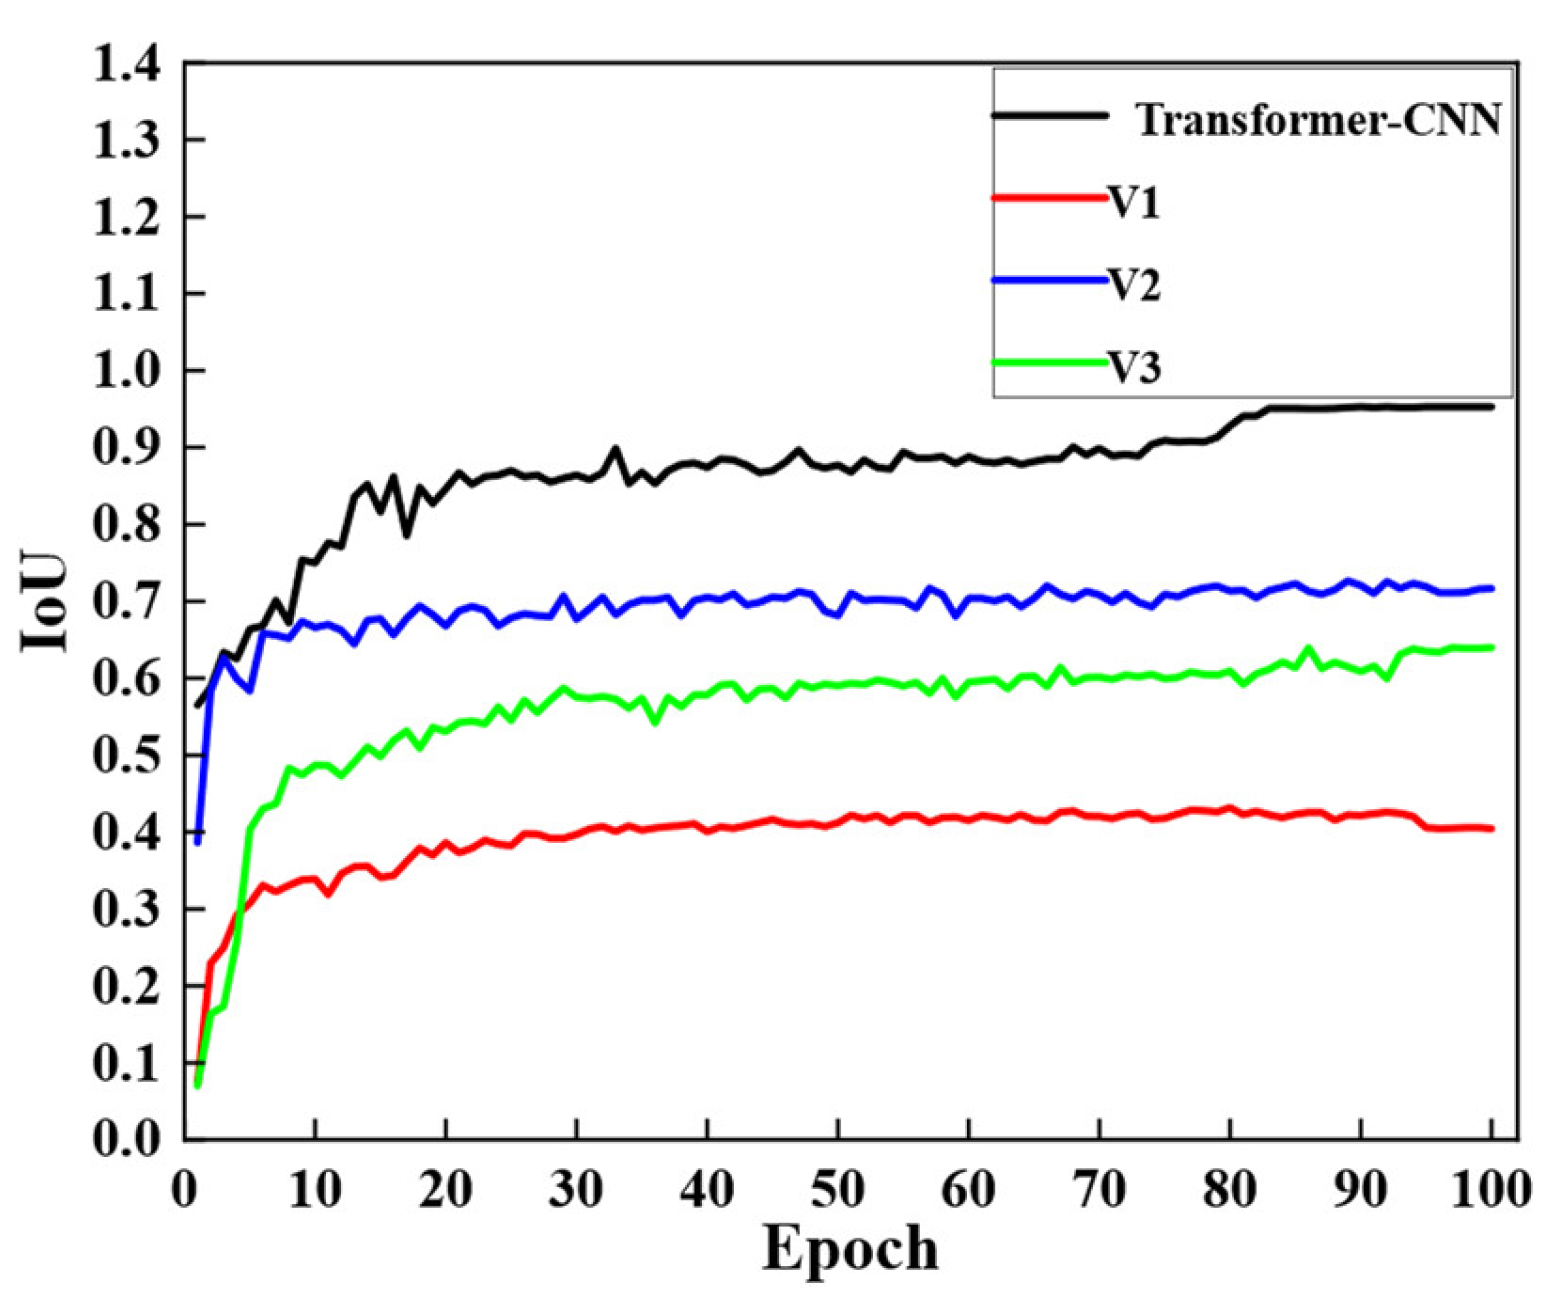
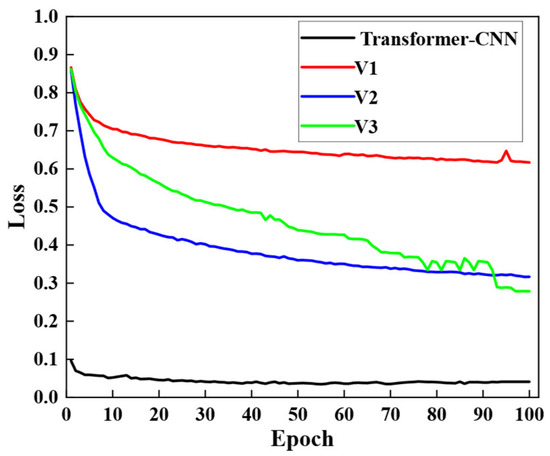
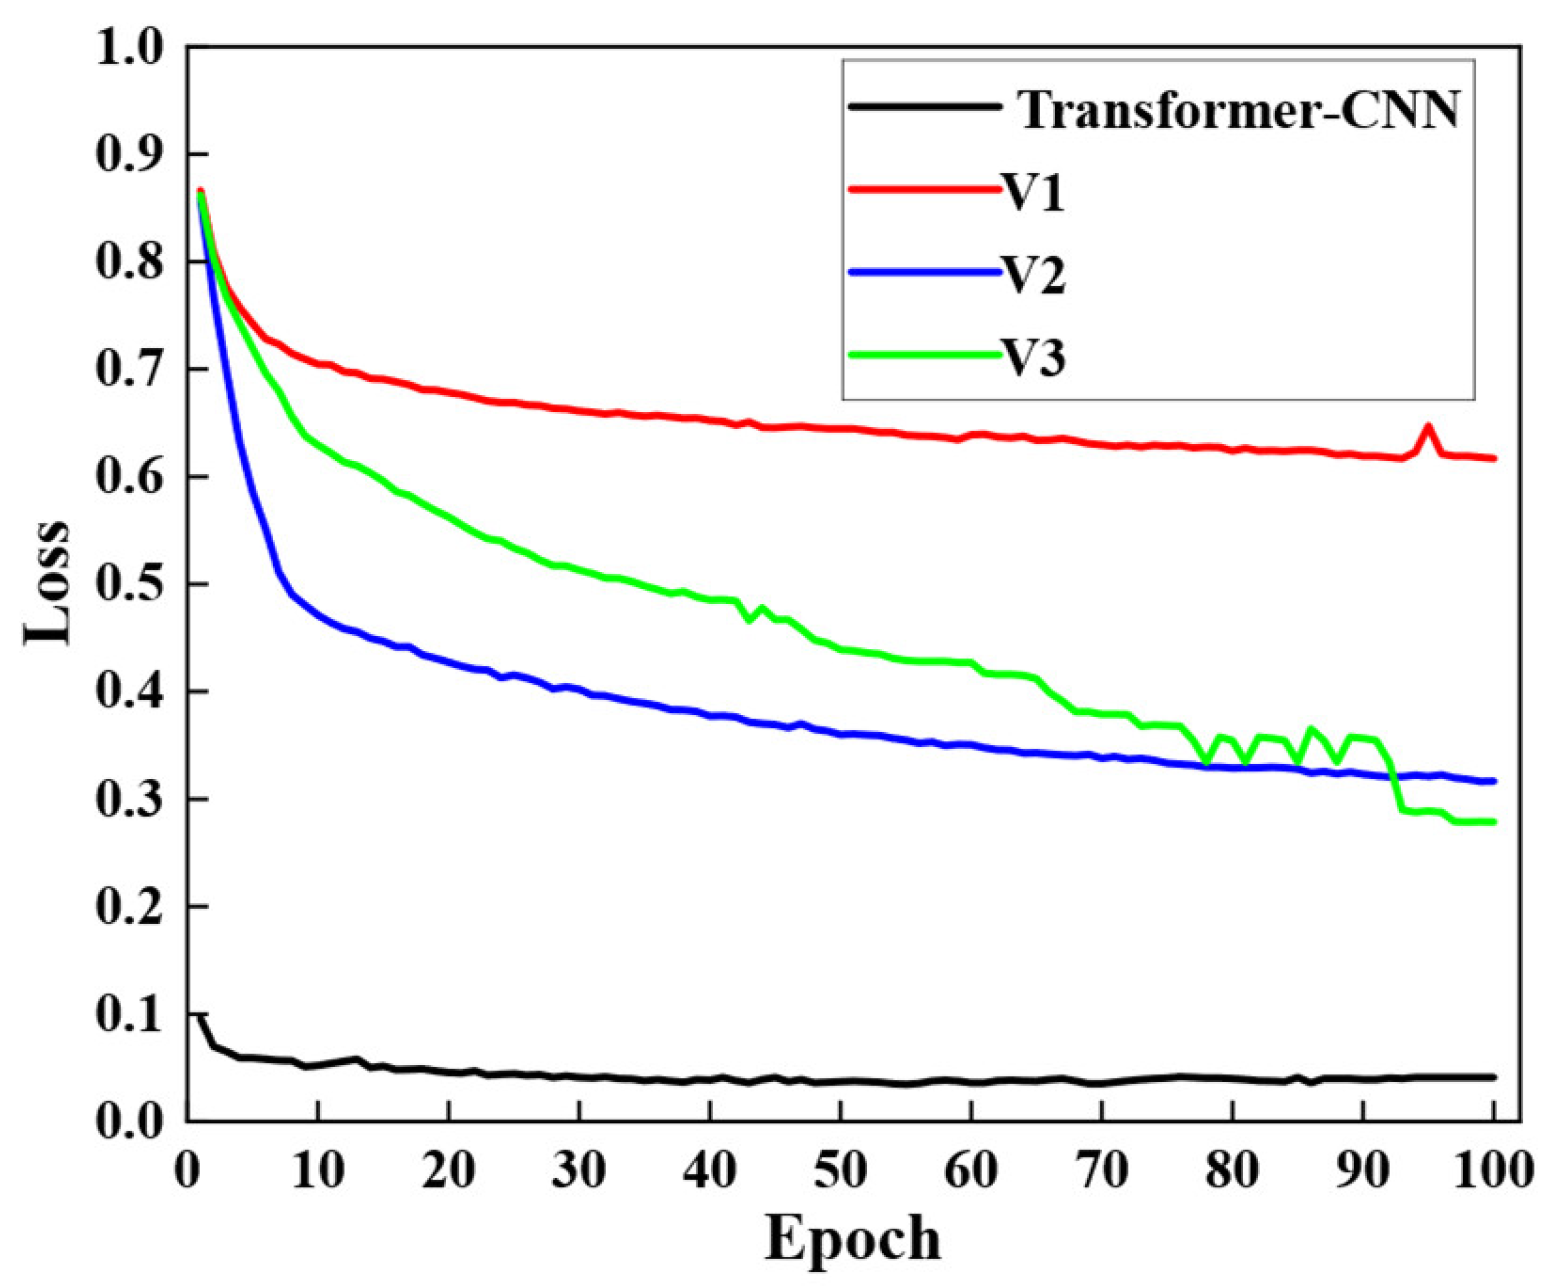
Figure 22 and Figure 23 illustrate the loss and IoU of three ablation variants, respectively. According to the quantitative evaluation of the proposed framework in the preceding text, the complete Transformer–CNN model achieves an excellent steady state, with a loss of approximately 0.044 and an IoU of 95.29%. In contrast, all simplified variants exhibit significant performance degradation and higher residual loss. Specifically, V1 (without reconstruction) shows the most severe decline, with its IoU stagnating at around 43%, which emphasizes that skipping the topology recovery stage severely impairs the model’s ability to convert sequential scalars into accurate spatial masks. Compared with the baseline model, V2 (without a Transformer) achieves some improvement in IoU, reaching about 73%, which reveals that a backbone relying solely on convolutional operations lacks the global context necessary to maintain the continuity of crack structures under complex background interference. Furthermore, the results of V3 indicate that replacing transposed convolution with static bilinear upsampling still yields unsatisfactory results, with an IoU of around 64%. These quantitative gaps confirm that each strategic module is indispensable for achieving high-precision segmentation of pavement cracks.
Figure 22.
IoU curves of different ablation variants during training.
Figure 23.
Loss curves of different ablation variants during training.
In summary, the ablation study provides robust empirical evidence for the structural rationality of the proposed architecture. The results emphasize that the synergistic integration of the Transformer encoder’s global attention and the spatial reconstruction layer’s geometric restoration is the decisive factor in surpassing simplified or purely convolutional methods. While each individual module contributes differently to semantic depth and boundary precision, the baseline configuration consistently achieves the optimal balance between loss convergence and segmentation quality. This structural synergy ensures high robustness and precision in identifying diverse crack morphologies within complex infrastructure environments.
5. Blind Test for Validation Using Field Data
In this section, the proposed hybrid Transformer–CNN methods were further validated using field images collected during bridge inspections to assess their performance in real-world infrastructure O&M assessment. Large-scale constructed facilities, such as bridges, present considerable challenges for automated crack detection due to their complex structural configurations, outdoor exposure, and susceptibility to variable lighting and background interference. Moreover, bridge components typically occupy only a small fraction of the image pixels, which makes fine crack identification and quantification particularly difficult. These factors highlight the practical and academic significance of robust computer vision methods for infrastructure inspection and maintenance workflows.
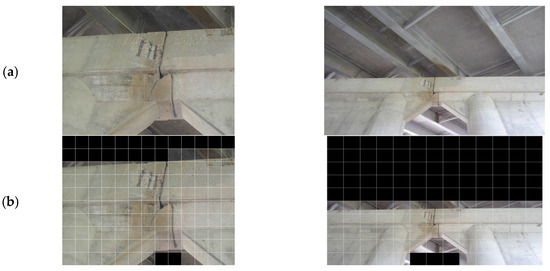
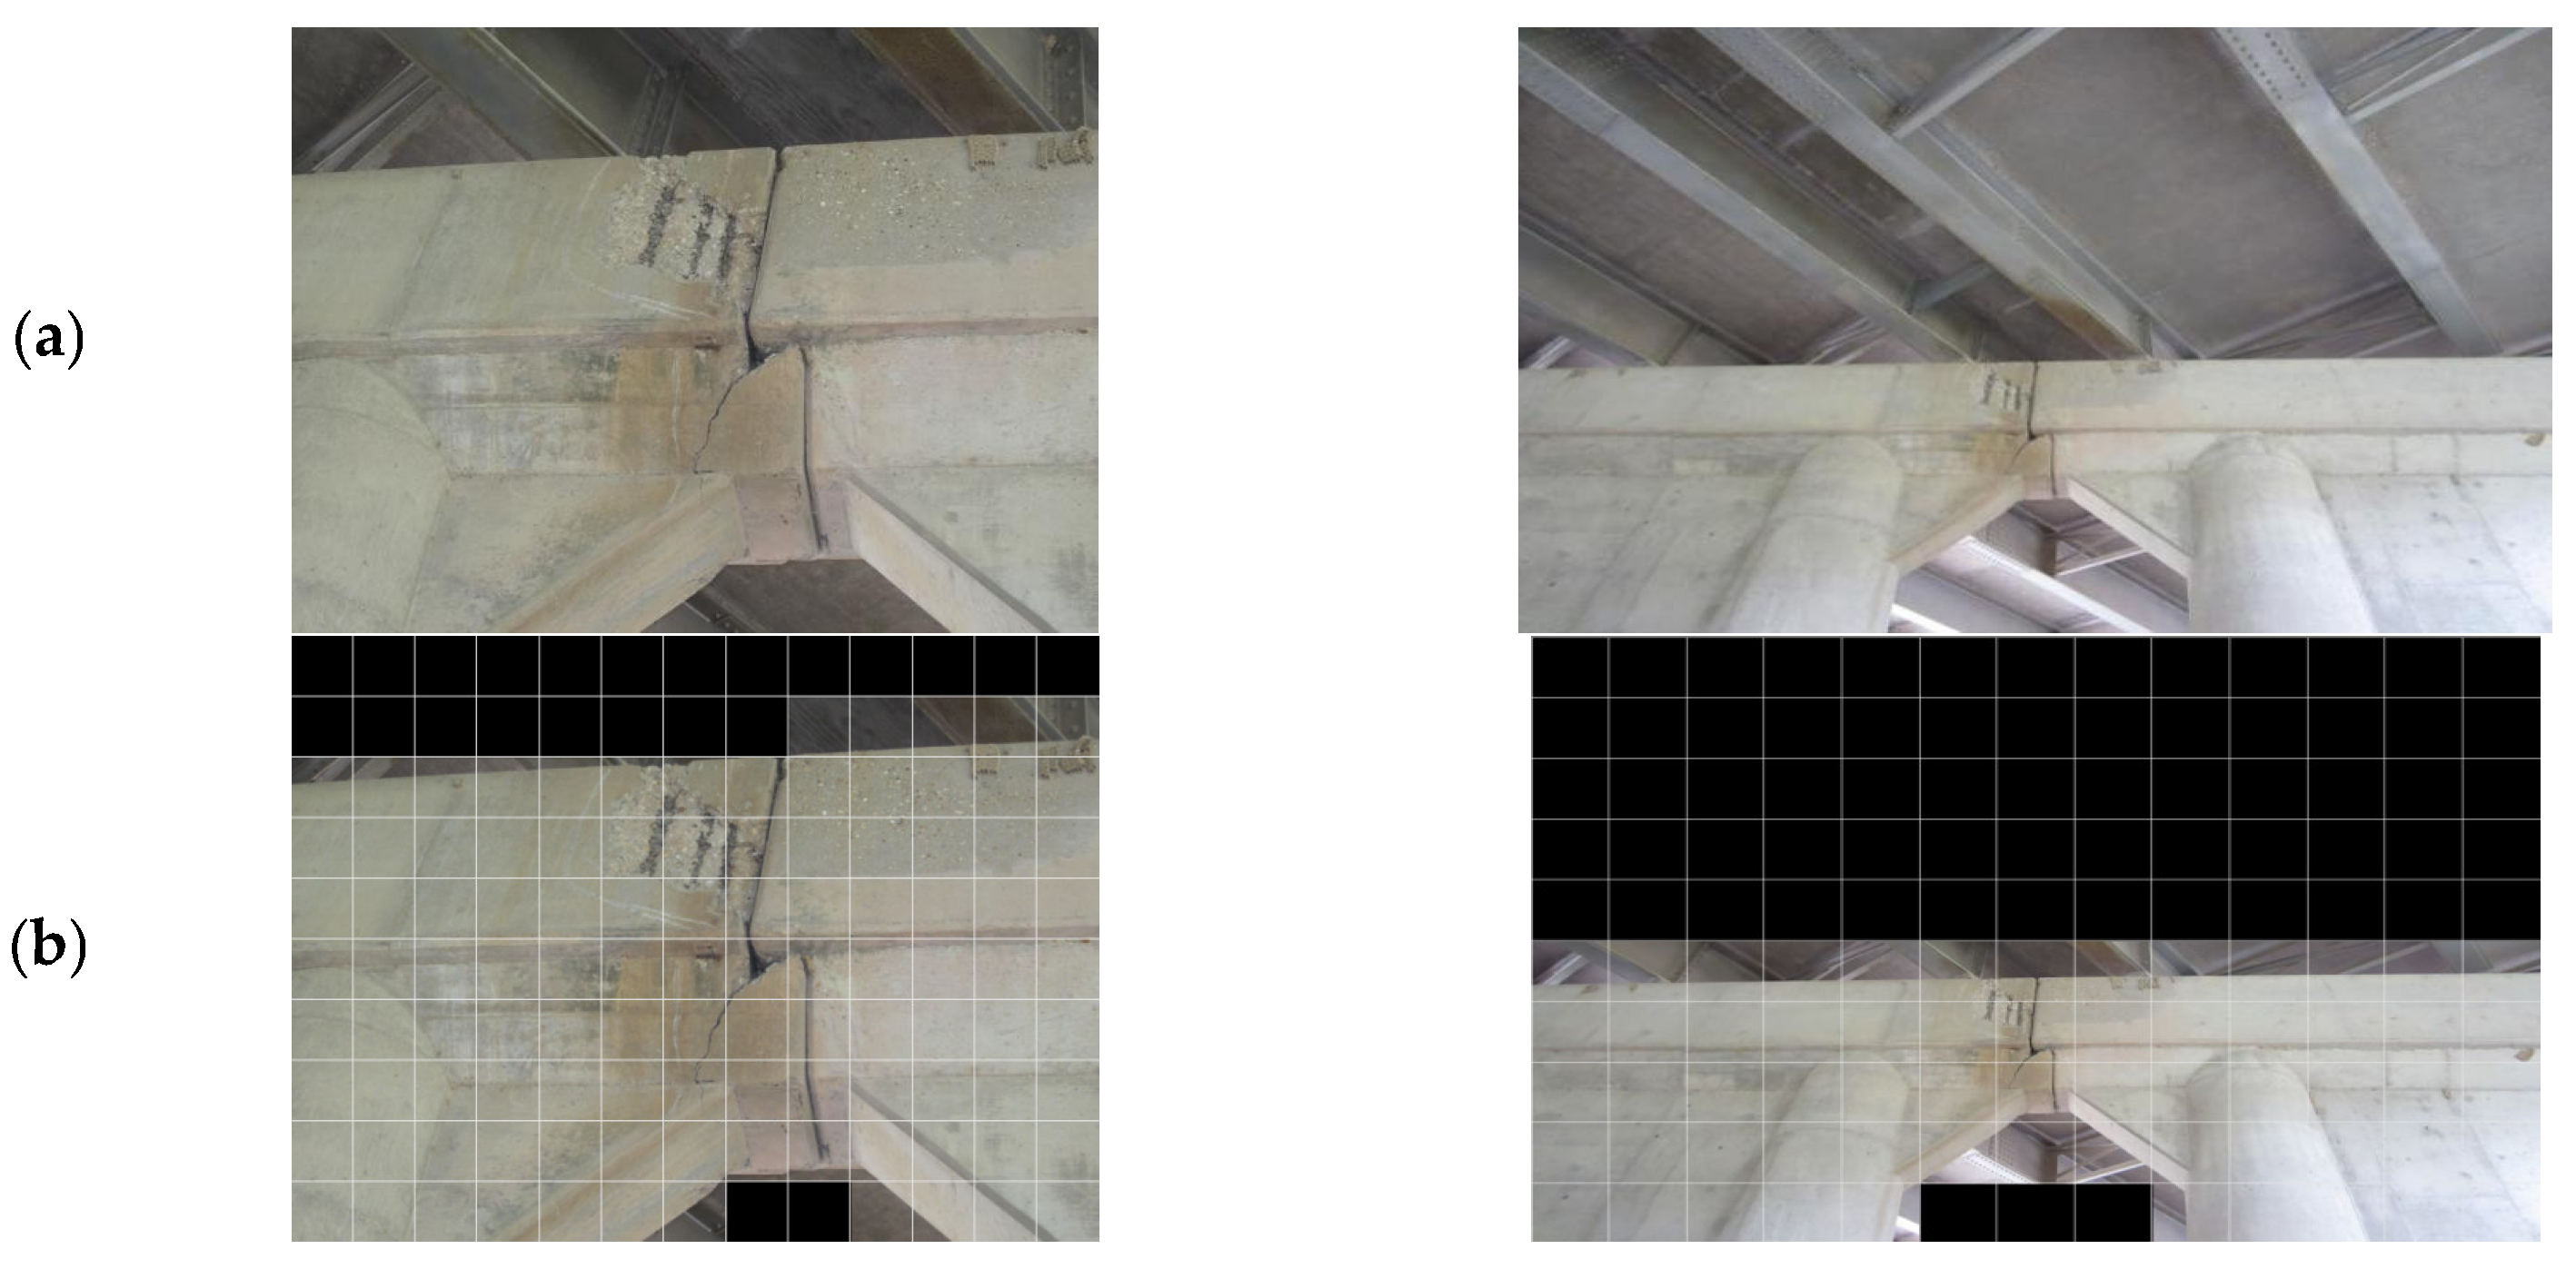
The validation study was carried out using field bridge data from the 44 Crossing of Roubidoux Creek in Phelps County, Missouri, U.S., where the bridge bent has experienced significant degradation due to rebar corrosion and concrete spall, as illustrated in Figure 24a.
Figure 24.
Field bridge used for validation: visible surface degradation at the bridge bent below the expansion joints. (a) original image; (b) corresponding image after grid-based segmentation.
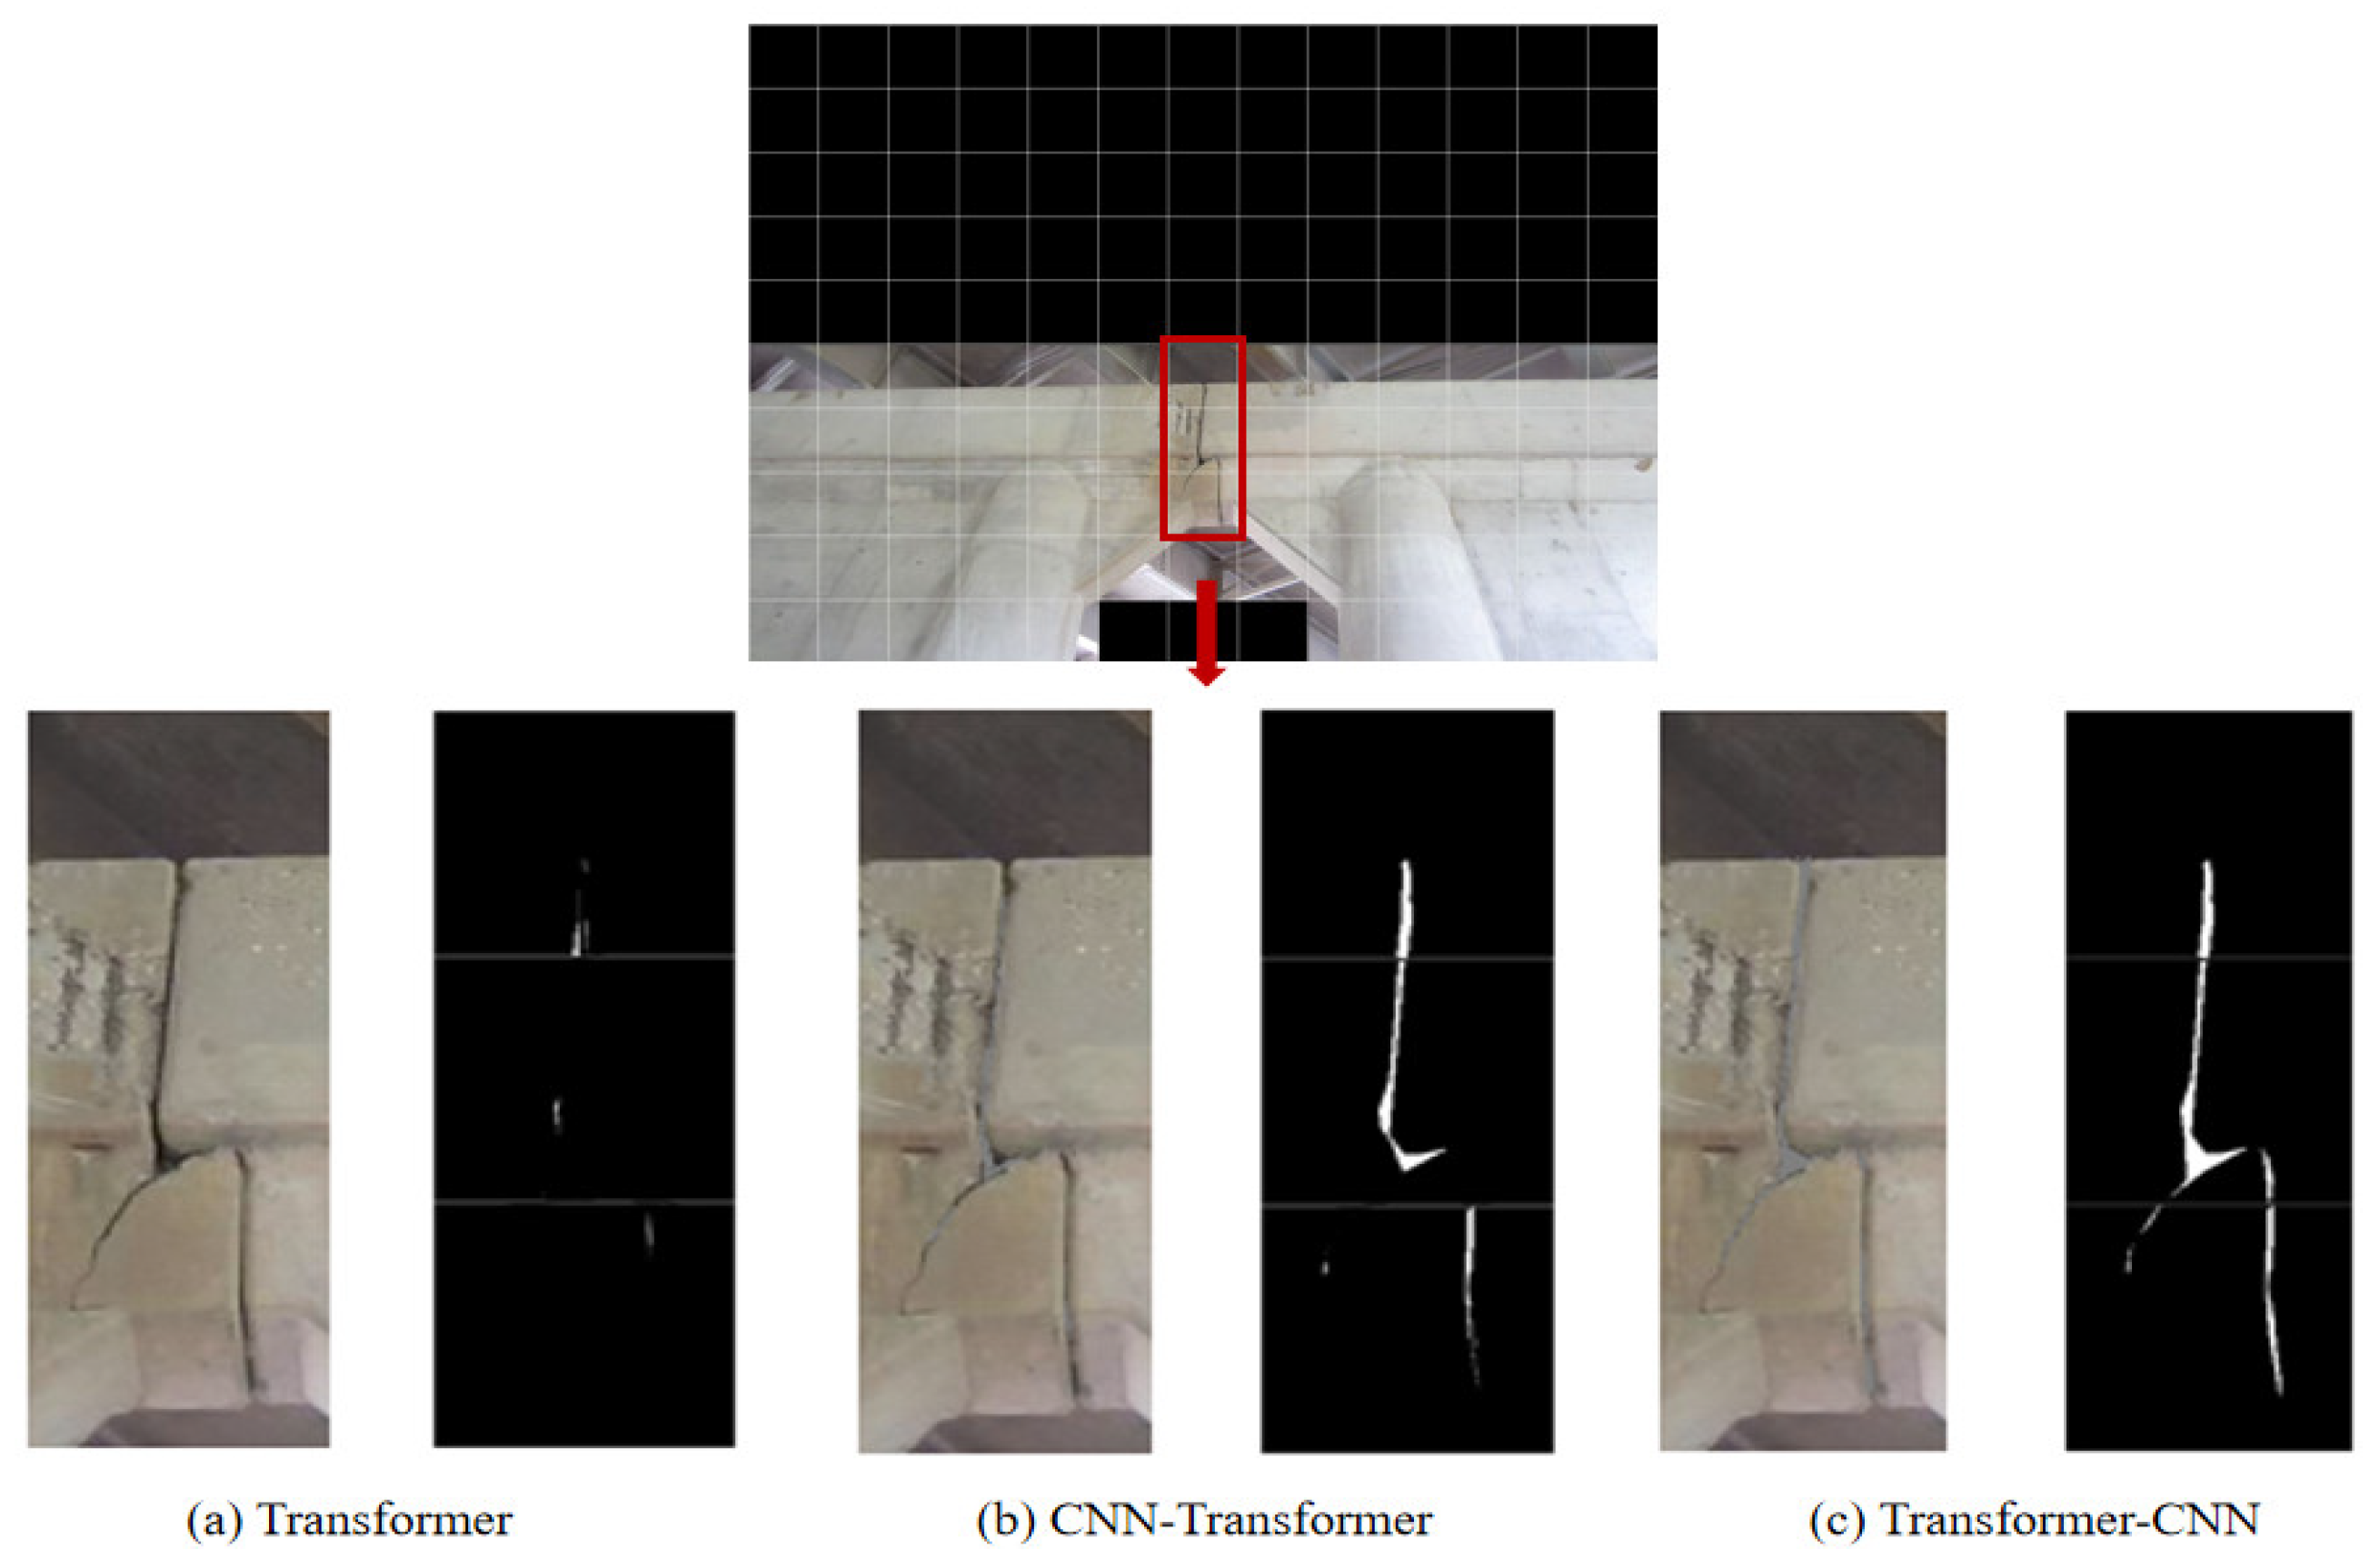
To address the issue of low pixel values of cracks in such images, which often leads to reduced detection accuracy, this study employed a grid-based segmentation approach. Bridge structure images containing multiple components were first acquired from online platforms. The original image, sized 4000 × 3000 pixels, was then divided both horizontally and vertically into sub-images of 300 × 307 pixels. This process aimed to mitigate noise in complex scenes and improve crack identification accuracy. In addition, to reduce interference during crack recognition, the pure background was distinguished from the structural subject, and the areas corresponding to the pure background in the small sub-images were filled with black. The pre-processed photos are illustrated in Figure 24b.
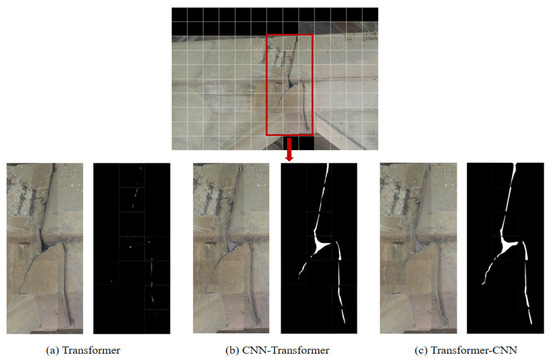
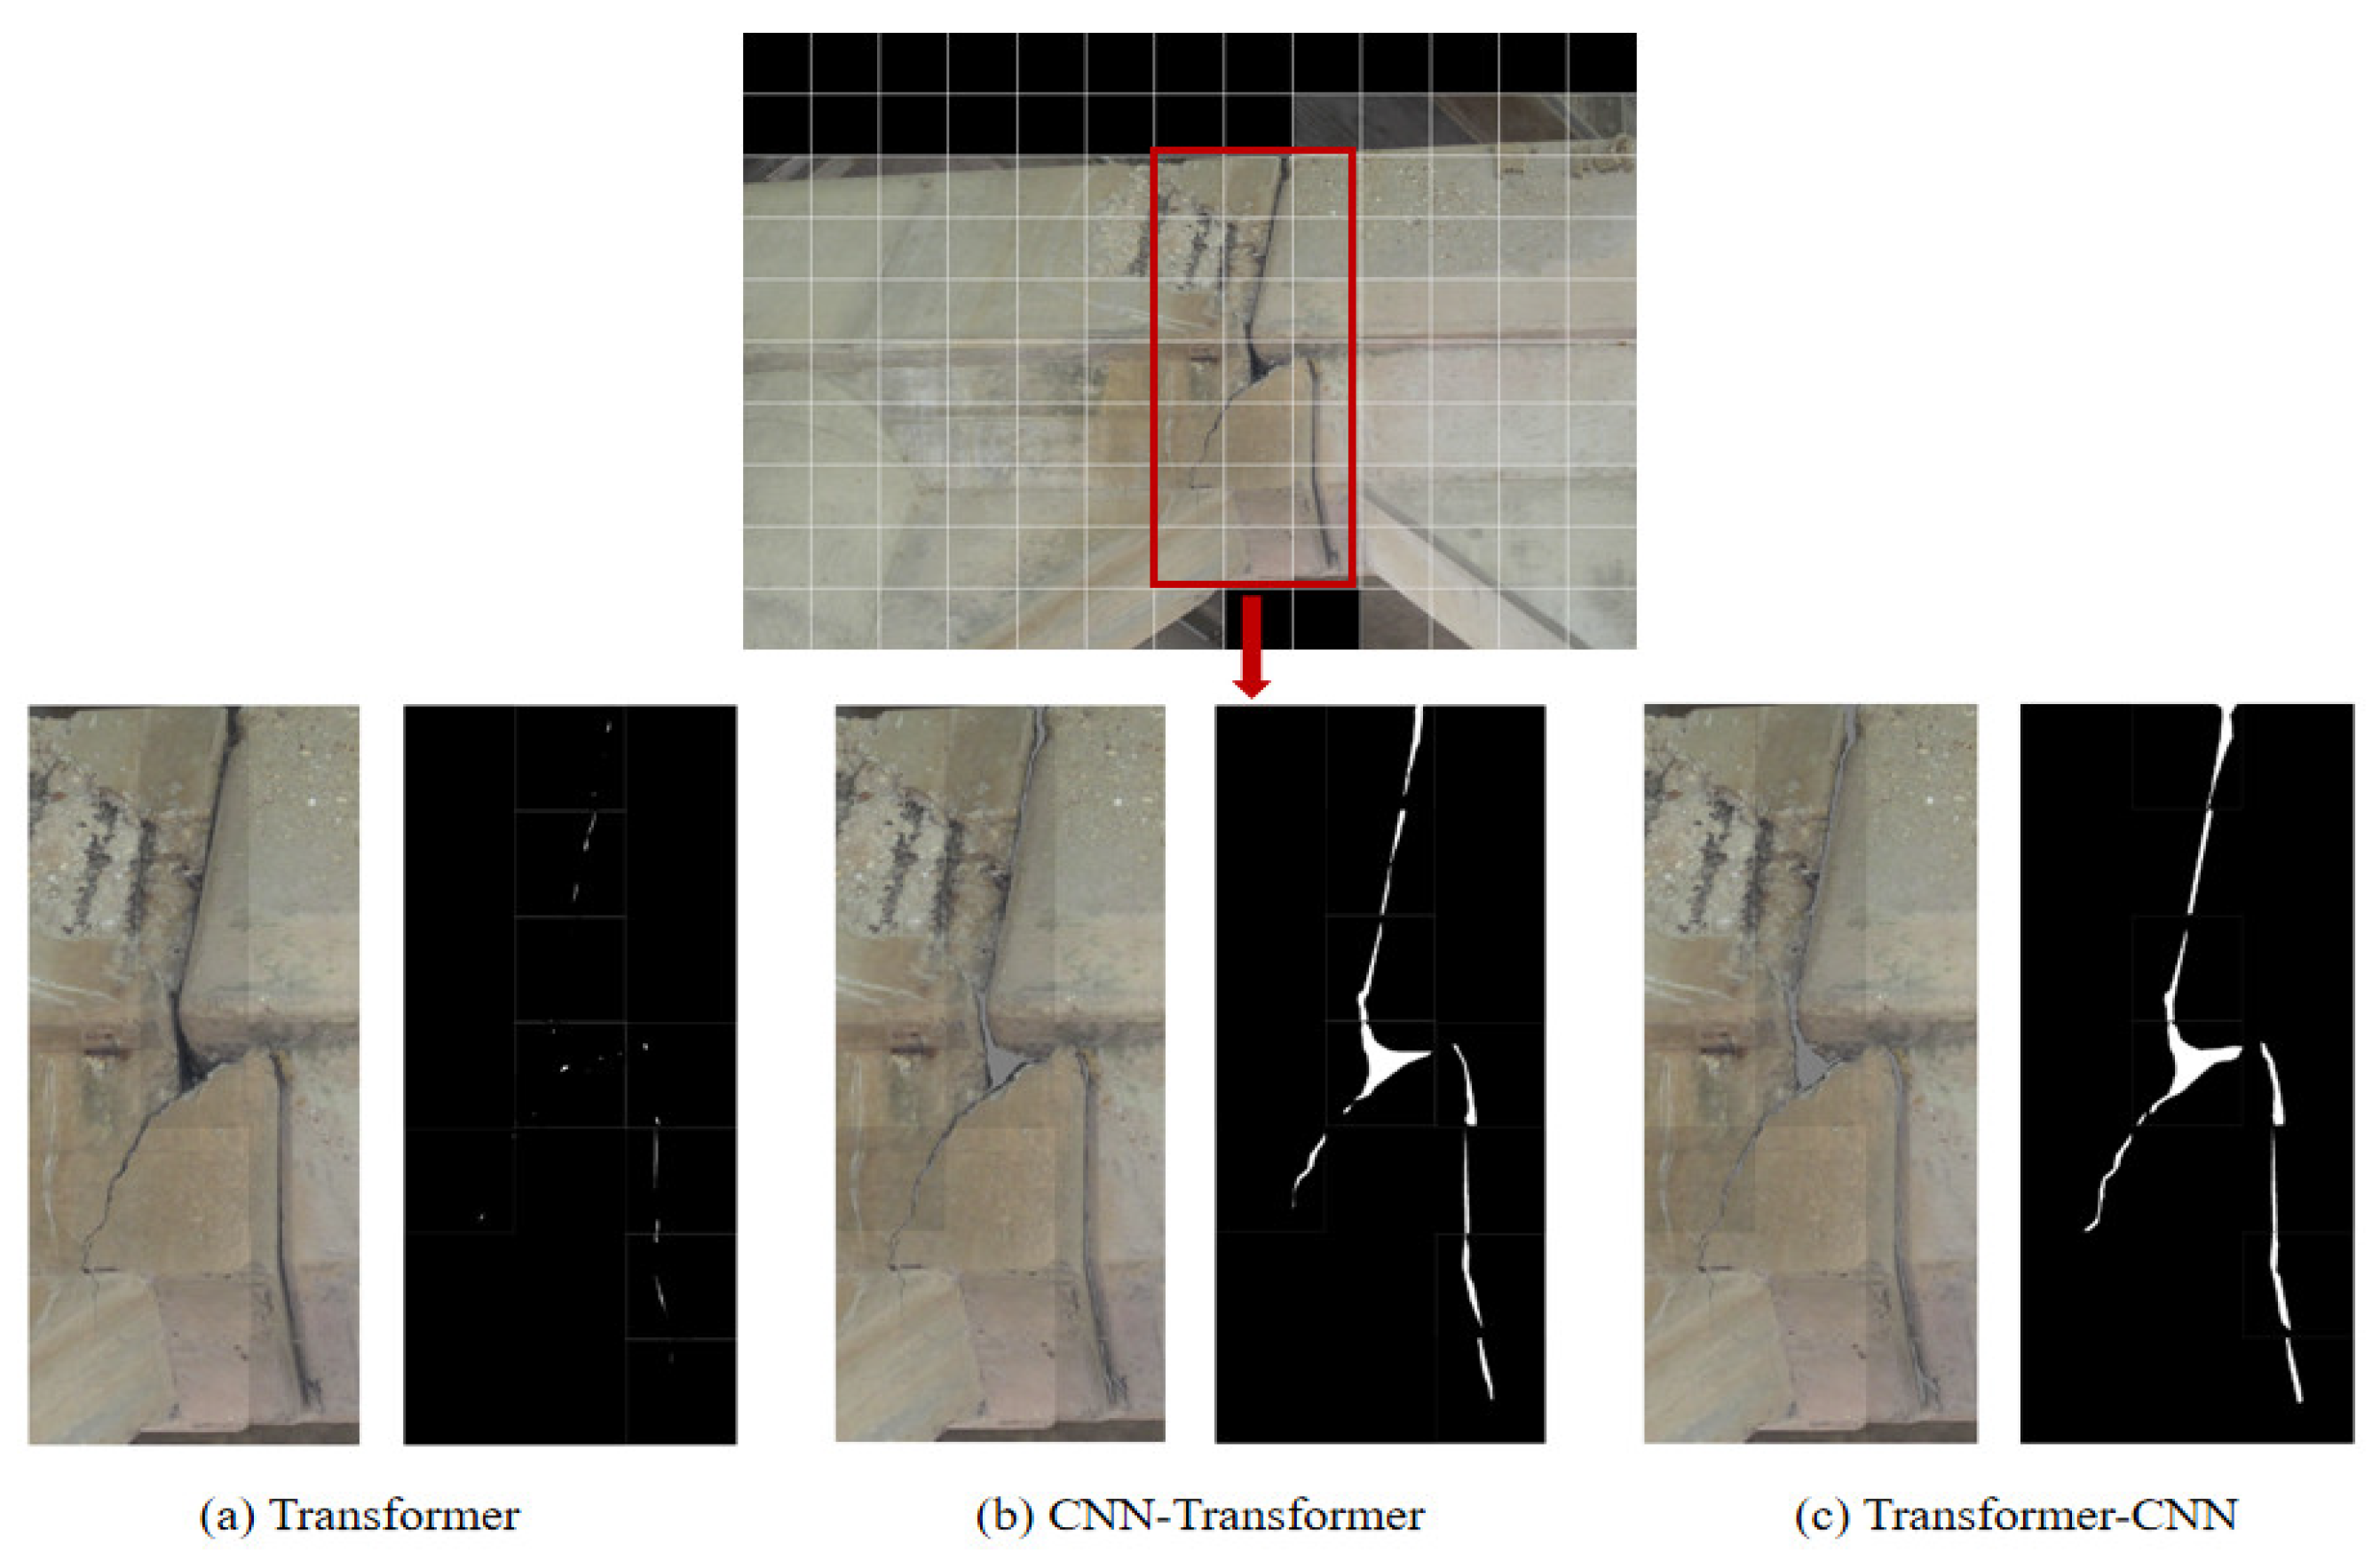
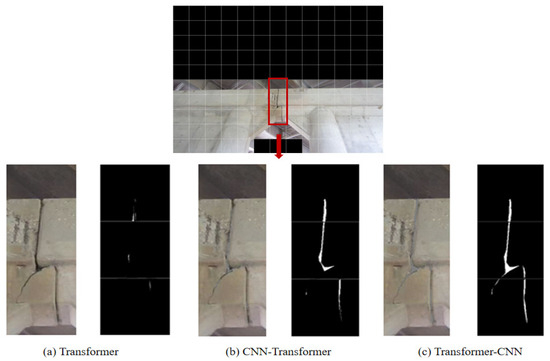
After the image was segmented, each sub-image was fed into the models for crack recognition. The recognition results of the three models are displayed in Figure 25 and Figure 26, respectively, to present the model performance more clearly. Specifically, subfigures (a) to (c) correspond to the Transformer, CNN–Transformer, and Transformer–CNN models, respectively, with the left side showing the original image and the right side displaying the masked image.
Figure 25.
The recognition performance of different models at a large scale.
Figure 26.
The recognition performance of different models at a small scale.
In the bridge image, a distinct crack was visible on the beam, while the bridge body exhibited water stains. Among the three methods, the Transformer model failed to detect any cracks, likely due to the low resolution and fine appearance of the crack. The CNN–Transformer model identified the crack, but the result appeared fragmented with unclear edges. In contrast, the Transformer–CNN model effectively recognized the crack completely and continuously. Based on the experimental results, the Transformer–CNN model demonstrated superior performance in crack detection under various conditions. However, despite its promising outcomes, the model still requires further optimization and enhancement to improve its robustness and accuracy in handling complex structural scenarios. Future work should focus on refining its architecture and expanding its adaptability to more challenging environments.
6. Conclusions
This study presents a Transformer–CNN hybrid architecture for computer-vision-based automated crack detection, developed to overcome the inefficiencies of traditional manual inspection and the limitations of conventional NDE sensors in infrastructure management. By integrating convolutional feature extraction with Transformer-based long-range dependency modeling, the framework provides a robust and scalable solution to support inspection and O&M assessment of constructed facilities. The experimental results demonstrate that the proposed hybrid model achieves superior performance, reaching an IoU of up to 91.8% and an accuracy of 98.7%, which outperforms LSTM, CNN, Transformer-only, and CNN–Transformer models. Furthermore, the integration of data augmentation significantly improved model performance, particularly in data-constrained scenarios. The model also exhibits remarkable robustness against variations in lighting and complex background textures, ensuring accurate detection under challenging real-world conditions. Through visualization and field validation using bridge inspection images, this approach provides intuitive interpretations of crack morphology and confirms its practical applicability for automated, non-intrusive assessment workflows.
Despite these promising results, several areas for future research remain. While current validation has focused on concrete bridge imagery, future studies are required to generalize the framework across diverse infrastructure types and environmental conditions. Additionally, optimizing computational efficiency for deployment on remote sensing platforms, such as UAVs or mobile robots, is essential for real-time applications. Future work will also explore advanced attention mechanisms, multimodal data integration (e.g., thermal imaging or LiDAR), and more diverse datasets to enhance generalization. Ultimately, integrating this model into automated O&M assessment platforms will facilitate seamless, data-driven decision-making for infrastructure inspection and lifecycle management.
Author Contributions
Conceptualization, Z.Z., H.P., Z.L. and X.B.; methodology, Z.Z. and J.R.; software, Z.Z. and J.R.; validation, Z.Z. and J.R.; formal analysis, Z.Z., H.P. and Z.L.; data curation, Z.Z. and J.R.; writing—original draft preparation, Z.Z. and J.R.; writing—review and editing, Z.Z., J.R., H.P., Z.L. and X.B.; visualization, Z.Z., J.R. and X.B.; funding acquisition, Z.Z., X.B. and Z.L. All authors have read and agreed to the published version of the manuscript.
Funding
The Eighth Batch of Jilin Province’s Youth Science and Technology Talent Support Program (Grant No. QT202412); the Department of Housing and Urban Rural Development of Jilin Province, China (Grant No. 2023-K-29); Science Research Project of the Education Department of Jilin Province (JJKH20261801KJ). The USDOTs (DTPH5616HCAP03, 693JK318500010CAAP, 693JK31850009CAAP, 693JK32110003POTA, and 693JK32250007).
Data Availability Statement
The data presented in this study are available upon request from the corresponding authors.
Acknowledgments
The 1st, 2nd, and 3rd authors gratefully acknowledge the financial support provided by the Eighth Batch of Jilin Province’s Youth Science and Technology Talent Support Program (Grant No. QT202412); the Department of Housing and Urban Rural Development of Jilin Province, China (Grant No. 2023-K-29). The 1st, 4th, and 5th authors acknowledge the financial support provided by the USDOTs (DTPH5616HCAP03, 693JK318500010CAAP, 693JK31850009CAAP, 693JK32110003POTA, and 693JK32250007). The results, discussion, and opinions reflected in this paper are those of the authors only and do not necessarily represent those of the sponsors.
Conflicts of Interest
The authors declare no conflicts of interest.
References
- Ren, J.; Hu, Y.; Cui, H.; Xu, J.; Bai, L. Scattering matrix similarity metric optimization for improved defect characterisation based on dynamic graph attention networks. NDT E Int. 2024, 148, 103220. [Google Scholar] [CrossRef] [Scilit]
- Duan, R.; Yan, Z.; Huang, P.; Li, S.; Hu, Q. A Method for Steel Crack Detection Based on Multispectral Image Fusion. SSRN 2023. preprint. [Google Scholar]
- Mohseni, E.; Habibzadeh Boukani, H.; Ramos França, D.; Viens, M. A study of the automated eddy current detection of cracks in steel plates. J. Nondestruct. Eval. 2020, 39, 6. [Google Scholar] [CrossRef] [Scilit] [PubMed]
- Mukherjee, A.; Banerjee, A. Analysis of acoustic emission signal for crack detection and distance measurement on steel structure. Acoust. Aust. 2021, 49, 133–149. [Google Scholar] [CrossRef] [Scilit]
- Pan, B. Digital image correlation for surface deformation measurement: Historical developments, recent advances and future goals. Meas. Sci. Technol. 2018, 29, 082001. [Google Scholar] [CrossRef] [Scilit]
- Kim, J.J.; Kim, A.-R.; Lee, S.-W. Artificial neural network-based automated crack detection and analysis for the inspection of concrete structures. Appl. Sci. 2020, 10, 8105. [Google Scholar] [CrossRef] [Scilit]
- Zhang, Z.; Pan, H.; Wang, X.; Lin, Z. Deep learning empowered structural health monitoring and damage diagnostics for structures with weldment via decoding ultrasonic guided wave. Sensors 2022, 22, 5390. [Google Scholar] [CrossRef] [Scilit]
- Zhang, Z.; Tang, F.; Cao, Q.; Pan, H.; Wang, X.; Lin, Z. Deep learning-enriched stress level identification of pretensioned rods via guided wave approaches. Buildings 2022, 12, 1772. [Google Scholar] [CrossRef] [Scilit]
- Ali, R.; Zeng, J.; Cha, Y.-J. Deep learning-based crack detection in a concrete tunnel structure using multispectral dynamic imaging. In Proceedings of the Smart Structures and NDE for Industry 4.0, Smart Cities, and Energy Systems; SPIE: Bellingham, WA, USA, 2020; pp. 12–19. [Google Scholar]
- Lee, Y.-K.; Jo, K.-H. Faster R-CNN with Attention Feature Map for Robust Object Detection. In Proceedings of the Frontiers of Computer Vision: 26th International Workshop, IW-FCV 2020, Ibusuki, Kagoshima, Japan, 20–22 February 2020; Revised Selected Papers 26, F, 2020; Springer: Berlin/Heidelberg, Germany, 2020; pp. 180–191. [Google Scholar]
- Jang, S.-J.; Jang, S.-Y. Short-Term Crack in Sewer Forecasting Method Based on CNN-LSTM Hybrid Neural Network Model. J. Korean Geosynth. Soc. 2022, 21, 11–19. [Google Scholar]
- Chen, T.; Cai, Z.; Zhao, X.; Chen, C.; Liang, X.; Zou, T.; Wang, P. Pavement crack detection and recognition using the architecture of segNet. J. Ind. Inf. Integr. 2020, 18, 100144. [Google Scholar] [CrossRef] [Scilit]
- Fu, Z.; Lam, W.; Yu, Q.; So, A.M.-C.; Hu, S.; Liu, Z.; Collier, N. Decoder-only or encoder-decoder? interpreting language model as a regularized encoder-decoder. arXiv 2023, arXiv:2304.04052. [Google Scholar]
- Huyan, J.; Li, W.; Tighe, S.; Xu, Z.; Zhai, J. CrackU-net: A novel deep convolutional neural network for pixelwise pavement crack detection. Struct. Control Health Monit. 2020, 27, e2551. [Google Scholar] [CrossRef] [Scilit]
- Liu, H.; Miao, X.; Mertz, C.; Xu, C.; Kong, H. Crackformer: Transformer network for fine-grained crack detection. In Proceedings of the IEEE/CVF International Conference on Computer Vision, Montreal, BC, Canada, 11–17 October 2021; pp. 3783–3792. [Google Scholar]
- Ren, Y.; Huang, J.; Hong, Z.; Lu, W.; Yin, J.; Zou, L.; Shen, X. Image-based concrete crack detection in tunnels using deep fully convolutional networks. Constr. Build. Mater. 2020, 234, 117367. [Google Scholar] [CrossRef] [Scilit]
- Hao, F.; He, F.; Liu, L.; Wu, F.; Tao, D.; Cheng, J. Class-aware patch embedding adaptation for few-shot image classification. In Proceedings of the IEEE/CVF International Conference on Computer Vision, Paris, France, 1–6 October 2023; pp. 18905–18915. [Google Scholar]
- Narushynska, O.; Teslyuk, V.; Doroshenko, A.; Arzubov, M. Data sorting influence on short text manual labeling quality for hierarchical classification. Big Data Cogn. Comput. 2024, 8, 41. [Google Scholar] [CrossRef] [Scilit]
- Wang, Q.; Jiang, K.; Wang, Z.; Ren, W.; Zhang, J.; Lin, C.-W. Multi-scale fusion and decomposition network for single image deraining. IEEE Trans. Image Process. 2023, 33, 191–204. [Google Scholar] [CrossRef] [Scilit] [PubMed]
- Bai, S.; Chen, J.; Yang, Y.; Liu, Y. Multi-dimension compression of feed-forward network in vision transformers. Pattern Recognit. Lett. 2023, 176, 56–61. [Google Scholar] [CrossRef] [Scilit]
- Wang, D.; Zhang, Z.; Jiang, Y.; Mao, Z.; Wang, D.; Lin, H.; Xu, D. DM3Loc: Multi-label mRNA subcellular localization prediction and analysis based on multi-head self-attention mechanism. Nucleic Acids Res. 2021, 49, e46. [Google Scholar] [CrossRef] [Scilit] [PubMed]
- Berragan, C.; Singleton, A.; Calafiore, A.; Morley, J. Transformer based named entity recognition for place name extraction from unstructured text. Int. J. Geogr. Inf. Sci. 2023, 37, 747–766. [Google Scholar] [CrossRef] [Scilit]
- Shamsabadi, E.A.; Xu, C.; Rao, A.S.; Nguyen, T.; Ngo, T.; Dias-da-Costa, D. Vision transformer-based autonomous crack detection on asphalt and concrete surfaces. Autom. Constr. 2022, 140, 104316. [Google Scholar] [CrossRef] [Scilit]
- Chen, C.; Min, F.; Zhang, Y.; Bao, H. ReLU-type Hopfield neural network with analog hardware implementation. Chaos Solitons Fractals 2023, 167, 113068. [Google Scholar] [CrossRef] [Scilit]
- Sahito, F.; Zhiwen, P.; Sahito, F.; Ahmed, J. Transpose convolution based model for super-resolution image reconstruction. Appl. Intell. 2023, 53, 10574–10584. [Google Scholar] [CrossRef] [Scilit]
- Zhao, X.; Wang, L.; Zhang, Y.; Han, X.; Deveci, M.; Parmar, M. A review of convolutional neural networks in computer vision. Artif. Intell. Rev. 2024, 57, 99. [Google Scholar] [CrossRef] [Scilit]
- Bai, X.; Yang, M. UAV based accurate displacement monitoring through automatic filtering out its camera’s translations and rotations. J. Build. Eng. 2021, 44, 102992. [Google Scholar] [CrossRef] [Scilit]
- Bai, X.; Yang, M.; Ajmera, B. An advanced edge-detection method for noncontact structural displacement monitoring. Sensors 2020, 20, 4941. [Google Scholar] [CrossRef] [Scilit] [PubMed]
- Paszke, A. Pytorch: An imperative style, high-performance deep learning library. arXiv 2019, arXiv:1912.01703. [Google Scholar]
- Dong, H.; Du, Y.; Feng, D.; Hu, Q.; Zhou, M.; Xing, J.; Zhang, L.; Wang, S.; Liu, Y. CSegNet: A Crack Segmentation Network Combining CNN and Transformer. Res. Sq. 2024. preprint. [Google Scholar]
- Fan, H.; Yan, W.; Wang, L.; Liu, J.; Bin, Y.; Xia, J. Deep learning-based multi-functional therapeutic peptides prediction with a multi-label focal dice loss function. Bioinformatics 2023, 39, btad334. [Google Scholar] [CrossRef] [Scilit] [PubMed]
- Chang, H.; Rao, Z.; Zhao, Y.; Li, Y. Research on tunnel crack segmentation algorithm based on improved U-net network. Comput. Eng. Appl. 2021, 57, 215–222. [Google Scholar]
- Rahman, M.A.; Wang, Y. Optimizing intersection-over-union in deep neural networks for image segmentation. In Proceedings of the International Symposium on Visual Computing; Springer: Berlin/Heidelberg, Germany, 2016; pp. 234–244. [Google Scholar]



Disclaimer/Publisher’s Note: The statements, opinions and data contained in all publications are solely those of the individual author(s) and contributor(s) and not of MDPI and/or the editor(s). MDPI and/or the editor(s) disclaim responsibility for any injury to people or property resulting from any ideas, methods, instructions or products referred to in the content. |
© 2026 by the authors. Licensee MDPI, Basel, Switzerland. This article is an open access article distributed under the terms and conditions of the Creative Commons Attribution (CC BY) license.