


Abstract
Multi-output, single-switch, hard-switched Pulse-Width Modulated (PWM) converters suffer from high switching losses, which strictly limit their power density. To significantly reduce these losses, this work proposes a novel family of non-isolated multi-output DC-DC converters based on a quasi-resonant, single-switch cell operating in the megahertz (MHz) range. Sixteen configurations are derived to enhance power density and minimize component stress. A comprehensive analysis derives the fundamental analytical expressions for operation, switching conditions, and power flow. These expressions form the basis of a design tool that facilitates parametric component selection and optimization. The developed tool calculates voltage and current stresses, alongside power losses, using RMS current analysis and user-defined parameters such as ESR and semiconductor non-idealities. Finally, experimental results from prototypes operating at approximately 1 MHz in both full-wave and half-wave modes, with step-up and step-down capabilities, confirm the accuracy of the analytical design tool and the simulation model.
1. Introduction
Power electronic systems are continually evolving to meet the increasing demands for high efficiency, reduced size, and enhanced power density. Among various power conversion techniques, resonant DC-DC converters [1] have emerged as a key solution due to their ability to operate at high frequencies [2] while minimizing switching losses. These converters profit from soft-switching techniques, such as Zero-Voltage Switching [3] (ZVS) and Zero-Current Switching (ZCS), to achieve improved efficiency and reduced Electromagnetic Interference (EMI) [4].
A significant challenge in power conversion is the requirement for multiple output voltages within a single power supply. Most telecommunications, industrial automation, electric vehicles, and renewable energy systems’ power supplies require multiple voltage levels to power digital logic circuits, sensors, analog devices, and communication modules [5,6,7]. Conventional multiple-output solutions typically employ multiple converters [8,9,10] or isolated schemes [11,12,13], which increase system cost, footprint, and complexity.
Single-switch multi-output Quasi-Resonant Converters (QRCs) [14,15] offer a promising solution to these challenges. Despite higher conduction losses, they achieve high power density while maintaining multiple regulated outputs. Several existing works have addressed multi-output non-isolated DC-DC converters based on single-switch topologies such as [1,5,14]. However, these approaches either rely on hard-switching transitions or require complex modulation and control strategies. In contrast, the methodology proposed in this work uses a systematic combination [16] of soft-switching topologies to derive a family of converters that operate efficiently at MHz-range frequencies with reduced complexity. Unlike the work in [1], which employs Pulse-Width Modulated (PWM) based cells and lacks soft-switching capabilities, the proposed topologies in this paper exploit quasi-resonant behavior to achieve ZVS or ZCS conditions in both step-up and step-down modes, using only a main switch and without a transformer.
Traditional PWM converters suffer from high switching losses due to overlapping transitions in voltage and current waveforms [1,3]. These losses bound the practical switching frequency, affecting power density [17]. This leads to intensive research efforts aimed at pushing these limits. In this context, theoretical power density barriers have been identified for various converter topologies, for instance, up to approximately 28 kW/dm3 at 300 kHz for isolated DC-DC converters [18]. Soft-switching techniques mitigate these issues by shaping the voltage and current waveforms to enable switching transitions at zero voltage or zero current. Quasi-resonant converters achieve these soft-switching conditions [19] by incorporating an LC resonant tank, which modulates the main switch voltage and current waveforms. These converters can be classified into half-wave and full-wave configurations, depending on the operation mode of the resonant cycle.
In the context of QRCs, full-wave refers to a configuration in which both the positive and negative half-cycles of the resonant waveform are used for power conversion. This allows for continuous power transfer throughout the full cycle, typically resulting in better load regulation and higher frequency operation capability. On the other hand, a half-wave refers to a configuration that uses only one half-cycle of the quasi-resonant cycle to process the power. While this simplifies the design, it results in worse load regulation. The choice between full-wave and half-wave configurations depends on the application requirements, with full-wave converters being preferred for higher frequencies and power density. Unlike hard-switching, soft-switching topologies such as QRCs mitigate the high switching losses through resonant transitions, where the power semiconductors change conductive state at either zero voltage across their power terminals, Zero Voltage Switching (ZVS), or at zero current, Zero Current Switching (ZCS). Moreover, full-wave quasi-resonant operation has been shown to improve output voltage regulation under dynamic loading conditions compared to half-wave approaches [20,21].
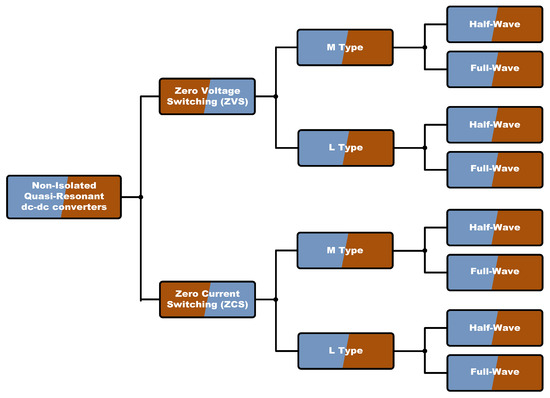
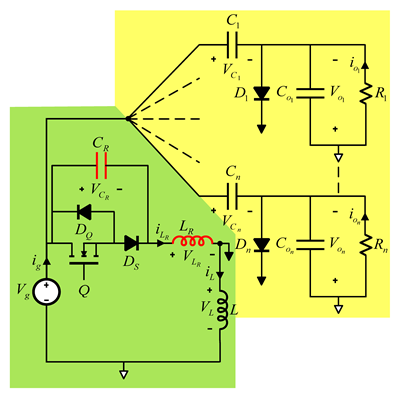
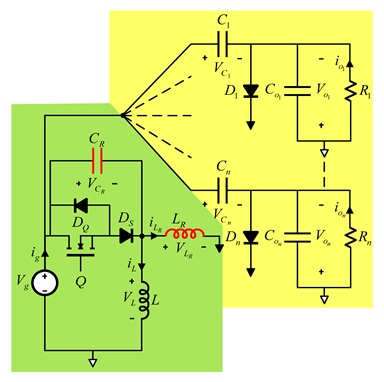
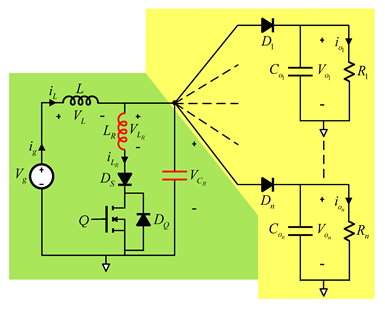
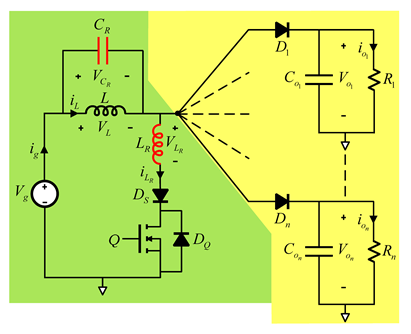
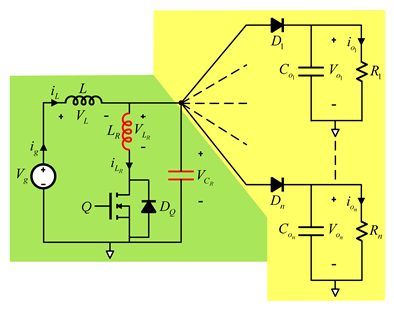
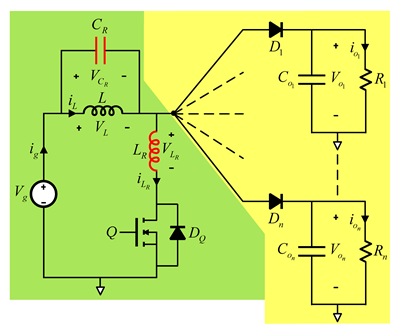
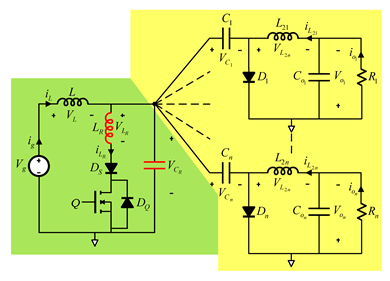
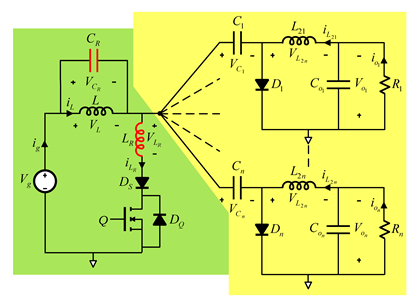
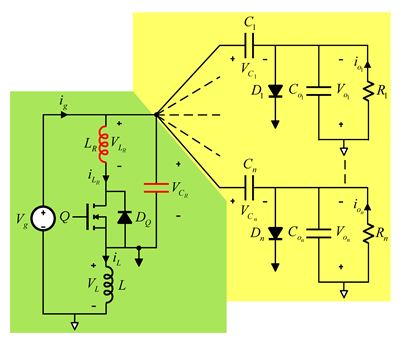
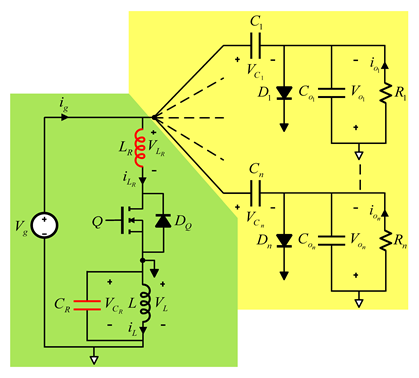
QRCs can also be classified into M-type and L-type based on the placement of their resonant tank. Before detailing the specific resonant combinations of the proposed family, Table 1 outlines the fundamental non-isolated topologies that serve as starting points. By evaluating their inherent advantages, disadvantages, and component stresses, this comparison justifies the subsequent selection and combination strategies. The location of the resonant tank components in both M-type and L-type is shown in Table 2 and Table 3. A brief classification of non-isolated QR DC-DC converters is summarized in Figure 1.
Table 1.
Main characteristics, advantages, and disadvantages of the fundamental non-isolated topologies.
Table 2.
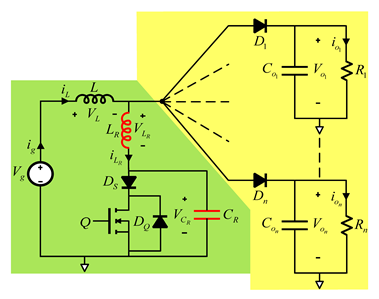
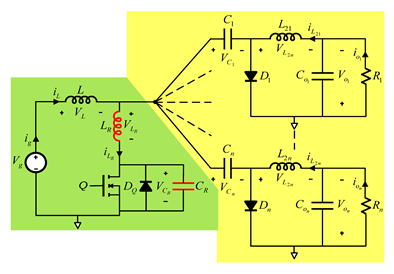
Integration Options for the Resonant Tank in Non-Isolated ZVS Resonant Power Converter Topologies. Resonant Elements Highlighted in Red.
Table 3.
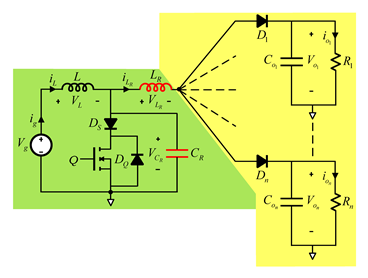
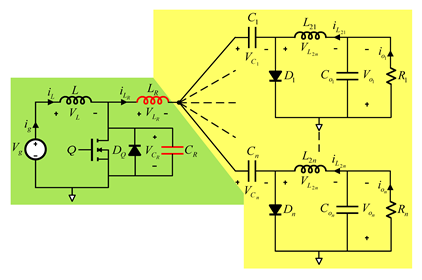
Integration Options for the Resonant Tank in Non-Isolated ZCS Resonant Power Converter Topologies. Resonant Elements Highlighted in Red.
Figure 1.
Non-Isolated QRC DC-DC converters classification.
While some industrial solutions, such as the LLC converter, offer excellent performance in isolated applications [22], they typically require transformer-based designs, multiple switches, and complex control [23]. In contrast, the proposed approach targets non-isolated multi-output systems, requiring hundreds of watts, compactness, soft-switching, MHz operation, and a single main switch, presenting an alternative for integration in power-dense environments such as LED drivers or embedded automotive electronics.
Building upon the advantages of QRCs, there is growing interest in extending their benefits to applications requiring multiple regulated output voltages. In this context, multi-output DC-DC converters can be broadly categorized into two groups:
- -
- Multiple-switch topologies: Utilize several switches for each output, increasing control complexity and component count.
- -
- Single-switch topologies: Share a main switch across multiple outputs, reducing the number of active components while maintaining high efficiency.
Although multiple output converters can follow any of these implementation schemes, single-switch QRC configurations are particularly attractive when the target is to obtain tightly coupled auxiliary rails without increasing switching complexity. This is especially relevant in the case of bipolar outputs, which are widely used in precision analog systems, such as op-amp front-end, data-acquisition modules, and instrumentation, where symmetric voltages improve linearity and noise performance. These bipolar voltages also suit gate-drive supplies for power switches (e.g., IGBT or SiC) that require both positive and negative biasing. In addition, such bipolar rails can support telecom and industrial applications, providing level-shifted bias for sensitive circuitry without needing extra regulators.
Several QRC topologies have been proposed in the literature to achieve soft-switching conditions and improve power conversion efficiency, including both zero-voltage switching (ZVS) and zero-current switching (ZCS) variants. Among them, full-wave and half-wave QRCs [1,24], as well as configurations employing frequency modulation for regulation [24], have been extensively studied. While these approaches enable soft-switching and reduced switching losses, they often suffer from limited scalability when multiple outputs are required, increased complexity due to duplicated control or switching stages, and a higher number of magnetic components [25]. Recent literature has extensively explored multi-output and multiport configurations [26]; however, these approaches typically introduce significant trade-offs. For instance, some solutions rely on multiple active switches to multiplex power for mixed-mode regulation [27], employ complex isolated forward transformers to decouple the output stages [28,29], rely on multi-port resonant topologies that demand complex hybrid modulation schemes [30], or utilize modular multilevel structures that drastically increase the overall component count [31]. These methods inevitably increase the physical footprint and control complexity. In this sense, a research gap exists for compact, non-isolated multi-output systems capable of operating efficiently in the MHz range with a single switch. This work addresses this gap by proposing a family of ZVS and ZCS single-switch quasi-resonant converters that prioritize power density and hardware simplicity over absolute component stress reduction. By minimizing the active component count, this approach serves as a streamlined alternative to recent multi-switch solutions. From this framework, a total of sixteen configurations is derived.
- The key advantages of these configurations include:
- i.
- Reduced switching losses due to soft-switching techniques.
- ii.
- Higher power density by enabling operation at elevated frequencies.
- iii.
- Lower electromagnetic interference (EMI) due to the absence of hard-switching transitions.
- iv.
- Simplified control by utilizing a single-switch operation for multiple outputs.
These benefits make single-switch multi-output QRCs an attractive solution for applications requiring compact and efficient power supplies. While QRCs inherently present higher voltage or current stresses on the main switch compared to multi-switch topologies (which naturally restricts their use in high power applications), their use in this multi-output context is justified for specific applications. The incorporation of the resonant tank enables high-frequency (MHz) operation due to soft-switching, which, combined with a simplified single-switch control scheme for bipolar outputs, makes them attractive for low-power, compact environments where component count and footprint minimization are critical.
The rest of this paper is organized as follows: Section 2 presents the combination strategy for new QRC multi-output topologies. Section 3 provides an analysis of the combined converter topologies, from which sixteen configurations are derived and introduces the analytical expressions that describe their operation, switching conditions, and power flow, providing the foundation for a design tool for component selection and optimization. Section 4 discusses the development of a MATLAB-based (R2025b version) design tool that implements the analytical expressions obtained, while Section 5 presents some simulation results that validate the previous analysis and show the converter’s performance. Section 6 details the experimental results, and finally, Section 7 provides some conclusions.
2. Combination Strategy for Exploration of New QRC Single-Input Multiple-Output Topologies
Innovative design strategies in multi-output QRCs can be achieved by combining established topologies that share a common switching cell. This approach not only simplifies the overall circuitry but also enhances performance by taking advantage of soft-switching techniques. In the following proposed designs, each combination supports eight distinct variants, divided between ZVS and ZCS. Each soft-switching method is further implemented in both full-wave and half-wave configurations, and within each, the design can be classified as either M type or L type [32]. From these combinations, a total of sixteen configurations are derived.
Table 2 and Table 3 present a classification of resonant tank integration possibilities for non-isolated quasi-resonant power converter topologies implementing ZVS and ZCS, respectively. Each table summarizes the integration of the resonant tank in the switching cell, derived from traditional topologies such as Buck, Boost, Buck-Boost, SEPIC, Cuk, Zeta and CSC, shown in each row [33,34,35]. The resonant tank elements—resonant inductor and capacitor—are highlighted in red. While the resonant tank remains common within each row, the output stage corresponds to the traditional topology associated with each configuration.
The classification into Class 1 (Boost, Cuk, SEPIC) and Class 2 (Buck-Boost, Zeta, CSC) is based on the shared characteristics of the switching cell. Class 1 topologies are more suited for grounded-switch configurations and yield both positive and negative outputs with simpler gate drive requirements. Bipolar outputs class 2 topologies, in contrast, require a floating main switch. Although the examples shown involve topologies from the same class, combinations across classes (e.g., Cuk-Zeta) are also possible. However, these combinations may require additional isolation considerations in the output stages, as not all outputs can share the same ground reference. In such cases, at least one of the outputs must be referred to a floating ground, which increases the complexity of the layout and the control circuitry.
The classification of the resonant tank as M type or L type is closely related to the location of the resonant capacitor or resonant inductor. In ZCS configurations, the resonant inductor must always remain in series with the main switch to ensure zero current switching and achieve soft-switching conditions. Therefore, in ZCS, the distinction between M-type and L-type is related to the relative position of the resonant capacitor. In ZVS configurations, the resonant capacitor must always remain in parallel with the main switch to enable zero-voltage conditions during turn-on. Therefore, in ZVS, the distinction between M-type and L-type is related to the relative position of the resonant inductor. This difference is illustrated in Table 2 and Table 3, which show the M-type and L-type variants for ZVS and ZCS configurations, respectively, along with the specific placement of each resonant component.
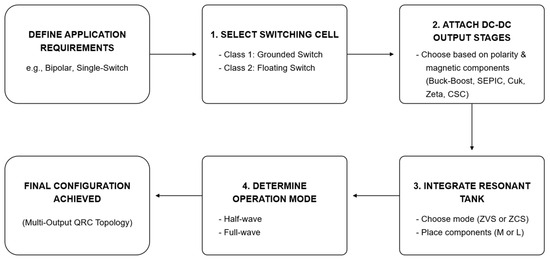
The generalization of the proposed derivation process is summarized in Figure 2. The procedure begins by selecting a shared switching cell (Class 1 or 2) and attaching the required output stages. Next, the resonant tank is integrated based on the desired soft-switching mode (ZVS/ZCS) and component placement (Type M/L). Finally, selecting the operational wave mode (half/full wave) yields the complete combined configuration.
Figure 2.
Proposed workflow for the systematic combination and design of multi-output quasi-resonant converters based on application requirements.
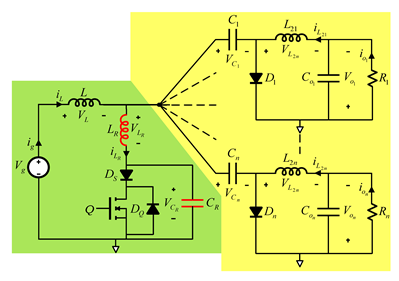
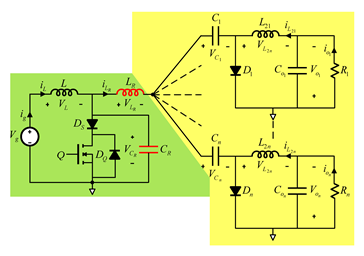
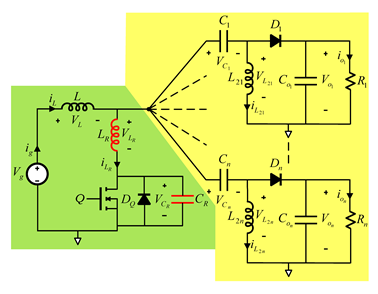
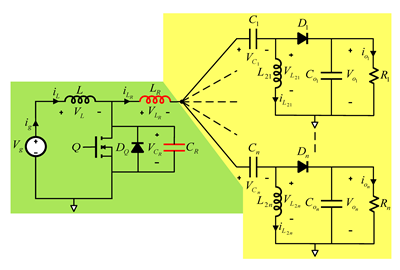
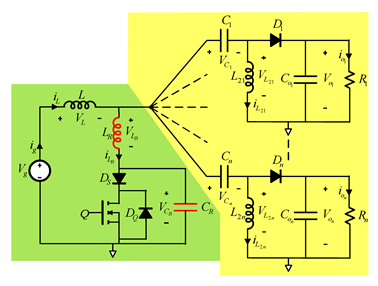
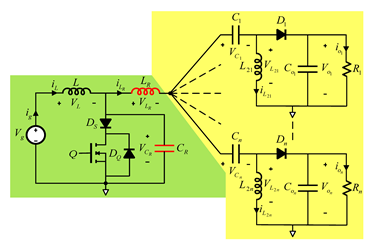
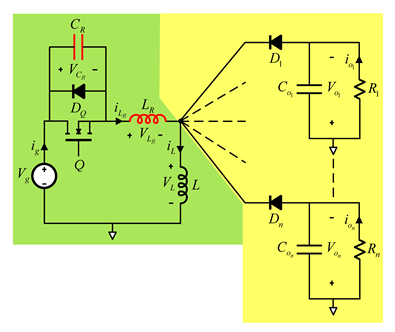
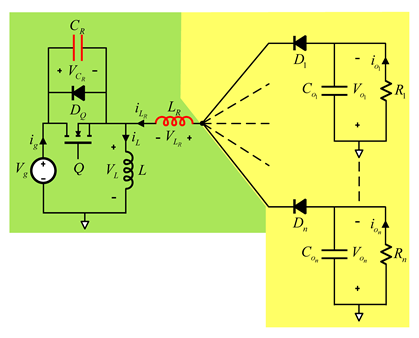
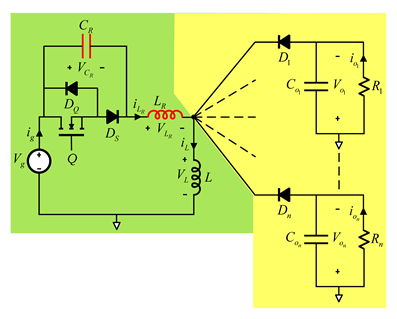
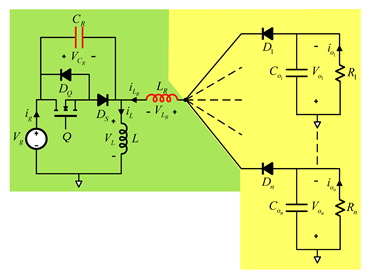
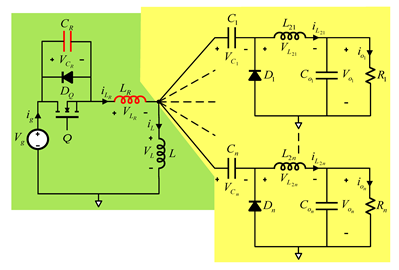
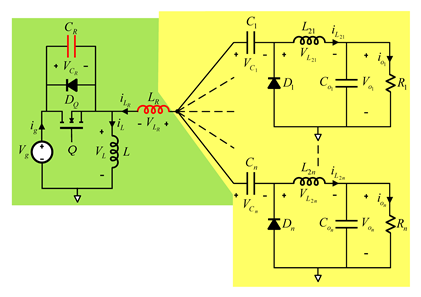
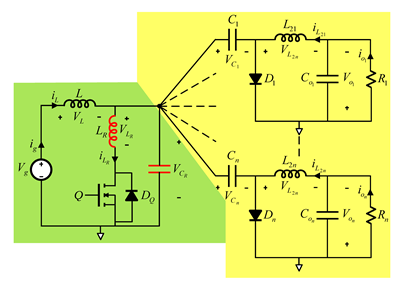
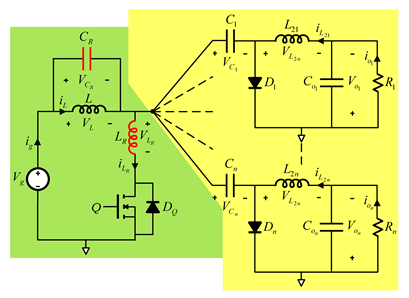
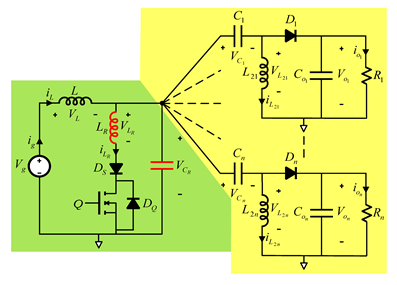
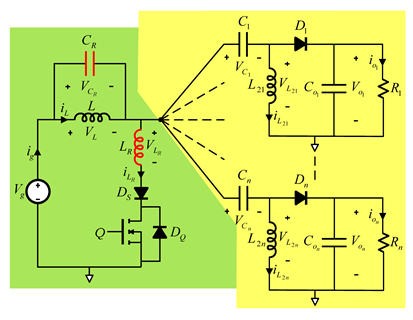
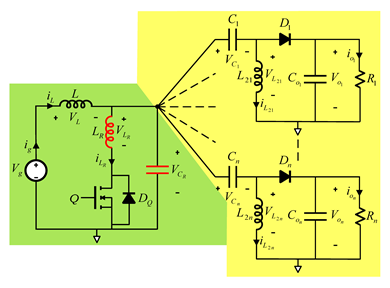
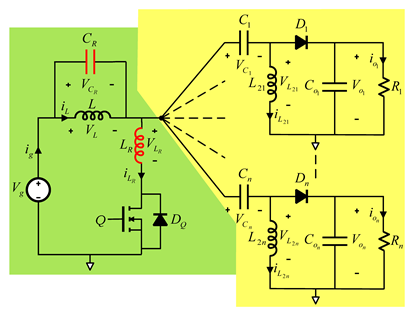
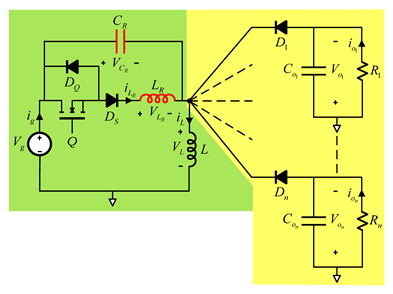
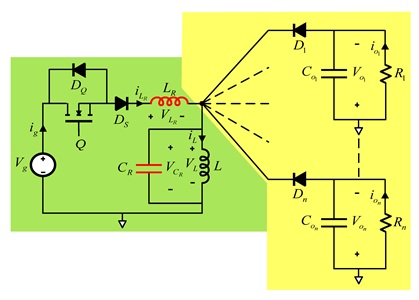
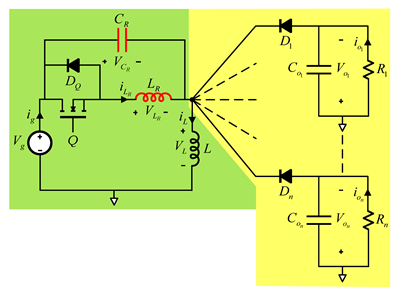
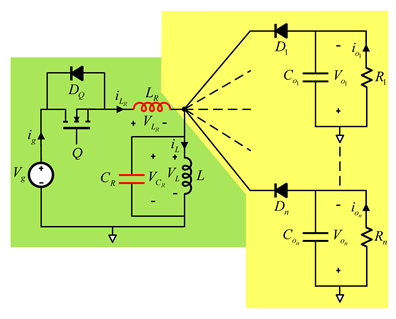
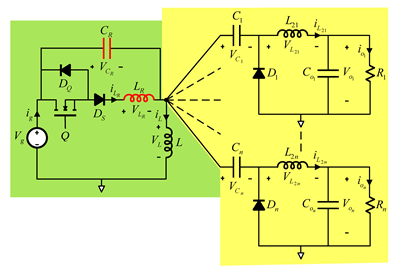
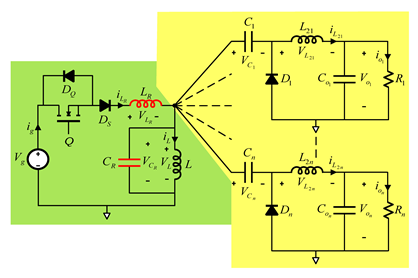
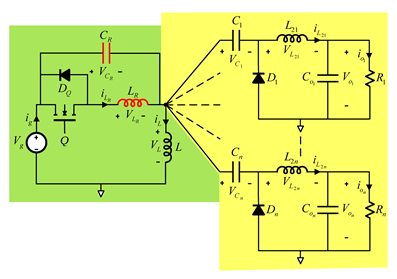
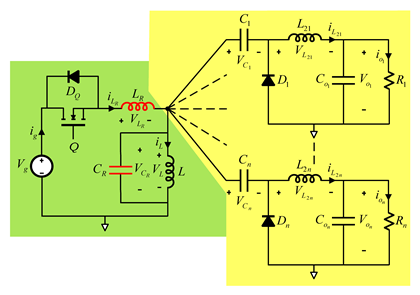
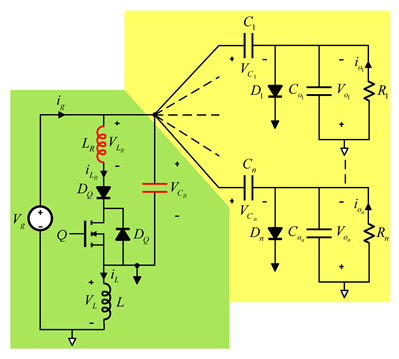
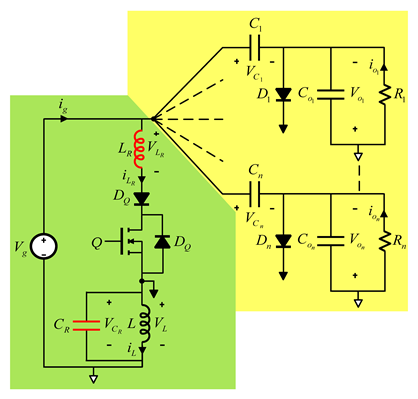
Based on the integration strategy described, three representative classification examples are presented for the generation of bipolar output voltages. This work focuses on bipolar output configurations, although the same approach could be extended to obtain multiple non-bipolar outputs as well. The selected combinations are SEPIC–Cuk, Zeta–Buck/Boost, and Zeta–CSC. Each combination leads to eight possible variants; however, only the four full-wave versions are depicted in Figure 3, Figure 4 and Figure 5, including both ZVS and ZCS implementations, as well as the so-called Type M and Type L arrangements. The corresponding four half-wave versions can be derived by either adding (ZCS) or removing (ZVS) a diode (Ds) that blocks the body diode of the main switch, as can be observed in Table 2 and Table 3, following the same resonant tank integration principles.
Figure 3.
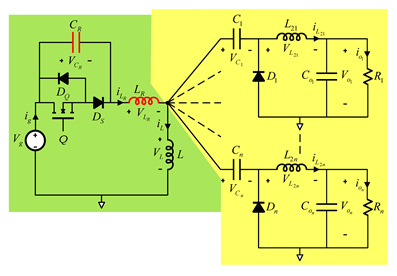
Combined SEPIC–Cuk Full-wave QR Converters. (a) ZVS M type (b) ZCS M type. (c) ZVS L type (d) ZCS L type.
Figure 4.
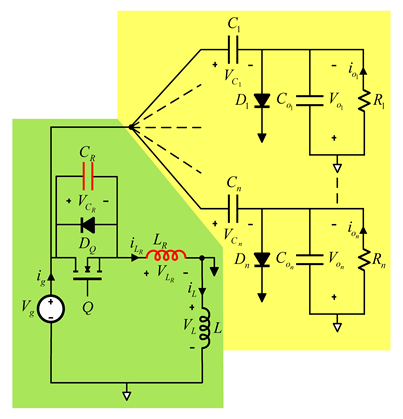
Combined Zeta–Buck/Boost Full-wave QR Converters. (a) ZVS M type (b) ZCS M type. (c) ZVS L type (d) ZCS L type.
Figure 5.
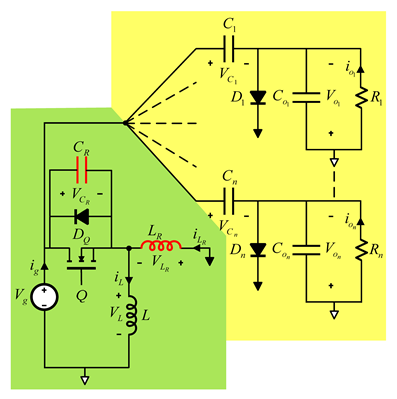
Combined Zeta–CSC Full-wave QR Converters. (a) ZVS M type (b) ZCS M type. (c) ZVS L type (d) ZCS L type.
2.1. SEPIC–Cuk Combined Converter
SEPIC and Cuk are buck-boost DC-DC converter topologies allowing step-up and step-down voltage conversion. Their main difference lies in the output polarity: the SEPIC converter maintains the same polarity between the input and output, while the Cuk converter inverts the output polarity. Additionally, SEPIC has a continuous input current, which reduces ripple and EMI, whereas Cuk features continuous currents at both the input and output, making it suitable for sensitive loads and sources. The front-end switching cell is common in both topologies, leading to a combined converter that provides both non-inverted and inverted output voltages from a single input voltage source and a single grounded switch. This makes the SEPIC–Cuk combination advantageous for low-power (<500 W) applications requiring symmetrical voltage supplies using a simple design. The SEPIC–Cuk variants are shown in Figure 3.
2.2. Zeta–Buck/Boost Combined Converter
Zeta and Buck/Boost, like the SEPIC and Cuk combination, allow both step-up and step-down voltage conversion while providing bipolar output voltage. The Zeta converter supplies a non-inverted output with continuous input and output current, reducing ripple and conducted emissions, while the Buck/Boost converter delivers an inverted output with a discontinuous output current, requiring a high-quality output capacitor. The front-end switching cell is common in both topologies, leading to a combined converter that generates both positive and negative output voltages from a single input source. Unlike the previous combination, this topology’s shared switching cell uses a floating switch instead of a grounded one, adding complexity to the gate drive design. This configuration is suitable for applications that require bipolar voltage supplies with a compact design and minimal components [36]. The Zeta–Buck/boost variants are shown in Figure 4.
2.3. Zeta–CSC Combined Converter
The Zeta–CSC combination integrates the versatile voltage regulation of the Zeta converter with a Canonical Switching Cell (CSC) [37]. This approach profits from the inherent robustness and simplified design afforded by the canonical switching cell, also making it suitable for multi-output applications. Consistent with the other combinations, the Zeta–CSC combined converter supports both step-up and step-down modes. The CSC converter provides the inverted output, while the Zeta converter provides a non-inverted output with continuous input and output current. The Zeta–CSC variants are shown in Figure 5.
These three example combinations demonstrate how a common switching cell can be utilized to develop multi-output QRCs with extensive design flexibility. By offering variants that highlight simple implementation, reduced electromagnetic interference, or overall design simplicity, this approach provides a new alternative for high-frequency applications requiring enhanced power density. Table 4 provides a comprehensive comparison of the characteristics of the proposed single-switch multi-output QRCs, highlighting the advantages and trade-offs of each combination and offering valuable insights for selecting the most suitable topology for specific applications. It summarizes several key parameters for the three exemplified bipolar QR configurations, serving as a practical reference for application-oriented design decisions. In the configurations shown in Figure 3c and Figure 4c (ZVS L type), the resonant inductor (LR) is connected in series with link capacitors C1 and C2. In contrast, in Figure 3a, Figure 4a and Figure 5a, the same resonant inductor is placed in series with the main switch (Q) and the resonant capacitor (CR), while in Figure 3b,d, Figure 4b,d, and Figure 5b,d, the resonant inductor is connected in series only with the main switch (Q). The main consequence of this different arrangement is that, under the same operating conditions, the average current (DC) through the resonant inductor is zero (Figure 3c and Figure 4c), while in the remaining configurations, it is proportional to the input current. This characteristic provides an advantage for the topologies shown in Figure 3c and Figure 4c, as it allows the use of magnetic cores in the resonant inductor with lower saturation limits and a wider dynamic range, due to the absence of a DC component. Similarly, in the configurations shown in Figure 3d, Figure 4d and Figure 5d (ZCS L type), the resonant capacitor (CR) is connected in parallel with the input inductor (L1). In contrast, in Figure 3b,c, Figure 4a,c and Figure 5a,c, the resonant capacitor is connected in parallel with the main switch (Q) and the blocking diode (DS), while in Figure 3b, Figure 4b and Figure 5b, it is connected in parallel with both the main switch and the resonant inductor (LR). As a result of these different configurations, the average voltage (DC component) across the resonant capacitor is zero in Figure 3d, Figure 4d and Figure 5d, while in the other cases it is proportional to the input voltage. This difference is important when sizing the capacitor in terms of voltage stress, enhancing its suitability for each specific application. Overall, the advantages and limitations of each configuration must be carefully evaluated in the context of the application. ZCS converters subject the main switch to a peak current significantly higher than its average value, while ZVS converters subject the main switch to a peak voltage higher than its average level. These characteristics establish trade-offs between the two approaches, determining their relative suitability for different operating conditions and design constraints.
Table 4.
Analysis of the characteristics of each proposed Single-Input Bipolar-Output QR combined converter.
Based on the structural characteristics and operational constraints summarized in Table 4, the optimal configuration can be determined according to the application. For instance, the analysis shows that the SEPIC–Cuk combination inherently provides a grounded switch configuration; this simplifies the gate drive implementation while maintaining a low input current ripple. Conversely, the Zeta–Buck/Boost combination requires an isolated high-side driver due to its floating switch, but it effectively reduces the magnetic component count to only two filter inductors, thereby optimizing the physical footprint. Finally, the Zeta–CSC combination represents an intermediate topological solution, leveraging the robust voltage regulation of the canonical switching cell with a moderate component count and medium transient response capabilities. Following this approach, this section has defined the structural derivation and the main operational trade-offs of the proposed multi-output configurations.
3. Analysis of the Combined Converters Topologies, Principles and Modes of Operation
The objective of this section is to analyze the steady-state operation, determine the switching intervals, and define the limits required to maintain soft-switching across the proposed topologies. The analysis is generalized to include the proposed topologies, considering that there are common aspects among them. While each topology has its own particularities, their fundamental behavior can be studied under a unified framework. This approach will allow for a systematic comparison of their performance and help identify the key factors influencing efficiency. Since the analysis considers multiple outputs, it is necessary to define the Equivalent Load Resistance (Req) used in the expressions and defined in Equation (1). This equivalent load, Req, is an abstraction representing the total equivalent impedance seen by the resonant tank from the input perspective. It is formulated under the premise of providing symmetrical bipolar outputs (Vo+ = |Vo−|). This abstraction accounts for the combined power processed by the converter, allowing a generalized study of the energy transfer within the resonant tank, regardless of whether the individual connected loads (RLoad1, RLoad2) are asymmetrical.
This equivalent load accounts for the combined power processed by the converter, allowing a generalized study of the resonant tank regardless of whether the specific output voltages and individual loads are asymmetrical.
The strategy for the analysis will be to divide the operation into time intervals, defined by the state transitions of the semiconductors. This segmentation allows for a clear understanding of how energy is processed and transferred throughout the switching cycle. Despite differences in topology, whether half-wave or full-wave operation, or between ZVS and ZCS implementations, the behavior can be generalized into four distinct intervals, considering ideal components (currents through filter inductors and capacitors voltages stay relatively constant during a switching period (TS), zero voltage drops, zero reverse currents, zero switching times, zero parasitic capacitors) and that the final conditions of one interval correspond to the initial conditions of the next interval. In this sense, the initial conditions at t0 are:
The cycle starts when Q turns off, with DS, D1, and D2 also being off.
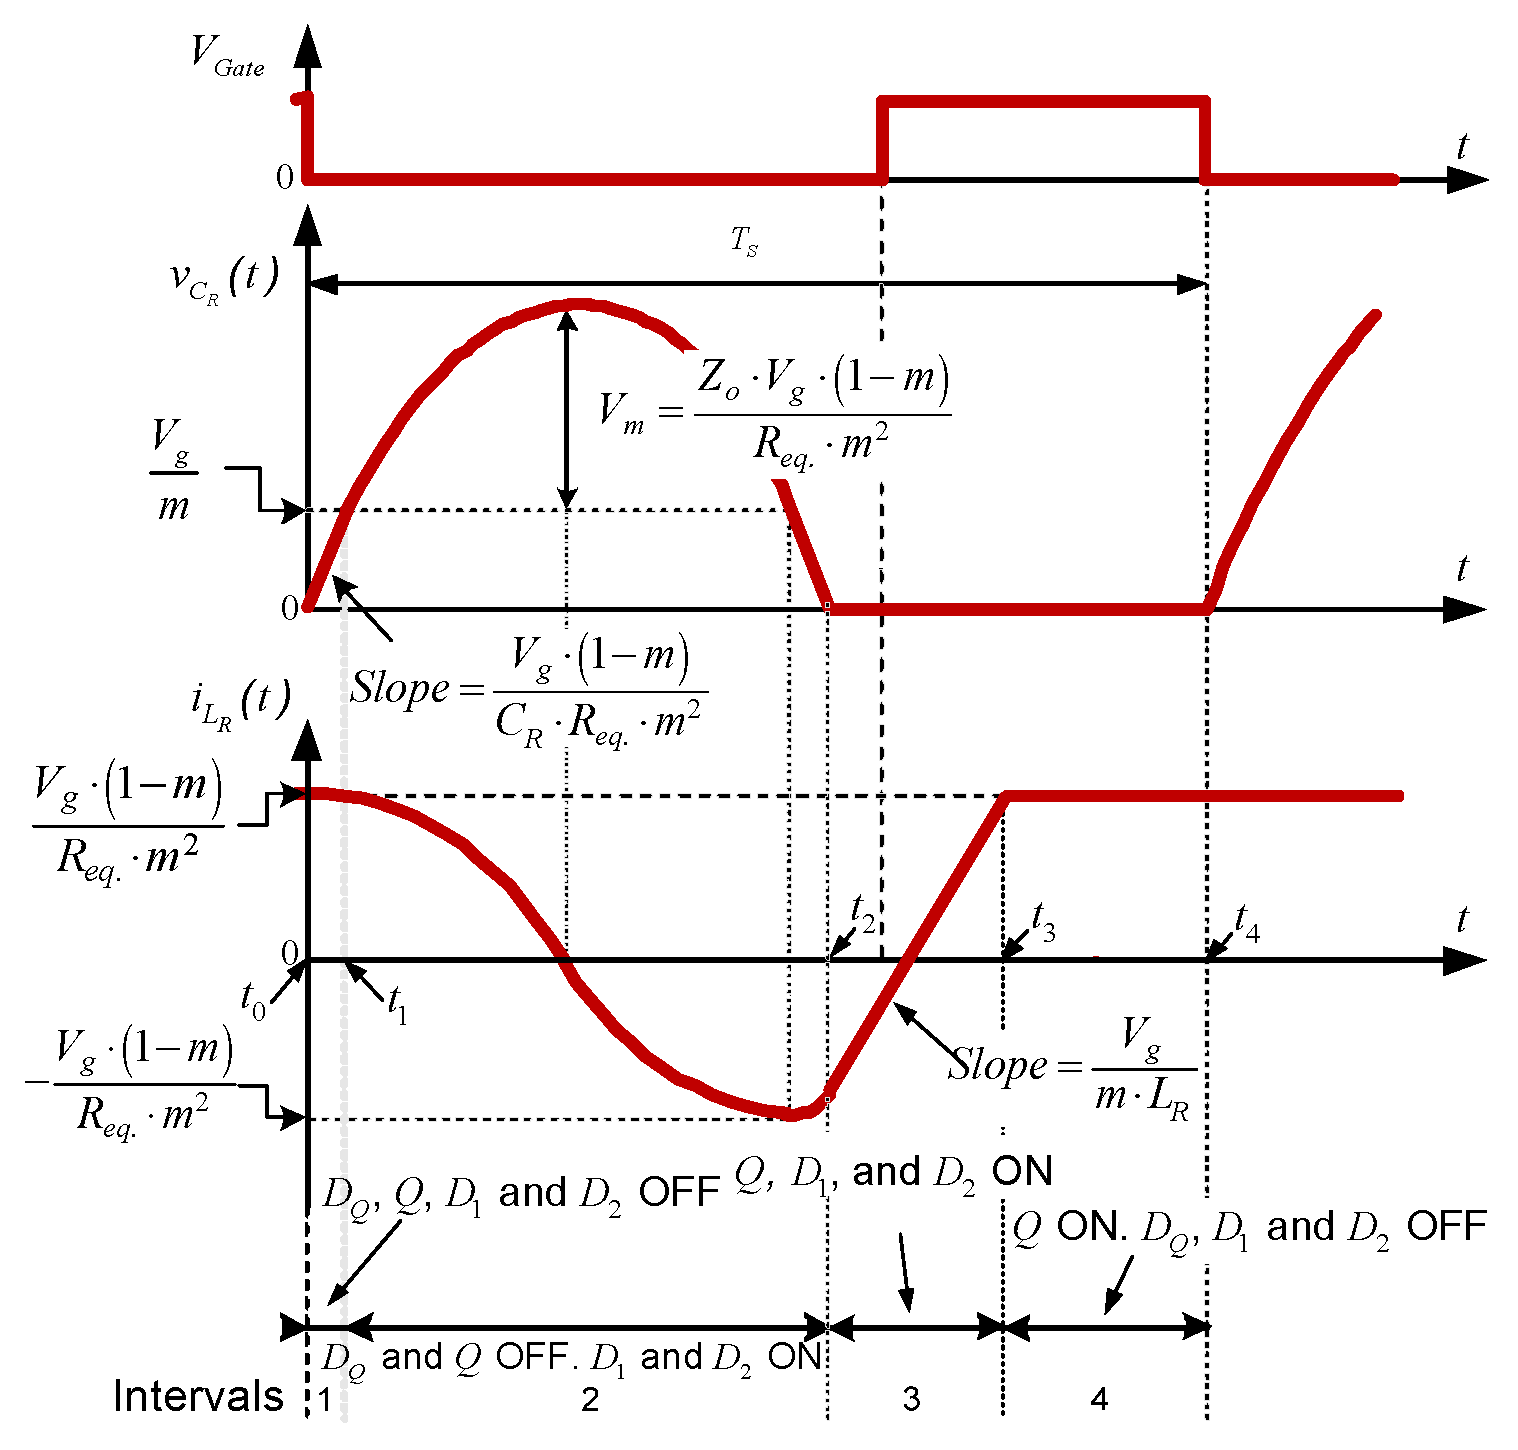
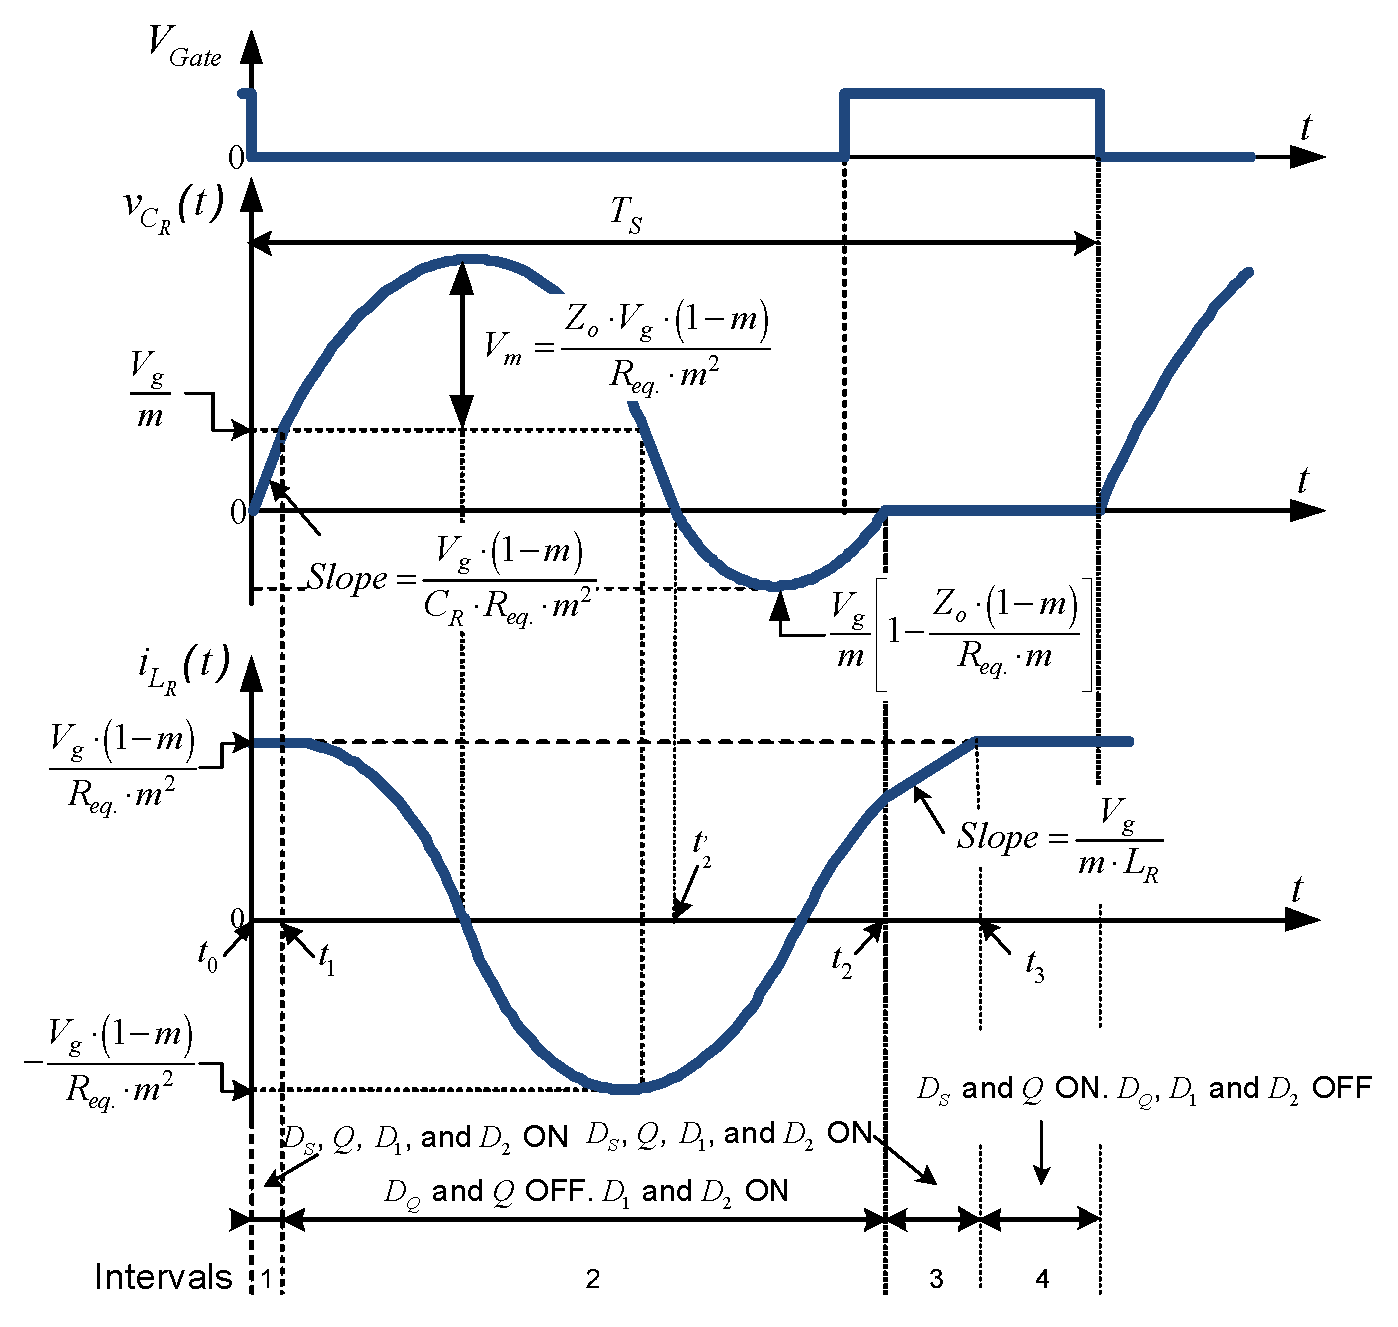
The first interval (t1 − t0 in Table 5 and Table 6 and Figure 5 and Figure 6) corresponds to the linear charging of the resonant tank. During this phase, energy is supplied to the resonant inductor, storing it as magnetic energy while the voltage across the resonant capacitor starts building up. This interval sets the initial conditions for the subsequent resonant behavior.
Table 5.
Interval time duration and soft-switching condition of the quasi-resonant combined converters in half-wave operation mode for M and L type variants.
Table 6.
Interval time duration and soft-switching condition of the quasi-resonant combined converters in full-wave operation mode for M and L type variants.
Figure 6.
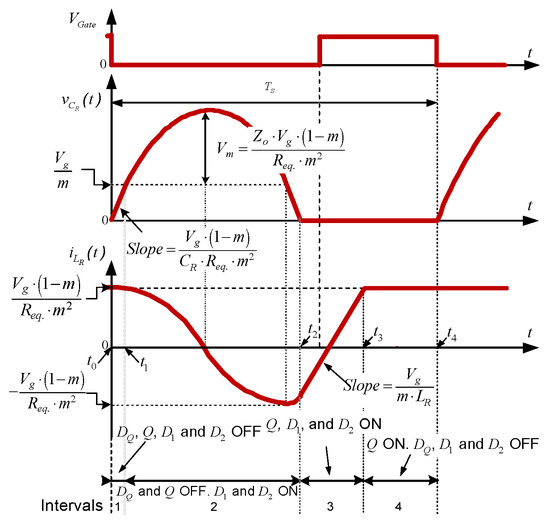
Half-wave waveforms of voltage in the resonant capacitor and current in the resonant inductor as a function of m parameter, Req and Vg.
The second interval (t2 − t1 in Table 5 and Table 6 and Figure 5 and Figure 6) is the resonant action stage. The current flows through the resonant tank, leading to the formation of oscillatory waveforms. This stage is critical for ensuring soft-switching conditions and minimizing switching losses. The nature of the resonant action depends on the topology, but the fundamental behavior remains similar across different implementations.
Once the resonant action has taken place, the third interval (t3 − t2 in Table 5 and Table 6 and Figure 5 and Figure 6) is responsible for discharging the inductor. This occurs through the output diodes, which remain forward-biased, allowing energy transfer to the load. The duration and effectiveness of this phase determine the power delivery efficiency and the output voltage regulation.
In the fourth interval (t4 − t3 in Table 5 and Table 6 and Figure 6 and Figure 7), a passive phase takes place. The output diodes become reverse-biased, preventing further conduction. At this stage, all state variables remain almost constant until the main switch is activated again, restarting the cycle. This passive interval plays a crucial role in defining the steady state behavior of the circuit and ensuring proper switching timing.
Figure 7.
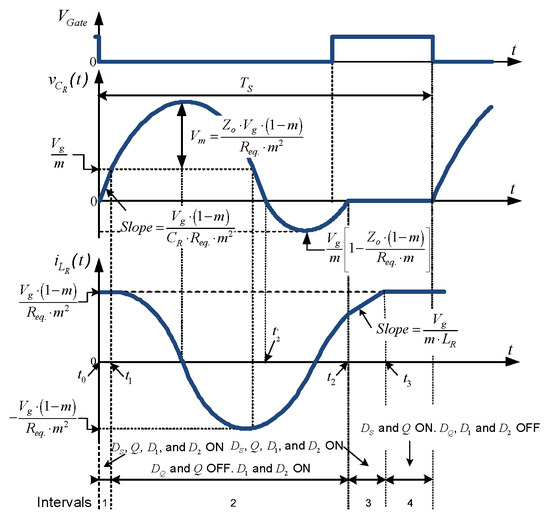
Full-wave waveforms of voltage in the resonant capacitor and current in the resonant inductor as a function of m parameter, Req and Vg.
The time interval expressions for each switching stage have been derived for both half-wave and full-wave modes. The analysis presented in reference [20] for a ZVS half-wave configuration has been followed, leading to the expressions shown in Table 5. The same approach has also been applied to derive the time interval expressions for the ZVS full-wave configuration [21], which are summarized in Table 6. Likewise, the same strategy as in those references has been followed to obtain the time intervals for the ZCS configurations, which are also included in Table 5 and Table 6. These expressions have been formulated in terms of the equivalent resistance and m parameter, as defined in Equations (1) and (2).
To provide the operating characteristics of the quasi-resonant converters, the analytical expressions derived for key parameters are presented. These expressions quantify the dynamic behavior of the resonant components. Specifically, Figure 6 and Figure 7 depict the half-wave and full-wave waveforms, respectively, of the voltage across the resonant capacitor and the current through the resonant inductor, shown together with the gate excitation signal. These figures visually capture the maximum and minimum values, slopes, and temporal intervals obtained directly from the analytical expressions, showcasing the relationship between these critical waveforms and the system-defining parameters, including the m parameter, Req and Vg.
The expressions shown in Table 5 and Table 6 and depicted waveforms in Figure 6 and Figure 7 come from considering four equivalent circuits established for each of the four intervals analyzed. These are shown in Figure 8, Figure 9 and Figure 10 for the configurations ZVS full-wave SEPIC–Cuk combination (Figure 3a), Zeta–Buck/Boost combination (Figure 4a) and Zeta–CSC combination (Figure 5a), including the m parameter, Req and Vg. To derive the steady-state mathematical model and the switching intervals, the following assumptions are established: First, the voltages across the link (C1 and C2) and output (C+o and C−o) capacitors, as well as the currents through the filter inductors (L1, L2 and L3), are considered constant over a switching period TS due to sufficiently large inductive and capacitive values. Second, all semiconductors (the main switches and diodes) are considered as ideal components, supposing zero forward voltage drops, zero reverse recovery currents, negligible parasitic capacitances, and instantaneous switching times. While these assumptions simplify the derivation of the theoretical time intervals, non-idealities (such as semiconductor losses, forward voltage drops, and components’ ESRs) are subsequently incorporated into the proposed MATLAB design tool and simulations to accurately estimate the converter’s physical performance and efficiency. Consequently, the scope of validity for this analytical model is strictly bounded: in terms of load and frequency, it is valid within the theoretical limits Rmax for ZVS, Rmin for ZCS) required to maintain soft switching.
Figure 8.
Equivalent circuits of the ZVS-QR M-type SEPIC–Cuk full-wave combined converters during a switching period, as a function of the m parameter, Req and Vg.
Figure 9.
Equivalent circuits of the ZVS-QR M type Zeta–Buck/Boost full-wave combined converters during a switching period, in function of m parameter, Req and Vg.
Figure 10.
Equivalent circuits of the ZVS-QR M type Zeta–CSC full-wave combined converters during a switching period, in function of m parameter, Req and Vg.
Within these theoretical limits, the steady-state voltage conversion ratios (Vo/Vg) for all the proposed multi-output combinations have been derived and are summarized in Table 7. These expressions define the ideal step-up or step-down/step-up relationships based on the equivalent load (Req) and the resonant tank’s characteristic impedance. However, as previously established with mathematical model assumptions, the maximum achievable voltage gain in a physical implementation will be inherently clamped by the parasitic elements (e.g., diode drops, switch conduction resistance and components’ ESRs).
Table 7.
Conversion relations for bipolar-output-type ZCS and ZVS quasi-resonant converter combinations.
In the family of converters described, ZVS-QR converters are generally more widely used than ZCS-QR converters, mainly due to the parasitic capacitance associated with the main switch Q, which can be integrated as part of the required resonant capacitor. In contrast, for ZCS-QR converters, the energy stored in the parasitic capacitance of the main switch Q is dissipated directly within the main switch itself during conduction, which can lead to less efficient operation. In terms of configuration types, both L-type and M-type exhibit similar behavior. However, the resonant capacitor CR in M-type configurations is subjected to a lower peak voltage, although it remains bipolar. One of the key advantages of L-type ZCS-QR converters is that, in certain configurations, the resonant capacitor CR can be effectively associated with the parasitic capacitance of the diode DQ, which further enhances the efficiency of the system.
4. Development of a MATLAB-Based Design Tool
To facilitate the design and optimization of the proposed quasi-resonant converter family, a dedicated MATLAB-based tool has been developed. This tool integrates the analytical expressions derived from the analysis of the different topologies, allowing for the calculation of the time intervals, maximum voltage and current stress that each component must withstand. Additionally, it provides a detailed loss analysis based on user-defined component parameters, such as Equivalent Series Resistance (ESR), diode forward voltage drops or/and/or on-state resistance of the main switch, based on datasheets provided by manufacturers.
The tool uses prior extensive studies of the Root Mean Square (RMS) currents through each component, enabling precise loss estimations [38]. A similar dynamic loss analysis and efficiency estimation has been carried out in [39], where the RMS currents and component losses are thoroughly analyzed. The design tool supports the proposed converter variants, including ZVS/ZCS techniques, full-wave/half-wave operation modes, and single or multi-output designs. By requesting key design parameters from the user, such as input voltage, desired output voltage, load conditions, and values of parasitic quantities in components, the tool performs calculations using the analytical equations governing the converter’s behavior and shows the breakdown losses.
Table 8 presents an example of the power losses expressions for ZVS full-wave M-type configurations. The tool also includes the corresponding expressions for all other combined topologies. Assuming that the filter inductors have been properly designed, the current ripple through these inductors is considered negligible. As a result, the RMS current is assumed to be equivalent to the average current in the filter inductors. The design of the filter inductors has been carried out following the methodology described in reference [20]. This tool presents several key features that enhance its usability. Firstly, it determines the voltage and current stress that each component withstands, providing the user with critical information for component selection. Additionally, it includes a loss distribution analysis, generating a pie chart that visually represents how different components contribute to the overall power dissipation. To assist efficiency estimation of the converter, it computes and represents power maps and the expected efficiency, offering insight into the theoretical efficiency based on the given parameters.
Table 8.
Expressions to calculate power loss in each component. Example for ZVS full-wave M-type topologies.
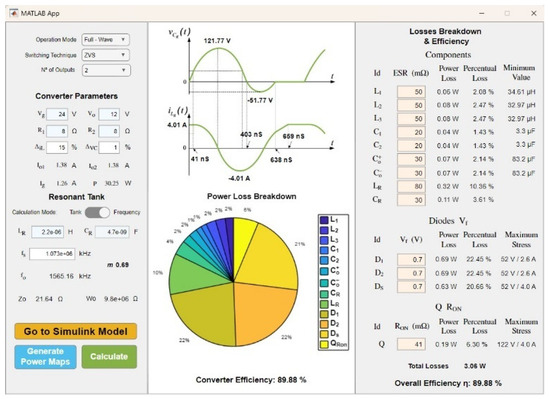
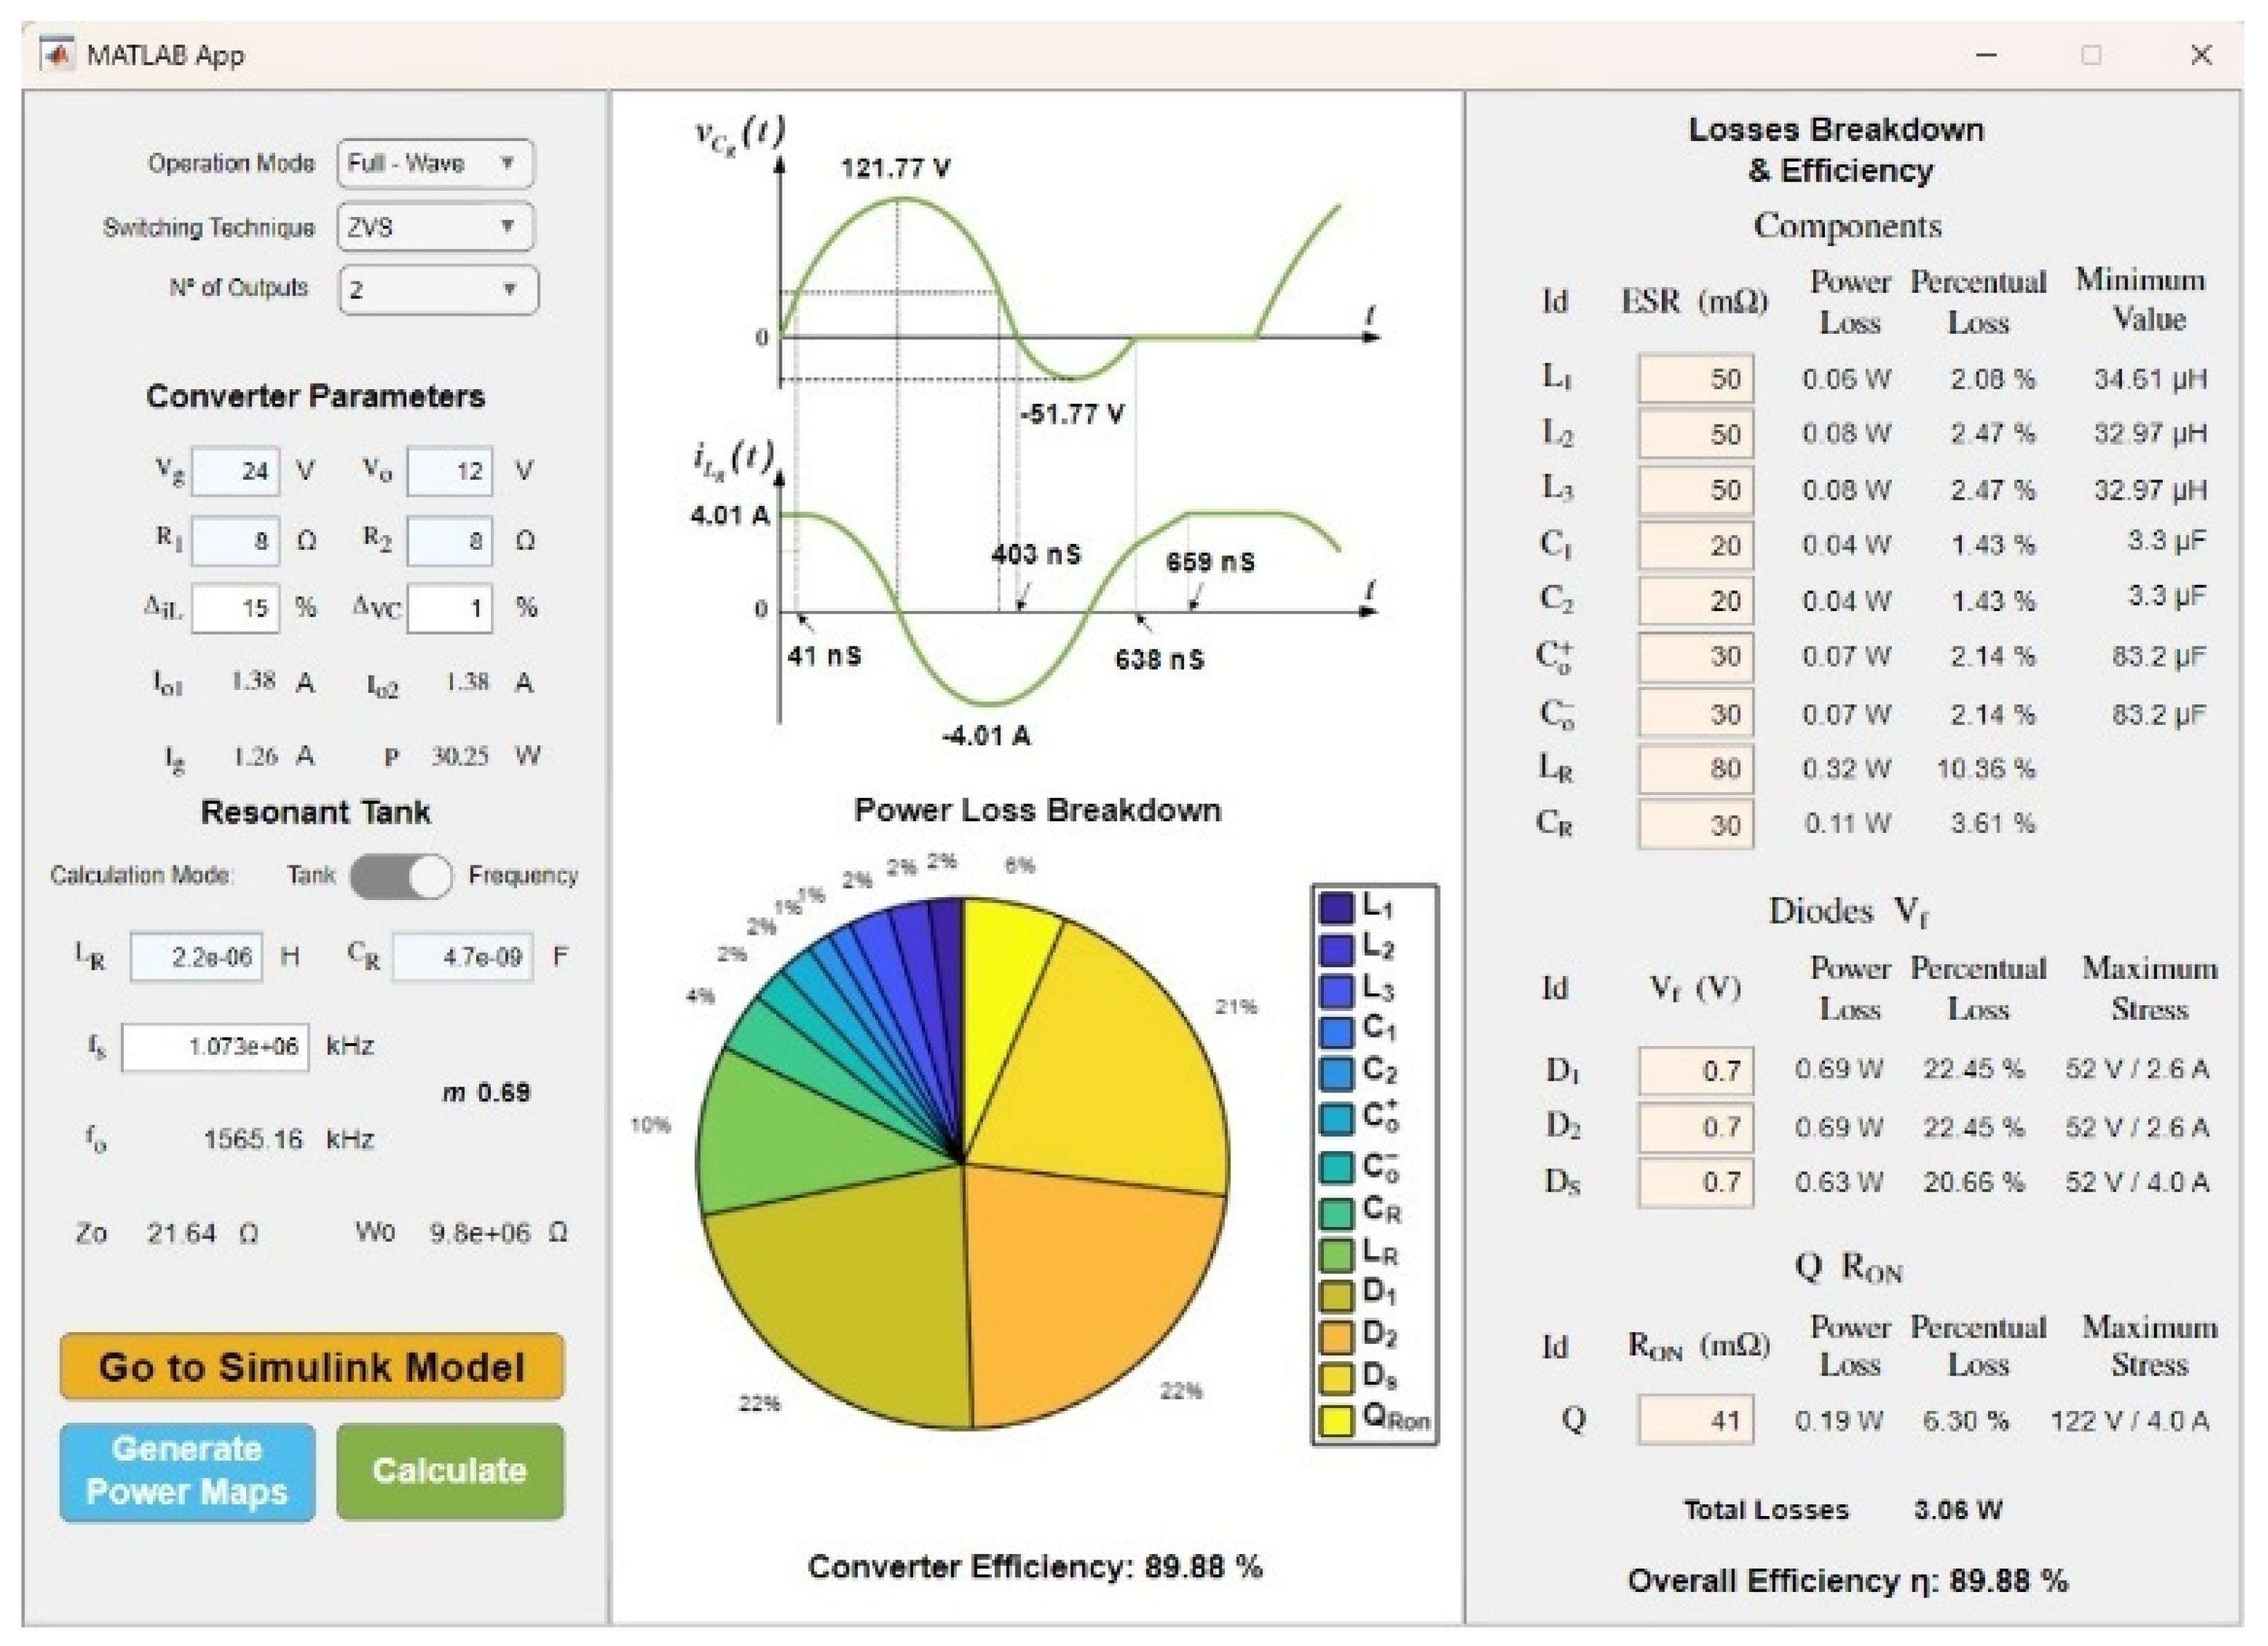
The interface of the design tool is shown in Figure 11, featuring example data for a combined bipolar-output M-type configuration operating in full-wave mode. The main screen is divided into 3 panels. The left panel allows the user to set operating parameters, select the configuration type, launch the calculations, link the results to a Simulink model, and generate power maps. The central panel displays the maximum and minimum voltage and current values of the resonant tank, the timing of each operational interval, and a pie chart of the loss distribution, computed using the ESR values entered in the right panel. In the right panel, the tool calculates the power dissipation in each component, provides overall efficiency, shows the minimum sizing values for the filter components, and reports the maximum stress levels on the semiconductors. Moreover, since all calculations rely on analytical expressions, this tool takes a few seconds of computing time to obtain the results, rather than iterative numerical methods, making it a faster alternative to conventional simulations. Additionally, it incorporates a simulation option that links with a Simulink model, which also includes parasitic components. This allows users to compare the tool’s analytical results with numerical simulations.
Figure 11.
Front-end of the developed MATLAB-based tool using the analysis of the Non-Isolated QRC DC-DC combined converters. Pie chart percentages are rounded to the nearest integer for readability. Exact values are detailed in the right panel.
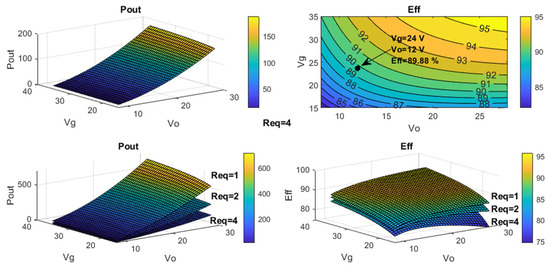
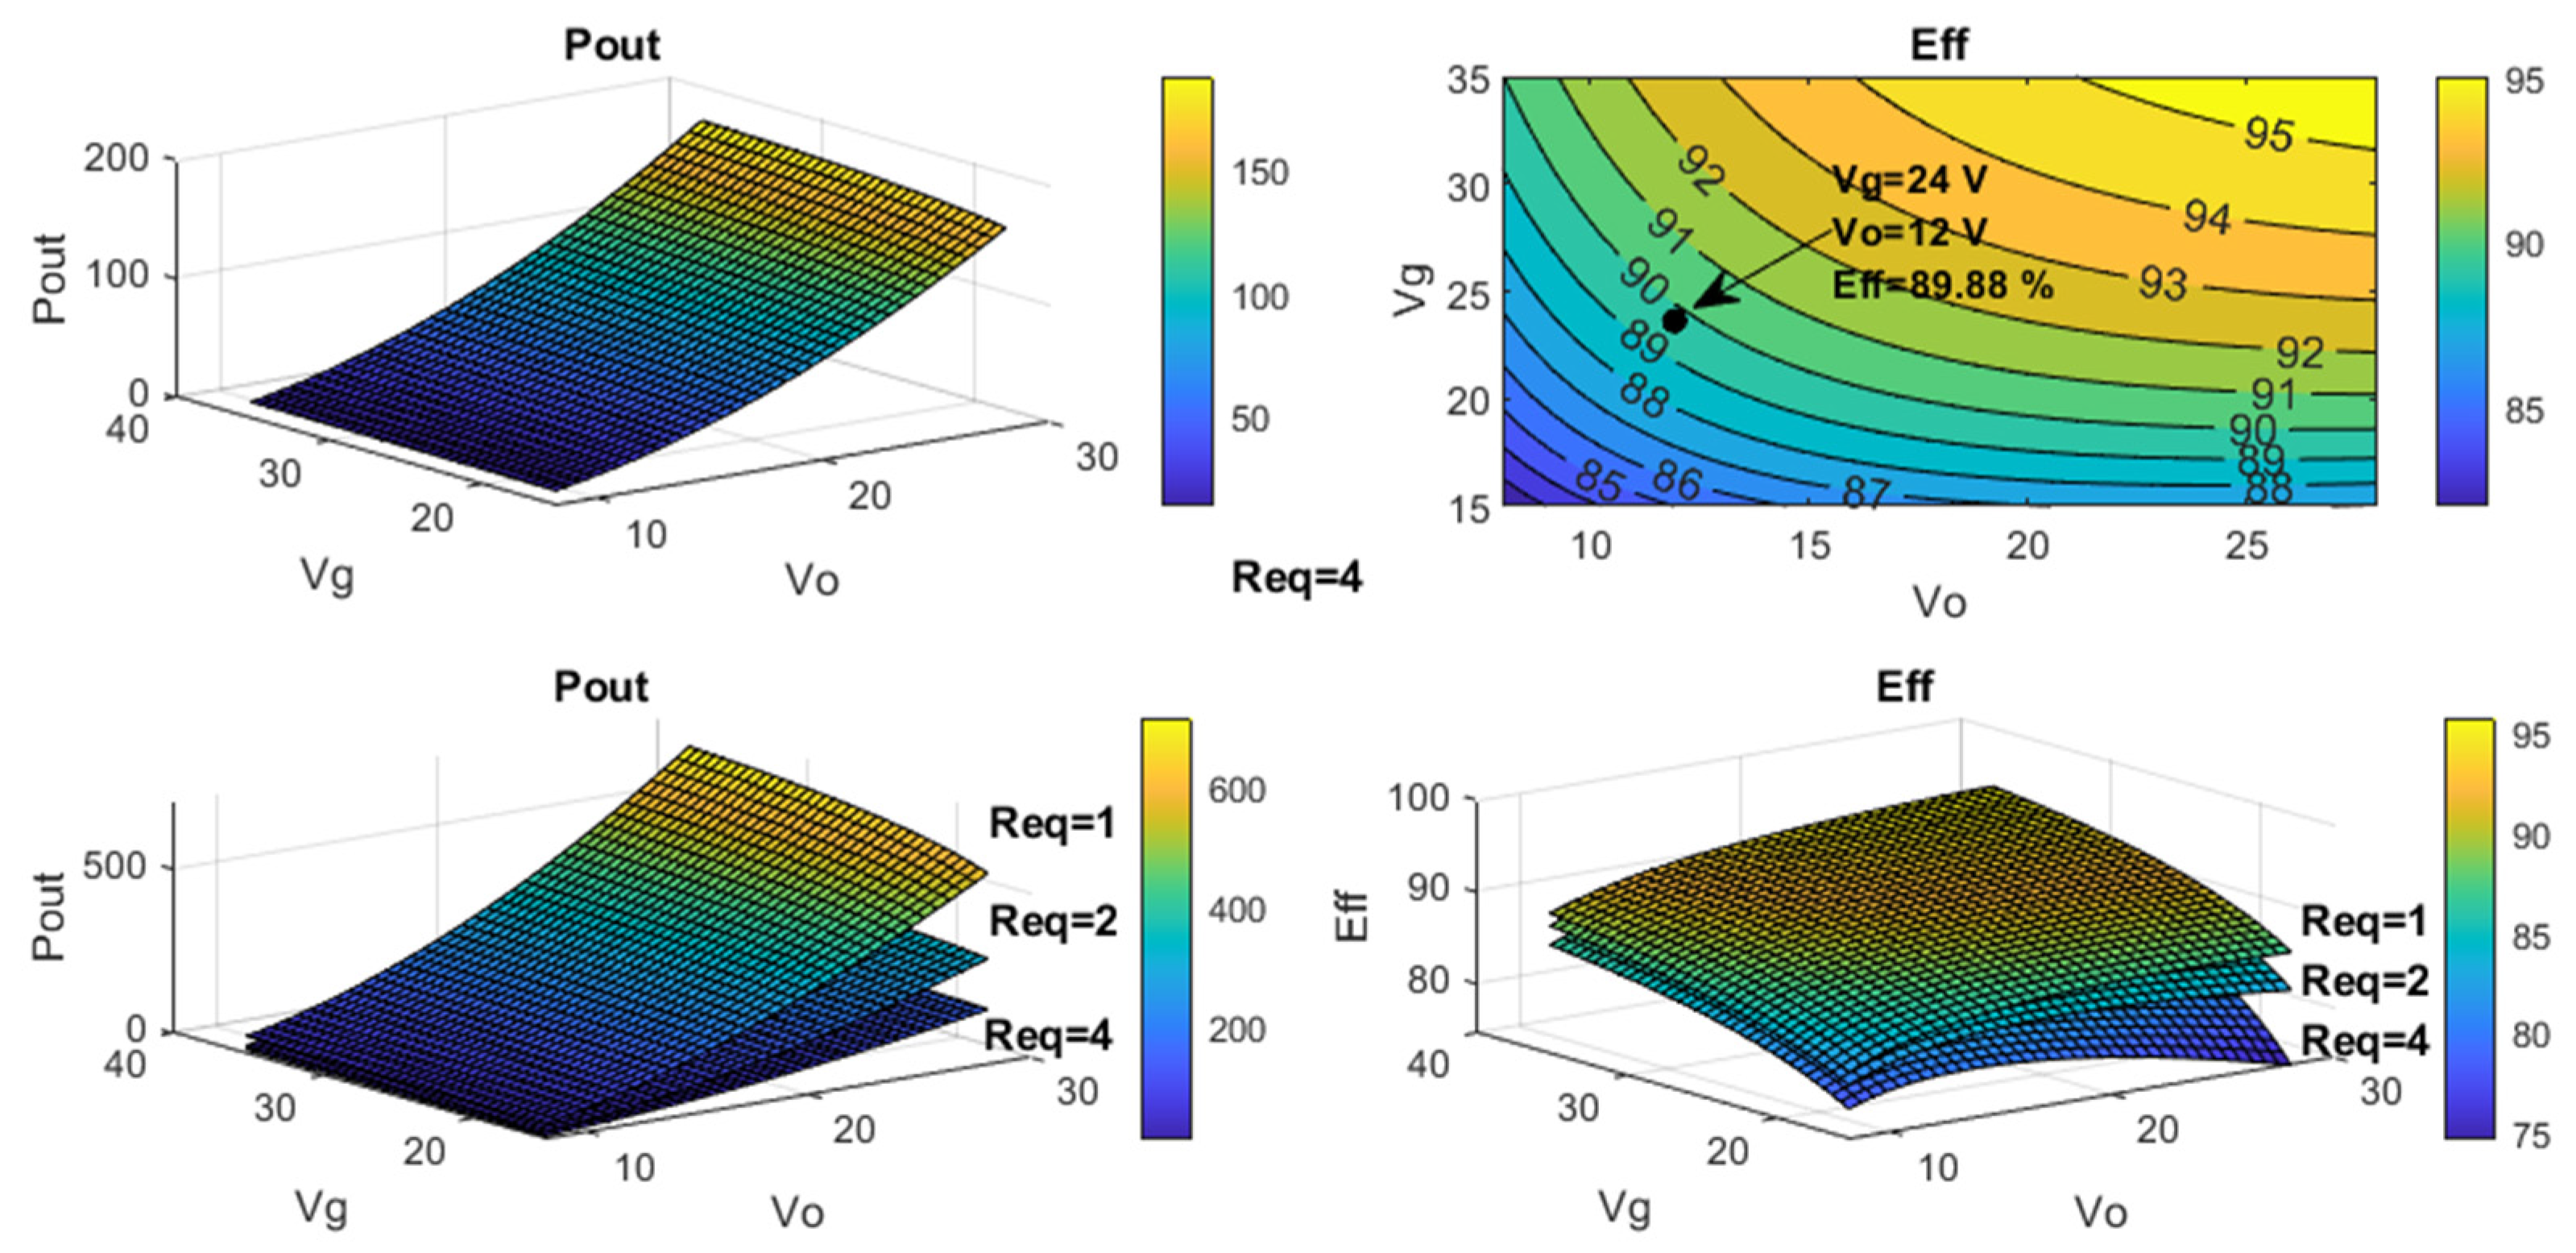
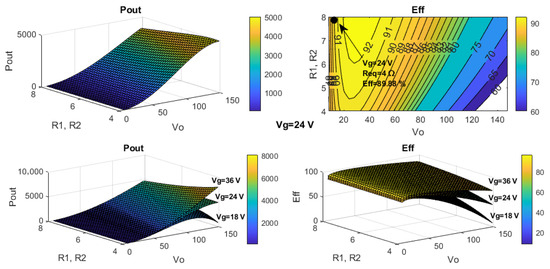
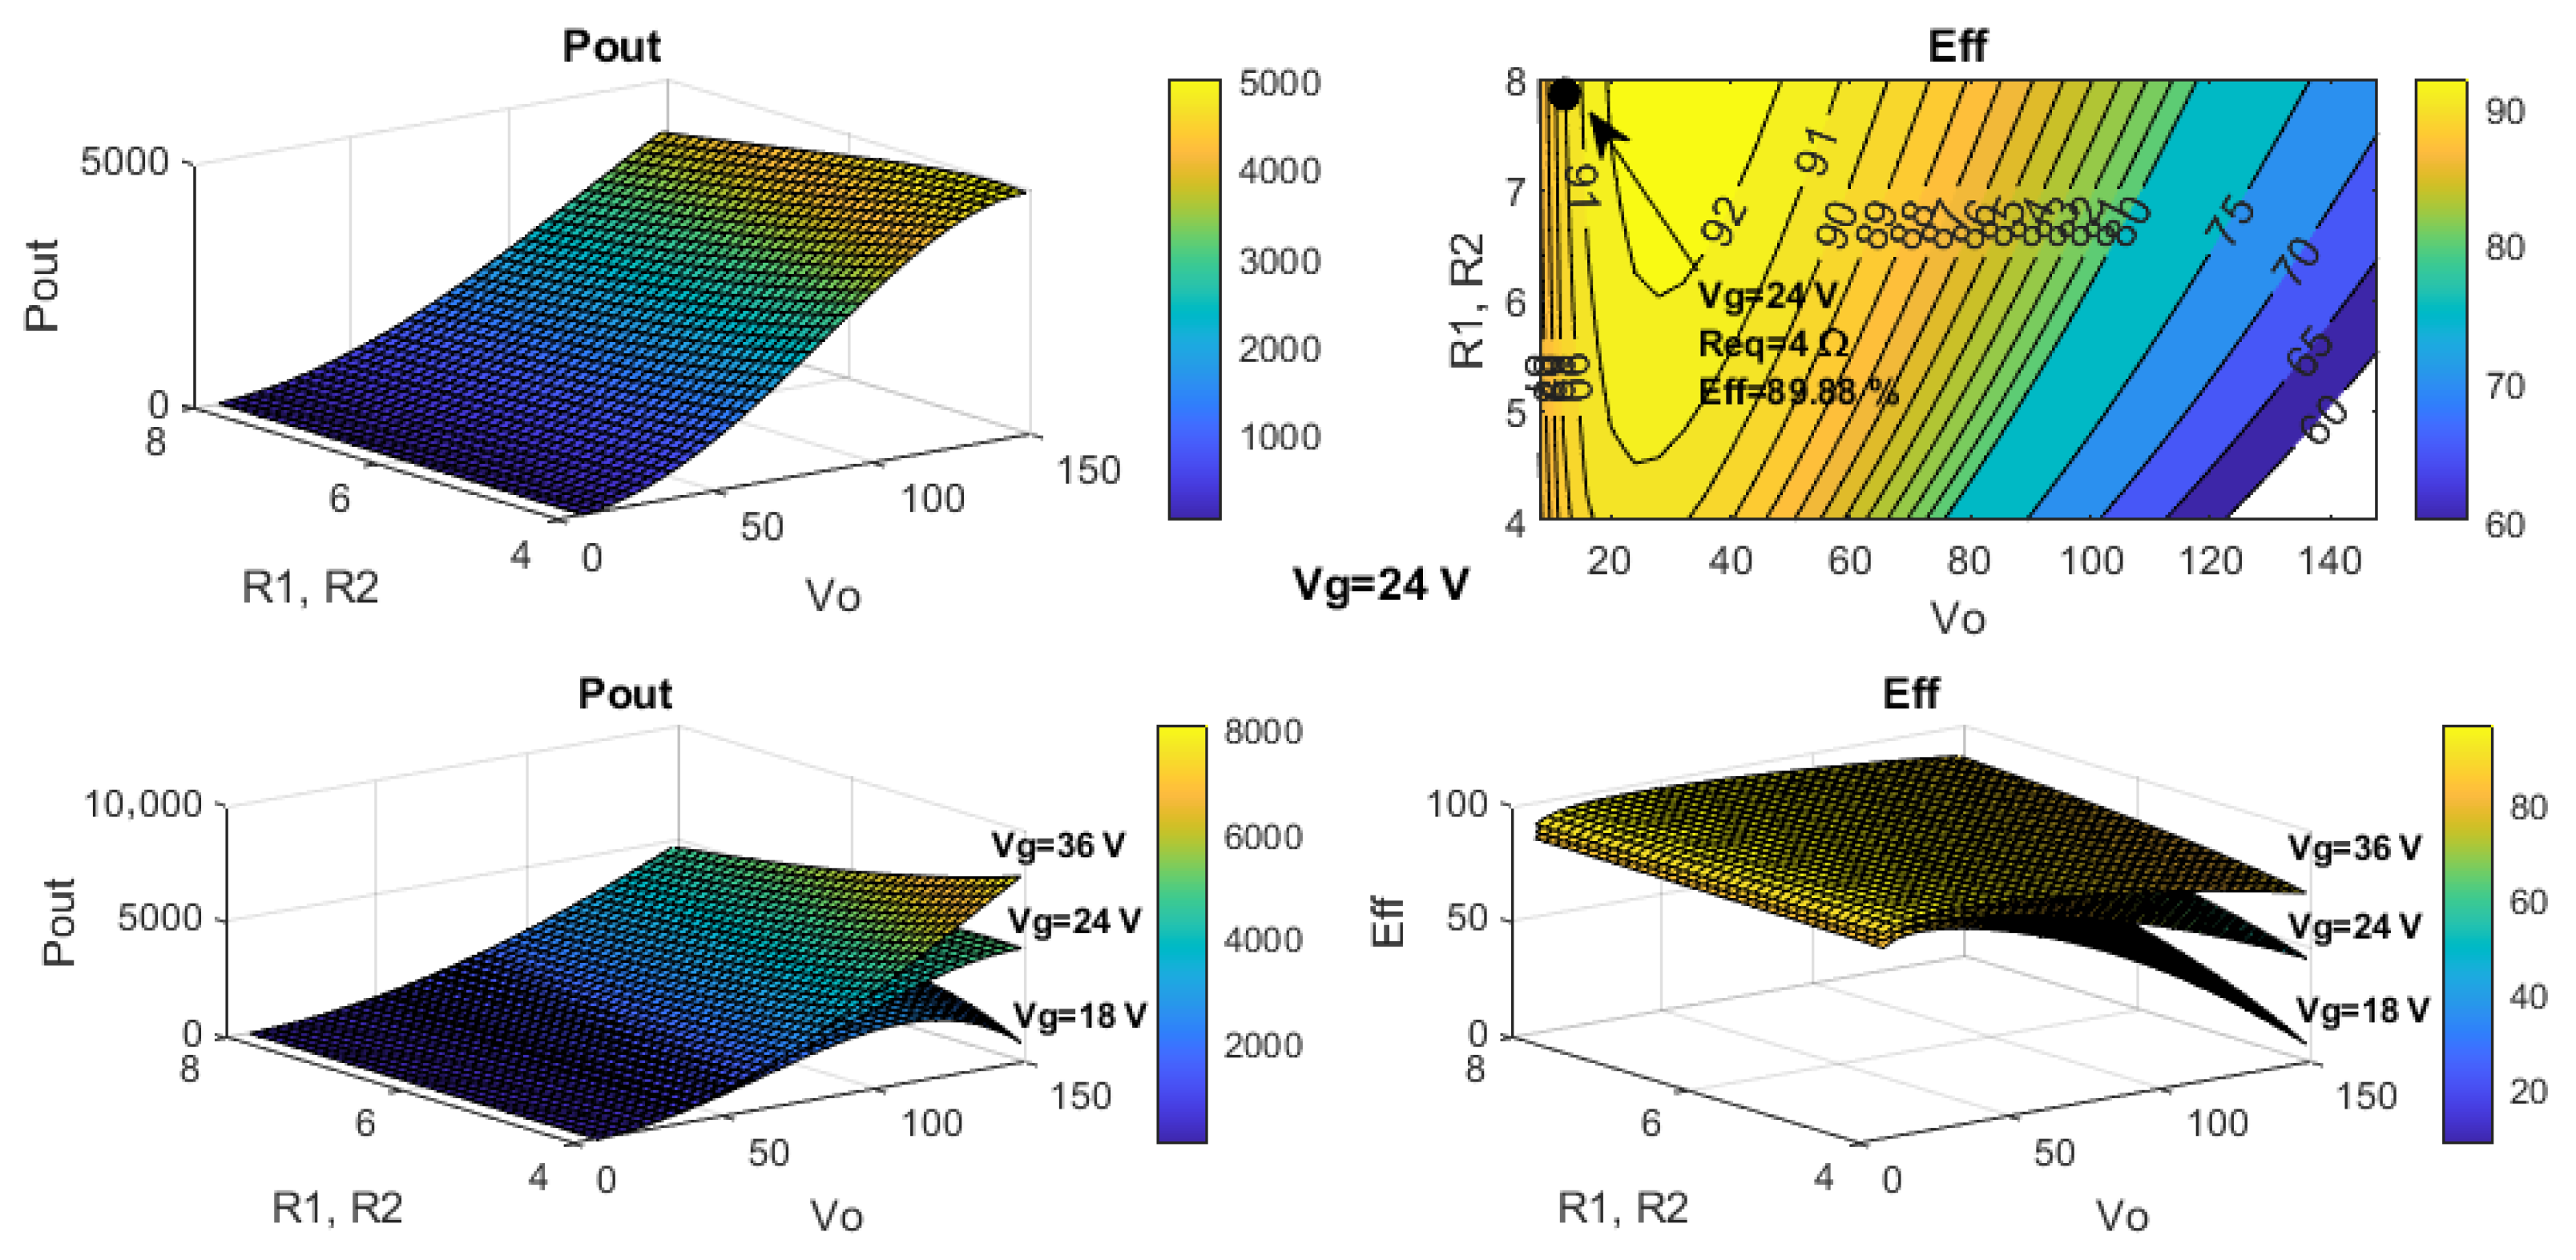
Additionally, the tool includes a button to generate power and efficiency maps, offering a direct visualization of the converter’s optimal operating conditions through 2D and 3D plots. Figure 12 and Figure 13 show the power maps generated. Figure 12 shows the output power and efficiency against input voltage variations for different load levels, while Figure 13 presents the output power and efficiency against load variations for different input voltages. These power maps allow a direct visualization of the optimal efficiency point and the impact of line and load variations on the overall efficiency.
Figure 12.
Power maps generated with the MATLAB-based tool. Output power and efficiency for line variation and with different loads.
Figure 13.
Power maps generated with the MATLAB-based tool. Output power and efficiency for load variation and with different input voltages.
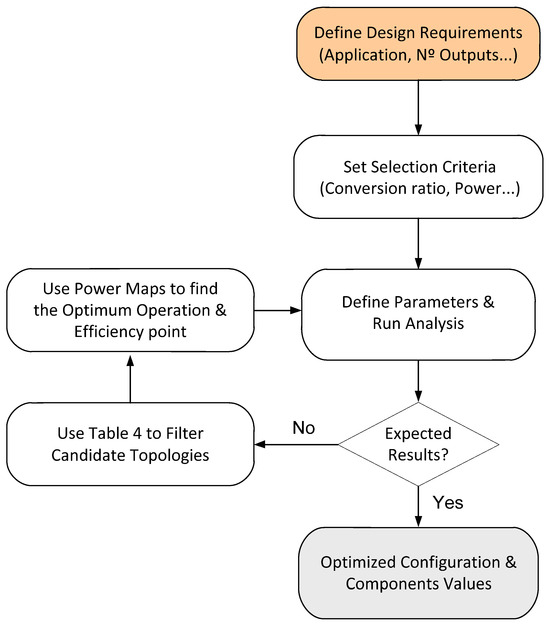
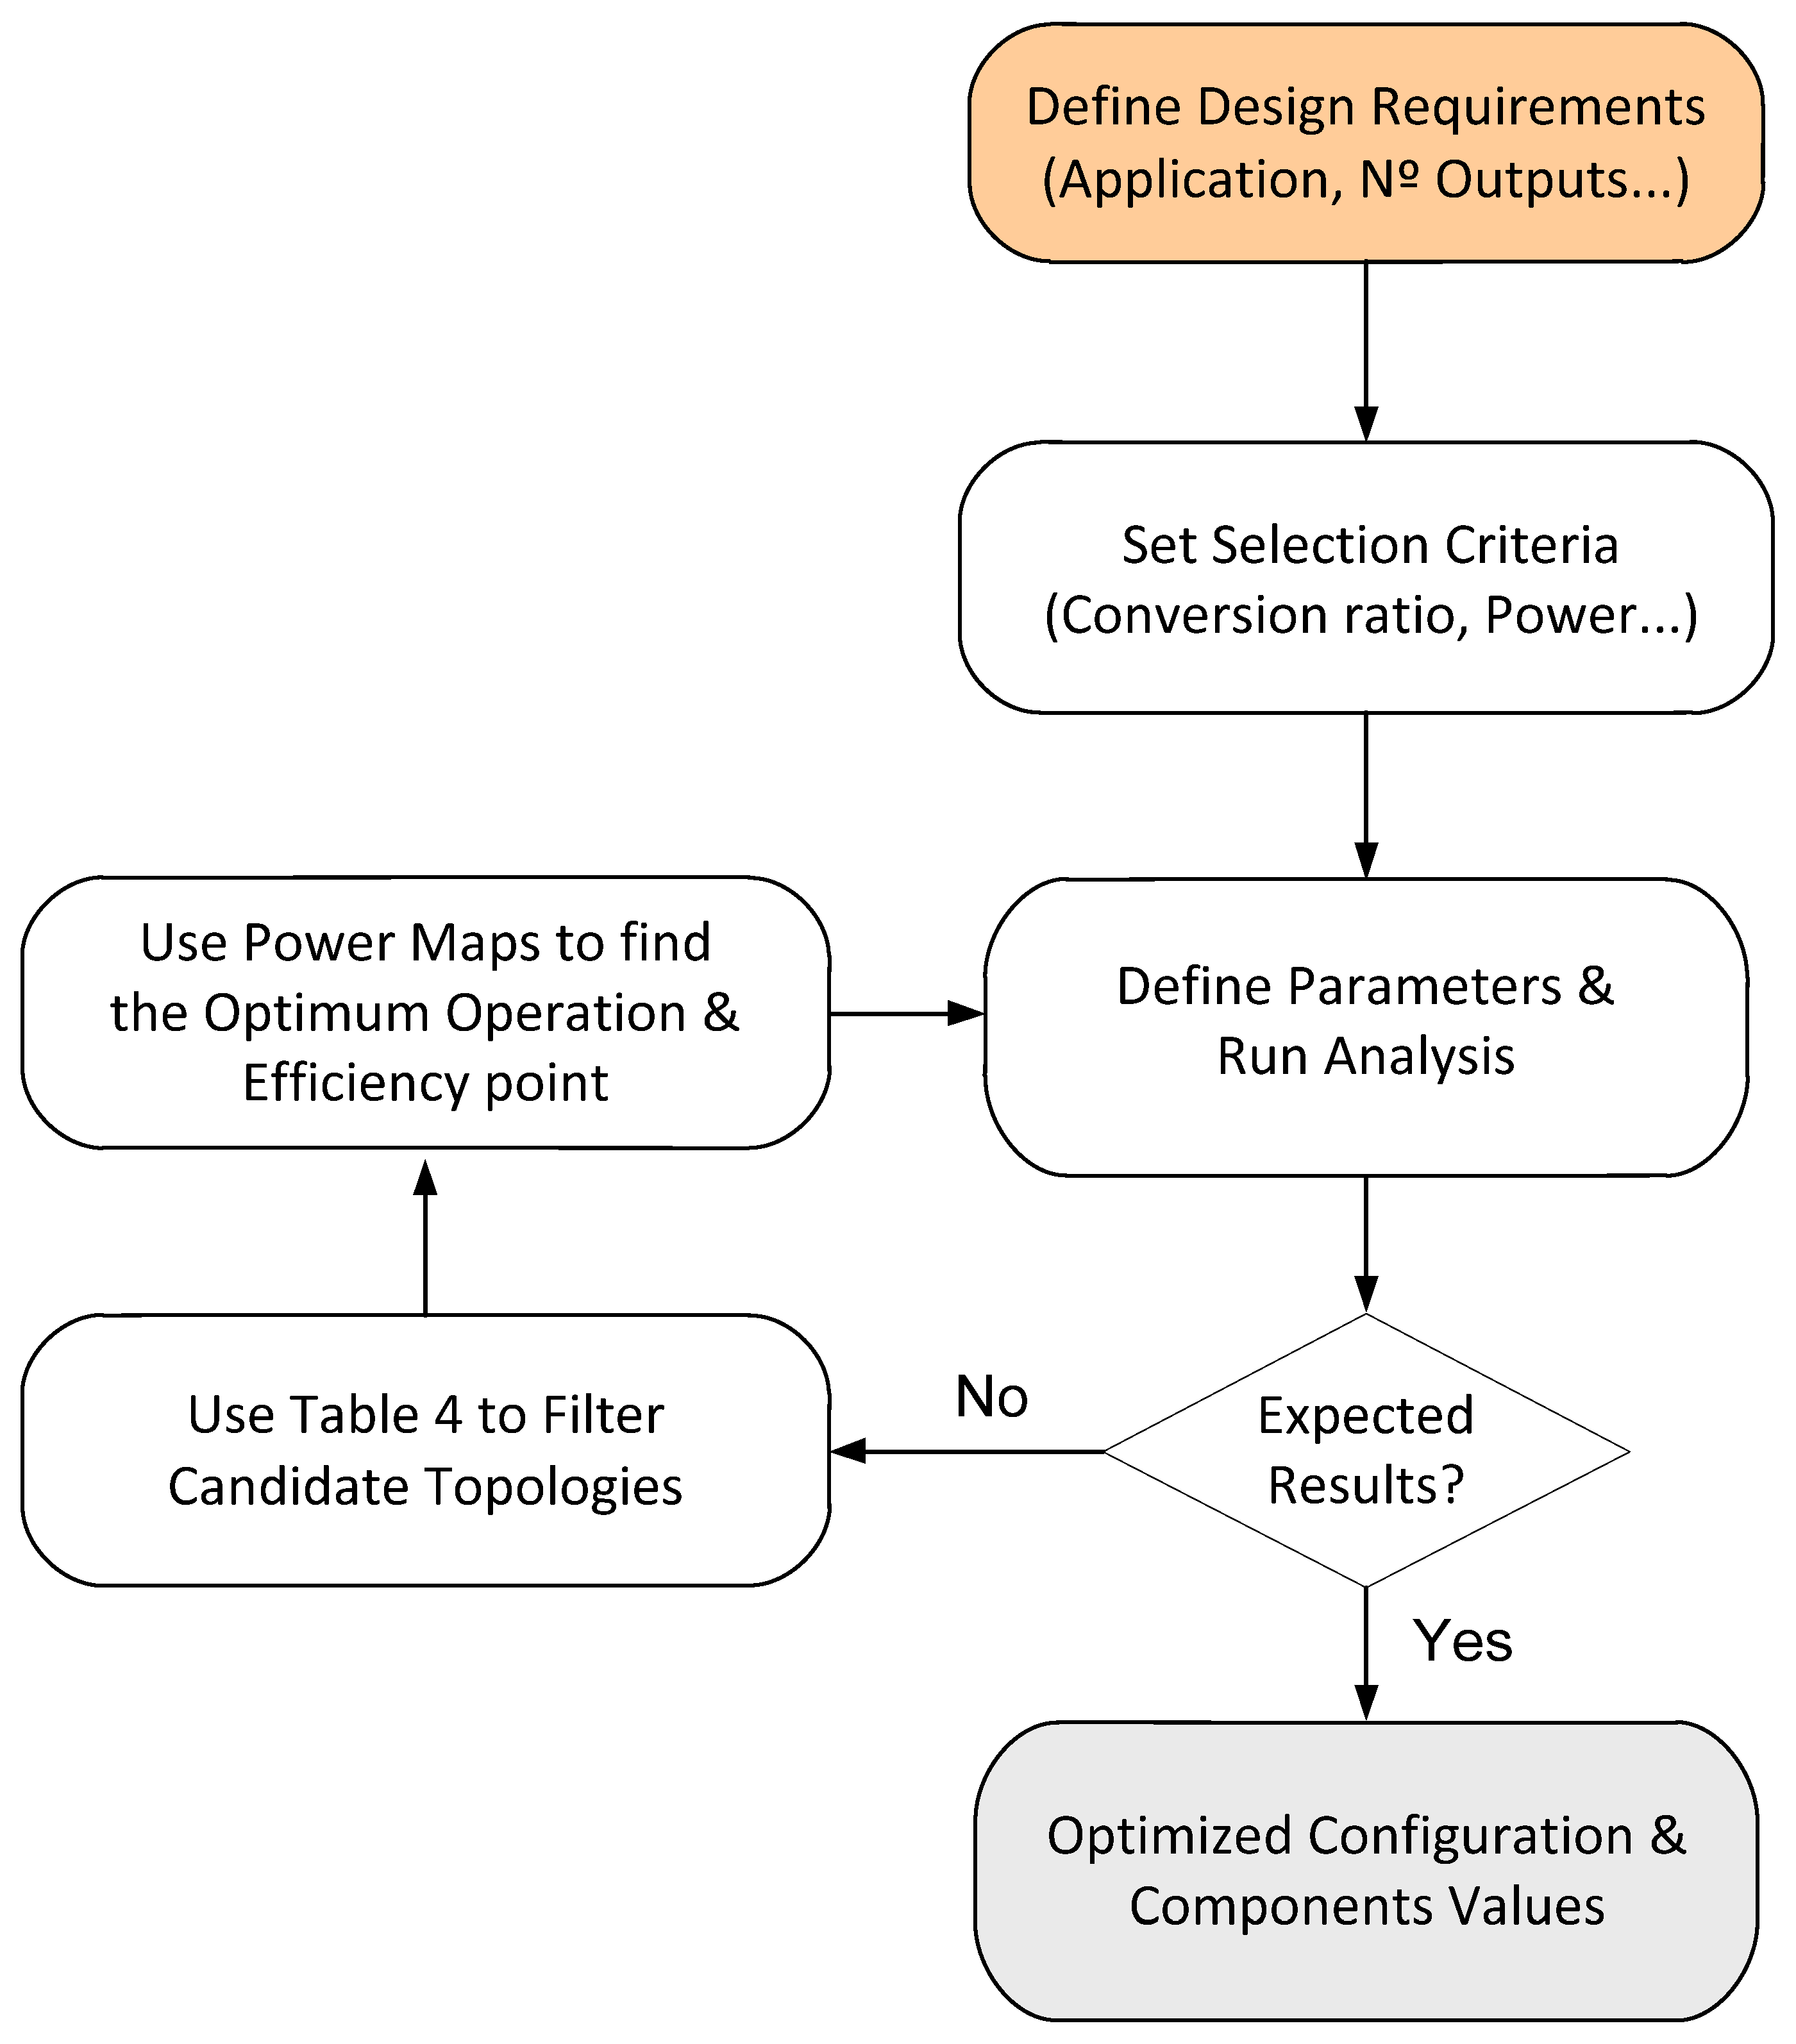
While the proposed tool enables the parametric analysis of all combinations, the optimal configuration for a given application (and for a given set of specifications) can be preliminarily selected based on key criteria such as required output polarity, load regulation sensitivity, control simplicity and compatibility between topologies. Table 4, together with the power maps generated by the tool, provides initial guidance for selecting the most appropriate topology for specific operating conditions. To illustrate the process, Figure 14 presents a simplified design methodology and how to identify the most suitable configuration. This proposed workflow serves as a decision map for selecting the optimal topology from the derived family based on application requirements, such as output polarity, efficiency targets, and footprint constraints. This section has introduced a practical MATLAB-based tool that utilizes theoretical equations to facilitate rapid parameter sizing and efficiency mapping.
Figure 14.
Proposed procedure for the selection and design of the most suitable quasi-resonant converter configuration.
5. Simulation Results
To validate the behavior of the proposed quasi-resonant converters, a series of simulations has been conducted using a MATLAB/Simulink model with an example of the SEPIC–Cuk ZVS full-wave M-type configuration, with all sixteen configurations being simulated and compared.
The simulations carried out analyze the maximum and minimum most relevant values, show the resonant waveforms and explore the behavior of the converters under conditions both near and far from the resonant switching limit (soft switching conditions given in Table 5 and Table 6). This allows for a deep evaluation of how deviations from the ideal resonant point affect the performance of both Zero-Voltage Switching and Zero-Current Switching. Simulating these extreme operating conditions allows for the quantification of efficiency variations, switching losses, and potential EMI implications in each scenario.
Simulations were performed with the combined two different load conditions, allowing for an evaluation of the converter’s efficiency in each case. The results indicate that efficiency improves as the load impedance approaches the resonant limit, suggesting a correspondence between the resonant tank impedance and the efficiency of the converter.
The resonant tank defines the dynamic impedance of the circuit and influences the switching performance. When the load impedance is closely matched to the resonant tank, energy transfer occurs more efficiently, minimizing conduction and switching losses. However, deviations from this condition result in increased resistive losses, which affect efficiency.
Thus, a factor influencing efficiency is the effective impedance presented to the switching cell. Near resonance limit, this impedance remains low, facilitating zero—voltage and zero current switching, thereby reducing switching losses. However, although adjusting the load to match the resonant tank impedance maximizes efficiency, it also reduces the allowable load variation range. A tightly matched load restricts operating flexibility, as even small deviations may shift the converter out of soft switching. Consequently, there is a trade-off between optimizing efficiency and maintaining a wider operational range, which must be considered in the design of the converter.
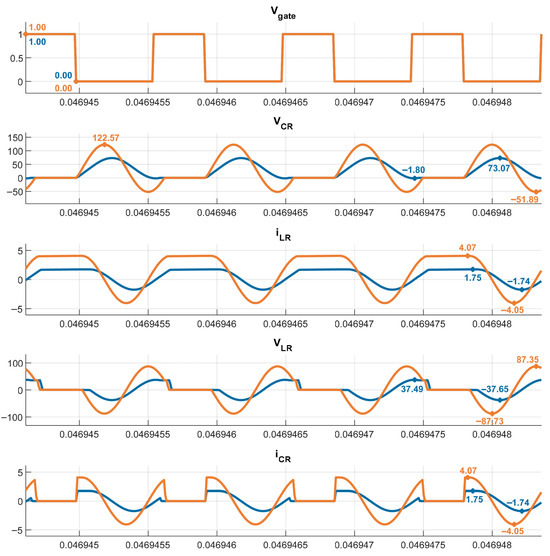
In contrast, when the load moves away from the resonant condition, the impedance increases, leading to higher voltage and current stresses on the semiconductor devices (Figure 15). This results in increased power dissipation and losses.
Figure 15.
Resonant waveforms for different ratios . Simulation results from ratio value of 3.32 (orange line) to 1.33 (blue line).
The useful operational range to maintain soft switching is defined by the load limits established in Table 5 and Table 6. In this context, it is important to note that in ZVS configurations, the load range defined by the resonant limit corresponds to an equivalent resistance between zero and a maximum value. Within this range, soft-switching is maintained, as the energy in the resonant tank ensures zero-voltage turn-on. Outside this range, ZVS conditions are lost, increasing switching losses.
0 < Req < Rmax
If Req exceeds Rmax, the load surpasses the characteristic impedance, Zo, because the load impedance is higher than the tank impedance, and the stored energy is insufficient to ensure zero-voltage switching. On the other hand, ZCS configurations operate with an equivalent load resistance between infinity and a minimum value. Soft-switching is guaranteed as long as the load remains above this minimum threshold. If the load is less than Rmin, its impedance is lower than that of the resonant tank, which breaks the zero-current switching condition by preventing the current from returning to zero.
∞ > Req > Rmin
These results emphasize the importance of appropriately designing the resonant tank parameters to match the expected load range. By optimizing the impedance characteristics of the resonant tank, the proposed family of converters can achieve improved efficiency over a broader range of operating conditions. The simulations shown in Figure 15 establish that as the load impedance approaches the resonant limit (blue color waveform), energy transfer becomes more effective, leading to reduced losses and enhanced efficiency. The orange waveform represents normal operation far from the resonant limit.
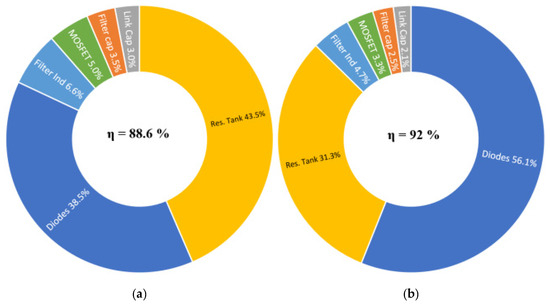
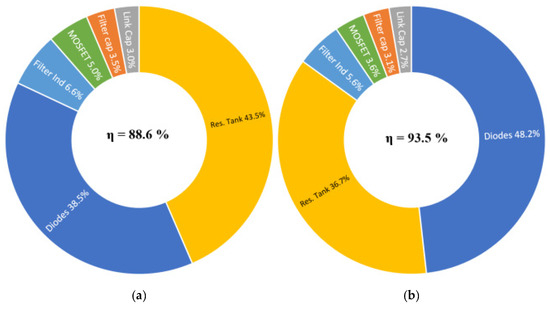
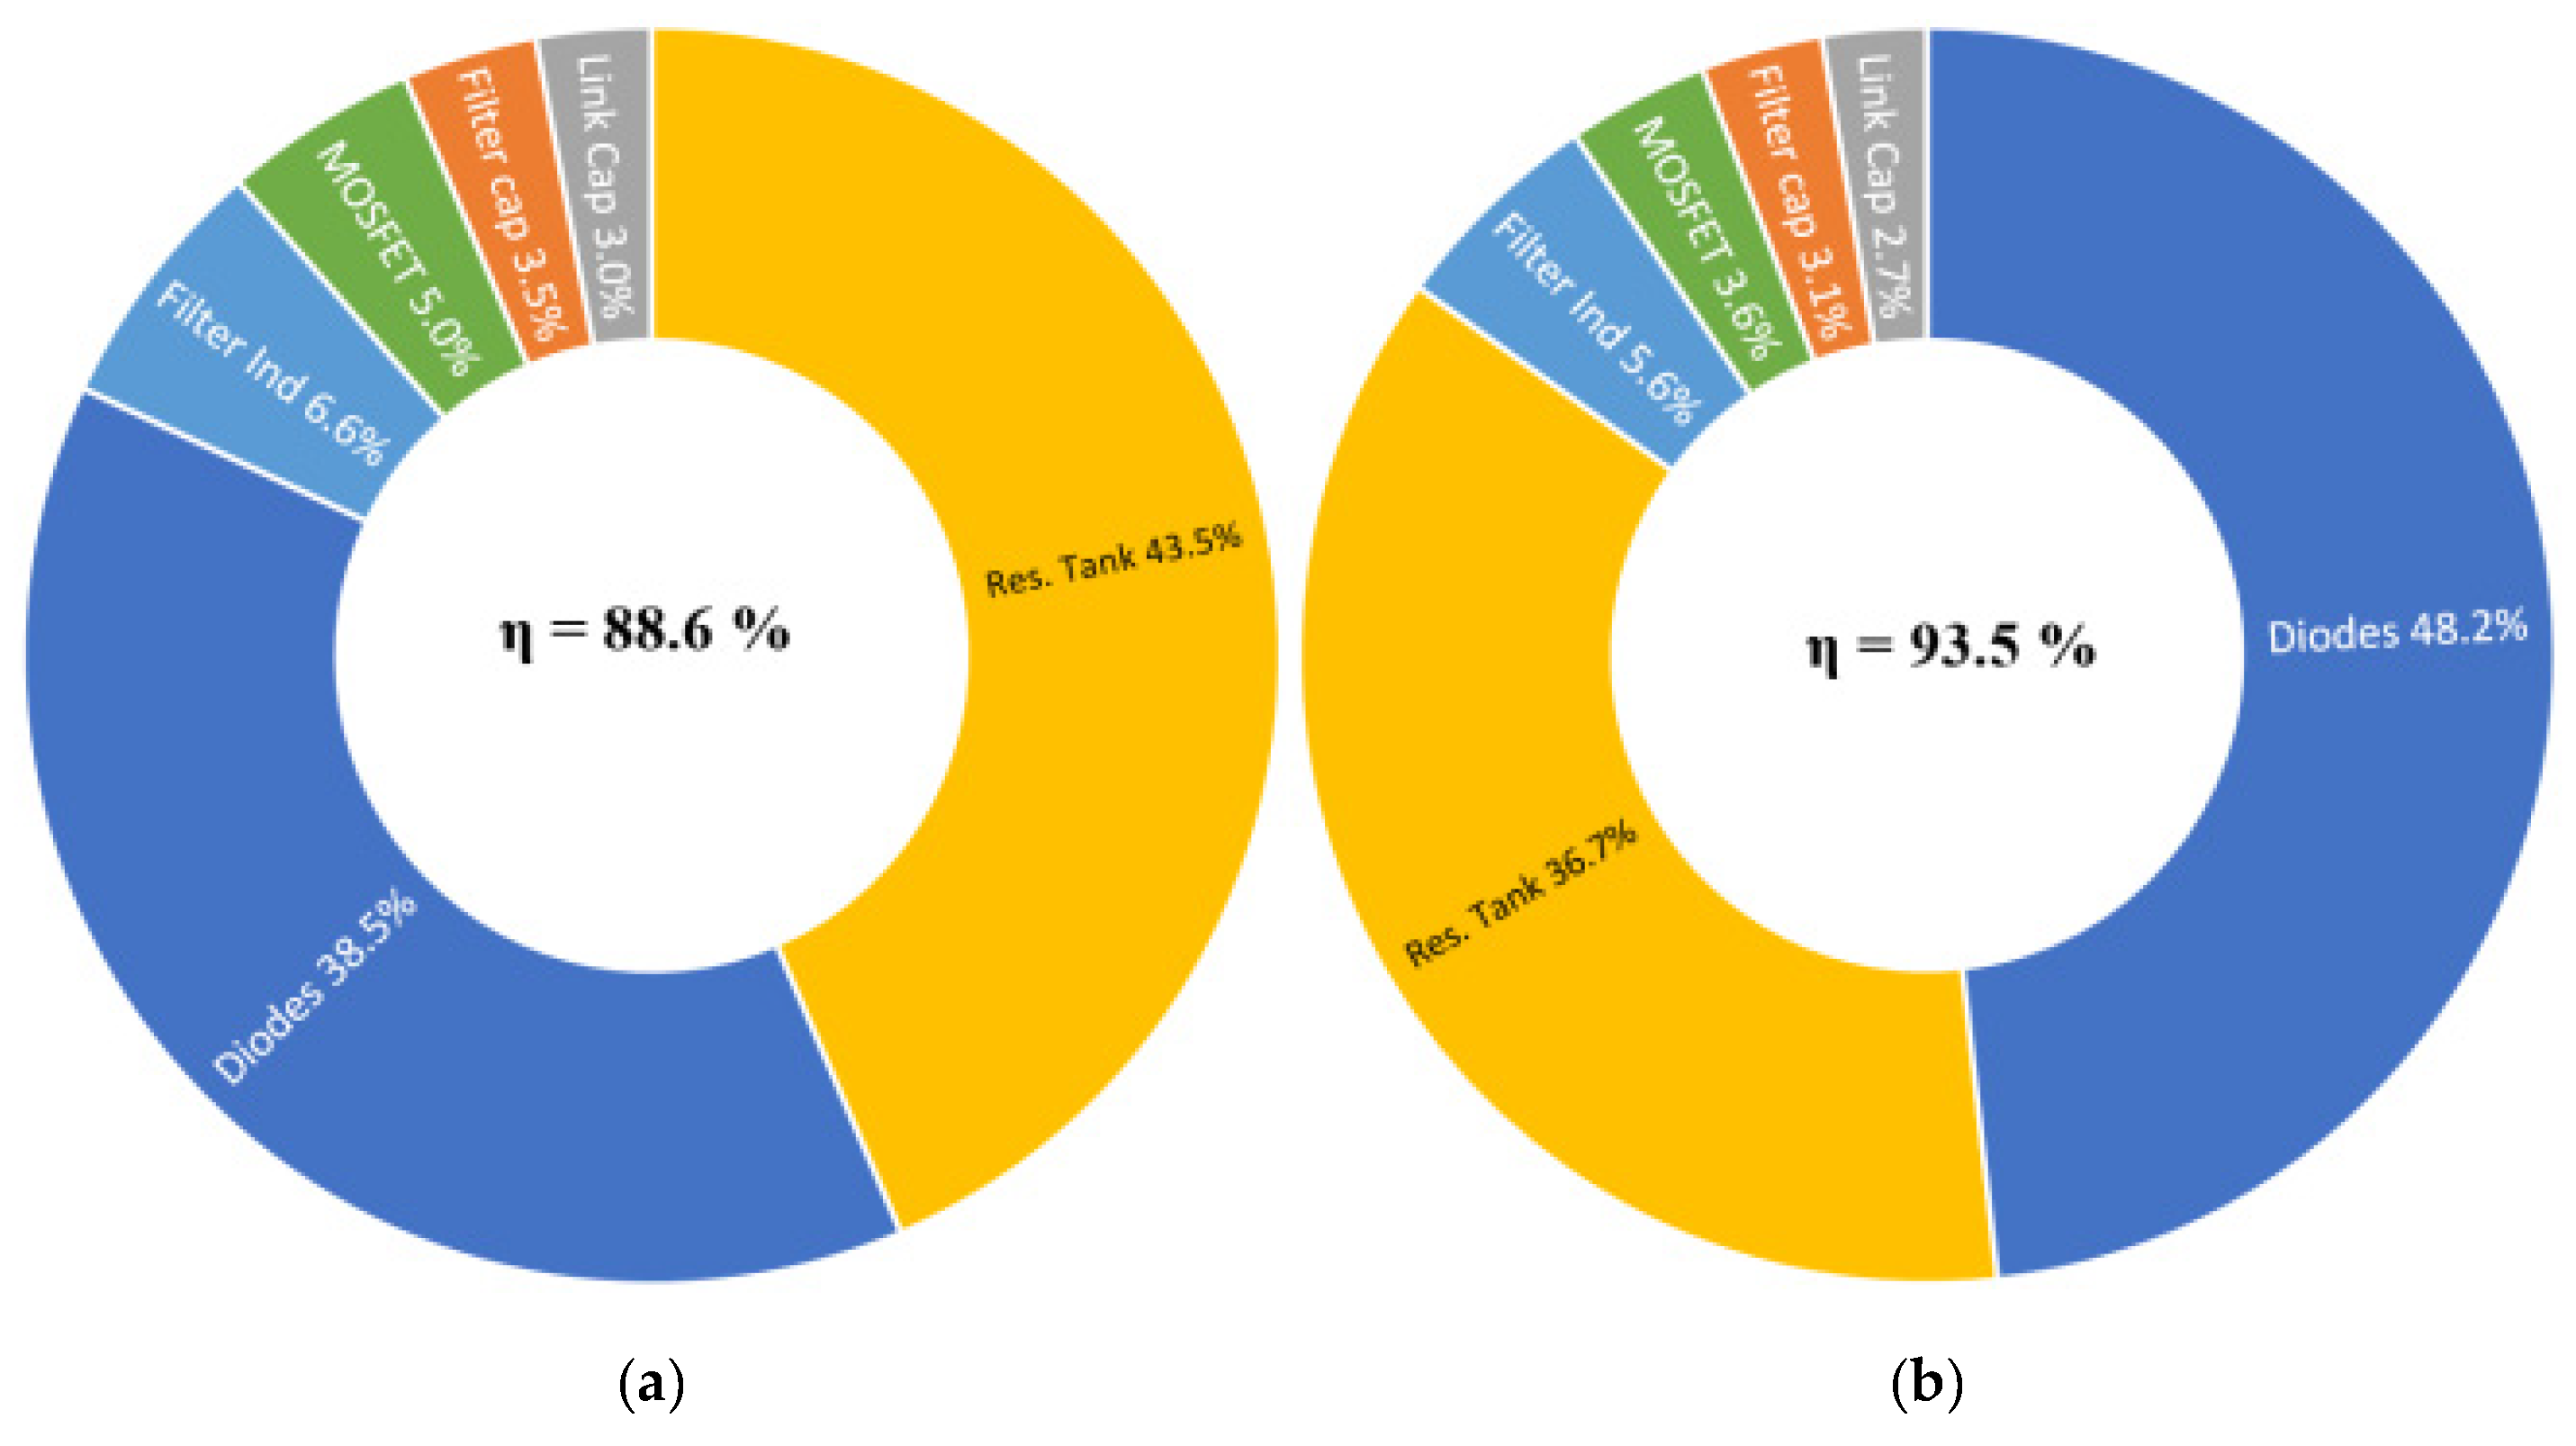
Figure 16 and Figure 17 show the percentual distribution of conduction losses among the converter components as the load varies relative to the resonant tank impedance. When the load impedance closely matches the resonant tank (i.e., near the resonant limit) the tank exhibits minimal conduction losses due to optimal impedance matching and enhanced soft—switching conditions. Under this situation, the energy transfer is efficient (around 90%), and the dominant losses are observed in the diodes (due to voltage drop). This behavior is attributed to the effective reduction in RMS current stresses within the resonant tank components, which minimizes resistive losses and highlights the critical role of load alignment in optimizing efficiency. For the converter operating point, the simulated efficiency obtained is 90.2% (0.35% error relative to the tool).
Figure 16.
Percentual losses and efficiency for different impedance ratio tank—load changing the load. (a) << (b) ~ .
Figure 17.
Percentual losses and efficiency for different impedance ratio tank-load changing load and voltage ratio to keep constant power. (a) << (b) ~ .
Figure 16 shows the percentage distribution of the conduction losses obtained by varying just the load resistance and keeping the switching frequency and input voltage constant. Under these conditions, variations in load resistance result in variations in output voltage and power. In contrast, Figure 17 represents the loss distribution when changes in the load resistance are combined with corresponding changes in the input and output voltages, so that the output power is kept constant.
6. Experimental Results
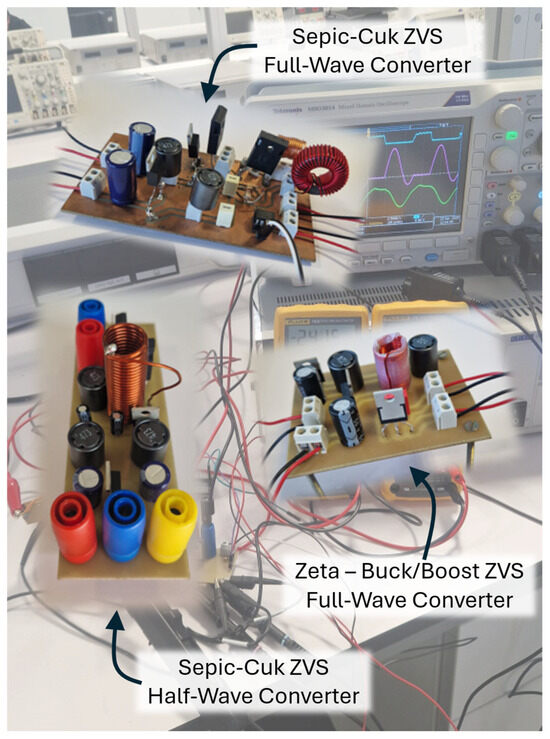
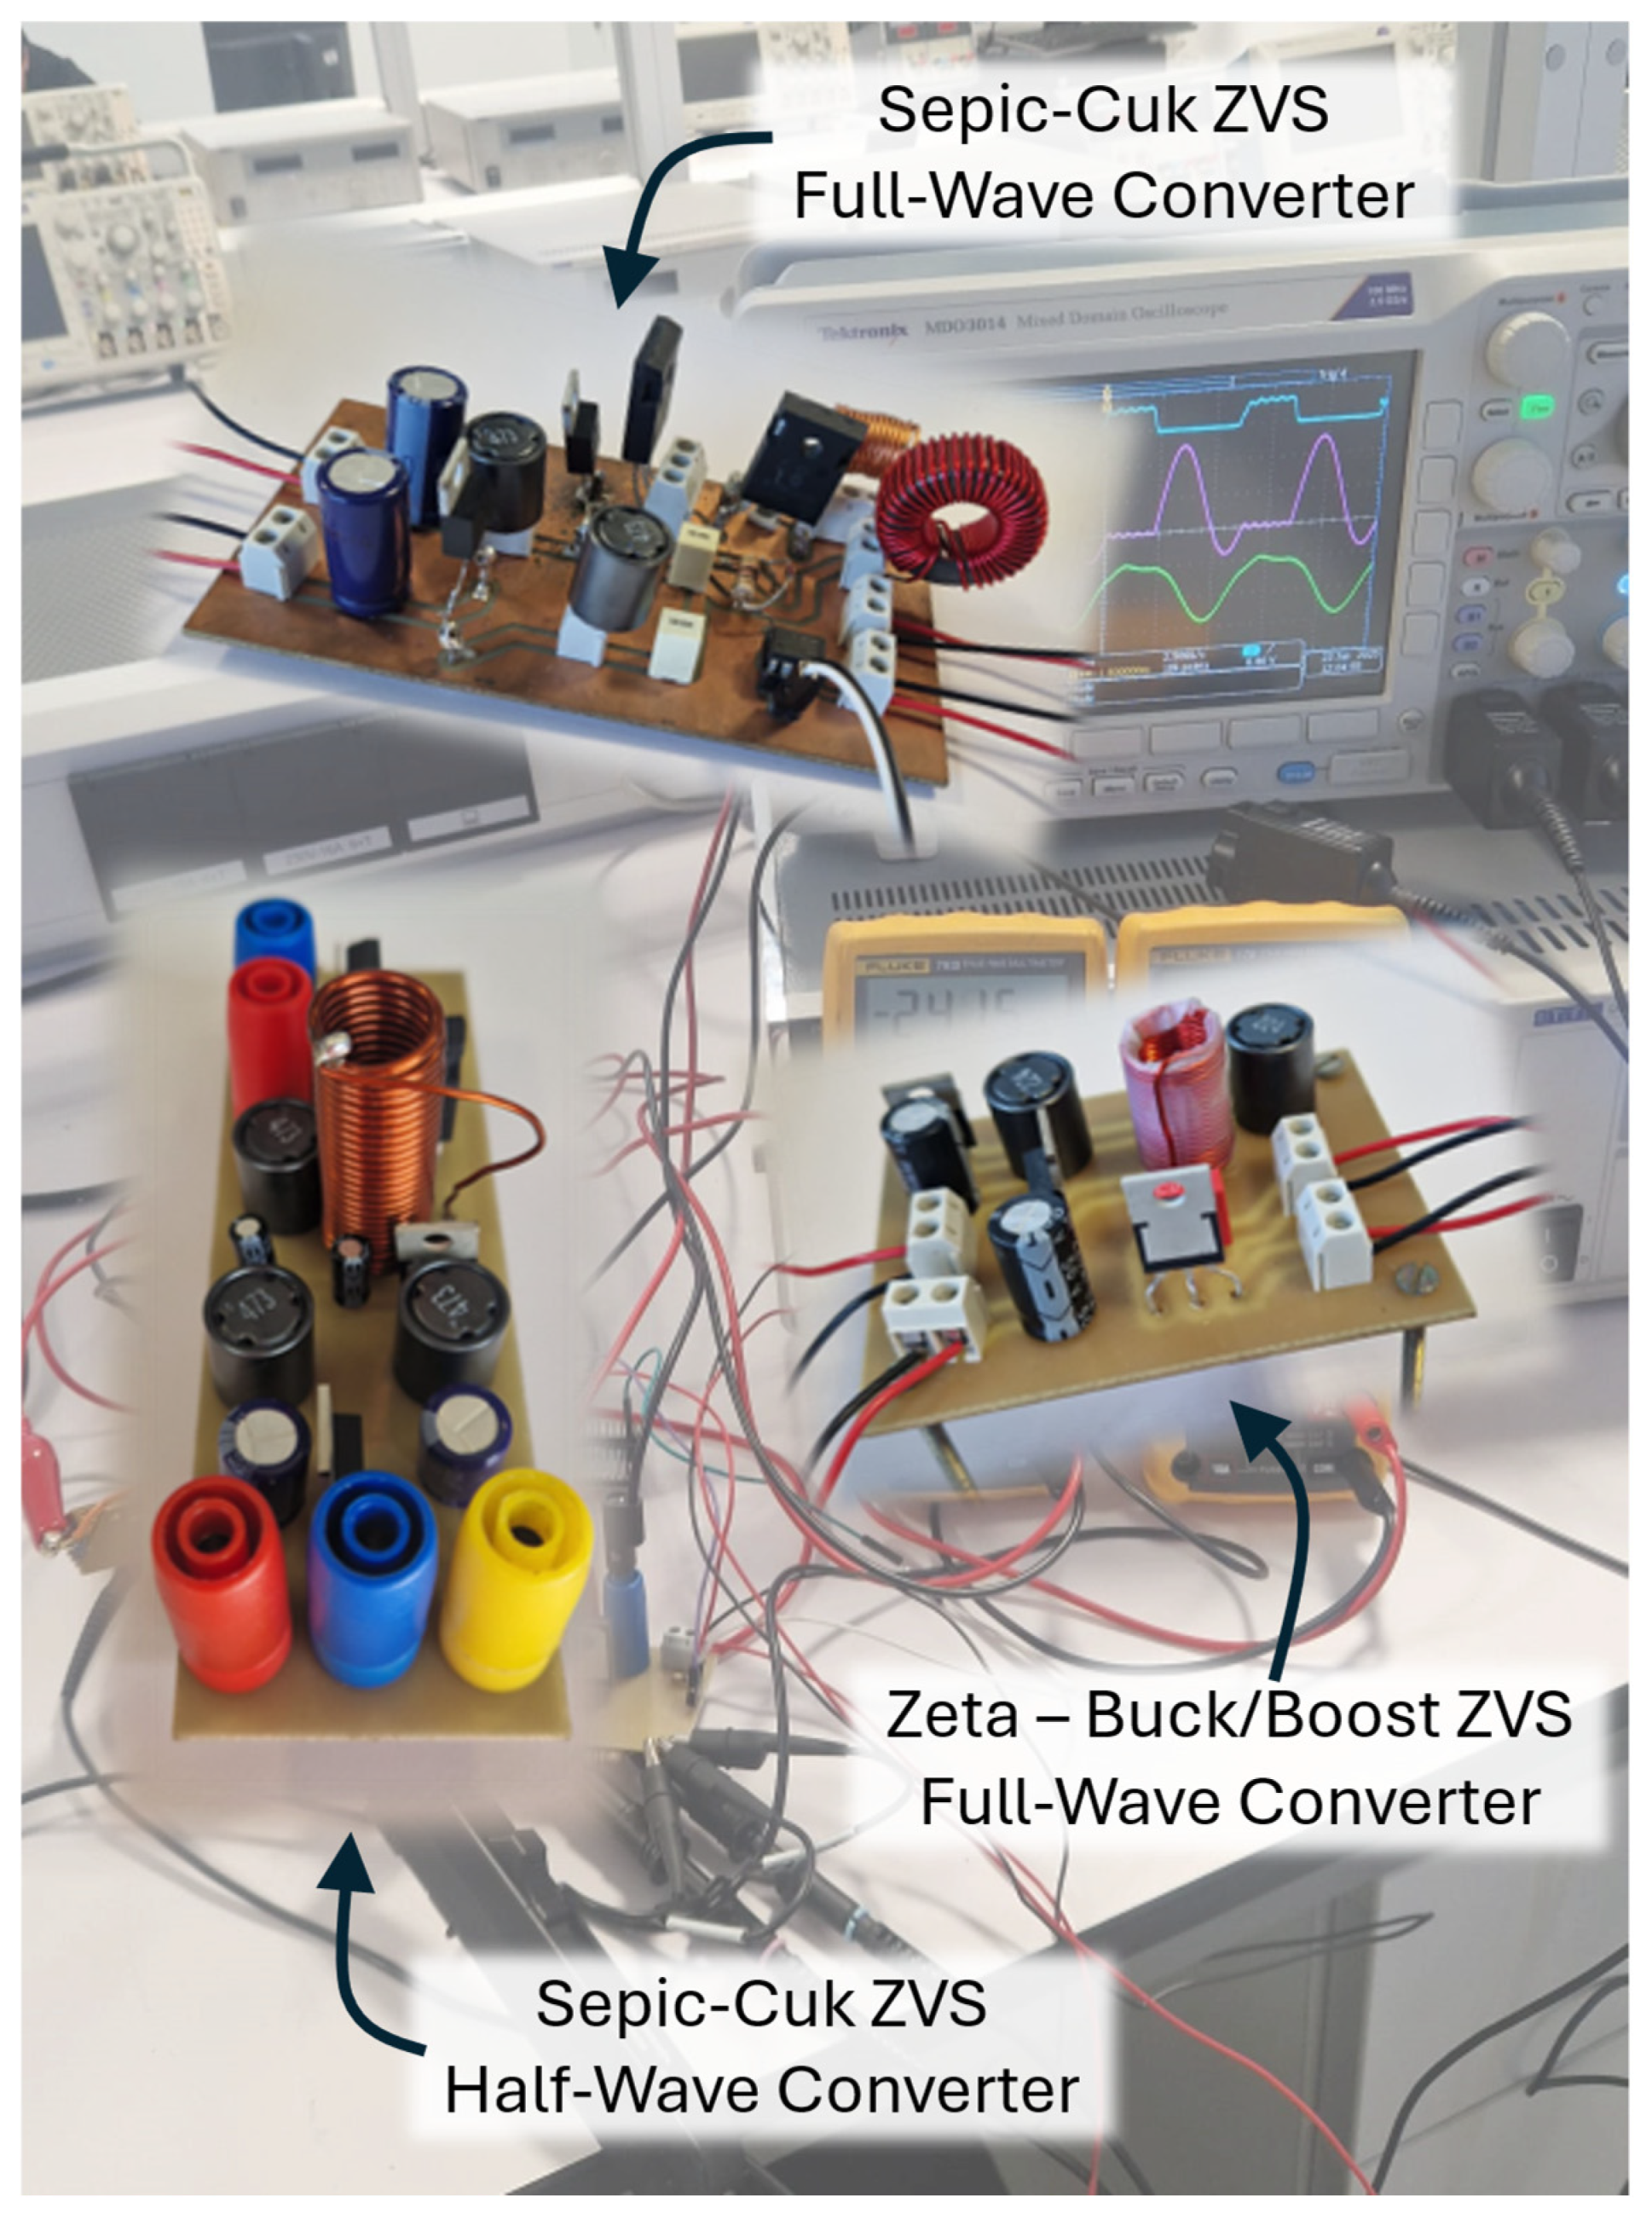
In this section, experimental results obtained from some high-frequency resonant power converter prototypes are presented to evaluate the performance under different operating conditions. The converters under consideration include a ZVS half-wave and full-wave SEPIC–Cuk combination (Figure 3a). These prototypes (Figure 18) were tested under a range of operating conditions, including load variations, input voltage variations, and unbalanced load scenarios. The experimental component values, operation parameters and applied variations are summarized in Table 9. The objective of these experiments was to assess the impact of these variables on the output voltages, resonant waveforms, and overall efficiency. The experimental setup utilized a Tektronix MDO3014 mixed-domain oscilloscope (100 MHz, 2.5 GS/s), which offers high timing resolution and a time-base accuracy of ±10 ppm. Signal acquisition was performed using high-performance probes: a Tektronix TCP0020 current probe (50 MHz) with a typical DC accuracy of ±1% and low offset error (<10 mA), and TPP0250 passive voltage probes (250 MHz). Input power was provided by an Aim-TTi QPX600D DC supply (0.1% voltage and 0.3% current accuracy).
Figure 18.
ZVS full-wave and half-wave M type converter prototypes.
Table 9.
Component values and parameters for the experimental operation of the SEPIC–Cuk ZVS M type topologies.
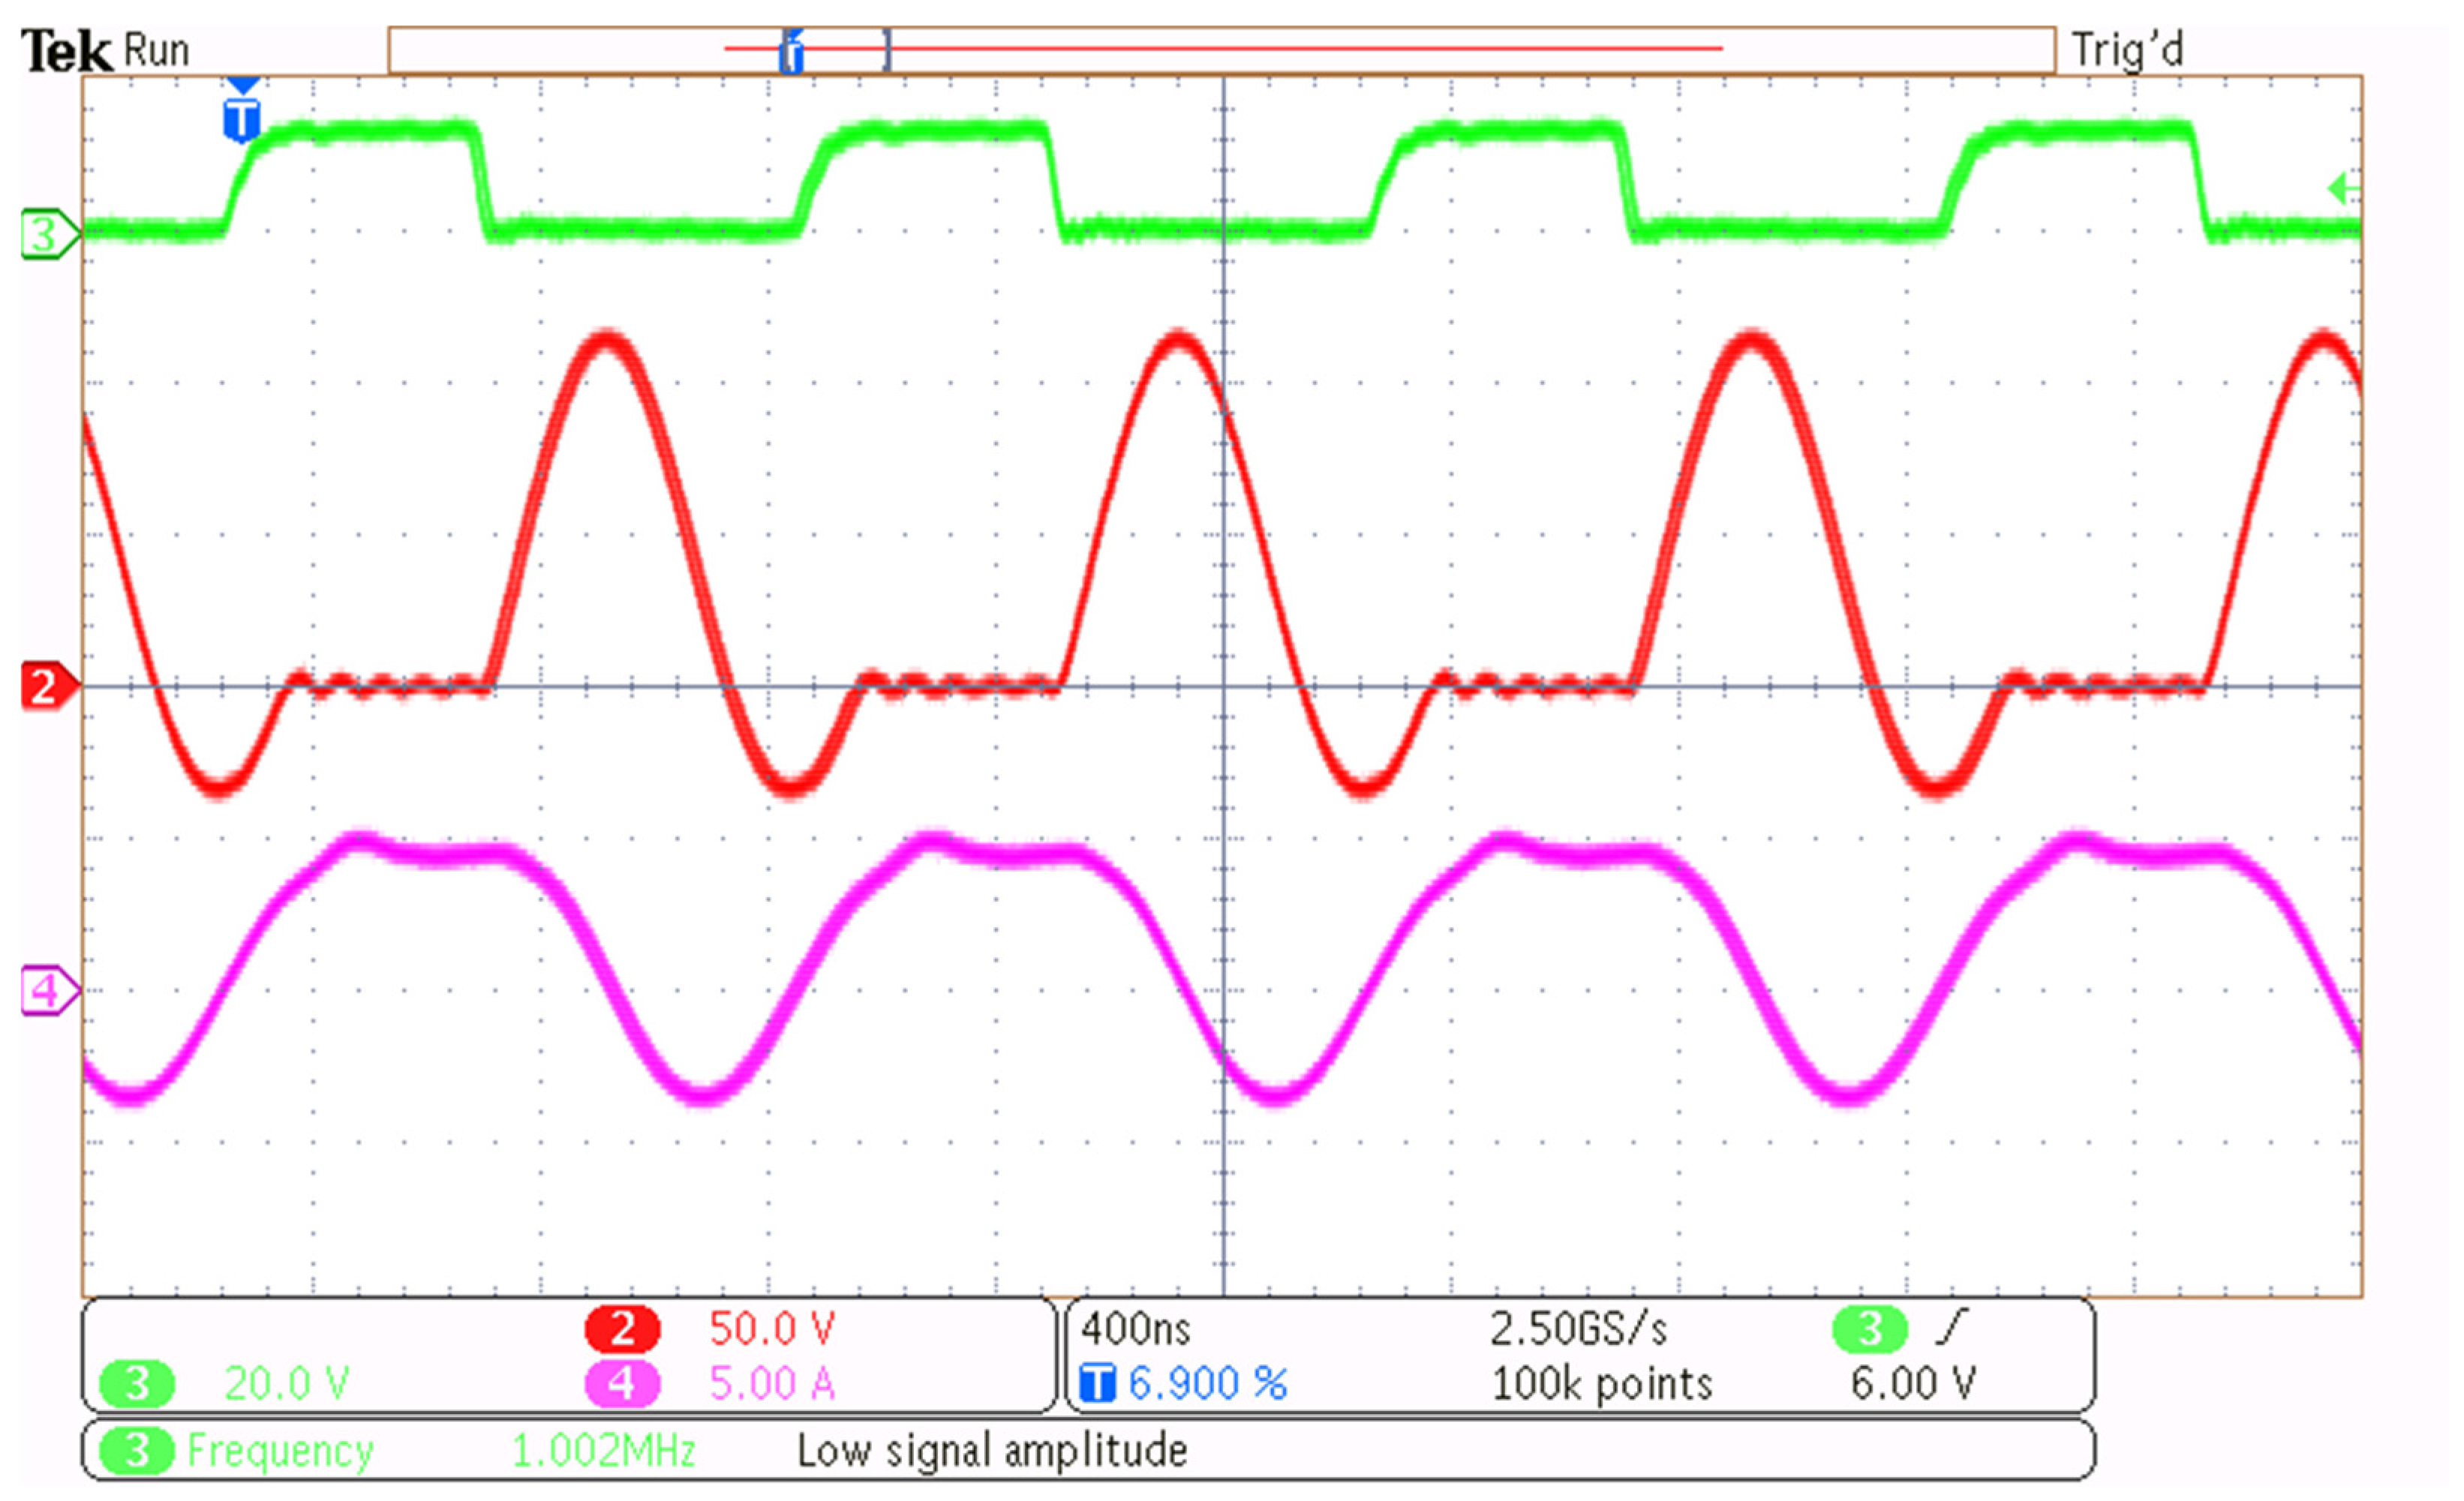
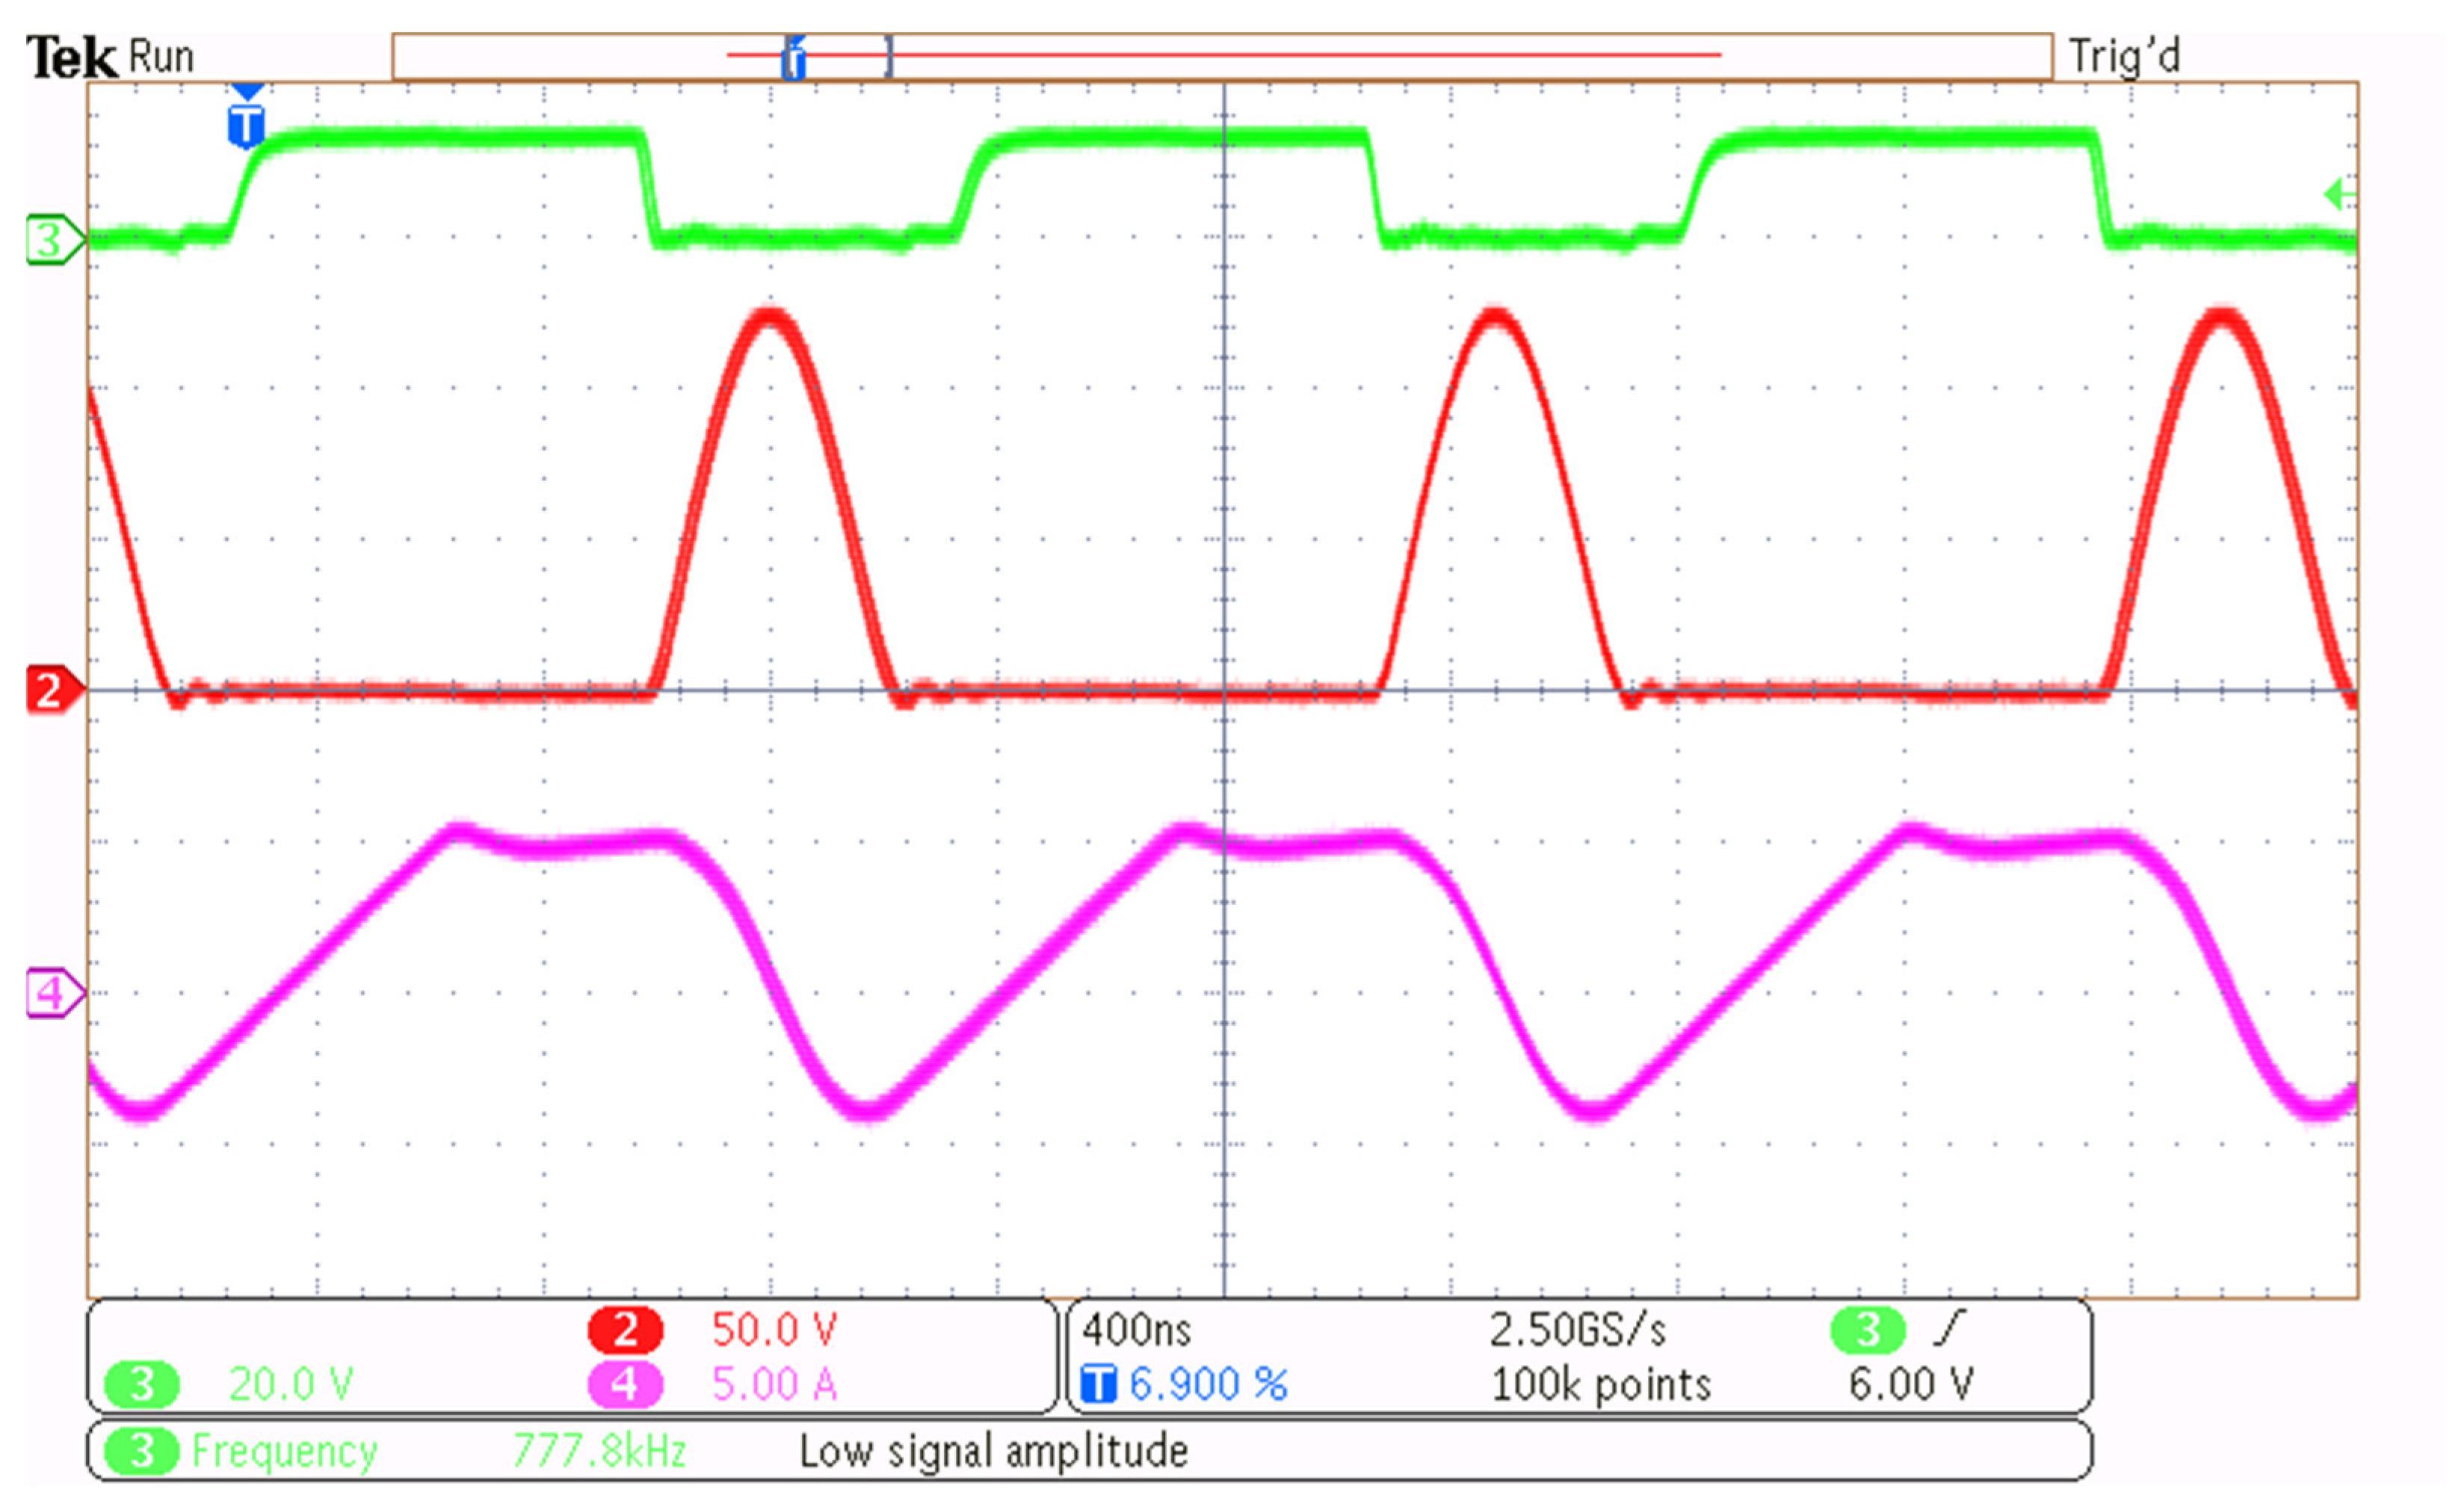
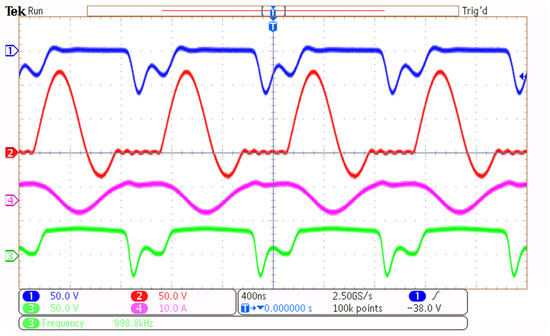
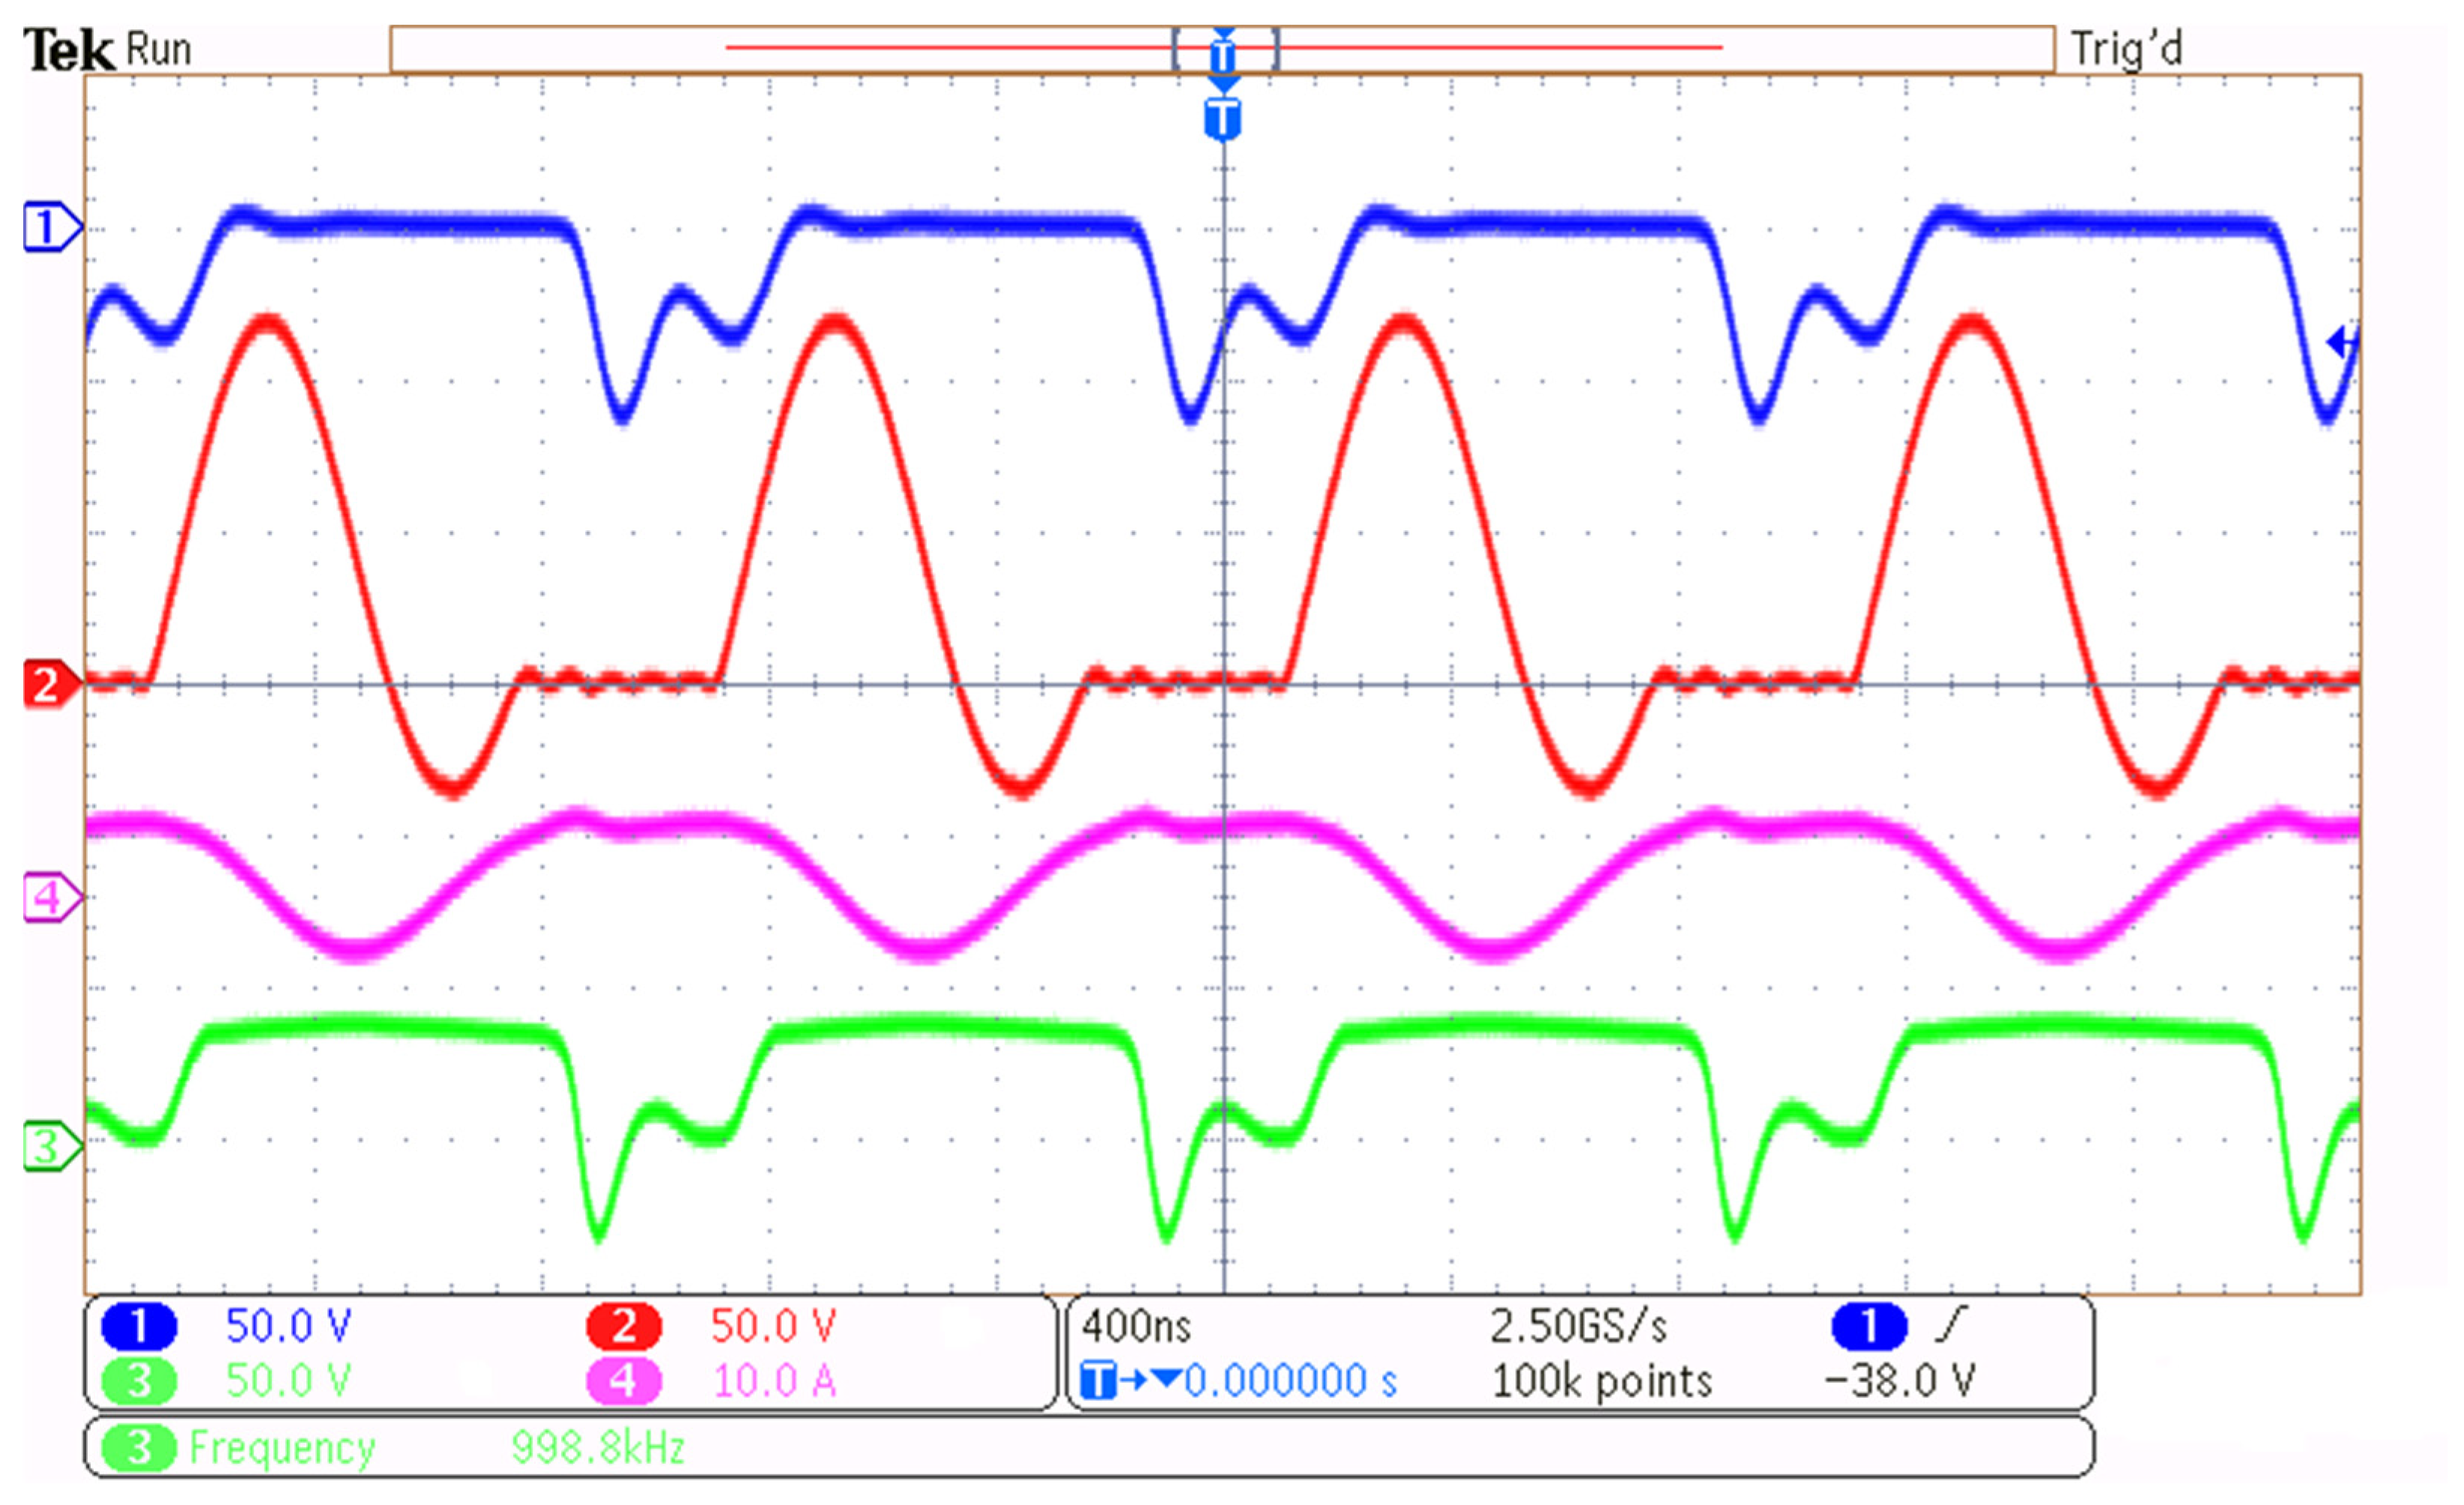
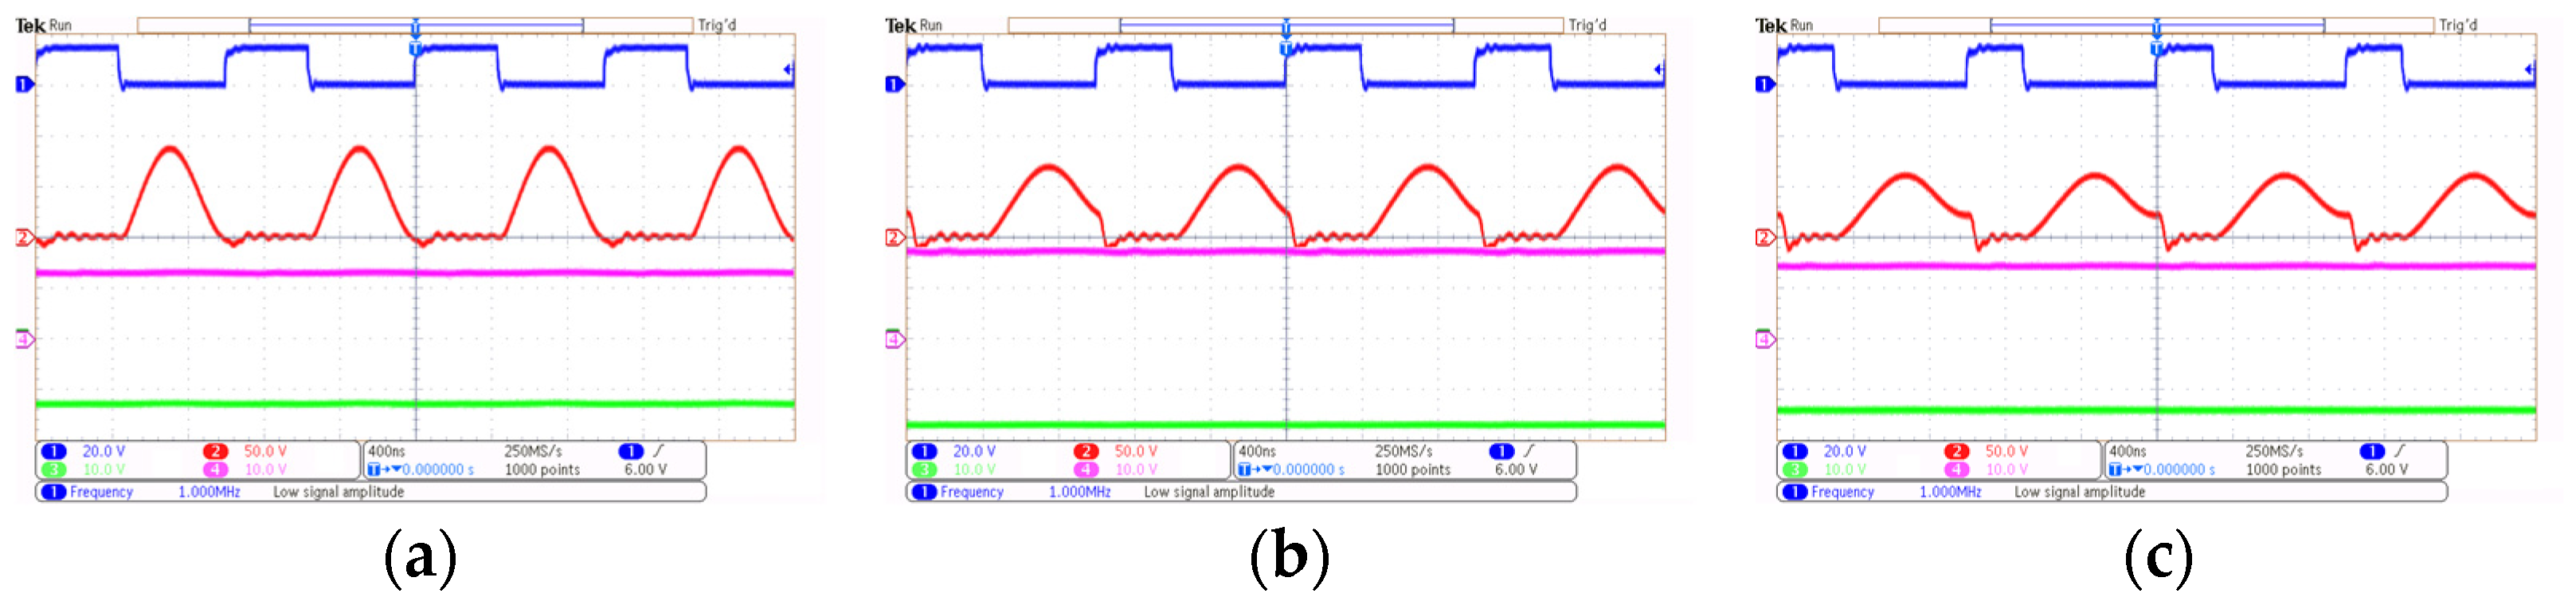
First, the resonant waveforms are presented to provide the switching behavior of the converter under different configurations. Figure 19 and Figure 20 show the experimental waveforms of the resonant voltage across the capacitor (red color waveform) and the resonant current through the inductor (pink color waveform) for the full-wave and half-wave configurations, respectively. The full-wave version operates at a switching frequency of 1 MHz, while the half-wave operates at 780 kHz. Both configurations are driven to achieve a voltage conversion ratio of 24 V to 12 V. Both versions correctly develop the resonant action: the full-wave configuration utilizes both current half-cycles, and the half-wave configuration operates on a single half-cycle. The semiconductor ratings predicted by the tool, including the maximum capacitor voltage and peak resonant inductor current, are summarized in Figure 11 and compared with simulation and experimental results. The tool estimates VCR,max = 121.77 V and iLR,max = 4.01 A, closely matching the simulation values of 122.57 V and 4.07 A, and showing minor deviations from the experimental measurements of 117.5 V and 3.92 A. The resulting relative errors are 0.47% and 1.72% with respect to simulations, and 3.83% and 2.04% with respect to experiments. These results indicate that the tool provides acceptable predictions of semiconductor stress and can be reliably used for design purposes, with minor discrepancies arising mainly from non-idealities in the experimental prototype. It is important to contextualize the components used in the experimental prototype. In these QRC topologies, the resonant tank alters the switch waveforms to enable soft-switching, causing the maximum drain-source voltage to significantly exceed the input voltage. As theoretically modeled (Figure 6 and Figure 7) and calculated by the design tool for the tested 24 V to 12 V conversion (a standard and useful ratio for auxiliary power supplies), the peak voltage stress reaches around 120 V. However, the 650 V GaN MOSFET was selected to provide the system with enhanced operational versatility, since the proposed converter family allows step-up and step-down capabilities, it is designed to operate across a wider range of conversion ratios. In regimes where higher voltage gains are required, the peak drain-source voltage stress increases substantially. Therefore, the selection of this semiconductor allows for the validation of the converter’s performance across diverse operating conditions and higher voltage stress scenarios for reliable high-frequency proof-of-concept testing. Air-core inductors were chosen for the resonant tank in these prototypes to eliminate high-frequency core losses at 1 MHz and prevent magnetic core saturation.
Figure 19.
Most relevant resonant waveforms in ZVS SEPIC–Cuk full-wave M type converter (Figure 3a). CH 2: VCR. CH 3: Gate signal. CH 4: Resonant inductor current iLR.
Figure 20.
Most relevant resonant waveforms in ZVS SEPIC–Cuk half-wave converter. CH 2: VCR. CH 3: Gate signal. CH 4: Resonant inductor current iLR.
It is worth noting the presence of minor high-frequency ringing in the experimental waveforms, particularly visible in the resonant capacitor voltage VCR. At operating frequencies near 1 MHz, small parasitic elements (such as stray inductances introduced by the PCB layout) inevitably couple with the circuit components to produce these oscillations. While minimizing this ringing requires a highly optimized PCB layout design, the overall impact must be evaluated relatively. Although this ringing introduces some associated losses, the proposed quasi-resonant topology’s inherently lower switching losses compensate for them compared to hard-switched alternatives near 1 MHz. By achieving Zero-Voltage Switching, the high dv/dt and di/dt transitions inherent to PWM converters are drastically reduced, minimizing switching losses and electromagnetic interference. This inherent EMI mitigation is critical for implementations at 1 MHz, where traditional hard switching would result in significantly higher interference levels.
To analyze the impact of these parasitic elements, additional measurements were taken at some points in the circuit. Figure 21 shows the voltage waveforms at the common node between the filter inductors and the voltage across one of the output freewheeling diodes. These high-frequency transients occur primarily from the resonance between the diode’s parasitic junction capacitance and the stray inductances of the PCB traces and magnetic components when the semiconductors block voltage. However, despite the presence of this ringing at these specific nodes, the primary resonant waveforms (the current through the resonant inductor iLR and the voltage across the resonant capacitor VCR) maintain their expected continuous resonant action, confirming that the localized parasitic oscillations do not affect the fundamental soft-switching mechanism.
Figure 21.
Experimental waveforms highlighting parasitic oscillations at critical circuit nodes at 1 MHz. CH 1: Voltage across the output freewheeling diode. CH 2: Resonant capacitor voltage VCR. CH 3: Voltage at the node between the inductors. CH 4: Resonant inductor current iLR.
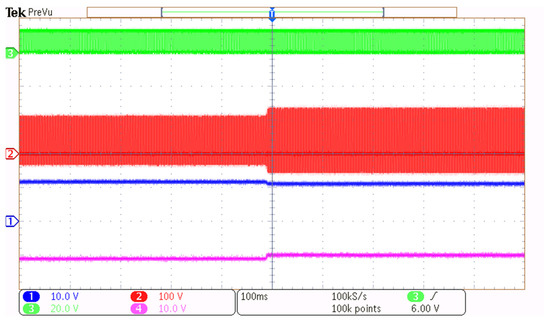
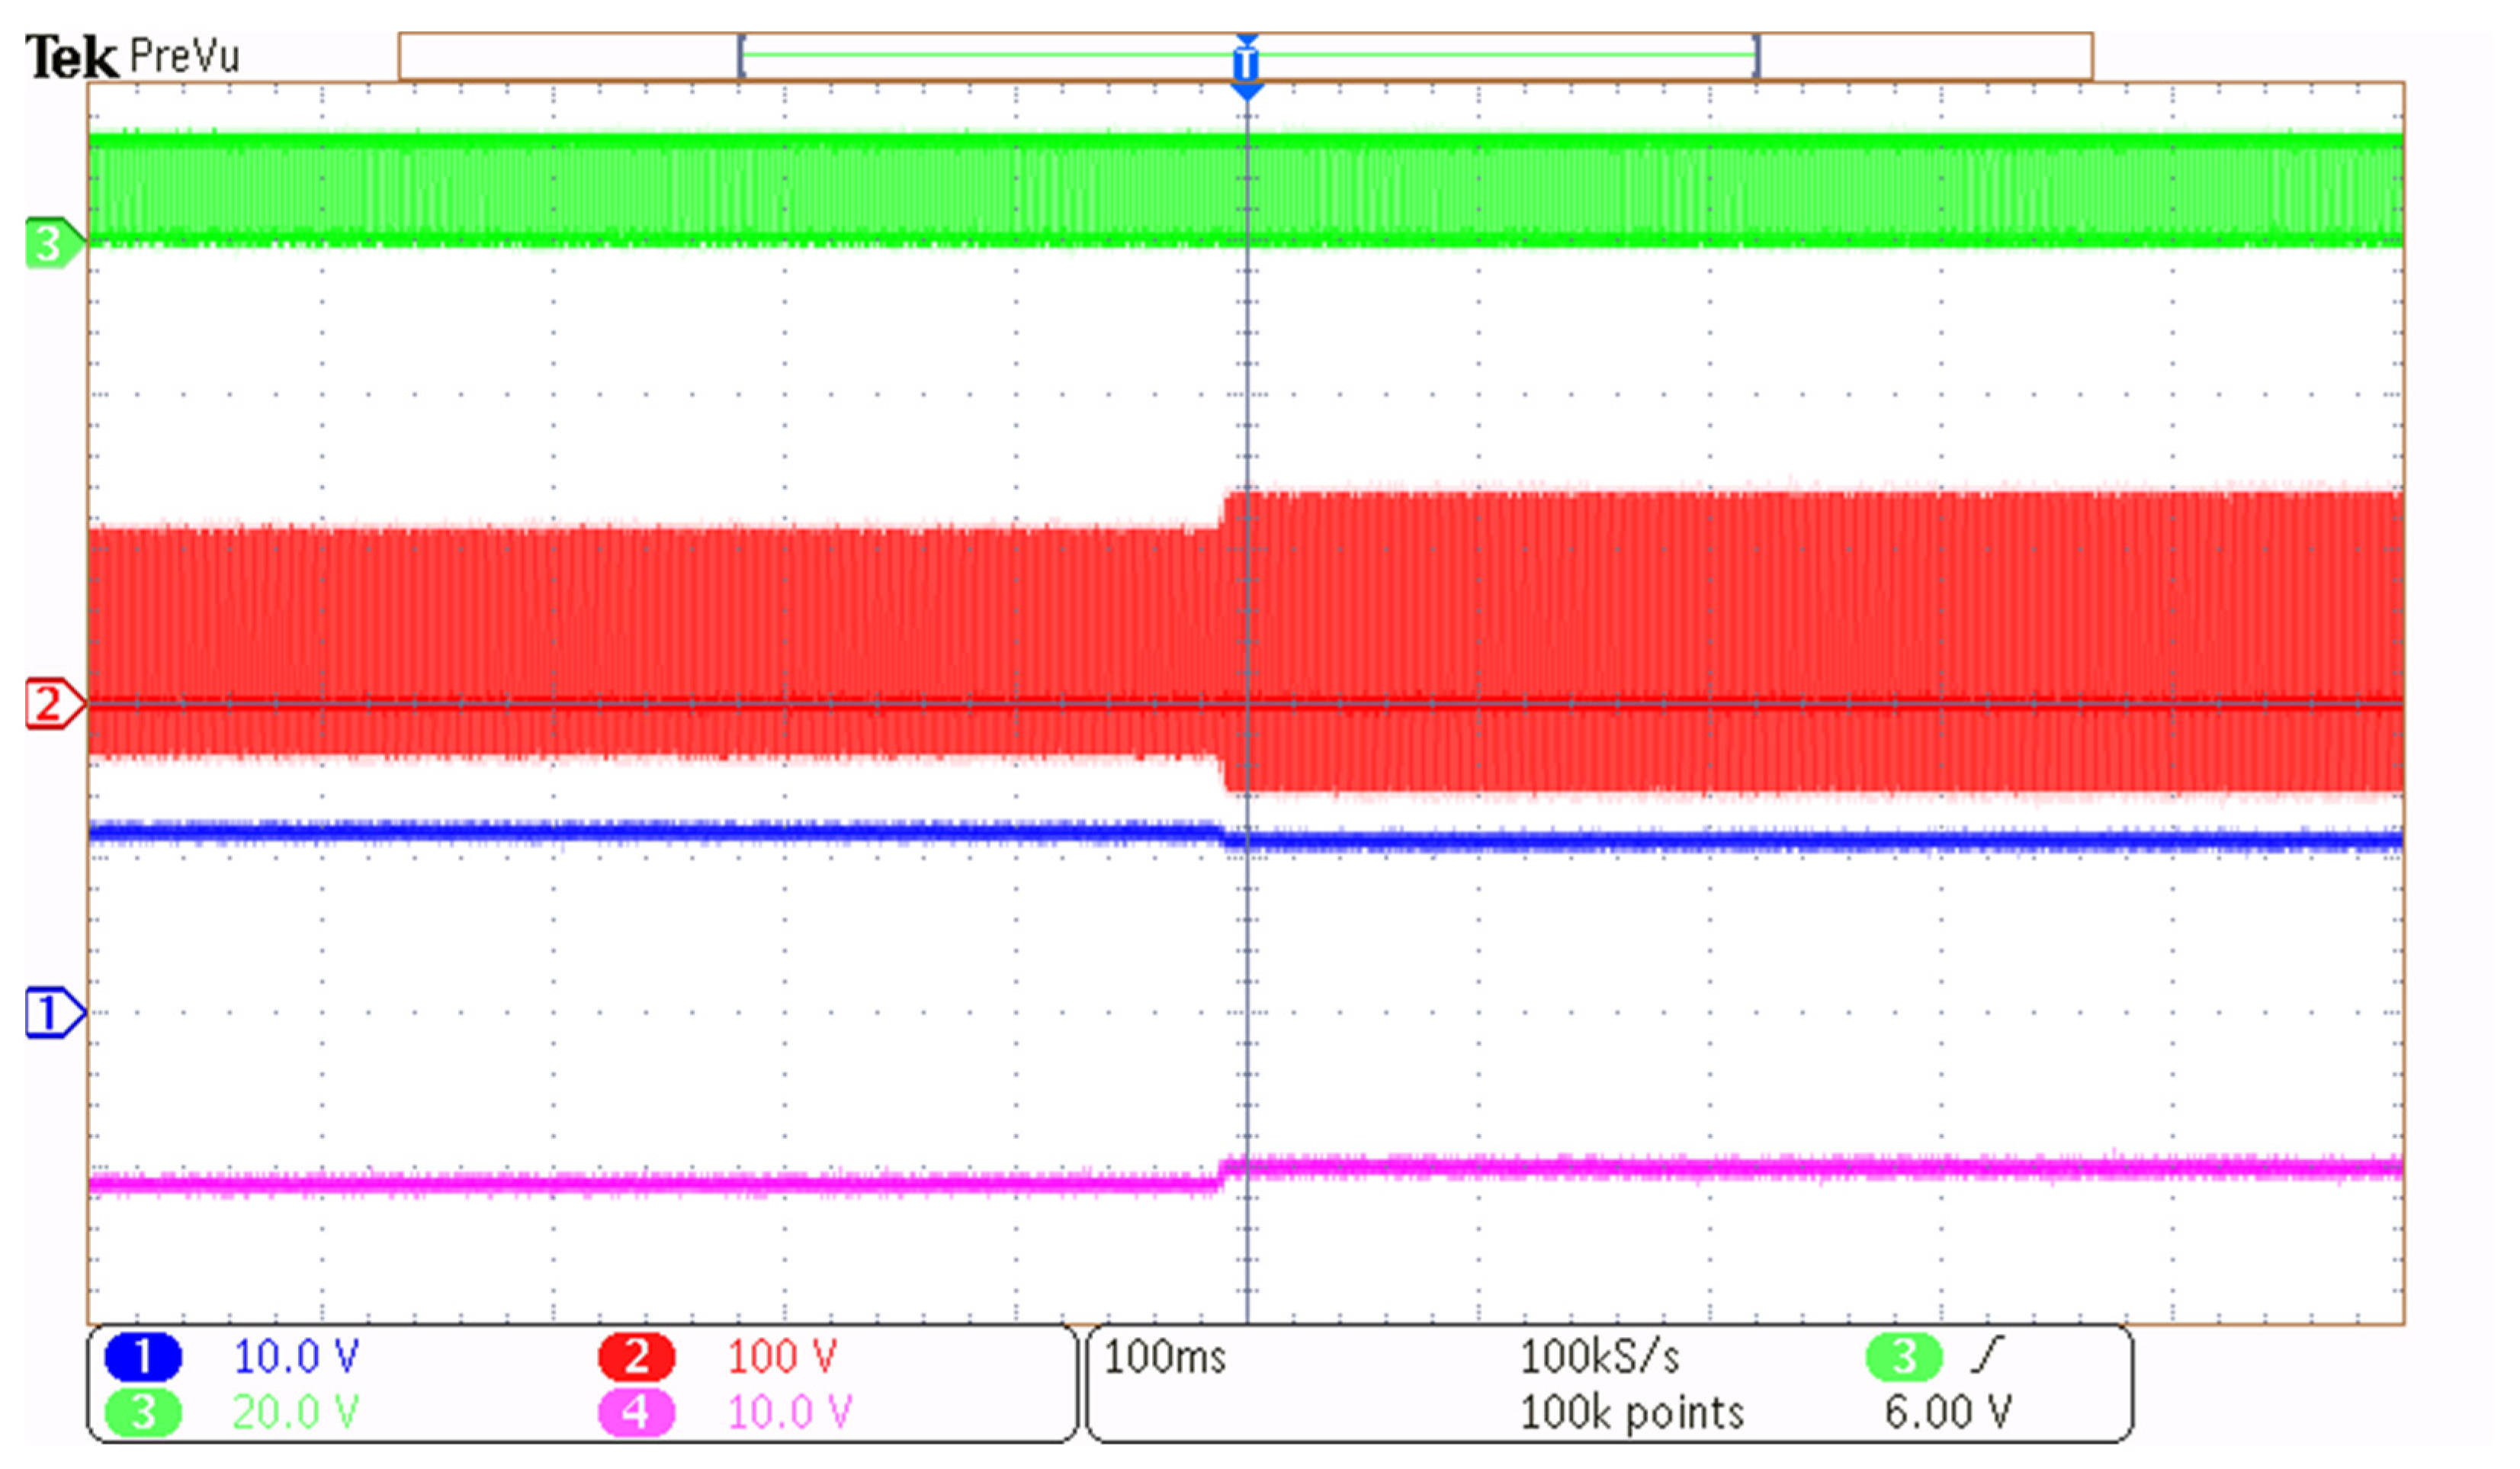
A second experimental test was conducted to evaluate the response of the converters under varying load conditions. For each prototype, the load resistance was adjusted from 8 Ω to 4.4 Ω while maintaining the same switching frequency, in order to assess the ability of the converter to maintain stable output voltage and current across a range of resistive loads. These results are shown in Figure 22 and Figure 23. It can be observed that the output voltage in the half-wave versions is more sensitive to load variations, exhibiting a more noticeable drop as the load increases. In contrast, the full-wave versions compensate for these changes by adjusting the amplitude of the oscillations in the resonant tank, thereby maintaining better voltage regulation.
Figure 22.
Output voltage and resonant response to load variations from 8 to 4.44 Ω in ZVS SEPIC–Cuk full-wave M-type converter (Figure 3a). CH 1: Vo+. CH 2: VCR. CH 3: Gate signal. CH 4: Vo−.
Figure 23.
Output voltage and resonant response to load variations from 8 to 4.44 Ω in ZVS SEPIC–Cuk half-wave converter. CH 1: Vo+. CH 2: VCR. CH 3: Gate signal. CH 4: Vo−.
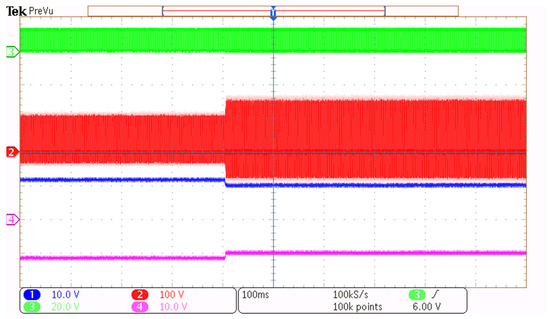
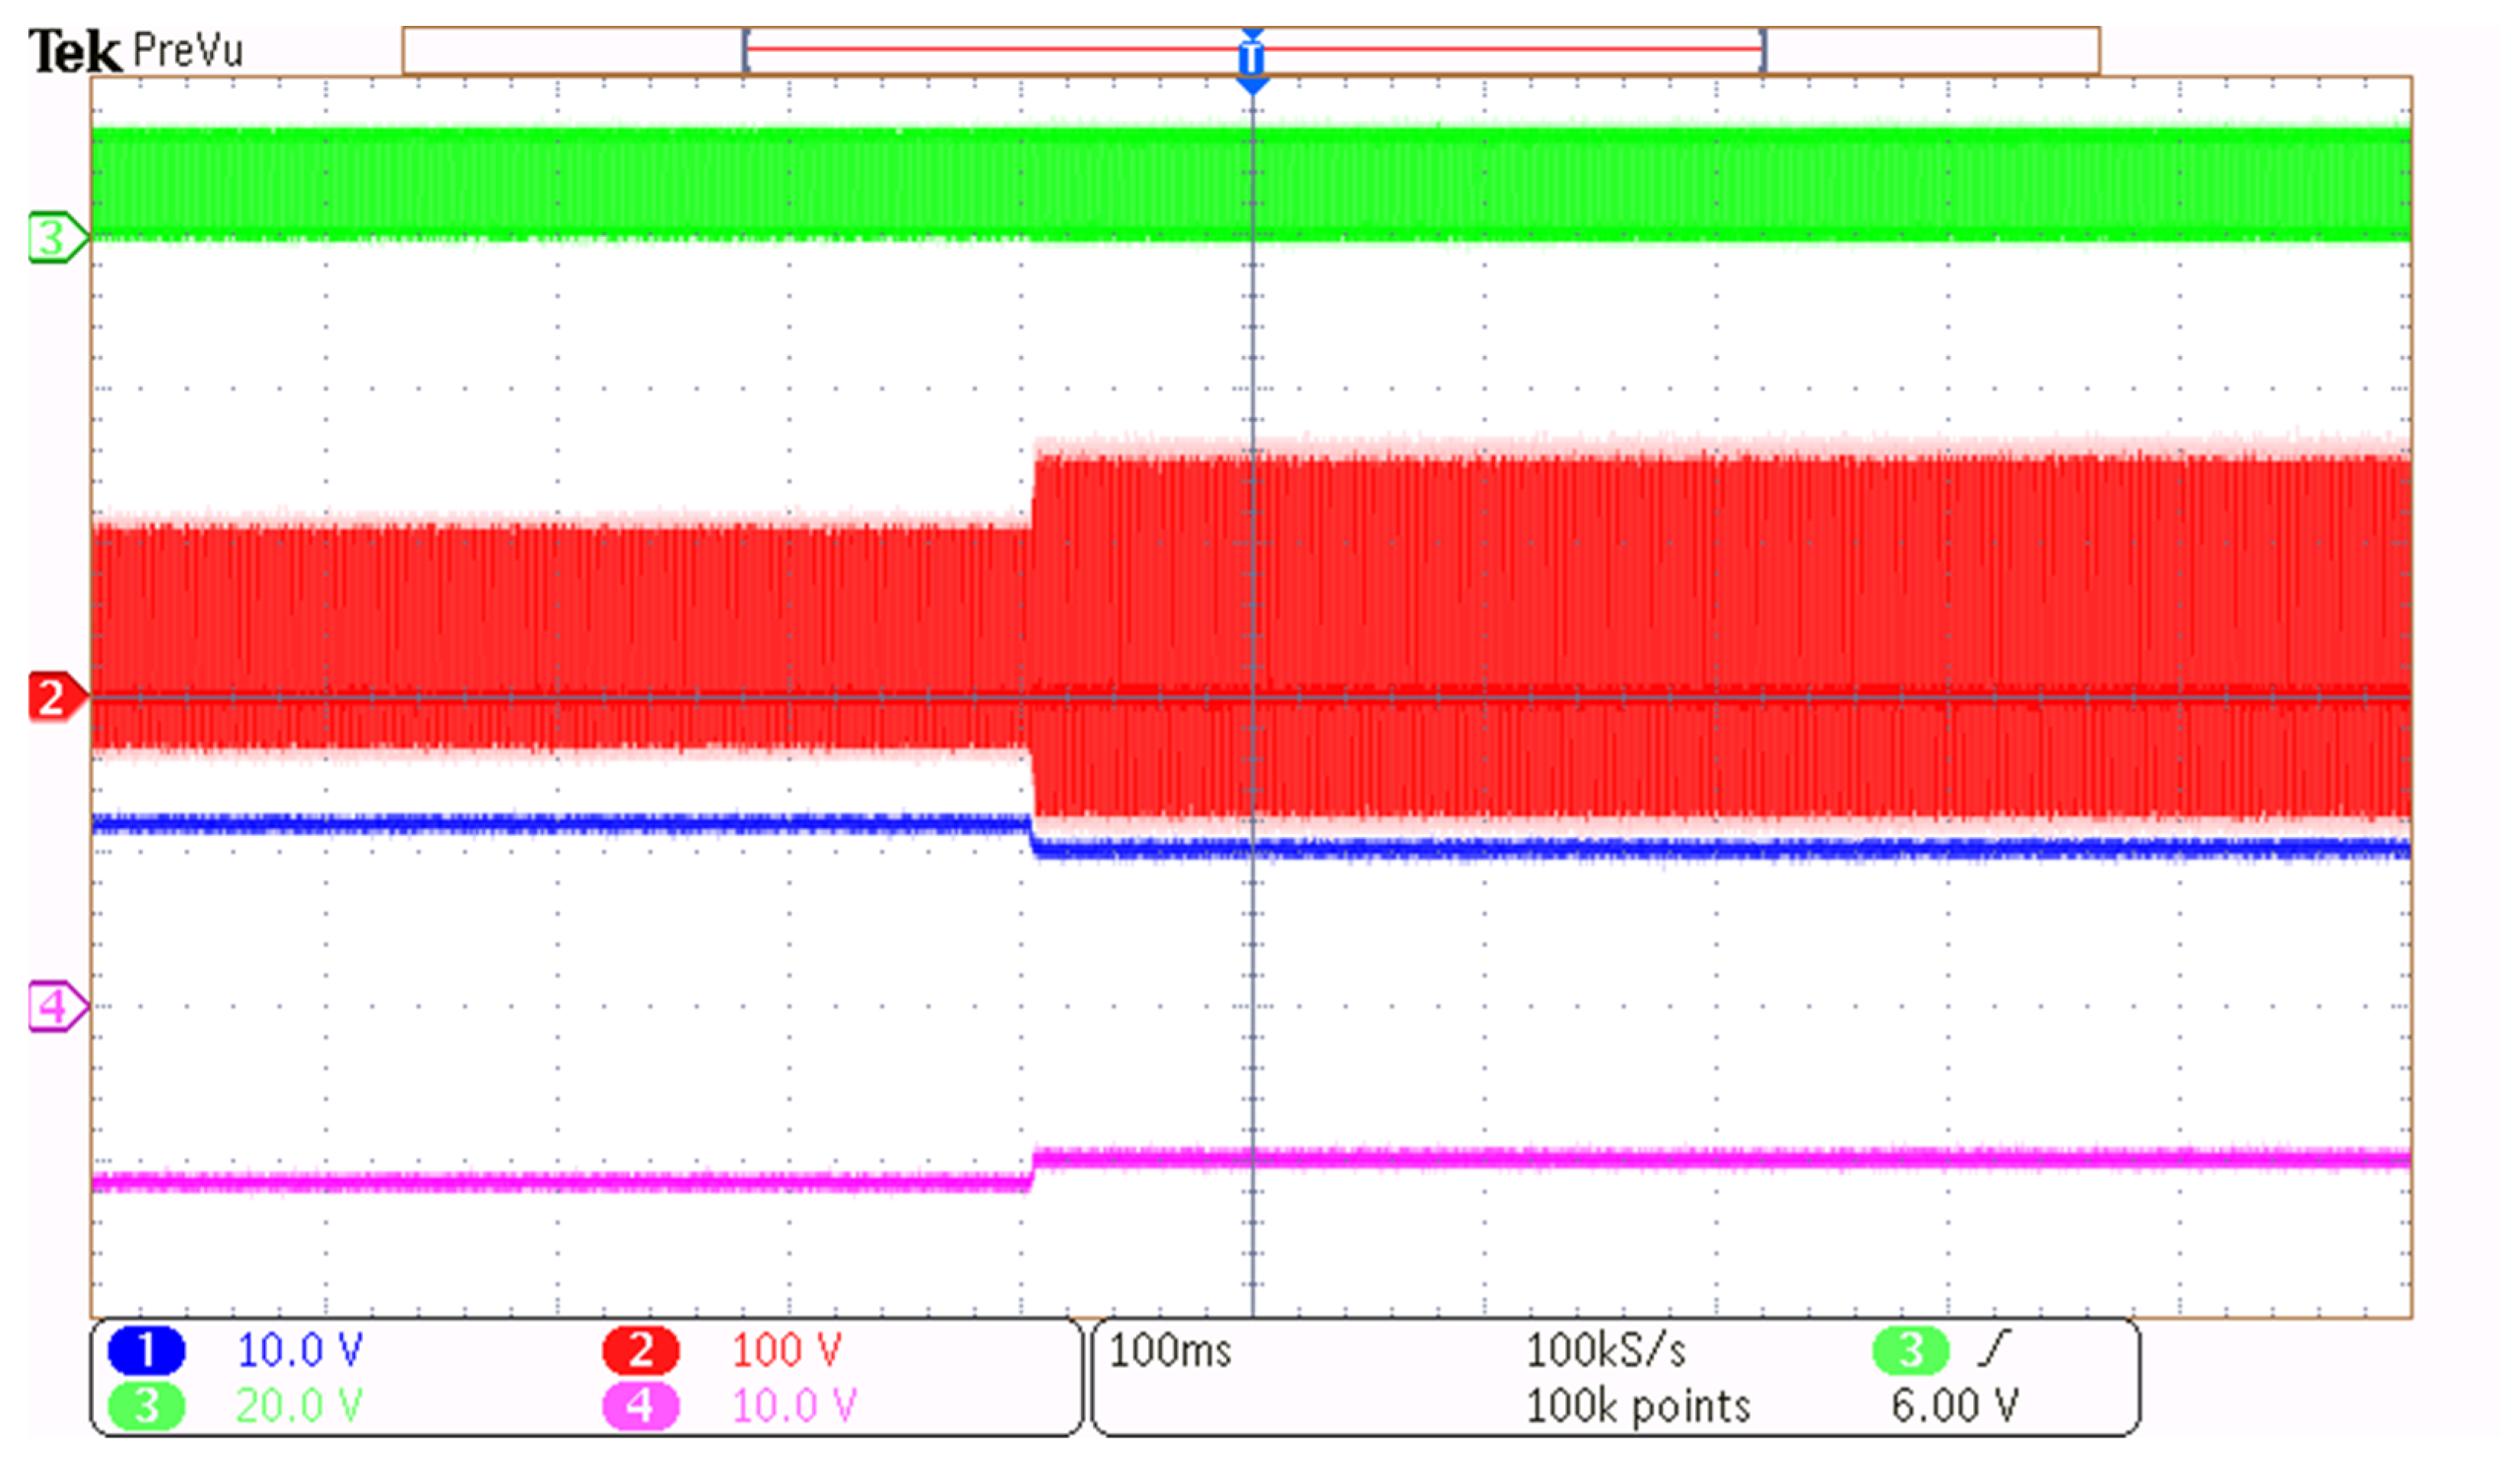
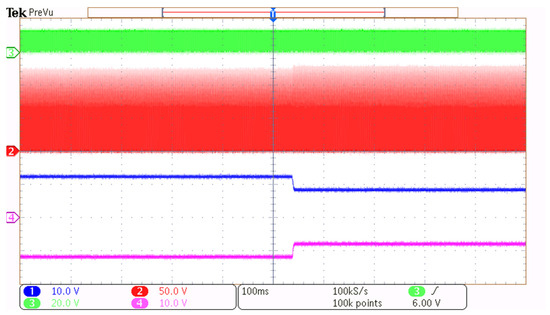
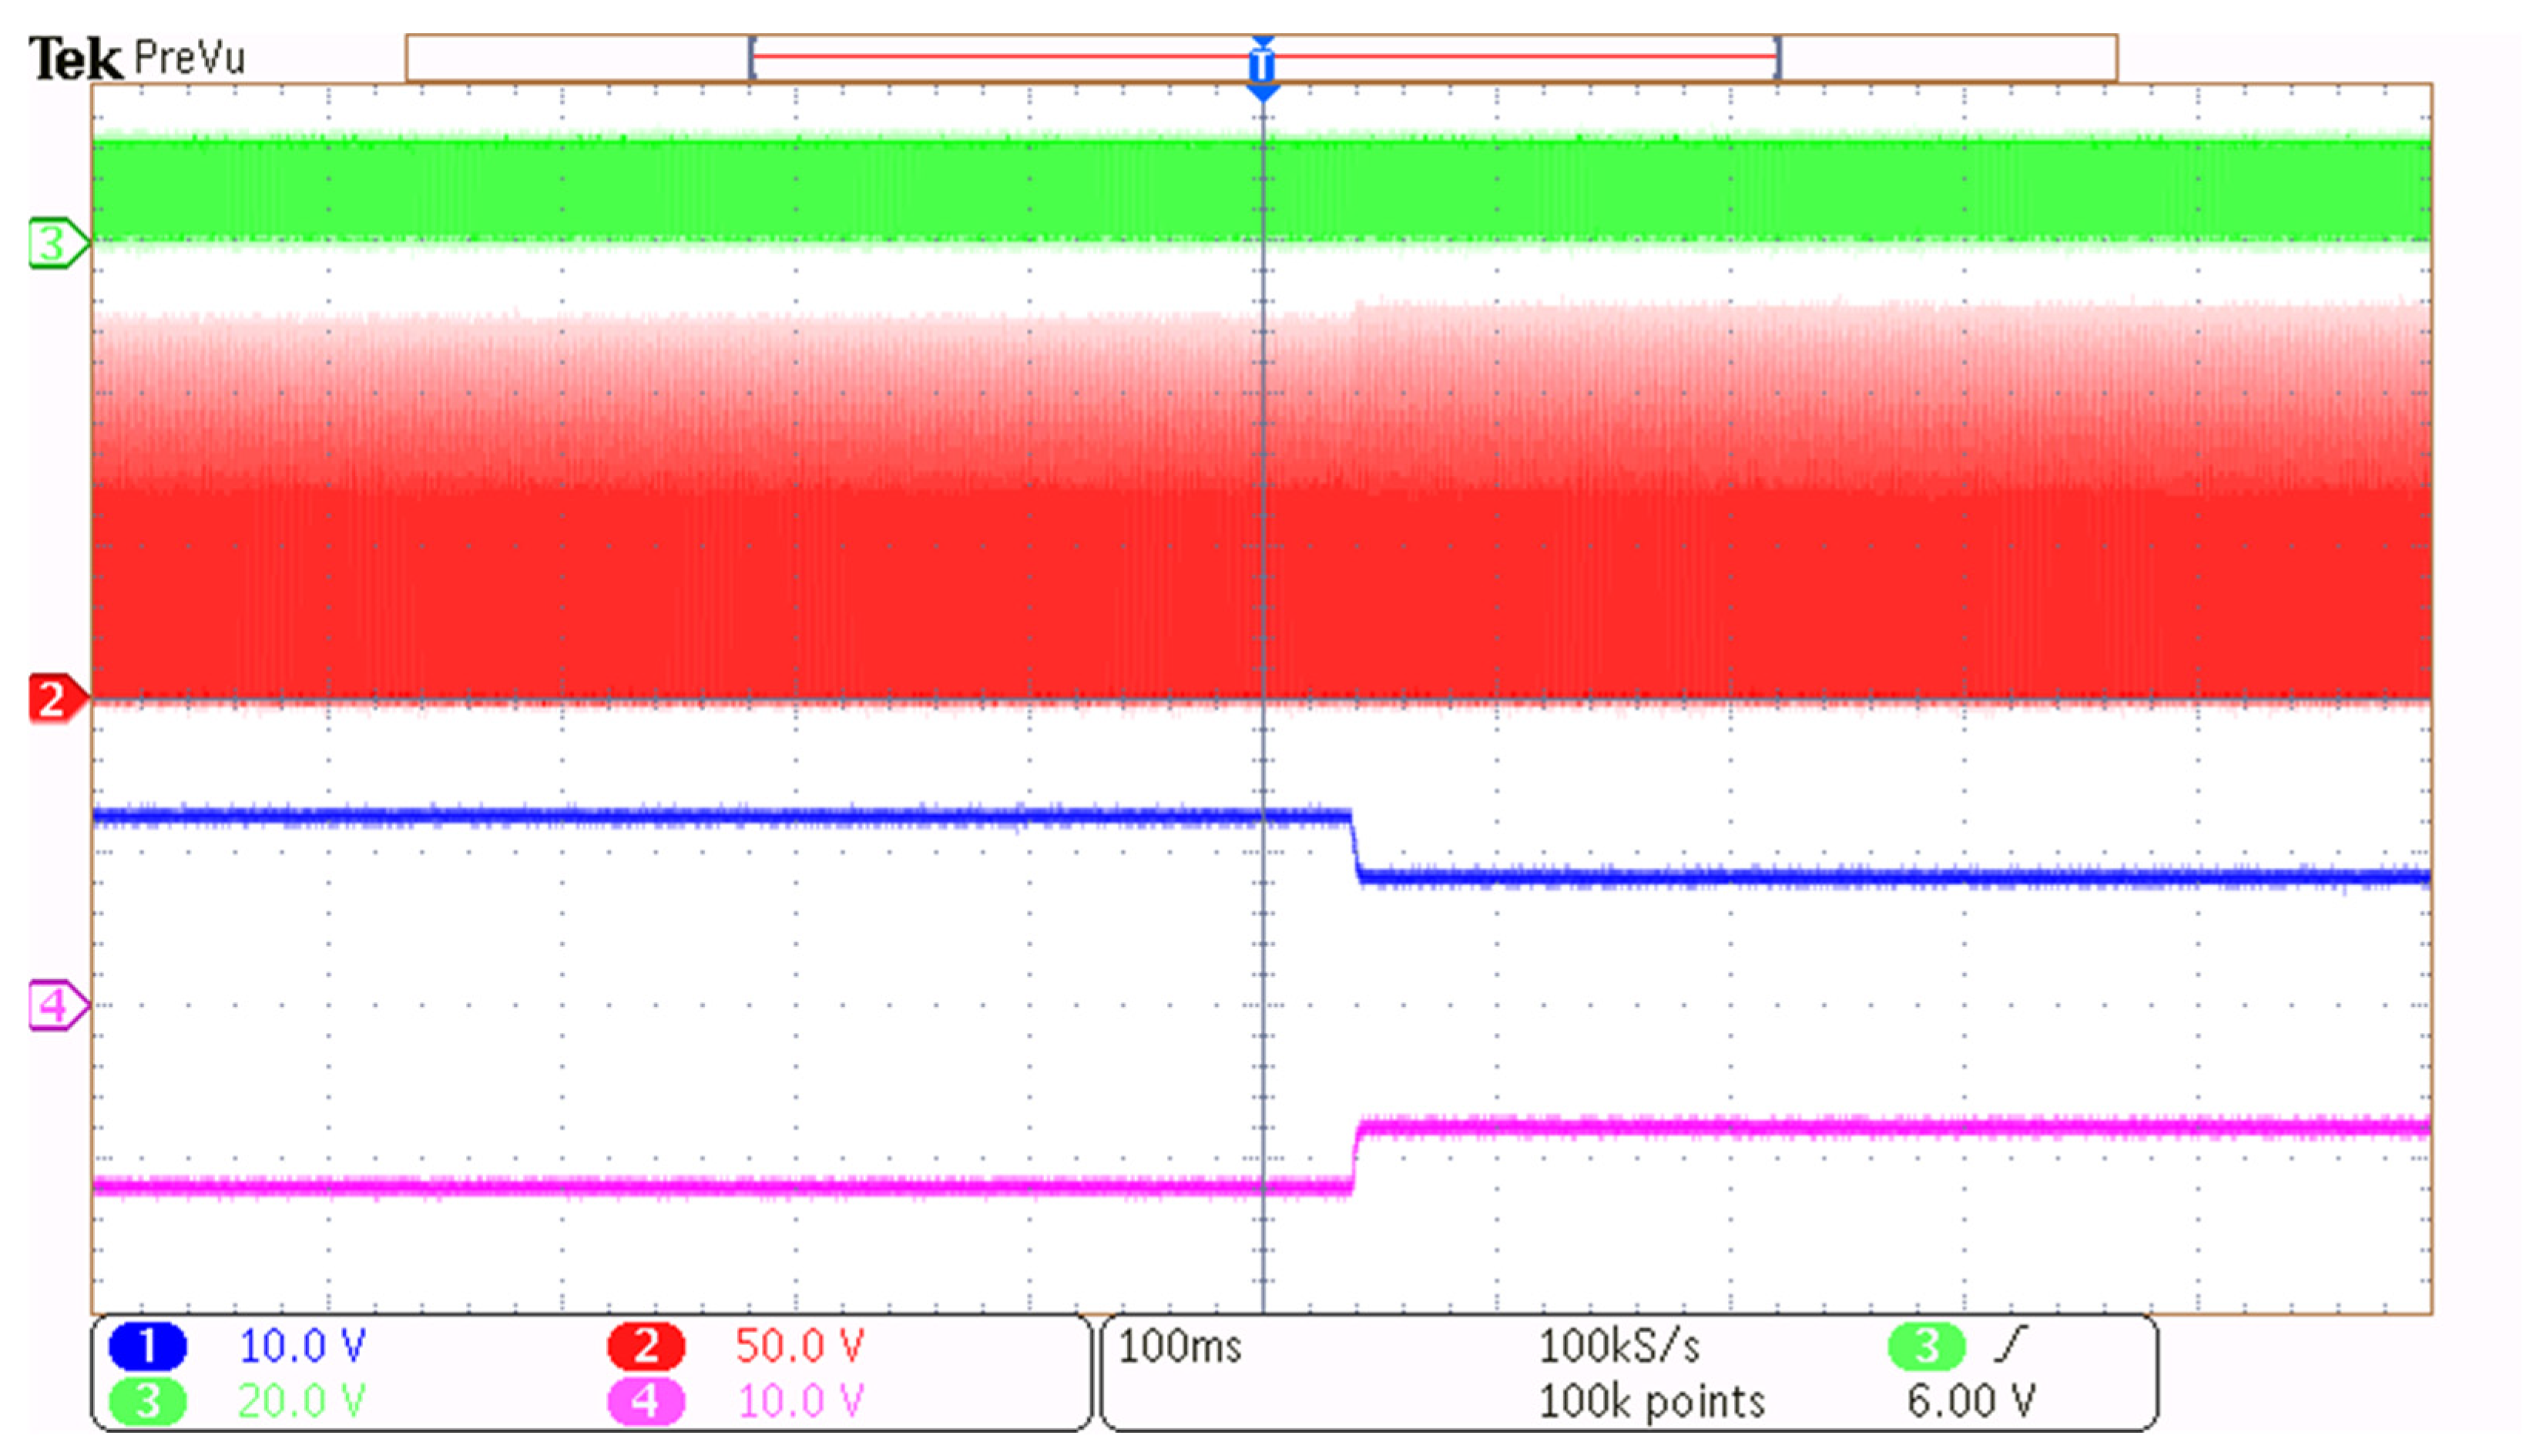
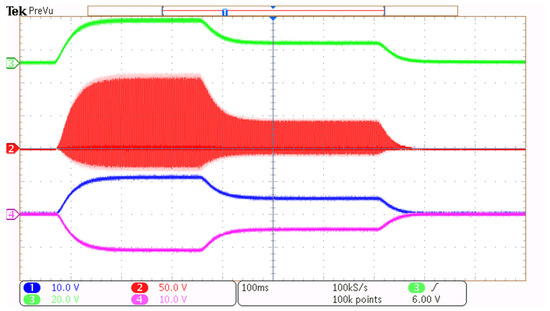
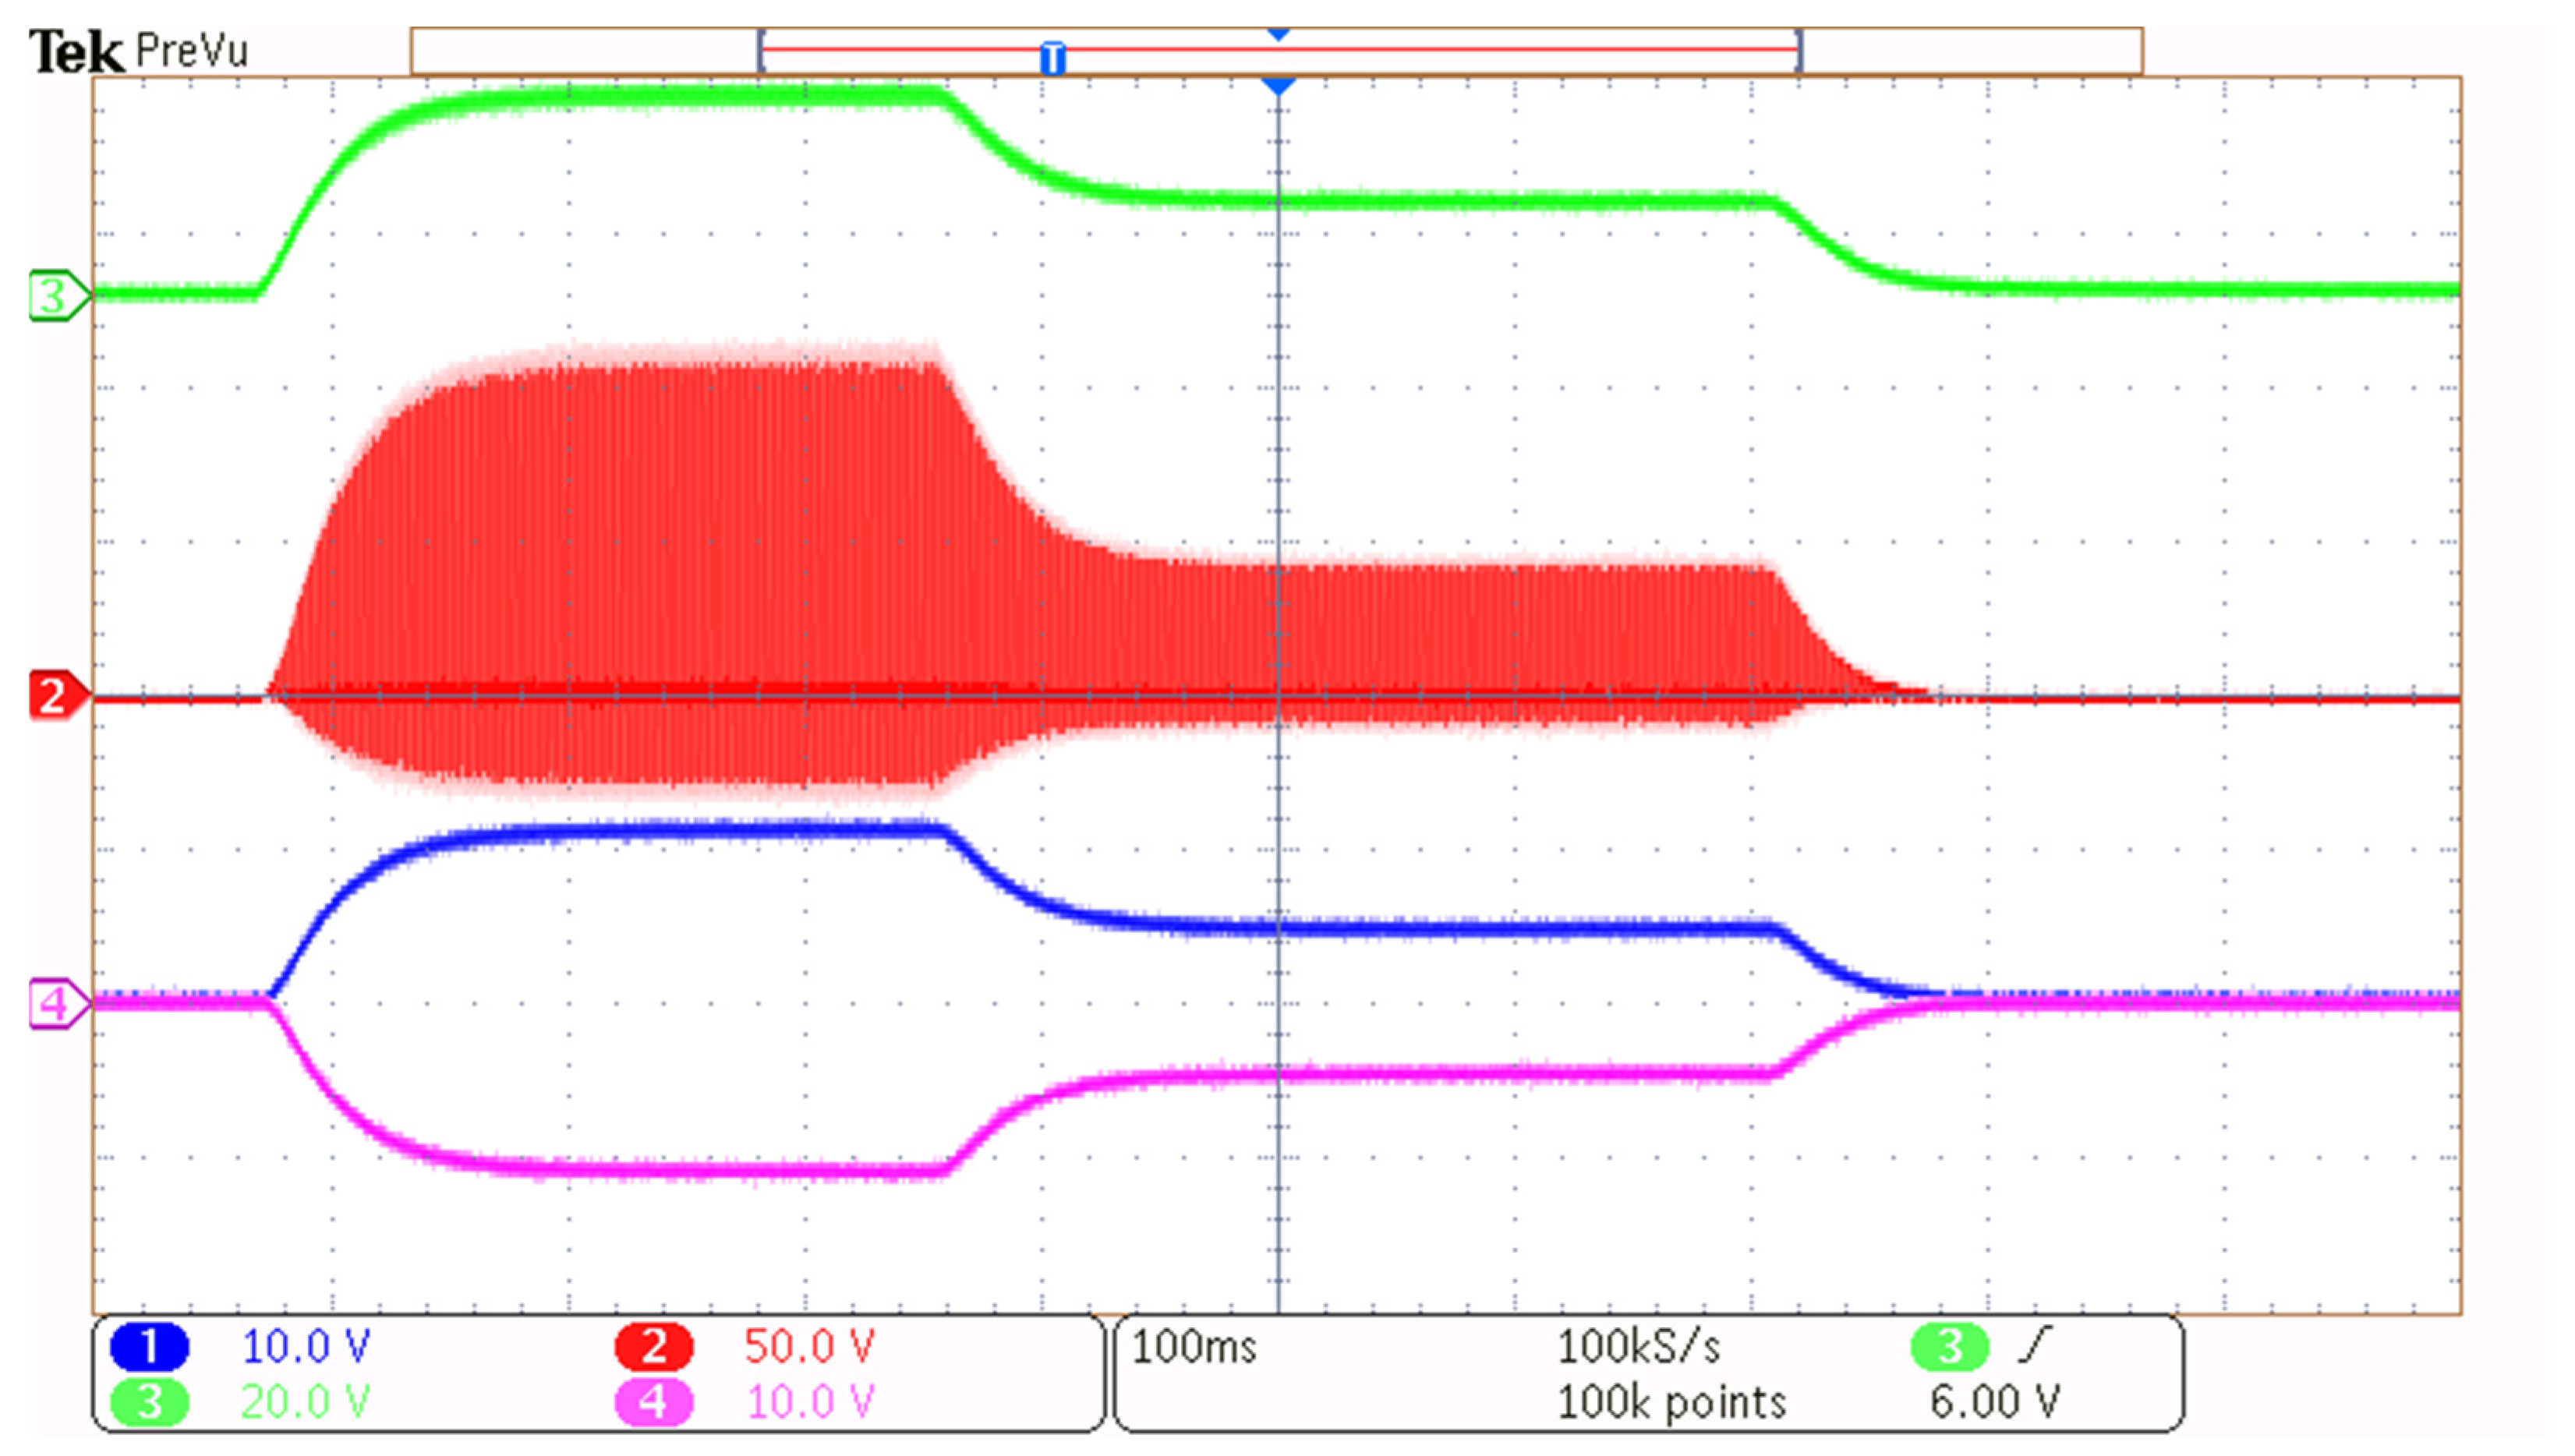
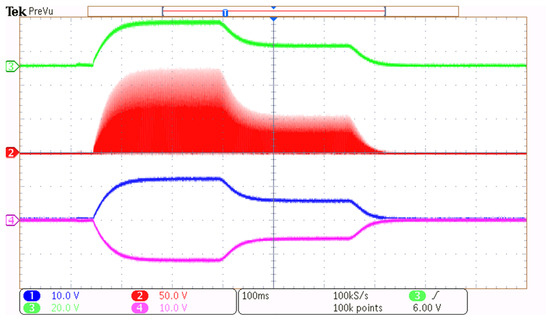
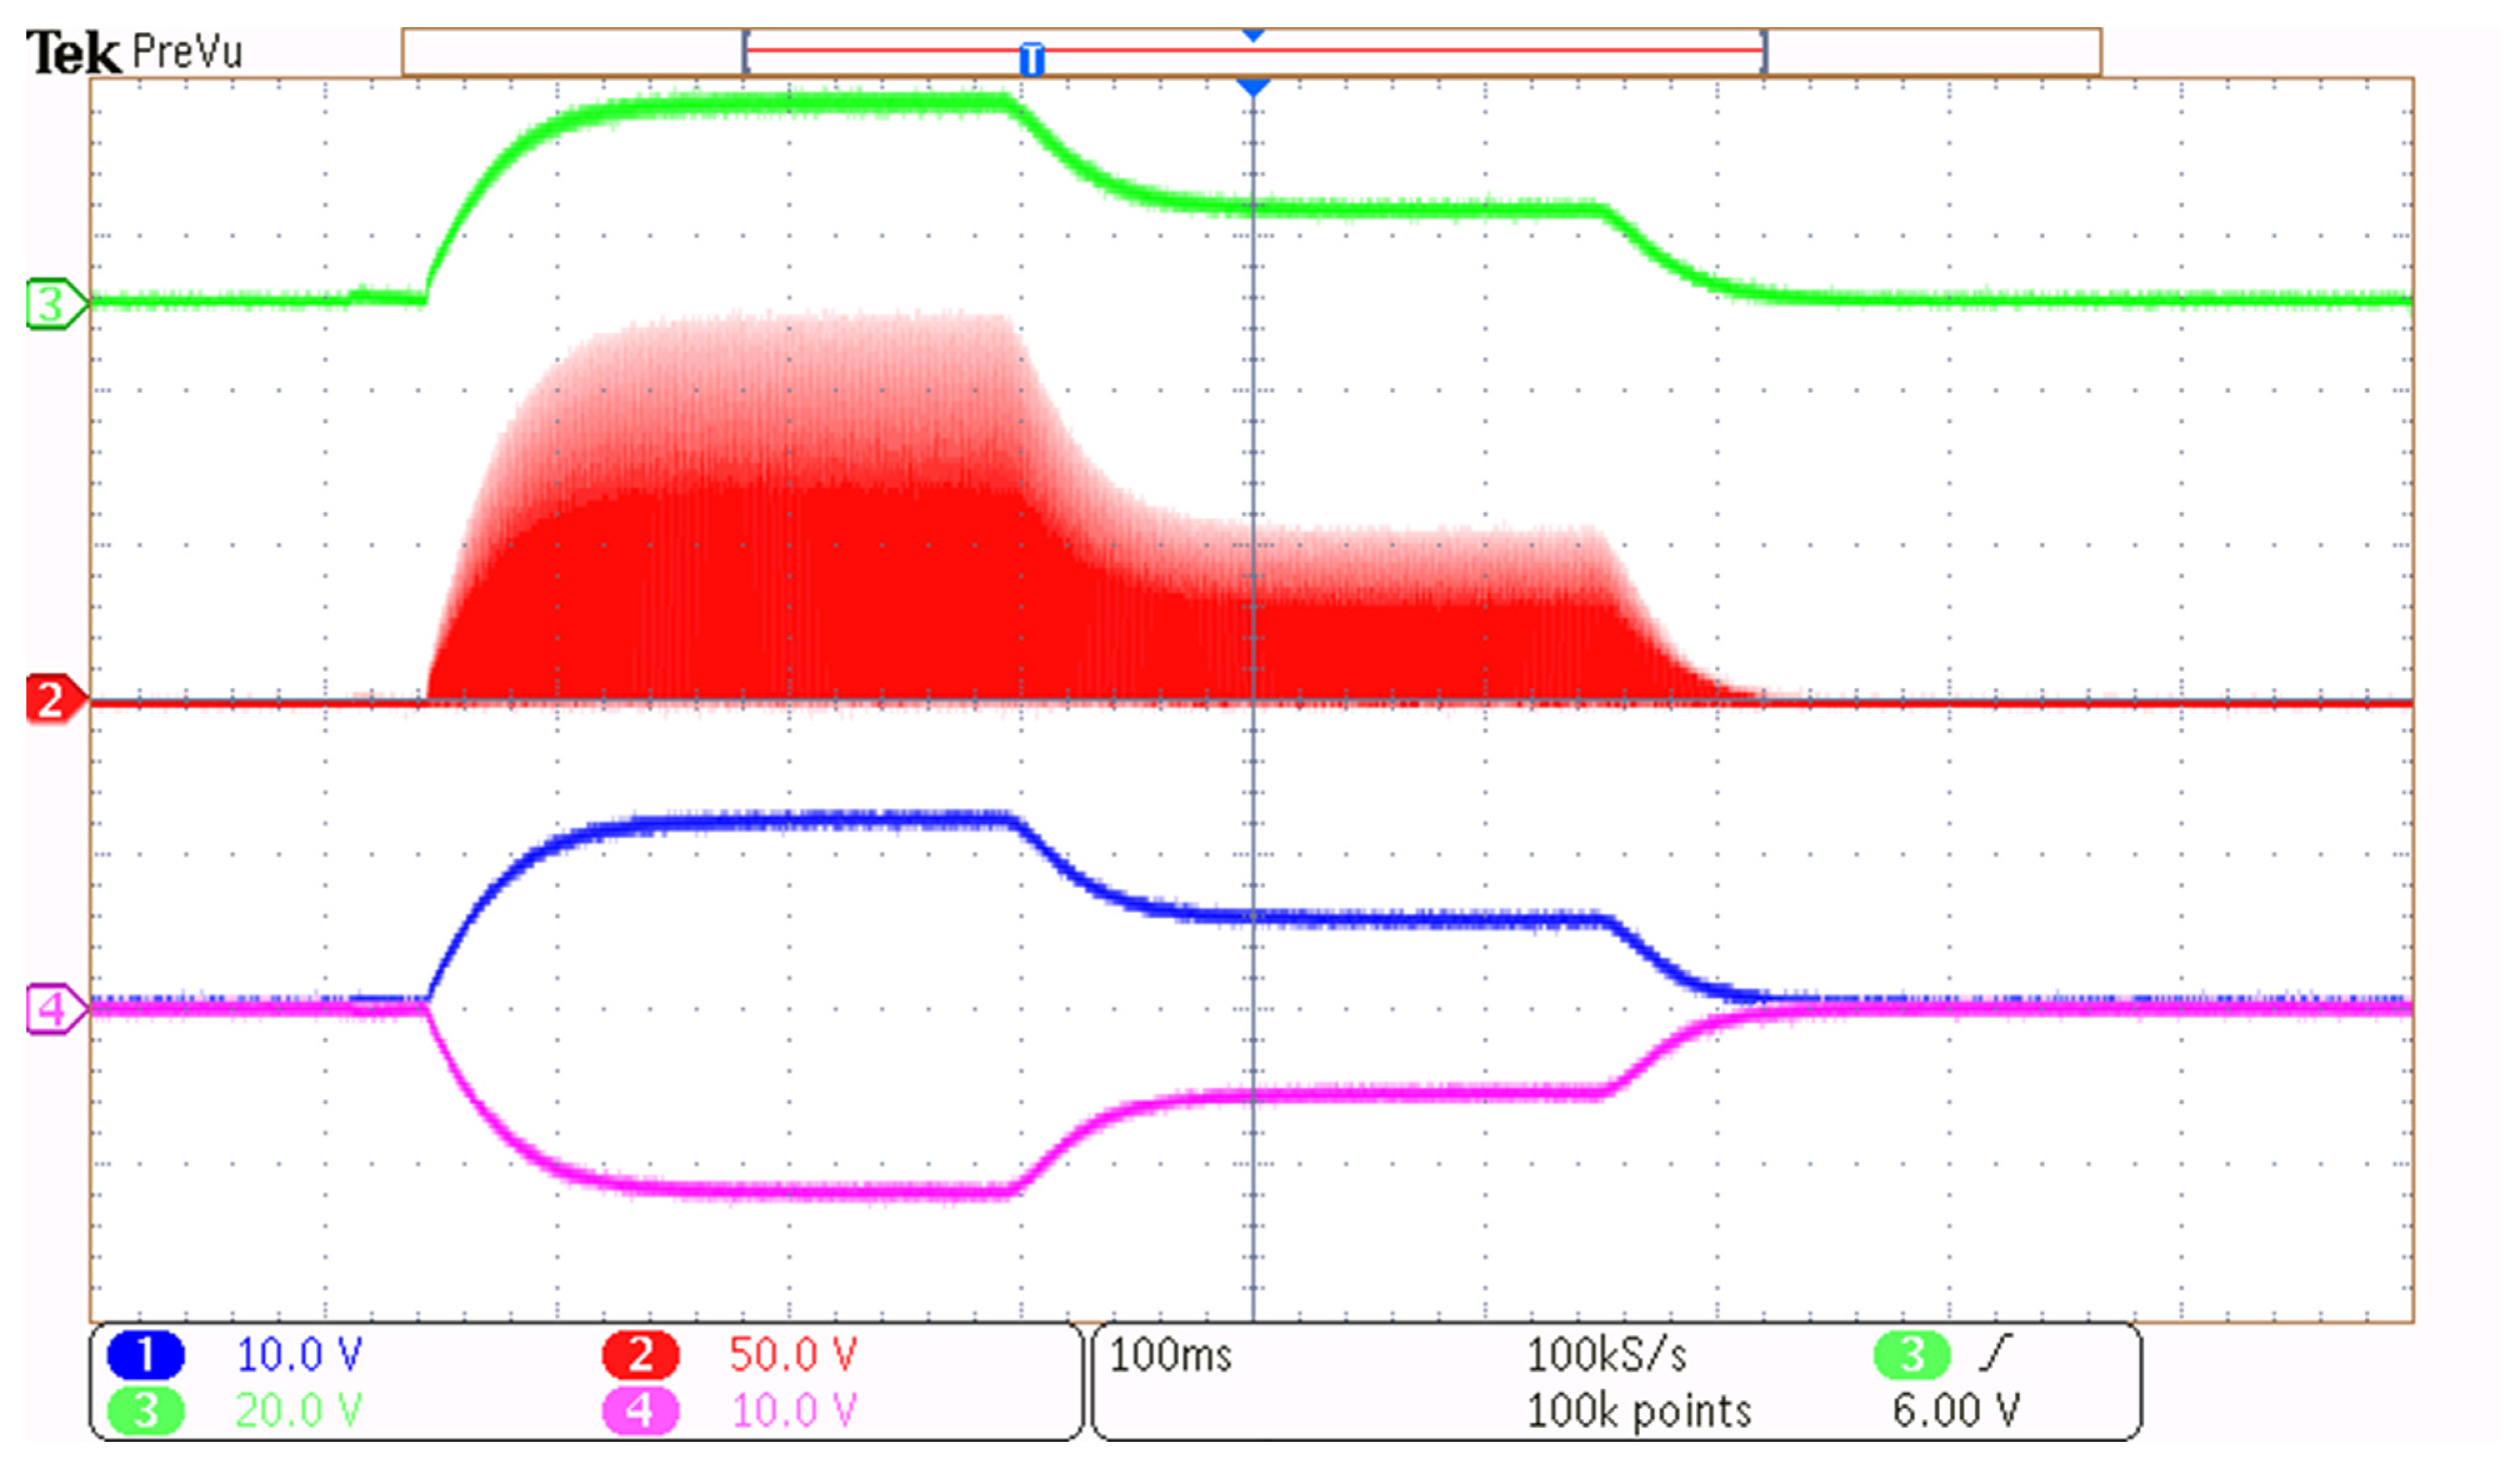
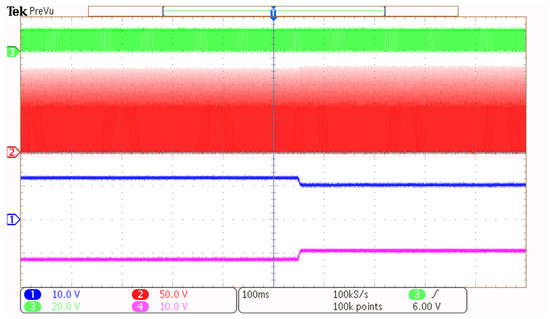
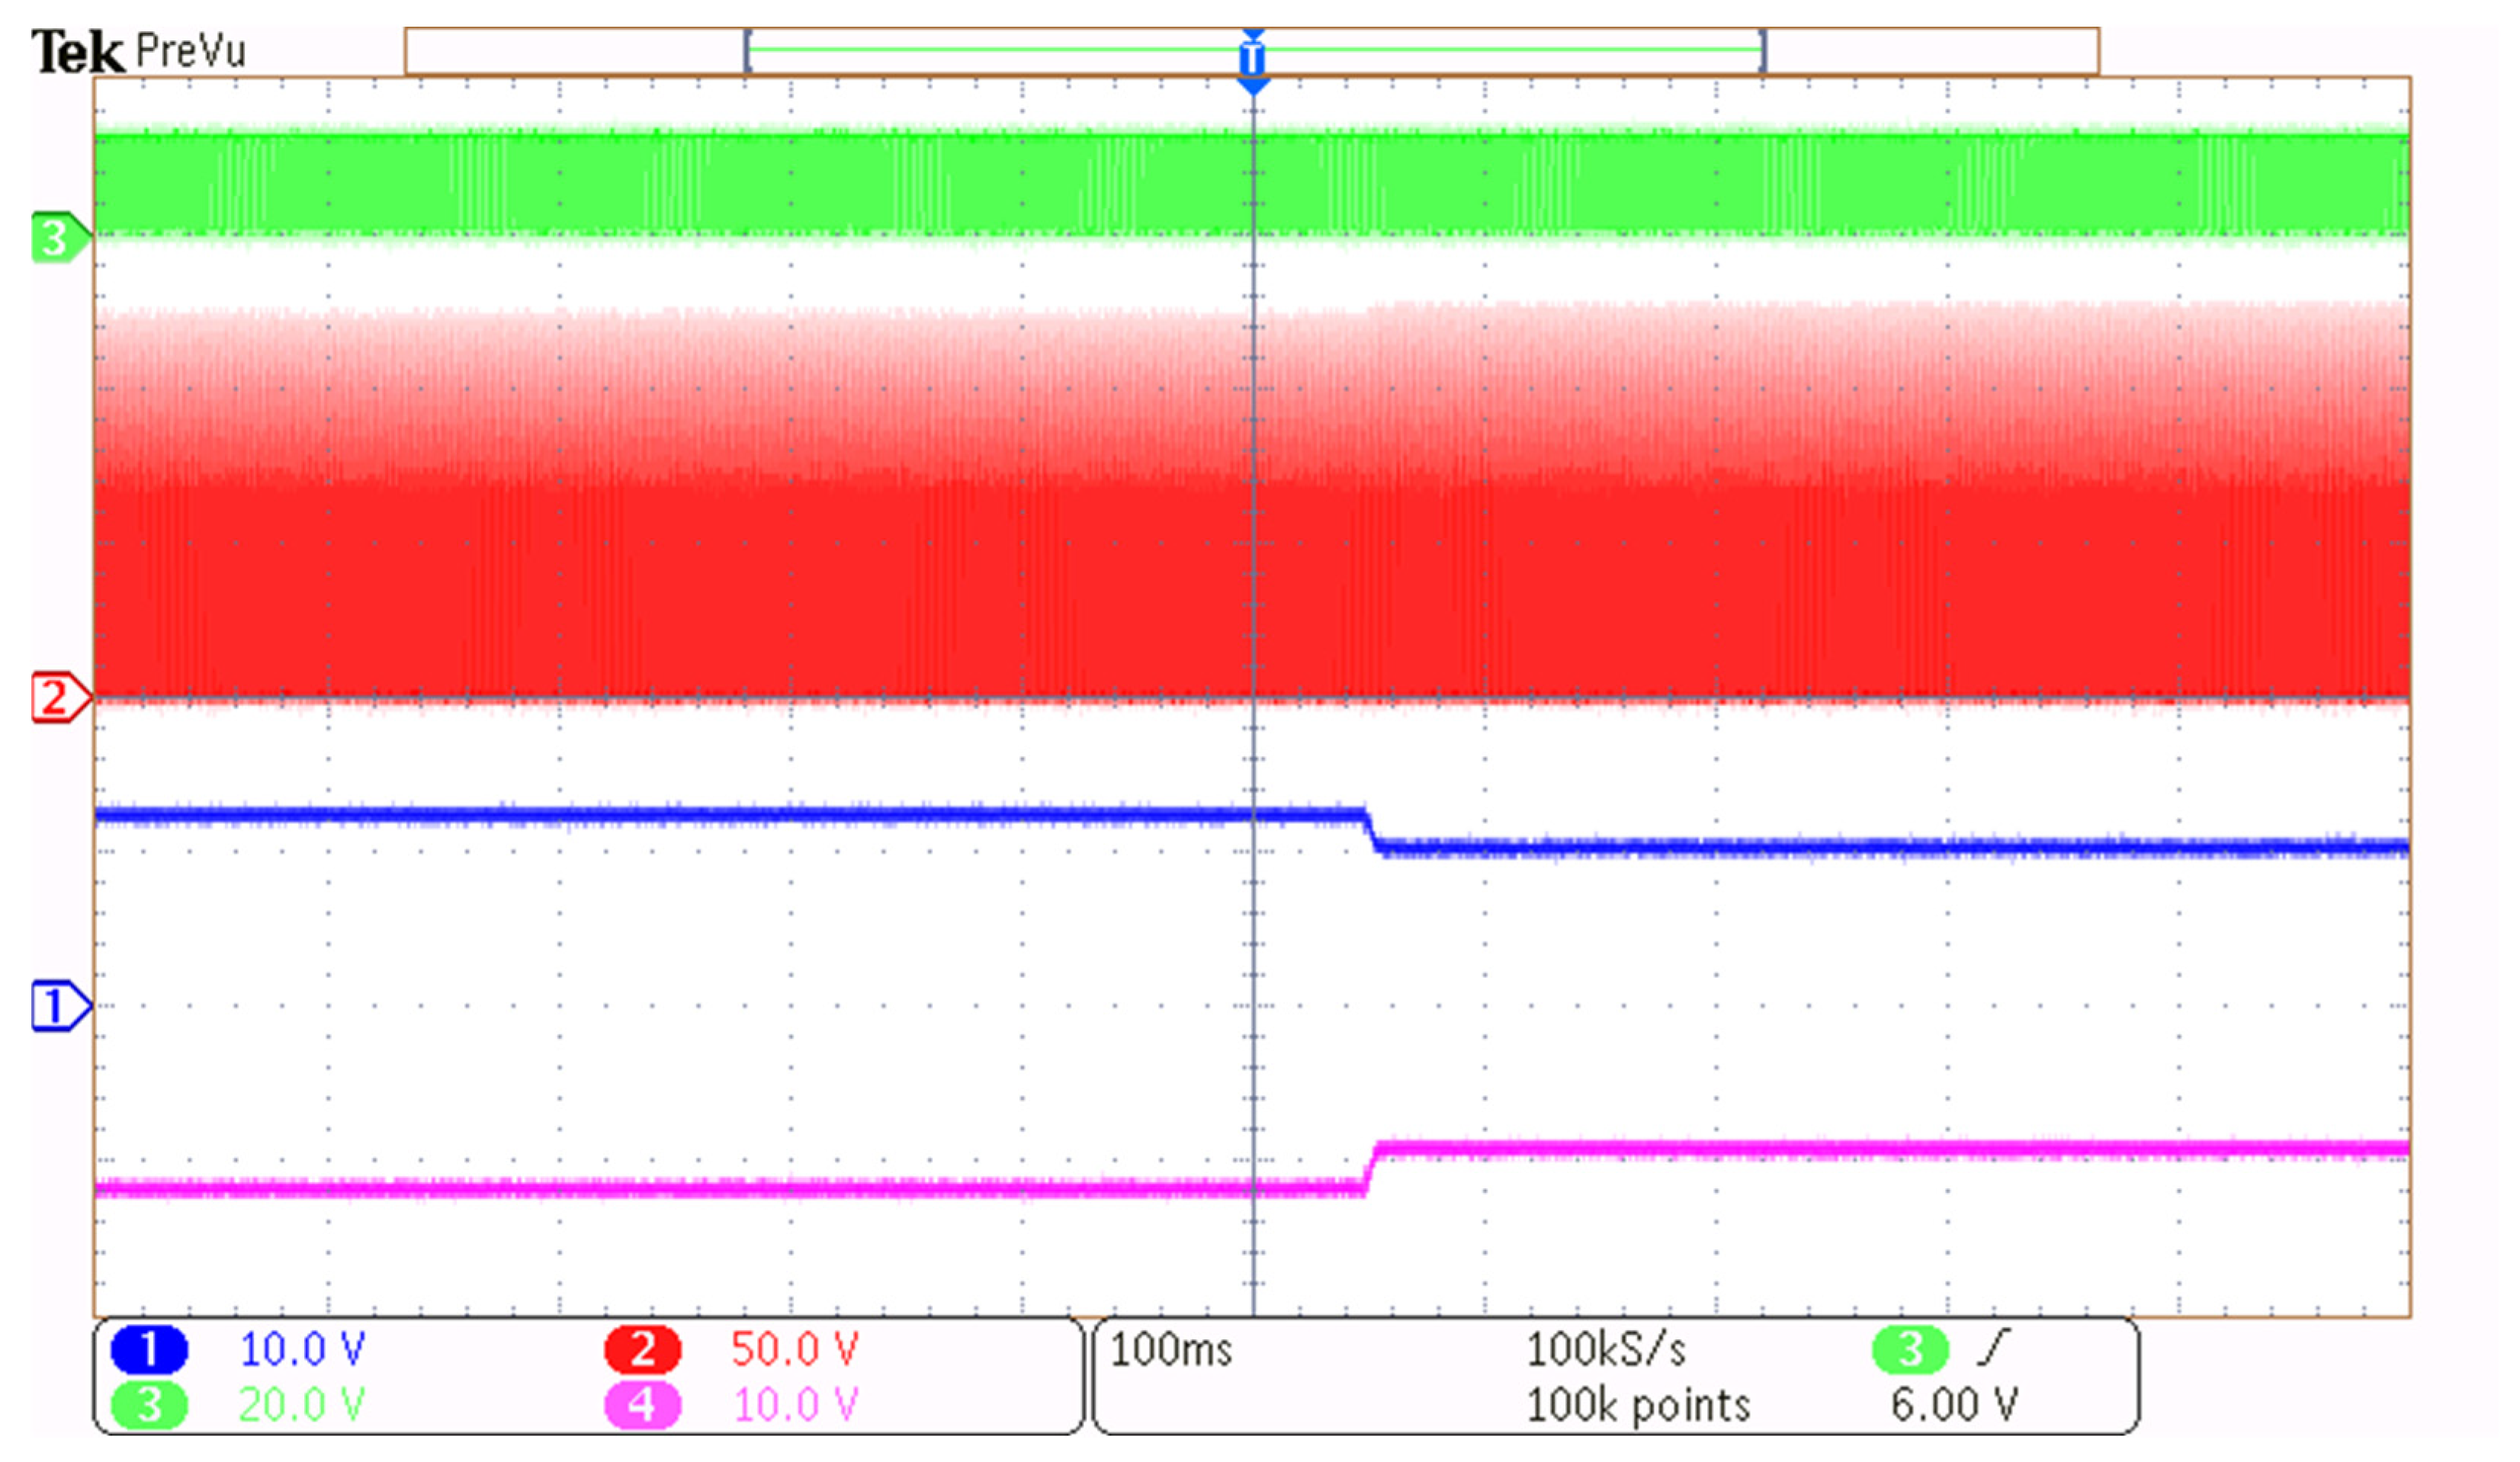
Additionally, some tests on the converters under different input voltage conditions were performed to evaluate their response and stability. The results show that variations in input voltage caused fluctuations in the output voltage, especially for topologies that rely heavily on the resonant tank for regulation. The results of this experiment are shown in Figure 24 and Figure 25, where the input voltage is initially set to 24 V, yielding 12 V at the output. Then, the input voltage is reduced to 12 V, resulting in approximately 5 V at the output, and finally, the power supply is turned off. Throughout the test, the switching frequency is kept constant (1 MHz for the full-wave configuration and 780 kHz for the half-wave). In the resonant voltage waveforms, one can observe how the input variation affects both the amplitude and the settling time of the resonant response. Figure 24 corresponds to the full-wave version, while Figure 25 shows the half-wave version. The results show that variations in input voltage caused fluctuations in the output voltage, especially for topologies that rely heavily on the resonant tank for regulation.
Figure 24.
Output voltage response to input voltage variations from 24 to 12 V in ZVS SEPIC–Cuk full-wave converter (Figure 3a). CH 1: Vo+. CH 2: VCR. CH 3: Vg. CH 4: Vo−.
Figure 25.
Output voltage response to input voltage variations from 24 to 12 V in the ZVS SEPIC–Cuk half-wave converter. CH 1: Vo+. CH 2: VCR. CH 3: Vg. CH 4: Vo−.
The effect of unbalanced loads on the output voltage and the resonant waveforms was also tested. In these tests, the load was intentionally imbalanced by changing one of the 8 Ω loads to 4.44 Ω, while keeping the other load at the initial 8 Ω value. The results, shown in Figure 26 and Figure 27, reveal how the output voltage of one channel is more affected than the other, but also how the variation in one load influences the other. The experimental data revealed an acceptable, but visible deviation (around 2%) in the output voltage values under unbalanced loading conditions. Additionally, the observed cross-regulation between outputs, although limited, indicates that variations in one load can slightly affect the voltage level of the other, underlining the relevance of mitigation strategies in multi-output designs. These results highlight not only the importance of proper load imbalance conditions, emphasizing the importance of appropriate load distribution and the possible need for adaptive control strategies to ensure robust and stable operation. Since both outputs share a single switch, regulating one output under load steps inevitably affects the other. This inherent cross-regulation trade-off requires careful post-regulation if strictly independent outputs are needed. The analysis of resonant capacitor voltage waveforms in all the experimental results showed the impact of various load and input variations on the switching behavior of the converter. In this sense, variations in the load resulted in shifts in amplitude of the resonant oscillations in full-wave versions, while variations in the input voltage have a similar effect on both the full-wave and half-wave configurations; they lead to changes in the amplitude of the resonant oscillation, which in turn affects the output voltages and transient response time in both topologies.
Figure 26.
Output voltage and resonant response to unbalanced load conditions in ZVS SEPIC–Cuk full-wave converter. CH 1: Vo+. CH 2: VCR. CH 3: Gate signal. CH 4: Vo−.
Figure 27.
Output voltage and resonant response to unbalanced load conditions in ZVS SEPIC–Cuk half-wave converter. CH 1: Vo+. CH 2: VCR. CH 3: Gate signal. CH 4: Vo−.
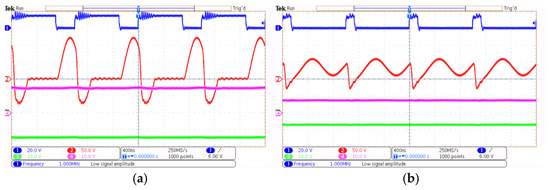
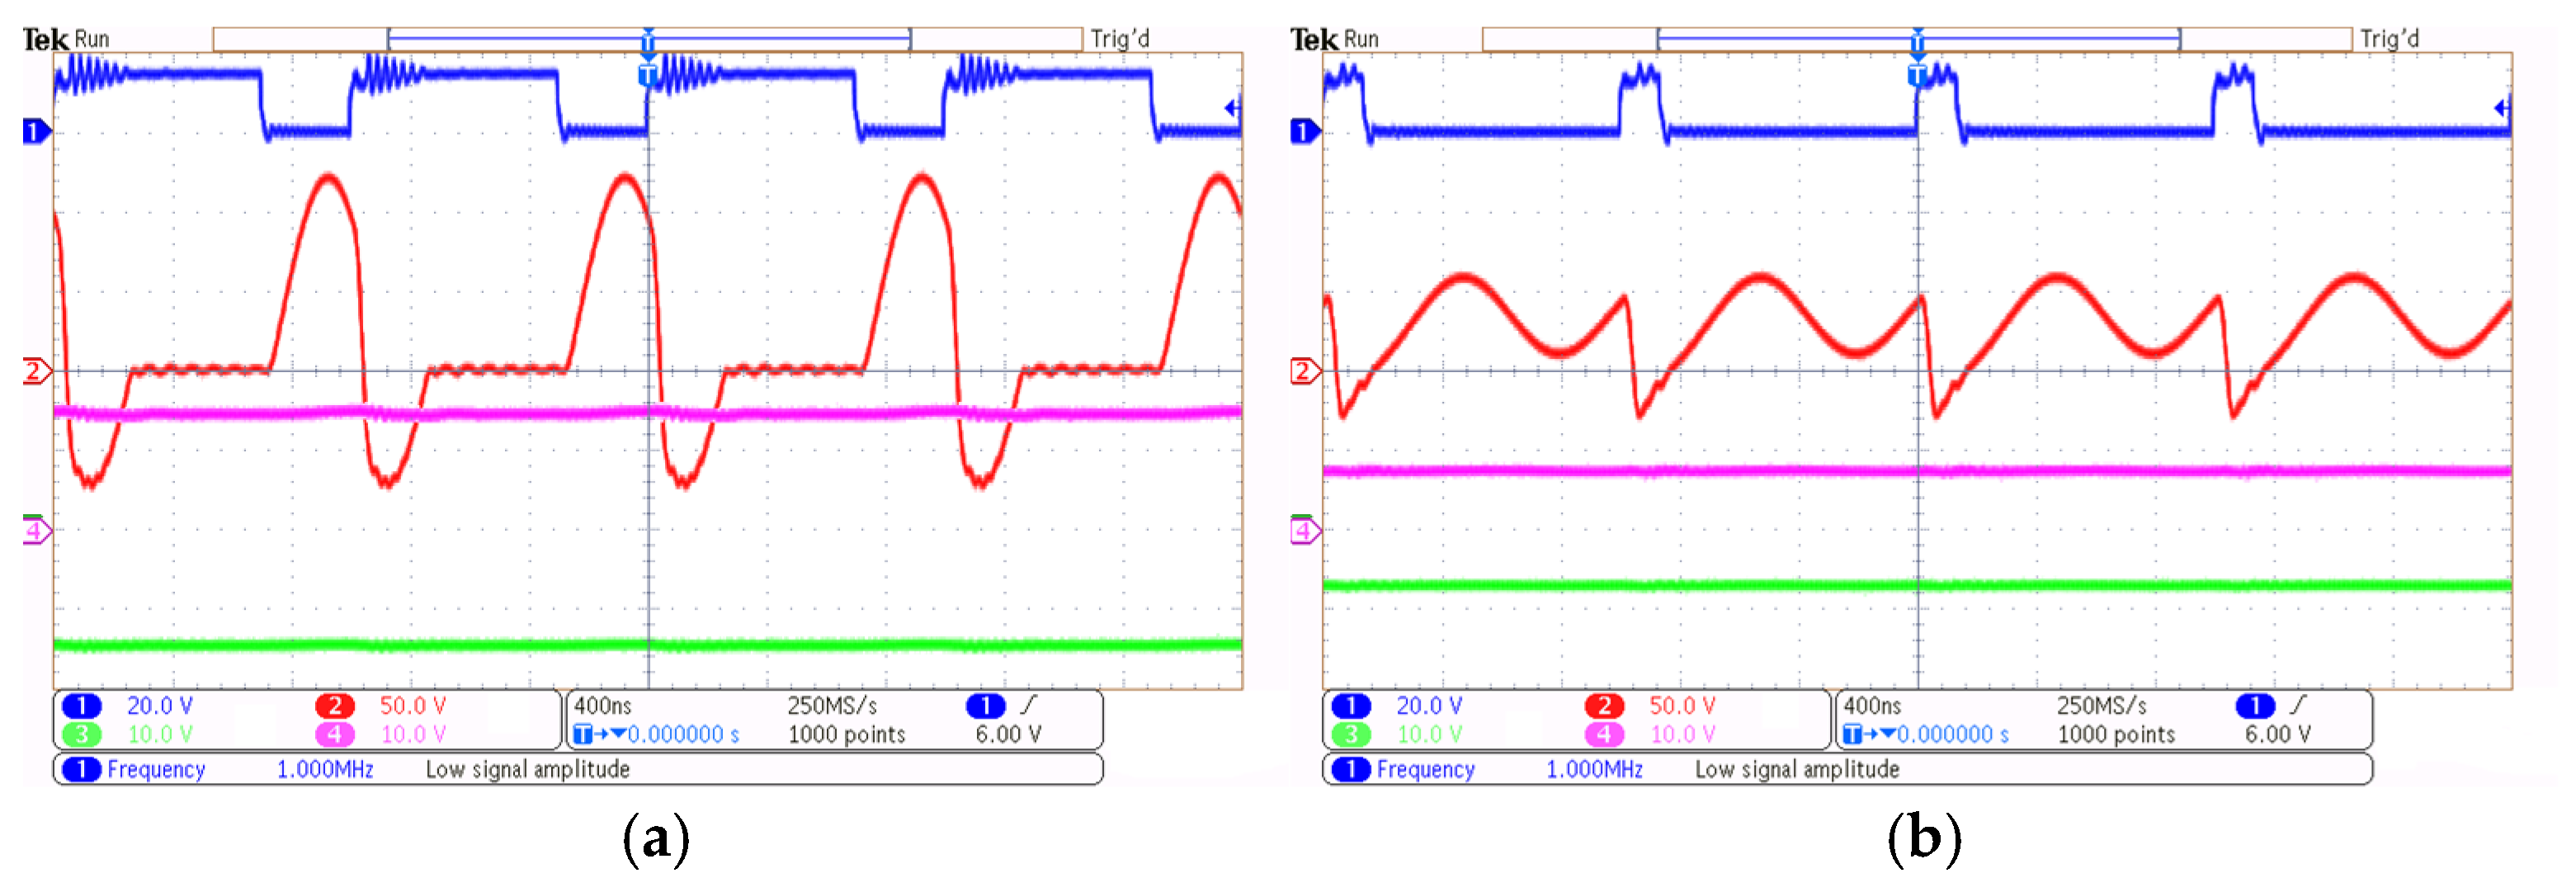
To address the theoretical limits of the proposed topologies and perform a sensitivity analysis on the switching parameters, the converter was tested under conditions outside its designed operational range. Figure 28 illustrates the loss of the resonant action when the duty cycle is aggressively modified, violating the timing requirements for soft-switching. In Figure 28a, the converter operates with an excessively large duty cycle, resulting in an insufficient off-time (toff). Under this condition, the resonant capacitor (VCR) does not have adequate time to fully discharge before the main switch is turned on again. This breaks the Zero-Voltage Switching (ZVS) condition, imposing hard-switching transitions and significantly increasing power losses. Conversely, Figure 28b demonstrates the behavior under a very small duty cycle (excessive toff). In this scenario, the off-time extends far beyond the passive interval (t4). As a result, the energy flow is disrupted, and the resonant tank begins to lose its ideal state, leading to secondary parasitic oscillations or premature ringing before the start of the next switching period. These tests experimentally confirm the physical limits and the strictly valid load/frequency range previously defined in the mathematical analysis.
Figure 28.
Loss of resonant action under out-of-range duty cycles. (a) Larger duty cycle (insufficient toff). (b) Smaller duty cycle (excessive toff). CH 1: Gate signal. CH 2: VCR. CH 3: Vo−. CH 4: Vo+.
To experimentally show the theoretical load limitations established in Section 5, the converter was tested over a wider load range. Figure 29 illustrates the converter’s waveforms when operating within and beyond the maximum equivalent resistance Rmax, which is required to ensure ZVS. In Figure 29a, the converter operates with a 15 Ω load, which is within the valid design range 0 < Req < Rmax). The resonant capacitor voltage VCR drops to zero, maintaining ideal soft-switching conditions. Conversely, Figure 29b,c show the response when the load resistance is increased to 40 Ω, exceeding the Rmax threshold. Consequently, VCR fails to reach zero before the main switch turns on, resulting in hard-switching. As demonstrated in these captures, any attempt to recover soft-switching by regulating the off-time (toff) is ineffective, showing that the resonant action is lost when the Req > Rmax condition is no longer met.
Figure 29.
Evaluation of resonant action over a wider load range. (a) Valid ZVS operation with a 15 Ω load (Req < Rmax). (b,c) Loss of ZVS with a 40 Ω load (Req > Rmax) where VCR fails to reach zero, despite varying toff. CH 1: Gate signal. CH 2: VCR. CH 3: Vo−. CH 4: Vo+.
The prototypes were designed to operate at a switching frequency around 1 MHz, which significantly reduces the size of the passive components. This high-frequency operation enhances the converter’s power density, demonstrating its potential for compact and efficient power supply applications. The implemented prototype achieves a power density of 48.7 W/in3, validating the benefits of MHz-range operation for miniaturization. The efficiency achieved in the full-wave version is 89.2%, while in the half-wave version, it is 88.1%. These values closely approximate the simulation results (1.12% error) and the power maps generated by the application, based on the theoretical loss analysis (0.36% error). The results confirm that both topologies achieve high-frequency operation while maintaining soft-switching across different loads. Additionally, the reduction in passive component values contributes to a more compact design, validating the suitability of these converters for high-power-density applications. The comparative analysis between the full-wave and half-wave prototypes provides further insights into the trade-offs between component count, conduction time, and overall efficiency.
A synthetic overview and link with the results to the paper’s objectives is shown in Table 10, which summarizes the more relevant performance metrics of the tested prototypes.
Table 10.
Comparative summary of results for the proposed prototypes.
This section concludes with a comparative table of other multiple-output topologies, which is attached in Table 11. This comparison highlights the structural and operational trade-offs, specifically regarding the number of active components, isolation requirements, switching frequency and efficiency, establishing a benchmark to evaluate the proposed converter’s performance in terms of power density and topology-specific regulation capabilities compared to existing literature.
Table 11.
Comparison with other related research.
7. Conclusions
This paper proposes a family of single-switch, multi-output quasi-resonant converters. First, regarding the scientific contribution, the work derives a family of bipolar output DC-DC converters resulting from the combination of fundamental resonant topologies. By applying systematic combinations, several configurations capable of providing symmetric bipolar outputs with a single switch have been obtained. Furthermore, a complete time-domain analysis has been developed for the derived topologies, obtaining all described operating intervals and deriving the analytical expressions that govern their dynamic behavior.
In terms of practical implications, a dedicated design tool has been implemented to support the selection and sizing of components, enabling the estimation of electrical stress across components, individual power losses, and overall converter efficiency, and providing a practical resource for rapid component sizing. Experimental validations under varying input voltage, load conditions, and unbalanced load scenarios confirm the performance of the proposed configurations. These findings highlight the potential of this family of converters to achieve compact power conversion with bipolar output capability and soft-switching at MHz-range frequencies. As a direction for further research, it should be noted that while this paper establishes the steady-state and static design strategies, the dynamic small-signal modeling and closed-loop control design remain out of the current scope. These areas represent the next stage for future research, as the established steady-state mathematical model provides the necessary foundation for robust frequency control design.
Author Contributions
C.D.-M., E.D.A., S.P.L. and J.F.S. have written the original draft and have reviewed and edited the paper, the conceptualization, the methodology, and the analysis of the state of the art. All authors have read and agreed to the published version of the manuscript.
Funding
This research was funded by EPIT24 Santander–UHU: Mobility grants for international stays for PhD students at the University of Huelva and by national funds through FCT, Fundação para a Ciência e a Tecnologia, under project UIDB/50021/2020 (DOI:10.54499/UIDB/50021/2020). The corresponding author is enjoying an FPU grant funded by the Spanish Ministry of Universities for the training of university teaching staff during his PhD period, grant number FPU22/03537.
Institutional Review Board Statement
Not applicable.
Informed Consent Statement
Not applicable.
Data Availability Statement
The original contributions presented in this study are included in the article. Further inquiries can be directed to the corresponding author(s).
Conflicts of Interest
The authors declare no conflicts of interest.
References
- Mohammed, S.A.Q.; Jung, J.-W. A State-of-the-Art Review on Soft-Switching Techniques for DC–DC, DC–AC, AC–DC, and AC–AC Power Converters. IEEE Trans. Ind. Inform. 2021, 17, 6569–6582. [Google Scholar] [CrossRef] [Scilit]
- Wang, J.; Zhang, F.; Xie, J.; Zhang, S.; Liu, S. Analysis and design of high efficiency Quasi-Resonant Buck converter. In 2014 International Power Electronics and Application Conference and Exposition, Shanghai, China; IEEE: New York, NY, USA, 2014; pp. 1486–1489. [Google Scholar] [CrossRef] [Scilit]
- Liu, K.-H.; Lee, F.C. Zero-voltage switching technique in DC/DC converters. In 1986 17th Annual IEEE Power Electronics Specialists Conference, Vancouver, BC, Canada; IEEE: New York, NY, USA, 1986; pp. 58–70. [Google Scholar] [CrossRef] [Scilit]
- Chuang, Y.-C.; Ke, Y.-L. A Novel High-Efficiency Battery Charger with a Buck Zero-Voltage-Switching Resonant Converter. IEEE Trans. Energy Convers. 2007, 22, 848–854. [Google Scholar] [CrossRef] [Scilit]
- Wai, R.-J.; Jheng, K.-H. High-Efficiency Single-Input Multiple-Output DC–DC Converter. IEEE Trans. Power Electron. 2013, 28, 886–898. [Google Scholar] [CrossRef] [Scilit]
- Feretti, P.H.; Tofoli, F.L.; Ribeiro, E.R. Family of Non-Isolated High Step-Up DC–DC Converters Based on the Multi-State Switching Cell. IEEE J. Emerg. Sel. Top. Power Electron. 2022, 10, 5882–5893. [Google Scholar] [CrossRef] [Scilit]
- Oliveira, T.M.; De Souza, A.F.; Fuzato, G.H.F.; Tofoli, F.L.; Ribeiro, E.R. Family of Non-Isolated High Step-Up DC-DC Converters Based on The Three-State Switching Cell and Coupled Inductors. IEEE J. Emerg. Sel. Top. Power Electron. 2025, 13, 5532–5543. [Google Scholar] [CrossRef] [Scilit]
- Liu, Y.; He, Z.; Wang, J.; Li, Z.; Wang, L.; Wang, F.; Li, X.; Fang, W.; Luo, A. A Dual-Output Power Supply Integrated High -Voltage Anode Power Supply and Filament Power Supply for Magnetrons. IEEE Trans. Ind. Electron. 2024, 71, 4629–4639. [Google Scholar] [CrossRef] [Scilit]
- Kwon, D.; Rincón-Mora, G. Single-Inductor–Multiple-Output Switching DC–DC Converters. IEEE Trans. Circuits Syst. II Express Briefs 2009, 56, 614–618. [Google Scholar] [CrossRef] [Scilit]
- Shan, Z.; Ding, X.; Jatskevich, J.; Tse, C. Synthesis of Multi-Input Multi-Output DC/DC Converters Without Energy Buffer Stages. IEEE Trans. Circuits Syst. II Express Briefs 2021, 68, 712–716. [Google Scholar] [CrossRef] [Scilit]
- Pan, W.; Liu, R.; Xie, R.; Zhuang, Y.; Mao, X.; Zhang, Y. A Multi-Output Modular Wireless Power Transfer System with Constant-Current Characteristic. IEEE Trans. Power Electron. 2025, 40, 6272–6281. [Google Scholar] [CrossRef] [Scilit]
- Jie, Y.; Zhang, Z.; Sun, K.; Yang, W.; Yang, S.; Li, F.; Yao, Y. Series input multiple outputs flyback auxiliary power supply for input series–output parallel/input series–output series system. IET Power Electron. 2019, 12, 2285–2294. [Google Scholar] [CrossRef] [Scilit]
- Ai, Y.; Shi, Y.; Chen, S.; Zhang, Z.; Zhao, S.; Liu, J. High-Voltage Isolated Multiple Output Auxiliary Power Supply with Output Voltage Self-Regulation. Energies 2022, 15, 2106. [Google Scholar] [CrossRef] [Scilit]
- Kwon, J.-M.; Choi, W.-Y.; Kwon, B.-H. Single-Switch Quasi-Resonant Converter. IEEE Trans. Ind. Electron. 2009, 56, 1158–1163. [Google Scholar] [CrossRef] [Scilit]
- Mohan, N.; Undeland, T.M.; Robbins, W.P. Power Electronics: Converters, Applications, and Design; Wiley: Hoboken, NJ, USA, 2003. [Google Scholar]
- Ferrera Prieto, M.B.; Litran, S.P.; Aranda, E.D.; Gomez, J.M.E. New Single-Input, Multiple-Output Converter Topologies: Combining Single-Switch Nonisolated dc-dc Converters for Single-Input, Multiple-Output Applications. IEEE Ind. Electron. Mag. 2016, 10, 6–20. [Google Scholar] [CrossRef] [Scilit]
- Cheng, X.-F.; Liu, C.; Wang, D.; Zhang, Y. State-of-the-Art Review on Soft-Switching Technologies for Non-Isolated DC-DC Converters. IEEE Access 2021, 9, 119235–119249. [Google Scholar] [CrossRef] [Scilit]
- Kolar, J.W.; Drofenik, U.; Biela, J.; Heldwein, M.L.; Ertl, H.; Friedli, T. PWM Converter Power Density Barriers. In 2007 Power Conversion Conference–Nagoya, Nagoya, Japan; IEEE: New York, NY, USA, 2007; pp. 9–29. [Google Scholar] [CrossRef] [Scilit]
- Liu, K.-H.; Oruganti, R.; Lee, F.C.Y. Quasi-Resonant Converters-Topologies and Characteristics. IEEE Trans. Power Electron. 1987, PE-2, 62–71. [Google Scholar] [CrossRef] [Scilit]
- Díaz-Martín, C.; Durán, E.; Litrán, S.P.; Álvarez, J.L.; Semião, J. Single-Switch Non-Isolated Resonant DC-DC Converter for Single-Input Dual-Output Applications. Appl. Sci. 2023, 13, 8798. [Google Scholar] [CrossRef] [Scilit]
- Díaz-Martín, C.; Durán Aranda, E.; da Silva, F.A.; André, S. A Novel Transformerless Soft-Switching Symmetrical Bipolar Power Converter: Analysis, Design, Simulation and Validation. Electronics 2025, 14, 1434. [Google Scholar] [CrossRef] [Scilit]
- Mudiyanselage, G.A.; Keshmiri, N.; Emadi, A. A Review of DC-DC Resonant Converter Topologies and Control Techniques for Electric Vehicle Applications. IEEE Open J. Power Electron. 2023, 4, 945–964. [Google Scholar] [CrossRef] [Scilit]
- He, P.; Khaligh, A. Comprehensive analyses and comparison of 1 kW isolated DC–DC converters for bidirectional EV charging systems. IEEE Trans. Transp. Electrif. 2016, 3, 147–156. [Google Scholar] [CrossRef] [Scilit]
- Vishnuram, P.; Ramachandiran, G.; Ramasamy, S.; Dayalan, S. A comprehensive overview of power converter topologies for induction heating applications. Int. Trans. Electr. Energy Syst. 2020, 30, e12554. [Google Scholar] [CrossRef] [Scilit]
- Faraji, R.; Ding, L.; Esteki, M.; Mazloum, N.; Khajehoddin, S. Soft-Switched Single Inductor Single Stage Multiport Bidirectional Power Converter for Hybrid Energy Systems. IEEE Trans. Power Electron. 2021, 36, 11298–11315. [Google Scholar] [CrossRef] [Scilit]
- Gevorkov, L.; Domínguez-García, J.L.; Romero, L.T.; Martínez, À.F. Modern MultiPort Converter Technologies: A Systematic Review. Appl. Sci. 2023, 13, 2579. [Google Scholar] [CrossRef] [Scilit]
- Lee, A.T.L.; Wong, K.T.; Tan, S.-C.; Hui, S.Y. A Single-Inductor Multiple-Output (SIMO) Buck-Boost Hybrid Converter for Multi-Device Wired and Wireless Charging System. In 2023 IEEE Applied Power Electronics Conference and Exposition (APEC), Orlando, FL, USA; IEEE: New York, NY, USA, 2023; pp. 2940–2945. [Google Scholar] [CrossRef] [Scilit]
- Kandukuri, S.; Ravikishore, D.; Kumar, M.M.; Ali, S.A.; Kumar, P.L.P. Single Input Multi Output Forward Converter for EV Charging Application. In 2024 International Conference on Computational Intelligence for Green and Sustainable Technologies (ICCIGST), Vijayawada, India; IEEE: New York, NY, USA, 2024; pp. 1–6. [Google Scholar] [CrossRef] [Scilit]
- Dindar, S.; Hardalac, F.; Aksoy, E.; Ayturan, K. Investigation of Multi-Output Single-Switch Forward Converter in Terms of Cross-Regulation Using Weighted Control Method. Appl. Sci. 2025, 15, 365. [Google Scholar] [CrossRef] [Scilit]
- Zhang, Y.; Liu, X.; Wang, J.; Wu, B.; Liu, F.; Xie, J. PWM–PFM Hybrid Control of Three-Port LLC Resonant Converter for DC Microgrids. Energies 2025, 18, 2615. [Google Scholar] [CrossRef] [Scilit]
- Sarkar, S.; Das, A. An Isolated Single Input-Multiple Output DC–DC Modular Multilevel Converter for Fast Electric Vehicle Charging. IEEE J. Emerg. Sel. Top. Ind. Electron. 2023, 4, 178–187. [Google Scholar] [CrossRef] [Scilit]
- Taufik; Luther, P.; Anwari, M. Digitally controlled ZVS quasi-resonant boost converter with M-type switch. In 2007 International Conference on Intelligent and Advanced Systems, Kuala Lumpur, Malaysia; IEEE: New York, NY, USA, 2007; pp. 823–828. [Google Scholar] [CrossRef] [Scilit]
- Outeiro, M.T.; Buja, G.; Czarkowski, D. Resonant Power Converters: An Overview with Multiple Elements in the Resonant Tank Network. IEEE Ind. Electron. Mag. 2016, 10, 21–45. [Google Scholar] [CrossRef] [Scilit]
- Severns, R. Topologies for three-element resonant converters. IEEE Trans. Power Electron. 1992, 7, 89–98. [Google Scholar] [CrossRef] [Scilit]
- Batarseh, I. Resonant converter topologies with three and four energy storage elements. IEEE Trans. Power Electron. 1994, 9, 64–73. [Google Scholar] [CrossRef] [Scilit]
- Martín, C.D.; Aranda, E.D.; Litrán, S.P.; Sotillo, E.B. A Buck/Boost-Zeta Quasi–Resonant Full–Wave Converter Combination for Bipolar Outputs. In IECON 2025—51st Annual Conference of the IEEE Industrial Electronics Society, Madrid, Spain; IEEE: New York, NY, USA, 2025; pp. 1–6. [Google Scholar] [CrossRef] [Scilit]
- Martín, C.D.; Aranda, E.D.; Litrán, S.P.; Semião, J. Quasi–Resonant DC–DC Combination Converter CSC–Zeta Full–Wave for Bipolar Outputs. In IECON 2025—51st Annual Conference of the IEEE Industrial Electronics Society, Madrid, Spain; IEEE: New York, NY, USA, 2025; pp. 1–6. [Google Scholar] [CrossRef] [Scilit]
- Glitz, E.; Ordonez, M. MOSFET Power Loss Estimation in LLC Resonant Converters: Time Interval Analysis. IEEE Trans. Power Electron. 2019, 34, 11964–11980. [Google Scholar] [CrossRef] [Scilit]
- Hu, D.; Yin, A.; Ghaderi, D. A transformer-less single-switch boost converter with high-voltage gain and mitigated-voltage stress applicable for photovoltaic utilizations. Int. Trans. Electr. Energy Syst. 2020, 30, e12569. [Google Scholar] [CrossRef] [Scilit]
- Ferrera, M.B.; Litrán, S.P.; Durán Aranda, E.; Andújar Márquez, J.M. A Converter for Bipolar DC Link Based on SEPIC-Cuk Combination. IEEE Trans. Power Electron. 2015, 30, 6483–6487. [Google Scholar] [CrossRef] [Scilit]
- Kumar, P.; Singh, R.K.; Mahanty, R. Performance of MPPT-Based Minimum Phase Bipolar Converter for Photovoltaic Systems. IEEE Trans. Power Electron. 2021, 36, 5594–5609. [Google Scholar] [CrossRef] [Scilit]
- Zhou, X.; Wang, Y.; Wang, L.; Liu, Y.-F.; Sen, P.C. A Soft-Switching Transformerless DC−DC Converter with Single-Input Bipolar Symmetric Outputs. IEEE Trans. Power Electron. 2021, 36, 8640–8646. [Google Scholar] [CrossRef] [Scilit]
- Prabhakaran, P.; Agarwal, V. Novel Boost-SEPIC Type Interleaved DC–DC Converter for Mitigation of Voltage Imbalance in a Low-Voltage Bipolar DC Microgrid. IEEE Trans. Ind. Electron. 2020, 67, 6494–6504. [Google Scholar] [CrossRef] [Scilit]
- Zeng, J.; Qiao, W.; Qu, L. A single-switch LCL-resonant isolated DC-DC converter. In 2013 IEEE Energy Conversion Congress and Exposition, Denver, CO, USA; IEEE: New York, NY, USA, 2013; pp. 5496–5502. [Google Scholar] [CrossRef] [Scilit]
- Chung, E.; Lee, K.-H.; Han, Y.; Ha, J.-I. Single-Switch High-Frequency DC–DC Converter Using Parasitic Components. IEEE Trans. Power Electron. 2017, 32, 3651–3661. [Google Scholar] [CrossRef]
- Dhimish, M.; Schofield, N. Single-switch boost-buck DC-DC converter for industrial fuel cell and photovoltaics applications. Int. J. Hydrogen Energy 2022, 47, 1241–1255. [Google Scholar] [CrossRef] [Scilit]













Disclaimer/Publisher’s Note: The statements, opinions and data contained in all publications are solely those of the individual author(s) and contributor(s) and not of MDPI and/or the editor(s). MDPI and/or the editor(s) disclaim responsibility for any injury to people or property resulting from any ideas, methods, instructions or products referred to in the content. |
© 2026 by the authors. Licensee MDPI, Basel, Switzerland. This article is an open access article distributed under the terms and conditions of the Creative Commons Attribution (CC BY) license.