


Abstract
Induced seismicity is a recognized challenge in hot dry rock (HDR) geothermal development. Based on a systematic review of previous studies on induced seismicity mechanisms, characteristics, risk assessment, and mitigation measures, we compiled publicly available data from 13 HDR projects worldwide. Our statistical analysis shows that felt earthquakes occurred in 62% of the projects, and a post-injection “tailing effect” was observed in 54% of the projects. The spatial influence range of induced seismicity is typically within 2 km of the injection well, and the duration of the “Kaiser effect” varies from months to years depending on local conditions. A cross-site comparison of injection parameters suggests that the maximum wellhead pressure may be a more useful indicator than injected volume for estimating the largest possible earthquake magnitude, especially when comparing different tectonic settings. Furthermore, we examine the applicability and limitations of b-value trends, seismogenic indices, and existing maximum magnitude prediction models in seismic risk assessment. Dynamic adjustment of injection parameters based on real-time risk indicators, combined with safer injection schemes, may represent an important research direction for improving the conventional traffic light system. These findings provide a data-driven basis for site-specific safety management of HDR development.
1. Introduction
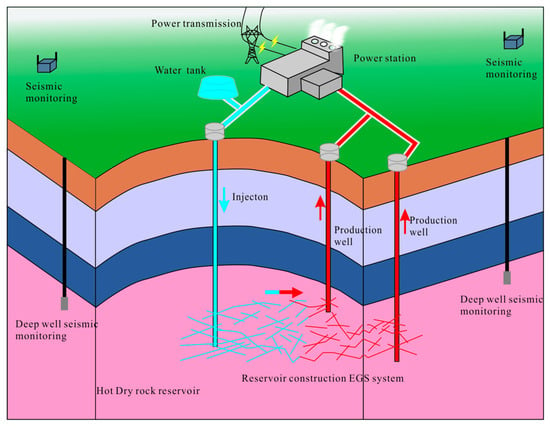
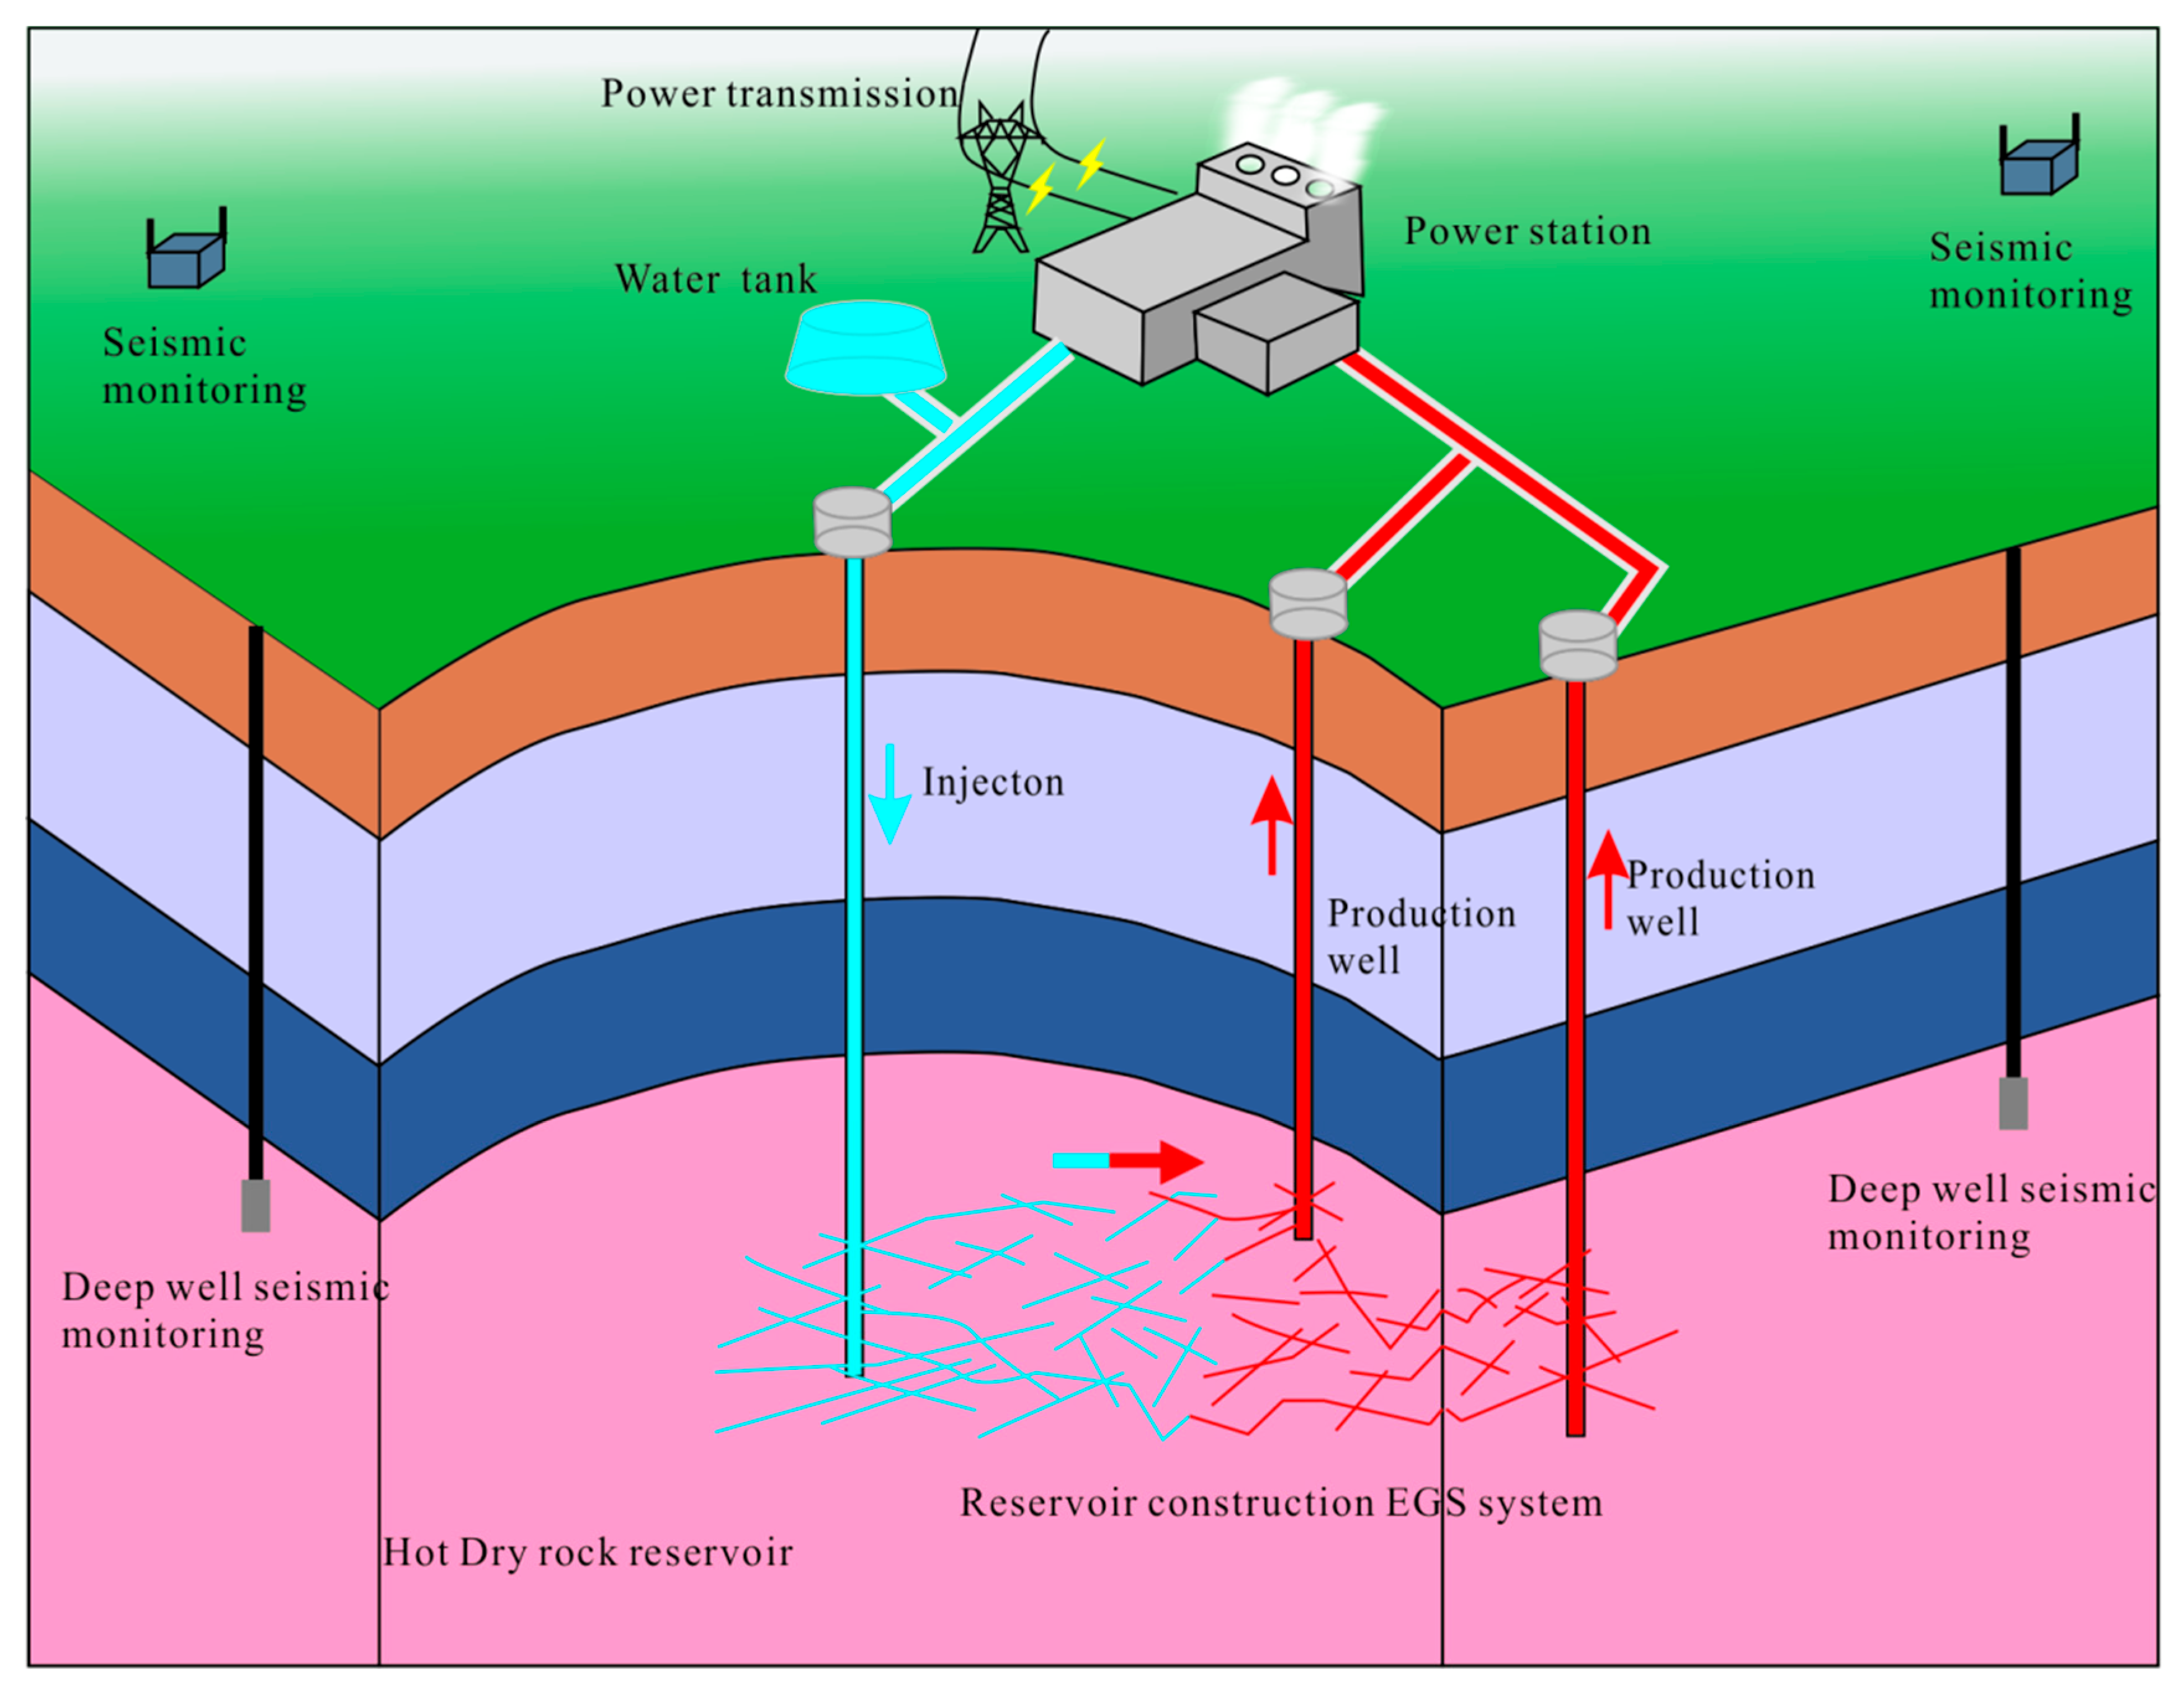
Hot dry rock (HDR) denotes high-temperature geological formations located at depths of several kilometers that contain little to no native fluid. Owing to its vast resource base and renewable nature, HDR constitutes a low-carbon geothermal energy option with substantial long-term potential [1]. Commercial utilization relies on Enhanced Geothermal Systems (EGS), in which hydraulic stimulation creates fracture networks within low-permeability reservoirs to establish closed-loop circulation. A working fluid is injected through injection wells; it extracts heat as it migrates through the stimulated volume and is subsequently produced via production wells for power generation (Figure 1). The earliest HDR field trials began in 1973 at Fenton Hill, United States, followed by experimental campaigns in the United Kingdom, France, Japan, Germany, and Australia. Among these, the Soultz-sous-Forêts project (France) achieved the first sustained commercial-scale electricity generation [2,3]. In 2019, the U.S. Department of Energy launched the Frontier Observatory for Research in Geothermal Energy (FORGE) initiative to reinvigorate fundamental and applied HDR research. In the same year, China initiated field-scale trials in Gonghe (Qinghai Province), Matouying (Tangshan), and Xinghua (Jiangsu Province). Collectively, these efforts indicate that HDR geothermal resources are poised to serve as a strategic complement to existing energy portfolios and may substantially reshape future energy supply configurations.
Figure 1.
Schematic diagram of hot dry rock development [4].
The expanding deployment of hydraulic stimulation in HDR developments, coupled with improved seismic monitoring capabilities, has revealed that injection-induced seismicity constitutes a non-negligible safety concern. Multiple HDR projects have already been suspended or terminated because of the unacceptable seismic risk. Induced events are thus emerging as a primary constraint on the scalable exploitation of HDR resources.
Although previous review articles have systematically summarized the mechanisms and characteristics of induced seismicity [5], prediction methods [6], criteria for distinguishing induced from natural earthquakes, and risk management frameworks [7,8] in enhanced geothermal systems (including both hot dry rock and hydrothermal systems), cross-site comparative analyses focusing specifically on the induced seismicity characteristics of HDR developments remain limited. In particular, the relationship between injection parameters and induced seismicity has not been well synthesized, making it difficult to directly transfer existing knowledge to seismic risk assessment for new projects. Moreover, induced seismicity data from HDR projects developed over the past decade—such as Pohang in South Korea, Gonghe and Tangshan in China, and FORGE in the USA—have not yet been integrated into a unified comparative framework.
To address this gap, we compiled publicly available data from 13 HDR projects worldwide, summarized the induced seismicity characteristics of major development sites, and provided basic parameters such as the spatial influence range of induced seismicity and the duration of the “Kaiser effect”. Cross-site comparison of injection parameters indicates that the maximum wellhead pressure may be a more informative indicator than injected volume when evaluating the maximum possible magnitude. This relationship is particularly pronounced in reservoirs with high pressure and low injectivity. We also discuss the applicability and limitations of major seismic risk indicators (including b-value, seismogenic index, and seismic release efficiency) as well as existing maximum-magnitude prediction models. On this basis, we further explore the potential value of real-time adjustment of injection parameters—based on real-time risk indicators—for improving conventional traffic light systems. The above analyses aim to provide a data-driven reference for site-specific safety management of HDR development.
2. Seismic Characteristics Induced by HDR Development
2.1. Data Compilation and Analysis Methodology
All data used in this study came from published peer-reviewed literature and publicly available project reports. To systematically compile induced seismicity data from global HDR projects, we searched Web of Science, Scopus, Google Scholar, CNKI, and relevant project reports (e.g., Gonghe), covering the period from the earliest available report of each project to December 2024. Keywords included “hot dry rock,” “enhanced geothermal system,” “induced seismicity,” “hydraulic fracturing,” and their combinations. Given the limited number of publicly documented HDR field sites, we additionally employed a site-driven supplementary search strategy: we first identified all known HDR/EGS test sites, then performed targeted searches using their formal and informal site names, project names, and associated geological formation names in the databases and grey literature. We also conducted backward and forward citation tracking of key papers. This two-pronged strategy ensured near-complete coverage of all publicly documented HDR projects with induced seismicity records.
For quality assessment, priority was given to peer-reviewed journal papers and authoritative project reports. When multiple sources existed for the same project (e.g., Soultz, Basel), we used the most recent and complete synthesis report, cross-validating key parameters such as maximum magnitude and injection pressure. Injection parameters (injection pressure, injection rate, cumulative injected volume), induced event magnitudes (ML or Mw), b-values, and spatial extents of seismic clouds were extracted directly from the original literature. No original seismic waveforms or raw injection records were reprocessed or recalculated.
The site selection criteria were as follows: (1) the project was explicitly reported as an HDR development; (2) at least three of the following parameters were reported in the open literature: maximum induced magnitude, wellhead pressure, injection flow rate, or cumulative injected volume; and (3) basic statistical information on induced seismic events (e.g., magnitude distribution, b-value, seismic cloud extent) was provided. Based on these criteria, 13 sites were selected. To ensure consistency across sites, priority was given to the moment magnitude (Mw) as reported in the original literature. For events reporting only local magnitude (ML)—most of these reports come from France and Switzerland—we uniformly applied the conversion formula of Grünthal et al. (2009) [9], which was derived from regression on central and northern European seismic data: Mw = 0.0376 × ML2 + 0.646 × ML + 0.53. Data items marked with “-” in Table 1 mean that the parameter was not reported in the original source. In correlation and regression analyses, only complete pairs of data were retained, and missing values were excluded from statistical tests. For all linear regressions, 95% confidence intervals were calculated using the bootstrap method with 1000 resampling iterations. Because the sample size is small and the data may not follow a normal distribution, we used Spearman’s rank correlation coefficient to evaluate the monotonic relationship between injection parameters and maximum magnitude. For the bimodal trend between injection pressure and maximum magnitude, Spearman rank correlation analyses were performed separately for the low-pressure group (<30 MPa) and the high-pressure group (≥30 MPa) to assess the correlation between injection pressure and maximum magnitude within each group. The goodness of fit of each regression model is reported as R2 and p-values. All statistical analyses were performed using SPSS 22.0 software.
2.2. Event Magnitudes
A systematic compilation of publicly available data from thirteen major HDR stimulation campaigns worldwide indicates that eight sites (62%) generated perceptible events with local magnitude M ≥ 2. At four of these sites (31%), the largest events exceeded M3. The highest-magnitude event documented to date is the Mw 5.5 Pohang earthquake (Republic of Korea); however, the extent to which this event can be attributed to HDR operations remains contested.
For comparison, hydraulic fracturing in conventional hydrocarbon reservoirs and stimulation of hydrothermal geothermal systems typically produce maximum moment magnitudes below Mw 1 [10]. The propensity of HDR reservoirs—hosted predominantly in deep, competent crystalline rocks—to generate comparatively larger events is consistent with the higher differential stresses, lower fracture compliance, and limited poroelastic relaxation characteristic of such lithologies.
2.3. Spatial Extent of Influence
The distribution of microseismicity delineates the zone affected by hydraulic stimulation and provides a quantitative basis for site-specific safety assessments and fault setback distances. Numerical modeling by Westwood et al. [11] suggests that maintaining a horizontal separation of at least 433 m between the injection interval and a nearby fault minimizes the likelihood of perceptible induced seismicity. Using microseismic catalogues, Davies et al. [12,13] propose a vertical separation of 600 m between stimulated reservoirs and overlying aquifers to prevent fluid migration and contamination. Wilson et al. [14] analyzed 108 fluid-injection operations and reported a maximum horizontal detection distance of 895 m for microseismic events. The present compilation of HDR field data (Table 1) indicates that the horizontal extent of microseismic clouds ranges from 0.1 to 2 km, while the vertical influence spans from 0.2 to 1.5 km. These dimensions exceed those typically observed in conventional hydraulic fracturing of sedimentary formations, reflecting the deeper, stiffer crystalline host rocks and the larger injected volumes characteristic of HDR projects. Moreover, poroelastic stress transfer and aseismic slip can extend the seismogenic footprint beyond the hydraulically stimulated reservoir volume [15,16], underscoring the need to consider these processes when defining exclusion zones.
Table 1.
Statistical table of earthquakes induced by major hot dry rock development sites.
2.4. Post-Injection Seismicity
The term “tailing effect” denotes the continued occurrence of seismic events after the cessation of fluid injection. These events typically nucleate at the periphery of the previously active microseismic cloud and are frequently characterized by magnitudes larger than those observed during active injection [17,18,19]. Among the thirteen HDR stimulation campaigns compiled in Table 1, seven projects (54%) exhibit unequivocal evidence of post-shut-in events exceeding the maximum magnitude recorded during injection. The lag time between shut-in and the largest post-injection event varies markedly, reflecting site-specific geological conditions and injection parameters. For example, the Denver triggered-earthquake experiment exhibited a lag of ~10 days [32], whereas seismicity at the Pohang PX-2 well (Republic of Korea) persisted for approximately 6 months. Nevertheless, the largest post-injection events in most datasets occur within three months after shut-in. The Basel EGS site registered its maximum magnitude (Mw 3.4) on the day of shut-in and experienced three additional Mw ≥ 3 events within the subsequent 3 months. Similarly, the Mw 5.5 Pohang earthquake occurred 49 days after the injection ceased.
2.5. “Kaiser Effect”
The “Kaiser effect” refers to the phenomenon that, after unloading and subsequent reloading of rocks or materials, acoustic emissions occur only when the stress exceeds the previously experienced maximum stress [33]. In hot dry rock (HDR) development, the same “Kaiser effect” is observed in induced seismicity, where seismic activity is reactivated only when the wellhead injection pressure exceeds the peak value of the previous injection [5,32,34]. At the Paralana (Australia) site, the main stimulation phase failed to reactivate seismicity until the wellhead pressure surpassed the peak value recorded during an earlier trial conducted six months prior, implying a stress-field recovery time exceeding half a year. Similarly, reinjection experiments at the Copper Basin site, separated by a two-year interval, displayed a clear Kaiser signature. Evans et al. [31] compared microseismicity induced by successive stimulations at Soultz and concluded that 4 months were insufficient for either stress-field restoration, or fracture closure, whereas a 3-year hiatus was adequate. Two injection tests performed six years apart at the KTB deep borehole further demonstrated that the majority of post-reinjection events nucleated beyond the footprint of the prior seismic cloud, suggesting that the stress field had not fully recovered even after six years. Stress-field recovery is governed by the reservoir stress state, geological architecture, injected energy, and treatment volume; consequently, recovery times vary among sites. Nevertheless, the observed Kaiser intervals across multiple HDR projects indicate that even modest injection treatments do not ensure complete stress-field restoration within six months.
3. Mechanical Mechanisms of Injection-Induced Seismicity
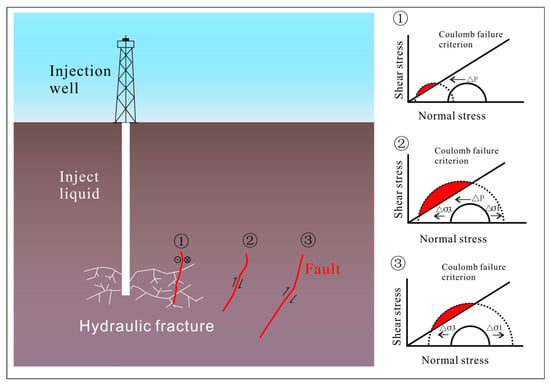
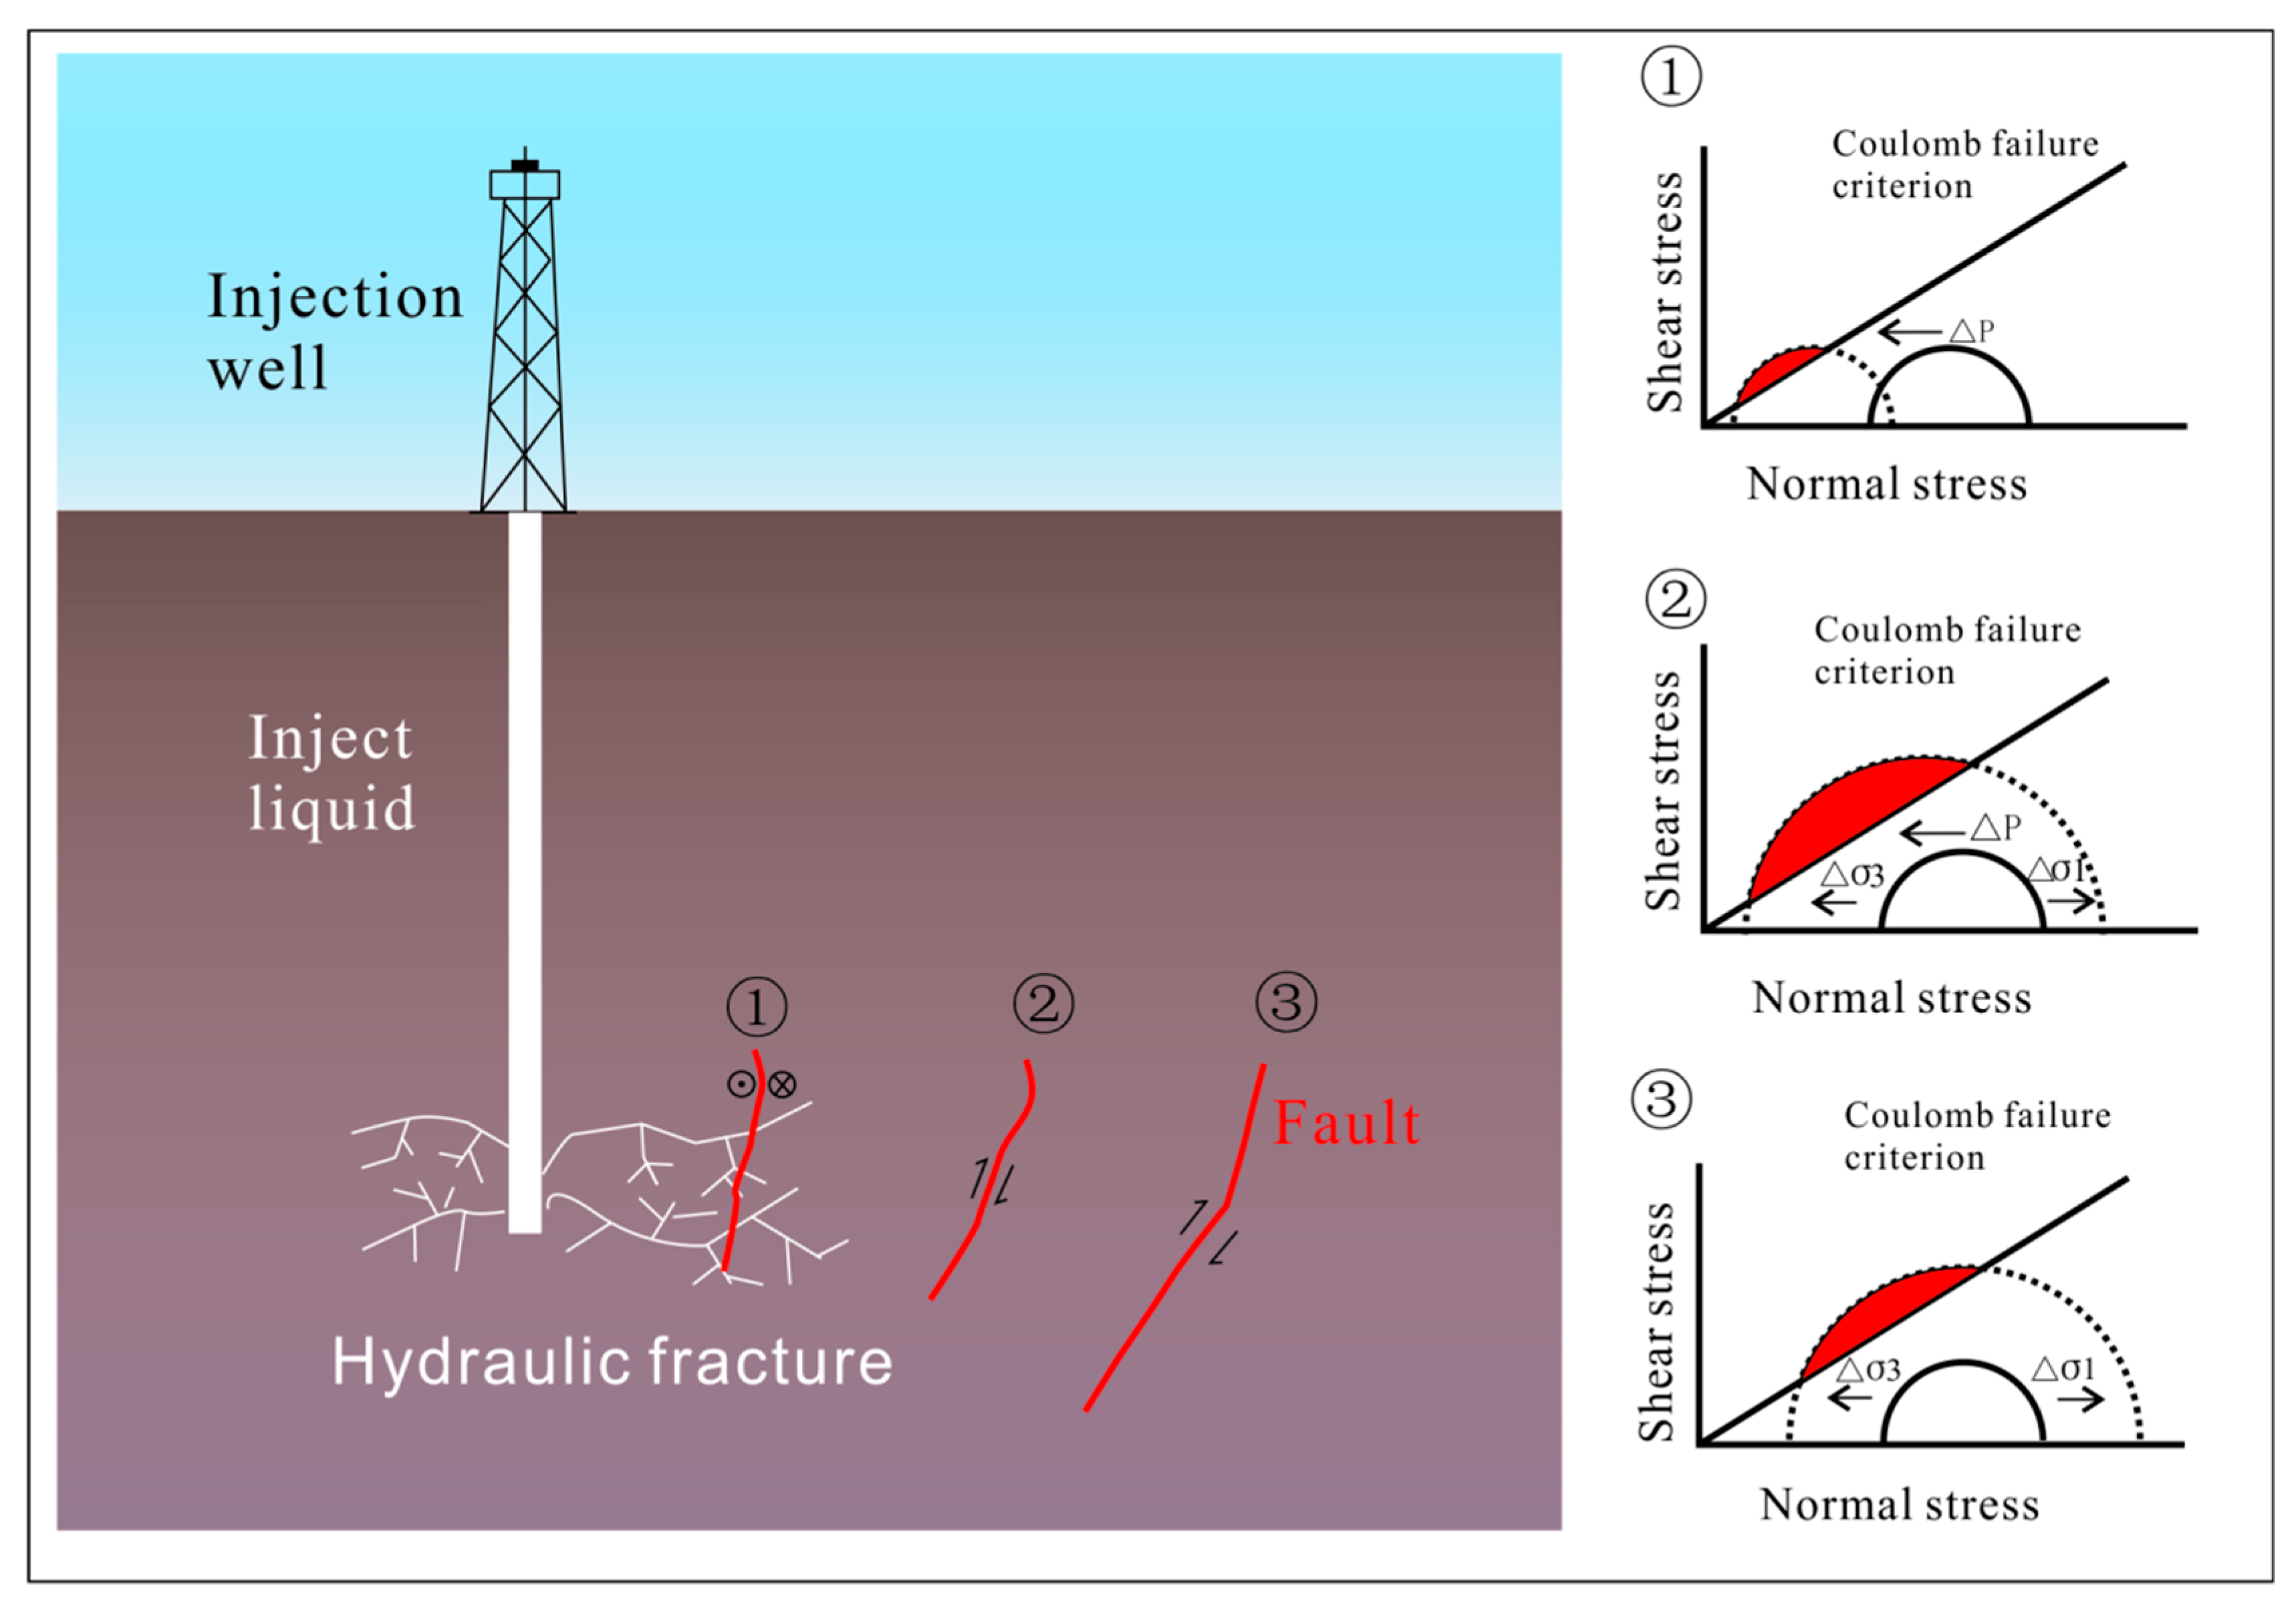
Fundamental insights into injection-induced seismicity originate from the fluid-injection experiments conducted in Colorado during the 1960s–1970s, where elevated pore pressure was identified as the primary driver reducing effective normal stress on pre-existing faults [35]. Subsequent investigations have expanded the understanding to encompass poro-elastic stressing, thermal stresses, earthquake-earthquake interactions, fault strength heterogeneity, and aseismic slip [35,36]. Keranen et al. [37] proposed a tripartite classification of induced-seismicity modes (Figure 2): (1) Pore–pressure increase with a consequent reduction in effective normal stress; (2) Combined influence of pore-pressure rise and poro-elastic stress perturbation; (3) Poro-elastic stress perturbation in the absence of significant pore-pressure change. Across a broad range of field observations and numerical studies, pore-pressure diffusion remains the dominant mechanism during fluid injection [37,38,39,40,41,42] whereas poro-elastic stress changes are primarily associated with fluid extraction scenarios [43,44].
Figure 2.
Schematic diagram of earthquakes induced by the development of hot dry rock and the Mohr’s circle diagrams of three induced seismic mechanical mechanisms [37,45]. ① Pore-pressure increase with consequent a reduction in effective normal stress. ② Combined influence of pore-pressure rise and poro-elastic stress perturbation. ③ Poro-elastic stress perturbation in the absence of significant pore-pressure change.
The physical processes governing seismicity after injection cessation remain only partially resolved. Numerical experiments by Baisch et al. [46] demonstrate that minimal residual pore-pressure diffusion can be sufficient to drive large regions to criticality once the well is shut in. Analytical solutions provided by Segall and Lu [47] attribute post-injection events to continuing poro-elastic stress perturbations that persist after the pressure transient has decayed. Using coupled thermo-poro-elastic simulations, Simone et al. [48] show that the superposition of thermal contraction and shear-stress transfer along existing fractures can sustain, or even enhance, seismic activity after shut-in. Field evidence and complementary modelling further suggest that previously opened fractures and faults begin to re-close as fluid pressure declines. These closing surfaces act as hydraulically impermeable barriers, redirecting residual fluids toward previously unstimulated zones at the periphery of the reservoir [48,49,50]. The resulting pressure build-up along these distal structures lowers the effective normal stress. It can trigger failure, thereby accounting for the systematic observation that post-injection events predominantly nucleate outside the footprint of the earlier seismic cloud.
4. Discrimination Between Induced and Natural Seismicity
Reliable discrimination between induced and tectonic earthquakes remains a prerequisite for seismic hazard assessment and operational control of HDR projects. Yet, no single seismological criterion has been established that can unambiguously separate the two populations [37]. At low magnitudes (M < 0), hydraulic-fracturing events may exhibit an increased tensile component in their focal mechanisms [51,52]; however, moderate-to-large events display source mechanisms, spectral content, stress-drop values, and ground-motion characteristics that are statistically indistinguishable from those of shallow crustal earthquakes [42]. Consequently, waveform-based or source-parameter-based identification alone is insufficient for felt events. Current practice therefore relies on spatiotemporal association tests and departures from the regional seismic baseline [10,53,54]. Zhang et al. [55] further emphasize that statistically significant correlations between seismicity metrics and injection parameters (e.g., injection rate, cumulative volume, wellhead pressure) should be incorporated as an additional discriminatory criterion beyond simple spatiotemporal proximity.
5. Statistical Analysis of Induced Seismicity Versus Injection Parameters Across Field Sites
5.1. Relationship with Injected Volume
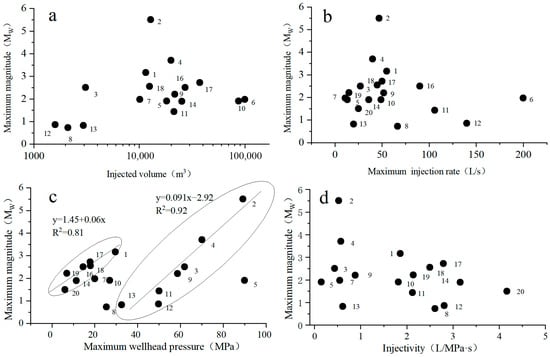
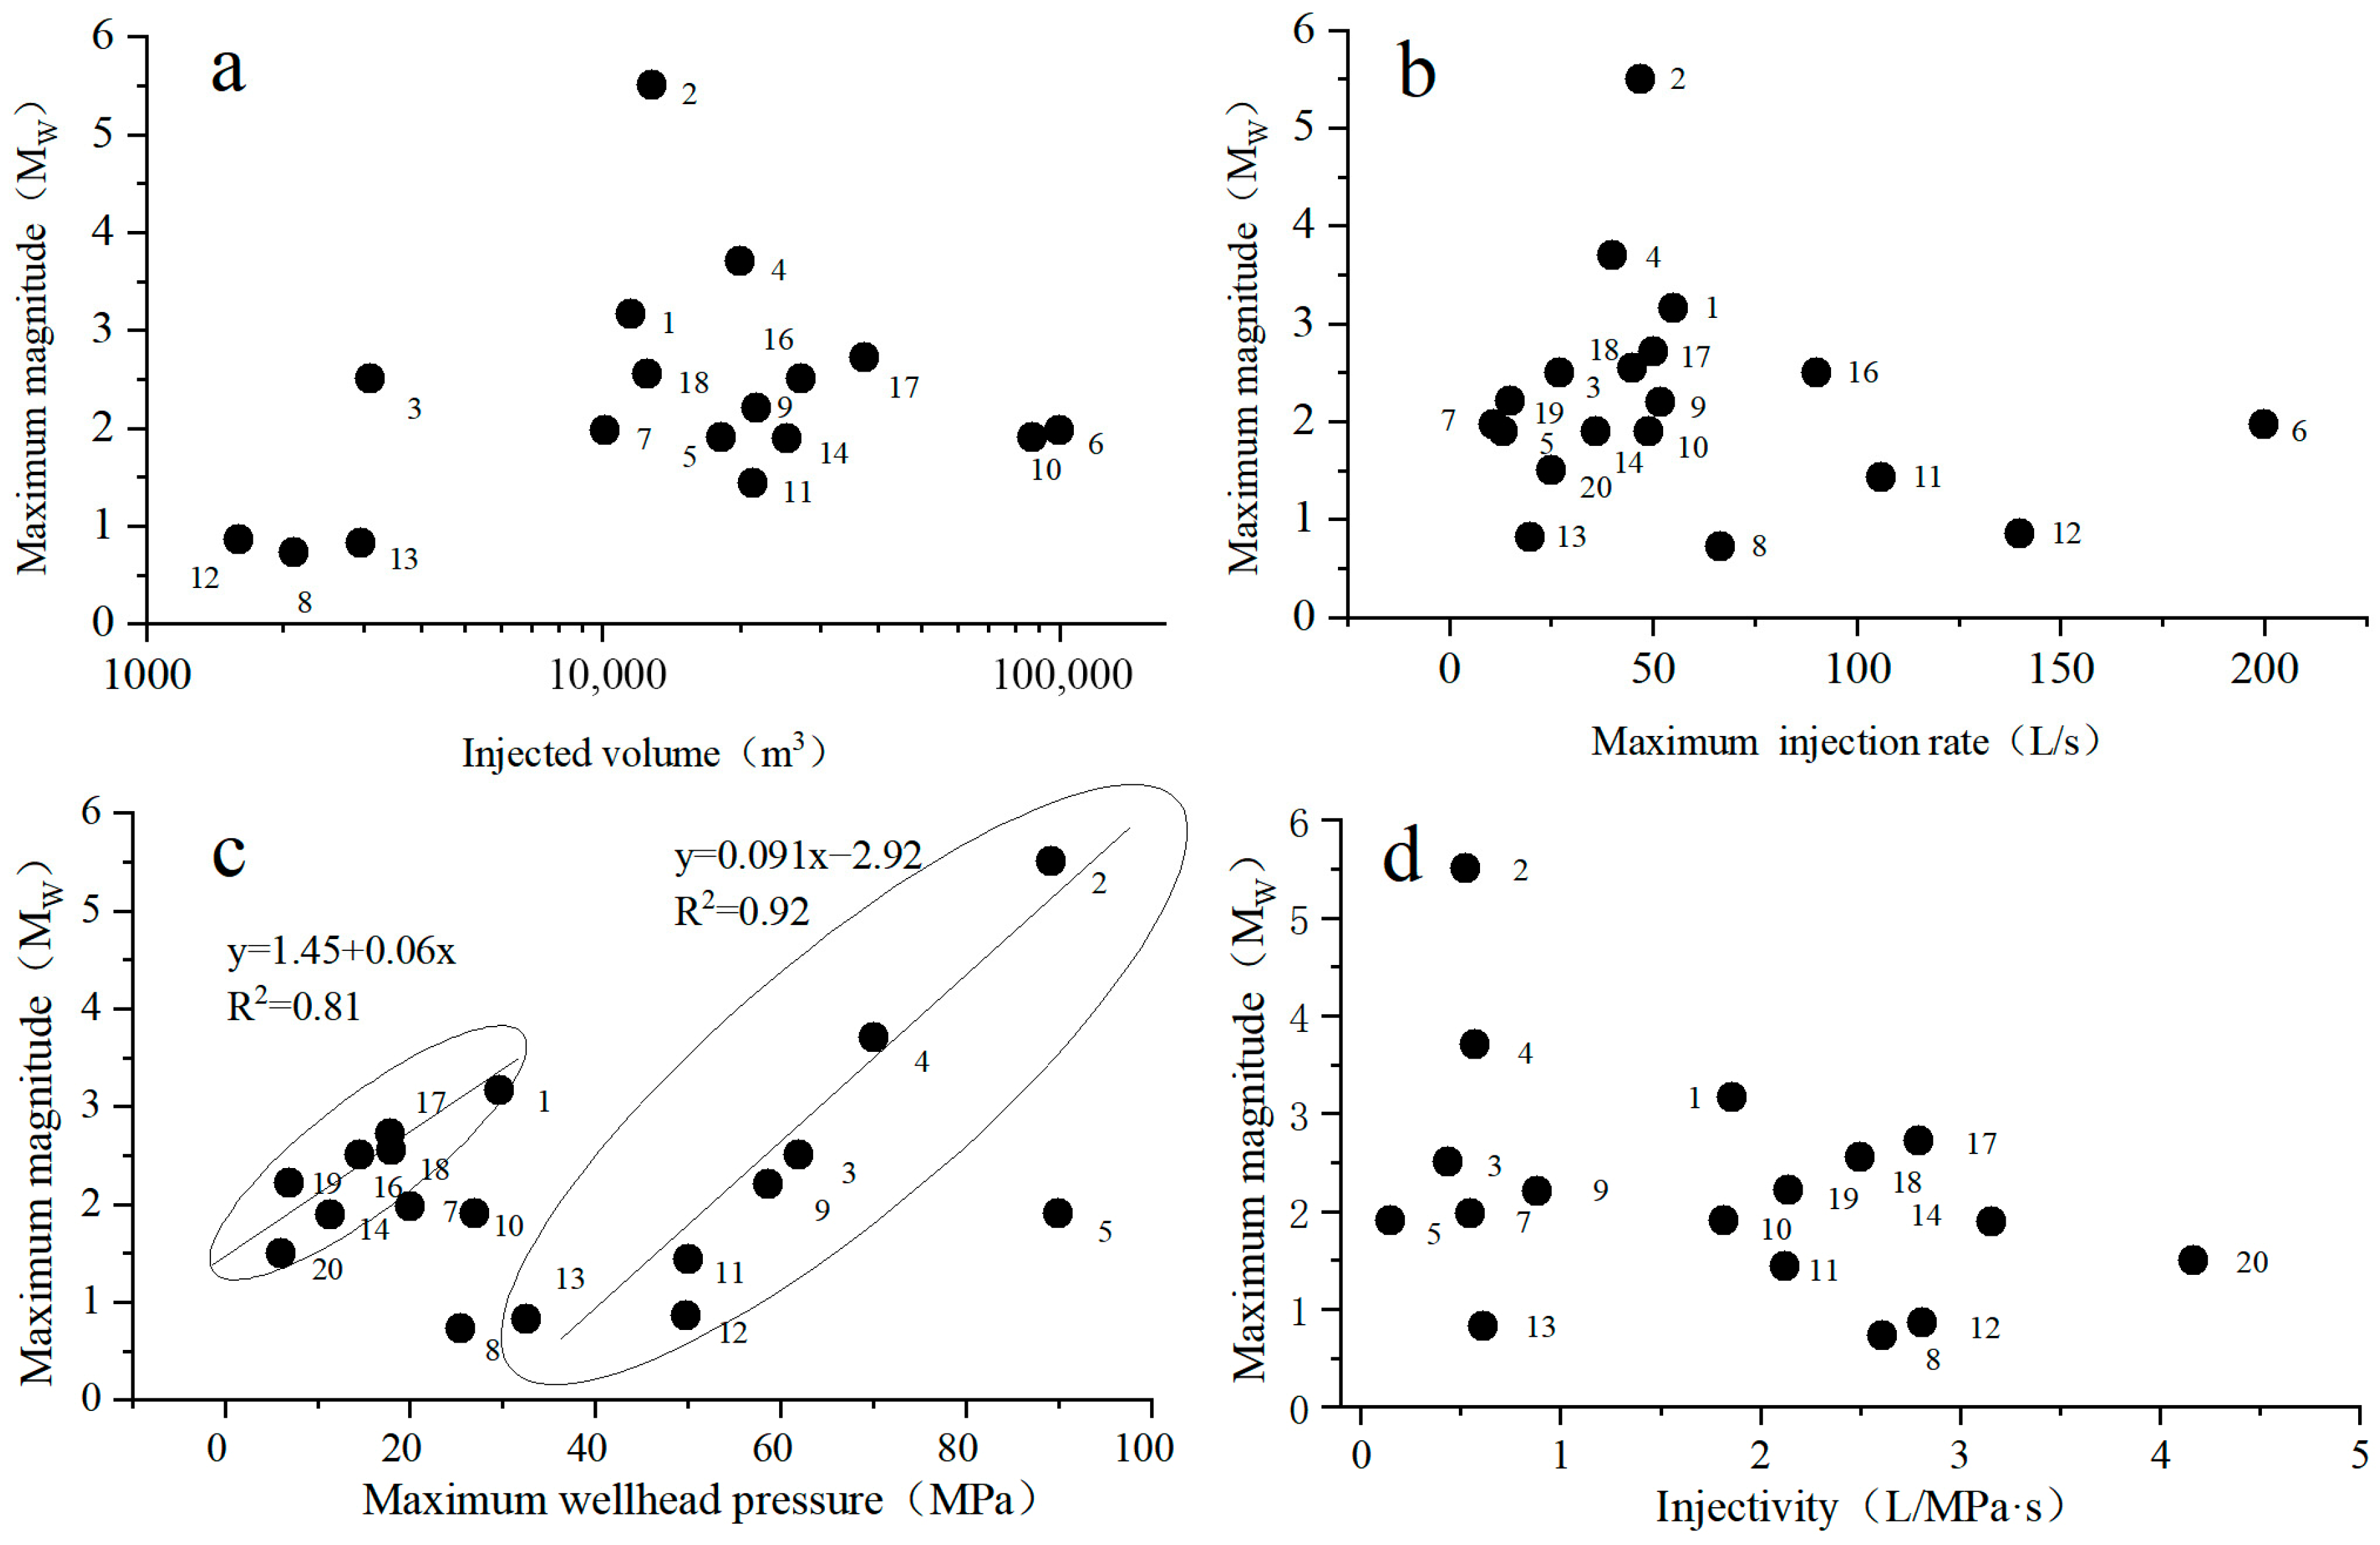
Inspection of Figure 3a reveals no universal scaling between the maximum induced magnitude and injected volume when data from different sites are pooled. However, within a single site, the largest event per stimulation stage exhibits an approximately linear trend on a semi-logarithmic plot of magnitude versus injected volume [56]. Earlier studies reported that cumulative seismic moment increases linearly with total injected volume [38], and Shapiro et al. [57] demonstrated that the number of induced events scales proportionally with injected volume. Conversely, Van der Elst et al. [58] used observational residuals, the absence of a robust correlation between cumulative moment and volume, and inconsistencies with physical scaling arguments to refute the proportionality between cumulative moment and injected volume, while reaffirming the proportionality between event count and volume.
Figure 3.
Relationship between maximum magnitude and injection parameters. The numbers in the figure correspond to the project serial numbers in Table 1. (a) Injected volume vs. maximum magnitude; (b) maximum injection rate vs. maximum magnitude; (c) maximum wellhead pressure vs. maximum magnitude; (d) injectivity vs. maximum magnitude, where injectivity is roughly estimated as the ratio of maximum injection rate to maximum wellhead pressure.
5.2. Relationship to Injection Flow Rate
Field data (Figure 3b) show that HDR stimulations typically employ flow rates below 50 L/s, yet no clear dependence of the maximum magnitude on peak flow rate is apparent. Alghannam and Juanes (2020) [59] experimentally demonstrated that for a fixed cumulative volume, abrupt increases in injection rate elevate seismic hazard, whereas gradual ramping reduces it. These findings indicate that rapid rate changes generate sharp pore-pressure transients, which in turn increase the probability of triggering larger events.
Cross-site analysis (Figure 3b) indicates that neither the magnitude nor the rate of induced seismicity exhibits a statistically significant, direct correlation with peak injection flow rate. Most HDR stimulations are conducted at flow rates below 50 L/s, and the largest events do not cluster at higher rates. Laboratory and field experiments by Alghannam and Juanes (2020) [59]; however, show that for a fixed cumulative volume, abrupt increases in flow rate markedly elevate seismic hazard, whereas gradual ramping attenuates it. The authors attribute the heightened risk to rapid pore-pressure transients generated by sudden rate changes, which can drive fractures or faults to critical stress conditions more efficiently than monotonic or stepwise injection schedules.
5.3. Relationship to Injection Pressure
Induced seismicity frequency exhibits a strong positive correlation with injection pressure, a pattern consistently observed across both HDR developments and controlled injection experiments [29,60]. The underlying mechanism is straightforward: once the target fracture network is hydraulically connected to the wellbore, the elevated wellhead pressure increases pore pressure, reduces effective normal stress, and thereby promotes slip on pre-existing fractures or faults. Inspection of the relationship between maximum magnitude and peak injection pressure reveals a clear bimodal distribution (Figure 3c).
Group 1 (low-pressure group) includes sites such as the multi-stage stimulation wells at Soultz (France) and the Basel project (Switzerland). These reservoirs are located in the Rhine Graben and its adjacent extensional tectonic zones, where the stress regime is predominantly strike-slip to normal-faulting, the tectonic setting is relatively consistent, and the injectivity is relatively high (>1 L/MPa·s, see Figure 3d). In this group, injection pressure shows a significant positive correlation with the maximum magnitude (Spearman ρ = 0.93, p < 0.01), with a bootstrap 95% confidence interval of [0.41, 1.00]. Notably, when the Japanese Ogachi site—which visually also belongs to this group—is included in the analysis, the correlation disappears (ρ = 0.29). This further suggests that the good correlation observed within the low-pressure group may be mainly controlled by regional tectonic homogeneity rather than by a simple pressure threshold effect.
Group 2 (high-pressure group) covers sites such as Fenton Hill and Utah (USA), Cooper Basin and Paralana (Australia), Pohang (Republic of Korea), and Gonghe (China). These sites share similar characteristics: a strike-slip to reverse-faulting stress regime, high crustal stress, and low injectivity (0.41–0.91 L/MPa·s, see Figure 3d). In this group, injection pressure exhibits an extremely strong monotonic positive correlation with the maximum magnitude (Spearman ρ = 1.00, p < 0.01), with a bootstrap 95% confidence interval of [1.00, 1.00]. Notably, the Pohang Mw 5.5 event (Republic of Korea)—although widely recognized as having reactivated a pre-existing fault and exceeding the predictions of injection-volume-based models (e.g., McGarr, 2014 [38])—still falls within the pressure-magnitude trend of this group. Another exception is the Finnish ST1 project: this site also has low injectivity and a high wellhead pressure (90 MPa), but it did not generate a high-magnitude event (maximum magnitude only about 1.9). Its main measures included real-time adjustment of injection parameters based on seismic risk analysis, such as controlling wellhead pressure and extending injection intervals. This case demonstrates that even under high-pressure, low-injectivity conditions, real-time adjustment of injection parameters can effectively suppress the growth of induced magnitudes, providing a feasible path for active risk management.
In summary, the “bimodal” distribution observed in this study is not simply a pressure threshold effect. The available field data suggest that this phenomenon may result from the combined influence of different tectonic stress regimes and injectivity. The above analysis further indicates that injection pressure may be a more robust and more valuable engineering early-warning indicator than injected volume when evaluating the maximum magnitude. At the same time, real-time adjustment of injection parameters offers a pathway toward safer hot dry rock development.
6. Seismic-Hazard Assessment of Induced Events
6.1. Conditions for Generating Perceptible Induced Earthquakes
The prevailing consensus holds that four necessary conditions must be simultaneously satisfied for fluid injection to generate a perceptible (felt) earthquake [45,61]: (i) an active stress perturbation source; (ii) a pre-existing fault at or near critical stress; (iii) a fault of sufficient geometric extent to produce a felt event; and (iv) a hydromechanical coupling pathway linking the stress perturbation source to the fault. Mechanically, once a fault intersects the stimulated reservoir volume—thereby establishing direct hydraulic communication—elevated injection pressures can destabilize faults even if their initial stress state is sub-critical. The 2011 Prague, Oklahoma, earthquake sequence exemplifies this behavior: ruptures nucleated not only along favourably oriented (critically stressed) planes but also along misoriented (non-critically stressed) structures [36]. These observations confirm that elevated pore pressures expand the range of fault orientations susceptible to failure [45].
6.2. B-Value Characteristics
The b-value, defined as the slope of the Gutenberg-Richter magnitude-frequency distribution, typically approximates 1.0 for tectonic earthquakes [62]. High-pressure fluid-injection experiments generally yield b-values significantly greater than 1.0 [63]. In contrast, induced seismicity recorded at HDR sites exhibits lower b-values, most of which cluster around or below 1.0 (Table 1). No systematic correlation is observed between the maximum induced magnitude and the b-value. Although the Mw 5.5 Pohang (Republic of Korea) and the large-magnitude sequence in the Cooper Basin (Australia) are both characterized by below-average b-values, the two datasets exhibit comparable b-values despite markedly different peak magnitudes. Consequently, the absolute b-value does not serve as a quantitative predictor of seismic hazard. Rather, because the b-value reflects the relative proportion of small to large events, a sustained decrease toward or below 1.0 can be interpreted qualitatively as an indicator of an elevated potential for larger-magnitude events.
6.3. Seismic-Energy Release Efficiency
Maxwell et al. [64] introduced the seismic release efficiency (IE) as:
where ΣEO is the cumulative radiated seismic energy and EH is the hydraulic energy. Bentz et al. [56] compared IE across multiple EGS sites and found that most projects converge within the range from 10−3 to 10−2. Projects that ultimately produced larger events—specifically the Cooper Basin (Australia) and Pohang (Republic of Korea)—experienced rapid increases in IE. The Pohang sequence is particularly notable: IE was initially low but escalated sharply prior to the Mw 5.5 event.
Conversely, the Finnish ST1 project maintained IE at the lower end of the observed spectrum, successfully limiting the maximum magnitude to 2.0 [21]. Nevertheless, the Basel stimulation demonstrates that IE alone is insufficient as a safeguard: IE declined monotonically throughout the operation, yet the sequence culminated in an ML 3.4 earthquake. Consequently, while constraining IE can reduce seismic hazard, it must be embedded within a broader, multi-parameter risk-management protocol.
6.4. Seismogenic Index
Shapiro et al. [57] introduced the seismogenic index (Σ) to quantify the propensity of a given geological setting to generate injection-induced seismicity. Derived under the assumption that pore-pressure diffusion is the dominant triggering mechanism and incorporating the Gutenberg–Richter distribution, the index is independent of operational injection parameters and depends solely on tectonic characteristics:
where N(t) is the cumulative number of events with a magnitude of ≥M, Qc(t) is the cumulative injected volume, and b is the b-value of the Gutenberg–Richter distribution.
HDR projects exhibit systematically higher Σ values compared with the hydrocarbon stimulations. Specifically, Cooper Basin (Australia) records Σ ≈ −1.2, and Basel (Switzerland) records Σ ≈ 0.1; both sites experienced events exceeding Mw 3. In contrast, Ogachi (Japan) displays Σ ≈ −2.6, and it generated significantly lower-magnitude seismicity. These observations indicate that higher seismogenic indices correspond to elevated seismic hazard under equivalent injection volumes.
6.5. Alignment of Seismic-Cloud Planes
Large, induced events are frequently observed to nucleate on discrete planar structures that can be resolved within high-resolution microseismic clouds. During the circulation phase at Soultz (France), the largest event (ML 2.9) occurred on the F3 fault plane, as interpreted from the seismic cloud [65]. Similarly, the Pohang project (Republic of Korea) intersected a high-angle fault that caused severe mud losses while drilling; microseismicity was first triggered at this location, and the subsequent Mw 5.4 earthquake ruptured the same plane [18]. Because deep-seated faults—particularly steeply dipping structures in crystalline basement—are difficult to detect a prioritised, real-time, high-precision microseismic monitoring should be employed throughout HDR development to identify and continuously update the geometry of seismogenic planes. The interpretation of these seismic-cloud planes is a critical qualitative component of induced-seismicity risk assessment.
6.6. Maximum-Magnitude Forecasting
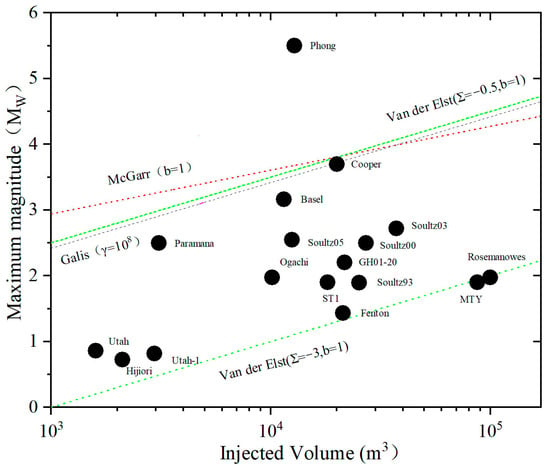
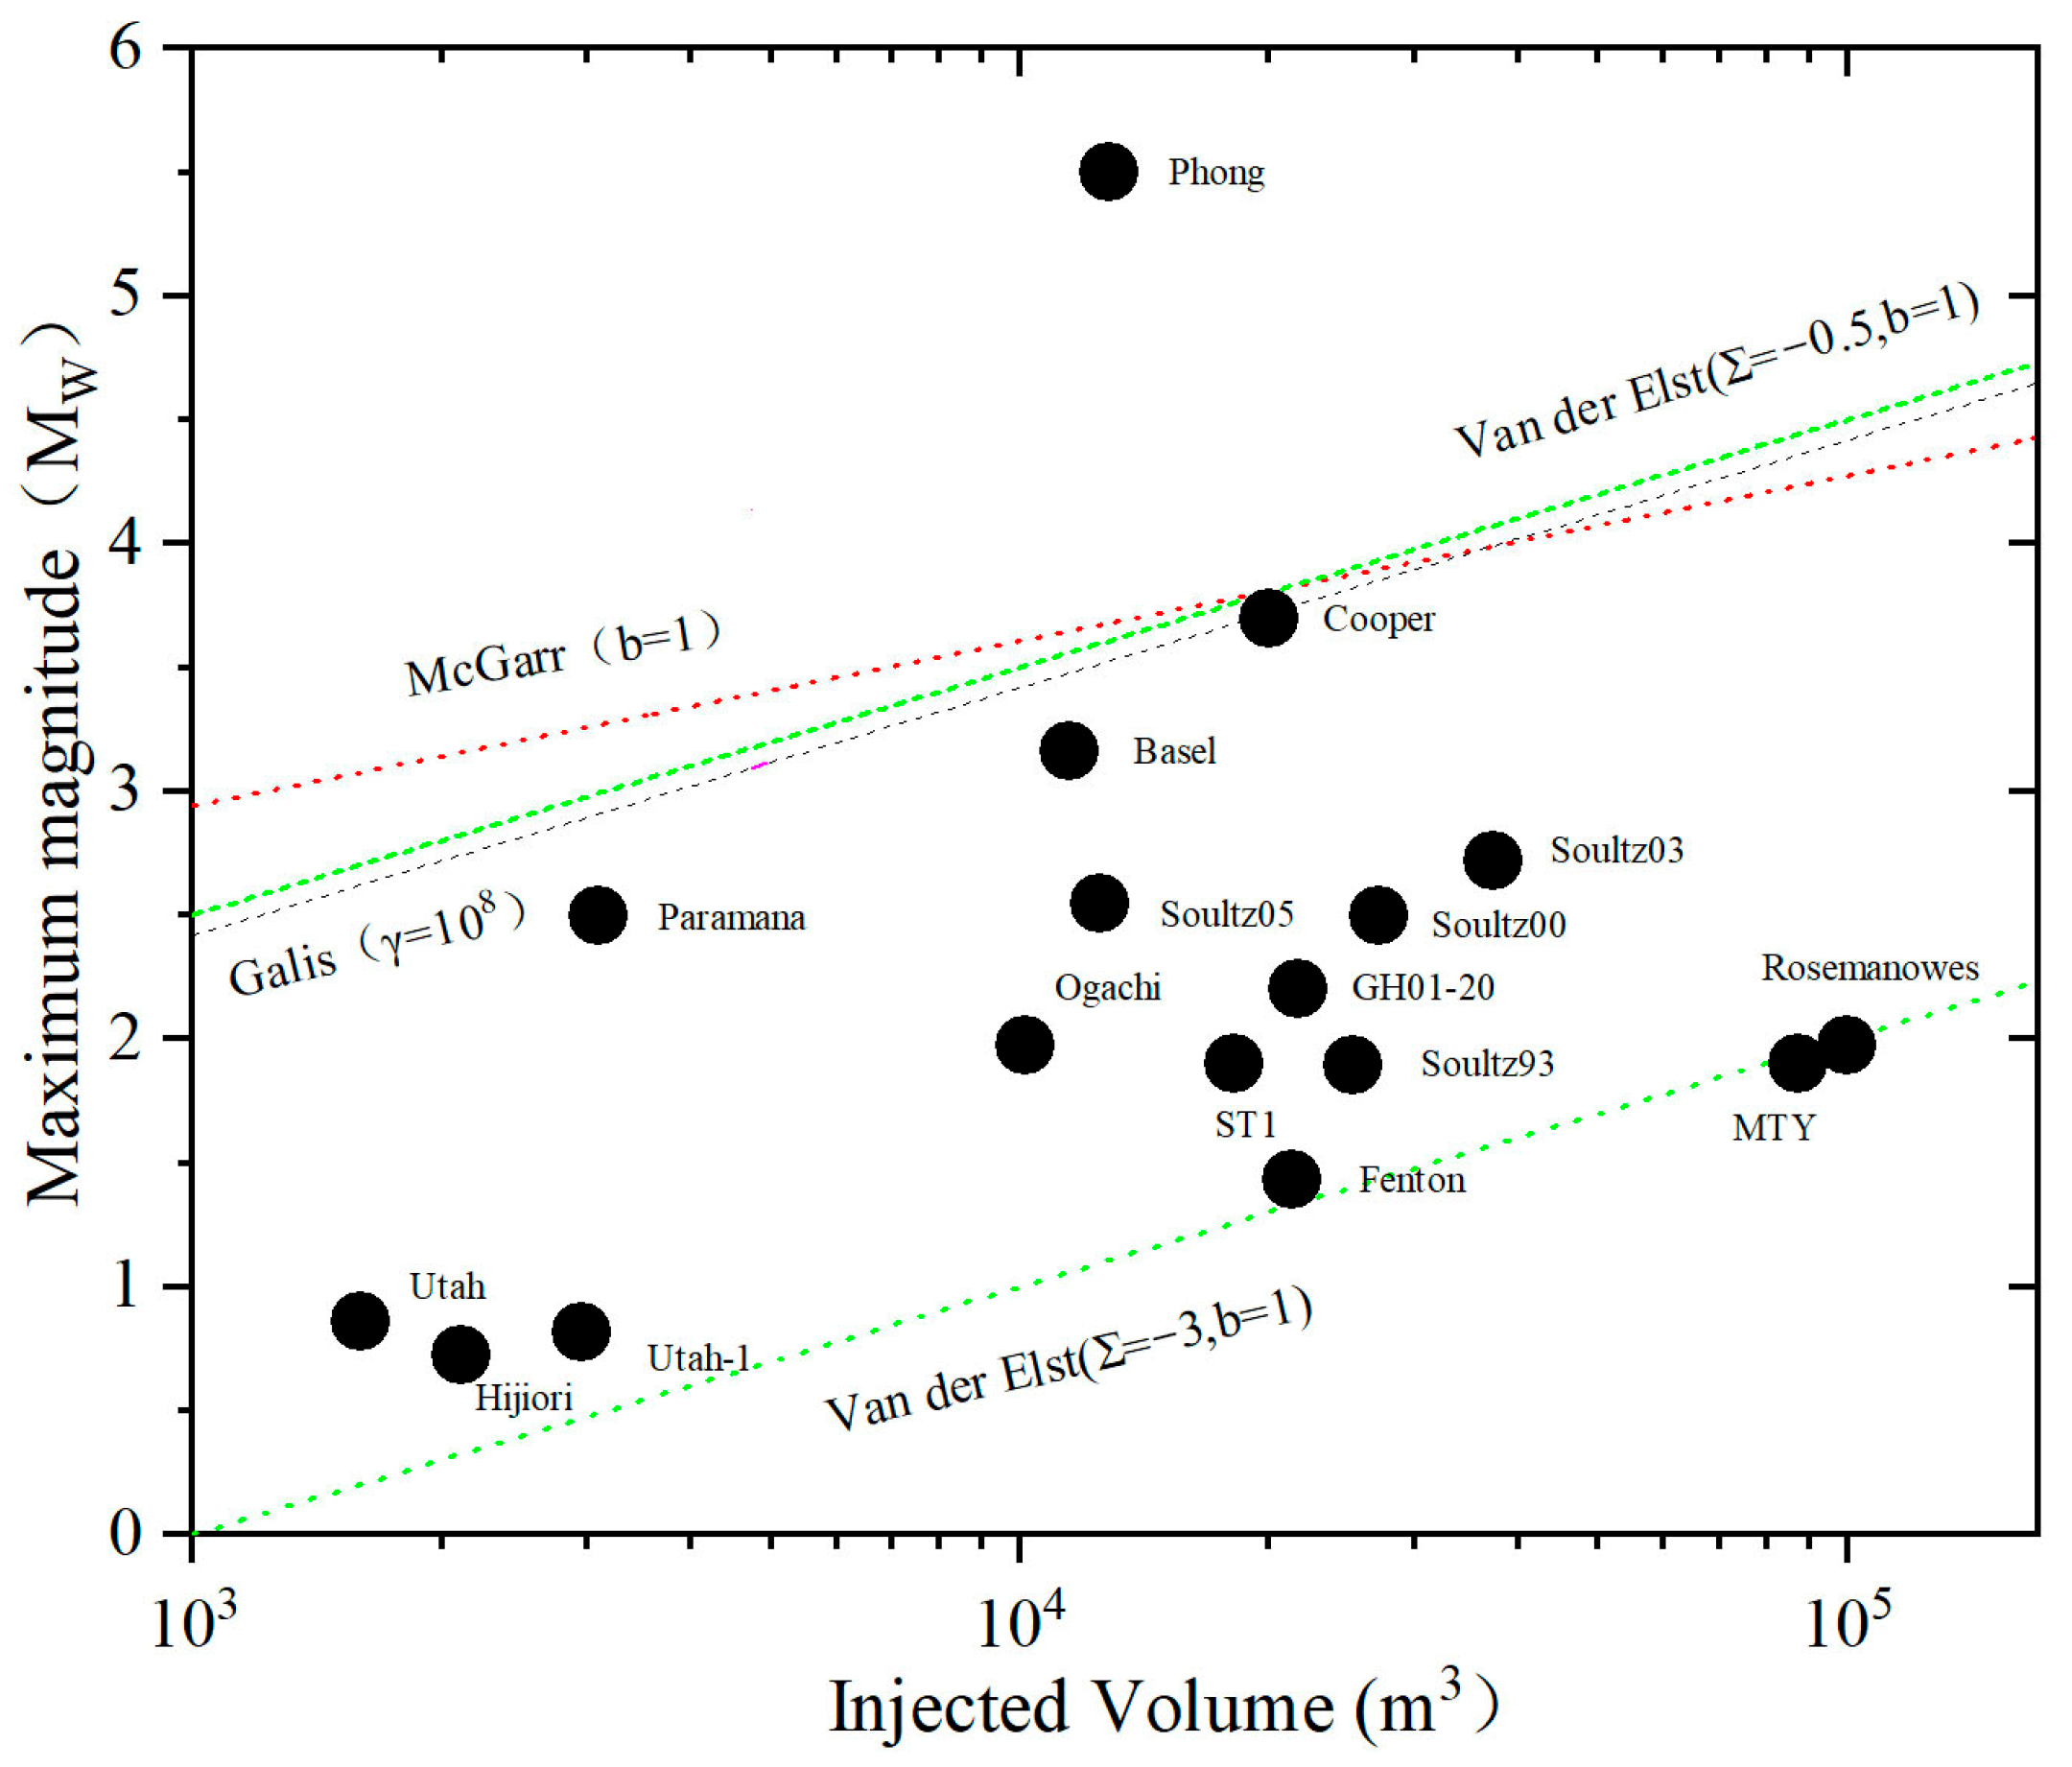
Two conceptually distinct upper bounds are invoked for the largest possible magnitude (Mmax) that can be induced during HDR stimulation [45]: (1) the largest earthquake that the seismogenic volume could host under purely natural conditions, as inferred from regional seismicity and tectonic assessment [39,44] and (2) a volume-dependent bound dictated by the injected fluid volume within the stimulated reservoir [57,66]. For the second bound, statistical and reduced-physics models have been developed that couple the spatial distribution of microseismicity with simplified fracture-mechanics considerations and have shown reasonable agreement with field observations. The three most frequently applied forecasting frameworks are: the McGarr model [38]; the Van der Elst model [58] and Galis model [67]. When the three models are benchmarked against the HDR projects listed in Table 1 (Figure 4), the McGarr (fixed b = 1) and Galis (γ = 1.5 × 10⁸) formulations systematically over-predict observed Mmax. The McGarr overestimation is attributable to its implicit neglect of aseismic deformation and enhanced permeability, which reduce seismic moment release per unit of volume. Although conservative, the McGarr estimate is therefore useful as an upper bound when no other constraints are available. The Van der Elst model, which depends on both the seismogenic index (Σ) and the b-value, is more sensitive to parameter choice. Its statistical premise—that Σ and b remain temporally invariant—limits applicability in heterogeneous or evolving stress environments. Nevertheless, because it leverages real-time seismicity statistics, it generally produces more accurate short-term forecasts during active injection. The Galis formulation is strictly a mechanical bound for self-arrested rupture rather than a predictive model for induced Mmax. The observation that all recorded HDR-induced events fall below this bound merely indicates that ruptures to date have been self-limiting, implying technical controllability under current operational envelopes.
Figure 4.
Comparison chart of maximum magnitude predictions from models versus observed maximum magnitudes at various hot dry rock development sites. The red line represents the prediction curve of the McGarr model, the black line represents the prediction curve of the Galis model, and the green curves represent the prediction curves of the Van der Elst model under different seismogenic index values.
Current prediction models are mostly based on simplified physical frameworks [6]. Developing more accurate multi-field coupling models is an important direction for future maximum magnitude forecasting. Recent studies have highlighted the key role of temperature effects on the reservoir pore pressure, fluid viscosity, and rock mechanical properties in physical prediction models of induced seismicity [6,68]. Therefore, in multi-field coupling models, more attention should be paid to temperature effects, for instance, by incorporating non-isothermal flow models [69], to improve the predictive accuracy of the physical models. However, it should be noted that when injection occurs near buried faults, none of the existing models are reliable, which is a limitation that must be addressed through both model improvement and risk avoidance.
7. Induced-Seismicity Management
The traffic-light system (TLS) is presently the primary risk-management protocol for Enhanced Geothermal System (EGS) projects. Originally formalized by Bommer et al. [70], the TLS establishes site-specific thresholds (e.g., magnitude, peak ground velocity) based on regulatory requirements or local seismic risk tolerance. When a threshold is exceeded, predefined operational responses—such as reducing or ceasing injection—are triggered automatically. Although the TLS has proven effective in several campaigns, its intrinsically reactive nature has allowed threshold breaches to occur, notably at Basel (Switzerland) and Pohang (Republic of Korea), where an Mw 3.2 event was recorded during injection.
Current improvements of the TLS focus on two complementary directions: (1) Prognostic risk assessment. Adaptive traffic-light systems (ATLS) [71] integrate forward-looking seismic forecasts to adjust thresholds and operational parameters in real time. These systems require dense, high-quality datasets. The Finnish ST1 project evaluated such forward models’ post-stimulation and concluded that existing algorithms tend to over-predict hazard; recalibration against site-specific data remains essential before operational deployment. (2) Operational mitigation measures. A suite of engineering strategies has been proposed and field-tested: gradual rate ramp-up and stepped shut-down [59], cyclic soft stimulation [72,73], fracture “caging” [74], and controlled fault creep [75].
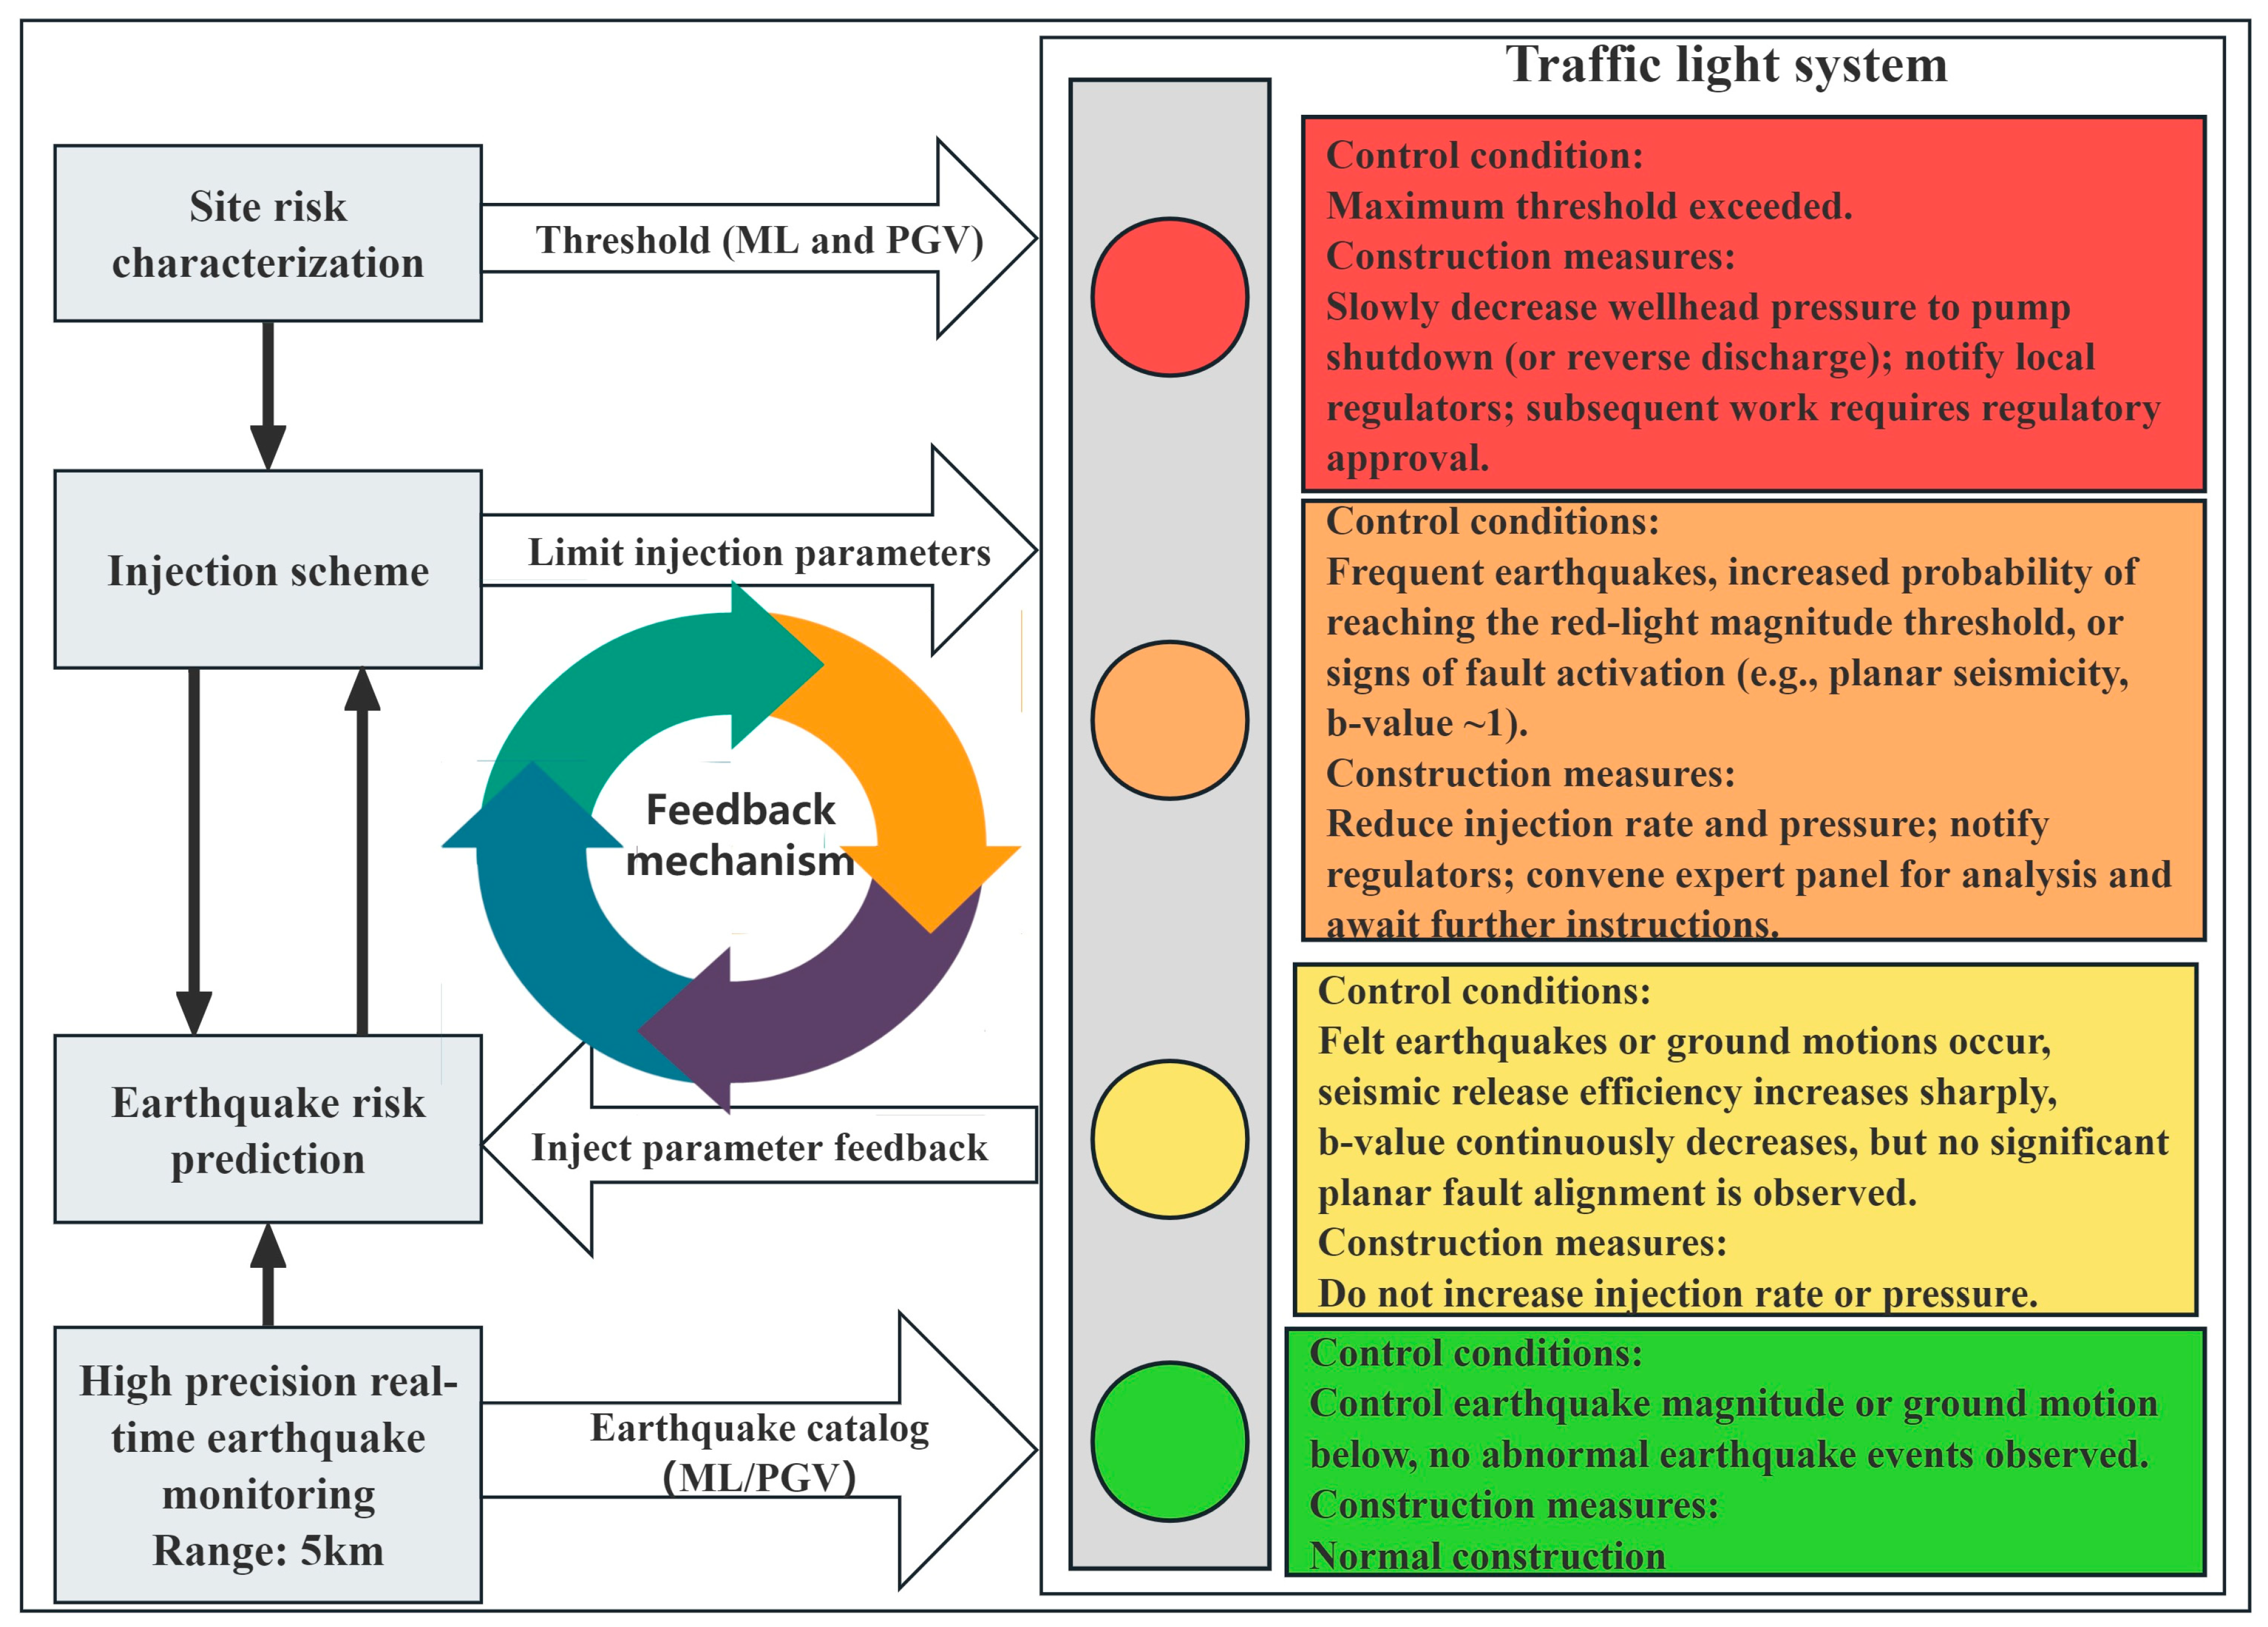
Cyclic soft stimulation has demonstrated consistent reduction in maximum magnitude across laboratory, mine-scale, and full-field trials (e.g., the fourth stimulation stage at Pohang). Comparable results were obtained from non-seismicity-targeted cyclic treatments at Groß Schönebeck (Germany) [76] and ST1 (Finland), suggesting that alternative injection schedules may become pivotal in regions with stringent seismic constraints. Building on the generalized hydraulic-fracturing TLS framework proposed by Walters et al. [7], a real-time feedback protocol that integrates dynamic risk metrics—b-value trends, seismic-energy release efficiency (IE), forecasted maximum magnitude, and seismogenic-plane alignment—should be implemented. This protocol enforces adjustable limits on wellhead pressure, per-stage injected volume, injection rate, and inter-stage shut-in duration (Figure 5), thereby representing a requisite evolution toward proactive, data-driven seismic-risk management.
Figure 5.
Real-time management framework for induced seismicity in hot dry rock (HDR) development. Four-tier control thresholds are established through site-specific seismic risk characterization. By combining induced seismicity catalogues with injection plans, real-time prospective forecasting of induced seismic risk is conducted. Feedback-based real-time control is then implemented through measures such as limiting wellhead pressure, restricting single-injection volume, controlling injection rates, and extending injection intervals.
8. Limitations
This study conducts a cross-site comparative analysis based on publicly available data from 13 hot dry rock (HDR) projects worldwide. However, several limitations should be noted. Differences across projects—such as in monitoring network configurations, recording durations, and the level of detail in stress state descriptions—may affect the reliability of direct comparisons of seismic characteristics. Inconsistent monitoring capabilities may lead to an underestimation of the proportion of the felt earthquakes. Therefore, the 62% reported in this paper should be seen as a minimum estimate. Non-uniform magnitude scales and the use of empirical conversion formulas may introduce some uncertainty and bias into the cross-site correlation analysis between magnitude and injection parameters. Publicly available information on in situ stress magnitudes and operational strategies is limited. Although we observed a grouped linear relationship between injection pressure and maximum magnitude, caution is needed when generalizing the conclusions. Furthermore, the sample size is small, which limits its statistical power. Thus, these findings require further validation with more data.
9. Conclusions
Undoubtedly, hot dry rock (HDR) stimulations frequently generate felt events, yet destructive earthquakes remain rare. The affected volume is generally confined within 2 km of the injection well, and most projects exhibit a clear “tailing effect” and a pronounced “Kaiser effect.” Discrimination between induced and natural earthquakes relies on spatiotemporal correlations, deviations from the regional baseline, and causal links to injection parameters.
Furthermore, the dominant mechanism for felt events appears to be slip on pre-existing fractures or faults driven by pore-pressure increase and poro-elastic stress changes, with pore pressure likely serving as the primary controlling factor.
On the other hand, cross-site comparisons reveal no statistically significant correlation between total injected volume and the maximum induced magnitude. Correlations between the injection rate and magnitude seem weak; nevertheless, gradual rate modulation may reduce the likelihood of large events. The wellhead pressure appears to be a key control variable, with correlation analyses suggesting a robust positive relationship with the maximum magnitude. Low-injectivity reservoirs subjected to high wellhead pressures tend to be particularly prone to large events, whereas cyclic fracturing and similar modified injection strategies may represent important means for mitigating risk in analogous settings.
In addition, sustained low b-values, elevated seismogenic indices, and rapidly increasing seismic-energy release efficiency may serve as qualitative indicators of hazard. Within the same site, volume-based maximum-magnitude models can provide quantitative reference for evaluation, but all of models may fail when the injection occurs near major faults. In cross-site comparisons, the injection pressure seems to offer more reference value than injected volume, although further data support is needed and caution is required.
Finally, integrating comprehensive seismic risk indicators (e.g., b-value, seismic release efficiency, maximum magnitude forecasting) with key injection control parameters (e.g., wellhead pressure, single-injection volume) into a real-time control system may represent a promising research direction. Preliminary analyses suggest that a multi-metric decision framework appears worthy of further investigation for balancing induced seismic risk against reservoir stimulation performance. However, all the above evaluation metrics and the thresholds of control parameters require further validation through more field applications.
Author Contributions
Conceptualization, Z.N. and H.Z.; methodology, X.N.; software, X.J.; validation, X.N., D.C. and L.Z.; formal analysis, X.N.; investigation, C.Z. and Q.L.; resources, Z.N. and H.Z.; data curation, X.N. and X.J.; writing—original draft preparation, X.N.; writing—review and editing, Z.N. and H.Z.; visualization, D.C.; supervision, Z.N. and H.Z.; project administration, Z.N.; funding acquisition, Z.N. and H.Z. All authors have read and agreed to the published version of the manuscript.
Funding
This research was funded by the Natural Science Foundation Joint Fund Project (grant number U24B2032) and the Science Project of China Geological Survey (grant number DD202605202302 and DD20230018).
Institutional Review Board Statement
Not applicable.
Informed Consent Statement
Not applicable.
Data Availability Statement
The datasets used and analyzed during the current study are available from the corresponding author on reasonable request.
Acknowledgments
We would like to thank the reviewers for their constructive comments. The author wishes to acknowledge the many contributions of other authors, both past and present, to the development of the concepts and workflows presented in this paper.
Conflicts of Interest
The authors declare no conflicts of interest. All authors are employed by the Center for Hydrogeology and Environmental Geology. The authors declare that the research was conducted in the absence of any commercial or financial relationships that could be construed as a potential conflict of interest.
Abbreviations
The following abbreviations are used in this manuscript:
| HDR | hot dry rocks |
| G-R | Gutenberg-Richter |
| EGS | Enhanced Geothermal Systems |
| FORGE | Frontier Observatory for Research in Geothermal Energy |
| ATLS | Adaptive traffic-light systems |
| TLS | traffic-light system |
References
- Kumari, W.G.P.; Ranjith, P.G. Sustainable development of enhanced geothermal systems based on geotechnical research—A review. Earth Sci. Rev. 2019, 199, 102955. [Google Scholar] [CrossRef] [Scilit]
- Xu, T.F.; Hu, Z.X.; Li, S.T. Enhanced Geothermal System: International Progresses and Research Status of China. Acta Geol. Sin. 2018, 92, 1936. [Google Scholar] [CrossRef]
- Yin, X.; Jiang, C.; Yin, F.; Zhai, H.; Zheng, Y.; Wu, H.; Niu, X.; Zhang, Y.; Jiang, C.; Li, J. Assessment and optimization of maximum magnitude forecasting models for induced seismicity in enhanced geothermal systems: The Gonghe EGS project in Qinghai, China. Tectonophysics 2024, 886, 230438. [Google Scholar] [CrossRef] [Scilit]
- Moska, R.; Labus, K.; Kasza, P. Hydraulic Fracturing in Enhanced Geothermal Systems—Field, Tectonic and Rock Mechanics Conditions—A Review. Energies 2021, 14, 5725. [Google Scholar] [CrossRef] [Scilit]
- Zang, A.; Oye, V.; Jousset, P.; Deichmann, N.; Gritto, R.; McGarr, A.; Majer, E.; Bruhn, D. Analysis of induced seismicity in geothermal reservoirs—An overview. Geothermics 2014, 52, 6–21. [Google Scholar] [CrossRef] [Scilit]
- Gaucher, E.; Schoenball, M.; Heidbach, O.; Zang, A.; Fokker, P.A.; van Wees, J.-D.; Kohl, T. Induced seismicity in geothermal reservoirs: A review of forecasting approaches. Renew. Sustain. Energy Rev. 2015, 52, 1473–1490. [Google Scholar] [CrossRef] [Scilit]
- Walters, R.J.; Zoback, M.D.; Baker, J.W.; Beroza, G.C. Characterizing and Responding to Seismic Risk Associated with Earthquakes Potentially Triggered by Fluid Disposal and Hydraulic Fracturing. Seismol. Res. Lett. 2015, 86, 1110–1118. [Google Scholar] [CrossRef] [Scilit]
- Zhou, W.; Lanza, F.; Grigoratos, I.; Schultz, R.; Cousse, J.; Trutnevyte, E.; Muntendam-Bos, A.; Wiemer, S. Managing induced seismicity risks from enhanced geothermal systems: A good practice guideline. Rev. Geophys. 2024, 62, e2024RG000849. [Google Scholar] [CrossRef] [Scilit]
- Grünthal, G.; Wahlstrom, R.; Stromeyer, D. The unified catalogue of earthquakes in central, northern, and northwestern Europe (CENEC)—Updated and expanded to the last millennium. J. Seismol. 2009, 13, 517–541. [Google Scholar] [CrossRef] [Scilit]
- Ellsworth, W.L. Injection-Induced Earthquakes. Science 2013, 341, 1225942. [Google Scholar] [CrossRef] [Scilit]
- Westwood, R.F.; Toon, S.M.; Styles, P.; Cassidy, N.J. Horizontal respect distance for hydraulic fracturing in the vicinity of existing faults in deep geological reservoirs: A review and modelling study. Geomech. Geophys. Geo-Energy Geo-Resour. 2017, 3, 379–391. [Google Scholar] [CrossRef] [Scilit]
- Davies, R.J.; Mathias, S.A.; Moss, J.; Hustoft, S.; Newport, L. Hydraulic fractures: How far can they go? Mar. Pet. Geol. 2012, 37, 1–6. [Google Scholar] [CrossRef] [Scilit]
- Davies, R.J.; Foulger, G.R.; Mathias, S.; Moss, J.; Hustoft, S.; Newport, L. Reply: Davies et al. (2012), Hydraulic fractures: How far can they go? Mar. Pet. Geol. 2013, 43, 519–521. [Google Scholar] [CrossRef] [Scilit]
- Wilson, M.P.; Worrall, F.; Davies, R.J.; Almond, S. Fracking: How far from faults? Geomech. Geophys. Geo-Energy Geo-Resour. 2018, 4, 193–199. [Google Scholar] [CrossRef] [Scilit]
- Davis, S.D.; Frohlich, C. Did (Or Will) Fluid Injection Cause Earthquakes?—Criteria for a Rational Assessment. Seismol. Res. Lett. 1993, 64, 207–224. [Google Scholar] [CrossRef] [Scilit]
- Niu, Z.-X.; Deng, Z.-H.; Niu, X.; Chen, D.-F.; Zhu, G.-L.; Xu, W.-H.; Zhang, L.-Y.; Feng, Q.-D. Origin and risk assessment of natural radioactivity in groundwater from the Eastern Gonghe Basin, Tibetan Plateau. J. Groundw. Sci. Eng. 2025, 13, 301–311. [Google Scholar] [CrossRef] [Scilit]
- Häring, M.O.; Schanz, U.; Ladner, F.; Dyer, B.C. Characterisation of the Basel 1 enhanced geothermal system. Geothermics 2008, 37, 469–495. [Google Scholar] [CrossRef] [Scilit]
- Ellsworth, W.L.; Giardini, D.; Townend, J.; Ge, S.; Shimamoto, T. Triggering of the Pohang, Korea, Earthquake (Mw 5.5) by Enhanced Geothermal System Stimulation. Seismol. Res. Lett. 2019, 90, 1844–1858. [Google Scholar] [CrossRef] [Scilit]
- Albaric, J.; Oye, V.; Langet, N.; Hasting, M.; Lecomte, I.; Iranpour, K.; Messeiller, M.; Reid, P. Monitoring of induced seismicity during the first geothermal reservoir stimulation at Paralana, Australia. Geothermics 2014, 52, 120–131. [Google Scholar] [CrossRef] [Scilit]
- Asanuma, H.; Soma, N.; Kaieda, H.; Kumano, Y.; Izumi, T.; Tezuka, K.; Niitsuma, H.; Wyborn, D. Microseismic Monitoring of Hydraulic Stimulation at the Australian HDR Project in Cooper Basin. In Proceedings of the Proceedings World Geothermal Congress, Antalya, Turkey, 24–29 April 2005. [Google Scholar]
- Kwiatek, G.; Saarno, T.; Ader, T.; Bluemle, F.; Bohnhoff, M.; Chendorain, M.; Dresen, G.; Heikkinen, P.; Kukkonen, I.; Leary, P.; et al. Controlling fluid-induced seismicity during a 6.1-km-deep geothermal stimulation in Finland. Sci. Adv. 2019, 5, eaav7224. [Google Scholar] [CrossRef] [Scilit] [PubMed]
- Sigfússon, B.; Uihlein, A. 2014 JRC Geothermal Energy Status Report; Publications Office of the European Union: Luxembourg, 2015. [Google Scholar]
- Kaieda, H.; Sasaki, S.; Wyborn, D. Comparison of characteristics of micro-earthquakes observed during hydraulic stimulation operations in Ogachi, Hijiori and Cooper Basin HDR projects. In Proceedings of the World Geothermal Congress, Bali, Indonesia, 24 September 2021. [Google Scholar]
- Sasaki, S.; Kaieda, H. Determination of Stress State from Focal Mechanisms of Microseismic Events Induced During Hydraulic Injection at the Hijiori Hot Dry Rock Site. Pure Appl. Geophys. 2002, 159, 489–516. [Google Scholar] [CrossRef] [Scilit]
- Wang, N.; Wang, Y.L.; Zhang, X.G.; Yin, K.; Mao, G.; Ji, C. Study on earthquakes induced by artificial water injection in matouying dry hot rock mining test site. J. Geod. Geodyn. 2024, 44, 905–909+936. [Google Scholar] [CrossRef]
- House, L. Locating microearthquakes induced by hydraulic fracturing in crystalline rock. Geophys. Res. Lett. 2013, 14, 919–921. [Google Scholar] [CrossRef] [Scilit]
- Niemz, P.; Mclennan, J.; Pankow, K.L.; Rutledge, J.; England, K. Circulation experiments at Utah FORGE: Near-surface seismic monitoring reveals fracture growth after shut-in. Geothermics 2024, 119, 102947. [Google Scholar] [CrossRef] [Scilit]
- Baria, R.; Baumgärtner, J.; Gérard, A.; Jung, R.; Garnish, J. European HDR research programme at Soultz-sous-Forêts (France) 1987–1996. Geothermics 2000, 28, 655–669. [Google Scholar] [CrossRef] [Scilit]
- Cuenot, N.; Dorbath, C.; Frogneux, M. Microseismic activity induced under circulation conditions at the EGS Project of Soultz-sous-Forêts (France). In Proceedings of the World Geothermal Congress 2010, Bali, Indonesia, 25–30 April 2010. [Google Scholar]
- Baria, R.; Michelet, S.; Baumgärtner, J. Microseismicmonitoring of the world’s largest potential HDR reservoir. In Proceedings, Twenty-Ninth Workshop on Geothermal Reservoir Engineering; Stanford University: Stanford, CA, USA, 2004. [Google Scholar]
- Evans, K.F.; Zappone, A.; Kraft, T.; Deichmann, N.; Moia, F. A survey of the induced seismic responses to fluid injection in geothermal and CO2 reservoirs in Europe. Geothermics 2012, 41, 30–54. [Google Scholar] [CrossRef] [Scilit]
- Healy, J.H.; Rubey, W.W.; Griggs, D.T.; Raleigh, C.B. The Denver Earthquakes. Science 1986, 161, 1301–1310. [Google Scholar] [CrossRef] [Scilit]
- Lavrov, A. The Kaiser effect in rocks: Principles and stress estimation techniques. Int. J. Rock Mech. Min. Sci. 2003, 40, 151–171. [Google Scholar] [CrossRef] [Scilit]
- Kwiatek, G.; Bohnhoff, M.; Dresen, G.; Schulze, A.; Schulte, T.; Zimmermann, G.; Huenges, E. Microseismicity induced during fluid-injection: A case study from the geothermal site at Groß Schönebeck, North German Basin. Acta Geophys. 2010, 58, 995–1020. [Google Scholar] [CrossRef] [Scilit]
- Shapiro, S.A.; Dinske, C. Scaling of seismicity induced by nonlinear fluid-rock interaction. J. Geophys. Res. Solid Earth 2009, 114, 2008JB006145. [Google Scholar] [CrossRef] [Scilit]
- Chang, K.W.; Segall, P. Seismicity on Basement Faults Induced by Simultaneous Fluid Injection–Extraction. Pure Appl. Geophys. 2016, 173, 2621–2636. [Google Scholar] [CrossRef] [Scilit]
- Keranen, K.M.; Weingarten, M. Induced Seismicity. Annu. Rev. Earth Planet. Sci. 2018, 46, 149–174. [Google Scholar] [CrossRef] [Scilit]
- McGarr, A. Maximum magnitude earthquakes induced by fluid injection: Limits on fluid injection earthquakes. J. Geophys. Res. Solid Earth 2014, 119, 1008–1019. [Google Scholar] [CrossRef] [Scilit]
- Skoumal, R.J.; Brudzinski, M.R.; Currie, B.S. Proximity of Precambrian basement affects the likelihood of induced seismicity in the Appalachian, Illinois, and Williston Basins, central and eastern United States. Geosphere 2018, 14, 1365–1379. [Google Scholar] [CrossRef] [Scilit]
- Ge, S.; Saar, M.O. Review: Induced Seismicity During Geoenergy Development—A Hydromechanical Perspective. J. Geophys. Res. Solid Earth 2022, 127, e2021JB023141. [Google Scholar] [CrossRef] [Scilit]
- Stokes, S.M.; Ge, S.; Brown, M.R.M.; Menezes, E.A.; Sheehan, A.F.; Tiampo, K.F. Pore Pressure Diffusion and Onset of Induced Seismicity. J. Geophys. Res. Solid Earth 2023, 128, e2022JB026012. [Google Scholar] [CrossRef] [Scilit]
- Moein, M.J.A.; Langenbruch, C.; Schultz, R.; Grigoli, F.; Ellsworth, W.L.; Wang, R.; Rinaldi, A.P.; Shapiro, S. The physical mechanisms of induced earthquakes. Nat. Rev. Earth Environ. 2023, 4, 847–863. [Google Scholar] [CrossRef] [Scilit]
- Segall, P.; Grasso, J.; Mossop, A. Poroelastic stressing and induced seismicity near the Lacq gas field, southwestern France. J. Geophys. Res. Solid Earth 1994, 99, 15423–15438. [Google Scholar] [CrossRef] [Scilit]
- Zoback, M.D.; Gorelick, S.M. Earthquake triggering and large-scale geologic storage of carbon dioxide. Proc. Natl. Acad. Sci. USA 2012, 109, 10164–10168. [Google Scholar] [CrossRef] [Scilit]
- Atkinson, G.M.; Eaton, D.W.; Igonin, N. Developments in understanding seismicity triggered by hydraulic fracturing. Nat. Rev. Earth Environ. 2020, 1, 264–277. [Google Scholar] [CrossRef] [Scilit]
- Baisch, S.; Vörös, R.; Rothert, E.; Stang, H.; Jung, R.; Schellschmidt, R. A numerical model for fluid injection induced seismicity at Soultz-sous-Forêts. Int. J. Rock Mech. Min. Sci. 2010, 47, 405–413. [Google Scholar] [CrossRef] [Scilit]
- Segall, P.; Lu, S. Injection-induced seismicity: Poroelastic and earthquake nucleation effects. J. Geophys. Res. Solid Earth 2015, 120, 5082–5103. [Google Scholar] [CrossRef] [Scilit]
- De Simone, S.; Carrera, J.; Vilarrasa, V. Superposition approach to understand triggering mechanisms of post-injection induced seismicity. Geothermics 2017, 70, 85–97. [Google Scholar] [CrossRef] [Scilit]
- Ucar, E.; Berre, I.; Keilegavlen, E. Postinjection Normal Closure of Fractures as a Mechanism for Induced Seismicity. Geophys. Res. Lett. 2017, 44, 9598–9606. [Google Scholar] [CrossRef] [Scilit]
- Rathnaweera, T.D.; Wu, W.; Ji, Y.; Gamage, R.P. Understanding injection-induced seismicity in enhanced geothermal systems: From the coupled thermo-hydro-mechanical-chemical process to anthropogenic earthquake prediction. Earth Sci. Rev. 2020, 205, 103182. [Google Scholar] [CrossRef] [Scilit]
- Šílený, J.; Hill, D.P.; Eisner, L.; Cornet, F.H. Non–double-couple mechanisms of microearthquakes induced by hydraulic fracturing. J. Geophys. Res. Solid Earth 2009, 114, 2008JB005987. [Google Scholar] [CrossRef] [Scilit]
- Eaton, D.W.; Van, D.B.M.; Birkelo, B.; Tary, J.-B. Scaling relations and spectral characteristics of tensile microseisms: Evidence for opening/closing cracks during hydraulic fracturing. Geophys. J. Int. 2014, 196, 1844–1857. [Google Scholar] [CrossRef] [Scilit]
- Llenos, A.L.; Michael, A.J. Modeling Earthquake Rate Changes in Oklahoma and Arkansas: Possible Signatures of Induced Seismicity. Bull. Seismol. Soc. Am. 2013, 103, 2850–2861. [Google Scholar] [CrossRef] [Scilit]
- Atkinson, G.M.; Eaton, D.W.; Ghofrani, H.; Walker, D.; Cheadle, B.; Schultz, R.; Shcherbakov, R.; Tiampo, K.; Gu, J.; Harrington, R.M.; et al. Hydraulic Fracturing and Seismicity in the Western Canada Sedimentary Basin. Seismol. Res. Lett. 2016, 87, 631–647. [Google Scholar] [CrossRef] [Scilit]
- Zhang, J.; Kuang, W.H.; Zhang, X. Global review of induced earthquakes in oil and gas production fields. Rev. Geophys. Planet. Phys. 2021, 52, 239–265. [Google Scholar] [CrossRef]
- Bentz, S.; Kwiatek, G.; Martínez-Garzón, P.; Bohnhoff, M.; Dresen, G. Seismic Moment Evolution During Hydraulic Stimulations. Geophys. Res. Lett. 2020, 47, e2019GL086185. [Google Scholar] [CrossRef] [Scilit]
- Shapiro, S.A.; Dinske, C.; Langenbruch, C.; Wenzel, F. Seismogenic index and magnitude probability of earthquakes induced during reservoir fluid stimulations. Lead. Edge 2010, 29, 304–309. [Google Scholar] [CrossRef] [Scilit]
- Van der Elst, N.J.; Page, M.T.; Weiser, D.A.; Goebel, T.H.; Hosseini, S.M. Induced earthquake magnitudes are as large as (statistically) expected. J. Geophys. Res. Solid Earth 2016, 121, 4575–4590. [Google Scholar] [CrossRef] [Scilit]
- Alghannam, M.; Juanes, R. Understanding rate effects in injection-induced earthquakes. Nat. Commun. 2020, 11, 3053. [Google Scholar] [CrossRef] [Scilit]
- Baisch, S.; Voros, R.; Weidler, R.; Wyborn, D. Investigation of Fault Mechanisms during Geothermal Reservoir Stimulation Experiments in the Cooper Basin, Australia. Bull. Seismol. Soc. Am. 2009, 99, 148–158. [Google Scholar] [CrossRef] [Scilit]
- Eaton, D.W. Passive Seismic Monitoring of Induced Seismicity: Fundamental Principles and Application to Energy Technologies; Cambridge University Press: Cambridge, UK, 2018. [Google Scholar]
- Woessner, J. Assessing the Quality of Earthquake Catalogues: Estimating the Magnitude of Completeness and Its Uncertainty. Bull. Seismol. Soc. Am. 2005, 95, 684–698. [Google Scholar] [CrossRef] [Scilit]
- Shapiro, S.A.; Krüger, O.S.; Dinske, C.; Langenbruch, C. Magnitudes of induced earthquakes and geometric scales of fluid-stimulated rock volumes. Geophysics 2012, 76, WC55–WC63. [Google Scholar] [CrossRef] [Scilit]
- Maxwell, S.C.; Shemeta, J.E.; Campbell, E. Microseismic Deformation Rate Monitoring. In Proceedings of the SPE Annual Technical Conference and Exhibition, Denver, CO, USA, 21–24 September 2008. [Google Scholar]
- Dezayes, C.; Valley, B.; Maqua, E. Natural fracture system of the Soultz granite based on UBI data in the GPK3 and GPK4 wells. In Proceedings of the EHDRA Scientific Meeting, Soultz-sous-Forêts, France, 17–18 March 2005. [Google Scholar]
- McGarr, A. Seismic moments and volume changes. J. Geophys. Res. 1976, 81, 1487–1494. [Google Scholar] [CrossRef] [Scilit]
- Galis, M.; Ampuero, J.P.; Mai, P.M.; Cappa, F. Induced seismicity provides insight into why earthquake ruptures stop. Sci. Adv. 2017, 3, eaap7528. [Google Scholar] [CrossRef] [Scilit]
- An, M.; Huang, R.; Elsworth, D.; Zhang, F.; Dontsov, E. Thermoporoelastic stress perturbations from hydraulic fracturing and thermal depletion in enhanced geothermal systems (EGS) and implications for fault reactivation and seismicity. Rock Mech. Geotech. Eng. 2025, 17, 2893–2903. [Google Scholar] [CrossRef] [Scilit]
- Heringer, J.D.S.; Debossam, J.G.S.; Souza, G.; Souto, H.P. Numerical simulation of non-isothermal flow in oil reservoirs using a two-equation model. Coupled Syst. Mech. 2019, 8, 147–168. [Google Scholar] [CrossRef]
- Bommer, J.J.; Oates, S.; Cepeda, J.M.; Lindholm, C.; Bird, J.; Torres, R.; Marroquín, G.; Rivas, J. Control of hazard due to seismicity induced by a hot fractured rock geothermal project. Eng. Geol. 2006, 83, 287–306. [Google Scholar] [CrossRef] [Scilit]
- Mignan, A.; Broccardo, M.; Wiemer, S.; Giardini, D. Induced seismicity closed-form traffic light system for actuarial decision-making during deep fluid injections. Sci. Rep. 2017, 7, 13607. [Google Scholar] [CrossRef] [Scilit] [PubMed]
- Zang, A.; Yoon, J.S.; Stephansson, O.; Heidbach, O. Fatigue hydraulic fracturing by cyclic reservoir treatment enhances permeability and reduces induced seismicity. Geophys. J. Int. 2013, 195, 1282–1287. [Google Scholar] [CrossRef] [Scilit]
- Zang, A.; Zimmermann, G.; Hofmann, H.; Stephansson, O.; Min, K.-B.; Kim, K.Y. How to Reduce Fluid-Injection-Induced Seismicity. Rock Mech. Rock Eng. 2019, 52, 475–493. [Google Scholar] [CrossRef] [Scilit]
- Frash, L.P.; Fu, P.; Morris, J.; Gutierrez, M.; Neupane, G.; Hampton, J.; Welch, N.J.; Carey, J.W.; Kneafsey, T. Fracture Caging to Limit Induced Seismicity. Geophys. Res. Lett. 2021, 48, e2020GL090648. [Google Scholar] [CrossRef] [Scilit]
- Gutiérrez-Oribio, D.; Tzortzopoulos, G.; Stefanou, I.; Plestan, F. Earthquake Control: An Emerging Application for Robust Control. Theory and Experimental Tests. IEEE Trans. Control Syst. Technol. 2023, 31, 1747–1761. [Google Scholar] [CrossRef] [Scilit]
- Zimmermann, G.; Moeck, I.; Blöcher, G. Cyclic waterfrac stimulation to develop an Enhanced Geothermal System (EGS)—Conceptual design and experimental results. Geothermics 2010, 39, 59–69. [Google Scholar] [CrossRef] [Scilit]
Disclaimer/Publisher’s Note: The statements, opinions and data contained in all publications are solely those of the individual author(s) and contributor(s) and not of MDPI and/or the editor(s). MDPI and/or the editor(s) disclaim responsibility for any injury to people or property resulting from any ideas, methods, instructions or products referred to in the content. |
© 2026 by the authors. Licensee MDPI, Basel, Switzerland. This article is an open access article distributed under the terms and conditions of the Creative Commons Attribution (CC BY) license.