


Abstract
Room acoustics computer models based on geometrical acoustics usually handle the sound reflections by the assumption of plane waves. However, if the sound source is a point source, which is usually the case, the spherical wave reflection would be more correct. An approximate model for the spherical wave reflection is presented, starting with the assumption of an infinite plane. It was found that the errors caused due to the simplified plane wave assumption can be significant, especially for hard surfaces and near grazing incidence. As something new, the gradual transition from a spherical wave to a plane wave approximation was addressed. For sound propagation exceeding 50 times the wavelength, the plane wave approximation was found to be fully justified, but for shorter distances the spherical wave reflection model should be applied. In contrast to previous work on spherical wave reflection, the reflection from a finite-sized surface was studied. For the first time, the spherical wave reflection model was combined with the complex radiation impedance of a finite-sized surface. One interesting application example of the spherical reflection model is the attenuation of sound propagation above the audience area in a performance space. Finally, the extension of the spherical wave reflection model to higher order reflections was addressed.
1. Introduction
A sound wave emitted from a point source and reflected from a plane surface is a fundamental physical phenomenon, but surprisingly not covered in textbooks on room acoustics. Compared to the case of a plane wave reflection, the spherical wave reflection is mathematically much more complicated. Based on earlier studies of similar problems in electromagnetic waves, Ingard presented a solution in 1951 adapted to sound waves but limited to surfaces with local reaction and a real surface impedance [1]. Twenty-five years later, Thomasson presented a different solution valid for a complex impedance boundary [2]. In the work of Chessel [3], the spherical reflection was combined with an impedance model for a porous material, and the method was applied for outdoor sound propagation over an infinite ground surface modelled as a porous absorber. The different mathematical solutions have led to a discussion about the existence of a “surface wave” as part of the solution to the spherical wave reflection. This part was missing in the solution by Ingard, and this is explained as a consequence of the approximation that neglects a term, which Ingard argued to be insignificant.
Several other researchers have studied the problem, and a detailed analysis of these research papers is found in a chapter of the book by Mechel [4] (pp. 513–666). The focus of these papers is mainly on the mathematical method and choice of path of integration for solving integral equations. Practical applications for acoustical calculations are not found. It is also noted that the difference between the plane wave approximation and the spherical wave solution is not well described. A discussion of an acceptable transition from the spherical wave model to a plane wave approximation is also missing in the literature. These questions will be addressed in the present work.
The importance of taking the spherical wave nature into account in room acoustic simulations has been pointed out by Lam [5]. He found that the spherical wave reflection model in a geometrical acoustics model could produce predictions in both frequency and time domains that are very close to those of the boundary element method.
One case in which the spherical wave reflection might be of importance is the attenuation of sound propagating over the audience in an auditorium. This problem was studied as early as 1933 by von Bekesy [6], and later by many others [7,8,9,10]. Mommertz presented measurements of the attenuation and pointed at a possible solution to derive a calculation model using an image source model with spherical wave reflection and a real surface impedance [11] (p. 53, 124). Although the surface of a seated audience is very far from a smooth surface, Mommertz proposed to model the audience area as a simple box with sound absorption as a real audience [11] (p. 125). The attenuation of sound propagating near the audience area is explained as a result of the destructive interference between the direct sound and the reflected sound wave when the angle of incidence is near grazing incidence. The present paper is an attempt to follow these ideas.
A special phenomenon related to sound propagation over a seated audience is the “seat dip effect”, which is a dip in the sound attenuation, typically observed between 80 Hz and 300 Hz. Economou and Charalampous have analyzed the phenomenon and demonstrated that with a detailed geometrical model of the seat rows, the application of spherical reflection and a diffraction model can lead to a good reproduction of the effect in calculations [12]. Examples of the application are briefly described for outdoor sound propagation [13] and for calculation of modal reverberation times and transfer functions in small rooms with extended reaction impedance surfaces [14].
It is clear from the existing literature that there can be advantages in the combination of a geometrical acoustics model and the spherical wave reflection model. One thing missing is an analysis of the transition from the complicated spherical wave model to the simple plane wave model. In other words, what are the criteria for the plane wave model to be sufficiently accurate? Another obvious limitation in the existing models is the assumption of the reflecting surfaces to be infinite. For a general application, especially in room acoustics, it is important that the finite size of surfaces is taken into account. But how can that be possible? The current paper will try to address these two questions.
In the following, the spherical reflection model is first analyzed in terms of the limits of validity and the transition to the plane wave approximation. The mathematical basis is the solution by Ingard [1] and a numerical approximation to the Fresnel integrals as presented in Appendix A. Next, the solution is extended to take the finite area of a reflecting surface into account. For this purpose, the complex radiation impedance for a rectangular surface is applied [15]. The spherical reflection model for first order reflections is analyzed through examples of sound propagation over an audience area. Finally, the possible extension of the spherical reflection model to higher order reflections is discussed.
2. Theory for an Infinite Plane
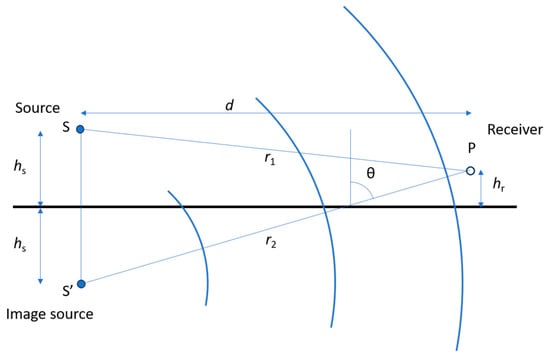
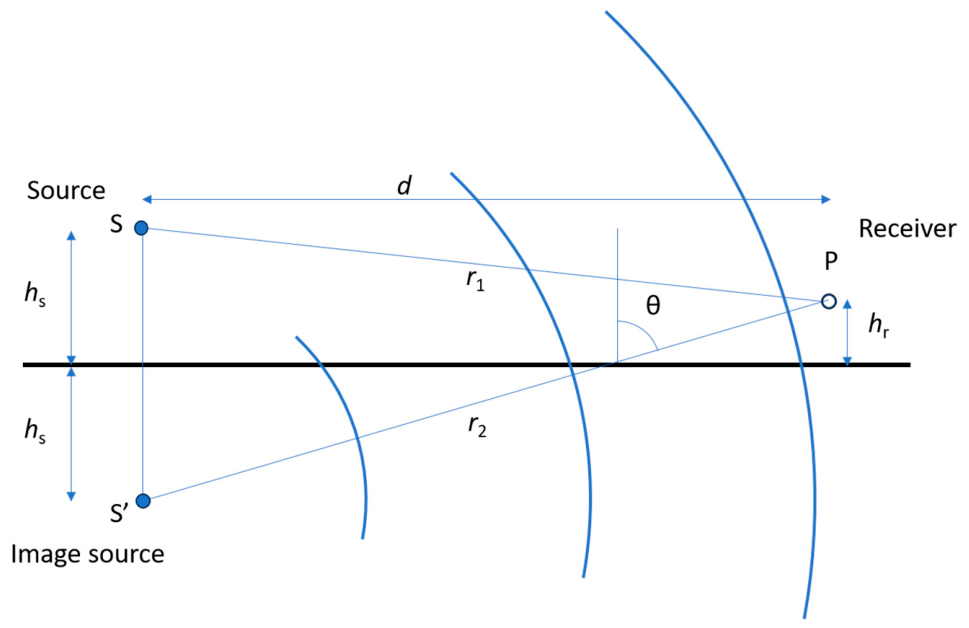
Figure 1 shows the geometry of the sound emitted from a point source and reflected by a plane surface. The image source model is applied, and the distance from the image source to the receiver point is called r2, while the distance from the real source to the receiver point is r1. The height of the source and receiver above the plane is hs and hr, respectively, and the horizontal distance is d. The angle of incidence and reflection is θ.
Figure 1.
Image source model for sound reflection with indication of applied symbols.
2.1. The Plane Wave Reflection Factor
The angle-dependent pressure reflection factor is the complex ratio of the sound pressure of the reflected sound wave to the sound pressure of the incident sound, both taken at the reflecting surface. If the specific surface impedance is Za and the specific radiation impedance is Zr, the plane wave reflection factor R is [16] (p. 22):
where Zr*(θ) is the complex conjugate of the specific radiation impedance. For a local-reacting material, the specific surface impedance Za is independent of the angle of incidence. Here and in the following, the impedances are understood to be specific impedances; i.e., normalized with ρc, where ρ is the density of air and c is the speed of sound in air.
In the case of an infinite surface, the radiation impedance becomes:
The imaginary part disappears and the plane wave reflection factor can be written:
where β = 1/Za is the surface admittance. This is assumed to be real and independent of the angle of incidence as in [1].
2.2. The Spherical Wave Reflection Factor
In the following, the imaginary unit is i and the time factor exp(-iωt) is understood. In Figure 1, the sound source S is a point source with the strength 1. The spherical wave emitted from S will reach the receiver point P, where the normalized sound pressure p1 is:
where k = ω/c is the wave number, ω is the angular frequency and c is the speed of sound. Application of the image source method means that the sound reflected from the surface can be calculated as the sound that propagates from the image source S’ and reaches the receiver point in the distance r2. The reflection from the surface is then equivalent to a change of the strength of the emitted sound from the image source. The normalized sound pressure of the reflected sound is p2:
where Q is the spherical wave reflection factor of the surface. Ingard [1] derived an approximate solution for Q, which can be expressed as a function of the plane wave reflection factor R and a complex function F. Thus, the spherical reflection factor is:
The function F is the solution to an integral equation [1] (Equation (10)):
where γ = cos(θ). It is noted that there is a symmetry in how the two parameters β and γ appear in the equation. While the surface admittance β can take values between 0 and infinity, γ is restricted to be between 0 and 1. In the following, it is assumed that the surface impedance is Za ≥ 1, and thus the surface admittance β should also be restricted to be between 0 and 1. The possibility of β < 1 (or Za > 1) occurs when the sound travels from a medium with high ρc to a medium with lower ρc. An example of this is a sound wave that propagates in water and reflects from the surface where water meets air.
In Equation (7) the it term in the first parenthesis within the brackets is of negligible importance, and thus an approximate solution was proposed by Ingard [1] (Equation (17)):
where C(x) and S(x) are the Fresnel integrals. These integrals are well described in Appendix A. The variable x is:
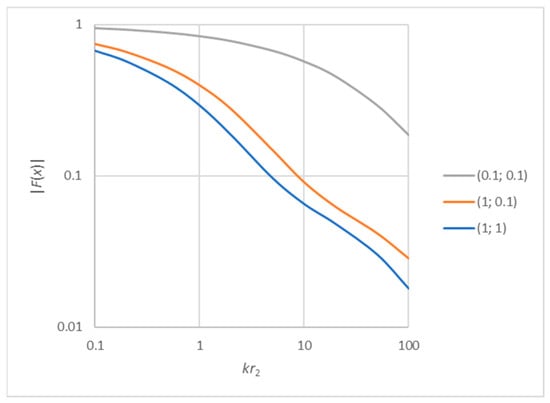
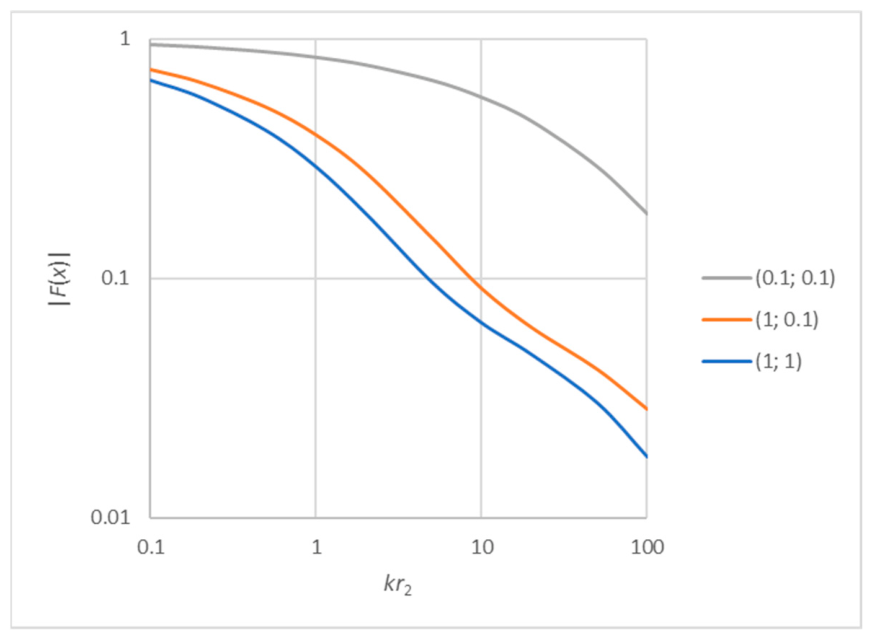
The function F(x) is complex, and the numerical value is depicted in Figure 2 for some examples of the parameters γ and β. The calculations here and in the following were made in Excel using the possibility of complex variables.
Figure 2.
The numerical value of the function F(x) as function of kr2. The curves represent the combinations of γ = cos(θ) and β being either 1 or 0.1. The symmetry of γ and β is applied.
In general, the function decreases monotonically with the normalised distance kr2. When |F(x)| is small (less than 0.01), the plane wave reflection will be a good approximation of the spherical wave reflection. If the surface impedance is high (acoustically hard surface), β is low (0.1), and the F function varies between the red and grey curves in Figure 2, depending on the angle of incidence. The influence of the spherical wave reflection is most pronounced when F takes high values, which is for low frequencies, short distances, high surface impedances, and angles of incidence near grazing incidence. For low surface impedance (acoustically soft surface), β is high (1), the spherical wave reflection is dependent on the angle of incidence, and the F function varies between the blue and red curves in Figure 2.
It is noted from the above formulas that, in addition to the source strength, the sound pressure of the reflected wave depends on the following four parameters: k, r2, θ, and Za. It is interesting (and somewhat surprising) that the distance from the image source to the reflecting plane is not a parameter. This has the consequence that it does not matter if the source is closer to the surface or farther away from the surface. This also means that it is possible to switch the source point and the receiver point, and the result remains the same (this has been proved true by test examples, not reported here). In other words; the reciprocity principle is maintained also for the spherical wave reflection.
2.3. Example of Sound Distribution Above an Infinite Plane
In the simple case of an infinite surface with a real surface impedance, the total sound pressure p at the receiver point is calculated as the sum of the direct and the reflected sound waves, (4) and (5):
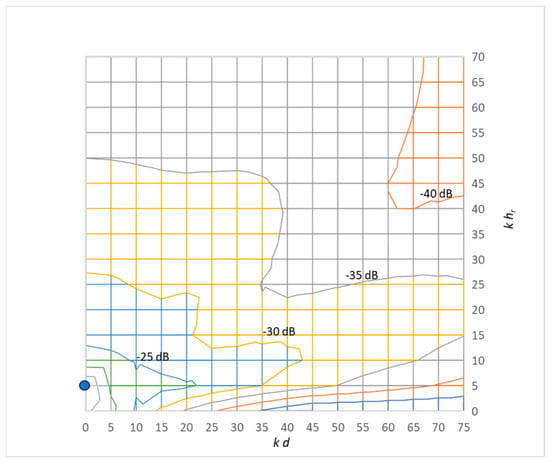
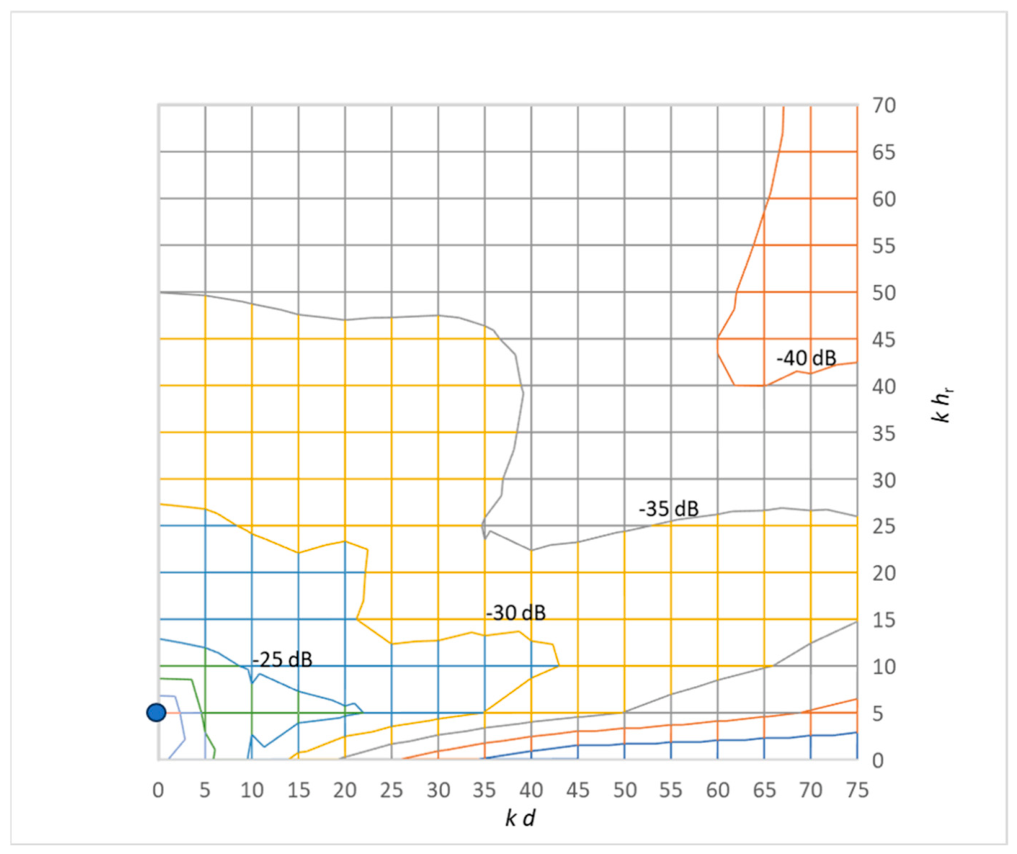
The results for a case with the sound source elevated to khs = 5 above the surface are shown in Figure 3. The surface impedance is Za = 1 (β = 1), corresponding to an acoustically soft surface. This example aims to reproduce the results of Ingard presented in [1] (Figure 8). The results in Figure 3 are found to be in close agreement with those of Ingard.
Figure 3.
Contour of sound pressure level calculated with Equation (10) in a plane above a reflecting surface with a real surface impedance Za = 1. The source is located at the point kd = 0 and khr = 5 (the blue dot).
If the reflected sound arrives with a very short delay after the direct sound, the two sound waves are merged into a single wave. Then, the result in (10) can be interpreted as a correction to the sound pressure level of the direct sound. Expressed in dB, the correction yields:
3. Transition from Spherical to Plane Wave Reflection
At a sufficiently long distance from the image source, the spherical wave front approaches that of a plane wave. In the following. we look for an answer to the question, ‘What is the minimum distance for application of the plane wave approximation?’.
As above, the assumptions are that the surface is infinite and the surface impedance is real and independent of the angle of incidence. The difference between sound pressure level calculated with spherical wave reflection and the sound pressure level calculated with plane wave reflection is in accordance with (3) and (6):
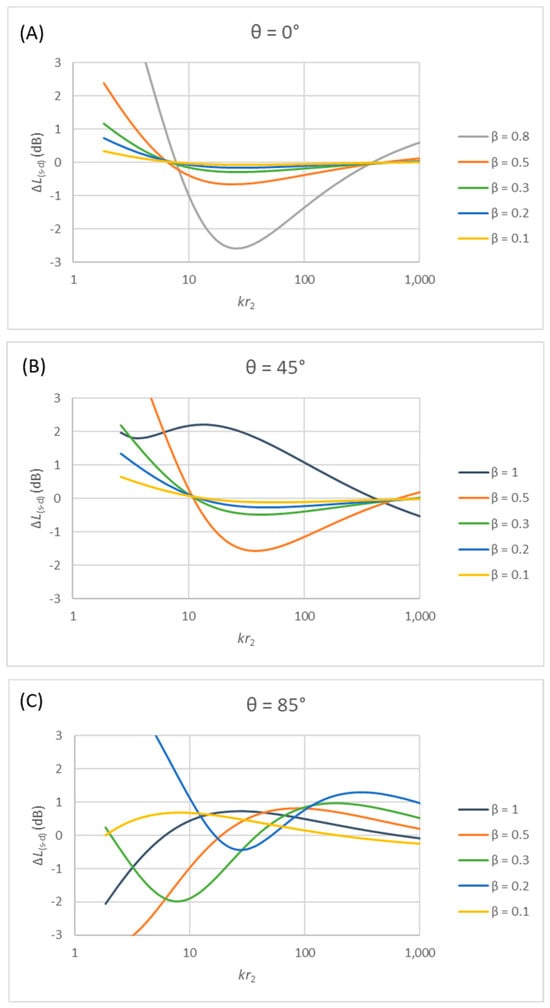
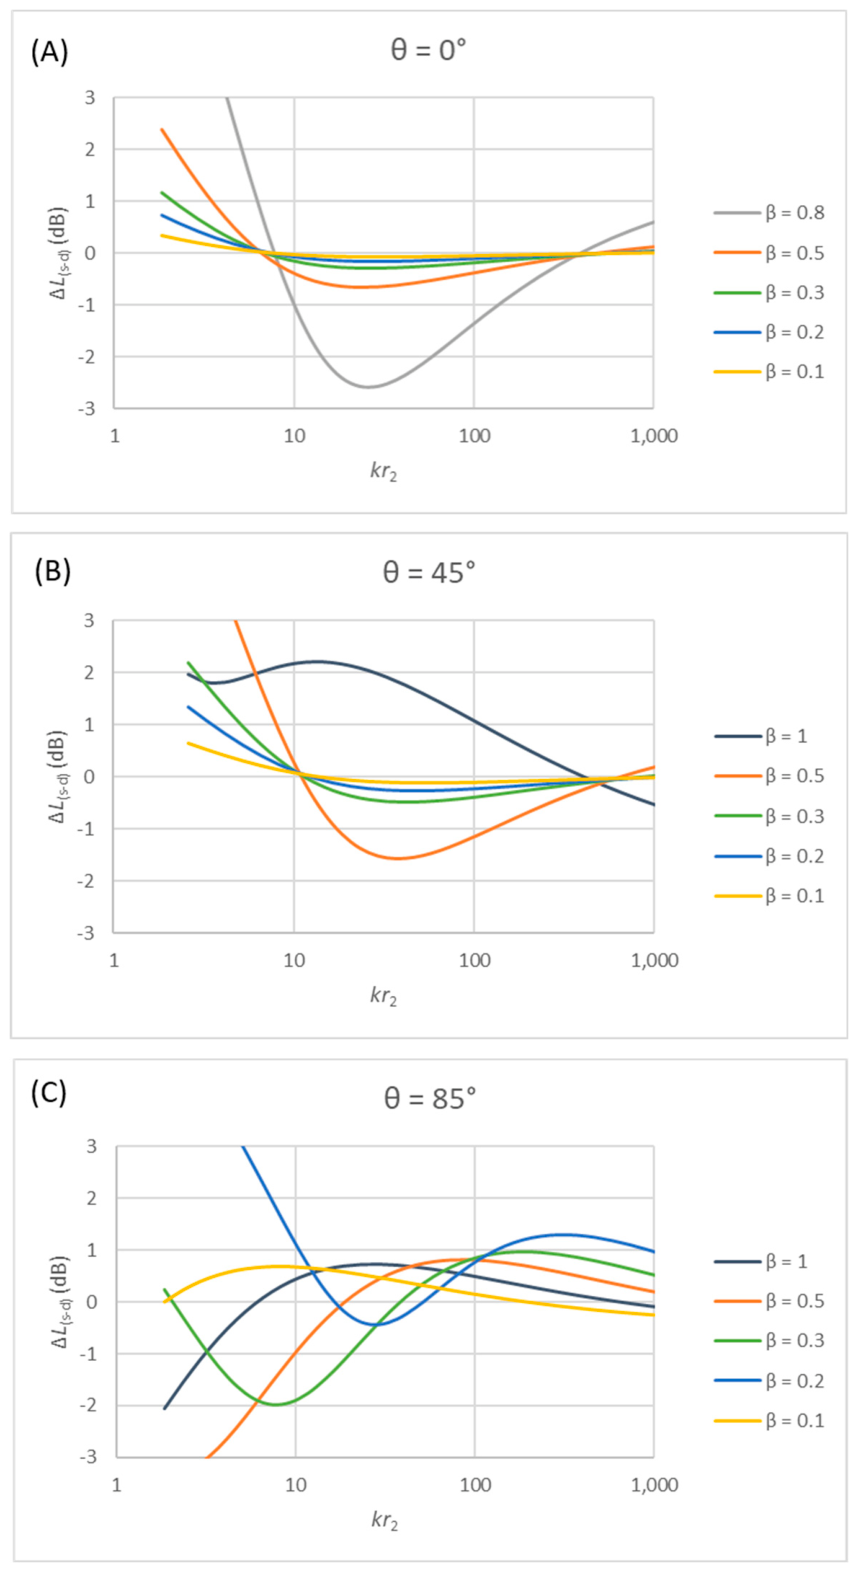
This difference is calculated as a function of the normalized distance kr2 for some typical cases and the results are displayed in Figure 4. The surface admittance varies from hard (β = 0.2) to soft (β = 1) surfaces, and three different angles of incidence are applied (0°, 45°, and 85°). It is noted that no sound reflection occurs at normal incidence when β = 1.
Figure 4.
Difference between the spherical and the plane wave reflection in dB as a function of the normalized distance from the image source and with different values of the surface admittance: (A) for normal incidence, (B) for the angle of incidence 45°, (C) for the angle of incidence 85°.
The results in Figure 4 indicate that the error caused by using the plane wave reflection instead of the spherical wave reflection can be within a range of several dBs, less for normal incidence and more pronounced near grazing incidence. The sign of the error can be either positive or negative. A positive error means that the spherical reflection is stronger than the plane wave reflection. At the angles of incidence 0° and 45°, the error diminishes with increasing distance kr2, and a minimum is reached at about kr2 ≈ 300 ≈ 100 π. This corresponds to the distance r2 ≈ 50 λ, where λ is the wavelength of the sound. At this point, the error is just a fraction of a dB. When the angle approaches grazing incidence (85°) and the surface admittance is low (β = 0.2), the minimum error is reached at somewhat longer distance.
The difference between spherical and plane wave reflection is complicated, and it is interesting to look more closely at the results in Figure 4 in the case of a surface with medium admittance (β = 0.5). At normal incidence, the difference only exceeds 1 dB at very low frequencies (kr2 < 4). At 45° degrees incidence, the differences are larger, negative in the kr2 range between 20 and 100, but positive and rapidly increasing at low frequencies. For the angle of incidence near grazing incidence, the deviations have changed sign, so the low-frequency deviation is negative instead of being positive. This is a consequence of the discontinuity that appears when cos θ = β, and the expression in (12) goes to infinity. This happens at 60° when β = 0.5. It must be concluded that there is no simple answer to the question, ‘What is the difference in the result when the spherical wave reflection is applied instead of the plane wave approximation?’.
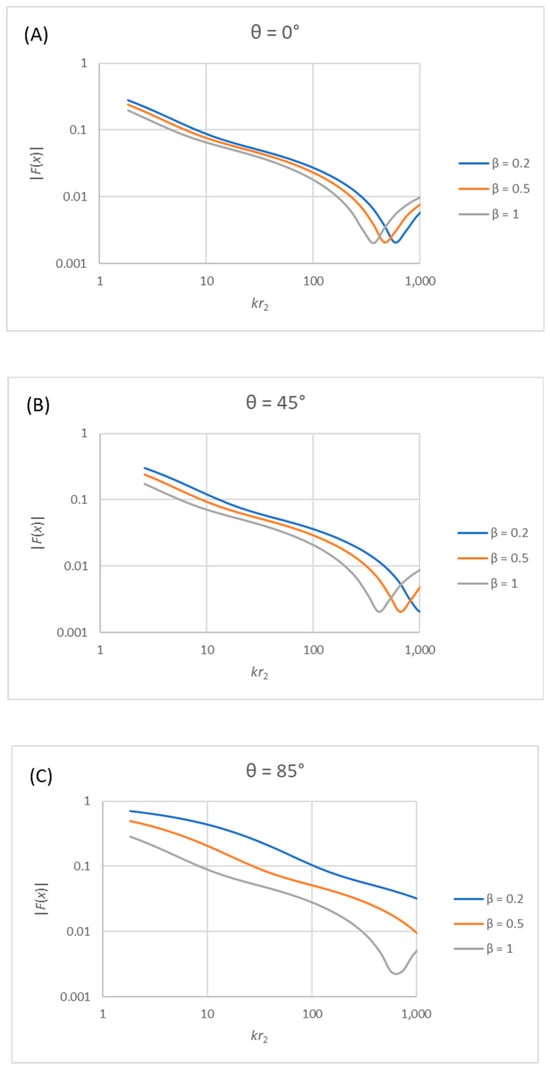
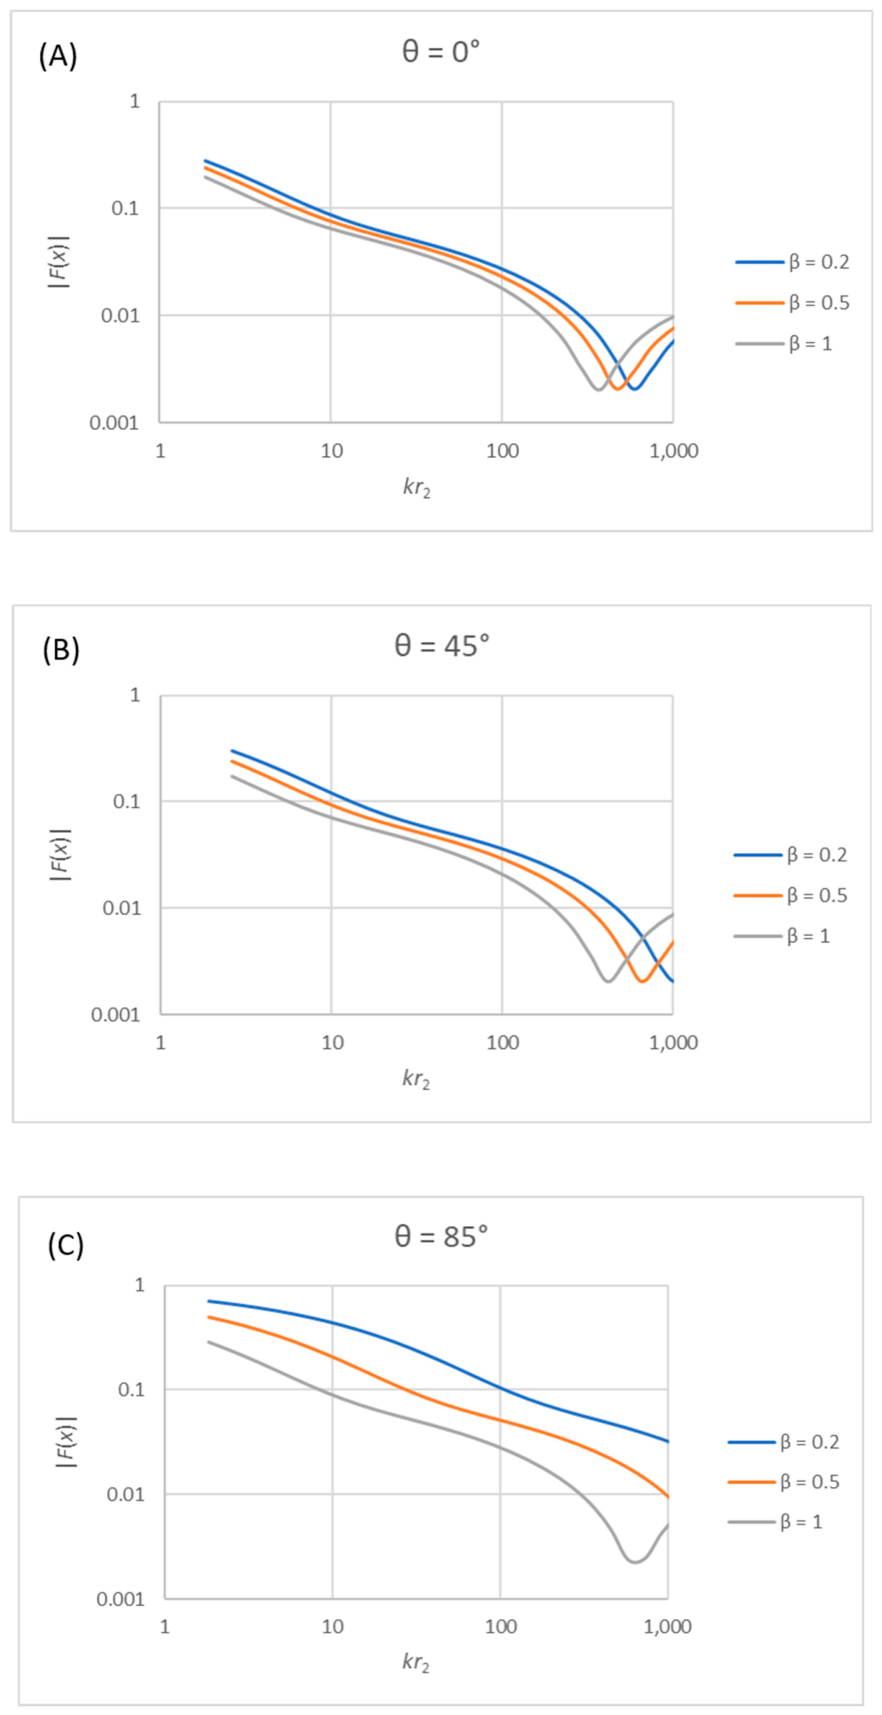
It is noted that the error seems to increase again when kr2 increases above ca 300, which is unexpected. The reason for this must be the fact that the solution for the function F(x) is not exact, but an approximation that is good within certain limits. With very high values of kr2, the approximation may be insufficient. In order to throw some light on this, the function |F(x)| is displayed in Figure 5 for the same angles of incidence as in Figure 4. While the function should be expected to decrease monotonically with increasing kr2, this is clearly not the case for very large values; the curves display a minimum followed by an increase with distance. This cannot be correct from a physical point of view, and the conclusion is that the current approximation (8) should not be applied for kr2 > 300. It is noted that the interruption of the monotonical decrease of the function appears for |F(x)| < 0.01.
Figure 5.
The numerical value of |F(x)| as a function of the normalized distance from the image source and with different values of the surface admittance: (A) for normal incidence, (B) for the angle of incidence 45°, (C) for the angle of incidence 85°.
4. Radiation Impedance and Surface Impedance for a Finite Size Surface
4.1. The Complex Radiation Impedance
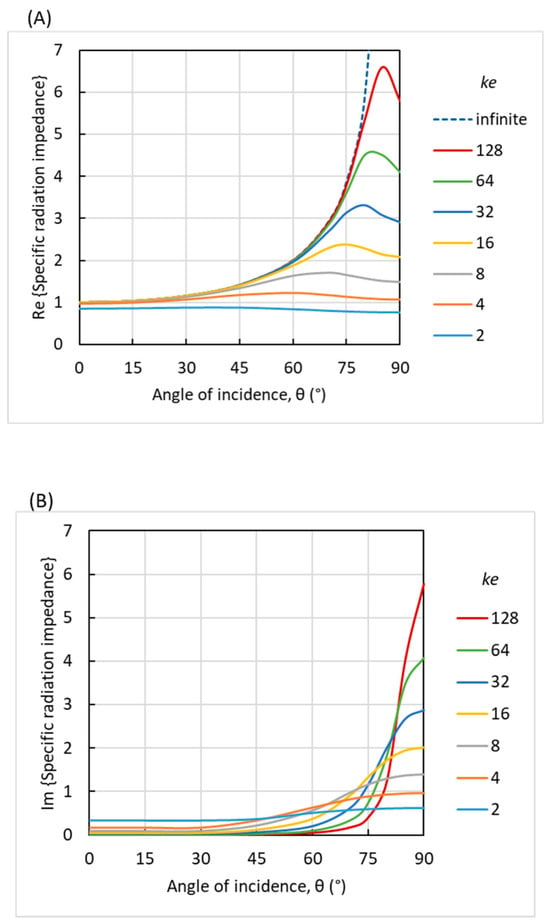
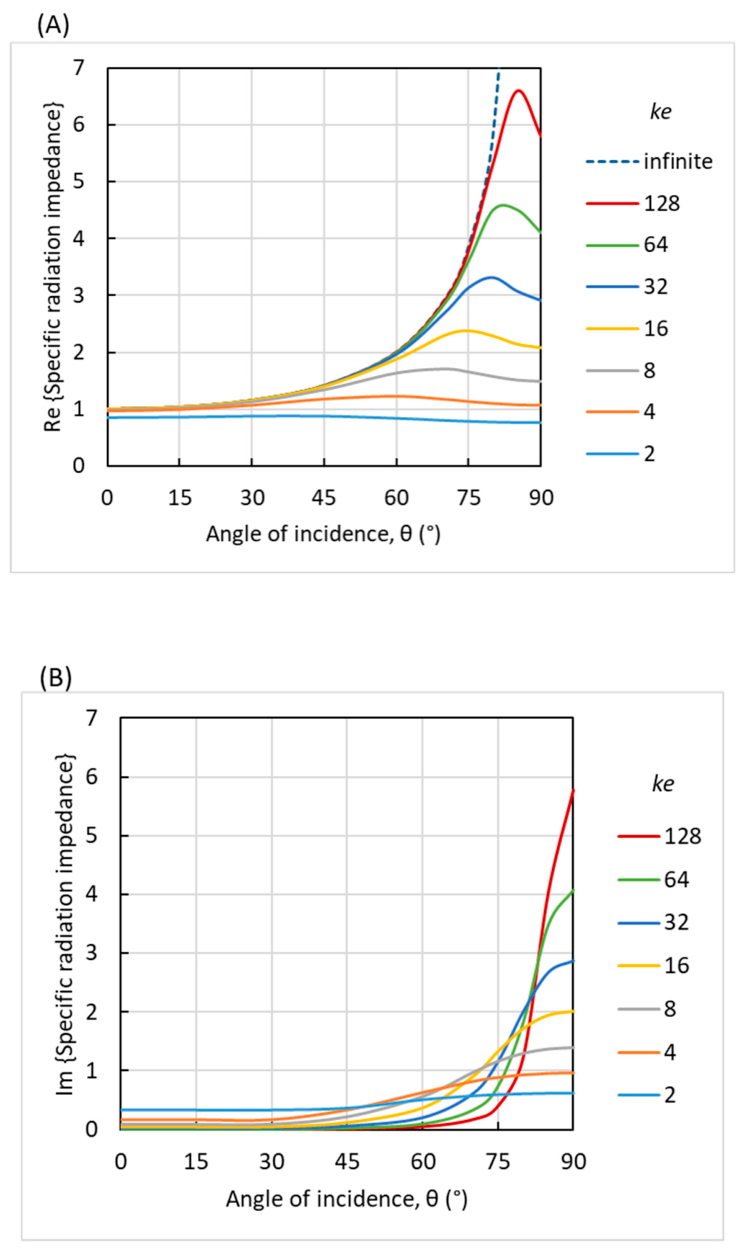
For the infinite surface, the radiation impedance is real and equal to 1/cos θ, as in Equation (2). When the reflecting surface has a finite area, the radiation impedance is complex and the dependence of the angle of incidence is not simple, as shown in Figure 6. The curves in the figure are calculated from the formulas presented in [15] for a square surface with the edge length e = √S, where S is the area of the surface. In principle, it is possible to include the aspect ratio of a rectangle, but here we shall stick to a square surface for simplicity.
Figure 6.
Radiation efficiency as a function of the angle of incidence for different values of ke: (A) real part, (B) imaginary part. Calculated from the formulas in [15].
While the imaginary part of the radiation impedance is negligible, for most angles of incidence it increases rapidly when the angle approaches grazing incidence, as shown in Figure 6B. It is noted that for θ = 90°, we have Re(Zr) ≈ Im(Zr), which implies that the phase angle of the radiation impedance at grazing incidence is 45°.
4.2. Babinet’s Principle
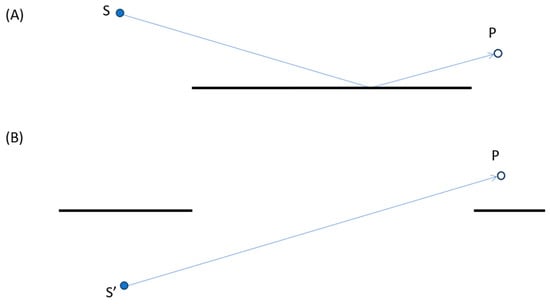
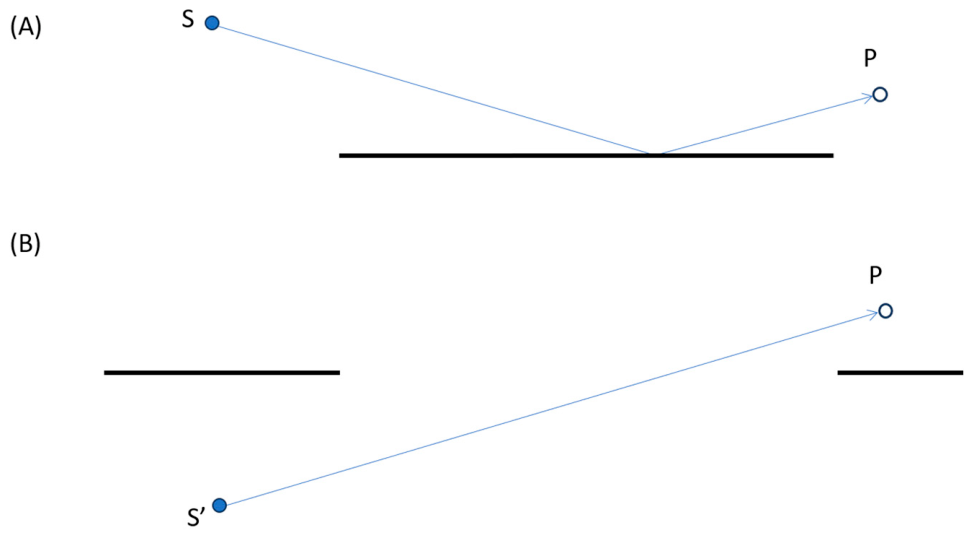
The reflection from a surface of finite size can be described with the image source method using Babinet’s principle. The reflection of a sound wave from the source S is equivalent to the transmission from the image source S’ through an aperture surrounded by an infinite, rigid baffle. The aperture must have the same dimensions as the original reflecting surface (see Figure 7A,B).
Figure 7.
Sound reflection from a finite size surface: (A) reflection path from source S to receiver P, (B) transmission through an aperture from image source S’ to receiver P (Babinet’s principle).
4.3. Equivalent Real Surface Impedance
The complex pressure reflection factor can be calculated from Equation (1) using the complex radiation impedance as in Figure 6. Ideally, the surface impedance should also be complex, but the solution for the spherical wave reflection presented here is based on the assumption of a real surface impedance. Therefore, the method given in [17] may be suitable in order to convert the statistical absorption coefficients αs of a material into an equivalent real surface impedance Za. Assuming Za ≥ 1, then ref. [17] (Equation (3)) yields:
where Zf,d is the equivalent field impedance applied to the statistical absorption coefficient measured in accordance with ISO 354 [18]. The equivalent field impedance is given in Table 1 for one-third octave bands from 50 Hz to 10,000 Hz together with αs and Za for a material, which is typical for an audience on upholstered seats. These data are the same as applied in [17] but interpolated and extrapolated to one-third octave bands.
Table 1.
The equivalent field impedance, the statistical absorption coefficient, and the equivalent surface impedance as derived with Equation (13).
For a surface with this material, the sound pressure level relative to the direct sound is calculated with Equation (11) using the spherical reflection factor calculated with Equation (6). The surface representing a seated audience is represented by a large, flat box with a height of 0.80 m. If the source is 1.50 m above the floor and the receiver is 1.20 m above the floor, the calculations can be made with the heights hs = 0.70 m and hr = 0.40 m above the reflecting surface, as shown in Figure 1.
4.3.1. Variation of the Size of the Reflecting Surface
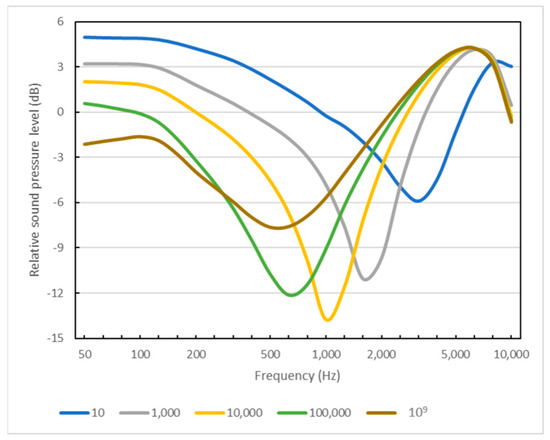
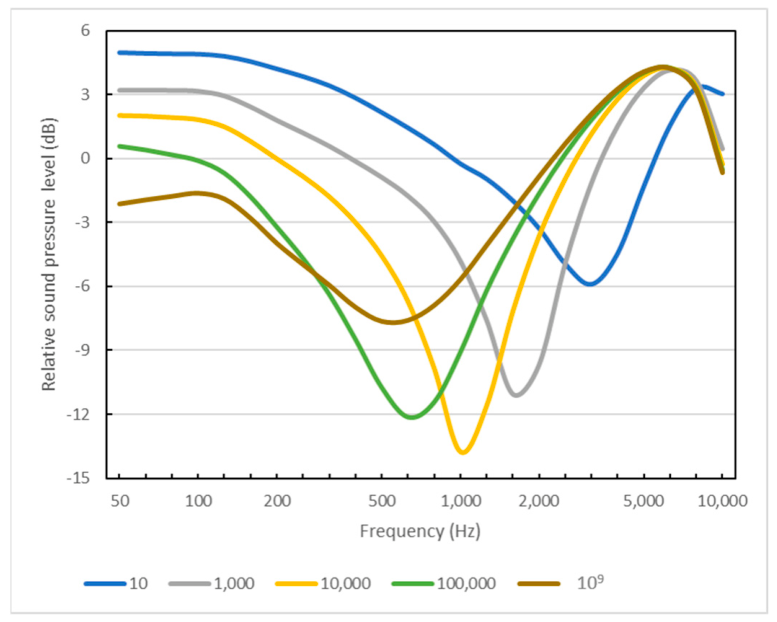
The results with the horizontal distance d = 20 m for different sizes of the surface are displayed in Figure 8. The frequency curves are dominated by an attenuation of 5 dB to 15 dB due to the cancellation effect when the two sound waves are out of phase. This dip depends on the area of the surface and is located in the frequency range 500 Hz to 3000 Hz. The attenuation is less pronounced if the area approaches infinity.
Figure 8.
The sound pressure level relative to the direct sound, ΔL, calculated with reflection surfaces of different size (10 m2 to 109 m2). Horizontal distance is 20 m, height of source is 0.7 m, and height of receiver is 0.4 m.
4.3.2. Variation of the Source Height Above the Reflecting Surface
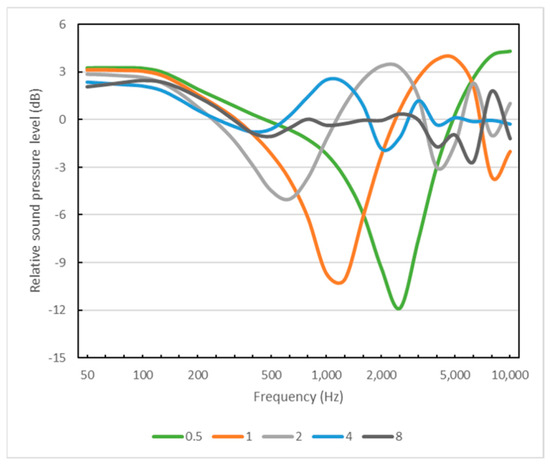
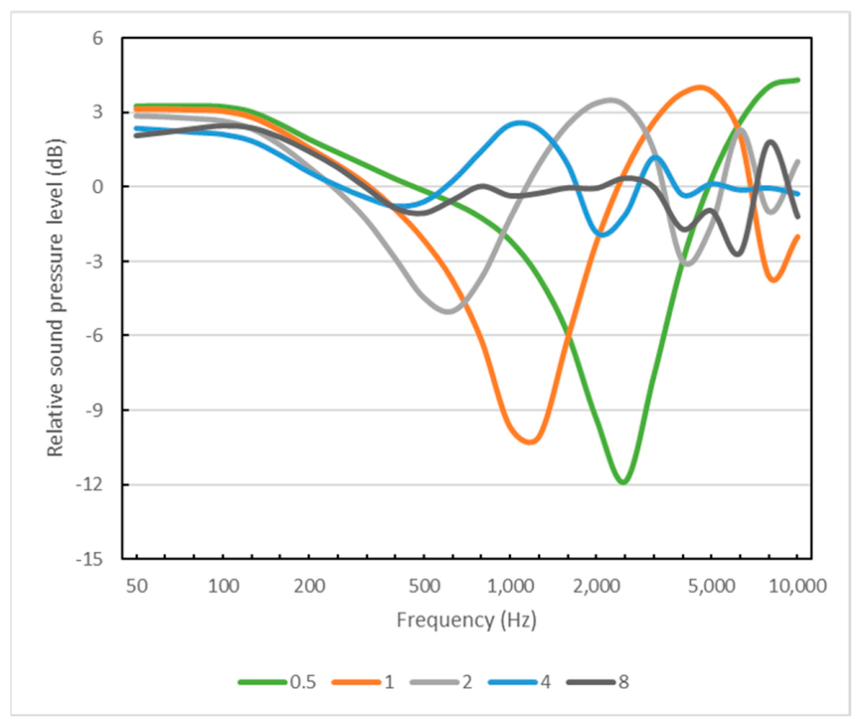
The influence of the source height above the surface is displayed in Figure 9. Here, the area is fixed at 1000 m2, the horizontal distance is 20 m, and the receiver height is kept at 0.40 m. When the height is changed from 0.5 m to 8 m, the dip in the curve moves down in frequency, from 2500 Hz at 0.5 m to 500 Hz at 2 m, and the dip disappears for source positions of 4 m and higher. The angle of incidence is θ = 83° when hs = 2 m, and θ = 78° when hs = 4 m. The attenuation of sound propagating over an audience area is found to be negligible when the angle of incidence is less than 78° or the grazing angle relative to the surface is above 12°. This is not a sharp limit, and it is in good agreement with the 10° suggested by Mommertz [11] (p. 81).
Figure 9.
The sound pressure level relative to the direct sound, ΔL, calculated using different heights of the source over the reflecting surface (0 m to 8 m). Area of reflecting surface 1000 m2, horizontal distance is 20 m, and height of receiver is 0.4 m.
4.3.3. Variation of the Horizontal Distance from Source to Receiver
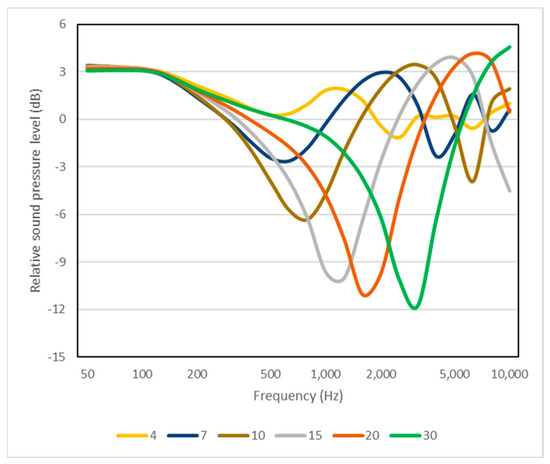
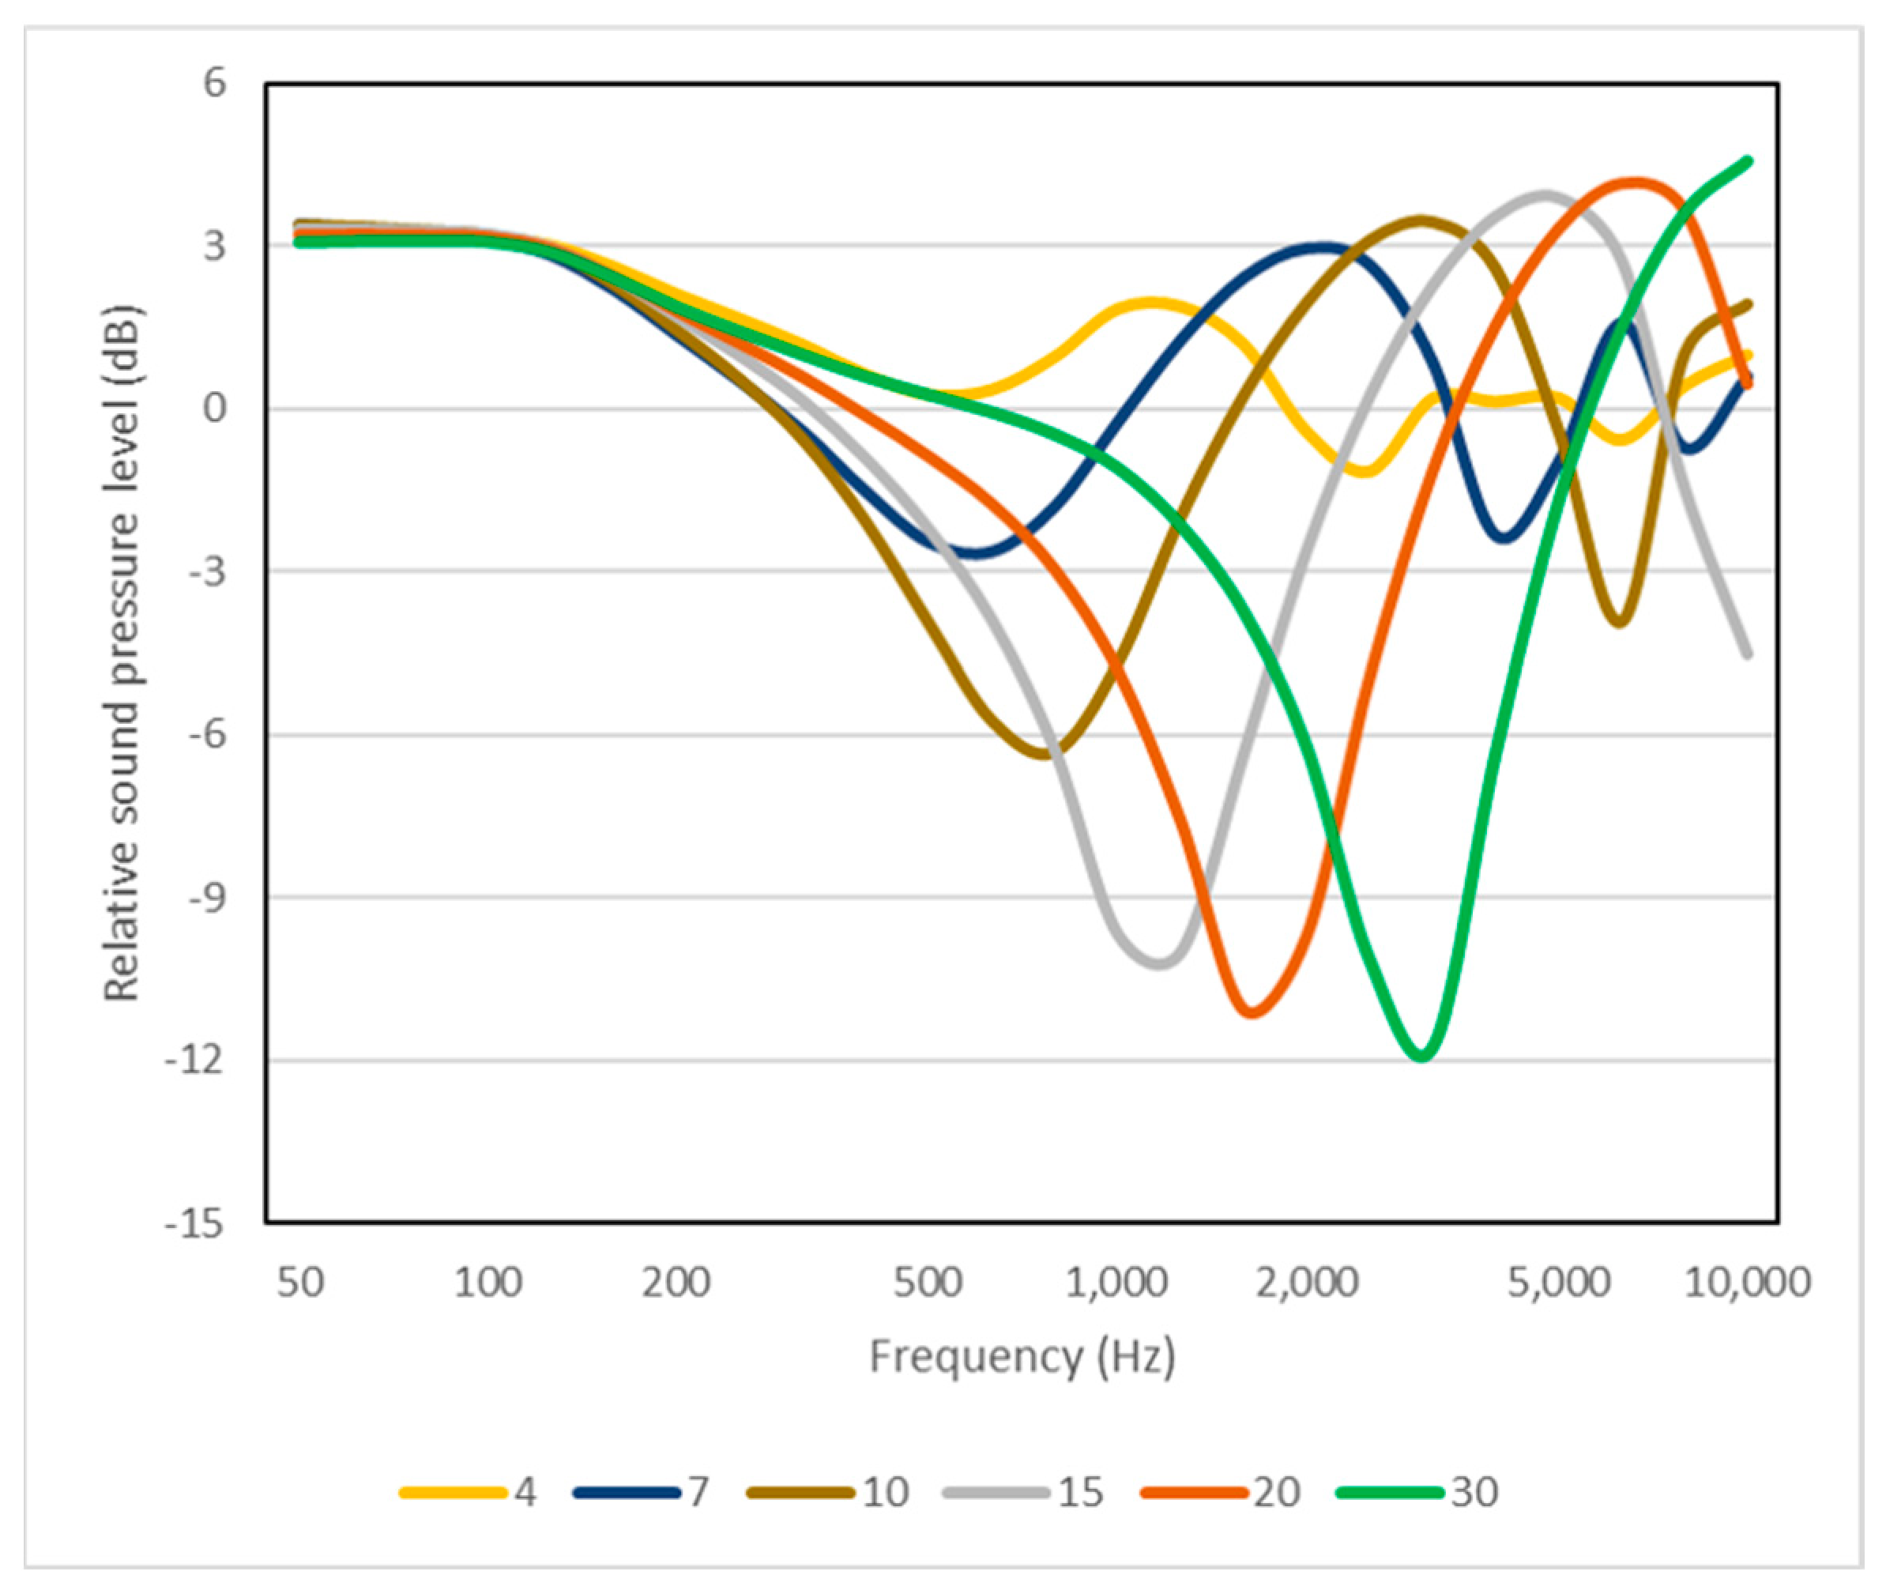
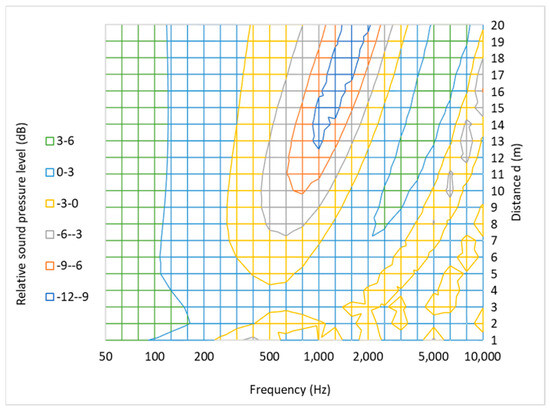
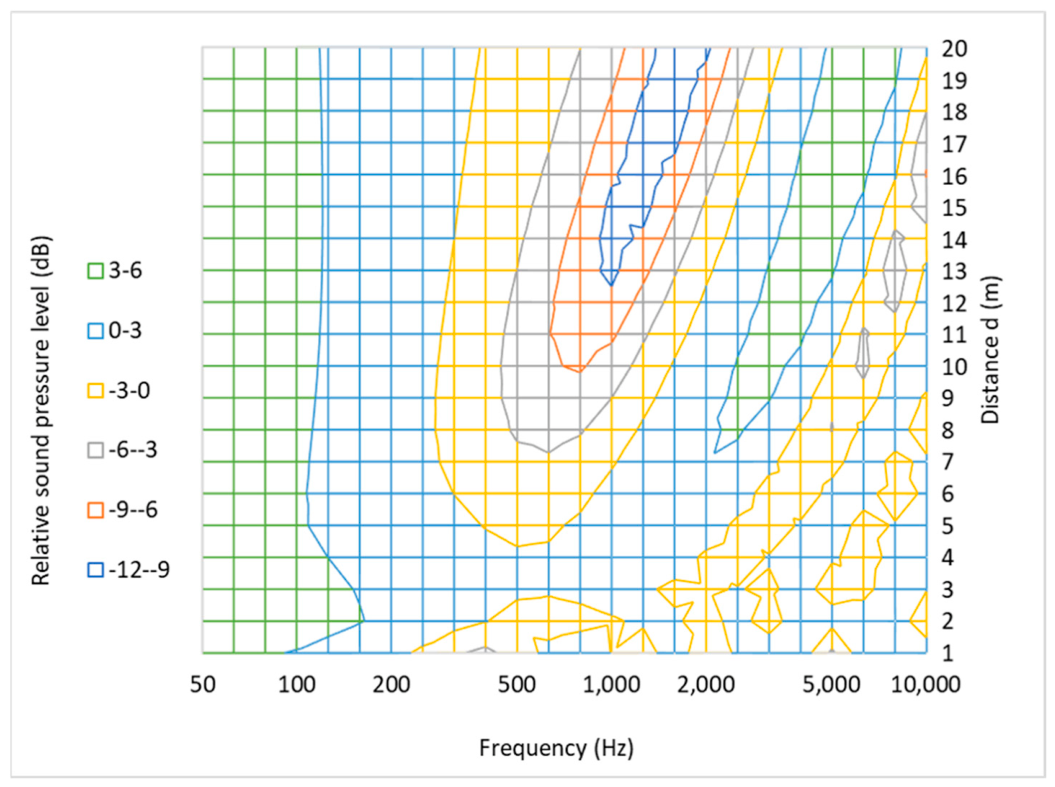
The influence of the horizontal distance d is illustrated in Figure 10 and the contour plot in Figure 11. The heights of source and receiver are 0.70 m and 0.40 m, respectively, and the area is 1000 m2. The attenuation is most pronounced at the furthest distance 30 m, where there is a dip of 12 dB at 3150 Hz. At shorter distances, the dip is weaker and located at lower frequencies. For example, at 7 m the attenuation is −3 dB at 500 Hz.
Figure 10.
The sound pressure level relative to the direct sound, ΔL, calculated at different distances from the source (up to 30 m). Area of reflecting surface is 1000 m2, height of source is 0.7 m, and height of receiver is 0.4 m.
Figure 11.
Contour plot of the relative sound pressure level relative to the direct sound as function of frequency and distance from the source. Area of reflecting surface is 1000 m2, height of source is 0.7 m, and height of receiver is 0.4 m.
It should be noted that the attenuation of the sound is primarily a result of destructive interference between the direct sound wave and the reflected sound wave. So, the attenuation does not mean that the sound energy is absorbed. In other frequency regions, the interference is constructive, resulting in increased sound pressure levels that can be more than 3 dB above the level of the direct sound.
5. Decay with Distance of Sound Propagating over an Audience Area
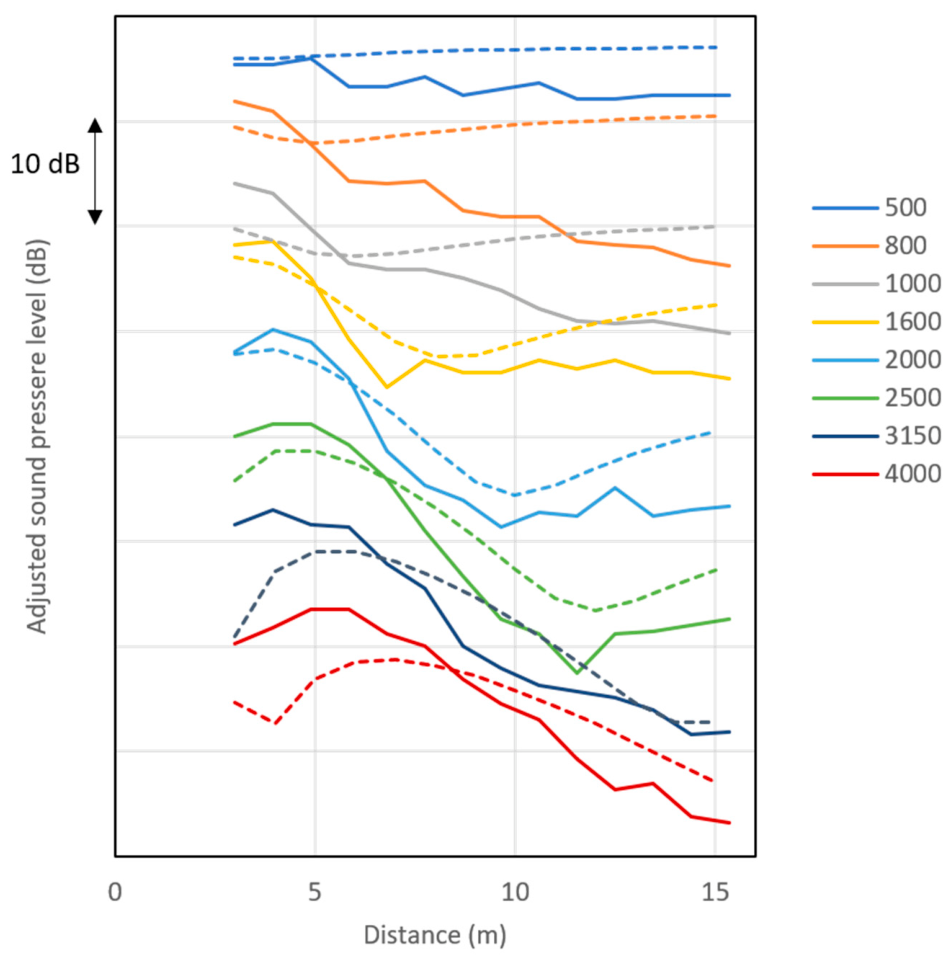
The attenuation of the sound when propagating over an audience area has been measured and reported by several authors. The results measured by Meyer et al. [9] have been chosen for a comparison with the present calculation model. The measurements by Meyer et al. were made in an outdoor setting, and they seem to be of good quality. The sound absorption coefficient of a seated audience was measured by the same research group in a reverberation chamber and reported in [19].
For the outdoor measurements, the audience was seated on wooden chairs with a density of about 1.5 people per m2 and distance of 0.90 m between the seat rows. The area of the surface was 43.2 m2. The source and the receivers were at a height of 1.15 m above the floor. The calculations were made with the height hs = hr = 0.4 m above the reflecting surface. Measurements were made in one-third octave bands from 500 Hz to 4000 Hz, except the 630 Hz and 1250 Hz bands, which were not included for unknown reasons.
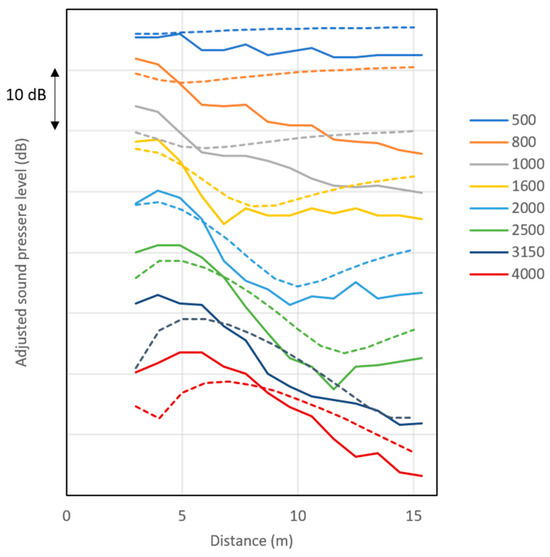
Figure 12 displays the measured and calculated results with the distance from source to receiver varying from 3 m to 15 m. The agreement is not very good at 500 Hz, 800 Hz, and 1000 Hz. At 1600 Hz, 2000 Hz, and 2500 Hz the calculated attenuations between 5 m and 10 m are close to the measured results. At the higher frequencies, the slopes between 5 m and 15 m have some similarities with the measured results, but in the range from 3 m to 5 m the results are quite different.
Figure 12.
Adjusted sound pressure level relative to the direct sound as function of the distance from the sound source, calculated (dotted lines) for audience on wooden chairs with density around 1.5 per m2. The curves refer to center frequency of one-third octave bands. Calculations made with the height 0.4 m above the surface representing the audience. The measured results (full lines) are from [9].
The calculated results are based on some assumptions and simplifications, which can explain the differences between calculated and measured results:
- The surface is modelled as a simple box, although the seated audience has a complicated geometry.
- The acoustical properties of the surface are approximated by a real surface impedance, although a complex surface impedance would be more realistic.
- The measurements were made with the first seat row at a distance of 3 m from the sound source, while the calculations assume a continuous reflecting surface.
As to point one above, it should be noted that it is known from physical scale models of auditoria that the detailed modelling of the audience is important. For instance, the heads and shoulders are important for the attenuation of the sound propagating over the audience area. Even the shape of the heads (cubes versus spheres) has been found to be of some importance. Thus, the modelling of the audience as a simple box cannot provide an accurate simulation of the sound attenuation. A more detailed model for the audience may be necessary in order to achieve more correct results at frequencies below 500 Hz.
As to point two above, the introduction of complex surface impedance will first of all change the phase of the reflected sound wave, especially at low frequencies. It is believed that this can lead to attenuation due to destructive interference in the frequency range 100 Hz to 500 Hz. If so, this would bring the results into better agreement with the attenuation measured on a real audience.
As to point three above, the measurements at high frequencies in the distance of 3 m to 5 m show low sound pressure levels that could be due to the reflection at the front of the first seat row.
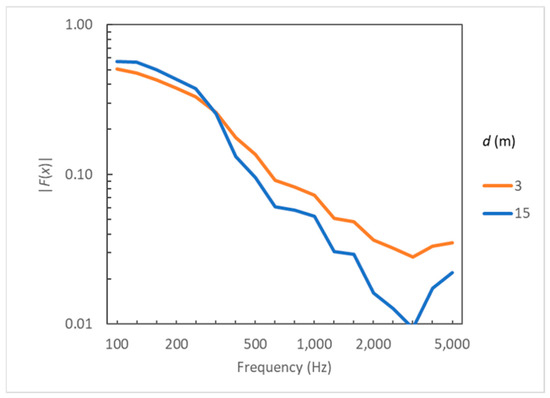
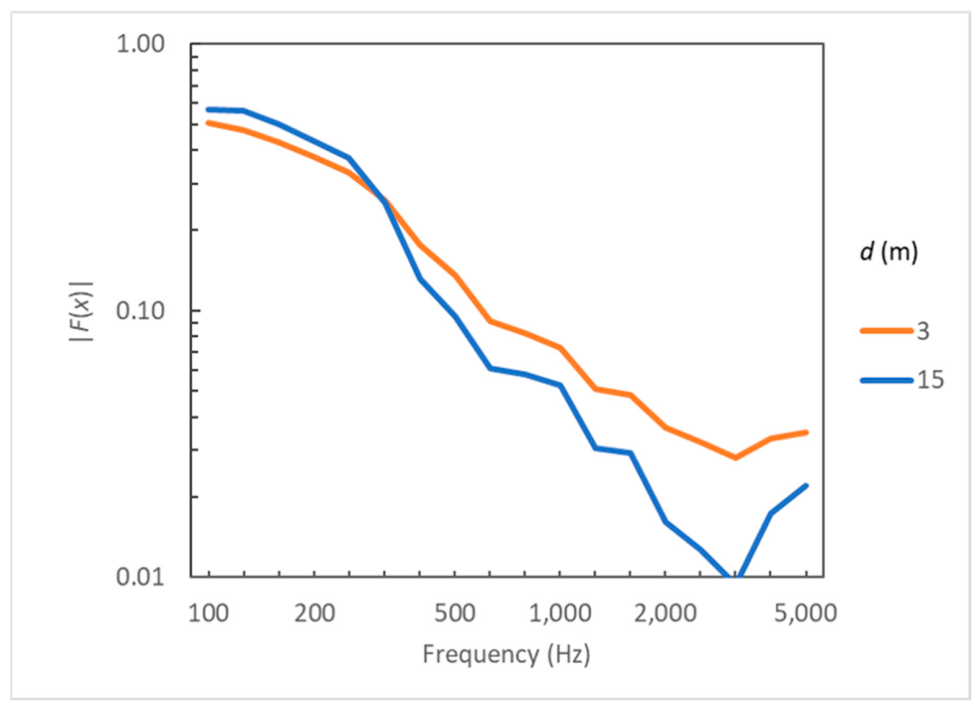
The numerical value of the function |F(x)| is displayed in Figure 13 for the first and last seat row; i.e., at distances of 3 m and 15 m, as in Figure 12. These results indicate that spherical reflection plays an important role, especially at frequencies below 500 Hz, where |F(x)| > 0.10.
Figure 13.
The numerical value of |F(x)|as a function of frequency for the distances 3 m and 15 m of sound propagation over a seated audience as in Figure 12.
6. Higher-Order Reflections
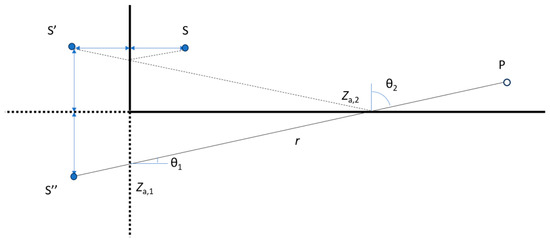
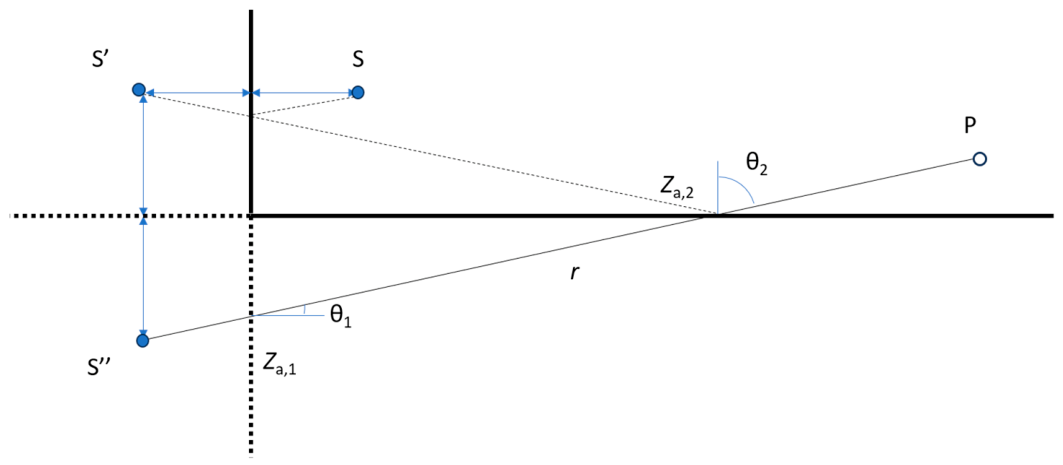
Only first-order reflections have been considered so far. The image source method can easily be expanded to higher-order reflections. An example of a second-order reflection and a corresponding second-order image source is shown in Figure 14. The total distance of propagation is r, and the two reflecting surfaces have the surface impedances of Za,1 and Za,2, respectively. The angles of incidence/reflection are θ1 and θ2, and the areas of the two surfaces are needed to find the radiation impedances for each of the two reflections. While the plane wave reflection factor for each reflection is independent of the distances, the spherical wave reflection factor for both reflections depends on the total distance r. Each of the reflection factors Q1 and Q2 are calculated as in (6), and the strength Q of the second order image source yields:
Figure 14.
A second-order reflection, converted into the transmission from the second-order image source S″ to the receiver point P.
In geometrical acoustics it well-known that the scattering of reflected sound due to the roughness of a surface is important and necessary for accurate room acoustic simulations. The scattering can also be included in an image source model; e.g., by introducing a number of secondary sources randomly distributed over the reflecting surface [20] (p. 158).
The definition of the scattering coefficient s is given in ISO 17497-1 [21] (clause 3.3): “value calculated by one minus the ratio of the specularly reflected acoustic energy to the total reflected acoustic energy”. Taking the scattering due to surface roughness into account, the strength of a higher order image source is:
where sn is the scattering coefficient of the surface n, and the spherical reflection factor of surface n is:
At low frequencies (below 200 Hz), the scattering coefficient is usually very low but increasing towards higher frequencies. This means that higher-order image sources may be accurate at low frequencies, but not at high frequencies because of scattering from multiple reflections.
7. Discussion
The solution to the spherical wave reflection revealed an interesting property, which was unexpected, namely that the distance from the source point to the reflecting surface is not involved; only the total distance from the image source point to the receiver point is a parameter in the Equations (6)–(9). This was also found in case of higher-order reflections. On the other hand, if the distance to the reflecting surface had been involved, the consequence would be that the reciprocity principle for a point source and a point receiver would not be valid.
For higher-order reflections it was found that the spherical reflection factor for each of the involved surfaces is dependent on the total distance from the image source to the receiver, Equation (16). One consequence of this observation is that a common method in geometrical acoustics, namely particle tracing, is not compatible with spherical wave propagation. In particle tracing, the sound energy carried by the particle is reduced by a reflection factor in each reflection, and the distance to the receiver point is not known in advance. However, the spherical reflection factor changes depending on how far the particle travels.
For the special case of sound propagation above an audience area, the model could be improved by modelling each seat row separately. Obviously, the “seat dip effect” cannot be calculated without a more detailed geometry.
The application of the spherical wave reflection model has the potential of improving acoustic prediction models more generally. As mentioned by Lam [5], there is a possibility that the combination with a higher-order image source model can be used to calculate the transfer function at low frequencies in small rooms with an accuracy that is comparable to that obtained with the boundary element method. This would give the advantage of significantly faster calculations with the image source method.
Finally, the image source calculation model with spherical wave reflection can be improved in the future by introducing complex surface impedances. However, this will probably require another solution to the spherical wave reflection, because the model applied here is based on the assumption of a real surface impedance.
8. Conclusions
The use of spherical wave reflection offers a significant improvement to the image source model in room acoustics. It was revealed that the reciprocity principle is maintained with spherical wave reflection, and also for higher reflection orders. The plane wave approximation for sound reflection is valid for distances above 50 times the wavelength, and the current approximation to the spherical wave reflection should not be applied beyond this distance. It is clear that calculation models could be improved by implementing spherical wave reflection mainly at low frequencies. However, it is not possible to give simple guidelines on the expected difference between spherical and plane wave reflection calculations.
Funding
This research received no external funding.
Data Availability Statement
Data are available by contacting the author.
Acknowledgments
The author is grateful to Antoine Richard for discussions and valuable comments to the manuscript.
Conflicts of Interest
The author was employed by the company Odeon A/S. The author Jens Holger Rindel declares that the research was conducted in the absence of any commercial or financial relationships that could be construed as a potential conflict of interest.
Variables
| Symbol | Unit | Meaning |
| c | m/s | speed of sound in air |
| C(x) | - | Fresnel integral, Equation (A1) |
| d | m | horizontal distance from source to receiver |
| e | m | side of a square with area S |
| F(x) | - | complex function, Equation (8) |
| f(x) | - | help function, Equation (A5) |
| g(x) | - | help function, Equation (A6) |
| hr | m | height of receiver above plane |
| hs | m | height of source above plane |
| i | - | imaginary unit |
| k | m−1 | angular wave number |
| p | Pa | sound pressure |
| Q | - | spherical wave reflection factor |
| R | - | plane wave reflection factor |
| r | m/s | distance |
| S | m2 | area of reflecting surface |
| s | - | scattering coefficient |
| S(x) | - | Fresnel integral, Equation (A2) |
| SPL | dB | sound pressure level |
| t | - | integration variable |
| x | - | variable, Equation (9) |
| Za | - | surface impedance (specific) |
| Zf,d | - | equivalent field impedance (specific) |
| Zr | - | radiation impedance (specific) |
| αs | - | statistical absorption coefficient |
| β | - | surface admittance |
| γ | - | =cos(θ) |
| ΔL | dB | total SPL relative to the direct sound |
| ΔL(s-d) | dB | difference in SPL for spherical and plane wave |
| θ | ° | angle of incidence |
| λ | m | wavelength |
| ρ | kg m−3 | density of air |
| ω | rad s−1 | angular frequency |
Appendix A. Fresnel Integrals
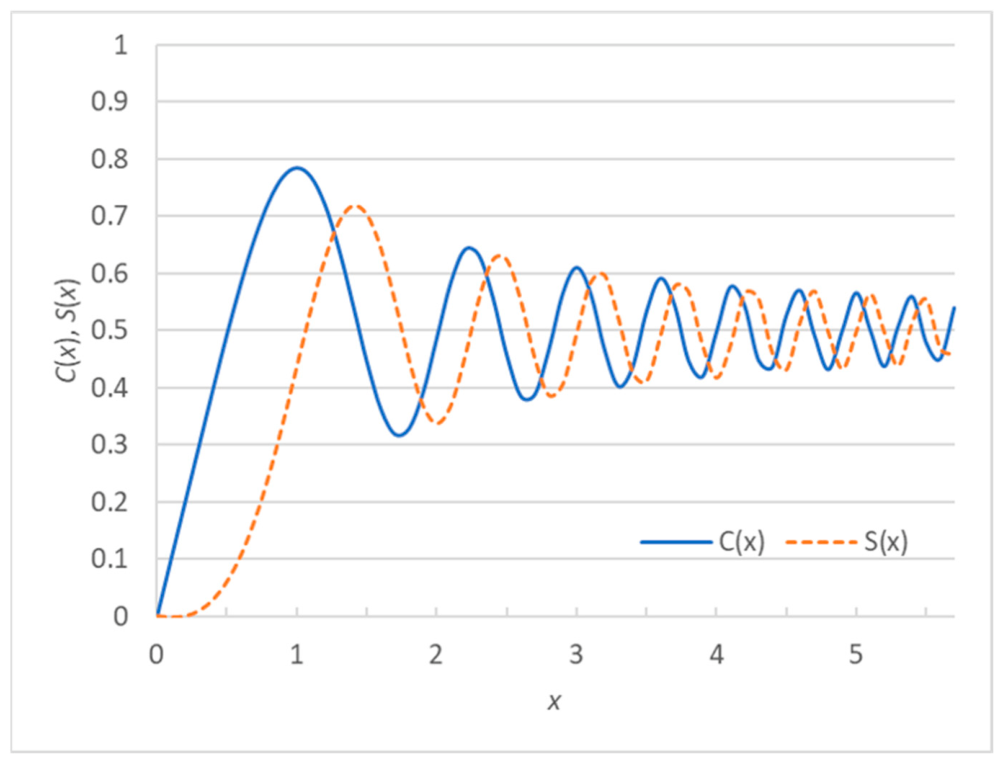
The Fresnel integrals are applied for the solution of Equation (8). The complex Fresnel integral can be divided into two integrals representing the real part C(x) and the imaginary part S(x), respectively:
Approximations for the Fresnel integrals are with reference to [22] (Chapter 7):
and
where the help functions f(x) and g(x) are:
and
The error of the approximation is |ε|< 0.002. The Fresnel integrals are depicted in Figure A1. For we have the asymptotic values and .
Figure A1.
The Fresnel integrals C(x) and S(x).
References
- Ingard, U. On the Reflection of a Spherical Sound Wave from an Infinite Plane. J. Acoust. Soc. Am. 1951, 23, 329–335. [Google Scholar] [CrossRef] [Scilit]
- Thomasson, S.-I. Reflection of waves from a point source by an impedance boundary. J. Acoust. Soc. Am. 1976, 59, 780–785. [Google Scholar] [CrossRef] [Scilit]
- Chessel, C.I. Propagation of noise along a finite impedance boundary. J. Acoust. Soc. Am. 1977, 62, 825–834. [Google Scholar] [CrossRef] [Scilit]
- Mechel, F.P. Schallabsorber, Band I: Äussere Schallfelder, Wechselwirkungen; S. Hirzel Verlag: Stuttgart, Germany, 1989. [Google Scholar]
- Lam, Y.W. Issues for computer modelling of room acoustics in non-concert hall settings. Acoust. Sci. Technol. 2005, 26, 145–155. [Google Scholar] [CrossRef] [Scilit]
- von Bekesy, F. Über die Schallfeldverzerrung in der Nähe von absorbierenden Flächen und ihre Bedeutung für die Raumakustik. Z. Tech. Phys. 1933, 14, 6. [Google Scholar]
- Subrahanyam, D.L.; Bolt, R.H. On the Attenuation of Sound Passing over an Audience. J. Acoust. Soc. Am. 1954, 26, 937–938. [Google Scholar] [CrossRef] [Scilit]
- Schultz, T.; Watters, B.G. Propagation of Sound across Audience Seating. J. Acoust. Soc. Am. 1964, 36, 885–896. [Google Scholar] [CrossRef] [Scilit]
- Meyer, E.; Kuttruff, H.; Schulte, F. Versuche zur Schallausbreitung über Publikum. Acustica 1965, 15, 175–182. [Google Scholar]
- Economou, P.; Charalampous, P. Improved room acoustics calculations using complex impedance and spherical wave reflection & diffraction coefficients. In Proceedings of the 23rd International Conference on Sound & Vibration, Athens, Greece, 10–14 July 2016; International Institute of Acoustics and Vibration (IIAV): Auburn, AL, USA, 2016. [Google Scholar]
- Mommertz, E. Untersuchung Akustischer Wandeigenschaften und Modellierung der Schallrückwürfe in der Binauralen Raumsimulation. Ph.D. Thesis, RWTH Aachen, Shaker Verlag, Aachen, Germany, 1996. [Google Scholar]
- Economou, P.; Charalampous, P. The seat dip effect using wave based geometrical acoustics (WBGA). In Proceedings of the 23rd International Conference on Sound & Vibration, Athens, Greece, 10–14 July 2016; International Institute of Acoustics and Vibration (IIAV): Auburn, AL, USA, 2016. [Google Scholar]
- Economou, P.; Charalampous, P. From Theory to Practice: Advanced calculation methods applied in OTL—Terrain. In Proceedings of the DAGA 2014, Oldenburg, Germany, 10–13 March 2014; German Acoustical Society: Berlin, Germany, 2014; pp. 834–835. [Google Scholar]
- Economou, P.; Economou, C. Reverberation time (RT) calculation based on room modal decay and using wave based geometrical acoustics (WBGA) and modal parameter estimation. In Proceedings of the Euronoise 2018, Crete, Greece, 27–31 May 2018; Hellenic Institute of Acoustics: Crete, Greece, 2018; pp. 2099–2106. [Google Scholar]
- Davy, J.L.; Larner, D.J.; Wareing, R.R.; Pearse, J.R. The average specific forced radiation wave impedance of a finite rectangular panel. J. Acoust. Soc. Am. 2014, 136, 525–536. [Google Scholar] [CrossRef] [Scilit] [PubMed]
- Thomasson, S.-I. Theory and Experiments on the Sound Absorption as Function of the Area; Report TRITA-TAK-8201; Royal Institute of Technology: Stockholm, Sweden, 1982. [Google Scholar]
- Rindel, J.H. Modelling the Angle-Dependent Pressure Reflection Factor. Appl. Acoust. 1993, 38, 223–234. [Google Scholar] [CrossRef] [Scilit]
- ISO 354:2003; Acoustics—Measurement of Sound Absorption in a Reverberation Room. ISO: Geneva, Switzerland, 2003.
- Meyer, E.; Kunstmann, D.; Kuttruff, H. Ûber einige Messungen zur Schallabsoption von Publikum. Acustica 1964, 14, 119–124. [Google Scholar]
- ODEON Room Acoustics Software. User’s Manual, Version 19; DTU Science Park: Kongens Lyngby, Denmark, 2025. Available online: https://odeon.dk/download/Version19/OdeonManual.pdf (accessed on 23 April 2026).
- ISO 17497-1; Acoustics—Sound-Scattering Properties of Surfaces—Part 1: Measurement of the Random-Incidence Scattering Coefficient in a Reverberation Room. ISO: Geneva, Switzerland, 2004.
- Abramowitz, M.; Stegun, I.A. (Eds.) Handbook of Mathematical Functions, 3rd ed.; National Bureau of Standards: Washington, DC, USA, 1964.

Disclaimer/Publisher’s Note: The statements, opinions and data contained in all publications are solely those of the individual author(s) and contributor(s) and not of MDPI and/or the editor(s). MDPI and/or the editor(s) disclaim responsibility for any injury to people or property resulting from any ideas, methods, instructions or products referred to in the content. |
© 2026 by the author. Licensee MDPI, Basel, Switzerland. This article is an open access article distributed under the terms and conditions of the Creative Commons Attribution (CC BY) license.