1. Introduction
Foodborne bacterial contamination imposes substantial public health and economic burdens. In the United States, the Centers for Disease Control and Prevention (CDC) estimates that foodborne illness causes approximately 48 million illnesses, 128,000 hospitalizations, and 3000 deaths annually, and identifies non-typhoidal
Salmonella as a leading cause of hospitalizations and deaths as well as
E. coli O157 as a leading cause of severe outcomes [
1]. In a CDC burden analysis of major known pathogens, non-typhoidal
Salmonella accounted for the largest share of hospitalizations (estimated 35%) [
2]. Additionally, the food system experiences frequent product interventions: in 2023, the USDA Food Safety and Inspection Service (FSIS) reported 65 recalls totaling 4,005,384 pounds of meat and poultry products [
3]. Foodborne events also create material economic losses; for example, the overall economic burden of foodborne illness has been estimated to be as high as US
$90 billion annually [
4]. Produce-associated outbreaks, including outbreaks linked to onions, further highlight that complex food matrices can contribute to contamination risk and motivate earlier screening protocols [
5,
6].
Conventional detection pipelines rely heavily on culture-based assays involving enrichment, plating, and confirmatory steps. These methods remain the reference standard for confirming viable organisms, but they are time- and labor-intensive because they require extended incubation and multiple processing stages [
7,
8,
9]. Although culture-independent alternatives (e.g., nucleic acid-based and immunological methods) can shorten the time-to-result in some workflows, they introduce trade-offs such as matrix-dependent inhibition, additional sample preparation requirements, and potential challenges in distinguishing viability depending on the assay design [
7,
10,
11].
To shorten the time-to-result while leveraging the direct observation of early growth, researchers have explored detection and quantification at the microcolony stage, where bacterial proliferation can be observed microscopically within hours. For example, an on-chip microscopy microcolony assay reported enumeration within 6 h for colonies above a defined size threshold [
12]. A resazurin-amplified picoarray method quantified viable
E. coli with precision in approximately 3 h by detecting microcolonies in compartmentalized chambers [
13]. In a food safety context, phase-contrast microscopy combined with YOLO-based detection has been used to distinguish
E. coli at the microcolony stage after 3 h of cultivation [
14]. These approaches motivate automated microscopy pipelines where images can be processed at scale without manual counting.
Deep learning object detectors enable the automated localization and classification of multiple microcolonies directly in full-frame microscopy images, supporting scalable screening workflows [
14,
15]. YOLO-family detectors are widely used for real-time object detection due to their single-stage design and end-to-end efficiency [
16]. In this work, we build on the YOLOv8 implementation provided by the Ultralytics framework [
17], which supports consistent training, evaluation, and profiling under standardized settings.
Backbone selection and multi-scale feature fusion are critical design degrees of freedom for small and low-contrast target detection. EfficientNetV2 is a parameter-efficient convolutional backbone family that introduces Fused-MBConv blocks and training-aware scaling to improve the speed–accuracy trade-offs [
18,
19]. EfficientNetV2 backbones have been integrated into YOLOv8 variants in other applications (e.g., drone-captured image recognition and traffic sign detection), often improving accuracy–efficiency trade-offs [
20,
21]. Microscopy bacterial microcolonies, however, differ from natural image objects: they can be small, low-contrast, densely clustered, and morphologically variable across growth stages and imaging conditions [
15,
22]. These properties place strong demands on feature extraction and multi-scale representation.
Despite progress in adapting detectors to specialized domains, two practical knowledge gaps remain for microscopy-based bacterial screening systems. First, controlled studies that isolate backbone effects from other confounders (dataset shifts, training protocol changes, and head/loss redesign) are limited. Second, the interaction between backbone expressiveness and multi-scale feature aggregation remains under-characterized for microscopy images with extreme appearance variability. To address these limitations in a controlled and reproducible manner, we conduct a systematic architectural evaluation of YOLOv8 for bacterial microcolony detection. We replace the original backbone with EfficientNetV2 variants of varying capacity and evaluate three feature fusion configurations: no neck, the original PAN-FPN neck, and a NAS-FPN-inspired neck. All models are trained and evaluated under identical experimental conditions on a two-class dataset of Salmonella and Escherichia coli microcolonies, enabling isolation of architectural effects from confounding training or data factors.
This study presents a controlled investigation of YOLOv8-based designs for bacterial microcolony detection in microscopy images. The main contributions are as follows. First, a consistent evaluation setting is established to isolate the impact of architectural components under identical training conditions. Second, EfficientNetV2 backbones (S, M, and L) and different feature fusion strategies, including no-neck, PAN-FPN, and a NAS-FPN-inspired design, are examined to assess their influence on detection performance. Third, both detection accuracy and computational efficiency are evaluated under microscopy-specific challenges. Finally, the analysis provides a structured evaluation of how backbone capacity and feature fusion design jointly influence detection performance under controlled microscopy conditions.
2. Related Work
Culture-based workflows for foodborne bacteria detection (enrichment, selective plating, and biochemical confirmation) remain widely used because they confirm viable organisms, but they require extended incubation and multi-step handling that limits rapid screening [
7,
8]. Reviews of modern diagnostic pipelines emphasize that culture-independent methods (e.g., PCR/qPCR, immunoassays, and biosensors) can accelerate detection in some settings but introduce trade-offs related to sample preparation complexity, matrix effects, and assay-specific limitations, including viability interpretation depending on the detection principle [
7,
10]. Comparative studies of culture-based and culture-independent approaches for
Salmonella detection further highlight practical differences in sensitivity, operational complexity, and interpretation across workflows [
11].
Microscopy-based detection targeting early-stage microcolonies has been explored as a route to shorten the time-to-result while preserving biologically meaningful cues. Lens-free/on-chip microscopy platforms and microfluidic methods demonstrate that microcolonies (or microcolony proxies) can be detected and quantified within hours in controlled assays [
12,
13,
23]. In food safety imaging workflows, phase-contrast microscopy combined with deep learning has been used to detect bacteria at the microcolony stage after a few hours of growth [
14]. Beyond standard bright-field/phase-contrast imaging, coherent and hyperspectral approaches provide additional signal diversity that can improve discrimination, typically at the cost of increased instrumentation and data processing complexity [
22,
24,
25].
Deep learning has become a dominant tool for bacterial image analysis because it can learn discriminative features directly from microscopy data. Prior work includes classification and segmentation approaches for morphology and growth-stage quantification, but these approaches have deployment limitations: classification often presupposes reliable region-of-interest extraction, and segmentation requires pixel-level annotation, which is typically more time consuming to produce and more computationally intensive to run than bounding box detection [
15,
26]. Recent work has also explored robust learning under noisy supervision. Zhang et al. [
27] proposed a progressive sample selection framework combined with contrastive learning to mitigate the impact of noisy labels. Such approaches are particularly relevant in microscopy-based datasets, where annotation ambiguity and visual similarity between classes can introduce labeling uncertainty.
Object detection provides a practical compromise by localizing and classifying multiple instances directly in full-resolution images through bounding box regression, supporting scalable screening workflows and producing interpretable outputs (bounding boxes, class labels, and confidence scores) [
14,
16].
Within object detection, YOLO-family models are widely adopted due to their single-stage design and demonstrated real-time performance in the foundational YOLO formulation [
16]. Modern implementations (including YOLOv8) are often adapted to specialized tasks through architectural modifications, particularly backbone replacement and changes to multi-scale feature fusion. EfficientNetV2 provides an attractive backbone candidate due to its parameter efficiency and training-aware scaling behavior [
19]. Recent application papers have integrated EfficientNetV2 into YOLOv8-style pipelines for improved accuracy–efficiency trade-offs on non-microscopy tasks [
20,
21]. However, EfficientNetV2-based YOLO variants remain underexplored for microscopy-based bacterial microcolony detection, and controlled evaluations of how backbone capacity interacts with feature fusion mechanisms under microscopy-specific challenges remain limited.
Based on the identified gaps in existing studies, the objective of this work is to systematically evaluate how backbone design and feature fusion strategies influence bacterial microcolony detection in microscopy images under controlled experimental conditions. In particular, the study aims to analyze the impact of different backbone capacities and multi-scale feature integration approaches on detection accuracy, robustness, and computational efficiency.
3. Materials and Methods
3.1. Dataset Description
We use a high-resolution microscopy dataset designed for two-class bacterial microcolony detection, targeting
Salmonella and
Escherichia coli during their early growth stages. The dataset was collected, curated, and verified over approximately one year through repeated cycles of bacterial cultivation, controlled sample preparation, and microscopy imaging. Data acquisition was conducted in collaboration with a domain expert from an agricultural sciences school to ensure that growth conditions, cultivation protocols, and the visual characteristics of the observed microcolonies reflect realistic food safety scenarios encountered in laboratory and applied settings. Following image acquisition, the samples were annotated in two complementary representations—bounding boxes and polygon-based masks—using the Computer Vision Annotation Tool (CVAT) [
28]. These annotations were produced through expert-guided manual review to ensure that labeled microcolonies correspond to biologically valid bacterial structures rather than imaging artifacts or background irregularities. Although both annotation representations are included in the dataset, the experiments reported in this work utilize only the bounding box annotations for bacterial object detection.
We acquired images using an IX73 inverted microscope equipped with an Olympus LC35 digital color camera and stored them in RGB .tif format at a resolution of pixels. This corresponds to a physical field of view of approximately and a spatial resolution of 0.125 per pixel. In total, we collected data across growth intervals ranging from h to h in h increments and under two background conditions: Onion-Present and Onion-Absent. This acquisition design intentionally captures biologically realistic variation in microcolony size, morphology, contrast, and background complexity, all of which influence detection difficulty in microscopy-based food safety applications.
Dataset Composition and Utilization
Our complete dataset comprises several biologically distinct subsets collected under controlled experimental conditions. We acquired single-species image groups for E. coli and Salmonella under both Onion-Present and Onion-Absent conditions. For each growth interval, between 90 and 100 images were collected per species and background condition, reflecting the practical variability across repeated cultivation experiments. Consequently, the number of images per interval is not strictly uniform. Across the full temporal range (– h), this resulted in a total of 3181 single-species images.
In addition to the single-species data, we collected mixed-species images containing both E. coli and Salmonella within the same field of view. These mixed datasets were acquired under Onion-Present and Onion-Absent conditions, with 100 images collected per background condition at each growth interval. This resulted in 200 mixed-species images per time point and 1600 mixed images in total. To further characterize background appearance independently of bacterial presence, we also collected 400 background-only images, consisting of 200 Onion-Present images and 200 Onion-Absent images without bacteria.
Although the dataset spans early growth intervals beginning at h, not all collected images were suitable for reliable expert annotation. For single-species images acquired before h, bacterial structures were frequently visually indistinguishable from background artifacts such as agar texture, air bubbles, surface depressions, and onion debris. Under these conditions, expert verification of annotation correctness was not feasible, and these images were excluded from model training and evaluation. Similarly, mixed-species images acquired before h were not annotated because E. coli and Salmonella could not be reliably distinguished at extremely small spatial scales. Even at later growth intervals (≥2.0 h), mixed-species samples continued to exhibit labeling ambiguity, preventing full expert verification of annotation correctness. Consequently, mixed-species data were not used in the experiments reported in this study.
Our experiments therefore focus exclusively on single-species
E. coli and
Salmonella images acquired at growth times between
h and
h under Onion-Present and Onion-Absent conditions. In total, we collected 2381 images satisfying these criteria, and all of these images were used for training, validation, and testing in the experiments reported in this study.
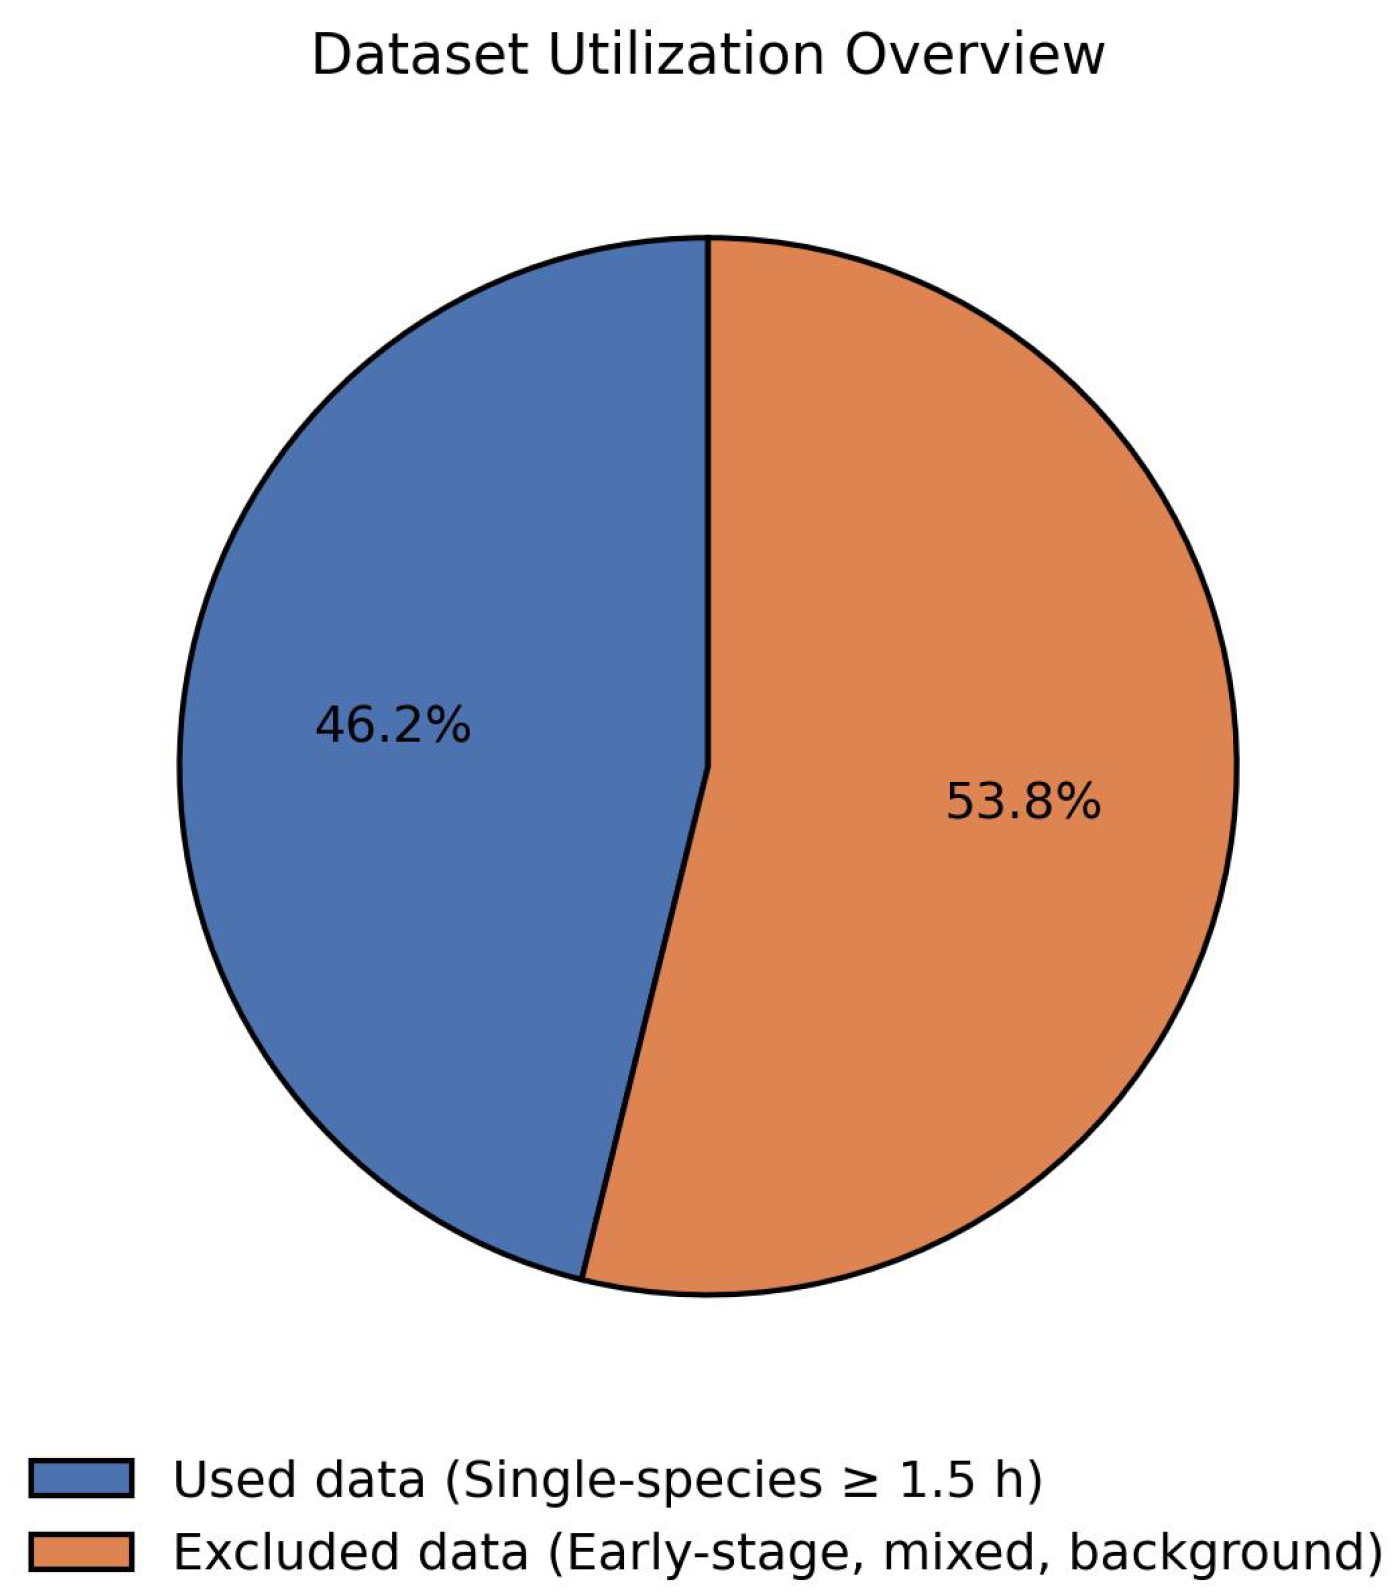
Figure 1 summarizes the proportion of the collected dataset used in this work relative to data acquired at earlier growth stages or under mixed-species conditions.
Annotations are provided in YOLO detection format, where each bacterial microcolony is represented by a single bounding box and assigned to one of two classes: Salmonella or E. coli. The final annotated dataset contains 2381 images split into 1663 training, 240 validation, and 478 test samples. All splits include every combination of species, growth time, and background condition to avoid domain leakage. The dataset contains a total of annotated instances, with a mild class imbalance favoring Salmonella. Overall, the dataset captures substantial variation in object scale, colony morphology, local clustering patterns, and background appearance across different growth stages and experimental conditions. These characteristics create a challenging detection scenario involving extremely small bacterial structures, dense early-stage clusters, and visually complex microscopy backgrounds, making the dataset well suited for evaluating the robustness of modern object detection architectures in microscopy-based food safety applications.
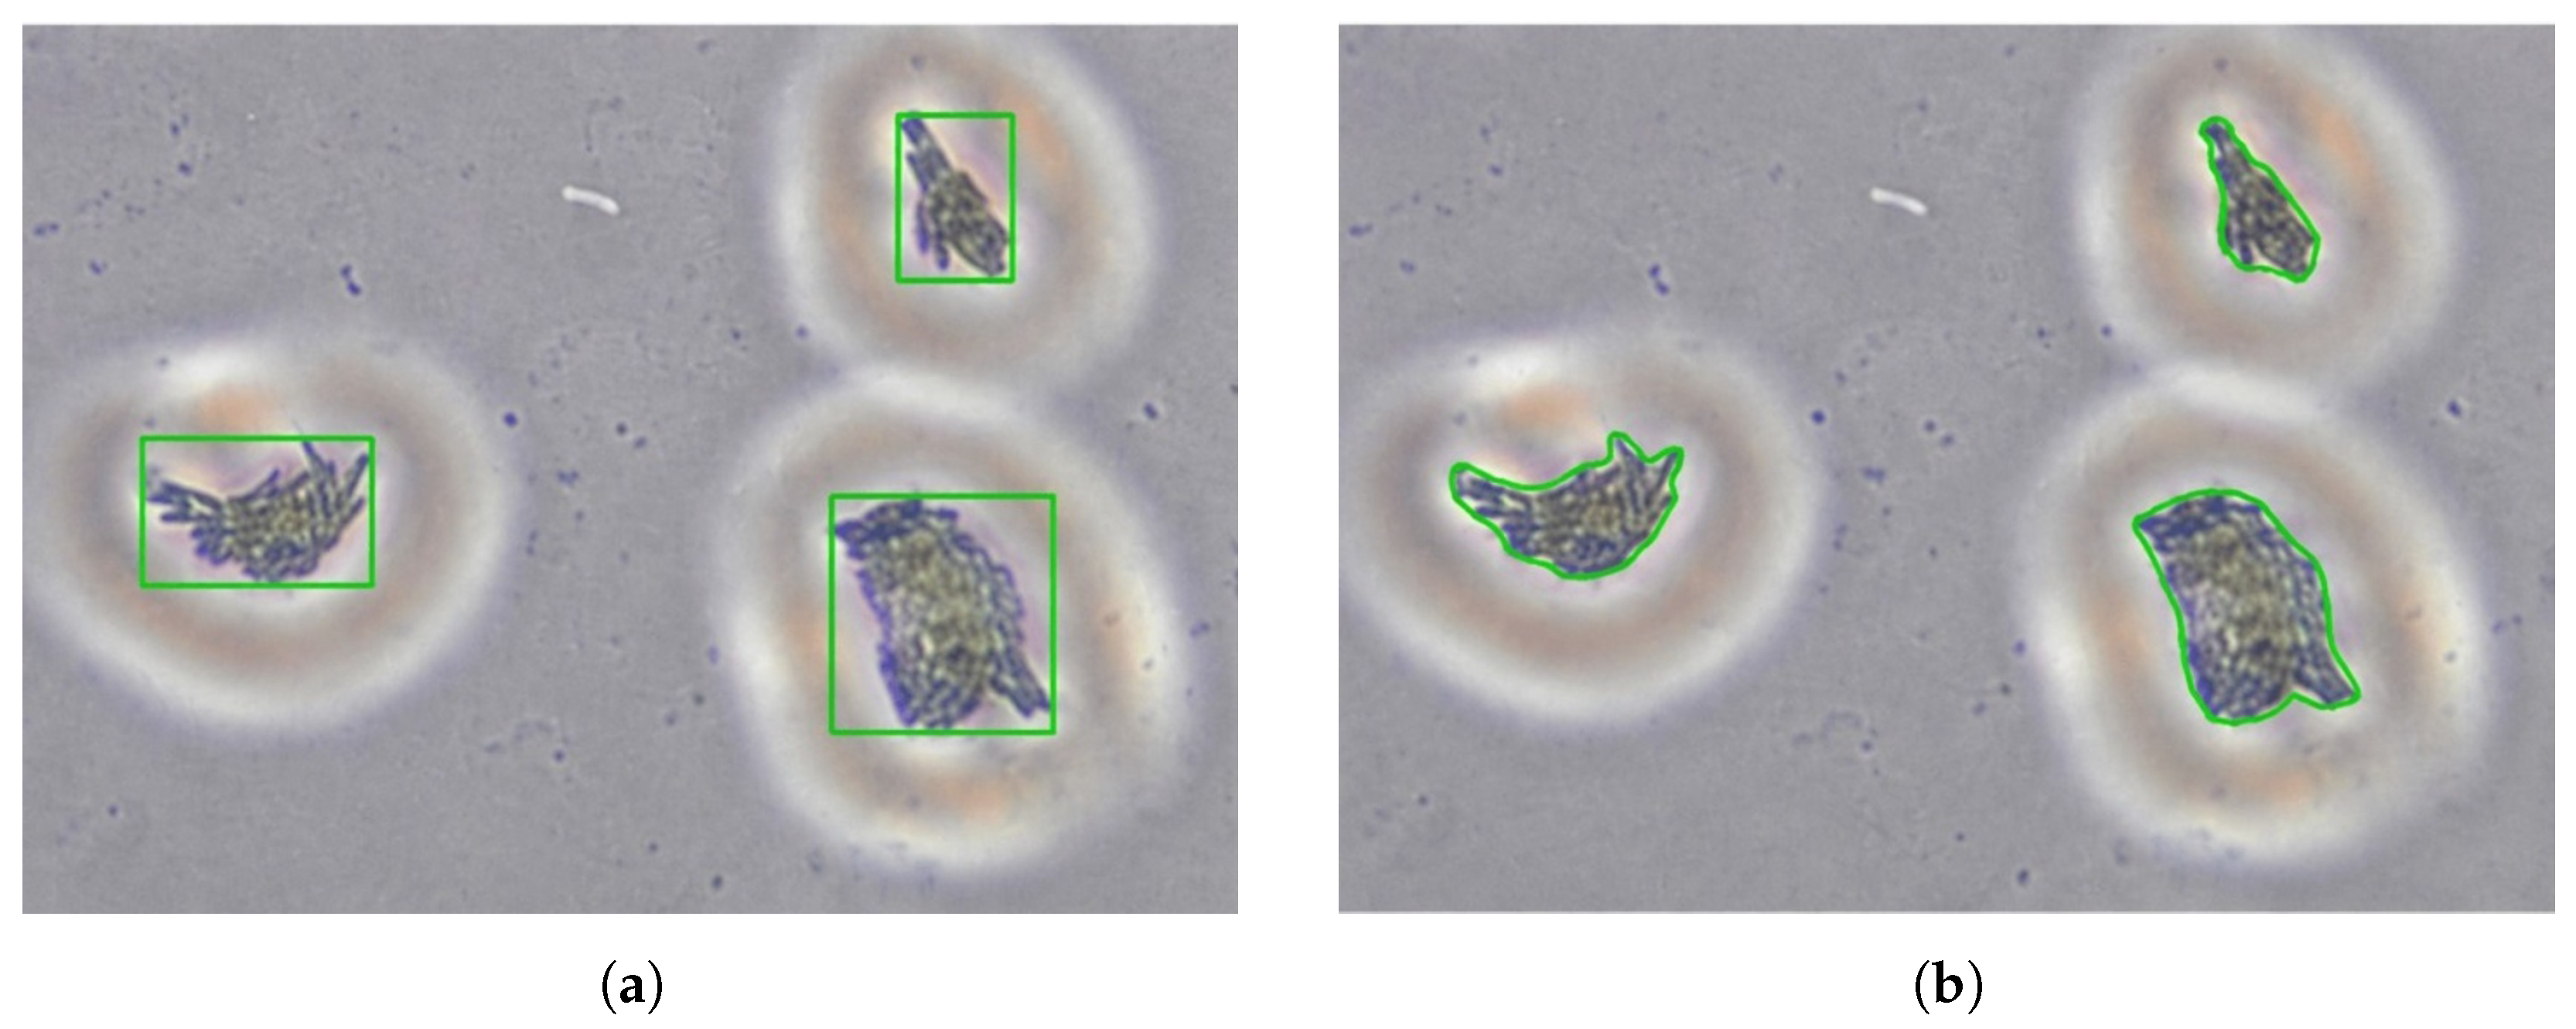
Figure 2 presents representative annotation examples from the microscopy dataset.
Figure 2a shows the bounding box annotations used for bacterial object detection in this study, where each microcolony is represented by a single detection box.
Figure 2b shows polygon-based annotations included in the dataset for fine-grained spatial delineation of bacterial microcolony boundaries. Together, these examples highlight irregular colony shapes, local boundary variation, low-contrast regions, and proximity to background artifacts, which motivated the use of expert-reviewed annotations.
To further characterize the dataset composition,
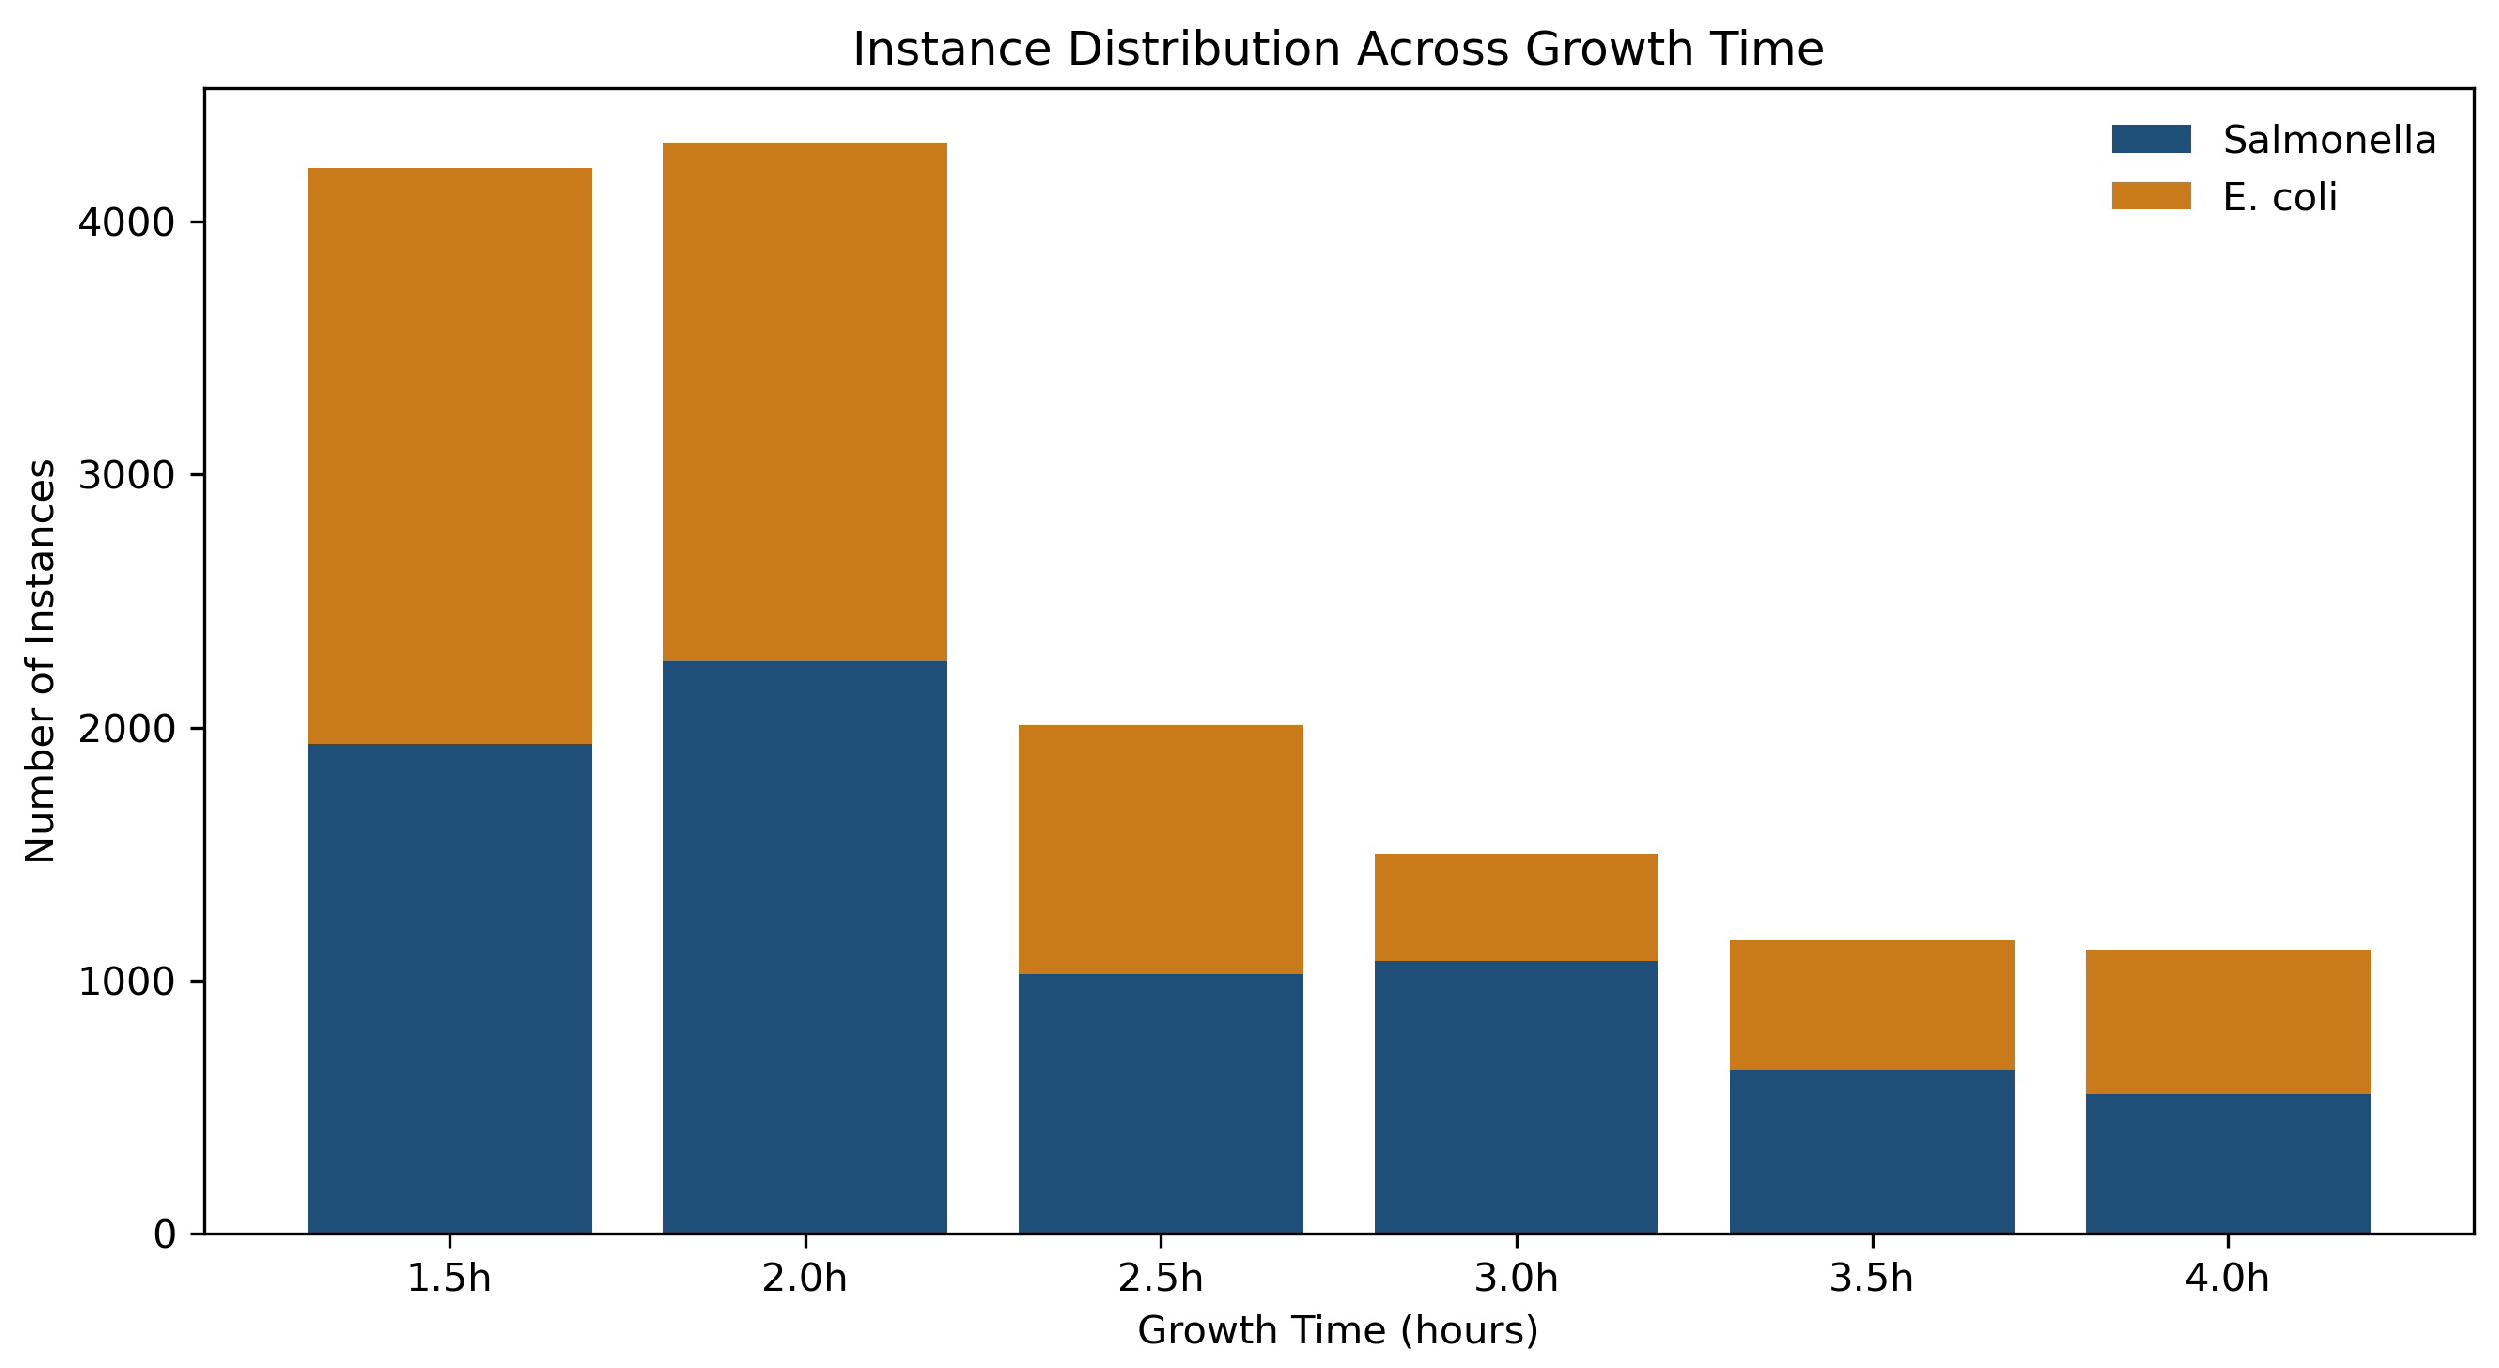
Figure 3 illustrates the distribution of annotated bacterial instances across growth times. The majority of instances occur at early growth stages (
–
h), where microcolonies are smaller and visually ambiguous, emphasizing the importance of robust multi-scale detection for early screening.
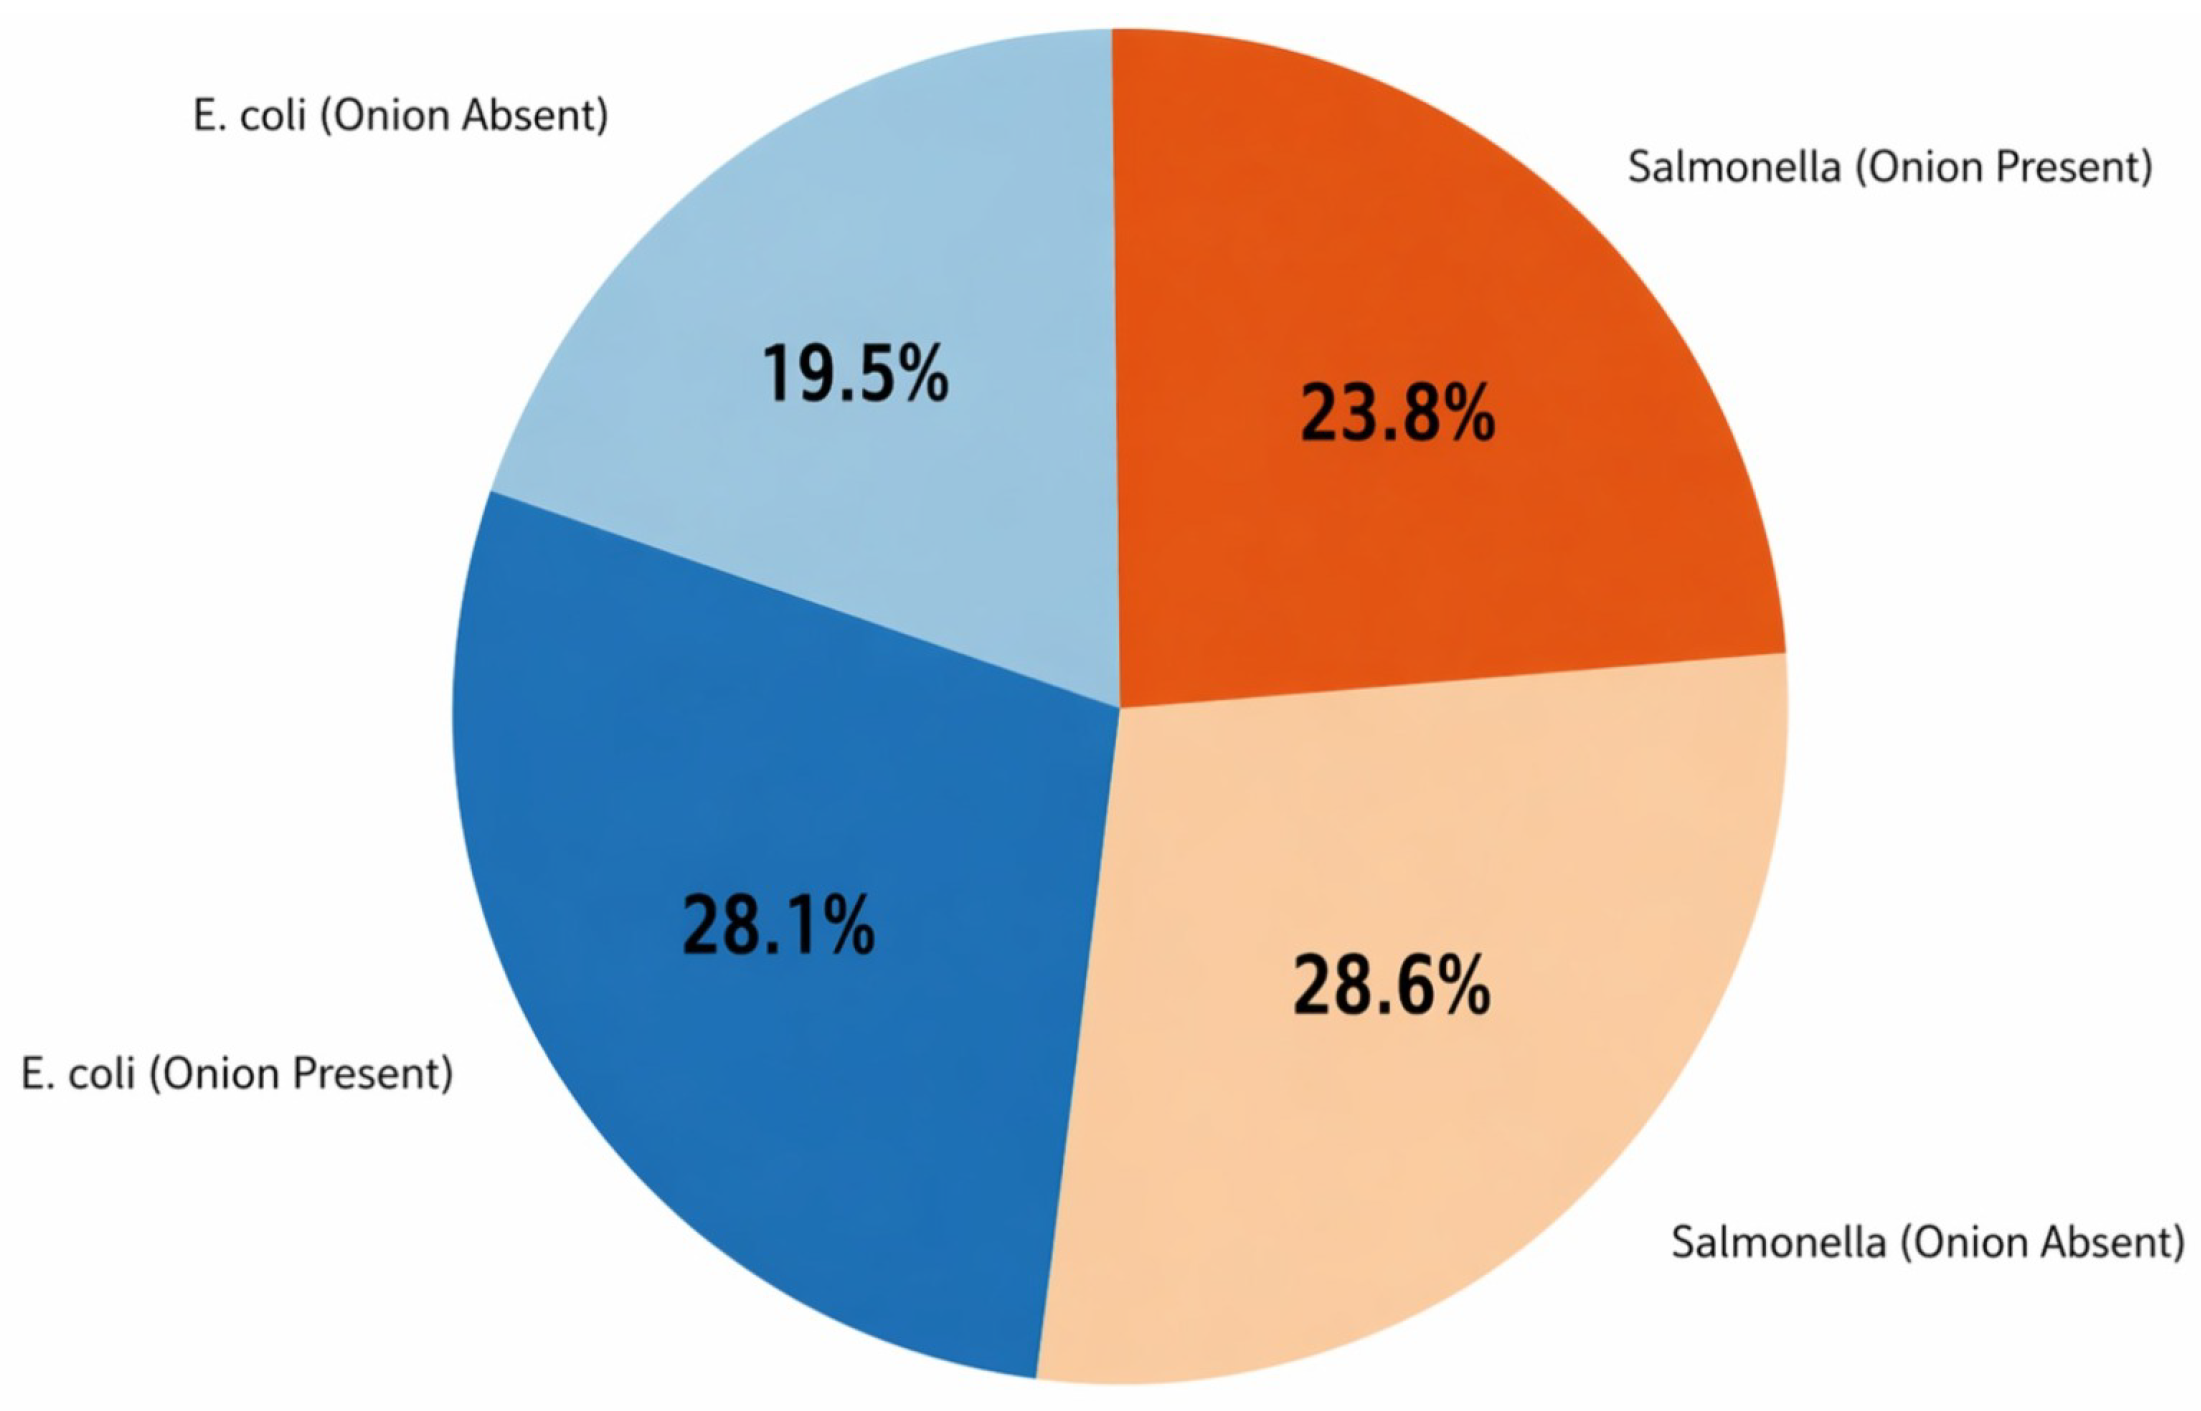
Figure 4 shows the class distribution under Onion-Present and Onion-Absent background conditions. The dataset exhibits moderate imbalance across species and background settings, reflecting realistic acquisition conditions and reinforcing the need for detectors that remain stable under biologically induced background variation.
To support reproducibility and facilitate future research in microscopy-based bacterial analysis, the dataset structure and annotations are designed to enable reproducible benchmarking and support subsequent studies on bacterial detection, segmentation, and automated microscopy analysis. The complete microscopy dataset used in this study will be made publicly available upon the publication of this paper.
3.2. Implementation Details
All models were trained using the Ultralytics YOLOv8 optimization pipeline, which performs end-to-end learning for bounding box regression, classification, and confidence estimation. The training process employs stochastic gradient-based optimization with adaptive learning rate scheduling and built-in data augmentation strategies, including mosaic augmentation and geometric and color–space transformations. Under this unified training configuration, the study evaluates backbone replacement with EfficientNetV2 variants and different feature fusion configurations, enabling a controlled analysis of their impact on detection performance. All YOLOv8-based models were initialized from pretrained checkpoints and subsequently fine-tuned end-to-end on the microscopy dataset for 100 epochs. Thus, the reported results correspond to a controlled transfer-learning setting rather than training from scratch. To ensure fair comparison, the same optimizer configuration, learning-rate schedule, augmentation pipeline, input resolution, batch size, and dataset splits were used across all evaluated architectures. All experiments were conducted on a Linux-based workstation equipped with a 24-core CPU, 32.58 GB RAM, and two NVIDIA RTX A6000 GPUs (49 GB VRAM each). The implementation used Python within the Anaconda environment, with PyTorch and the Ultralytics YOLOv8 framework for model development. All experiments were performed under consistent hardware and software conditions to ensure reproducibility.
Unless otherwise stated, all models were trained for 100 epochs using an input image size of pixels and a batch size of 16. The Ultralytics automatic optimizer selection was used, with an initial learning rate of 0.01, final learning rate factor of 0.01, momentum of 0.937, weight decay of 0.0005, and three warmup epochs. Data augmentation included HSV perturbation (, , and ), translation (0.1), scaling (0.5), horizontal flipping (0.5), mosaic augmentation (1.0), and random erasing (0.4). Mosaic augmentation was disabled during the final ten epochs. All experiments were conducted with deterministic training enabled to maintain consistent comparison across models.
3.2.1. Detection Problem Formulation
The task is formulated as a supervised object detection problem on microscopy images, where the objective is to localize and classify bacterial microcolonies belonging to two classes:
Escherichia coli and
Salmonella. Given an input image
, the detector predicts a set of bounding boxes
where
denotes bounding box coordinates,
is the predicted class label, and
is the confidence score.
Bounding Box Parameterization
Each predicted box is parameterized as
where
denotes the box center and
its width and height in image coordinates.
Bacterial microcolonies are challenging detection targets due to their small spatial extent, low contrast, and substantial appearance variation across growth stages. Accurate detection therefore depends heavily on effective multi-scale feature representation and fusion. In addition, from a food safety perspective, recall for Salmonella detection is of particular importance, as false negatives pose a greater risk than false positives.
3.2.2. Baseline YOLOv8 Architecture
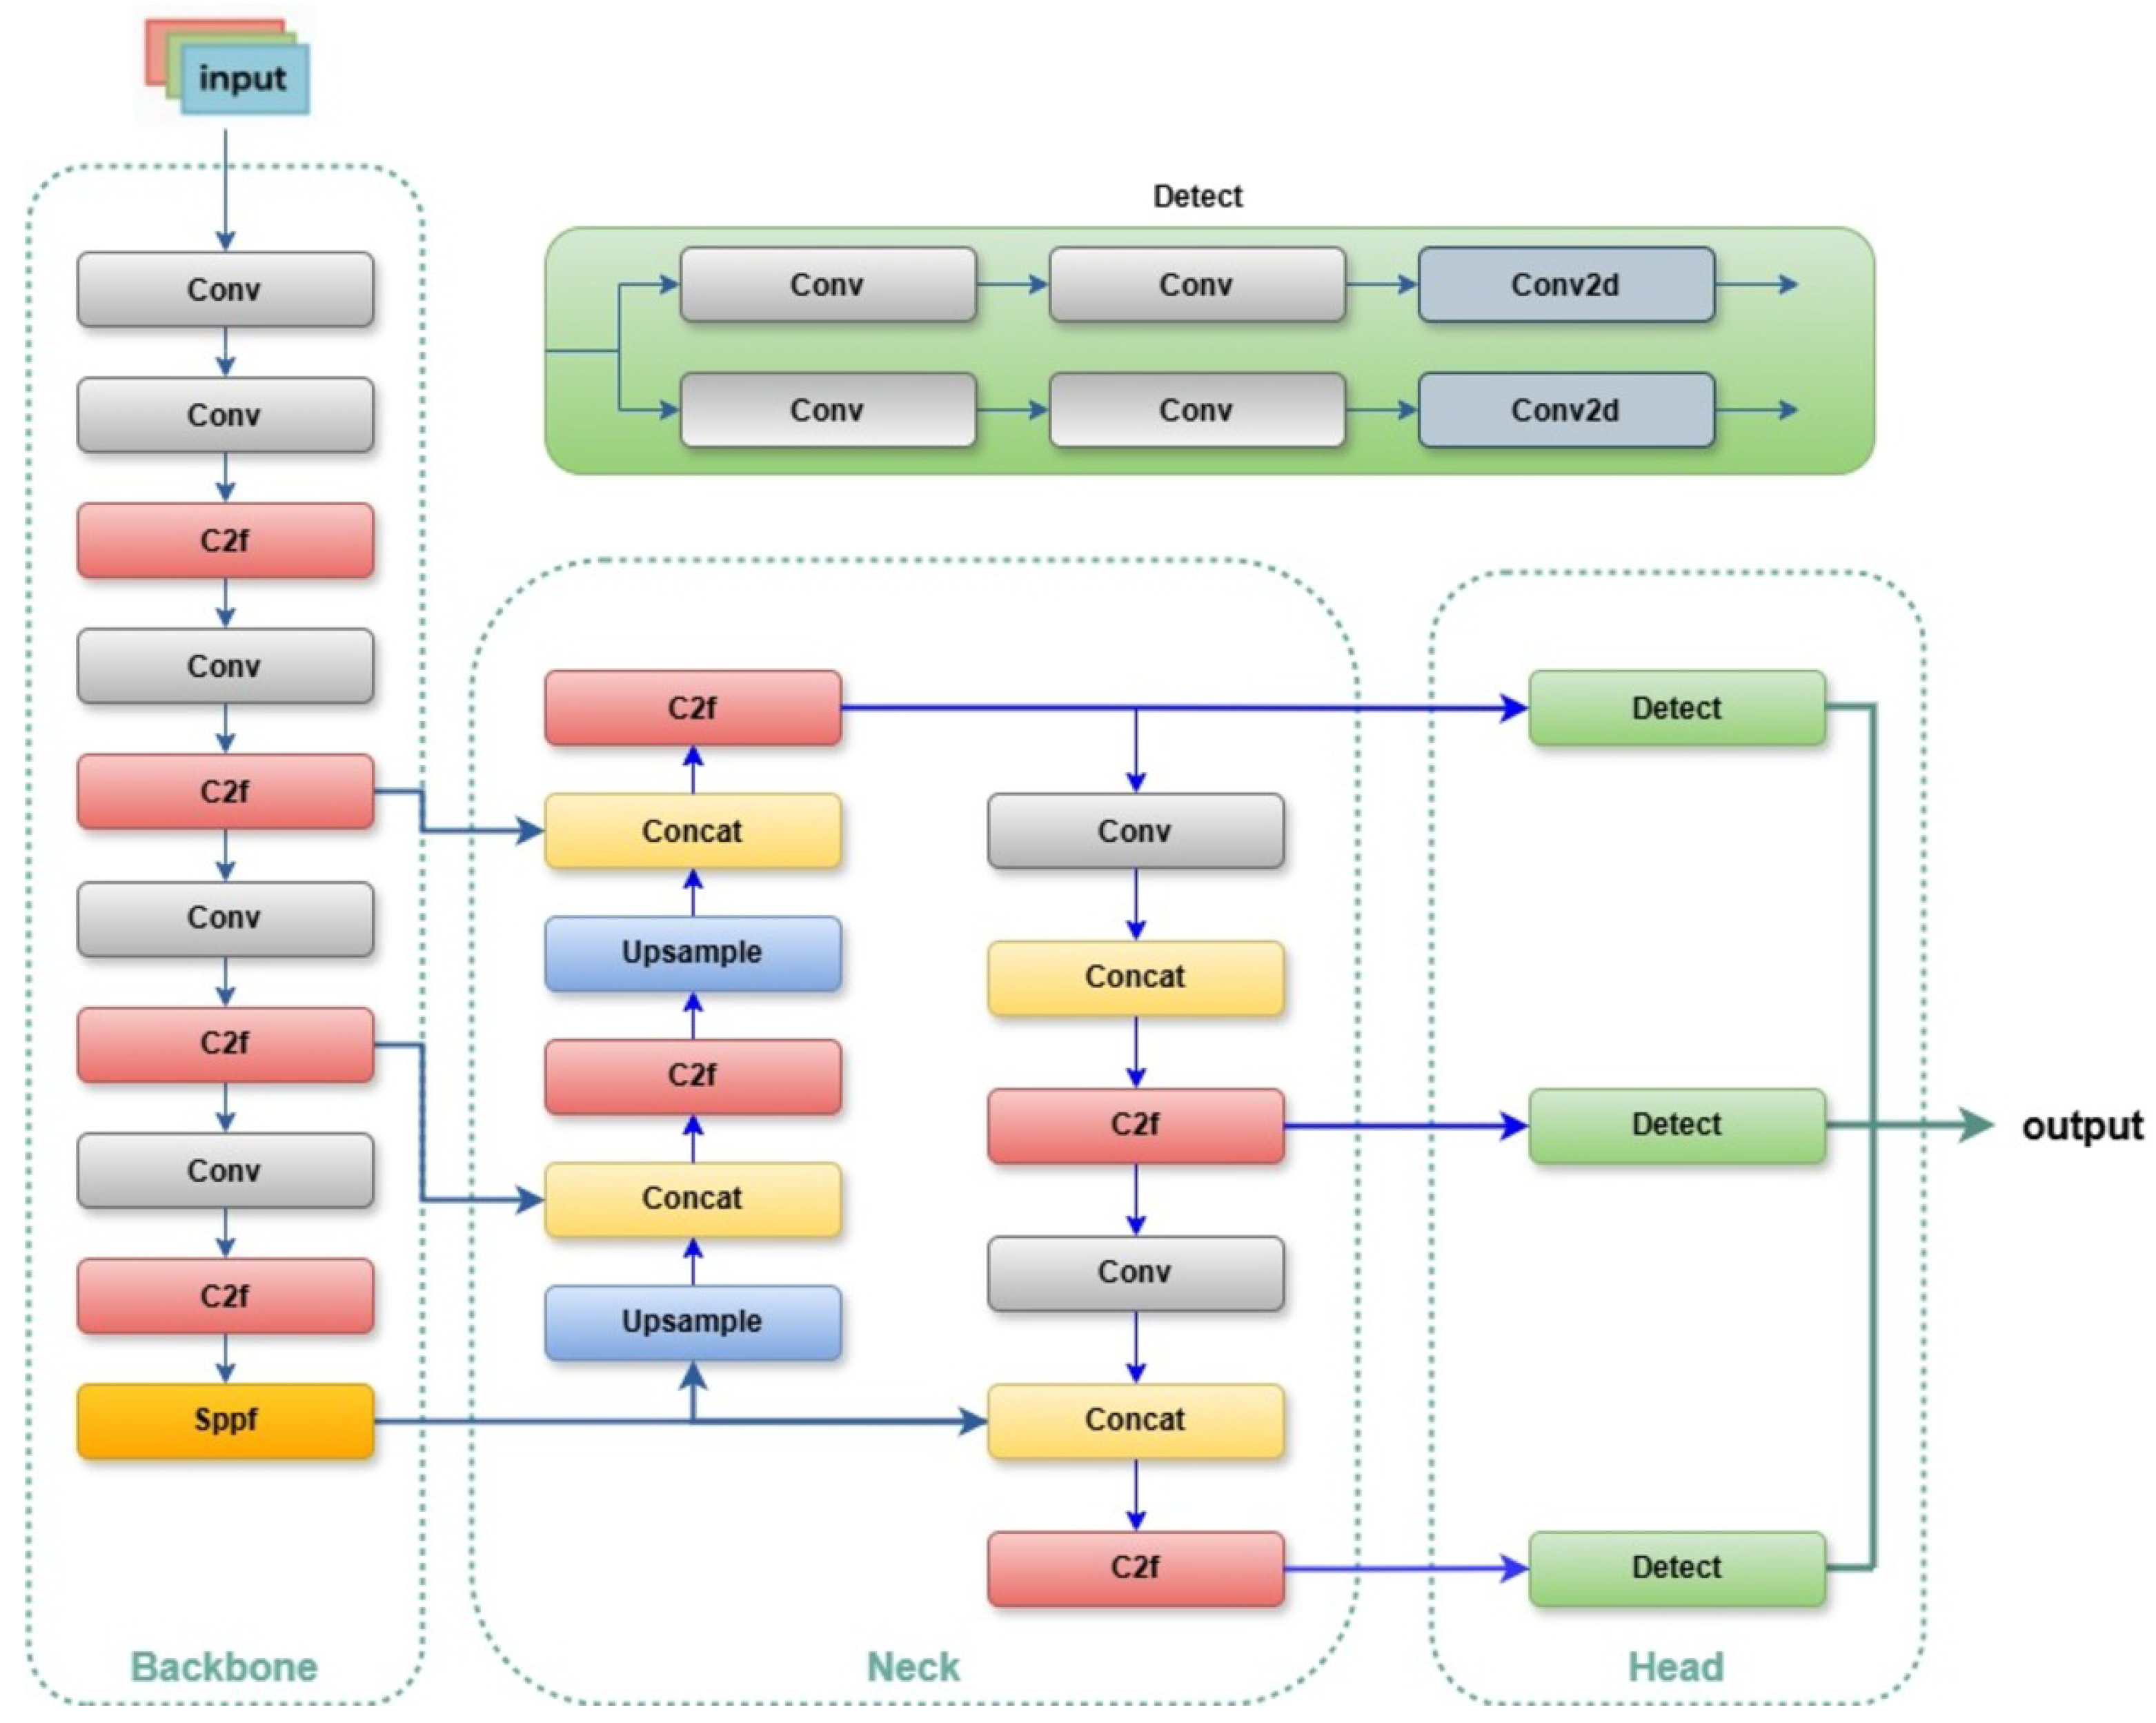
As a reference model, we employ YOLOv8x as the baseline detector using the Ultralytics implementation [
17]. The baseline architecture consists of three main components: a CSP-Darknet backbone for feature extraction, a PAN-FPN-style neck for multi-scale feature aggregation (conceptually aligned with feature pyramid and path aggregation designs) [
29,
30,
31], and a detection head operating at three spatial resolutions. The architecture is illustrated in
Figure 5.
The baseline performance used for comparison in this study is taken from our prior work conducted on the same dataset [
32]. In that evaluation, the YOLOv8x model achieved 0.891 precision, 0.867 recall, and 0.898 mAP@50 for bacterial microcolony detection. However, despite its competitive performance, we found that the achieved detection accuracy was not sufficient to meet the expected reliability for early-stage bacterial screening. In particular, additional improvements were necessary to increase detection sensitivity and achieve higher overall accuracy under challenging microscopy conditions. These observations motivated us to systematically redesign the architecture by replacing the original backbone and evaluating alternative feature fusion strategies to improve detection performance.
3.2.3. EfficientNetV2 Backbone Integration
To assess the effect of backbone design on bacterial detection performance, we replace the CSP-Darknet backbone with EfficientNetV2 [
19]. EfficientNetV2 employs compound scaling across depth, width, and resolution, and integrates MBConv and Fused-MBConv blocks with squeeze-and-excitation mechanisms, enabling strong feature extraction with improved parameter efficiency. The EfficientNetV2 backbones were initialized with pretrained weights, while the newly introduced neck and detection layers were randomly initialized. The complete detection models were then fine-tuned end-to-end on the microscopy dataset under identical training settings for all variants. We evaluate three EfficientNetV2 variants: small (S), medium (M), and large (L). For each variant, intermediate feature maps corresponding to effective strides of approximately 8, 16, and 32 are extracted and aligned with the detection pipeline. These feature maps serve as inputs to the neck or, in certain configurations, directly to the detection head. All EfficientNetV2 backbones are trained under identical experimental conditions using the standard YOLOv8 training pipeline, ensuring a fair and controlled comparison across all architectures while accounting for domain differences between natural image and microscopy data.
3.2.4. Neck Design Variants
To isolate the role of feature fusion, we investigate three neck configurations.
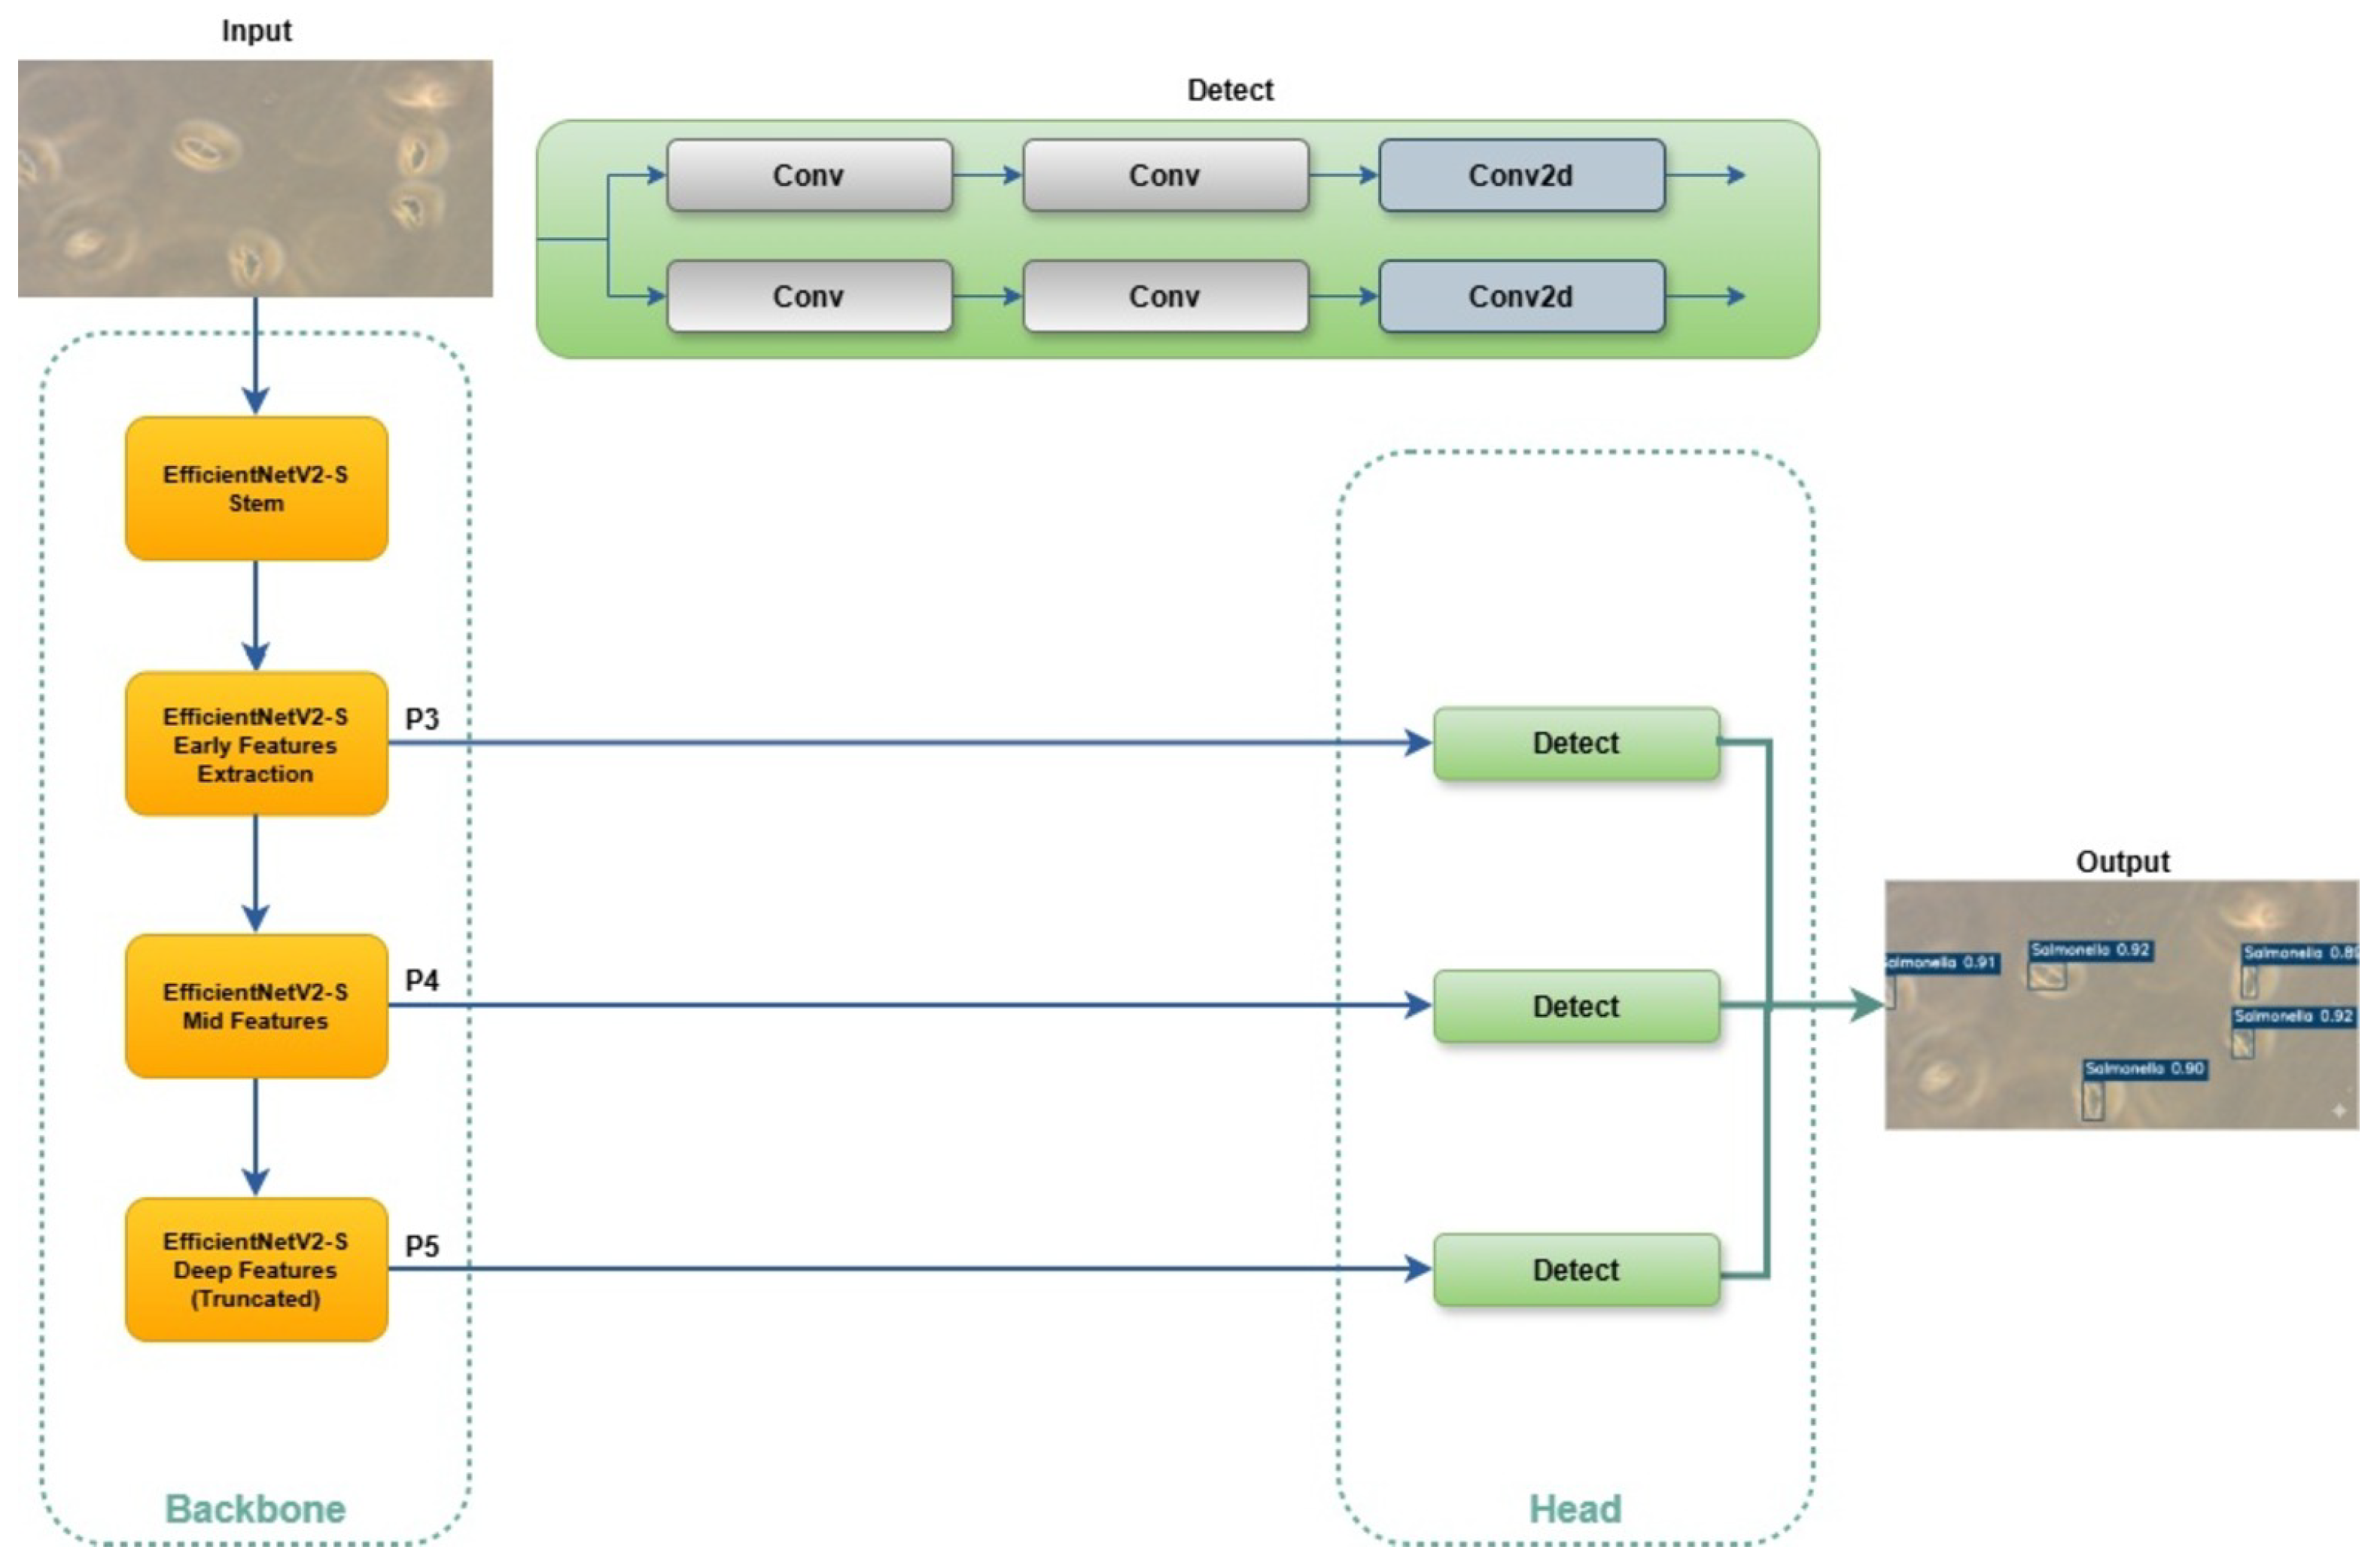
No-Neck Configuration
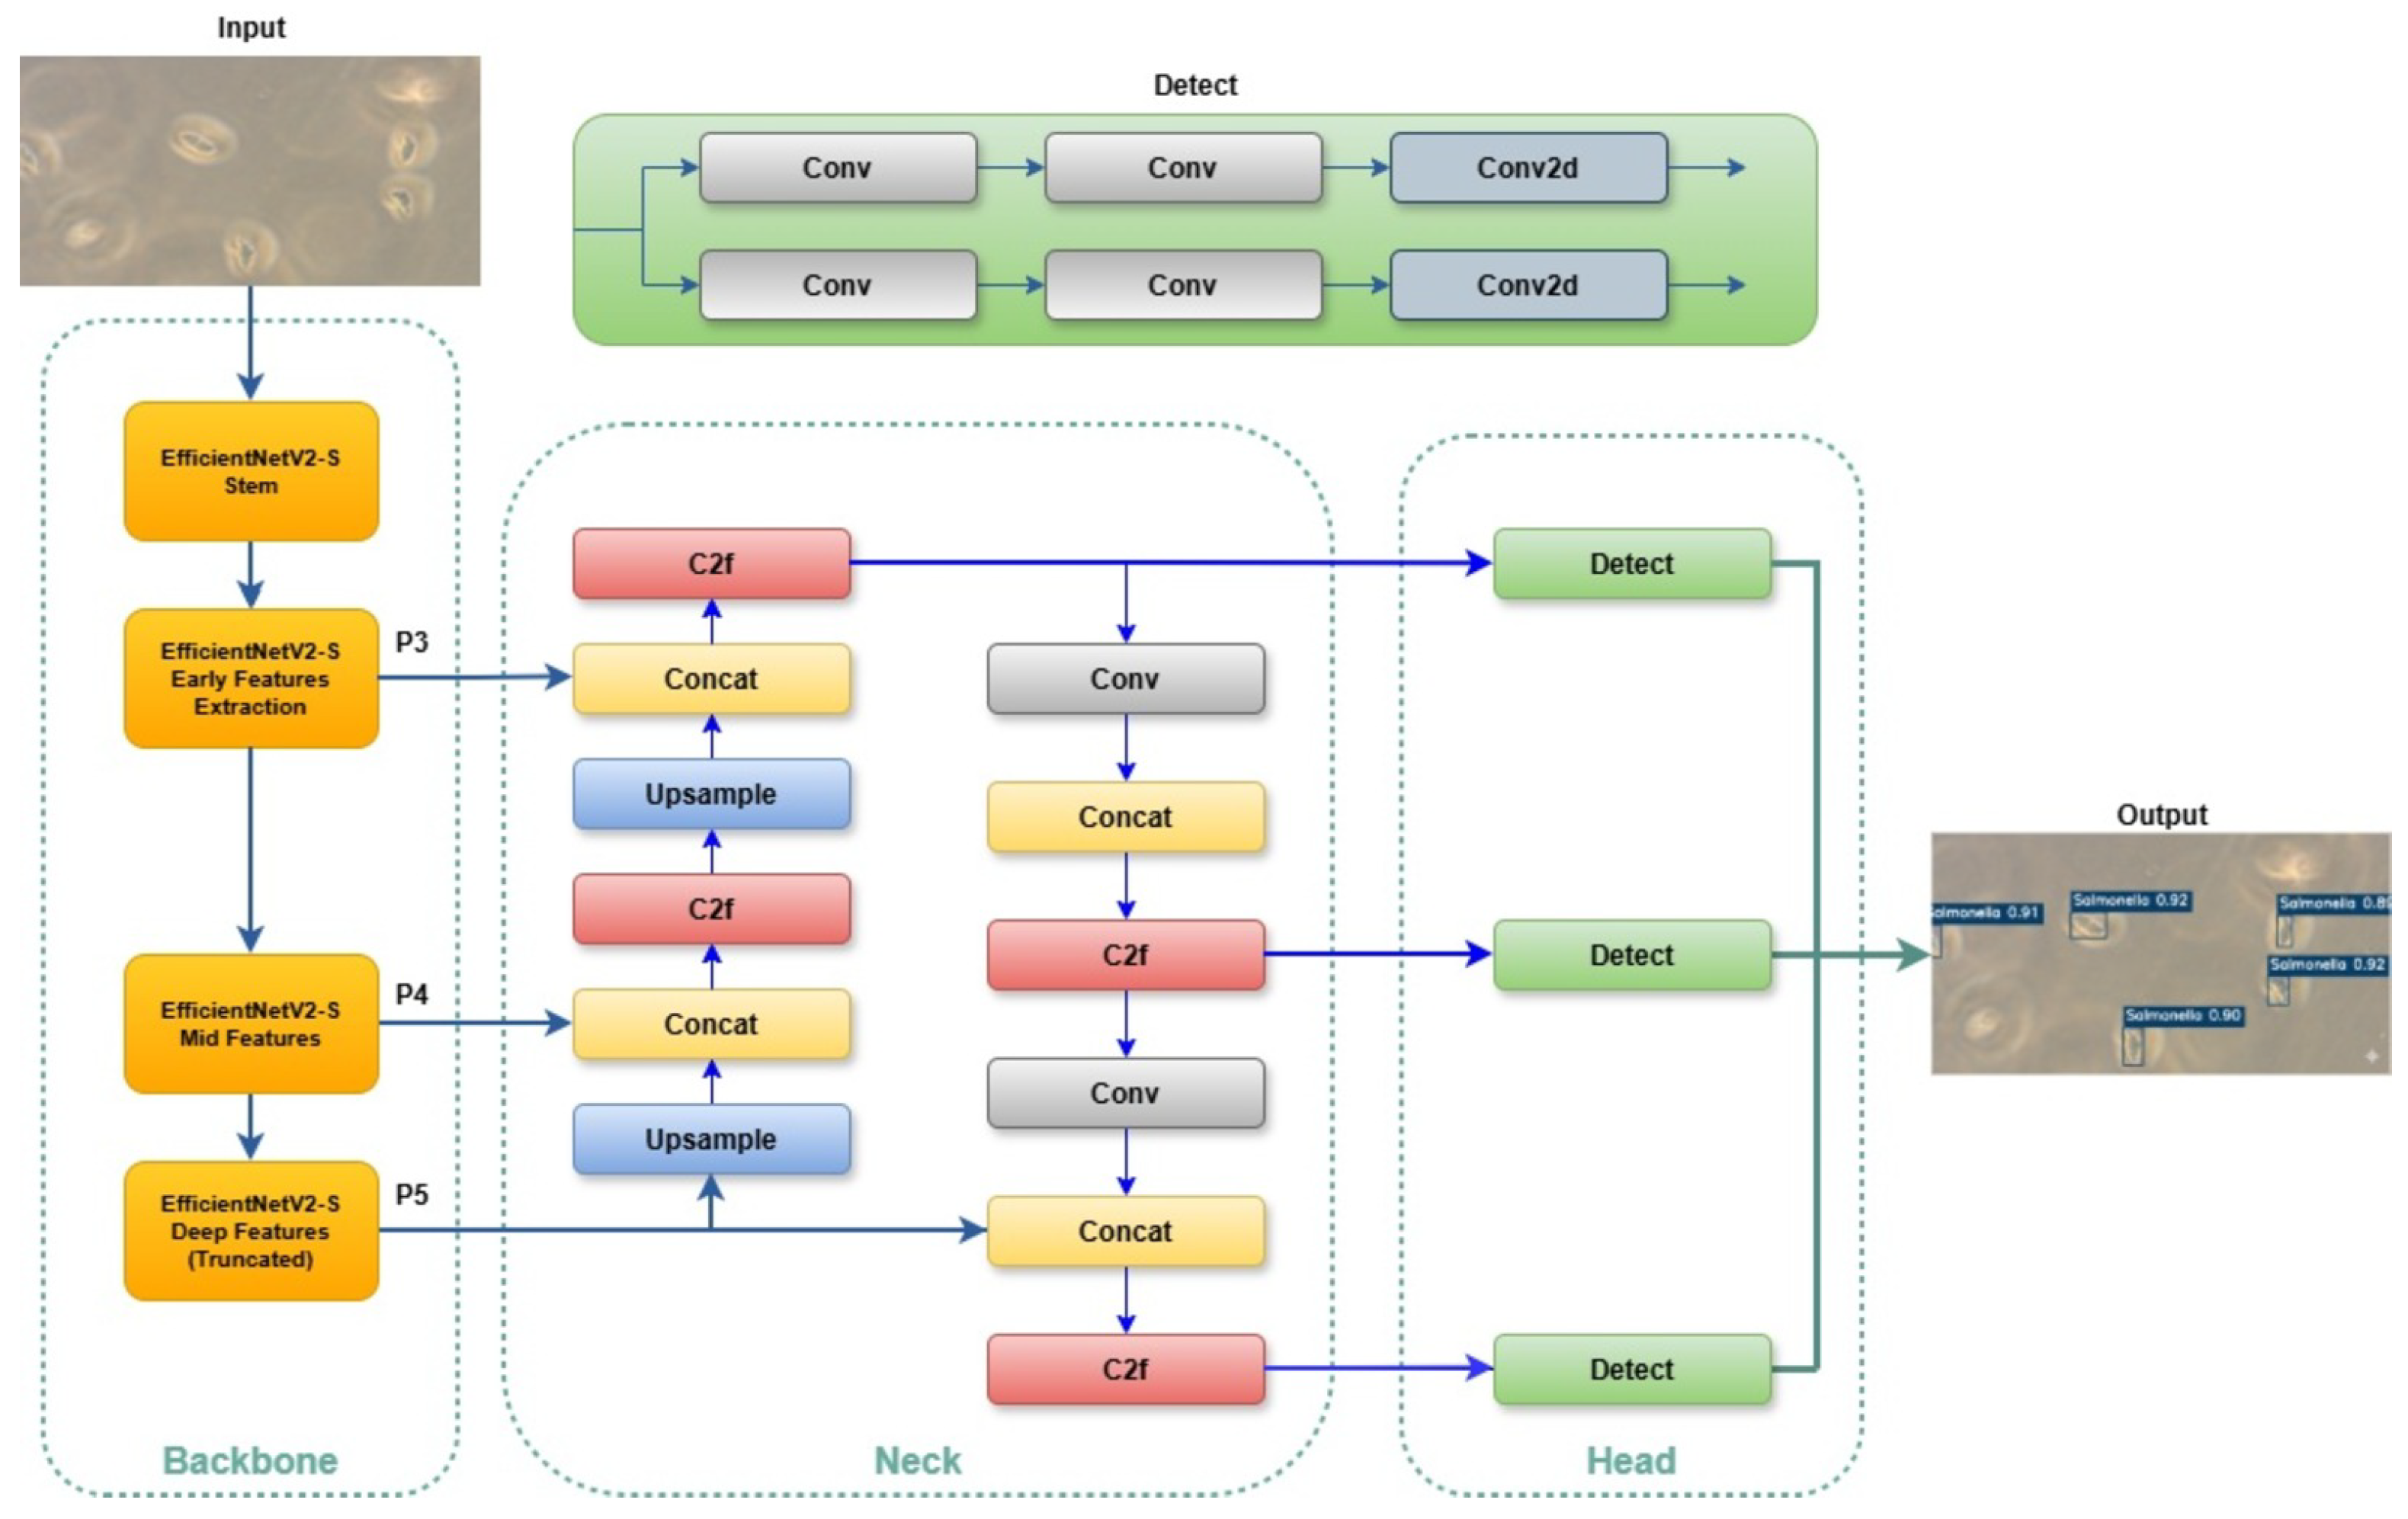
In the no-neck configuration, the feature pyramid is entirely removed. Backbone feature maps are passed directly to the detection head without intermediate fusion or refinement. This architecture is illustrated in
Figure 6. This configuration intentionally deviates from modern detector design and serves as a stress test to assess the necessity of explicit multi-scale aggregation. While it simplifies the architecture, it eliminates cross-scale contextual interactions that are typically critical for detecting small and faint objects such as early-stage microcolonies.
YOLOv8 PAN-FPN Neck with EfficientNetV2
In this configuration, the standard YOLOv8 PAN-FPN neck is retained while replacing the backbone with EfficientNetV2. Feature maps extracted at multiple scales are fused using bidirectional pathways with concatenation and convolutional refinement. The resulting architecture is shown in
Figure 7. This design preserves YOLOv8’s original detection pipeline and enables a controlled comparison between CSP-Darknet and EfficientNetV2 backbones under identical neck and head conditions.
NAS-FPN-Inspired Neck
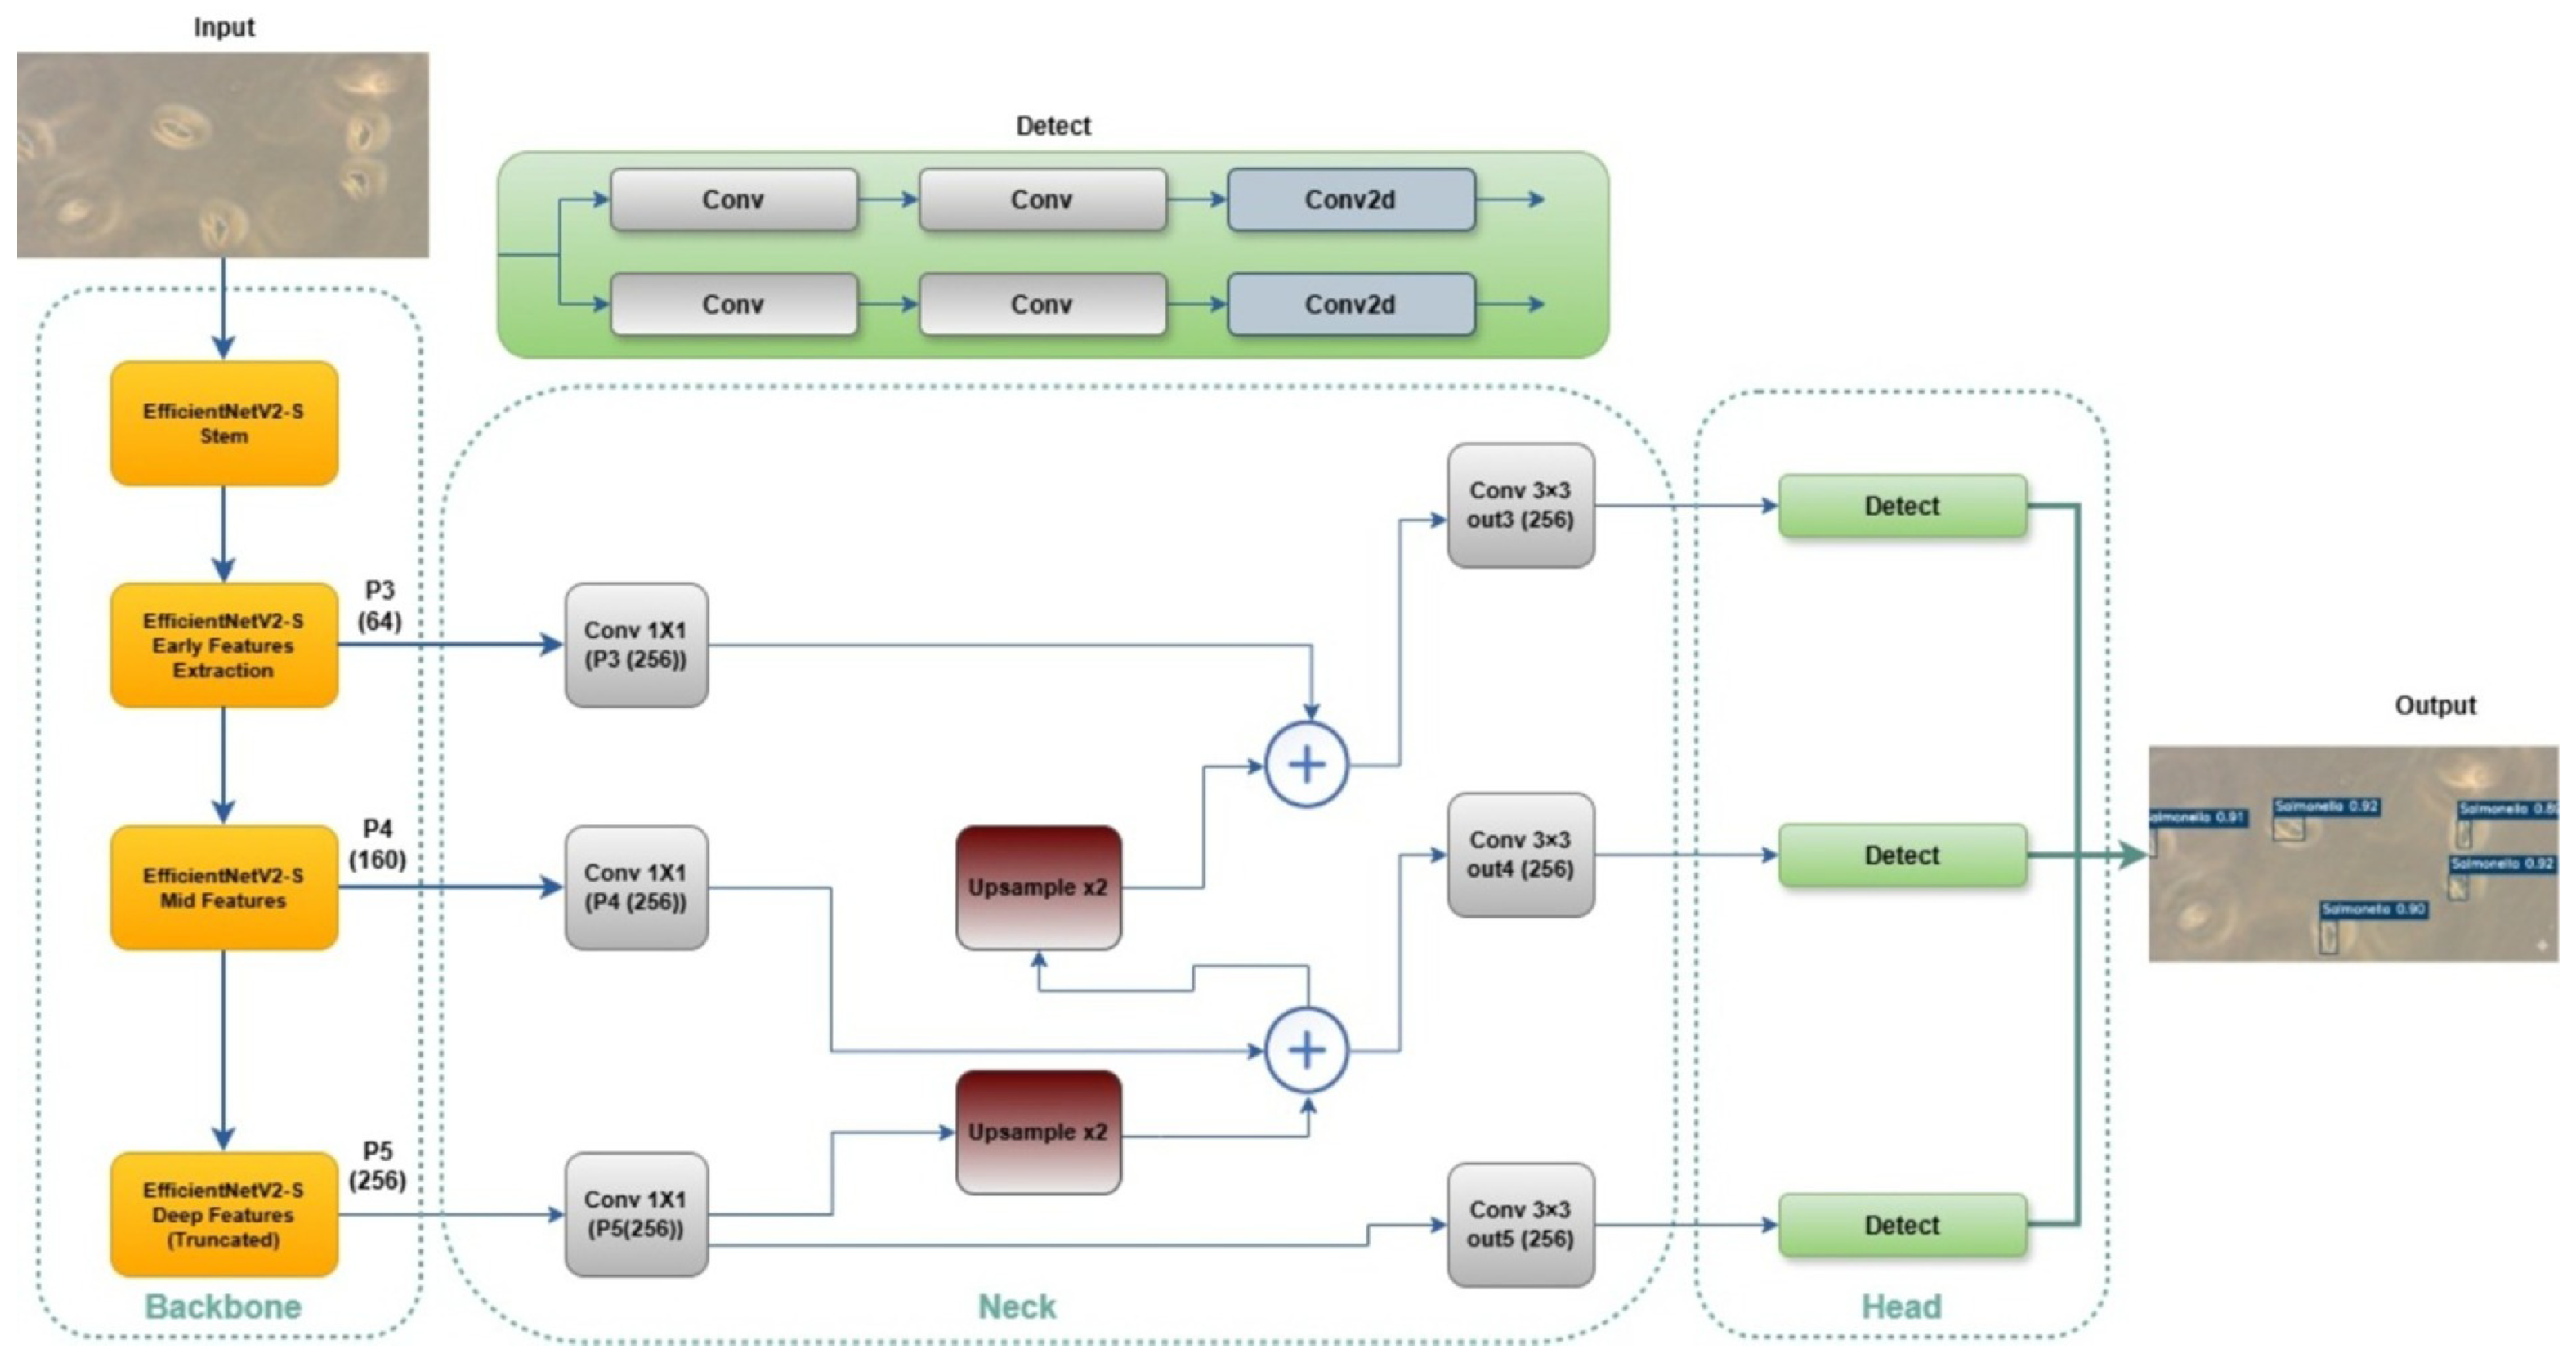
In the third configuration, we replace the PAN-FPN neck with a NAS-FPN-inspired design. Backbone feature maps are first projected to a uniform channel dimension using
convolutions, followed by summation-based multi-scale fusion and convolutional refinement. The feature fusion process operates on three pyramid levels corresponding to backbone feature maps with approximate strides of 8, 16, and 32. Each feature map is first projected to a common channel dimension using
convolution for alignment. Multi-scale fusion is then performed through element-wise summation across scales, followed by
convolutional layers for feature refinement. Unlike full NAS-FPN or BiFPN implementations, the fusion weights are not learned but fixed, resulting in a simplified and computationally efficient design. This approach preserves the key idea of bidirectional information flow across feature scales while maintaining consistency with the controlled experimental setting of this study. This architecture is illustrated in
Figure 8. Although manually designed, it follows key design principles of NAS-FPN and BiFPN architectures, emphasizing efficient bidirectional information flow across scales [
33,
34].
3.2.5. Training Strategy and Convergence Analysis
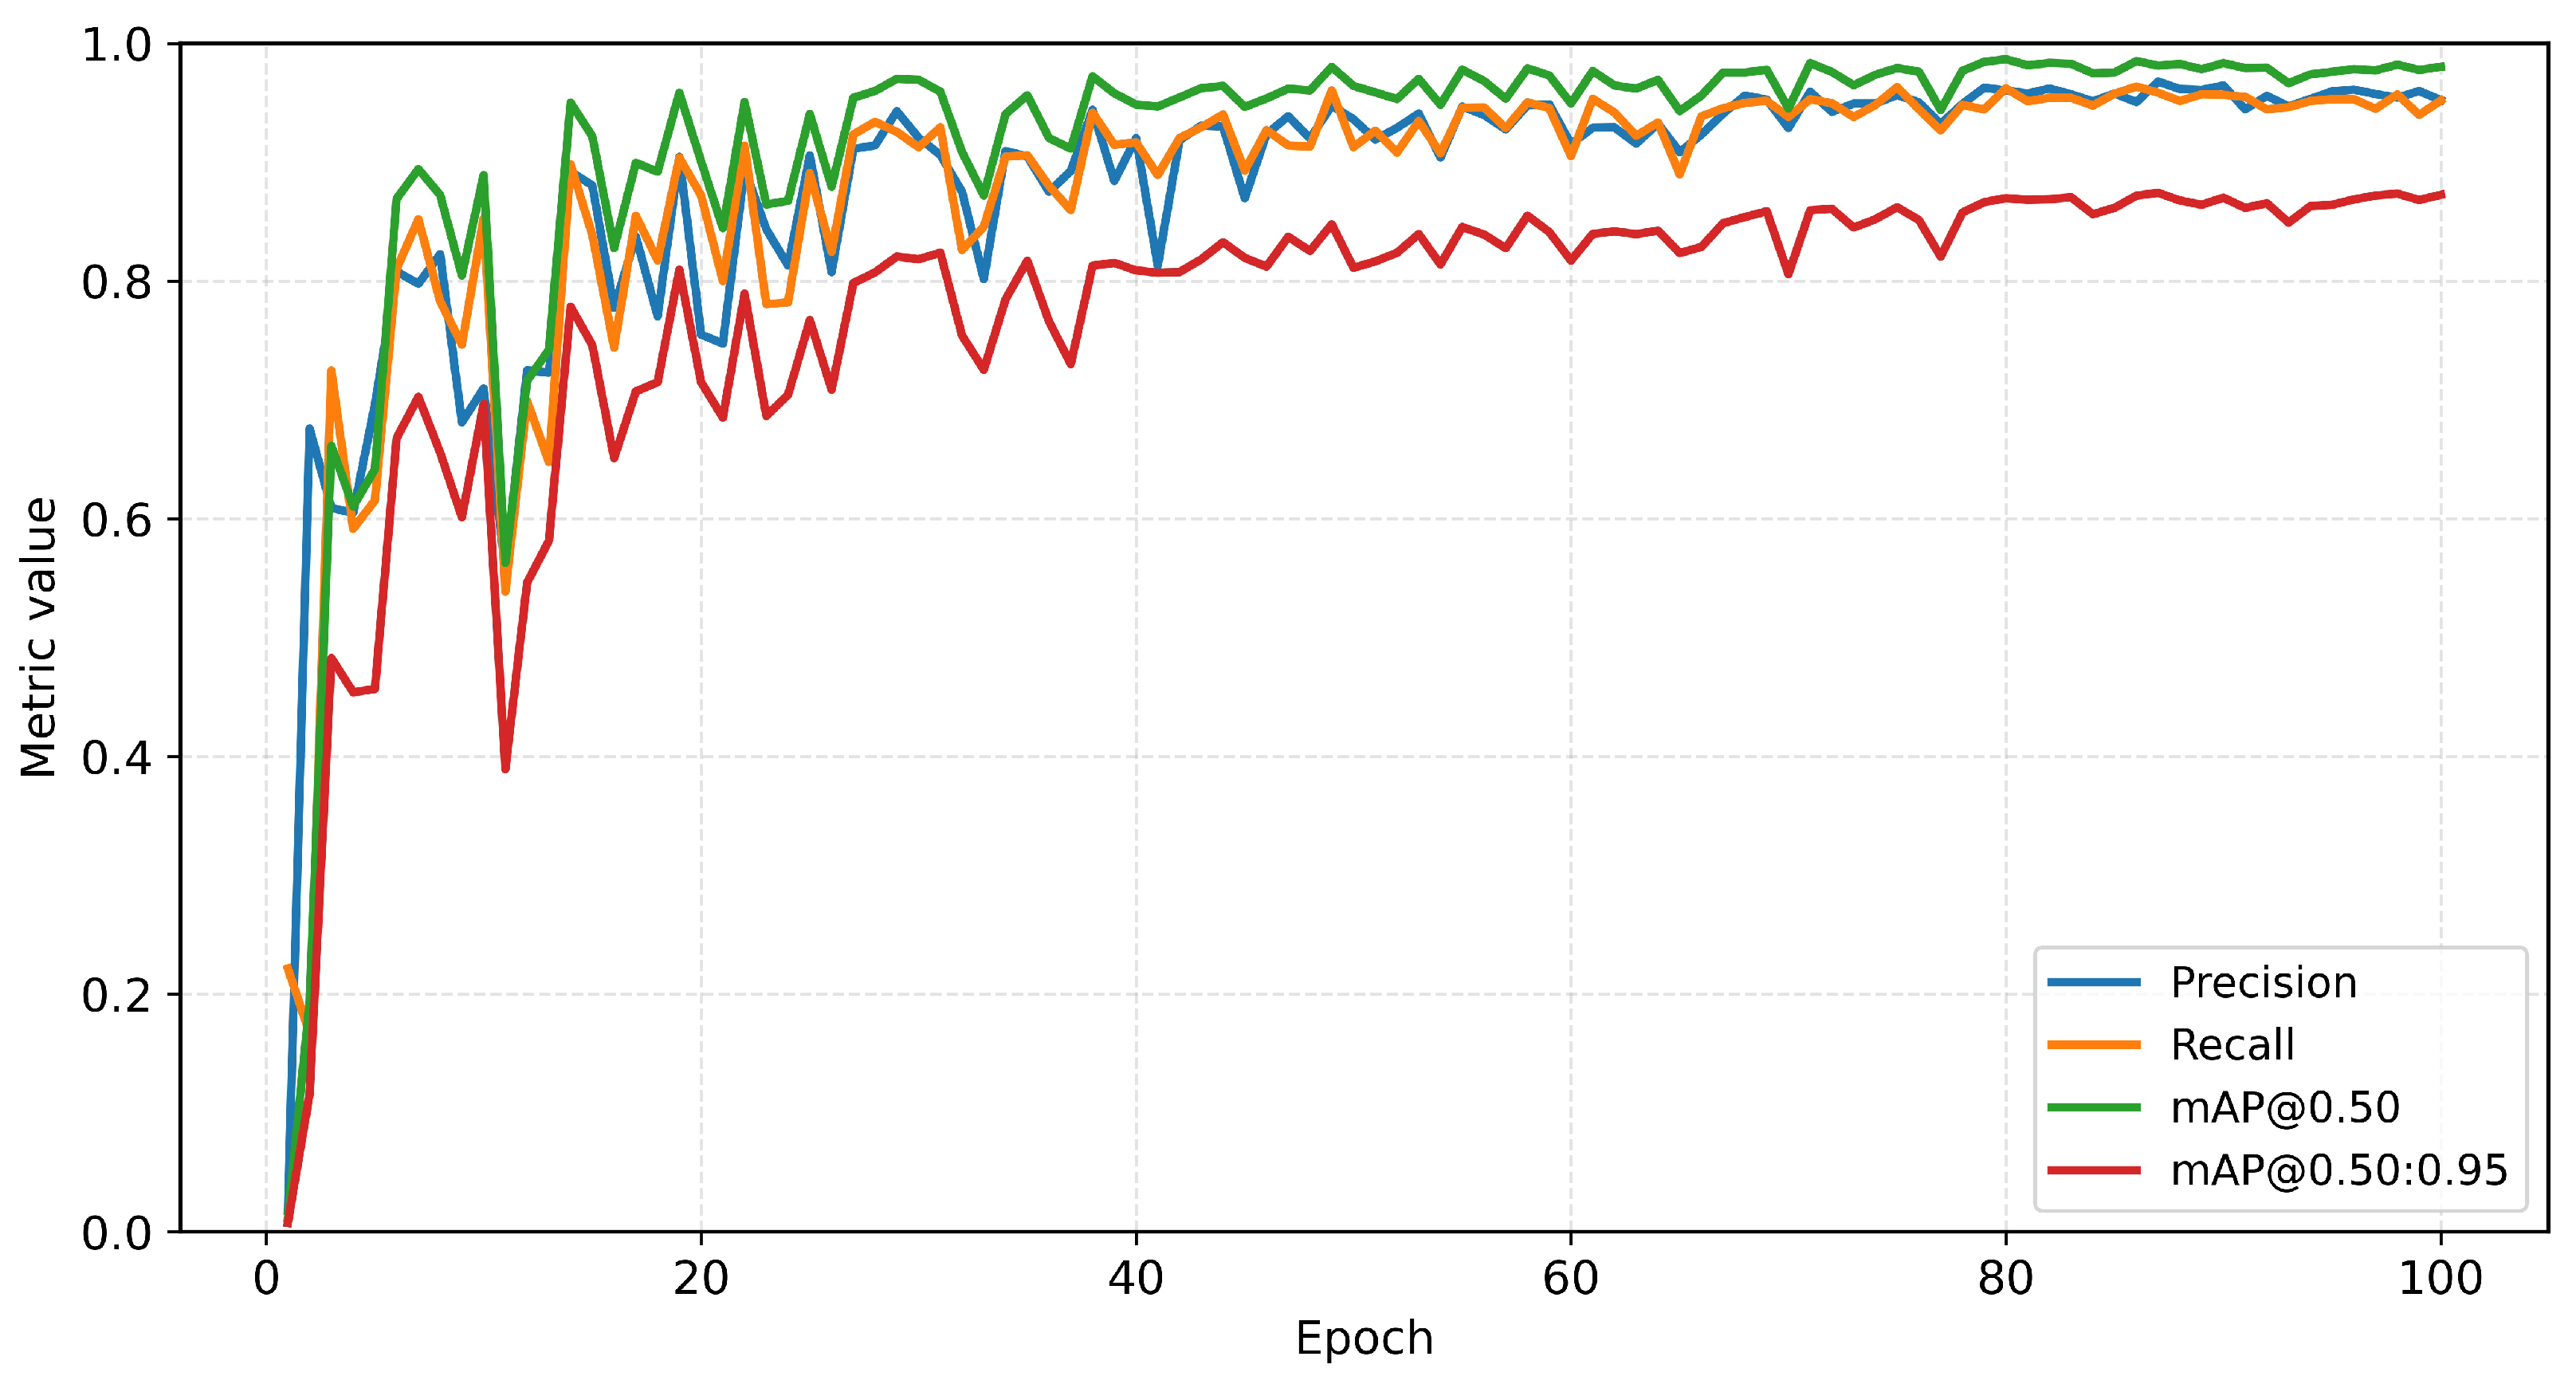
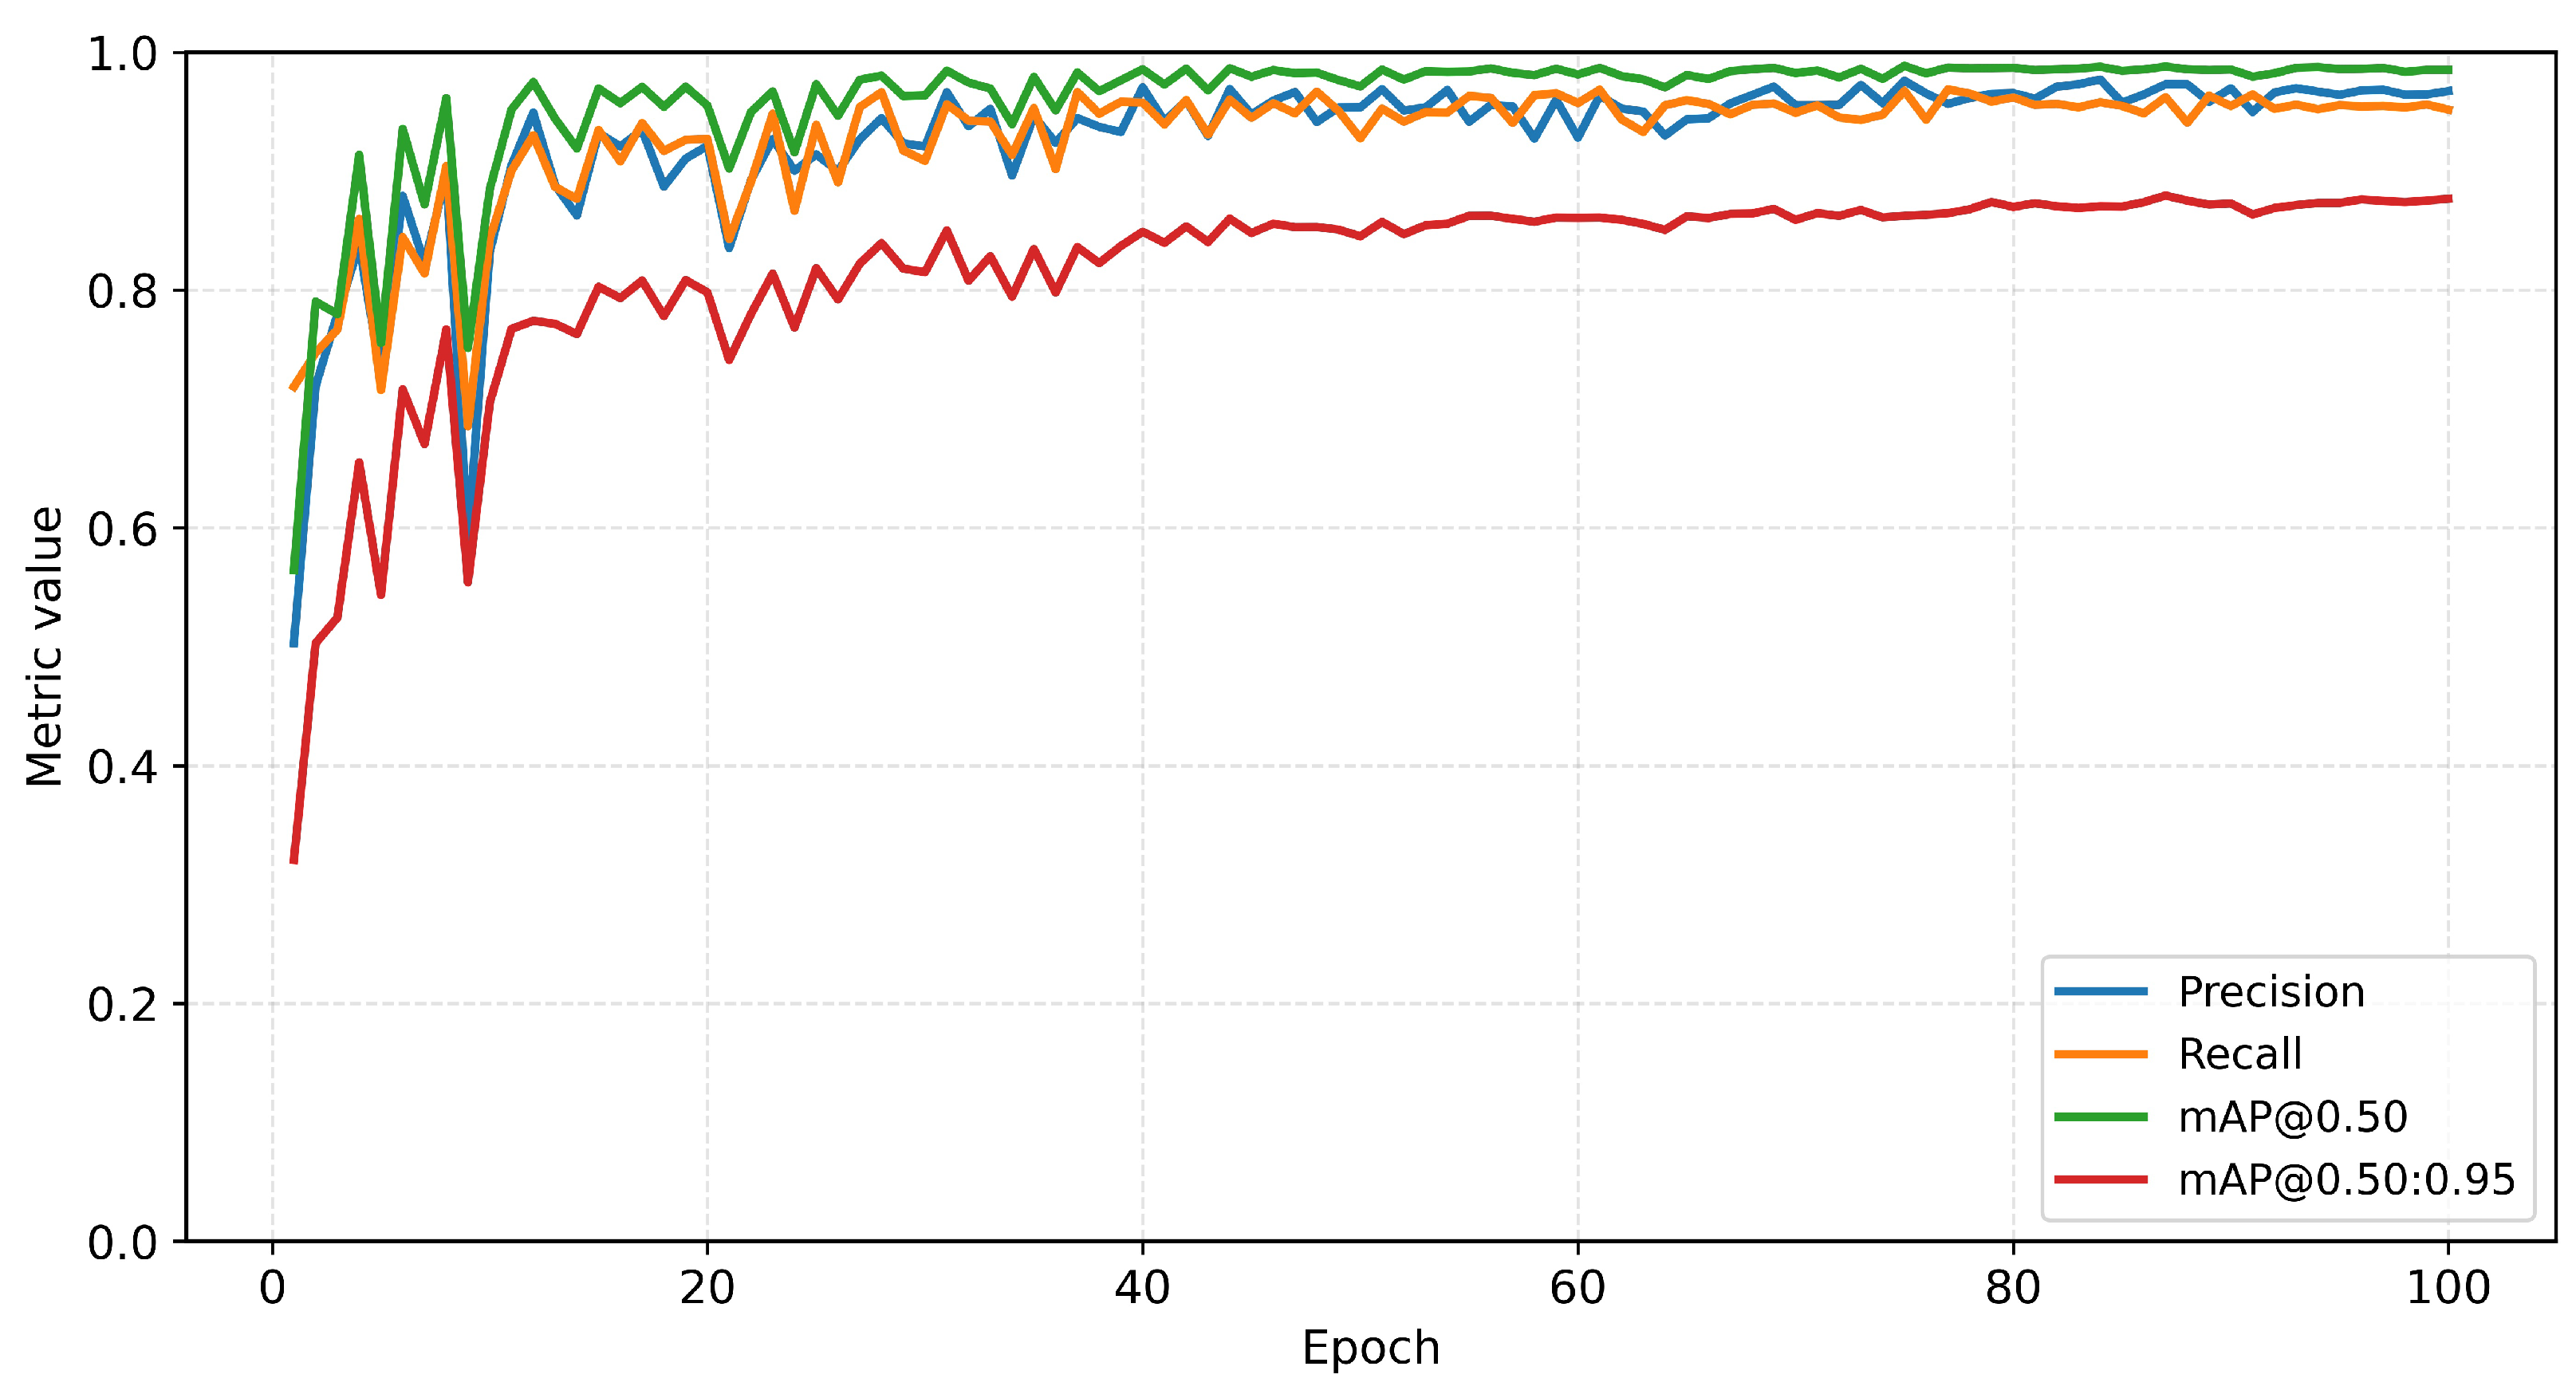
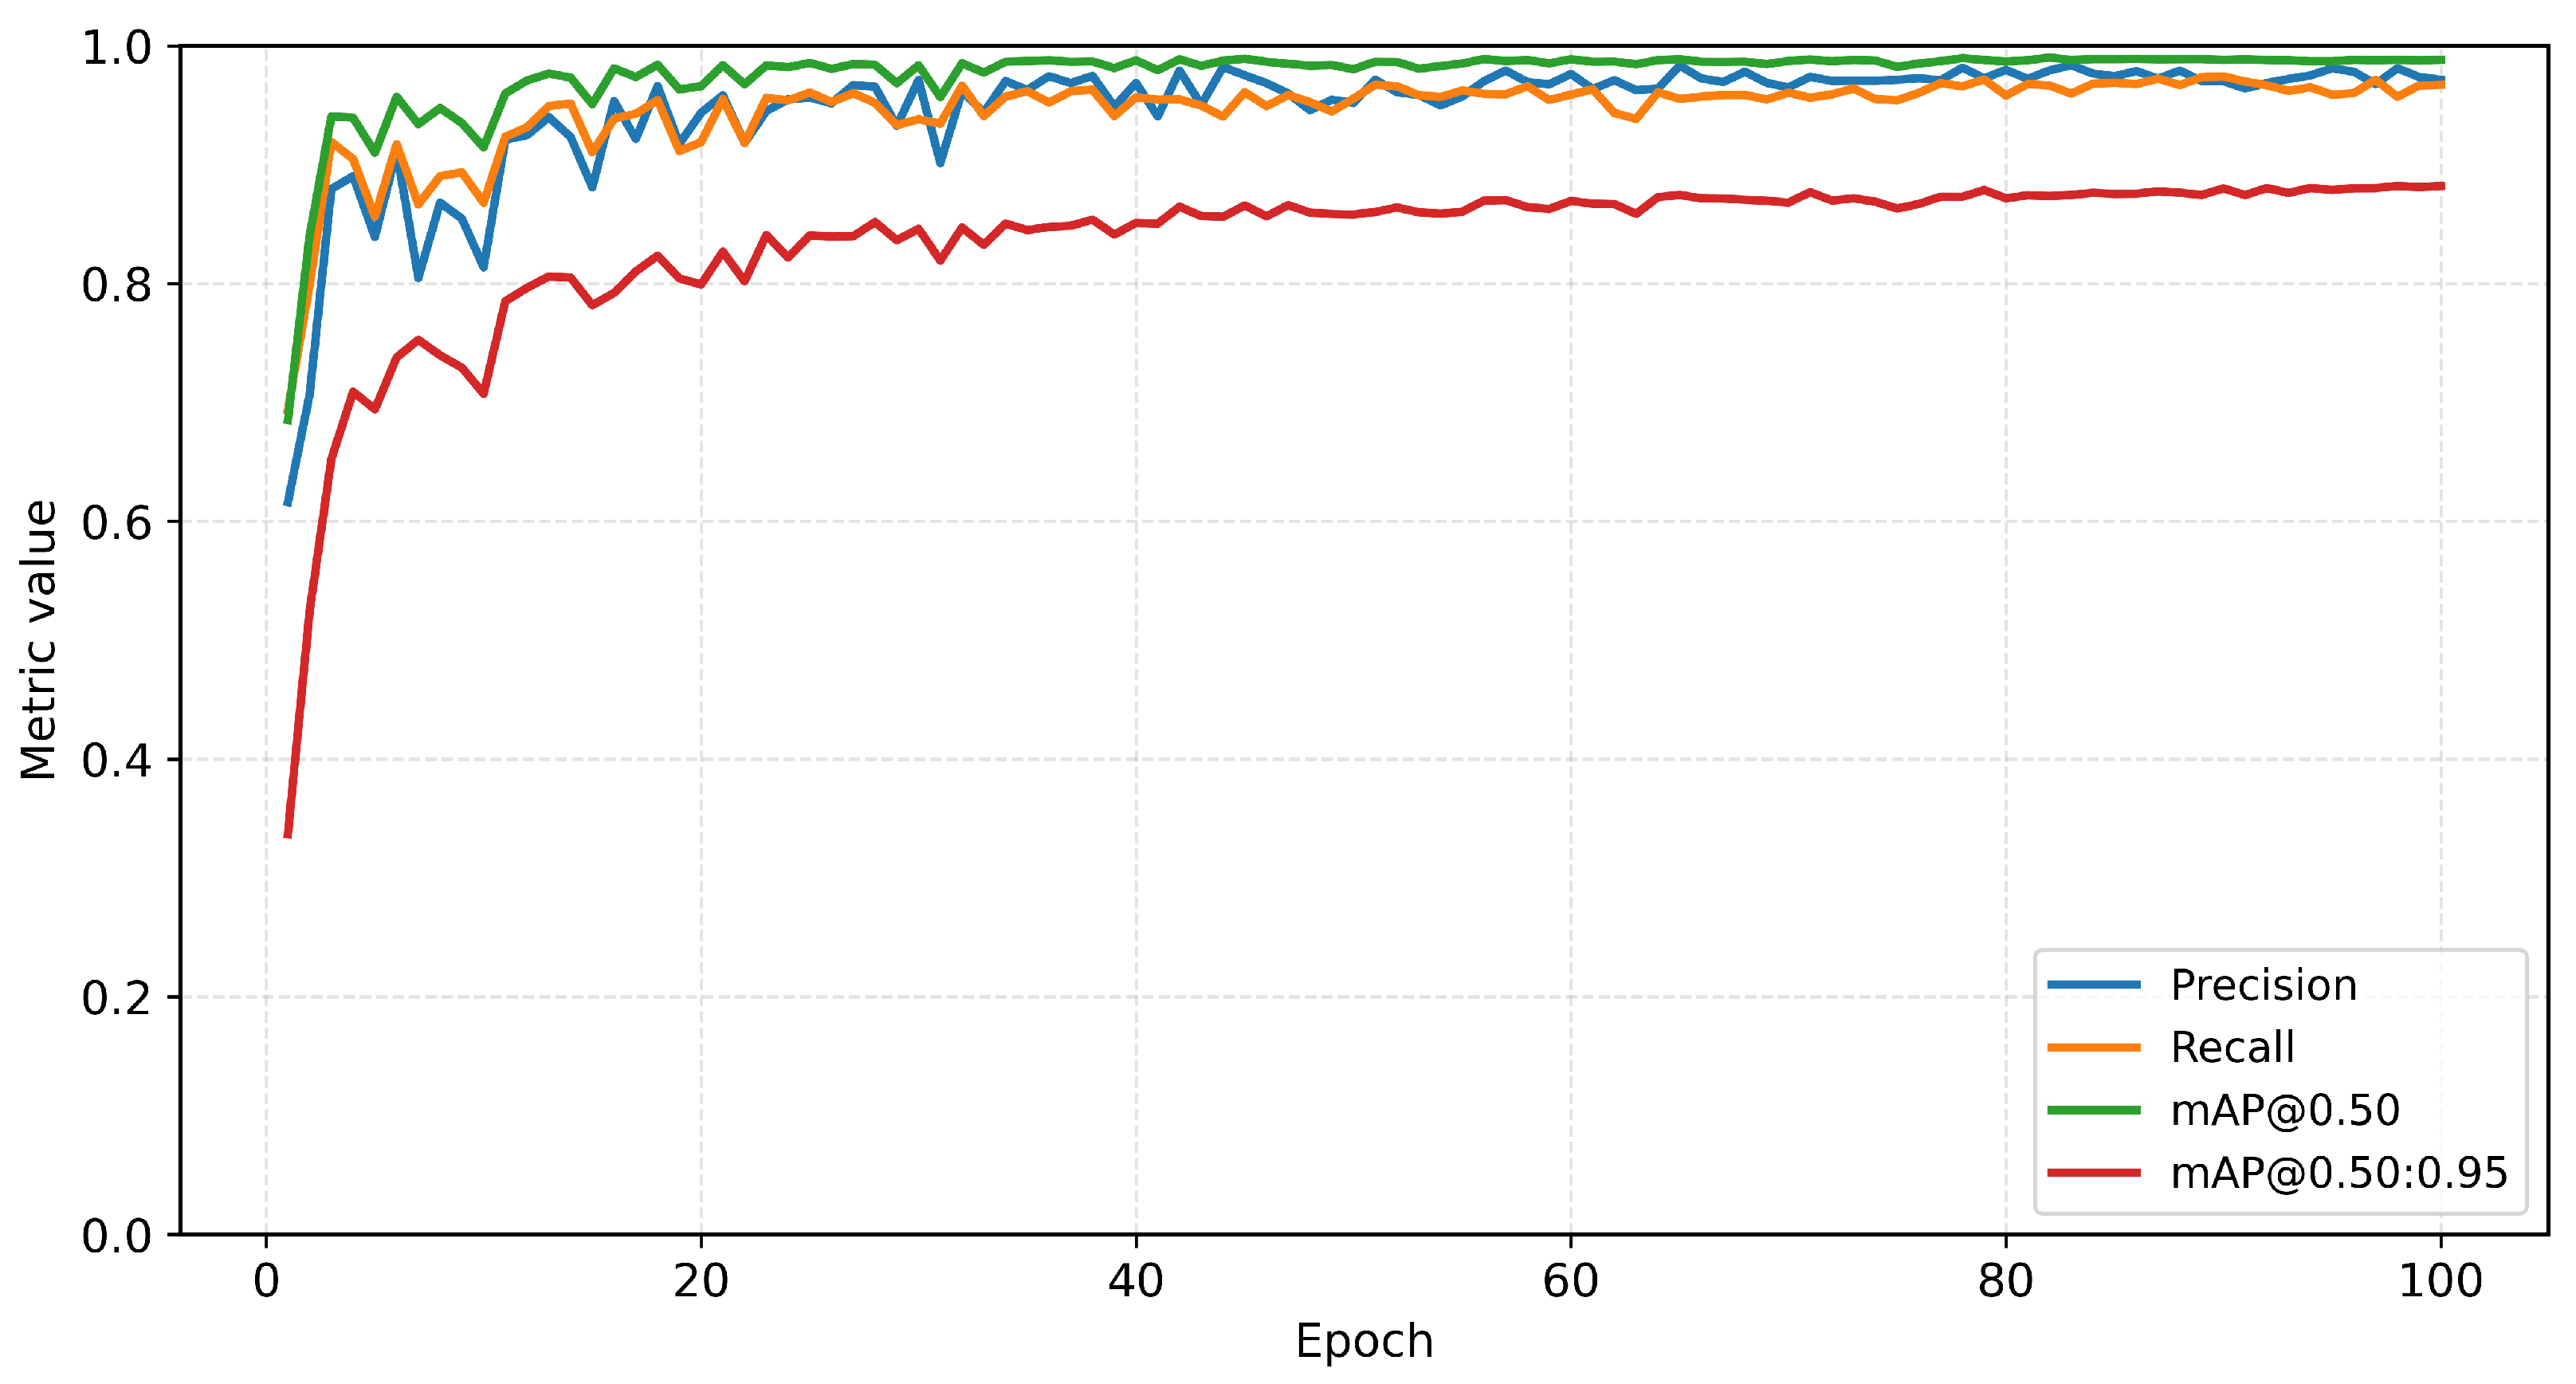
We train all models under identical experimental settings, including dataset splits, input resolution, batch size, optimizer configuration, learning rate schedule, and number of epochs. This strict control ensures that architectural differences are the sole source of performance variation. We monitor training dynamics using loss curves and validation metrics over epochs. Representative training and validation trajectories for the baseline, EfficientNetV2-S with PAN-FPN, and EfficientNetV2-L with NAS-FPN are shown in
Figure 9,
Figure 10 and
Figure 11, respectively. These curves confirm stable convergence behavior across all architectures and indicate no training instability introduced by the proposed modifications.
3.2.6. Evaluation Metrics and Error Analysis
We evaluate detection performance using precision, recall, and mAP@0.50. The mAP@0.50 metric summarizes localization accuracy under a standard IoU criterion, while precision and recall are emphasized when discussing deployment considerations in safety-critical foodborne pathogen detection. In particular, recall is prioritized for Salmonella detection, where false negatives carry higher risk than isolated false positives. From an application standpoint, the evaluated design choices directly shape the false positive/false negative balance, enabling deployment configurations that prioritize screening sensitivity (minimizing missed microcolonies) or operational workload (minimizing spurious detections) depending on food safety requirements.
Precision, Recall, and F1
Let , , and denote true positives, false positives, and false negatives at a fixed IoU criterion and confidence threshold. Precision, recall, and F1 are reported following their standard definitions and are used to characterize detection accuracy, error characteristics, and confidence threshold behavior.
Average Precision and Mean Average Precision
For each class, average precision (AP) is computed as the area under the precision–recall curve:
where
denotes precision as a function of recall and
represents the interpolated precision. The mean average precision at IoU 0.50 (mAP@0.50) is obtained by averaging AP across all classes under a fixed intersection-over-union threshold of 0.50, providing a standardized measure of localization accuracy suitable for microscopy-based detection tasks.
Deployment-oriented efficiency metrics, including latency and frames per second (FPS), are reported separately in
Section 4 using end-to-end measurements that include preprocessing and postprocessing. To support detailed error analysis and confidence threshold robustness assessment, normalized confusion matrices and F1–confidence curves are reported in
Section 4. Confusion matrices characterize class-wise misclassification behavior and false positive/false negative patterns, while F1–confidence curves summarize the precision–recall trade-off as a function of the detection confidence threshold. Varying the threshold
induces a family of operating points
, enabling the identification of stable decision regions suitable for safety-critical bacterial screening.
3.2.7. Model Complexity and Inference Speed Measurement
We quantify model efficiency using four complementary metrics: the number of parameters, floating-point operations (FLOPs), end-to-end inference latency (ms/image), and frames per second (FPS). For the YOLOv8-based architectures, efficiency measurements were obtained using the Ultralytics framework under consistent experimental settings. For Faster R-CNN and RetinaNet, the reported efficiency values were obtained separately under matched hardware conditions for reference comparison, ensuring comparable evaluation across architectures [
17]. The number of parameters corresponds to the total count of learnable weights in the model and is reported in millions (M) as provided by the Ultralytics model summary. FLOPs represent the computational complexity of a single forward pass and are reported in billions (G), assuming an input resolution of
pixels and batch size equal to one. We measure inference latency using the Ultralytics speed profiler, including preprocessing, forward-pass inference, and postprocessing (e.g., NMS). The end-to-end latency is
and throughput is computed as
with
measured in milliseconds. Reporting end-to-end FPS reflects realistic deployment conditions and avoids overestimating throughput by excluding auxiliary processing stages.
We perform all efficiency measurements with a batch size equal to one, an input resolution of , and identical hardware configuration across all models.
4. Results
This section presents quantitative and qualitative evaluation results on the held-out test split. The analysis focuses on overall detection performance in terms of precision, recall, and mAP@50, as well as class-wise error behavior, robustness across confidence thresholds, and visual detection quality across early bacterial growth stages. Particular attention is given to the impact of backbone and feature fusion design choices on detection accuracy and robustness in challenging microscopy conditions.
4.1. Overall Detection Performance
Table 1 reports test-split performance for the baseline YOLOv8x model and the EfficientNetV2-based architectural variants, with metrics computed over all classes to reflect realistic deployment conditions involving class imbalance and background clutter.
Replacing the CSP-Darknet backbone with EfficientNetV2 consistently improves detection performance across most configurations. Relative to the YOLOv8x baseline reported in recent work [
32] (Precision = 0.891, Recall = 0.867, and mAP@50 = 0.898), all EfficientNetV2-based models achieve higher precision, recall, and mAP@50, demonstrating the benefit of stronger feature extraction for microscopy-based bacterial detection. To provide a more comprehensive assessment of localization quality, we also evaluate performance using mAP@50–95. The EfficientNetV2-based models demonstrate consistent improvements in this metric, with the highest score of 0.888 achieved by the EffNetV2-L + NAS-FPN configuration. Architectures that incorporate an explicit feature fusion neck generally yield stronger mAP@50–95 results than their no-neck counterparts, indicating that multi-scale feature aggregation improves detection robustness across stricter IoU thresholds.
Architectures that retain an explicit feature fusion neck substantially outperform their no-neck counterparts across all metrics. Removing the neck leads to consistent reductions in recall and mAP@50, indicating a decreased sensitivity to small and low-contrast bacterial microcolonies and reduced robustness to background clutter. Among the evaluated models, the EfficientNetV2-S configuration with the original YOLOv8 neck achieves the strongest overall balance, attaining the highest recall (0.968) and the highest mAP@50 (0.987). Larger EfficientNetV2 variants further improve precision, with the EfficientNetV2-L model combined with a NAS-FPN-inspired neck achieving the highest precision value (0.978), albeit with a modest reduction in recall. These results indicate that optimal detection performance arises from a trade-off between precision and recall that is governed by the interaction between backbone capacity and feature fusion design rather than backbone scaling alone. The observed gains in precision correspond to a reduction in false positive detections in cluttered microscopy backgrounds, while improvements in recall indicate fewer missed bacterial microcolonies, directly enhancing screening sensitivity at early growth stages.
4.2. Computational Efficiency and Throughput Analysis
In addition to detection accuracy, computational efficiency is evaluated to assess suitability for practical deployment scenarios.
Table 2 reports the number of parameters, computational complexity (FLOPs), inference throughput (FPS), and end-to-end latency (ms/image) for representative architectures evaluated on the test split.
All reported FPS and latency values correspond to end-to-end inference and exclude inference-only timing in order to reflect realistic deployment behavior.
The results reveal clear efficiency differences across architectural configurations. The EfficientNetV2-S model with the original YOLOv8 neck achieves the highest inference throughput while simultaneously reducing the parameter count and computational cost relative to the baseline. This configuration provides more than an 80% increase in throughput (416.67 FPS versus 227.27 FPS) and substantially lower latency, making it well suited for high-throughput microscopy screening applications.
In contrast, the EfficientNetV2-L model combined with a NAS-FPN-inspired neck incurs a higher computational cost due to the increased model capacity and feature fusion complexity. Despite this overhead, it remains practically deployable (181.82 FPS, 5.50 ms/image) and is preferable in scenarios where precision-oriented detection performance is prioritized over maximum throughput. Overall, these results highlight a clear trade-off between detection accuracy and computational efficiency, enabling architecture selection to be guided by deployment requirements.
4.3. Class-Wise Error Analysis
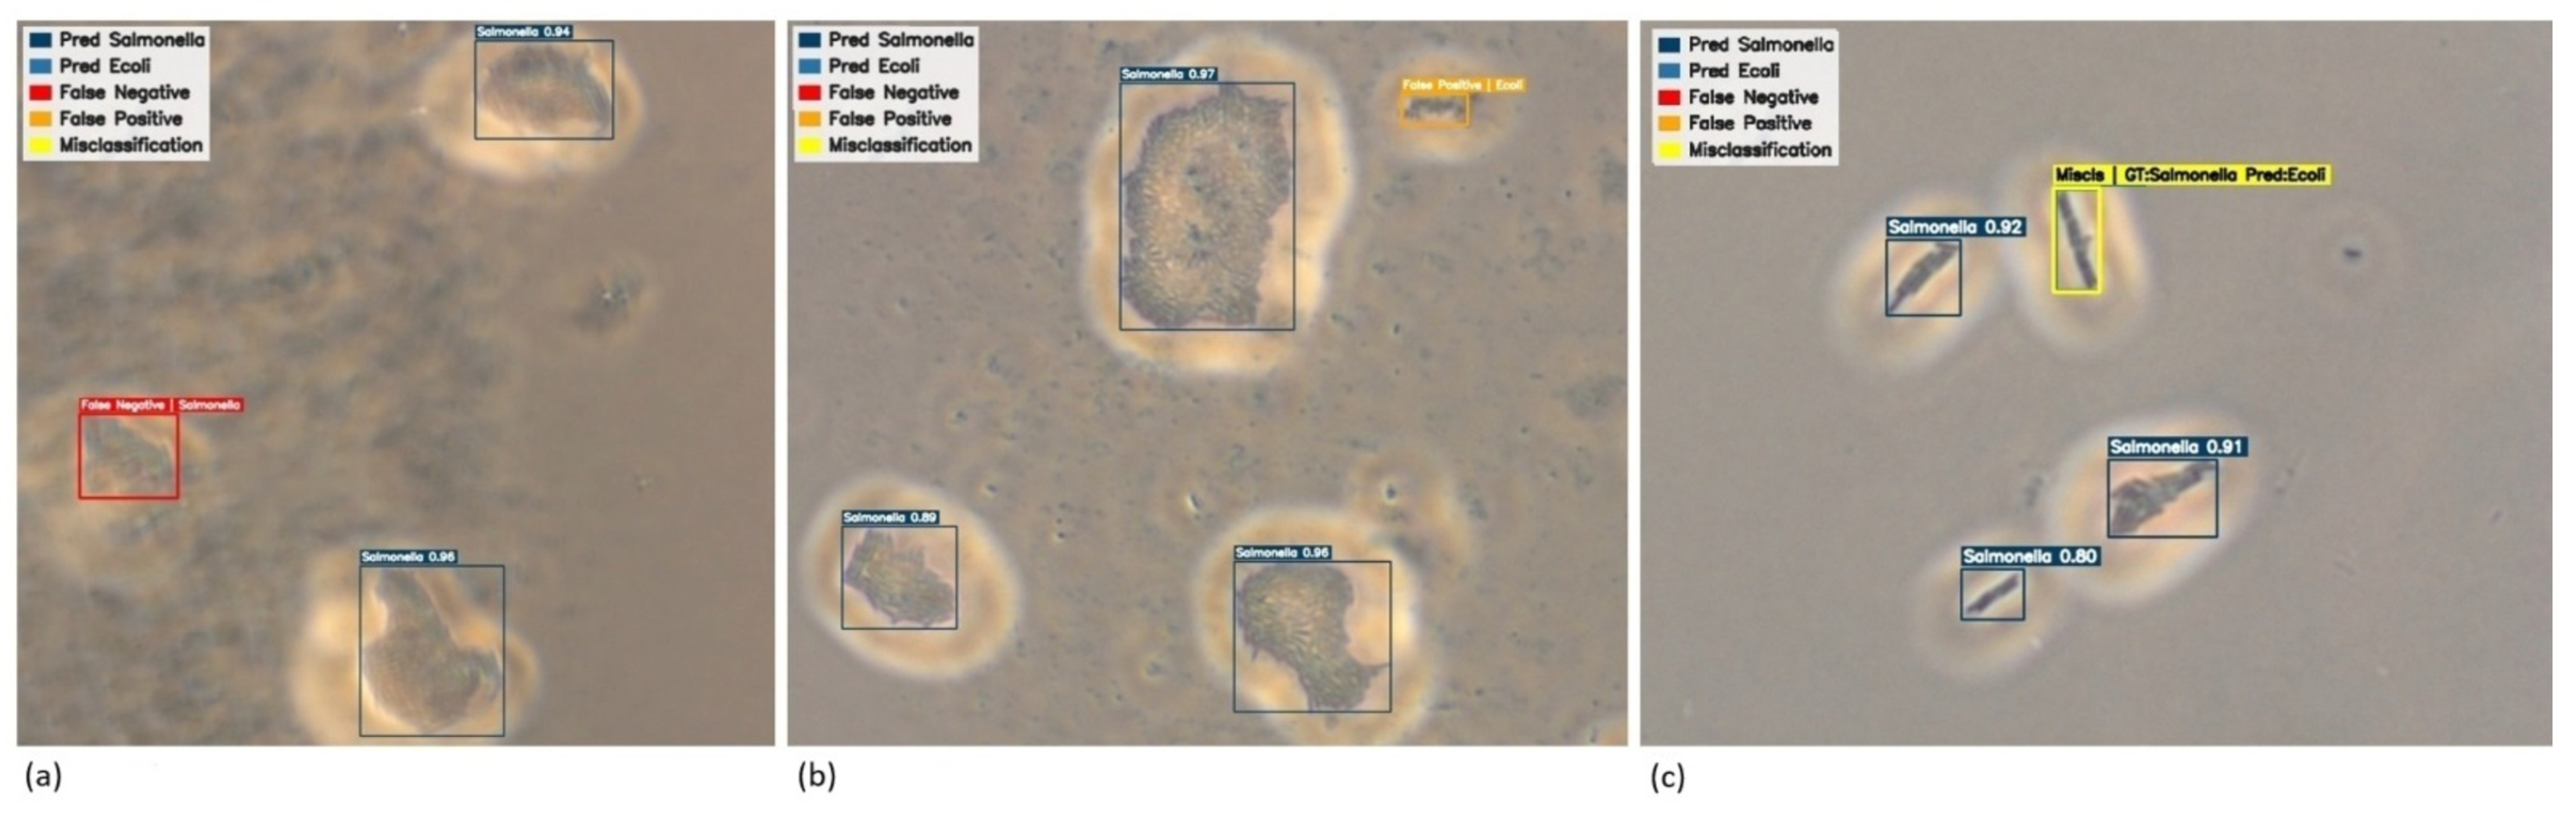
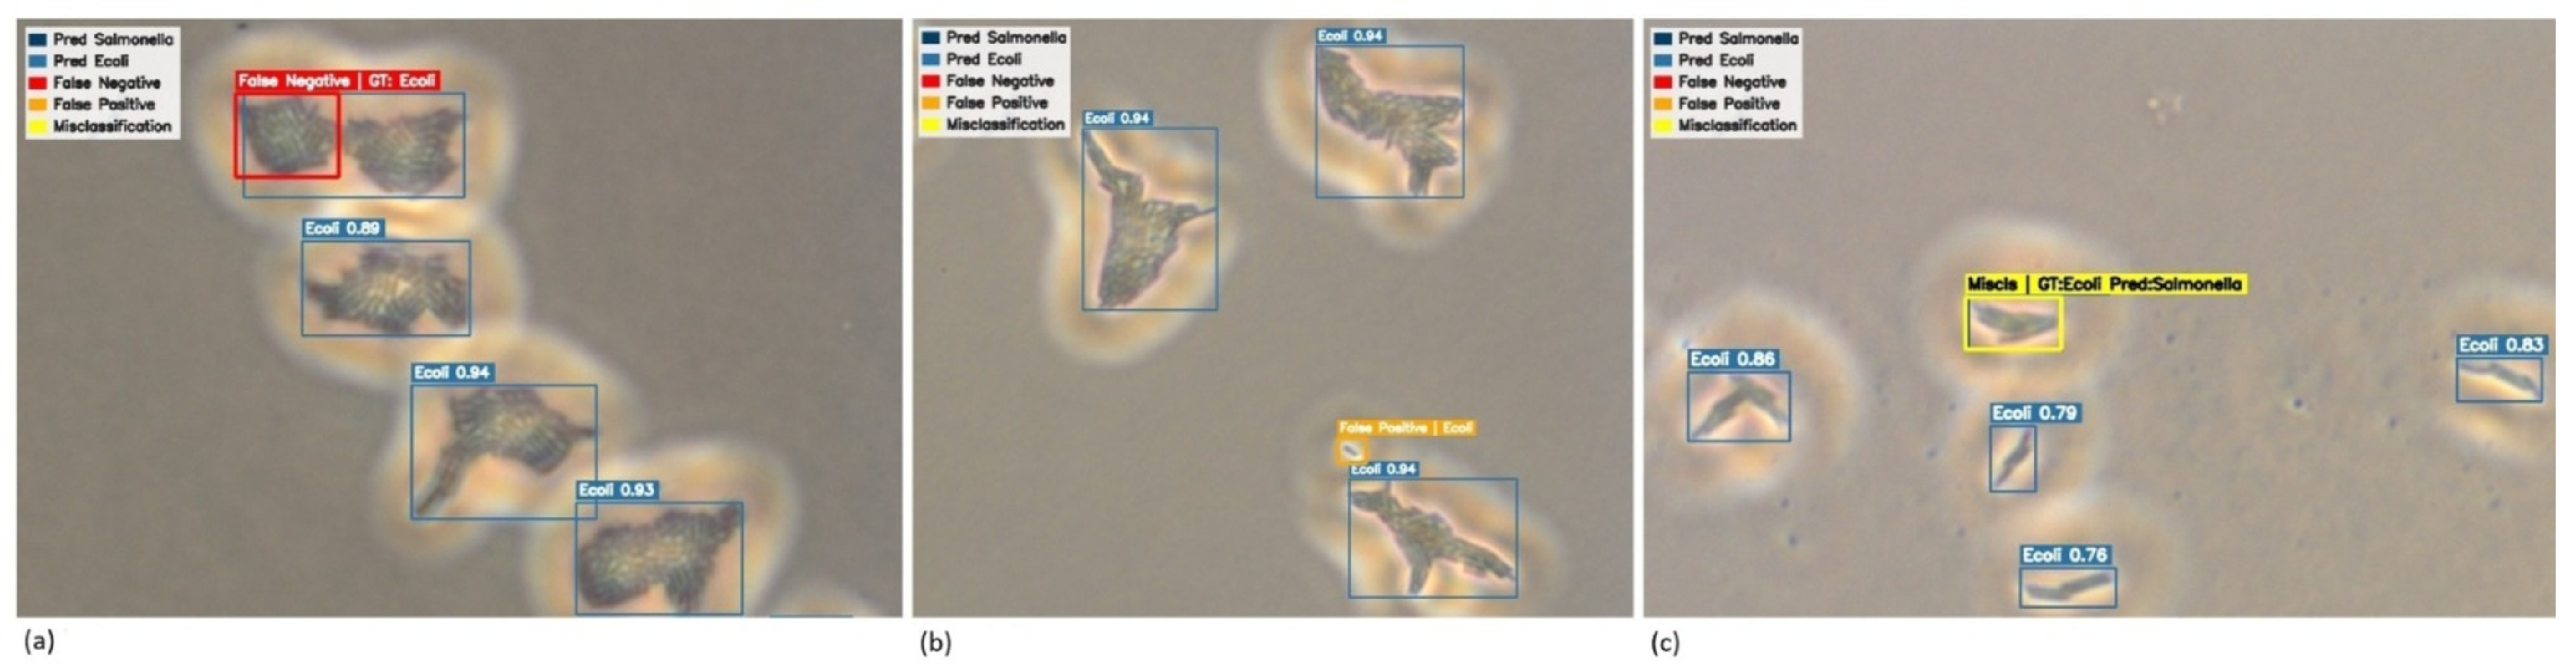
Figure 12 and
Figure 13 present representative qualitative failure cases for
E. coli and
Salmonella, respectively, organized into (a) false negatives, (b) false positives, and (c) misclassifications. While the proposed models achieve strong overall detection performance, these examples highlight challenging scenarios inherent to microscopy-based bacterial detection.
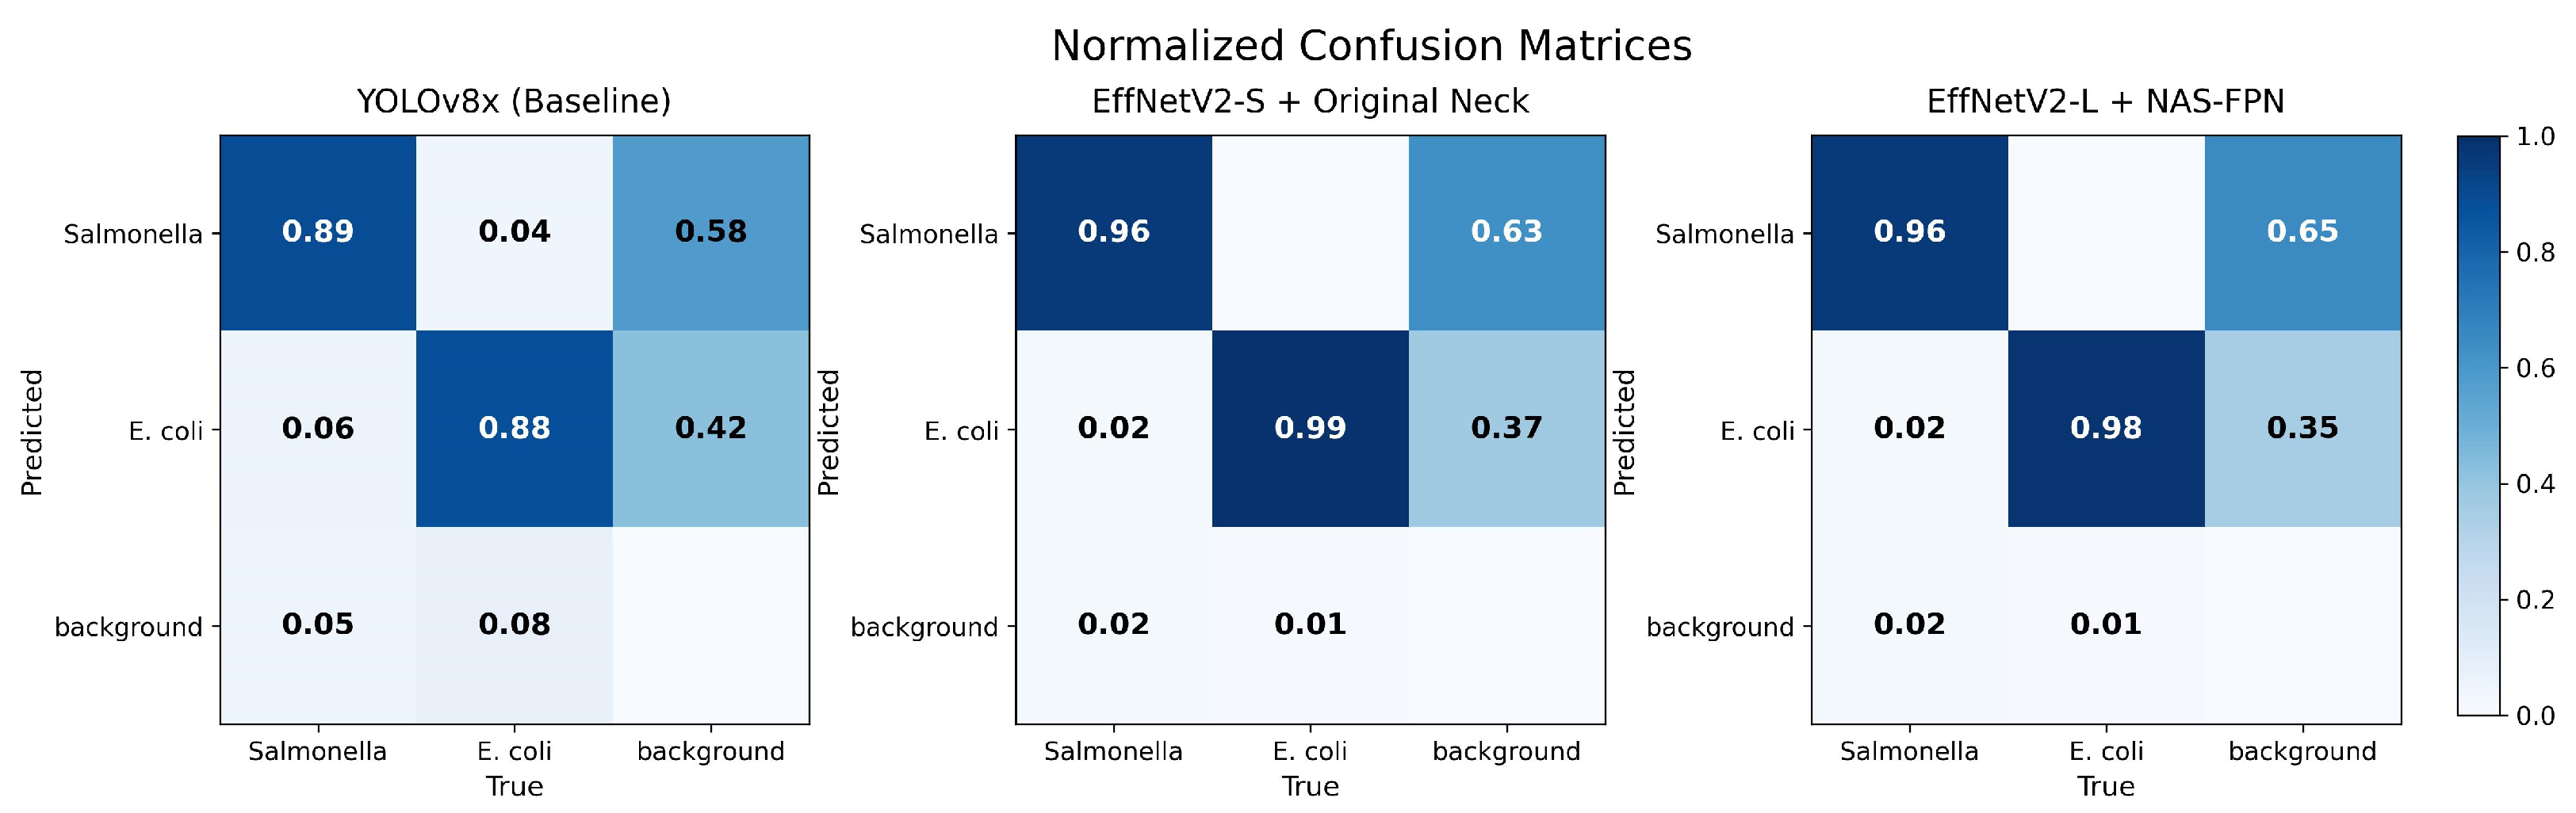
Figure 14 presents normalized confusion matrices for the baseline YOLOv8x model and two representative EfficientNetV2-based architectures. All models exhibit clear diagonal dominance, indicating effective discrimination between
E. coli and
Salmonella under challenging microscopy conditions. Lower background activations correspond to fewer false positive detections, while stronger diagonal concentration indicates reduced false negative rates for both bacterial classes.
Relative to the baseline, EfficientNetV2-based models demonstrate improved class separation and more stable error distributions, particularly for bacterial instances appearing in visually complex background regions. The EfficientNetV2-S model paired with the original YOLOv8 neck shows the most balanced class-wise behavior, achieving higher recall for both bacterial classes while maintaining low cross-class confusion.
The EfficientNetV2-L model combined with a NAS-FPN-inspired neck exhibits reduced false positive responses in background regions, reflecting its higher precision-oriented behavior. This improvement comes with a modest reduction in recall compared to smaller-scale configurations, highlighting the trade-off between suppressing background noise and preserving sensitivity to faint microcolonies. These patterns are consistent with the quantitative results and underscore the role of feature fusion design in shaping class-wise error characteristics.
For
E. coli, false negatives (
Figure 12a) are primarily observed in densely clustered regions where adjacent colonies exhibit close spatial proximity and partial overlap. In such cases, multiple instances form merged visual structures with a similar intensity and texture, reducing separability and leading the model to localize dominant regions while missing smaller or less distinct sub-instances. In contrast, false negatives for
Salmonella (
Figure 13a) are more strongly associated with low visual contrast and weak structural definition, where colonies appear diffuse and lack clear boundaries, limiting the availability of discriminative features for detection.
False positives (
Figure 12b and
Figure 13b) are mainly attributed to background artifacts that exhibit structural similarity to bacterial morphology. For
E. coli, small-scale noise and subtle intensity variations in the agar can resemble early-stage microcolonies, particularly due to the model’s sensitivity to small and low-contrast features developed during training. For
Salmonella, false positives are more frequently linked to complex medium conditions, especially in Onion-Present environments, where debris, bubbles, and irregular textures generate patterns that partially align with learned bacterial features. These cases reflect the inherent difficulty of distinguishing biological structures from visually similar background elements.
Misclassification cases (
Figure 12c and
Figure 13c) arise primarily from the high morphological similarity between
E. coli and
Salmonella, particularly in early or weakly developed colonies. In these scenarios, reduced contrast, a simplified internal structure, and less pronounced boundaries lead to overlapping feature representations. As a result, the model may rely on local shape and texture cues that are not sufficiently distinctive, causing occasional class confusion while still maintaining accurate localization.
Despite these challenges, the observed error patterns are consistent with the intrinsic difficulty of microscopy-based bacterial detection under conditions involving small object size, low contrast, dense clustering, and complex background variability. Overall, the results demonstrate that EfficientNetV2-based architectures enhance feature representation and detection robustness, while multi-scale feature fusion improves the ability to handle spatial complexity and scale variation. These findings confirm that the proposed design effectively addresses key challenges of the task, with remaining errors primarily reflecting inherent data ambiguity rather than systematic limitations of the model.
4.4. Confidence Sensitivity and F1 Analysis
Confidence threshold robustness is evaluated using the F1 score as a function of the detection confidence threshold. The F1 metric provides a compact summary of the precision–recall trade-off and is particularly relevant for safety-critical bacterial detection, where both false positives and false negatives must be carefully controlled.
Across the evaluated architectures, EfficientNetV2-based models achieve high peak F1 scores, indicating strong overall detection capability. Differences become more apparent when examining confidence stability across threshold ranges. The EfficientNetV2-S configuration with the original YOLOv8 neck exhibits the broadest high-F1 operating region, indicating greater tolerance to confidence threshold variation and more stable behavior under deployment conditions.
In contrast, the EfficientNetV2-L configuration with a NAS-FPN-inspired neck reaches a similarly high peak F1 score but displays increased sensitivity at extreme confidence thresholds, reflecting tighter confidence calibration requirements. The baseline YOLOv8x model shows a narrower optimal operating range, suggesting reduced robustness to confidence threshold selection rather than a limitation in peak detection accuracy.
These results emphasize that confidence stability, in addition to peak performance, is an important factor when selecting detection architectures for practical microscopy-based food safety screening.
4.5. Qualitative Detection Results Across Growth Stages
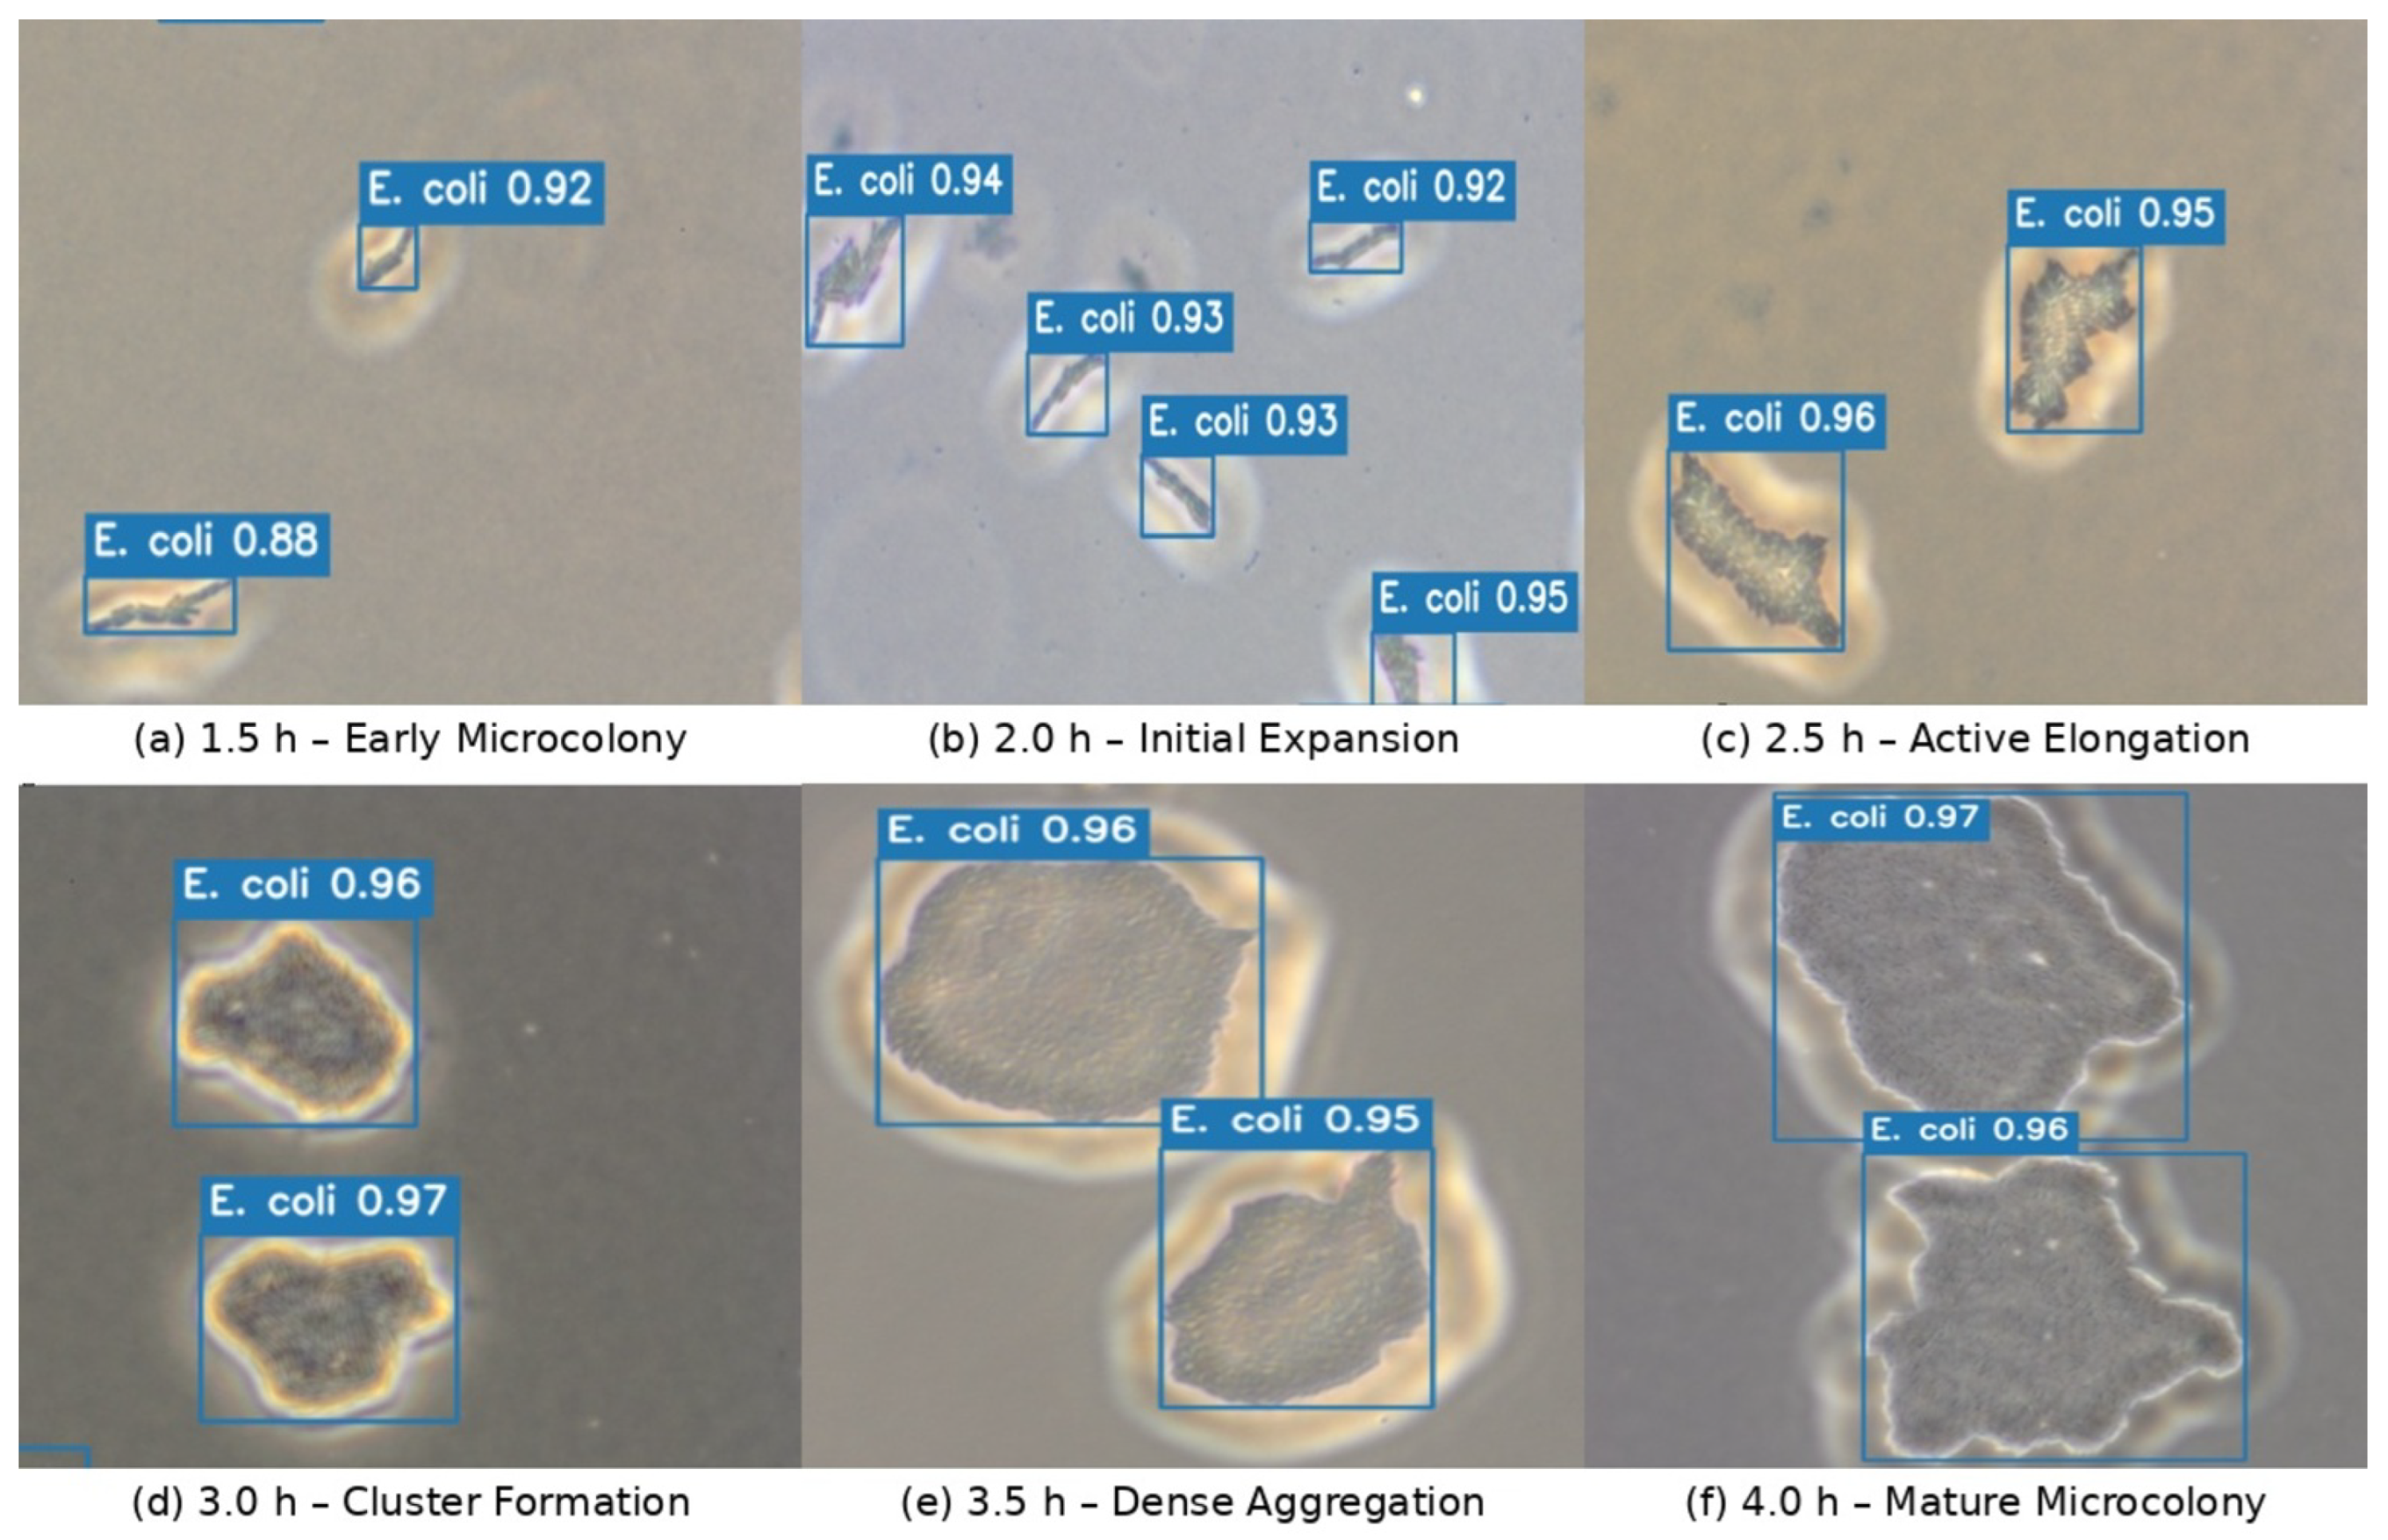
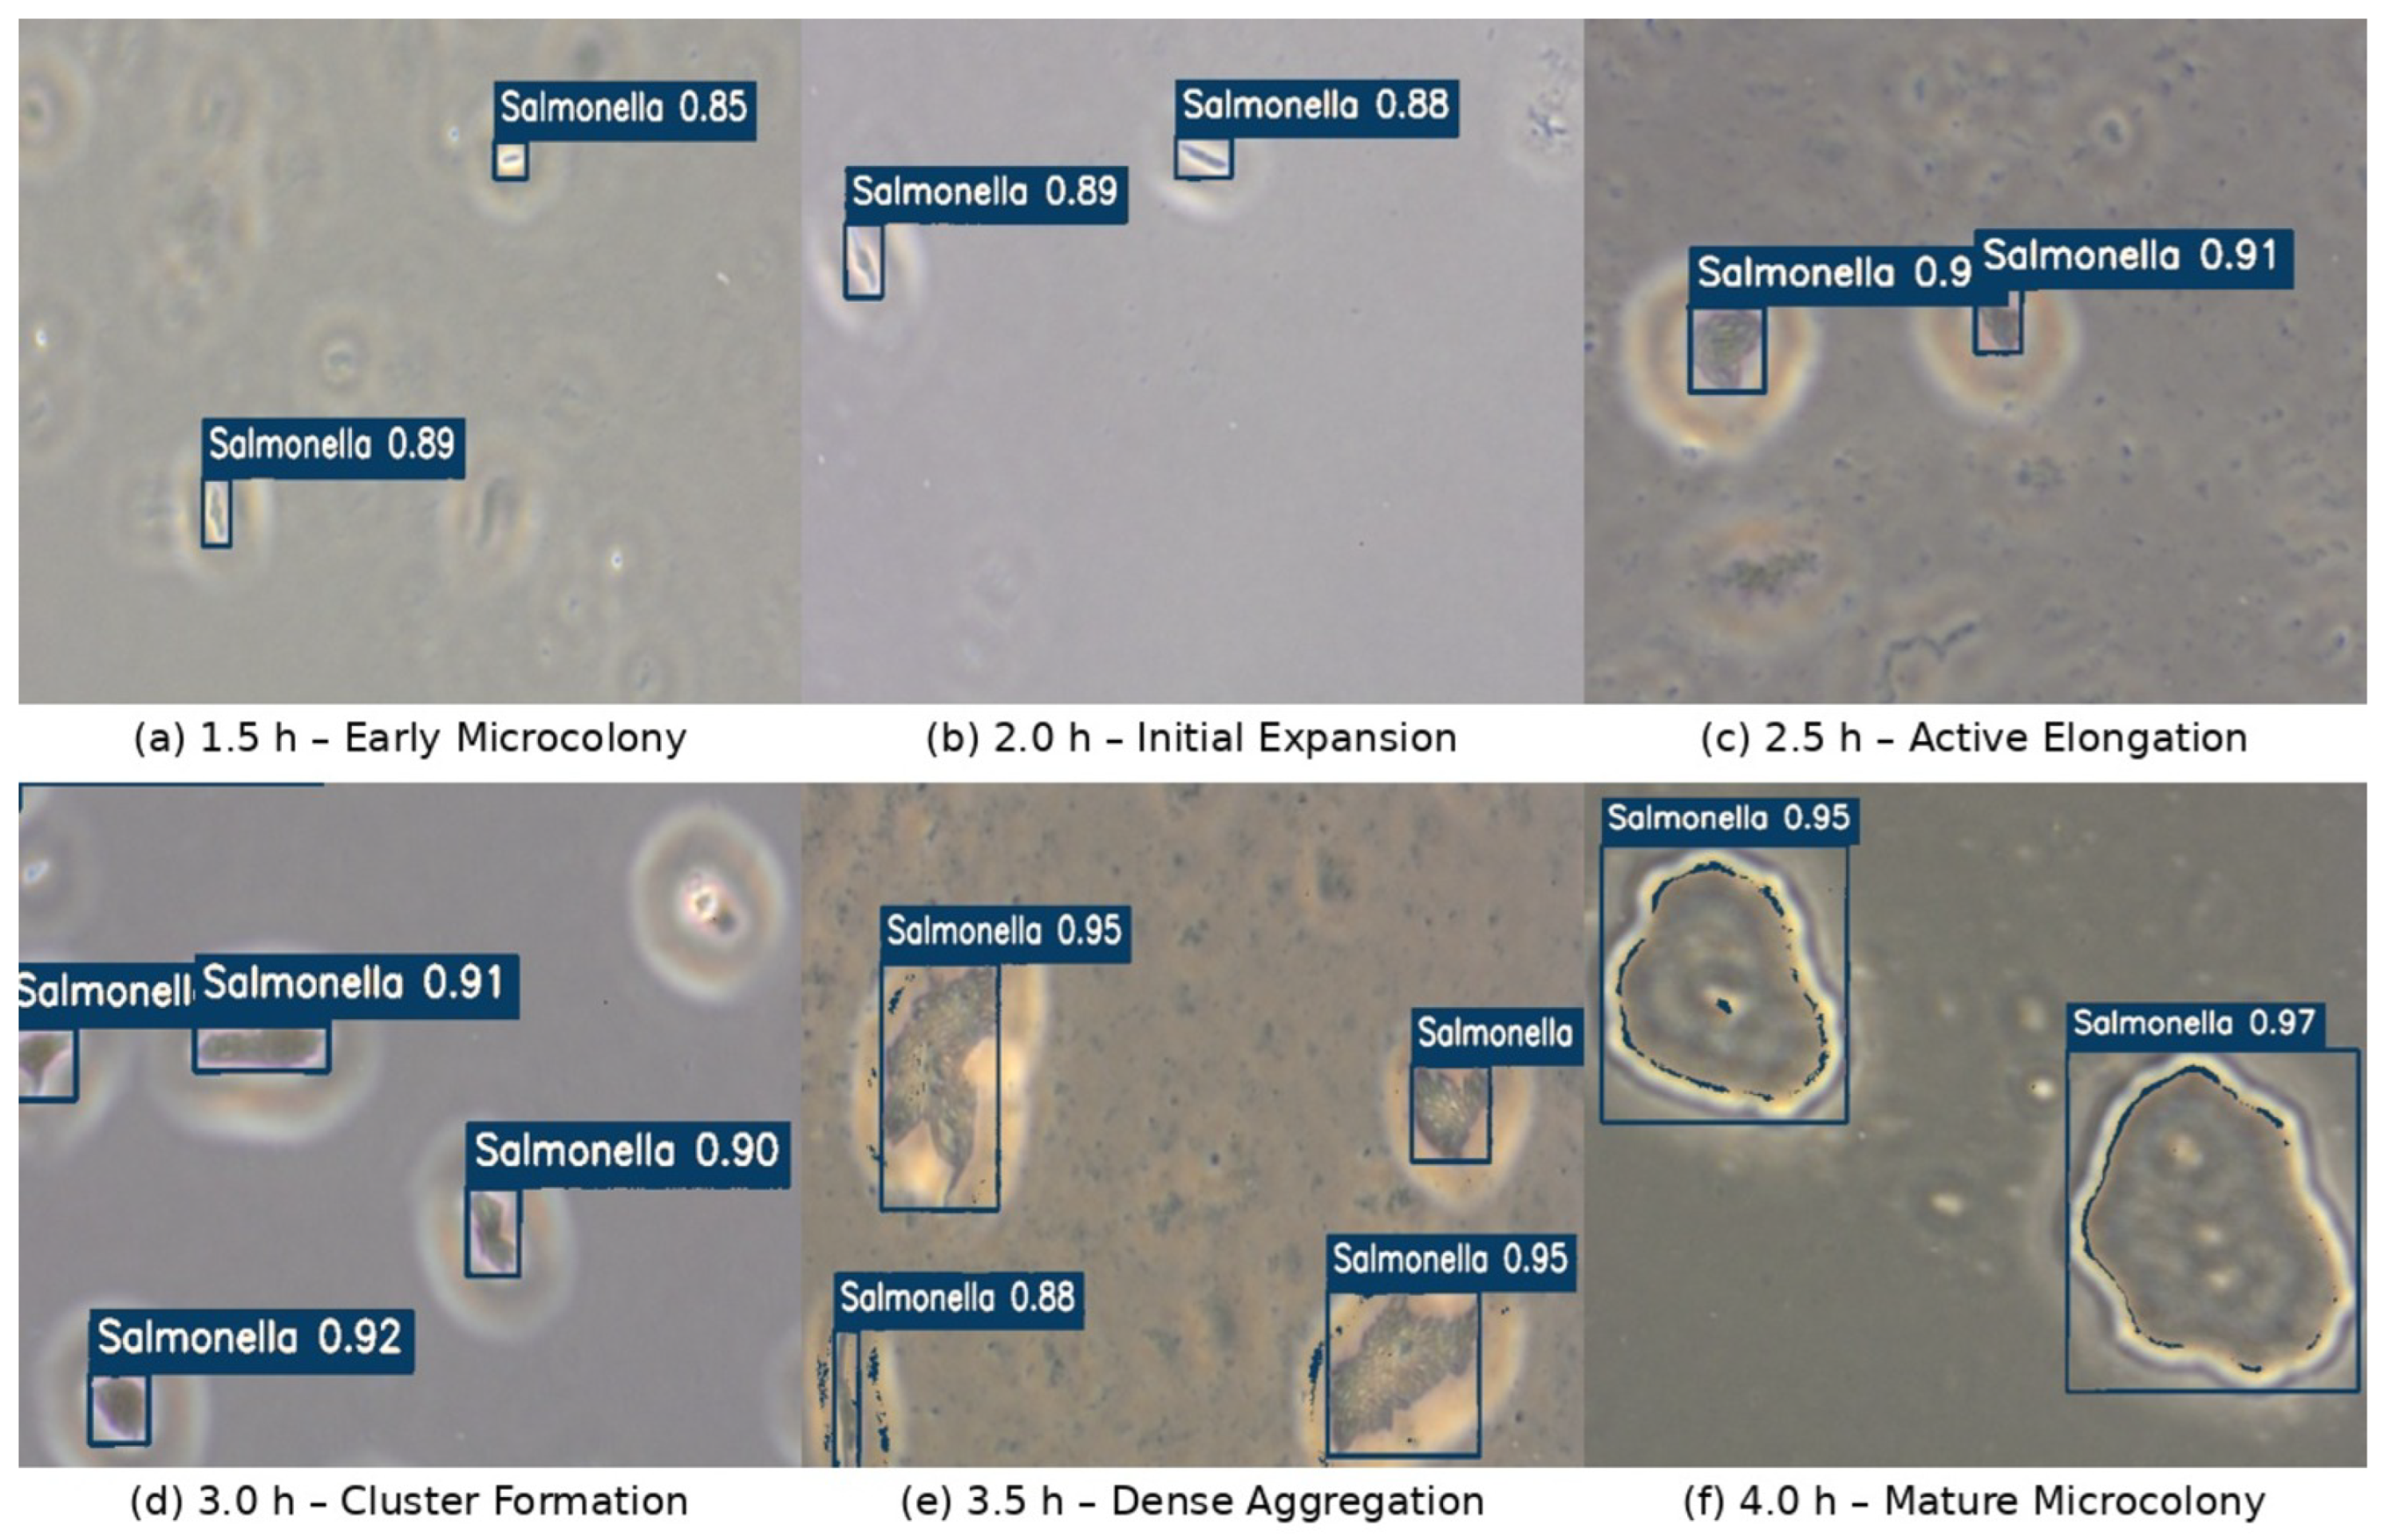
Figure 15 and
Figure 16 present qualitative detection results for
E. coli and
Salmonella, respectively, across bacterial growth stages ranging from early microcolonies to mature aggregates.
Across the evaluated growth stages, the models capture the progression of bacterial morphology while maintaining reliable localization. At early growth times, where microcolonies are small and exhibit low contrast relative to the background, detections remain stable and spatially consistent. At later stages, characterized by dense aggregation, irregular boundaries, and increased structural complexity, the models continue to localize bacterial regions without substantial fragmentation or spurious detections.
These qualitative observations complement the quantitative results by illustrating that the evaluated architectures generalize across temporal growth dynamics rather than overfitting to a specific colony size or morphology. In particular, the persistence of coherent detections across growth stages supports the robustness of the proposed designs under biologically driven appearance variation.
5. Discussion
In this study, we investigated how backbone and feature fusion design choices influence bacterial microcolony detection within the YOLOv8 framework under controlled microscopy conditions. Replacing the CSP-Darknet backbone with EfficientNetV2 variants consistently improved detection performance across most configurations, demonstrating that EfficientNetV2 provides more effective feature representations for small, low-contrast bacterial structures commonly observed in early growth stages. Quantitative comparisons further highlight the effectiveness of the evaluated configurations. The baseline YOLOv8x model achieves an mAP@50 of 0.898, precision of 0.891, and recall of 0.867. In contrast, the best-performing configuration (EfficientNetV2-S with the YOLOv8 neck) improves performance to an mAP@50 of 0.987, precision of 0.976, and recall of 0.968. These results demonstrate the impact of backbone and feature fusion design on detection performance.
A key finding is that architectural efficiency and feature fusion design are more influential than backbone scaling alone. The EfficientNetV2-S variant combined with the original YOLOv8 neck achieves a strong balance between precision and recall while substantially reducing computational cost, indicating that lightweight backbones can deliver competitive accuracy when paired with appropriate multi-scale aggregation. In contrast, simply increasing backbone capacity does not guarantee uniformly improved performance.
Our results further confirm that explicit multi-scale feature fusion is essential for robust bacterial detection. Across all backbone sizes, architectures retaining a feature fusion neck significantly outperform no-neck variants, underscoring the importance of cross-scale information for handling extreme object-size variation and dense early-stage microcolonies. The NAS-FPN-inspired neck enhances precision for the largest backbone, reducing false positive responses in visually complex backgrounds, but introduces greater sensitivity to confidence threshold selection, revealing a trade-off between precision-oriented behavior and operational robustness.
From a deployment perspective, confidence stability and computational efficiency are as critical as peak detection accuracy. F1–confidence analysis shows that EfficientNetV2-S with the original YOLOv8 neck exhibits the most stable performance across confidence thresholds while also delivering the highest inference throughput. This configuration is therefore well suited for high-throughput or real-time microscopy-based screening. In contrast, EfficientNetV2-L with a NAS-FPN-inspired neck is better suited for scenarios where maximizing precision is prioritized over efficiency.
Class-wise error analysis further indicates improved recall for Salmonella across EfficientNetV2-based architectures, which is particularly important in food safety applications where false negatives carry higher risk. Overall, these findings demonstrate that careful backbone selection combined with appropriate feature fusion design can substantially improve bacterial microcolony detection without altering the core YOLOv8 detection paradigm.
While the proposed study demonstrates consistent improvements across multiple architectural configurations, it remains focused on controlled experimental evaluation within a microscopy-specific dataset. As such, the findings primarily reflect the impact of backbone and feature fusion design under domain-constrained conditions. Future work will extend this analysis to broader datasets and incorporate additional training strategies to further evaluate generalization and robustness across diverse imaging environments.
6. Conclusions
In this work, we examined the impact of backbone and feature fusion design choices within the YOLOv8 framework for bacterial microcolony detection in high-resolution microscopy images. By systematically replacing the CSP-Darknet backbone with EfficientNetV2 variants and evaluating multiple feature fusion configurations under controlled conditions, we provided a clear assessment of how architectural components influence detection accuracy, confidence robustness, and computational efficiency. The experimental results demonstrate that EfficientNetV2 backbones consistently improve detection performance relative to the YOLOv8x baseline, particularly when paired with explicit multi-scale feature fusion. Architectures retaining a feature aggregation neck substantially outperform no-neck variants, confirming that cross-scale information is essential for detecting small, low-contrast bacterial structures. These trends are further supported by the mAP@50–95 results, which evaluate localization quality across multiple IoU thresholds. The highest mAP@50–95 value of 0.888 is achieved by the EffNetV2-L + NAS-FPN configuration, while models incorporating either the original YOLOv8 neck or NAS-FPN consistently outperform their no-neck counterparts. This demonstrates that the architectural improvements provide more robust localization performance, not only at a single IoU threshold but across stricter evaluation criteria. To provide a broader evaluation context, additional experiments were conducted using representative two-stage and one-stage detectors, namely Faster R-CNN and RetinaNet (ResNet50-FPN). Faster R-CNN achieved a precision of 0.9016, recall of 0.9371, and mAP@50 of 0.9016, while RetinaNet achieved a precision of 0.9680, recall of 0.9214, and mAP@50 of 0.8513. Although these models demonstrate competitive performance, the evaluated EfficientNetV2-based YOLOv8 configurations achieve a higher detection performance in terms of mAP@50, while maintaining a balanced trade-off between precision and recall. Among the evaluated designs, EfficientNetV2-S combined with the original YOLOv8 neck achieves the most balanced performance, delivering strong precision and recall alongside stable confidence behavior and high inference throughput. Larger EfficientNetV2 configurations paired with a NAS-FPN-inspired neck further emphasize precision-oriented behavior, at the cost of increased computational demand and tighter confidence calibration. Class-wise analysis indicates improved recall for Salmonella across EfficientNetV2-based architectures, which is particularly relevant for food safety screening scenarios where false negatives carry higher risk. Qualitative results across bacterial growth stages further support the quantitative findings, demonstrating that the evaluated architectures generalize across biologically driven morphological variation rather than overfitting to specific colony sizes or appearances.
Author Contributions
Conceptualization, M.R. and A.A. (Anas AlSobeh); methodology, M.R.; software, M.R.; validation, M.R., A.A. (Anas AlSobeh), N.D. and A.A. (Amer AbuGhazaleh); formal analysis, M.R.; investigation, M.R.; resources, N.D. and A.A. (Amer AbuGhazaleh); data curation, M.R. and N.D.; writing—original draft preparation, M.R.; writing—review and editing, A.A. (Anas AlSobeh), N.D. and A.A. (Amer AbuGhazaleh); visualization, M.R.; supervision, A.A. (Anas AlSobeh) and A.A. (Amer AbuGhazaleh); project administration, A.A. (Anas AlSobeh) and A.A. (Amer AbuGhazaleh); and funding acquisition, A.A. (Anas AlSobeh) and A.A. (Amer AbuGhazaleh). All authors have read and agreed to the published version of the manuscript.
Funding
This research was funded by the United States Department of Agriculture, National Institute of Food and Agriculture (USDA-NIFA), through the Capacity Building Grants for Non-Land-Grant Colleges of Agriculture program, grant number 2024-02854.
Institutional Review Board Statement
Not applicable.
Informed Consent Statement
Not applicable.
Data Availability Statement
The microscopy dataset used in this study is currently being expanded and analyzed as part of ongoing research. The dataset will be made publicly available upon publication of this article. The data presented in this study are available from the corresponding author upon reasonable request.
Acknowledgments
The authors acknowledge the support of the United States Department of Agriculture, National Institute of Food and Agriculture (USDA-NIFA), through the Capacity Building Grants for Non-Land-Grant Colleges of Agriculture program (Grant No. 2024-02854).
Conflicts of Interest
The authors declare no conflicts of interest.
Abbreviations
The following abbreviations are used in this manuscript:
| CDC | Centers for Disease Control and Prevention |
| CVAT | Computer Vision Annotation Tool |
| FPN | Feature Pyramid Network |
| FPS | Frames Per Second |
| IoU | Intersection over Union |
| mAP | mean Average Precision |
| NAS | Neural Architecture Search |
| PAN | Path Aggregation Network |
| PCR | Polymerase Chain Reaction |
| USDA | United States Department of Agriculture |
| YOLO | You Only Look Once |
| GT | Ground Truth |
References
- Centers for Disease Control and Prevention. Facts About Food Poisoning. 24 November 2025. Available online: https://www.cdc.gov/food-safety/data-research/facts-stats/index.html (accessed on 12 March 2026).
- Scallan, E.; Hoekstra, R.M.; Angulo, F.J.; Tauxe, R.V.; Widdowson, M.-A.; Roy, S.L.; Jones, J.L.; Griffin, P.M. Foodborne illness acquired in the United States—Major pathogens. Emerg. Infect. Dis. 2011, 17, 7–15. [Google Scholar] [CrossRef]
- U.S. Department of Agriculture; Food Safety and Inspection Service. Summary of Recall and PHA Cases in Calendar Year 2023, Updated 28 February 2024. Available online: https://www.fsis.usda.gov/food-safety/recalls-public-health-alerts/annual-recall-summaries/summary-recall-and-pha-cases-0 (accessed on 12 March 2026).
- Scharff, R.L. Food Attribution and Economic Cost Estimates for Meat- and Poultry-Related Illnesses. J. Food Prot. 2020, 83, 959–967. [Google Scholar] [CrossRef]
- McCormic, A.; Mølbak, K.; Haley, B.J.; Wang, X.; DeMent, J.; Brown, E.; Allard, M.; Trees, E.; Ottesen, A.; Gerner-Smidt, P.; et al. Bi-national outbreak of Salmonella Newport Infections Linked to Onions: The United States experience. Epidemiol. Infect. 2022, 150, e199. [Google Scholar] [CrossRef]
- Elbehiry, A.; Aljumaah, M.R.; Almuzaini, A.M.; Aljaddawi, A.A.; Aljoudi, A.M.; Alaqil, A.A.; Moussa, I.M.; Alsubki, R.A.; Rawway, M.; Almalki, R.H.; et al. An Overview of the Public Health Challenges in Diagnosing and Controlling Human Foodborne Pathogens. Vaccines 2023, 11, 725. [Google Scholar] [CrossRef] [PubMed]
- Wang, Y.; Salazar, J.K. Culture-independent rapid detection methods for bacterial pathogens and toxins in food matrices. Compr. Rev. Food Sci. Food Saf. 2016, 15, 183–205. [Google Scholar] [CrossRef] [PubMed]
- Kim, S.; Kim, S.-S. Bacterial pathogen detection by conventional culture-based and recent alternative (polymerase chain reaction, isothermal amplification, enzyme linked immunosorbent assay, bacteriophage amplification, and gold nanoparticle aggregation) methods in food samples: A review. J. Food Saf. 2021, 41, e12870. [Google Scholar]
- AlSobeh, A.; Shatnawi, A.; Magableh, A. AspectFL: Aspect-Oriented Programming for Trustworthy and Compliant Federated Learning Systems. Information 2025, 16, 1048. [Google Scholar] [CrossRef]
- Panwar, S.; Duggirala, K.S.; Yadav, P.; Debnath, N.; Yadav, A.K.; Kumar, A. Advanced diagnostic methods for identification of bacterial foodborne pathogens: Contemporary and upcoming challenges. Crit. Rev. Biotechnol. 2023, 43, 982–1000. [Google Scholar] [CrossRef]
- Bradford, L.M.; Yao, L.; Anastasiadis, C.; Cooper, A.L.; Blais, B.; Deckert, A.; Reid-Smith, R.; Lau, C.; Diarra, M.S.; Carrillo, C.; et al. Limit of detection of Salmonella Ser. Enteritidis Using culture-Based Versus Culture-Independent Diagnostic Approaches. Microbiol. Spectr. 2024, 12, e01027-24. [Google Scholar] [CrossRef]
- Jung, J.H.; Lee, J.E. Real-time bacterial microcolony counting using on-chip microscopy. Sci. Rep. 2016, 6, 21473. [Google Scholar] [CrossRef]
- Hsieh, K.; Zec, H.C.; Chen, L.; Kaushik, A.M.; Mach, K.E.; Liao, J.C.; Wang, T.-H. Simple and Precise Counting of Viable Bacteria by Resazurin-Amplified Picoarray Detection. Anal. Chem. 2018, 90, 9449–9456. [Google Scholar] [CrossRef]
- Ma, L.; Yi, J.; Wisuthiphaet, N.; Earles, M.; Nitin, N. Accelerating the detection of bacteria in food using artificial intelligence and Optical Imaging. Appl. Environ. Microbiol. 2023, 89, e0182822. [Google Scholar] [CrossRef] [PubMed]
- Chin, S.Y.; Dong, J.; Hasikin, K.; Ngui, R.; Lai, K.W.; Yeoh, P.S.Q.; Wu, X. Bacterial image analysis using multi-task deep learning approaches for clinical microscopy. PeerJ Comput. Sci. 2024, 10, e2180. [Google Scholar] [CrossRef]
- Redmon, J.; Divvala, S.; Girshick, R.; Farhadi, A. You Only Look Once: Unified, Real-Time Object Detection. In Proceedings of the IEEE Conference on Computer Vision and Pattern Recognition (CVPR), Las Vegas, NV, USA, 27–30 June 2016; pp. 779–788. [Google Scholar]
- Jocher, G.; Chaurasia, A.; Qiu, J. Ultralytics YOLO, Version v8.2.43; Zenodo: Geneva, Switzerland, 2024. [Google Scholar]
- Koirala, B.; AlSobeh, A.; Dhahir, N.; AbuGhazaleh, A. Background-Aware Instance Segmentation for Early Detection of E. coli and Salmonella in Time-Stamped Microscopy Images. In Proceedings of the 24th IEEE International Conference on Machine Learning and Applications (ICMLA), Boca Raton, FL, USA, 3–5 December 2025. [Google Scholar]
- Tan, M.; Le, Q.V. EfficientNetV2: Smaller Models and Faster Training. In Proceedings of the 38th International Conference on Machine Learning (ICML), Virtual Event, 18–24 July 2021; Volume 139, pp. 10096–10106. [Google Scholar]
- Kridalukmana, R.; Eridani, D.; Septiana, R.; Windasari, I. YoloV8_s, EfficientNetv2_s, and CSP_Darknet_l Comparison as Recognition Model’s Backbone for Drone-Captured Images. Int. J. Inform. Vis. 2025, 9, 683–689. [Google Scholar]
- Gui, Z.; Lian, X.; Kang, M. An improved YOLOv8 detection algorithm for traffic signs. Proc. SPIE 2024, 13181, 131812V. [Google Scholar]
- Wang, H.; Koydemir, H.C.; Qiu, Y.; Bai, B.; Zhang, Y.; Jin, Y.; Tok, S.; Yilmaz, E.C.; Gumustekin, E.; Rivenson, Y.; et al. Early detection and classification of live bacteria using time-lapse coherent imaging and deep learning. Light Sci. Appl. 2020, 9, 118. [Google Scholar] [CrossRef]
- Paquin, P.; Durmort, C.; Paulus, C.; Vernet, T.; Marcoux, P.R.; Morales, S. Spatio-temporal based deep learning for rapid detection and identification of bacterial colonies through lens-free microscopy time-lapses. PLoS Digit. Health 2022, 1, e0000122. [Google Scholar] [CrossRef] [PubMed]
- Soni, A.; Dixit, Y.; Reis, M.M.; Brightwell, G. Hyperspectral imaging and machine learning in food microbiology: Developments and challenges in detection of bacterial, fungal, and viral contaminants. Compr. Rev. Food Sci. Food Saf. 2022, 21, 3717–3745. [Google Scholar] [CrossRef]
- Papa, M.; Bhattacharya, S.; Park, B.; Yi, J. Rapid Salmonella Serovar Classification Using AI-Enabled Hyperspectral Microscopy with Enhanced Data Preprocessing and Multimodal Fusion. Foods 2025, 14, 2737. [Google Scholar] [CrossRef] [PubMed]
- Tan, Z.; Ding, Y.; Ma, H.; Li, J.; Zheng, D.; Bai, H.; Xin, W.; Li, L.; Peng, B. Advances in deep learning for bacterial image segmentation in optical microscopy. J. Innov. Opt. Health Sci. 2025, 18, 2530011. [Google Scholar] [CrossRef]
- Zhang, Q.; Zhu, Y.; Cordeiro, F.R.; Chen, Q. PSSCL: A progressive sample selection framework with contrastive loss designed for noisy labels. Pattern Recognit. 2025, 161, 111284. [Google Scholar] [CrossRef]
- CVAT.ai Corporation. Computer Vision Annotation Tool (CVAT), Version v2.10.3; Zenodo: Geneva, Switzerland, 2024. [Google Scholar]
- Lin, T.-Y.; Dollár, P.; Girshick, R.; He, K.; Hariharan, B.; Belongie, S. Feature Pyramid Networks for Object Detection. In Proceedings of the IEEE Conference on Computer Vision and Pattern Recognition (CVPR), Honolulu, HI, USA, 21–26 July 2017; pp. 2117–2125. [Google Scholar]
- Liu, S.; Qi, L.; Qin, H.; Shi, J.; Jia, J. Path Aggregation Network for Instance Segmentation. In Proceedings of the IEEE Conference on Computer Vision and Pattern Recognition (CVPR), Salt Lake City, UT, USA, 18–22 June 2018; pp. 8759–8768. [Google Scholar]
- Khamaiseh, S.Y.; Chiacchira, S.; Alsobeh, A.; Aljadayah, A. MuAE: A Mutation Testing Framework for Evaluating Autoencoders. In Proceedings of the 49th IEEE Annual Computers, Software, and Applications Conference (COMPSAC 2025), Toronto, ON, Canada, 8–11 July 2025; pp. 1015–1020. [Google Scholar] [CrossRef]
- AlSobeh, A.; AbuGhazaleh, A.; Dhahir, N.; Rababa, M. XAIPath: Temporal-environmental explainable AI framework for co-contaminated food pathogen detection in microscopic imaging. In Workshop Proceedings of the 54th International Conference on Parallel Processing; Association for Computing Machinery: New York, NY, USA, 2025; pp. 112–119. [Google Scholar]
- Ghiasi, G.; Lin, T.-Y.; Le, Q.V. NAS-FPN: Learning Scalable Feature Pyramid Architecture for Object Detection. In Proceedings of the IEEE/CVF Conference on Computer Vision and Pattern Recognition (CVPR), Long Beach, CA, USA, 15–20 June 2019; pp. 7036–7045. [Google Scholar]
- Tan, M.; Pang, R.; Le, Q.V. EfficientDet: Scalable and Efficient Object Detection. In Proceedings of the IEEE/CVF Conference on Computer Vision and Pattern Recognition (CVPR), Seattle, WA, USA, 13–19 June 2020; pp. 10781–10790. [Google Scholar]
Figure 1.
Proportion of the collected dataset used in this study versus data not considered. Only single-species images acquired at growth times between h and h under Onion-Present and Onion-Absent conditions were used for training and evaluation. Data collected at earlier growth stages and mixed-species samples were not considered due to labeling uncertainty, while background-only images were collected for background characterization and were not included because they contain no bacterial targets.
Figure 1.
Proportion of the collected dataset used in this study versus data not considered. Only single-species images acquired at growth times between h and h under Onion-Present and Onion-Absent conditions were used for training and evaluation. Data collected at earlier growth stages and mixed-species samples were not considered due to labeling uncertainty, while background-only images were collected for background characterization and were not included because they contain no bacterial targets.
Figure 2.
Representative annotation examples from the microscopy dataset. (a) Bounding box annotations used for bacterial object detection in this study, where each microcolony is enclosed by a single detection box. (b) Polygon-based annotations included in the dataset for fine-grained spatial delineation of bacterial microcolonies, illustrating irregular colony boundaries and local shape variation in the microscopy images.
Figure 2.
Representative annotation examples from the microscopy dataset. (a) Bounding box annotations used for bacterial object detection in this study, where each microcolony is enclosed by a single detection box. (b) Polygon-based annotations included in the dataset for fine-grained spatial delineation of bacterial microcolonies, illustrating irregular colony boundaries and local shape variation in the microscopy images.
Figure 3.
Distribution of bacterial instances across growth times for Salmonella and E. coli. Early growth stages dominate the dataset, where microcolonies are small and low-contrast.
Figure 3.
Distribution of bacterial instances across growth times for Salmonella and E. coli. Early growth stages dominate the dataset, where microcolonies are small and low-contrast.
Figure 4.
Distribution of bacterial instances by species and onion background condition. Both species appear under Onion-Present and Onion-Absent settings, introducing realistic background variability.
Figure 4.
Distribution of bacterial instances by species and onion background condition. Both species appear under Onion-Present and Onion-Absent settings, introducing realistic background variability.
Figure 5.
Baseline YOLOv8x architecture consisting of a CSP-Darknet backbone, PAN-FPN neck, and multi-scale detection head.
Figure 5.
Baseline YOLOv8x architecture consisting of a CSP-Darknet backbone, PAN-FPN neck, and multi-scale detection head.
Figure 6.
YOLOv8 architecture with EfficientNetV2 backbone and no feature pyramid neck. Backbone outputs are fed directly to the detection head.
Figure 6.
YOLOv8 architecture with EfficientNetV2 backbone and no feature pyramid neck. Backbone outputs are fed directly to the detection head.
Figure 7.
YOLOv8 architecture with EfficientNetV2 backbone and the original PAN-FPN neck.
Figure 7.
YOLOv8 architecture with EfficientNetV2 backbone and the original PAN-FPN neck.
Figure 8.
YOLOv8 architecture with EfficientNetV2 backbone and a NAS-FPN-inspired feature fusion neck.
Figure 8.
YOLOv8 architecture with EfficientNetV2 backbone and a NAS-FPN-inspired feature fusion neck.
Figure 9.
Training and validation metrics over epochs for the baseline YOLOv8x model.
Figure 9.
Training and validation metrics over epochs for the baseline YOLOv8x model.
Figure 10.
Training and validation metrics over epochs for EfficientNetV2-S with PAN-FPN neck.
Figure 10.
Training and validation metrics over epochs for EfficientNetV2-S with PAN-FPN neck.
Figure 11.
Training and validation metrics over epochs for EfficientNetV2-L with NAS-FPN neck.
Figure 11.
Training and validation metrics over epochs for EfficientNetV2-L with NAS-FPN neck.
Figure 12.
Qualitative error analysis for E. coli: (a) false negatives, (b) false positives, and (c) misclassifications. Red boxes indicate missed detections, orange boxes indicate false positives, and yellow boxes indicate incorrect class assignments.
Figure 12.
Qualitative error analysis for E. coli: (a) false negatives, (b) false positives, and (c) misclassifications. Red boxes indicate missed detections, orange boxes indicate false positives, and yellow boxes indicate incorrect class assignments.
Figure 13.
Qualitative error analysis for Salmonella: (a) false negatives, (b) false positives, and (c) misclassifications. Red boxes indicate missed detections, orange boxes indicate false positives, and yellow boxes indicate incorrect class assignments.
Figure 13.
Qualitative error analysis for Salmonella: (a) false negatives, (b) false positives, and (c) misclassifications. Red boxes indicate missed detections, orange boxes indicate false positives, and yellow boxes indicate incorrect class assignments.
Figure 14.
Normalized confusion matrices comparing the baseline YOLOv8x model, EfficientNetV2-S with the original YOLOv8 neck, and EfficientNetV2-L with a NAS-FPN-inspired neck.
Figure 14.
Normalized confusion matrices comparing the baseline YOLOv8x model, EfficientNetV2-S with the original YOLOv8 neck, and EfficientNetV2-L with a NAS-FPN-inspired neck.
Figure 15.
Qualitative detection results for E. coli across growth stages from 1.5 h to 4.0 h.
Figure 15.
Qualitative detection results for E. coli across growth stages from 1.5 h to 4.0 h.
Figure 16.
Qualitative detection results for Salmonella across growth stages from 1.5 h to 4.0 h.
Figure 16.
Qualitative detection results for Salmonella across growth stages from 1.5 h to 4.0 h.
Table 1.
Test split performance (all classes) across the evaluated architectural variants, including mAP@50–95. The YOLOv8x baseline results are taken from our prior study [
32]; mAP@50–95 was not reported in that work.
Bold indicates the best-performing value per metric;
bold underline indicates the second-best value per metric.
Table 1.
Test split performance (all classes) across the evaluated architectural variants, including mAP@50–95. The YOLOv8x baseline results are taken from our prior study [
32]; mAP@50–95 was not reported in that work.
Bold indicates the best-performing value per metric;
bold underline indicates the second-best value per metric.
| ID | Architecture Variant | Precision | Recall | mAP@50 | mAP@50–95 |
|---|
| 1 | Baseline (YOLOv8x backbone + YOLOv8 neck) | 0.891 | 0.867 | 0.898 | – |
| 2 | EffNetV2-S + YOLOv8 neck | 0.976 | 0.968 | 0.987 | 0.887 |
| 3 | EffNetV2-S (No neck) | 0.897 | 0.923 | 0.966 | 0.824 |
| 4 | EffNetV2-S + NAS-FPN neck | 0.969 | 0.962 | 0.986 | 0.884 |
| 5 | EffNetV2-M + YOLOv8 neck | 0.971 | 0.959 | 0.983 | 0.886 |
| 6 | EffNetV2-M (No neck) | 0.928 | 0.922 | 0.971 | 0.853 |
| 7 | EffNetV2-M + NAS-FPN neck | 0.969 | 0.962 | 0.985 | 0.885 |
| 8 | EffNetV2-L + YOLOv8 neck | 0.973 | 0.962 | 0.984 | 0.886 |
| 9 | EffNetV2-L (No neck) | 0.938 | 0.929 | 0.973 | 0.862 |
| 10 | EffNetV2-L + NAS-FPN neck | 0.978 | 0.951 | 0.983 | 0.888 |
| 11 | Faster R-CNN | 0.9016 | 0.9371 | 0.9016 | 0.7757 |
| 12 | RetinaNet (ResNet50-FPN) | 0.9680 | 0.9214 | 0.8513 | 0.8239 |
Table 2.
Computational complexity and efficiency comparison across all evaluated architectures, including the number of parameters, FLOPs, inference throughput (FPS), and end-to-end latency (ms/image).
Table 2.
Computational complexity and efficiency comparison across all evaluated architectures, including the number of parameters, FLOPs, inference throughput (FPS), and end-to-end latency (ms/image).
| ID | Architecture Variant | Params (M) | FLOPs (G) | FPS | ms/img |
|---|
| 1 | Baseline (YOLOv8x + YOLOv8 Neck) | 68.13 | 257.4 | 227.27 | 4.40 |
| 2 | EffNetV2-S + YOLOv8 Neck | 59.49 | 177.1 | 416.67 | 2.40 |
| 3 | EffNetV2-M + YOLOv8 Neck | 92.24 | 224.0 | 156.25 | 6.40 |
| 4 | EffNetV2-L + YOLOv8 Neck | 156.70 | 329.2 | 120.00 | 8.33 |
| 5 | EffNetV2-S (No Neck) | 22.15 | 51.3 | 700.00 | 1.43 |
| 6 | EffNetV2-M (No Neck) | 55.15 | 93.8 | 500.00 | 2.00 |
| 7 | EffNetV2-L (No Neck) | 119.91 | 208.2 | 210.00 | 4.76 |
| 8 | EffNetV2-S + NAS-FPN Neck | 25.85 | 77.3 | 560.00 | 1.79 |
| 9 | EffNetV2-M + NAS-FPN Neck | 58.28 | 118.1 | 320.00 | 3.13 |
| 10 | EffNetV2-L + NAS-FPN Neck | 122.54 | 246.0 | 181.82 | 5.50 |
| 11 | Faster R-CNN (ResNet50-FPN) | 41.08 | 133.92 | 24.87 | 40.00 |
| 12 | RetinaNet (ResNet50-FPN) | 32.19 | 85.0 | 90.00 | 11.06 |
| Disclaimer/Publisher’s Note: The statements, opinions and data contained in all publications are solely those of the individual author(s) and contributor(s) and not of MDPI and/or the editor(s). MDPI and/or the editor(s) disclaim responsibility for any injury to people or property resulting from any ideas, methods, instructions or products referred to in the content. |