


Abstract
Tiankeng ecosystems are characterized by strong microenvironmental gradients that influence plant adaptation; however, the molecular mechanisms underlying plant responses to altitudinal variation remain poorly understood. In this study, transcriptome sequencing and bioinformatic analyses were conducted to investigate the environmental adaptation mechanisms of three representative plant species (Hydrangea strigosa Rehder, Pilea martini, and Pilea sinofasciata) distributed along the vertical gradient of the Hanzhong Tiankeng in Shaanxi Province, China. Differential gene expression and functional enrichment analyses were performed to explore transcriptional responses under different altitude conditions. The results showed that flower coloration in Hydrangea strigosa Rehder was associated with the activation of sugar metabolism and triterpenoid biosynthesis pathways, suggesting potential indirect roles in modulating cellular metabolism and physiological conditions linked to flower coloration, while poor growth at the tiankeng bottom was associated with enhanced cellular respiration under low-light conditions, suggesting a potential link between energy metabolism and growth performance. In contrast, Pilea martini and Pilea sinofasciata exhibited better growth in the pit-bottom environment. Pilea martini promoted growth through enhanced carbohydrate metabolism and tricarboxylic acid cycle activity, whereas Pilea sinofasciata responded to environmental stress through hormone signaling, triterpenoid biosynthesis, and light signaling pathways. These findings reveal species-specific molecular strategies for plant adaptation to altitude-related environmental gradients in tiankeng ecosystems and provide insights into plant survival mechanisms in karst habitats.
1. Introduction
In 2016, a rare large tiankeng cluster was discovered in Hanzhong City, Shaanxi Province. This region lies in the transitional zone between the humid climate of the northern subtropical zone and the semi-humid climate of the warm temperate zone in China. Serving as an important intersection of northern and southern flora, it provides a natural experimental site for investigating how environmental variations across latitudinal gradients influence plant adaptation and evolution. Previous studies have shown that plants often exhibit adaptive differences in morphology, physiology, and genetics along latitude and altitude gradients in response to environmental factors such as light, temperature, and moisture [1,2]. Within the tiankeng ecosystem, pronounced small-scale environmental gradients exist: for example, compared with the pit mouth, the bottom region exhibits higher moisture levels [3], and studies on bryophyte distribution have documented a rapid increase in humidity and a decrease in light intensity from top to bottom [4]. This environmental heterogeneity creates diverse ecological niches for various plant populations, thereby driving adaptive differentiation and local evolution. In addition, as a typical karst landform unit, tiankengs are characterized by enclosed depressions, steep rock walls, and poor soil [5]. At a broader regional scale, karst environments are often accompanied by shallow soil, limited water availability, alkaline substrates, and a deficiency of essential nutrients such as nitrogen and phosphorus [6,7]. However, due to their unique geomorphological structure, tiankengs can create distinct microhabitats in which moisture accumulates, leading to relatively higher humidity at the pit bottom. These limiting factors promote a series of adaptive changes in plant morphology, physiological metabolism, and root function. Therefore, investigating the adaptive mechanisms of plants in the tiankeng area of Hanzhong across multiple environmental scales not only helps elucidate the principles governing plant survival and evolution under unique ecological conditions but also holds great significance for biodiversity conservation and ecological restoration.
At present, research on karst ecosystems has primarily focused on community structure, vegetation restoration, and soil microbial function, whereas systematic investigations into plant molecular adaptation mechanisms remain relatively limited [8,9,10]. In recent years, a few related studies have emerged—for example, Yang et al. conducted a genetic analysis of Illicium lanceolatum populations inside and outside the tiankeng and found significant genetic differentiation between them, suggesting that the unique microenvironment of tiankeng may promote local adaptation and evolution in plants [11]. However, comprehensive studies on the molecular adaptation mechanisms of plants along the vertical gradient of tiankeng are still lacking. Elucidating the transcriptomic regulatory characteristics of tiankeng plants, therefore, holds significant scientific value for understanding plant adaptation strategies in karst habitats.
In this study, three representative plant species coexisting along the vertical gradient of the Hanzhong tiankeng—Hydrangea strigosa Rehder, Pilea martini, and Pilea sinofasciata—were selected as research objects. These species exhibit complementary characteristics in their growth habits and altitude distributions within the tiankeng. From a taxonomic and ecological perspective, all three are dominant species within the tiankeng flora, representing shrubs of the family Hydrangeaceae and herbaceous plants of the family Urticaceae (with the two Pilea species being closely related). Together, they effectively reflect the adaptive differences among distinct phylogenetic lineages and functional groups within the tiankeng environment. From the perspective of altitude distribution and ecological adaptability, Hydrangea strigosa Rehder thrives in cool and humid environments, while the two Pilea species are shade-tolerant herbaceous plants that grow beneath forest canopies, sharing similar preferences for shaded and moist habitats. These three species occupy different altitudinal zones within the tiankeng, allowing for the comparative analysis of closely related species (Pilea genus) to reveal differences in their responses to vertical environmental gradients. Furthermore, cross-life-form comparisons between shrubs and herbs help elucidate the molecular adaptation characteristics of plants with distinct growth types. These species were selected based on field observations of their relatively high abundance, frequent occurrence, and ecological dominance across different altitudinal zones within the tiankeng.
Based on these characteristics, this study compared and analyzed the transcriptomic differences among the three plant species across different microenvironments with the tiankeng. The aim was to elucidate the molecular adaptation mechanisms of plants under vertical environmental gradients and to provide a theoretical foundation for understanding plant adaptation in the unique karst tiankeng habitat.
2. Materials and Methods
2.1. RNA Extraction, Quality Control, and Sequencing
In August 2023, fresh leaf samples of Hydrangea strigosa Rehder, Pilea martini, and Pilea sinofasciata were collected along the altitude gradient in Chanjiayan Tiankeng, Hanzhong City, Shaanxi Province. Approximately 2 g of mature, intact leaves were collected from each sampling point, rinsed with sterile water, blotted dry with sterile filter paper, and immediately placed into 5 mL cryovials. The samples were rapidly frozen in liquid nitrogen in the field and subsequently stored in an ultra-low-temperature freezer at −80 °C. Total RNA was extracted using TRIzolTM reagent (Invitrogen, Carlsbad, CA, USA; Catalog No. 15596026CN). Total RNA was extracted, and its purity was assessed using a kaiaoK5500® spectrophotometer (Kaiao, Beijing, China), while RNA integrity and concentration were evaluated using the Agilent Bioanalyzer 2100 system (Agilent TECHNOLOGIES, Santa Clara, CA USA). A total of 2 μg RNA per sample was used as input material for library preparation with the NEBNext® Ultra™ RNA Library Prep Kit for Illumina® (#E7530L, NEB, Ipswich, MA, USA) following the manufacturer’s instructions. Briefly, mRNA was purified using poly-T oligo-attached magnetic beads and fragmented under elevated temperature in the presence of divalent cations. First- and second-strand cDNA were subsequently synthesized, followed by purification, end repair, A-tailing, and adapter ligation. The libraries were amplified by means of PCR to obtain the final products. Library concentration was preliminarily quantified using Qubit® 3.0 (Thermo Fisher Scientific, Waltham, MA, USA), and insert size was assessed using the Agilent Bioanalyzer 2100 system (Agilent Technologies, Santa Clara, CA, USA). Accurate quantification was then performed using a StepOnePlus™ Real-Time PCR system (Thermo Fisher Scientific, Waltham, MA, USA) (library concentration >10 nM). Finally, clustering was carried out on a cBot system, and the libraries were sequenced on an Illumina platform to generate 150 bp paired-end reads.
2.2. Transcriptome Data Processing and Assembly
The raw transcriptome sequencing data obtained from three plant species (Hydrangea strigosa Rehder, Pilea martini, and Pilea sinofasciata) were first subjected to quality control using fastp (v 0.20.0) [12]. Low-quality reads and adapter sequences were removed using the default parameters to obtain high-quality clean reads for subsequent analysis. De novo transcriptome assembly was performed using Trinity(v2.9.1) [13] to reconstruct transcript sequences and predict coding sequences (CDSs). After merging the CDS results assembled from each sample, CD-HIT (v4.8.1) [14] was used to remove redundant sequences and generate a non-redundant reference transcriptome dataset. Assembly quality was evaluated based on contig statistics and completeness assessment using BUSCO v5.4.5 with the embryophyta_odb10 dataset. Transcript abundance was quantified using Salmon (v1.10.3) [15] at the transcript level based on a quasi-mapping approach, and subsequently summarized to the gene level for downstream analyses. Gene expression levels were normalized and expressed as TPM (Transcripts Per Million).
2.3. Sample Grouping
Sample details for Hydrangea strigosa Rehder, Pilea martini, and Pilea sinofasciata are provided in Table 1. To capture the natural phenotypic variation along the vertical gradient of tiankeng, different grouping strategies were designed. For Hydrangea strigosa Rehder, field observations indicated that individuals growing at the bottom and edges of the tiankeng generally exhibited more vibrant coloration than those in the middle region. Based on these consistent visual differences, Group_A was defined to compare plants from the bottom and edge with those from the middle region, aiming to explore the molecular mechanisms potentially associated with this phenotypic variation. In addition, plants growing along the edge of the tiankeng exhibited more vigorous growth than those at the bottom. To further analyze the impact of altitude differences on their molecular mechanisms, Group_B was established to compare plants from the pit edge with those from the pit bottom.
Table 1.
Sample information.
Overall, the two Pilea species exhibited better growth at the bottom of the tiankeng. To investigate the effect of altitude variation on transcription levels, Group_C was established to compare Pilea martini individuals from the bottom with those from the middle region; while Group_D compared Pilea sinofasciata individuals from the middle with those from the bottom of the tiankeng. Pilea martini and Pilea sinofasciata both belong to the family Urticaceae and the genus Pilea. As dominant herbaceous species growing beneath the tiankeng forest canopy, they share similar life forms and microhabitat conditions. To compare the lineage-specific transcriptional responses of congeneric plants under similar environmental conditions and to distinguish lineage constraint effects from environmentally induced effects, Group_E was established to compare Pilea martini and Pilea sinofasciata at the bottom of the tiankeng.
2.4. Identification of Differentially Expressed Genes and Functional Enrichment Analysis
To investigate gene expression patterns across the groups mentioned above, differential expression analysis was conducted using the ‘limma’ R package (version 3.58.1, https://www.bioconductor.org/packages/release/bioc/html/limma.html, accessed on 7 February 2025) [16]. Data processing followed established RNA-seq analytical frameworks [17]. Before analysis, gene expression data were log2-transformed [18]. Differentially expressed genes (DEGs) were identified based on both fold change and statistical significance. Different |log2FC| thresholds were applied for different comparison groups (|log2FC| ≥ 2 for Group_A and Group_B; |log2FC| ≥ 1 for Group_C and Group_D; |log2FC| ≥ 0.5 for Group_E), reflecting differences in biological variation among groups. Statistical significance was determined using the Benjamini–Hochberg method for multiple testing correction, and genes with p-values < 0.05 were considered significantly differentially expressed. Subsequently, GO enrichment analysis was performed on the differentially expressed genes (DEGs) identified in each group. The ‘AnnotationForge’ R package (version 1.44.0, https://bioconductor.org/packages/release/bioc/html/AnnotationForge.html, accessed on 17 February 2025) [19] was used to construct a custom database for enrichment analysis. First, the FASTA sequence files of the genes were annotated using the eggNOG-MAPPER online platform (http://eggnog5.embl.de/#/app/home, accessed on 9 February 2025) [20], and the resulting annotation information was used to construct a custom annotation database. The eggNOG-MAPPER online platform is based on curated orthology databases and widely used in functional annotation of transcriptomic data, providing a reliable basis for downstream analysis. Enrichment analysis was then performed using the ‘clusterProfiler’ R package (version 4.10.1, https://www.bioconductor.org/packages/release/bioc/html/clusterProfiler.html, accessed on 17 February 2025) [21], with p-values < 0.05 considered statistically significant. Relevant pathways were selected for GSVA enrichment analysis based on the differences in growth conditions among the groups, to elucidate pathway activation patterns. GSVA analysis was performed using the “GSVA” R package (version 1.50.5, https://bioconductor.org/packages//release/bioc/vignettes/GSVA/inst/doc/GSVA.html, accessed on 31 March 2025) [22] with the method set to “gsva”. The kernel function (kcdf) was set to “Gaussian”, and the minimum gene set size was set to the default value (minSize = 1).
2.5. Integrated Analysis of the Effects of Altitude on Plant Responses
To further investigate the molecular mechanisms underlying the comprehensive effects of altitude on plants, we identified the union of DEGs from Group_A, Group_B, Group_C, and Group_D, and conducted GO enrichment analysis on these genes. The significance threshold was set at p-value < 0.05. Pearson correlation analysis was conducted on the selected genes, and a correlation network was constructed using Cytoscape software (version 3.10.3, https://cytoscape.org/) [23] based on gene pairs with an absolute correlation coefficient greater than 0.9 and a p-value less than 0.05. The CytoHubba plugin (version 0.1, https://apps.cytoscape.org/apps/cytohubba, accessed on 20 March 2025) was employed to identify key hub genes within the network.
2.6. Plant Material Collection and Identification
All plant materials used in this study were collected from natural populations in the Hanzhong Tiankeng area, with permission granted by the Hanzhong Tiankeng Geological Heritage Protection and Utilization Center. Formal species identification of all samples was performed by Dr. Yong Wang, PhD in Botany, School of Biological Science and Engineering, Shaanxi University of Technology. Identification was conducted based on systematic comparison of key taxonomic characteristics, including stem and leaf morphology and inflorescence traits, with reference to authoritative floristic literature such as Flora of China, ensuring accurate taxonomic determination. Voucher specimens were prepared for all studied species and are currently stored in the Qinba State Key Laboratory of Biological Resources and Ecological Environment (Incubation), Shaanxi University of Technology. The specimens are undergoing accession and cataloguing at the Qinba Biological Museum of Shaanxi University of Technology, and accession numbers will be provided after herbarium registration. To ensure research reproducibility, leaf tissue samples from the same collection batch were preserved and stored at −80 °C in the Qinba State Key Laboratory of Biological Resources and Ecological Environment (Incubation). These materials are available for future molecular or phytochemical verification if required.
2.7. Ethics Statement and Compliance with Regulations
The collection of wild plant materials, including Hydrangea strigosa Rehder, Pilea martini, and Pilea sinofasciata, was approved by the Hanzhong Tiankeng Geological Heritage Protection and Utilization Center, the administrative authority responsible for conservation management of the study area. All sampling activities complied with institutional, national, and international guidelines and legislation, including the Convention on the Trade in Endangered Species of Wild Fauna and Flora (CITES) and the regulations on wild plant protection in Shaanxi Province, China. The studied species are not listed as protected plants. This study followed the principles of sustainable and non-destructive sampling, and all activities did not negatively impact the survival or regeneration of natural plant populations.
3. Results
3.1. De Novo Transcriptome Assembly and Quality Assessment
The de novo transcriptome assembly generated 1,517,699 contigs with a contig N50 of 829 bp. BUSCO analysis against embryophyta_odb10 indicated high completeness, with 98.9% complete BUSCOs (4.1% single-copy and 94.8% duplicated), 1.0% fragmented, and 0.1% missing BUSCOs (n = 1614).
3.2. Identification of Differentially Expressed Genes
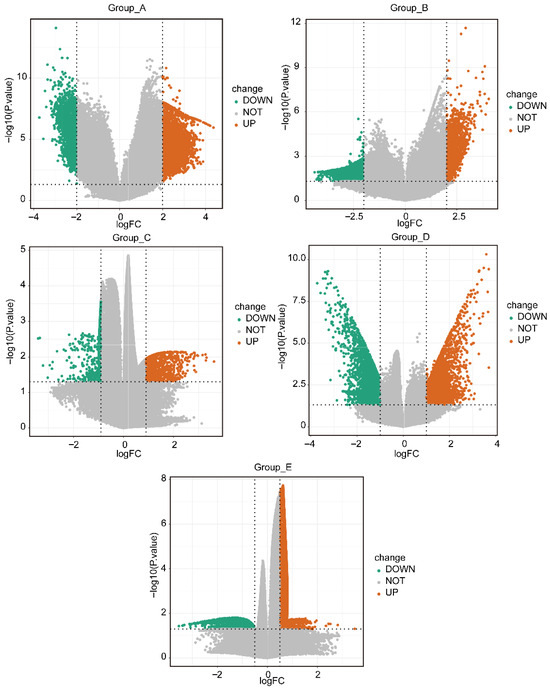
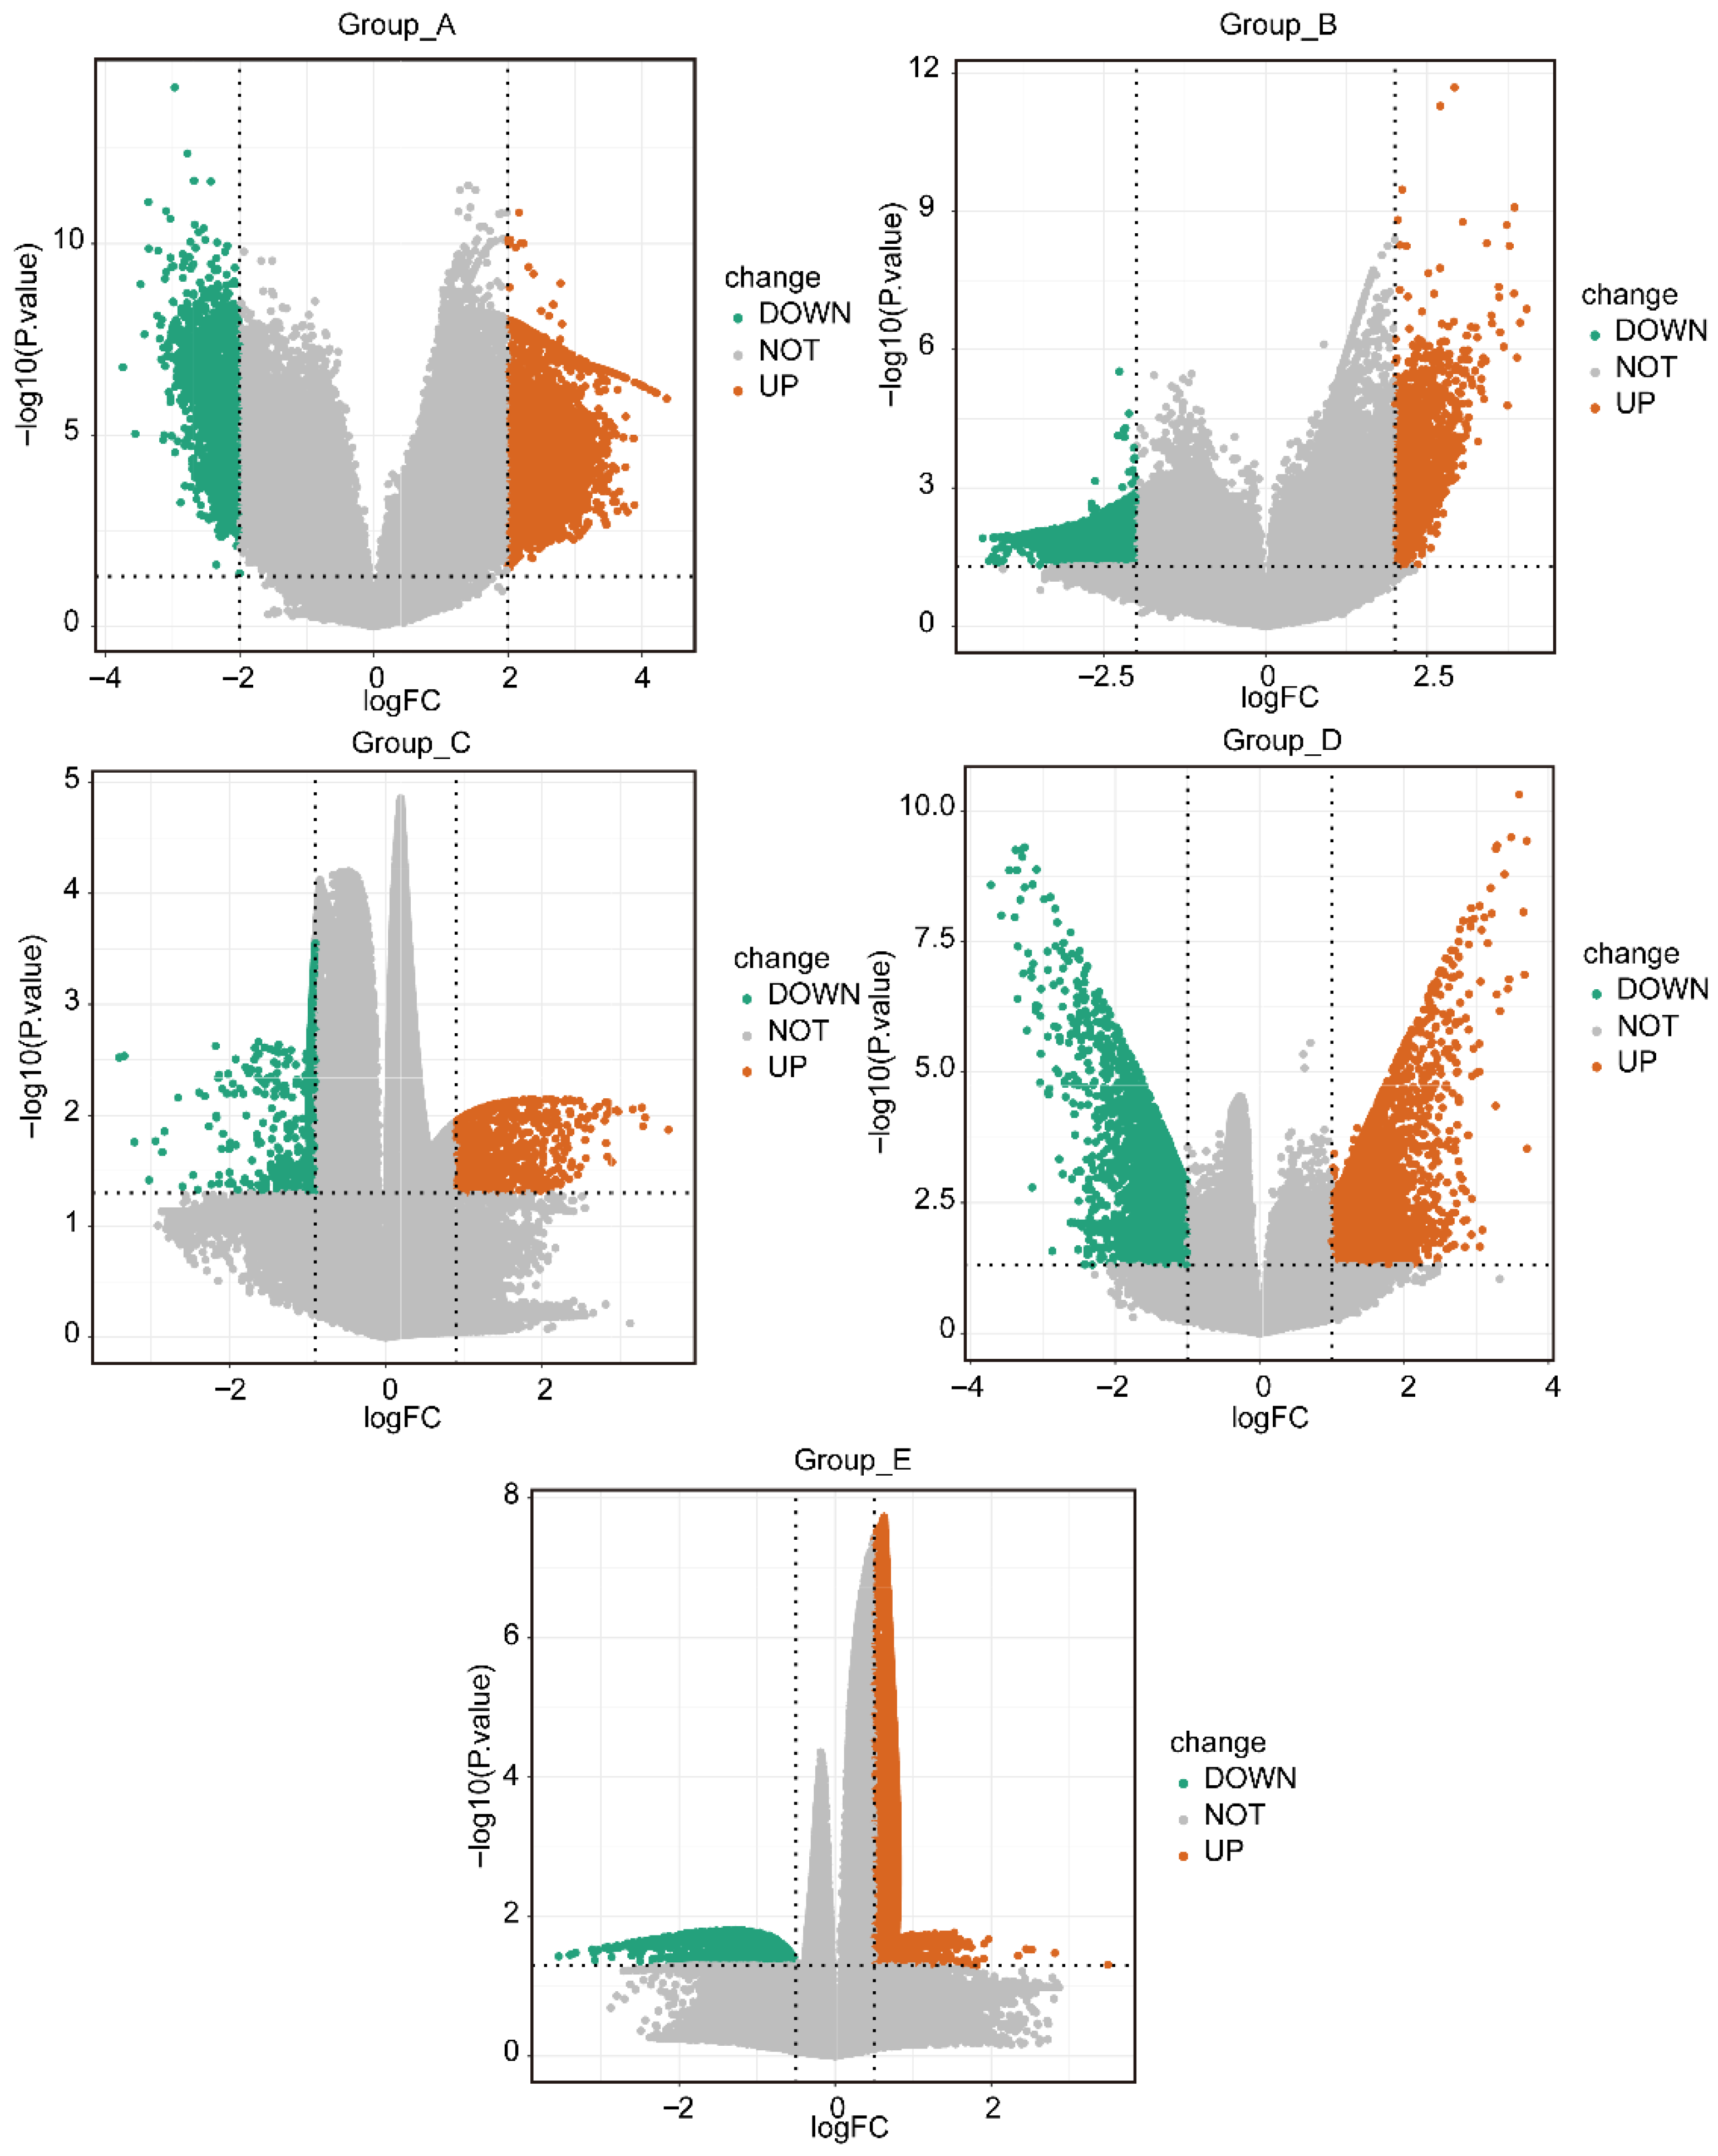
This study analyzed differential expression across five pairwise group comparisons: Group_A, Group_B, Group_C, Group_D, and Group_E [Figure 1]. A summary of the differential expression results for all comparisons is provided in Table 2. Detailed information on the differentially expressed genes was provided in Table S1. A total of 12,342 genes were identified in Group_A as being associated with differences in flower color among plants. Compared with Hydrangea strigosa Rehder samples grown in the middle of the tiankeng, 10,344 genes were upregulated, and 1998 genes were downregulated in samples grown at the bottom and edge. In Group_B, 11,697 genes were found to be differentially expressed in association with plant vigor. Samples from the edge of the tiankeng displayed 2428 upregulated and 9269 downregulated genes compared to those from the bottom. Group_C revealed 11,930 genes with differential expression linked to differences in the growth size of Pilea martini. Compared to the bottom-growing samples, those from the middle exhibited 1021 upregulated and 10,909 downregulated genes. In Group_D, a total of 8770 DEGs were identified as associated with variations in plant size of Pilea sinofasciata, including 4225 upregulated and 4545 downregulated genes in plants growing in the middle compared to those at the bottom of the tiankeng. At the bottom of the pit (Group_E), Pilea martini showed 20,557 DEGs relative to Pilea sinofasciata, comprising 17,746 upregulated and 2811 downregulated genes.
Figure 1.
Volcano plot of differentially expressed genes across different groups.
Table 2.
Summary of differential expression.
3.3. Pathway Enrichment Analysis of Group_A–Group_D
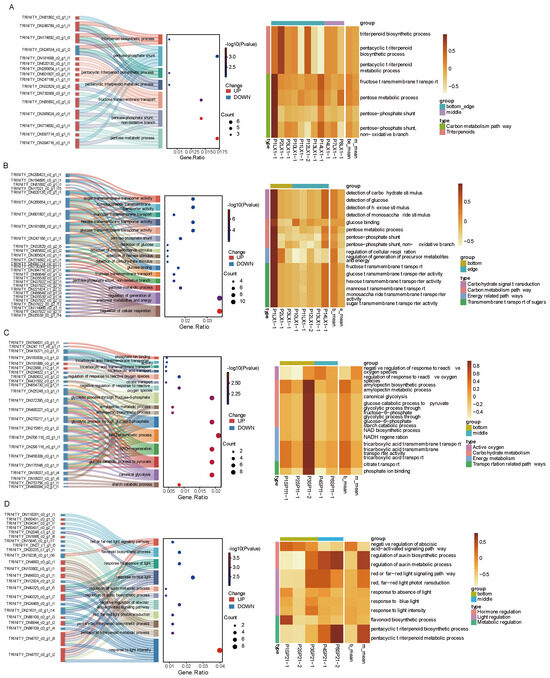
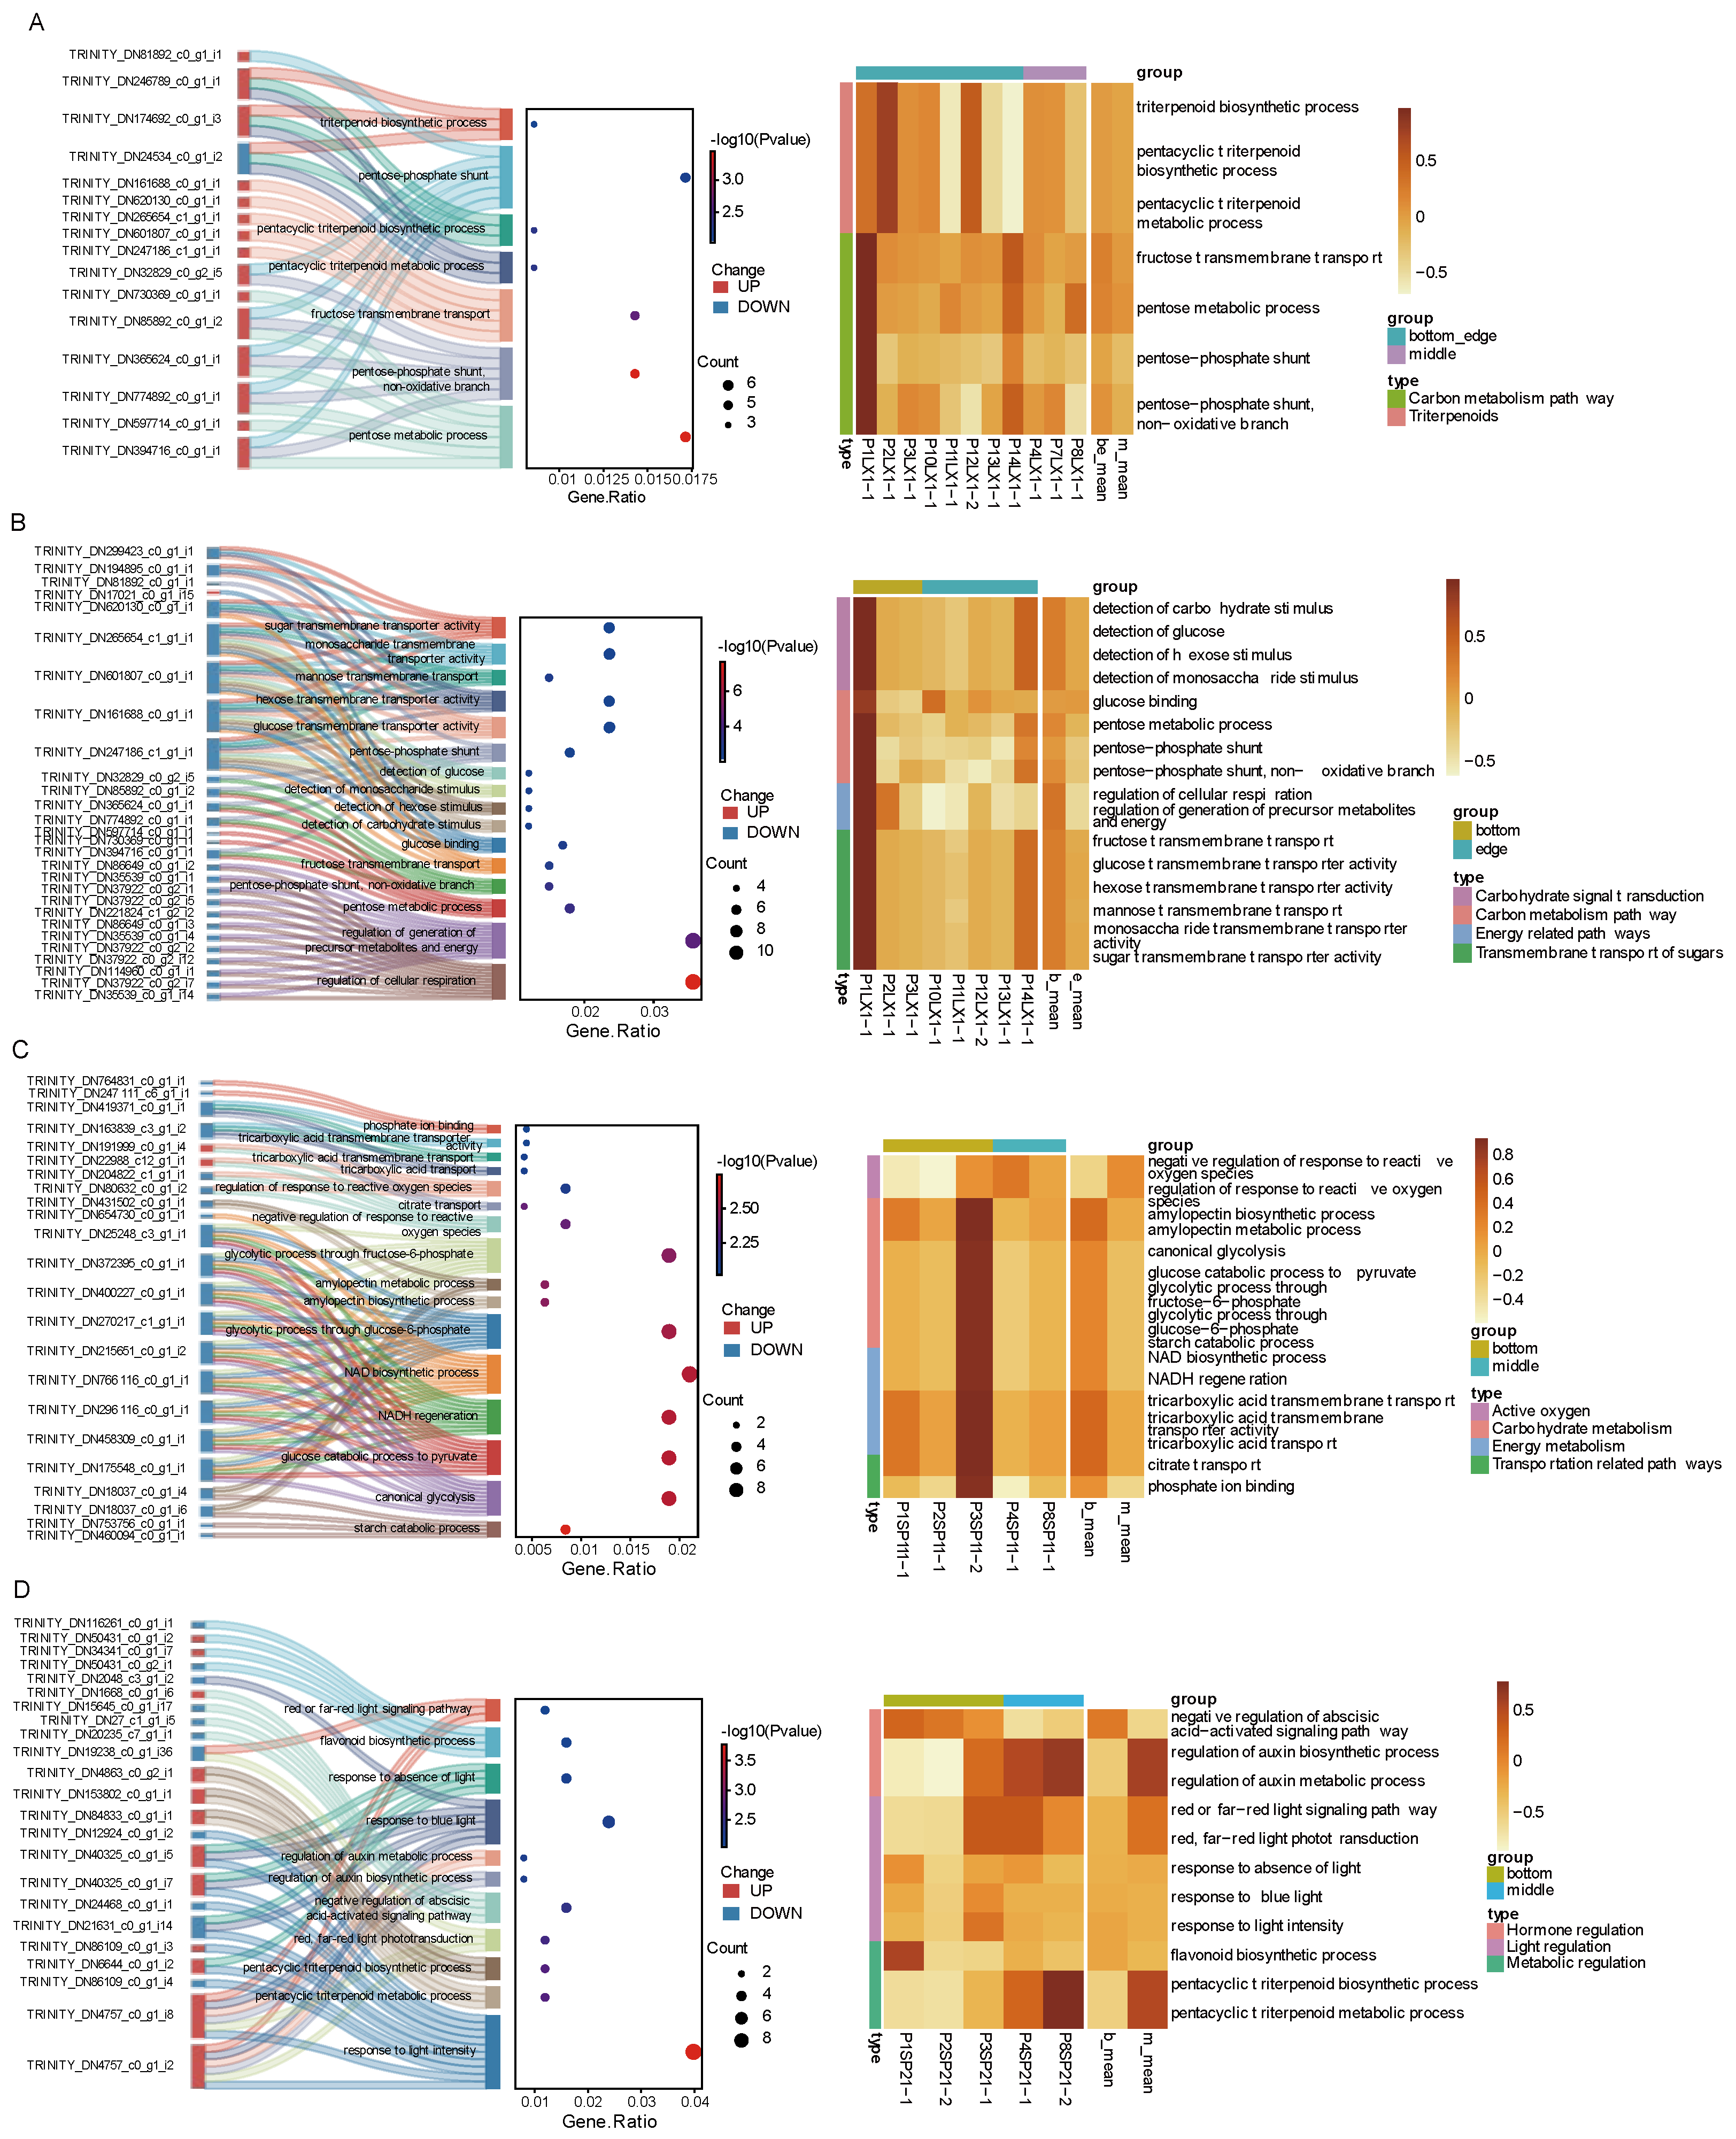
The DEGs in Group_A were primarily enriched in pathways related to carbohydrate metabolism and secondary metabolism. Specifically, these pathways included pentose metabolism and the pentose phosphate pathway, as well as triterpenoid metabolism and biosynthesis. Furthermore, the DEGs enriched in these pathways were significantly upregulated in the pit bottom and pit edge groups. GSVA analysis revealed that the pathway scores in the pit bottom and pit edge groups were higher than those in the middle group. These results suggested that the activation of these pathways in Hydrangea strigosa Rehder growing at the pit bottom and edge might be associated with flower coloration, potentially through indirect effects such as metabolic regulation and stress-related physiological processes [Figure 2A, Tables S2 and S3].
Figure 2.
Functional annotation and pathway enrichment analysis of DEG in Group_A (A), Group_B (B), Group_C (C), and Group_D (D). The left Sankey diagram illustrates the association between differentially expressed genes and their corresponding GO pathways (red squares indicate upregulated genes, blue squares indicate downregulated genes); the middle dot plot presents the significance of pathway enrichment based on GeneRatio (dot size indicates the number of genes, and color reflects the p-value); the right panel shows GSVA scores of the enriched pathways across different samples.
The DEGs in Group_B were mainly enriched in pathways associated with energy metabolism, carbohydrate metabolism, and sugar transport. These included processes related to cellular respiration, generation of precursor metabolites and energy, as well as sugar sensing and transmembrane transport of various carbohydrates such as glucose, hexose, and monosaccharides. Additionally, genes involved in the aforementioned pathways were significantly upregulated in the pit edge group. GSVA analysis of these pathways showed that the pit edge group exhibited higher pathway scores compared to the pit bottom group. This suggested that Hydrangea strigosa Rehder in the pit edge group might have activated these pathways during growth to regulate plant vigor [Figure 2B, Tables S2 and S3].
In Group_C, the DEGs were mainly enriched in pathways related to carbohydrate metabolism, energy metabolism, and oxidative stress response. These included processes associated with glycolysis, starch metabolism, NAD/NADH metabolism, and tricarboxylic acid (TCA) transport, as well as regulation of reactive oxygen species (ROS) responses. Except for TRINITY_DN191999_c0_g1_i4 and TRINITY_DN22988_c12_g1_i1, all other genes involved in these pathways were downregulated in Pilea martini samples from the middle region. GSVA enrichment analysis revealed that the pathway ‘negative regulation of response to reactive oxygen species’ had a higher score in the middle group, whereas the remaining pathways showed lower scores compared to those in Pilea martini growing at the bottom of the tiankeng [Figure 2C, Tables S2 and S3].
In Group_D, the DEGs were primarily enriched in pathways associated with light response, hormone regulation, and secondary metabolism. These included processes related to light signaling (e.g., red/far-red and blue light responses), regulation of phytohormones such as abscisic acid (ABA) and auxin, as well as triterpenoid and flavonoid biosynthesis. Genes involved in the aforementioned pathways revealed that 12 genes were upregulated and 11 genes were downregulated in the middle Pilea sinofasciata group. GSVA enrichment analysis showed that the score for the ‘negative regulation of abscisic acid-activated signaling pathway’ in Pilea sinofasciata from the middle environment was lower than that in plants from the pit bottom. In contrast, the scores for ‘regulation of auxin biosynthetic process,’ ‘regulation of auxin metabolic process,’ ‘red, far-red light phototransduction,’ ‘red or far-red light signaling pathway, ‘pentacyclic triterpenoid metabolic process,’ and ‘pentacyclic triterpenoid biosynthetic process’ were higher in the middle group [Figure 2D, Tables S2 and S3].
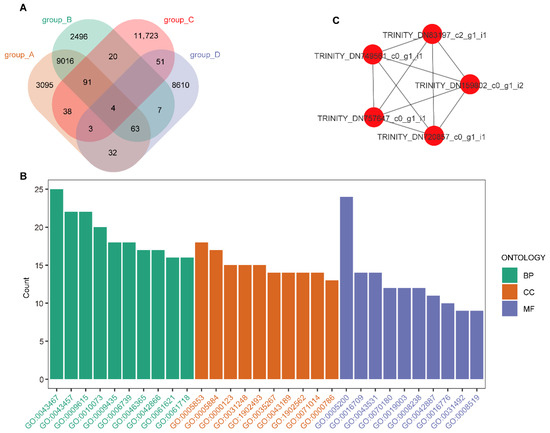
3.4. Identification and Functional Characterization of Genes in the Combined Gene Set
A total of 35,249 genes were shared across Group_A–Group_D [Figure 3A]. Functional enrichment analysis indicated that these genes were involved in a wide range of molecular functions, cellular components, and biological processes [Figure 3B, Table S4]. In the Molecular Function (MF) category, enriched terms were mainly related to catalytic activity and binding functions, including oxidoreductase activity and ADP binding. In the Cellular Component (CC) category, enriched terms were primarily associated with protein complexes, particularly histone acetyltransferase-related complexes. In the Biological Process (BP) category, enriched pathways were mainly involved in energy metabolism, cellular respiration, and stress-related responses, including processes such as regulation of energy generation and response to external stimuli.
Figure 3.
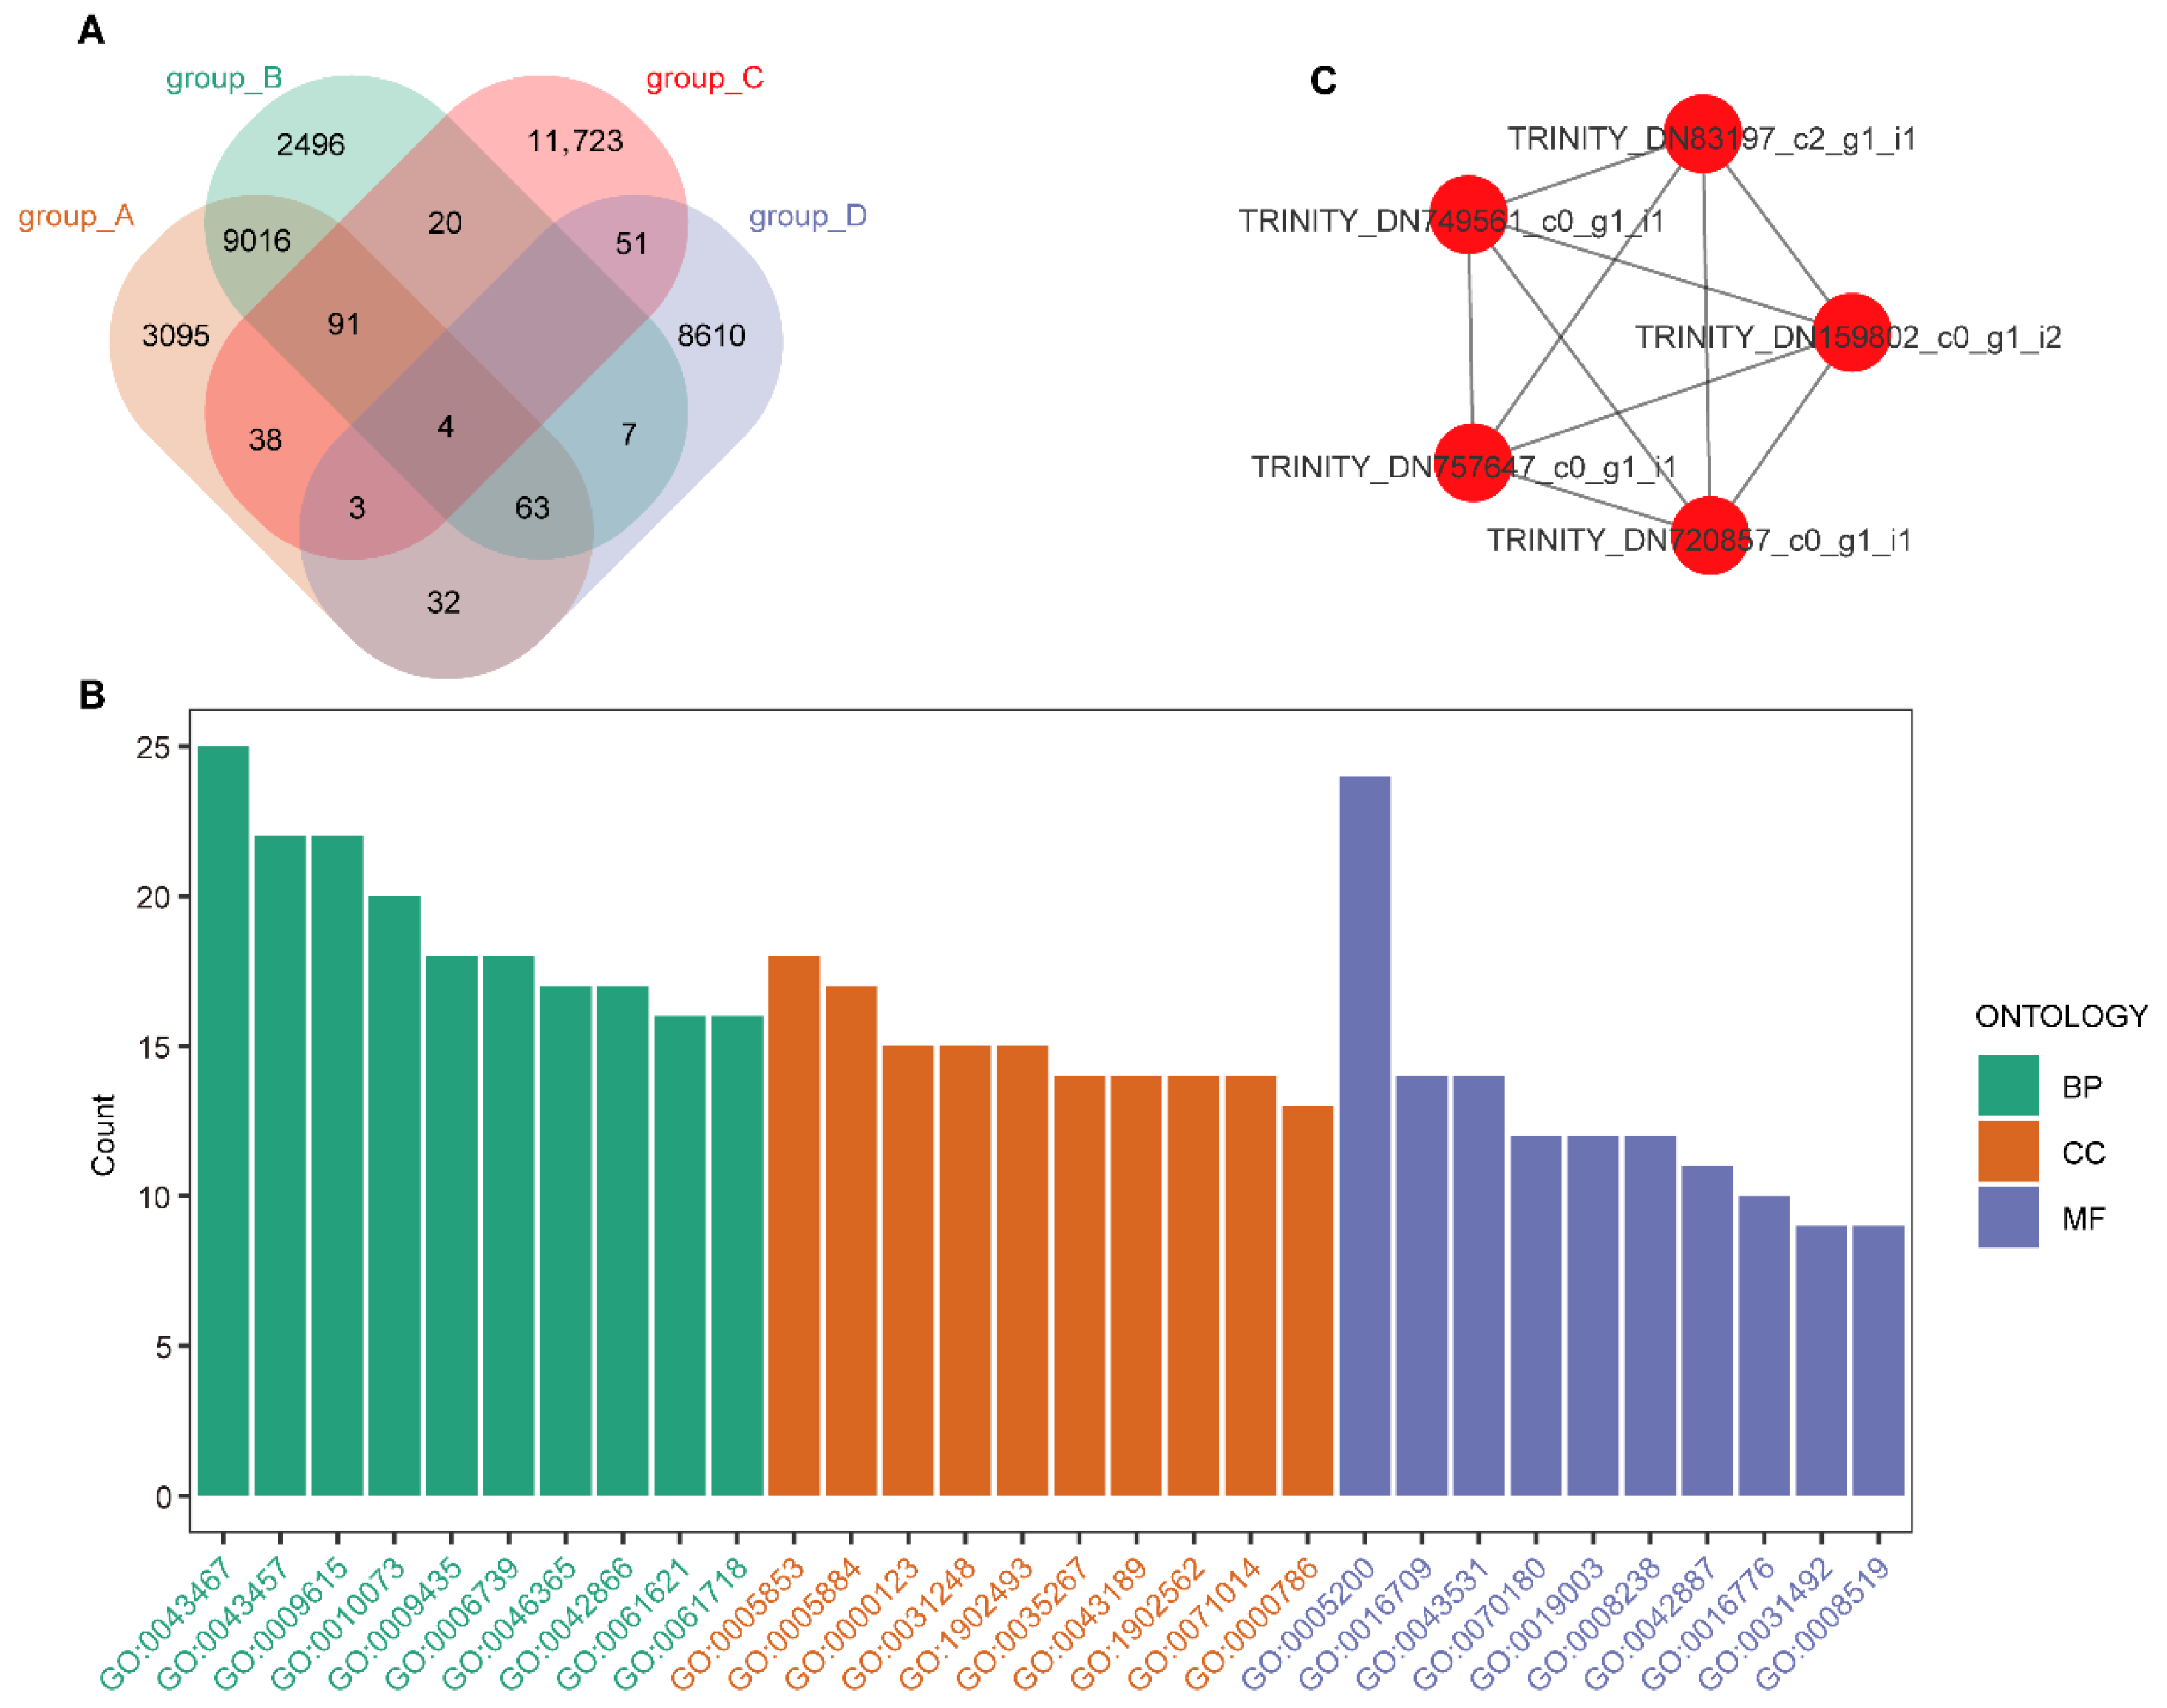
(A) Venn diagram illustrating the union of DEGs from four groups. (B) Bar chart showing the GO enrichment results of the merged gene set, including BP (green), CC (orange), and MF (purple). The x-axis represents GO term identifiers, and the y-axis indicates the number of genes annotated to each term. (C) Key genes identified in the gene correlation network.
Subsequently, pathways relevant to altitude-associated environmental variation were selected for further analysis. Genes associated with enriched BP pathways were selected, and a gene correlation network was constructed based on Pearson correlation analysis [Figure S1, Table S5]. Among these, TRINITY_DN83197_c2_g1_i1, TRINITY_DN159802_c0_g1_i2, TRINITY_DN720857_c0_g1_i1, TRINITY_DN757647_c0_g1_i1, and TRINITY_DN749561_c0_g1_i1 were identified as key genes within the network [Figure 3C]. Based on gene annotation information, TRINITY_DN159802_c0_g1_i2 was found to be involved in the tricarboxylic acid (TCA) cycle within the carbon metabolism pathway, while TRINITY_DN720857_c0_g1_i1 was associated with the inositol phosphate metabolism pathway, also within the carbon metabolism network.
3.5. Functional Analysis of DEGs in Group_E
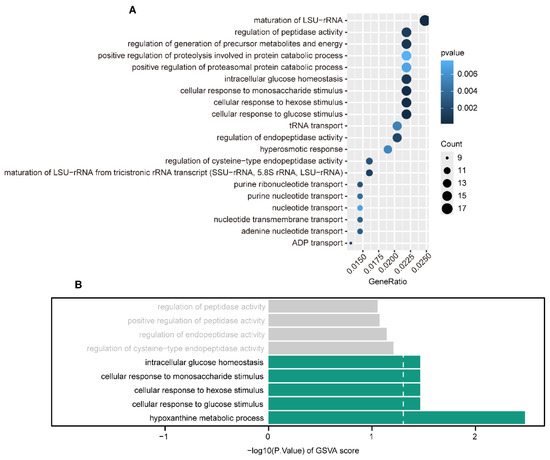
To further investigate the functions of differentially expressed genes in Group_E, GO enrichment analysis was performed using a significance threshold of p-value < 0.01, and were interpreted with caution. Due to the use of a custom annotation database and limited sample size, adjusted p-values were not used as a strict filtering criterion. The results indicated that the DEGs were primarily enriched in BP pathways, including maturation of LSU-rRNA, cellular response to monosaccharide stimulus, and cellular response to hexose stimulus [Figure 4A, Table S6]. GSVA enrichment analysis revealed that hypoxanthine metabolic process, cellular response to glucose stimulus, cellular response to hexose stimulus, cellular response to monosaccharide stimulus, and intracellular glucose homeostasis were upregulated in Pilea martini samples [Figure 4B, Table S7].
Figure 4.
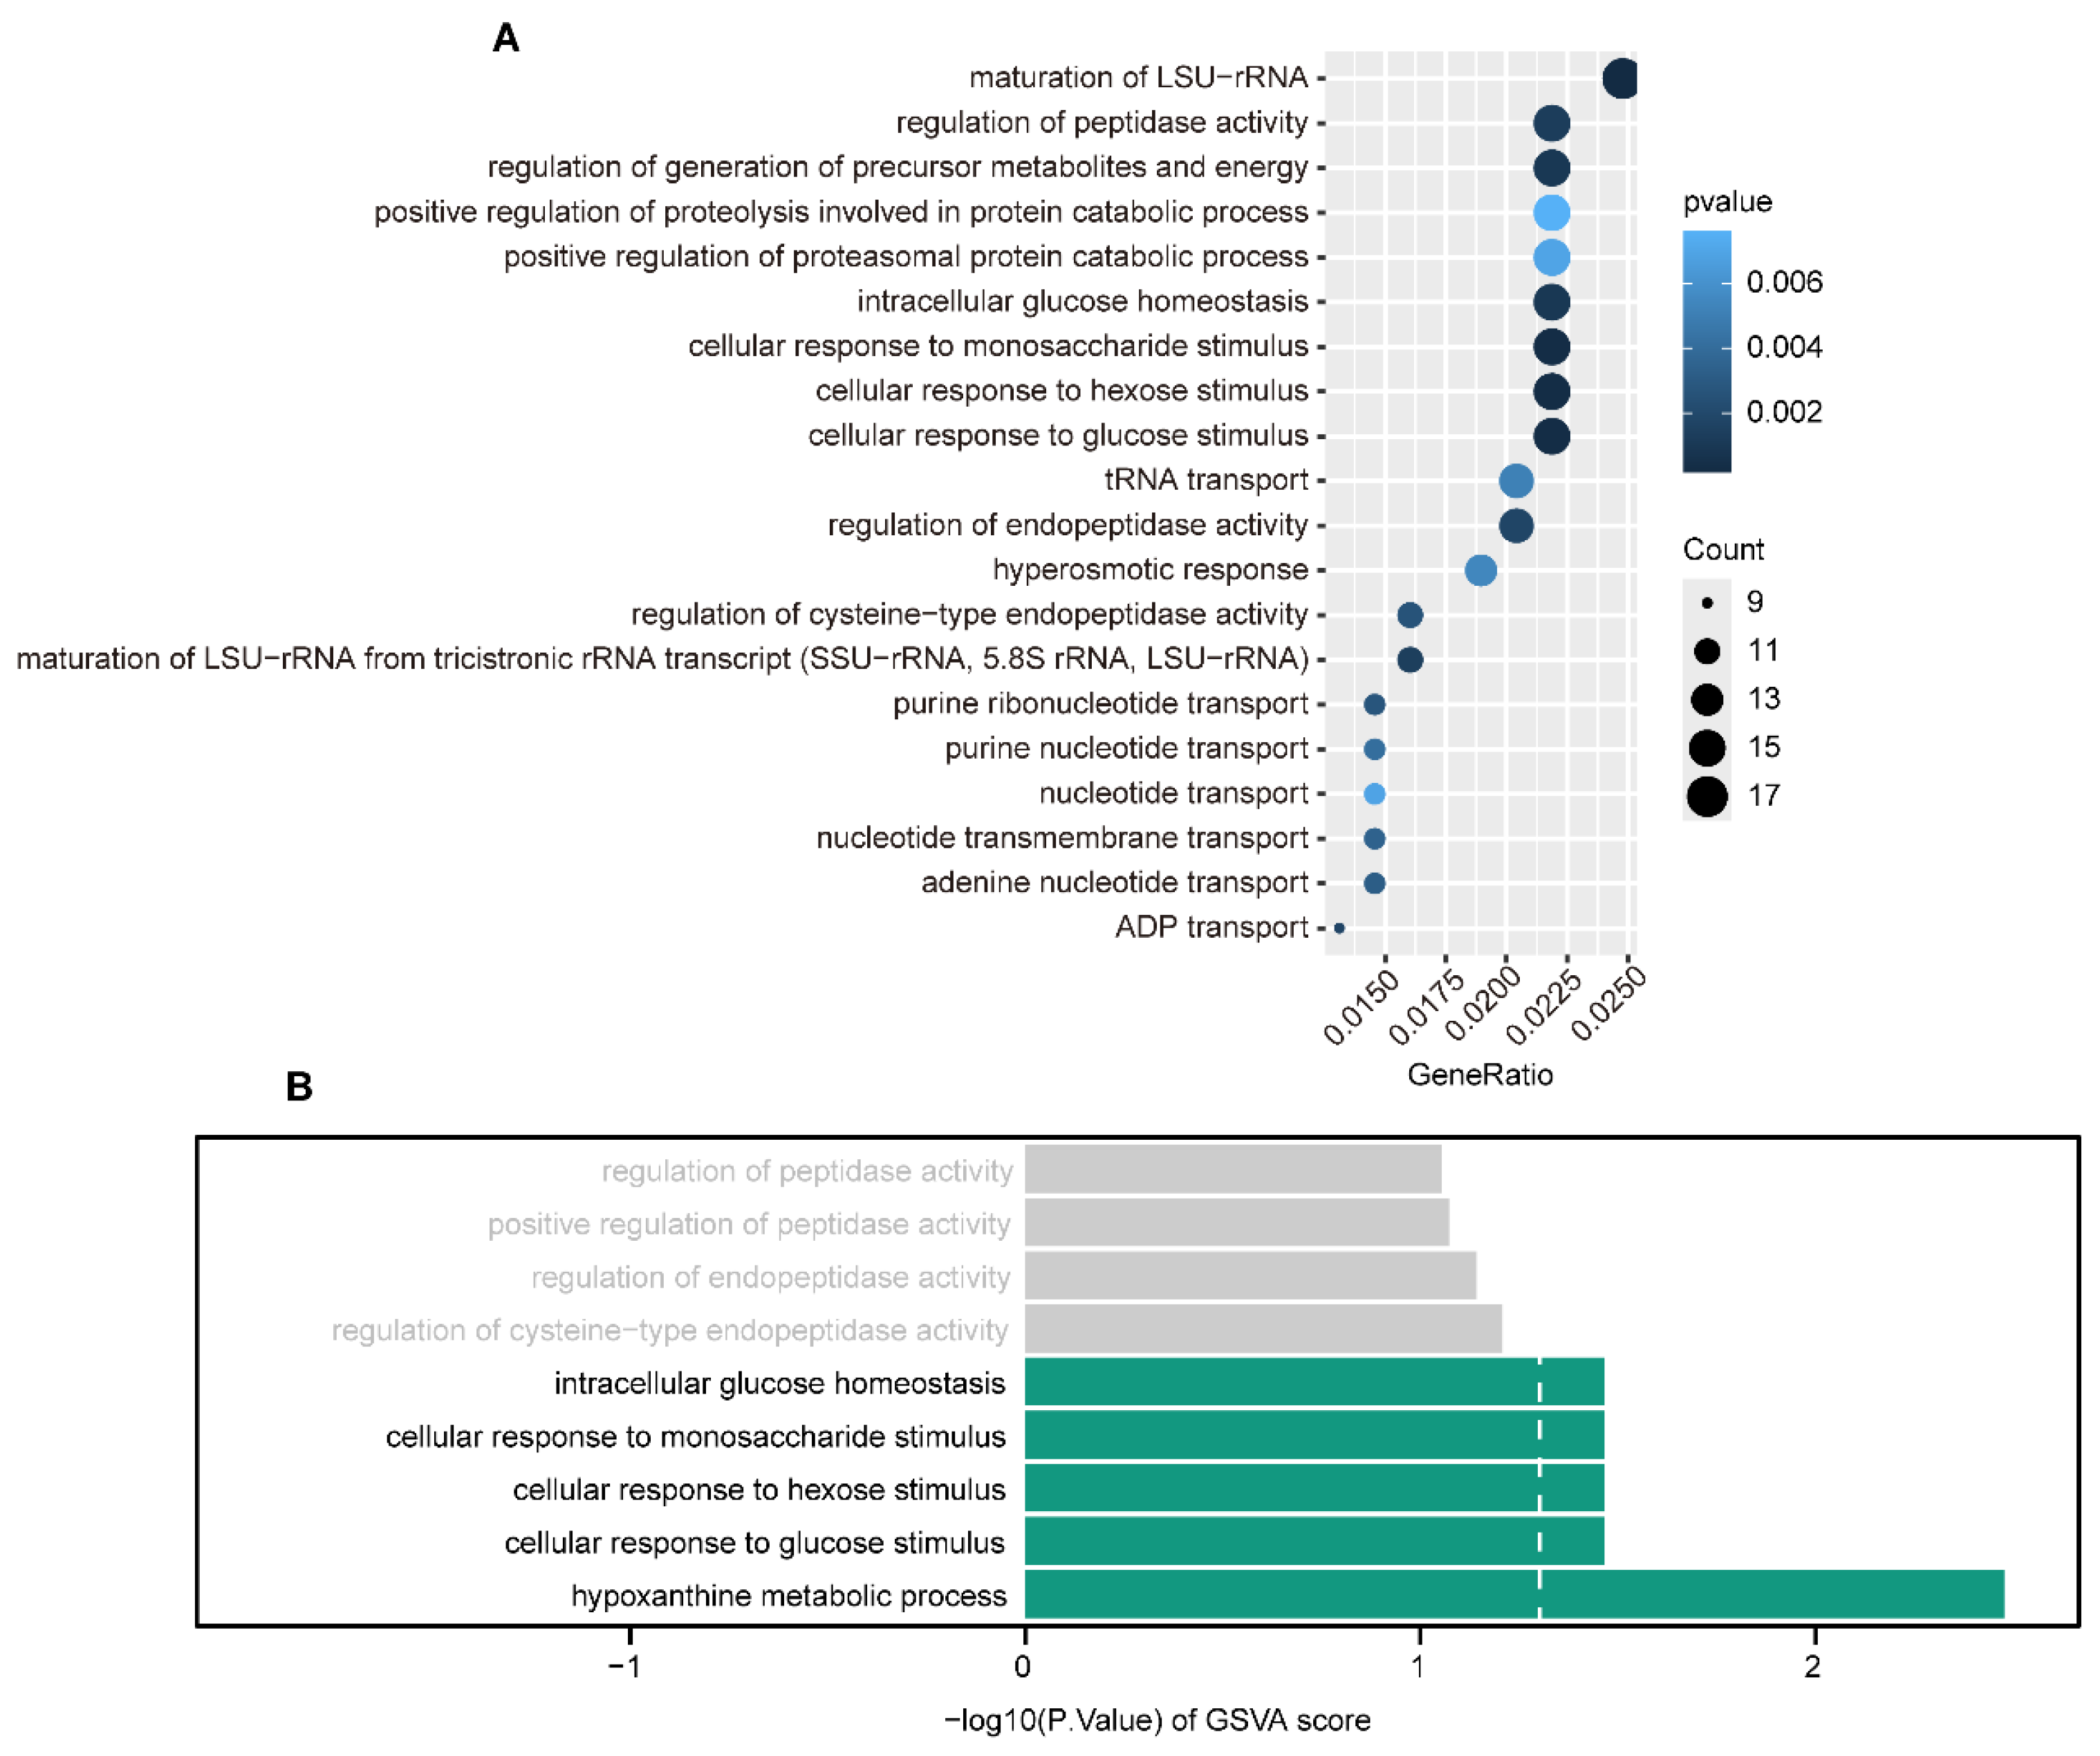
(A) The bubble plot displays the BP pathway involving DEGs. Bubble size indicates the number of genes enriched in each pathway, while bubble color represents the corresponding p-value. (B) The bidirectional bar chart presents the GSVA enrichment analysis results for the Pilea martini and Pilea sinofasciata groups. Green bars indicate pathways significantly upregulated in the Pilea martini samples, gray bars represent pathways with no statistically significant differences.
4. Discussion
Transcriptomic approaches have been widely used to investigate plant responses to environmental gradients, providing insights into molecular adaptation mechanisms under varying ecological conditions [24]. This study utilized transcriptome data from Hydrangea strigosa Rehder, Pilea martini, and Pilea sinofasciata to comprehensively analyze the similarities and differences in plant response mechanisms across different altitudinal gradients. As described in the Section 2, Hydrangea strigosa Rehder individuals at the bottom and edge of the tiankeng exhibited more vivid flower coloration than those in the middle region, and this naturally observed variation was used to explore the molecular mechanisms associated with pigment metabolism. Differential expression analysis identified 12,342 genes associated with this variation, with enrichment in pathways related to sugar metabolism and triterpenoid biosynthesis. GSVA results further indicated that these pathways were more active in plants from the bottom and edge compared to those from the middle region. These metabolic pathways are known to play important roles in plant growth, stress responses, and secondary metabolism [25,26,27,28]. Triterpenoids, in particular, exhibit notable antioxidant and stress-resistance properties, which may indirectly influence pigment-related processes [29,30]. Therefore, the activation of these pathways may reflect broader physiological adjustments associated with environmental variation. Overall, these findings suggest that the observed differences in flower coloration may be associated with coordinated changes in metabolic and physiological processes, rather than direct effects of specific pathways. It should be noted that the differences in flower color are based on qualitative observation, and the results should be interpreted with caution.
Furthermore, we found that different altitude conditions (pit bottom and pit edge) were associated with differences in the growth vigor of Hydrangea strigosa Rehder, with 11,697 DEGs identified in relation to altitudinal variation. GSVA analysis indicated that, in the pit bottom environment—generally characterized by relatively lower light conditions—pathways related to energy metabolism were more active. This pattern may suggest that plants at lower altitudes tend to rely more on cellular respiration–related processes, potentially as a compensatory response under reduced light availability. Previous studies have shown that under low light conditions, photosynthetic activity is reduced, leading to decreased ATP and NADPH production and consequently limiting biomass accumulation [31,32]. Under such conditions, reduced photosynthetic input may result in decreased carbohydrate availability, and plants may adjust respiratory activity while relying on stored carbon reserves to sustain basic metabolic processes [33]. However, while this metabolic adjustment may support basic physiological processes, it may also be associated with reduced growth performance, possibly due to increased consumption of stored resources and limited carbon assimilation. This observation may reflect differences in resource allocation strategies of Hydrangea strigose Rehder under varying altitudinal conditions.
Observation of the growth status of Pilea martini across different altitude gradients revealed that plants growing in the pit bottom (low-altitude) environment exhibited better growth compared to those in the middle (higher-altitude) region. Further transcriptomic analysis identified 11,930 DEGs associated with variation along the altitude gradient. GO enrichment analysis indicated that these genes were primarily involved in carbohydrate metabolism, oxidative stress response, and tricarboxylic acid (TCA) cycle-related pathways. GSVA analysis showed that oxidative stress–related pathways were more active in the middle-altitude environment, whereas pathways related to carbohydrate metabolism and the TCA cycle were more active in the pit bottom environment. These patterns may suggest that plants in the middle-altitude environment experience relatively higher oxidative stress, which could be associated with reduced growth performance. Reactive oxygen species (ROS) play a central role in plant stress responses and signaling [34]. Under oxidative stress conditions, plants typically activate ROS-scavenging pathways to mitigate cellular damage [34], and such processes may also influence plant growth by affecting energy metabolism [35]. In contrast, the relatively favorable conditions in the pit bottom environment may be associated with reduced oxidative stress and enhanced metabolic activity. Under such conditions, plants may allocate more resources to carbohydrate metabolism and energy production, which could support improved growth performance. Previous studies have shown that water-sufficient environments are often associated with enhanced carbohydrate metabolism and biomass accumulation [36]. Overall, these results suggest that differences in growth performance of Pilea martini across altitudinal gradients may be associated with coordinated changes in oxidative stress responses and energy metabolism, rather than being driven by a single environmental factor.
This study further investigated the effects of different altitude gradients on the growth performance of Pilea sinofasciata. Growth observations revealed that Pilea sinofasciata exhibited slower growth in the central (high-altitude) environment compared to the pit bottom (low-altitude) environment. Differential expression analysis identified a total of 8770 genes associated with variation across altitudinal environments. GO analysis revealed that these genes were primarily involved in hormone regulation pathways, light signaling response, and pentacyclic triterpenoid metabolism. GSVA analysis showed that light–signaling–related pathways were more active in the central (high-altitude) environment. This pattern may suggest that plants in this region are exposed to different light conditions compared to those at lower altitudes, potentially leading to altered light-response processes. Previous studies have shown that high light intensity or fluctuating light conditions can affect the photosynthetic system and may induce photooxidative stress and reactive oxygen species (ROS) accumulation [37]. In addition, the pentacyclic triterpenoid metabolic pathway was found to be more active in plants from the central environment. Triterpenoid compounds are known to possess antioxidant properties [29], and their increased activity may be associated with enhanced stress-response capacity under varying environmental conditions. These results suggest that the differences in growth performance of Pilea sinofasciata across altitudinal gradients may be associated with coordinated changes in light-response pathways, hormone regulation, and secondary metabolism.
Additionally, in the pit bottom environment, pathways related to negative regulation of the abscisic acid (ABA)-activated signaling pathway were more active, whereas in the middle environment, auxin-related pathways showed higher activity. ABA is widely recognized as a key hormone involved in plant responses to abiotic stress [38]. Increased activity of pathways associated with negative regulation of ABA signaling may reflect a reduced activation of stress-response processes, potentially allowing plants to allocate more resources toward growth and development. In contrast, the activation of auxin-related pathways may be associated with adjustments in growth regulation under varying environmental conditions [39]. These patterns may suggest differences in hormonal regulation strategies across altitudinal environments. Taken together, these results indicate that variations in hormone-related pathways may be associated with differences in the growth performance of Pilea sinofasciata across altitudinal gradients. However, these interpretations are based on indirect inference from transcriptomic data, and the specific environmental drivers and underlying mechanisms require further investigation.
Using bioinformatics approaches, we further elucidated the differences in response mechanisms among different plant species exposed to the same altitudinal environment. Transcriptome analysis revealed substantial differences in molecular responses between Pilea martini and Pilea sinofasciata growing at the pit bottom, with a total of 20,557 DEGs identified. GSVA analysis of BP pathways enriched by these genes revealed that Pilea martini exhibited higher activity in pathways such as hypoxanthine metabolic process, cellular response to glucose/hexose/monosaccharide stimulus, and intracellular glucose homeostasis compared to Pilea sinofasciata. Cellular responses to hexose sugars such as glucose are often linked to sugar signaling and energy production in plants, thereby supporting enhanced growth and development [40,41]. Purine metabolism plays a crucial role in maintaining nitrogen balance, providing energy, and mediating environmental stress responses in plants [42]. As a component of purine metabolism, the activation of hypoxanthine-related processes may be associated with the maintenance of basic metabolic functions. In this study, the relatively higher activity of sugar-responsive and purine metabolic pathways in Pilea martini may suggest differences in carbon metabolism and energy utilization between the two species under similar environmental conditions. These differences may be associated with variation in growth performance observed between species. In contrast, the lower activity of these pathways in Pilea sinofasciata may reflect differences in metabolic regulation under the same conditions. In summary, this study demonstrated that even under the same altitudinal conditions, different plant species exhibit distinct and species-specific metabolic response patterns. This divergence not only reflects species-specific differences in ecological niche selection and resource competition strategies but also highlights the complexity and diversity of ecological adaptation mechanisms among plant species. Such species-specific responses are commonly observed in ecological genomics studies of plant adaptation [43].
5. Conclusions
This study provides transcriptomic insights into the molecular responses of Hydrangea strigose Rehder, Pilea martini, and Pilea sinofasciata to altitudinal variation within the tiankeng ecosystem. The results indicate that differences in metabolic pathways, including carbohydrate metabolism, energy metabolism, hormone regulation, and secondary metabolism, are associated with variation in plant growth performance and phenotypic traits across environments. In addition, species-specific differences in metabolic responses were observed, suggesting distinct adaptive strategies among coexisting plant species. However, several limitations should be acknowledged. Environmental factors such as light intensity, water availability, and humidity were not quantitatively measured in this study, and thus, the interpretations regarding environmental effects are based on indirect inference. In addition, the conclusions are primarily derived from transcriptomic data without experimental validation (e.g., qRT-PCR), which may limit the strength of functional interpretation. Some comparison groups included a limited number of biological replicates (e.g., n = 2), which may reduce the statistical robustness of the analysis. These data were retained due to RNA quality control constraints and the challenges of sample collection in natural field conditions, but the corresponding results should be interpreted with caution. Future studies should integrate transcriptomic analyses with physiological measurements and metabolomic approaches, as well as experimental validation of key genes, to further elucidate the regulatory mechanisms underlying plant adaptation to complex environmental gradients in karst ecosystems.
Supplementary Materials
The following supporting information can be downloaded at https://www.mdpi.com/article/10.3390/app16094242/s1. Supplementary Table S1: DEGs in Group_A–E; Supplementary Table S2: GO analysis of Group_A–D; Supplementary Table S3: GSVA of Group_A–D; Supplementary Table S4: GO analysis of union genes; Supplementary Table S5: Correlation network of union genes; Supplementary Table S6: GO analysis of Group_E; Supplementary Table S7: GSVA of Group_E; Supplementary Figure S1: Correlation network of merged DEGs.
Author Contributions
Conceptualization, S.L.; methodology, S.L. and J.D.; investigation, S.L. and J.D.; formal analysis, S.L.; visualization, S.L.; writing—original draft preparation, S.L.; writing—review and editing, S.L. and J.D.; supervision, J.D.; funding acquisition, S.L. All authors have read and agreed to the published version of the manuscript.
Funding
This research was funded by the Municipal–University Joint Project (Research on Ecological Sensitivity and Plant Habitat Adaptation Mechanisms in the Hanzhong Tiankeng), grant number SXJ-2302.
Institutional Review Board Statement
Not applicable.
Informed Consent Statement
Not applicable.
Data Availability Statement
The raw RNA-seq data generated in this study have been deposited in the NCBI Sequence Read Archive (SRA) under accession number PRJNA1238025.
Conflicts of Interest
The authors declare no conflicts of interest.
References
- Körner, C. The use of ‘altitude’ in ecological research. Trends Ecol. Evol. 2007, 22, 569–574. [Google Scholar] [CrossRef] [Scilit]
- Halbritter, A.H.; Fior, S.; Keller, I.; Billeter, R.; Edwards, P.J.; Holderegger, R.; Karrenberg, S.; Pluess, A.R.; Widmer, A.; Alexander, J.M. Trait differentiation and adaptation of plants along elevation gradients. J. Evol. Biol. 2018, 31, 784–800. [Google Scholar] [CrossRef] [Scilit]
- Shui, W.; Chen, Y.; Jian, X.; Jiang, C.; Wang, Q.; Zeng, Y.; Zhu, S.; Guo, P.; Li, H. Original karst tiankeng with underground virgin forest as an inaccessible refugia originated from a degraded surface flora in Yunnan, China. Sci. Rep. 2022, 12, 9408. [Google Scholar] [CrossRef] [Scilit] [PubMed]
- Tang, Q.; Liu, Y.; Lou, Y.; Ho, B.C.; Jin, X.; Wei, Y. Bryophyte diversity, distribution pattern and their environmental drivers in the forest along the vertical gradient of a mature tiankeng, China. Glob. Ecol. Conserv. 2025, 62, e03821. [Google Scholar] [CrossRef] [Scilit]
- Geekiyanage, N.; Goodale, U.M.; Cao, K.; Kitajima, K. Plant ecology of tropical and subtropical karst ecosystems. Biotropica 2019, 51, 626–640. [Google Scholar] [CrossRef] [Scilit]
- LeGrand, H.E. Hydrological and ecological problems of karst regions: Hydrological actions on limestone regions cause distinctive ecological problems. Science 1973, 179, 859–864. [Google Scholar] [CrossRef] [Scilit]
- Li, F.; He, X.; Sun, Y.; Zhang, X.; Tang, X.; Li, Y.; Yi, Y. Distinct endophytes are used by diverse plants for adaptation to karst regions. Sci. Rep. 2019, 9, 5246. [Google Scholar] [CrossRef] [Scilit]
- Tao, J.; Qi, Q.; Kang, M.; Huang, H. Adaptive molecular evolution of PHYE in Primulina, a karst cave plant. PLoS ONE 2015, 10, e0127821. [Google Scholar] [CrossRef] [Scilit]
- Cao, Y.; Almeida-Silva, F.; Zhang, W.P.; Ding, Y.M.; Bai, D.; Bai, W.N.; Zhang, B.W.; Van de Peer, Y.; Zhang, D.Y. Genomic insights into adaptation to karst limestone and incipient speciation in East Asian Platycarya spp. (Juglandaceae). Mol. Biol. Evol. 2023, 40, msad121. [Google Scholar] [CrossRef] [Scilit]
- Li, Y.; Tang, Q.; Yuan, C.; Zhu, S.; Ye, Y.; Wu, P.; Cui, Y.; Ding, F. Changes in community structure and functional characteristics of soil bacteria and fungi along karst vegetation succession. Forests 2023, 14, 1562. [Google Scholar] [CrossRef] [Scilit]
- Yang, Y.; Tang, J.; Zhu, X.; Pan, L.; Zou, R.; Jiang, Y.; Wei, X. Evidence for the use of karst tiankengs as shelters: The effect of karst tiankengs on genetic diversity and population differentiation in Manglietia aromatica. Forests 2024, 15, 576. [Google Scholar] [CrossRef] [Scilit]
- Chen, S.; Zhou, Y.; Chen, Y.; Gu, J. fastp: An ultra-fast all-in-one FASTQ preprocessor. Bioinformatics 2018, 34, i884–i890. [Google Scholar] [CrossRef] [Scilit] [PubMed]
- Grabherr, M.G.; Haas, B.J.; Yassour, M.; Levin, J.Z.; Thompson, D.A.; Amit, I.; Adiconis, X.; Fan, L.; Raychowdhury, R.; Zeng, Q.; et al. Full-length transcriptome assembly from RNA-Seq data without a reference genome. Nat. Biotechnol. 2011, 29, 644–652. [Google Scholar] [CrossRef] [Scilit]
- Li, W.; Godzik, A. Cd-hit: A fast program for clustering and comparing large sets of protein or nucleotide sequences. Bioinformatics 2006, 22, 1658–1659. [Google Scholar] [CrossRef] [Scilit]
- Patro, R.; Duggal, G.; Love, M.I.; Irizarry, R.A.; Kingsford, C. Salmon provides fast and bias-aware quantification of transcript expression. Nat. Methods 2017, 14, 417–419. [Google Scholar] [CrossRef] [Scilit]
- Ritchie, M.E.; Phipson, B.; Wu, D.; Hu, Y.; Law, C.W.; Shi, W.; Smyth, G.K. limma powers differential expression analyses for RNA-sequencing and microarray studies. Nucleic Acids Res. 2015, 43, e47. [Google Scholar] [CrossRef] [Scilit]
- Conesa, A.; Madrigal, P.; Tarazona, S.; Gomez-Cabrero, D.; Cervera, A.; McPherson, A.; Szcześniak, M.W.; Gaffney, D.J.; Elo, L.L.; Zhang, X.; et al. A survey of best practices for RNA-seq data analysis. Genome Biol. 2016, 17, 13. [Google Scholar] [CrossRef] [Scilit]
- Liu, H.; Hu, W.; Zhang, L.; Li, Z.; Liu, J.; Chen, L. Plasma-Derived Exosomal i-tRF-LeuCAA as Biomarker for Glioma Diagnosis and Promoter of Epithelial-Mesenchymal Transition via TPM4 Regulation. CNS Neurosci. Ther. 2025, 31, e70356. [Google Scholar] [CrossRef] [Scilit] [PubMed]
- Carlson, M.; Pagès, H. AnnotationForge: Tools for Building SQLite-Based Annotation Data Packages, R package version 1.44.0; Bioconductor: Buffalo, NY, USA, 2023.
- Cantalapiedra, C.P.; Hernández-Plaza, A.; Letunic, I.; Bork, P.; Huerta-Cepas, J. eggNOG-mapper v2: Functional annotation, orthology assignments, and domain prediction at the metagenomic scale. Mol. Biol. Evol. 2021, 38, 5825–5829. [Google Scholar] [CrossRef] [Scilit] [PubMed]
- Yu, G. Thirteen years of clusterProfiler. Innovation 2024, 5, 100722. [Google Scholar] [CrossRef] [Scilit]
- Hänzelmann, S.; Castelo, R.; Guinney, J. GSVA: Gene set variation analysis for microarray and RNA-seq data. BMC Bioinform. 2013, 14, 7. [Google Scholar] [CrossRef] [Scilit]
- Shannon, P.; Markiel, A.; Ozier, O.; Baliga, N.S.; Wang, J.T.; Ramage, D.; Amin, N.; Schwikowski, B.; Ideker, T. Cytoscape: A software environment for integrated models of biomolecular interaction networks. Genome Res. 2003, 13, 2498–2504. [Google Scholar] [CrossRef] [Scilit] [PubMed]
- Nong, M.L.; Luo, X.H.; Zhu, L.X.; Zhang, Y.N.; Dun, X.Y.; Huang, L. Insights into the Adaptation to High Altitudes from Transcriptome Profiling: A Case Study of an Endangered Species, Kingdonia uniflora. Genes 2023, 14, 1291. [Google Scholar] [CrossRef] [Scilit] [PubMed]
- Lindner, S.N.; Ralser, M. The ability of pentose pathways to form all essential metabolites provides clues to the origins of metabolism. PLoS Biol. 2025, 23, e3002996. [Google Scholar] [CrossRef] [Scilit]
- Cosgrove, D.J. Expansive growth of plant cell walls. Plant Physiol. Biochem. 2000, 38, 109–124. [Google Scholar] [CrossRef] [Scilit]
- Cruz-Valderrama, J.E.; Bernal-Gallardo, J.J.; Herrera-Ubaldo, H.; de Folter, S. Building a flower: The influence of cell wall composition on flower development and reproduction. Genes 2021, 12, 978. [Google Scholar] [CrossRef] [Scilit] [PubMed]
- Lu, J.; Yan, S.; Xue, Z. Biosynthesis and functions of triterpenoids in cereals. J. Adv. Res. 2024, 71, 155–171. [Google Scholar] [CrossRef] [Scilit]
- Syakri, S.; Syahrana, N.A.; Ismail, A.; Tahir, K.A.; Masri, A. A review: Testing antioxidant activity on kawista plants (Limonia acidissima L.) in Indonesia. Open Access Maced. J. Med. Sci. 2021, 9, 281–287. [Google Scholar] [CrossRef] [Scilit]
- Tsai, S.H.; Hsiao, Y.C.; Chang, P.E.; Kuo, C.E.; Lai, M.C.; Chuang, H. Exploring the biologically active metabolites produced by Bacillus cereus for plant growth promotion, heat stress tolerance, and resistance to bacterial soft rot in Arabidopsis. Metabolites 2023, 13, 676. [Google Scholar] [CrossRef] [Scilit]
- Choi, H.G. Correlation among phenotypic parameters related to the growth and photosynthesis of strawberry (Fragaria × ananassa Duch.) grown under various light intensity conditions. Front. Plant Sci. 2021, 12, 647585. [Google Scholar] [CrossRef] [Scilit]
- Vera-Vives, A.M.; Novel, P.; Zheng, K.; Tan, S.; Schwarzländer, M.; Alboresi, A.; Morosinotto, T. Mitochondrial respiration is essential for photosynthesis-dependent ATP supply of the plant cytosol. New Phytol. 2024, 243, 2175–2186. [Google Scholar] [CrossRef] [Scilit]
- Gary, C.; Baldet, P.; Bertin, N.; Devaux, C.; Tchamitchian, M.; Raymond, P. Time-course of tomato whole-plant respiration and fruit and stem growth during prolonged darkness in relation to carbohydrate reserves. Ann. Bot. 2003, 91, 429–438. [Google Scholar] [CrossRef] [Scilit]
- Mittler, R.; Zandalinas, S.I.; Fichman, Y.; Van Breusegem, F. Reactive oxygen species signalling in plant stress responses. Nat. Rev. Mol. Cell Biol. 2022, 23, 663–679. [Google Scholar] [CrossRef] [Scilit] [PubMed]
- Choudhury, F.K.; Rivero, R.M.; Blumwald, E.; Mittler, R. Reactive oxygen species, abiotic stress and stress combination. Plant J. 2017, 90, 856–867. [Google Scholar] [CrossRef] [Scilit]
- Savi, T.; García González, A.; Herrera, J.C.; Forneck, A. Gas exchange, biomass and non-structural carbohydrates dynamics in vines under combined drought and biotic stress. BMC Plant Biol. 2019, 19, 408. [Google Scholar] [CrossRef] [Scilit]
- Heber, U.; Bilger, W.; Bligny, R.; Lange, O.L. Phototolerance of lichens, mosses and higher plants in an alpine environment: Analysis of photoreactions. Planta 2000, 211, 770–780. [Google Scholar] [CrossRef] [Scilit]
- Jeong, C.Y.; Lee, W.J.; Truong, H.A.; Trịnh, C.S.; Hong, S.W.; Lee, H. AtMybL-O modulates abscisic acid biosynthesis to optimize plant growth and ABA signaling in response to drought stress. Appl. Biol. Chem. 2018, 61, 473–477. [Google Scholar] [CrossRef] [Scilit]
- Frank, M.; Cortleven, A.; Pěnčík, A.; Novak, O.; Schmülling, T. The photoperiod stress response in Arabidopsis thaliana depends on auxin acting as an antagonist to the protectant cytokinin. Int. J. Mol. Sci. 2022, 23, 2936. [Google Scholar] [CrossRef] [Scilit]
- Liao, H.S.; Chen, Y.J.; Hsieh, W.Y.; Li, Y.C.; Hsieh, M.H. Arabidopsis ACT DOMAIN REPEAT9 represses glucose signaling pathways. Plant Physiol. 2023, 192, 1532–1547. [Google Scholar] [CrossRef] [Scilit]
- Hu, L.; Zhang, F.; Song, S.; Yu, X.; Ren, Y.; Zhao, X.; Liu, H.; Liu, G.; Wang, Y.; He, H. CsSWEET2, a hexose transporter from cucumber (Cucumis sativus L.), affects sugar metabolism and improves cold tolerance in Arabidopsis. Int. J. Mol. Sci. 2022, 23, 3886. [Google Scholar] [CrossRef] [Scilit] [PubMed]
- Ashihara, H.; Stasolla, C.; Fujimura, T.; Crozier, A. Purine salvage in plants. Phytochemistry 2018, 147, 89–124. [Google Scholar] [CrossRef] [Scilit] [PubMed]
- Yang, Z.; You, J.; Li, J.; Zhao, W.; Xing, M.; Zhang, Y.; Cui, M.; Gong, Y.; Zhao, Y.; Chen, X. Divergent functional traits and gene expression profiles in native and encroaching plant species across an alpine elevational gradient. Front. Plant Sci. 2025, 16, 1656812. [Google Scholar] [CrossRef] [Scilit] [PubMed]

Disclaimer/Publisher’s Note: The statements, opinions and data contained in all publications are solely those of the individual author(s) and contributor(s) and not of MDPI and/or the editor(s). MDPI and/or the editor(s) disclaim responsibility for any injury to people or property resulting from any ideas, methods, instructions or products referred to in the content. |
© 2026 by the authors. Licensee MDPI, Basel, Switzerland. This article is an open access article distributed under the terms and conditions of the Creative Commons Attribution (CC BY) license.