


Abstract
This paper examines the subjective annoyance associated with shared-bike electronic alert sounds (SBeASs), an emerging urban noise source. A study was conducted by employing extensive questionnaire surveys and psychoacoustic experiments. A preliminary survey (N = 1340) indicated that 90.6% of participants reported being impacted by SBeASs, with pronounced effects on nighttime rest and daytime work efficiency. In this study, SBeAS samples were taken from three prominent Chinese bike-sharing brands: Hello Bike, Meituan Bike, and DiDi Bike. Under laboratory conditions, subjective annoyance assessments (N = 28) for SBeASs were conducted at controlled sound pressure levels (SPLs) ranging from 45 to 65 dBA, with occurrence frequencies of 1, 3, and 5 s. Simultaneously, annoyance assessments were also conducted for two reference noise types: traffic noise and street noise. The results indicated a notable increase in annoyance levels related to SBeASs with rising SPL and increased occurrence frequency. Minor variations in annoyance were identified among different bike-sharing brands, which can be attributed to their distinct acoustic features. When the SPL was above 55 dBA, the DiDi Bike SBeASs produced considerably higher annoyance than those of other brands. This can be attributed to its elevated low-frequency energy, loudness, and roughness. Moreover, individuals exhibiting increased sensitivity to noise reported notably higher annoyance ratings on the SBeAS scale (p = 0.019). Under low-SPL conditions (45–55 dBA), the annoyance attributed to frequent SBeASs can exceed that caused by traffic noise and street noise at comparable SPLs, highlighting the distinct disruptive impact of abrupt sound sources.
1. Introduction
Given the rapid growth of the sharing economy, shared bicycles have emerged as an essential element of modern urban transportation systems, providing benefits in terms of convenience and environmental sustainability [1,2,3]. Statistical data indicate that by the end of 2023, China had deployed upward of 12 million shared bicycles, with services extending to over 80% of prefecture-level cities across the nation [4,5]. Zhang et al. [6] examined the role of soundscapes in bikeshare usage and found that micro-scale soundscape perception outweighs visual perception in explaining cycling behavior. Nonetheless, the electronic sounds integrated into these bicycles—such as locking/unlocking notifications and low-battery warnings—are increasingly contributing to noise pollution in urban areas. This is primarily due to their abrupt onset, elevated sound pressure levels (SPLs), and high recurrence frequency. These shared-bike electronic alert sounds (SBeASs) have become a new source of community noise pollution, persistently disturbing residents along roadsides, in commercial areas, and near public spaces. Frequent alerts at night, early morning, and during rest periods not only trigger complaints but may also harm mental health and social harmony, making this an urgent issue for urban acoustic environment governance. Field measurements by the authors show that the instantaneous peak SPL of SBeASs can achieve a level of 75–80 dBA when measured at a distance of 1 m from the shared bicycle. In recent years, complaints about SBeASs have significantly increased, posing a challenge for urban acoustic environment management.
In recent years, noise pollution has been acknowledged as the second most critical environmental risk factor for human health and well-being, following air pollution [7,8]. Many studies have verified that extended exposure to noise can lead to physiological impacts, including hearing damage and sleep disruptions [9,10]. It can also elevate the risk of cardiovascular diseases via pathways involving stress hormones [11,12,13]. Among the several adverse effects of noise, the extent of annoyance it induces is the most prevalent indicator of non-auditory effects [14], and this measure also serves as a vital foundation for setting environmental noise regulations.
In recent research, the examination of noise annoyance has broadened from its conventional focus on traffic and industrial noise to include diverse areas such as construction-related noise and disturbances within community living environments [15,16]. Research methodologies have progressed from focusing solely on physical metrics to adopting a comprehensive assessment framework that incorporates physical, psychological, and social dimensions [17,18], resulting in improved scientific robustness and practical relevance for such studies. Furthermore, exposure to noise adversely affects the quality of life of inhabitants and notably diminishes both learning efficiency and work productivity [19,20]. Different activities, including commuting, professional tasks, and recreational pursuits, may affect how individuals perceive noise [10]. This emphasizes the societal importance of investigating noise annoyance.
Existing studies have demonstrated that noise annoyance is shaped by a variety of elements, such as characteristics of the sound source (e.g., type and frequency spectrum) [21], along with exposure attributes (e.g., SPL, exposure time, and frequency of bursts) [22,23]. Previous research concerning noise annoyance has predominantly concentrated on constant noise sources, such as traffic and industrial disturbances [15,24,25]. These studies have applied evaluation techniques based on stable noise conditions, such as the equivalent continuous sound level () [26] or the Zwicker psychoacoustic model [16,27]. Conversely, research demonstrates that impulsive sounds generate greater perceived annoyance than continuous noise, even when both have identical A-weighted levels. Psychoacoustic studies by Rajala and Hongisto [28] revealed a pronounced relationship between sound annoyance and the frequency and extent of fluctuations in sound intensity. Hongisto et al. [29] recently compared several objective methods for assessing impulsive noise annoyance and recommended using the difference between the 1st and 99th percentile levels for outdoor impulsive sounds in the 45–65 dBA range. Similarly, Yadav et al. [30] examined traffic noise annoyance at intersections and identified intermittency ratio as one of the key acoustic factors significantly affecting annoyance, along with equivalent noise level. Park et al. [31] identified that abrupt fluctuations in noise levels during the transit of high-speed trains substantially raised the annoyance ratings of passengers. Zhu et al. [32] observed that the factors of ringtone volume, frequency, and environmental context play a crucial role in the level of subjective annoyance. At elevated sound intensities, both the absolute sound level and the increment in sound contribute substantially to increased levels of annoyance [33,34,35,36]. In the presence of elevated ambient noise levels, the emergence of abrupt sounds, such as horn blasts, significantly escalates annoyance levels. In an analysis by Shi et al. [37] on airport noise attributes, the contrast between military and civilian airports was assessed. The study highlighted that a solitary military aircraft event could produce a noise surge reaching 160 dBA. Such a rapid escalation from tranquility to an intense noise environment, commonplace around military airfields, results in greater disturbance levels than continuous noise. To summarize, the degree of annoyance produced by sudden or intermittent noise significantly contrasts with that caused by continuous noise. The transient acoustic properties of such noise sources thus warrant specific consideration.
The correlation between transient properties (including fluctuations in sound level, peak sound pressure amplitudes, and frequency of occurrence) and the annoyance levels associated with intermittent electronic noise, such as SBeASs, which is known for its abrupt, high-frequency repetitive patterns, remains largely unexplored. Moreover, noise sensitivity emerges as a significant psychological determinant accounting for the variability in individual responses to noise [38]. The Noise Sensitivity Scale serves as a tool for forecasting and assessing the degree of annoyance experienced by individuals exposed to identical noise conditions. The impact of individual variations in noise sensitivity on the annoyance caused by transient noise deserves further attention.
In light of the stated research background and challenges, the goal of this research is to conduct an in-depth exploration of the annoyance levels caused by SBeASs, alongside identifying the key factors influencing these levels, utilizing questionnaire surveys and subjective annoyance trials. First, an extensive online survey was deployed to evaluate authentic public opinions on SBeASs and the possible disturbances it might cause. Following this, the SBeASs from three prominent shared bicycle brands were captured on location for use as experimental stimuli. Subsequently, subjective annoyance ratings were assessed in a controlled environment with participants using headphones. In order to determine the critical factors affecting responses, the SBeAS SPLs were varied between 45 and 65 dBA, and the frequency of occurrence varied between 1, 3, and 5 s. For comparative purposes, subjective assessments of annoyance were performed using reference noise categories, specifically traffic and street noise. To explore variations in annoyance ratings across different noise-sensitive groups, standardized scales were employed to measure noise sensitivity among all participants during the experiment. This study explores SBeASs as a novel source of urban noise, providing a comprehensive analysis and evaluation of the annoyance caused by SBeASs. This work fills a research gap related to the annoyance levels associated with this form of intermittent electronic noise. The main research questions addressed in this paper are as follows:
- 1.
- How young adult respondents perceive SBeASs and identify the contexts in which they report being most affected.
- 2.
- Whether SBeASs from different bike-sharing brands differ in perceived annoyance and explore potential psychoacoustic factors underlying such differences.
- 3.
- How SPL and occurrence frequency of SBeASs affect annoyance ratings under controlled laboratory conditions.
- 4.
- Whether annoyance ratings differ between individuals with high and low noise sensitivity.
- 5.
- Whether the annoyance caused by SBeASs is on par with that caused by traffic and street noise at the same SPLs.
2. Materials and Methods
2.1. Questionnaire Survey
To investigate the degree of disturbance caused by SBeASs to public life and its contributing factors, a large-scale online survey was first conducted using the Questionnaire Star mutual-filling platform, yielding 1340 valid responses. The survey covered public perceptions of annoyance toward SBeASs, evaluations of volume and comfort levels, scenarios where sounds are easily heard, disruptive behaviors and time periods, specific manifestations of annoyance, and the degree of impact. The aim of this approach was to comprehensively understand how SBeASs affect public life. The questionnaire combined a five-point Likert scale with multiple-choice questions to ensure comprehensive and accurate data collection. Among the survey sample, female respondents accounted for 70.26%, the 18–35 age group comprised 89.21%, and students constituted 51.98%. This overall sample structure reflects a respondent profile dominated by young students. The complete questionnaire is provided in Appendix A.
2.2. Noise Sample Collection and Characterization
In the initial phase of data gathering, market research was performed on widely accessible shared bicycle brands in China. The SBeASs were sourced from brands known for high usage and notable market presence. As a result, three common shared bicycle brands frequently used in everyday scenarios were chosen: Hello Bike, DiDi Bike, and Meituan Bike [39].
The SBeASs were captured on-site with the i3DMic Pro360 binaural recording setup (MicW Audio, Beijing, China) at a 44.1 kHz sample rate. The collection used the iDAQ2022 data acquisition card (Beijing Sound Testing Technology Co., Ltd., Beijing, China) along with AcousticLab software (version 2024 edition, ZKXY Technology Co., Ltd., Beijing, China), complying with the GB/T 42473-2023 noise measurement standard [40]. Experimenters standing 1 m away from shared bicycles, with handheld data acquisition devices, terminals, and binaural recording systems, recorded the original lock and unlock notification sounds from the three shared bicycle brands.
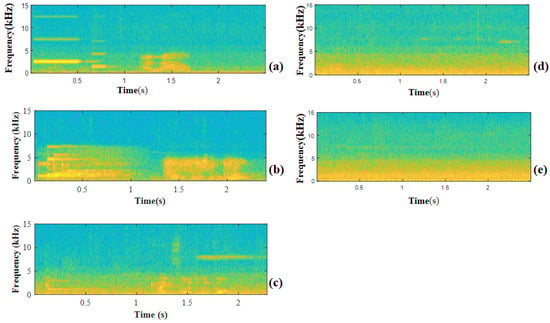
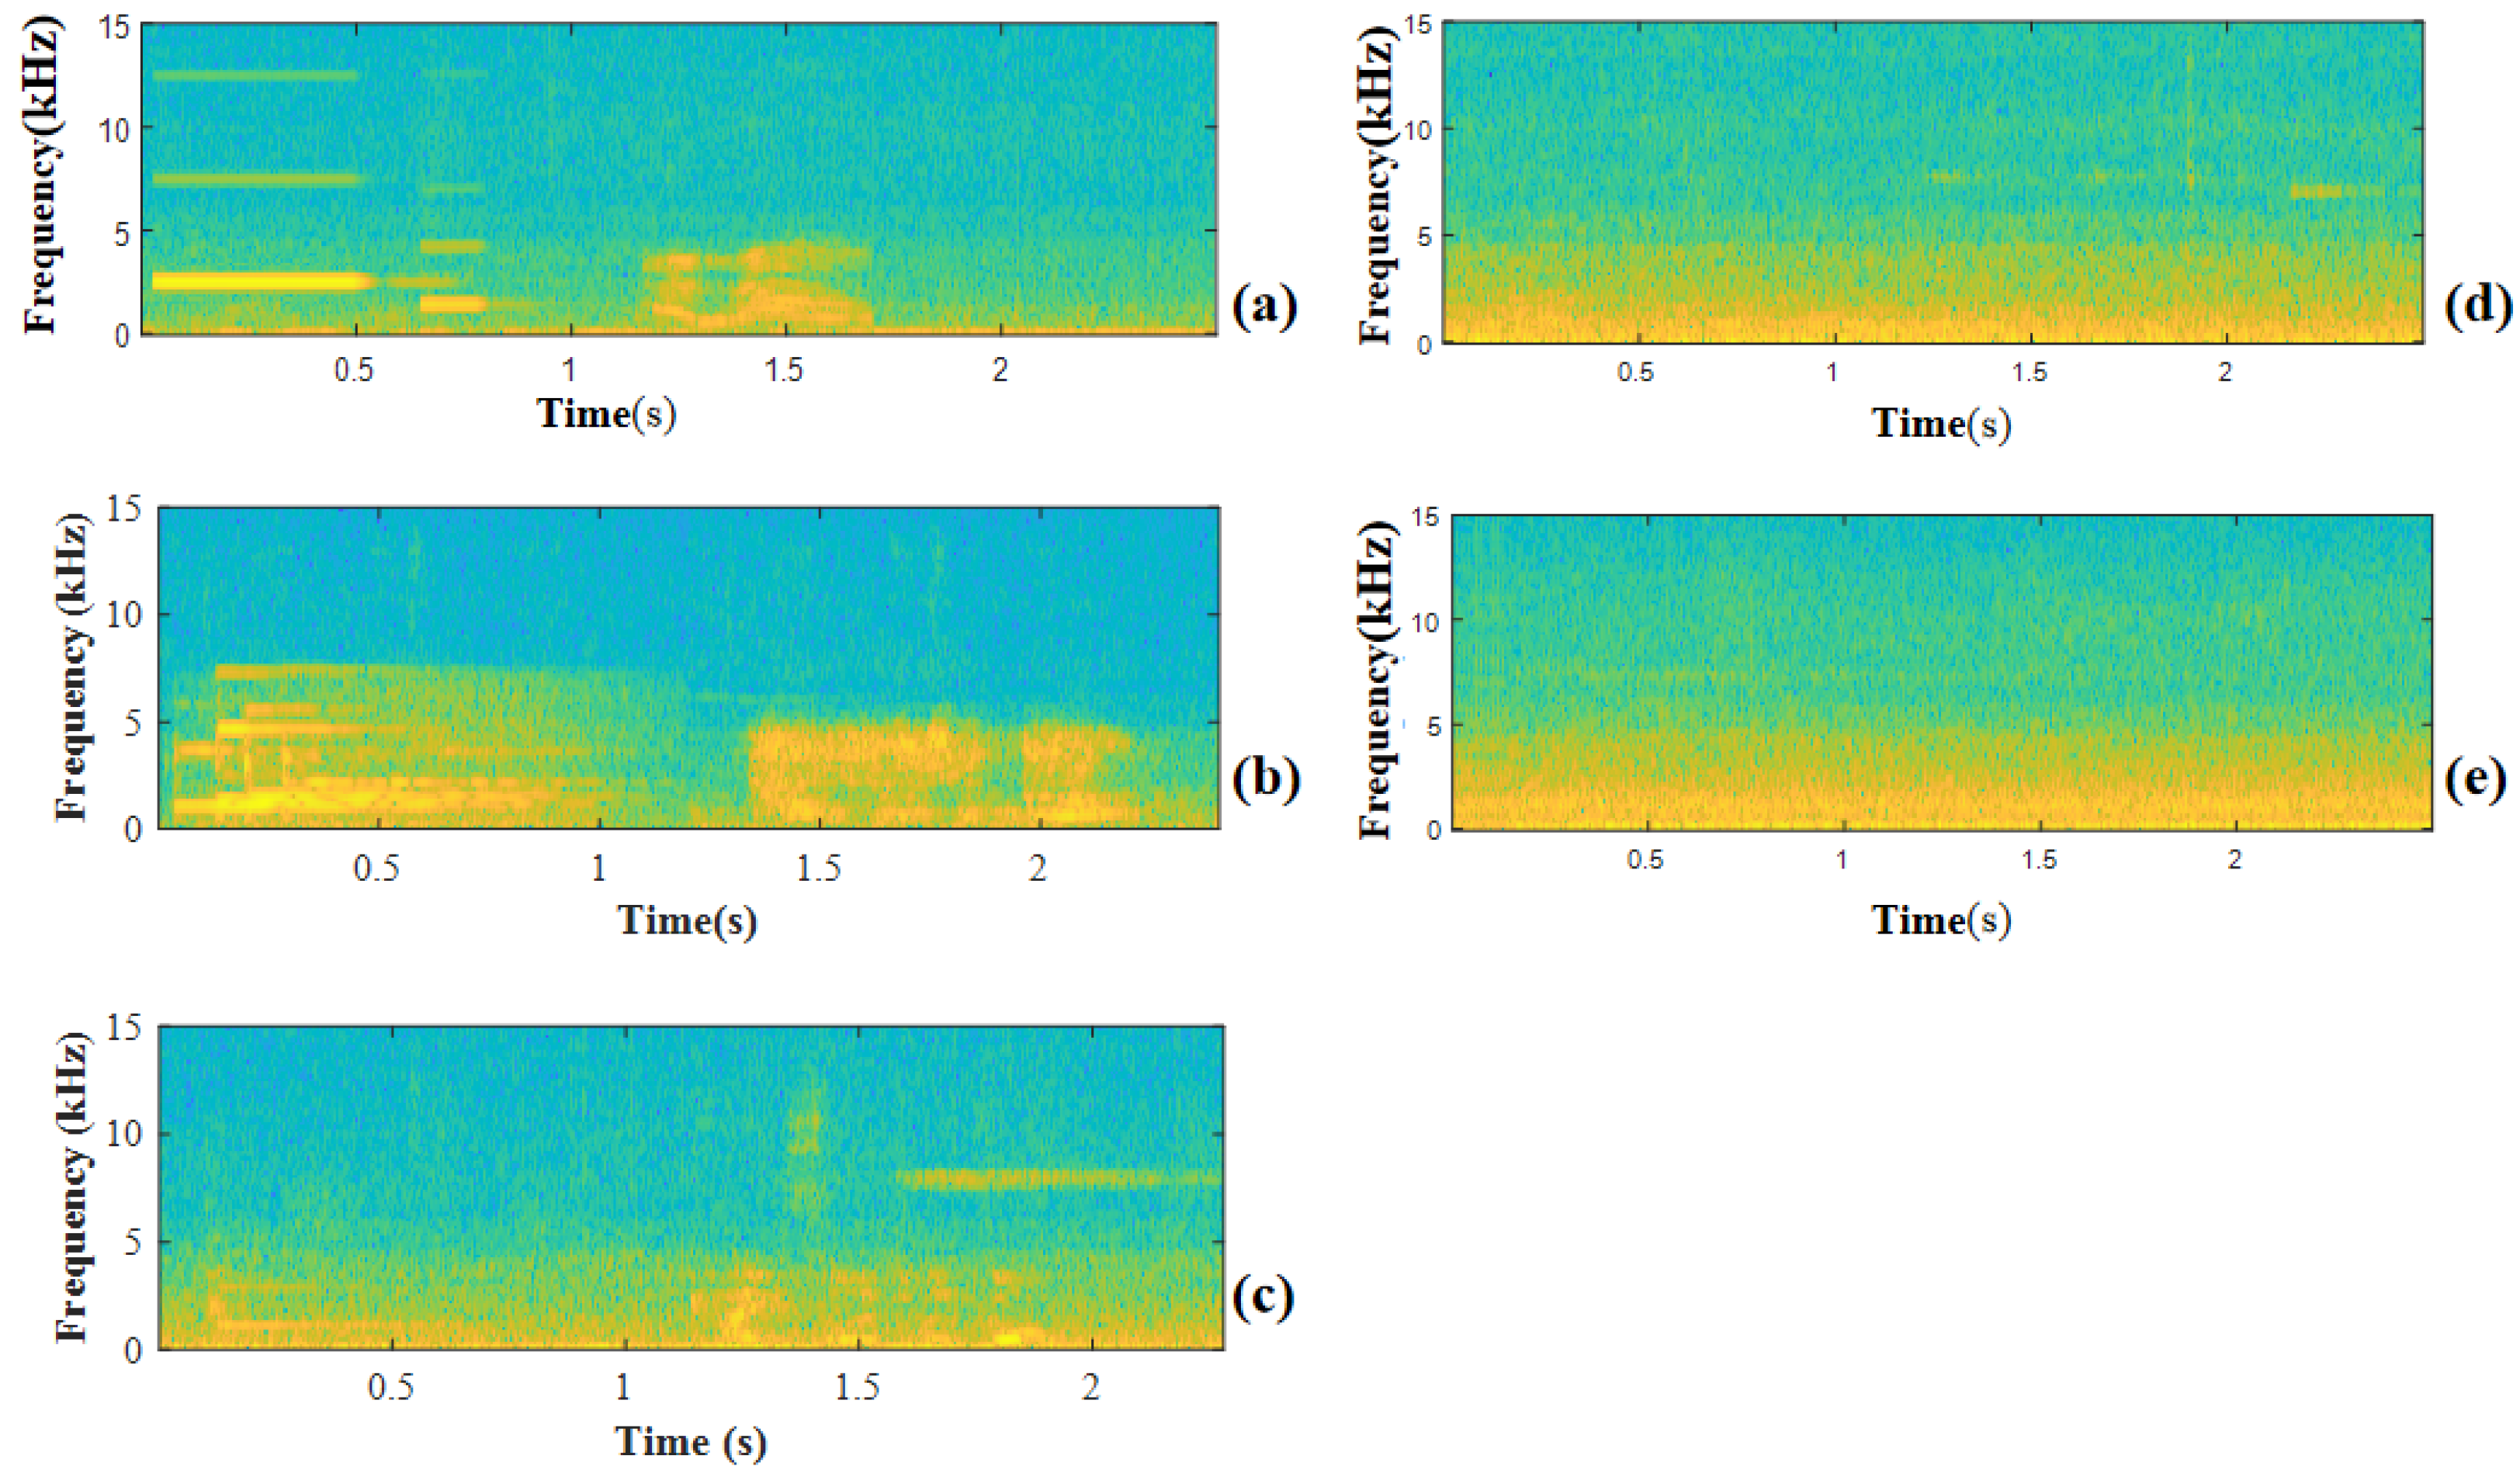
Recordings were conducted in a residential area during the evening rush hour (7:00–8:00 PM). A handheld Class 2 sound level meter (AWA5636, Aihua Instruments, Hangzhou, China) was used to monitor ambient noise levels, which ranged from 55–65 dBA due to traffic and pedestrian activity. Although the ambient noise level was elevated, the SBeAS signals were clearly distinguishable from the background due to their transient nature and higher peak levels. No additional noise reduction was applied to preserve the original acoustic characteristics. For traffic and street noise recordings, the microphone was positioned at a height of 1.5 m above ground, approximately 3 m from the roadside curb. This approach guaranteed a strong signal-to-noise ratio for the recorded SBeAS signal. Additionally, recordings of traffic and street environmental noise were taken using the same methods and tools for comparison. Figure 1 shows the time-spectral plots for the three SBeAS categories along with the two environmental noise types (traffic and street noise) derived from the recordings.
Figure 1.
Spectrograms of different noise samples: (a) Hello Bike; (b) Meituan Bike; (c) DiDi Bike; (d) Traffic noise; (e) Street noise.
As depicted in Figure 1, the acoustic profiles of the three SBeAS types differ markedly from those of the two environmental noise types. The Hello Bike SBeAS starts with a 0.5-s pure tone spanning three frequencies (2.5, 7.5, and 12.5 kHz), followed by a 1.2-s voice output saying “Hello.” Its main acoustic energy is concentrated below 5000 Hz (Figure 1a). The Meituan Bike SBeAS begins with a brief pure tone concentrating energy in the 1.5–7.5 kHz range, succeeded by the verbal announcement “Unlock successful” (Figure 1b). DiDi Bike SBeAS features distinct low-frequency elements, with spectral peaks between 1 and 5 kHz, and includes a short pure tone followed by the message “Welcome to use Qingju Bike” (Figure 1c). Traffic noise is characterized by a continuous steady state with energy spanning the entire 0.1–4 kHz frequency range (Figure 1d). Street noise also maintains continuous steady-state features but is scattered with random impulses, with energy discretely distributed between 1.5 and 4 kHz (Figure 1e).
Table 1 presents the psychoacoustic parameters for different noise types (including SBeASs and traffic/street noise) at an SPL of 55 dBA. The ‘loudness’ parameter reflects subjective perceived loudness. As shown, traffic noise and street noise exhibit significantly higher subjective loudness than SBeASs due to their energy distribution and persistence. Among SBeAS shared bikes, DiDi Bike exhibits relatively high loudness, while Hello Bike is the quietest. Sound roughness also influences perceived annoyance levels [41]. Traffic and street noise exhibit the greatest fluctuations due to complex sound sources, resulting in the highest roughness. Among shared bike alerts, DiDi Bike has higher roughness than Hello Bike and Meituan Bike, while Hello Bike is the smoothest. Sharpness correlates with high-frequency energy distribution and perceived harshness to the human ear. Meituan Bike is the sharpest due to its high proportion of high-frequency components, whereas DiDi Bike and street noise have lower high-frequency content.
Table 1.
Psycho acoustic parameters of the experimental audio at 55 dBA.
In addition to the psychoacoustic parameters reported in Table 1, the original recorded SBeASs (before SPL adjustment) had peak SPLs above 75 dBA at 1 m for all three brands. The duration of each alert sound was approximately 1.5–2.0 s, consisting of an initial pure tone followed by a voice message.
2.3. Experimental Design
A laptop connected to a Roland Studio-Capture sound card (Roland Corporation, Hamamatsu, Japan) served as the audio interface in the experiment. This sound card enabled high-precision 24-bit/192-kHz signal conversion and low-latency audio transmission. Sennheiser HD 650 open-back headphones (Sennheiser electronic GmbH & Co. KG, Wedemark, Germany) were used for playback, calibrated beforehand to maintain output accuracy within ±1 dBA.
The SBeAS SPLs were varied between 45 and 65 dBA. The laboratory experiment focused on the range of 45–65 dBA because this covers typical ambient sound levels in urban environments where SBeASs are perceived, while the higher peak levels (75–80 dBA) occur only in close proximity to the source. SPLs above 65 dBA were not included in the laboratory experiment because prolonged exposure to such levels may pose a risk of auditory discomfort or hearing fatigue. The study therefore focused on the typical ambient sound range (45–65 dBA) where SBeASs are commonly perceived in urban environments. The experiment made use of MATLAB (version R2021b, The MathWorks, Inc., Natick, MA, USA) to modify the SPLs of audio samples. The SBeAS samples were adjusted to five standard SPLs: 45 dBA, 50 dBA, 55 dBA, 60 dBA, and 65 dBA. Each SPL also allowed for three different occurrence frequencies: high-frequency (once per second), mid-frequency (every 3 s), and low-frequency (every 5 s). This resulted in a total of 3 (brands) × 5 (SPL) × 3 (frequencies) = 45 SBeASs samples. Traffic noise and street noise were used as consistent steady-state background sounds. These were adjusted only to the five SPLs mentioned earlier, without occurrence frequency parameters, resulting in five samples each. The concluding experiment included 45 SBeAS samples in addition to five traffic noise samples and five street noise samples, totaling 55 audio samples with a uniform duration of 10 s each. To avoid sequence effects, all samples were played in a random sequence.
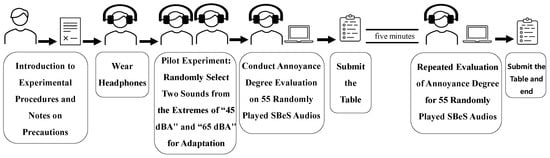
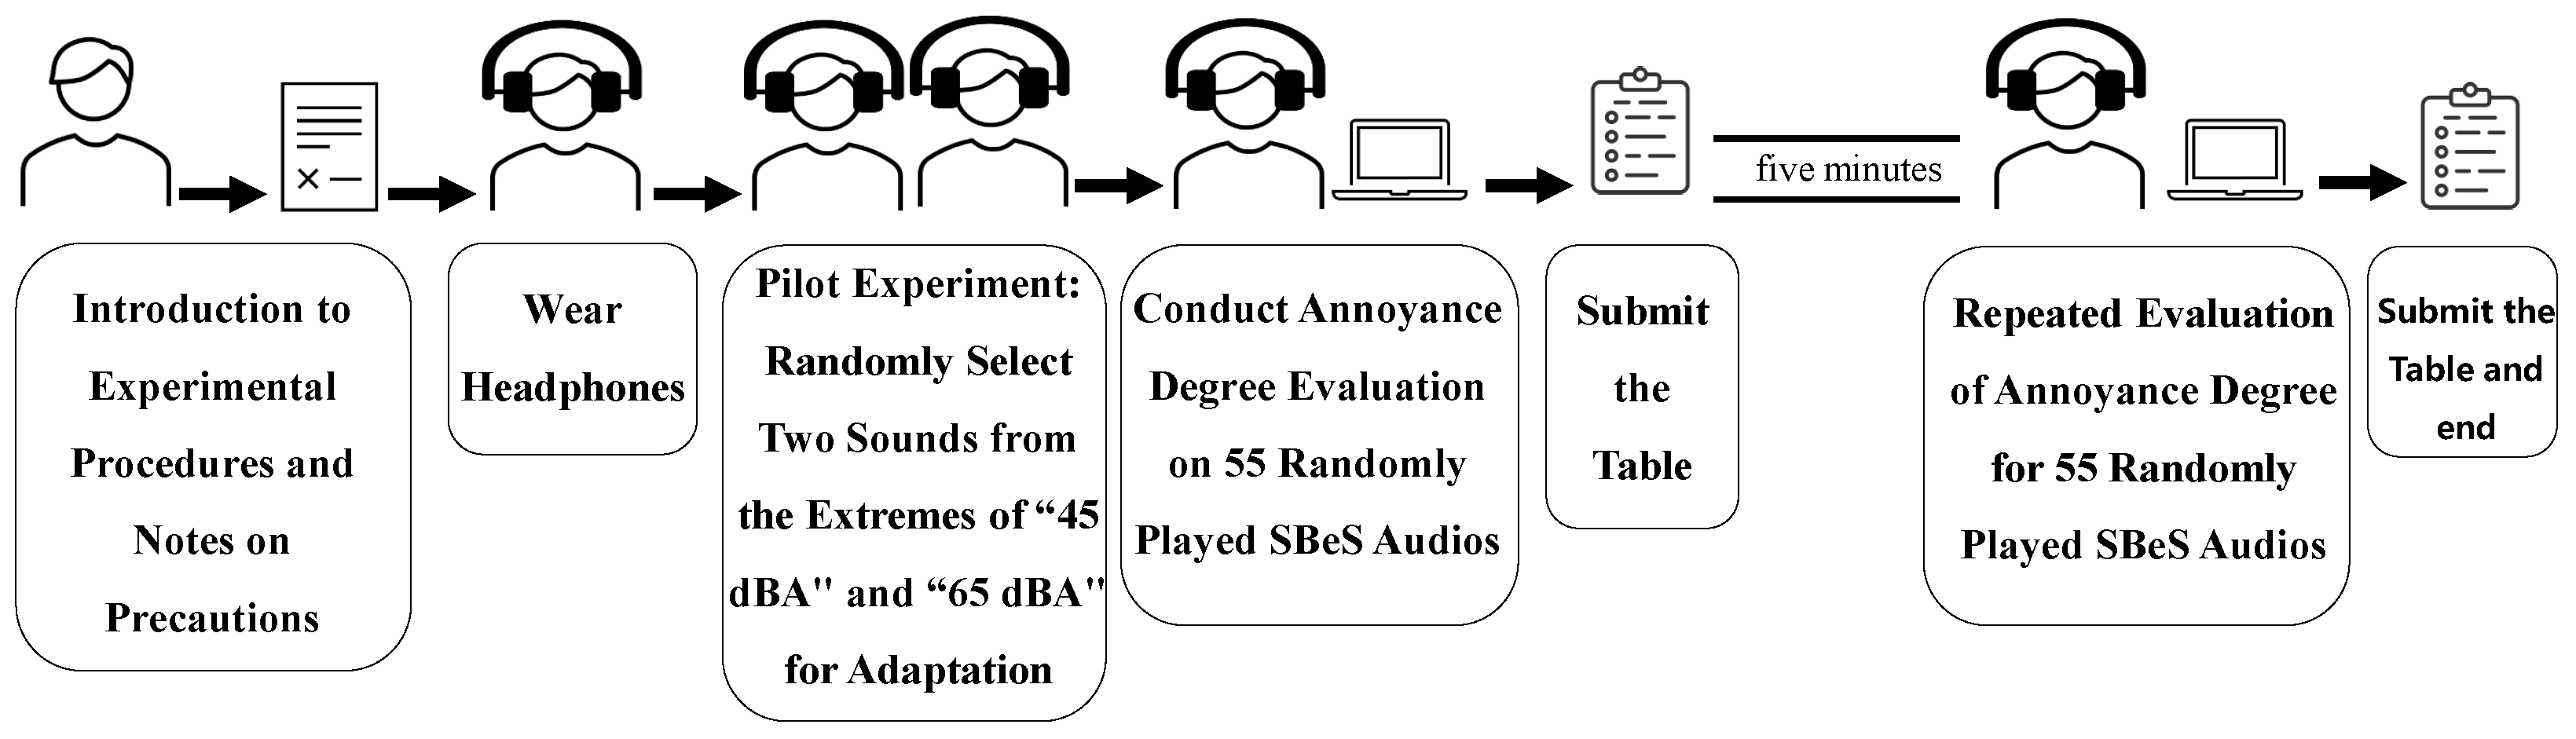
The experimental protocol and safety measures were described to participants prior to the start of the experiment (see Figure 2 for reference). Essential demographic details were gathered (such as gender, age, and frequency of shared bicycle use). Participants were required to complete the Noise Sensitivity Scale by rating each item from “Strongly Agree” to “Strongly Disagree,” ensuring correct handling of variably phrased items and transforming scores as necessary for both forward- and reverse-scored questions. The scores were summed to derive the overall noise sensitivity score [42]. Before commencing evaluation, an audio clip with a minimum SPL and one with a maximum SPL were selected at random for adaptation purposes. After the trial listening session, the formal evaluation phase began, during which participants assessed the annoyance level of randomly played sound samples. Subjects listened to each sample and chose an integer from 0 to 10 to evaluate its associated noise annoyance [40]. A value of 0 indicated no annoyance, and 10 indicated extreme annoyance. After finishing one set of samples, participants had a five-minute break before re-evaluating the audio.
Figure 2.
An experimental flowchart of the psychoacoustic testing process.
The assessment of the full set of audio samples was restricted to 15 min. A five-minute break followed each listening session before the measurements were repeated for data reliability purposes. Test–retest reliability was assessed by calculating Pearson’s correlation coefficient between each participant’s two ratings across all 55 sound samples. For each participant, we computed the correlation between their first and second ratings. Participants with a correlation coefficient below 0.7 were excluded as their responses were considered inconsistent. Based on this criterion, 2 out of 28 participants were excluded from further analysis. No sound samples were excluded [8]. Ultimately, the mean score from both evaluations of the same audio sample was computed and used as the definitive annoyance score for each sound sample [43].
2.4. Participants and Experimental Environment
The experiment took place in a room designed to mimic the acoustics of standard classrooms or office settings. Lighting was kept suitable, and both the air temperature and humidity were maintained at a comfortable level [44]. A total of 30 students initially participated. After data collection, two participants were excluded because their test–retest correlation coefficients (between first and second ratings across all 55 sound samples) were below the pre-established threshold of 0.7, indicating insufficient response consistency. The final sample thus consisted of 28 participants (18 females, 10 males) aged 18–35 from various disciplines at Guangxi University. Participants used headphones to individually switch between randomly sequenced audio clips, rating their annoyance level based on given codes.
2.5. Data Analysis
To confirm the validity of further statistical evaluations, this study utilized IBM SPSS Statistics 27.0 (IBM Corp., Armonk, NY, USA) to perform reliability testing on subjective assessment data. Cronbach’s was calculated based on the annoyance ratings of all 28 participants across all 45 SBeAS samples (28 participants × 45 samples = 1260 ratings). The Shapiro–Wilk test for normality was performed on the mean annoyance ratings of the 45 SBeAS samples (each sample’s rating averaged across 28 participants, ). The result (, , ) indicates that the data do not deviate significantly from a normal distribution, justifying the use of parametric tests (ANOVA). According to statistical standards, a p-value above 0.05 suggests that the data are normally distributed, meeting the prerequisite for parametric tests such as analysis of variance.
An analysis of variance (ANOVA) with three factors (3 brands × 5 SPLs × 3 occurrence frequencies, within-subjects design) was conducted to assess the main effects and interactions between brand, SPL, and occurrence frequency on annoyance scores. Mauchly’s test of sphericity was performed, and the Greenhouse-Geisser correction was applied when the sphericity assumption was violated. To further explore the impact of individual differences, an independent samples t-test was carried out to compare annoyance scores between groups with high and low sensitivity.
3. Results
3.1. Questionnaire Results
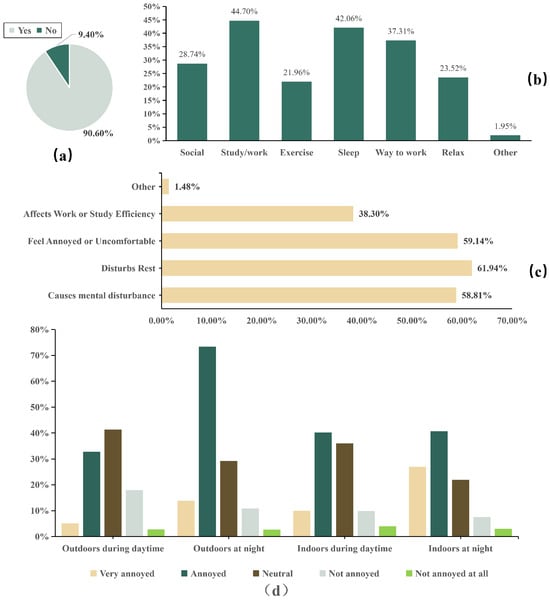
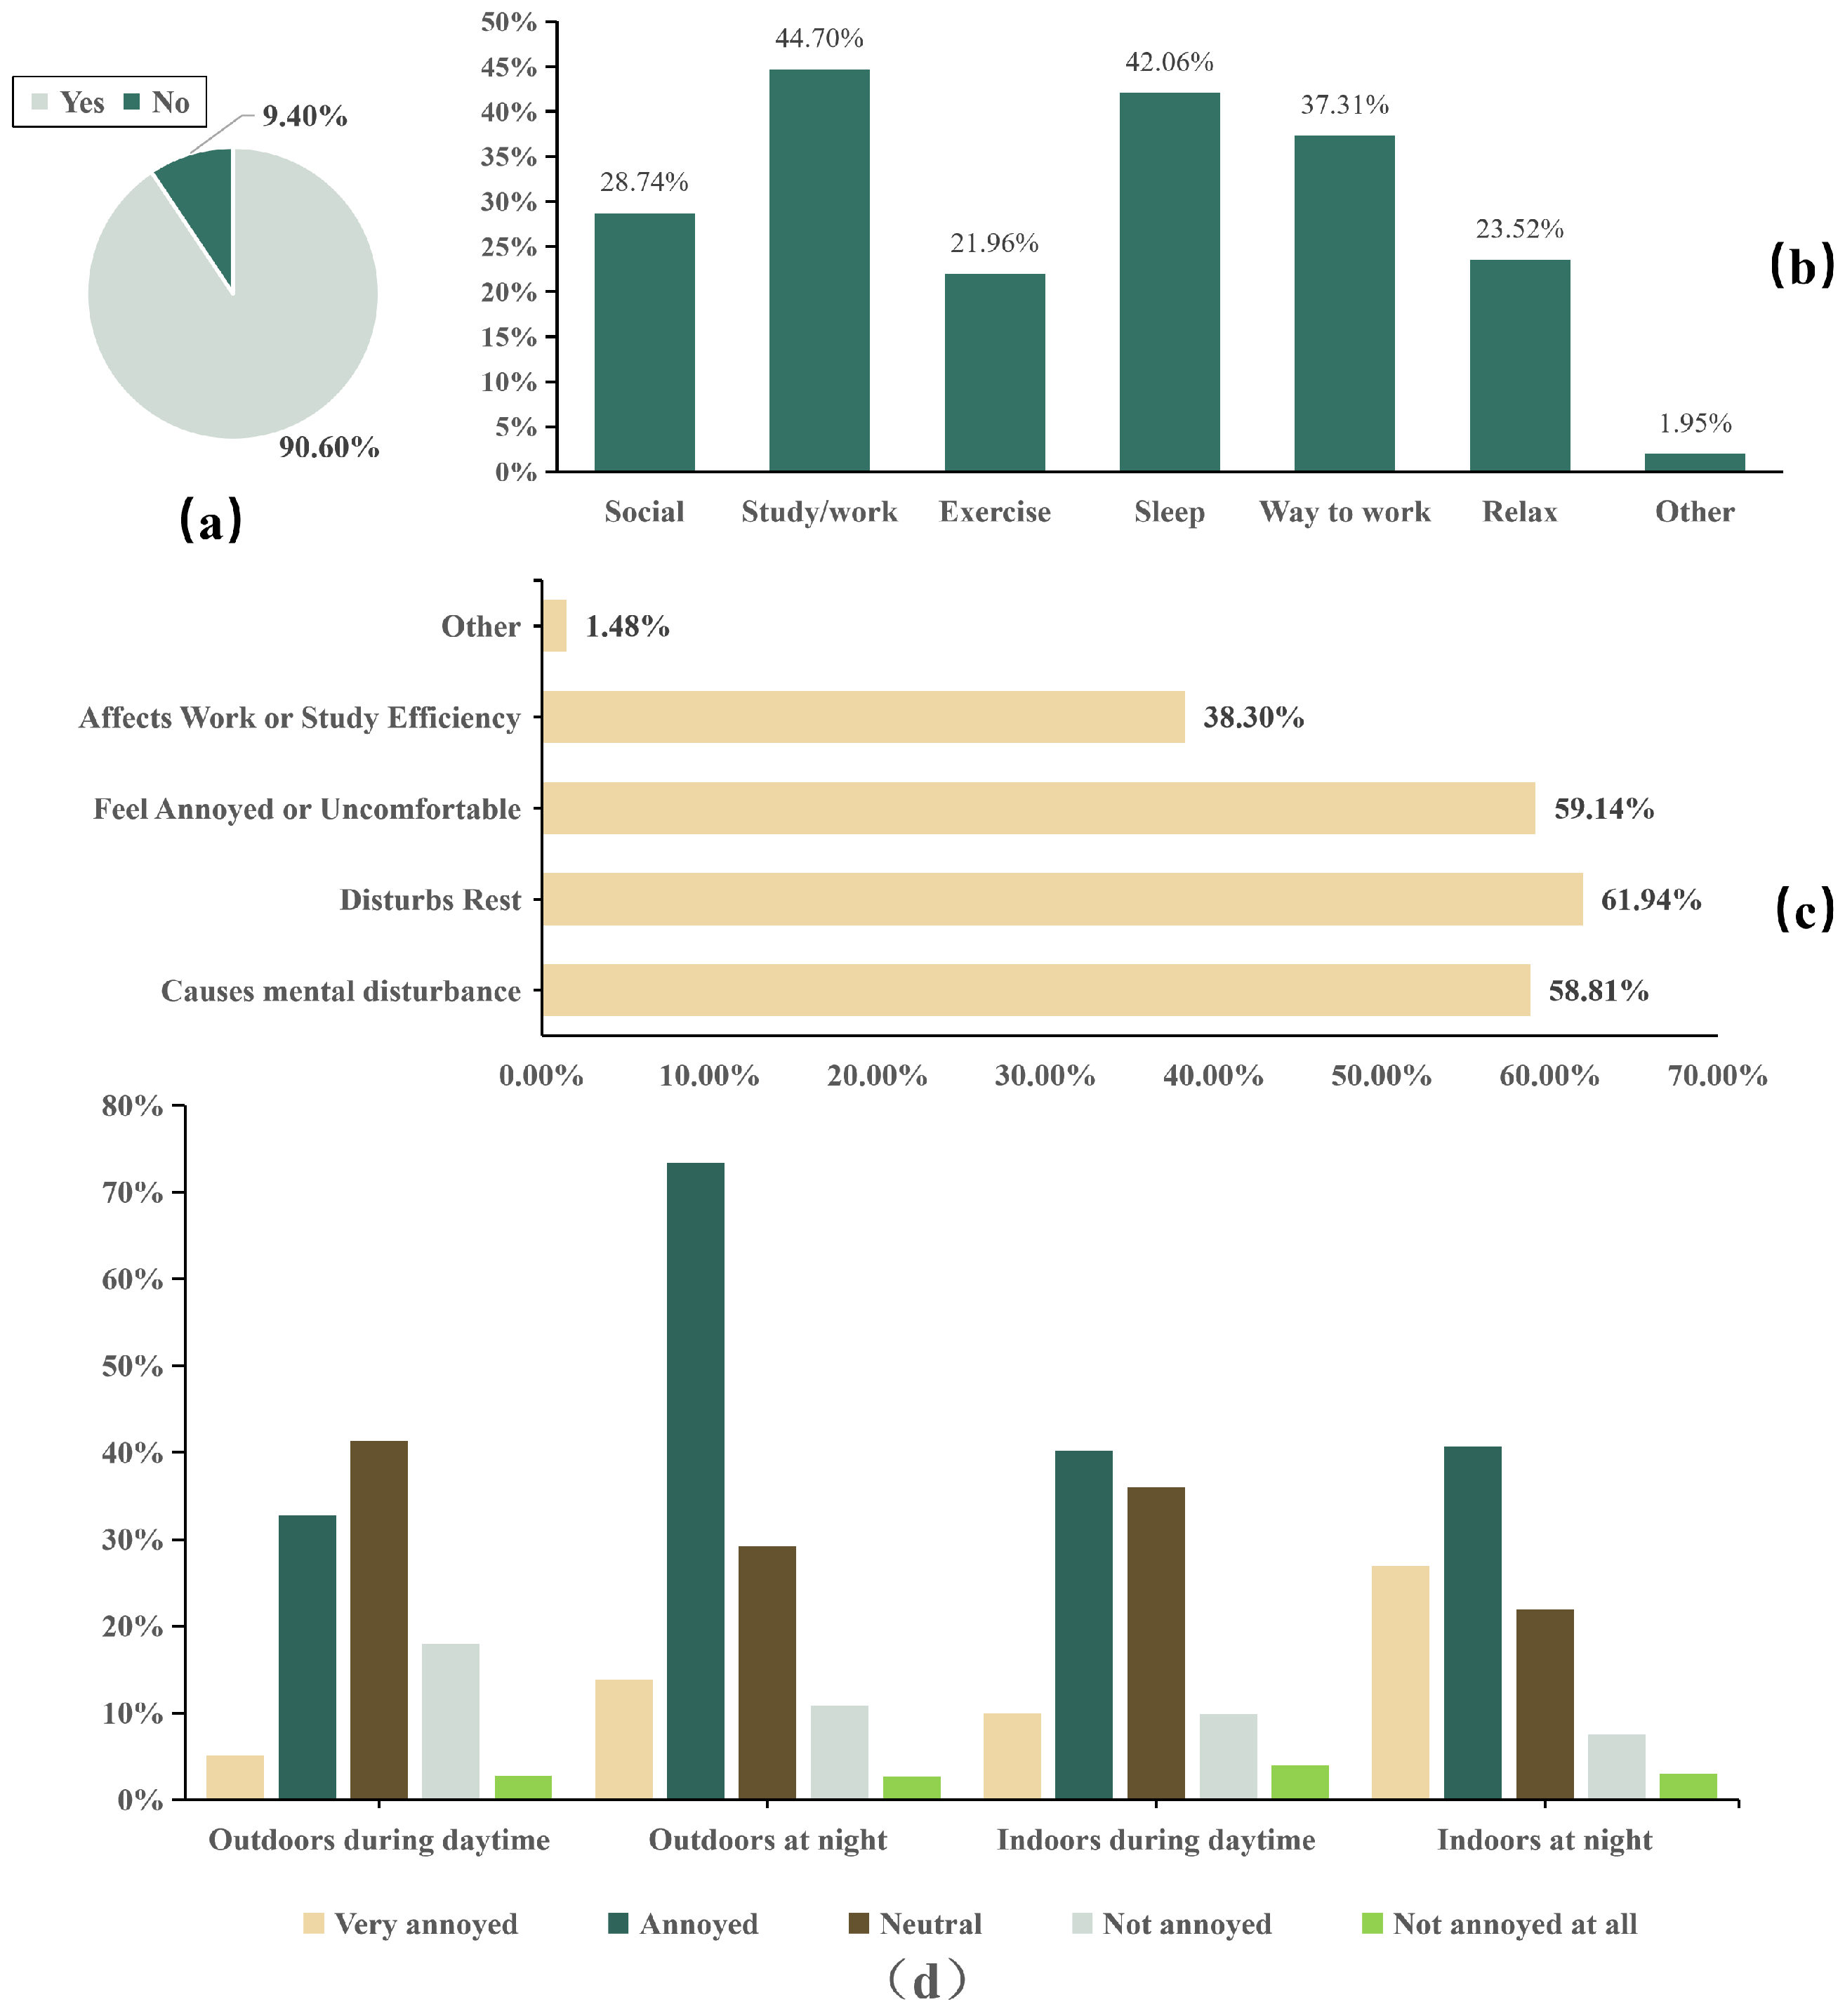
Figure 3 illustrates the results obtained from analyzing 1340 questionnaires, detailing the proportion of individuals troubled by SBeASs and the contexts in which these disturbances occur. The data show that a substantial 90.6% of participants indicated they were disturbed by SBeASs (Figure 3a). For specific disrupted activities (Figure 3b), SBeASs mainly interfered with residents’ rest (61.94%), work/study efficiency (59.14%), and mental state (58.81%). Sleep (42.06%) and relaxation (37.31%) were the most impacted activities (Figure 3c), emphasizing how SBeASs invades private and rest times. The level of annoyance with SBeASs varied significantly in different settings (Figure 3d). Notably, the highest percentages of respondents feeling “extremely annoyed” or “annoyed” were in indoor nighttime settings (67.6% combined), followed by outdoor nighttime settings (57.3% combined). Daytime outdoor environments had the lowest negative sentiment. This trend is clear:“nighttime > daytime, indoor > outdoor.”
Figure 3.
Survey results on the proportion of respondents troubled by SBeASs and the contexts in which disturbances occur. (a) Proportion of respondents troubled by SBeASs; (b) Activities disrupted by SBeASs; (c) Most impacted activities; (d) Annoyance levels in different settings (indoor/outdoor, daytime/nighttime).
3.2. Annoyance Caused by SBeASs, Considering Different Brands, SPLs, and Occurrence Frequencies
The data shown in Figure 4, Figure 5 and Figure 6 and the three-way repeated-measures ANOVA reported in this section are based on the mean annoyance ratings of the 28 participants for each of the 45 SBeAS samples (3 brands × 5 SPLs × 3 occurrence frequencies). For each sample, the annoyance score for each participant was the average of two repeated ratings. The scores were then averaged across participants to obtain the mean annoyance rating for each sample.
Figure 4.
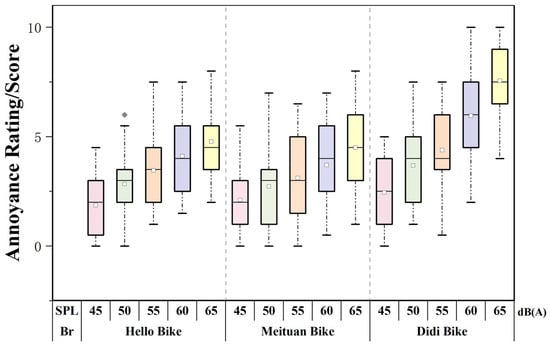
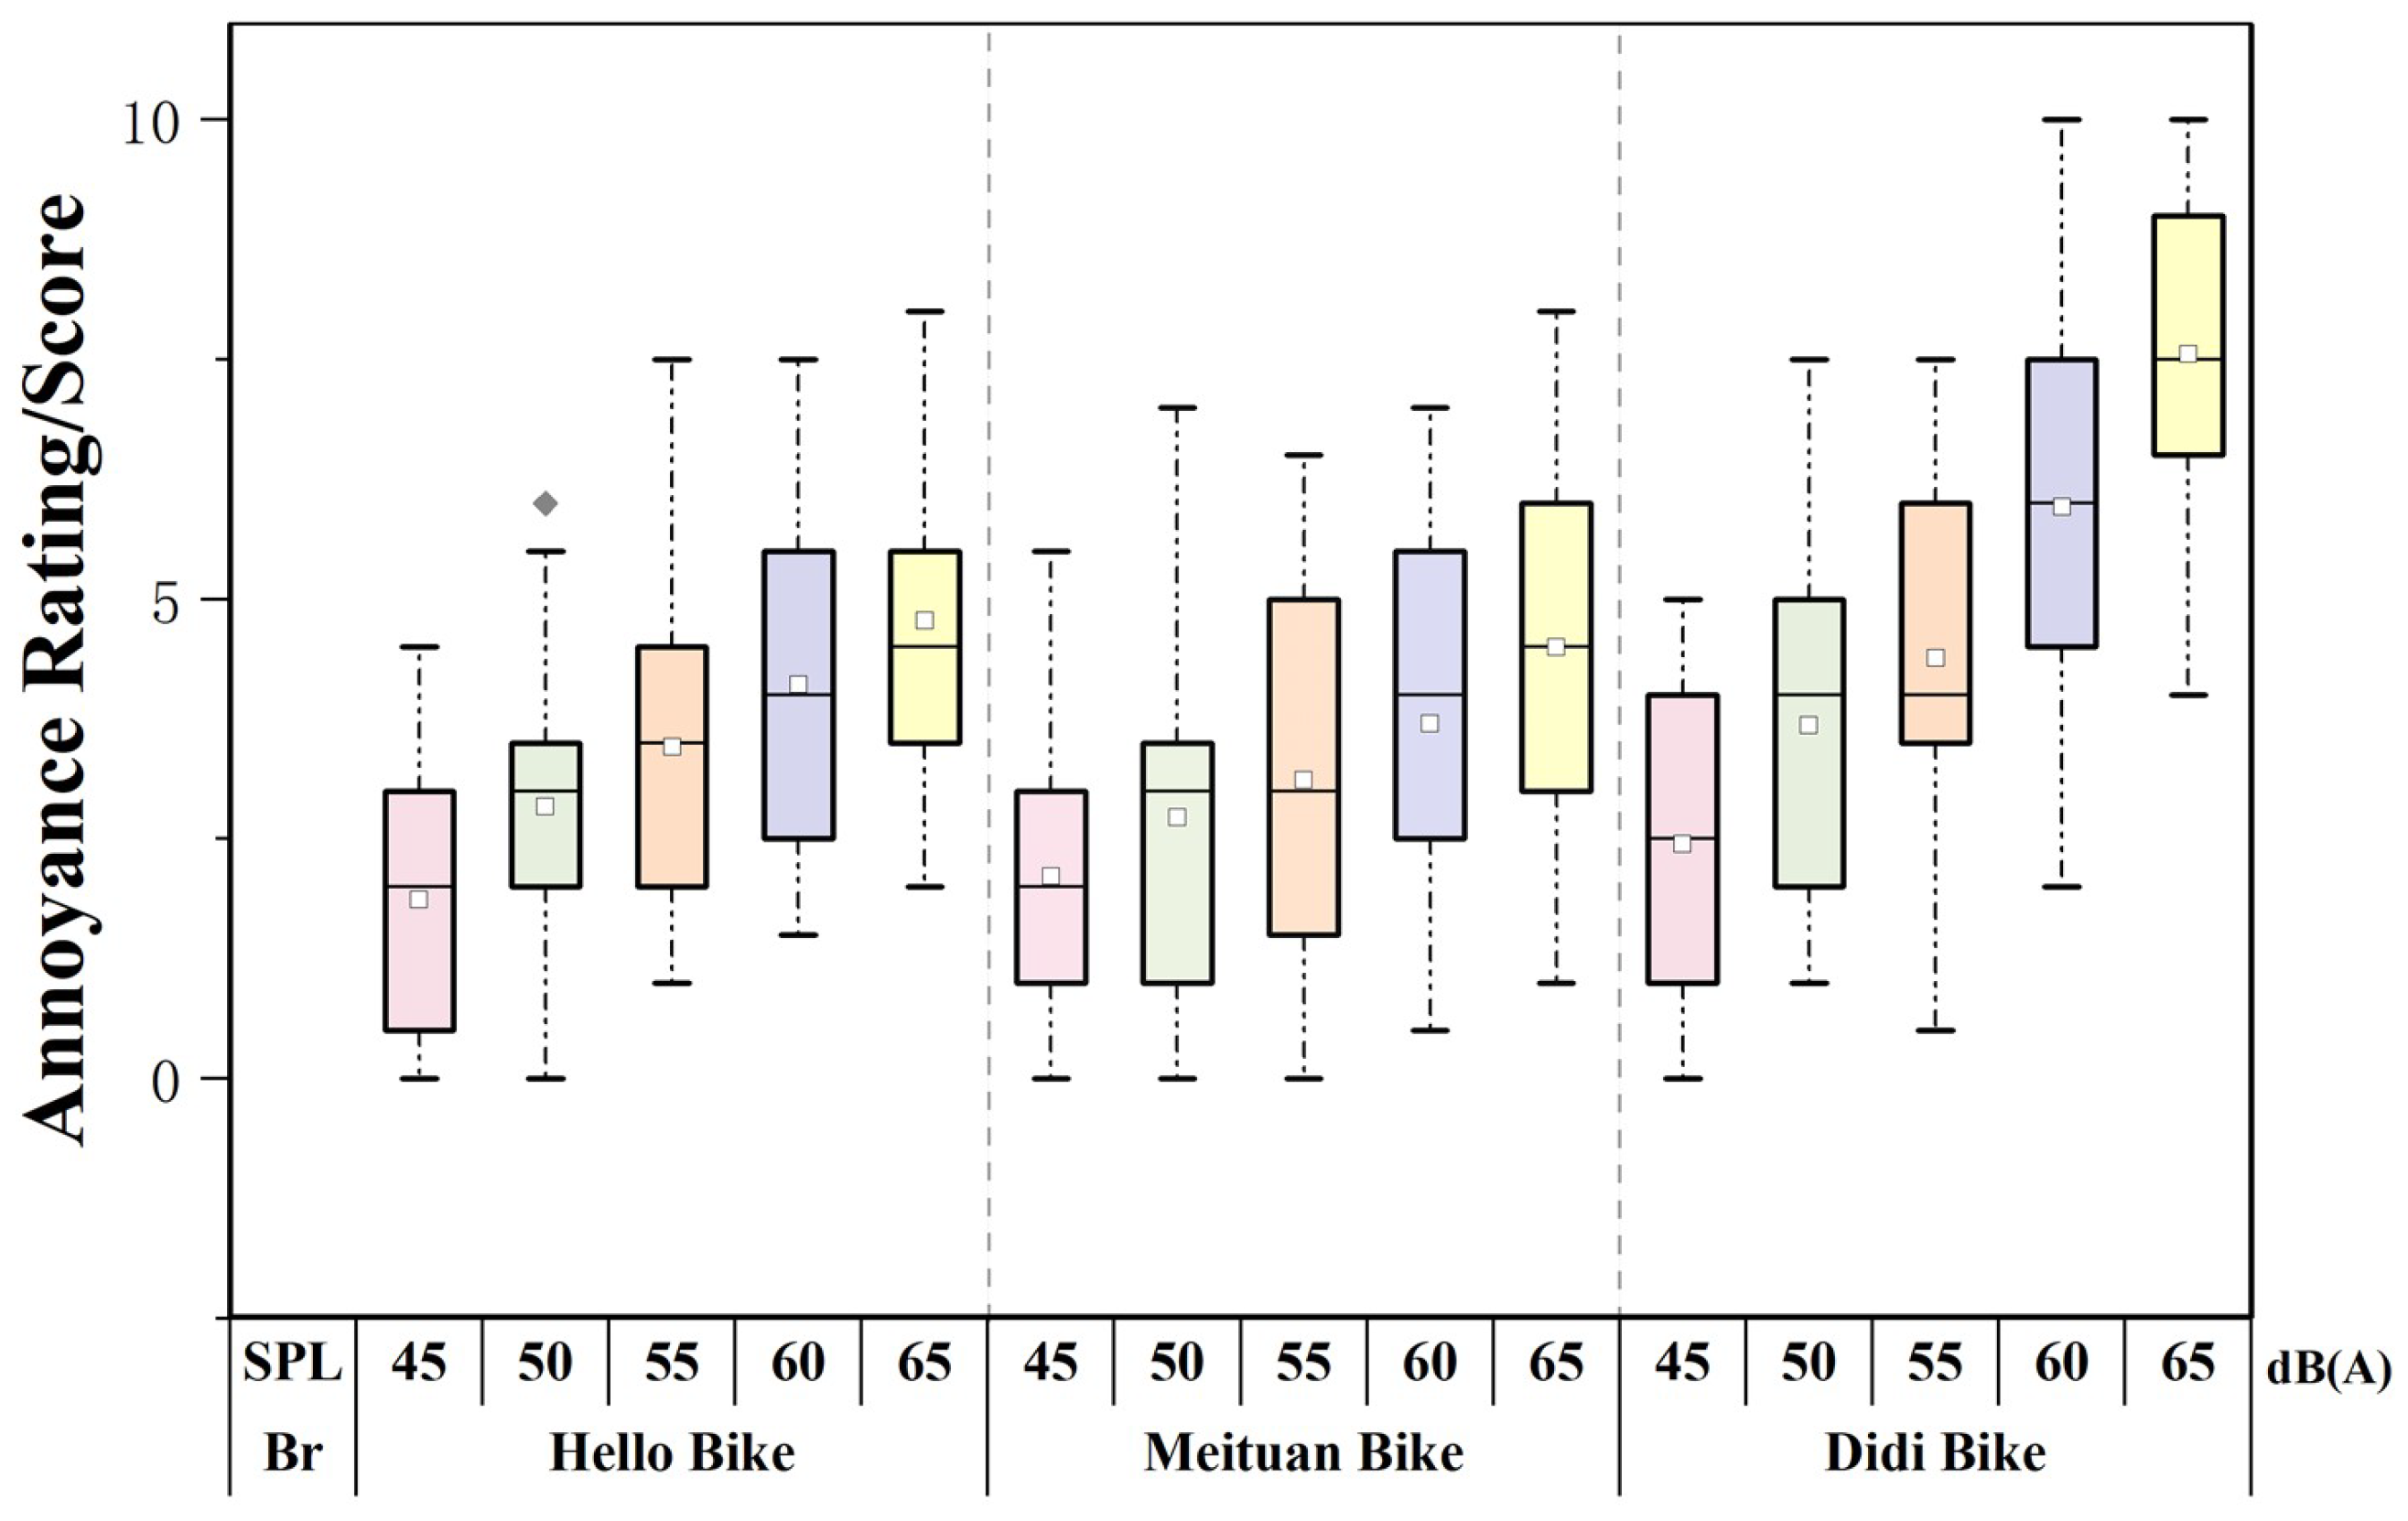
Box plots of subjective annoyance ratings for three brands of SBeASs under 45–65 dBA SPL conditions. The box encapsulates the interquartile range (IQR, Q1–Q3), while the whiskers extend to the data spread within 1.5 × IQR. The internal black line and white dot indicate the median and mean, respectively. The grey diamond represents outliers.
Figure 5.
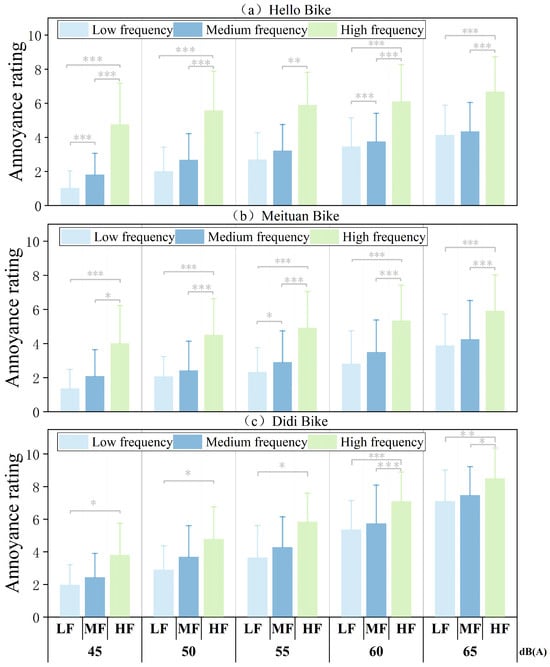
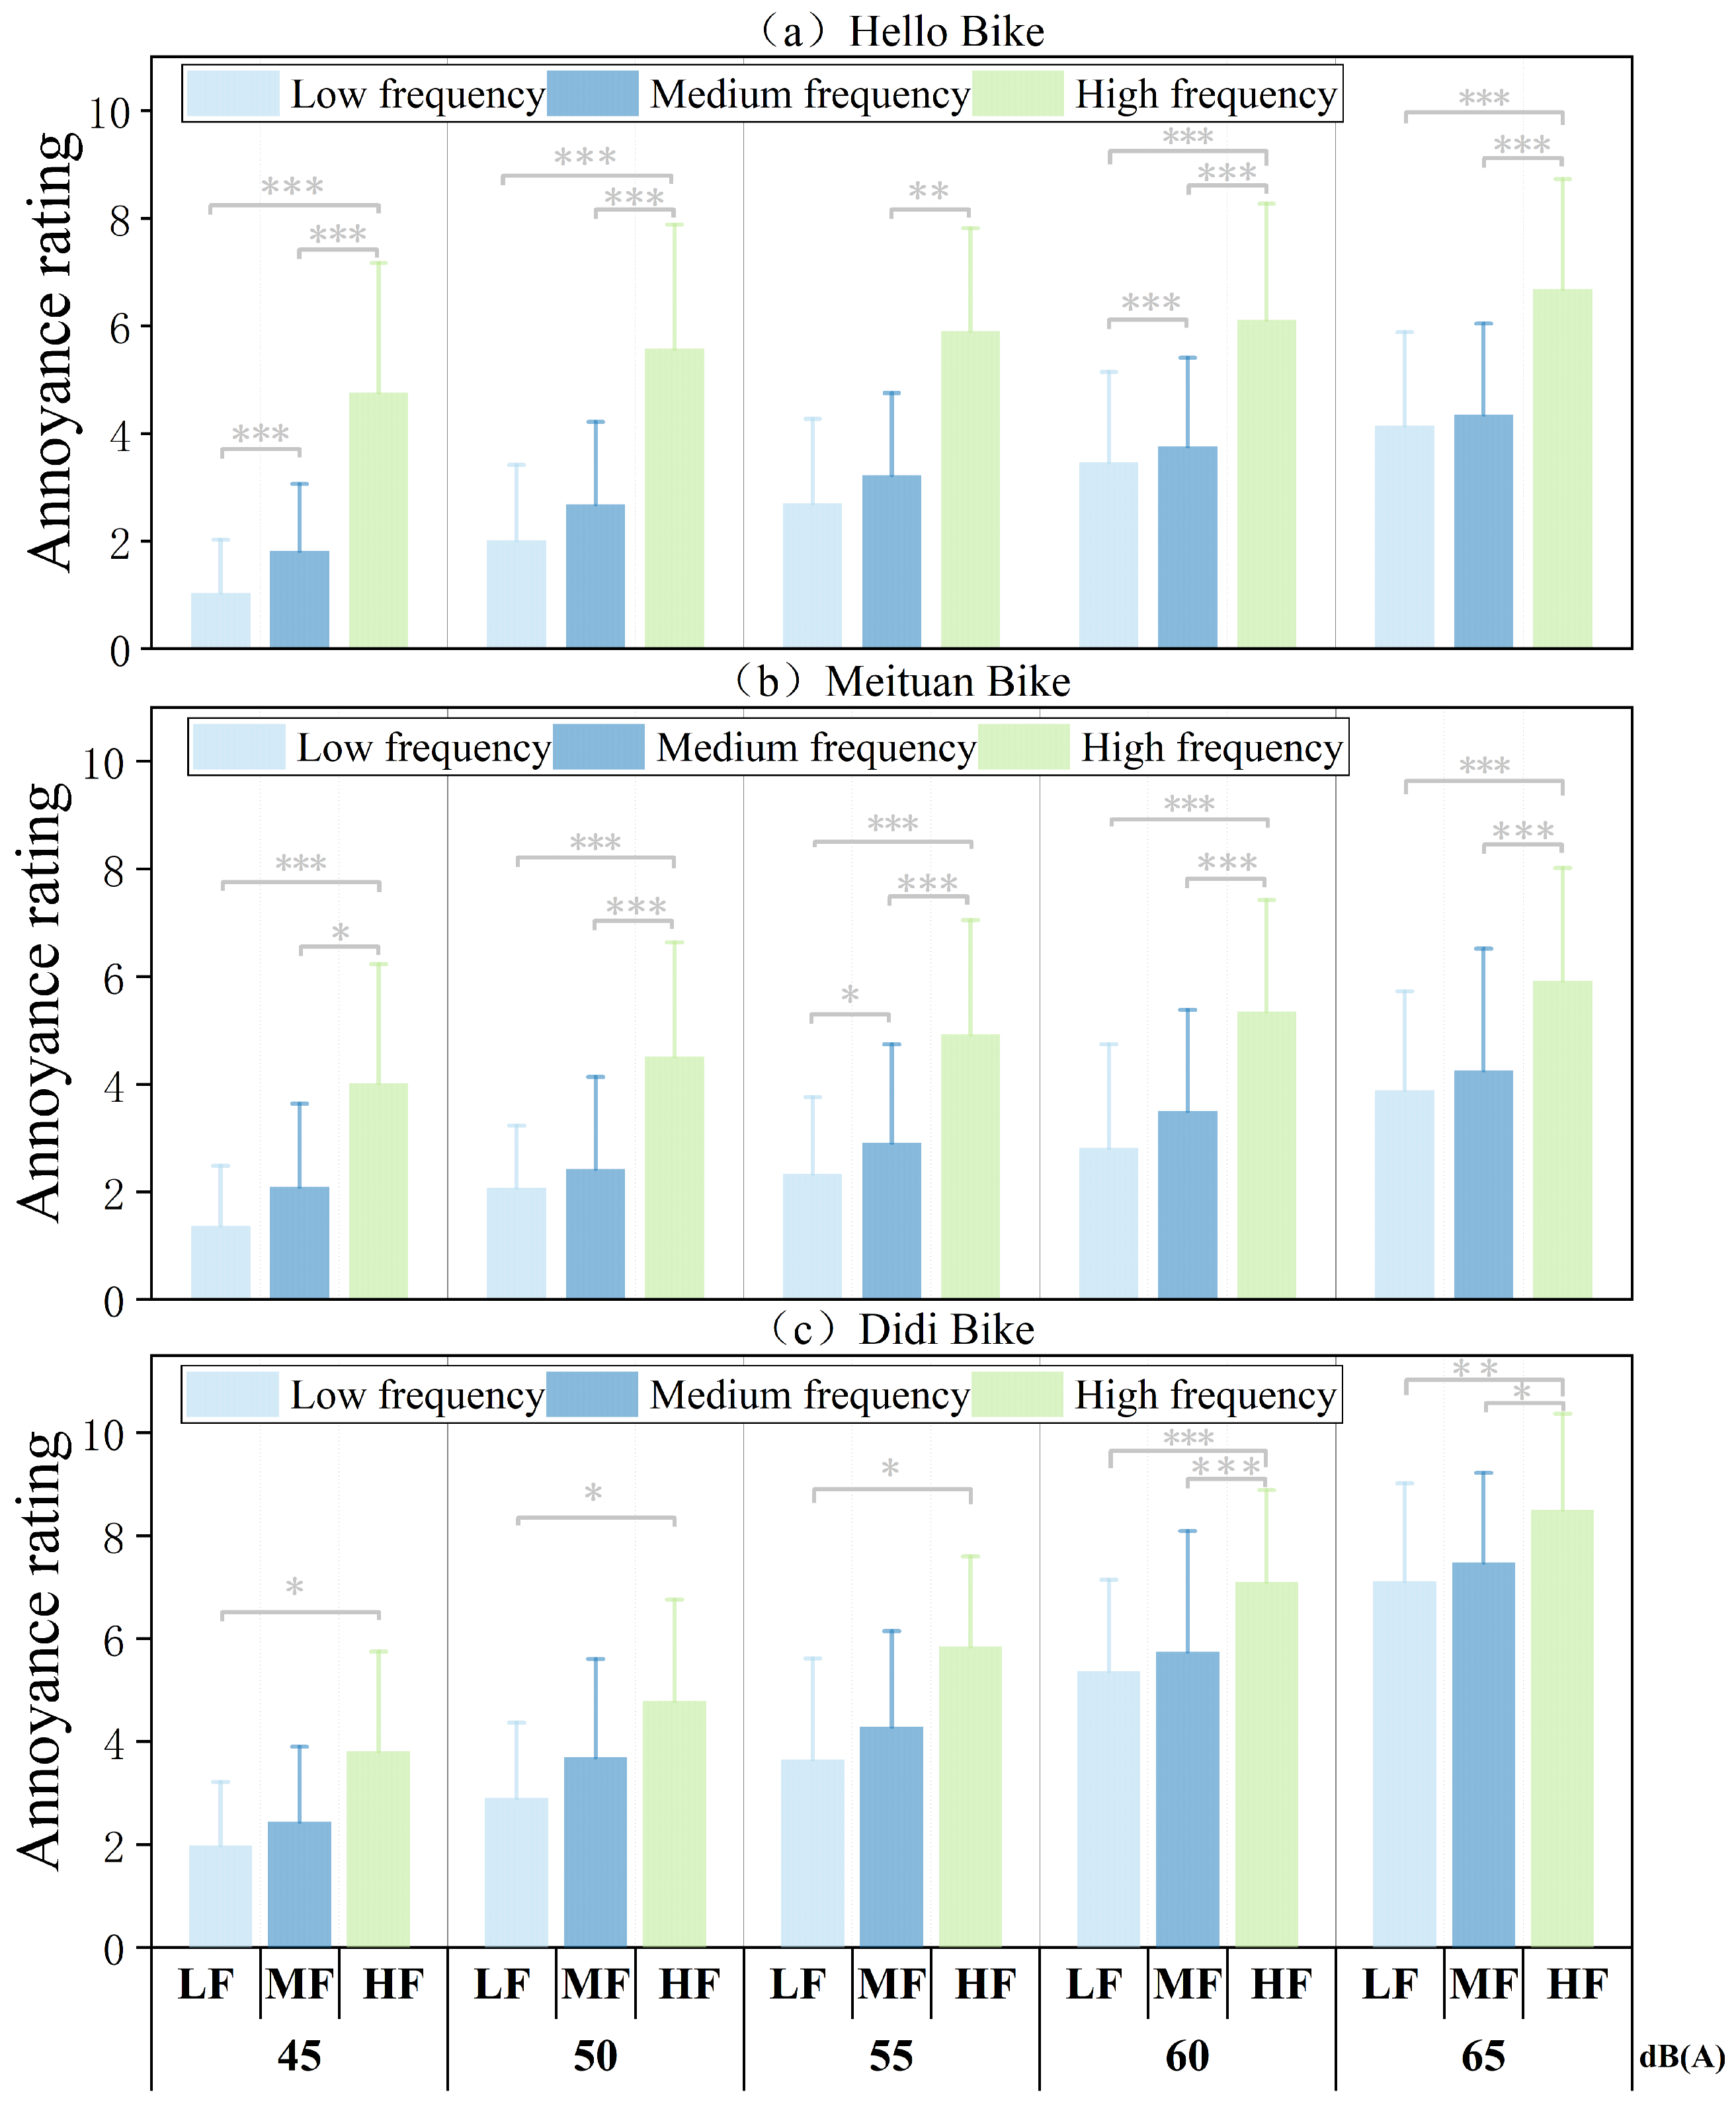
Annoyance variation of Hello/Meituan/DiDi SBeASs under low/medium/high occurrence frequencies. LF = low frequency (once per 5 s), MF = medium frequency (once per 3 s), HF = high frequency (once per second). Asterisks indicate statistically significant differences (* , ** , *** ).
Figure 6.
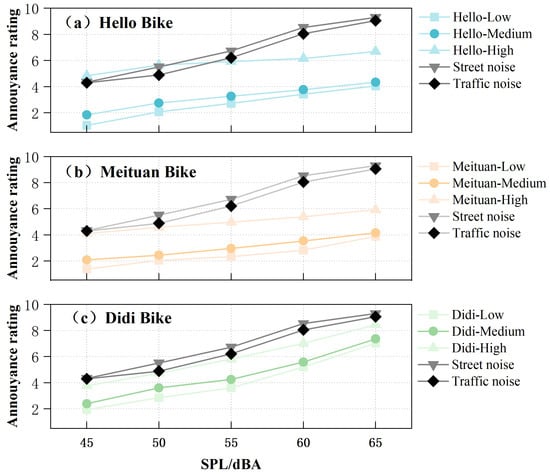
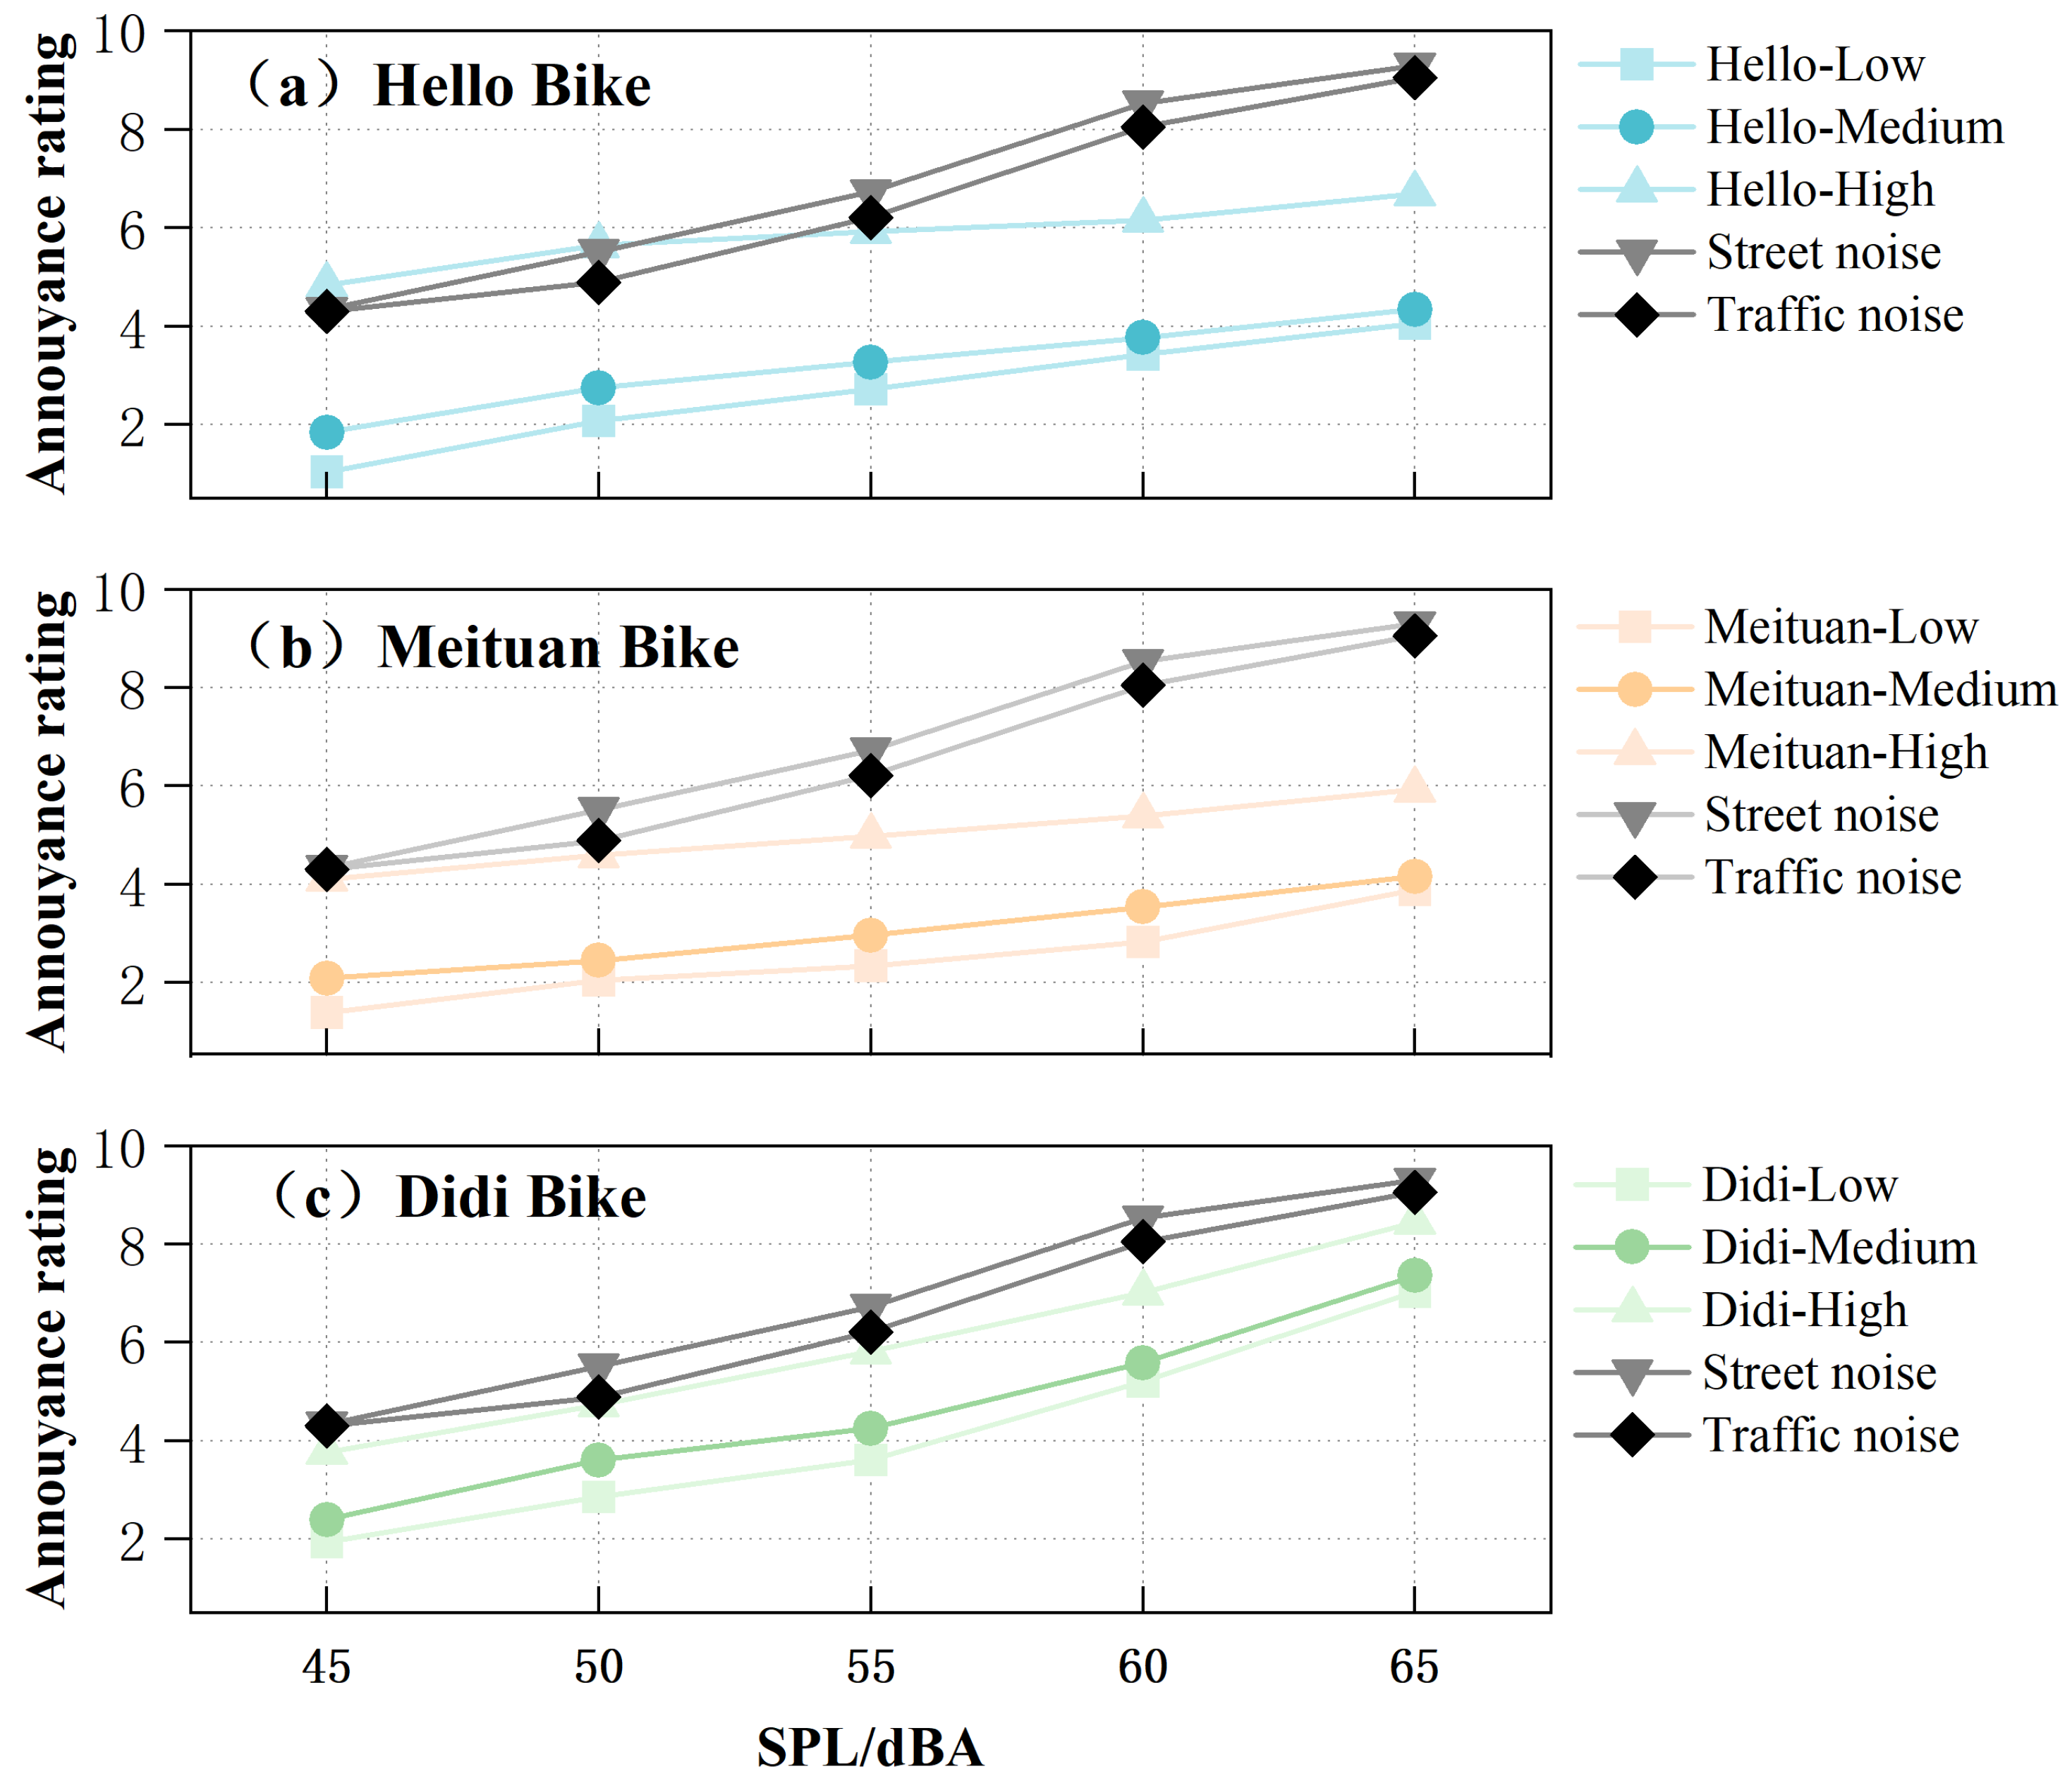
Comparison of annoyance between SBeASs at different occurrence frequencies (high/ medium/low) and traffic/street noise (S/T).
Figure 4 depicts the annoyance levels associated with three different SBeAS models at various SPLs. This chart compiles annoyance feedback from all participants, encompassing all possible occurrence frequencies.
Figure 4 indicates that as SPLs rise, annoyance levels for each of the three brands also increase. DiDi Bike, in particular, shows a sharp increase at SPLs of at least 55 dBA. At 65 dBA, DiDi Bike registered a notably higher annoyance score (7.56 ± 1.68) compared to Hello Bike (4.78 ± 1.65) and Meituan Bike (4.50 ± 1.95). At lower SPLs (45–50 dBA), the differences in annoyance scores among the brands were minimal; however, upon reaching 55 dBA, DiDi Bike’s scores began to significantly branch off from the others.
To examine how frequency of occurrence influences outcomes, Figure 5 highlights annoyance scores at varying frequencies for different brands and SPLs. Note that, under high-frequency conditions (1 s/occurrence), the annoyance score (6.69 ± 2.04) surpassed those in medium-frequency (4.35 ± 1.69) and low-frequency (4.15 ± 1.74) settings. This suggests that a greater SBeAS frequency leads to increased annoyance levels.
A three-way repeated-measures ANOVA showed significant main effects for SPL (F(1.809, 48.840) = 137.66, p < 0.001, = 0.836), occurrence frequency (F(1.247, 33.666) = 92.70, p < 0.001, = 0.774), and brand (F(1.837, 49.605) = 29.29, p < 0.001, = 0.520). The brand × SPL interaction was significant (F(4.531, 122.349) = 25.47, p < 0.001, = 0.485), while the SPL × frequency interaction was significant at the = 0.05 level (p = 0.017). Post-hoc tests (Bonferroni) indicated that DiDi Bike produced significantly higher annoyance than Hello Bike and Meituan Bike (p < 0.01), with no significant difference between Hello Bike and Meituan Bike (p = 0.127).
3.3. Comparisons with Traffic Noise and Street Noise
Figure 6 compares three SBeAS categories (DiDi Bike, Meituan Bike, Hello Bike) across different SPLs, with street noise and traffic noise. The figure classifies each SBeAS into low-frequency (once per 5 s), medium-frequency (once per 3 s), and high-frequency (once per second) groups, comparing them with the two kinds of environmental noise. Note that the subjective annoyance caused by certain high-frequency SBeASs can surpass that of traffic and street noise when measured under low SPL conditions (45–55 dBA). Above 55 dBA, environmental traffic/street noise scores were consistently higher than those of SBeASs.
3.4. Annoyance Differences by Noise Sensitivity
Noise sensitivity was assessed using the complete 21-item Weinstein Noise Sensitivity Scale as specified in GB/T 42473-2023 [40] (Appendix A of the standard). Each item is rated on a 6-point scale from 1 (strongly disagree) to 6 (strongly agree), with reverse scoring for negatively worded items. The total score thus ranges from 21 to 126. In the present sample, scores ranged from 66 to 115. Participants were divided into high- and low-sensitivity groups using a median split (median = 87): low-sensitivity (66–86, N = 14) and high-sensitivity (87–115, N = 14).
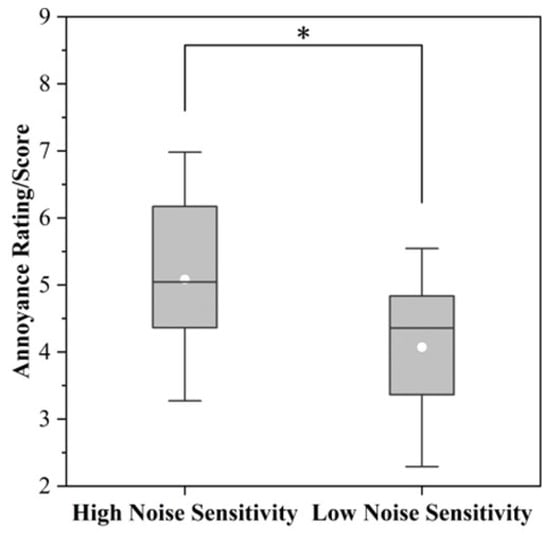
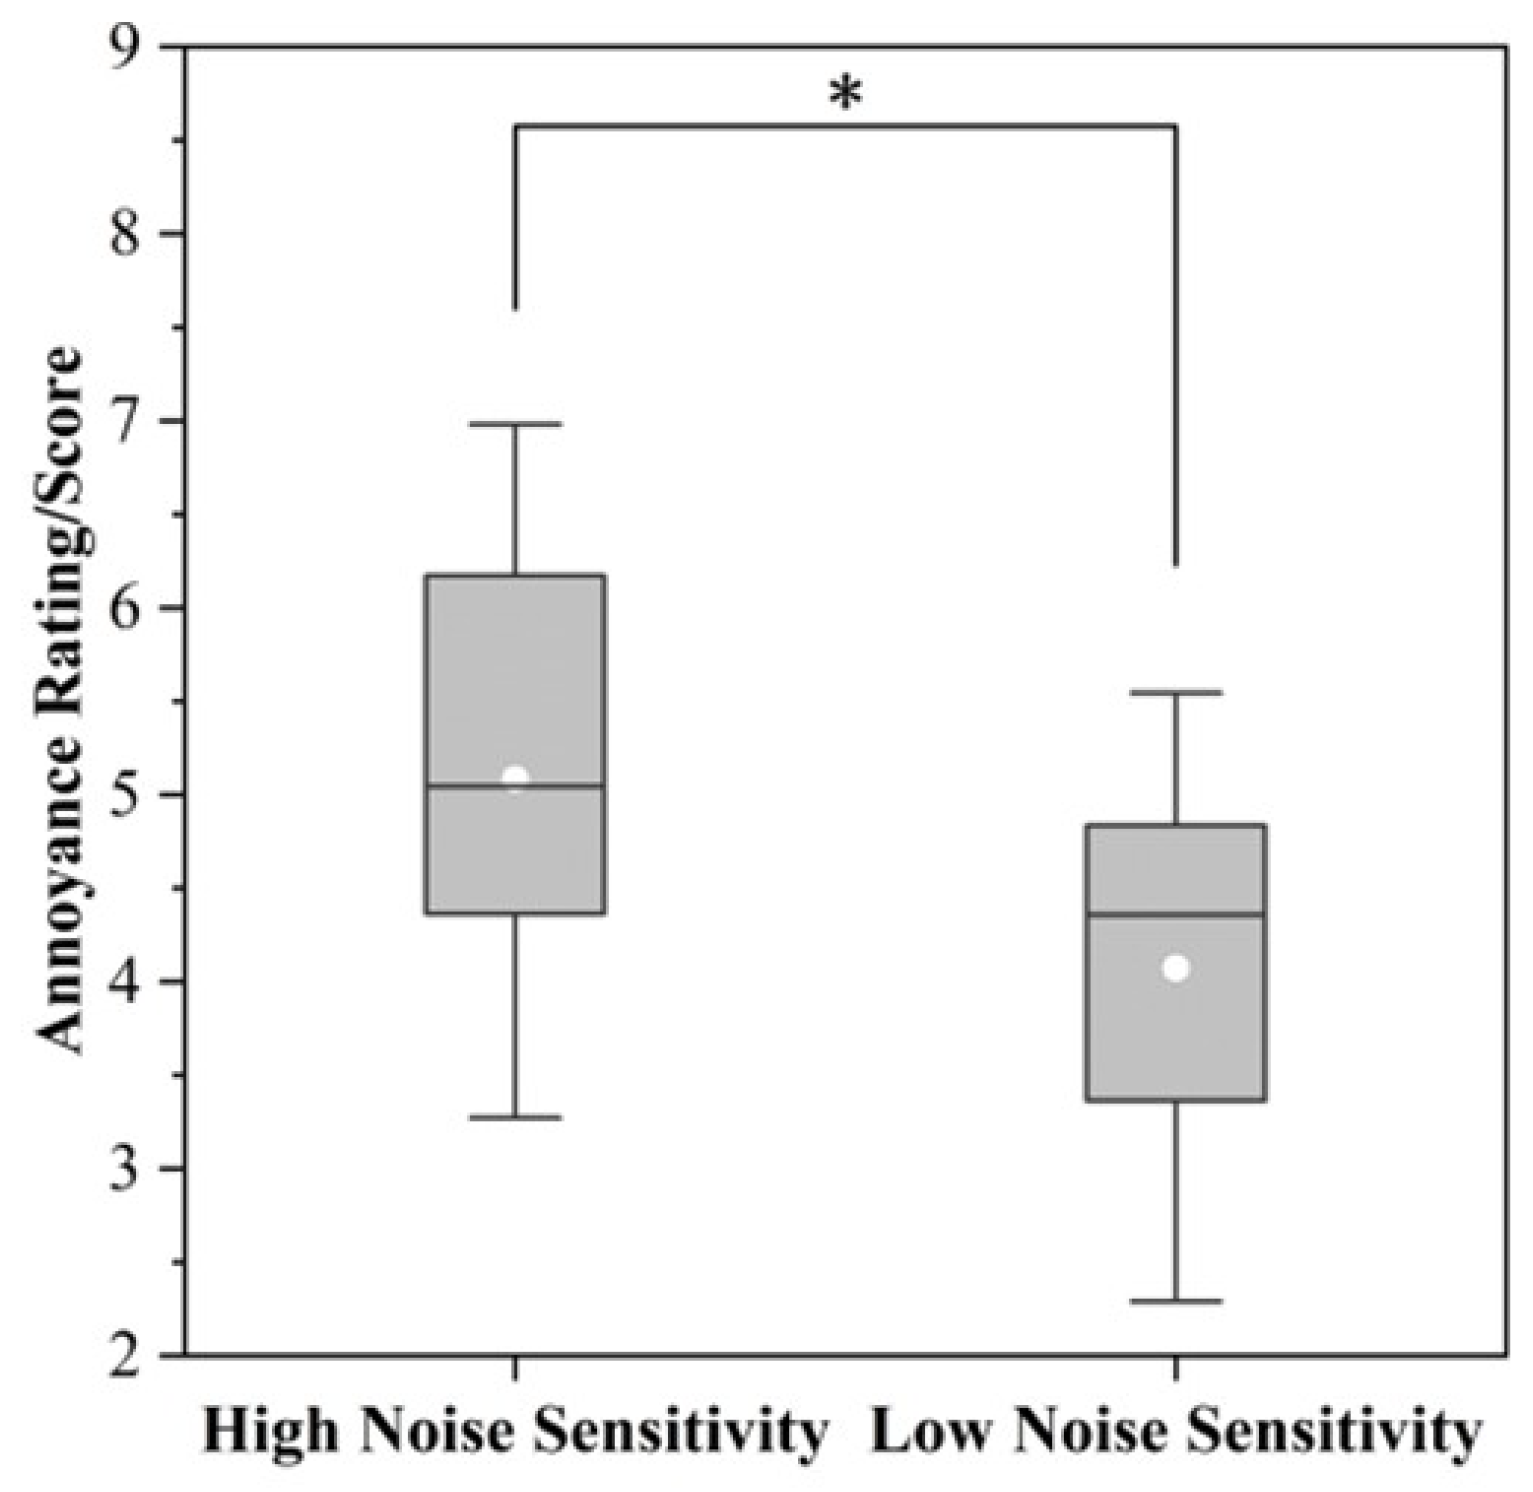
Research has shown that personal variations significantly impact noise sensitivity [38]. Those with heightened sensitivity are more likely to experience annoyance in loud environments, potentially due to their hearing levels. An independent-samples t-test revealed a significant difference between high- and low-sensitivity groups (, ), suggesting that the classification of noise sensitivity has a moderate impact on how alert tones are subjectively perceived. The analysis in Figure 7 shows that individuals with high sensitivity had considerably greater annoyance scores than those with low sensitivity, underscoring that such individuals have stronger adverse emotional reactions to SBeASs.
Figure 7.
Comparison of annoyance scores across groups with differing levels of noise sensitivity, accompanied by score distribution. * p < 0.05. The white dots represent average values.
4. Discussion
To thoroughly explore the potential effects of SBeASs on the general populace and assess corresponding annoyance levels, an extensive online survey was conducted in conjunction with controlled subjective annoyance experiments in a laboratory setting. The survey findings indicate that 90.6% of all respondents (N = 1340) reported being affected by SBeASs, with nighttime rest and daytime work efficiency being the most affected activities. Moreover, the annoyance experiments, which were centered on three prevalent types of SBeASs, demonstrated that the levels of annoyance caused by SBeASs are associated with the SBeAS type, SPL, and occurrence frequency. Additionally, these effects are influenced by the varying noise sensitivity levels of different individuals.
The survey findings show that 90.6% of respondents are troubled by SBeASs, upgrading it from a minor issue to a serious urban noise problem. Key areas affected are nighttime rest and daytime work productivity. At night, the unpredictable nature of alerts disrupts sleep, while during the day, frequent alerts break concentration and lower efficiency. Participants noted “disturbing rest” and “inducing annoyance” as major negative impacts. These sounds act not only as physical disturbances but also as psychological stressors, disrupting expectations of quiet and leading to high annoyance, as observed in laboratory settings.
SBeAS annoyance is not dictated by a single factor but by a complex mix of acoustic features, exposure conditions, and personal differences. The SBeAS of DiDi Bike, due to its high loudness and roughness, is significantly more annoying at SPLs of ≥55 dBA, aligning with the idea that “loudness is the dominant factor in noise perception” [45]. Meituan Bike’s higher high-frequency energy and sharp timbre also contribute to a piercing sound quality. These findings suggest that psychoacoustic factors, beyond SPL, are key in explaining annoyance variations among brands. Time-spectral map analysis reveals distinct acoustic features in SBeASs (Hello Bike, Meituan Bike, and DiDi Bike) compared to environmental noise. SBeASs have transient spectral qualities, e.g., low-frequency focus in DiDi Bike and mid-to-high frequencies in Hello and Meituan Bikes. Conversely, traffic and street noise are continuous signals, leading to different perceptual effects. Alert tones capture attention and disrupt auditory scenes, causing cumulative annoyance, especially with repeated exposure. In contrast, steady-state noise encourages auditory adaptation, supporting the findings of Rajala and Hongisto [28], who suggested that transient sounds cause more annoyance at the same sound levels. Previous studies have shown that low-frequency noise is more likely to cause distress in subjects [46]. This is consistent with the research conclusion of Hu et al. [47] on the annoyance curve of low-frequency noise. Their experiments showed that at the same sound pressure level, the annoyance caused by low-frequency signals increased significantly with decreasing frequency.
SPL emerges as the preeminent determinant affecting annoyance. This outcome is consistent with traditional noise assessment theory, which asserts that the magnitude of acoustic energy constitutes the physical foundation that defines the intensity of auditory stimuli and is directly linked to perceived loudness [45]. It also harmonizes with results from Liu et al. [48] concerning the influence of burst rate in pure-tone noise on annoyance. Elevated SPLs were associated with significantly higher annoyance ratings in the present study.
The frequency of occurrence significantly impacted subjective annoyance levels, highlighting that repeated exposure to SBeASs, which are intermittent, sudden sounds, is a crucial contributor to cumulative annoyance. This is consistent with the findings of Park et al. [31] on sudden train noise changes and those of Rajala and Hongisto [28] on pulsed sounds, where unpredictability and repetition heighten annoyance. This finding supports previous research showing that noise parameters (sound level, frequency, duration) notably affect subjective responses [22].
Under certain conditions, SBeASs can be more annoying than environmental noise. This study detected that at low SPLs (45–55 dBA), the subjective annoyance from frequent SBeASs might surpass that from traffic and street noise at the same SPL. This might be due to the transient, unpredictable, and sharp nature of the alert tones in the mid-to-high frequency range. In quieter environments (typical residential noise levels of 40–50 dBA), the contrast of SBeASs against the low background noise intensifies, heightening their perception as a significant annoyance. This supports the idea that sudden noise is more likely to cause auditory discomfort than steady-state noise [37].
Individuals highly sensitive to noise report greater annoyance than those with low sensitivity, underscoring noise sensitivity as a significant psychological factor in subjective auditory responses. This aligns with previous findings on environmental noise [49], indicating variability in psychological reactions to noise stimuli. Thus, individual differences are crucial when evaluating the impact of noise, alongside objective measures.
This study has effectively used transient noise, psychoacoustic assessment, and individual differences theory to explore SBeASs, a new urban noise source. The results validate classic theories in fresh contexts. Focusing on SBeASs as a novel high-frequency noise source, this work contributes to the study of sudden, inconsistent noise annoyance and supports the refinement of urban soundscape and public health noise assessment theories. Additionally, it offers practical insights for shared bicycle operators and urban noise managers.
This study is limited by the following factors: (1) Experiments were conducted in a sound-controlled lab with standardized audio, not in real-world environments with mixed sound sources and visual distractions; (2) Participants were mainly young adults aged 18–35, excluding older individuals and those with different auditory sensitivities or occupational exposure, which restricts generalizability; (3) The study focused on immediate noise annoyance, omitting the investigation of long-term effects or habituation from extended exposure; (4) Furthermore, the application of research findings may be influenced by regional development disparities (such as the prevalence and usage intensity of shared bicycles), local policy regulations, and user group habits; (5) The psychoacoustic analysis was limited to loudness, roughness, and sharpness; fluctuation strength and temporal variability were not examined.
Nevertheless, the core significance of this study lies precisely in the distinctiveness of its subject matter—shared bicycle electronic alerts, which are a rapidly proliferating and widely complained about new urban sound source, and remain inadequately addressed by existing noise control systems. Therefore, despite the aforementioned limitations, a systematic assessment of this specific sound source retains urgent practical relevance, providing indispensable scientific evidence for the formulation of relevant standards and the optimization of governance strategies.
5. Conclusions
This study has systematically examined the impact of shared bicycle electronic sounds (SBeASs)—a novel urban noise source—on the public’s subjective annoyance levels through a combined questionnaire survey and a subjective annoyance experiment. The primary findings are as follows:
- Within the surveyed sample, 90.6% of respondents reported being affected by SBeASs—chiefly with respect to their nighttime rest and work efficiency.
- The subjective annoyance of SBeASs depends on acoustics, exposure, and individual factors. Experiments show that SPLs and occurrence frequency are key factors; higher SPLs and more frequent occurrences markedly increase annoyance. SBeASs vary across brands due to differing psychoacoustic parameters. The DiDi Bike sound, with its greater loudness and roughness, causes significantly more annoyance than other sounds at high SPLs (≥55 dBA).
- While traffic and street noise commonly cause more annoyance than SBeASs at equivalent SPL, high-frequency SBeASs—owing to their sudden and unpredictable nature—can provoke more annoyance than continuous noise in quiet environments. This underscores their distinct disruptive impact as abrupt sound sources.
- Individual noise sensitivity serves as a crucial psychological factor in regulating annoyance levels, with highly sensitive individuals exhibiting significantly stronger negative reactions to SBeASs.
Author Contributions
K.M. [Collected and preprocessed experimental data, conducted field/ laboratory work, led in-depth data analysis and result interpretation, completed literature review and theoretical foundation construction, summarized research background and existing studies, and organized original data/reports]. L.L. (Corresponding Author) [Designed the overall research framework, reviewed and revised the manuscript, secured research funding, and provided overall guidance]. Y.S. [Advised on research methodology and tool selection, and assisted in manuscript revision (language and citation standardization)]. All authors have read and agreed to the published version of the manuscript.
Funding
This research was funded by the Middle-aged and Young Teachers’ Basic Ability Promotion Project of Guangxi (2024KY0028) and the Young Talent Inclusive Support Policy Research Start-up Funding (ZX02080030324022).
Institutional Review Board Statement
The study was conducted in accordance with the Declaration of Helsinki, and approved by the Institutional Review Board (or Ethics Committee) of Guangxi University (protocol code GXU2024043 and date of approval: 18 July 2024). The experiments in the present study were conducted after obtaining this ethical approval.
Informed Consent Statement
Informed consent was obtained from all subjects involved in the study.
Data Availability Statement
The data presented in this study are available on request from the corresponding author due to privacy or ethical restrictions.
Acknowledgments
This work was supported by the Middle-aged and Young Teachers’ Basic Ability Promotion Project of Guangxi (Grant No. 2024KY0028) and the Young Talent Inclusive Support Policy Research Start-up Funding (ZX02080030324022). The authors wish to express their gratitude to Liuying Ou for her valuable suggestions, as well as to all participants involved in the questionnaire survey and psychoacoustic experiments. During the preparation of this manuscript, the authors used DeepSeek (DeepSeek AI, China) for language refinement and grammar checking. The authors have reviewed and edited the output and take full responsibility for the content of this publication.
Conflicts of Interest
The authors declare no conflicts of interest. The funders had no role in the design of the study; in the collection, analyses, or interpretation of data; in the writing of the manuscript; or in the decision to publish the results.
Appendix A. Questionnaire
The full text of the questionnaire used in the online survey is provided below.
- Questionnaire on Annoyance Caused by Shared-Bike Electronic Alert Sounds
Dear Respondent,
We are conducting a study on the impact of shared-bike electronic alert sounds (SBeASs) on the public. This questionnaire aims to collect your honest feedback on the annoyance caused by SBeAS and how these sounds affect your daily life and work efficiency. Thank you for your cooperation.
| Have you ever been annoyed by shared-bike electronic alert sounds? |
| Q1. □ Yes □ No |
| Part 1. Basic Information |
| Q2. Your gender: |
| □ Male □ Female |
| Q3. Your age: |
| □ Under 18 □ 18–25 □ 26–35 □ 36–45 □ 46–55 □ 56 or above |
| Q4. Your occupation: |
| □ Student □ Employee □ Freelancer □ Retired □ Other |
| Part 2. Subjective Perception of SBeAS |
| Q5. How often do you hear SBeAS? |
| □ Often □ Occasionally □ Never |
| Q6. How do you perceive the volume of SBeAS? |
| □ Very low, barely audible □ Low but audible □ Moderate □ High, somewhat harsh □ Very high, very harsh |
| Q7. How do you rate the comfort of SBeAS? |
| □ Very uncomfortable □ Uncomfortable □ Neutral □ Comfortable □ Very comfortable |
| Q8. Where do you most often hear SBeAS? (Select all that apply) |
| □ Residential area □ Commercial area □ Near schools □ Office area □ Open street □ Other (please specify): __________ |
| Q9. Which activities have been disrupted by SBeAS? (Select all that apply) |
| □ Socializing □ Studying/working □ Exercising □ Sleeping □ Commuting □ Leisure □ Other (please specify): __________ |
| Part 3. Annoyance Caused by SBeAS |
| Q10. During which time periods do you find SBeAS most annoying? (Select all that apply) |
| □ Morning (7:00–9:00) □ Noon (12:00–14:00) □ Afternoon (15:00–17:00) □ Evening (18:00–22:00) □ Late night (after 22:00) |
| Q11. How does the annoyance manifest? (Select all that apply) |
| □ Noise pollution □ Disturbed rest □ Feeling irritated or uneasy □ Reduced work/study efficiency □ Other |
| Q12. How much does SBeAS affect your daily life? |
| □ Very much □ Much □ Moderately □ Slightly □ Not at all |
| Q13. Does SBeAS affect your work efficiency or concentration? |
| □ Very much □ Much □ Moderately □ Slightly □ Not at all |
| Q14. How annoyed are you by SBeAS in the following scenarios? |
| (a) During the day, outdoors: |
| □ Very annoyed □ Annoyed □ Neutral □ Not annoyed □ Not at all annoyed |
| (b) At night, outdoors: |
| □ Very annoyed □ Annoyed □ Neutral □ Not annoyed □ Not at all annoyed |
| (c) During the day, indoors (e.g., office, classroom): |
| □ Very annoyed □ Annoyed □ Neutral □ Not annoyed □ Not at all annoyed |
| (d) At night, indoors (e.g., bedroom): |
| □ Very annoyed □ Annoyed □ Neutral □ Not annoyed □ Not at all annoyed |
| Part 4. Suggestions for Improvement |
| Q15. In which aspects could SBeAS be improved? (Select all that apply) |
| □ Lower volume □ Change the tone/melody □ Limit playback time/frequency □ User control (e.g., option to turn off) □ Other (please specify): __________ |
| Q16. Do you have any other suggestions or comments on SBeAS? |
| ______________________________________________________________________ |
References
- Gong, M.; Xin, R.; Yang, J.; Wang, J.; Li, T.; Zhang, Y. Spatio-temporal dynamics and recovery of commuting activities via bike-sharing around COVID-19: A case study of New York. J. Transp. Geogr. 2024, 121, 104031. [Google Scholar] [CrossRef] [Scilit]
- Todd, J.; O’Brien, O.; Cheshire, J. A global comparison of bicycle sharing systems. J. Transp. Geogr. 2021, 94, 103119. [Google Scholar] [CrossRef] [Scilit]
- Liu, J.; Ma, W.X. Evolutionary equations of a sharing-bicycle system and their solutions. Wave Motion 2025, 134, 103498. [Google Scholar] [CrossRef] [Scilit]
- Dai, Y.; Xu, L.; Zhang, X.; Fu, Y.; Dong, W. Promoting sustainable development: A study of China’s bicycle sharing industry policies based on text analysis. Res. Transp. Bus. Manag. 2024, 52, 101085. [Google Scholar] [CrossRef] [Scilit]
- Li, Y.; Wang, S.; Tang, J.H.C.G.; Peng, Z.; Zhuge, C. Public attention and attitudes towards bike-sharing in China: A text mining approach. Transp. Res. Part D Transp. Environ. 2024, 134, 104348. [Google Scholar] [CrossRef] [Scilit]
- Zhang, K.; Song, Q.; Ma, H.; Qiu, W.; Li, M.; Kim, I. Synergistic role of audio-visual perceptions in promoting bikeshare for active travel. Transp. Res. Part D Transp. Environ. 2025, 145, 104806. [Google Scholar] [CrossRef] [Scilit]
- Andrade, K.P.; Souza, R.D.P.; Matos, I.M.D. Noise level measurement and its effects on hospital employees based on complaint reports. Rev. CEFAC 2016, 18, 1379–1388. [Google Scholar] [CrossRef] [Scilit]
- Berchtold, A. Test-retest: Agreement or reliability? Methodol. Innov. 2016, 9, 307–317. [Google Scholar]
- Abbasi, M.; Monazzam Esmaeilpour, M.R.; Akbarzadeh, A.; Zakerian, S.A.; Ebrahimi, M.H. Investigation of the effects of wind turbine noise annoyance on the sleep disturbance among workers of Manjil wind farm. J. Health Saf. Work 2015, 5, 51–62. [Google Scholar]
- Oommen, B.; Sagesh, M.; Midhuna, K.; Yadukrishna, S. Epidemiology and risk factors for recreational noise exposure induced hearing loss among adult. Indian J. Otolaryngol. Head Neck Surg. 2025, 77, 3707–3713. [Google Scholar] [CrossRef] [Scilit]
- Khomenko, S.; Cirach, M.; Barrera-Gómez, J.; Pereira-Barboza, E.; Iungman, T.; Mueller, N. Impact of road traffic noise on annoyance and preventable mortality in European cities: A health impact assessment. Environ. Int. 2022, 162, 107160. [Google Scholar] [CrossRef] [Scilit]
- Lam, B.; Fan, E.M.P.; Ooi, K.; Ong, Z.T.; Hong, J.Y.; Gan, W.S.; Ang, S.Y. Assessing the perceived indoor acoustic environment quality across building occupants in a tertiary-care public hospital in Singapore. Build. Environ. 2022, 222, 109403. [Google Scholar] [CrossRef] [Scilit]
- Ndrepepa, A.; Twardella, D. Relationship between noise annoyance from road traffic noise and cardiovascular diseases: A meta-analysis. Noise Health 2011, 13, 251–259. [Google Scholar]
- Schulte-Fortkamp, B. The meaning of annoyance in relation to the quality of acoustic environments. Noise Health 2002, 4, 13–18. [Google Scholar]
- Zhang, W.; Nishikizawa, S.; Murayama, T.; Suwanteep, K.; Liu, K. Community responses to changes in perceptions and annoyance with noise and shadow flickering: A longitudinal study. Renew. Energy Focus 2025, 54, 100701. [Google Scholar] [CrossRef] [Scilit]
- Kim, J.; Kim, S.; Lee, S.; Song, H.; Ryu, J. Comparative examination of the relationship between personal and social factors and annoyance on floor impact noise using survey and laboratory methods. J. Build. Eng. 2023, 72, 106736. [Google Scholar] [CrossRef] [Scilit]
- Rimskaya-Korsakova, L.K.; Pyatakov, P.A.; Shulyapov, S.A. Evaluations of the annoyance effects of noise. Acoust. Phys. 2022, 68, 502–512. [Google Scholar] [CrossRef] [Scilit]
- Gilani, T.A.; Mir, M.S.; Rather, A.A. A study on the impact of road traffic noise exposure on work efficiency of housewives. Environ. Sci. Pollut. Res. 2023, 30, 57434–57447. [Google Scholar] [CrossRef] [Scilit]
- Cao, X.; Zheng, D.; Qin, P.; Li, X. Impact of construction industrial noise on workers’ learning efficiency: A study based on electroencephalogram analysis. J. Tsinghua Univ. (Sci. Technol.) 2024, 64, 189–197. [Google Scholar]
- Song, J.; Zhou, S.; Zou, D.; Kwan, M.P.; Cai, J.; Lu, J. Non-linear associations between noise level and people’s short-term noise annoyance in different activity contexts. Environ. Res. 2024, 260, 119772. [Google Scholar] [CrossRef] [Scilit] [PubMed]
- Hong, X. Research on evaluation indicators for sound environment quality in urban “compliant yet annoying” open areas. Noise Vib. Control 2023, 43, 208–211. [Google Scholar] [CrossRef]
- Hernández-Salazar, A.D.; Gallegos-Martínez, J.; Reyes-Hernández, J. Level and noise sources in the neonatal intensive care unit of a reference hospital. Investig. Educ. Enferm. 2020, 38, e09. [Google Scholar] [CrossRef] [Scilit] [PubMed]
- Müller, F.J.Y.; Leschinger, V.; Hübner, G.; Pohl, J. Understanding subjective and situational factors of wind turbine noise annoyance. Energy Policy 2023, 173, 113361. [Google Scholar] [CrossRef] [Scilit]
- Eggenschwiler, K.; Heutschi, K.; Taghipour, A.; Pieren, R.; Gisladottir, A. Urban design of inner courtyards and road traffic noise: Influence of facade characteristics and building orientation on perceived noise annoyance. Build. Environ. 2022, 224, 109526. [Google Scholar] [CrossRef] [Scilit]
- Sato, T.; Yano, T.; Bjorkman, M.; Rylander, R. Road traffic noise annoyance in relation to average noise level, number of events and maximum noise level. J. Sound Vib. 1999, 223, 775–784. [Google Scholar] [CrossRef] [Scilit]
- Nowakowski, T.; Komorski, P. Tram noise annoyance: The role of different psychoacoustic measures in the assessment of noise. Appl. Acoust. 2024, 219, 109946. [Google Scholar] [CrossRef] [Scilit]
- Zhai, G.Q.; Wang, Q.Y.; Li, Z.G.; Jia, L. Study on subjective annoyance of intermittent noise. Acta Sci. Circumstantiae 2008, 28, 1699–1703. [Google Scholar] [CrossRef]
- Rajala, V.; Hongisto, V. Annoyance penalty of impulsive noise—The effect of impulse onset. Build. Environ. 2020, 168, 106539. [Google Scholar] [CrossRef] [Scilit]
- Hongisto, V.; Rajala, V.; Saarinen, P. Prediction of subjective annoyance penalty of impulsive noise based on objective measurements. Appl. Acoust. 2026, 245, 111186. [Google Scholar] [CrossRef] [Scilit]
- Yadav, A.; Parida, M.; Choudhary, P.; Kumar, B. Modelling traffic noise-induced annoyance at intersections and its association with psychological health. Transp. Res. Part D Transp. Environ. 2024, 136, 104568. [Google Scholar] [CrossRef] [Scilit]
- Park, B.; Jeon, J.Y.; Choi, S.; Park, J. Short-term noise annoyance assessment in passenger compartments of high-speed trains under sudden variation. Appl. Acoust. 2015, 97, 46–53. [Google Scholar] [CrossRef] [Scilit]
- Zhu, Y.D.; Du, H.; Li, X.K. Survey and research on the cell-phone annoyance. Tech. Acoust. 2008, 27, 717–721. [Google Scholar]
- Eze, I.C.; Foraster, M.; Schaffner, E.; Vienneau, D.; Probst-Hensch, N. Incidence of depression in relation to transportation noise exposure and noise annoyance in the SAPALDIA study. Environ. Int. 2020, 144, 106014. [Google Scholar] [CrossRef] [Scilit]
- He, J.; Li, H.; Chen, X.; Jin, S.; Su, F. Noise Levels in a Medical Intensive Care Unit. Preprints.org 2018. [Google Scholar] [CrossRef] [Scilit]
- Jiang, H.; Fu, X. The analysis and discussion of noise spectrum characteristics and sound quality of typical civil construction facilities. Tech. Acoust. 2020, 39, 482–489. [Google Scholar]
- Cai, J.; Kwan, M.P.; Kan, Z.; Huang, J. Perceiving noise in daily life: How real-time sound characteristics affect personal momentary noise annoyance in various activity microenvironments and times of day. Health Place 2023, 83, 103053. [Google Scholar] [CrossRef] [Scilit] [PubMed]
- Shi, X.G.; Tang, H.H.; Sun, B.; Zhou, L.; Tan, Z.Q. Research on combined index evaluation system for aircraft noise environment in military airports. Noise Vib. Control 2016, 36, 153–157. [Google Scholar]
- Di, G.; Yao, Y.; Chen, C.; Lin, Q.; Li, Z. An experiment study on the identification of noise sensitive individuals and the influence of noise sensitivity on perceived annoyance. Appl. Acoust. 2022, 185, 108394. [Google Scholar] [CrossRef] [Scilit]
- China Academy of Urban Planning and Design; DiDi Qingqi Research Team. Annual Report on Shared Bicycle/E-Bike Riding in Major Chinese Cities (2024); Research Report; Urban Transport Infrastructure Monitoring and Governance Laboratory, Ministry of Housing and Urban-Rural Development: Beijing, China, 2024. [Google Scholar]
- GB/T 42473-2023; Acoustics—Assessment and Prediction Methods for Noise Annoyance. National Standard of China. Standards Press of China: Beijing, China, 2023.
- Wang, W.D.; Miao, Z.J.; Huang, Y. Nonlinear psychoacoustic annoyance modeling of interior noise in electric vehicle cabins. Noise Vib. Control 2024, 44, 170–176. [Google Scholar]
- Clark, C.; Gjestland, T.; Lavia, L.; Notley, H.; Michaud, D.; Morinaga, M. Assessing community noise annoyance: A review of two decades of the international technical specification ISO/TS 15666:2003. J. Acoust. Soc. Am. 2021, 150, 3362–3373. [Google Scholar] [CrossRef] [Scilit]
- Socher, M.; Zaglauer, M.; Babajic, D.; Sumalvico, T.; Herget, N. Stability of noise annoyance. Appl. Acoust. 2025, 231, 110443. [Google Scholar] [CrossRef] [Scilit]
- Morel, J.; Marquis-Favre, C.; Violon, S.; Alayrac, M. A laboratory study on total noise annoyance due to combined industrial noises. Acta Acust. United Acust. 2012, 98, 286–300. [Google Scholar] [CrossRef] [Scilit]
- Fastl, H.; Zwicker, E. Psychoacoustics: Facts and Models, 3rd ed.; Springer: Berlin/Heidelberg, Germany, 2007. [Google Scholar]
- Leventhall, H.G. Low frequency noise and annoyance. Noise Health 2004, 6, 59–72. [Google Scholar]
- Hu, S.; Chen, W.; Wang, J.J.; Zhao, R.D.; Cai, J. Study on ISO-annoyance contour of low frequency sound signal. Noise Vib. Control 2024, 44, 242–246. [Google Scholar]
- Liu, W.; Zhou, Y.; Zhu, W. Study on the influence of sound burst rate on annoyance of pure tone noise. In Proceedings of the Prediction and Control of Transportation Noise—Proceedings of the 2009 National Conference on Environmental Acoustics, Shanghai, China, December 2009; Chinese Society of Acoustics: Beijing, China, 2009; pp. 55–59. [Google Scholar]
- Gao, W.; Kang, J.; Ma, H.; Wang, C. The effects of environmental sensitivity and noise sensitivity on soundscape evaluation. Build. Environ. 2023, 245, 110896. [Google Scholar] [CrossRef] [Scilit]

Disclaimer/Publisher’s Note: The statements, opinions and data contained in all publications are solely those of the individual author(s) and contributor(s) and not of MDPI and/or the editor(s). MDPI and/or the editor(s) disclaim responsibility for any injury to people or property resulting from any ideas, methods, instructions or products referred to in the content. |
© 2026 by the authors. Licensee MDPI, Basel, Switzerland. This article is an open access article distributed under the terms and conditions of the Creative Commons Attribution (CC BY) license.