


Highlights
What are the main findings?
- RFSCPE ontology clarifies dust-related causal chains in wood product green design.
- KG-driven BN construction reduces subjectivity in dust concentration modeling.
- FBN-based evaluation identifies optimal green schemes and key dust factors.
- Case verification of a wooden toy car process scheme design.
What are the implications of the main findings?
- Facilitates early-stage green evaluation for cleaner wood product manufacturing.
- The KG-FBN framework generalizes to other environmental indicators and domains.
- Supports dust hazard mitigation and occupational health in the wood industries.
Abstract
As cleaner production gains prominence in wooden product manufacturing, green evaluation of process schemes during early design is crucial. However, dust concentration, a key environmental indicator in wood product manufacturing, is often evaluated in a subjective and fragmented manner, which greatly hinders the selection of green process schemes in early design. To address this gap, an adaptability evaluation model for green process schemes was proposed based on process knowledge graphs (PKG) and fuzzy Bayesian network (FBN), with the objective of minimizing dust concentration. First, a PKG for wooden products was constructed based on the requirement-function-structure-characteristic-process-equipment (RFSCPE) ontology using patents and process manuals. Second, candidate process schemes were generated via the PKG, and dust-related causal relationships encoded in the PKG were mapped onto a Bayesian network structure. Third, conditional probabilities were obtained by combining probabilistic hesitant fuzzy sets and experimental dust data. The FBN was then updated to perform probabilistic reasoning on dust concentration. Finally, a case study on a wooden toy car validated the proposed approach, and sensitivity analysis identified the key dust-influencing factors, thereby providing quantitative support for greener process decisions.
1. Introduction
Green design of wood products has become a central concern in addressing the environmental and occupational health challenges of the wood manufacturing industry, and the early-stage evaluation of green process schemes is a decisive step in this process [1,2]. Dust emissions are among the most significant environmental and health hazards in wood processing and constitute a critical indicator of the greenness of a process [3,4,5]. Nevertheless, existing evaluations of green process schemes with the objective of minimizing dust concentration still rely heavily on experts’ subjective judgments and fail to systematically analyze the key design factors affecting dust concentration, such as structural characteristics, processes, and equipment, as well as the interdependencies among them. This limitation hinders the effective identification of optimal process schemes.
Green process scheme evaluation for wooden products can be grouped into two families: (1) the multi-criteria decision-making (MCDM) paradigm [6], and (2) the Bayesian network (BN)-based reasoning approaches. When applied to the dust-minimization problem described above, both families exhibit notable limitations. In the first family, a set of criteria is first established through literature surveys or expert questionnaires [7,8,9,10], criteria weights are then derived by subjective methods such as Analytic Hierarchy Process (AHP) and the Best-Worst Method (BWM) [11] or by objective methods such as the entropy weight method [12], principal component analysis [13], and the criteria importance through the intercriteria correlation (CRITIC) method [14]. Once weights are assigned, ranking is typically performed using methods like the weighted sum model (WSM) [15], the technique for order preference by similarity to ideal solution (TOPSIS) [16], and the vlsekriterijumska optimizacija i kompromisno resenje (VIKOR) [17]. Although this methodological framework is relatively mature, it still exhibits two notable limitations: (i) the upstream causal relationships among structural characteristics, processes, equipment, and dust generation are insufficiently considered; and (ii) subjective evaluation relies heavily on the professional experience of decision-makers (DMs), which obscures the reasoning process and may reduce the reliability and credibility of the evaluation results [18,19,20]. In the second family, BNs, whose probabilistic causal semantics make them well-suited to dust-related reasoning under uncertainty, have already been used for green supply chain prediction [21] and renewable-energy MCDM [22]. However, the credibility of a BN hinges on the fidelity of its structure, and BN structures in wood manufacturing are still constructed manually based on expert experience, making it impractical to capture the dense and cross-domain causal knowledge that governs dust generation [23].
Behind both families lies a common bottleneck: the dust-relevant design and process knowledge of wood products is scattered across patents and process manuals in highly unstructured form, and there is no systematic representation that can both organize this knowledge and supply causal evidence to a downstream inference model. For this purpose, a knowledge graph (KG) is introduced to systematically represent diverse design knowledge scattered across patents and process manuals [24,25]. By capturing interpretable relationships among knowledge, the KG provides a reasoning foundation for modeling the dynamic interdependencies that influence dust concentration, thus supporting more adaptive evaluation of green process schemes. However, existing KG-based studies in product development stop at knowledge representation and retrieval; few have exploited the causal semantics of a KG to automatically construct a Bayesian network structure, and even fewer have applied such an integration to dust-oriented green process scheme evaluation. A KG-driven route to BN structure construction, therefore, remains an open research opportunity.
A second, equally important bottleneck arises after the BN structure is in place. The conditional probability tables (CPTs) of upstream nodes—those representing characteristics, processes, and equipment selection—cannot be obtained from physical measurements and must be elicited from DMs. Such elicitation is inherently affected by inter-DM disagreement and cognitive fuzziness, and traditional hesitant or intuitionistic fuzzy treatments are prone to information loss and fail to express the probabilistic nature of DMs’ hesitation [26,27,28]. Without an explicit fuzzy mechanism, the inferred ranking of green process schemes risks being driven by elicitation noise rather than by genuine performance. Probabilistic hesitant fuzzy sets (PHFS), which jointly encode hesitation values and their occurrence frequencies, provide a principled remedy that has not yet been combined with a KG-driven BN for green process scheme evaluation.
In light of the above, green process scheme evaluation for wood-based products still faces three key limitations:
- Existing evaluation models treat dust concentration as an isolated downstream parameter and fail to systematically model the causal pathways linking product characteristics, processes, and equipment to dust generation, which prevents reliable identification of dust-driving factors at the early design stage.
- Although BNs are a natural tool for such causal reasoning, their structures are still predominantly built manually from expert experience, which is neither scalable nor able to capture the dense, cross-domain knowledge embedded in patents and process manuals.
- Even when the BN structure is available, the CPTs of upstream nodes are typically populated by subjective expert scoring, which suffers from inter-expert disagreement and cognitive fuzziness, undermining the credibility of the inferred green-performance ranking.
To fill these gaps, a wood product green process scheme adaptability evaluation approach based on a fuzzy BN (FBN) and a process KG (PKG) is proposed, with dust concentration as the green target. Here, adaptability indicates that a scheme is more environmentally favorable with respect to dust control. First, a PKG for wood products is constructed on the basis of a requirement-function-structure-characteristic-process-equipment (RFSCPE) ontology to achieve semantic correlation of design and manufacturing knowledge for wooden products. Then, utilizing the PKG, process scheme retrieval and causal relationship modeling among influencing factors are implemented. Process schemes are generated based on the relationships between knowledge entities, and the corresponding causal dependencies among these entities are extracted to construct the FBN. Third, the FBN performs probabilistic reasoning for green process schemes, enabling the uncertainty inference and quantitative assessment of different schemes to achieve a probabilistic ranking based on dust concentration. Finally, a case study of a wooden toy car is presented to verify the effectiveness of the proposed approach and to perform a sensitivity analysis.
The remainder of this article is organized as follows: Section 2 outlines the related literature review. Section 3 develops the PKG and constructs the BN model for the adaptability evaluation of wooden product process schemes, aiming to minimize the probability of dust concentration. Section 4 verifies the feasibility of the proposed approach and performs a sensitivity analysis through a case study of a wooden toy car. Finally, conclusions and future research directions are presented in Section 5.
2. Literature Review
This section provides a comprehensive review of the relevant literature, encompassing studies on green scheme decision-making for products as well as the application of KG in product development. The research gaps identified in the existing body of published work are summarized at the end of Section 2.2.
2.1. Research on Green Product Design Scheme Evaluation
The evaluation of green design schemes is a pivotal stage in product green design, aiming to select the most sustainable and optimal design schemes at the early stage, and can be divided into two parts: (1) acquisition of evaluation criteria, and (2) comprehensive ranking of design schemes.
The primary task of criteria acquisition is to identify key factors influencing the green performance of products, establishing a quantifiable and operational evaluation-criteria system. Dornfeld [29] constructed a green manufacturing evaluation framework encompassing energy consumption, waste, and toxic emissions based on literature reviews and industrial surveys. Similarly, Pusavec et al. [30] conducted field studies in manufacturing enterprises to translate process-level data, such as equipment efficiency and cutting fluid consumption, into environmental burden indicators. These efforts established valuable green evaluation metrics centered on material utilization and energy efficiency. However, such approaches have largely focused on the manufacturing stage and overlooked critical determinants of product sustainability during the preliminary design phase. This gap is especially pronounced in the green design of wood products, where dust concentration—a key indicator of environmental and occupational health impact—is often treated merely as an end-of-pipe emission outcome. As a result, dust-related considerations are rarely embedded into the upfront evaluation system, creating a significant disconnect between the assessed performance of green design schemes and their actual environmental behavior during production.
Comprehensive scheme ranking is achieved by determining the weights of evaluation criteria and then aggregating the overall utility of each scheme to produce an optimal ranking of schemes. Pascoe et al. [31] developed an AHP-based analytical framework for this purpose. Similarly, Govindan et al. [32] applied the BWM to green logistics provider selection, reducing pairwise comparison complexity and improving decision consistency. However, these approaches rely heavily on DMs’ subjective judgments, making them susceptible to high subjectivity and rank reversal risks. To mitigate these limitations, objective weighting methods have been introduced. Li et al. [12] employed the entropy weight method to construct an information-theoretic model that enhances weighting objectivity, while Alkan [33] adopted the CRITIC method to derive more robust green indicator weights for hydropower systems. Although these data-driven approaches help reduce subjectivity, their outputs remain highly sensitive to data quality and sample distribution. More importantly, they cannot incorporate the genuine preferences of decision-makers, which may itself introduce bias into the evaluation. Once the criteria weights are calculated, the overall utility of candidate schemes is computed to generate a final ranking. Faiyaz et al. [34] used the WSM for multi-criteria material selection, integrating sustainability, mechanical properties, and environmental safety. Amman et al. [35] combined dual-hesitant fermatean fuzzy sets with TOPSIS to support operator selection in natural gas pipeline projects under uncertainty. Despite their popularity and computational simplicity, these aggregation methods assume criterion independence and rely on linear combination rules, which fail to capture interactions, conflicts, or synergies among green evaluation dimensions. Although the decision-making trial and evaluation laboratory (DEMATEL) [36] and analytic network process (ANP) [37] are capable of capturing pairwise interdependencies among evaluation criteria, they ultimately reduce these relationships to static integrated weights and therefore cannot propagate probabilistic uncertainty through a causal chain. Consequently, they are unable to answer questions such as: “Under a specific combination of characteristics, processes, and equipment, what is the probability of the final dust concentration?”
In summary, existing MCDM-based approaches for green process scheme evaluation of wood products still exhibit a key limitation: they assume criterion independence and treat dust concentration as a static indicator rather than the result of an upstream causal chain. BNs have therefore been introduced into green and sustainability decision-making [38,39] to express such causal dependencies and propagate uncertainty in a principled way. However, the network structure of BNs is still elicited manually from experts, which limits their ability to incorporate the knowledge embedded in patents and process manuals. Moreover, upstream conditional probabilities in BNs also rely on subjective expert scoring, making them vulnerable to inter-expert disagreement and cognitive fuzziness.
2.2. Research on Knowledge Graph in Product Development
With the rapid development of information technologies, the scale of design data has increased dramatically, making it difficult for designers to extract useful knowledge from massive and fragmented design data. To address this, KG-based design models [40,41,42] have been developed to capture semantic relationships among knowledge elements and to support designers in idea generation and inspiration. Originally introduced by Google in 2012 to enhance search engine capabilities [43], a KG is a semantic network typically represented as a set of triples: G = (Eh, R, Et), where Eh and Et denote head and tail entities, respectively, and R denotes the relationship between them. By organizing and representing knowledge in a structured manner, KGs enable efficient utilization of knowledge in advanced applications.
To effectively utilize KG in product development, establishing an appropriate knowledge ontology to manage different types of knowledge is of paramount importance. Fantoni et al. [44] constructed the function-behavior-structure (FBS) ontology to express the mapping between design intent and implementation schemes. He and Hua [45] extended the FBS model into a function-effect-structure ontology to enhance the adaptability of design knowledge. However, these two models exhibit limitations in representing the assembly and composition relationships between structures, making it difficult to capture “part–whole” semantic associations. To address this, Yoon et al. [46] introduced the subject-action-object model, achieving a fine-grained description of technical relationships. These ontology models are mainly used for scheme generation and fail to establish deep links between design and downstream manufacturing processes and resource constraints, resulting in a disconnect between the design and manufacturing stages. To this end, related works have explored the integration of process knowledge into ontology models. For example, Ding et al. [47] proposed a product manufacturing processes ontology model, in which feature information is mapped to manufacturing knowledge, including machining methods and operators. Li et al. [48] developed a product assembly processes ontology model, effectively addressing the neglect of assembly process documentation and supporting assembly process planning. Yang et al. [49] introduced an industrial production workflow ontology that integrates the 5M elements (manpower, machine, material, method, and measurement) to formalize and integrate production process information.
As a powerful tool for representing and organizing relationships among knowledge entities [50], KGs enable relational retrieval by uncovering semantic relationships between different pieces of knowledge. For example, Zhou et al. [51] leveraged Word2Vec embeddings to compute textual similarity via a cosine similarity measure, significantly improving retrieval accuracy in service-oriented KGs. Guo et al. [52] integrated machining knowledge into the FBS model and applied a fuzzy evaluation model to strengthen the alignment between retrieved knowledge and design objectives. Zheng et al. [53] developed an ontology-driven KG framework for low-carbon product design, constructing a case-specific KG that enhanced design efficiency. Avdeenko and Makarova [54] addressed the limitations of traditional case-based reasoning by combining a case repository with domain ontologies within a unified semantic retrieval model, thereby boosting retrieval performance. Hao et al. [41] proposed a decision knowledge-based KG framework that integrated compromise ranking models to support rapid knowledge retrieval for decision-making. Peng et al. [55] offered a unified representation of both explicit and tacit knowledge, designing a knowledge space that fuses geometric models, knowledge analysis, and problem-solving strategies. In summary, the technical advantages of KGs in design knowledge representation and reasoning not only facilitate the visualization of complex relationships among design entities but also provide robust support for intelligent knowledge management throughout product development. However, two important limitations remain in the existing KG-based product-development literature. First, KGs are mainly used for knowledge representation and retrieval, while their causal semantics are rarely exploited to support the automatic construction of Bayesian network structures. Second, their application to dust-oriented green process scheme evaluation for wood products remains largely unexplored, even though dust generation is a typical multifactor characteristic–process–equipment causal phenomenon. These two gaps directly motivate the KG-driven FBN framework developed in Section 3.
Table 1 summarizes a side-by-side comparison between the proposed adaptability evaluation approach and existing green scheme evaluation models. As the comparison shows, existing MCDM-based approaches handle multi-criteria aggregation well but assume criteria independence and treat dust as a static end-of-pipe metric. KG-based approaches facilitate the structured representation of design knowledge, yet they rarely provide causal evidence for downstream inference, while existing BN-based approaches preserve causal reasoning capability but still rely heavily on manual structure elicitation and deterministic CPT scoring. To address these limitations in an integrated manner, a PKG-driven FBN framework for adaptability evaluation of green process schemes is proposed. The methodological details are presented in Section 3.
Table 1.
Comparison with other green design scheme evaluation approaches.
3. Methodology
Figure 1 presents an integrated adaptability evaluation framework for wooden product green process schemes that combines KG and FBN, and consists of the following three main parts.
Figure 1.
Framework of the proposed evaluation model.
Part 1: To overcome the lack of a structured representation of dust-relevant design knowledge, a PKG based on the RFSCPE ontology is constructed from patents and process manuals. This part systematically organizes the dispersed design and manufacturing knowledge associated with dust generation in wood products, and provides a structured knowledge basis for subsequent evaluation.
Part 2: To address the limitation of manual BN structure elicitation, a PKG-driven method for constructing a dust-oriented BN structure is proposed. By retrieving candidate process schemes from the PKG and mapping dust-related characteristic, process, and equipment entities and their semantic relationships into BN nodes and directed edges, this part establishes a causal network structure whose construction is transparent and scalable.
Part 3: To handle the cognitive fuzziness of decision-makers, an FBN-based adaptability evaluation method for green process schemes is developed by combining PHFS with dust data. This part enables probabilistic reasoning over dust concentration and supports the quantitative comparison and adaptability evaluation of alternative green process schemes.
3.1. Wooden Product PKG Construction Based on RFSCPE Ontology
The main challenge in dust-oriented green process scheme evaluation is that the knowledge related to dust generation in wood products is highly unstructured and cannot be directly used for downstream causal reasoning. To address this problem, this subsection proposes a PKG construction method based on the RFSCPE ontology, which provides the structured knowledge basis for subsequent BN construction.
Patents and process manuals are used as knowledge sources, extracting design knowledge and process knowledge from patent texts and process manuals, respectively [56]. The primary sources include the claims and invention descriptions in patent documents, as well as process specification texts in process manuals. The knowledge sources are shown in Figure 2. Given the highly unstructured nature of these texts, accurately extracting the relationships between design knowledge and process knowledge represents a key challenge in the construction of the proposed PKG.
Figure 2.
Knowledge sources for PKG (Translated).
By analyzing the types of knowledge contained in patent texts and process manuals, an RFSCPE knowledge ontology for green process scheme decision-making in wood products is constructed, comprising six types of nodes: requirement (R), function (F), structure (S), characteristic (C), process (P), and equipment (E), as shown in Equation (1).
where R represents requirement entities referring to specific wood products; F represents function entities, which describe the objectives of product design and consist of function verbs (Fv) and function nouns (Fn) (function verb definitions are shown in Table A1), see [57] for details; S denotes structure entities, which serve as the physical carriers for realizing product functions; C represents characteristic entities, which are specific geometric regions or processing semantics attached to structures and represent the smallest units directly acted upon by manufacturing processes; P represents the technical operations adopted to realize product characteristics; E represents the tools or machines used to execute manufacturing processes.
Based on the RFSCPE ontology, seven types of relationships among knowledge entities are defined, where circles represent the six entity types in the KG, and arrows indicate the relationships between entities. Subsequently, a schema of the knowledge entities and their relationships is specified to construct the KG, as shown in Figure 3.
Figure 3.
Wooden product PKG schema and examples.
Among these, the relationship has_Function indicates that S possesses certain F. The relationship has_Structure indicates that F is realized through S. The relationship Consists_of indicates that S consists of certain C. The relationship Realized_by indicates that C is produced by P. The relationship Before represents the precedence relationship between two P. The relationship Mutual_exclusion represents a mutual exclusion relationship between two P. The relationship Rely_on indicates that P depends on E for implementation. The definition of these knowledge entity relationships is described in Table 2.
Table 2.
Definition of knowledge entity relationships.
(1) Design knowledge extraction based on named entity recognition (NER) and dependency parsing.
Relevant wood product patents are downloaded from the Innojoy website (https://www.innojoy.com, accessed on 4 March 2025). Design patents and method patents are excluded. Using Python’s re module and web scraping techniques, the patent title, claims, and invention description texts are extracted and converted into text format. Subsequently, preprocessing is performed, including sentence segmentation, stop-word removal, word segmentation, and noise reduction. The patent title is defined as the R entity. In this study, only three types of entities (R, F, and S) and three types of relationships (has_function, has_structure, and consists_of) are extracted from patents and stored as triples in the form of <Head entity, Relationship, Tail entity>. The process of extracting these entities and their relationships is as follows:
Step A1: Extraction of design knowledge entities (S, C, F).
The Bidirectional Encoder Representations from Transformers (BERT)-Bidirectional Long Short-Term Memory (BiLSTM)-conditional random field (CRF) deep learning model is applied for S entity recognition. This model leverages the BERT pre-trained model to obtain semantic word embeddings of the input sequences. The trained word embeddings are then fed into a BiLSTM network to capture contextual features. Next, the CRF layer applies its labeling rules and sequence decoding capabilities to output the sequence labeling results with the highest probability. The patent claim texts are automatically parsed using sentence-ending markers, and structure entities within the texts are annotated using the YEDDA tool (https://github.com/jiesutd/YEDDA, accessed on 11 April 2025), following the BIO tagging rule. Unannotated patent claim texts are imported into YEDDA, and the annotated patent claims are utilized as annotated corpora and are divided into training and test sets at a ratio of 9:1. Then, the fine-tuned BERT-BiLSTM-CRF model is used to automatically extract structure entities, as detailed in our prior works [58,59].
After extracting S entities, it is necessary to consider the C entities attached to them. Knowledge descriptions of C entities for wooden products are inconsistent, and open-ended entity descriptions make it difficult to standardize and unify feature knowledge. In the field of manufacturing engineering, machining features are typically classified into 24 to 30 types according to established standards such as ISO 10303-224 (STEP AP224) [60] and the feature taxonomy proposed by Han et al. [61]. However, in wood processing, some of these features are commonly grouped into the same category; for instance, T-slots and keyways are both considered groove features. Therefore, to support more effective knowledge representation and entity association, the machining features are consolidated into 12 categories through an analysis of patents and process-related documents, as presented in Table 3.
Table 3.
Characteristics of wooden products.
F entities are defined in the form of “verb + noun”, where a function basis is used to standardize the expression of Fv. Dependency parsing based on the Language Technology Platform (LTP) (http://ltp.ai/demo.html, accessed on 25 April 2025) is applied to identify Fv, and functions are represented as “Fv + Fn” (e.g., “provide power”). Representative function bases are listed in Table A1. Then, the LTP tool is used to perform part-of-speech tagging and dependency parsing on the preprocessed patent sentences to obtain the semantic relationships among words. Accordingly, functions are classified into two categories. One category is abstract functions (e.g., provide power). The other category comprises specific functions involving connection and assembly relationships, which are defined in the form of auxiliary verb + noun + lexical verb (e.g., drive the rotation of a wooden wheel, where the word “drive” serves as the auxiliary verb and has a verb–object (VOB) relationship with the lexical verb “rotate”), as shown in Figure 4.
Figure 4.
Examples of abstract function and specific function.
The above steps are repeated to extract entities of types S, C, and F, while the R entity is defined as the patent title. An entity dictionary is established for subsequent triplet extraction.
Step A2: Extraction of “has_Function” relationship.
The patent title is defined as the R entity, and F entities are extracted from the beneficial effects text in the invention description. A “has_Function” relationship is established between the patent title and the corresponding function, defined as a triplet <R, has_Function, F>. Details are as follows: through the F-entity extraction approach, four functions, “transitioning form”, “enhancing adaptability”, “adjusting speed”, and “improving safety”, are extracted. These are then linked to the R entity “stitchable wooden toys” to generate four triplets: <stitchable wooden toys, has_Function, transitioning form>, <stitchable wooden toys, has_Function, enhancing Adaptability>, <stitchable wooden toys, has_Function, adjusting speed>, and <stitchable wooden toys, has_Function, improving safety>, as shown in Figure 5.
Figure 5.
<R, has_Function, F> triples extraction process (Translated).
Step A3: Extraction of “has_Structure” and “Consists_of” relationship.
In patent texts, specific syntactic patterns exist, and the dependency syntax relationships of knowledge entities in different sentences share similarities, providing a semantic matching foundation for triplet extraction. The LTP tool is used for syntactic analysis of patent text, and six types of semantic matching rules are constructed to extract the “has_Structure” and “Consists_of” relationships, thereby generating predefined triples, as shown in Table 4. The dependency relation labels defined by the LTP tool are listed in Table A2.
Table 4.
Semantic matching rules based on LTP dependency syntax analysis.
Taking Rule 1 and Rule 3 as examples, in the sentence “the wooden wheel provides power”, an “SBV” relationship exists between “provides” and “wooden wheel”, while a “VOB” relationship exists between “provides” and “power”. According to Rule 1, the triple<provides power, has_Structure, the wooden wheel> is established. In the sentence “the building block consists of inclined planes and through holes”, “building block” serves as the subject, and a “COO” relationship exists between “inclined planes” and “through holes”. Based on Rule 3, the triple <the building block, Consists_of, inclined planes> and <the building block, Consists_of, through holes> are constructed.
Similarly, triples can be constructed based on the other rules, as shown in Figure 6.
Figure 6.
Examples of triples extracted based on rules 1–6.
(2) Extraction of process design knowledge based on Large Language Model (LLM).
Process manuals contain a large amount of unstructured and open-ended process knowledge, which makes it difficult to extract knowledge using dependency parsing. To address this, a DeepSeek-R1 model is adopted for knowledge extraction. By leveraging its language understanding and contextual reasoning capabilities, the model can automatically identify process knowledge in a zero-shot manner. The DeepSeek-R1 model is guided through prompt design, including requirement prompts, domain knowledge prompts, and example prompts, to enable triple extraction from process manuals, as shown in Figure 7. The extraction workflow consists of three parts, which are described as follows:
Figure 7.
Prompt engineering examples.
Step B1: Data preprocessing of the process manual.
First, the process manual texts are uniformly preprocessed, including data cleaning and semantic chunking. Images, tables, redundant punctuation, and irrelevant symbols are removed to ensure the semantic integrity of the input corpus. Subsequently, semantic segmentation is performed to divide long paragraphs into process fragments according to semantic logic, enabling the model to maintain contextual coherence in subsequent processing.
Step B2: Prompt design and character development.
The DeepSeek-R1 model is defined as a “wood product knowledge extraction expert” to perform semantic understanding and knowledge extraction tasks. In prompt design, a stepwise prompting strategy is adopted, including requirement prompts, domain knowledge prompts, and example prompts. The requirement prompts specify the task objectives, the six RFSCPE entity types to be extracted, and the seven semantic relationships, while also defining the output format and prohibiting the generation of logically inconsistent relationships. The domain knowledge prompts provide relevant background knowledge and annotated examples to help the model understand domain characteristics and data features. The example prompts demonstrate how to identify and extract entities from data by presenting representative corpus samples, extraction rules, and standard output formats, thereby guiding the model to learn the syntactic patterns and logical relationships of wood product process language.
Step B3: Extraction of entity and relationship.
The prompts are used to enable automatic identification of entities and relationships in the text and to support semantic reasoning. Specifically, the model first identifies the six RFSCPE entity types and the seven relationship types. During generation, it leverages contextual logic and latent semantics to complete missing relations and correct conflicts, thereby ensuring the logical consistency and semantic accuracy of the extracted results. The output is formatted in JSON, as shown in Figure 8. In addition, type-matching checks are performed on the generated entities and relationships to ensure that the head and tail entity types conform to the predefined rules. Isolated entities are also detected; if unlinked nodes are found, their plausible relationships are supplemented through semantic completion or manual reasoning. On this basis, redundant or logically conflicting relationships are removed or corrected.
Figure 8.
LLM-based extraction example (Translated).
(3) Construction of the PKG.
When constructing the KG, the mainstream Neo4j graph database is employed to represent knowledge entities and their relationships. Neo4j offers robust data management and analytical capabilities, enabling efficient storage, retrieval, and querying of large-scale knowledge through its expressive declarative Cypher query language, which facilitates the efficient processing and storage of large volumes of knowledge [62]. The construction process mainly consists of two parts. (1) During node generation, various colors are used to represent different categories of knowledge entities. Duplicate entities are removed, and each node corresponds to a unique knowledge entity. (2) During edge generation, syntactic matching rules are applied to determine the relationships among entities, and edges are generated accordingly. Each edge connects the corresponding entity nodes to form a directed graph, resulting in the complete KG. The specific implementation details of the above PKG construction procedure, including the dataset scale, model hyperparameters, extraction evaluation metrics, and the resulting entity and triple statistics, are reported in Section 4.1.
3.2. BN Structure Construction Based on PKG
Traditional construction of Bayesian network structures for dust-concentration reasoning relies heavily on expert elicitation, which makes the process subjective and difficult to systematize. To overcome this limitation, this subsection develops a method for projecting the knowledge encoded in the constructed PKG onto the structure of a Bayesian network dedicated to dust-concentration reasoning. The method follows three sequentially defined steps and is governed by two methodological principles.
The proposed projection is grounded on two principles. Principle 1 (minimal causal mapping): only those PKG relationships that carry an explicit cause–effect semantics from upstream design choices to downstream dust generation are eligible to become directed edges in the BN. Principle 2 (hierarchical causal aggregation): When many evidence-level nodes share the same downstream effect on the target dust node, intermediate aggregator nodes are introduced to absorb their joint influence, so that the BN topology around the target remains tractable for inference without compromising causal fidelity. These two principles jointly determine which entities become nodes, which relationships become edges, and how the final topology is organized.
Step C1: Candidate process scheme retrieval. Based on the developed PKG, the product functions are determined. The matching function of the Cypher query language is then utilized to retrieve structural entities associated with these functions from the PKG (e.g., “UNWIND [“Function 1”, “Function 2”, …] AS funcName MATCH (n:Function {name: funcName}), (m:Structure), p = (n)-[:has_Structure]->(m) RETURN p”), as shown in Figure 9. After the structures obviously irrelevant to the target product are removed, a second query (e.g., “UNWIND [‘Structure 1’, ‘Structure 2’, …] AS strucName, MATCH (n:Structure {name: strucName}), MATCH (m:Process), MATCH p = (n)-[*]->(m), RETURN m”) retrieves the P entities reachable from each retained structure.
Figure 9.
Retrieval of F-S entity relationships.
The retrieved processes are then linked into candidate schemes according to two relation-level rules: a Before relation defines the precedence between two processes, while a Mutual_exclusion relation forbids the simultaneous appearance of two processes within the same scheme. As shown in Figure 10, traversing these two relations from a starting process yields all admissible scheme paths. Starting from process entity P1, process P2 is identified by following the Before relationship. It is then found that processes P3 and P4 both have Before relationships with P2, while a Mutual_exclusion relationship exists between P3 and P4. This generates branch paths: P1 → P2 → P3 and P1 → P2 → P4. By continuing to follow the “Before” relationship downstream, process scheme 1 is formed: P1 → P2 → P3 → P7 → P8 → P10. In addition, along the path passing through process P4, it is observed that P4 and P5 are connected by two “Before” relationships, which further generate branching paths, namely P5 → P10 and P5 → P6 → P10. On this basis, the remaining process schemes are obtained: (2) P1 → P2 → P4 → P5 → P6 → P10, and (3) P1 → P2 → P4 → P5 → P10. According to the above extraction rules, multiple process schemes that satisfy the given requirements are extracted from the PKG. Note that Before and Mutual_exclusion relations are used only at this retrieval step and are not propagated to the BN, in accordance with Principle 1.
Figure 10.
Example of retrieving P entity association paths.
Step C2: Causal node-edge projection. With the candidate schemes available, the BN nodes and edges are derived from the PKG by applying Principle 1. Specifically, three key entity types—C, P, and E—are retained as nodes in the BN owing to their direct or indirect influence on dust concentration. In particular, characteristic entities (C) are associated with structural entities and exert a direct impact on the dust concentration generated by different processes. Processes (P) serve as the link between design characteristics and equipment and constrain the selection of manufacturing equipment. Equipment (E) serves as the physical medium for executing processes, and its operating parameters (such as spindle speed and feed rate) directly influence dust concentration levels, which are also recorded. Among the seven RFSCPE relationships, only two carry the cause–effect semantics required by Principle 1 and are projected onto the BN as directed edges: Realized_by, which links a characteristic to the process that produces it (C → P), and Rely_on, which links a process to the equipment that executes it (P → E). The remaining five relationships are excluded from the BN because they are not directly related to the probabilistic dependencies underlying dust generation. The output of Step 2 is therefore a partial BN topology consisting of C, P, and E nodes connected exclusively by Realized_by-derived and Rely_on-derived directed edges.
Step C3: Hierarchical causal aggregation. Given that the total dust concentration (D) is designated as the target node, initial modeling revealed an excessive number of direct parent nodes, which would compromise both structural clarity and computational efficiency. To address this, two intermediate node types are introduced: Equipment dust (ED) nodes represent dust concentration levels generated by individual machines. Equipment-type dust (ETD) nodes aggregate dust contributions from multiple devices of the same functional category. This two-level aggregation yields the causal chain C → P → E → ED → ETD → D, in which every edge represents a verifiable cause–effect relation. This hierarchical abstraction reduces network complexity while preserving causal fidelity. The complete BN topology produced by Steps 1–3 is illustrated in Figure 11, and its reliability is supported by the quality of PKG construction.
Figure 11.
PKG-based BN topology model construction.
3.3. Adaptability Evaluation of Green Process Schemes Based on an FBN Model and Dust Data
To address the subjectivity and fuzziness in the CPT input of the BN, an FBN-based adaptability evaluation method integrating PHFS and experimental dust data are proposed. A BN can be represented as a directed acyclic graph, G = (V, E), containing different nodes V = (X1, X2, X3, …, Xn) and a set of edges (arcs of links) represented by E. A line connecting node Xi to node Xj represents the causal relationship between these two nodes, where the value of Xj depends on Xi. Then, Xi is called a parent of Xj, and Xj is called a child of Xi. The relationships between different nodes are specified by CPT, and the conditional probability distribution of the node Xj given its parent node is expressed as P(Xj|p(Xi)), where p(Xi) represents all parent nodes of node Xi. Based on CPT, the joint probability for all variables specified in G can be expressed in Equation (2).
In the BN constructed in this study (Figure 11), the generic node variable Xi in Equation (2) corresponds to six specific entity types: characteristic nodes (C), process nodes (P), equipment nodes (E), equipment-dust nodes (ED), equipment-type-dust nodes (ETD), and the target dust concentration node (D). The parent set p(Xi) of each node is determined by the directed edges shown in Figure 11, which are derived from the Realized_by and Rely_on relationships projected from the PKG as described in Section 3.2. Equation (3) is used to compute the posterior probability of a parent node given the observed states of its child nodes, enabling analysis of the occurrence probability of each node.
where P(A) and P(B) are prior probabilities, while P(B|A) is a prior conditional probability, and P(A|B) is a posterior conditional probability to be calculated.
Step D1: PHFS-based fuzzy CPT acquisition for design-side nodes (C, P, E). Since the conditional distributions of C, P, and E nodes involve subjectivity and uncertainty and cannot be measured directly, their CPTs are constructed based on subjective evaluations provided by DMs with manufacturing backgrounds. The state spaces are defined as follows: each C node has two states {T, F}, describing whether the characteristic is selected. Each P node has four states {F, L, M, H}, corresponding to “process not selected”, “low”, “medium”, and “high process refinement”. Each E node uses its equipment-parameter set as the state space.
In the process of constructing CPT, DMk (1 ≤ k ≤ K) often fails to provide consistent assessment results, leading to fuzziness and subjectivity within the evaluation information [26,27,28]. Traditional hesitant fuzzy sets and intuitionistic fuzzy sets are prone to the loss of decision information and fail to authentically reflect the inherent randomness of assessments provided by DMs [28,63]. For this reason, PHFS are introduced to quantitatively transform DMs’ subjective evaluations, thereby constructing fuzzy CPTs. Let Xi denote a node in the FBN, and its state set be {xi1, xi2, …, xil, …, xim}, and 1 ≤ L ≤ m, where m denotes the number of states of a node. Using 0.05 as the scale unit, evaluation data in the interval [0,1] are semantically partitioned, where 0 indicates that the node state cannot be satisfied and 1 indicates that the state is fully satisfied. Based on the predefined semantic variables, the DMk assesses the conditional probability that the Xi node achieves state xil under a given combination of parent node states, yielding an evaluation value denoted by akil. Consequently, the assessment values from all DMs are defined as the sequence S = {a1il, …, akil, …, aKil}. By counting the frequency of occurrence of each semantic variable in this sequence, it is denoted as EN(aril), where r represents the semantic variable and 1 ≤ r ≤ R. The membership probability corresponding to each evaluation value is calculated as Pril = EN(aril)/K. Subsequently, the probabilistically hesitant fuzzy element hkil of this semantics is described as <akil, EN(aril)/K>. Each evaluation value and its probability in sequence S are then converted into a probabilistically hesitant fuzzy set PHFSil, as shown in Equation (4). The centroid method is adopted to defuzzify the probabilistic hesitant fuzzy elements and obtain a crisp conditional probability pil, as shown in Equation (5). Repeating this procedure for every parent-state combination of every C, P, and E node yields the complete fuzzy CPTs of the design-side nodes.
Taking P2 node in Figure 11 as an example, its parent nodes include C1 and C2 (with states T and F), and the state set of nodes P2 is defined as {F, L, M, H}. Assume that the parent node states are set to {C1 = T, C2 = T}. Four DMs evaluate the conditional probability P (P2 = L| C1 = T, C2 = T) using the predefined semantic variables, yielding the sequence S = {0.35, 0.5, 0.5, 0.6}. The corresponding frequencies are EN (0.35) = 1, EN (0.5) = 2, EN (0.6) =1. Therefore, the semantic variables 0.35, 0.50, and 0.60 have membership probabilities of 0.25, 0.50, and 0.25, respectively, and the associated probabilistic hesitant fuzzy element set is {(0.35,0.25), (0.5,0.5), (0.6,0.25)}. The crisp conditional probability is then calculated as p = 0.35 × 0.25 + 0.5 × 0.5 + 0.6 × 0.25 = 0.4875.
Step D2: Experimentally grounded CPT acquisition for the equipment-dust nodes. The CPTs of the ED nodes are obtained through experimental measurements and are defined as F (no dust), L (low dust concentration < 1 mg/m3), RL (relatively low dust concentration in [1, 5) mg/m3), M (moderate dust concentration in [5, 10) mg/m3), RH (relatively high dust concentration in [10, 15) mg/m3), and H (high dust concentration ≥ 15 mg/m3), as shown in Figure 12. Under each operating-parameter setting of the parent E node, the dust concentration variation curve is measured over a fixed observation window, the peak values are extracted from the curve, and the proportion of peaks falling within each state interval is taken as the conditional probability of the ED node being in the corresponding state. Iterating this measurement procedure over all operating parameters of every ED node yields the empirical CPTs of all equipment-dust nodes.
Figure 12.
Experimental measurements procedure of dust concentration.
Step D3: Deterministic CPT specification for the aggregation nodes. The CPTs of the ETD and target D nodes are not elicited and not measured; they are derived deterministically from the worst-state composition rule implied by the aggregation hierarchy introduced in Section 3.2. The states of the ETD and D nodes are defined as F (no dust), L (low dust), M (moderate dust), and H (high dust). Each ETD node acts as the child of a set of ED nodes belonging to the same equipment category: When any parent node is in state H, the state of the child node ETD is set to H, thereby constructing the CPT of the ETD node. For the target node D, if any parent ETD node is in state H, the state of node D is set to H. If none of the parent nodes are in state H but at least one parent node is in state M, the state of node D is set to M; otherwise, it is set to L. This worst-state cascade encodes the engineering intuition that a single dominant dust source determines the dust profile of an entire scheme, and it makes the CPTs of the aggregation nodes fully specified by the topology alone, completing the parameter learning of the PHFS-FBN.
Step D4: Probabilistic inference and adaptability ranking. With all CPTs populated through Steps 1–3, the PHFS-FBN is implemented in Netica, a Java-based software platform widely used for BN modeling, inference, and visualization, which provides intuitive tools for both constructing network structures and performing probabilistic calculations. For each candidate process scheme retrieved in Section 3.2, the corresponding evidence ek is encoded by clamping the related C, P, and E nodes to the states specified by the design choices of that scheme. The standard junction-tree algorithm is then applied to compute the marginal posterior distribution of the target node D under the given evidence, as illustrated in Figure 13. Accordingly, the adaptability of Schemek is defined as Adapt (Schemek) = P(D = L|ek), where a higher value indicates a greater probability that the scheme leads to a low dust concentration state. Based on this definition, the optimal green process scheme is identified by ranking all candidate schemes in descending order of their adaptability values.
Figure 13.
An illustration of the initial BN model.
4. Case Study
A wooden toy manufacturing enterprise seeks to quantitatively evaluate dust concentration at the early design stage of its products to ensure that proposed green process schemes meet stringent environmental regulations and sustainability requirements. To validate the proposed approach, a representative product produced by the company, a wooden toy car, is selected as a case study. The developed FBN model is applied to conduct adaptability evaluation of green process schemes for producing this toy car, thereby supporting the enterprise in selecting environmentally friendly production strategies. The structure of the wooden toy car and the descriptions of its characteristics are illustrated in Figure 14.
Figure 14.
Physical image of a wooden car.
4.1. PKG Construction for the Wooden Toy Car
Using “wooden AND (product OR toy OR furniture) NOT device NOT equipment” as the search keywords, invention patents filed between January 2010 and December 2025 are downloaded from the Innojoy website. After removing design patents and method-type patents, 1,566 patents remained, comprising 293 invention patents and 1263 utility model patents (439 granted patents). The os and re modules in Python are employed to extract the Claims and Descriptions as the textual corpus. Taking Chinese invention patent CN202511005361.X as an example, the patent title “Assembled wooden toy” is defined as the R entity. The Claims and Description were segmented into 71 sentence-level text lines. Due to article length constraints, four representative lines are selected for NER and relation extraction validation, as described in Table 5.
Table 5.
Example of preprocessed patent text (using patent CN202511005361.X as an example).
Subsequently, each sentence undergoes tokenization, stop-word removal, and part-of-speech tagging, and dependency parsing is conducted for each clause using the LTP tool, as shown in Figure 15.
Figure 15.
(a) Dependency parsing results of Clause 1; (b) Dependency parsing results of Clause 2; (c) Dependency parsing results of Clause 3; (d) Dependency parsing results of Clause 4.
Using the corpus from the aforementioned patents as the training set, a fine-tuned BERT-BiLSTM-CRF model is employed for structural entity extraction. In this case study, the model uses one hidden layer, 300-dimensional word embeddings, and 384 hidden units. Model parameters are fine-tuned using stochastic gradient descent. The dropout rate is set to 0.5, the batch size is set to 512, the number of training epochs is 20, and the initial learning rate is 0.0005. After multiple training iterations, the model achieves a precision of 0.8834, a recall of 0.8947, and an F1 score of 0.889 on the validation set, indicating robust performance in structure entity recognition.
Then, the above four clauses are identified through the trained model, and the following S entities are obtained: (1) shell, (2) shell & car body, (3) car body, (4) clamp plate. Combining these with the characteristic entities summarized in Section 3.1, the C entity “the end face” is extracted from clause 3. By extracting dependency syntactic analysis results from subordinate clauses: (a) The participle in clause 1 follows the pattern “auxiliary verb + structural noun + lexical verb”, meeting the definition of a specific function. The auxiliary verb, structural noun, and lexical verb form the F entity “allows the form to transform”. (b) The phrase “ensures stability” in clause 2 meets the definition of an abstract function and can be extracted as an F entity. (c) Clause 3 yields the F entity “changes direction”. (d) Clause 4 yields the F entity “move position,” as shown in Table 6.
Table 6.
Entities extracted from the example patent CN202511005361.X.
The above procedure is iteratively applied to the remaining 1566 patent texts to extract four categories of entities, namely R, F, S, and C. In total, 4644 entities are identified across these categories, of which only 12 correspond to C entities. The detailed distribution of each entity type is summarized in Table 7.
Table 7.
Distribution of entities of different types.
Triples are extracted from each clause. R and F entities with has_Function are extracted as triples: <assemblable wooden toy, has_Function, allows the form to transform>, <assemblable wooden toy, has_Function, ensures stability>, <assemblable wooden toy, has_Function, changes direction>, <assemblable wooden toy, has_Function, move position>. Through dependency parsing, clause 1 exhibits an “SBV” relationship between “allows” and “shell”, and a “VOB” relationship between “allows” and “the form to transform”. This syntactic pattern satisfies Rule 1, and the corresponding triple < allows the form to transform, has_Structure, shell> is established. Clause 2 satisfies Rule 2, yielding the triple <ensures stability, has_Structure, car body>. Clause 3 satisfies Rule 1 and Rule 6, yielding the triples <changes direction, has_Structure, clamp plate> and <car body, Consists_of, the end face>. Clause 4 satisfies Rule 1, yielding the triple <move position, has_Structure, clamp plate>; the extracted triple results are shown in Table 8.
Table 8.
Extracted triples from clause examples in patent CN202511005361.X.
The above process is repeated to extract triple structures from the remaining patent text, and the results were subsequently manually screened to eliminate duplicate or evidently incorrect triples. A total of 7501 triples are matched, and the statistical distribution of entity relations is summarized in Table 9.
Table 9.
Distribution of triplets by different types.
Using the woodworking product process manual as the source text, the text is preprocessed. The preprocessed text is then input into the DeepSeek-R1 model, where a prompt is designed to extract six types of entities and seven types of relations from the process manual. A Python program is implemented to parse entities and normalized triples from the output JSON files and store them in Excel format. The pseudo-code for the extraction process is shown in Algorithm 1.
| Algorithm 1. Pseudocode for triple extraction based on the DeepSeek-R1 model |
| Input: RawTextFiles(process manual) Output: KnowledgeGraph(Entities, Relations) |
| 1: Initialize PreprocessingModule() 2: For each File in RawTextFiles do Text Preprocessing CleanText ← RemoveImages(File) Segments ← SplitText(CleanText, MaxLength = 2000) Normalize (Segments) End 3: Knowledge Extraction with DeepSeek-R1 For each Segment in Segments do Prompt ← ConstructPrompt(Segment, ExtractionType = [Entity, Relation]) ExtractionResult ← DeepSeek-R1_API(Prompt) ParsedResult ← ParseToTriplets(ExtractionResult) Append (Triplets, ParsedResult) End 4: Data Structuring and Storage Entities ← Unique(Triplets.Subject ∪ Triplets.Object) Relations ← Triplets.Predicate SaveToExcel(Entities, Relations, FileName="KnowledgeTriplets.xlsx") |
| 5: Return KnowledgeGraph(Entities, Relations) |
After triple extraction, a consistency evaluation of the extracted results is conducted. First, 100 representative text fragments are randomly sampled from the original corpus to construct a gold standard dataset. Two domain experts are invited to manually annotate entities and relations, thereby establishing the ground-truth entities and relations. The extraction results obtained by each approach (dependency parsing and LLM) are evaluated against the expert-annotated gold standard. In this study, the F1-score, precision (P), and recall (R) are adopted to evaluate the knowledge extraction performance, as shown in Equations (6)–(8).
where TP denotes samples predicted as positive and actually positive, FP denotes samples predicted as positive but actually negative, and FN denotes samples predicted as negative but actually positive.
The computational results are shown in Table 10. The results show that both dependency parsing-based analysis for structured patent texts and the DeepSeek-R1 model for unstructured process manuals achieved relatively high performance in entity recognition and relation extraction. This not only demonstrates the credibility of the extracted knowledge but also validates the reliability of adopting different knowledge extraction methods for different text types in PKG construction.
Table 10.
Entity-relation extraction performance results.
A total of 7739 entities is jointly extracted by the two approaches, including 2752 R entities, 2032 F entities, 2894 S entities, 12 C entities, 20 P entities, and 29 E entities. The seven types of triples jointly obtained by the two approaches are further subjected to manual screening to remove duplicate or evidently incorrect triples, resulting in a total of 20,869 matched triples. The statistical distribution of entity–relation pairs is reported in Table 11.
Table 11.
Statistics of entity relations in PKG.
Using the Neo4j graph database, a PKG based on the RFSCPE ontology is constructed to enable visualization of the knowledge entities and analysis of entity linkages, as illustrated in Figure 16.
Figure 16.
An illustration of PKG stored in the Neo4j platform.
4.2. BN Structure Construction for the Wooden Toy Car
After constructing the wooden product PKG, the MATCH function (MATCH (Requirement {name: “wooden toy car”}), MATCH p = (n)-[*]->(m), RETURN p) is used to extract the subgraph corresponding to the wooden toy car and to analyze the S entities contained therein. Owing to space limitations, the “base plate” structure, which covers all C entities of the wooden toy car, is taken as an illustrative example. By inputting the matching query “MATCH p = (n:Structure {name: ‘base plate’})-[*]->(m:Process) RETURN m”, all P entities associated with the S entity “base plate” can be retrieved, as shown in Figure 17.
Figure 17.
P entities associated with the S entity “base plate”.
The retrieved P entities and their associated “Before” and “Mutual_exclusion” relationships follow the rules outlined in Section 3.1. P entities are connected sequentially based on their “Before” relationships, and P entities sharing a “Mutual_exclusion” relationship cannot appear simultaneously in a single process scheme. Consequently, the 14 green process schemes for the S entity base plate are shown in Figure 18.
Figure 18.
Process schemes for the base plate.
Based on the BN modeling rules described in Section 3.2, the matching query “MATCH p = (n:Characteristic)-[Realized_by]->(m:Process)-[Rely_on]->(l:Equipment) RETURN p” is executed to retrieve the C, P, and E entities from the PKG, along with the Realized_by and Rely_on relationships, as shown in Figure 19. These extracted entities and semantic relationships are then mapped directly to BN nodes and directed causal edges, respectively. The constructed wood product BN model comprises 12 C nodes, 19 P nodes, and 34 E nodes, forming a structured probabilistic framework for evaluating the adaptability of green process schemes.
Figure 19.
C, P, and E entities retrieved from the PKG.
To complete the network structure, 34 ED nodes and 7 ETD nodes are added to the BN, establishing causal chains with the target node D. Based on the extracted entities, their interrelationships, and the modeling rules described earlier, a comprehensive BN is constructed to support adaptive reasoning for green process schemes. Each node in the network is defined by four attributes: name, type, state, and state value. Due to space limitations, the detailed specifications of all nodes—including their types and associated states—are provided in Table A3. The initial BN model is constructed using Netica software, with the conditional probabilities for each node assigned as initial values, as illustrated in Figure 20.
Figure 20.
Initialized BN in Netica software.
4.3. Adaptability Evaluation of Green Process Schemes Based on the Wooden Toy Car FBN
Taking node P1 as an example, its parent nodes include C1, C7, and C11. Four graduate students majoring in mechanical engineering serve as DMs and evaluate the conditional probabilities of node P1 under different combinations of parent node states based on the linguistic variables defined in Section 3.3, as described in Table 12.
Table 12.
CPT of node provided by four DMs (taking node P1 as an example).
Based on the membership probability calculation rules and Equation (4), the evaluation results are transformed into PHFS to generate the fuzzy CPT of node P1, as described in Table 13.
Table 13.
Fuzzy CPT construction based on PHFS transformation (taking node P1 as an example).
Based on Equation (5), the PHFS in Table 13 are transformed into crisp probabilities to form the crisp CPT, as shown in Table 14.
Table 14.
CPT of the node P1.
Next, the CPTs of ED nodes are constructed based on experimental measurements. Taking the belt sander dust node ED12 as an example, dust concentration data are measured under an equipment parameter setting of 1000 RPM. A total of 154 peak values is obtained, among which 132 peak values are lower than 1 mg/m3, and 22 peak values fall within the range of 1–5 mg/m3. According to the ED node state classification rules defined in Section 3.3, 132 peak values are classified into the L state and 22 peak values into the RL state, as shown in Table 15.
Table 15.
Peak distribution of measured dust concentration data for the belt sander.
The conditional probability of each dust concentration state is calculated by dividing the number of peak values in that state by the total number of peaks, thereby constructing the CPT of dust concentration for the belt sander under different equipment parameter settings. Taking the dust concentration data of the belt sander at 1000 RPM as an example, Table A3 indicates that when the belt sander operates at an equipment parameter state of 1000 RPM, node E12 is in state L. The probabilities are calculated as: P(ED12 = L|E12 = L) = 132/154 = 0.857, P(ED12 = RL|E12 = L) = 22/154 = 0.143. On this basis, the CPT of the belt sander is established, as presented in Table 16. Following the same computational procedure, the CPTs for the remaining equipment are derived and summarized in Table A4. Subsequently, all node-specific CPTs are incorporated into the BN model, and parameter learning is conducted, resulting in the probability-updated BN illustrated in Figure A1.
Table 16.
CPT of node ED12.
Based on the 14 process schemes for the base plate component of the wooden toy car, the node states are specified. The base plate includes the following characteristics: end face, blind hole, through hole, fillet, curved surface, chamfer, thread, and step. Accordingly, the C node states are set as P(C1 = F) = 0, P(C2 = F) = 0, P(C3 = F) = 0, P(C4 = F) = 0, P(C5 = F) = 100%, P(C6 = F) = 100%, P(C7 = F) = 0, P(C8 = F) = 0, P(C9 = F) = 100%, P(C10 = F) = 0, P(C11 = F) = 0, P(C12 = F) = 100%. The status of process nodes was set according to the process plan. Taking Process Plan 1 as an example, set the status of process-type nodes as follows: P(P1 = F) = 0, P(P2 = F) = 0, P(P3 = F) = 0, P(P4 = F) = 100.00%, P(P5 = F) = 100.00%, P(P6 = F) = 100.00%, P(P7 = F) = 0, P(P8 = F) = 0, P(P9 = F)= 100.00%, P(P10 = F) = 0, P(P11 = F) = 0, P(P12 = F) = 0, P(P13 = F) = 0, P(P14 = F) = 0, P(P15 = F) = 100.00%, P(P16 = F) = 100.00%, P(P17 = F) = 0, P(P18 = F) = 100.00%, P(P19 = F) = 0, P(P20 = F) = 0, as shown in Figure 21.
Figure 21.
Node state setting and reasoning results.
Similarly, the BN model is specified for the remaining process schemes following the above procedure. The joint probability distribution of the target node D is computed, with particular focus on the probability of D being in state L (low dust), as illustrated in Figure 22. The fourteen process schemes are ranked according to the probability of dust concentration being in state L. The resulting ranking is as follows: process scheme 12 < process scheme 5 < process scheme 11 < process scheme 4 < process scheme 9 < process scheme 2 < process scheme 8 < process scheme 1 < process scheme 13 < process scheme 6 < process scheme 14 < process scheme 7 < process scheme 10 < process scheme 3. Notably, scheme 3 exhibits the highest probability of node D being in state L, indicating superior environmental performance in terms of dust control. Consequently, it is identified as the optimal process scheme for manufacturing the base plate component.
Figure 22.
Reasoning results of dust concentration states for process schemes.
4.4. Sensitivity Analysis
To evaluate the robustness of the constructed PHFS-FBN and to identify the key factors that dominate dust concentration variation, a sensitivity analysis is conducted comprising two complementary parts: belief reasoning and uncertainty analysis. The former employs forward and backward propagation to examine how changes in the states of individual nodes propagate through the network and affect the target dust node D, thereby pinpointing the equipment types and specific machines with the greatest influence on dust concentration. The latter applies entropy-based mutual information to quantify how much each node’s data reliability contributes to the overall prediction uncertainty, thereby guiding the priority allocation of monitoring resources during practical production.
(a) Belief reasoning.
A sensitivity analysis of the BN model is performed based on forward propagation, backward propagation, and uncertainty analysis. Forward propagation refers to a type of reasoning technique for cause analysis. For the forward propagation analysis, node D is designated as the target node, and the states of its seven parent nodes (ETD1–ETD7) are individually set to F. This configuration yields seven distinct scenarios, enabling a systematic examination of the influence of each parent node on dust concentration, as presented in Table 17. In Scenario 7, the presence of seven parent nodes in state F has the largest impact on the target node, increasing the probability of D = F from 0.1% to 100%. In addition, Figure A2 illustrates the forward propagation analysis for the seven scenarios.
Table 17.
Probability comparison of adaptability under different design scenarios.
When the prior probabilities of the seven parent nodes change from the F state to a non-F state, the marginal probability change of the target node is analyzed. Then, define the probability change rate (percentage change in probability of a node as the false state transitions to true state) to assess the importance of each parent node. A larger value indicates a larger impact of that parent node on changes in the dust concentration probability. Taking node ETD1 as an example, its probability change rate η is 0.832%. The probability change rates of the remaining nodes are ETD2: 0.671%, ETD3: 0.563%, ETD4: 0.850%, ETD5: 0.379%, ETD6: 0.603%, and ETD7: 0.635%. Accordingly, ETD5 exhibits the lowest change rate. The influence of the remaining nodes on changes in dust concentration probability follows the order ETD4 > ETD1 > ETD2 > ETD7 > ETD6 > ETD3. This indicates that ETD5 (drilling-type equipment) has the least impact on dust concentration variation, whereas ETD4 (precision cutting equipment) has the greatest impact.
Backward propagation performs what-if analysis by setting observations for specific nodes and then calculating the marginal probability of the parent nodes by taking their influence on the successor variable in the backward strategy in BN. Equation (9) represents the backward propagation analysis model for the BN (setting the state of child nodes to observe changes in parent node states), where a larger probability change degree η indicates a more pronounced influence of child nodes on parent nodes [25].
where vi denotes a child node, v* denotes a parent node, K represents the number of node states, and s denotes the different states of a node.
Taking node ETD5 (drilling-type equipment) as an example, its parent nodes include ED17, ED18, ED19, ED20, ED21, and ED22. As shown in Figure 23a, when the conditional probability of node ETD5 being in state F is set to 0, the state probabilities of the parent node ED17 change from P(ED17 = F) = 74.9%, P(ED17 = L) = 4.2%, P(ED17 = M) = 15.8% and P(ED17 = H) = 5.1% to 70.5%, 5.0%, 18.5%, and 6.0%, respectively. According to Equation (9), the probability change rate is calculated as η = ((74.9 − 70.5)/70.5 + (5 − 4.2)/4.2 + (18.5 − 15.8)/15.8 + (6 − 5.1)/5.1)/4 = 0.150. Similarly, the probability change rates of ED18, ED19, ED20, ED21, and ED22 are calculated as 0.178, 0.156, 0.148, 0.176, and 0.160, respectively, as shown in Figure 23. Among them, nodes ED18 and ED21 exhibit relatively higher probability change rates, whereas nodes ED20 and ED17 show lower values. This indicates that ED18 and ED21 have a stronger influence on changes in ETD5, while ED20 and ED17 have a smaller influence. Accordingly, to control the dust concentration induced by drilling-type equipment during the machining process, the operating parameters of the multi-spindle drilling machine need to be adjusted to avoid excessive dust generation.
Figure 23.
Analysis of backward propagation relationship based on node ETD5.
(b) Uncertainty analysis.
To quantify the uncertainty associated with nodes in the wood product manufacturing process, entropy theory [64] is employed to measure inter-node uncertainty, thereby enabling sensitivity analysis of the target node. In this study, uncertainty not only reflects the variability of the system’s dust concentration prediction results but also indicates the reliability of knowledge sources and the stability of the reasoning chain. The entropy calculation process, based on Shannon’s information theory [64], is used to quantify the disorder of node X; lower entropy indicates lower uncertainty of the node, as shown in Equation (10). Second, after being affected by the parent node Y, the conditional entropy calculation formula of the target node X is shown in Equation (11).
where k represents the number of node states, H(X|Y) represents the conditional entropy of the target node under the influence of the parent node, and H(X) represents the marginal entropy of the target node.
Equation (12) is used to obtain the mutual information of the node under the influence of the parent nodes. A larger value of U(X, Y) indicates that the knowledge of the parent nodes, as established through the decision-makers’ experience, more effectively reduces uncertainty, thereby enhancing the robustness of the decision outcomes.
Taking node C1 as an example, the probability distributions under different states are shown in Figure 24. When node C1 is set to state T, the probability of the target node D being in state F decreases from 0.1% to 0%, the probability of state L decreases from 3% to 1.1%, the probability of state M decreases from 44.2% to 43.4%, and the probability of state H increases from 52.7% to 55.5%. When node C1 is set to state F, the probability of node D being in state F is 0.1%, that of state L is 4.8%, the probability of state M is 45.1%, and the probability of state H is 50%. Based on Equations (10)–(12), the mutual information between node C1 and node D can be calculated.
Figure 24.
Different states of mutual information between C1 and D.
The results show that the sensitivity of the node C1 to the target node D is 1.10%. If the knowledge reliability of the node C1 is improved, the 1.10% degree of uncertainty can be reduced. Similarly, the mutual information of other nodes to the target node can be obtained, and the results are reported in Table 18. From Table 18, the mutual information of node ETD1 reaches as high as 50.74%, which is far greater than that of the other nodes. This indicates that, if the data associated with node ETD1 can be obtained accurately, the entropy of the system’s final dust concentration prediction can be reduced by more than half. In addition, nodes ED3 and ETD6 also exhibit relatively high uncertainty, which arises from the inherent variability in factors such as equipment performance and operating modes, leading to fluctuations in the inferred probabilities of dust concentration. Therefore, during the design stage of wood products, particular attention should be paid to the reliability of input data for nodes ETD1, ED3, and ETD6 to improve the accuracy of evaluation results. In practical production, resource constraints make it infeasible to precisely monitor all stages. To ensure the accuracy and stability of the final dust concentration inference, resources should be preferentially allocated to ETD1, ED3, and ETD6. In addition, the mutual information of characteristic nodes is at most 1.46%, which is far lower than that of other node types. This indicates that variations in characteristics contribute only marginally to the randomness of dust concentration generation, whereas process-related factors have a much greater impact on dust concentration uncertainty. Therefore, greater emphasis should be placed on process knowledge during the design stage.
Table 18.
Sensitivity analysis of node D.
4.5. Approach Comparison
To validate the superiority of the proposed PHFS-FBN approach, a comparative experiment is conducted against five benchmark methods, including three MCDM methods, namely AHP-TOPSIS, Entropy-TOPSIS, and CRITIC-VIKOR, and two BN variants, Crisp-BN (with dust data) and PHFS-BN (without dust data). For the MCDM methods, a dust-minimization-oriented criteria system is constructed with four cost-type criteria closely related to dust generation: sawing-process dust (C1), planing-process dust (C2), sanding/finishing-process dust (C3), and total process count (C4). The criterion weights are determined by AHP, the entropy weight method, and CRITIC, respectively. For the BN-based baselines, Crisp-BN retains the experimentally measured dust values for the ED nodes, consistent with the proposed approach, but uses crisp values to specify the design-side CPTs, thereby neglecting the frequency distribution of hesitant information. In contrast, PHFS-BN retains the PHFS-based design-side CPTs but replaces the experimentally measured equipment-dust CPTs with subjective estimates provided by DMs. The comparative evaluation results, ranking differences, and inter-approach correlations are shown in Table 19, Figure 25 and Figure 26, respectively.
Table 19.
Comparative evaluation results of green process schemes using different methods.
Figure 25.
Ranking comparison of 14 candidate process schemes evaluated by six methods.
Figure 26.
Spearman’s rank correlation coefficients among the six evaluation methods.
As shown in Table 19 and Figure 25, the three MCDM methods consistently identified Scheme 7 (Jointing + Thickness planing) as the optimal scheme, whereas the proposed PHFS-FBN approach identifies Scheme 3 (Rough planing + Polishing) as the optimal one, with a P(D = L) value of 3.54%. This discrepancy can be attributed to the inherent independence assumption of MCDM methods. Specifically, because the dust score associated with rough planing (P3) is higher than that of jointing (P4) and thickness planing (P5), the MCDM methods tend to favor Scheme 7. By contrast, the PHFS-FBN approach propagates probabilities along the causal chain C → P → E → ED → ETD → D, revealing that the equipment configuration activated by Scheme 3 actually resulted in a higher probability of low dust concentration at the system level. Such causal interactions between process and equipment cannot be captured by conventional aggregation-based methods, highlighting the necessity of causal inference in dust-oriented evaluation of green process schemes.
Among the three BN-based methods, all of them correctly identify Scheme 3 as the optimal scheme, but differences are observed in their quantitative outputs. Compared with the proposed approach, Crisp-BN (with dust data) generally produces lower P(D = L) values and shows weaker discrimination among schemes. This difference can be attributed to the use of crisp values for the design-side CPTs, which ignore the frequency distribution of DMs’ hesitation and therefore reduce the accuracy of probability propagation. PHFS-BN (without dust data) exhibits an even more pronounced deviation: the P(D = L) values are shifted downward overall, and the ranking of Scheme 7 drops from third to sixth. This suggests that the absence of objective information can make the evaluation results more susceptible to subjectivity. As shown in Figure 26, the Spearman rank correlation coefficients between PHFS-BN (without dust data) and the MCDM methods (0.635–0.785) are much lower than those between the proposed approach and the same MCDM methods (0.855–0.921). This indicates that the incorporation of experimental dust data not only improves evaluation accuracy but also makes the BN-based ranking more consistent with the general consensus reflected by independent expert-oriented methods. Taken together, these results demonstrate that the proposed PHFS-FBN approach improves the reliability of identifying the optimal green process scheme by integrating causal reasoning with both subjective and objective information sources.
4.6. Discussion and Limitations
The proposed approach is designed for the early-stage adaptability evaluation of green process schemes for wood products, with dust concentration as the target green indicator. This section discusses the significance, generalizability, and limitations of the proposed approach.
(1) Practical significance and application scope. The practical significance of this study lies in the prominent role of dust concentration in green production for wood-product manufacturing [3,4,5]. Dust concentration has become a major concern in occupational health and environmental regulation, and wood-product manufacturing is one of the industrial sectors most strongly associated with dust emissions. For this reason, dust concentration has increasingly been studied as an independent target in studies on dust prediction [65] and risk assessment [66]. In wood processing, dust concentration results from the combined effects of product characteristics, machining processes, and equipment operating parameters, many of which are determined at the early design stage of process schemes. This makes early-stage evaluation of the dust-related process scheme practically meaningful. Accordingly, the proposed framework is mainly applicable to reasoning, evaluation, or risk-analysis problems in wood-product manufacturing where dust concentration is treated as the sole objective. However, in real industrial applications, the applicability of our approach may still face limitations, such as the difficulty of obtaining initial data and the greater complexity of actual production operations. Therefore, the present work is intended mainly to provide pre-manufacturing optimization insights and solutions.
(2) Generalizability. The generalizability of the proposed approach can be discussed at two levels. At the knowledge level, the RFSCPE ontology is intended to capture the general knowledge structure of wood-product manufacturing, and the framework is therefore applicable in principle to different types of wood products, such as furniture, flooring, and building components. At the methodological level, the overall workflow, from knowledge-graph construction to rule-based KG-to-BN structural projection to dual-source PHFS-FBN reasoning, can potentially be extended to other manufacturing domains. These aspects suggest a certain degree of generalizability of the proposed approach. However, the current empirical validation was based on only one case study. Although this case covered all 12 characteristic types and was sufficient to demonstrate the complete workflow and verify the effectiveness of the proposed approach, its applicability to other categories of wood products remains to be further examined. Moreover, for non-wood products, such as ceramics or plastics, additional limitations may arise, and the proposed approach may even become ineffective. Therefore, strengthening the evidence for its generalizability and extending its application to non-wood products should be regarded as priorities for future research. Furthermore, although the current study focuses exclusively on dust concentration, the proposed framework is extensible to other green indicators: additional target nodes (e.g., energy consumption or noise level) can be incorporated into the BN by expanding the RFSCPE ontology, and the same PHFS-FBN inference procedure can be applied to the extended network. Such a multi-indicator extension is also identified as a direction for future research.
5. Conclusions and Future Work
To address the lack of systematic causal modeling of dust-related factors, as well as the difficulty of reliably evaluating the adaptability of green process schemes for wood products at the early design stage due to the subjectivity and fuzziness of reasoning, a process scheme adaptability evaluation approach based on a PKG and an FBN was proposed. After constructing an RFSCPE ontology-based PKG for wood products, the entity relationships extracted from the PKG were then transformed into a BN structure, thereby constructing an FBN model tailored to dust concentration inference in wood product manufacturing. In addition, PHFS were introduced to quantify the fuzzy evaluations of DMs and were combined with experimentally measured dust concentration data to construct the CPTs of all nodes in the BN. Based on probabilistic inference using the FBN model, the optimal process scheme was identified with the objective of minimizing dust concentration. A wooden toy car case study validated the effectiveness of the proposed approach, and sensitivity analysis identified the factors that have a significant impact on overall dust concentration, providing clear priority guidance for design optimization.
The main novelties of this work are as follows:
- An RFSCPE ontology tailored to green wood product design was developed to structure and represent the complex interplay between design and process knowledge, clarifying the multifactor causal pathways driving dust concentration.
- A KG-driven approach to BN construction was proposed, enabling efficient extraction of dust-relevant knowledge nodes and causal relationships, reducing the subjectivity and inaccuracies of the traditional BN construction process.
- A green process scheme adaptability evaluation approach based on PKG and PHFS-FBN was developed to identify the optimal green process scheme for wood products, and key factors influencing dust concentration were revealed through sensitivity analysis.
However, a few limitations of the proposed decision model exist and suggest directions for future research. First, due to limitations in the timeliness of enterprise equipment data acquisition, the dynamic and real-time characteristics of the model data are still insufficient. Second, the BN structure of the proposed wood product process schemes is relatively complex, resulting in a more computationally demanding probabilistic inference process. Third, the BN model does not yet account for the indirect effects of factors such as wood source and processing environment on dust concentration. Thus, the following three aspects may be examined in future studies:
(1) In the present study, real-time operational data were not incorporated into the FBN. As a future direction, integrating Internet of Things (IoT) sensing technologies could enable continuous collection of operational data across the full life cycle of wood products, allowing real-time updates of the effects of different process schemes on dust concentration and further improving the accuracy of scheme evaluation results.
(2) The current evaluation workflow involves multiple manual steps, PKG querying, evidence encoding, and Netica-based inference, which limits its practical efficiency. A future direction is to develop an integrated auxiliary system that automates data invocation and inference execution, lowering the operational barrier for industrial users.
(3) The RFSCPE ontology does not yet account for raw-material properties such as wood moisture content and density. Extending the ontology to incorporate these material-level factors would broaden the framework’s applicability to different wood types.
Author Contributions
Conceptualization, Y.D. and J.N.; methodology, Y.D. and J.N.; validation, D.F., X.Y. and L.J.; formal analysis, S.J.; investigation, J.N.; writing—original draft preparation, Y.D. and J.N.; writing—review and editing, D.F. and L.J.; funding acquisition, Y.D., D.F. and S.J. All authors have read and agreed to the published version of the manuscript.
Funding
This work was supported by the National Natural Science Foundation of China [grant numbers 52505291, 52575320, 52105282], the Key Research and Development Program of Zhejiang Province [grant number 2026C02A3034], and the Zhejiang Provincial Natural Science Foundation of China [grant numbers LQN26E050044, LMS26E050032, LQN26E050042]. These sources of support are gratefully acknowledged.
Institutional Review Board Statement
Not applicable.
Informed Consent Statement
Not applicable.
Data Availability Statement
The data presented in this study are available on request from the corresponding author.
Conflicts of Interest
Author Xiaowei You was employed by the company Zhejiang Jinertai Toys Co., Ltd. The remaining authors declare that the research was conducted in the absence of any commercial or financial relationships that could be construed as a potential conflict of interest.
Abbreviations
The following abbreviations are used in this manuscript:
| AHP | Analytic hierarchy process |
| BERT | Bidirectional Encoder Representations from Transformers |
| BiLSTM | Bidirectional Long Short-Term Memory |
| BNs | Bayesian networks |
| BWM | Best-worst method |
| CPTs | Conditional probability tables |
| CRF | Conditional random field |
| CRITIC | Criteria importance through intercriteria correlation |
| DEMATEL | Decision-Making Trial and Evaluation Laboratory |
| DMs | Decision makers |
| ETD | Equipment-type dust |
| FBN | Fuzzy Bayesian network |
| FBS | Function-behavior-structure |
| IoT | Internet of Things |
| KG | Knowledge graph |
| LLM | Large language model |
| LTP | Language technology platform |
| MCDM | Multi-criteria decision making |
| NER | Named entity recognition |
| NLP | Natural language processing |
| PHFS | Probabilistic hesitant fuzzy sets |
| PKG | Process knowledge graph |
| RFSCPE | Requirement-function-structure-characteristic-process-equipment |
| TOPSIS | Technique for order preference by similarity to ideal solution |
| VIKOR | VlseKriterijumska Optimizacija I Kompromisno Resenje |
| WSM | Weighted sum model |
Appendix A
Appendix A.1. Function Basis Classification
To standardize the expression of product functions, existing function-basis definitions are adopted to convey design intent, including 8 categories covering class functions (CF), basic functions (BF), and synonyms (SyF), as shown in Table A1. The introduction of a function basis provides a rigorous framework for representing product functions, standardizes functional expression, and mitigates semantic inconsistencies arising from the use of heterogeneous terminology by different designers to describe the same function. The first level of Fv is categorized into eight types: branch, guide, connect, control, transform, supply, detect, and support. The abstract level of Fv gradually decreases from the first level to the third level, as shown in Table A1.
Table A1.
Three-level functional classification set.
Appendix A.2. Dependency Syntax Analysis Grammar Table
The LTP toolkit is specifically chosen because it is suitable for dependency syntactic analysis of Chinese text, which provides several functions such as lexical annotation, syntactic analysis, and semantic dependency analysis. Tags for these 17 dependency relationships (DRs) described in Section 3.3 are defined in Table A2.
Table A2.
Dependency syntax analysis grammar table.
Appendix A.3. Node and State Description
A detailed description of all nodes in the BN, their state settings, and the corresponding sources for these settings is provided. Nodes with identical state configurations are grouped into the same cell, as shown in Table A3.
Table A3.
Node and state description.
Appendix A.4. Equipment CPT
By experimentally measuring dust concentration data and applying the calculation method described in Section 3.3, the conditional probabilities of dust states under all equipment parameter settings are obtained, thereby constructing the CPTs of dust states for all equipment, as shown in Table A4.
Table A4.
CPTs of all equipment.
Figure A1.
Updated BN for wooden product green process scheme adaptability evaluation.
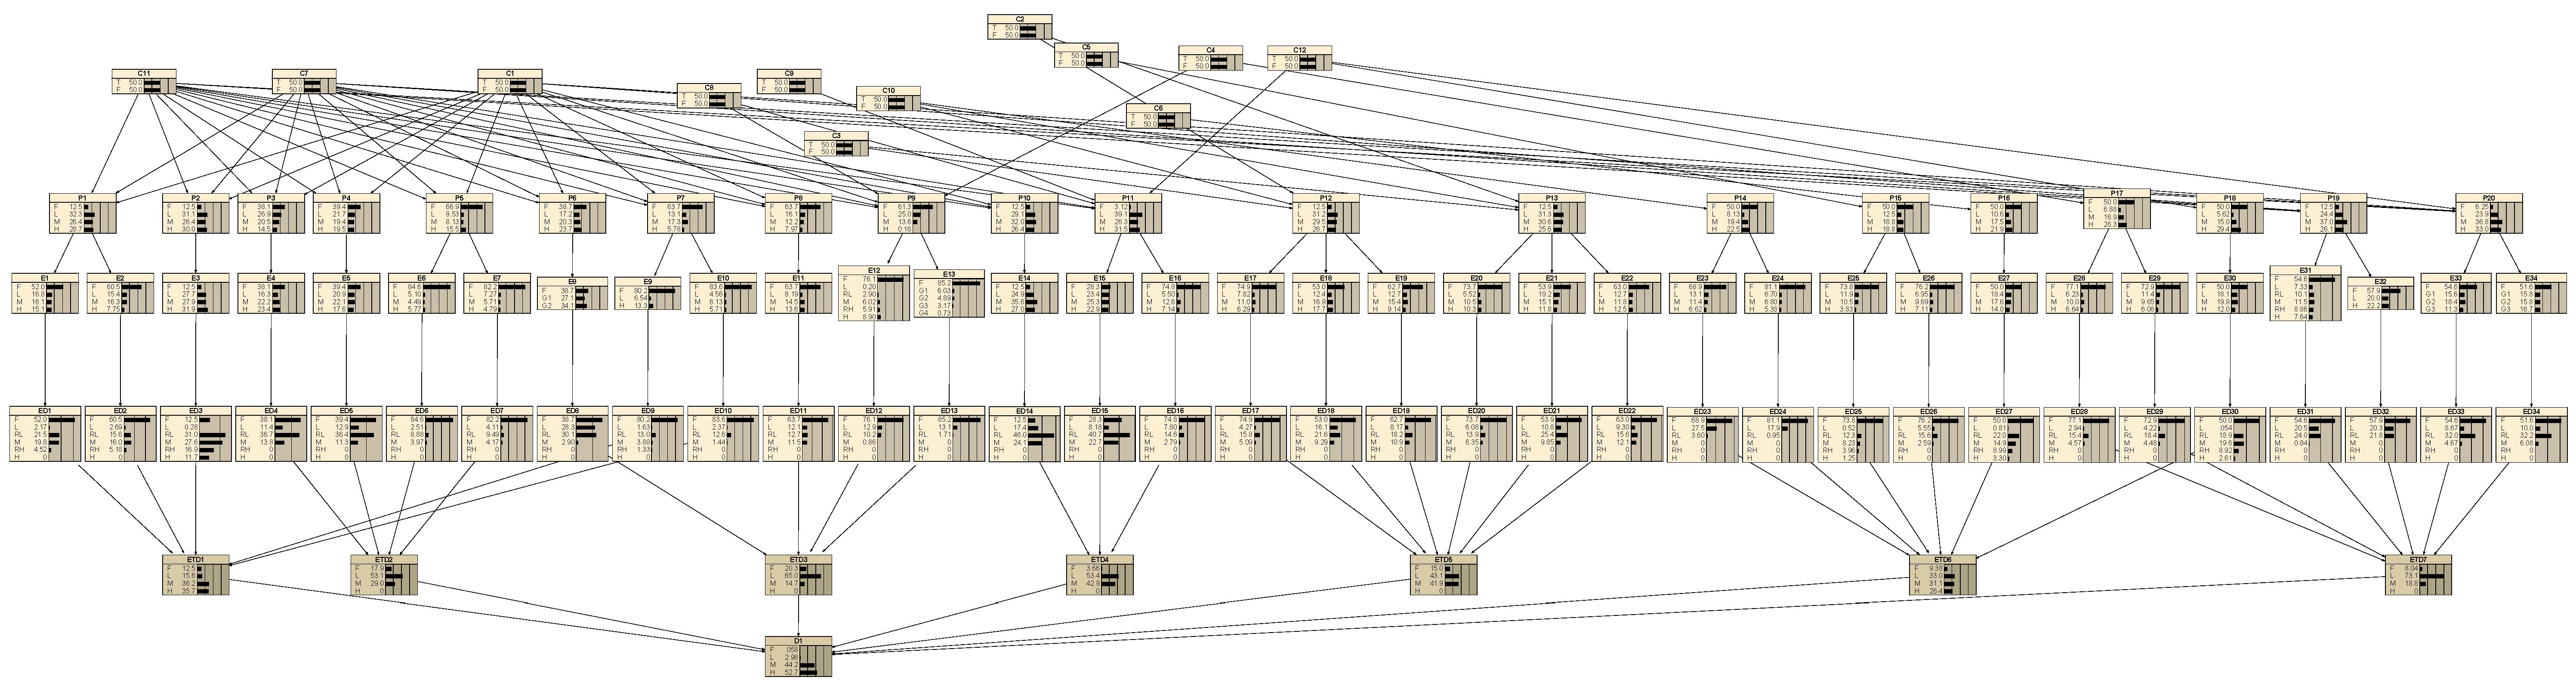
Figure A2.
Forward propagation analysis of BN.
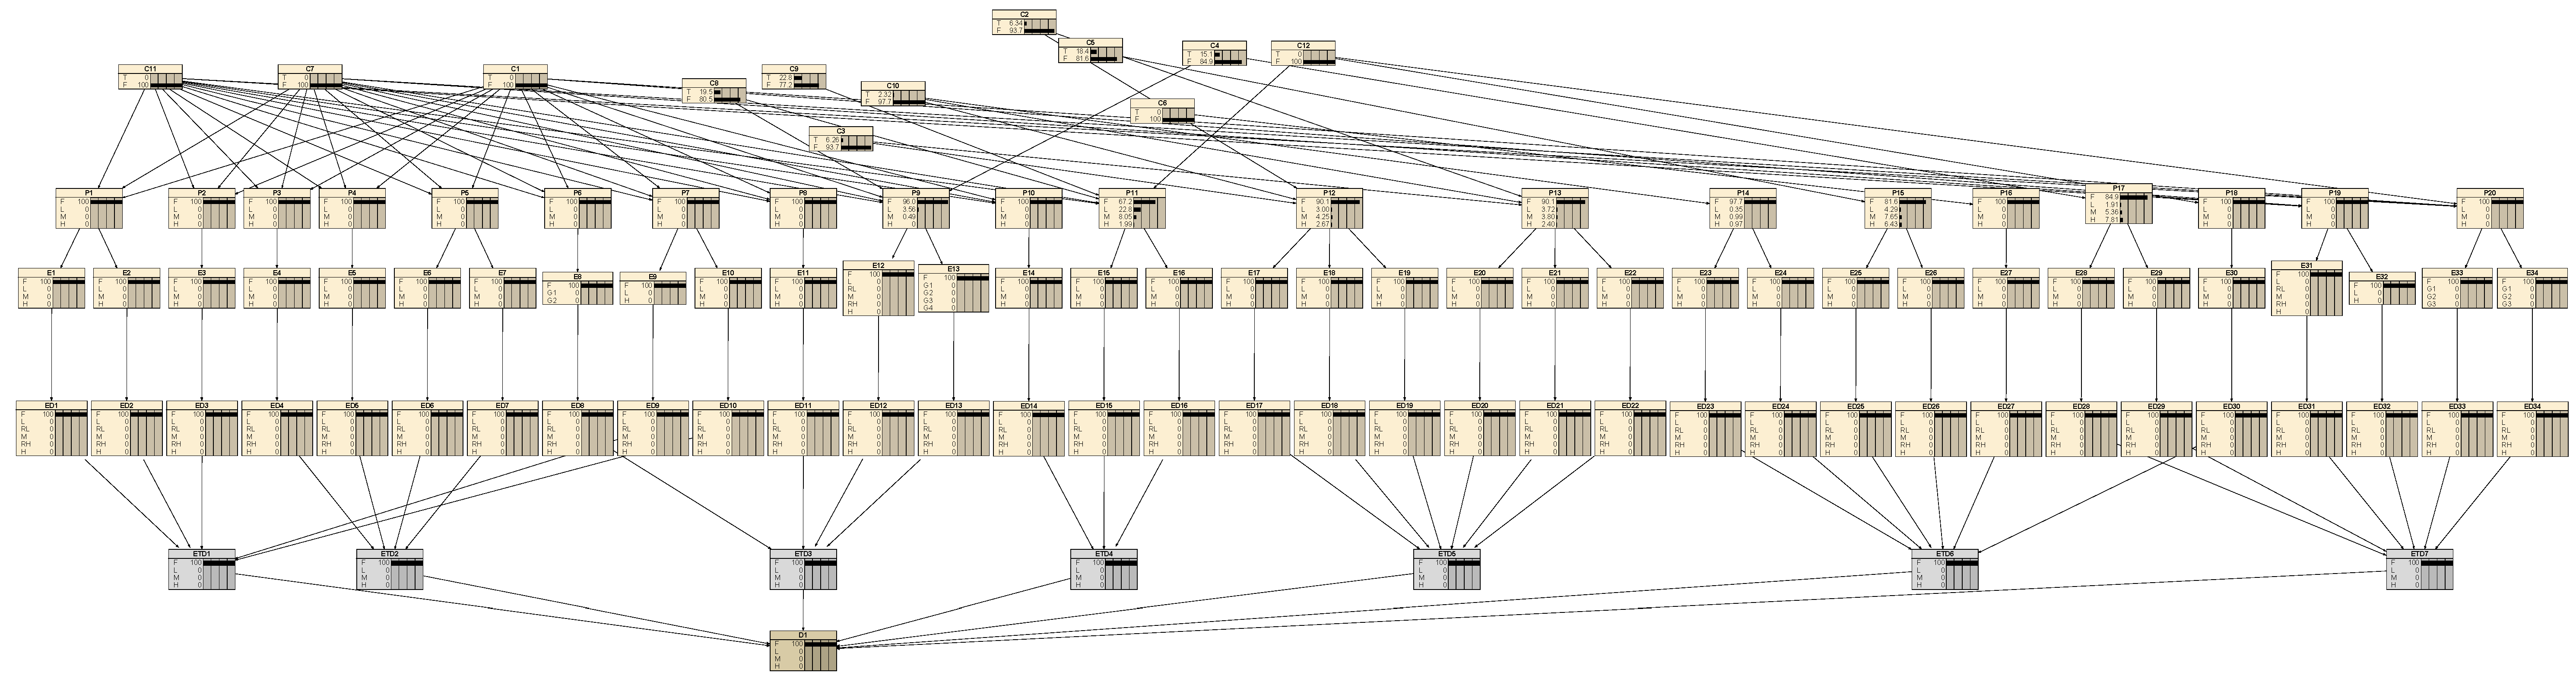
Figure A3.
Backward propagation analysis of the node (ETD5).
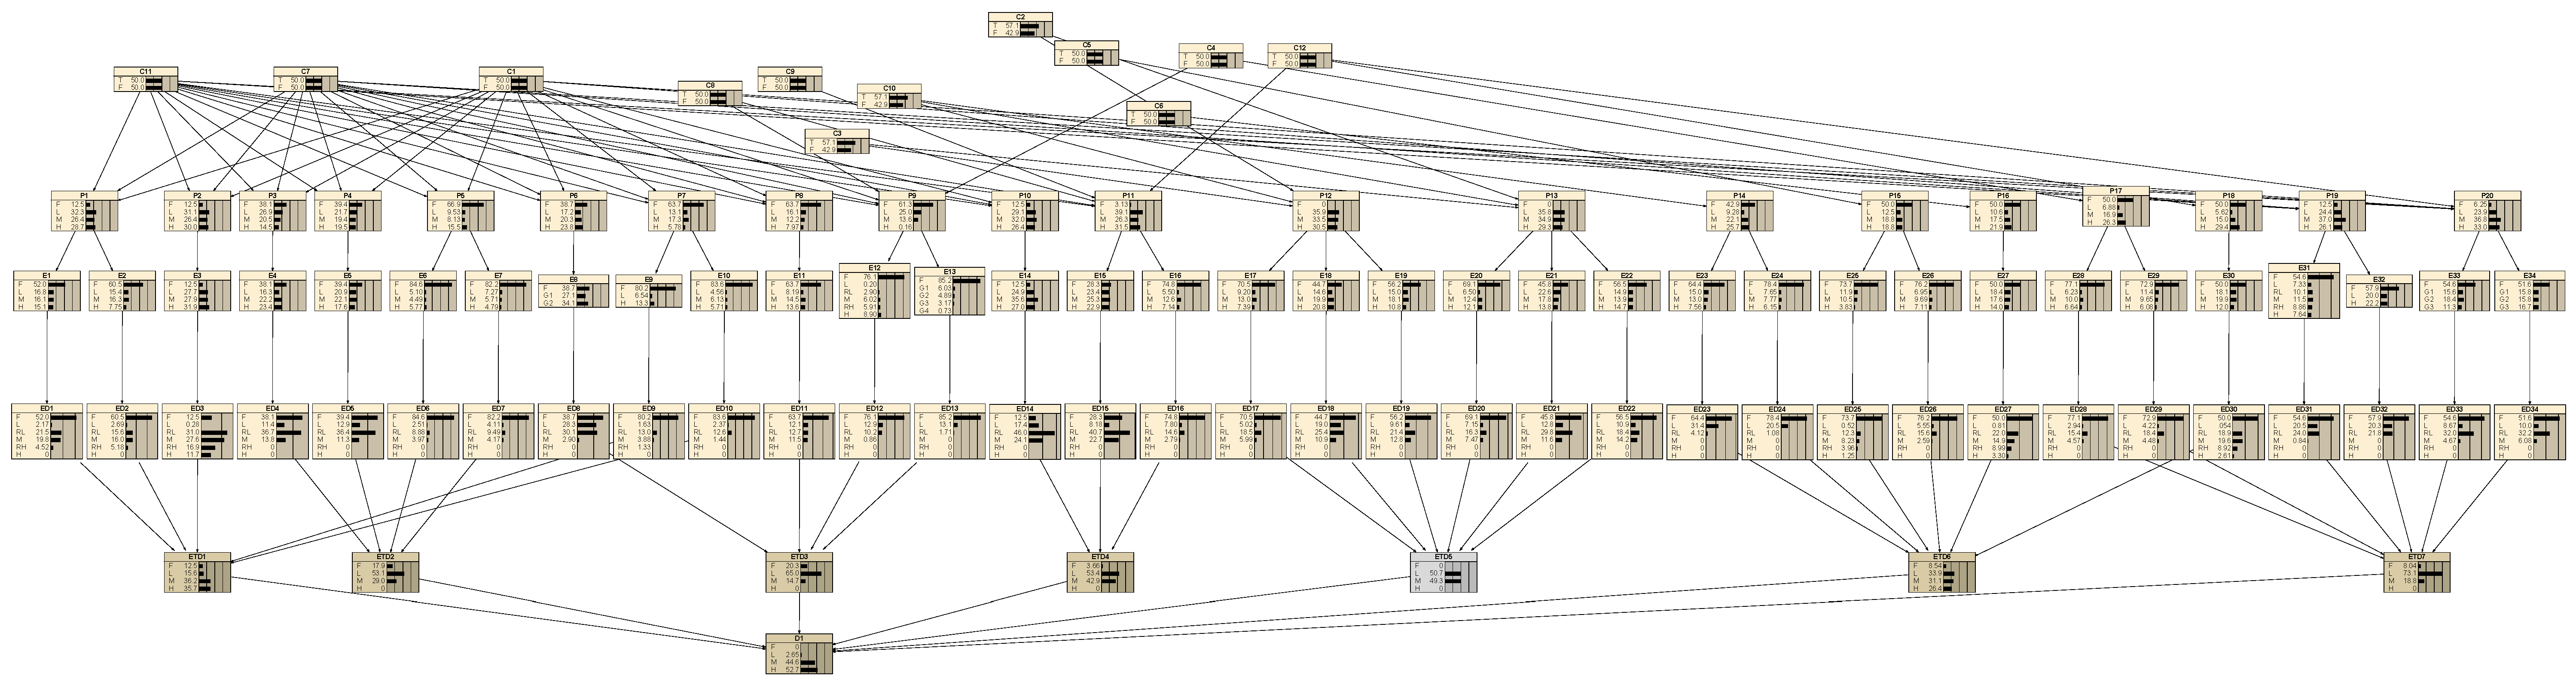
References
- Xiong, X.; Ma, Q.; Wu, Z.; Zhang, M. Current situation and key manufacturing considerations of green furniture in China: A review. J. Clean. Prod. 2020, 267, 121957. [Google Scholar] [CrossRef] [Scilit]
- Muhammad Suandi, M.E.; Amlus, M.H.; Hemdi, A.R.; Abd Rahim, S.Z.; Ghazali, M.F.; Rahim, N.L. A review on sustainability characteristics development for wooden furniture design. Sustainability 2022, 14, 8748. [Google Scholar] [CrossRef] [Scilit]
- Scarselli, A.; Binazzi, A.; Ferrante, P.; Marinaccio, A. Occupational exposure levels to wood dust in Italy, 1996–2006. Occup. Environ. Med. 2008, 65, 567–574. [Google Scholar] [CrossRef] [Scilit]
- Očkajová, A.; Kučerka, M.; Kminiak, R.; Krišťák, Ľ.; Igaz, R.; Réh, R. Occupational exposure to dust produced when milling thermally modified wood. Int. J. Environ. Res. Public Health 2020, 17, 1478. [Google Scholar] [CrossRef] [Scilit]
- Zhou, X.; Li, X.; Cui, Z.; Wu, L.; Zhou, H.; Lu, X. Combustible wood dust explosions and impacts on environments and health-A review. Environ. Res. 2023, 216, 114658. [Google Scholar] [CrossRef] [Scilit]
- Zavadskas, E.K.; Turskis, Z.; Kildienė, S. State of art surveys of overviews on MCDM/MADM methods. Technol. Econ. Dev. Econ. 2014, 20, 165–179. [Google Scholar] [CrossRef] [Scilit]
- Guha, D.; Chakraborty, D. Fuzzy multi attribute group decision making method to achieve consensus under the consideration of degrees of confidence of experts’ opinions. Comput. Ind. Eng. 2011, 60, 493–504. [Google Scholar] [CrossRef] [Scilit]
- Gustavsson, L.; Sathre, R. Variability in energy and carbon dioxide balances of wood and concrete building materials. Build. Environ. 2006, 41, 940–951. [Google Scholar] [CrossRef] [Scilit]
- Feil, A.A.; de Brito Reiter, I.; Oberherr, R.; Strasburg, V.J.; Schreiber, D. Analysis and measurement of the sustainability level in the furniture industry. Environ. Dev. Sustain. 2022, 24, 13657–13682. [Google Scholar] [CrossRef] [Scilit]
- Jia, L.; Chu, J.; Ma, L.; Qi, X.; Kumar, A. Life cycle assessment of plywood manufacturing process in China. Int. J. Environ. Res. Public Health 2019, 16, 2037. [Google Scholar] [CrossRef] [Scilit]
- Liu, Q.; Chen, J.; Wang, W.; Qin, Q. Conceptual design evaluation considering confidence based on Z-AHP-TOPSIS method. Appl. Sci. 2021, 11, 7400. [Google Scholar] [CrossRef] [Scilit]
- Li, H.; Wang, W.; Fan, L.; Li, Q.; Chen, X. A novel hybrid MCDM model for machine tool selection using fuzzy DEMATEL, entropy weighting and later defuzzification VIKOR. Appl. Soft Comput. 2020, 91, 106207. [Google Scholar] [CrossRef] [Scilit]
- Dugger, Z.; Halverson, G.; McCrory, B.; Claudio, D. Principal component analysis in MCDM: An exercise in pilot selection. Expert Syst. Appl. 2022, 188, 115984. [Google Scholar] [CrossRef] [Scilit]
- Habiba, U.; Zhang, R.; Sarwar, M.A.; Gong, Y. A robust fractional fuzzy decision support framework for sustainable energy planning. Sci. Rep. 2025, 15, 31503. [Google Scholar] [CrossRef] [Scilit]
- O’Shea, R.; Deeney, P.; Triantaphyllou, E.; Diaz-Balteiro, L.; Tarim, S.A. Weight stability intervals for multi-criteria decision analysis using the weighted sum model. Expert Syst. Appl. 2026, 296, 128460. [Google Scholar] [CrossRef] [Scilit]
- Gaona, À.; Guisasola, A.; Baeza, J.A. An integrated TOPSIS framework with full-range weight sensitivity analysis for robust decision analysis. Decis. Anal. J. 2025, 17, 100642. [Google Scholar] [CrossRef] [Scilit]
- Karczmarczyk, A.; Wątróbski, J.; Bączkiewicz, A.; Mróz-Malik, O.; Drożdż, W. New robust multi-criteria decision-making method for wind farm location problems. Appl. Energy 2025, 398, 126401. [Google Scholar]
- Pöyhönen, M.; Hämäläinen, R.P. On the convergence of multiattribute weighting methods. Eur. J. Oper. Res. 2001, 129, 569–585. [Google Scholar] [CrossRef] [Scilit]
- Kminiak, R.; Kučerka, M.; Kristak, L.; Reh, R.; Antov, P.; Očkajová, A.; Rogoziński, T.; Pędzik, M. Granulometric characterization of wood dust emission from CNC machining of natural wood and medium density fiberboard. Forests 2021, 12, 1039. [Google Scholar] [CrossRef] [Scilit]
- Cui, Y.; Yin, J.; Cai, Y.; Wang, H.; Zhu, N.; Ding, T. Spatial distribution characteristics of the dust emitted at different cutting speeds during MDF milling by image analysis. J. Wood Sci. 2022, 68, 17. [Google Scholar] [CrossRef] [Scilit]
- Rabbi, M.; Ali, S.M.; Kabir, G.; Mahtab, Z.; Paul, S.K. Green supply chain performance prediction using a Bayesian belief network. Sustainability 2020, 12, 1101. [Google Scholar] [CrossRef] [Scilit]
- Kumar, S.; Arzaghi, E.; Baalisampang, T.; Abaei, M.M.; Garaniya, V.; Abbassi, R. A risk-based multi-criteria decision-making framework for offshore green hydrogen system developments: Pathways for utilizing existing and new infrastructure. Sustain. Prod. Consum. 2024, 46, 655–678. [Google Scholar] [CrossRef] [Scilit]
- Kitson, N.K.; Constantinou, A.C.; Guo, Z.; Liu, Y.; Chobtham, K. A survey of Bayesian Network structure learning. Artif. Intell. Rev. 2023, 56, 8721–8814. [Google Scholar] [CrossRef] [Scilit]
- Jiang, S.; Hu, J.; Wood, K.L.; Luo, J. Data-driven design-by-analogy: State-of-the-art and future directions. J. Mech. Des. 2022, 144, 020801. [Google Scholar] [CrossRef] [Scilit]
- Hogan, A.; Blomqvist, E.; Cochez, M.; d’Amato, C.; Melo, G.D.; Gutierrez, C.; Kirrane, S.; Gayo, J.E.L.; Navigli, R.; Neumaier, S. Knowledge graphs. ACM Comput. Surv. 2021, 54, 1–37. [Google Scholar] [CrossRef] [Scilit]
- Han, Y.; Deng, Y. An enhanced fuzzy evidential DEMATEL method with its application to identify critical success factors. Soft Comput. 2018, 22, 5073–5090. [Google Scholar] [CrossRef] [Scilit]
- Jing, L.; Li, Q.; Ma, J.; Xie, J.; Peng, X.; Li, J.; Jiang, S. A conceptual design decision approach by integrating rough Bayesian network and game theory under uncertain behavior selections. Expert Syst. Appl. 2022, 202, 117108. [Google Scholar] [CrossRef] [Scilit]
- Jing, L.; Huang, M.; Cai, X.; Dou, Y.; Feng, D.; Jiang, S. A multi-granularity personalised semantic fusion approach for conceptual design decision-making: Integrating BERT and prospect theory. J. Eng. Des. 2025, 37, 830–870. [Google Scholar] [CrossRef] [Scilit]
- Dornfeld, D.A. Moving towards green and sustainable manufacturing. Int. J. Precis. Eng. Manuf.-Green Technol. 2014, 1, 63–66. [Google Scholar] [CrossRef] [Scilit]
- Pusavec, F.; Krajnik, P.; Kopac, J. Transitioning to sustainable production–Part I: Application on machining technologies. J. Clean. Prod. 2010, 18, 174–184. [Google Scholar] [CrossRef] [Scilit]
- Pascoe, S.; Farmery, A.; Nichols, R.; Lothian, S.; Azmi, K. A modified Analytic Hierarchy Process suitable for online survey preference elicitation. Algorithms 2024, 17, 245. [Google Scholar] [CrossRef] [Scilit]
- Govindan, K.; Kadziński, M.; Ehling, R.; Miebs, G. Selection of a sustainable third-party reverse logistics provider based on the robustness analysis of an outranking graph kernel conducted with ELECTRE I and SMAA. Omega 2019, 85, 1–15. [Google Scholar] [CrossRef] [Scilit]
- Alkan, N. Evaluation of sustainable development and utilization-oriented renewable energy systems based on CRITIC-SWARA-CODAS method using interval valued picture fuzzy sets. Sustain. Energy Grids Netw. 2024, 38, 101263. [Google Scholar] [CrossRef] [Scilit]
- Nayeemuddin; Ahmed, A.F.; Latif, K.; Mudassir, S.; Al-Amri, K.R.S. Fabrication of Green Composite Materials Using the Weight Sum Method (WSM) Method. Int. J. Innov. Sci. Res. Technol. 2024, 9, 200–207. [Google Scholar]
- Amman, M.; Rashid, T.; Ali, A.; Albalawi, O.; Alharthi, A.M. Dual-hesitant fermatean fuzzy Hamacher aggregation operators and TOPSIS with their application to multi-criteria decision-making. PLoS ONE 2024, 19, e0311580. [Google Scholar] [CrossRef] [Scilit]
- Nyimbili, P.H.; Erden, T.; Mwanaumo, E.M.u. A DEMATEL-based approach of multi-criteria evaluation for urban fire and emergency facilities. Front. Environ. Econ. 2023, 2, 1198541. [Google Scholar] [CrossRef] [Scilit]
- Zafeirakopoulos, I.B.; Genevois, M.E. An Analytic Network Process approach for the environmental aspect selection problem—A case study for a hand blender. Environ. Impact Assess. Rev. 2015, 54, 101–109. [Google Scholar] [CrossRef] [Scilit]
- Vairo, T.; Guarino, S.; Benvenuto, A.; Fabiano, B.; Setola, R. Emergent Risks in Complex Systems: A Bayesian Perspective on Uncertainty and Prediction. Reliab. Eng. Syst. Saf. 2025, 270, 112129. [Google Scholar] [CrossRef] [Scilit]
- Liao, J.; Huan, X.; Haapala, K.R.; Cooper, D.R. A Bayesian approach to modeling unit manufacturing process environmental impacts using limited data with case studies on laser powder bed fusion cumulative energy demand. Procedia CIRP 2023, 116, 516–521. [Google Scholar] [CrossRef] [Scilit]
- Liu, Q.; Wang, K.; Li, Y.; Liu, Y. Data-driven concept network for inspiring designers’ idea generation. J. Comput. Inf. Sci. Eng. 2020, 20, 031004. [Google Scholar] [CrossRef] [Scilit]
- Hao, J.; Zhao, L.; Milisavljevic-Syed, J.; Ming, Z. Integrating and navigating engineering design decision-related knowledge using decision knowledge graph. Adv. Eng. Inform. 2021, 50, 101366. [Google Scholar] [CrossRef] [Scilit]
- Huang, Z.; Guo, X.; Liu, Y.; Zhao, W.; Zhang, K. A smart conflict resolution model using multi-layer knowledge graph for conceptual design. Adv. Eng. Inform. 2023, 55, 101887. [Google Scholar] [CrossRef] [Scilit]
- Chen, X.; Jia, S.; Xiang, Y. A review: Knowledge reasoning over knowledge graph. Expert Syst. Appl. 2020, 141, 112948. [Google Scholar] [CrossRef] [Scilit]
- Fantoni, G.; Apreda, R.; Dell’Orletta, F.; Monge, M. Automatic extraction of function–behaviour–state information from patents. Adv. Eng. Inform. 2013, 27, 317–334. [Google Scholar] [CrossRef] [Scilit]
- He, B.; Hua, Y. Feature-based integrated product model for low-carbon conceptual design. J. Eng. Des. 2017, 28, 408–432. [Google Scholar] [CrossRef] [Scilit]
- Yoon, B.; Kim, S.; Kim, S.; Seol, H. Doc2vec-based link prediction approach using SAO structures: Application to patent network. Scientometrics 2022, 127, 5385–5414. [Google Scholar] [CrossRef] [Scilit]
- Ding, C.; Qiao, F.; Liu, J.; Wang, D. Knowledge graph modeling method for product manufacturing process based on human–cyber–physical fusion. Adv. Eng. Inform. 2023, 58, 102183. [Google Scholar] [CrossRef] [Scilit]
- Li, K.; Liu, J.; Zhai, S.; Zhuang, C.; Pei, F. Automatic generation method of knowledge graph for complex product assembly processes based on text mining. Chin. J. Mech. Eng. 2025, 38, 133. [Google Scholar] [CrossRef] [Scilit]
- Yang, C.; Zheng, Y.; Tu, X.; Ala-Laurinaho, R.; Autiosalo, J.; Seppänen, O.; Tammi, K. Ontology-based knowledge representation of industrial production workflow. Adv. Eng. Inform. 2023, 58, 102185. [Google Scholar] [CrossRef] [Scilit]
- Shen, T.; Zhang, F.; Cheng, J. A comprehensive overview of knowledge graph completion. Knowl.-Based Syst. 2022, 255, 109597. [Google Scholar] [CrossRef] [Scilit]
- Zhou, B.; Bao, J.; Li, J.; Lu, Y.; Liu, T.; Zhang, Q. A novel knowledge graph-based optimization approach for resource allocation in discrete manufacturing workshops. Robot. Comput.-Integr. Manuf. 2021, 71, 102160. [Google Scholar] [CrossRef] [Scilit]
- Guo, L.; Yan, F.; Li, T.; Yang, T.; Lu, Y. An automatic method for constructing machining process knowledge base from knowledge graph. Robot. Comput.-Integr. Manuf. 2022, 73, 102222. [Google Scholar] [CrossRef] [Scilit]
- Zheng, H.; Yang, S.; Lou, S.; Gao, Y.; Feng, Y. Knowledge-based integrated product design framework towards sustainable low-carbon manufacturing. Adv. Eng. Inform. 2021, 48, 101258. [Google Scholar] [CrossRef] [Scilit]
- Avdeenko, T.V.; Makarova, E.S. Knowledge representation model based on case-based reasoning and the domain ontology: Application to the IT consultation. IFAC-PapersOnLine 2018, 51, 1218–1223. [Google Scholar] [CrossRef] [Scilit]
- Peng, G.; Wang, H.; Zhang, H.; Zhao, Y.; Johnson, A.L. A collaborative system for capturing and reusing in-context design knowledge with an integrated representation model. Adv. Eng. Inform. 2017, 33, 314–329. [Google Scholar] [CrossRef] [Scilit]
- Wu, Z.; Liang, C. A review and prospects of manufacturing process knowledge acquisition, representation, and application. Machines 2024, 12, 416. [Google Scholar] [CrossRef] [Scilit]
- Jing, L.; Huang, M.; Li, Q.; Dou, Y.; Feng, D.; Jiang, S. Knowledge graph-assisted design-by-analogy: Promoting product innovation through structured analogical knowledge retrieval. Artif. Intell. Eng. Des. Anal. Manuf. 2025, 39, e20. [Google Scholar] [CrossRef] [Scilit]
- Jiang, S.; Yang, J.; Xie, J.; Xu, X.; Dou, Y.; Jing, L. Product innovation design approach driven by implicit relationship completion via patent knowledge graph. Adv. Eng. Inform. 2024, 61, 102530. [Google Scholar] [CrossRef] [Scilit]
- Jing, L.; Yang, J.; Ma, J.; Xie, J.; Li, J.; Jiang, S. An integrated implicit user preference mining approach for uncertain conceptual design decision-making: A pipeline inspection trolley design case study. Knowl.-Based Syst. 2023, 270, 110524. [Google Scholar] [CrossRef] [Scilit]
- Zhang, Z.; Jaiswal, P.; Rai, R. Featurenet: Machining feature recognition based on 3d convolution neural network. Comput.-Aided Des. 2018, 101, 12–22. [Google Scholar] [CrossRef] [Scilit]
- Han, J.; Pratt, M.; Regli, W.C. Manufacturing feature recognition from solid models: A status report. IEEE Trans. Robot. Autom. 2000, 16, 782–796. [Google Scholar] [CrossRef] [Scilit]
- Aldwairi, M.; Jarrah, M.; Mahasneh, N.; Al-khateeb, B. Graph-based data management system for efficient information storage, retrieval and processing. Inf. Process. Manag. 2023, 60, 103165. [Google Scholar] [CrossRef] [Scilit]
- Zhang, S.; Xu, Z.; He, Y. Operations and integrations of probabilistic hesitant fuzzy information in decision making. Inf. Fusion 2017, 38, 1–11. [Google Scholar] [CrossRef] [Scilit]
- Shannon, C.E. A mathematical theory of communication. Bell Syst. Tech. J. 1948, 27, 379–423. [Google Scholar] [CrossRef] [Scilit]
- Singer, H.; Ilce, A.C.; Şenel, Y.E.; Burdurlu, E. Artificial neural Network–based prediction model to minimize dust emission in the machining process. Saf. Health Work 2024, 15, 317–326. [Google Scholar] [CrossRef] [Scilit] [PubMed]
- Simpson, A.T.; Beattie, H.; Lekka, C.; Keen, C. Health and Safety Executive research on wood dust exposure controls in British manufacturing. Ann. Work Expo. Health 2024, 68, 180–191. [Google Scholar] [CrossRef] [Scilit] [PubMed]
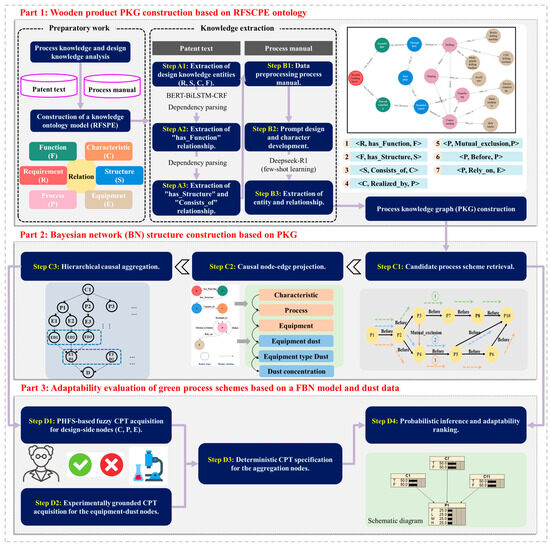
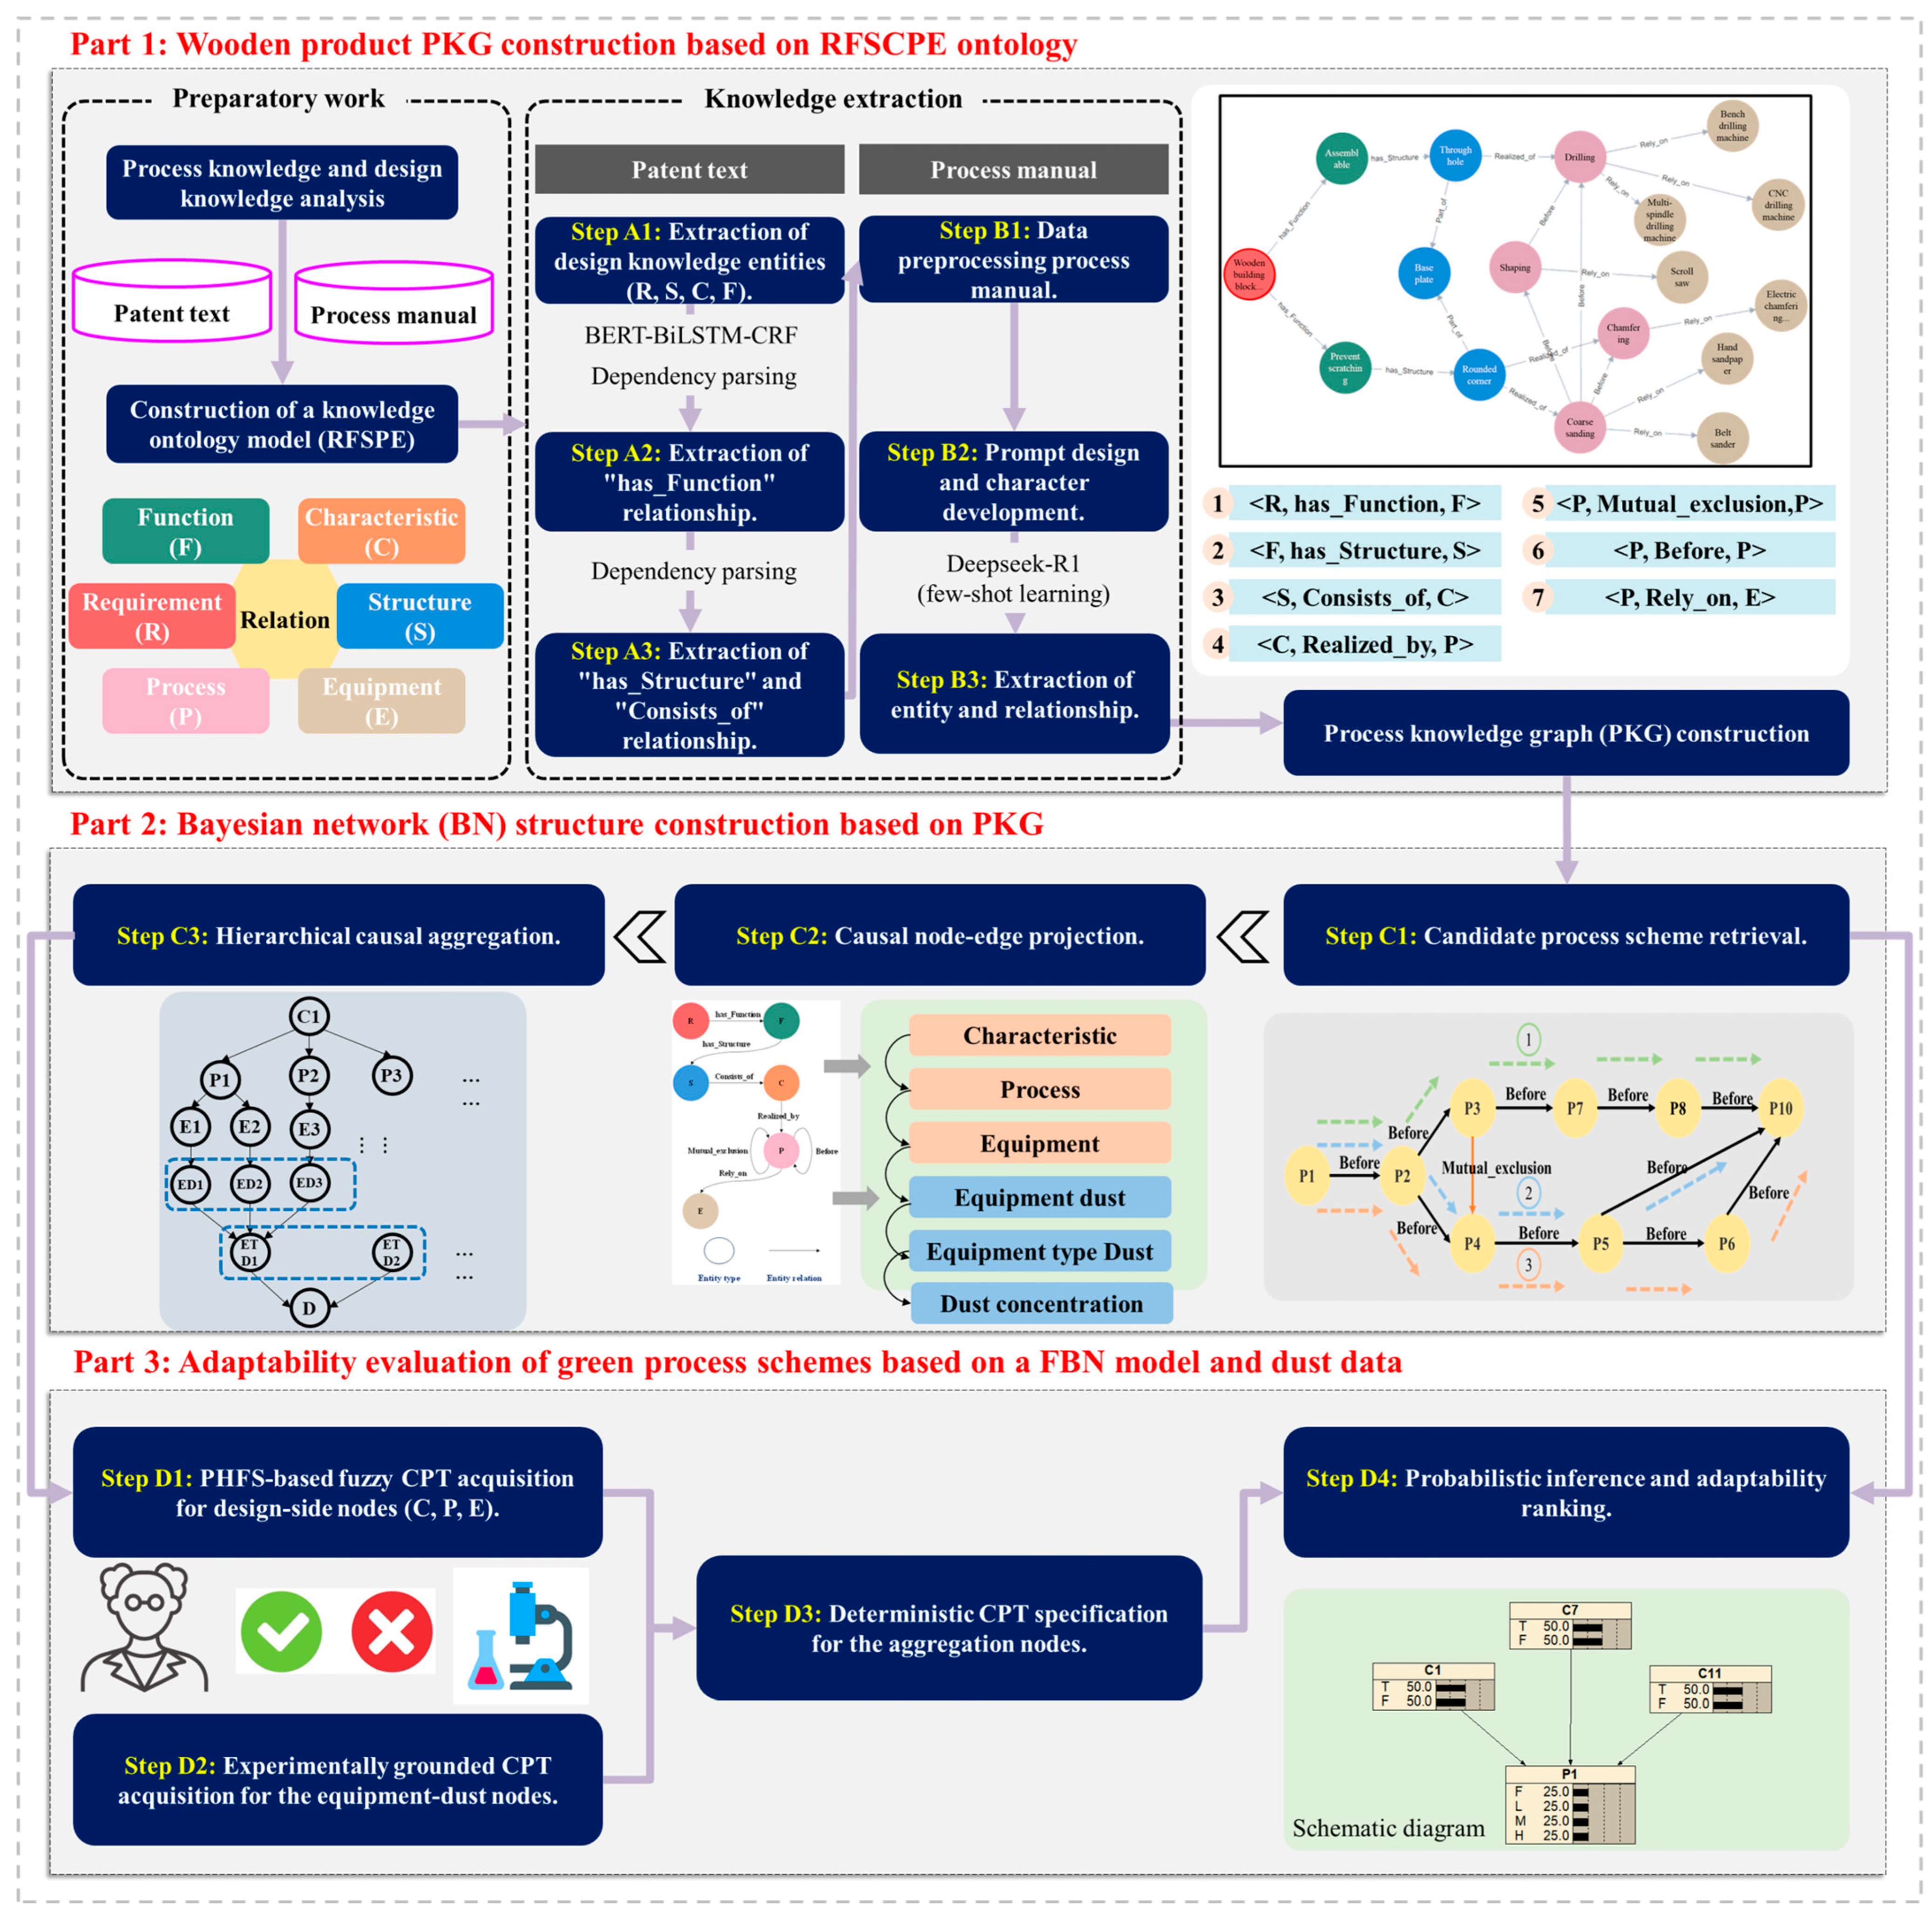
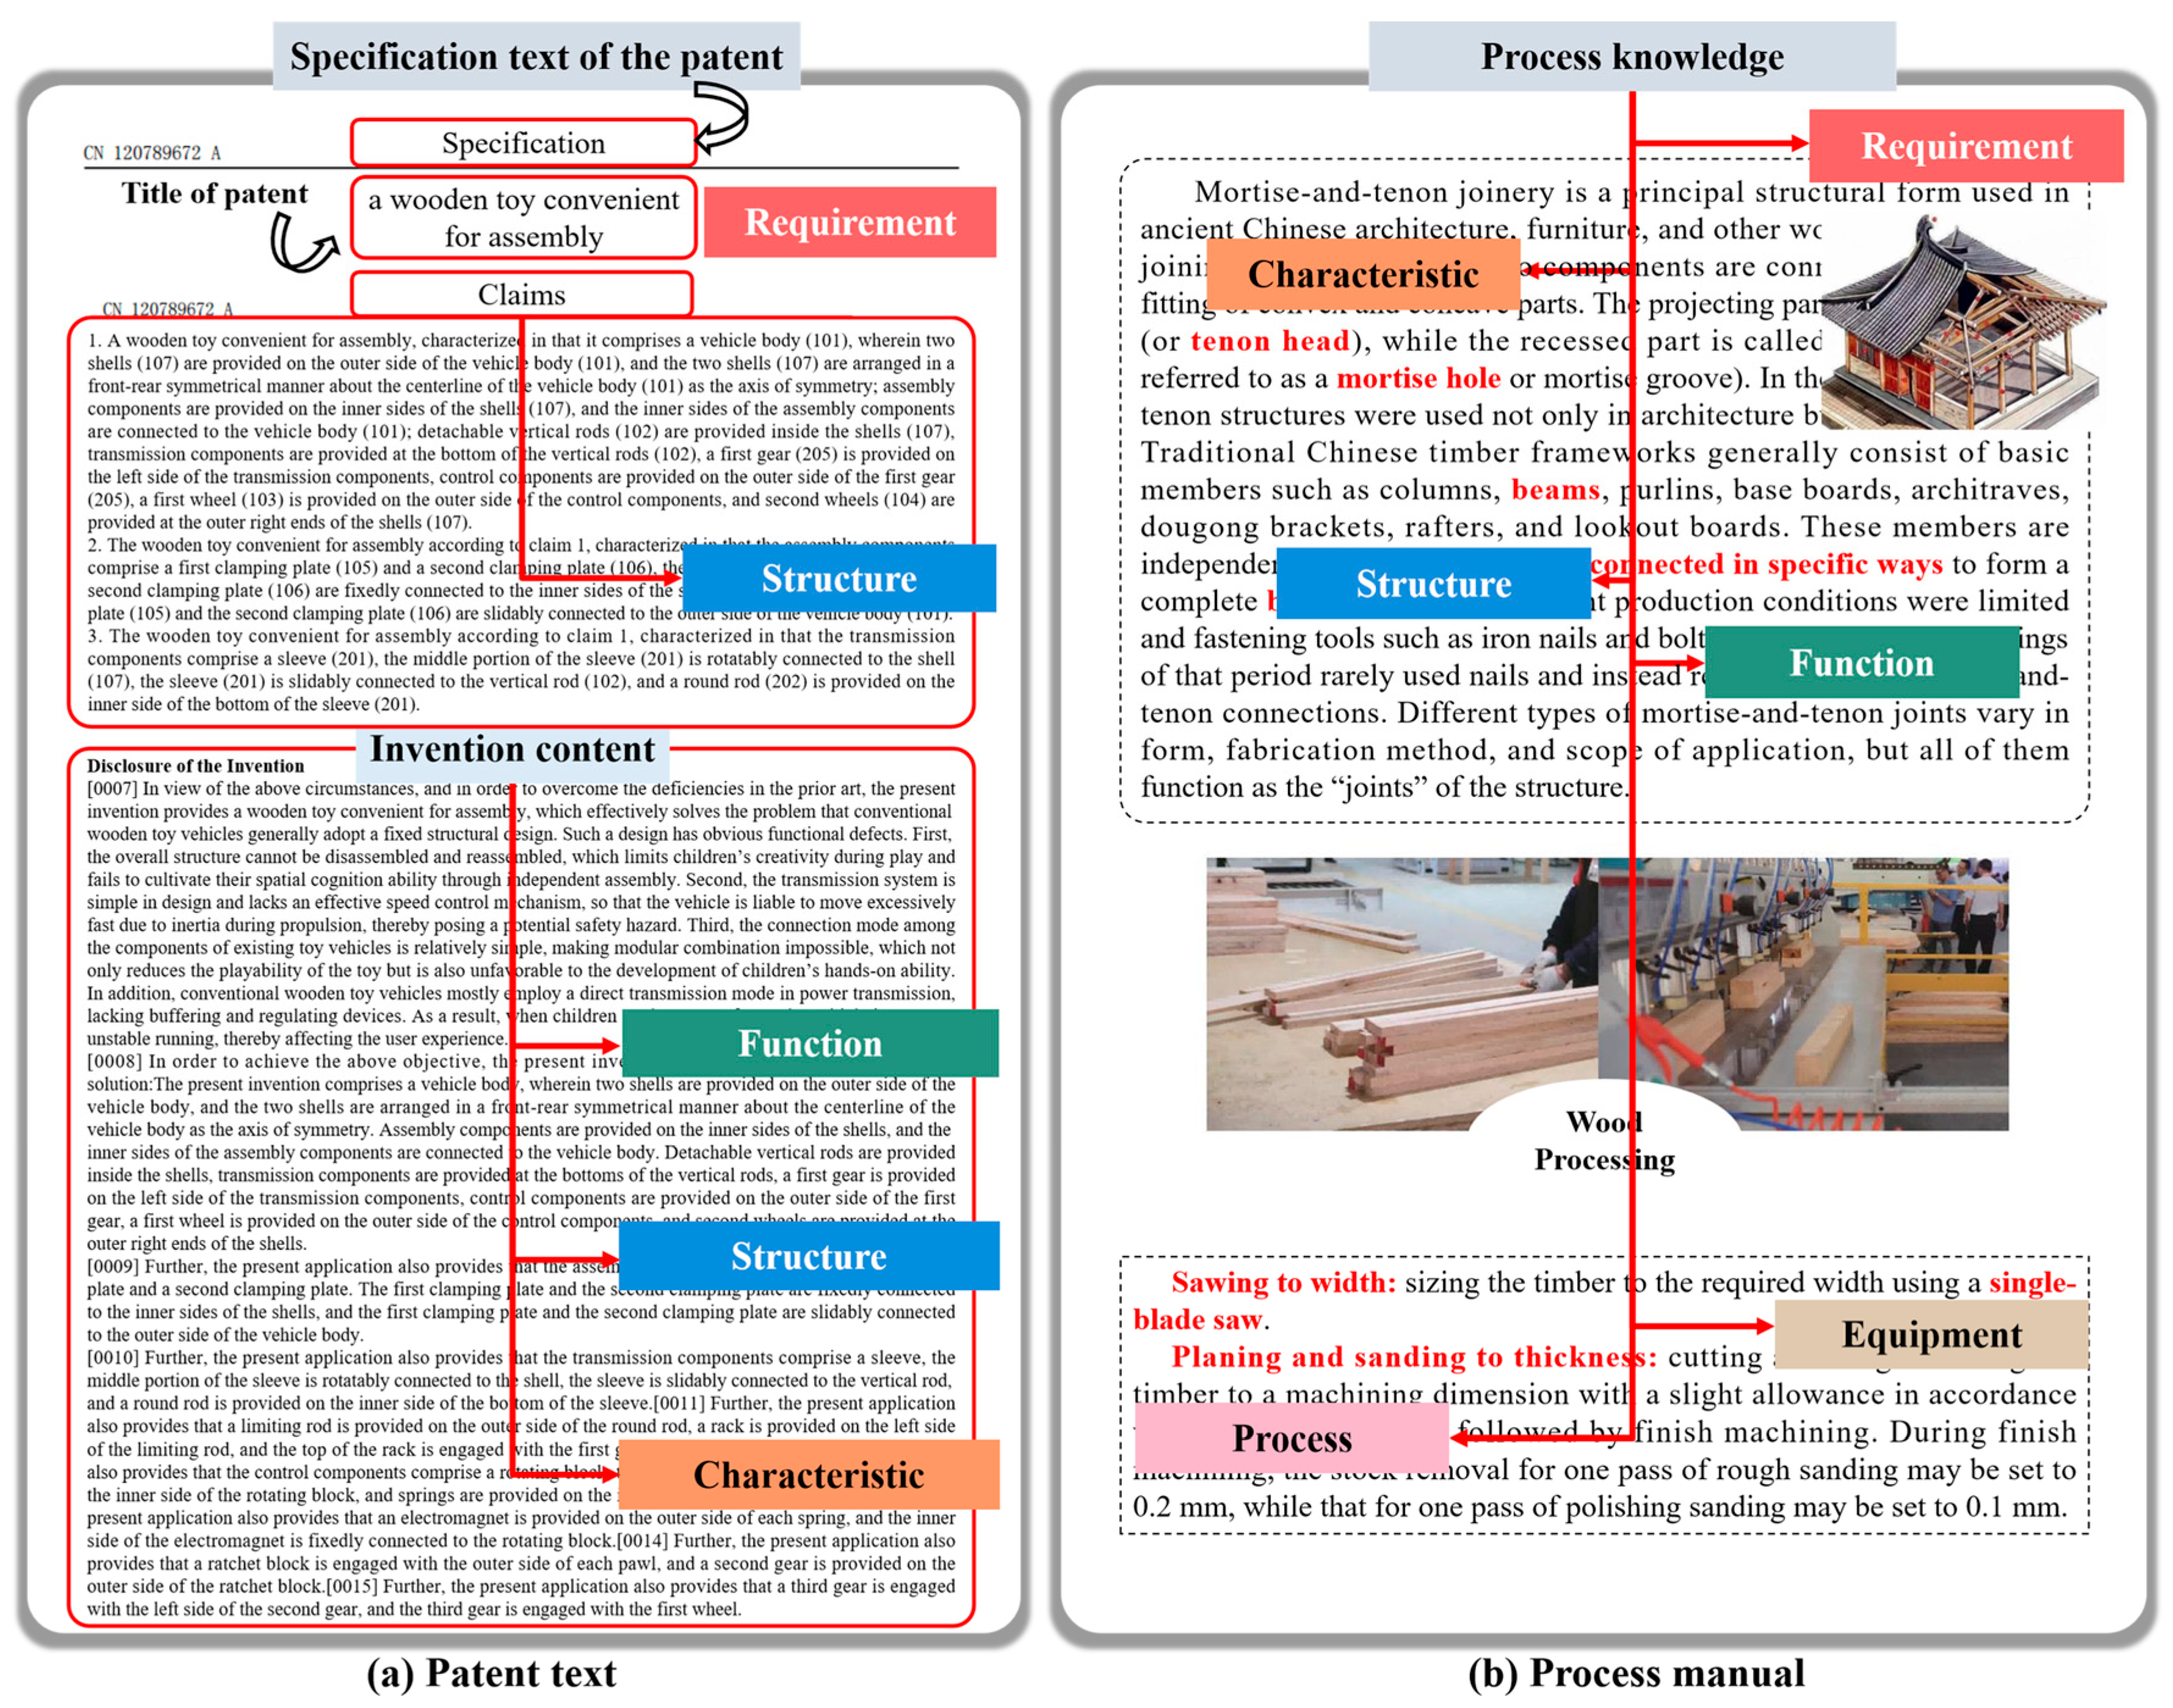
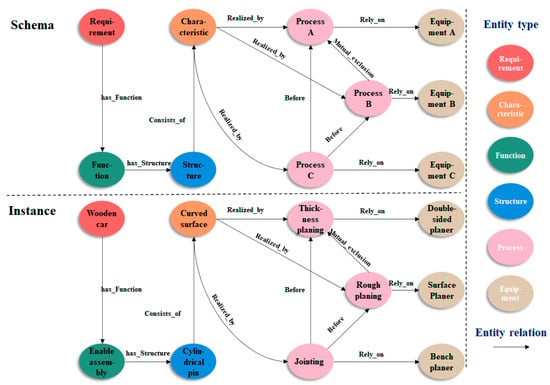
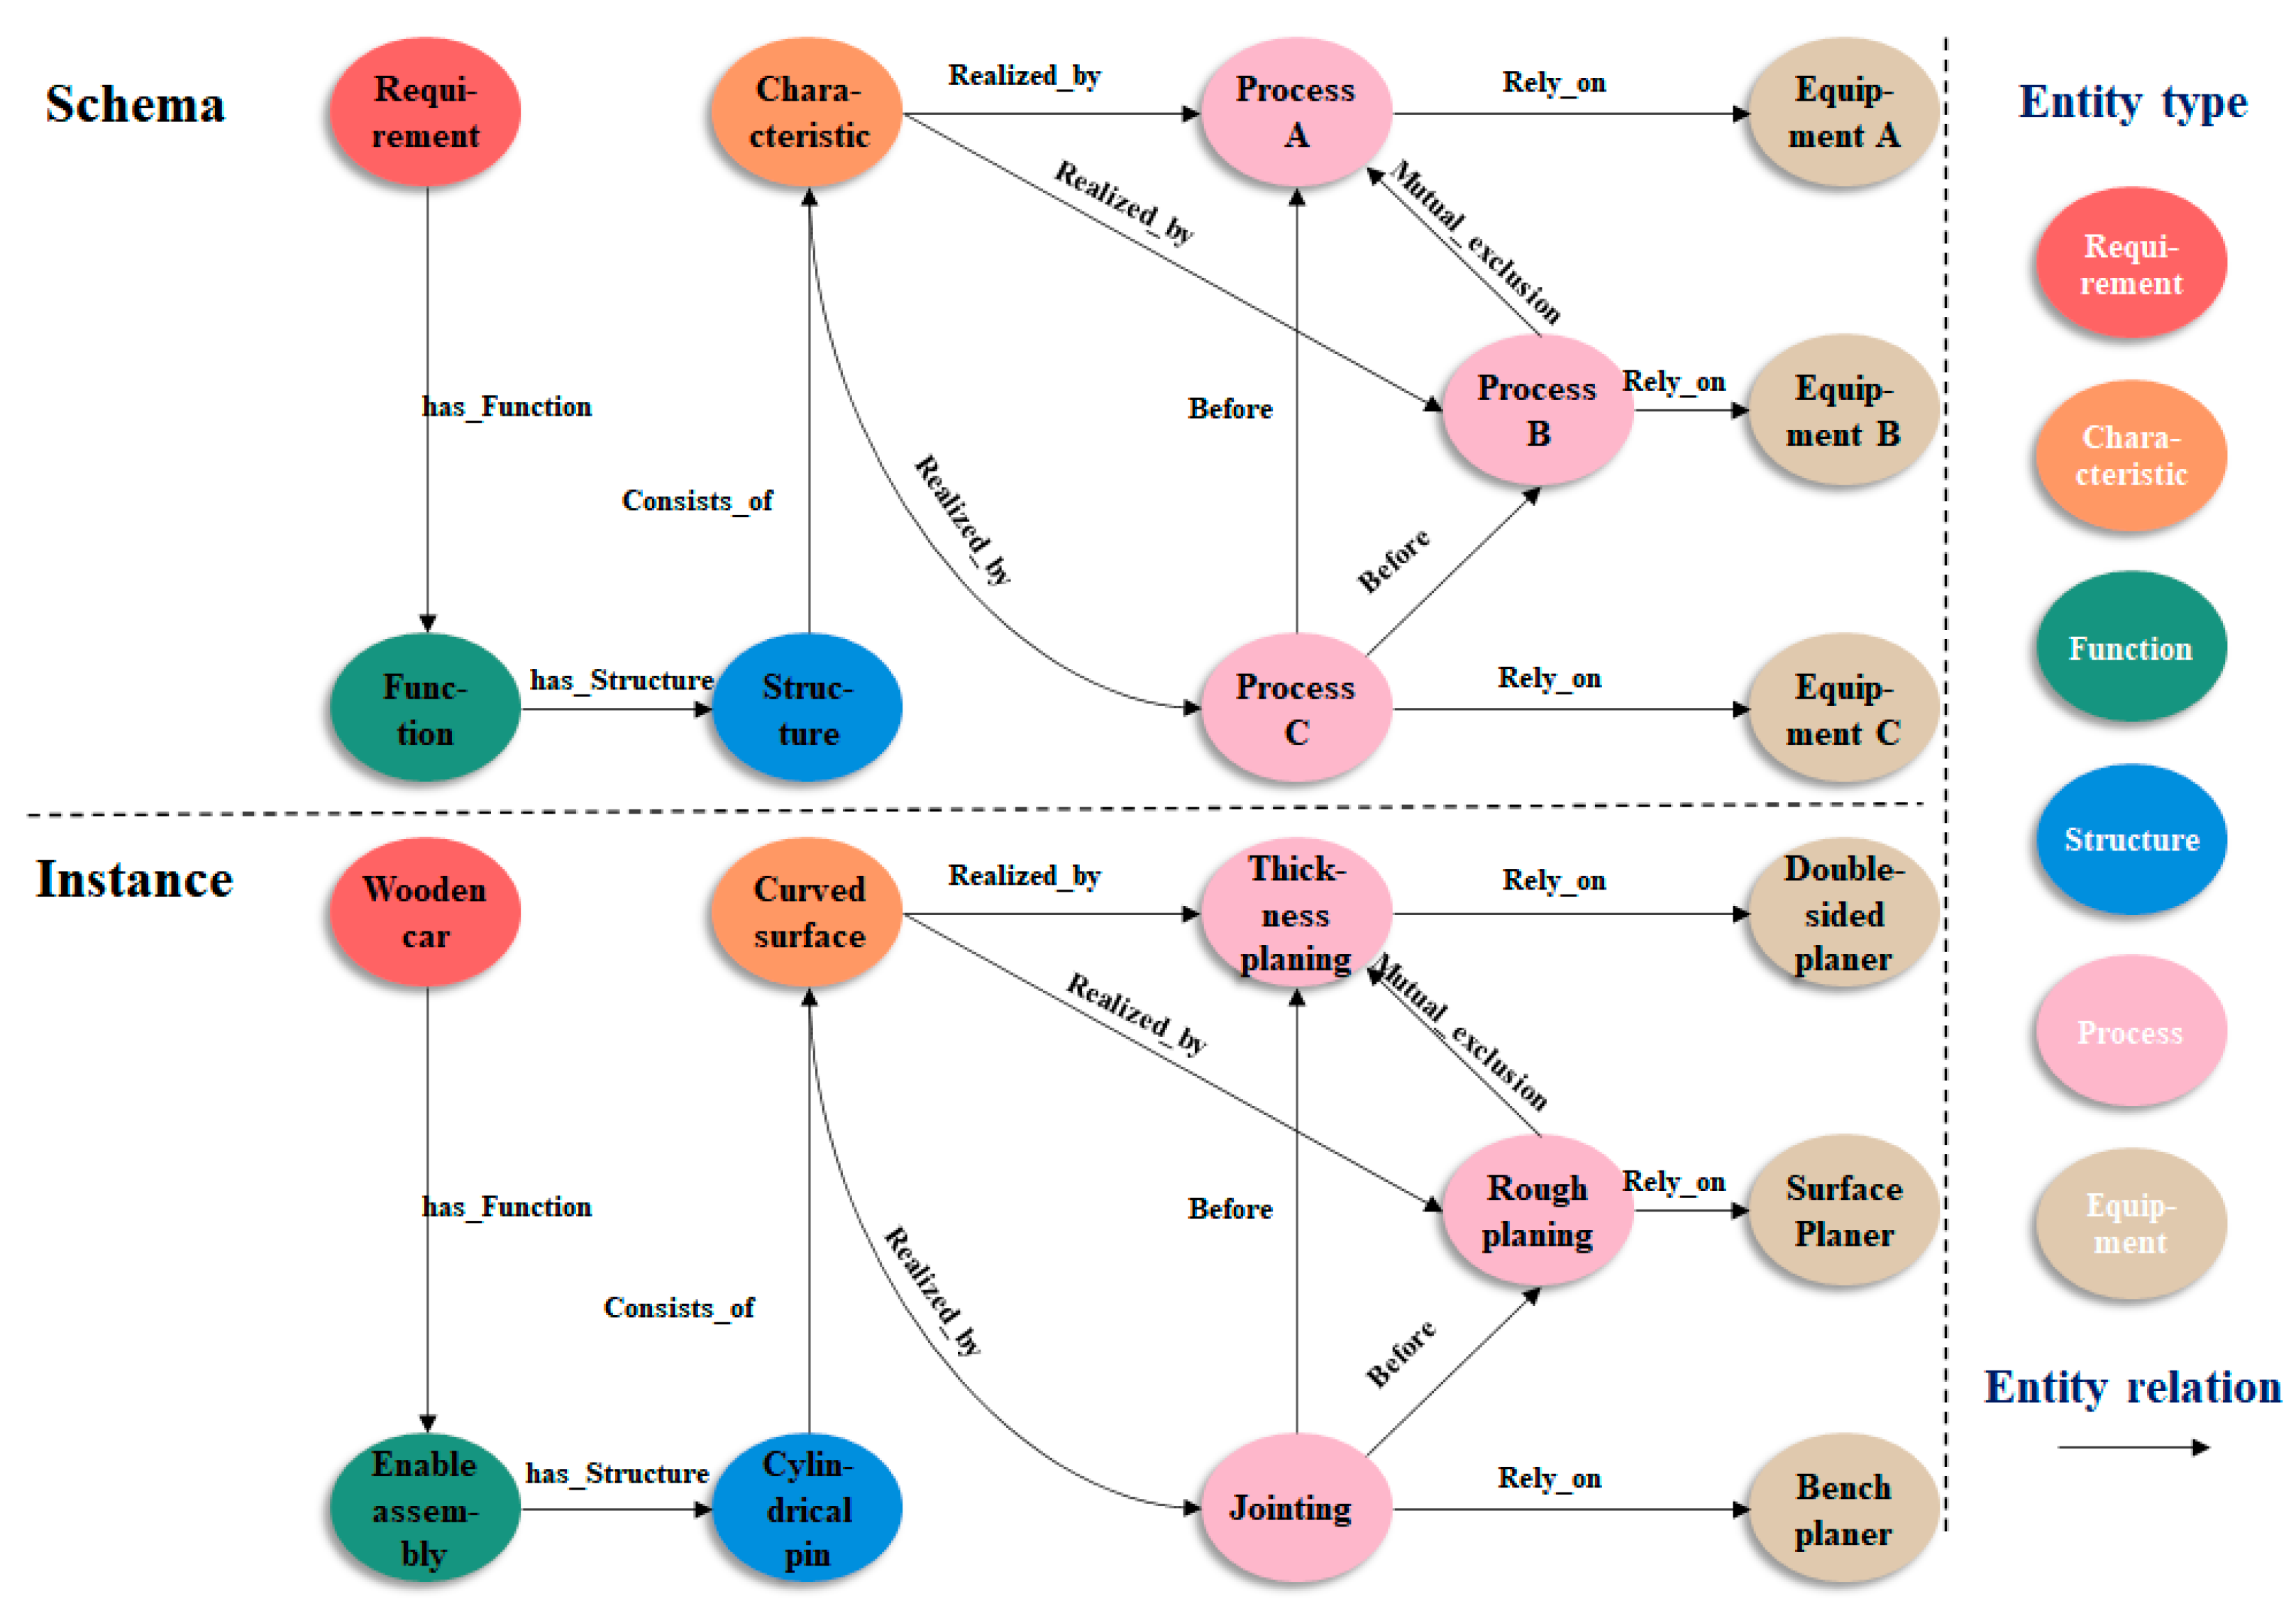
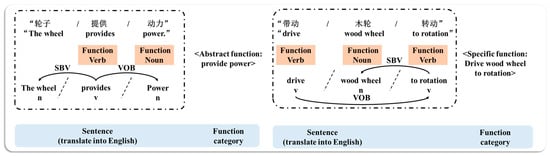
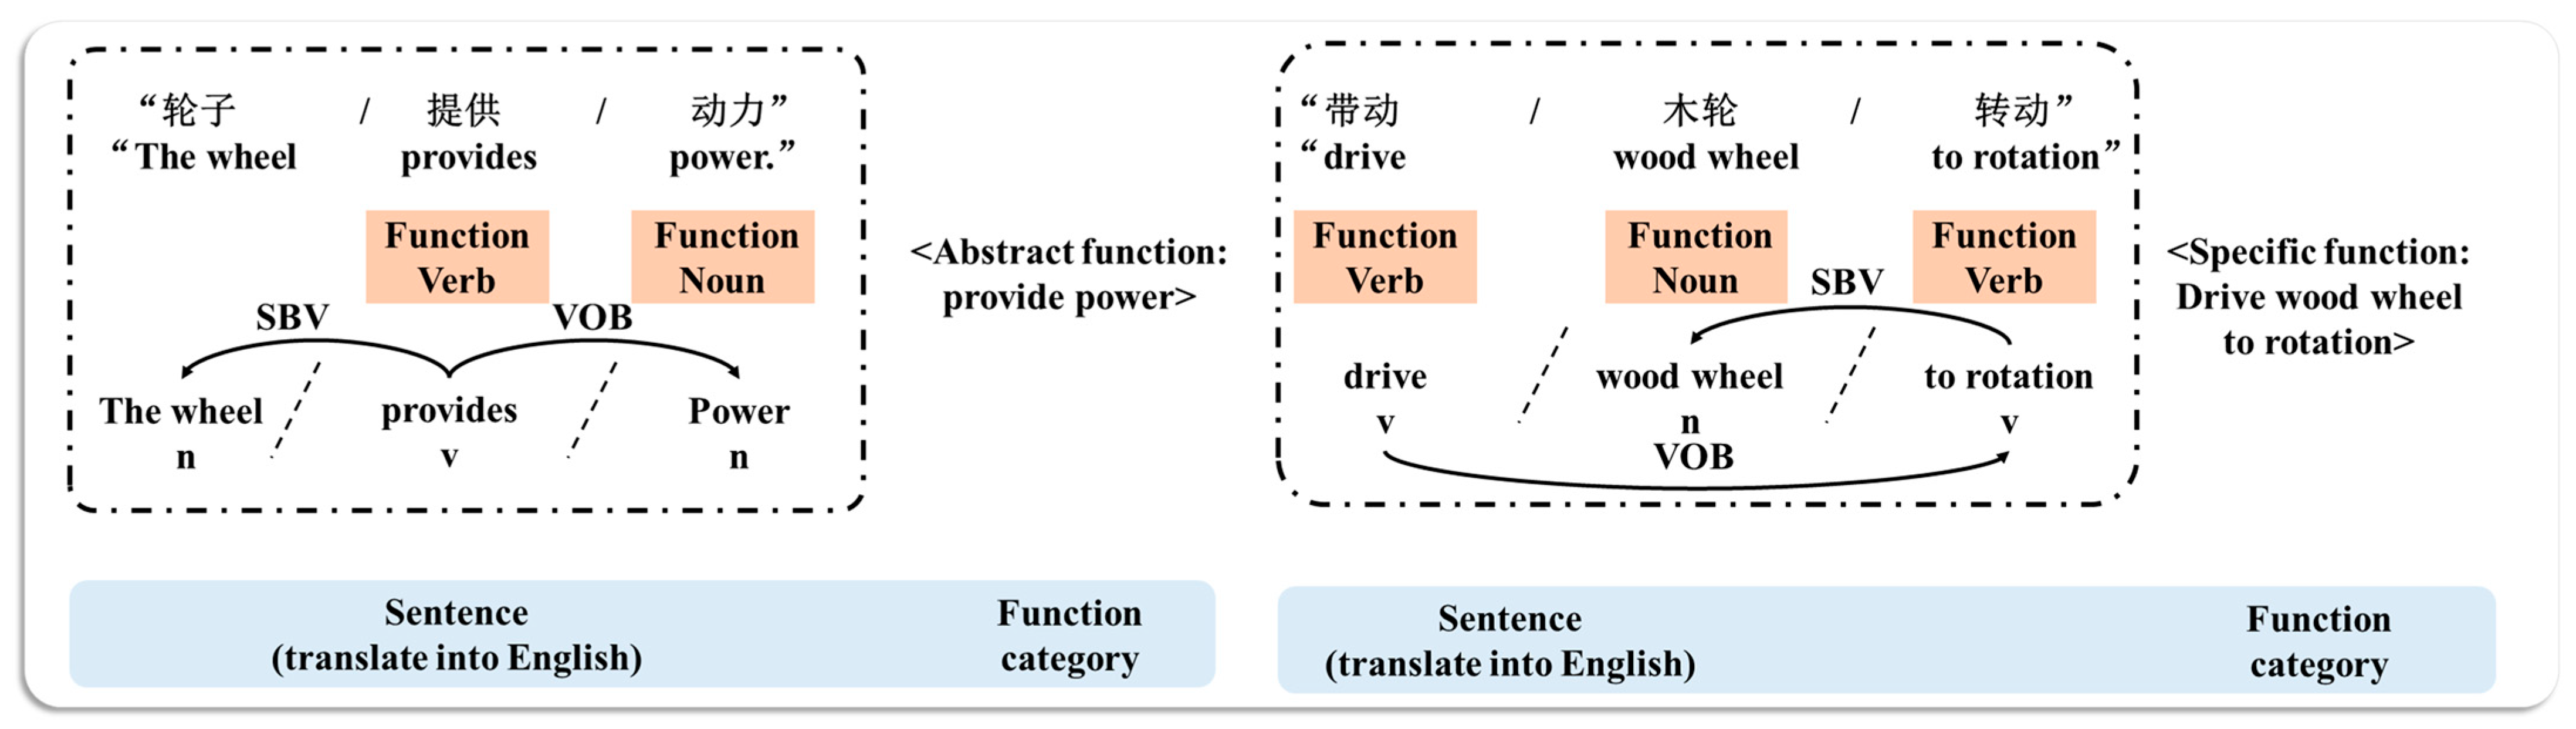
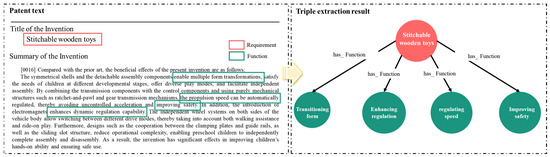
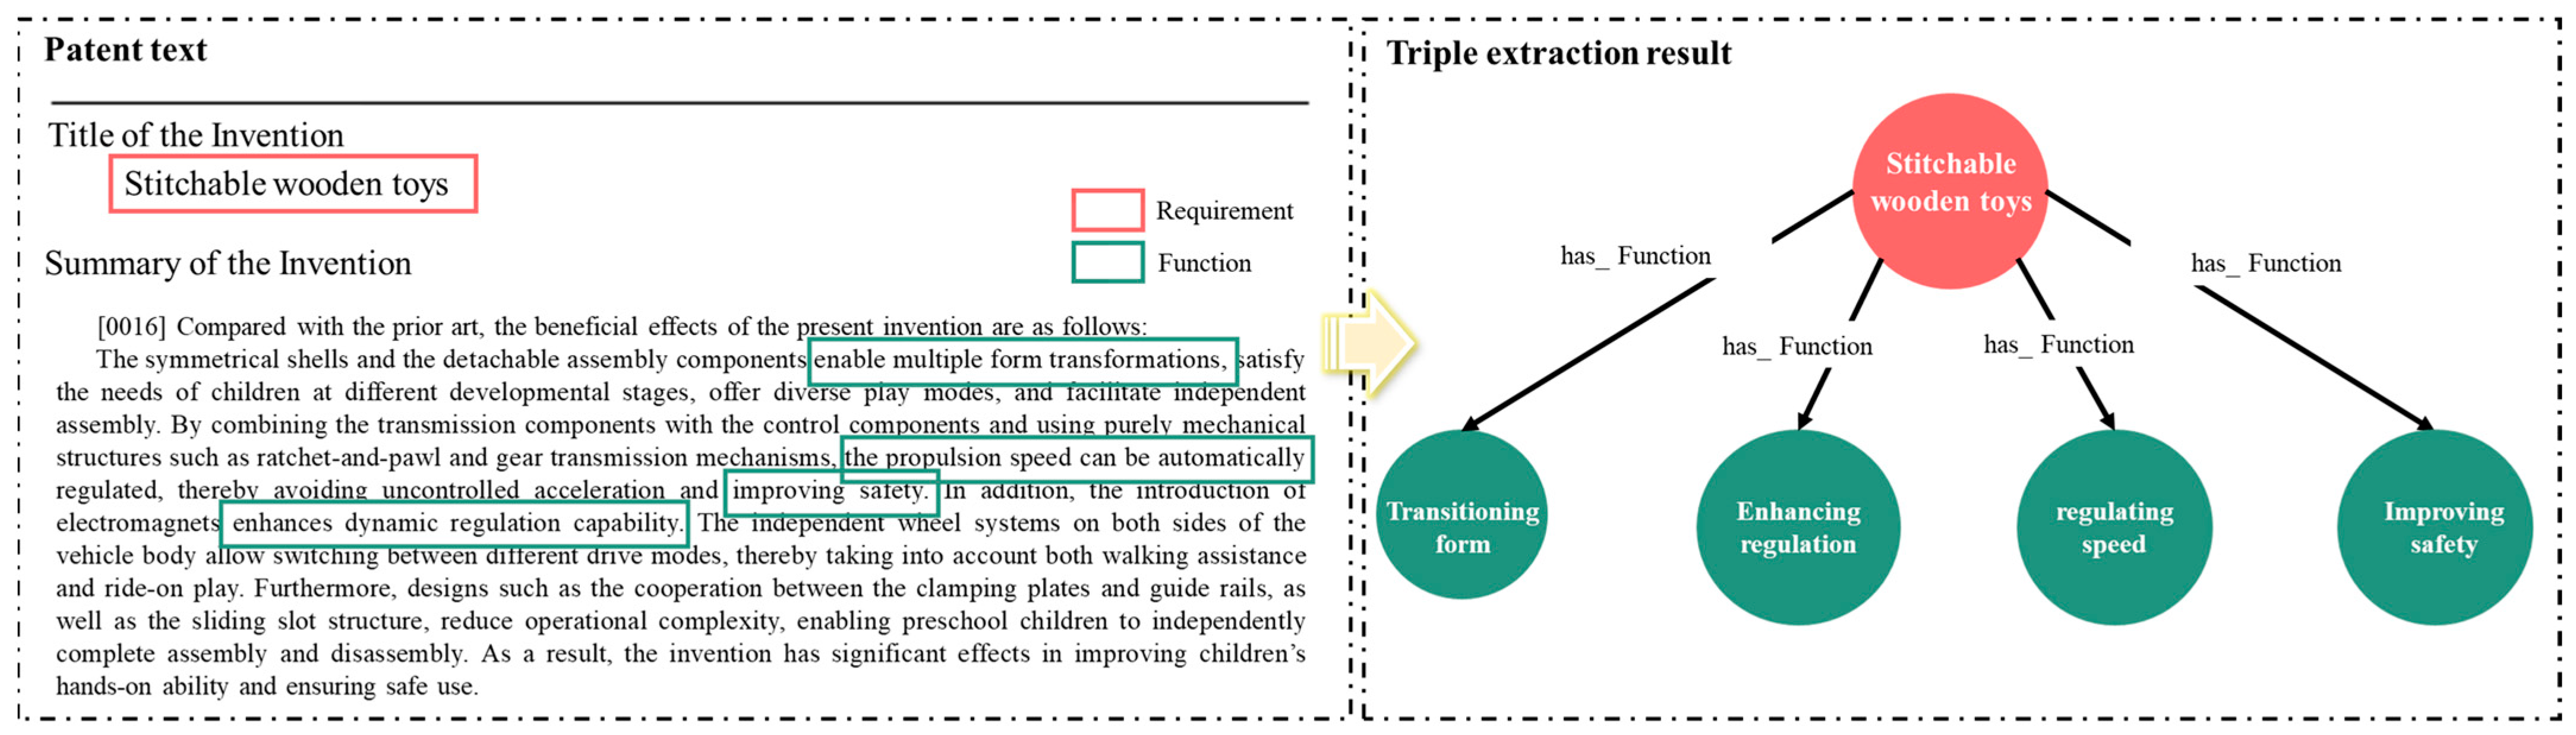
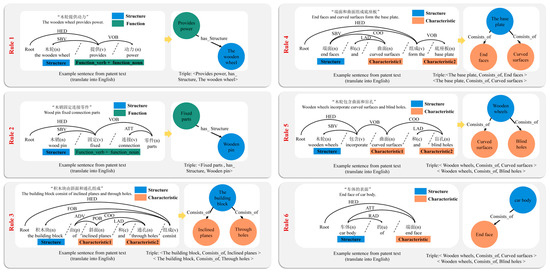
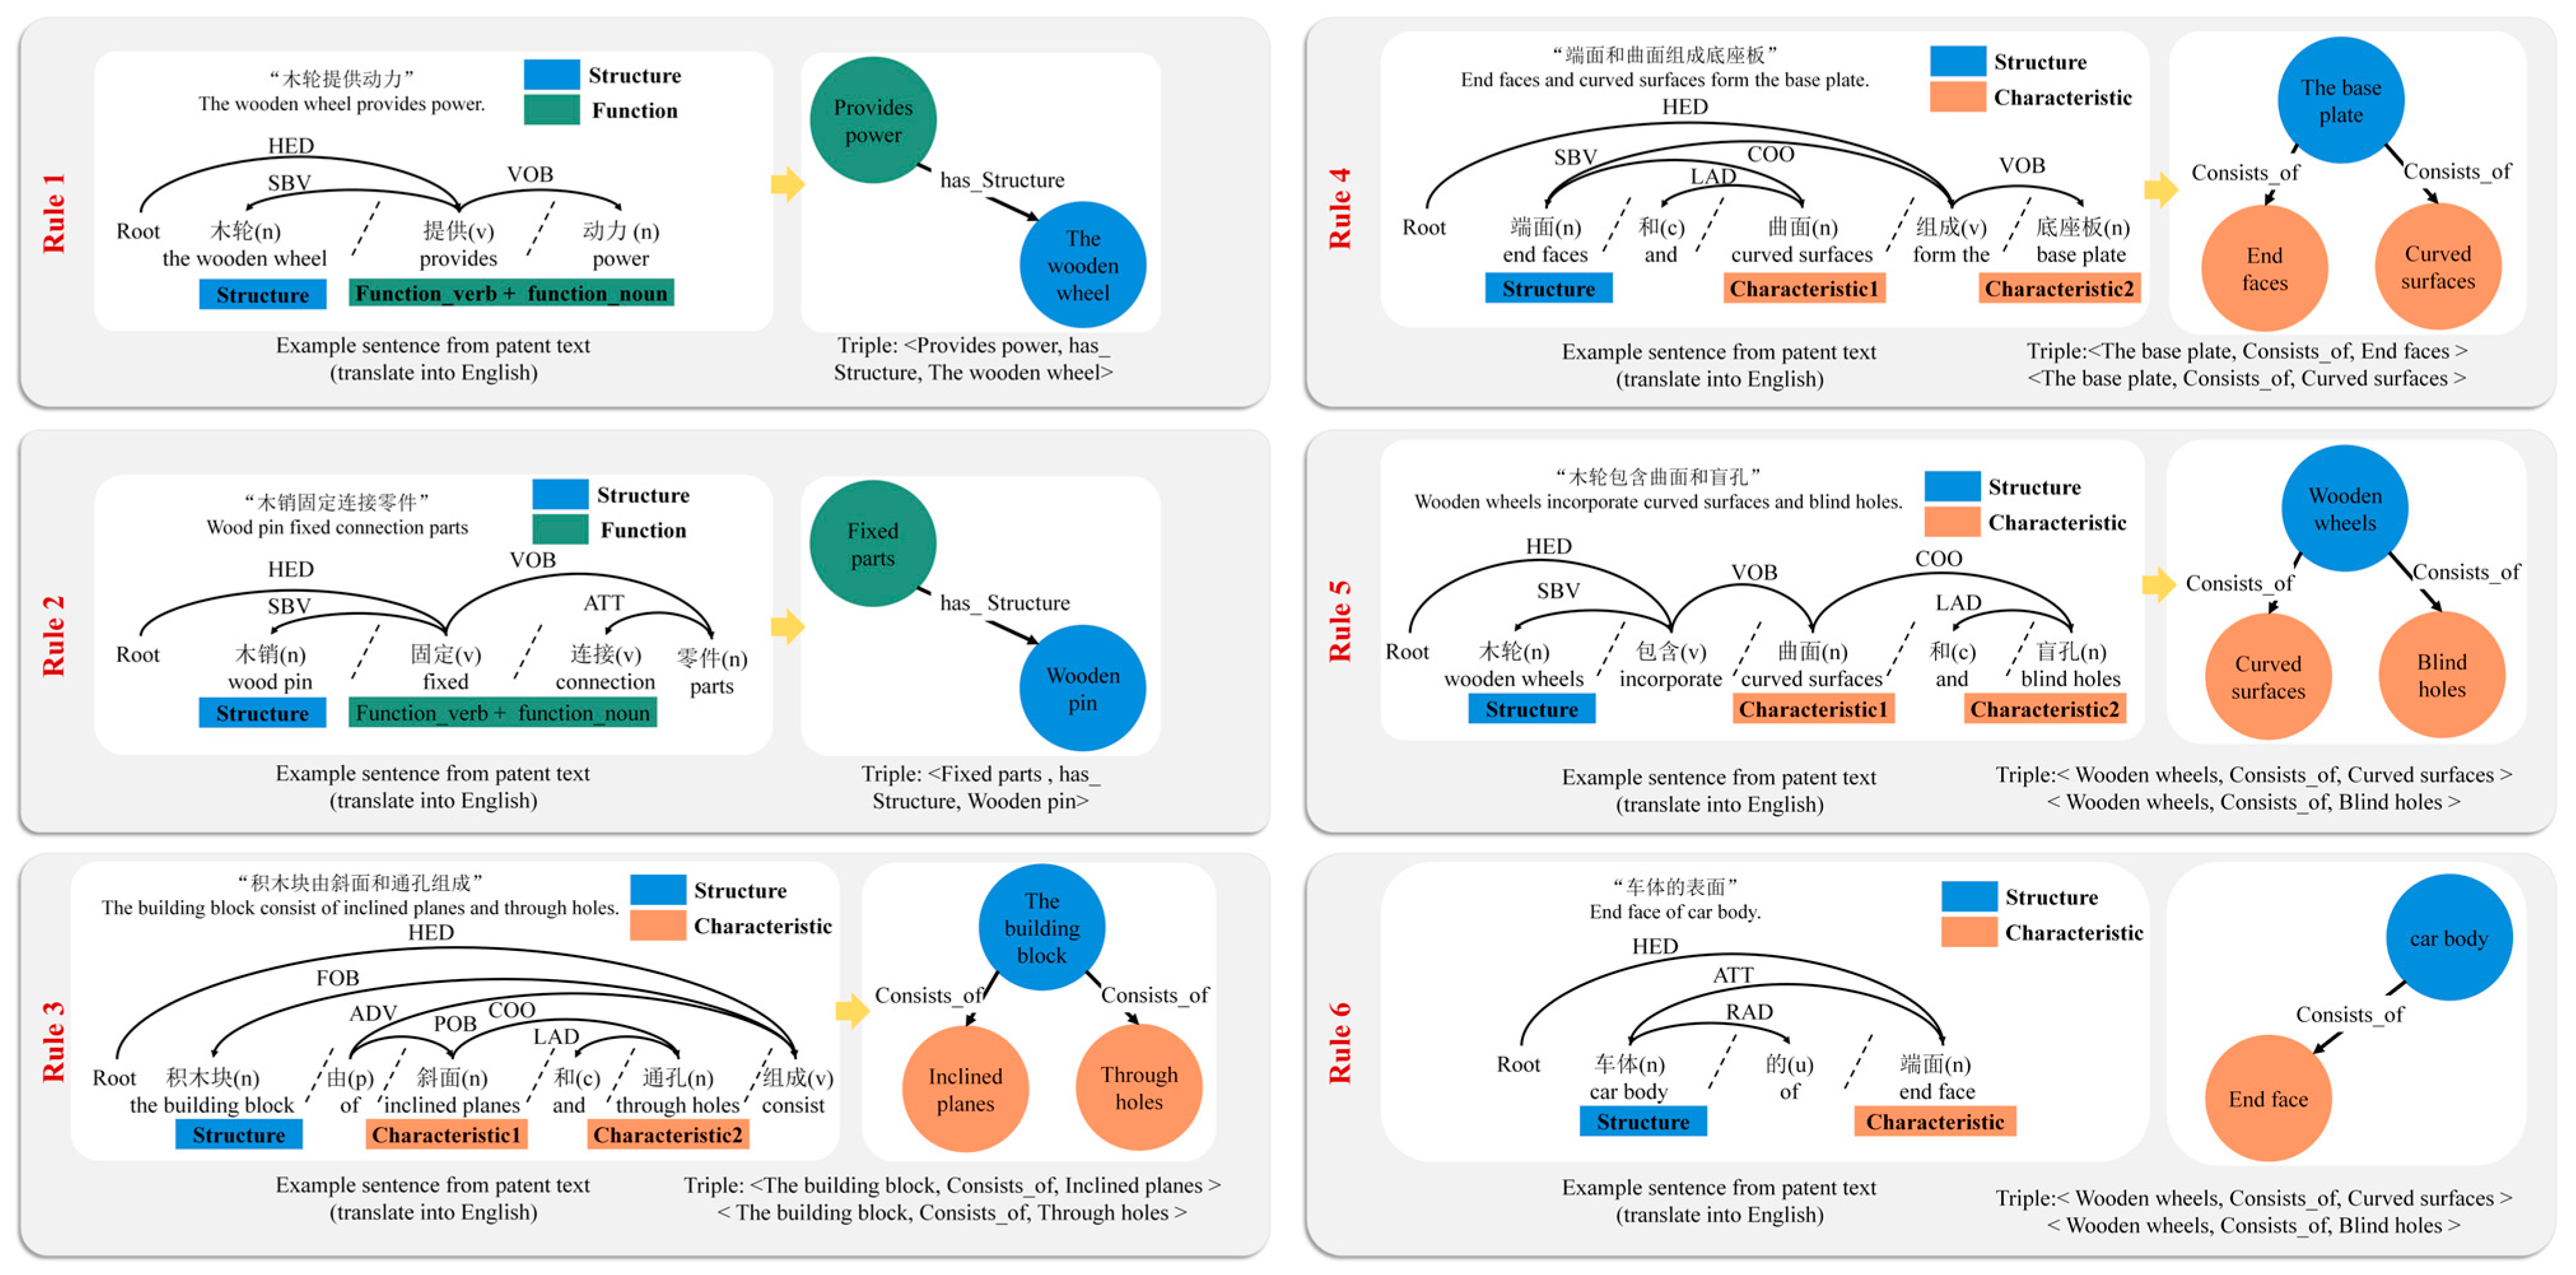
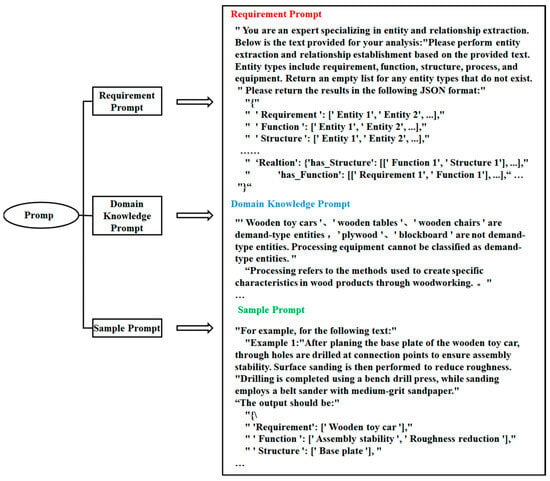
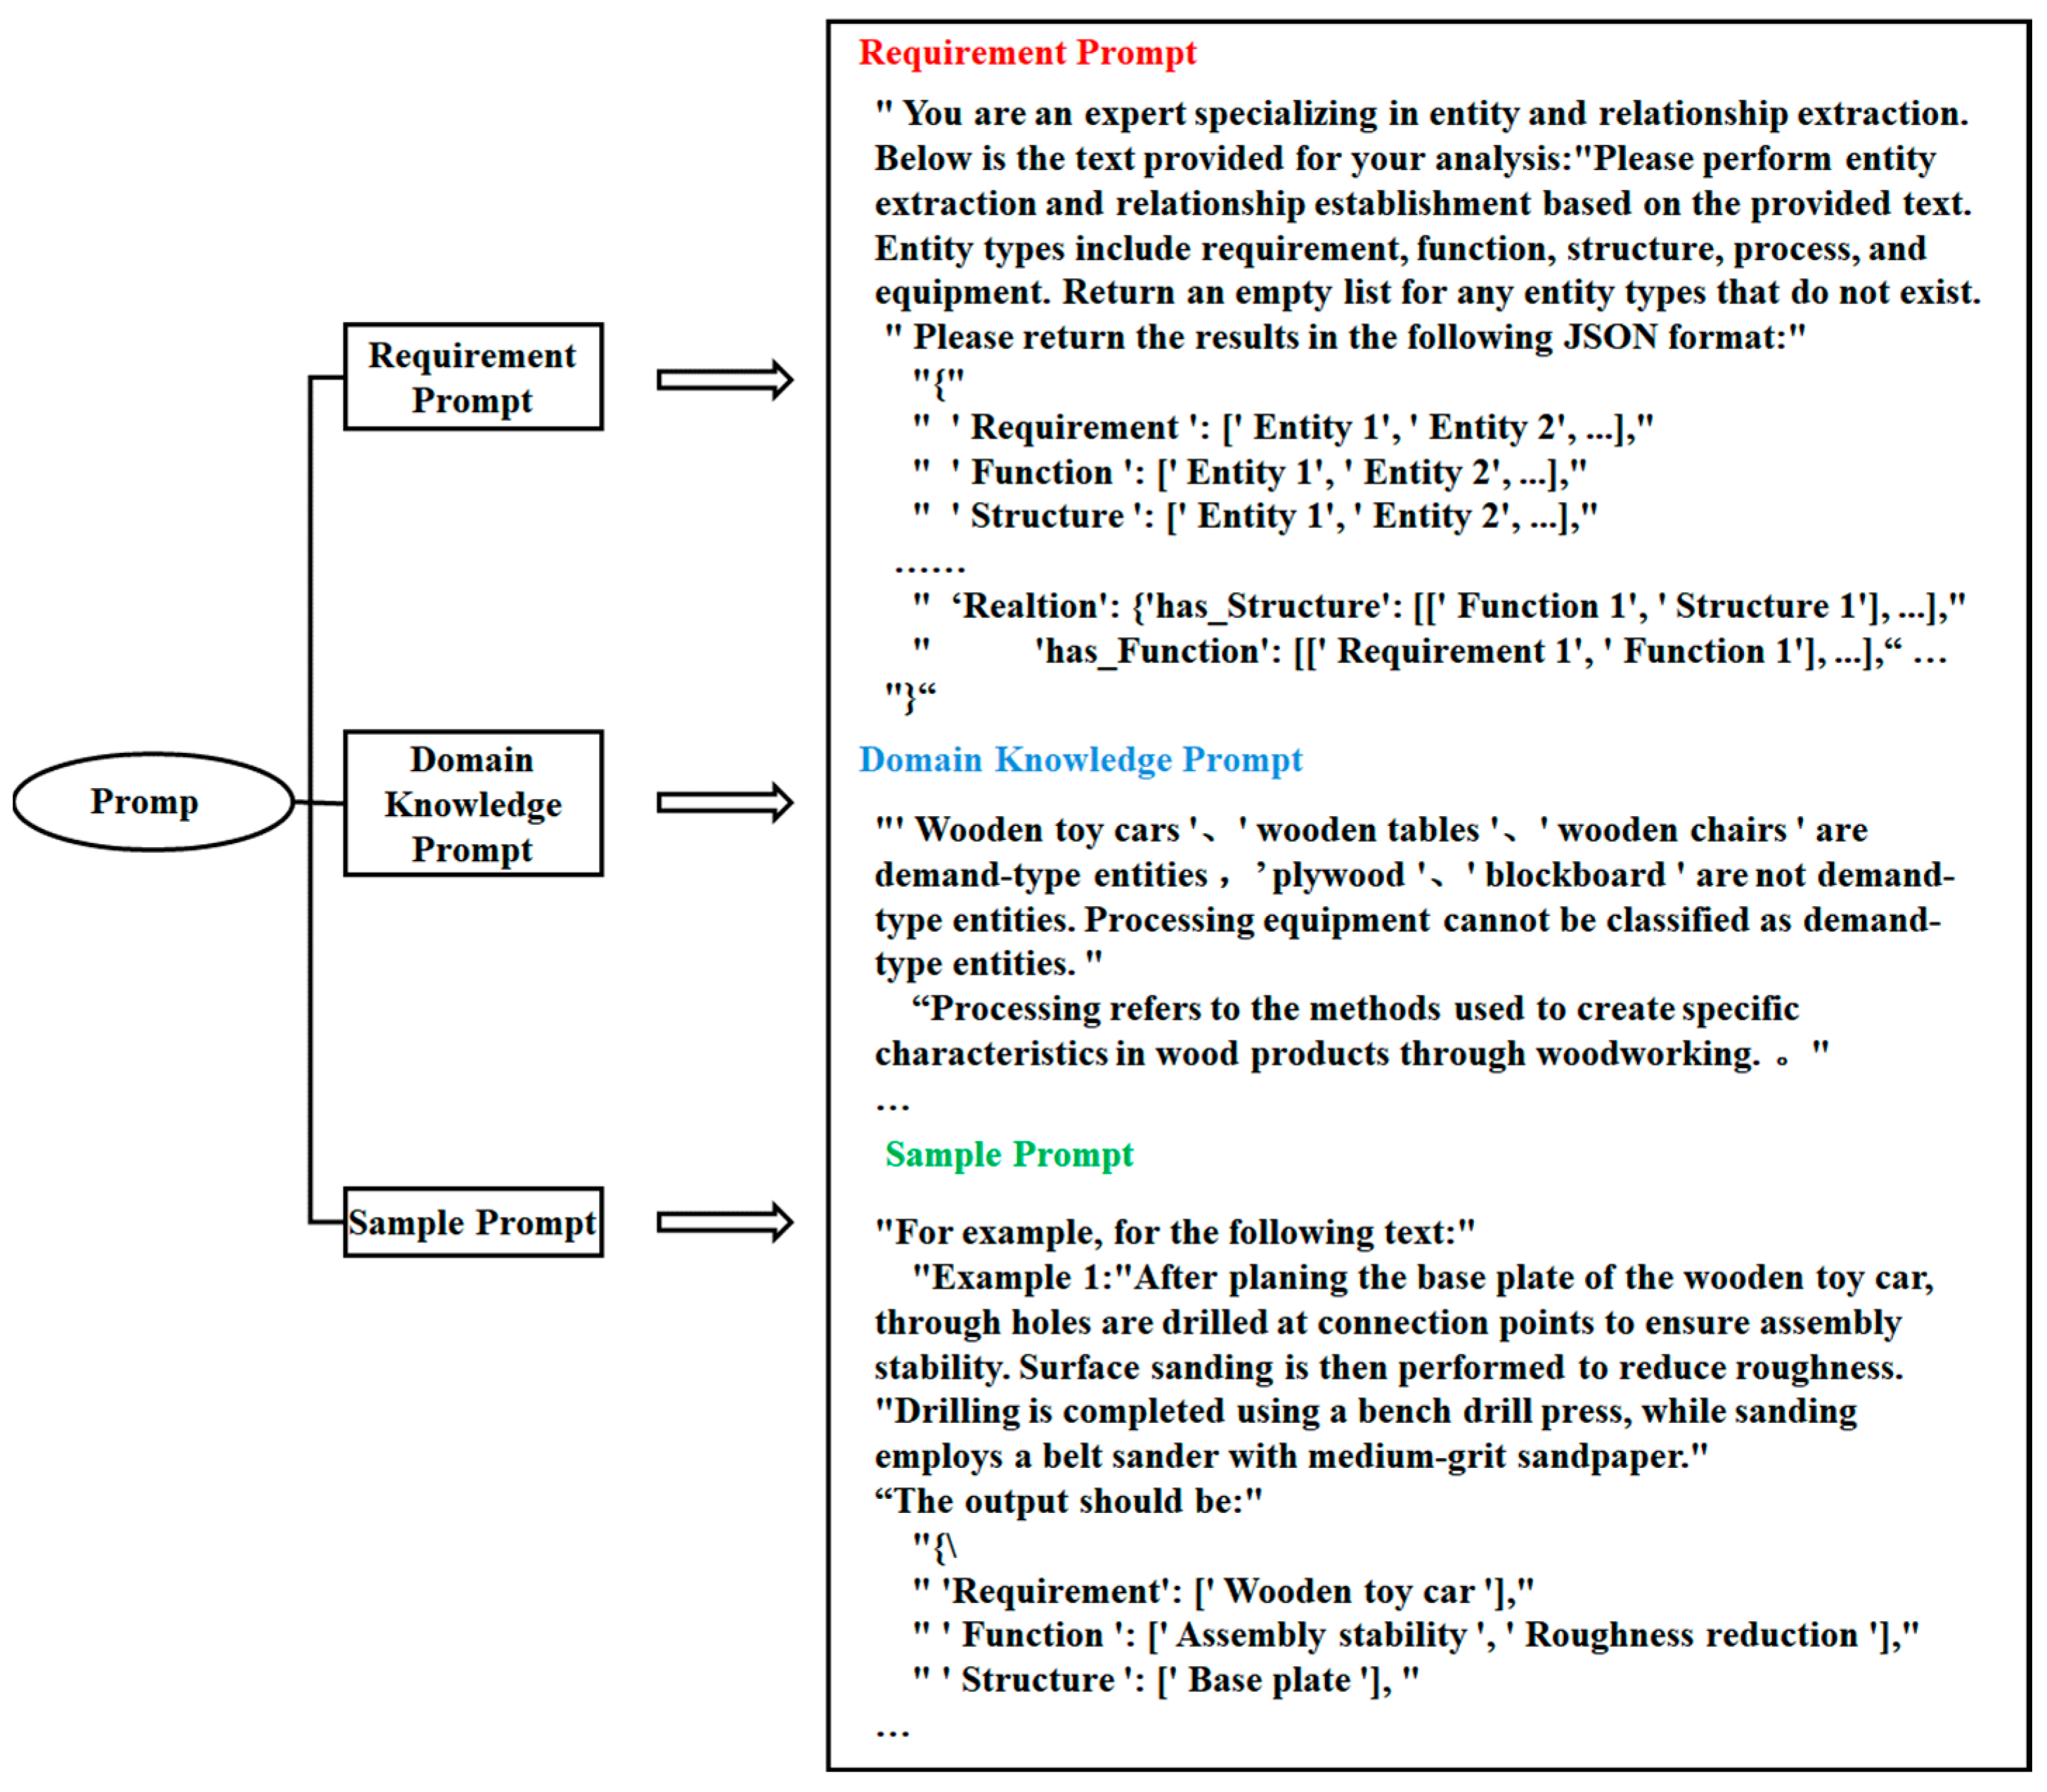
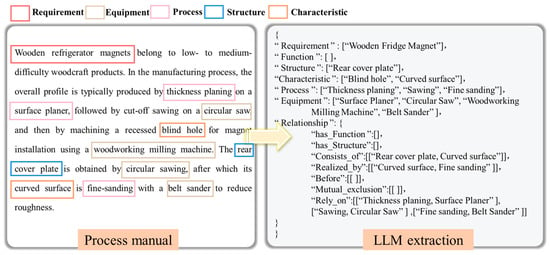
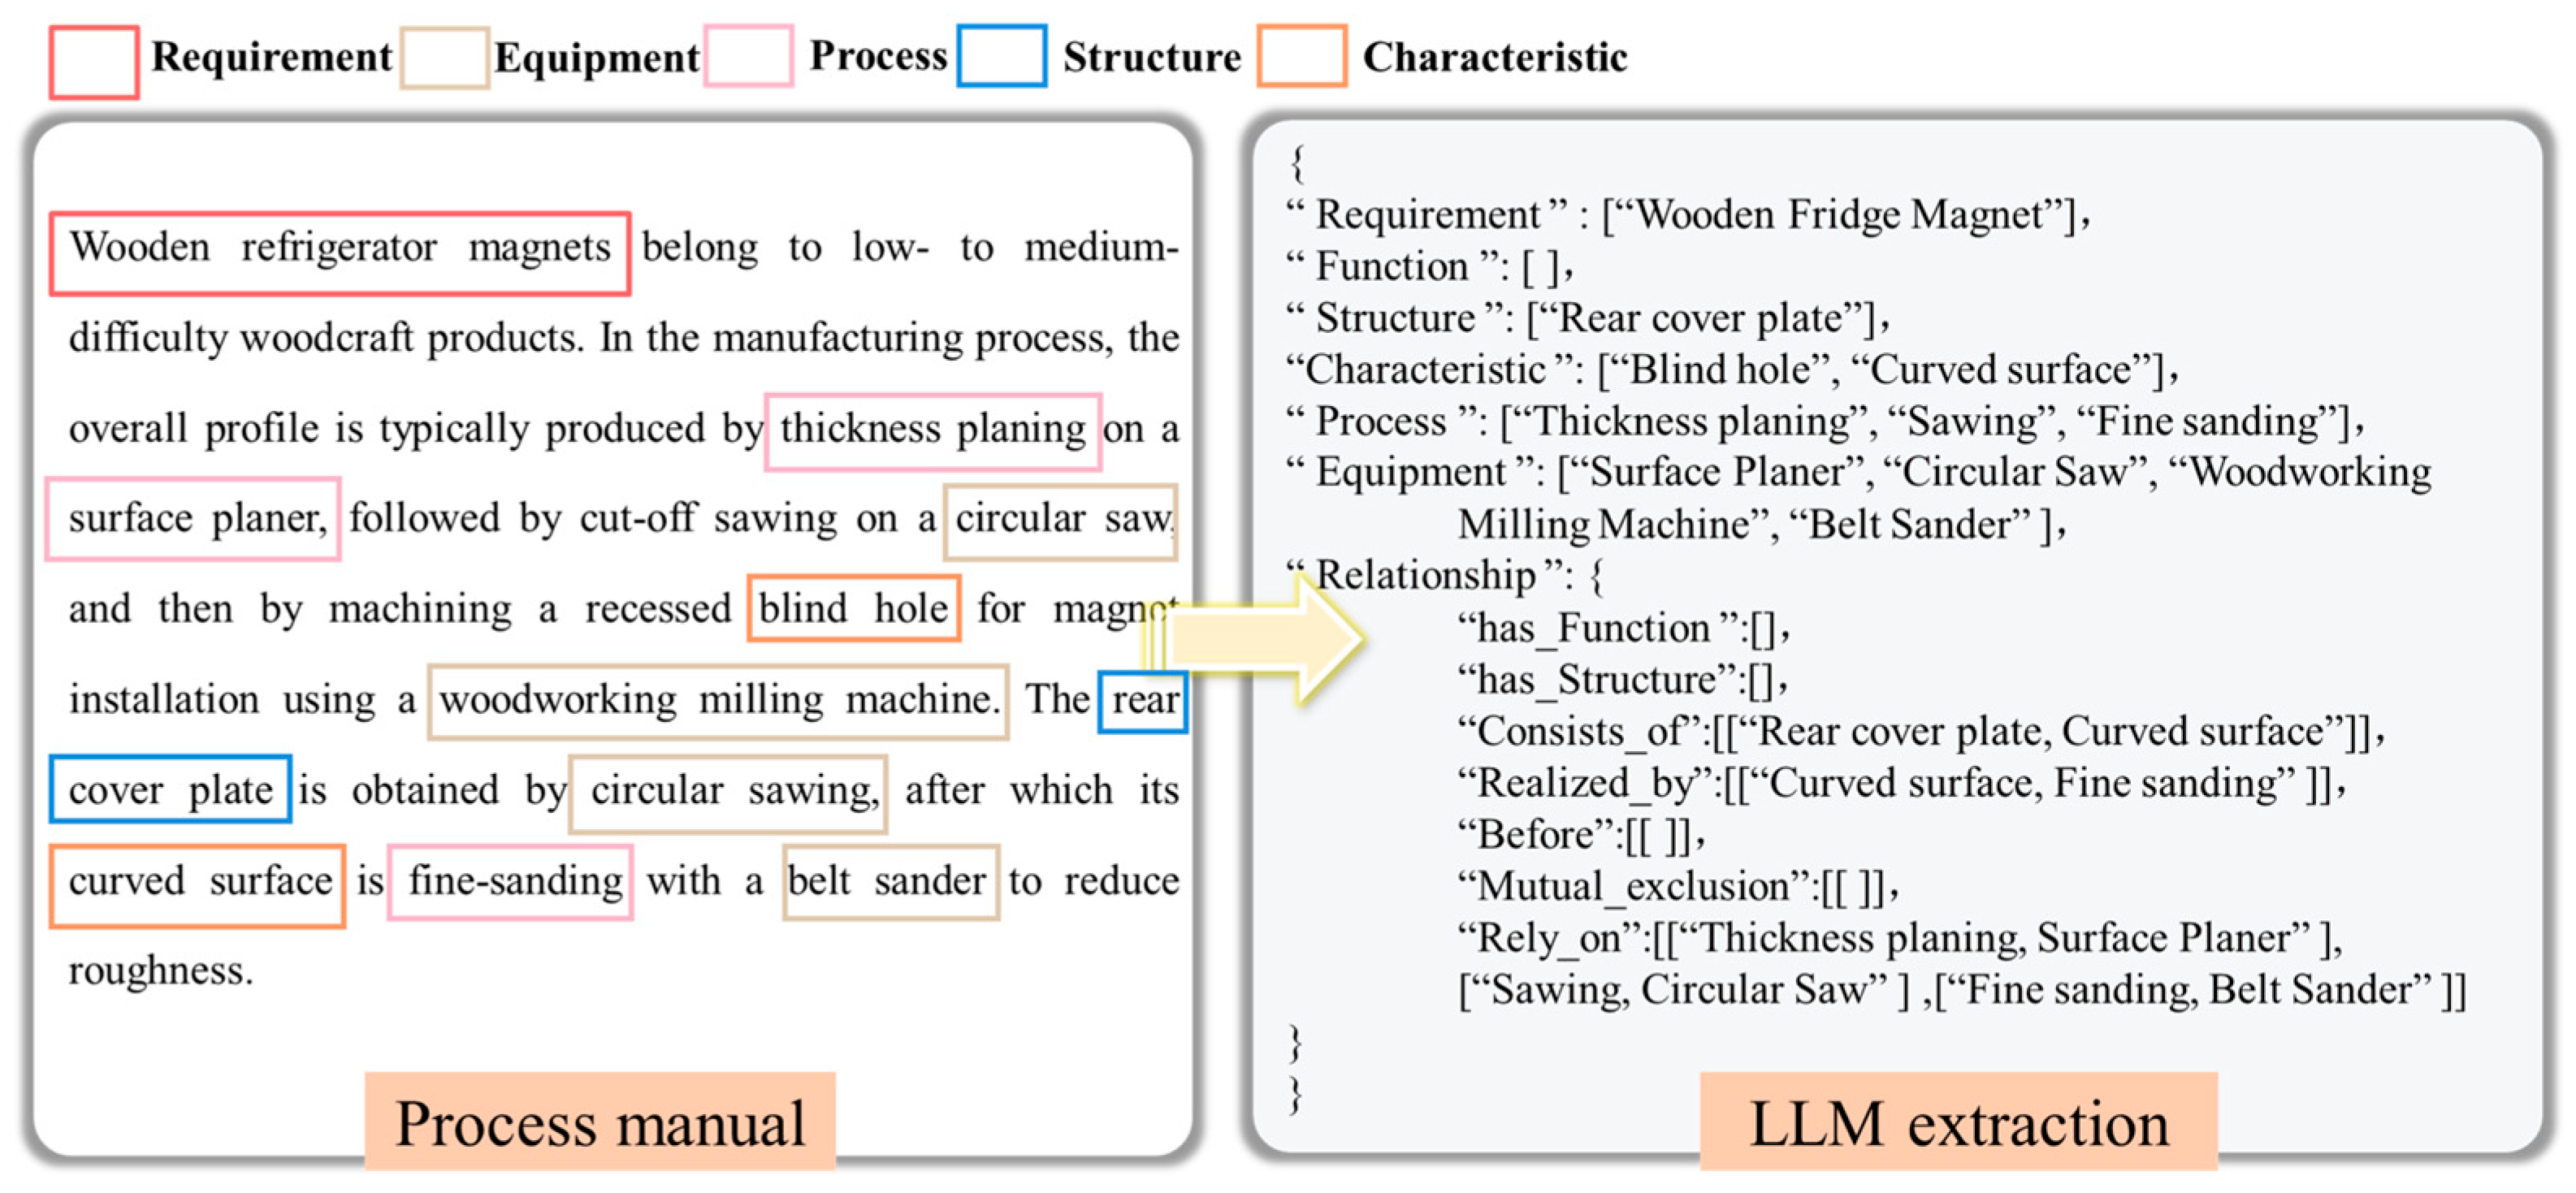
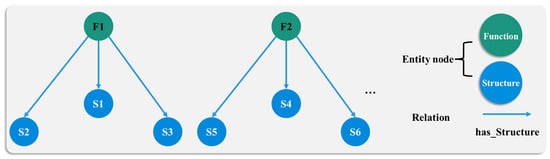
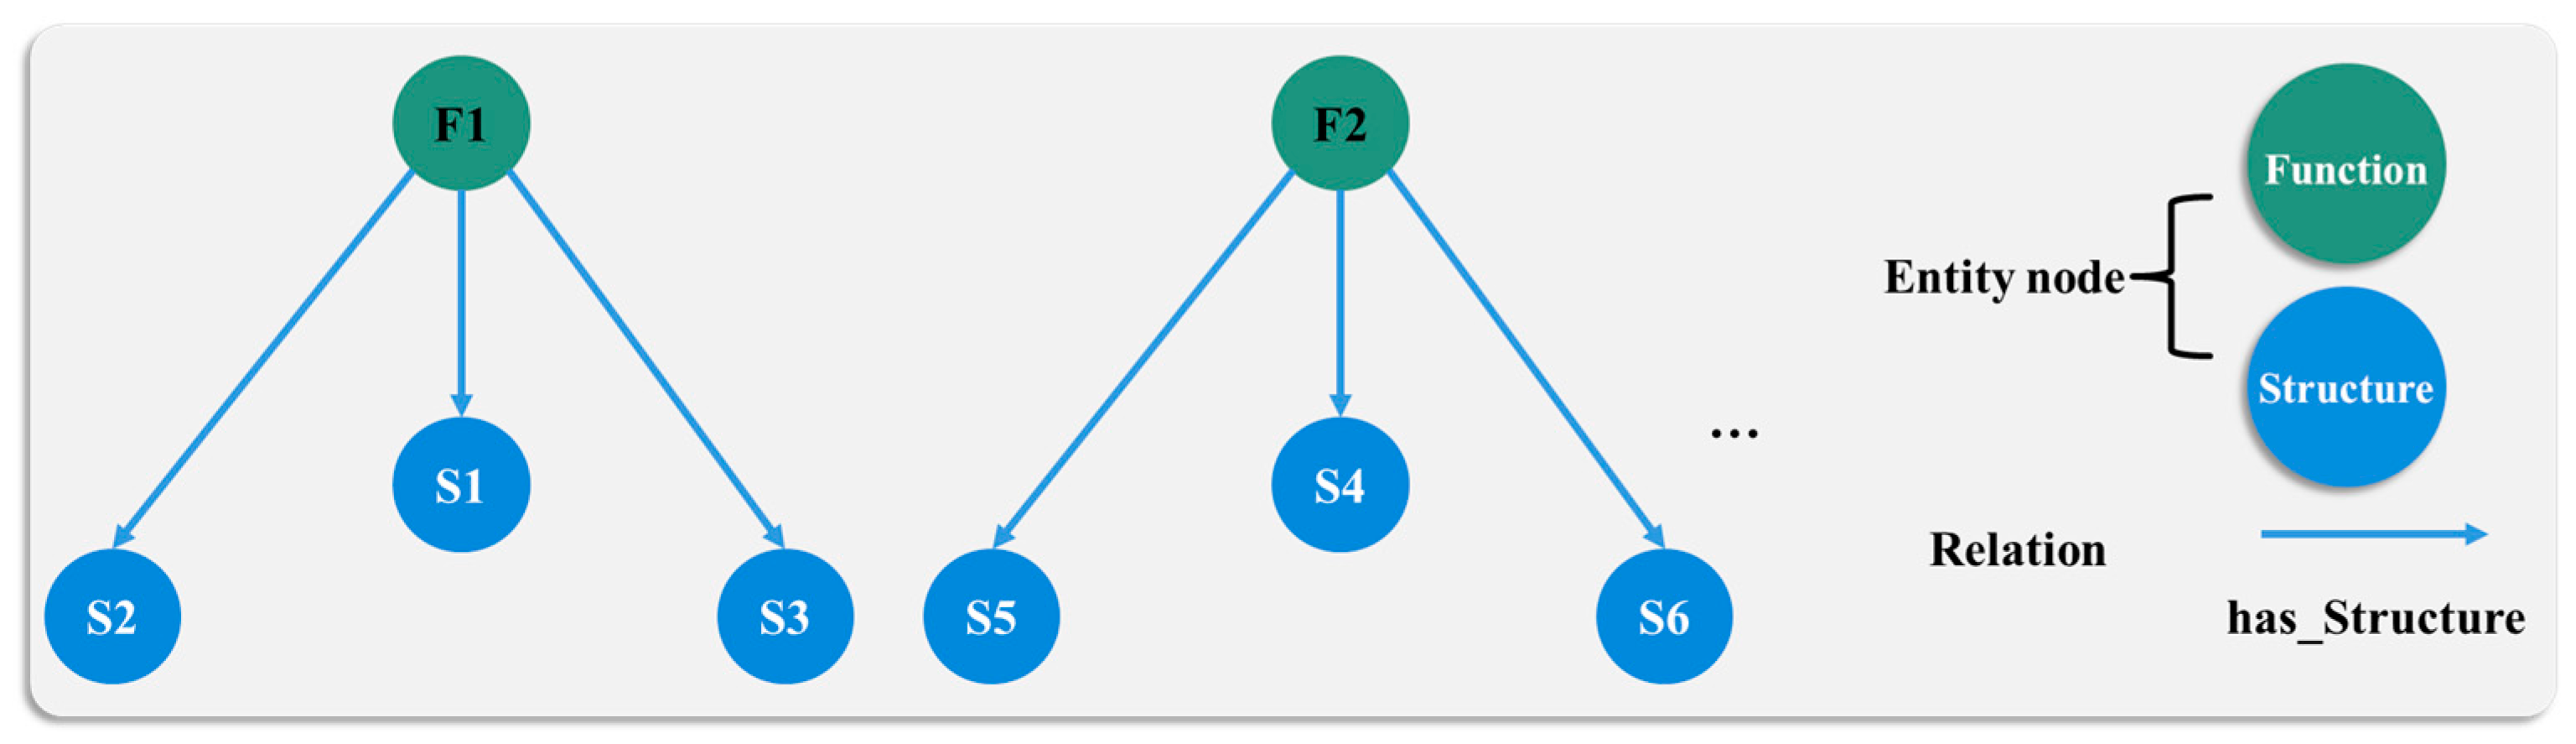
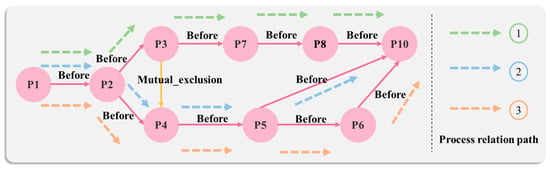
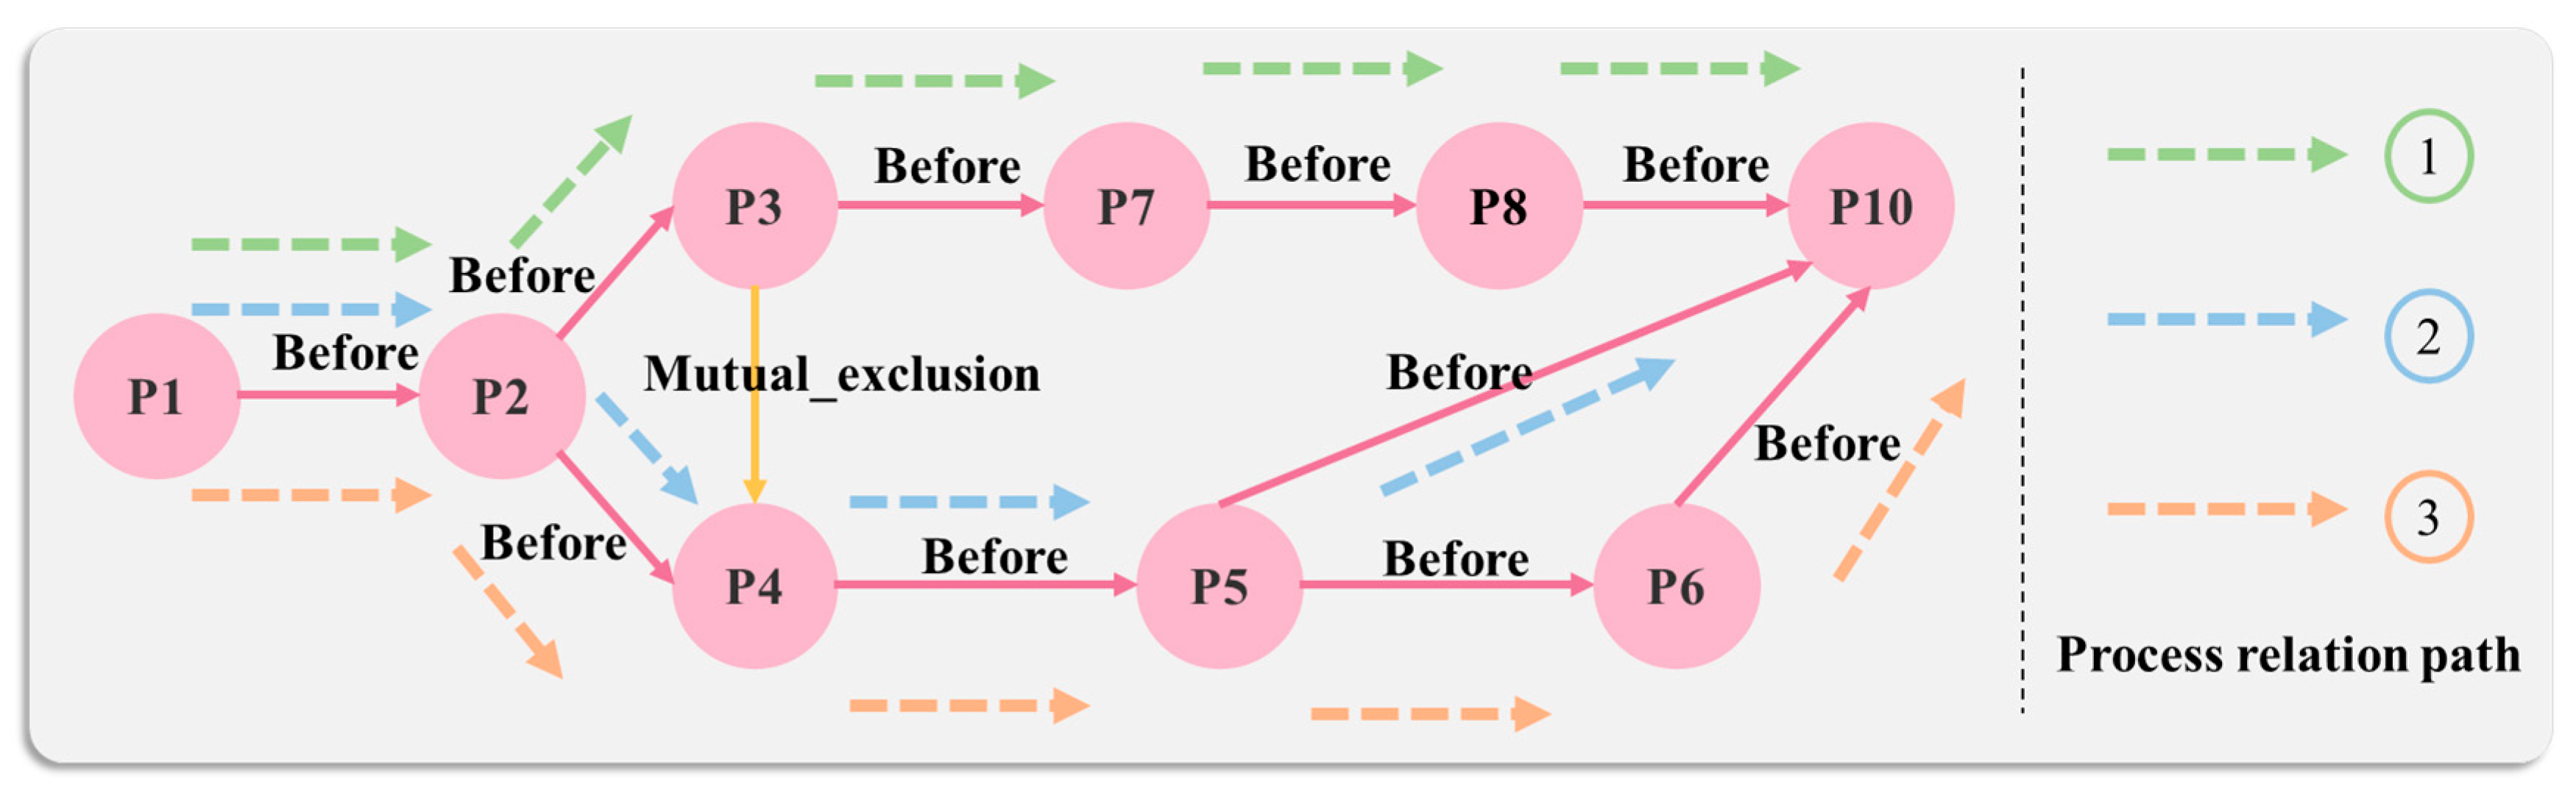
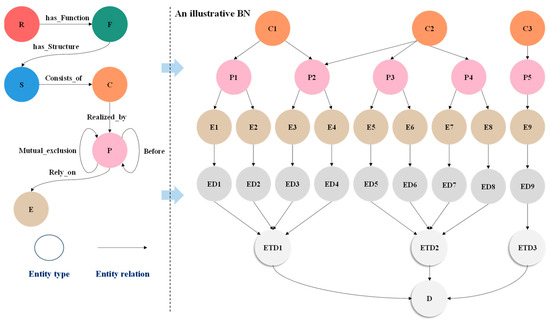
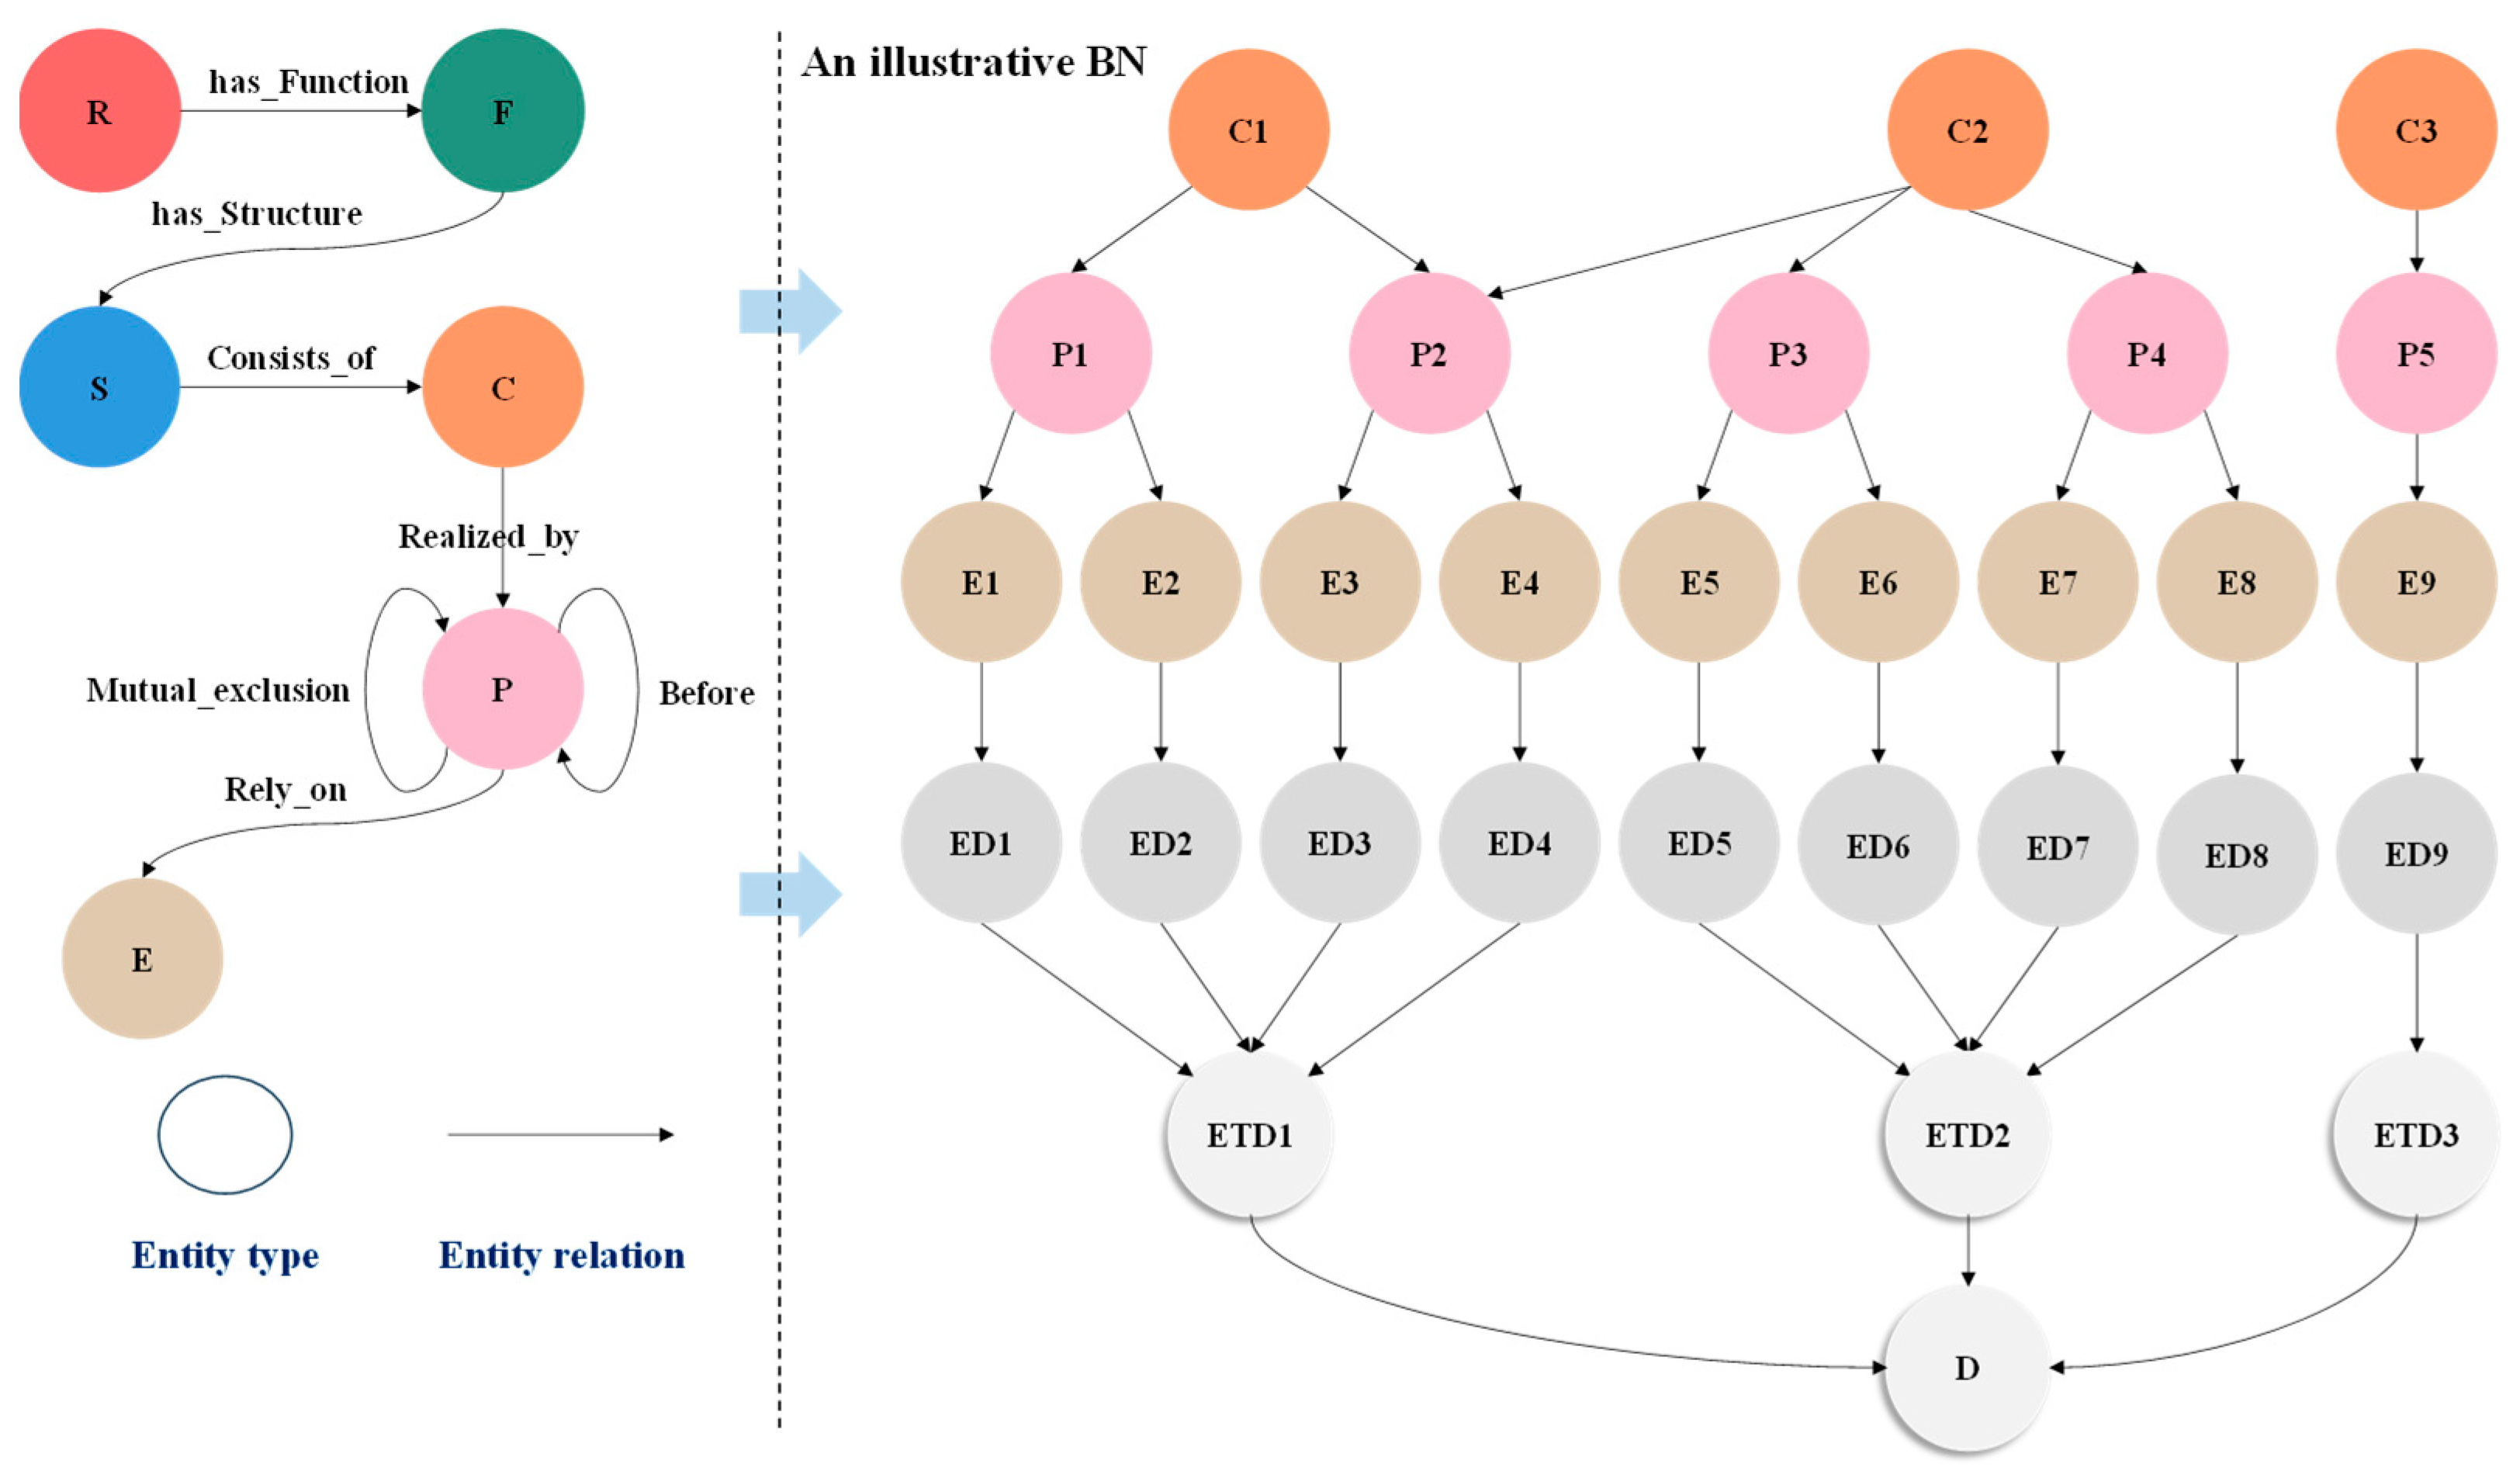


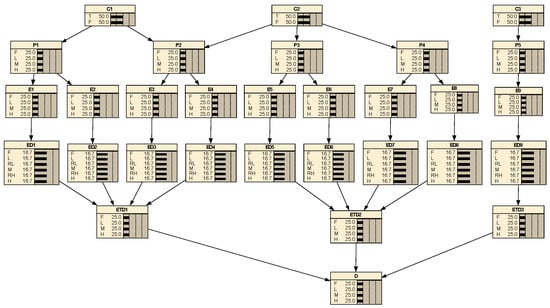
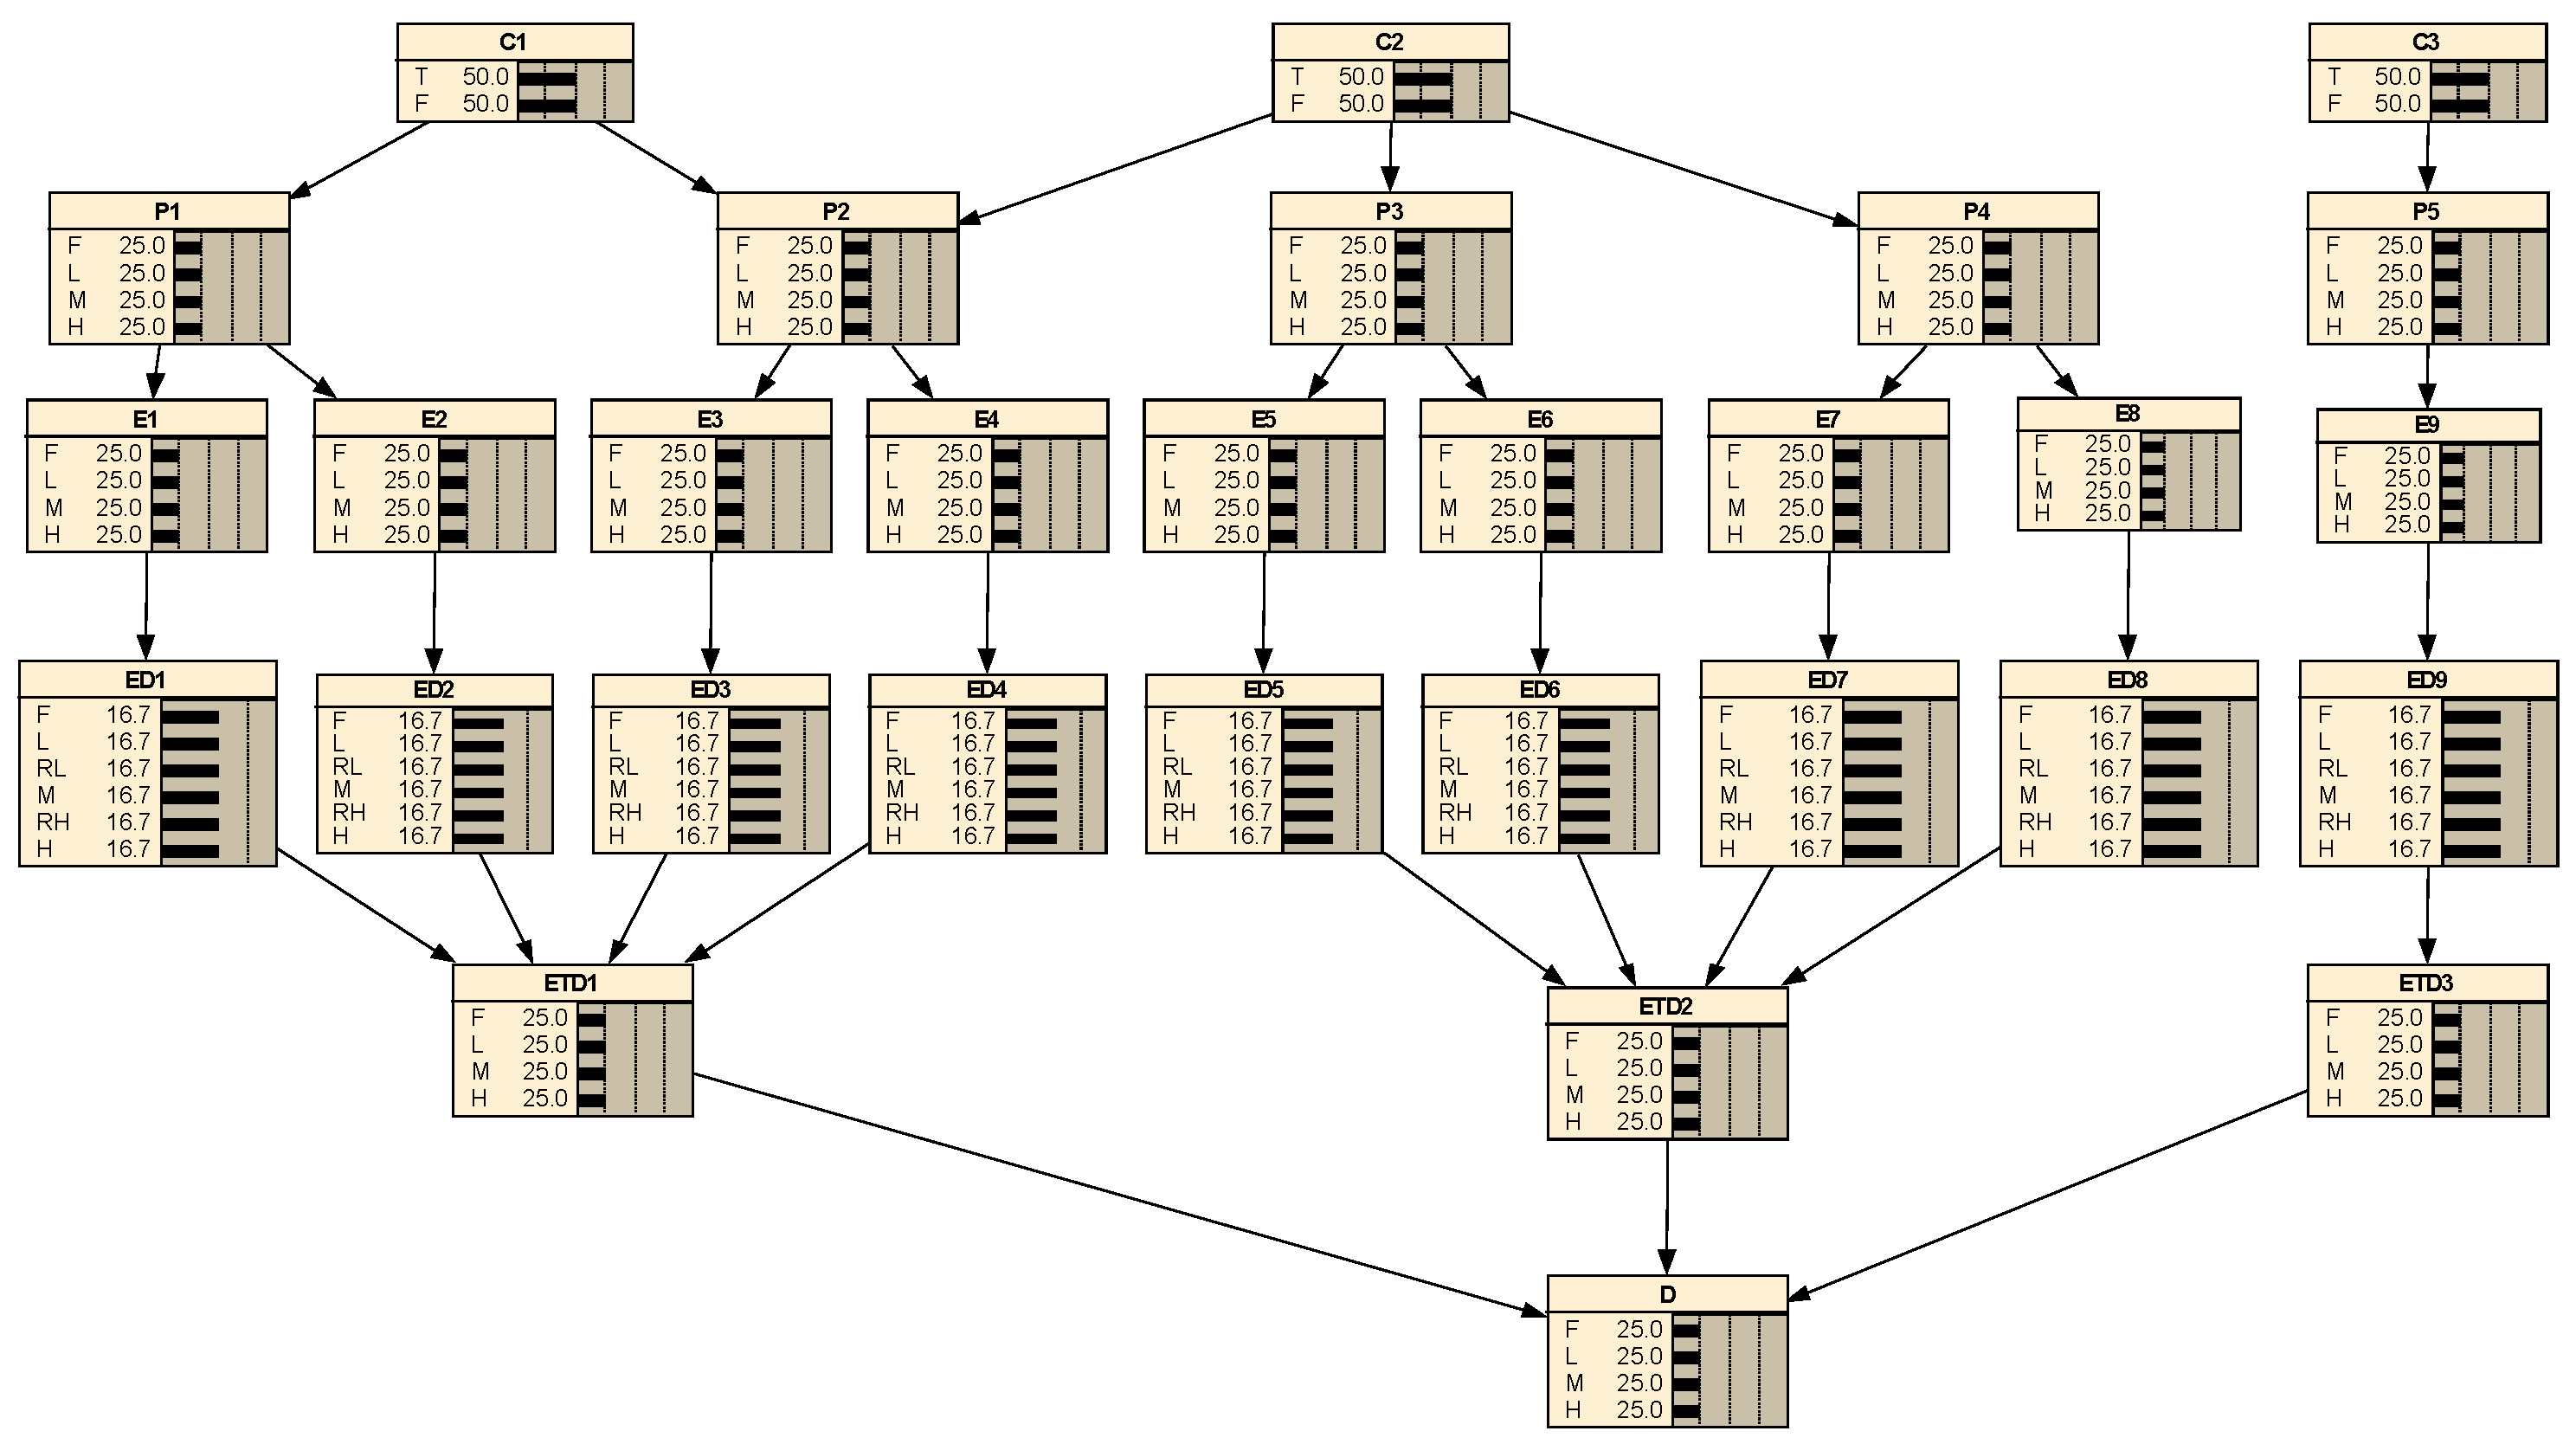
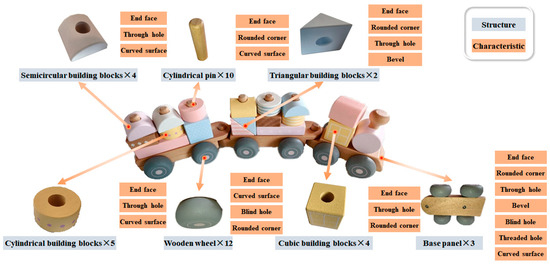
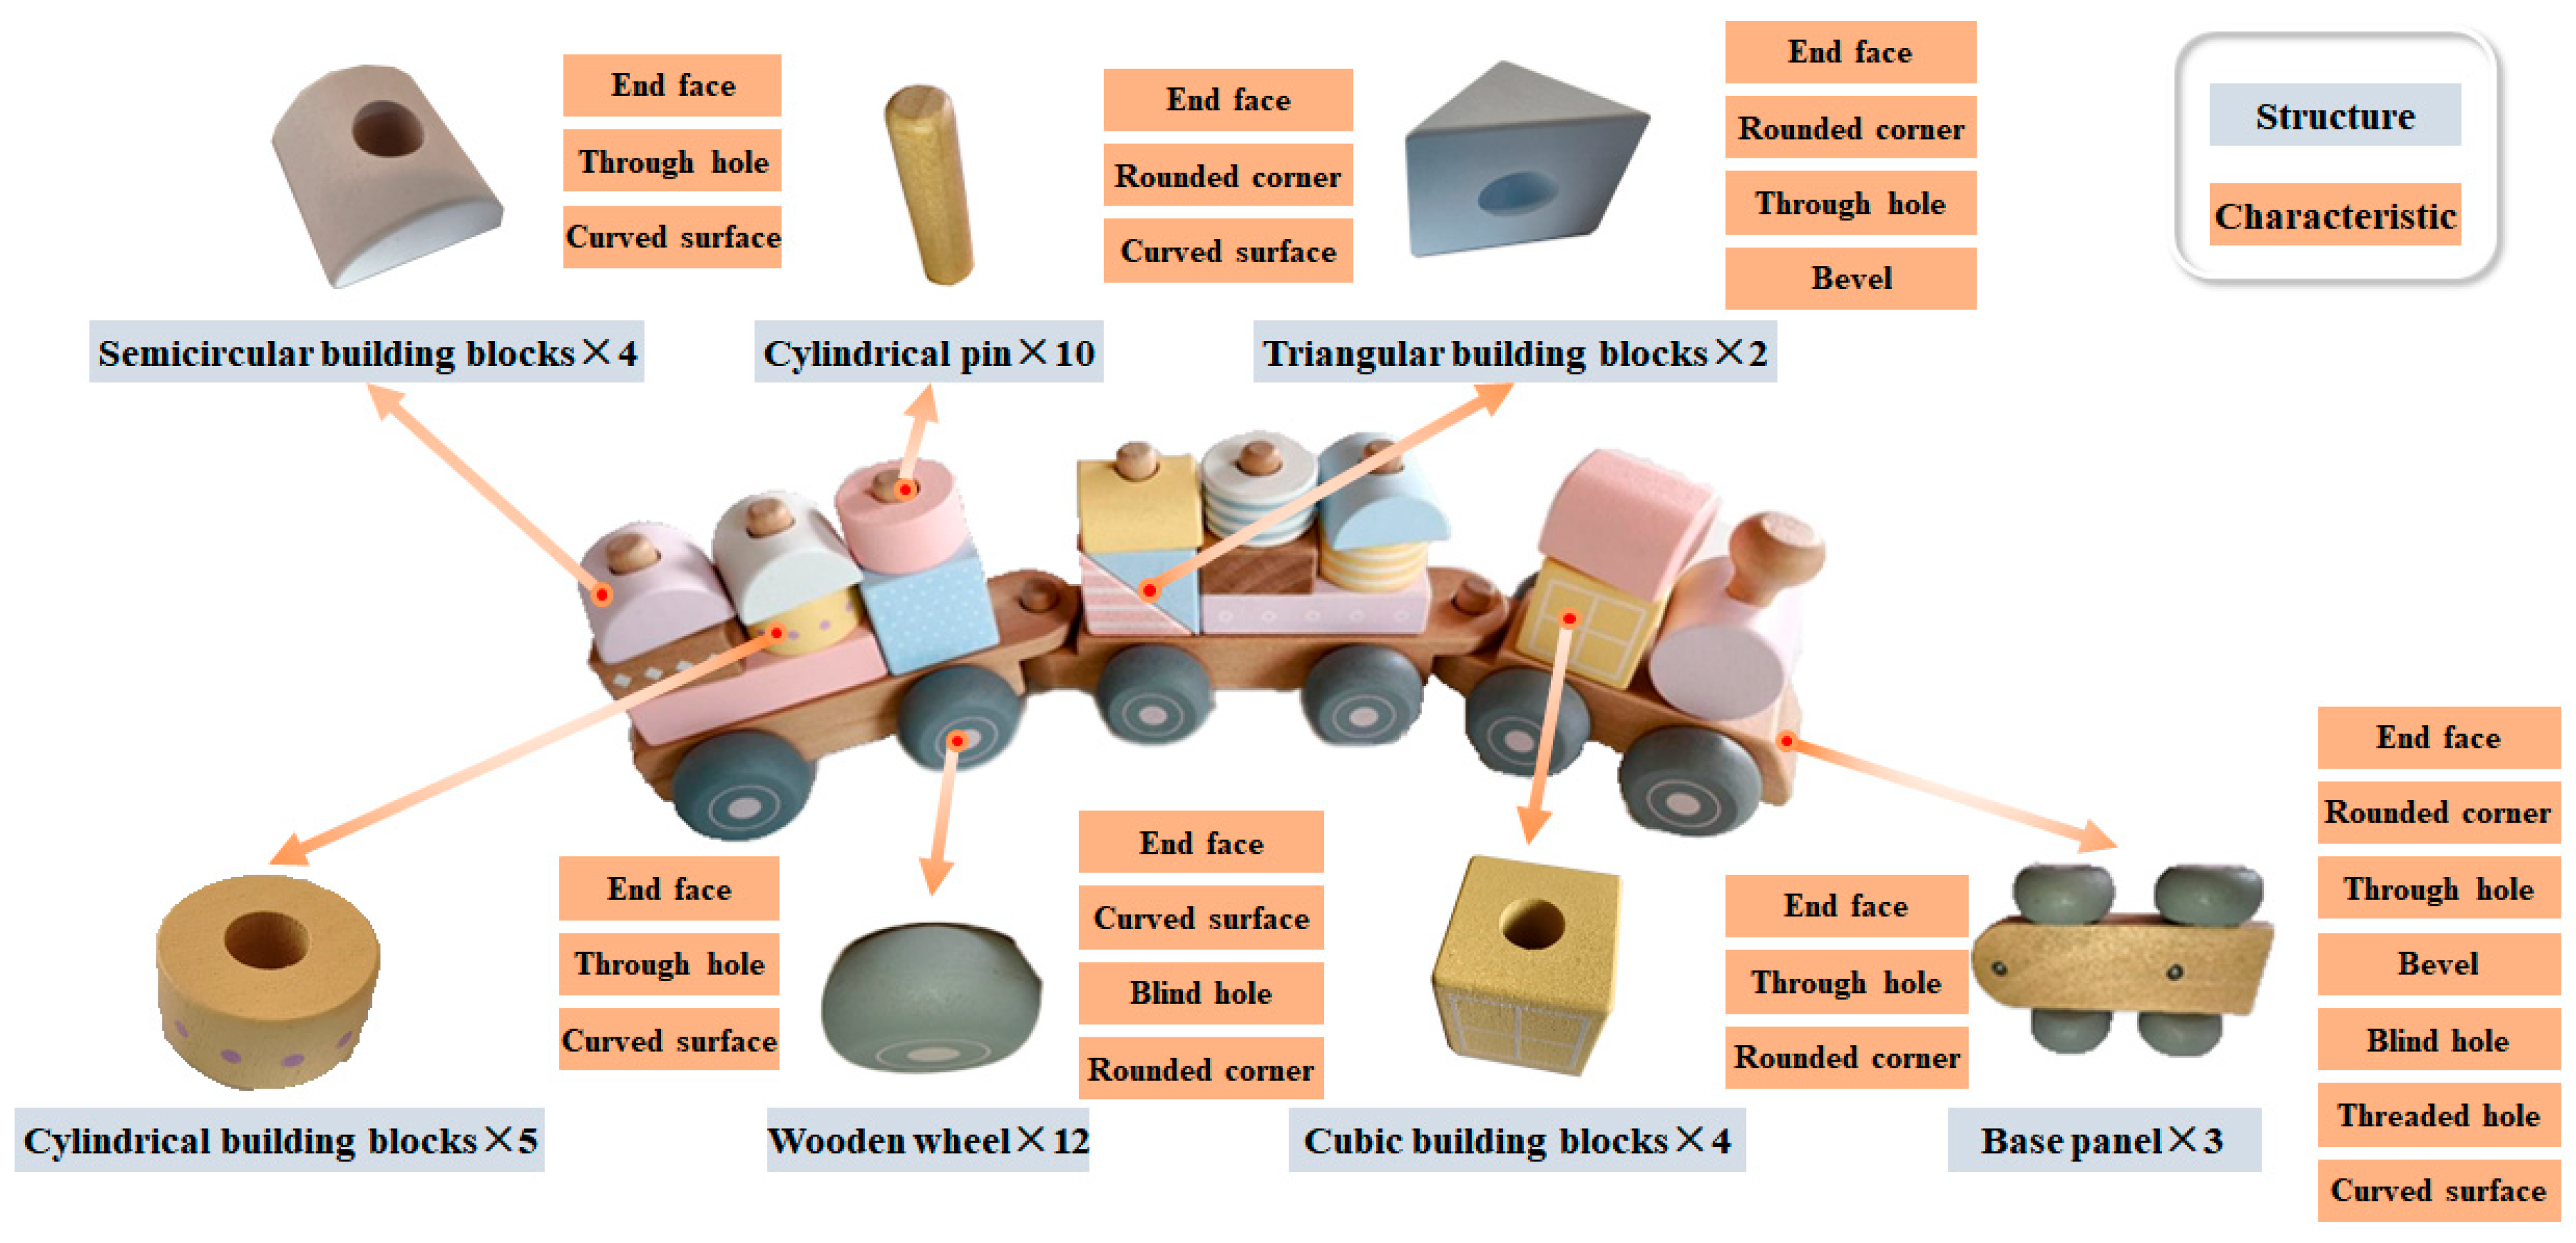
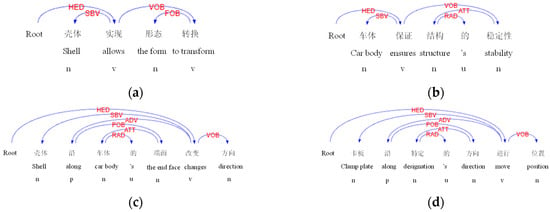
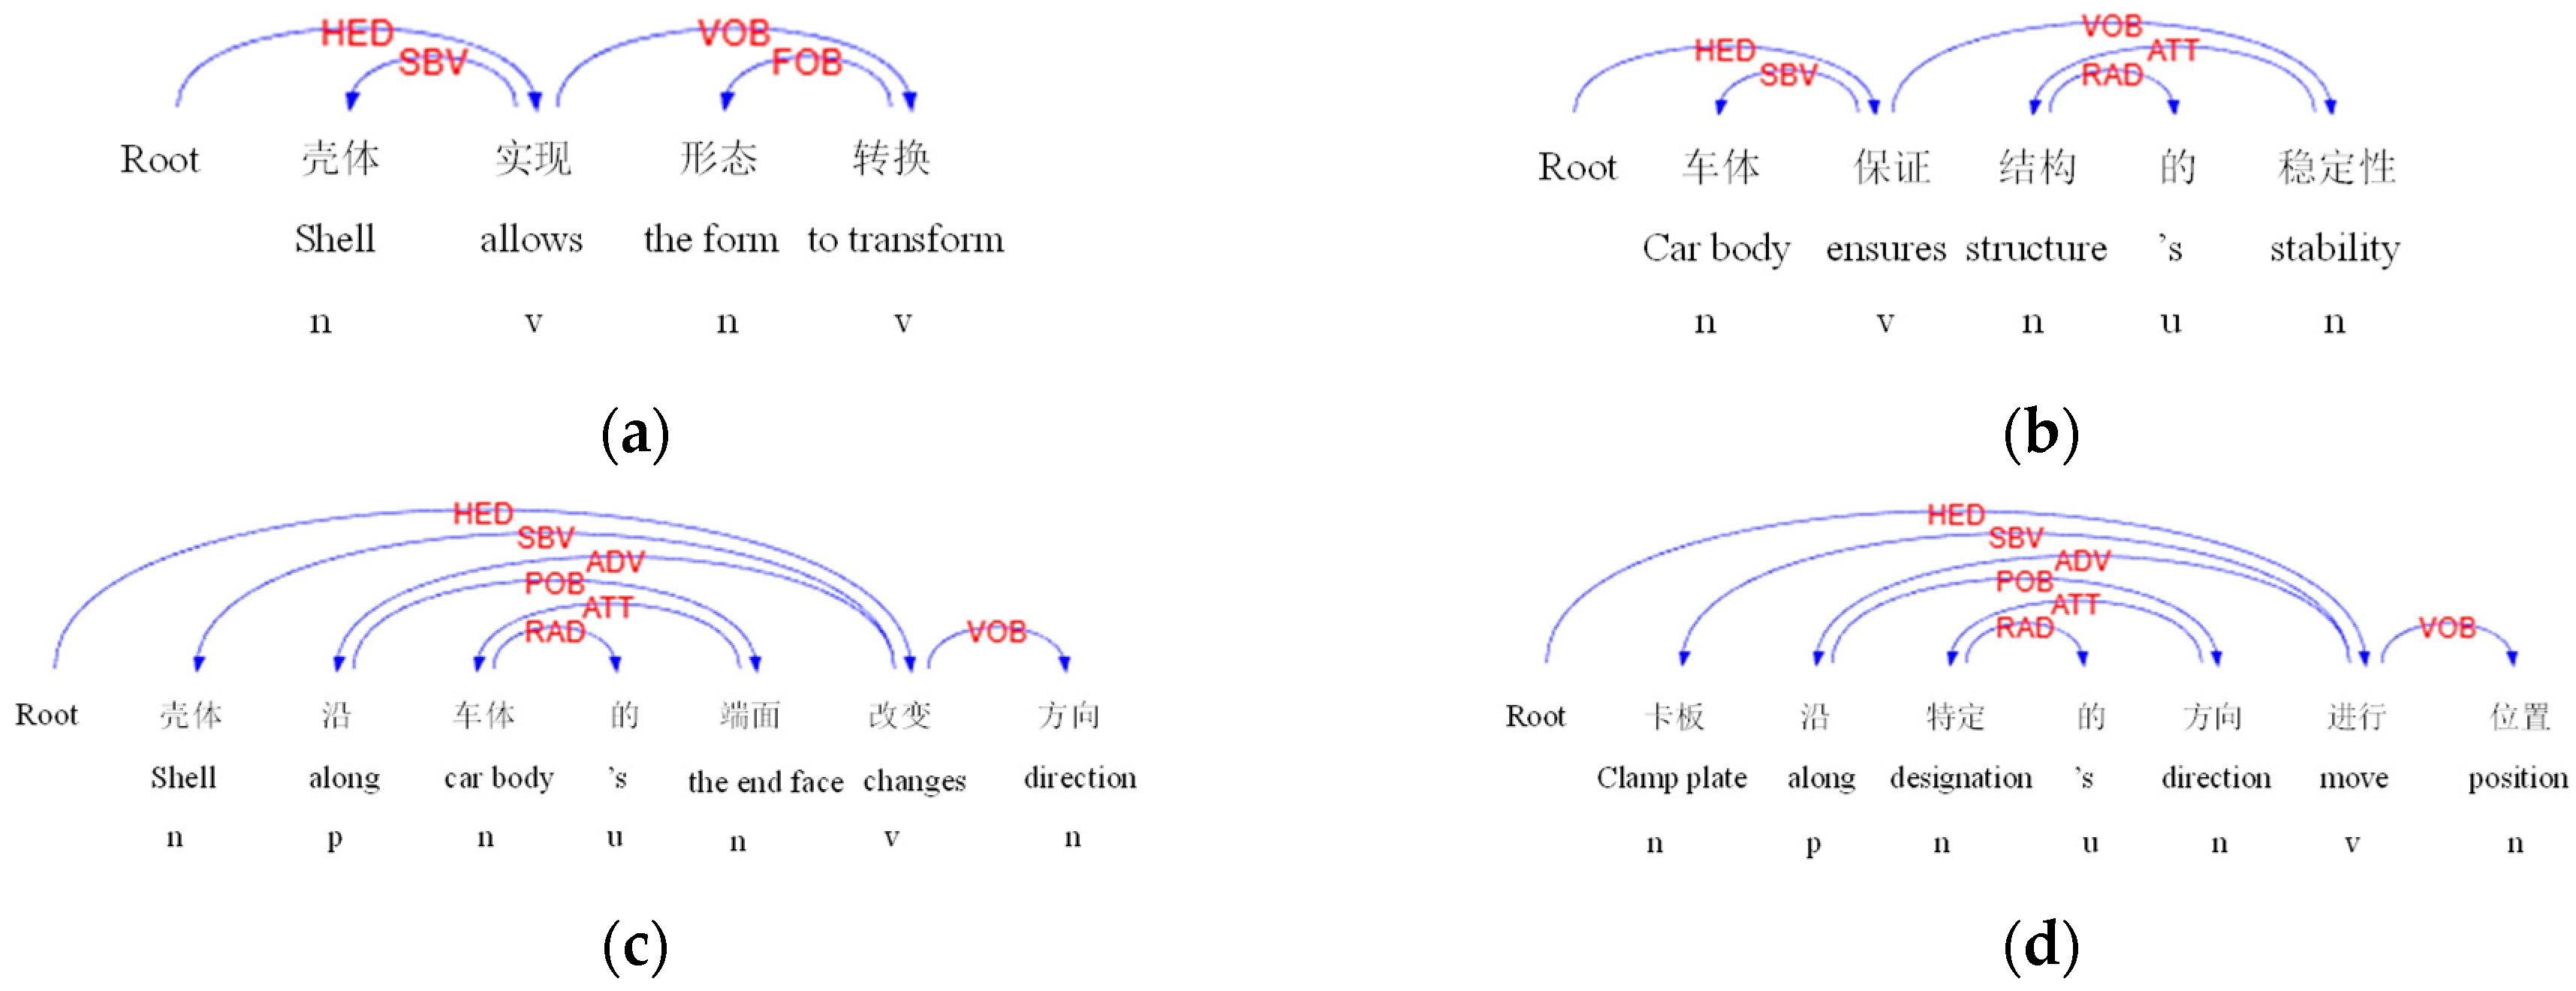
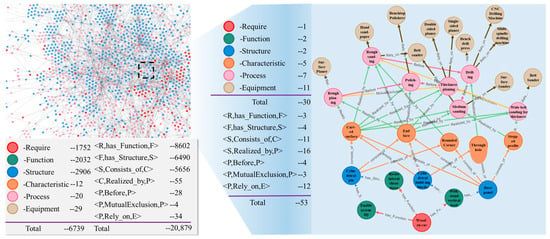
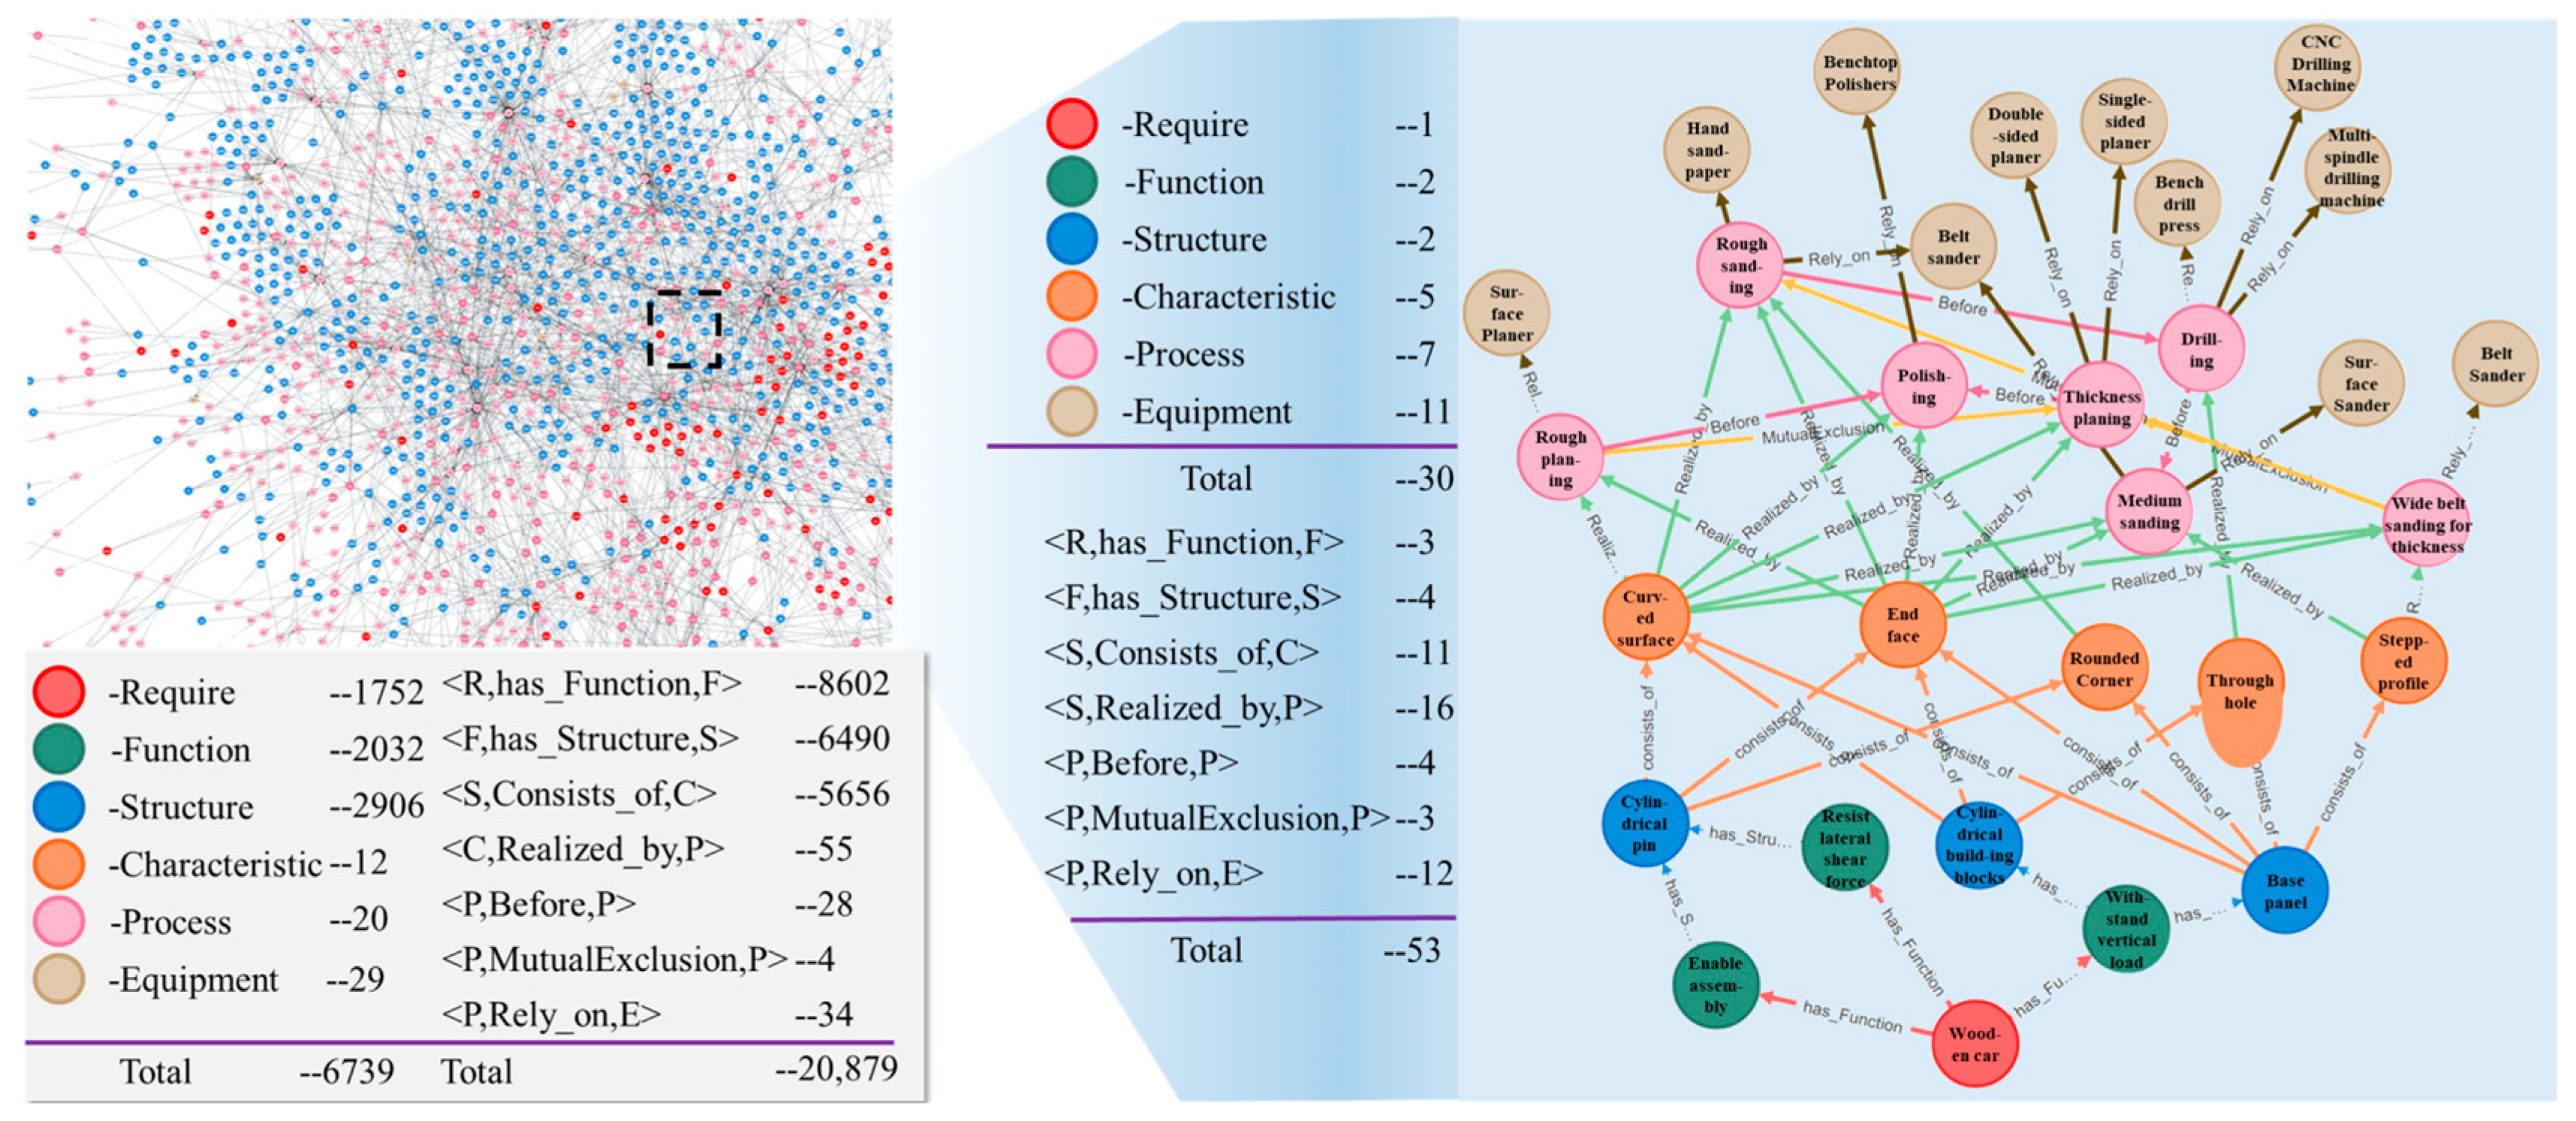
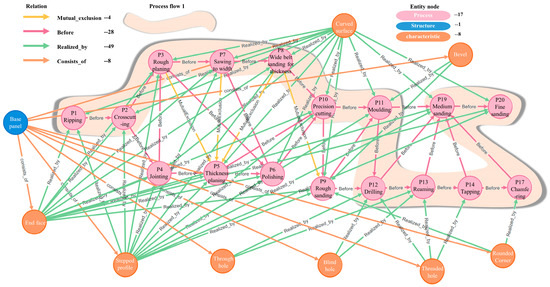
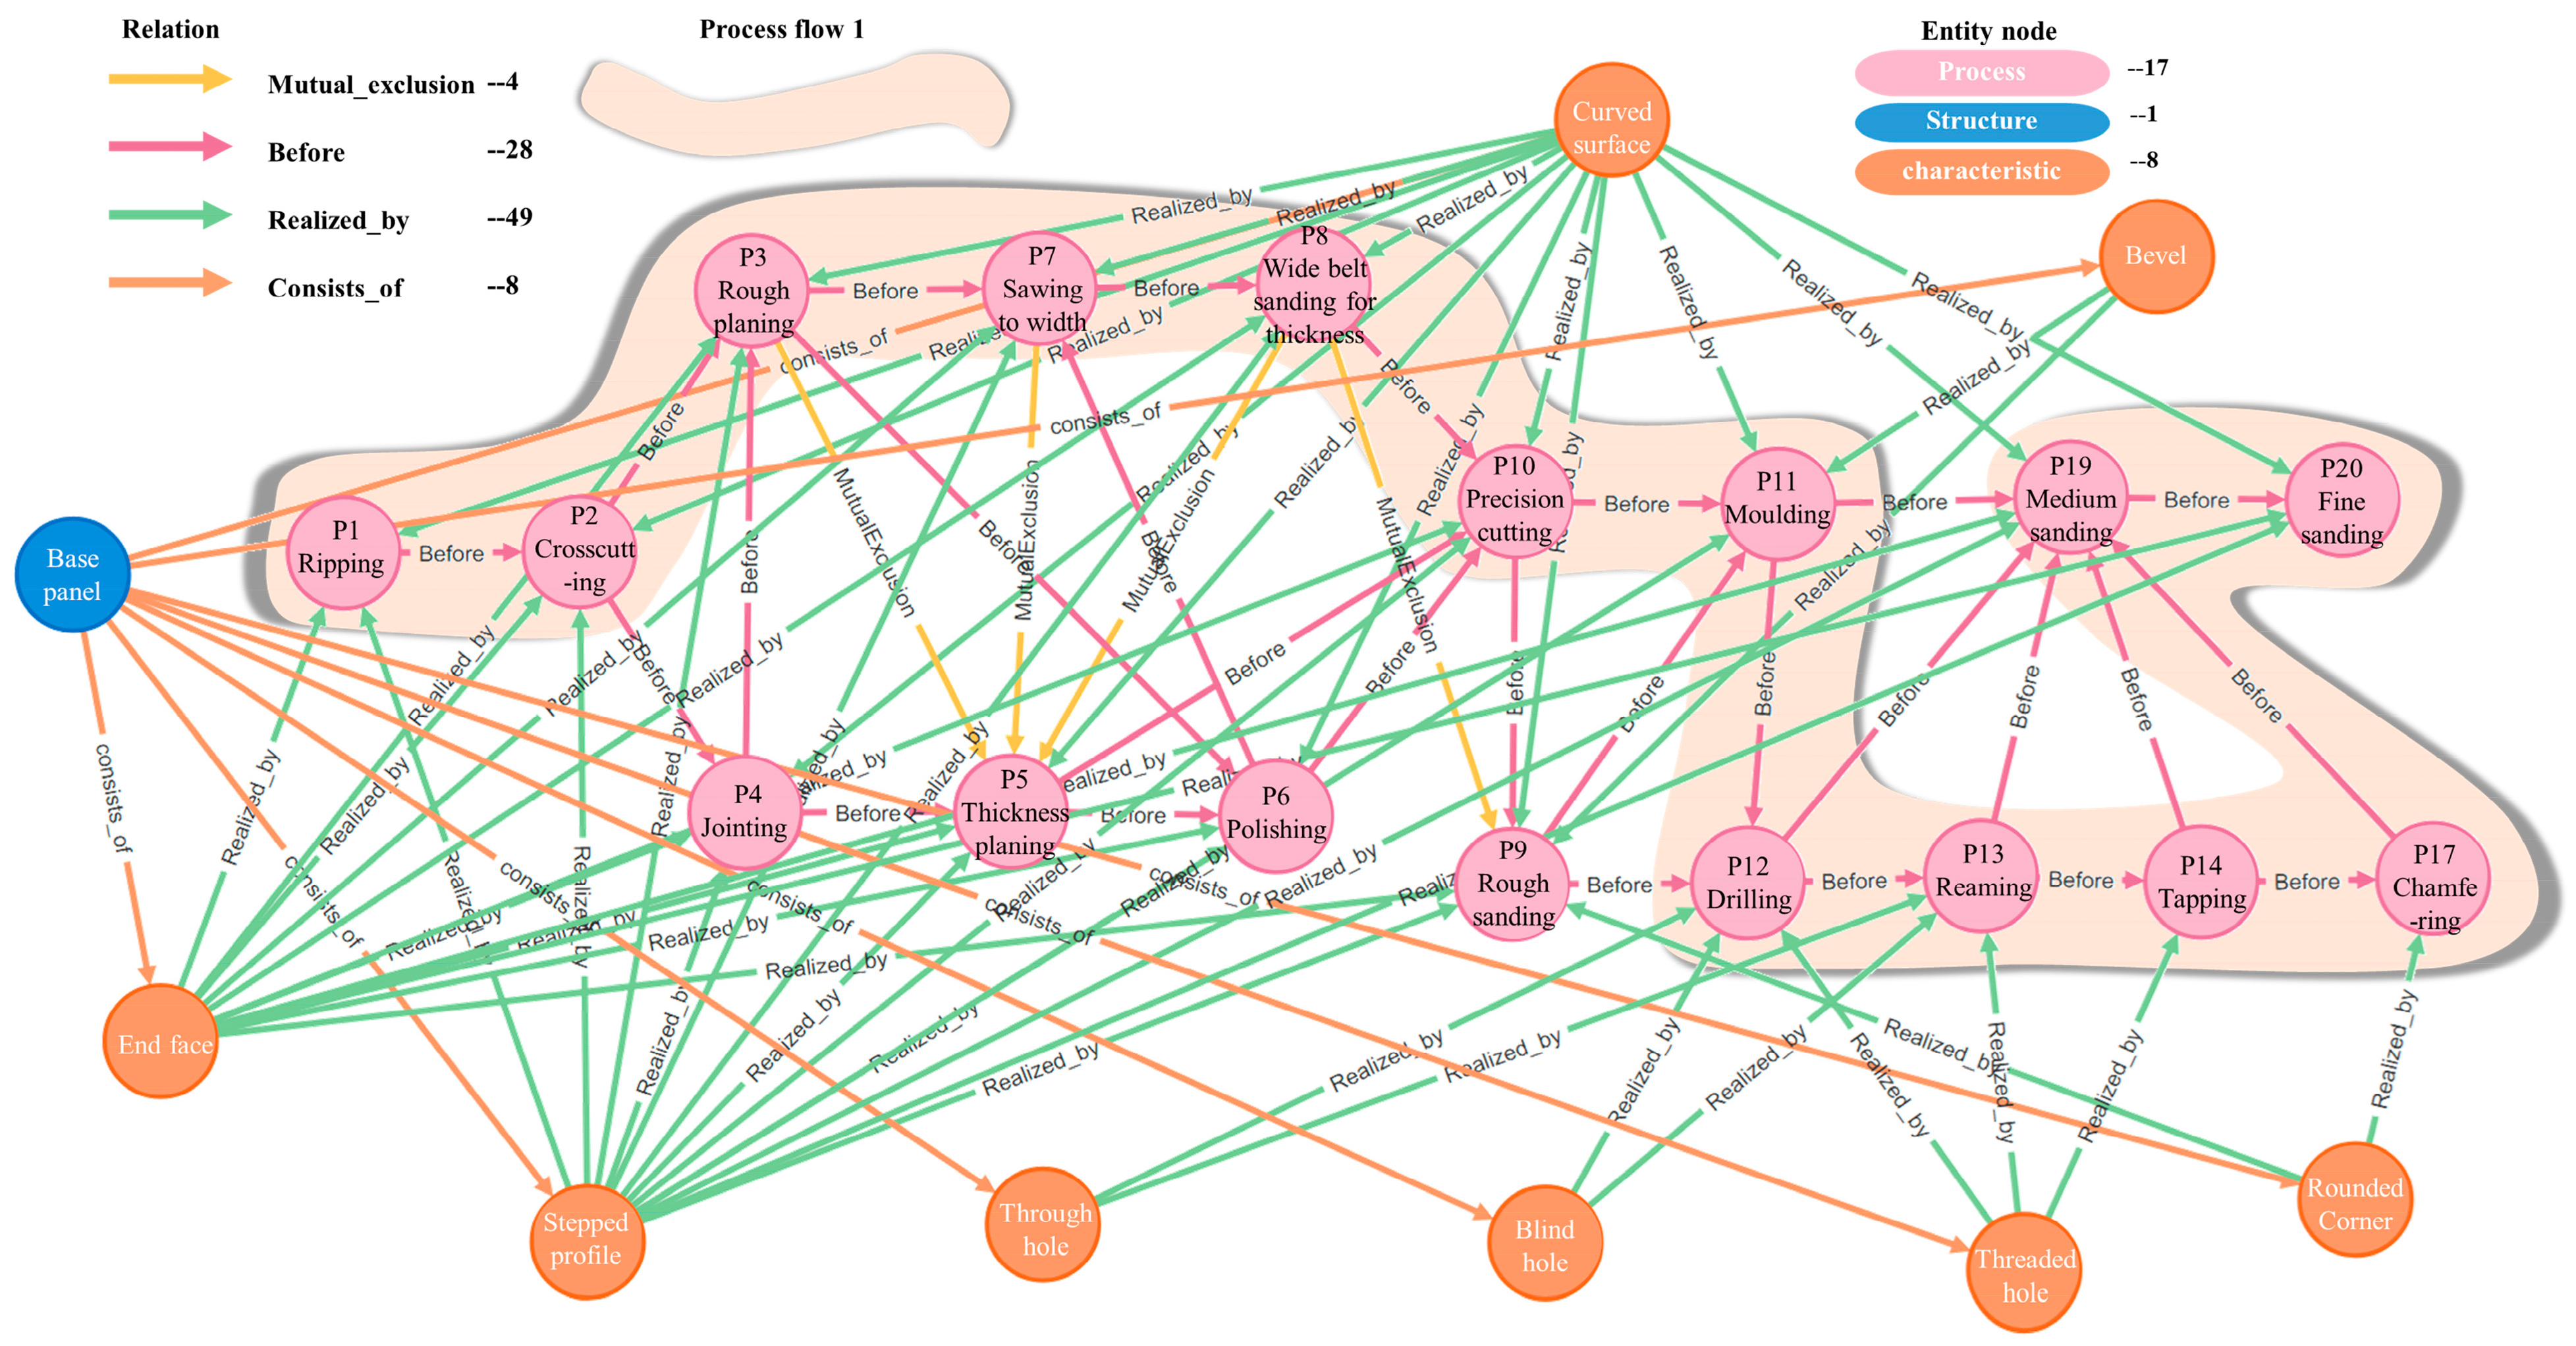
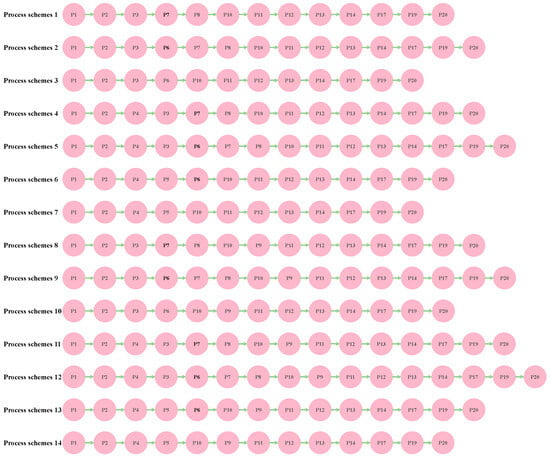
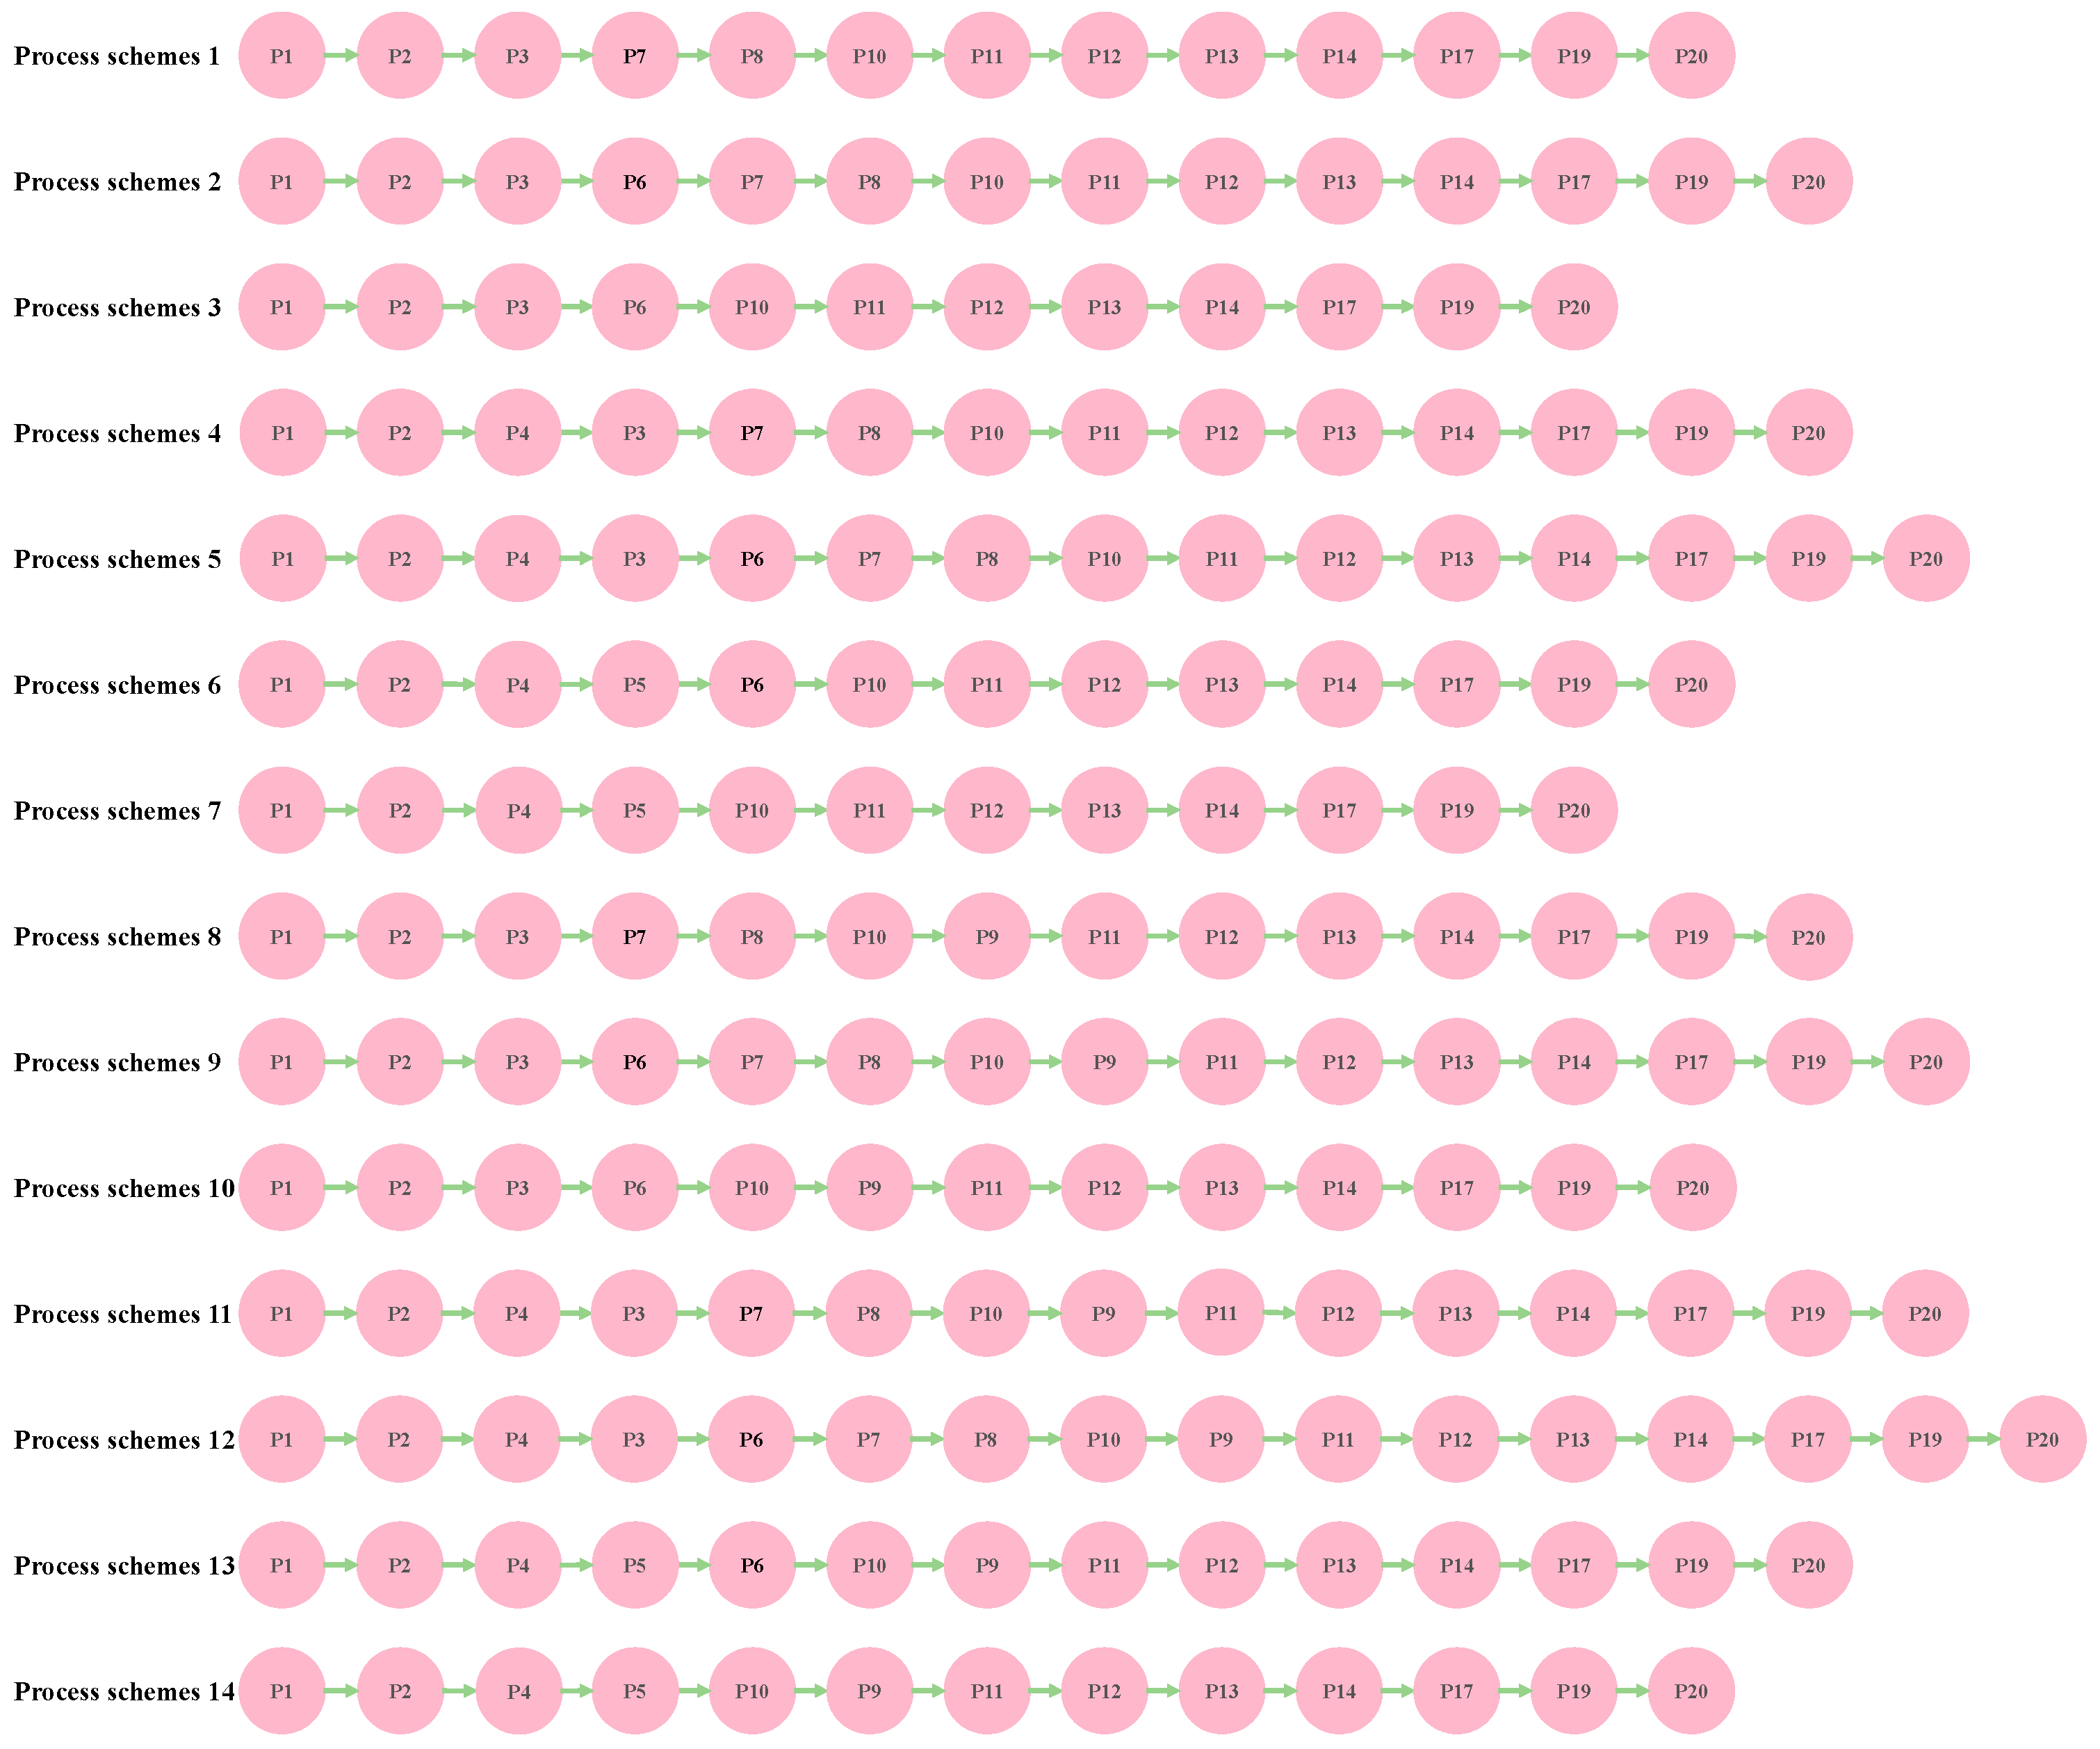
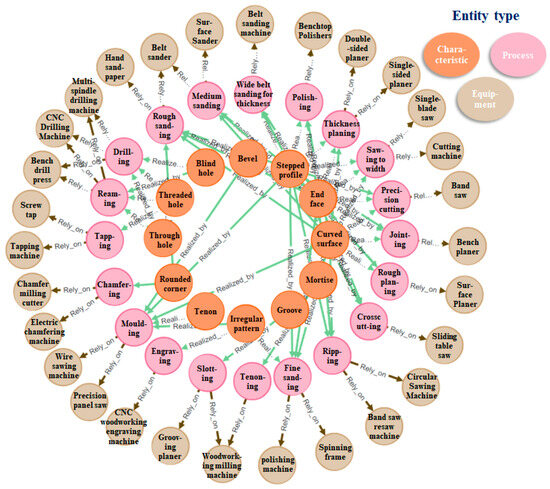
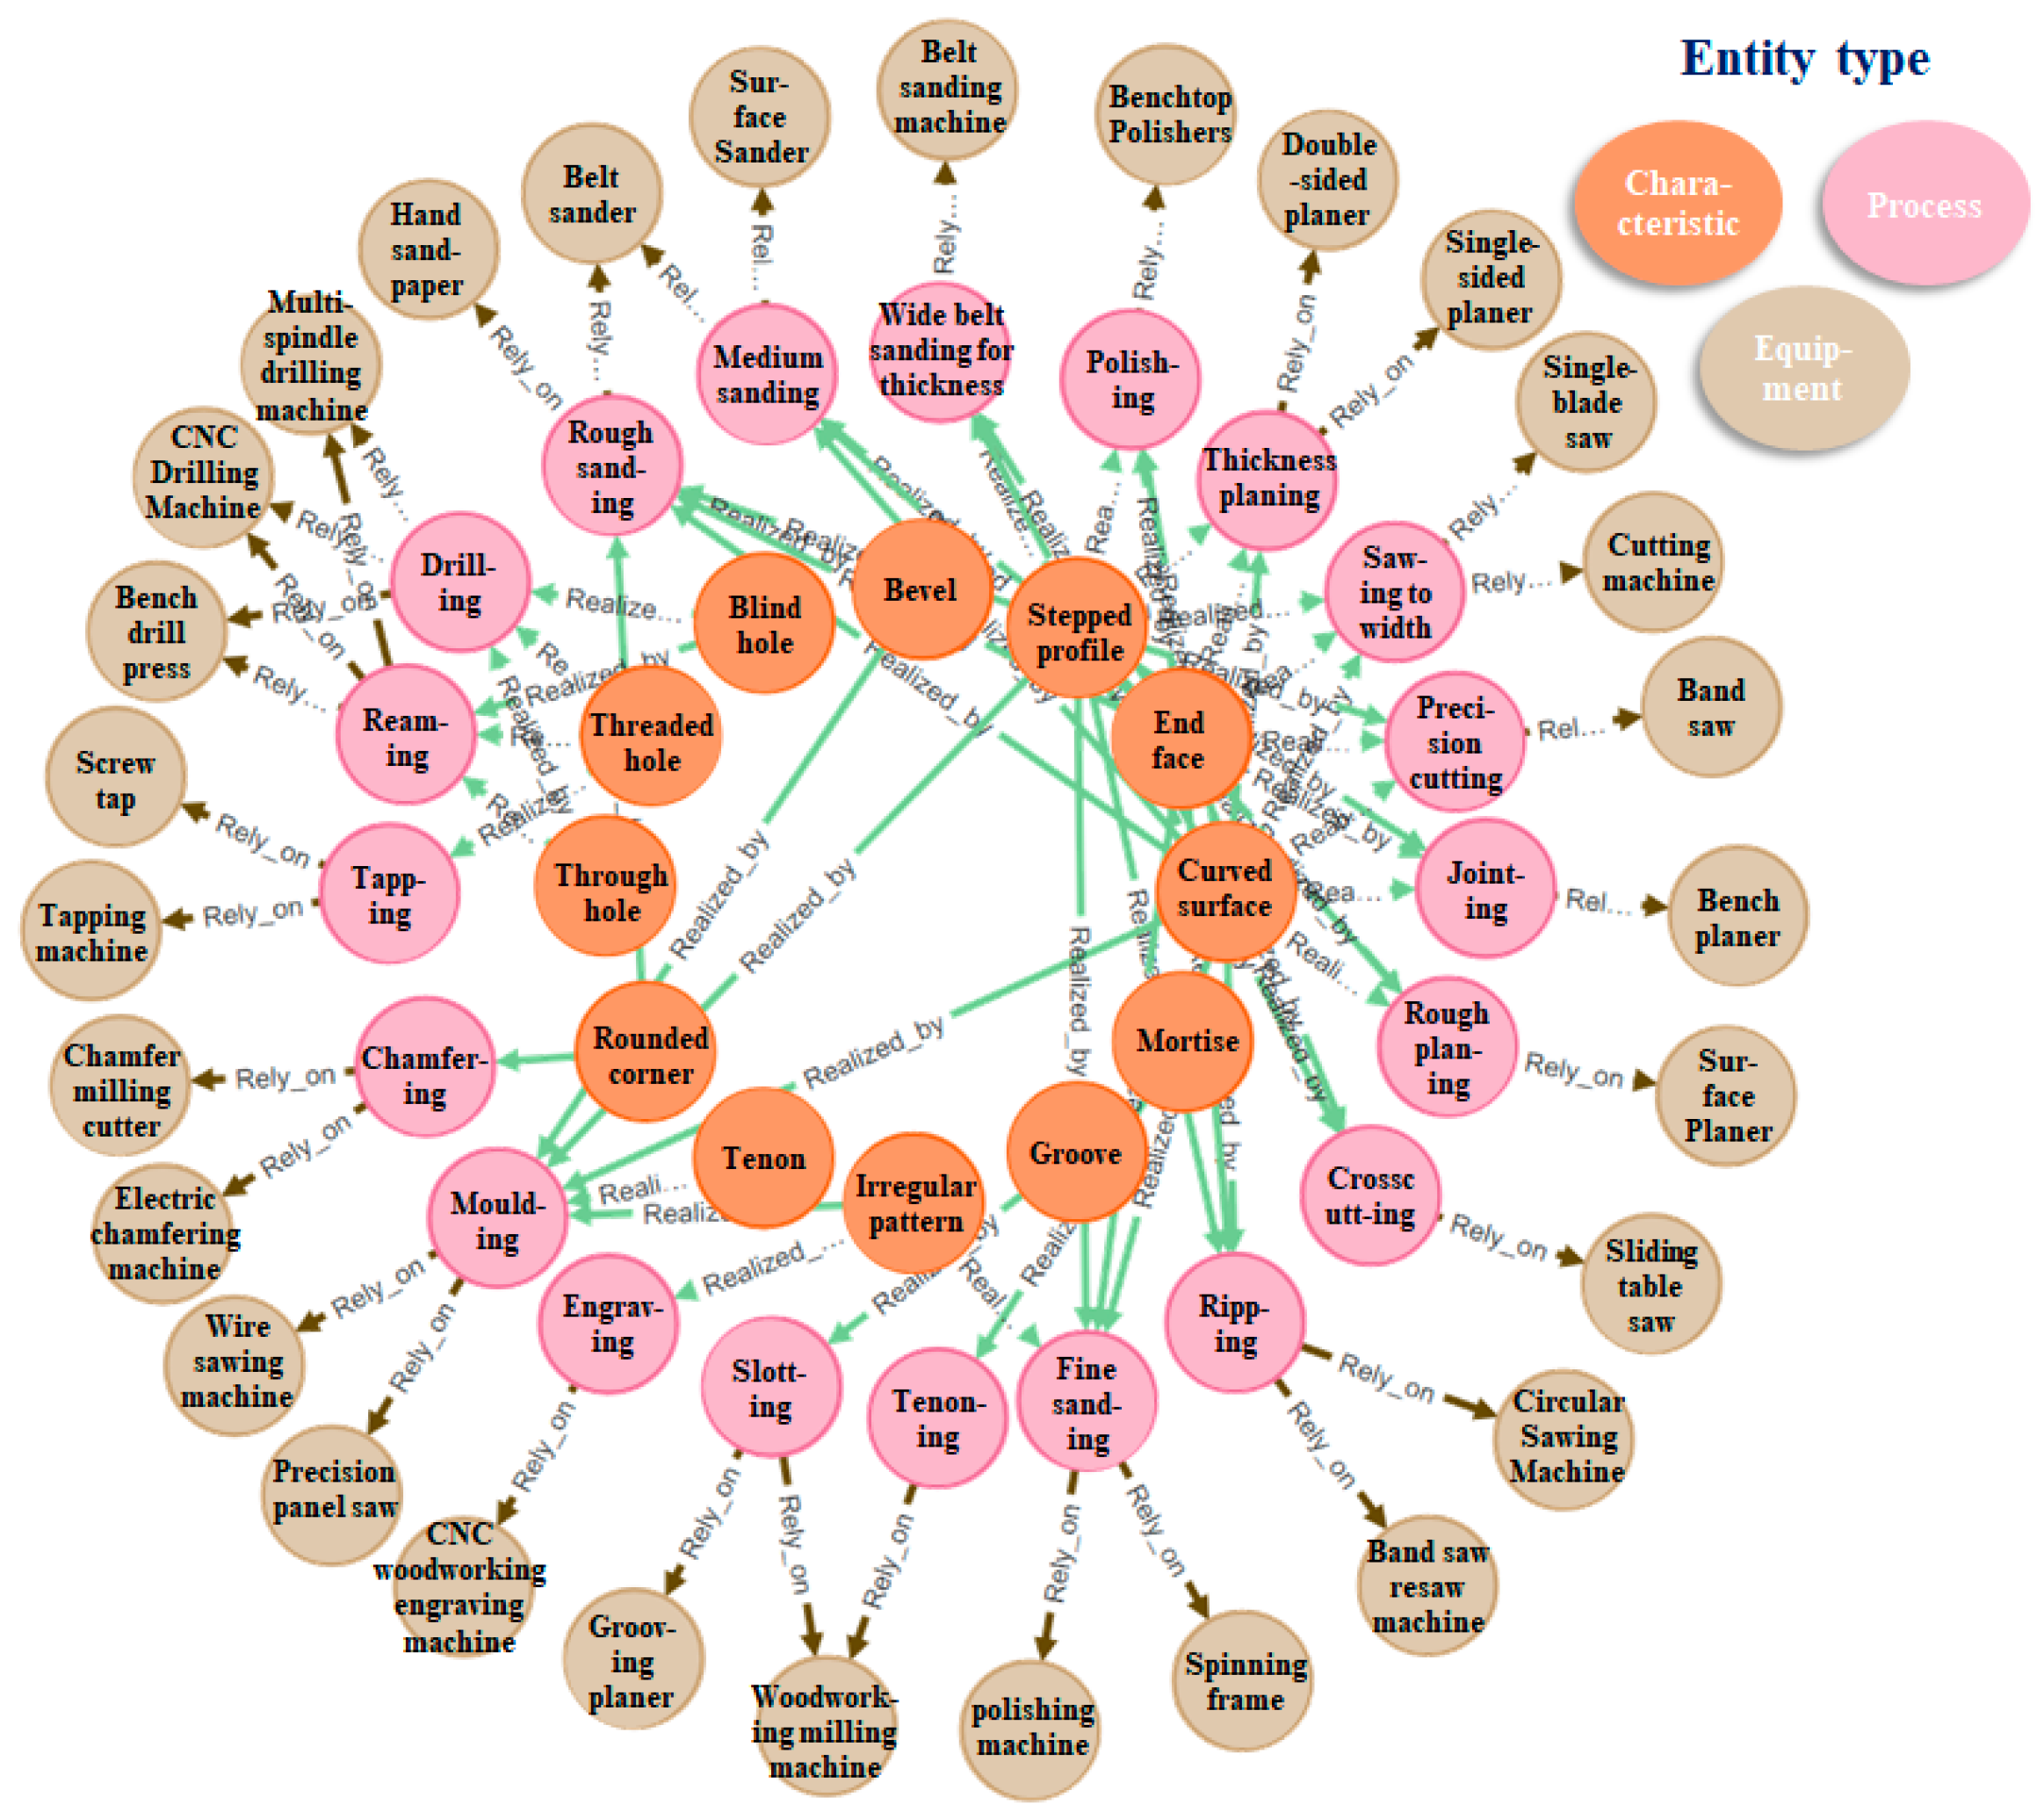
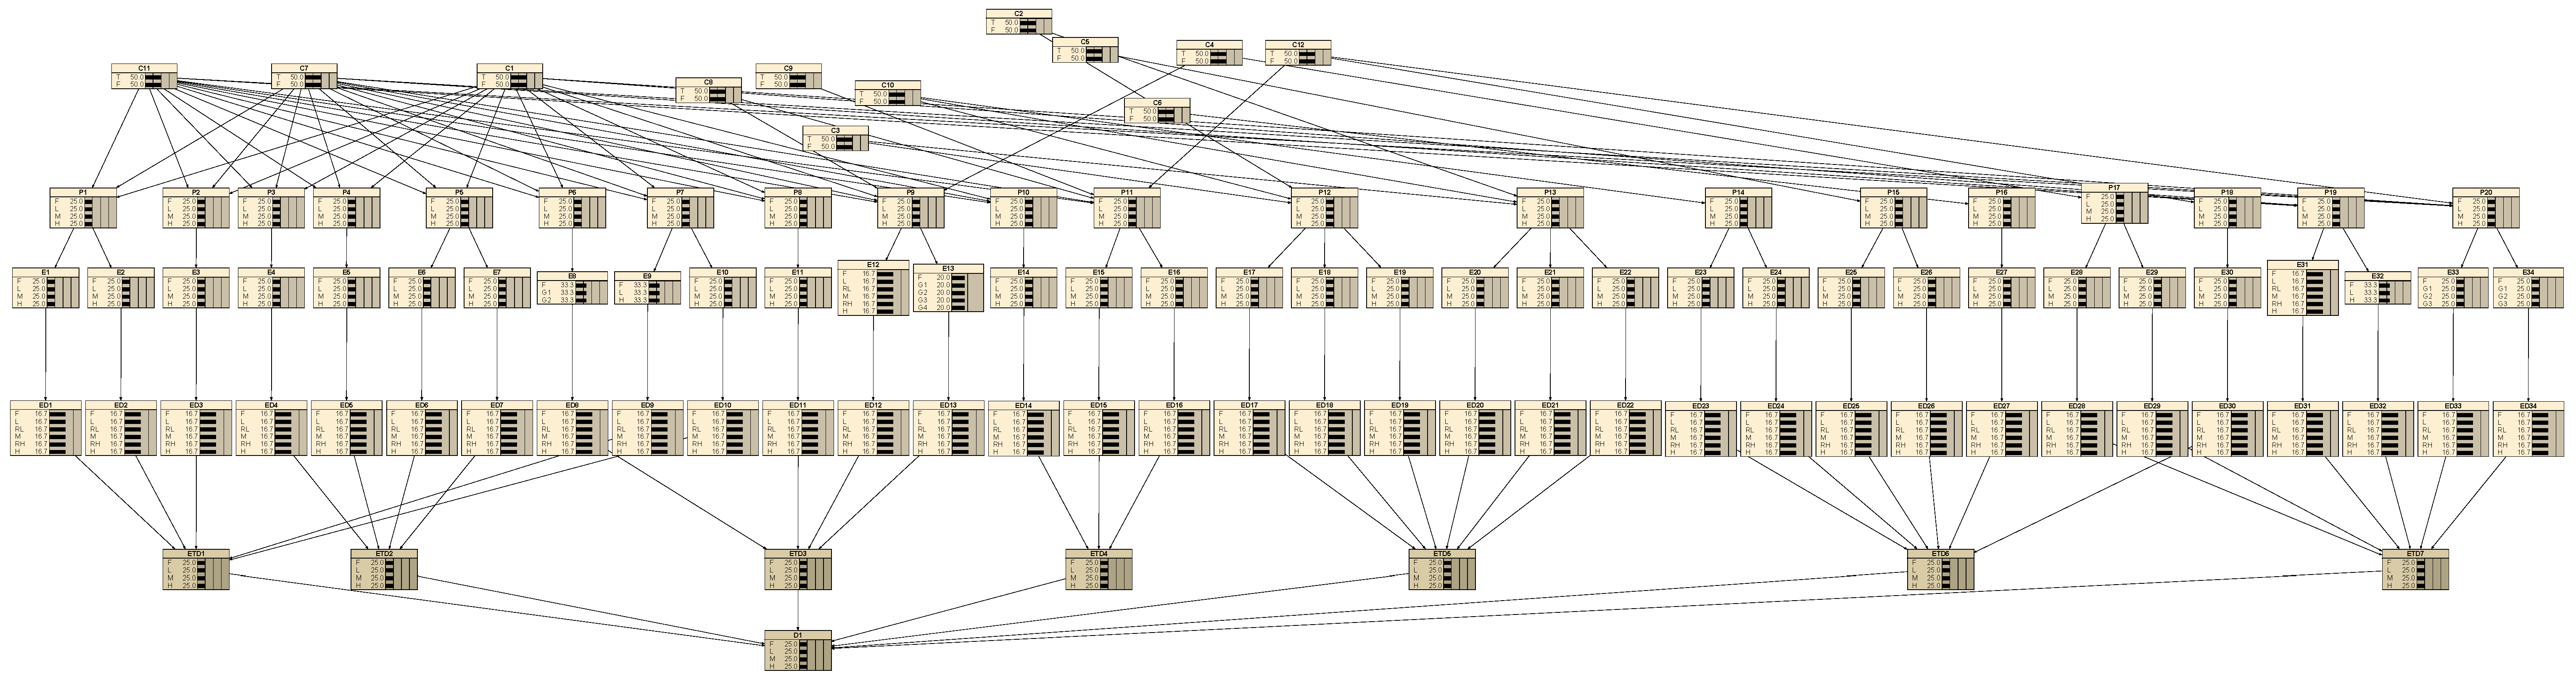
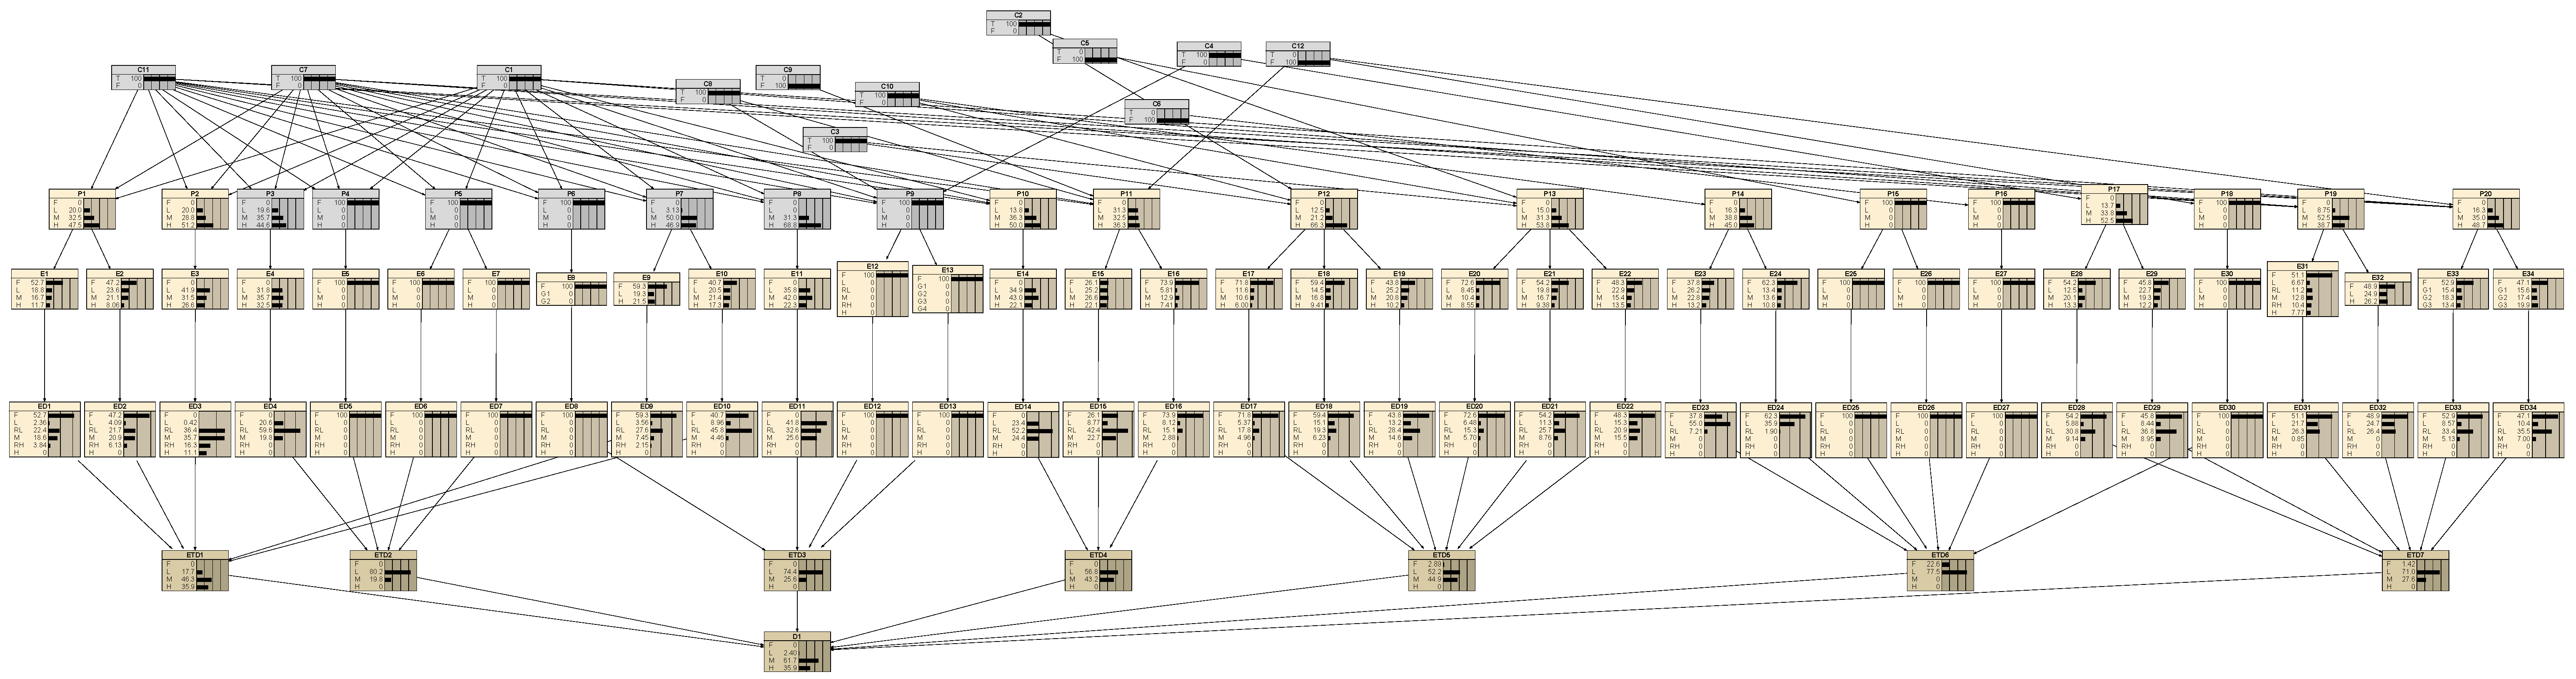
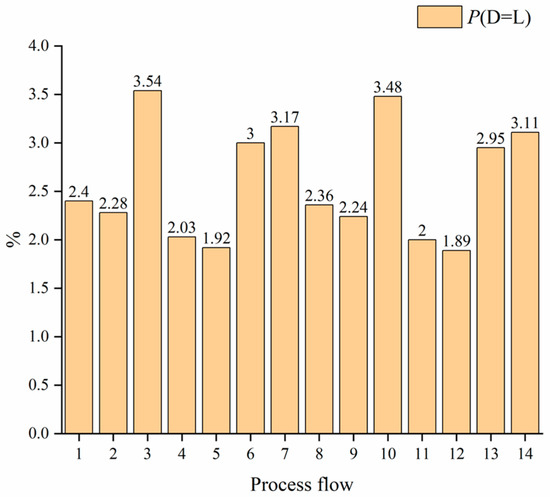
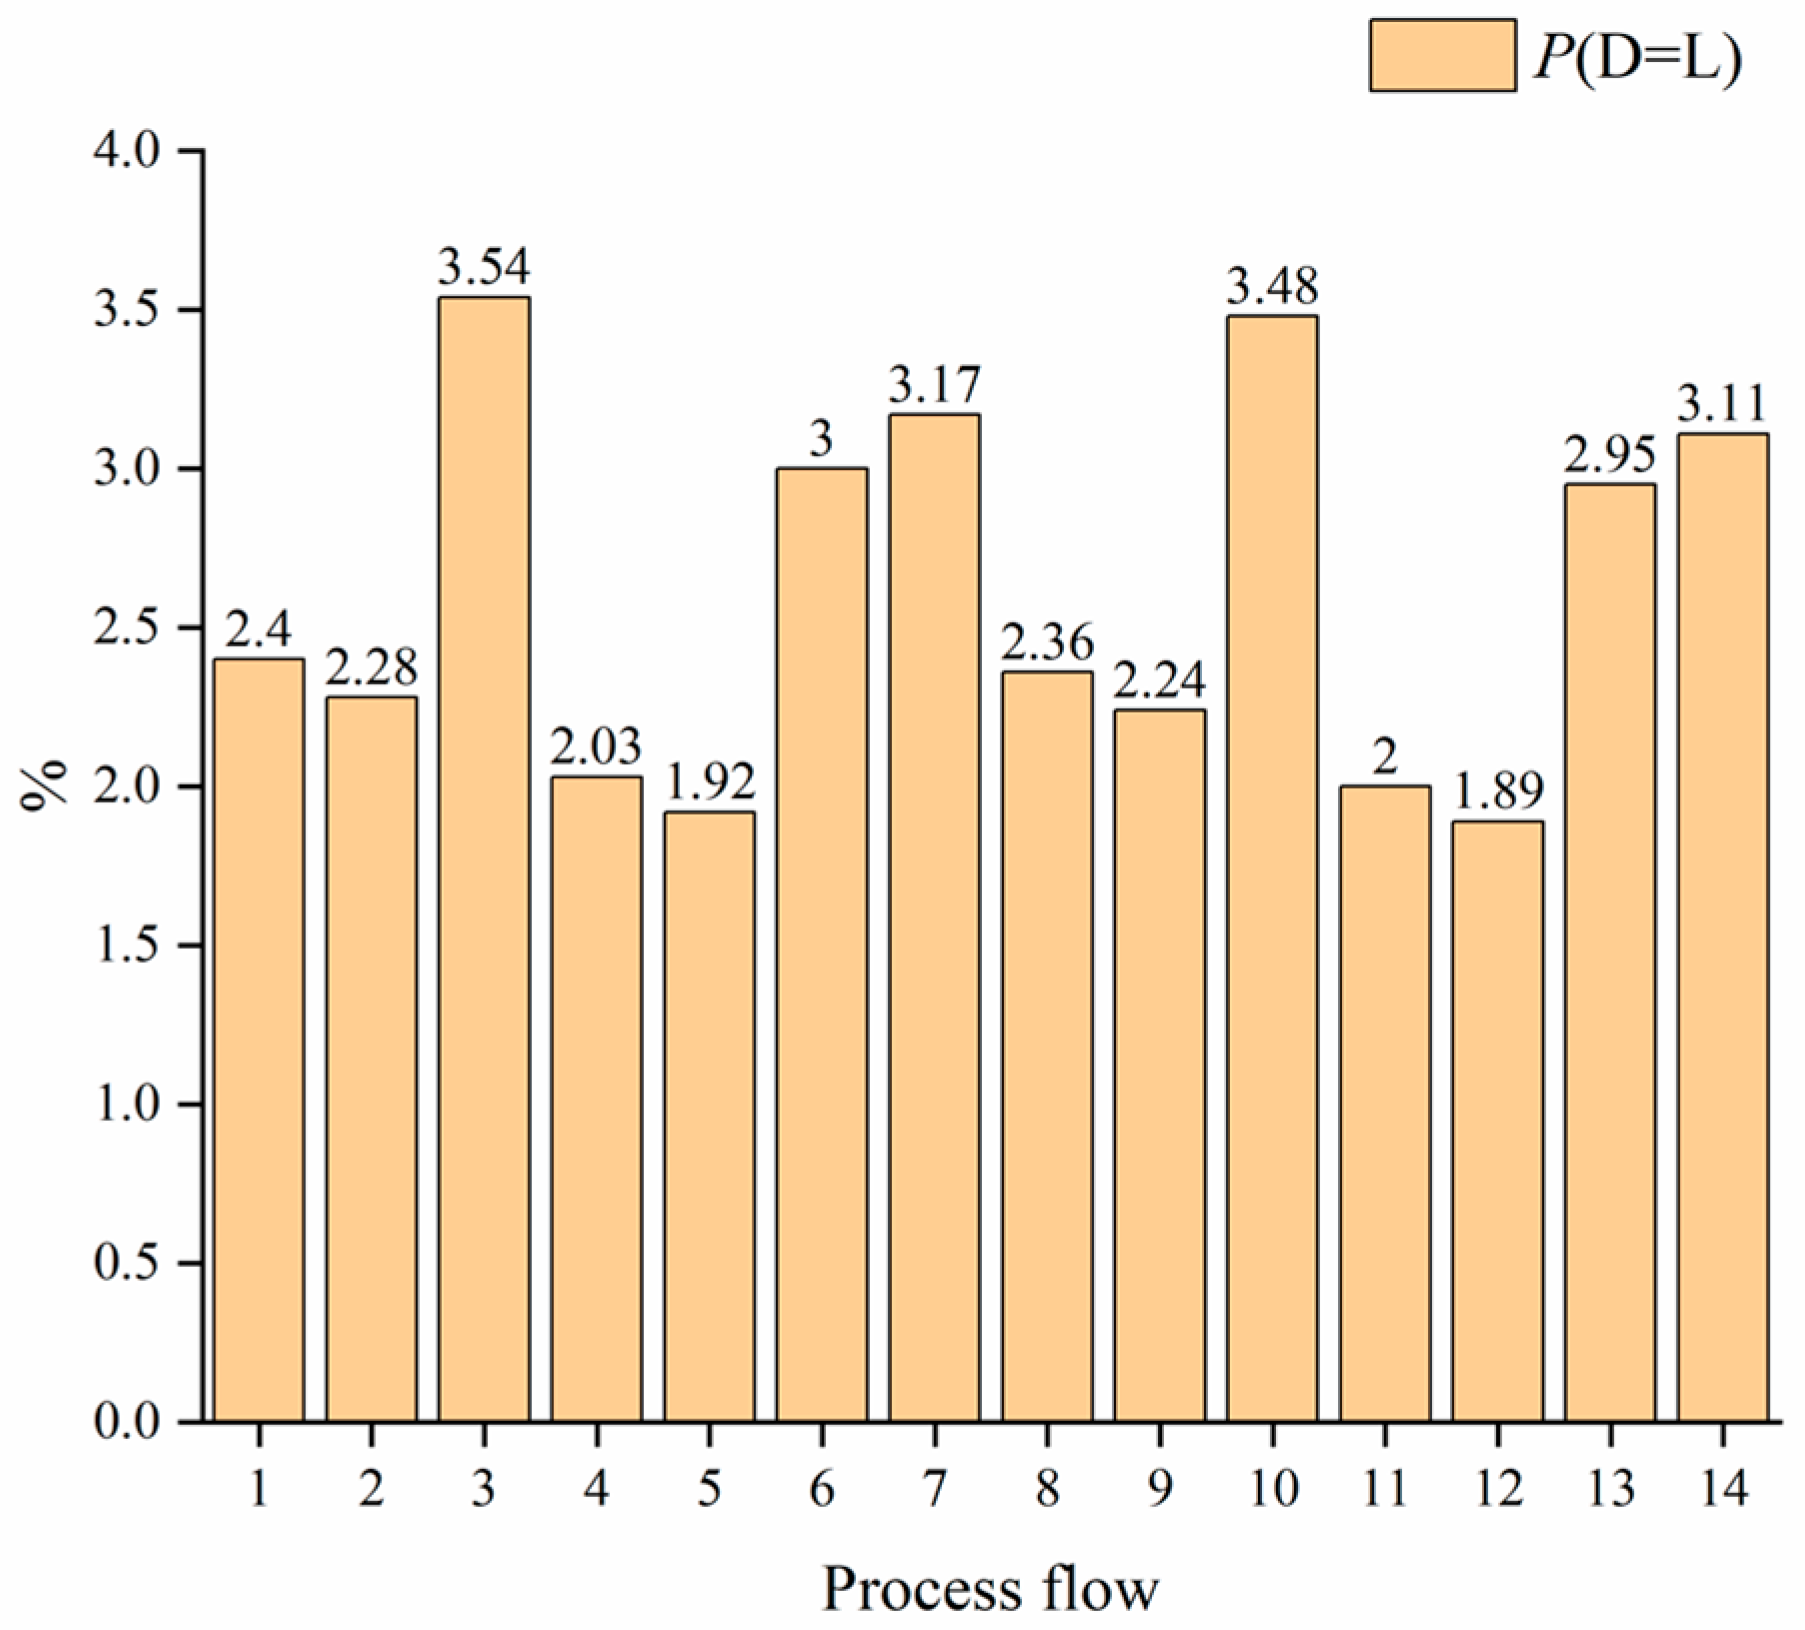
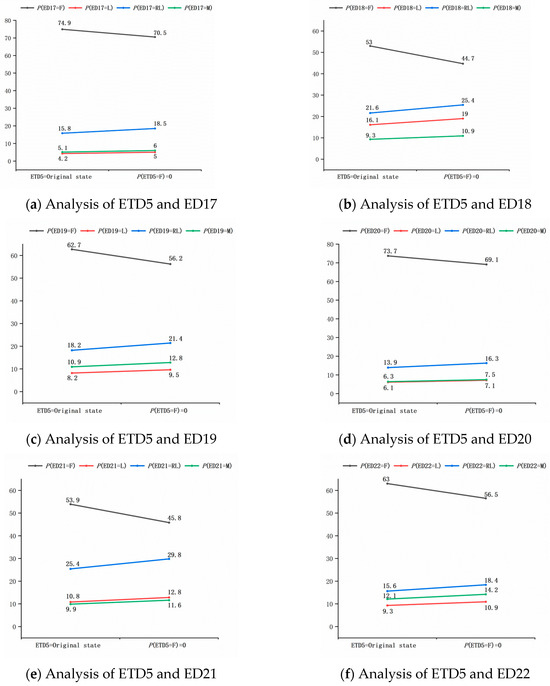
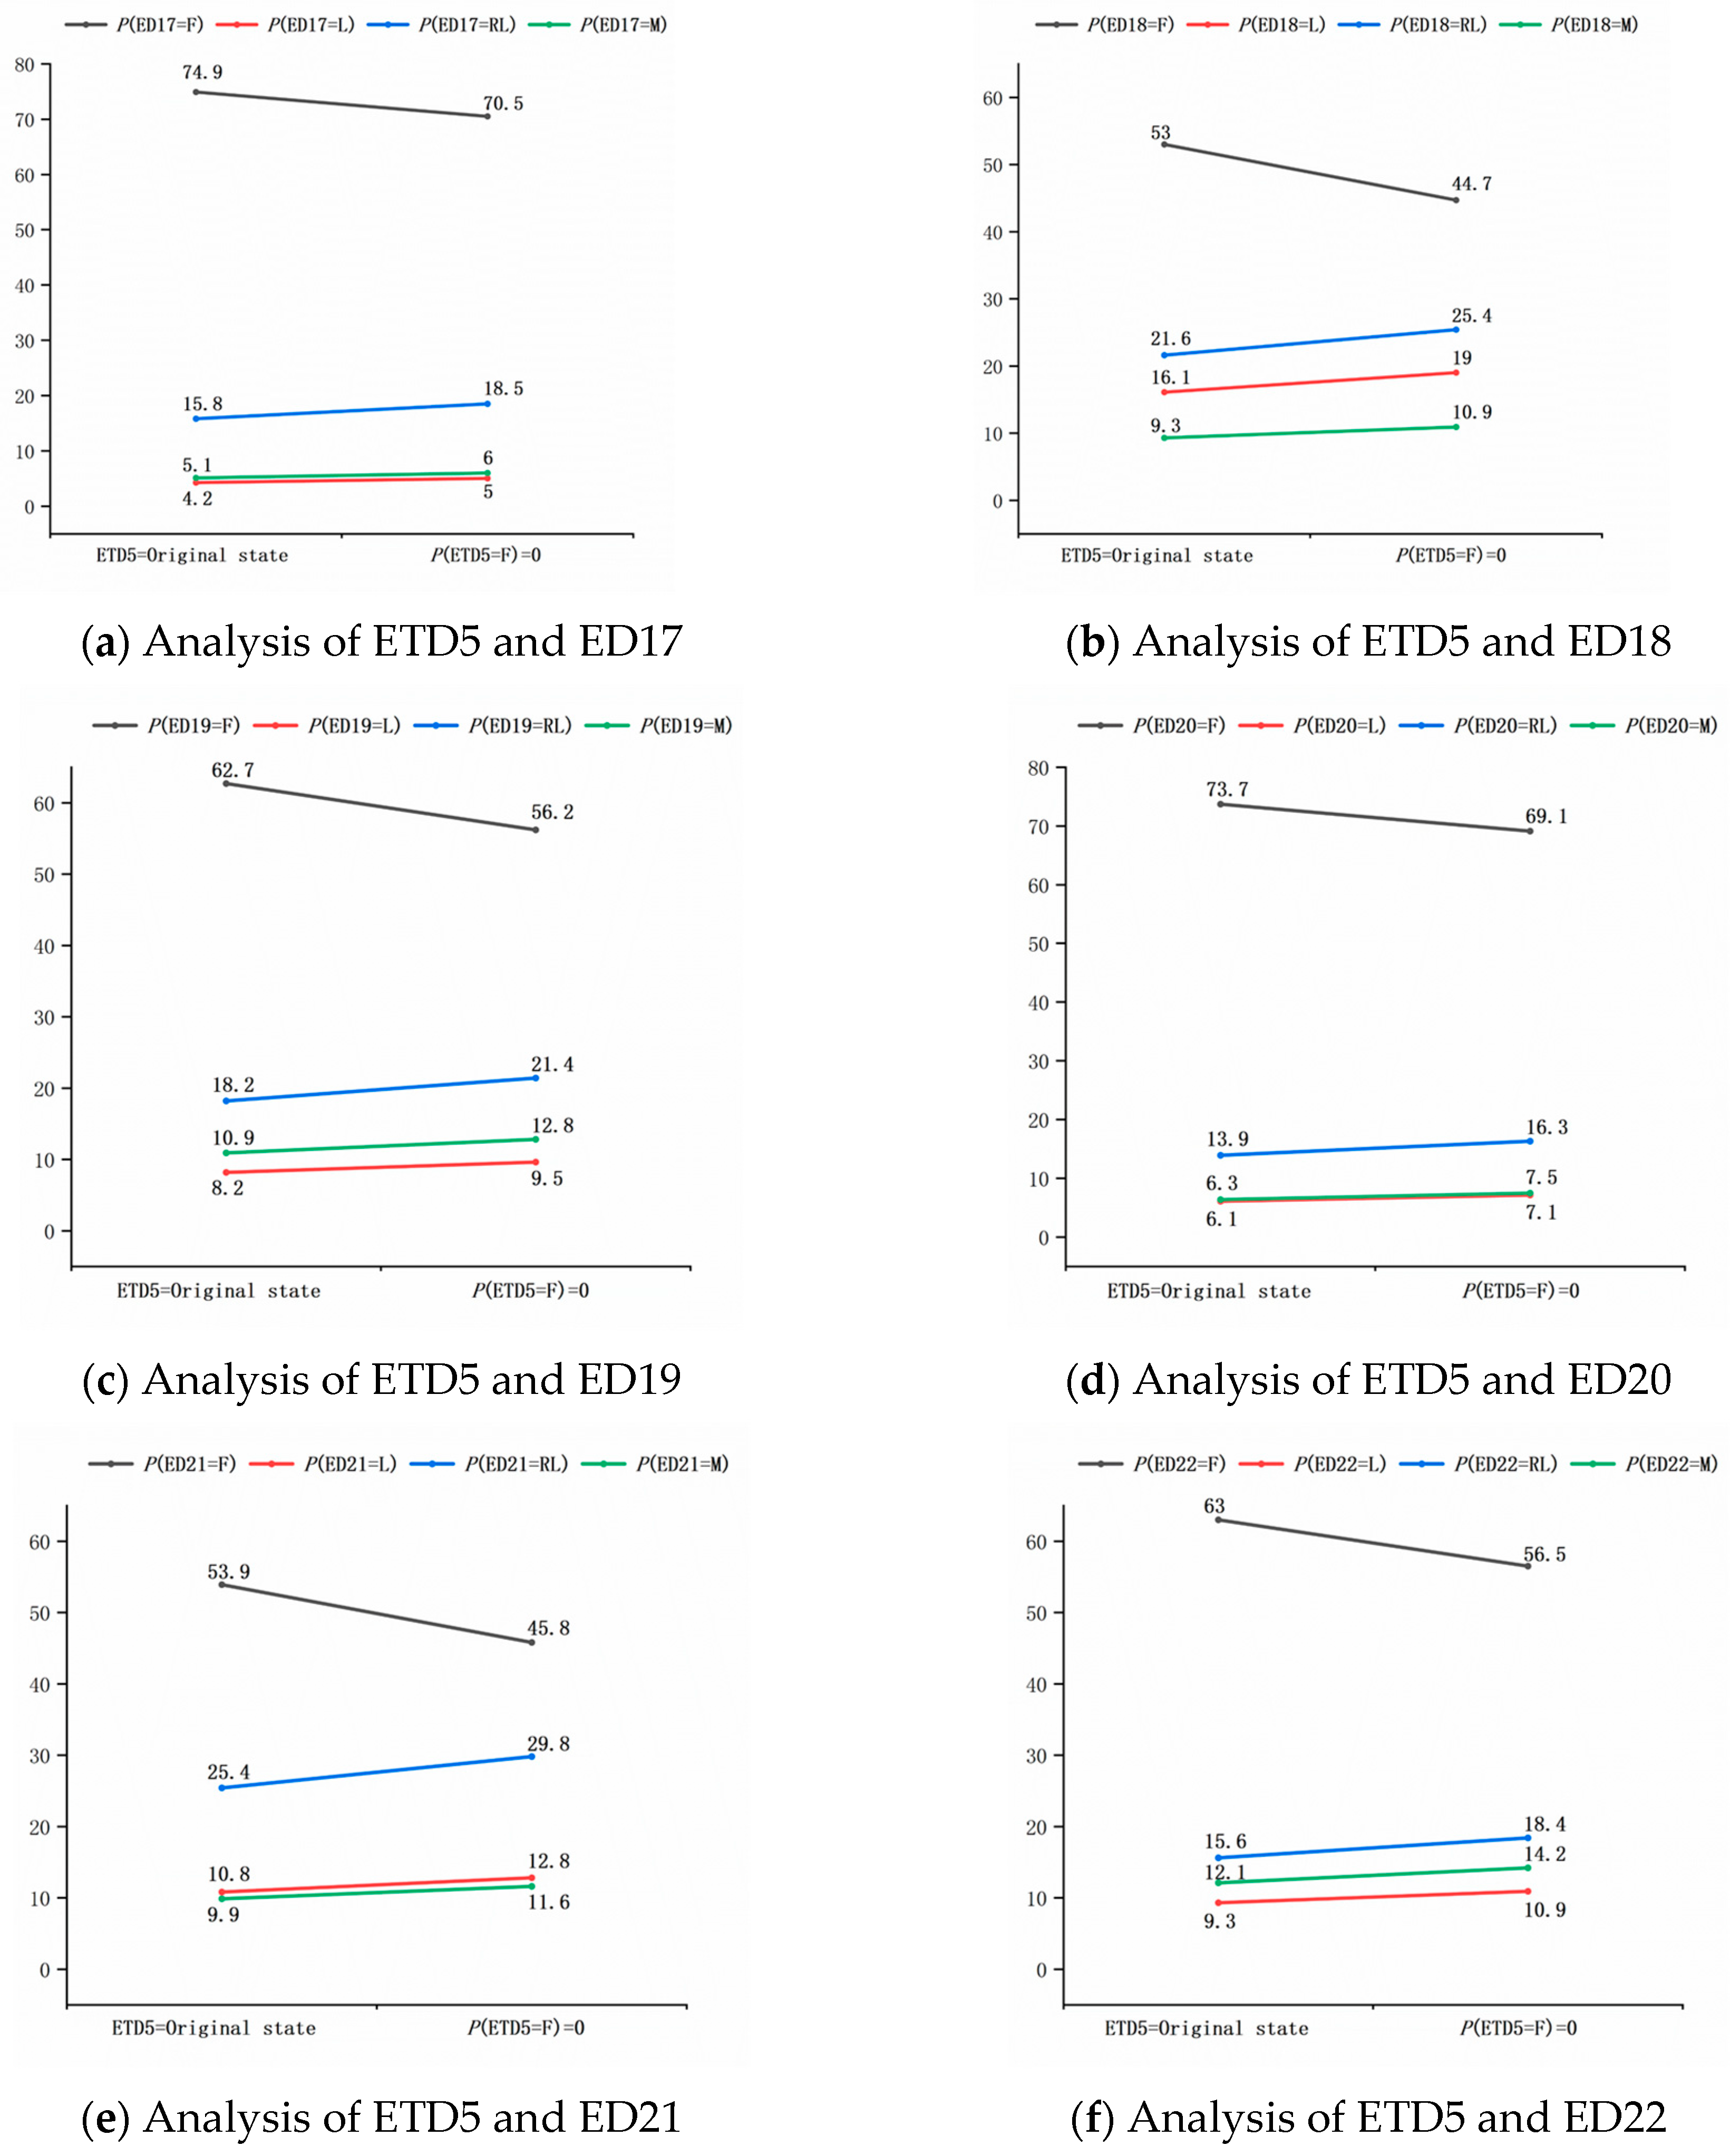
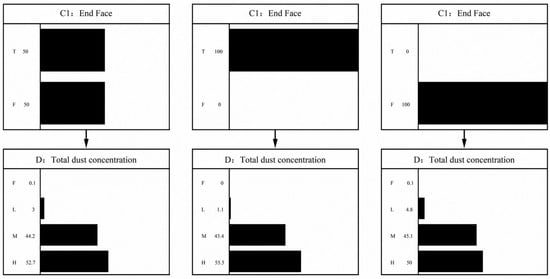
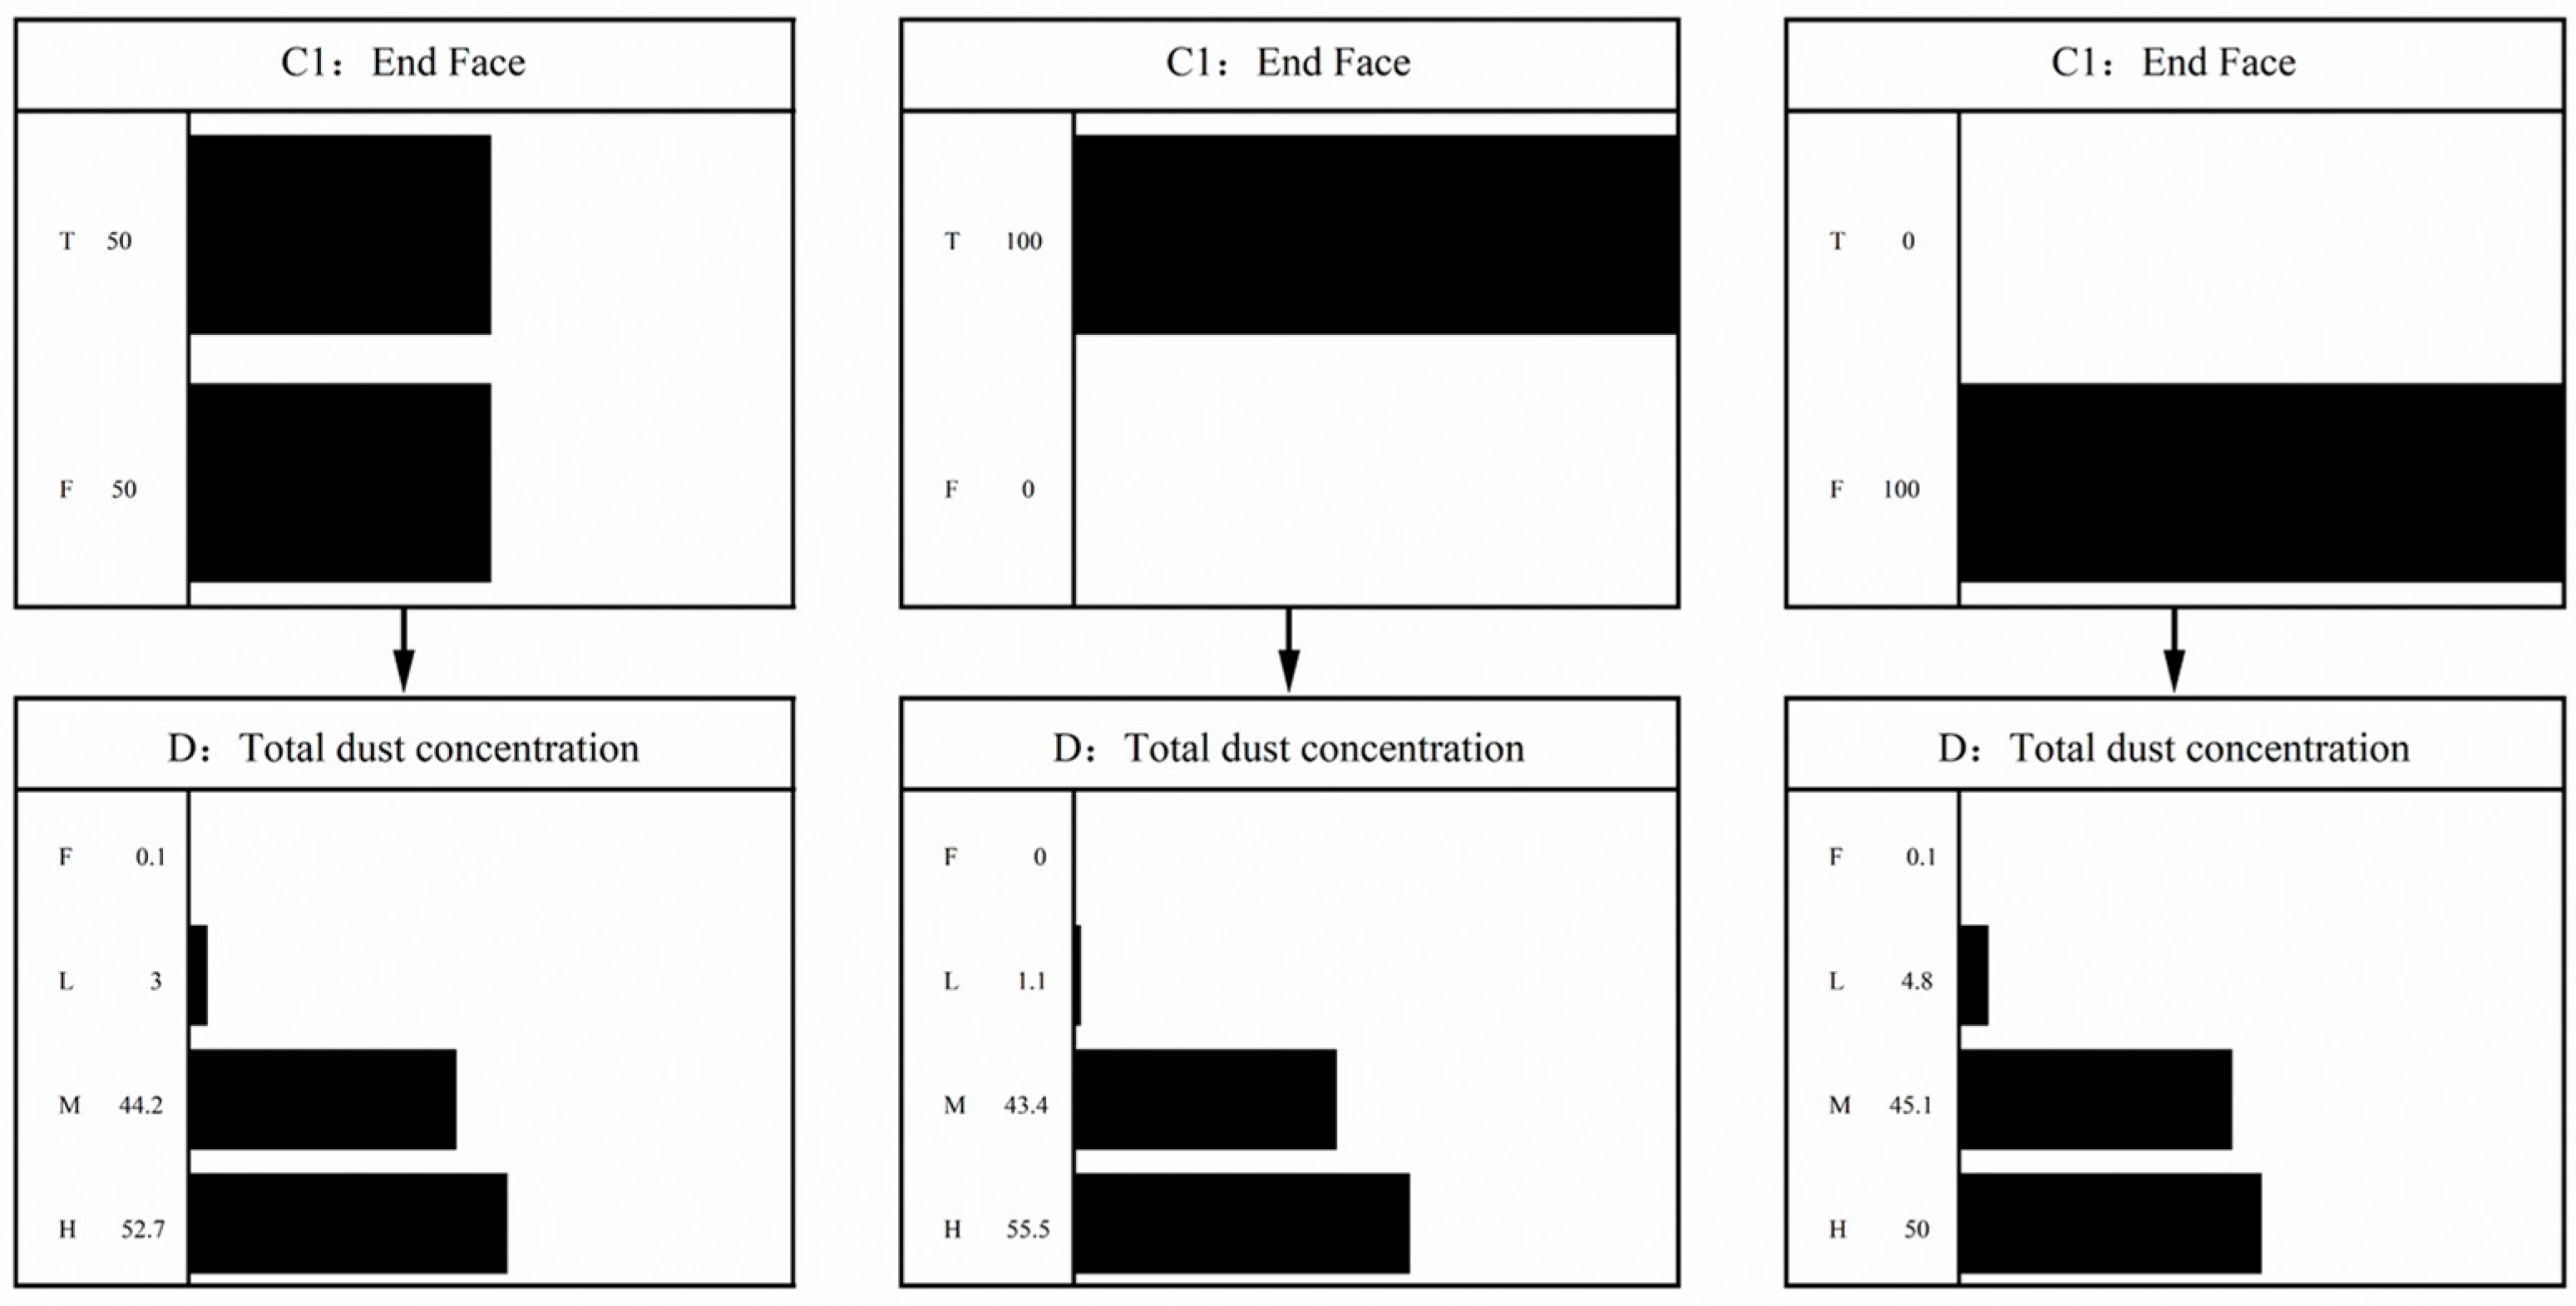
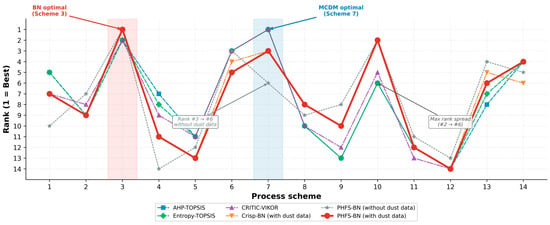
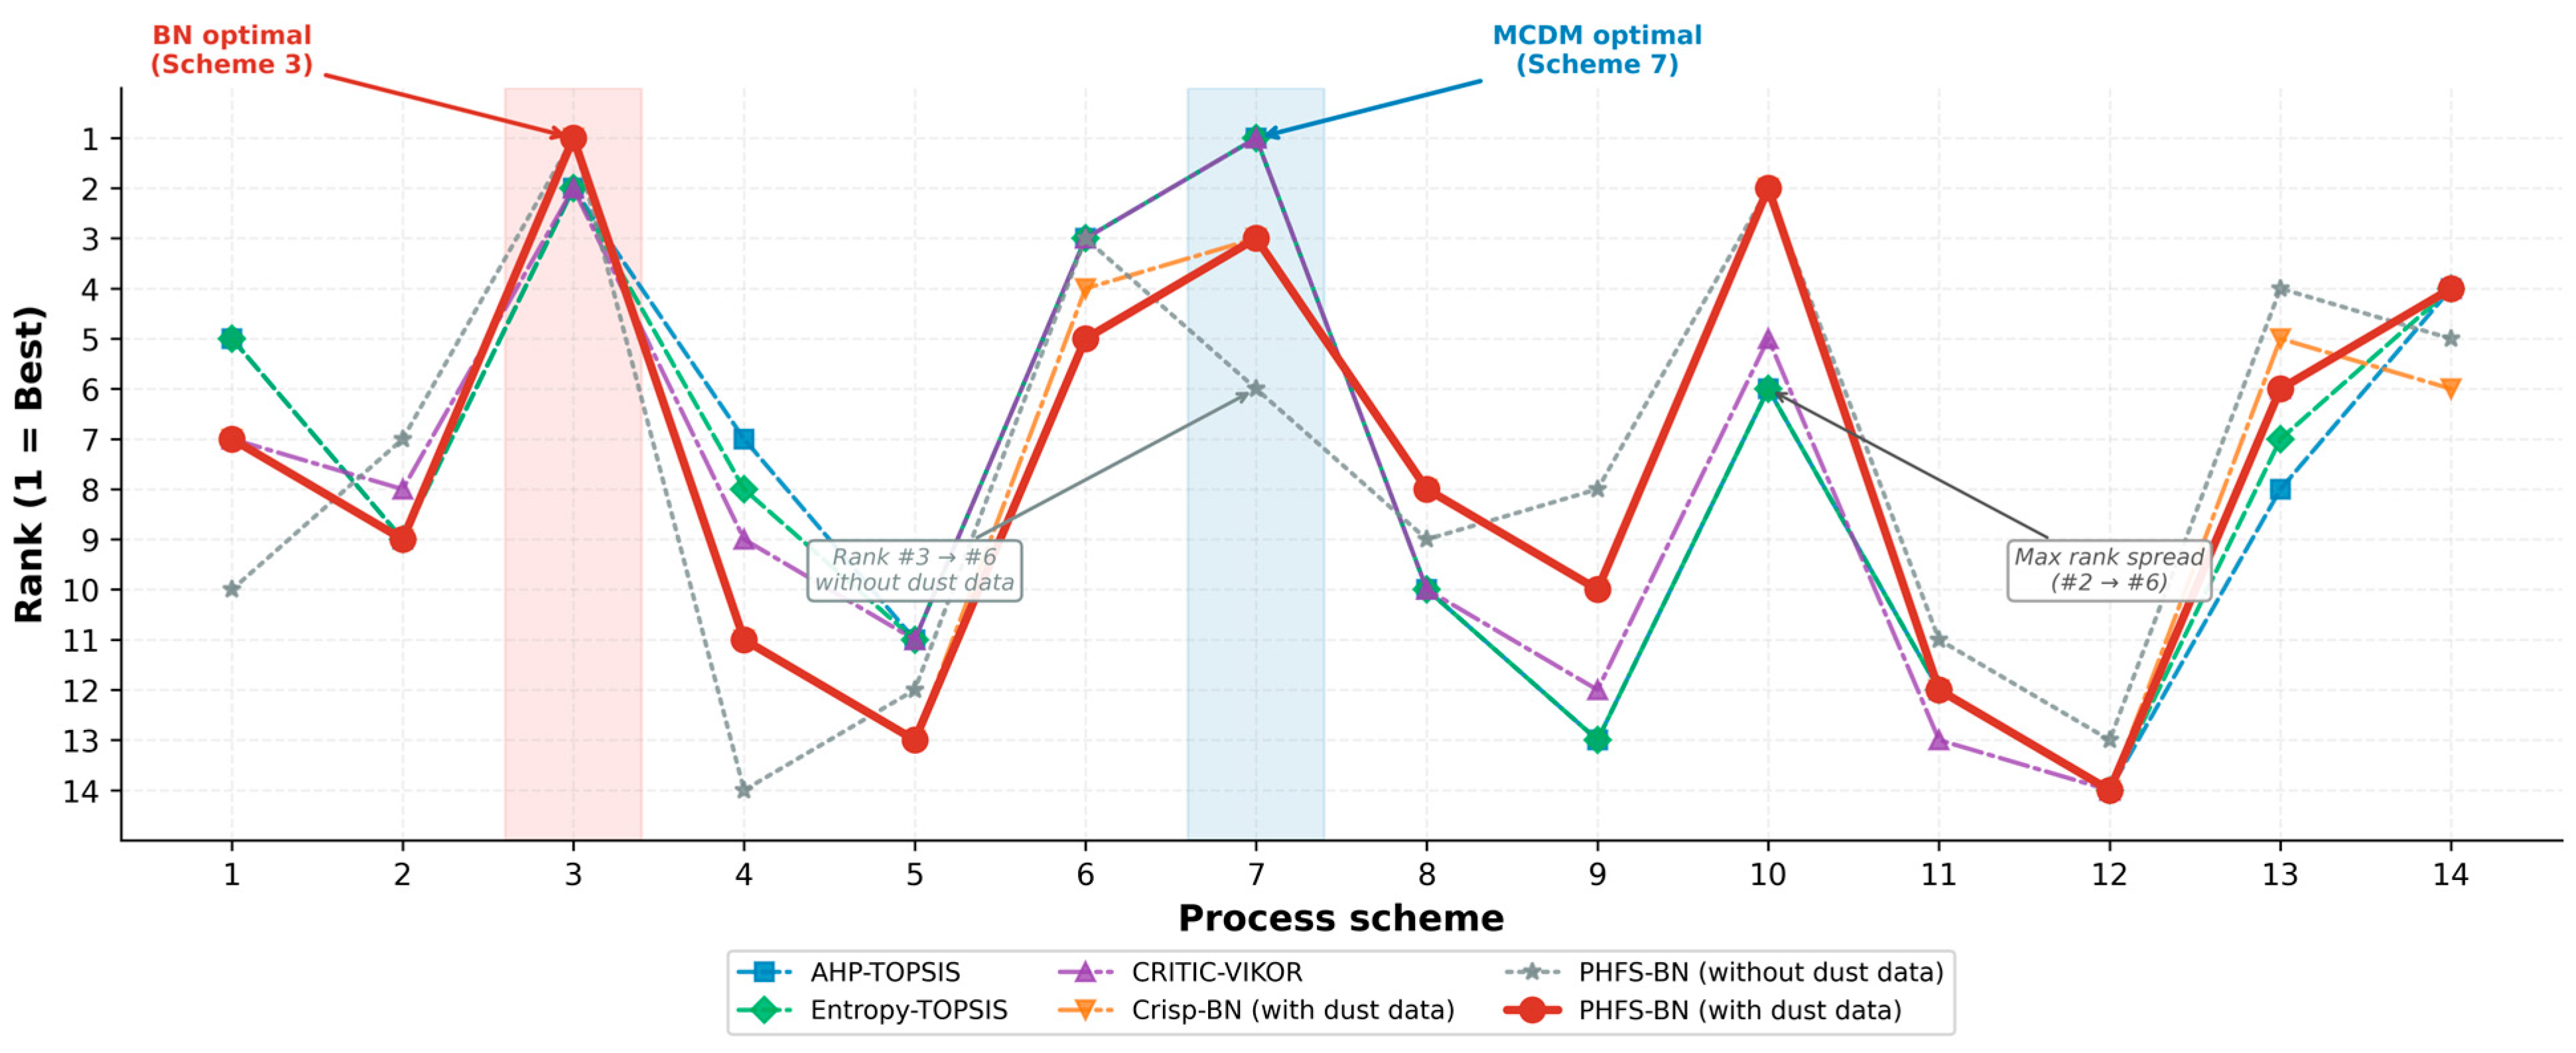
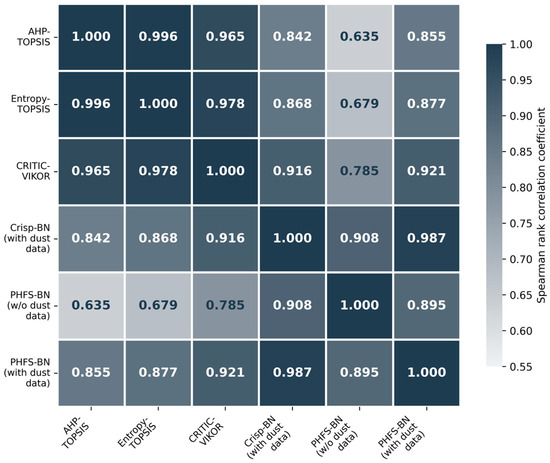
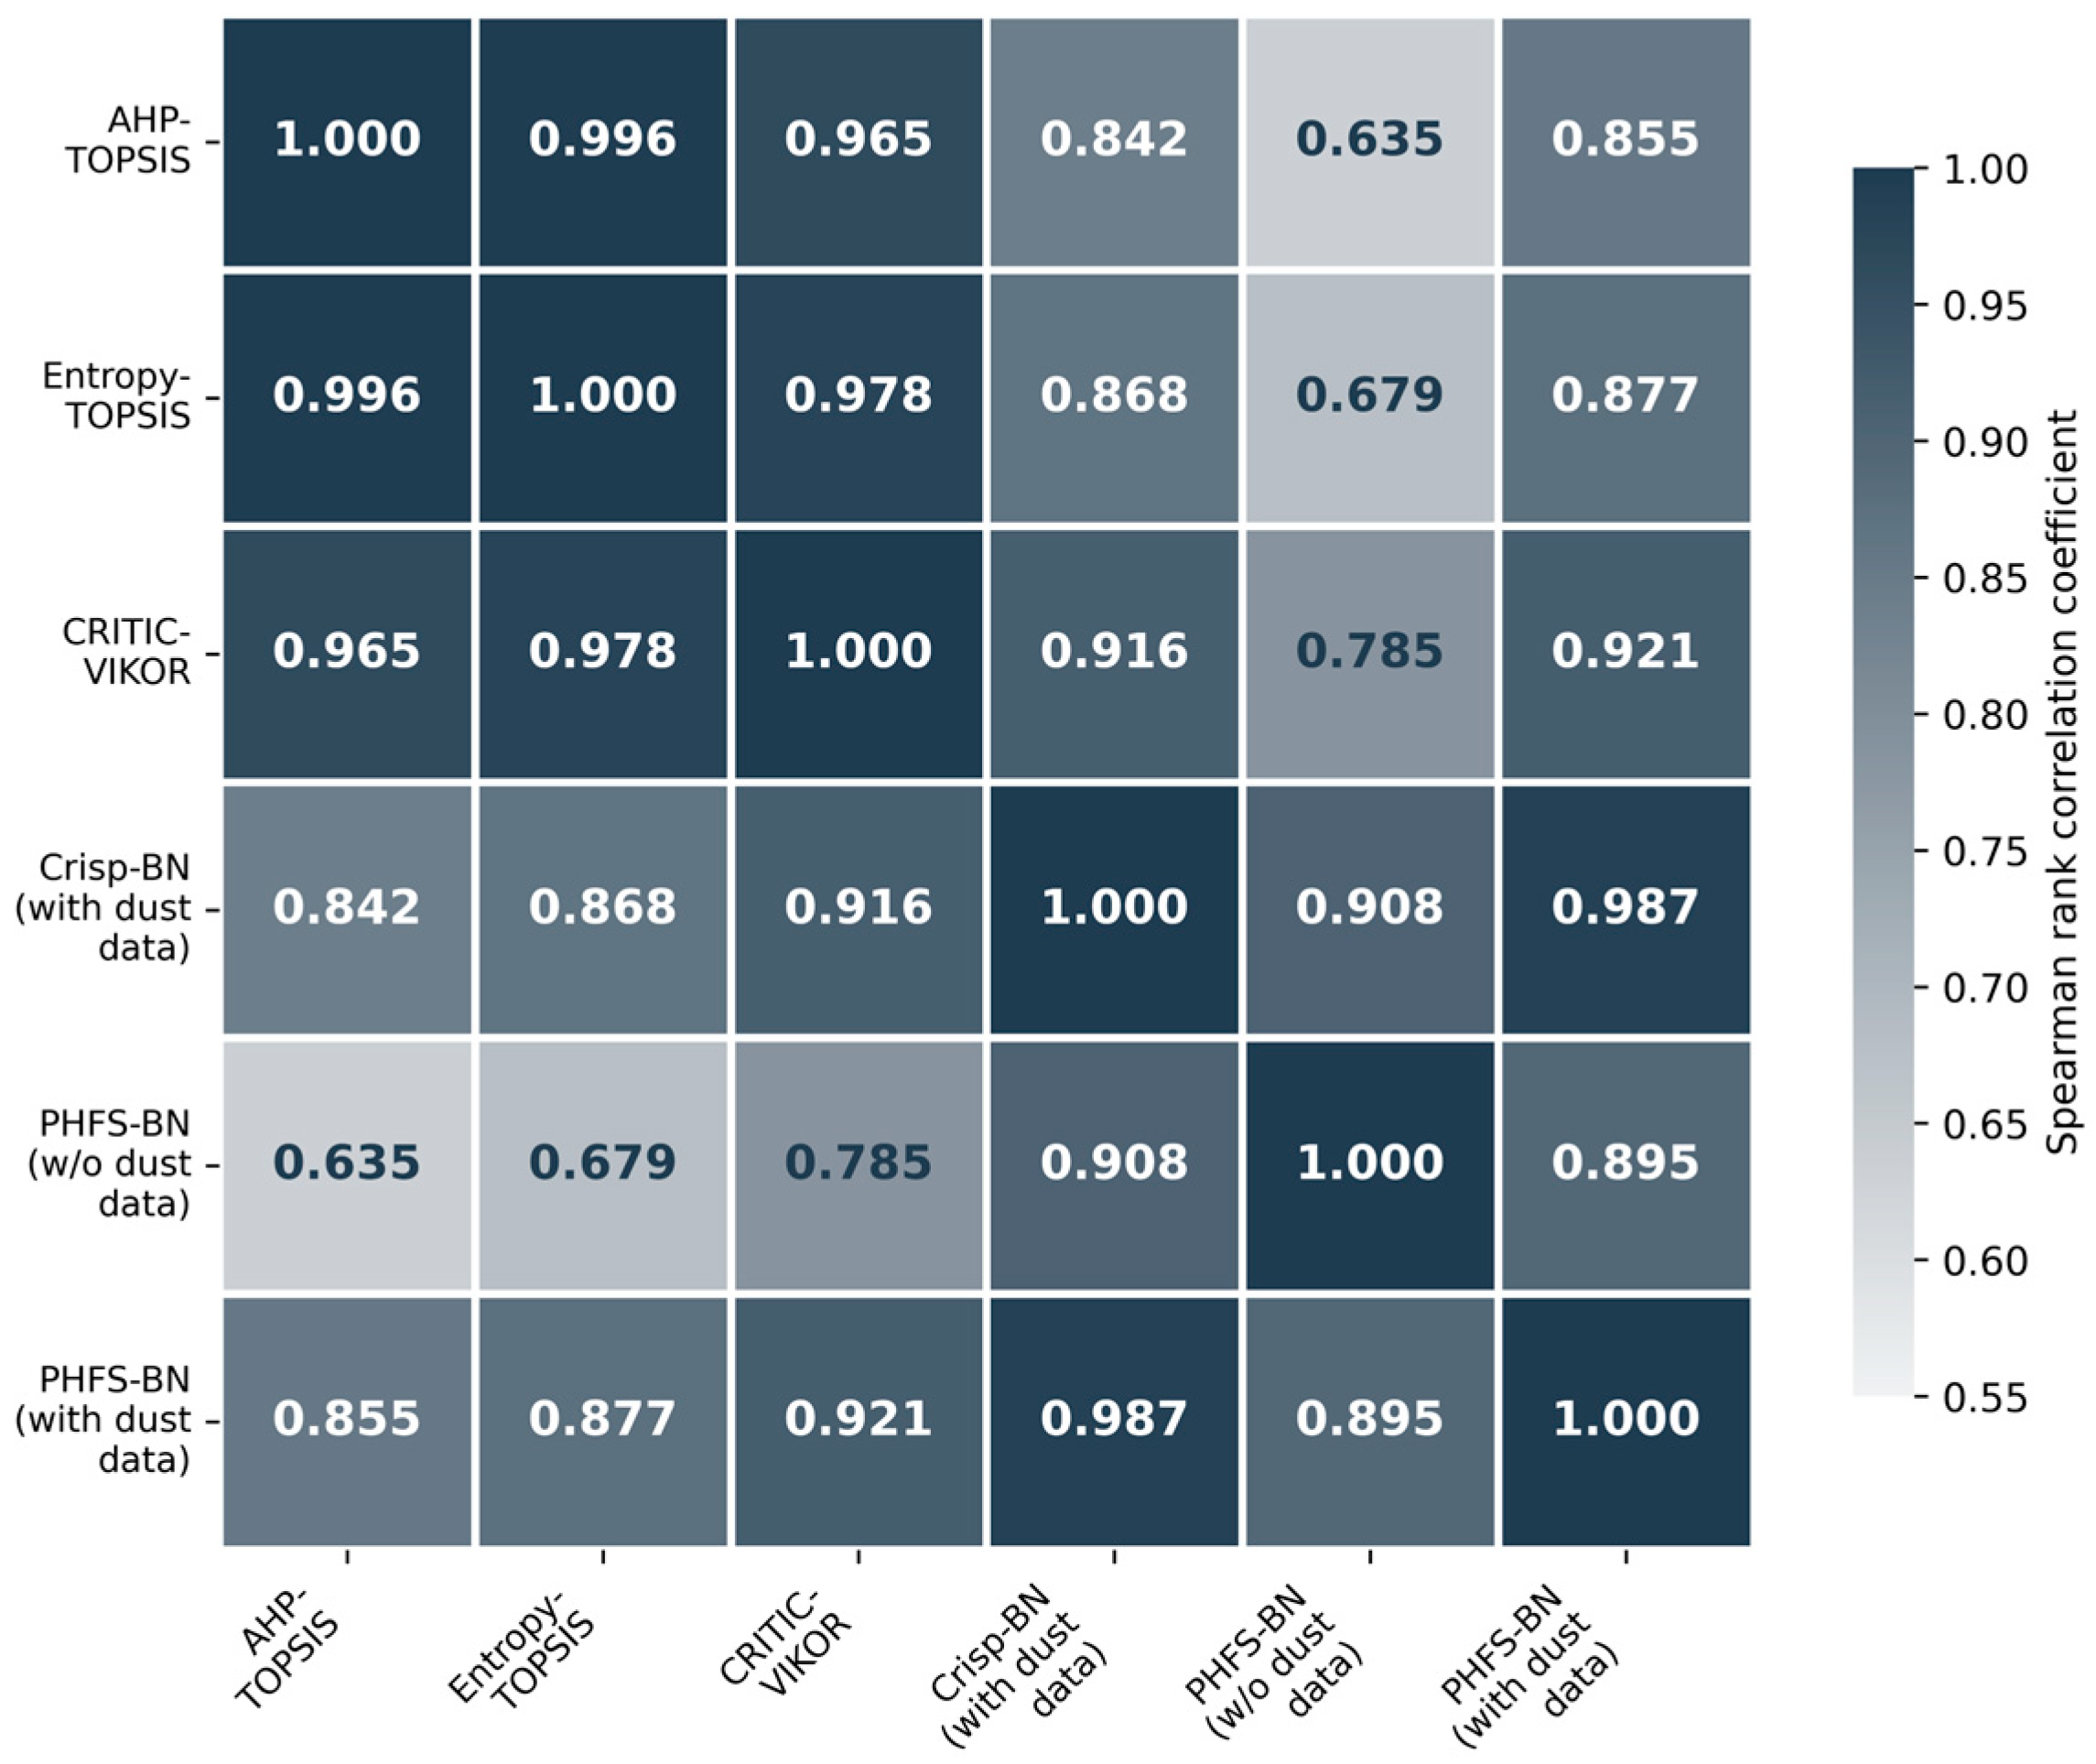






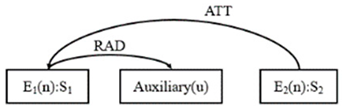
Disclaimer/Publisher’s Note: The statements, opinions and data contained in all publications are solely those of the individual author(s) and contributor(s) and not of MDPI and/or the editor(s). MDPI and/or the editor(s) disclaim responsibility for any injury to people or property resulting from any ideas, methods, instructions or products referred to in the content. |
© 2026 by the authors. Licensee MDPI, Basel, Switzerland. This article is an open access article distributed under the terms and conditions of the Creative Commons Attribution (CC BY) license.