


Abstract
Inorganic scale formation in oil wells is a major flow assurance challenge, causing production losses, increased intervention costs and reduced operational efficiency. In Brazil, recent discoveries in pre-salt reservoirs have increased the relevance of calcium carbonate (CaCO3) scaling under high-pressure and high-temperature (HPHT) conditions. Experimental data representative of petroleum environments under such conditions, particularly regarding the influence of CO2 and flow conditions, remain limited. In this study, a compact pressurized experimental unit was designed and constructed to investigate the dynamic formation, deposition and adhesion of CaCO3 under conditions close to those encountered in oil production systems. A dedicated experimental methodology was developed to promote controlled mixing of aqueous sodium bicarbonate (NaHCO3) and calcium chloride (CaCl2) solutions and CO2 injection, enabling precise control of pressure, temperature and flow regime. The effects of turbulent flow, expressed by different Reynolds numbers, on the deposited CaCO3 mass and its adhesion to the substrate were systematically evaluated under controlled conditions of 40 °C and a pressure drop of 15 bar was imposed in the control valve in order to promote the flash of CO2 and CaCO3 precipitation. Complementary characterization analyses were performed to assess crystal morphology and adhesion detachment strength. The results provide new experimental insights into CaCO3 scaling mechanisms under CO2-rich flowing conditions, contributing to improved understanding of scale adhesion and the development of mitigation strategies for flow assurance in oil and gas operations.
1. Introduction
The production of oil from the Brazilian pre-salt reservoirs is characterized by high concentrations of CO2 in the produced fluids, representing an important technological challenge for production and flow assurance operations [1]. In oil and gas production systems, inorganic scale formation is one of the main flow assurance problems, leading to flow restrictions, operational failures and significant increases in production costs [2,3]. Although different types of scales may occur in these systems, often in mixed forms (e.g., calcium and magnesium carbonates), calcium carbonate (CaCO3) is widely recognized as the most common inorganic scale found in petroleum fields [4,5].
Under reservoir pressure and temperature conditions, CO2 remains dissolved in the aqueous phase together with the chemical species of the carbonate system. However, during the production stage, the pressure reduction associated with fluid flow toward the surface may cause the release of dissolved CO2 as a gas phase, a phenomenon commonly referred to as CO2 flash [6]. The release of CO2 shifts the carbonate equilibrium, decreasing the acidity of the solution and increasing the supersaturation with respect to CaCO3, thereby promoting its precipitation [5,7,8]. The simplified chemical reaction associated with CaCO3 formation is presented in Equation (1).
Experimental studies indicate that CO2 flashing can represent a significant fraction of the total precipitated CaCO3, reaching up to 85% of the deposited mass under certain thermodynamic conditions, while only 15% is attributed to other thermodynamic effects at temperatures around 40 °C [9,10].
Carbonate scaling in pipelines is a dynamic process governed by the interaction of thermodynamic, kinetic and hydrodynamic phenomena [11]. Under supersaturated conditions, nucleation, crystal growth, transport and adhesion of CaCO3 crystals onto solid surfaces may occur simultaneously [12,13,14,15,16]. In addition to thermodynamic parameters, the crystalline morphology of calcium carbonate also plays an important role in the stability and adhesion of the deposits. CaCO3 can precipitate as the polymorphs calcite, aragonite and vaterite [17], whose structural differences influence the morphology and stability of the crystals formed [18]. Calcite, which presents the highest thermodynamic stability, is frequently associated with more persistent scale deposits in production systems [19]. Aragonite typically forms acicular crystals, while vaterite commonly precipitates as spherical aggregates [18,20]. In addition, surface properties such as roughness and surface free energy may influence heterogeneous nucleation and the initial attachment of crystals to the substrate [12,21,22].
Besides thermodynamic factors, hydrodynamic conditions play a significant role in carbonate scale formation [16]. The deposition of CaCO3 results from the balance between mass transport, crystal growth and hydrodynamic forces acting on the flow [23,24]. In turbulent regimes, increasing flow velocity may enhance mass transport and favor precipitation [25], whereas high shear stresses may simultaneously promote partial removal of deposits [26,27]. Consequently, hydrodynamic conditions can influence not only the deposition rate but also the morphology and adhesion strength of the resulting scale layer.
Several experimental studies have investigated scale formation under flowing conditions. Early investigations focused on evaluating scale inhibitor performance under thermal gradients and pressurized environments, establishing experimental methodologies for dynamic scaling studies [28]. Later experiments conducted in capillaries and small-scale systems demonstrated the influence of temperature and flow rate on CaCO3 deposition, although they presented limitations regarding reproducibility and representation of field conditions [29]. Tube blocking tests (TBT) became widely used for evaluating scale inhibitor performance under dynamic conditions by monitoring the pressure drop associated with scale growth inside small tubes [30,31,32].
Experimental investigations have also demonstrated that hydrodynamic conditions directly influence not only the deposition rate but also the characteristics of the resulting scale. Graham et al. [33] observed that the morphology and structure of CaCO3 deposits strongly depend on shear rate and turbulence levels, highlighting the need to reproduce hydrodynamic conditions in laboratory experiments representative of real field operations. Similarly, Goodwin et al. [34] reported that increased shear stress and turbulence intensity may enhance scaling potential when compared with low-shear laminar regimes, indicating that turbulence can promote the initial stages of deposition. Complementarily, Loureiro et al. [35], in experiments conducted in a large-scale laboratory facility, observed that increasing turbulence promotes higher crystal adhesion rates to the substrate, reinforcing the hypothesis that hydrodynamic effects play a determining role in the initial attachment of carbonate scale.
However, most of these methodologies were primarily designed to evaluate the chemical efficiency of inhibitors and frequently operate under restricted hydrodynamic regimes, which may not adequately reproduce the combined effects of turbulence and CO2 participation on scale formation.
Despite the advances in the understanding of carbonate scaling mechanisms, experimental studies capable of simultaneously reproducing key characteristics of petroleum production systems, such as high pressure, turbulent flow and the presence of dissolved CO2, remain limited. Consequently, there is still a lack of experimental data capable of quantitatively evaluating CaCO3 formation and adhesion under turbulent flow conditions in pressurized environments containing CO2.
In this context, the present study experimentally investigates carbonate scale formation under controlled turbulent flow conditions in the presence of CO2. A high-pressure experimental flow loop with continuous CO2 injection was developed to reproduce hydrodynamic conditions more representative of real production systems. The study focuses on the quantification of the deposited CaCO3 mass and the analysis of crystal adhesion onto solid surfaces, providing experimental data that may contribute to the future development of predictive models and computational simulations of carbonate scaling.
2. Materials and Methods
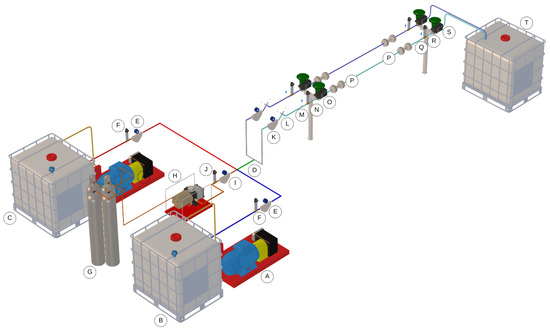
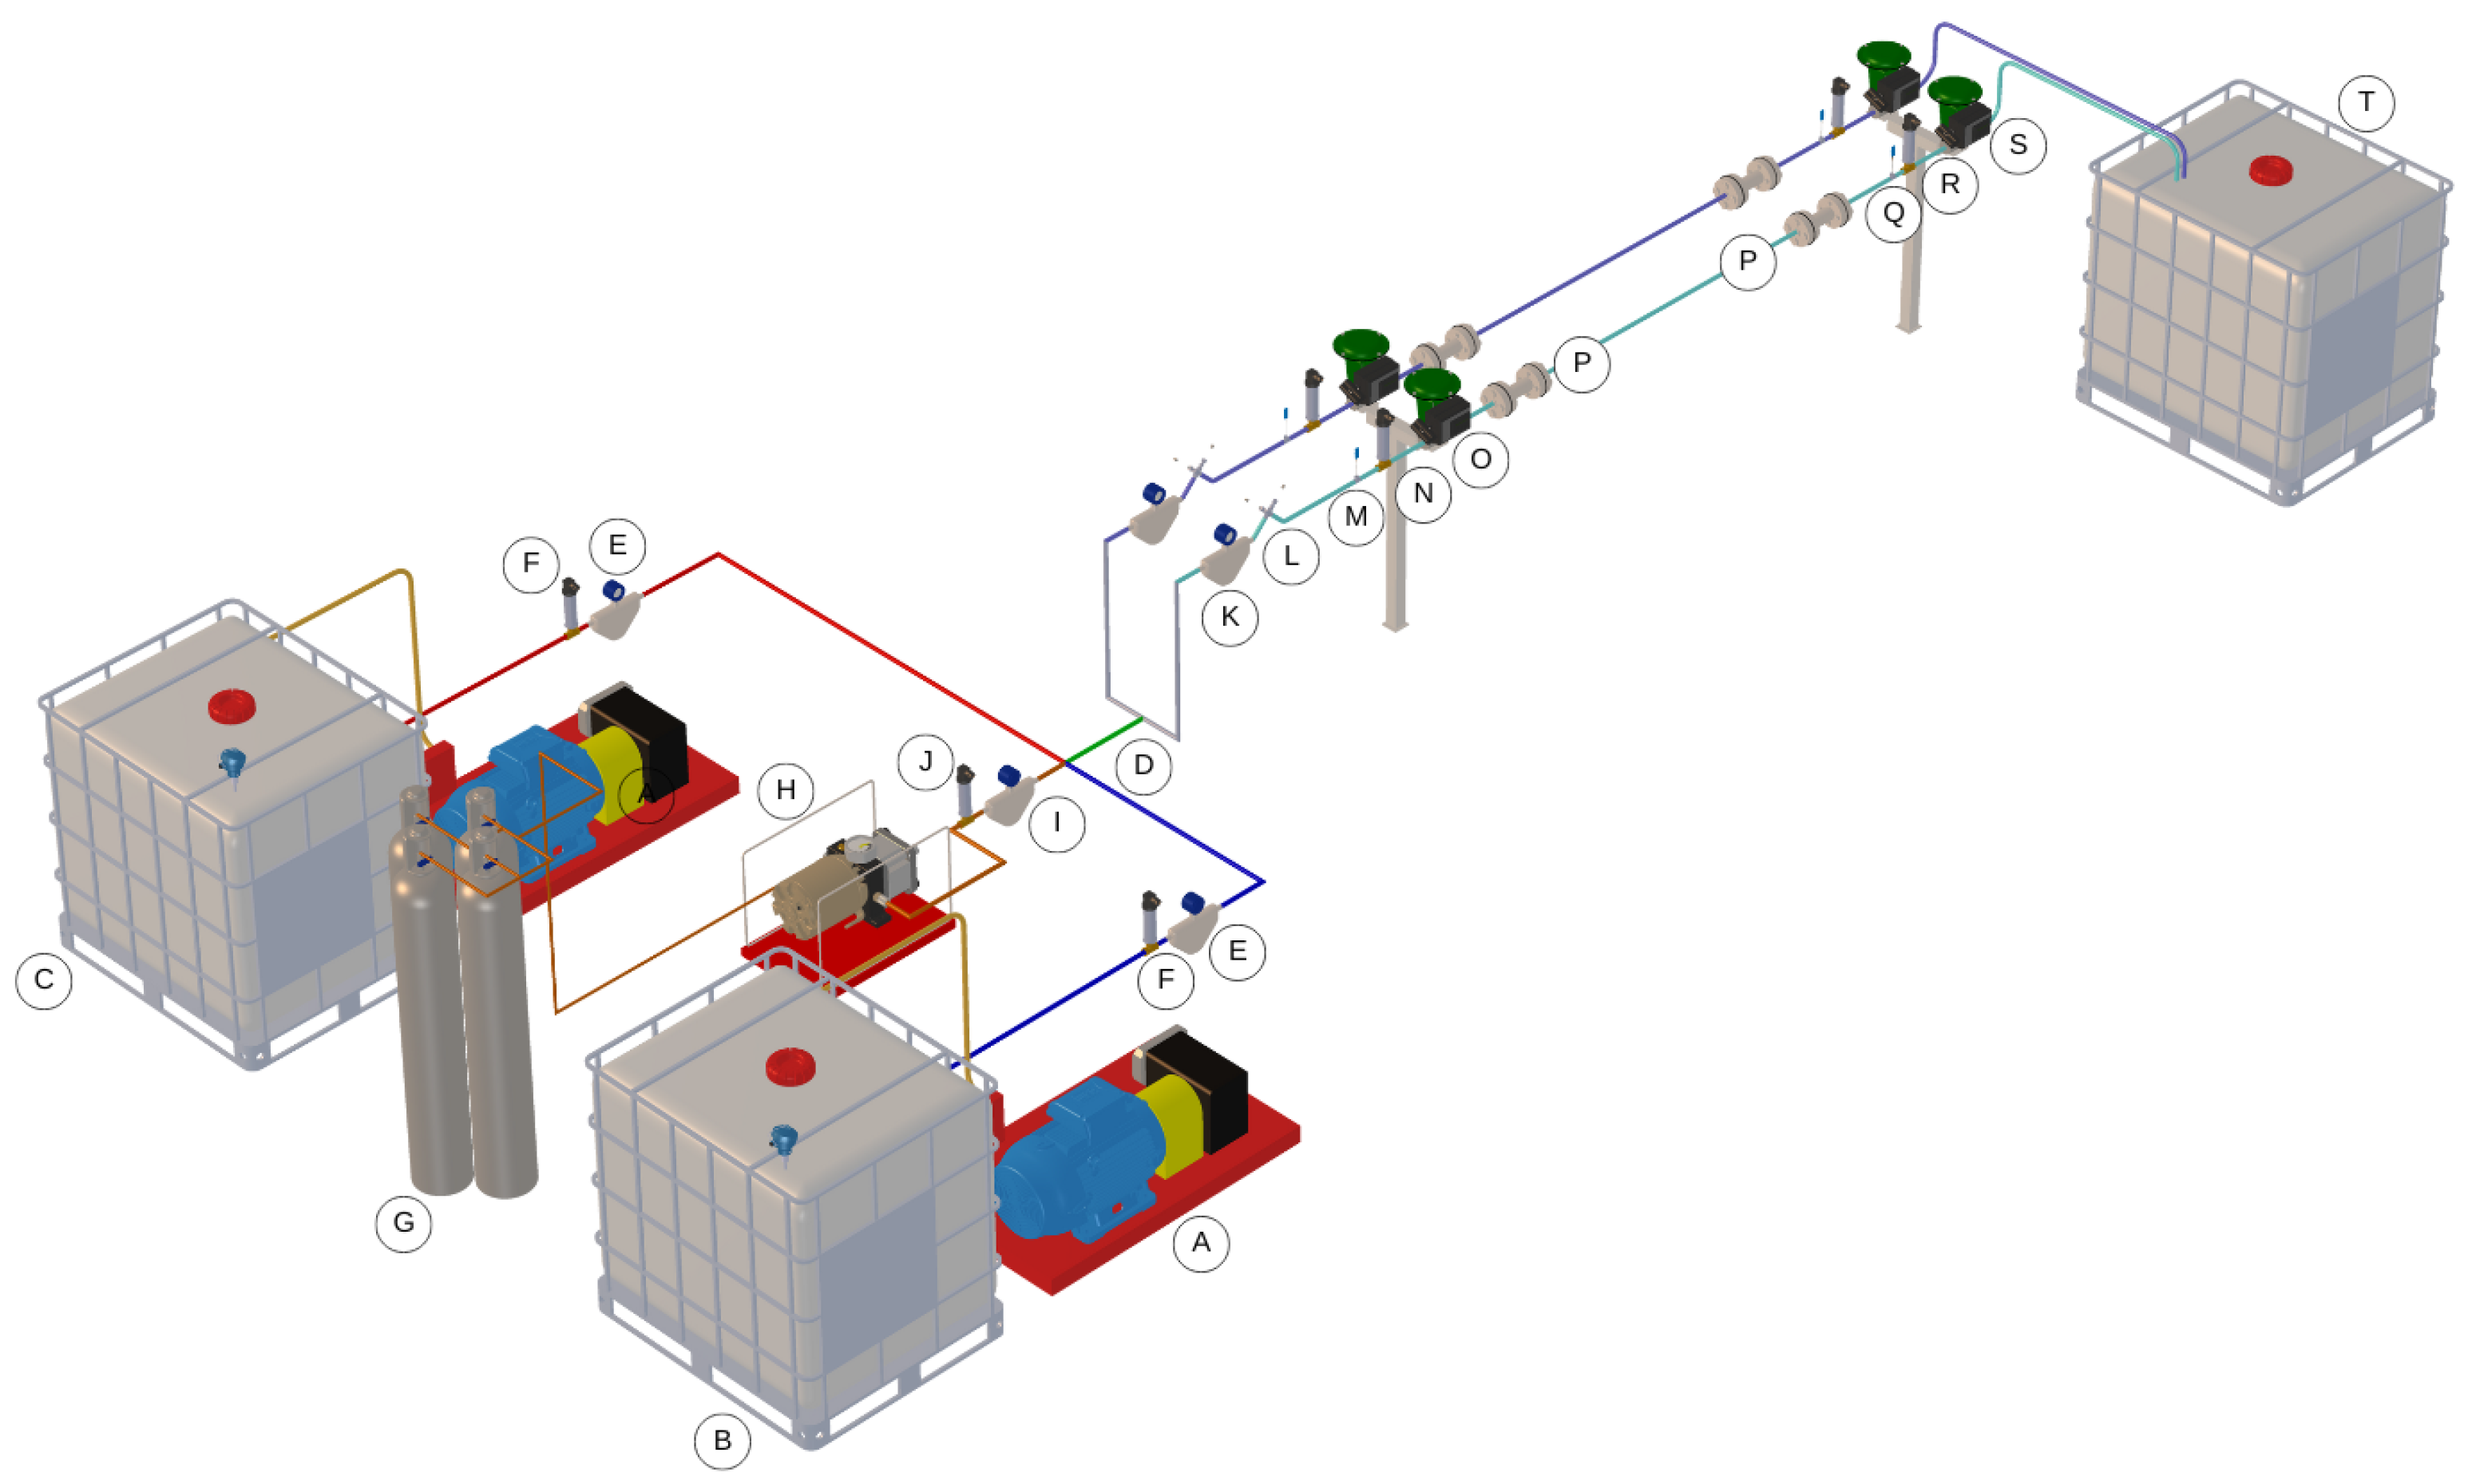
The experimental unit (Figure 1) was designed as an open-loop circuit to reproduce the effects of carbonate scaling induced by mixing saline solutions of sodium bicarbonate (NaHCO3) and calcium chloride (CaCl2). Temperature and pressure conditions are controlled and CO2 injection is implemented, representing a key experimental feature of the setup.
Figure 1.
Schematic of the pressurized experimental unit. The letters (A–T) indicate the main components of the system, as described in the text.
High-pressure pumps (A) independently transport the sodium bicarbonate solution (B) and the calcium chloride solution (C) through their respective flow lines to the mixing point (D), where calcium carbonate crystal formation may be initiated. Coriolis-type mass flow meters (E) and pressure transducers (F) are used to monitor the operating variables of each solution. In parallel, CO2 is supplied from a gas cylinder system (G) and injected via a pneumatic pump (H), equipped with a dedicated Coriolis flow meter for CO2 (I) and a pressure transducer (J). After mixing, the flow is divided into two lines with similar flow rates, each proceeding through separate test sections. Each section contains a Coriolis flow meter (K), a pair of pH probes (L), a thermocouple (M), a pressure transducer (N), and a first proportional control valve (O), which induces local depressurization and promotes CO2 flashing. From this point onward, conditions favor CaCO3 precipitation and scaling. Downstream of the local depressurization stage, a straight test section specifically designed for scaling investigation is installed. In this section, each test cell (P) accommodates four coupons, which are interchangeable metallic specimens used to avoid any geometric alteration of the flow cross-section during the experiments. The coupons are manufactured from AISI 316L stainless steel and sandblasted to ensure an isotropic surface condition. Further along the straight section, a thermocouple (Q), a pressure transducer (R), and a second proportional control valve (S) are positioned to establish the target pressure conditions for each experiment. At the end of the line, the fluid is discharged into a disposal tank (T), where it is stored, treated, and properly discarded. The technical characteristics of the experimental unit are presented in Table 1.
Table 1.
Technical characteristics of the experimental unit.
Process variables are monitored and controlled through a supervisory control system using LabVIEW 2019 (National Instruments, Austin, TX, USA) responsible for data acquisition and control of the manipulated variables. At the end of each experiment, the specimens are removed from the flow line and sent for analyses of the solids adhered to their surfaces. After completion of the test, a 10% v/v acetic acid solution is injected to promote the dissolution of the formed crystals and, consequently, the cleaning of the experimental unit.
2.1. Preparation of Aqueous Solutions
The aqueous sodium bicarbonate and calcium chloride solutions were prepared in 1000 L batches in a dedicated facility under controlled temperature conditions, with concentrations of 12.6 g/L and 7.3 g/L, respectively [35]. Solution preparation included water deionization, reagent mixing, and a solvation period of seven days [36,37]. Water deionization was performed to eliminate the influence of additional chemical species not accounted for in the calcium carbonate formation reactions. The solvation process promotes the dissociation of solute molecular bonds and the interaction of ions with solvent molecules, in this case water. Allowing sufficient solvation time ensures solution homogeneity and stability, preventing premature precipitation or ionic agglomeration that could affect the experimental results. During the solvation period, the NaHCO3 solution was stored under static conditions, while the CaCl2 solution was maintained under daily agitation to ensure complete dissolution and homogeneity. Prior to each experiment, both solutions were visually inspected to confirm the absence of sediment or pre-precipitation, ensuring their stability and suitability for the experimental runs.
2.2. Surface Characterization
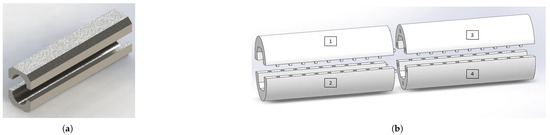
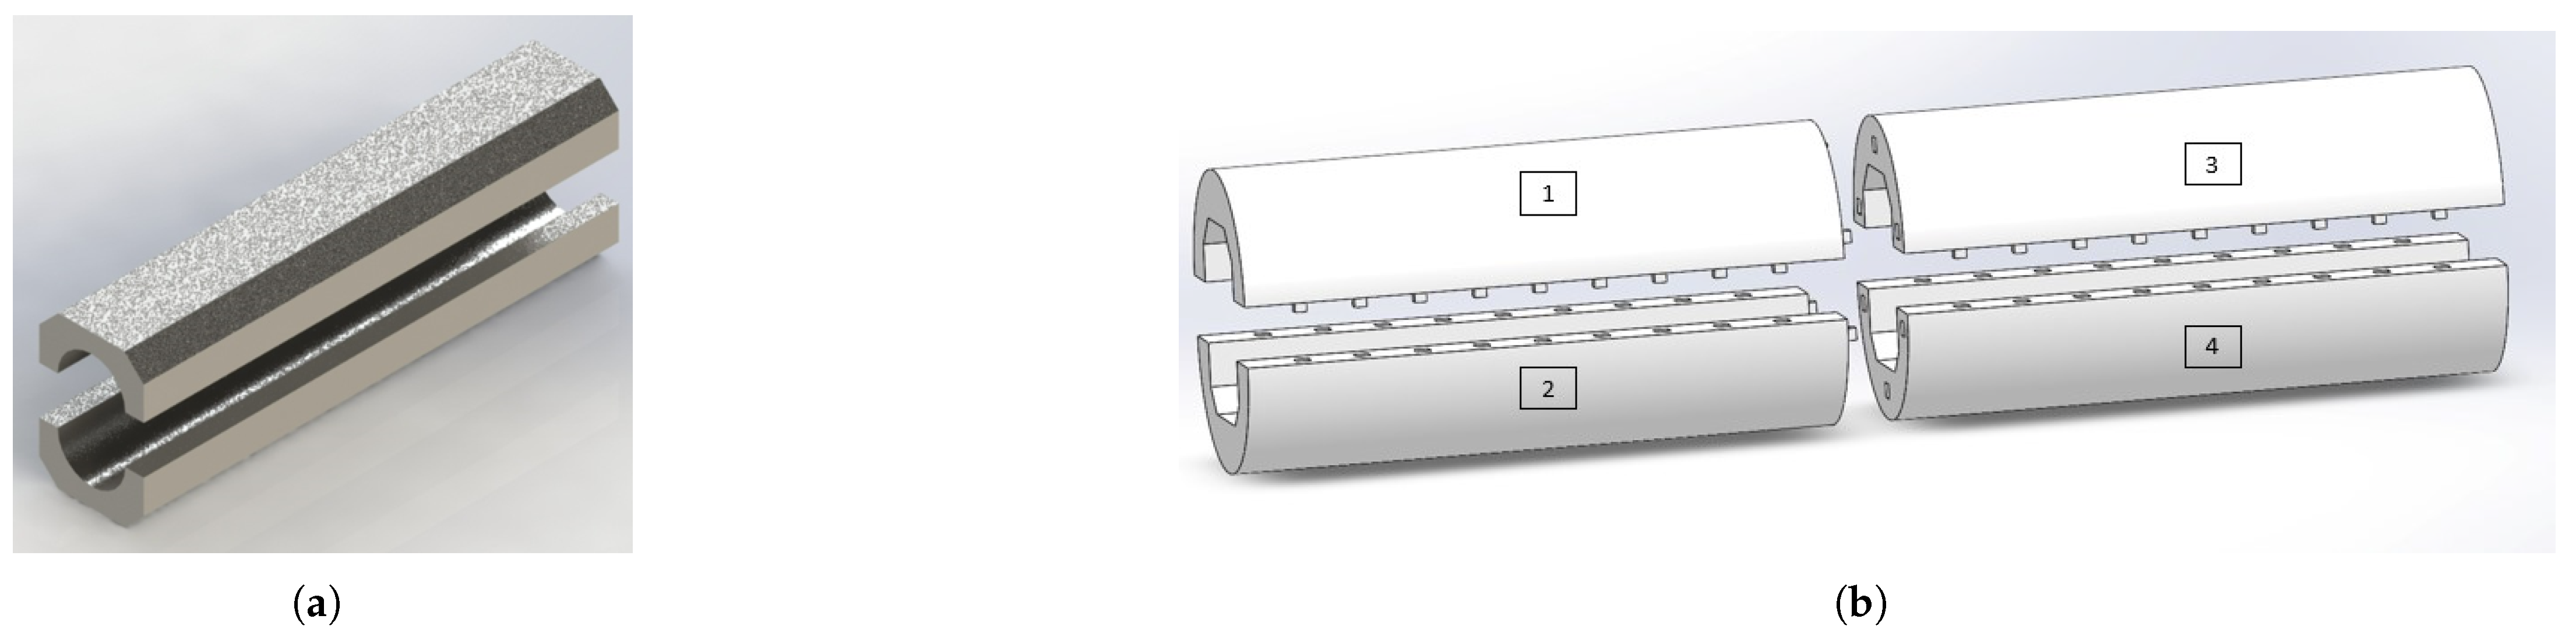
In addition to careful solution preparation, surface parameters were treated as a relevant factor due to their influence on the carbonate scaling phenomenon [12,21]. Surface characterization was based on roughness measurements, which describe surface irregularities formed by peaks and valleys (height variations). The parameters (arithmetic mean of height deviations relative to the mean surface line) and (root mean square of height deviations) were determined using a Sensofar optical profilometer. For the analysis of variance (ANOVA) of surface roughness, three sandblasted specimens were selected, and seven sampling points were randomly collected on each specimen. It is important to note that the specimens were always positioned in the same configuration within the test line using a split housing manufactured by additive manufacturing, as illustrated in Figure 2. The specimens were assembled and disassembled for each experiment.
Figure 2.
Illustration of (a) the split cylindrical specimens and (b) the assembly configuration in the test line. The numbers (1–4) indicate the fixed positions of each coupon.
2.3. Experimental Procedure
The Reynolds number was calculated according to , where is the fluid density, v is the average flow velocity, is the internal pipe diameter and is the dynamic viscosity. The internal diameter used in the calculations was 14.23 mm, obtained from the outer diameter of 19.05 mm and wall thickness of 2.41 mm. Fluid properties were considered at the experimental temperatures of 25 °C and 40 °C.
Two groups of experimental tests were conducted. The first group consisted of comparative tests designed to demonstrate the importance of CO2 participation in the carbonate scaling process under identical experimental conditions, alternately with and without CO2 injection. These tests were performed at a temperature of 25 °C and Reynolds number ( L/h).
For the second group of tests, conducted under variable Reynolds numbers (), the temperature was increased to better approximate reservoir conditions. The solutions were previously heated to 40 °C using a 7000 W immersion electric heater. Under these conditions, the solution density was 1002.8 kg/m3 and the dynamic viscosity was 0.00109 Pa·s. The upstream pressure of the control valve was maintained at 15 bar, while the downstream pressure was atmospheric, resulting in a pressure drop of 15 bar. CO2 was injected upstream of the control valve and kept constant throughout the 20 min duration of each experimental run. Under these conditions, it was considered to be predominantly dissolved in the aqueous phase prior to the pressure drop. The pressure drop across the valve promoted CO2 flash, leading to local supersaturation and CaCO3 precipitation. All tests were performed in triplicate.
2.4. Post-Experimental Analyses
After completion of each experimental run, the scaling rate was calculated from the mass difference of CaCO3 adhered to the surface of each coupon, measured using an analytical balance (0.1 mg resolution, MS304TS/A00, Mettler Toledo, Columbus, OH, USA). The specimens were weighed before and after each test, and the mass difference was divided by the experiment duration.
Scratch tests were performed using a microtribometer equipped with a Rockwell C indenter (CSM Instruments, Peseux, Switzerland) applying a load ramp from 0.5 to 20.5 N over a scratch length of 20 mm to determine substrate exposure. The detachment force was estimated by measuring the scratch length and multiplying it by the loading rate (1 N/mm), followed by the addition of the preload value (0.5 N). Scratch measurements were analyzed using a ZEISS Stereo Discovery V20 microscope (Carl Zeiss AG, Oberkochen, Germany).
The formed crystals were examined by scanning electron microscopy (SEM, JEOL, Tokyo, Japan), after sputter coating with a gold target. The CaCO3 polymorphs present (calcite, aragonite, and vaterite) were identified through X-ray diffraction (XRD) analyses. Data were acquired over a range from 5° to 80°, with a step size of 0.02°, using a diffractometer (D8-ADVANCE, Bruker, Billerica, MA, USA) equipped with a standard diffraction system, quantitative analysis software, and Powder Diffraction Files (PDF) database.
3. Results and Discussion
3.1. Surface Roughness Analysis
To ensure that surface roughness would not act as a variable influencing calcium carbonate crystal adhesion, a statistical analysis of the specimen surfaces was performed. In general, the roughness measurements, identified as and , presented mean values close to their respective medians, indicating a symmetric data distribution. The average value was 1.01 μm with a standard deviation of 0.10 μm, while the average value was 1.29 μm with a standard deviation of 0.13 μm. For these parameters, no statistically significant differences were detected among the applied treatments considering a significance level of 5%. Additionally, the model residuals satisfied the assumptions of normality and homogeneity of variances. Therefore, the sandblasted surface condition of the specimens provided a consistent surface effect across all experiments conducted in this study.
3.2. Effect of CO2 on CaCO3 Crystals Deposited on Surfaces
Since CO2 promotes acidic pH conditions prior to depressurization, a lower extent of crystal formation is expected under such regulation of the medium. In the test conducted without CO2 injection, the measured pH was 8.0 and the scaling rate reached 8.04 mg of CaCO3/min. In contrast, with CO2 injection, the pH decreased to 6.5 and the scaling rate was reduced to 5.92 mg of CaCO3/min.
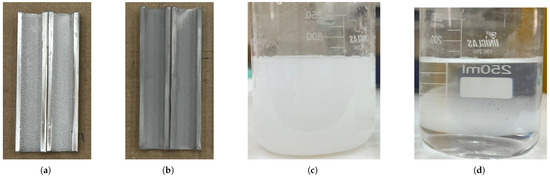
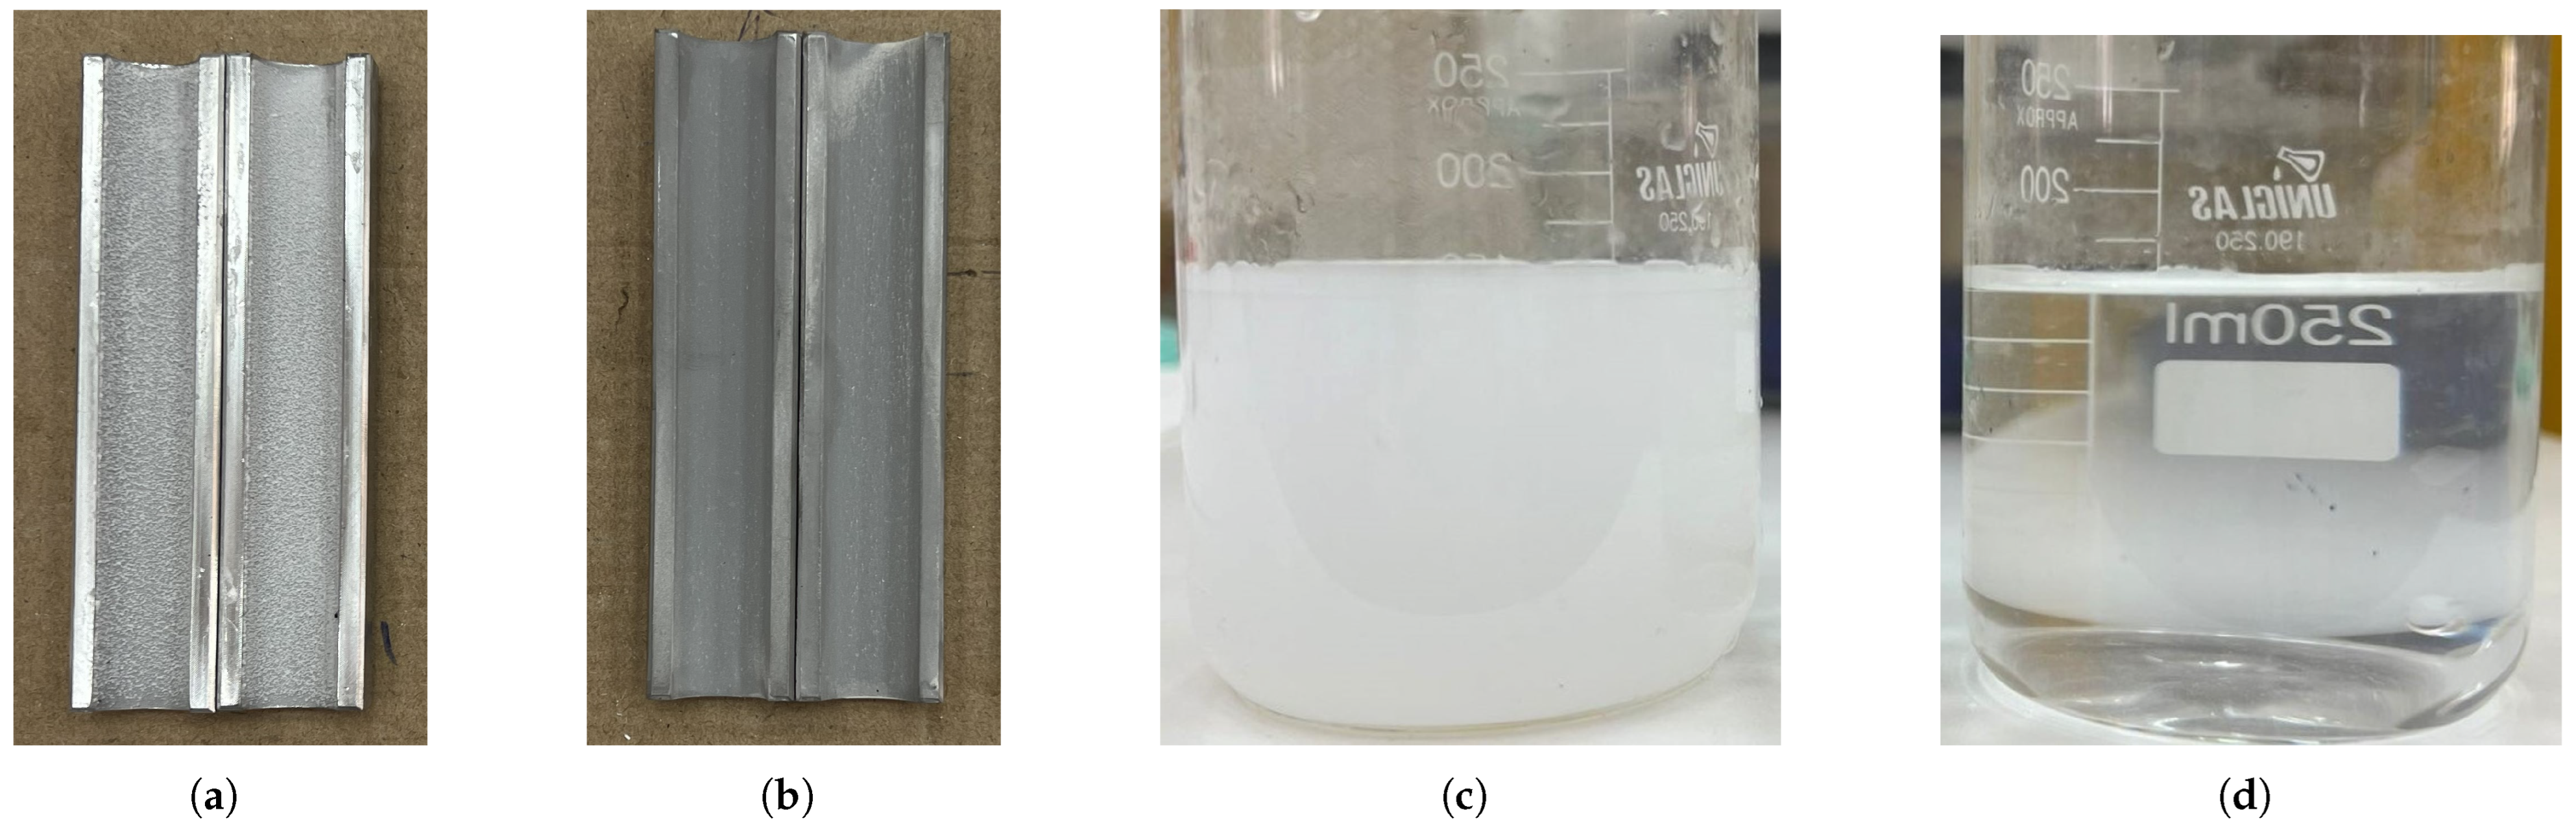
Figure 3 illustrates the visual differences in particle adhesion on the surfaces. In the absence of CO2 injection, particle formation exhibited a talc-like appearance (Figure 3a), with deposits that were easily removed from the coupon surface. Conversely, when CO2 was injected, fewer particles were formed, yet they displayed significantly stronger adhesion to the metallic surfaces (Figure 3b), as indicated by the more pronounced gray coloration characteristic of the AISI 316L stainless steel substrate. The influence of CO2 on the reaction medium was also evident in the effluent samples. Without CO2 injection (Figure 3c), the discharged solution appeared turbid, indicating enhanced CaCO3 crystal formation. When CO2 injection was applied (Figure 3d), reduced crystal formation resulted in a clearer solution. The same coupons were analyzed by profilometry after the experiments to evaluate the thickness of the deposited layer. For the test without CO2 injection, the CaCO3 layer height reached 529.06 μm. Under CO2 injection, the measured layer height decreased to 94.62 μm. These results clearly demonstrate the influence of CaCO3 formation as governed by pH control through CO2 injection.
Figure 3.
Observation of CaCO3 crystal formation under experimental conditions of 25 °C and = 8011 (Q = 450 L/h). (a) Coupons with crystals adhered to the surface in the absence of CO2. (b) Coupons with crystals adhered to the surface in the presence of CO2. (c) Effluent sample collected without CO2 injection. (d) Effluent sample collected with CO2 injection.
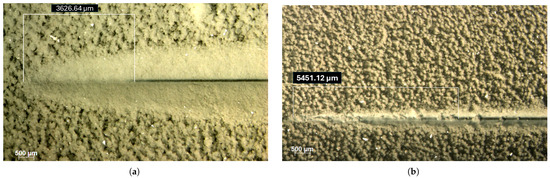
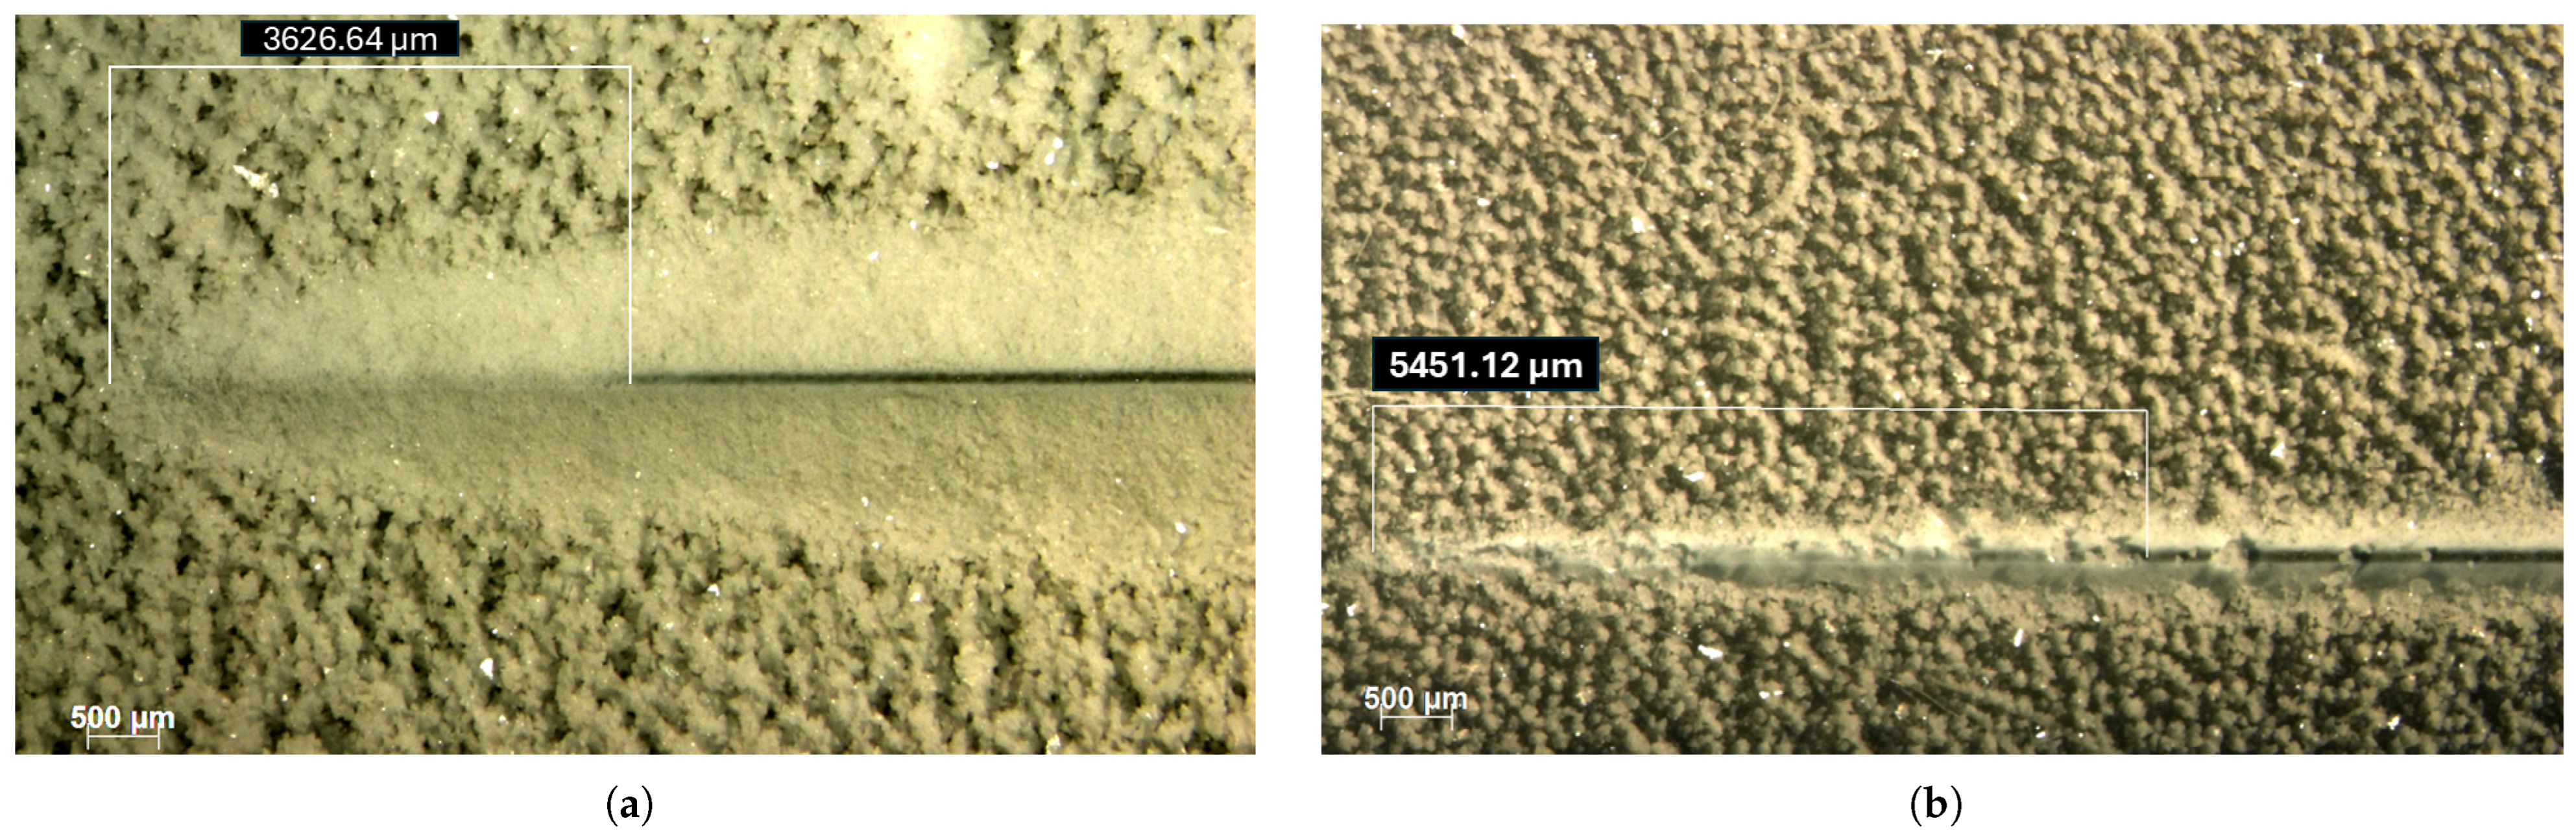
The scratch test results provide important insight into the mechanical integrity of the CaCO3 deposits. The stereomicroscopy images presented in Figure 4 illustrate the scratch length at which the indenter penetrated the deposit layer and the associated crystal characteristics. The shorter scratch length required to reach the substrate (3626.64 μm), observed in the absence of CO2 (Figure 4a), reflects reduced mechanical stability, consistent with lower adhesion and cohesion energies. The more agglomerated morphology under these conditions likely contributed to the diminished structural integrity of the deposit, facilitating crack initiation and particle detachment during scratching. In contrast, the longer scratch length required for substrate exposure (5451.12 μm) under CO2 injection (Figure 4b) indicates that the deposit exhibited greater resistance to mechanical failure. This behavior suggests increased effective adhesion energy at the deposit–substrate interface, along with enhanced cohesive strength within the crystalline layer. Therefore, although CO2 injection reduced the overall scaling rate, it promoted the formation of deposits with higher mechanical strength and stronger interfacial bonding. These findings highlight the dual role of CO2 in carbonate scaling processes, simultaneously influencing precipitation kinetics and the mechanical properties of the resulting crystalline deposits.
Figure 4.
Stereomicroscopy images of the coupons subjected to the scratch test after experiments conducted at 25 °C and = 8011 (Q = 450 L/h). (a) Absence of CO2 with substrate exposure after a scratch length of 3626.64 μm. (b) Presence of CO2 with substrate exposure after a scratch length of 5451.12 μm.
As the presence of CO2 may affect wettability and surface energy [38], it is reasonable to consider that CO2 may also influence interfacial interactions between the fluid and the substrate surface [39]. Although these effects were not directly measured, they may contribute to stronger crystal attachment and to the increased adhesion of CaCO3 deposits observed in this study.
The presented results demonstrate clear experimental differences in the precipitation potential, scaling behavior and adhesion of CaCO3 crystals under conditions with and without CO2 injection. In the absence of CO2, greater CaCO3 crystal formation was observed; however, the deposits exhibited weaker adhesion to the substrate. Conversely, in the presence of CO2, reduced CaCO3 formation occurred due to pH regulation, while the resulting deposits displayed stronger adhesion to the substrate. This effect should be carefully considered when designing new carbonate scaling experiments, as CO2 actively participates in the reaction medium. In the study by Cosmo [10], the influence of solution acidification and its impact on CaCO3 formation was preliminarily discussed under batch conditions, based on the theoretical interpretation of Bjerrum diagrams.
3.3. Effect of Turbulent Flow on CaCO3 Deposition and Adhesion
Understanding how turbulence levels influence particle transport and CaCO3 adhesion along a pipeline in the presence of CO2 can guide the development of more effective scale mitigation strategies. Table 2 summarizes the results obtained for the Reynolds number, total CaCO3 mass formed, CaCO3 scaling rate, and substrate exposure for experimental runs conducted over 20 min with a pressure drop of 15 bar and a temperature of 40 °C. The Reynolds number is presented with expanded uncertainty (), while CaCO3 mass and CaCO3 scaling rate are reported as mean values with standard deviations. Substrate exposure values were obtained from representative samples due to the experimental limitations of the scratch test.
Table 2.
Scaling results under CO2 injection.
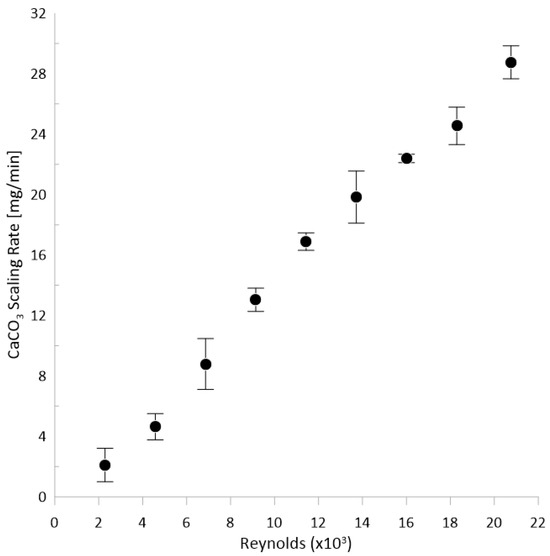
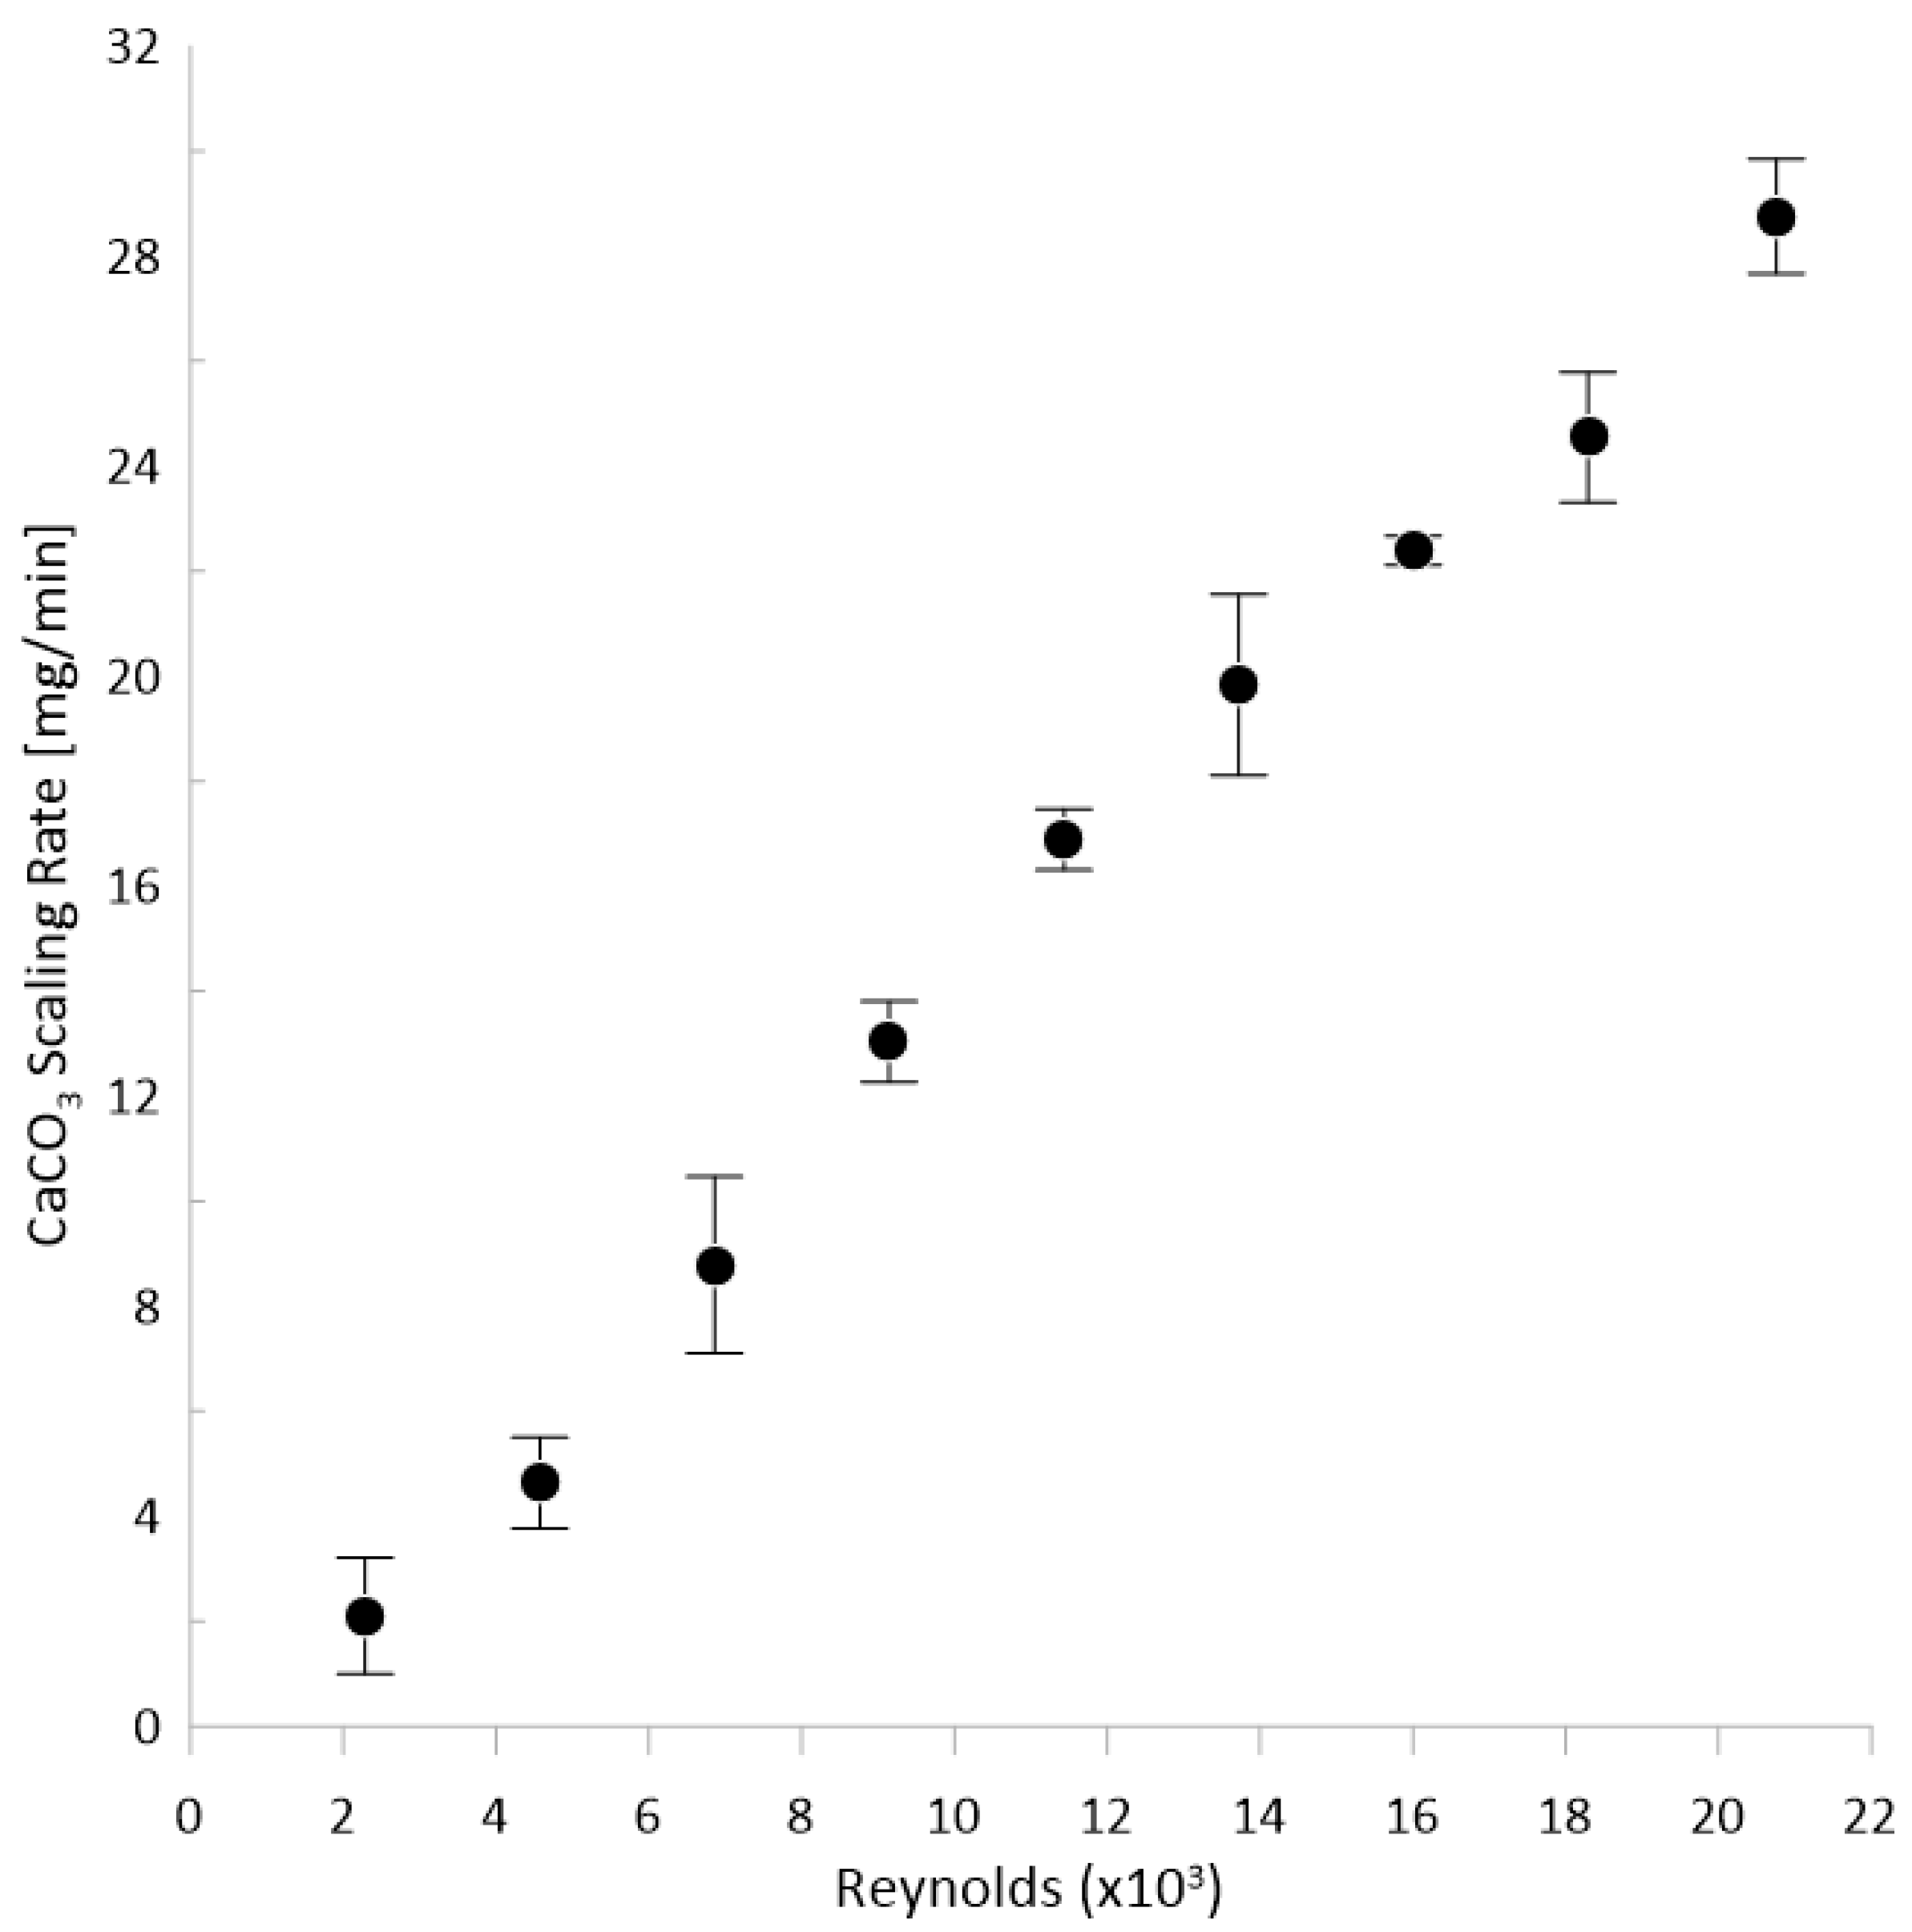
Increasing turbulence, induced by higher flow rates, led to an increase in the CaCO3 mass deposition rate on the coupon surfaces, as shown in Figure 5. Similar behavior has been reported by [24,33,35,40], although under different experimental conditions. This trend is physically expected, as higher flow rates imply the continuous supply of a larger volume of supersaturated solution, thereby intensifying the transport of Ca2+ and ions toward the solid-fluid interface. Furthermore, increased turbulence reduces the thickness of the diffusive boundary layer, enhancing nucleation kinetics and crystal growth at the surface. It is important to note that the scaling rates observed in this study are higher than those typically encountered in field conditions due to the controlled supersaturation and accelerated precipitation adopted in the experimental setup. Such conditions are commonly employed in laboratory studies to reproduce scaling phenomena within practical experimental timeframes.
Figure 5.
CaCO3 scaling rate as a function of the Reynolds number for experiments conducted under CO2 injection, with a pressure drop of 15 bar at 40 °C.
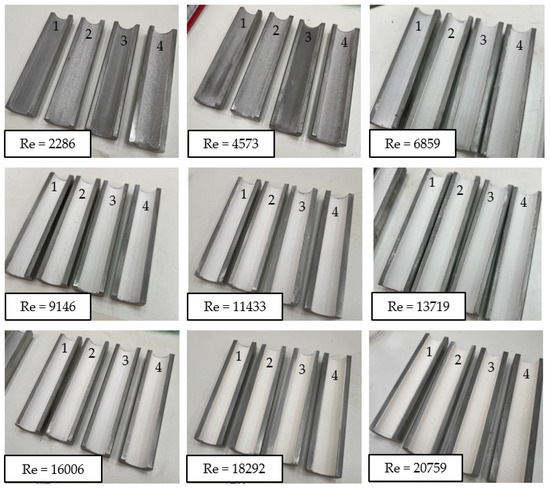
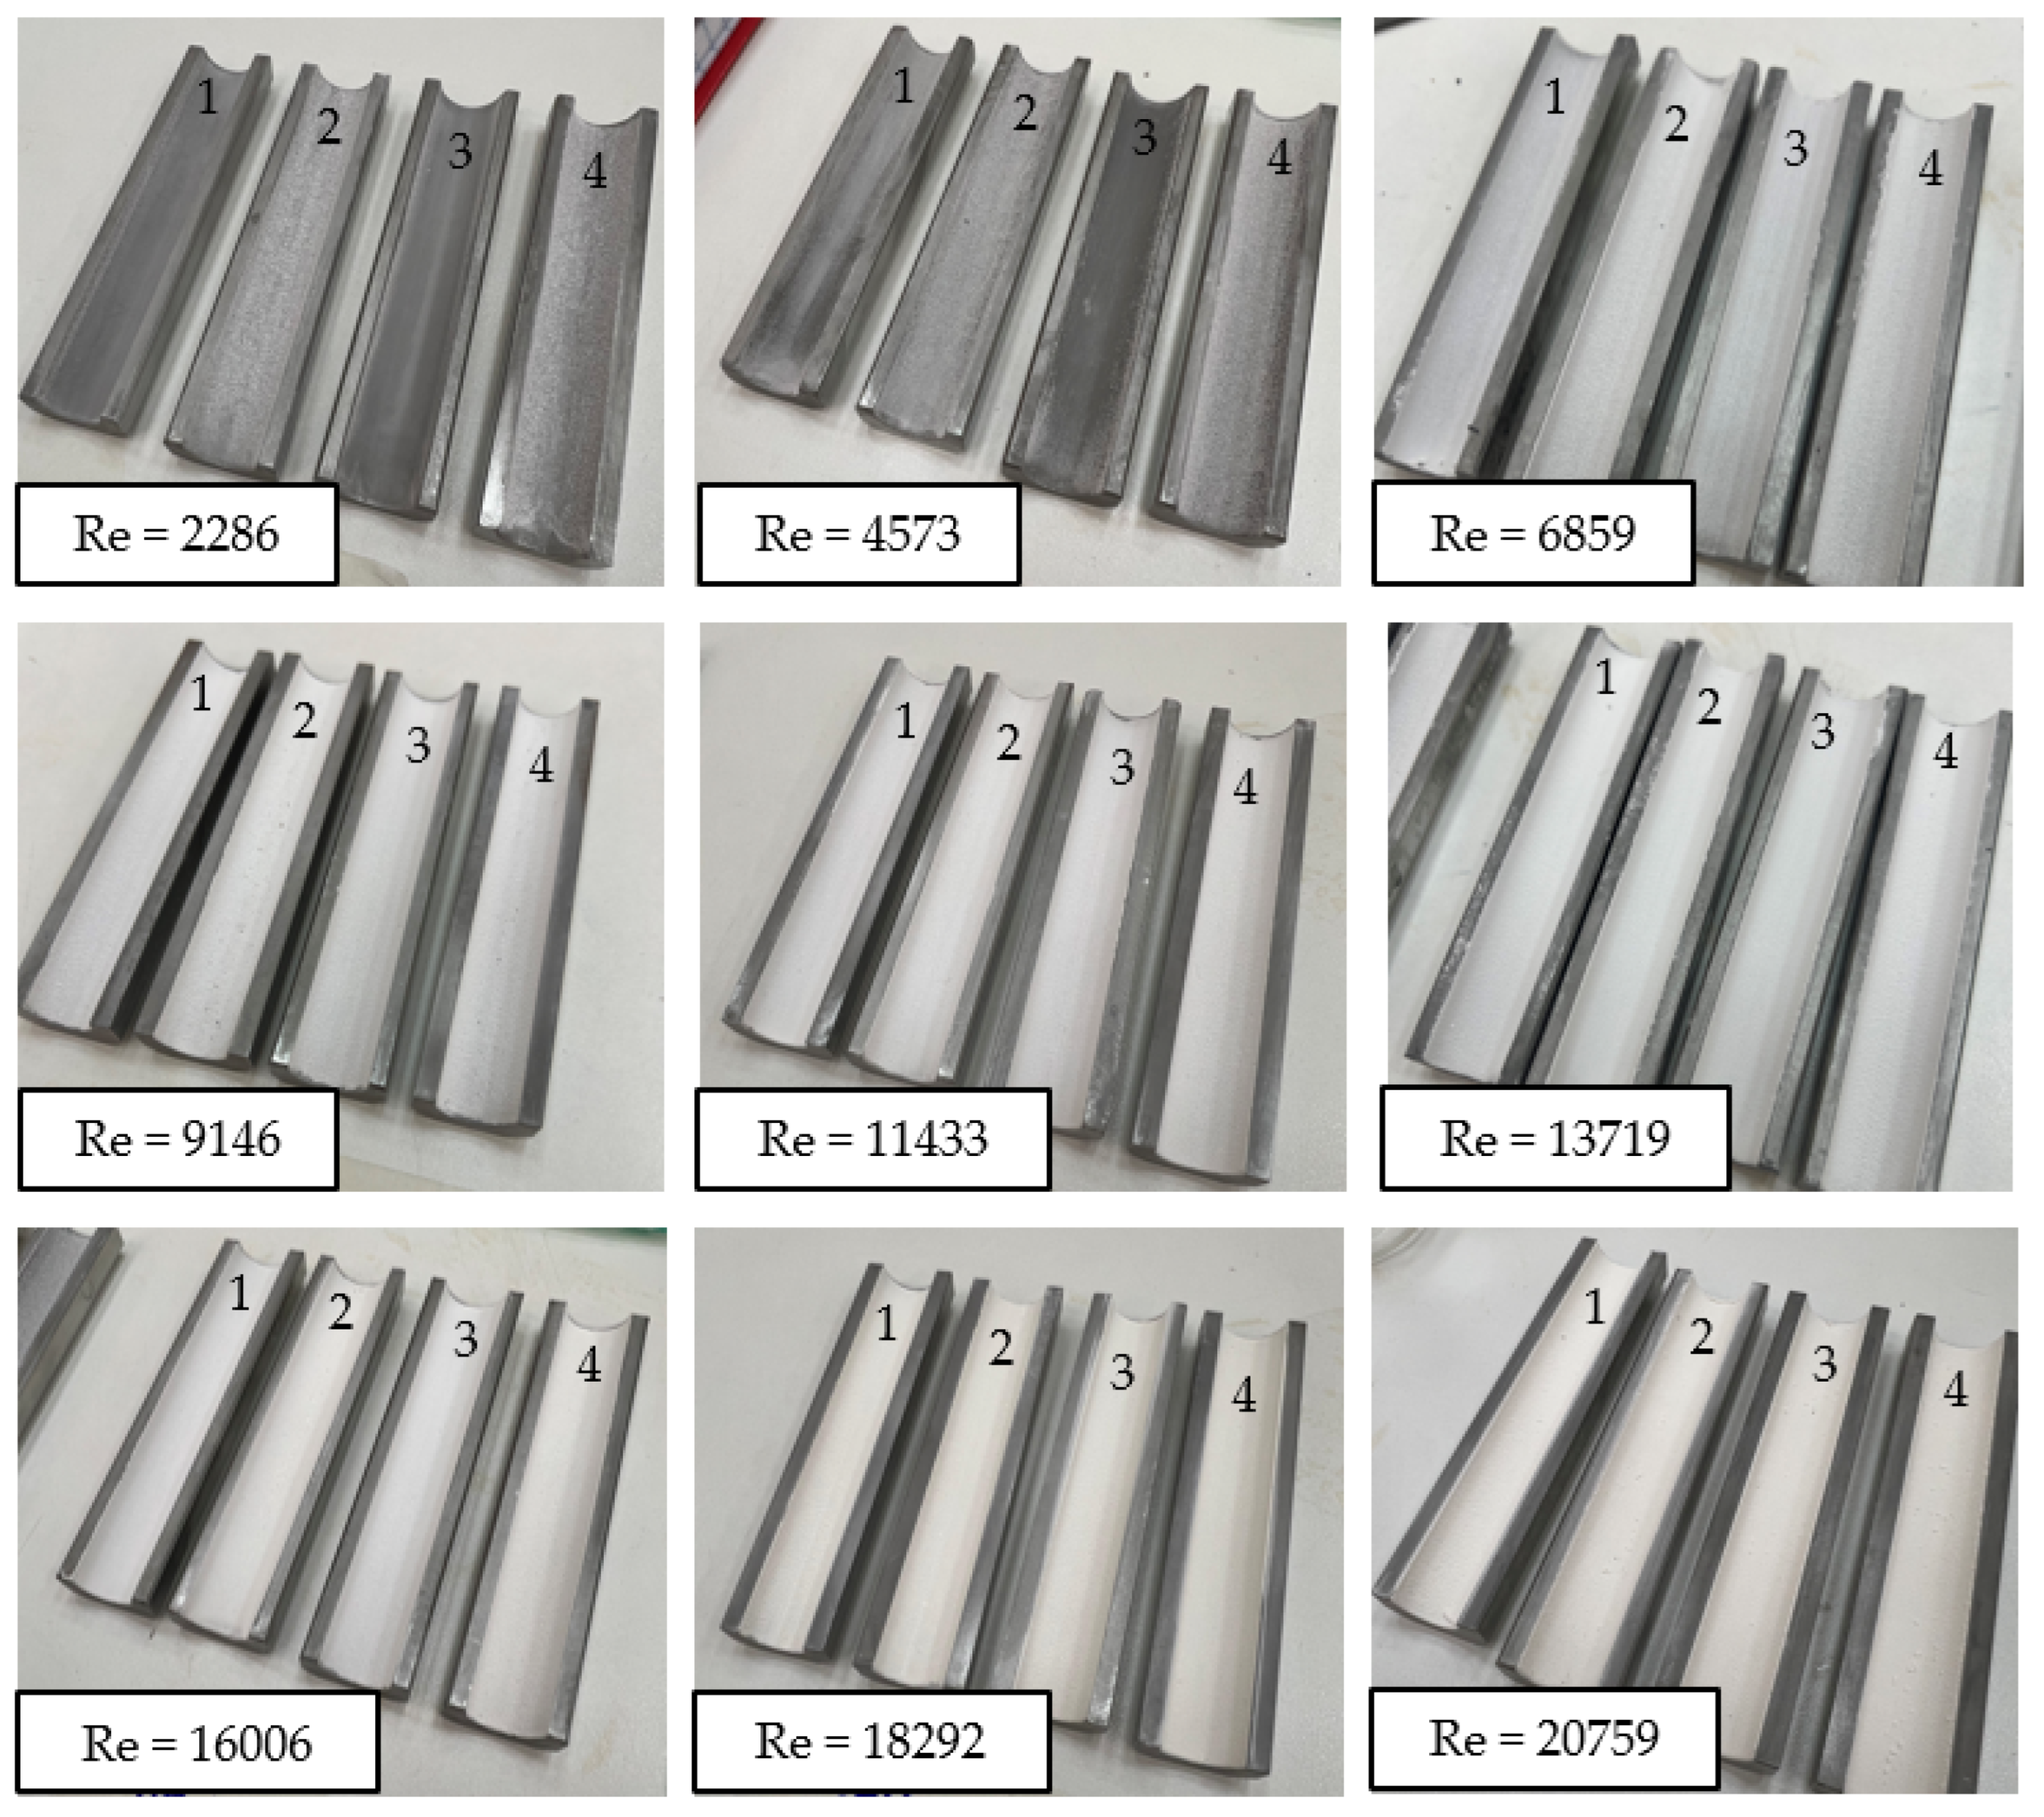
At lower Reynolds numbers, and , where the flow behaves close to the laminar and transitional regimes, a distinct CaCO3 mass adhesion pattern can be observed on the specimens (Figure 6). The specimens located in the lower part of the pipeline (#2 and #4) presented, both visually and quantitatively, a higher deposited mass compared to those positioned in the upper part (#1 and #3). This observation indicates that, under laminar or transitional flow conditions, CaCO3 adhesion is influenced by gravity and does not occur homogeneously along the pipe wall. For higher Reynolds numbers () no visible differences were observed between the scaling patterns in the upper and lower regions of the specimens.
Figure 6.
Coupons with CaCO3 mass adhered to the metallic surface under CO2 injection, with a pressure drop of 15 bar at 40 °C, corresponding to the upper (1 and 3) and lower (2 and 4) regions of the pipeline.
The analysis of the deposited mass distribution between specimens positioned in the upper and lower regions of the pipeline provides important insights into the mechanisms of scale formation under different hydrodynamic regimes. Under laminar and transitional flow conditions, the specimens located in the lower portion of the pipeline exhibited higher deposited mass, indicating that gravitational effects influence the distribution of scale along the pipe wall. In these regimes, the limited radial mixing of the flow allows CaCO3 crystals formed in suspension to undergo gravitational settling, increasing the local particle concentration near the lower wall and, consequently, the probability of adhesion and growth of the deposited layer.
As the Reynolds number increases and the flow becomes turbulent (), the intense radial mixing associated with turbulent fluctuations tends to homogenize the particle distribution across the flow cross-section, significantly reducing the gravitational effects. Consequently, the dominant mechanism shifts toward heterogeneous nucleation and crystal growth directly on the surface, resulting in similar scaling patterns in the upper and lower regions of the pipeline. From a flow assurance perspective, this result demonstrates that the hydrodynamic regime can significantly alter the dominant scale formation mechanism, influencing both the preferential location of deposits and their growth rate.
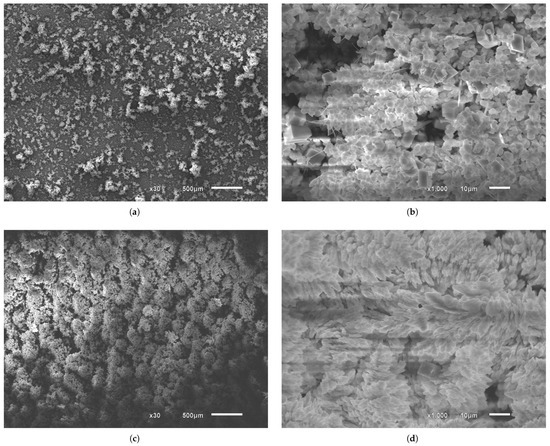
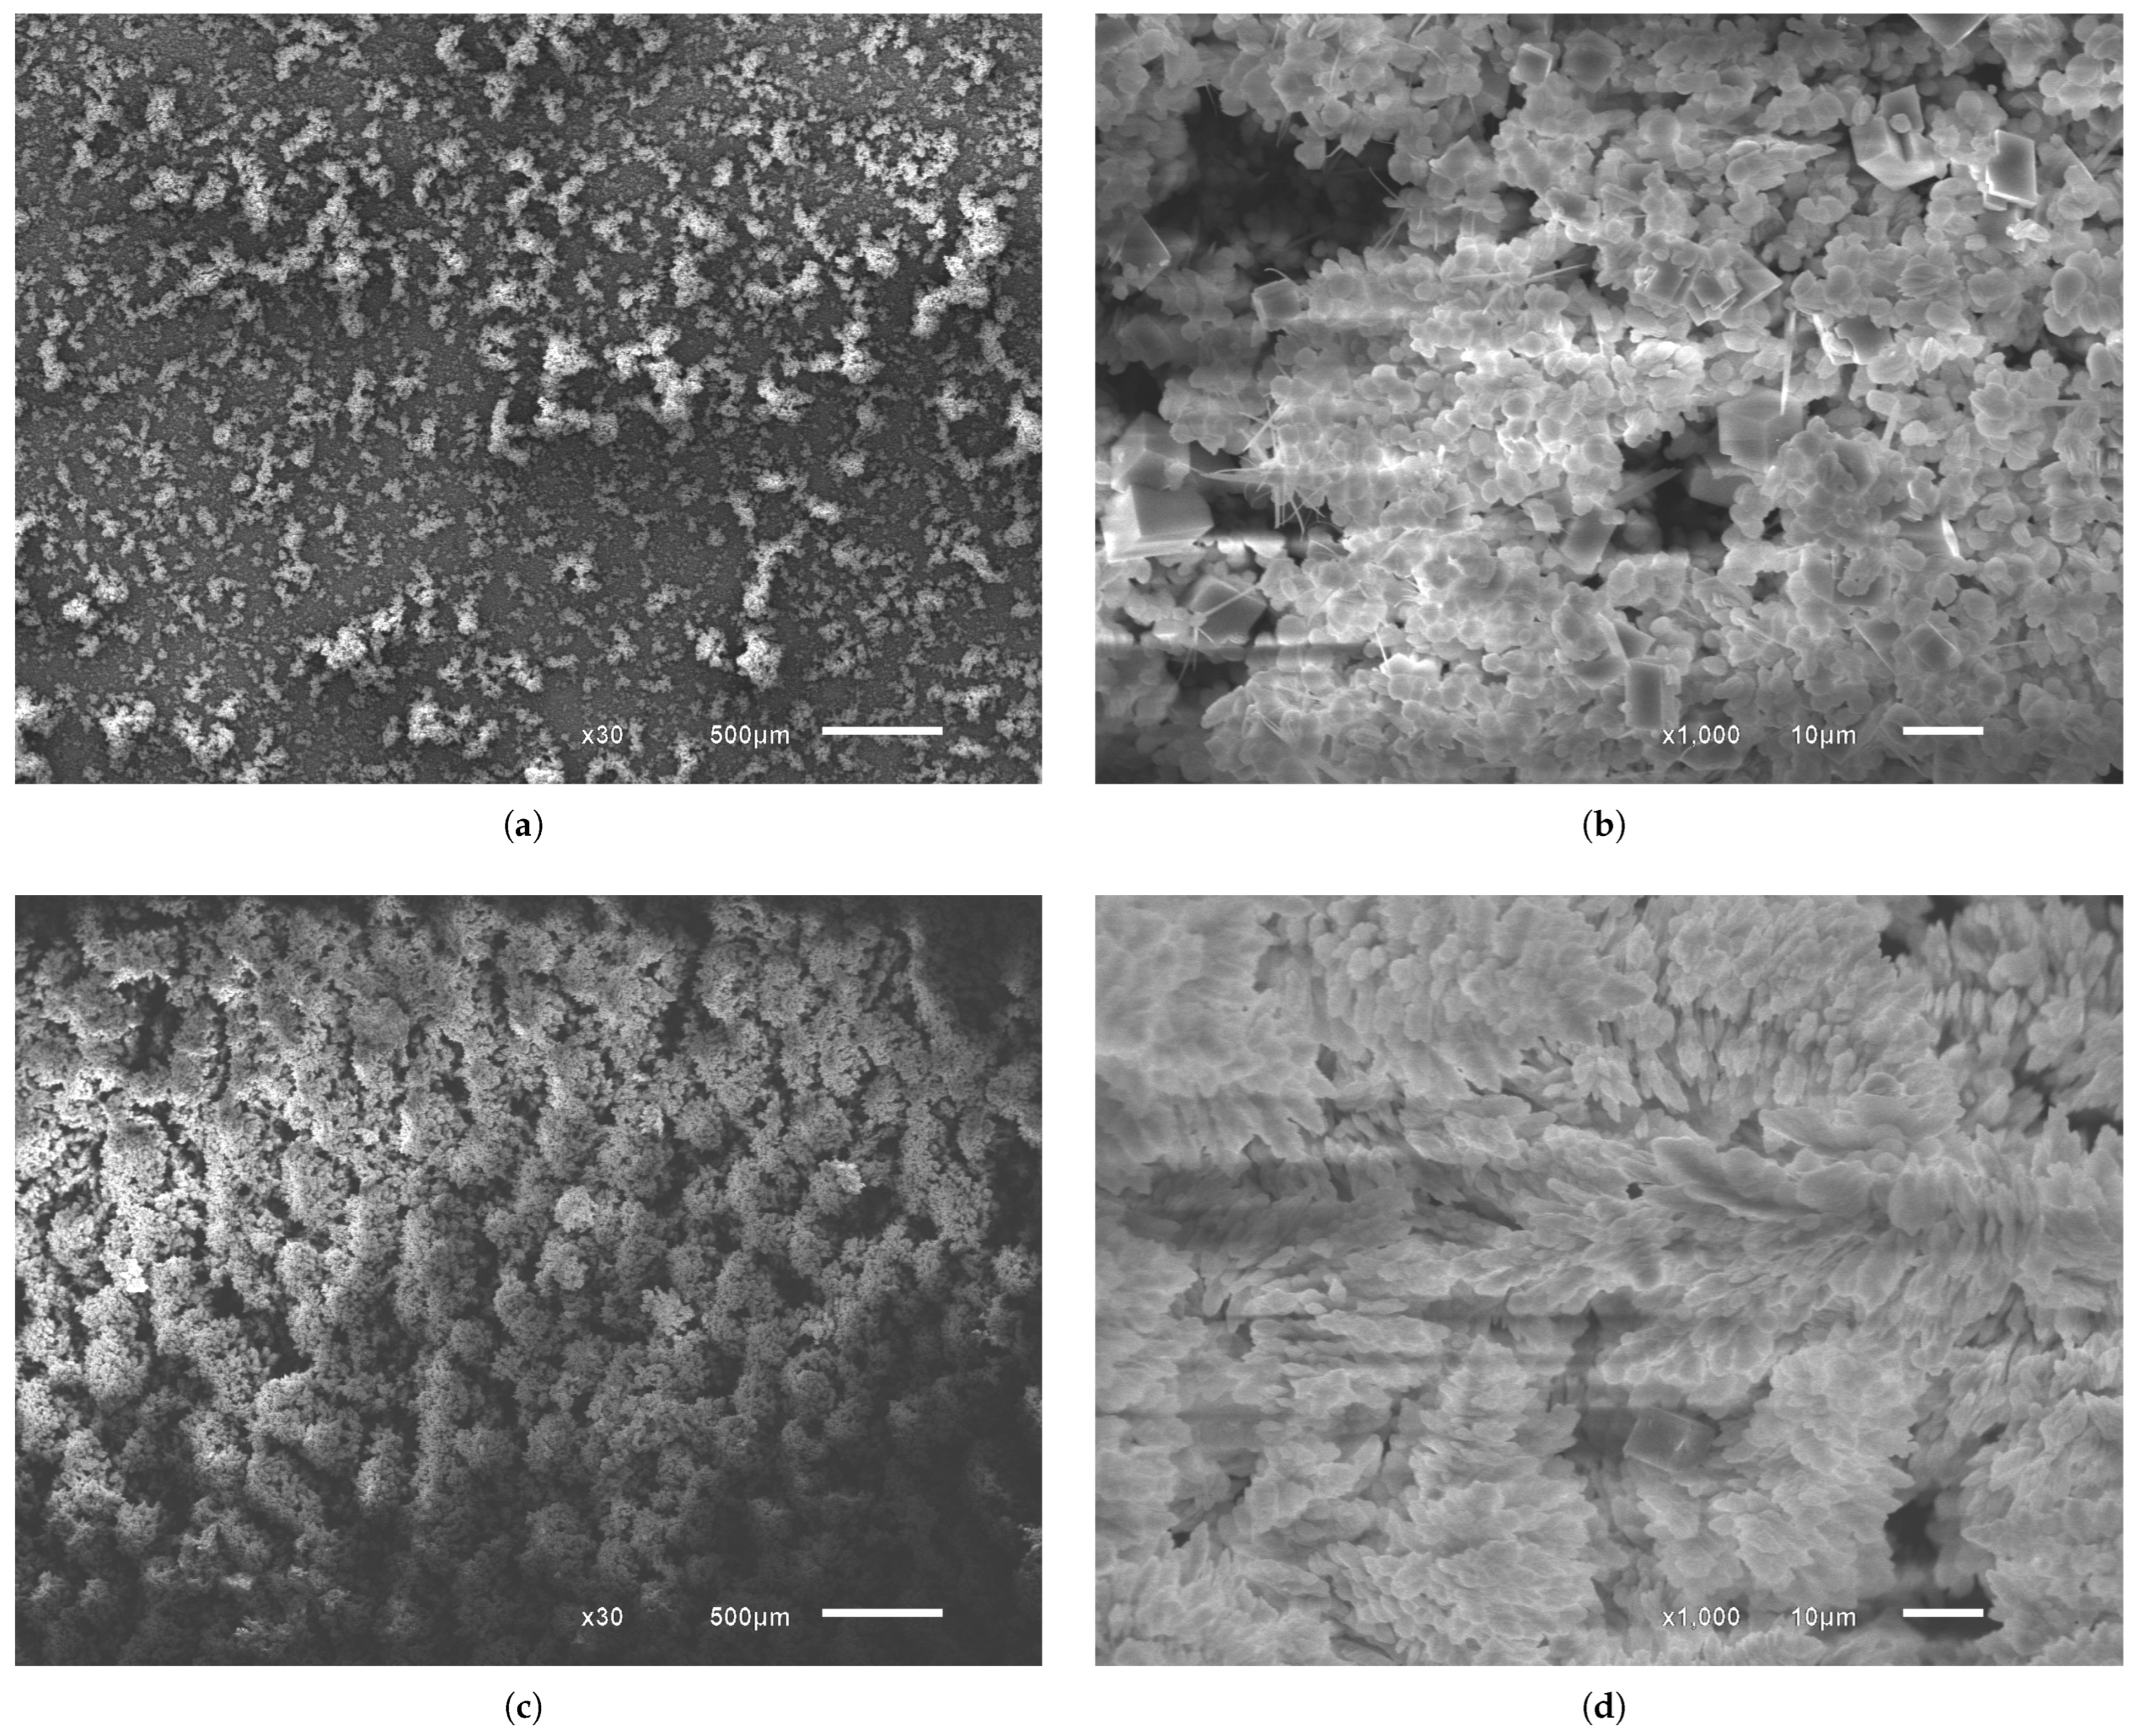
Complementing the evaluation of CaCO3 mass deposited on the coupon surfaces, microscopic images were analyzed to further investigate the carbonate scaling phenomenon (Figure 7). At lower flow velocities (Figure 7a), crystals appear more sparsely distributed, allowing the substrate to remain visible. In Figure 7b, spherical vaterite particles predominate, accompanied by a smaller fraction of cubic calcite crystals and a few aragonite needles. At higher flow velocities, Figure 7c, for experiments conducted with the same duration, the crystals appear more compacted, a phenomenon also reported by Karabelas [24], and the substrate is no longer visible. Under flow conditions with higher turbulence intensity, nucleation sites grow rapidly to cover the substrate, and well-formed crystals tend to coalesce as they grow, forming elongated vaterite structures (Figure 7d). This morphology resembles a layered dendritic growth pattern, a form well described in the work of Guan [17]. The change in crystal morphology with increasing flow rate may also be attributed to the presence of CO2, as previously observed by Yong [41]. Increasing flow rates intensify the CO2 flash induced by the pressure drop imposed by the proportional valve, thereby increasing the supersaturation of the solution. High supersaturation promotes rapid nucleation and precipitation, which limits the transformation of vaterite into calcite. As a result, vaterite is preserved and becomes the predominant phase at higher flow rates at 40 °C.
Figure 7.
SEM images of CaCO3 crystals formed on the surface of the coupons at different Reynolds numbers under CO2 injection, with a pressure drop of 15 bar at 40 °C. Vaterite (spherical and elongated structures), calcite (cubic crystals) and aragonite (needle-like structures) are identified based on morphology. (a) = 2286 at ×30 magnification; (b) = 2286 at ×1000 magnification; (c) = 20,759 at ×30 magnification; (d) = 20,759 at ×1000 magnification.
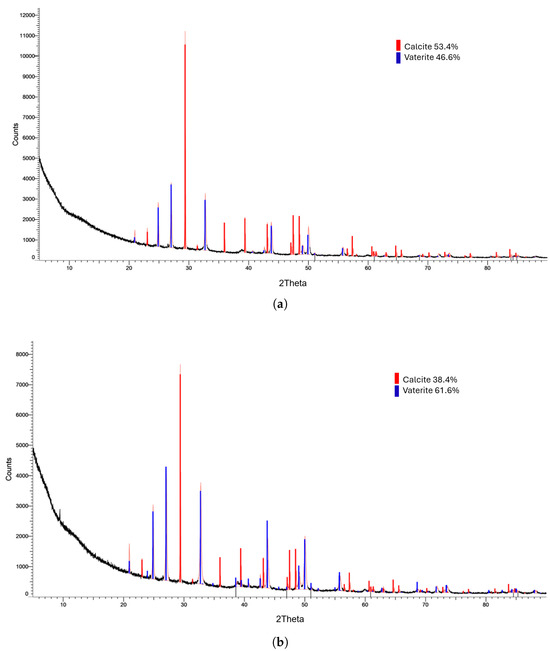
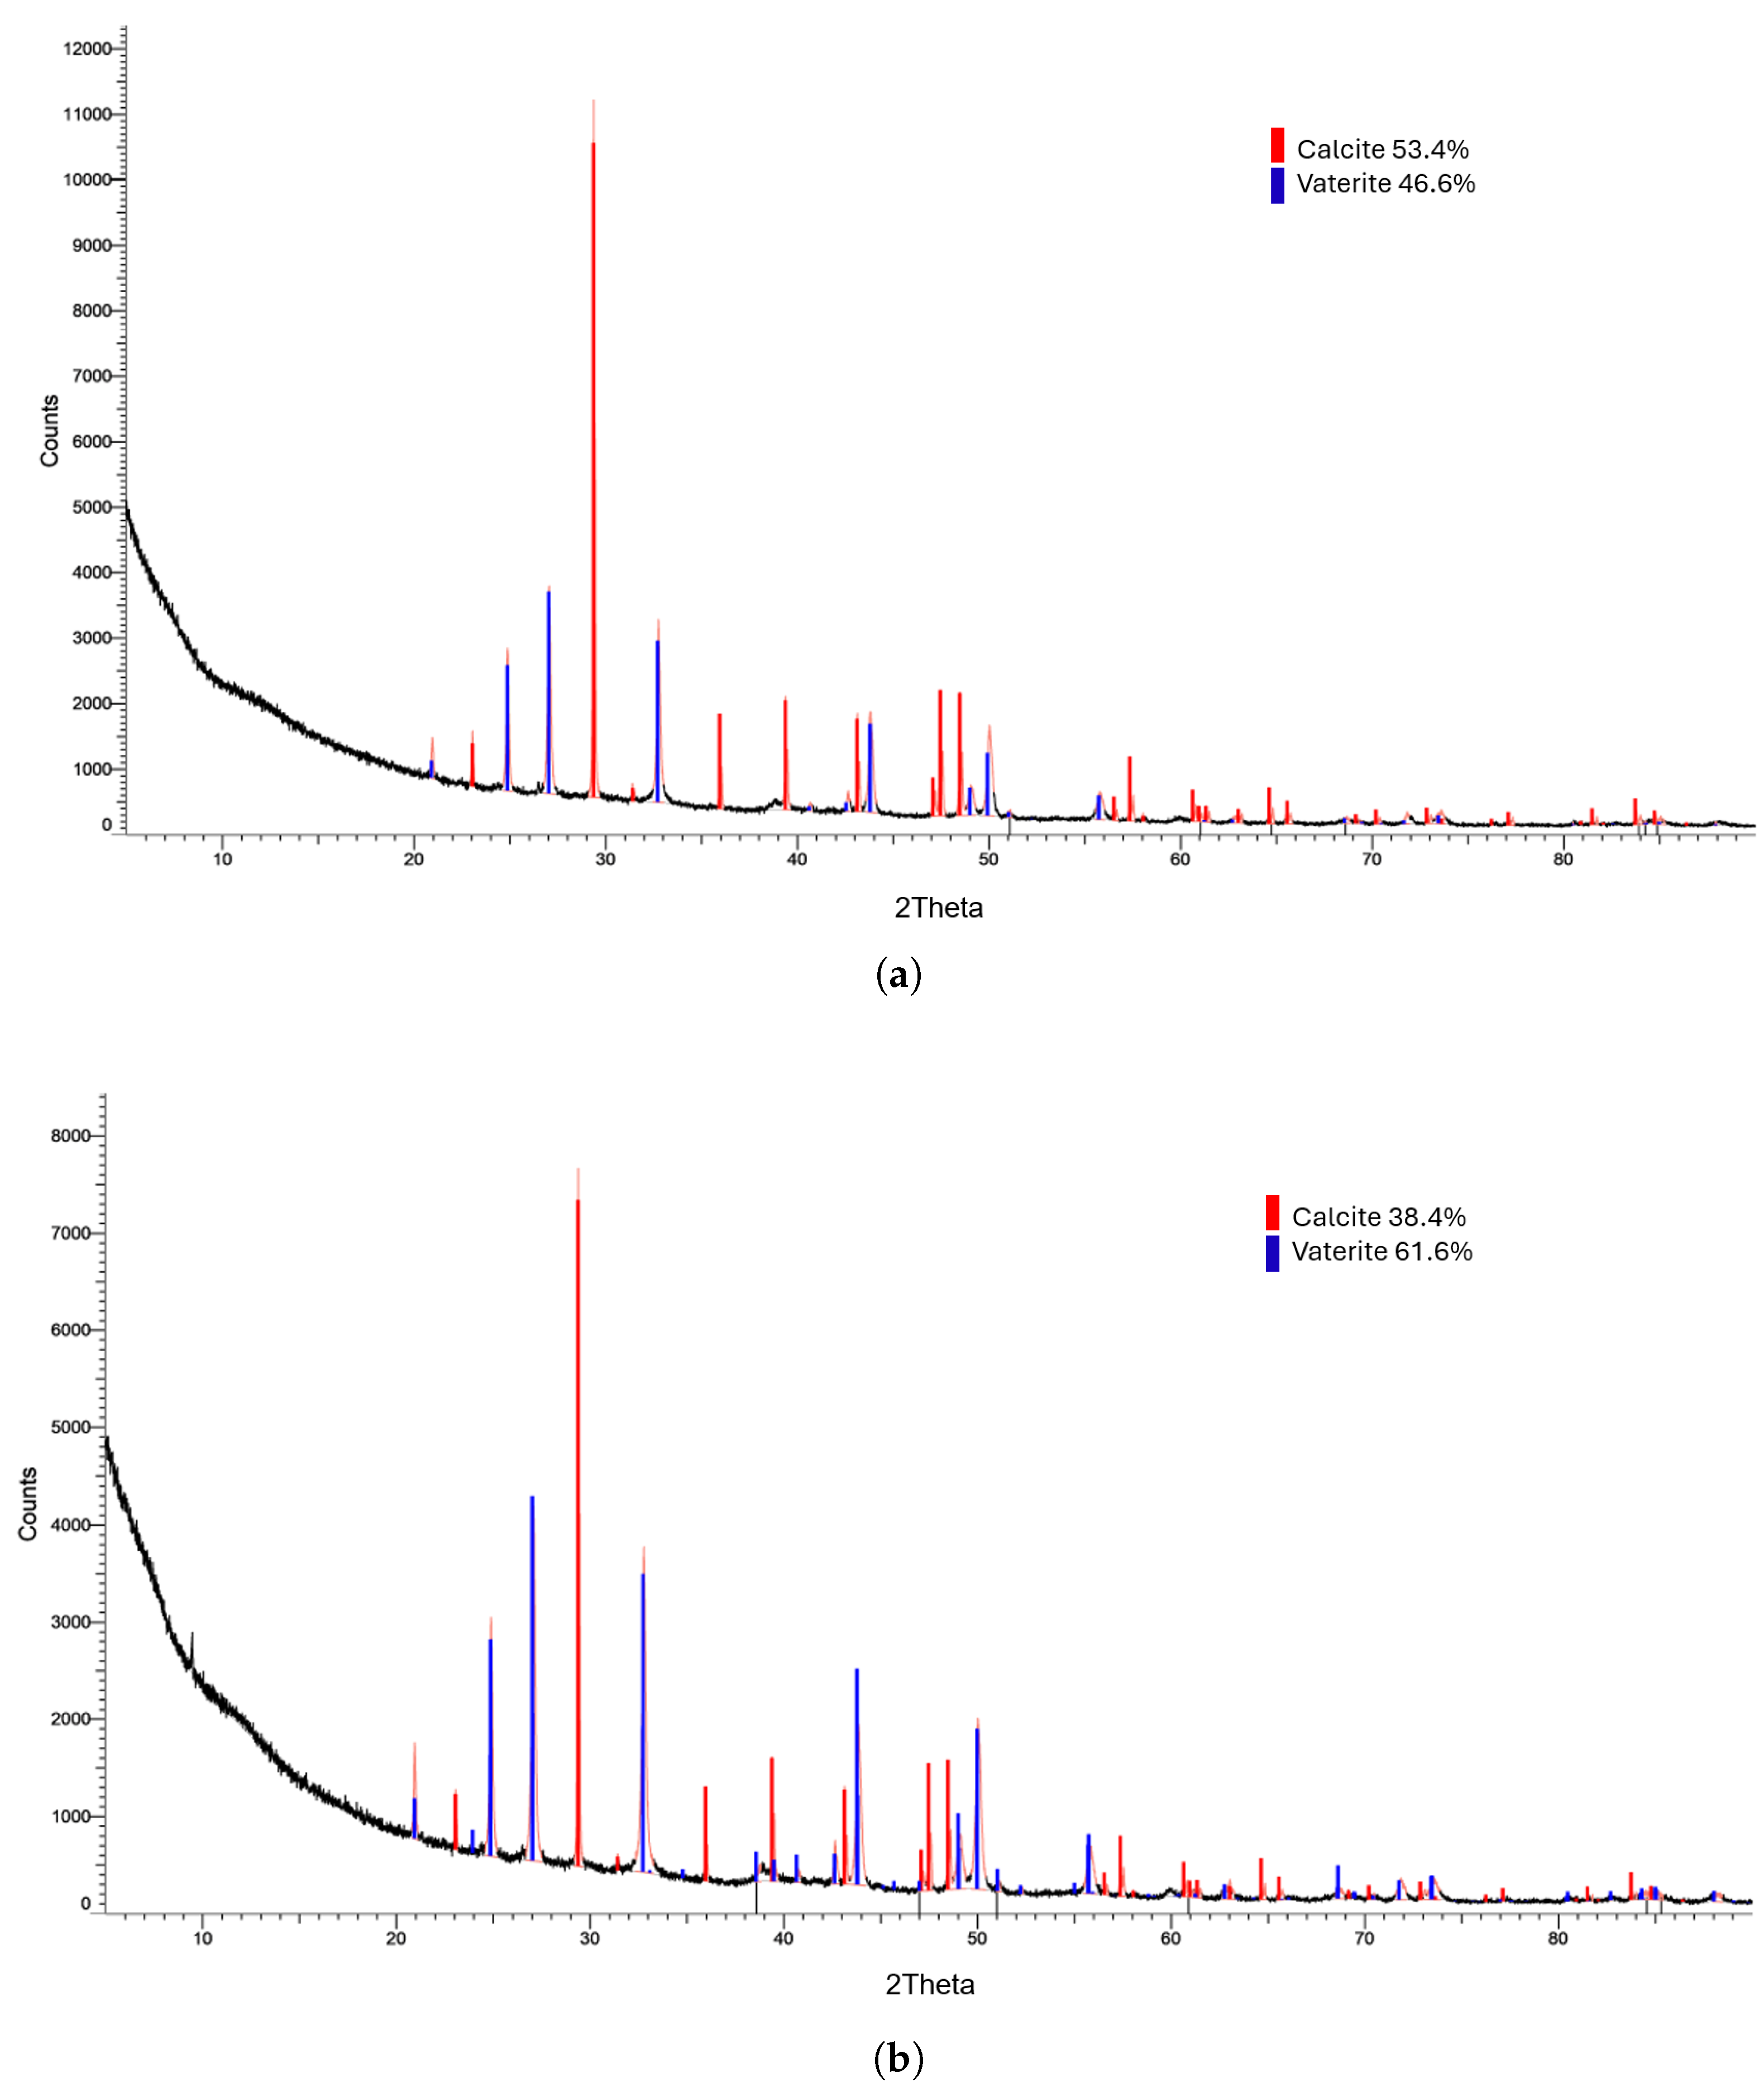
Corroborating the SEM observations, the XRD analysis reveals a shift in phase composition at 40 °C as a function of Reynolds number (Figure 8). At = 2286 (Figure 8a), calcite was the predominant phase (53.4%), followed by vaterite (46.6%). At higher turbulence ( = 20,759, Figure 8b), vaterite became dominant (61.6%), whereas calcite decreased to 38.4%.
Figure 8.
X-ray diffraction (XRD) patterns of the solids deposited on the coupons at (a) = 2286 and (b) = 18,292.
Under turbulent flow conditions, scale formation can be interpreted as the result of competing mechanisms. On one hand, turbulence enhances mass transport and promotes CaCO3 precipitation, while also increasing the probability of effective crystal adhesion to the surface, thereby contributing to deposit growth. On the other hand, increasing turbulence intensity raises the wall shear stress, which may promote the detachment of weakly adhered particles or crystals [26].
In the present study, however, no significant erosion or removal of particles was observed with increasing flow rate. The results indicate that, in the balance between adhesion and hydrodynamic removal, adhesion mechanisms prevailed even as the Reynolds number increased. It is also important to note that the experimental loop operated in an open configuration, ensuring the continuous supply of supersaturated solution and availability of ions, which favors nucleation, crystal growth and consequently an increase in the scaling rate.
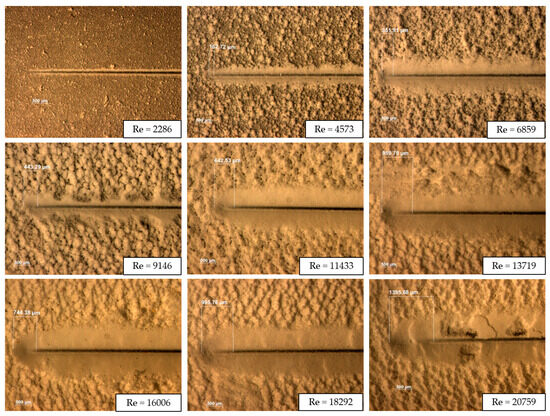
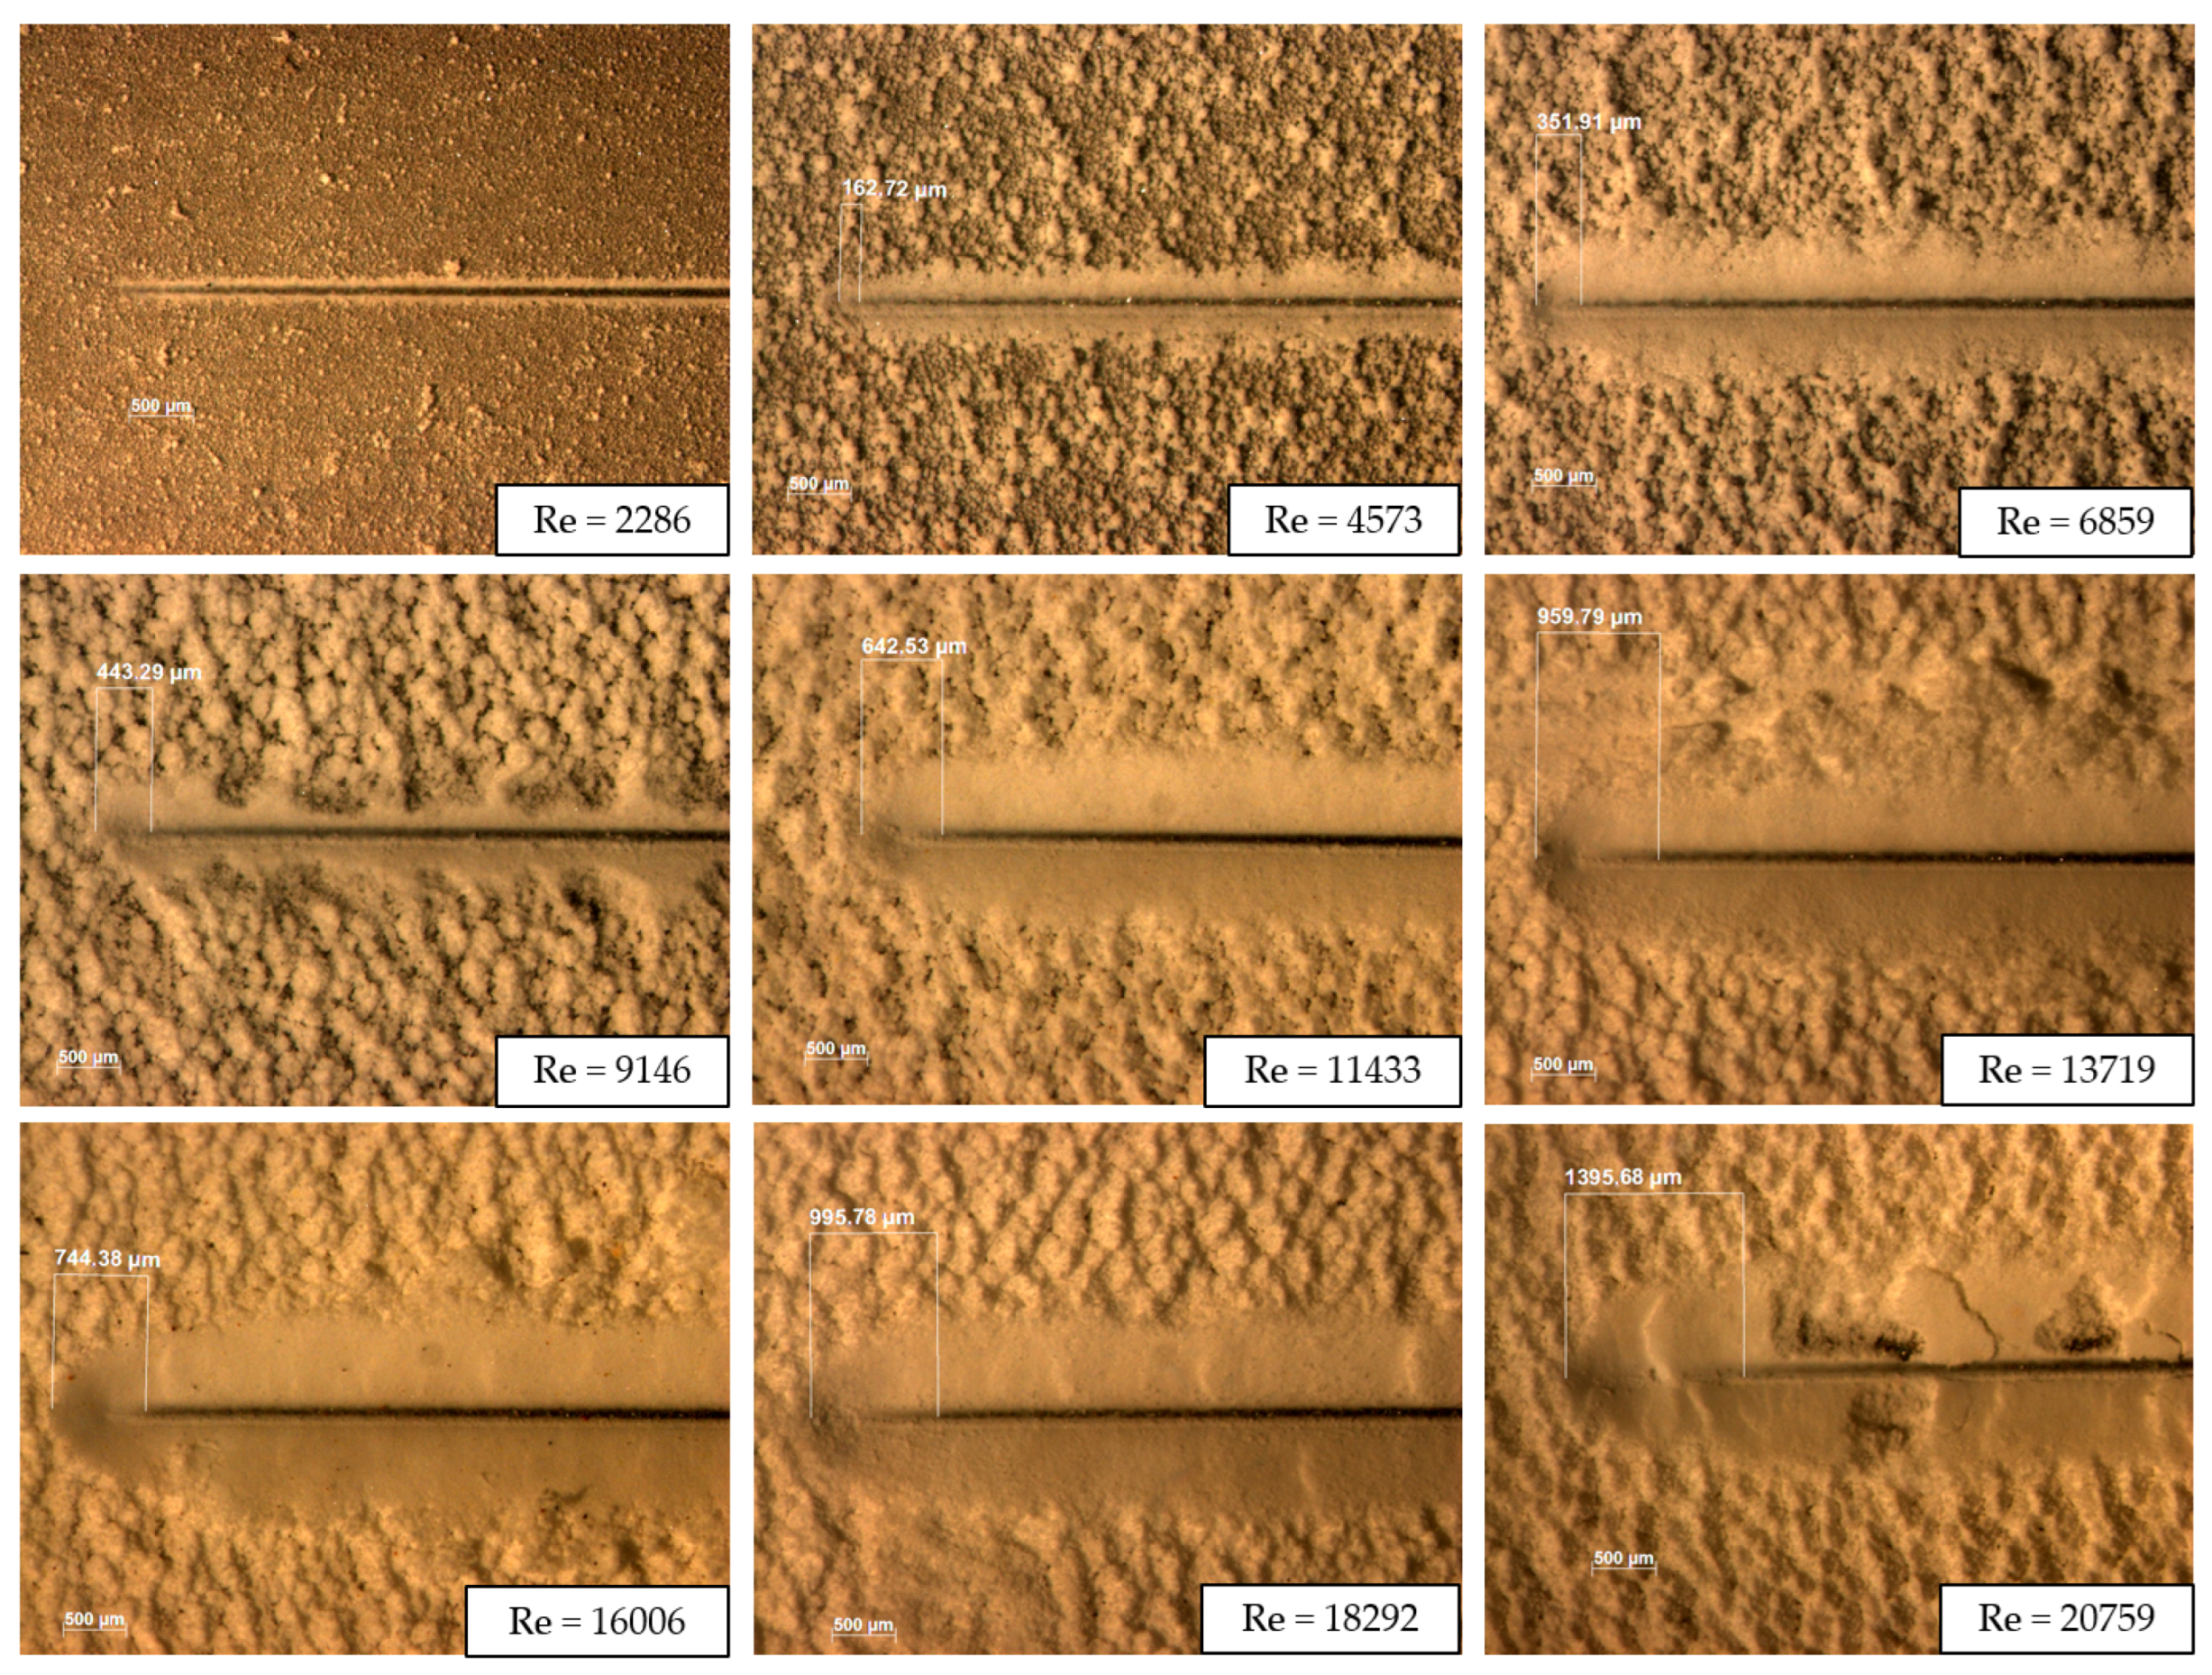
To further investigate the adhesion of the deposits to the substrate, the coupons were subjected to linear scratch testing to evaluate the force required to detach the carbonate scale layer (Figure 9). As the flow rate increases, for the same test duration, a larger amount of crystals is formed, generating larger CaCO3 agglomerates and, consequently, stronger adhesion to the substrate. With increasing Reynolds number, the distance at which the indenter reaches the substrate shifts farther from the initial position, indicating an increase in the detachment force.
Figure 9.
Stereomicroscopy images of the linear scratch tests performed under different flow rates in the presence of CO2, with a pressure drop of 15 bar at 40 °C, at ×25 magnification.
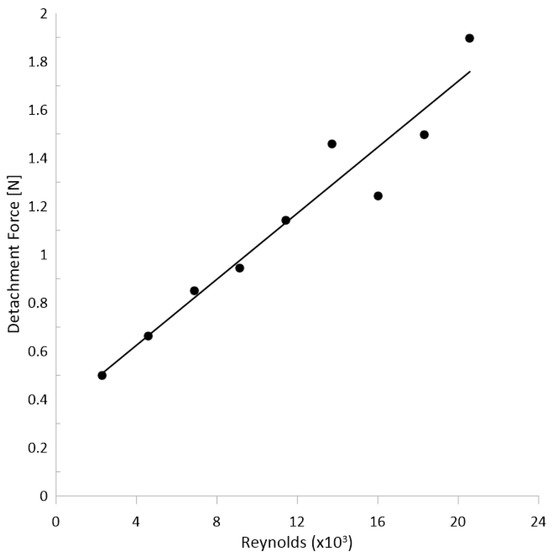
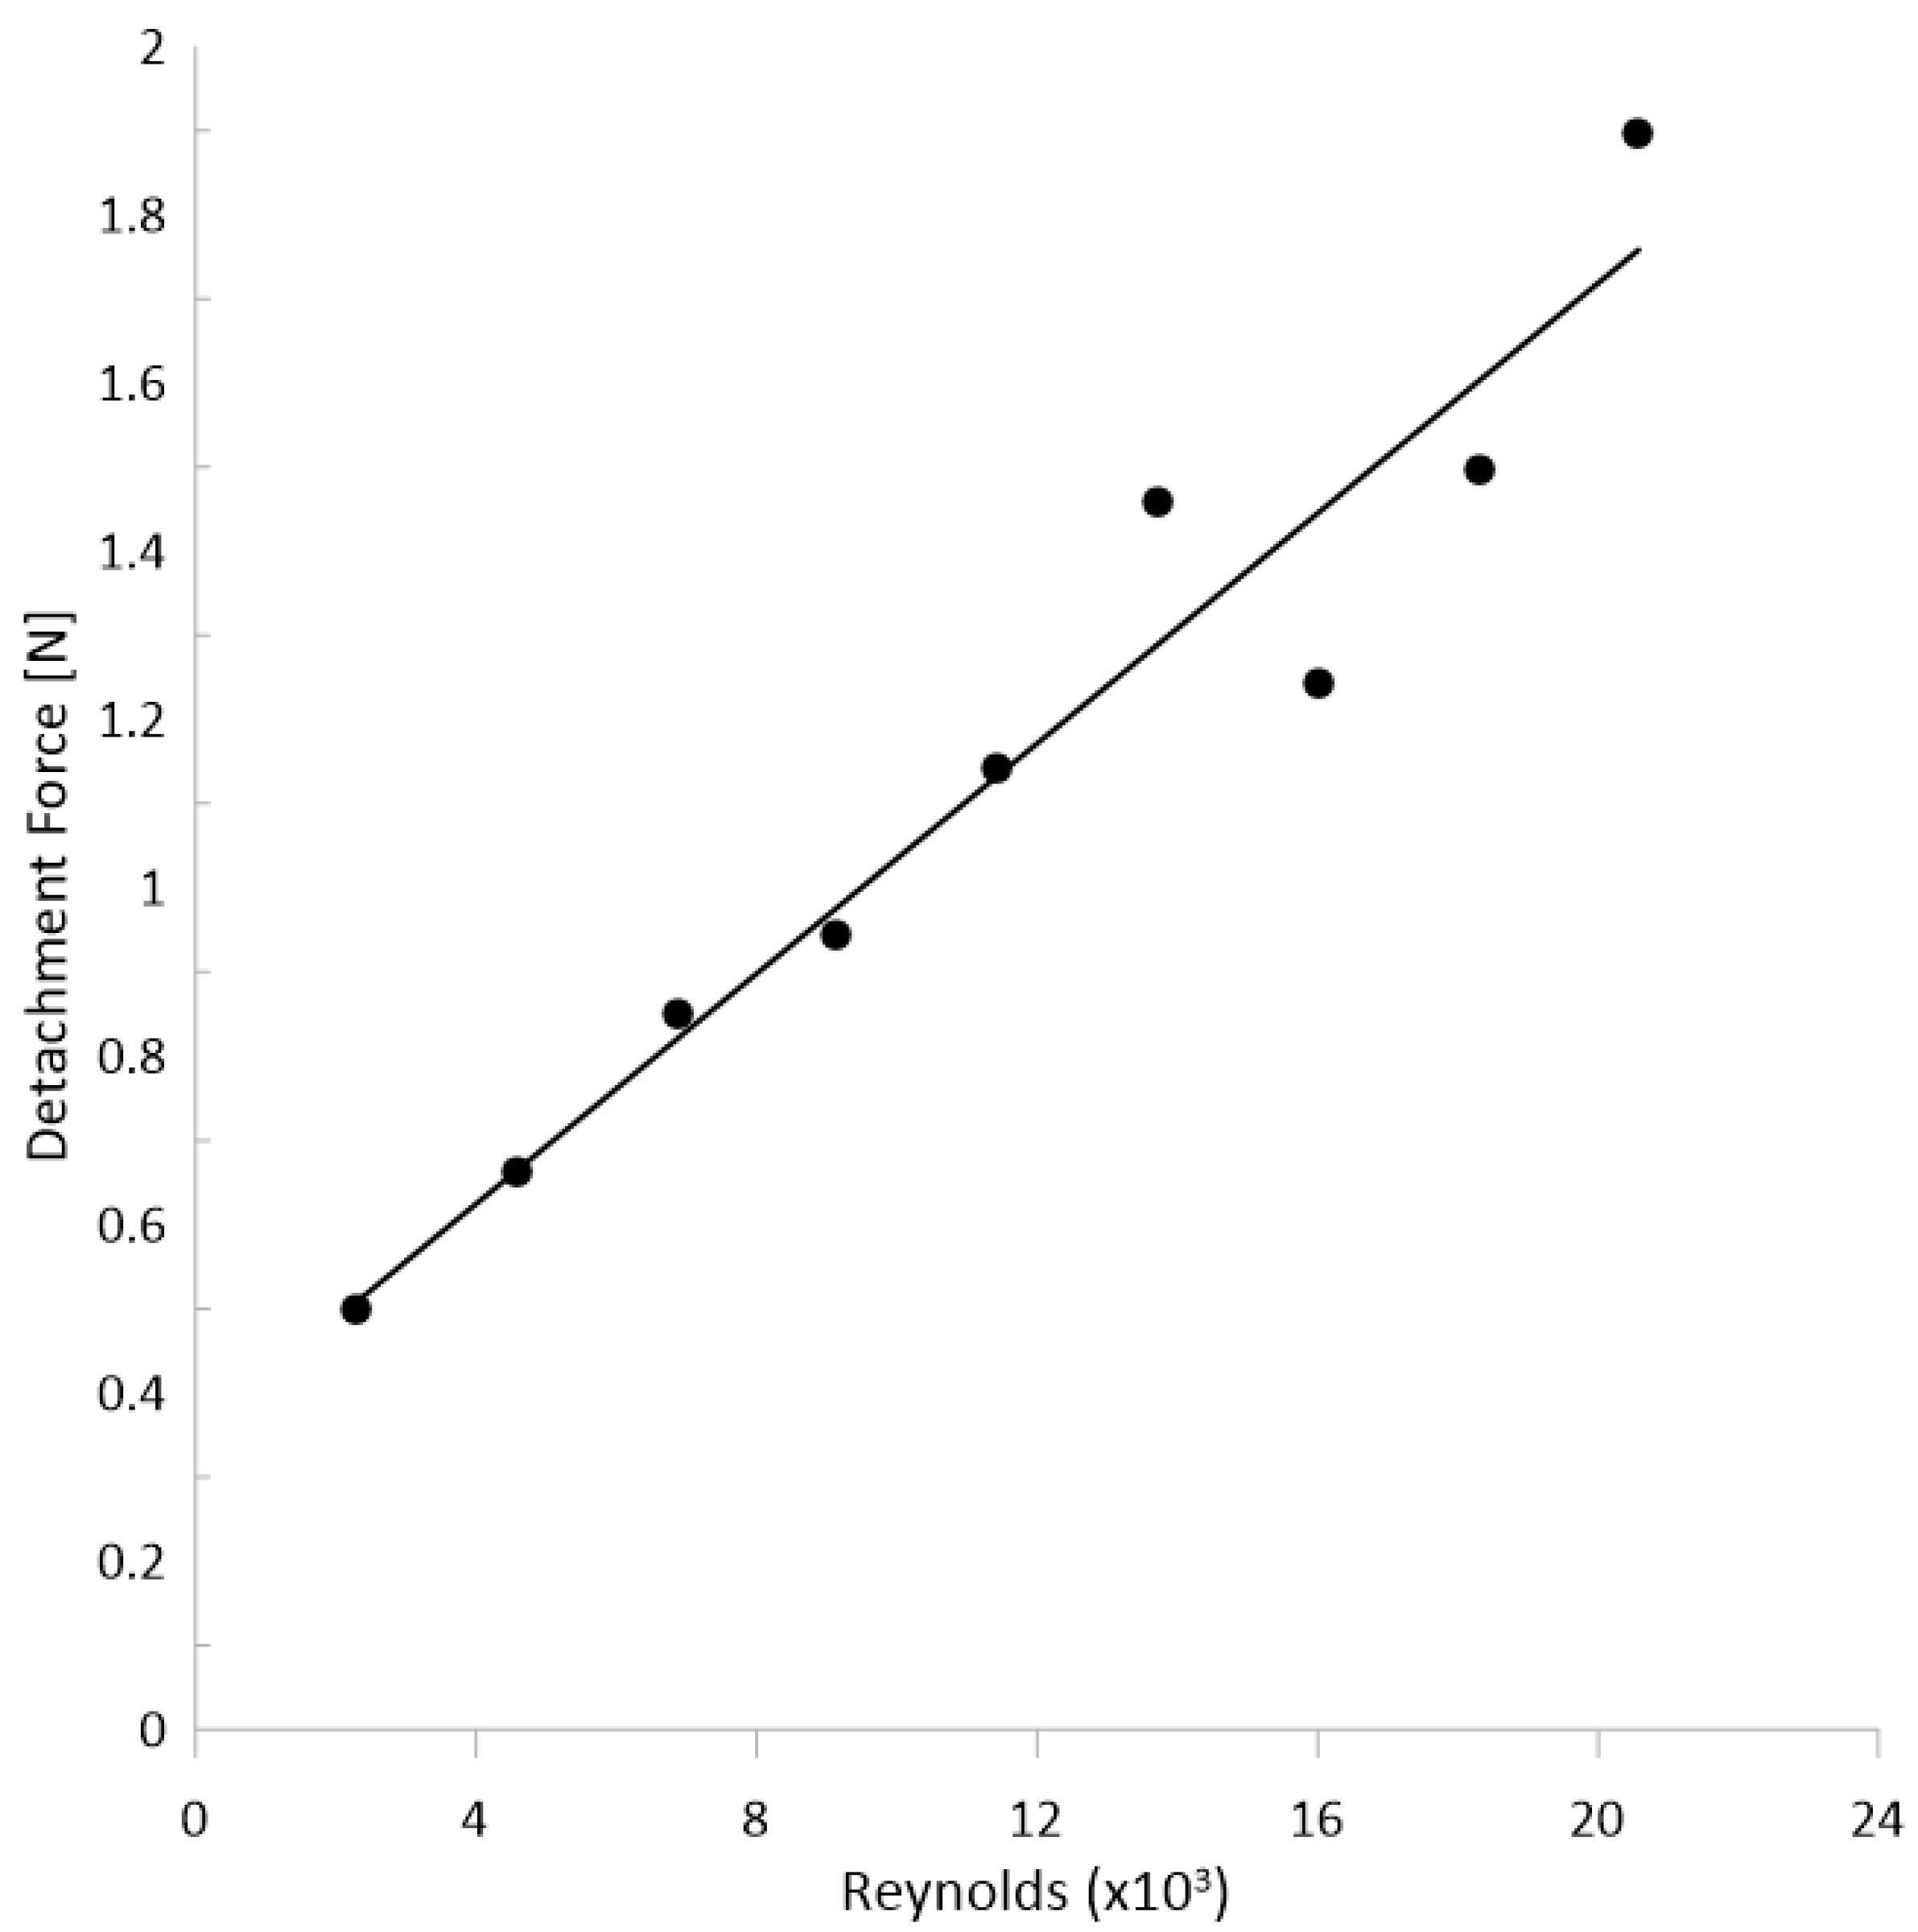
Figure 10 shows a clear linear relationship between the detachment force and the Reynolds number, with an excellent correlation coefficient for Reynolds numbers up to approximately 11,433. For higher Reynolds numbers, the results exhibit greater dispersion. This variation may be associated with the increase in wall shear stresses under more turbulent regimes, which can induce structural rearrangements within the deposit, partial detachment of weakly adhered crystals or changes in the morphology of the scale layer, thereby modifying the mechanical response measured in the test. Evidently, the adhesion forces between nuclei/crystals and the substrate play a fundamental role in the formation of scale deposits.
Figure 10.
Detachment force of the scale layer as a function of the Reynolds number.
These results highlight that the flow rates commonly encountered in oil and gas production systems require scale removal procedures that account for the force necessary to detach the CaCO3 solid layer, whether through mechanical treatments or longer exposure to chemical treatments.
Furthermore, the findings emphasize the importance of considering the role of CO2 in the scaling process, as its presence directly alters the physicochemical conditions of the reactive environment, influencing supersaturation levels, crystal nucleation and the adhesion behavior of the deposited solids.
4. Conclusions
This study experimentally investigated the formation and adhesion of calcium carbonate (CaCO3) scale under controlled hydrodynamic and chemical conditions representative of oil and gas production systems. A dedicated experimental loop was developed to evaluate the influence of flow regime and CO2 participation on carbonate scaling behavior.
The results showed that increasing the Reynolds number significantly increased the mass of CaCO3 deposited, indicating that enhanced turbulence promotes mass transport and favors precipitation and growth of the crystalline layer. Despite the higher wall shear stresses associated with turbulent regimes, no significant erosion of the deposited layer was observed, suggesting that adhesion mechanisms dominated over hydrodynamic removal under the tested conditions. In addition, CO2 injection reduced the overall scaling rate due to pH control, but led to the formation of deposits with higher mechanical strength and stronger adhesion to the substrate.
Morphological and structural analyses showed that flow conditions strongly influence crystal distribution and polymorphism. Higher turbulence promoted more homogeneous deposition and favored the preservation of vaterite, associated with increased supersaturation induced by CO2 flash. Scratch tests further confirmed that deposits formed under turbulent conditions exhibit greater resistance to removal. It is important to note that the adhesion results reported in this study are specific to the surface roughness of the sandblasted coupons used (Ra ∼ 1 μm). Therefore, surface roughness effects should be considered when extrapolating these results to field conditions.
The main novelty of this study lies in the experimental quantification of both the deposited mass and adhesion strength of CaCO3 under pressurized flow conditions in the presence of CO2, which remains scarce in the literature. The results highlight the dual role of CO2 in carbonate scaling, affecting both precipitation kinetics and interfacial adhesion mechanisms. The experimental loop developed in this study represents an important step toward reproducing realistic scaling conditions in laboratory environments and contributes to a better understanding of scale formation and mitigation strategies in industrial systems.
Author Contributions
Conceptualization, L.A.S., B.V.L., H.E.P.S. and A.L.M.; methodology, L.A.S. and B.V.L.; formal analysis, L.A.S. and R.d.N.S.; writing—original draft preparation, L.A.S.; writing—review and editing, B.V.L. and R.d.N.S.; project leader, B.V.L.; technical support, H.E.P.S. and A.L.M. All authors have read and agreed to the published version of the manuscript.
Funding
The research received external support from the company Petrobras.
Institutional Review Board Statement
Not applicable.
Informed Consent Statement
Not applicable.
Data Availability Statement
Data is contained within the article.
Acknowledgments
The authors would like to thank Petrobras for financially supporting this research study.
Conflicts of Interest
Authors Helga Elisabeth Pinheiro Schluter and Andre Leibsohn Martins are employed by the company Petrobras. The authors declare that the research was conducted in the absence of any commercial or financial relationships that could be construed as a potential conflict of interest. The authors declare that this study received funding from Petrobras. The funder was not involved in the study design, collection, analysis, interpretation of data, the writing of this article or the decision to submit it for publication.
References
- Santos, M.G.R.S.; Correia, L.M.S.; Medeiros, J.L.; Araújo, O.Q.F. Natural gas dehydration by molecular sieve in offshore plants: Impact of increasing carbon dioxide content. Energy Convers. Manag. 2017, 149, 760–773. [Google Scholar] [CrossRef] [Scilit]
- Crabtree, M.; Eslinger, D.; Fletcher, P.; Miller, M.; Johnson, A.; King, G. Fighting scale–removal and prevention. In Oilfield Review; Schlumberger: Houston, TX, USA, 1999; pp. 30–45. Available online: https://kh.aquaenergyexpo.com/wp-content/uploads/2023/09/Fighting-Scale-Removal-and-Prevention.pdf (accessed on 1 April 2026).
- Olajire, A.A. A review of oilfield scale management technology for oil and gas production. J. Pet. Sci. Eng. 2015, 135, 723–737. [Google Scholar] [CrossRef] [Scilit]
- Bezerra, M.C.M.; Rosario, F.F.; Rosa, K.R.S.A. Scale management in deep and ultradeep water fields. In Proceedings of the Offshore Technology Conference Brasil; Offshore Technology Conference: Rio de Janeiro, Brazil, 2013; OTC-24508-MS. [Google Scholar] [CrossRef] [Scilit]
- Zhang, F.; Dai, Z.; Zhang, Z.; Al-Saiari, H.; Yan, F.; Bhandari, N.; Ruan, G.; Liu, Y.; Lu, Y.-T.; Deng, G.; et al. Scaling risk and inhibition prediction of carbonate scale at high temperature. In Proceedings of the SPE International Conference on Oilfield Chemistry; Society of Petroleum Engineers: Montgomery, TX, USA, 2017; SPE-184518-MS. [Google Scholar] [CrossRef] [Scilit]
- Davies, M.; Scott, P.J.B. Oilfield Water Technology; NACE International: Houston, TX, USA, 2006. [Google Scholar]
- Moghadasi, J.; Jamialahmadi, M.; Müller-Steinhagen, H.; Sharif, A.; Ghalambor, A.; Izadpanah, M.R.; Motaie, E. Scale formation in Iranian oil reservoir and production equipment during water injection. In Proceedings of the 5th International Conference on Oilfield Scale Symposium Exhibition; Society of Petroleum Engineers: Aberdeen, UK, 2003; SPE-80406. [Google Scholar]
- Dawe, R.A.; Zhang, Y. Kinetics of calcium carbonate scaling using observations from glass micromodels. J. Pet. Sci. Eng. 1997, 18, 179–187. [Google Scholar] [CrossRef] [Scilit]
- Cosmo, R.P.; Pereira, F.A.R.; Ribeiro, D.C.; Barros, W.Q.; Martins, A.L. Estimating CO2 degassing effect on CaCO3 precipitation under oil well conditions. J. Pet. Sci. Eng. 2019, 181, 106207. [Google Scholar] [CrossRef] [Scilit]
- Cosmo, R.P.; Rinaldi, R.; Pereira, F.A.R.; Soares, E.J.; Martins, A.L. CO2 degassing in CaCO3 precipitation in the presence of oil: Implications, modeling, numerical simulation, validation, prototype development, and experimental results. Geoenergy Sci. Eng. 2023, 228, 211885. [Google Scholar] [CrossRef] [Scilit]
- Coto, B.; Martos, C.; Peña, J.L.; Rodríguez, R.; Pastor, G. Effects on the solubility of CaCO3: Experimental study and model description. Fluid Phase Equilib. 2012, 324, 1–7. [Google Scholar] [CrossRef] [Scilit]
- Cheong, W.C.; Gaskell, P.H.; Neville, A. Substrate effect on surface adhesion/crystallisation of calcium carbonate. J. Cryst. Growth 2013, 363, 7–21. [Google Scholar] [CrossRef] [Scilit]
- Collins, I.R. A new model for mineral scale adhesion. In Proceedings of the SPE Oilfield Scale Symposium; Society of Petroleum Engineers: Aberdeen, UK, 2002; SPE-74655-MS. [Google Scholar] [CrossRef]
- Lai, N.; Wen, Y.; Wang, Y.; Zhao, X.; Chen, J.; Wang, D.; Wang, X.; Yu, T.; Jia, C. Calcium carbonate scaling kinetics in oilfield gathering pipelines using a 1D axial dispersion model. J. Pet. Sci. Eng. 2020, 188, 106925. [Google Scholar] [CrossRef] [Scilit]
- Eroini, V.; Neville, A.; Kapur, N.; Euvrard, M. New insight into the relation between bulk precipitation and surface deposition of calcium carbonate mineral scale. Desalin. Water Treat. 2013, 51, 882–891. [Google Scholar] [CrossRef] [Scilit]
- Quddus, A.; Al-Hadhrami, L.M. Hydrodynamically deposited CaCO3 and CaSO4 scales. Desalination 2009, 246, 526–533. [Google Scholar] [CrossRef] [Scilit]
- Guan, Y.; Wang, X.; Cao, W.; Zhou, G. Controlled synthesis and microstructure of metastable flower-like vaterite. Materials 2018, 11, 2300. [Google Scholar] [CrossRef] [Scilit]
- Hanifa, M.; Sharma, U.; Thapliyal, P.C.; Singh, L.P. Effects of temperature, pH and calcium-to-carbonate ratio on the calcium carbonate polymorphs. Discov. Civ. Eng. 2025, 2, 147. [Google Scholar] [CrossRef] [Scilit]
- Kawano, J.; Shimobayashi, N.; Miyake, A.; Kitamura, M. Precipitation diagram of calcium carbonate polymorphs: Its construction and significance. J. Phys. Condens. Matter 2009, 21, 425102. [Google Scholar] [CrossRef] [Scilit]
- Brečević, L.; Kralj, D. On calcium carbonates: From fundamental research to application. Croat. Chem. Acta 2007, 80, 467–484. [Google Scholar]
- Jin, H.Q.; Athreya, H.; Wang, S.; Nawaz, K. Experimental study of crystallization fouling by calcium carbonate: Effects of surface structure and material. Desalination 2022, 532, 115754. [Google Scholar] [CrossRef] [Scilit]
- Zancanella, A.C.B.; Saidler, L.A.; Siqueira, R.N.; Schluter, H.E.P.; Loureiro, B.V. Evaluation of surface finish on 304 stainless steel as a way to mitigate calcium carbonate scaling. Surfaces 2025, 8, 13. [Google Scholar] [CrossRef] [Scilit]
- Zhang, Y.; Farquhar, R. Laboratory determination of calcium carbonate scaling rates for oilfield wellbore environments. In Proceedings of the International Symposium on Oilfield Scale, Aberdeen, UK, 30–31 January 2001. SPE-68329-MS. [Google Scholar] [CrossRef]
- Andritsos, N.; Karabelas, A.J. Calcium carbonate scaling in a plate heat exchanger in the presence of particles. Int. J. Heat Mass Transf. 2003, 46, 4613–4627. [Google Scholar] [CrossRef] [Scilit]
- Muryanto, S.; Bayuseno, A.P.; Ma’mun, H.; Usamah, M.; Jotho. Calcium carbonate scale formation in pipes: Effect of flow rates, temperature, and malic acid additives. Procedia Chem. 2014, 9, 69–76. [Google Scholar] [CrossRef] [Scilit]
- Vazirian, M.M.; Charpentier, T.V.J.; Penna, M.O.; Neville, A. Surface inorganic scale formation in oil and gas industry: As adhesion and deposition processes. J. Pet. Sci. Eng. 2016, 137, 22–32. [Google Scholar] [CrossRef] [Scilit]
- Wang, L.C.; Li, S.F.; Wang, L.B.; Cui, K.; Zhang, Q.L.; Liu, H.B.; Li, G. Relationships between CaCO3 fouling characteristics and flow velocity in smooth tubes. Exp. Therm. Fluid Sci. 2016, 74, 143–159. [Google Scholar] [CrossRef] [Scilit]
- Oddo, J.E.; Sloan, K.M.; Tomson, M.R. Inhibition of CaCO3 precipitation from brine solutions: A new flow system for high-temperature and high-pressure studies. J. Pet. Technol. 1982, 34, 2409–2412. [Google Scholar] [CrossRef] [Scilit]
- Hołysz, L.; Chibowski, E.; Wójcik, W.; Busch, K.W.; Busch, M.A. Parameters determining the deposition of calcium carbonate into a glass capillary. J. Adhes. Sci. Technol. 1994, 8, 181–193. [Google Scholar] [CrossRef] [Scilit]
- Freitas, T.C.; Ferreira, S.S.; Silva, J.M.; Fontes, R.A.; Lopes, H.E.; Silva, F.A.M.; Silva, M.G.F.; Cristante, V.M.; Silva, J.F.C. From lab to field: An approach for effective scale inhibitor recommendations in high-CO2 cases—Lessons from Búzios Field. In Proceedings of the SPE International Conference on Oilfield Chemistry; Society of Petroleum Engineers: Galveston, TX, USA, 2025; SPE-224307-MS. [Google Scholar] [CrossRef] [Scilit]
- Graham, G.M.; Collins, I.R.; Stalker, R.; Littlehales, I.J. The importance of appropriate laboratory procedures for the determination of scale inhibitor performance. In Proceedings of the SPE International Oilfield Scale Conference and Exhibition; Society of Petroleum Engineers: Aberdeen, UK, 2002; SPE-74679-MS. [Google Scholar] [CrossRef]
- Sanni, O.; Bukuaghangin, O.; Huggan, M.; Kapur, N.; Charpentier, T.; Neville, A. Development of a novel once-through flow visualization technique for kinetic study of bulk and surface scaling. Rev. Sci. Instrum. 2017, 88, 103903. [Google Scholar] [CrossRef] [Scilit]
- Graham, G.M.; Thomson, H.; Bowering, D.; Stalker, R. Correlation of shear and turbulence on scale formation and inhibition. In Proceedings of the SPE International Oilfield Scale Conference and Exhibition, Aberdeen, UK, 14 May 2014. SPE-169761-MS. [Google Scholar] [CrossRef] [Scilit]
- Goodwin, N.; May, M.; Nichols, D.; Graham, G. Scale deposition and hydrodynamics—Benchtop to pilot rig. In Proceedings of the SPE International Oilfield Scale Conference and Exhibition, Aberdeen, UK, 21 June 2018. SPE-190756-MS. [Google Scholar] [CrossRef] [Scilit]
- Loureiro, J.B.R.; Gonçalves, A.S.; Souza, B.G.B.; Pepe, I.M.; Demetino, G.G.; Soares, L.C.S.; Silva, C.E.T.; Soares, L.L.O.; Santos, H.F.L.; Castro, B.B.; et al. Large-scale pipe flow experiments for evaluation of non-chemical solutions for calcium carbonate scaling inhibition and control. In Proceedings of the SPE International Oilfield Scale Conference and Exhibition, Aberdeen, UK, 25–26 May 2022. SPE-209476-MS. [Google Scholar] [CrossRef] [Scilit]
- Burgos-Cara, A.; Putnis, C.V.; Rodriguez-Navarro, C.; Ruiz-Agudo, E. Hydration Effects on the Stability of Calcium Carbonate Pre-Nucleation Species. Minerals 2017, 7, 126. [Google Scholar] [CrossRef] [Scilit]
- Aldeia, W.; França, G.P.; Miliotti, M.A.; Martins, A.L.; Schluter, H.E.P.; Castro, B.B.; Pereira, A.Z.I.; Freitas, T.C. Experimental study of the effect of magnetic field associated with inhibitor in calcium carbonate scale formation. In Proceedings of the SPE International Oilfield Scale Conference and Exhibition, Aberdeen, UK, 25–26 May 2022. SPE-209488-MS. [Google Scholar] [CrossRef] [Scilit]
- Mouallem, J.; Arif, M.; Raza, A.; Glatz, G.; Rahman, M.M.; Mahmoud, M.; Iglauer, S. Critical review and meta-analysis of the interfacial tension of CO2-brine and H2-brine systems: Implications for CO2 and H2 geo-storage. Fuel 2024, 356, 129575. [Google Scholar] [CrossRef] [Scilit]
- Sun, N.; Jiang, H.; Liang, A.; Zhang, D.; Cai, H.; Zhang, L.; Chong, X. Influences of material types on the mechanisms of crystal growth in an aggregate scaling device. Int. Commun. Heat Mass Transf. 2019, 107, 104303. [Google Scholar] [CrossRef] [Scilit]
- Moriconi, L.; Nascimento, T.; Souza, B.G.B.; Loureiro, J.B.R. Top-down model of calcium carbonate scale formation in turbulent pipe flows. Therm. Sci. Eng. Prog. 2022, 28, 101141. [Google Scholar] [CrossRef] [Scilit]
- Han, Y.S.; Hadiko, G.; Fuji, M.; Takahashi, M. Factors affecting the phase and morphology of CaCO3 prepared by a bubbling method. J. Eur. Ceram. Soc. 2006, 26, 843–847. [Google Scholar] [CrossRef] [Scilit]

Disclaimer/Publisher’s Note: The statements, opinions and data contained in all publications are solely those of the individual author(s) and contributor(s) and not of MDPI and/or the editor(s). MDPI and/or the editor(s) disclaim responsibility for any injury to people or property resulting from any ideas, methods, instructions or products referred to in the content. |
© 2026 by the authors. Licensee MDPI, Basel, Switzerland. This article is an open access article distributed under the terms and conditions of the Creative Commons Attribution (CC BY) license.