


Abstract
The combined arch theory provides an effective means for designing support parameters in roadways within loose and fractured surrounding rock. A clear understanding of the internal stress evolution during the load-bearing process of the combined arch is of guiding significance for optimizing roadway support. Taking the 11308 return airway of a mine in Inner Mongolia as the engineering background, this study adopts a combined research approach of theoretical calculation, numerical simulation and laboratory testing. It systematically investigates the internal stress evolution of the anchored combined arch load-bearing structure in roadways with loose and fractured surrounding rock. The load-bearing capacity and failure characteristics of the anchored combined arch under different roof support schemes are explored and analyzed. An optimized support scheme for the loose and fractured roof is proposed and applied in the field, and the monitoring results verify its effectiveness. The results indicate that bolt density is a key factor affecting the load-bearing performance of the combined arch. As bolt spacing decreases, the vertical stress concentration in the anchored structure increases, and its deformation resistance is enhanced. During the stage from load-bearing to failure of the combined arch, the changes in vertical and horizontal stresses within the arch become more stable, and the load-bearing capacity is significantly improved. Comparison between the model test results and theoretical calculations shows good agreement, verifying the rationality of the theoretical calculations. Pressure sensors were pre-installed in the laboratory model to monitor the vertical stress changes in the anchored structure throughout the loading process, and numerical simulations confirmed the stress concentration effect of the combined arch. It was also found that the instability of the anchored structure is controlled by the shear plane at the arch feet. Finally, the bolt spacing in the 11308 return airway of the Inner Mongolia mine was optimized to 0.7 m, and field monitoring was introduced. The maximum roof surface settlement displacement was 15 mm, and the maximum roof separation was 3 mm, confirming that these parameters can meet the roadway stability requirements.
1. Introduction
As the geological conditions for surrounding rock control in China’s coal mines become increasingly complex, the challenge of supporting roadways in loose and fractured strata has become particularly pronounced. This type of surrounding rock is typically characterized by numerous joints and fissures, resulting in poor rock mass integrity and weak self-bearing capacity. Consequently, it is highly susceptible to deformation and failure upon excavation-induced disturbance, posing a serious threat to mine safety. Statistics indicate that a significant proportion of roadway roof falls and rib spalling accidents occur under such loose and fractured rock conditions. Bolt support, as the primary technique for controlling surrounding rock, functions by integrating the loose rock mass into a load-bearing composite structure through bolt installation [1,2,3,4].
The combined arch theory is a fundamental concept for elucidating the mechanism of bolt support. This theory posits that in arched roadways, systematically installed bolts can create a continuous combined arch within the surrounding rock. This arched structure is capable of bearing the load from the overlying strata, thereby maintaining roadway stability [5,6,7,8]. Since its introduction, the combined arch theory has undergone continuous development and refinement. Initial research primarily focused on the qualitative description of the arch’s formation mechanism and its mechanical effects, which subsequently evolved into quantitative design methodologies. The theory was originally proposed by Lang [9], who first demonstrated the reinforcing effect of bolts on fragmented rock through square table and bucket tests. This was followed by validation using two-dimensional photoelastic experiments. The combined arch theory suggests that bolts create cone-shaped compression zones in the surrounding rock. The overlap of these compression zones from adjacent bolts forms a combined arch structure, which possesses a certain load-bearing capacity.
Currently, the design of bolt support parameters based on the combined arch theory primarily involves determining key parameters such as bolt length, spacing, row spacing, and diameter. Regarding parameter design methodologies, Wang Yixuan et al. [10] investigated a working face located beneath the goaf of a contiguous coal seam. They systematically elucidated the calculation methods for bolt parameters based on the composite beam theory, including specific formulas for determining anchorage length in bolt length calculations and controlling combined arch thickness in spacing and row spacing calculations, thus providing an operational design basis for engineering practice. Li Yingming et al. [11] established a “layer-double arch” load-bearing structure model to address the interaction mechanism between two stages of support.
Current laboratory studies on supporting loose and fractured surrounding rock mainly rely on classic gravel anchorage tests. Meng Bo et al. [12] conducted gravel anchorage tests using a self-made gravel box and proposed a concept of roof fall prevention centered on reasonable support density. They also used the particle flow code PFC3D to simulate the internal stress changes during pressurization failure of the gravel-anchored structure. Wang Xiaoqing et al. [13,14] employed PFC3D to demonstrate a significant positive correlation between the bearing capacity of anchored gravel bodies and the internal stress within the gravel. However, because gravel pieces have varying shapes and their contact states follow no specific pattern, it is difficult to determine their direct influence on test results. Moreover, each measurement suffers from errors due to the anisotropy of the gravel blocks. Therefore, models built with regular blocks can better simulate the discontinuous characteristics of jointed rock masses. Bjarte Grindheim et al. [15,16] arranged regular blocks with different joint configurations in anchorage block failure tests, verifying the load-arching effect during rock mass failure. Such models also enable better monitoring of internal stress changes during loading and failure, and the stress evolution during failure was simulated using UDEC. In addition, with respect to structural morphology optimization and stress distribution analysis, Zhang Guojing et al. [17] established a pressure line combination model for long-span deck arch bridges that accounts for actual joint loads and the self-weight of non-prismatic sections, obtaining the optimal arch axis under pure compression. The principle of pressure line superposition employed in their study provides a theoretical reference for understanding the internal stress transfer paths and arch morphology optimization of the combined arch. Carlo Olivieri et al. [18] combined membrane equilibrium analysis with machine learning regression to achieve efficient morphological optimization of compression-only shells under vertical self-weight and horizontal loads. Their data-driven approach to surrogate-constrained optimization offers a methodological reference for the rapid prediction of the internal stress field and parameter identification of the combined arch.
At present, theoretical analyses and macroscopic support effect evaluations of the combined arch are relatively comprehensive, but research on the internal stress distribution of the combined arch remains limited. Existing studies have confirmed the existence of the bolt support stress field, yet there is a lack of in-depth analysis regarding the internal stress evolution process, stress distribution characteristics, and surrounding rock failure features during the load-bearing and failure stages of the combined arch.
Therefore, on the basis of existing research, this paper addresses the deformation and instability problems commonly encountered in roadways with loose and fractured surrounding rock. Using a combination of theoretical analysis, laboratory tests, and numerical simulation, the support parameters of the 11308 return airway in a mine in Inner Mongolia are optimized under the original support conditions that exhibited deformation and instability. The whole process of roof compression under different support parameters is simulated to reveal the internal stress evolution during roof loading. Subsequently, laboratory tests are conducted. Innovatively, regular blocks are arranged in a staggered pattern to simulate the discontinuous characteristics of loose and fractured surrounding rock. Pressure sensors are installed inside the model to monitor internal stress changes, and the results are compared with numerical simulations to reveal the load-bearing behavior and failure characteristics of the anchored combined arch structure. Finally, field monitoring of the support performance verifies the effectiveness of the optimized support parameters.
2. Mechanical Model of the Anchored Combined Arch in Loose and Fractured Surrounding Rock
2.1. Establishment of a Mechanical Model for the Anchored Combined Arch in Loose and Fractured Surrounding Rock
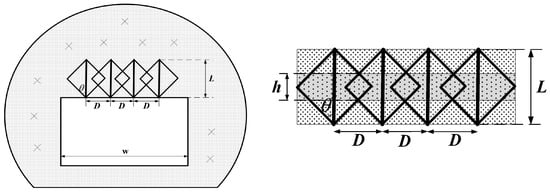
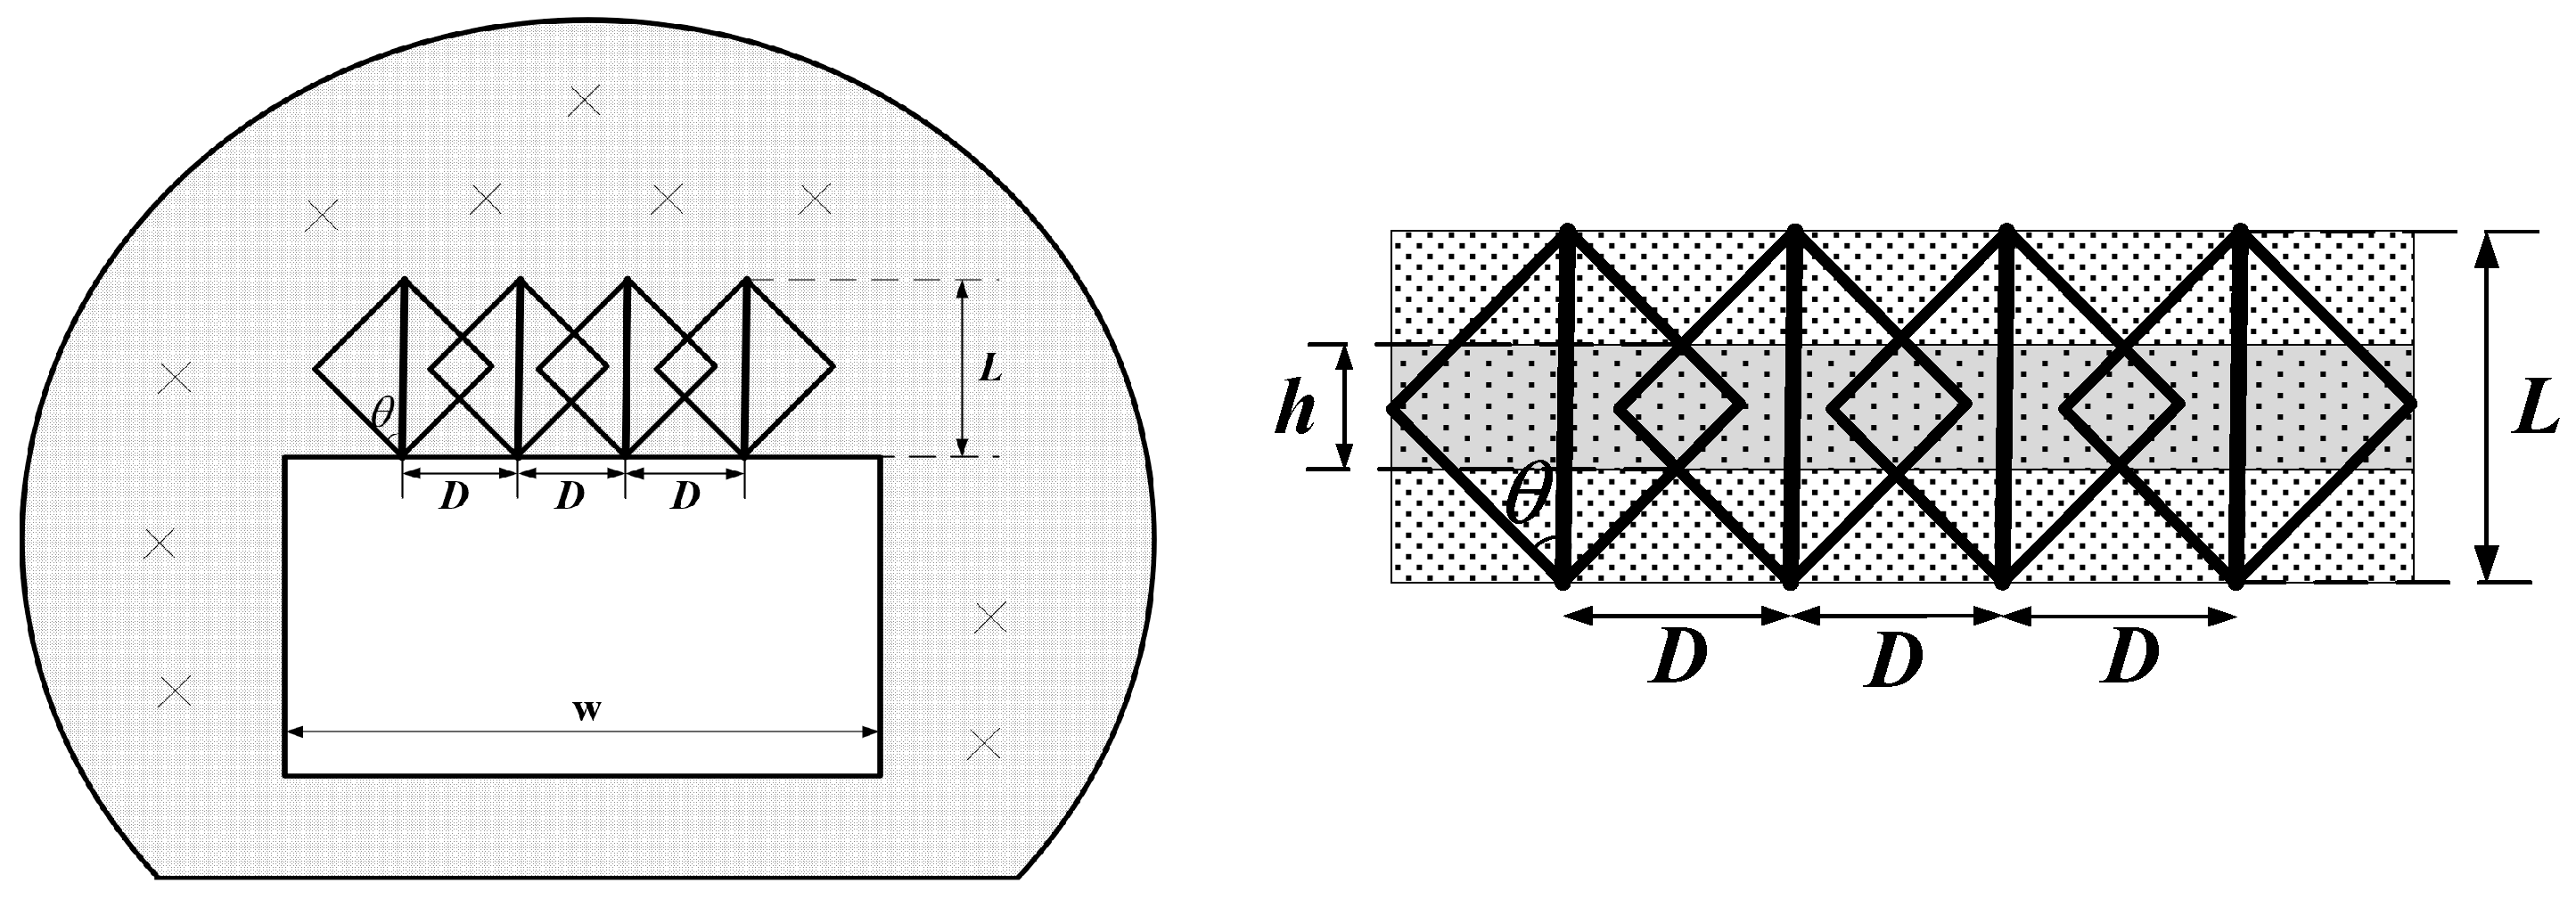
After roadway excavation, bolt support is installed. Figure 1 presents a simplified schematic diagram of the combined arch structure in the roof of a roadway with loose and fractured surrounding rock following bolt support.
Figure 1.
Schematic diagram of arch formation in a roadway after bolt support.
As shown in the figure, when the density of bolts in the loose fractured strata is sufficiently high, the conical compressive stress zones formed after bolt pre-tensioning overlap with each other. This creates a uniform compression overlap zone within the rock mass that bears the load from the overlying strata. This structure is defined as the combined arch. The combined arch is formed by the application of bolt pre-tension, and its thickness has the following geometric relationship with bolt length, bolt spacing and row spacing, and arch formation angle:
where is the thickness of the reinforced zone, is the bolt effective length, is the reinforcement angle of the surrounding rock, and is the bolt spacing.
According to the bearing capacity formula of the pressure arch proposed by Charlie C. Li [19]:
where is the maximum ground pressure the compression arch can withstand; is the uniaxial compressive strength of the intact rock; is the thickness of the bolt-reinforced zone; is the span of the chamber; and is a coefficient proportional to the length of the moment arm in the compression arch approximately equal to 1.5.
Following bolt installation, the strength of the surrounding rock is enhanced. Specifically, while the internal friction angle of the rock mass remains unchanged, the cohesion is increased. Assuming the failure of the reinforced rock mass obeys the Mohr-Coulomb criterion, the uniaxial compressive strength of the reinforced mass can be expressed as [20]:
where is the cohesion of the surrounding rock mass; is the bolt density; is the cross-sectional area of a bolt; is the cohesion contributed by the bolt; is the pre-tension strengthening coefficient; is the pre-tension force; and is the internal friction angle of the surrounding rock.
The ultimate load-bearing capacity of the combined arch is given by:
2.2. Engineering Geological Conditions and Original Roof Support Parameters
The 11308 return airway of a certain mine in Inner Mongolia is situated at a surface elevation of +1450.0 m to +1522.0 m, with the coal seam floor elevation ranging from +920 m to +977 m. The coal seam thickness varies from 3.6 m to 4.43 m, averaging 3.8 m. The coal seam dip angle ranges from 0° to 6°, with an average of 3°. The occurrence and structure of the coal seam belong to the Yan’an Formation of the Lower to Middle Jurassic system. The coal seam has a relatively simple structure, appearing black with an asphalt luster, exhibiting uneven and angular fractures. Endogenous fractures are relatively well developed. Most of the seam contains one layer of parting, locally two layers, with parting thickness ranging from 0.05 m to 1.1 m. The parting lithology is sandy mudstone or sandstone. The return airway has a rectangular cross-section, with a nominal excavated dimension of 5200 mm × 3850 mm and a finished dimension of 5000 mm × 3600 mm. The designed support scheme is a combined support of bolts, mesh, and cables.
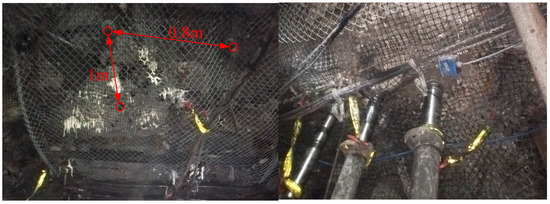
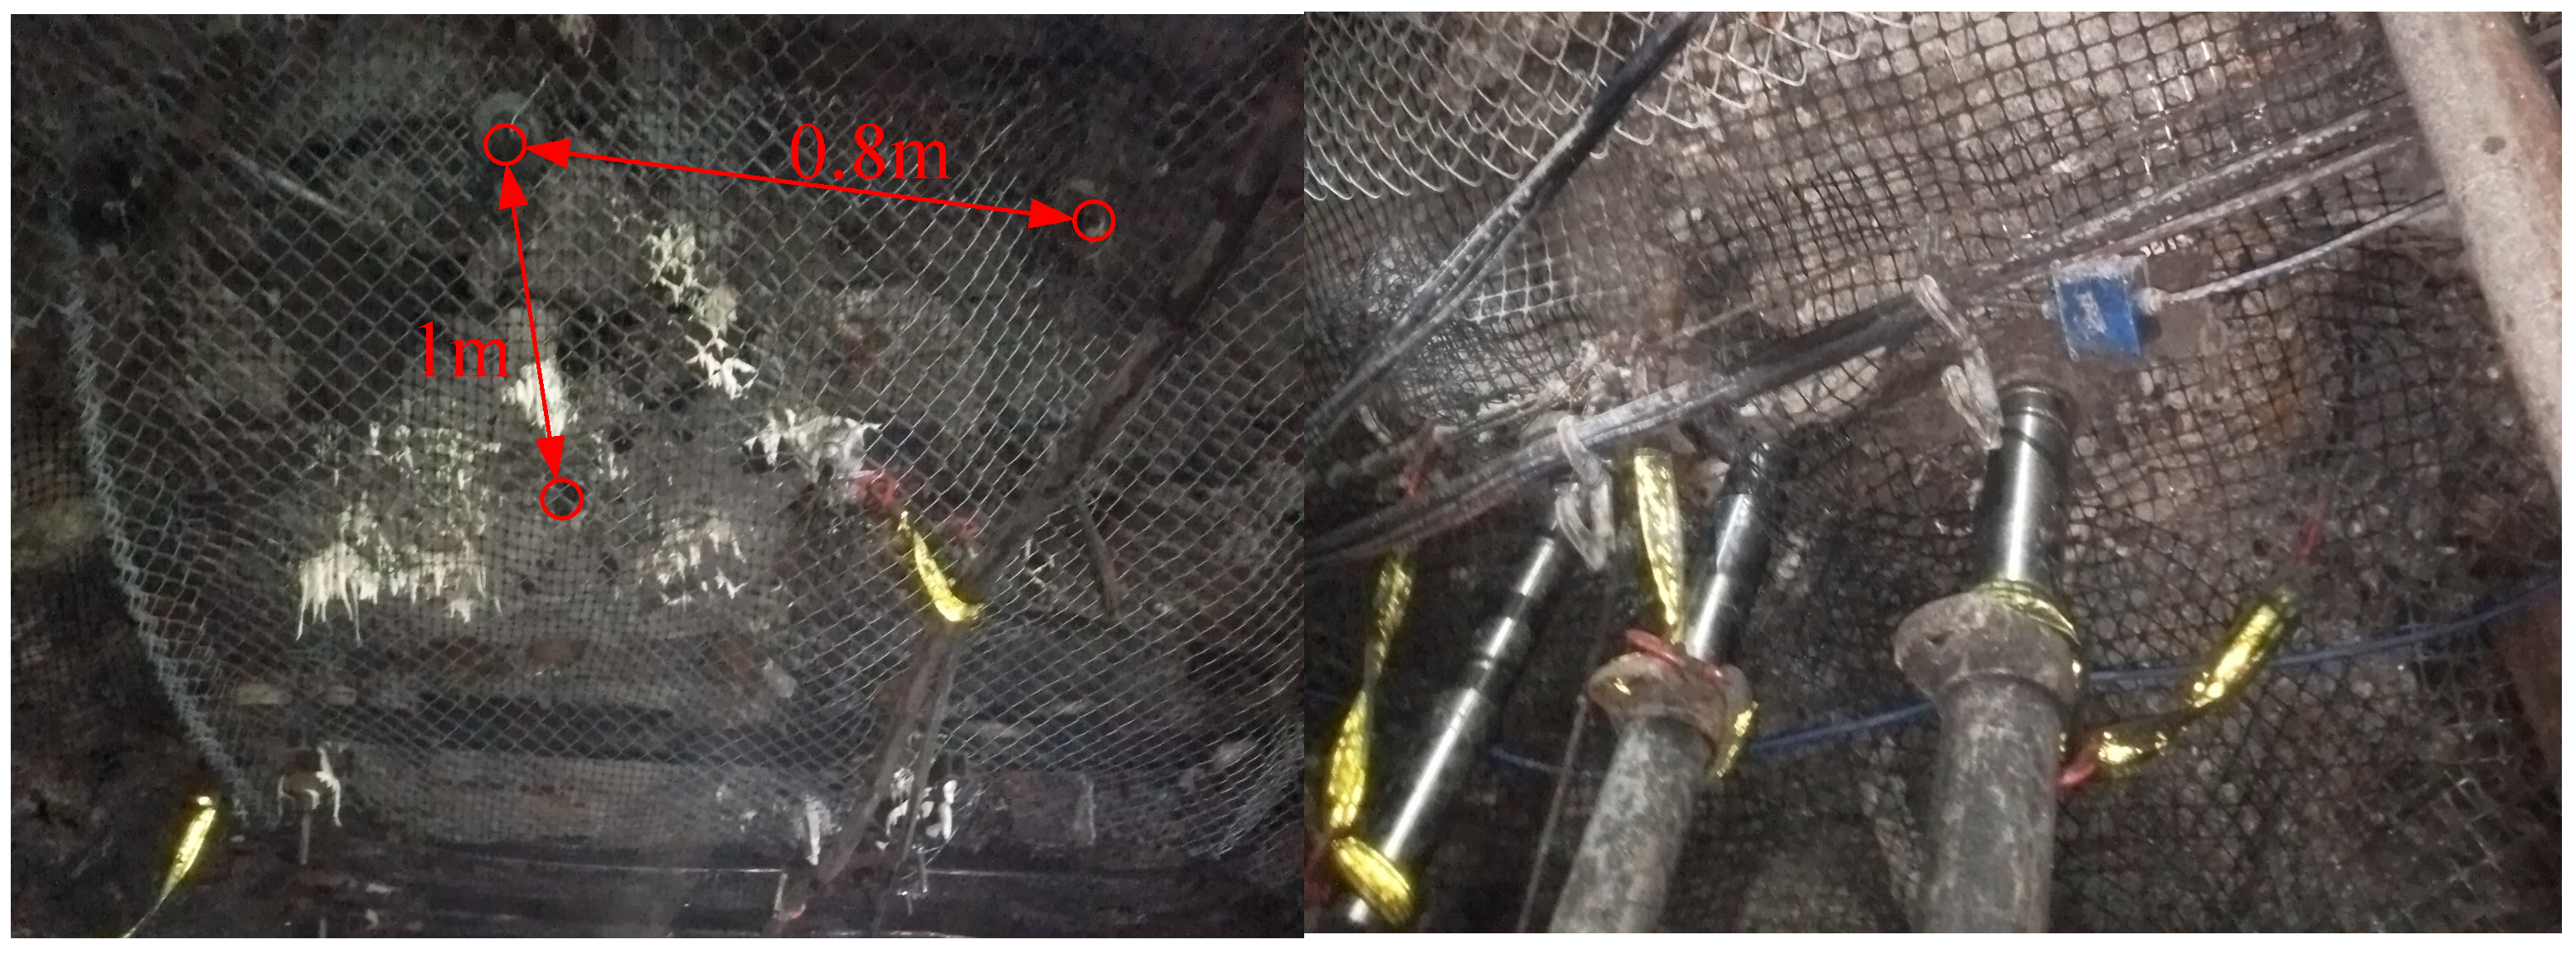
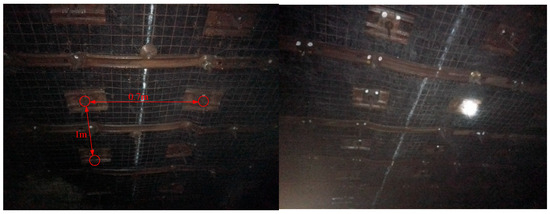
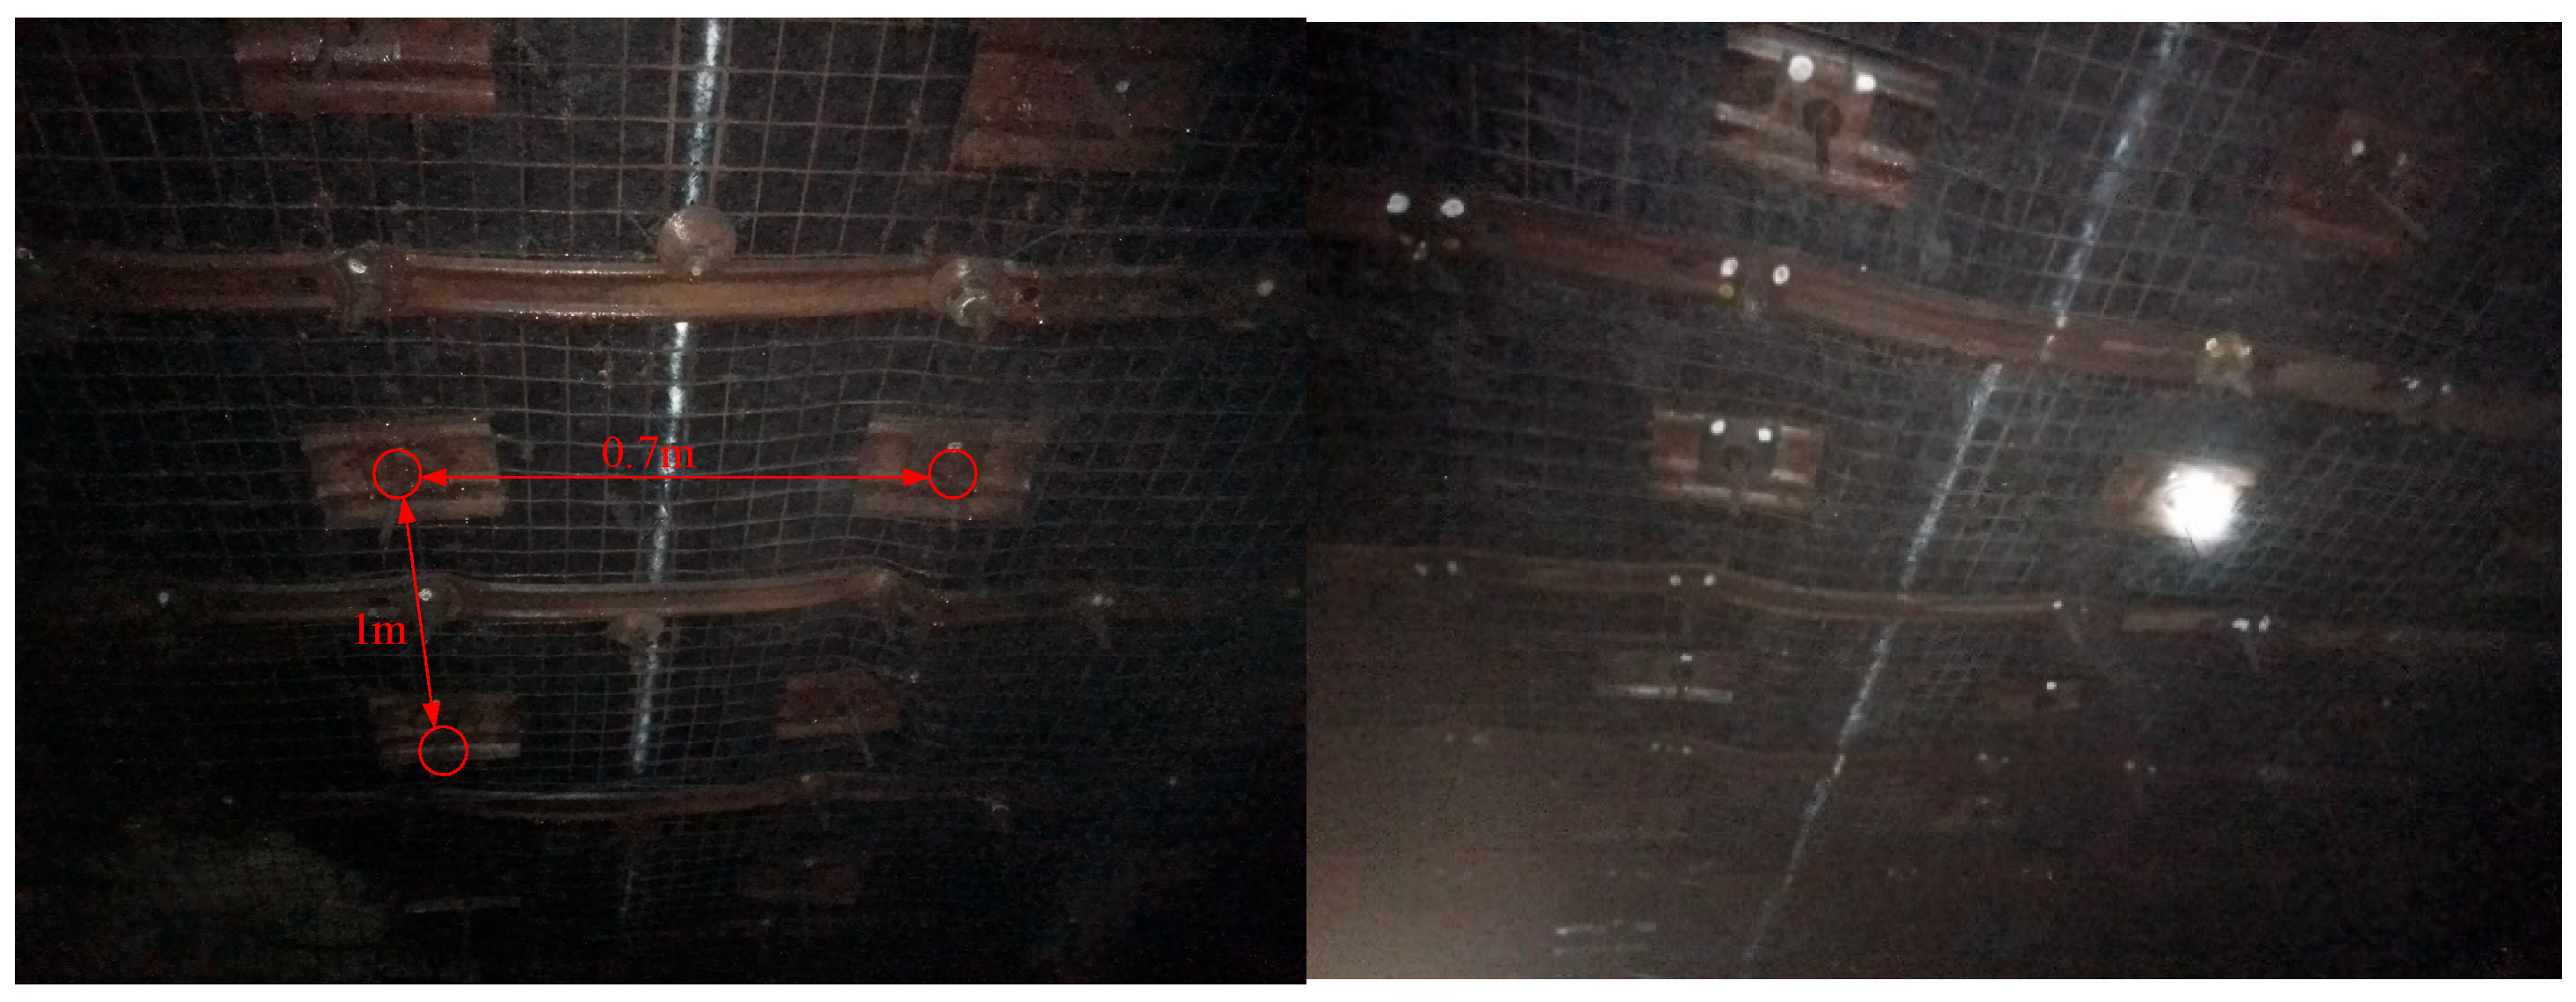
The field bolt layout is shown in Figure 2. The bolts used in this roadway are Φ22 mm × 2600 mm right-hand threaded steel bolts, with a spacing and row spacing of 800 mm × 1000 mm. Additional combined support is provided by mesh and cables. Under the original support conditions, the surrounding rock control effect of the coal mine roadway was unsatisfactory, showing obvious signs of support failure. After roadway excavation, the surrounding rock deformation continued to develop, the roof subsided, and the support structure failed to effectively restrain the surrounding rock.
Figure 2.
The 11308 return airway of a coal mine in Inner Mongolia.
2.3. Design of Roof Bolt Support Parameters
The original support system exhibits insufficient collaborative load-bearing capacity with the surrounding rock, failing to adequately control the stability of the surrounding rock. Therefore, its support parameters need to be optimized. Right-handed threaded steel bolts remain the choice for roof support installation, supplemented by anchor cables and metal mesh for combined reinforcement. Table 1 presents the mechanical parameters of the coal seam roof and floor strata [21]. The support parameters are determined as follows:
Table 1.
Mechanical parameters of rock strata.
2.3.1. Determination of Bolt Diameter
The surrounding rock of the roadway is classified as moderately stable. End-anchored bolt support was adopted, and a bolt diameter of Φ22 mm was selected accordingly.
2.3.2. Determination of Bolt Length
According to the roadway design plan, the bolt length was calculated based on the suspension theory and Protodyakonov’s natural arching theory [22,23], which can be expressed as:
where is the exposed length of the bolt, taken as 0.10 m; is the effective length of the bolt:
where is the roadway width, taken as 5 m; is the roadway height, taken as 3.6 m; is Protodyakonov’s hardness coefficient of the roof rock, taken as 2.15; and is the internal friction angle, taken as 37.12°; is the anchorage length of the bolt, taken as 0.3 m.
The length of the anchor bolt is: = 0.10 + 1.99 + 0.3 = 2.39 m.
Determine the length of the roof bolts in the working face to be 2.4 m.
2.3.3. Determination of Bolt Row Spacing
Considering that the load-bearing capacity of each bolt should equal the weight of the rock within the caving zone, the bolt row spacing was calculated using the following formula:
where is the safety factor, taken as 1.5; is the anchoring force of the bolt, taken as 80 kN; is the rock unit weight, taken as 25.5 kN/m; is the effective length of the bolt, taken as 2 m.
Thus, the bolt row spacing is determined to be 1 m.
2.3.4. Determination of Bolt Spacing
According to Equation (4), the bolt material is selected with a yield strength of 500 MPa and a diameter of 22 mm, and the pre-tension force is 80 kN. Based on the roof and floor parameters, the required support force for the roadway is determined to be 102.2 kN/m2, with a safety factor of 1.8. The cohesion of the surrounding rock is 0.2, and the bolt cohesion is 0.5. According to the roadway surrounding rock conditions, the bolt reinforcement angle θ and the coefficient k related to the reinforcement moment arm are determined. Generally, θ is taken as 45°, k as 0.9, and the pre-tension strengthening coefficient as 1.0. The bolt length is 2.6 m. The specific parameters are listed in Table 2.
Table 2.
Numerical values of parameters in the formula.
The optimal bolt spacing for the roadway roof support is calculated to be 0.72 m; therefore, the final bolt spacing is taken as 0.7 m.
3. Characteristics and Evolution of Internal Stress Distribution in the Load-Bearing Roof
3.1. Establishment of a Numerical Simulation Model for the Roof
UDEC (Universal Distinct Element Code) is a two-dimensional distinct element numerical analysis software developed by the team of Peter Cundall, the founder of the distinct element method. Its core concept is to realistically represent a jointed rock mass as an assembly of two basic elements: rock blocks (continuum) and discontinuities (structural planes), with the deformation and failure behavior of each being described by continuum mechanics laws and contact mechanics laws, respectively.
UDEC can handle rock mass structures containing numerous intersecting joints and fractures. It accurately simulates large displacements, sliding, rotation, opening, and even complete detachment of blocks along discontinuities, as well as the dynamic changes in contact states. Consequently, UDEC can simulate the entire process from local instability to complete failure of the model [24,25].
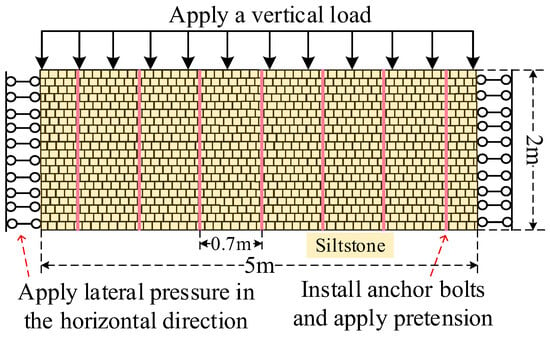
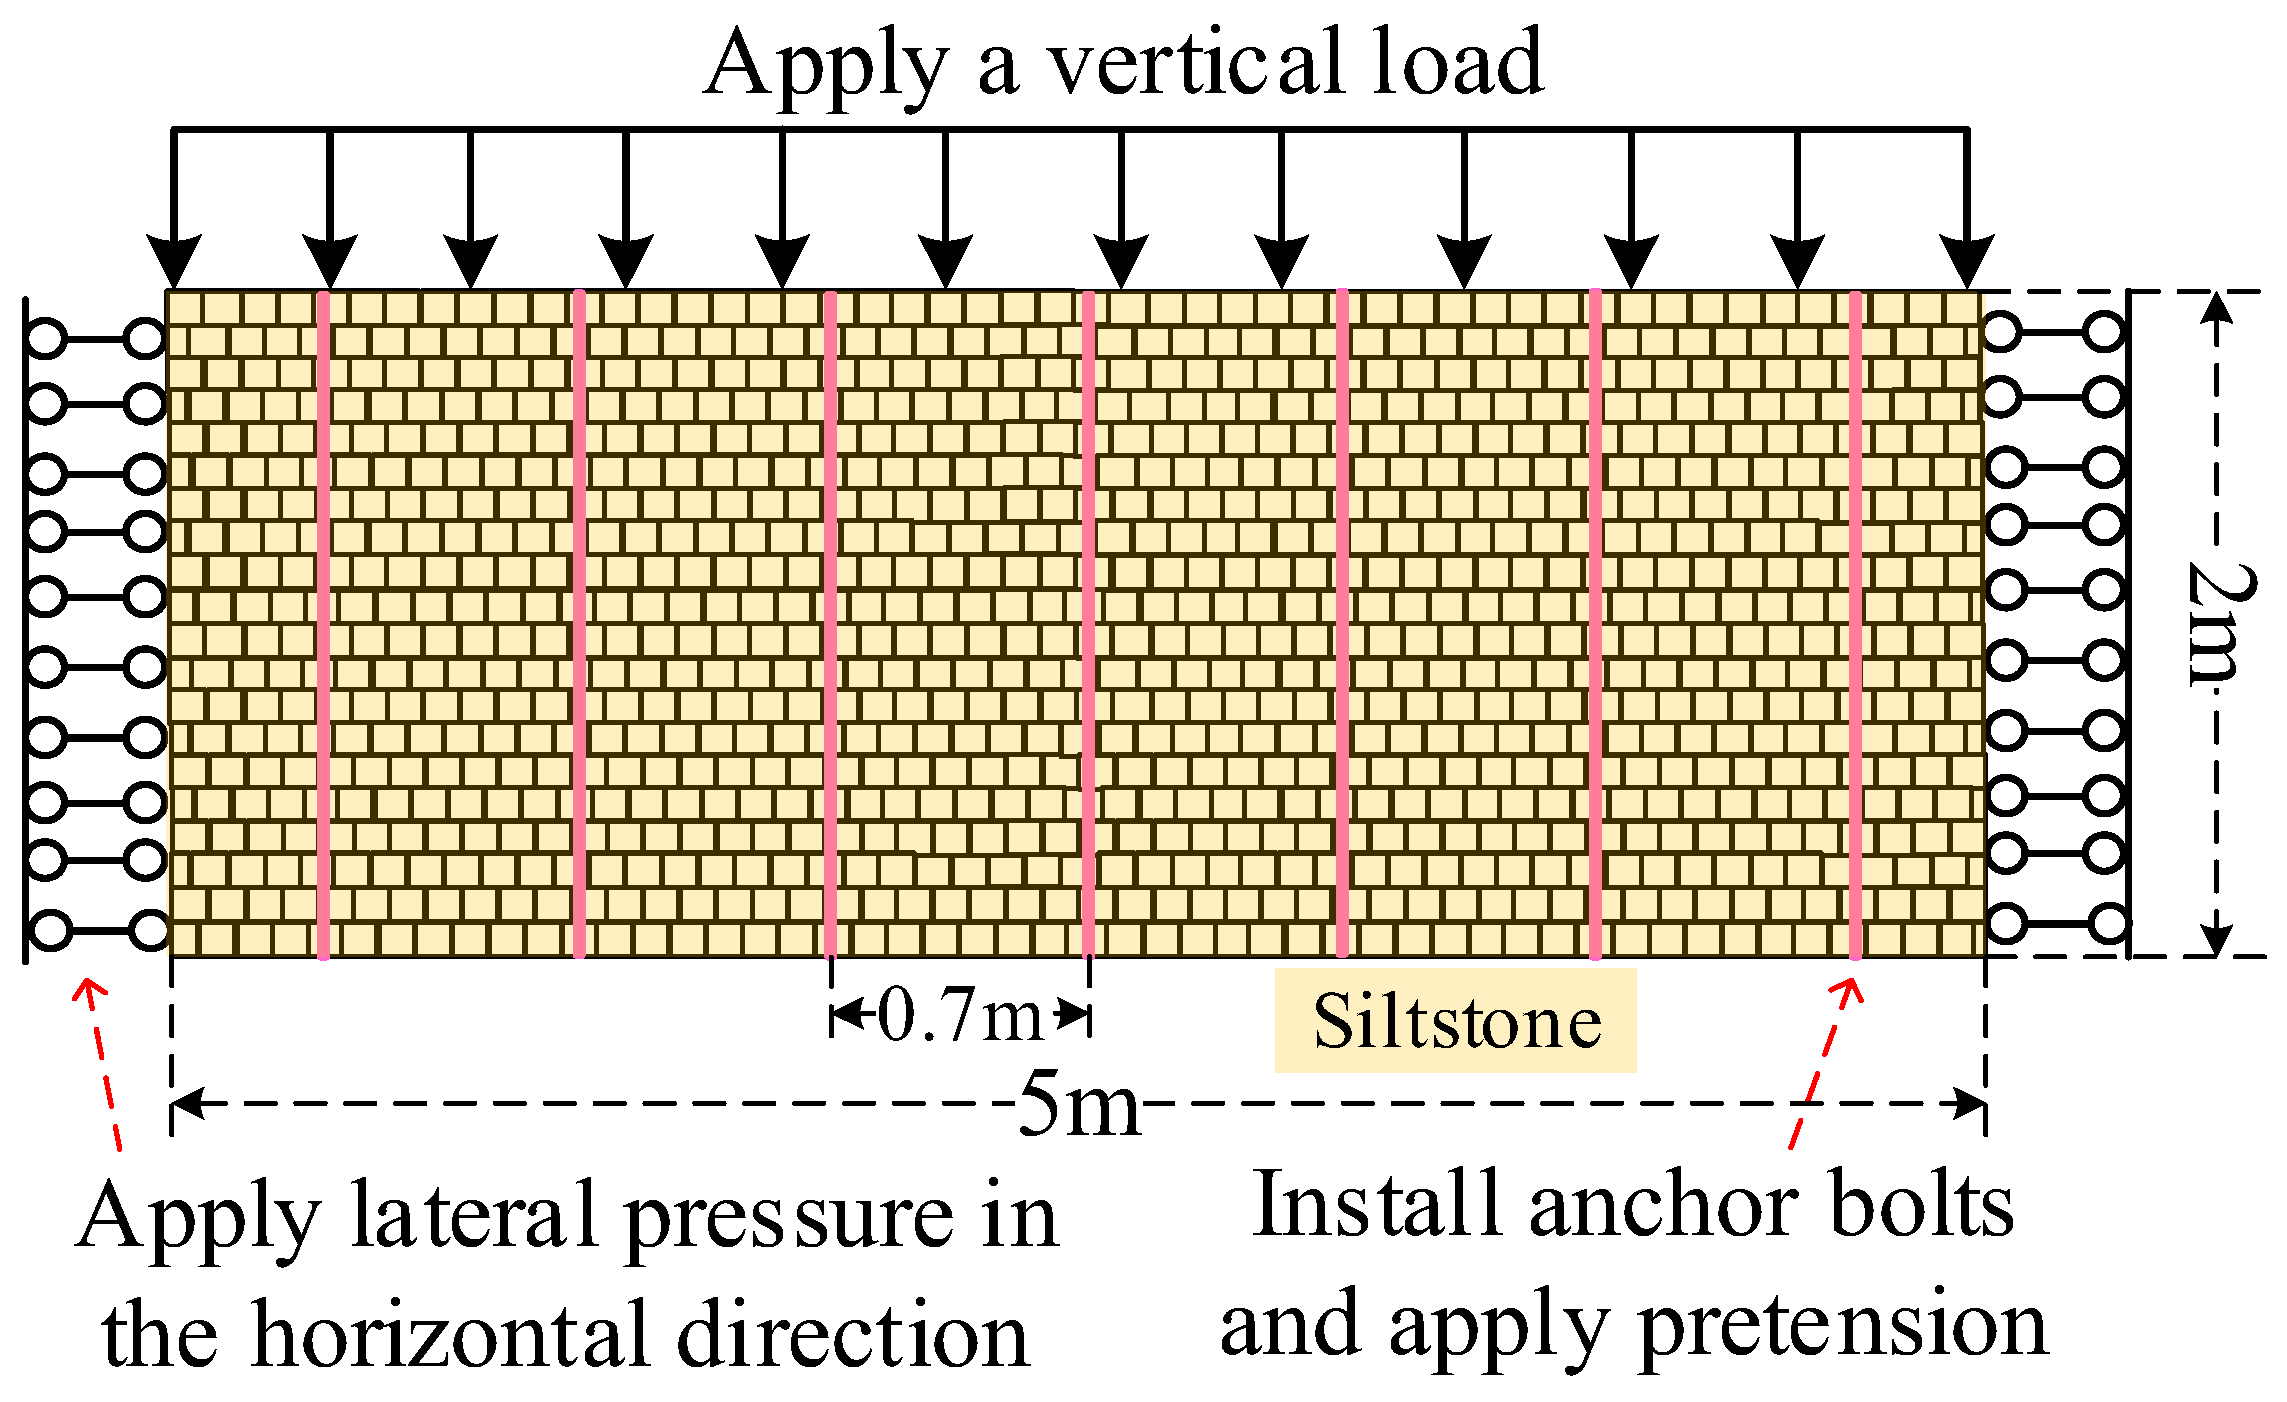
Using the UDEC software, a roof model with a bolt spacing of 0.7 m was established, as shown in Figure 3. The model dimensions are 5 m × 2 m, consisting of uniform 0.1 m blocks. To simulate the joint characteristics of loose surrounding rock, the blocks were arranged with staggered joints. The constitutive model adopted is the Mohr-Coulomb model. Boundary conditions were applied to the simulation model according to the roof bolt support conditions. The displacement and velocity vectors on the left and right boundaries were set to zero. The loading path was defined as a load applied to the top of the model, as shown in Figure 3.
Figure 3.
Simulation model and application of boundary conditions.
The simulation model parameters are listed in Table 3, and the bolt parameters are listed in Table 4.
Table 3.
Simulation model parameters.
Table 4.
Bolt parameters.
3.2. Effect of Bolt Spacing Parameters on the Internal Stress of the Load-Bearing Roof
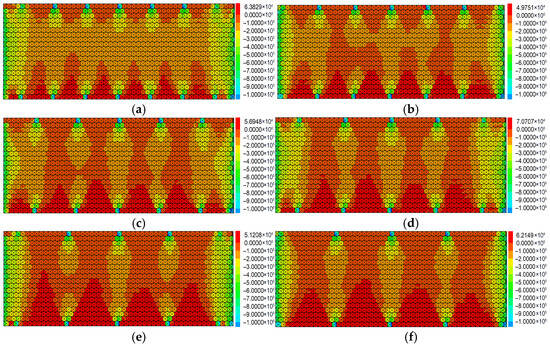
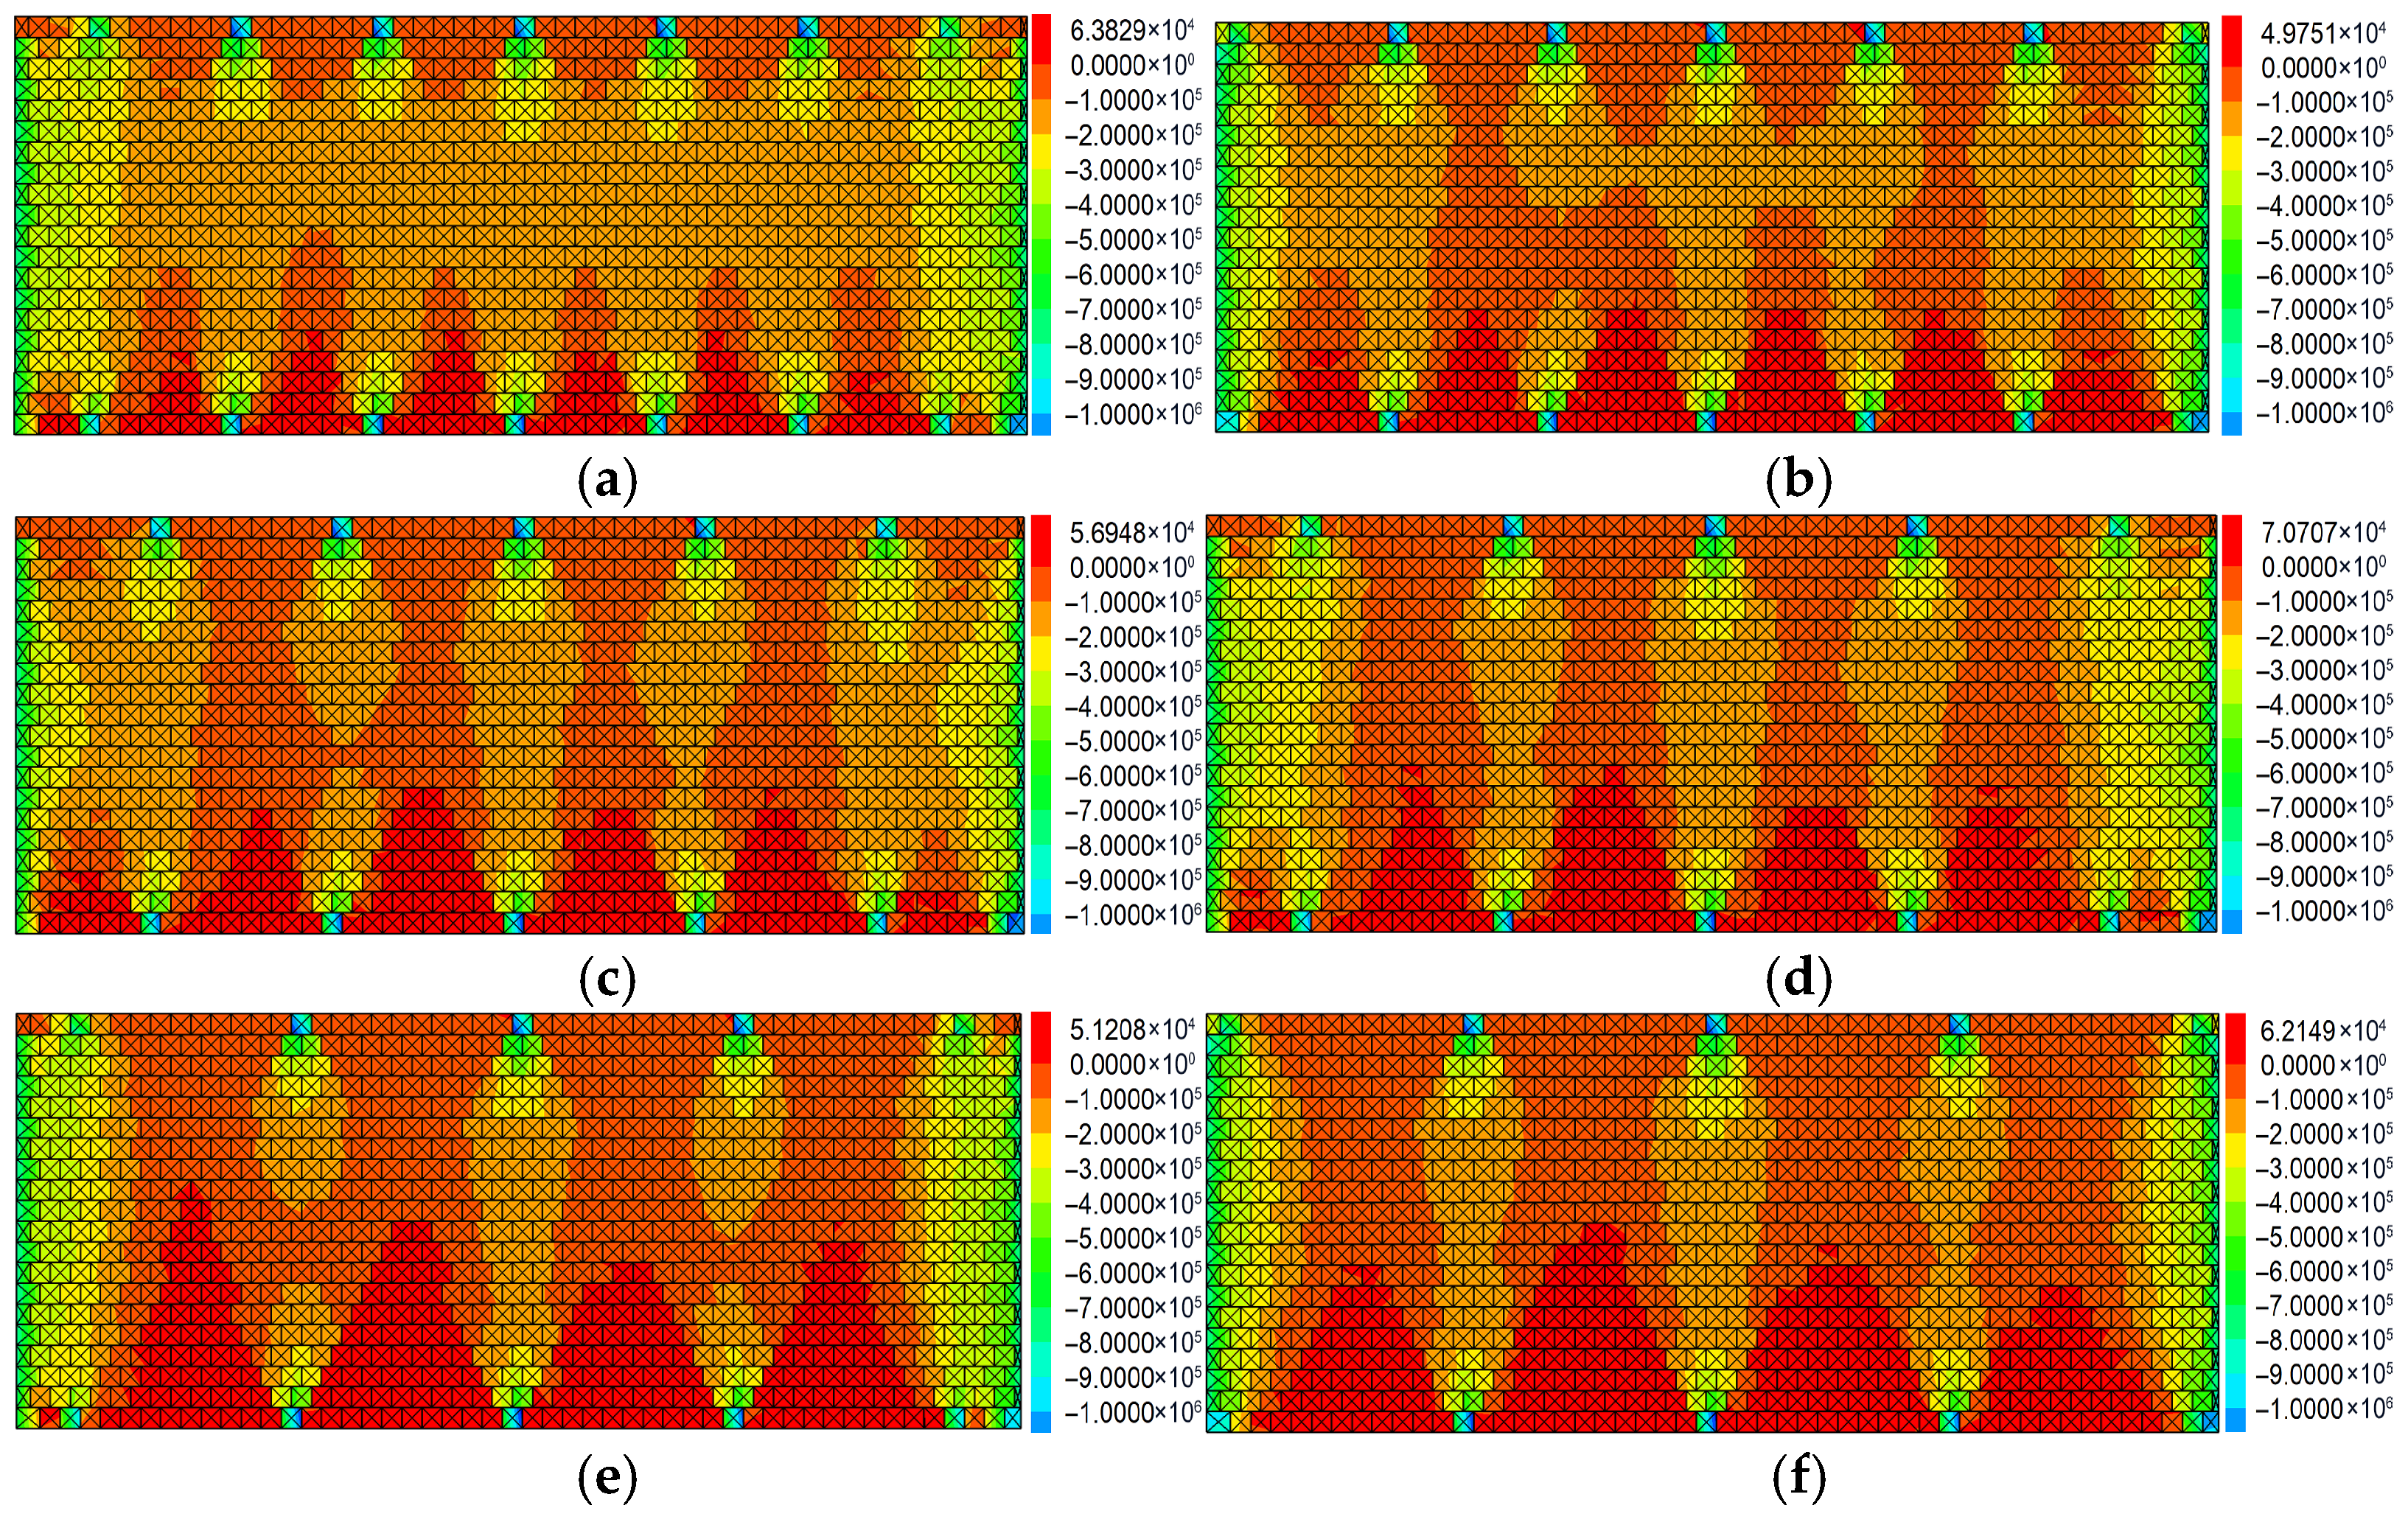
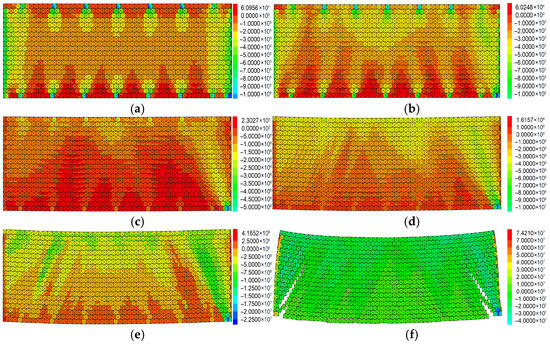
To further clarify the morphology and stress distribution of the combined arch within the reinforced roof under different bolt spacings, a series of roof models were simulated with bolt spacing as the sole variable while keeping all other parameters unchanged. The models for different bolt spacings are illustrated in Figure 4 below.
Figure 4.
Analysis of vertical stress in the combined arch under different bolt spacings. (a) Stress contour for a bolt spacing of 0.7 m. (b) Stress contour for a bolt spacing of 0.8 m. (c) Stress contour for a bolt spacing of 0.9 m. (d) Stress contour for a bolt spacing of 1.0 m. (e) Stress contour for a bolt spacing of 1.1 m. (f) Stress contour for a bolt spacing of 1.2 m.
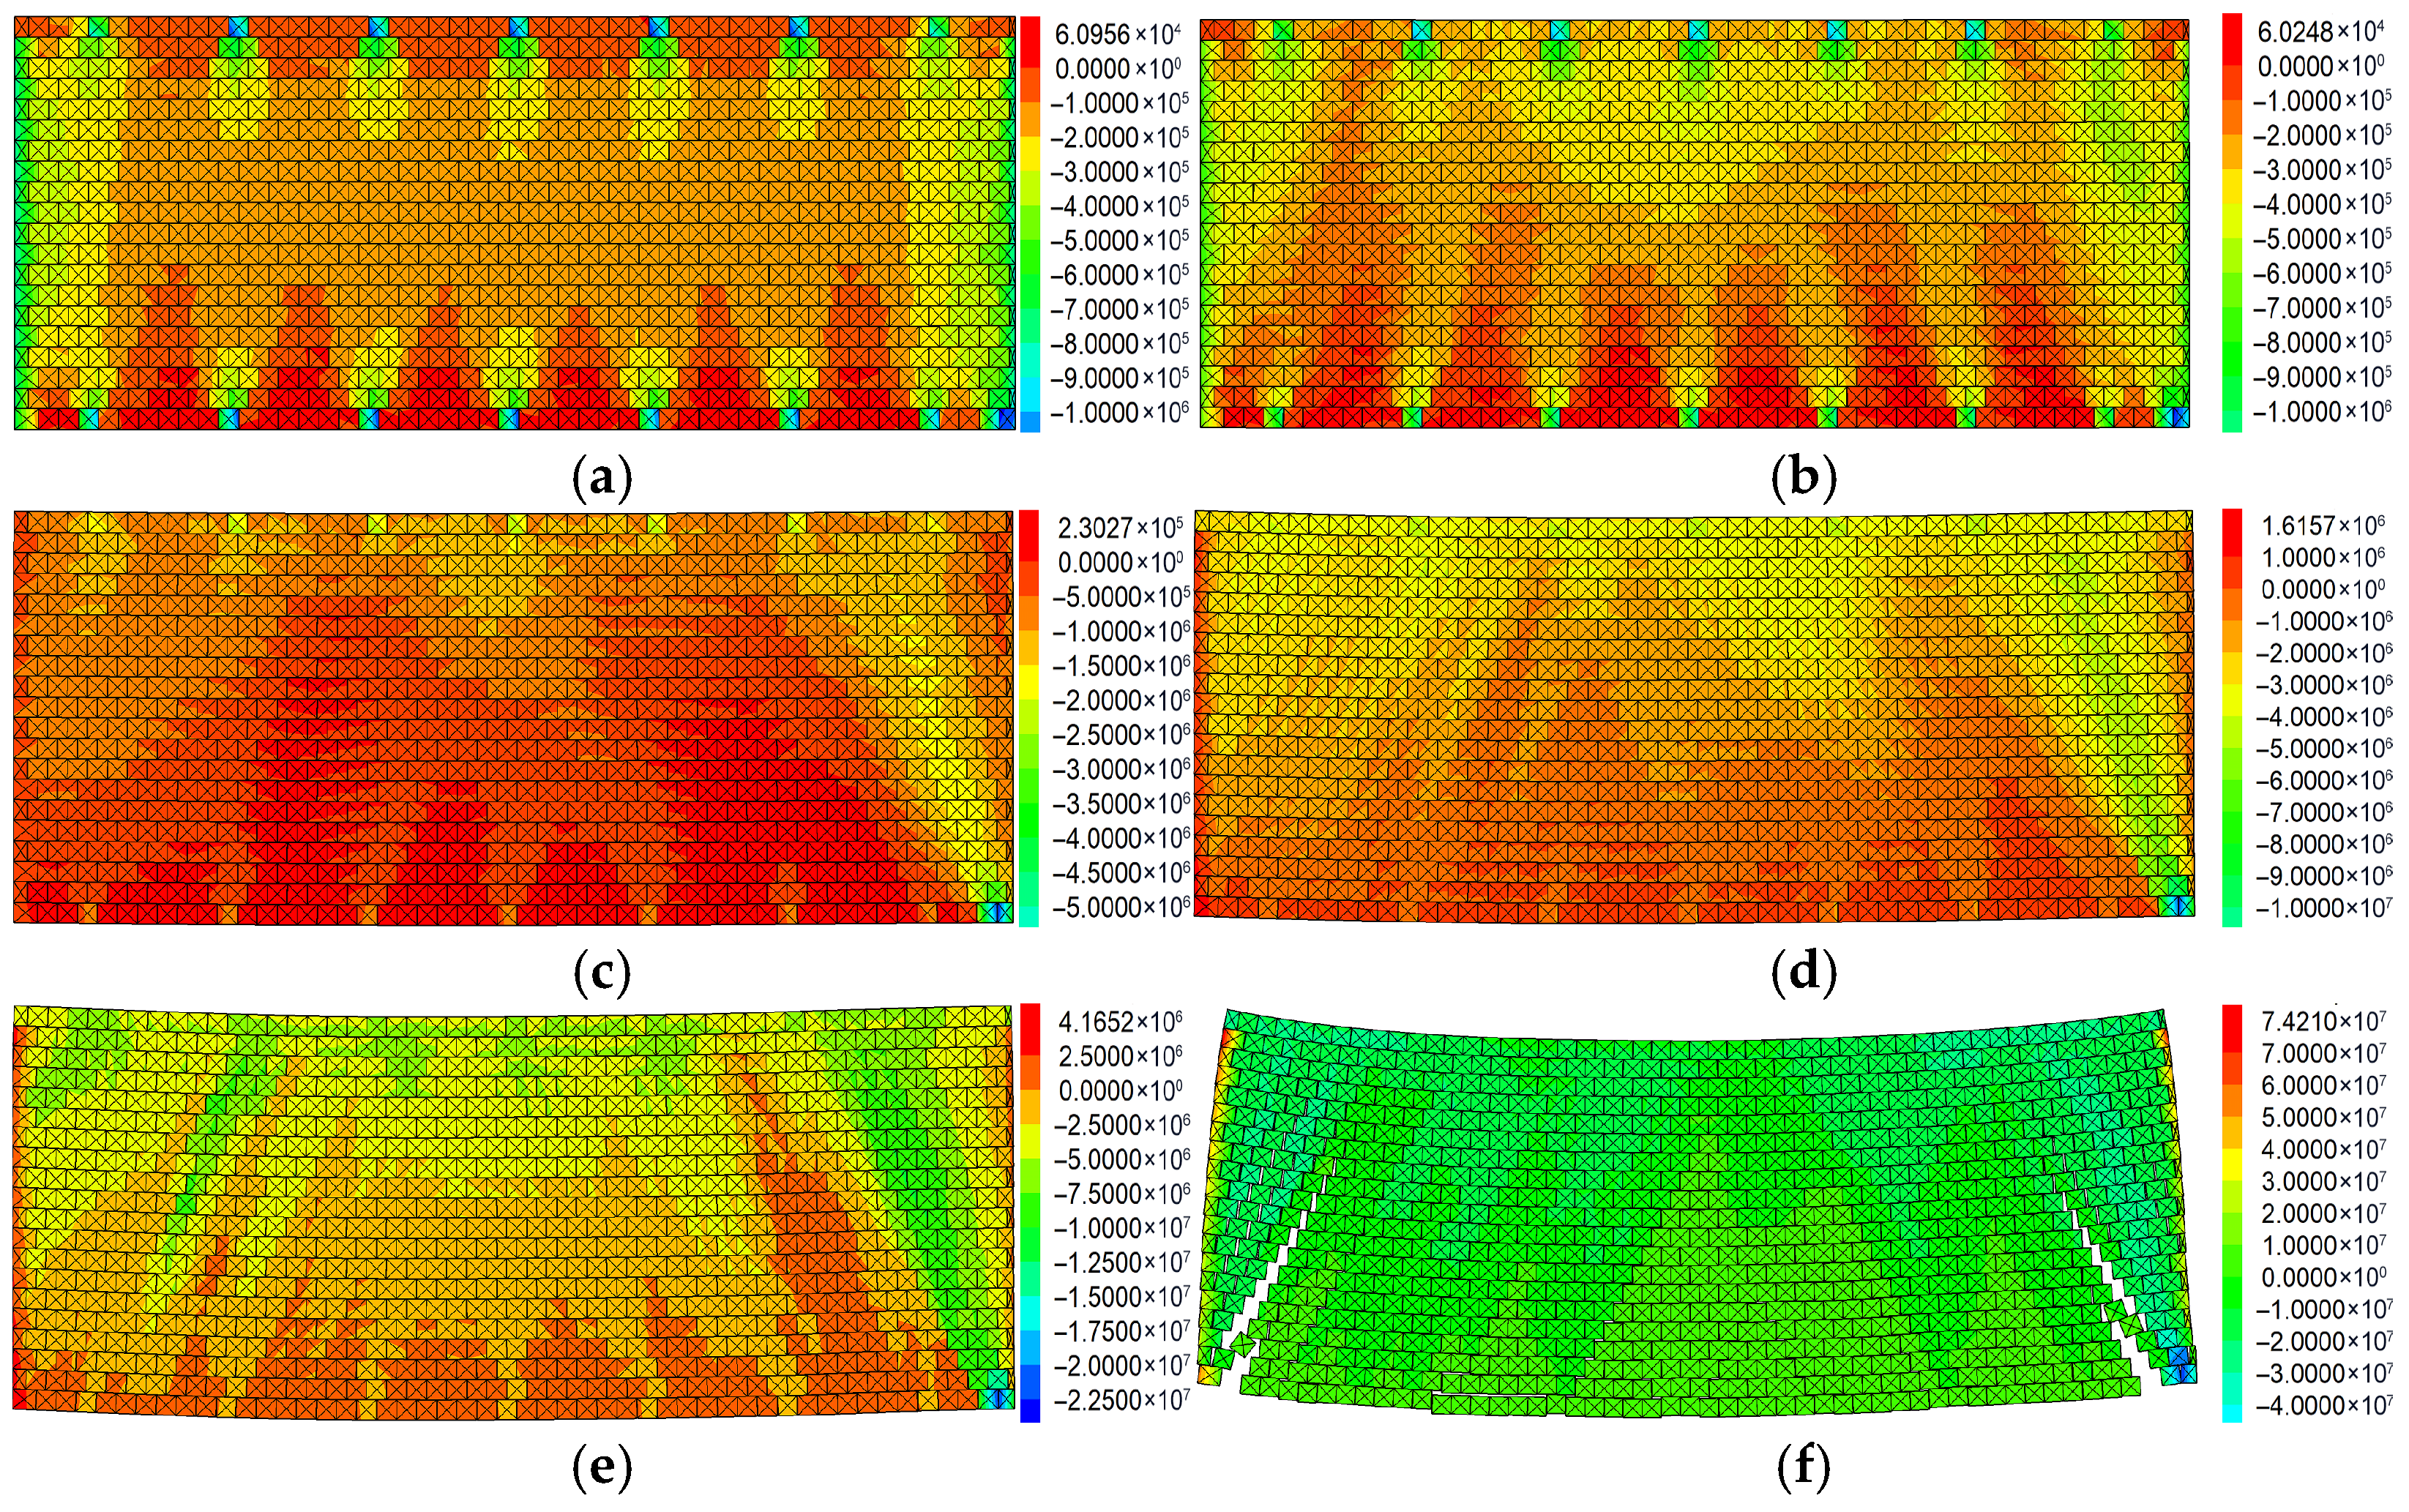
Under the application of bolt pre-tension, friction and interlocking forces between rock particles are mobilized. Through the synergistic action of the bolt group, the rock mass is hinged together into a continuous combined arch structure. Figure 5 illustrates the “formation–loading–failure” process of the combined arch:
Figure 5.
Stress evolution analysis during the complete “formation–loading–failure” process of the combined arch. (a) Initial stage of combined arch formation. (b) Load-bearing stage of the combined arch. (c) Stress rising stage of the combined arch. (d) Initial failure stage of the combined arch. (e) Failure propagation stage. (f) Failure completion.
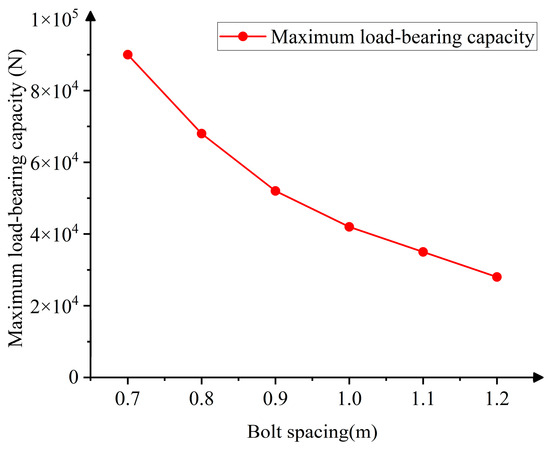
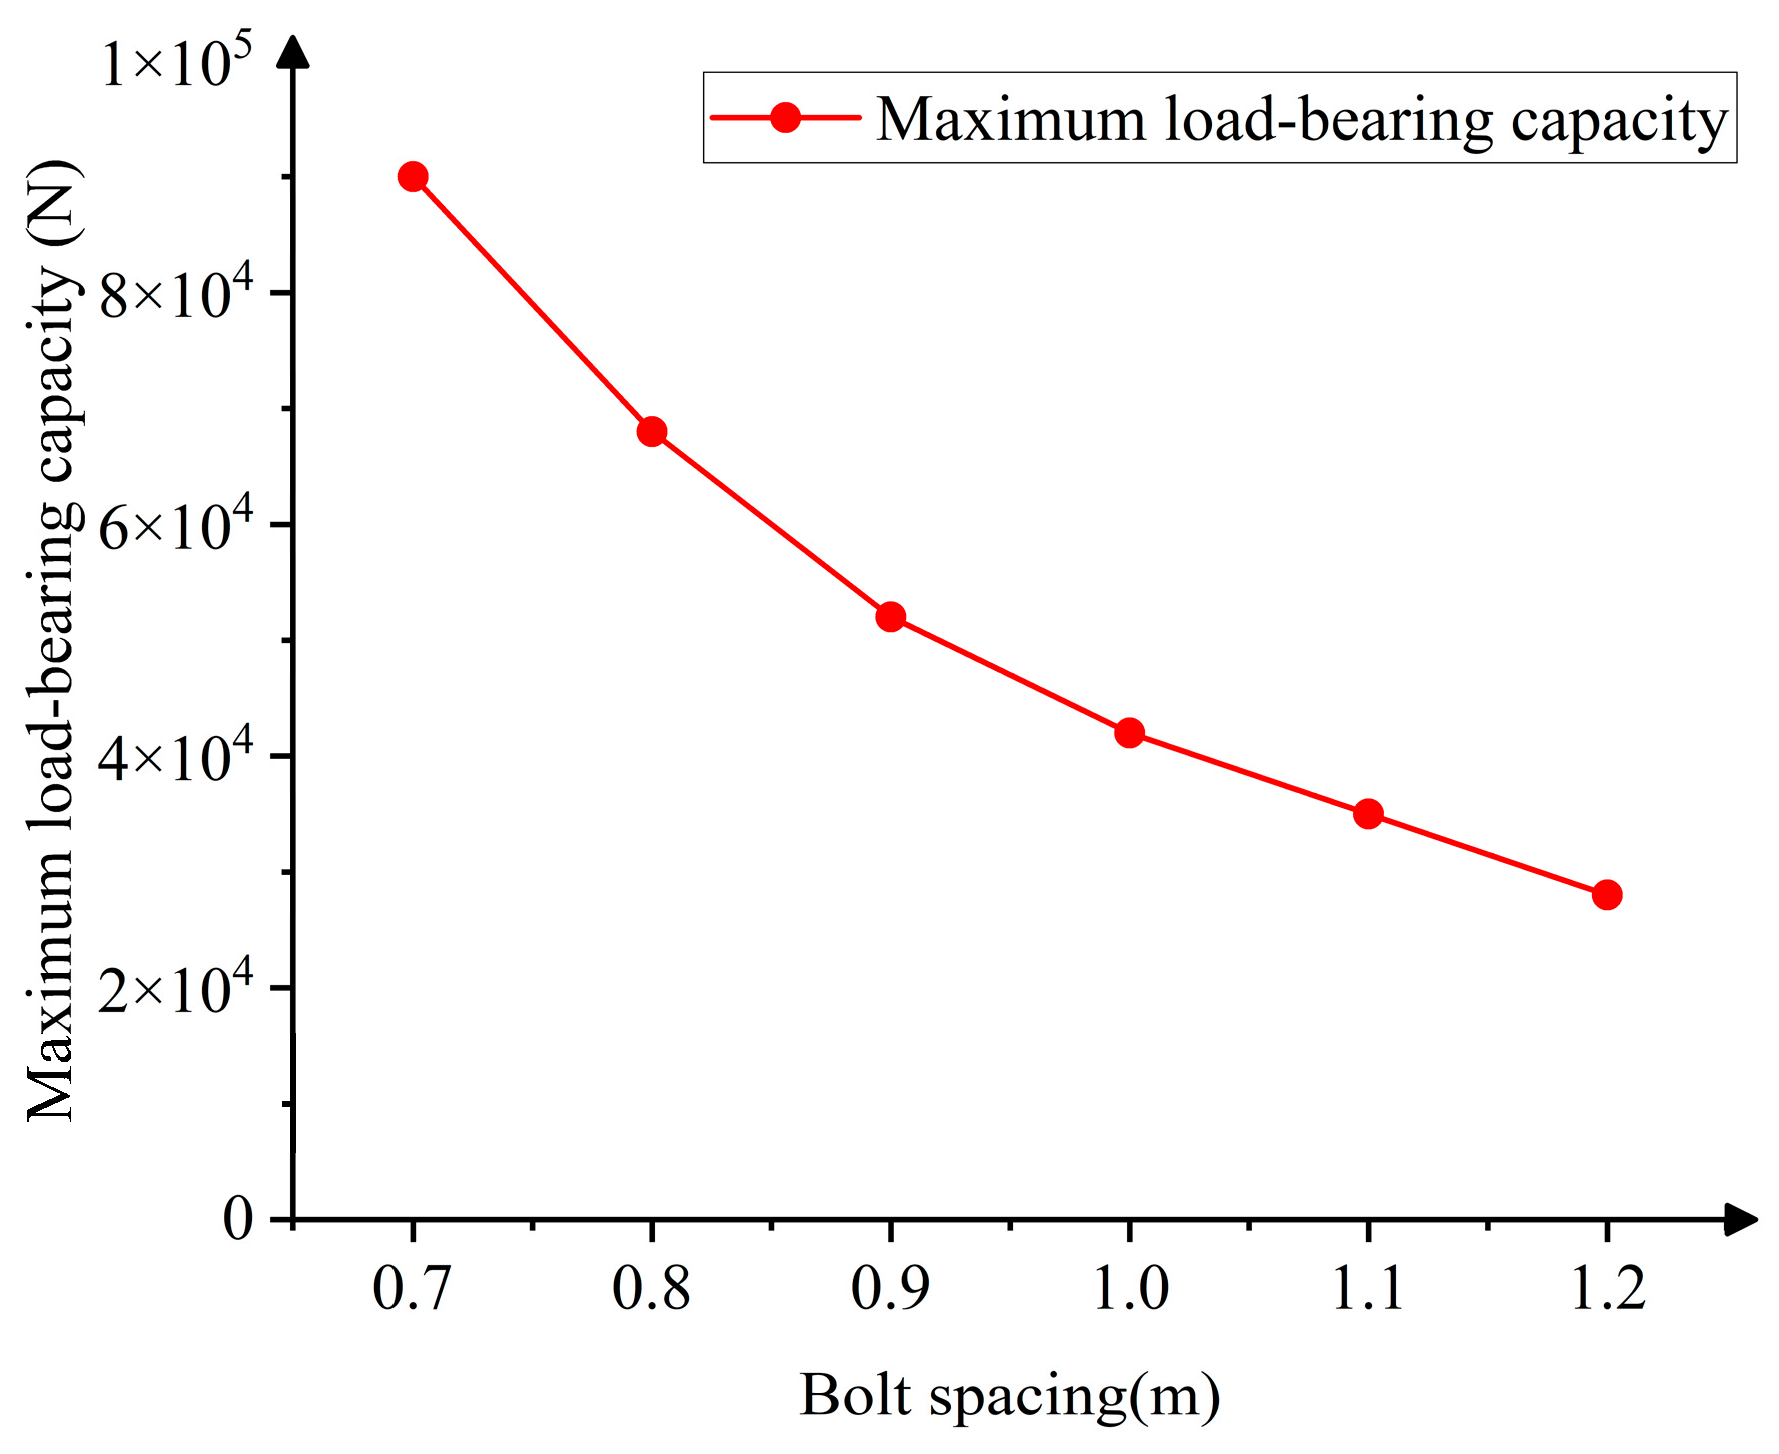
As Figure 5 shows: bolt pre-tension creates the combined arch structure → the arch transfers the load downward → the integrity of the arch is compromised after the load exceeds its limit. This sequence intuitively demonstrates that the combined arch is formed by bolt pre-tension and possesses a certain load-bearing capacity, ultimately becoming unstable after the accumulated vertical stress within the arch is released upon load exceedance. Figure 6 shows the fitted curves of the maximum roof load-bearing capacity under different bolt parameters.
Figure 6.
Fitted curves of maximum load-bearing capacity for models with different bolt spacings.
At a spacing of 0.7 m, which is also the design support parameter for the aforementioned background, the compressive stress zones of adjacent bolts overlap extensively. The combined arch exhibits a continuous, thick, and wide shape, providing the strongest load-bearing capacity and effectively restraining surrounding rock deformation. At spacings of 0.8–0.9 m, although the conical compressive stress zones still overlap to a high degree, the compressive stress values begin to become uneven. As the bolt spacing further increases, the overlap of the compressive stress zones decreases, the continuity of the combined arch weakens, its thickness shrinks, and the load-bearing performance declines. At spacings of 1.0–1.2 m, the compressive stress values become largely uneven over a wide range, the load-bearing capacity and continuity of the combined arch diminish, the ability to constrain the surrounding rock significantly drops, and the support effect is greatly weakened.
From the above analysis, it can be concluded that increasing the bolt spacing reduces the uniformity and continuity of the compressive stress zone in the combined arch and decreases its thickness, thereby lowering the load-bearing performance. This also indicates that a bolt spacing of 0.7 m is more suitable for this roadway, confirming the accuracy of the design value.
The smaller the bolt spacing, the higher the overlap of the compressive stress zones in the roof, the more continuous and thicker the combined arch, the stronger its load-bearing capacity, and the more suitable it is for highly loose surrounding rock. The combined arch is formed by the superposition of vertical stresses after bolt pre-tensioning. As shown in Figure 6, the uniformity of vertical stress superposition at a bolt spacing of 0.7 m is clearly better than that at 0.8 m. Therefore, designing the bolt support spacing as 0.7 m can more effectively control the deformation of the loose and fractured surrounding rock in this mine.
4. Full-Process Evolution of Internal Stress and Failure Characteristics of the Load-Bearing Combined Arch
4.1. Laboratory Test Setup
To further verify the feasibility of the designed parameters, corresponding laboratory model tests were carried out. By replicating the key influencing factors under controlled conditions, the load-bearing performance and failure deformation characteristics of models with bolt spacings of 0.7 m and 0.8 m were analyzed, and the influence of the parameter settings on the support structure was examined. The test results can provide direct evidence for parameter optimization and offer a reliable basis for subsequent engineering applications.
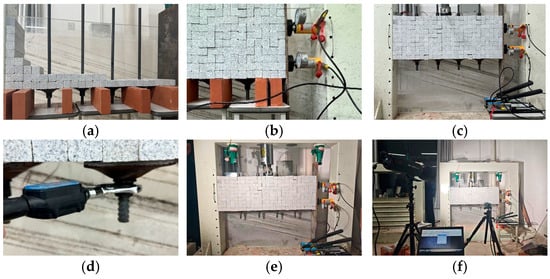
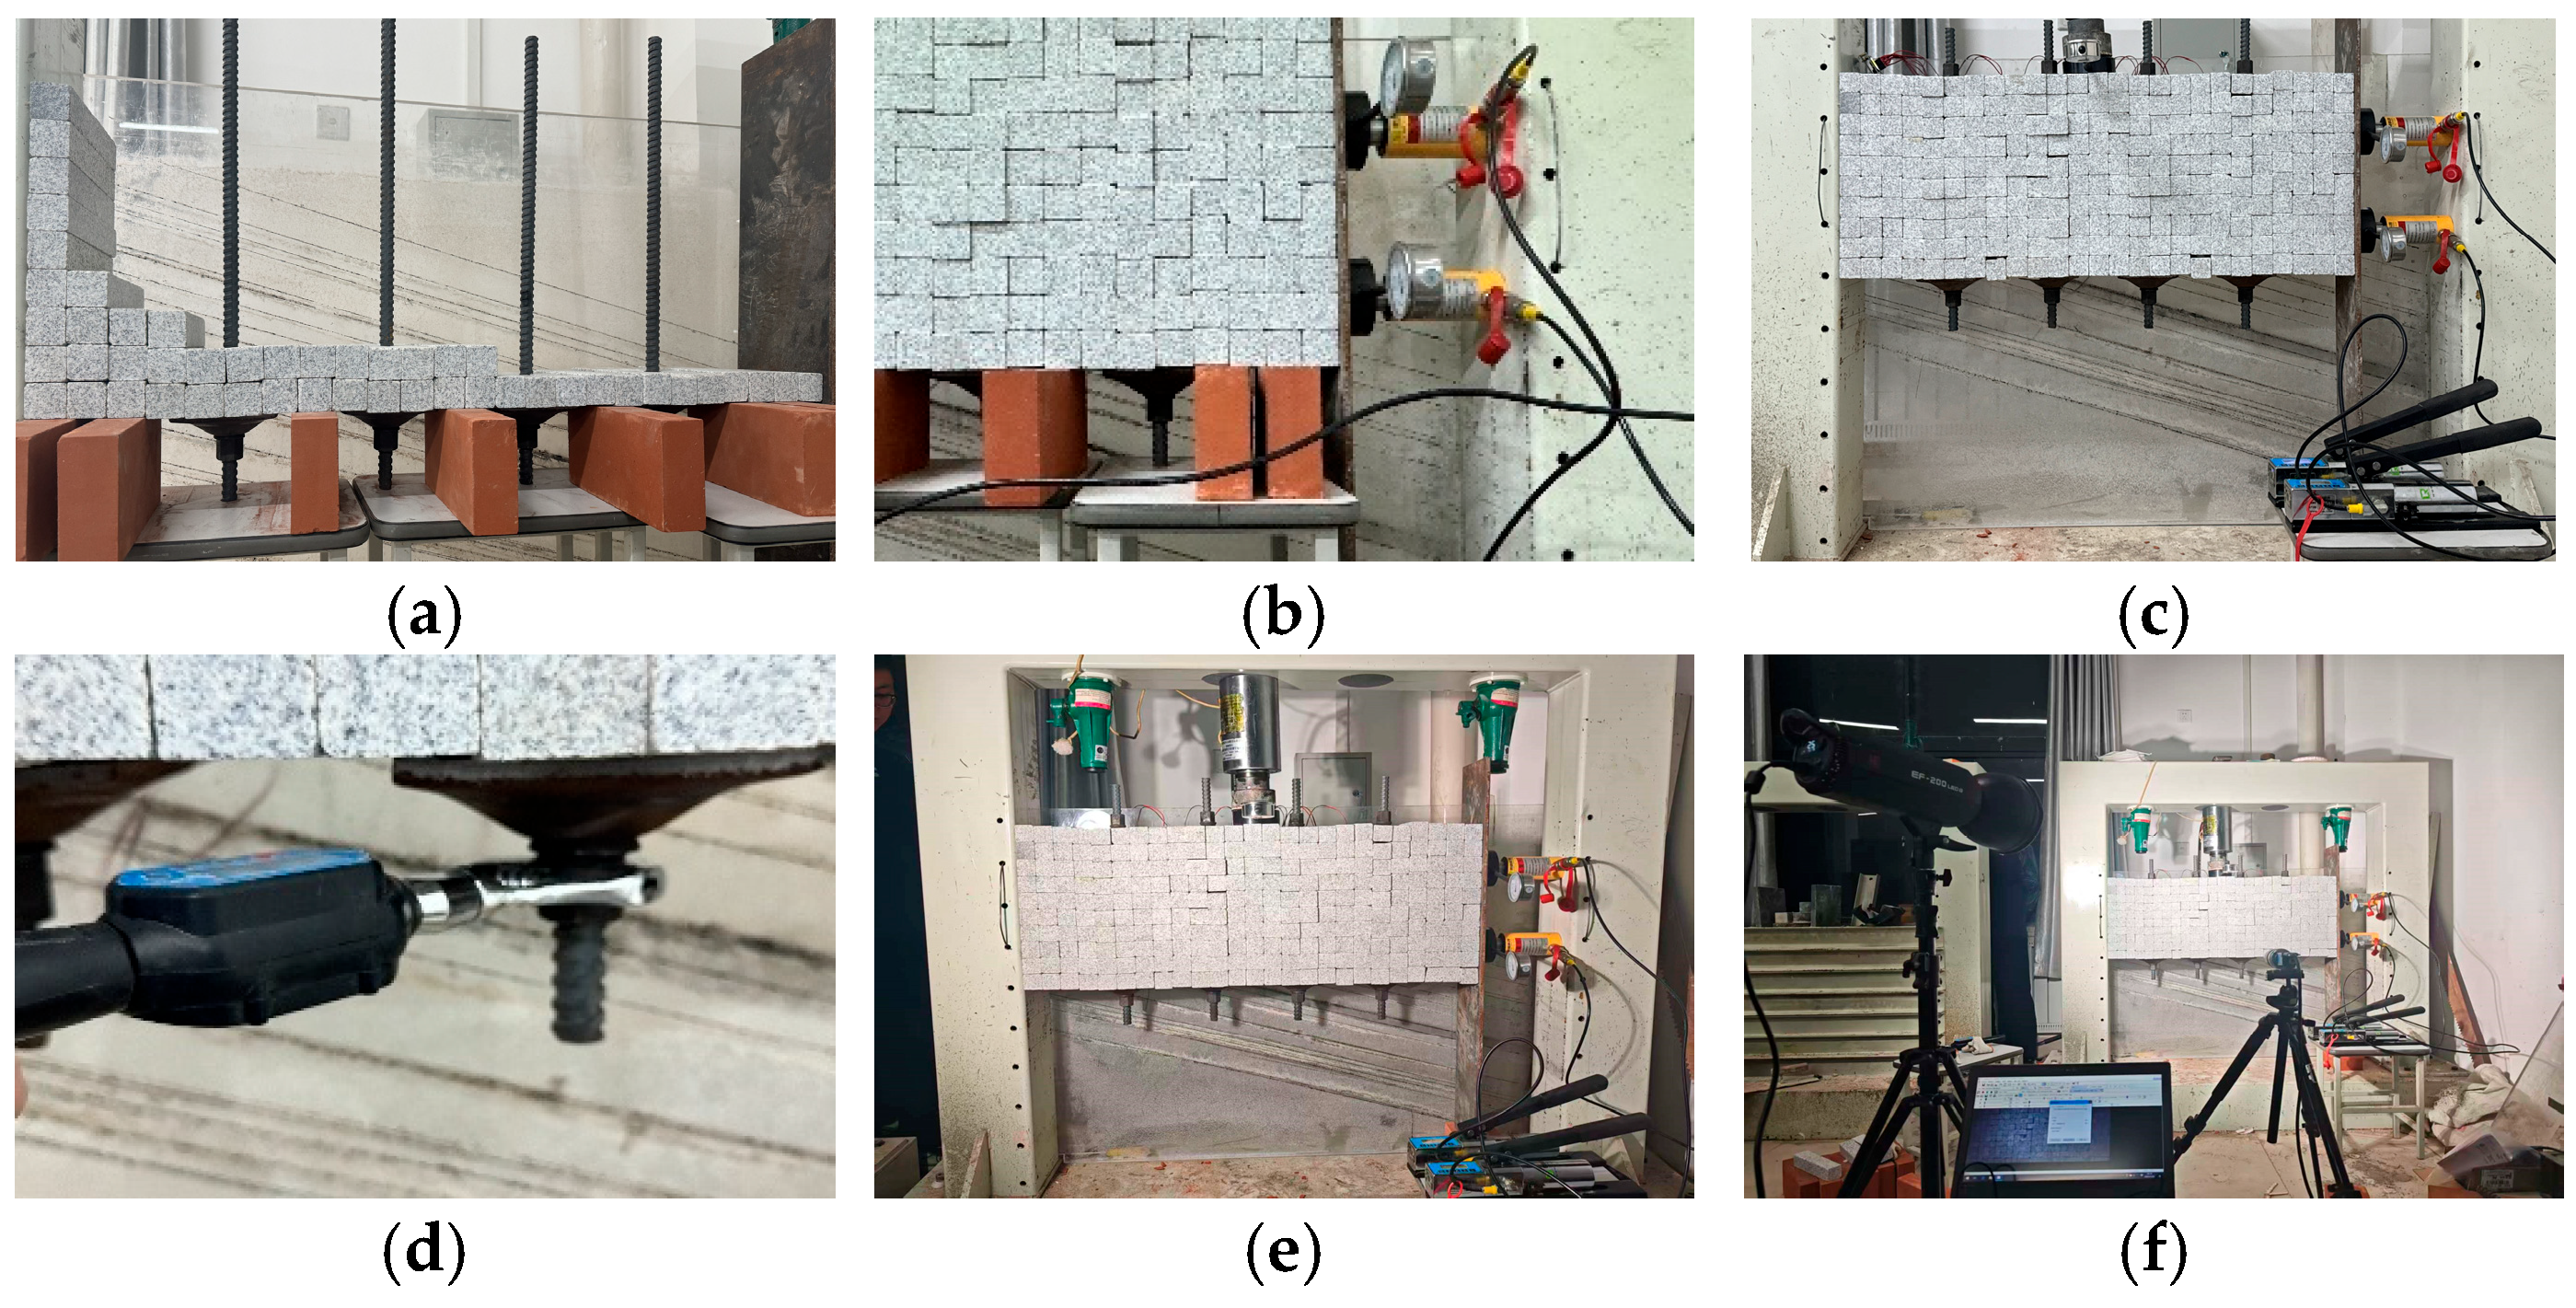
Therefore, a laboratory test model of an anchored structure in loose and fractured rock mass was designed. The detailed procedure is illustrated in Figure 7.
Figure 7.
Indoor test process of loose and fractured rock masses. (a) Preset anchor rods covered with rock. (b) One-sided pressure fixation model. (c) Remove the support below. (d) Applying pre-tightening force to the anchor bolt. (e) Apply a jack above. (f) Record the destruction process.
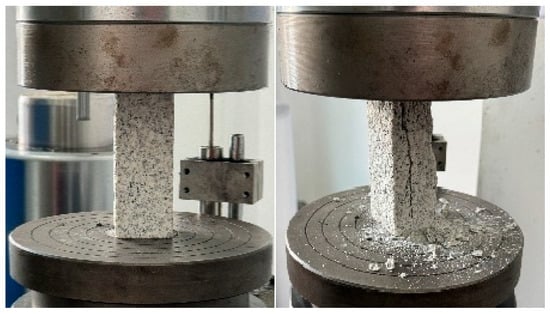
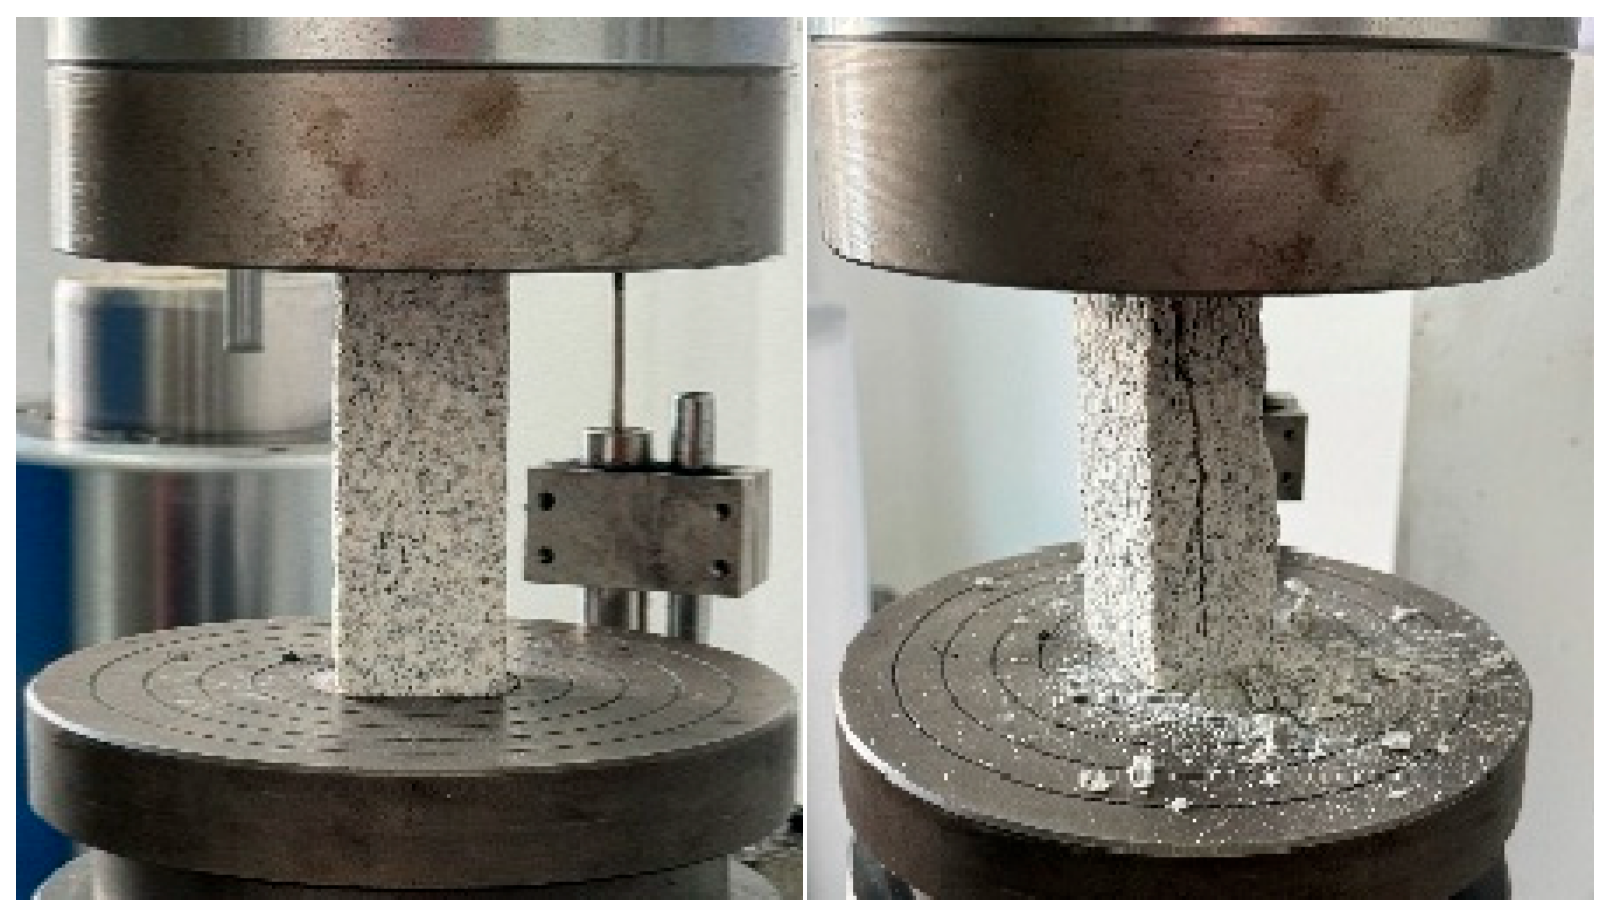
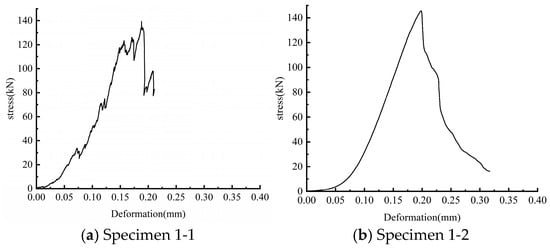
The test aims to reveal, from a mechanistic perspective, the fundamental principle of bolt support in loose and fractured surrounding rock. The focus is on how bolts transform an originally loose rock mass into a load-bearing structure through the combined arch effect. In coal mine roadways, the roof rock mass with loose fractures is often prone to loosening and fracturing due to low strength, loose structure, or geological disturbances, and is mostly composed of mudstone or sandstone. The material selected for this test was subjected to strength testing (Figure 8 and Figure 9), and its average compressive strength was approximately 56.95 MPa (Table 5), which falls within the strength range of the actual roof strata.
Figure 8.
Material specimen during uniaxial testing.
Figure 9.
Uniaxial compressive strength test curve of the material.
Table 5.
Maximum failure load and compressive strength of specimens.
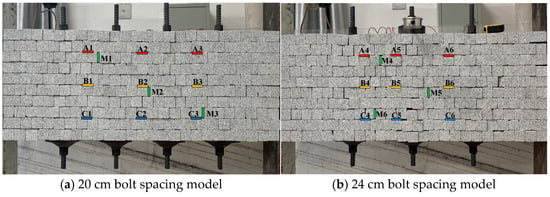
The model dimensions are 100 cm × 80 cm. The support bolts are 18 mm right-hand threaded steel bolts. Based on a comprehensive consideration of the model material parameters, a bolt spacing of 20 cm in the model corresponds to a field bolt spacing of 0.7 m, and a spacing of 24 cm in the model corresponds to a field spacing of 0.8 m. To reduce the influence of the left and right boundary effects on the anchored structure and to highlight the effect of bolt spacing on the structure, and also considering that a larger bolt spacing reduces the number of bolts, the model with a bolt spacing of 24 cm uses three bolts. The pre-tension force applied to the bolts is 10 kN. The model is designed to simulate the mechanical behavior of the anchored combined arch structure in a roadway roof. Thin-film pressure sensors are systematically arranged to comprehensively monitor the internal stress changes in the model during loading. Figure 10 is a schematic diagram of the bolt layout and pressure monitoring point distribution in the laboratory test model.
Figure 10.
Diagram of bolt layout and pressure monitoring point distribution.
4.2. Analysis of Model Compressive Strength
Table 6 presents the maximum load-bearing capacity and maximum failure displacement of the composite structures with different bolt spacings.
Table 6.
Summary of load-bearing capacity and failure displacement for models.
The test results show that when the bolt spacing is reduced from 24 cm to 20 cm, the load-bearing capacity of the anchored structure increases by 41.2%, and the maximum failure displacement it can withstand increases by 42.8%. The anchoring effect is significantly enhanced.
Due to the differences in materials, dimensions, and boundary conditions between the laboratory test and the actual engineering, an error correction factor of 0.21 is introduced into the formula to account for these discrepancies. This factor is used to correct the errors between the laboratory test and the engineering practice. The model parameters from the laboratory test (Table 7) are then substituted into the Formula (4), and the results are presented in Table 8 below.
Table 7.
Laboratory test parameter settings.
Table 8.
Load-bearing capacity from model tests and calculated load-bearing capacity.
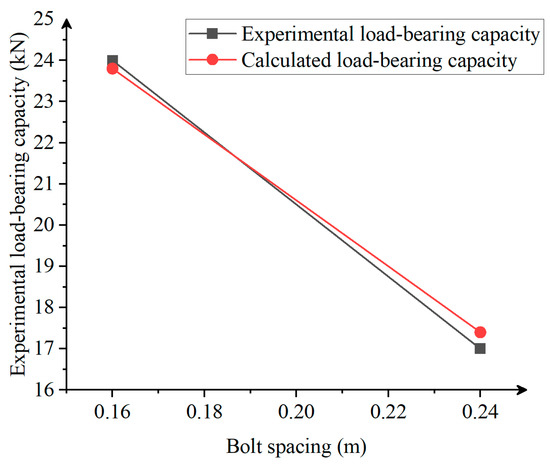
Figure 11 shows the numerical fitting of the load-bearing capacity obtained from model tests and the calculated load-bearing capacity.
Figure 11.
Numerical fitting of the load-bearing capacity obtained from model tests and calculated load-bearing capacity.
As shown in the figure, after introducing the error correction factor, the laboratory test results agree well with the theoretical calculations, confirming the validity of the bolt spacing design formula and the error correction factor.
4.3. Full Process of Internal Stress Evolution in the Combined Arch
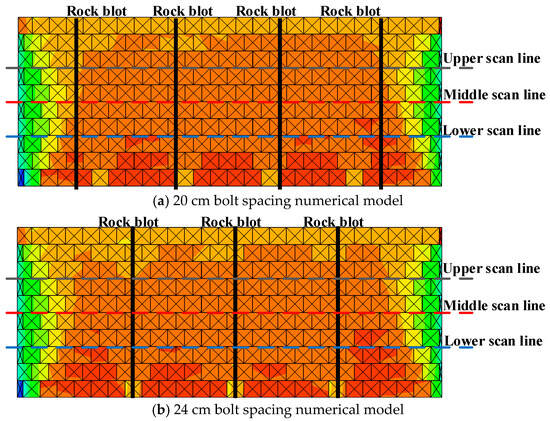
Figure 12 presents the UDEC numerical simulation model developed based on the laboratory anchored model. The constitutive model adopted is the Mohr-Coulomb model. The displacement and velocity vectors on the left and right boundaries are set to zero, and the loading path is a concentrated load applied to the top of the model. The figure illustrates the internal vertical stress characteristics of the model under bolt support and the formation of the combined arch. Compressive stresses dominate the interior of the roof. Significant zones of increased compressive stress form around the bolts, particularly near their mid-sections and ends. This indicates that the pre-tension force applied to the bolts transfers the load to the surrounding rock, creating conical pressure diffusion zones around the bolts. The overlap of these conical pressure diffusion zones ultimately forms the combined arch structure.
Figure 12.
Numerical simulation model of the laboratory test.
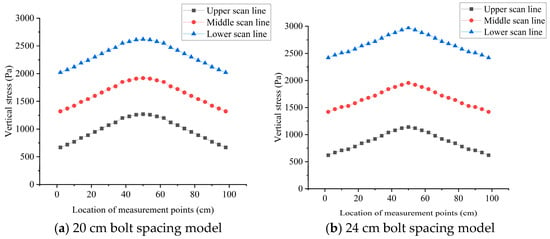
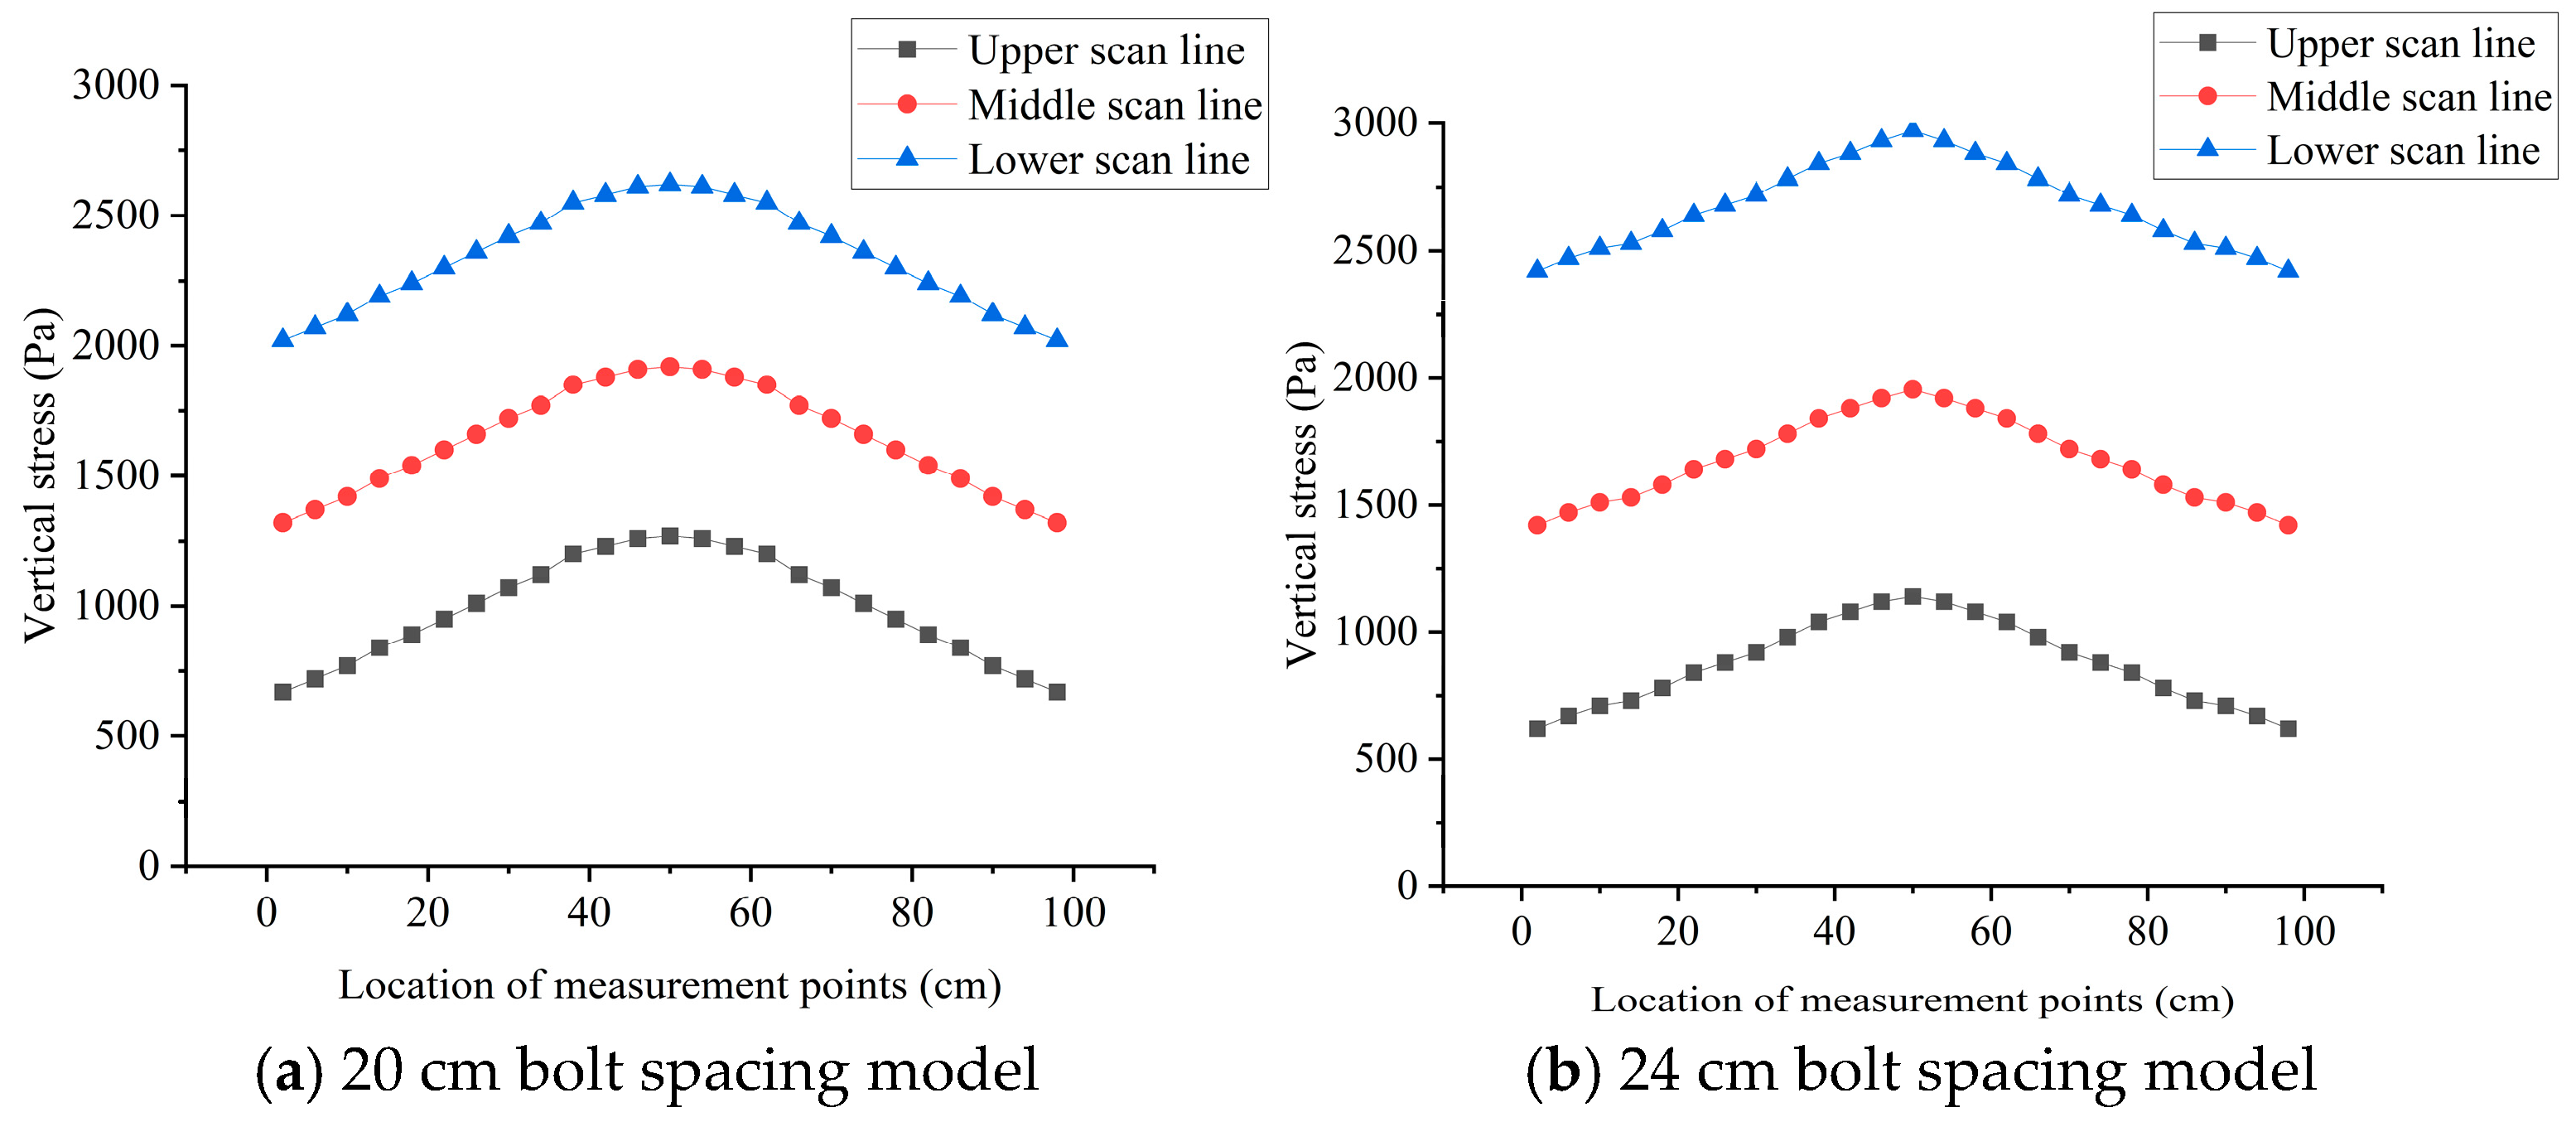
Figure 13 shows the initial stress curves of the two models. It can be observed that as the bolt spacing decreases, the peak internal stress within the anchored structure gradually increases, and the degree of stress concentration also increases. Consequently, the load-bearing capacity of the combined arch is enhanced.
Figure 13.
Initial stress state of models with different bolt spacings.
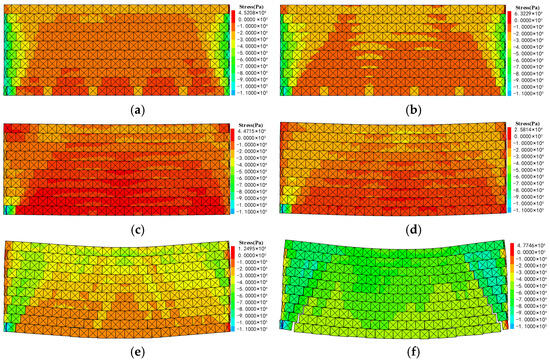
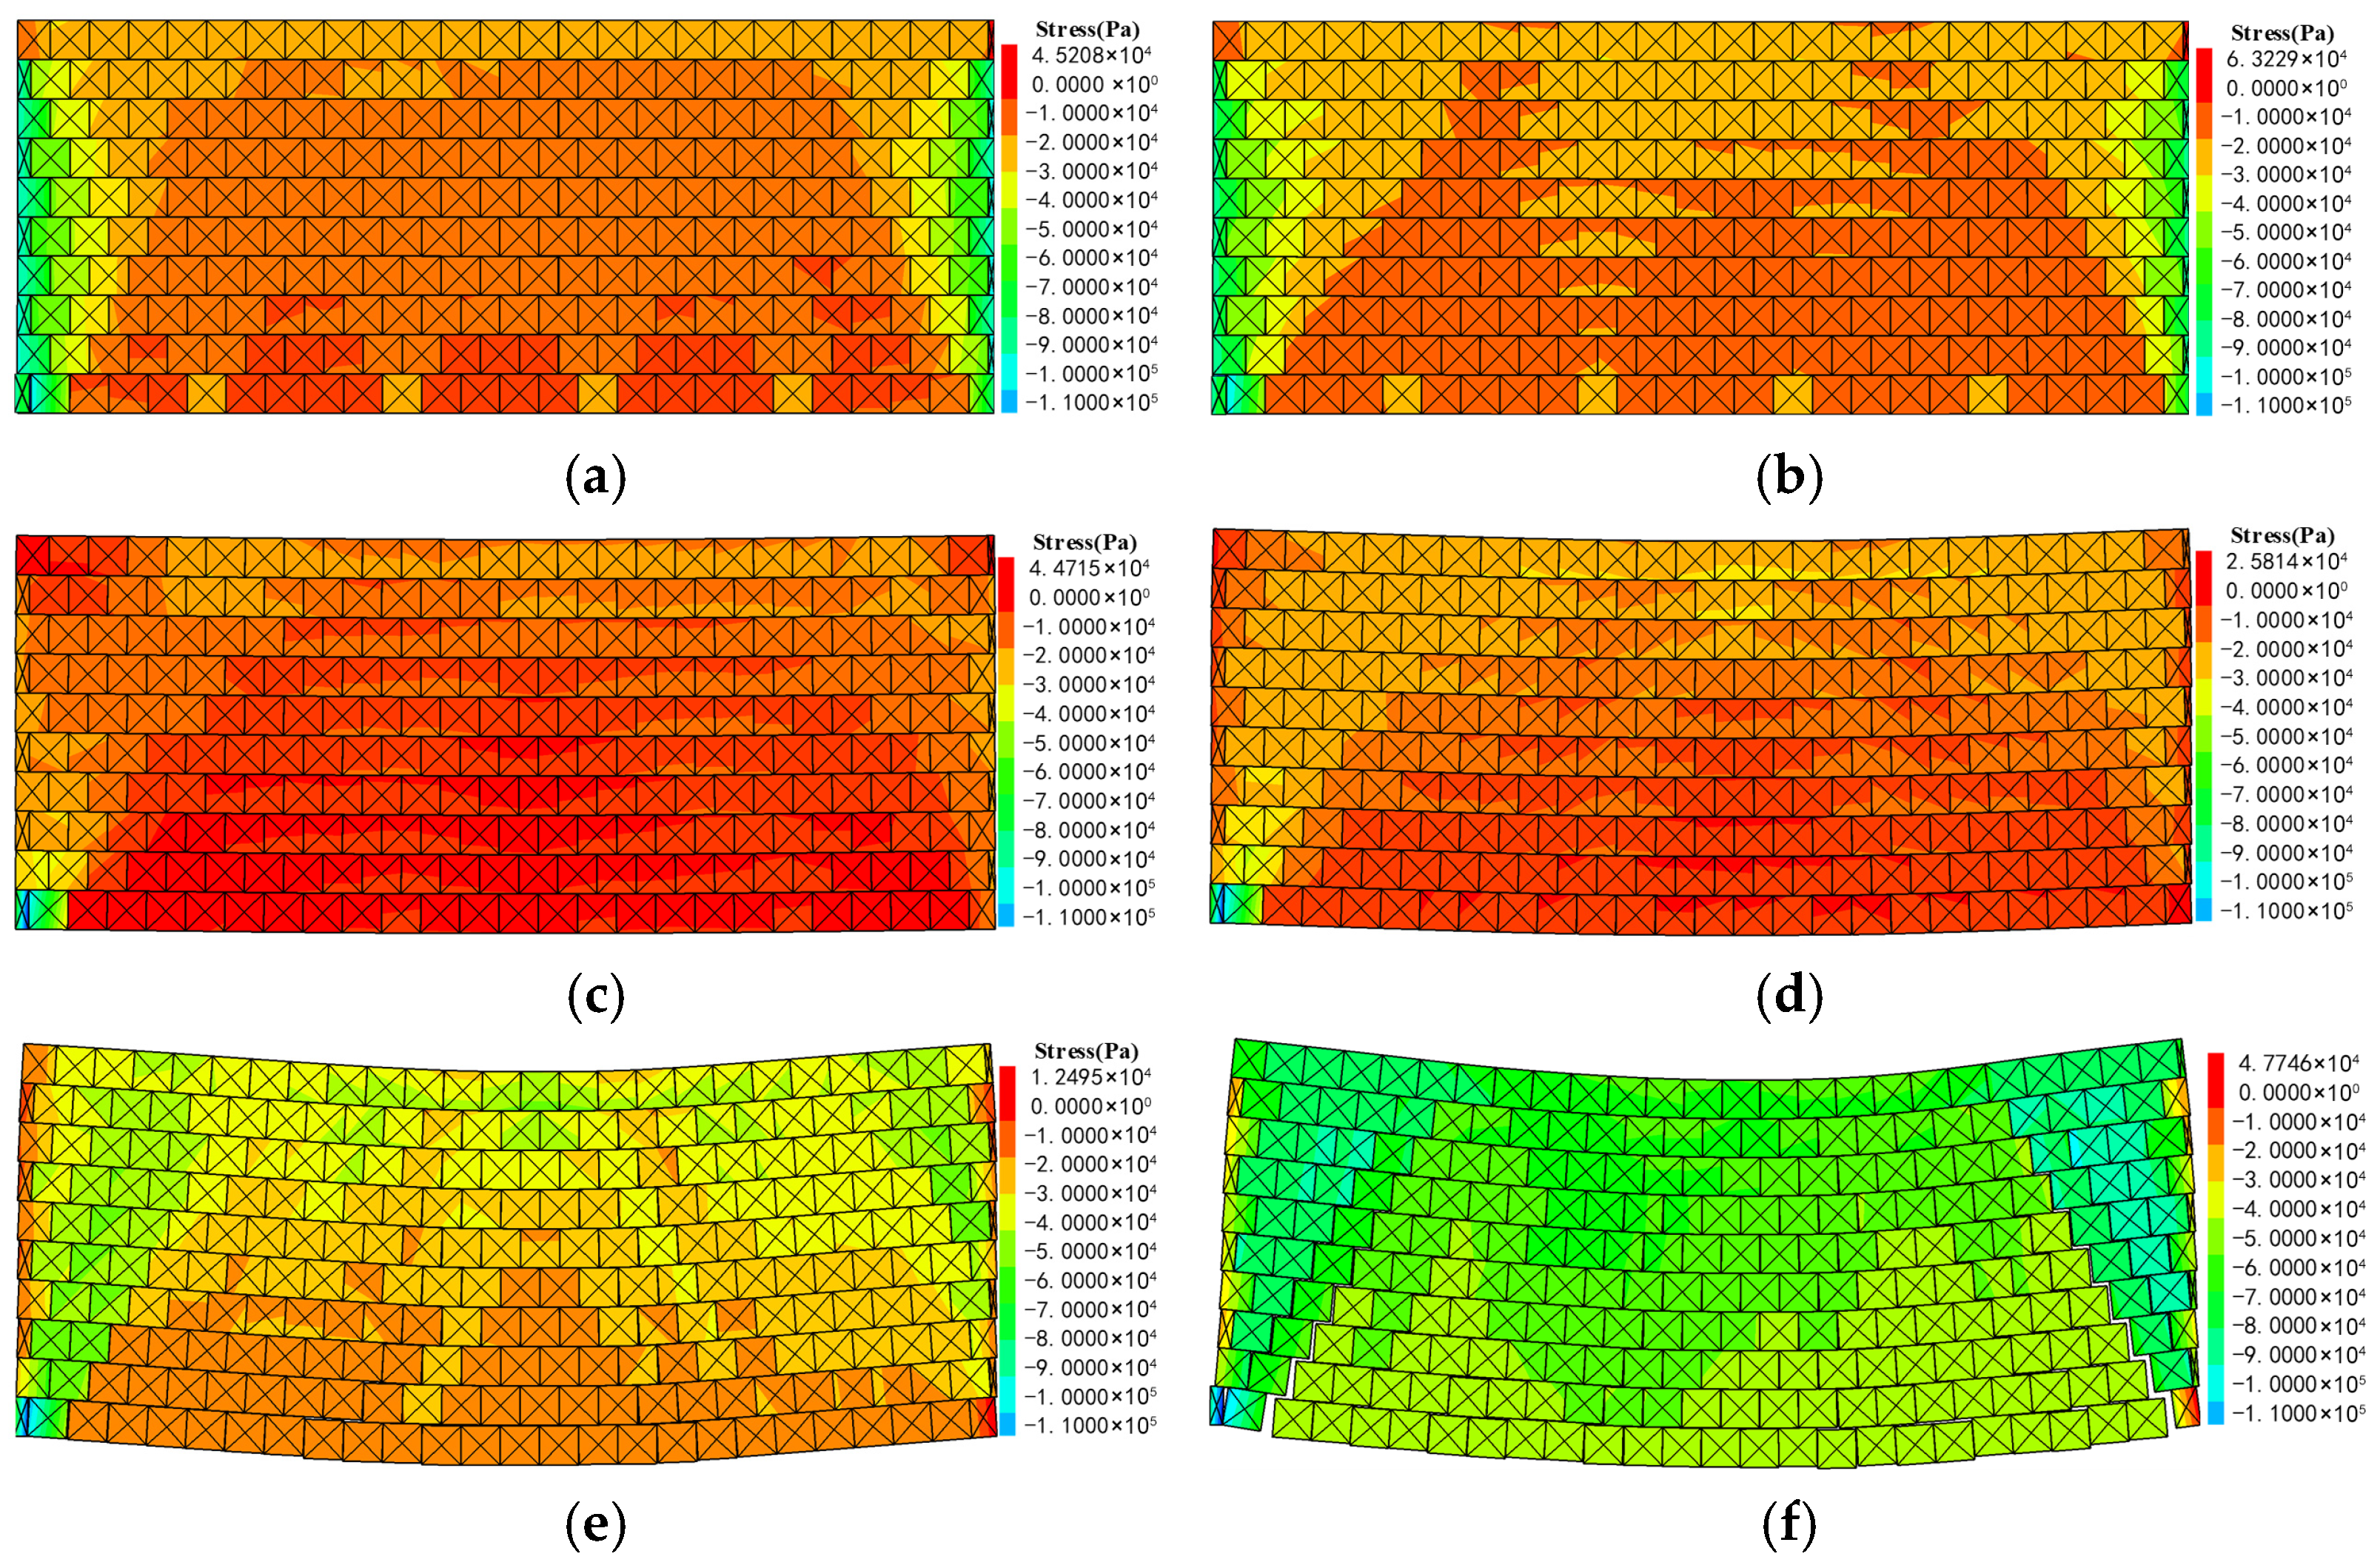
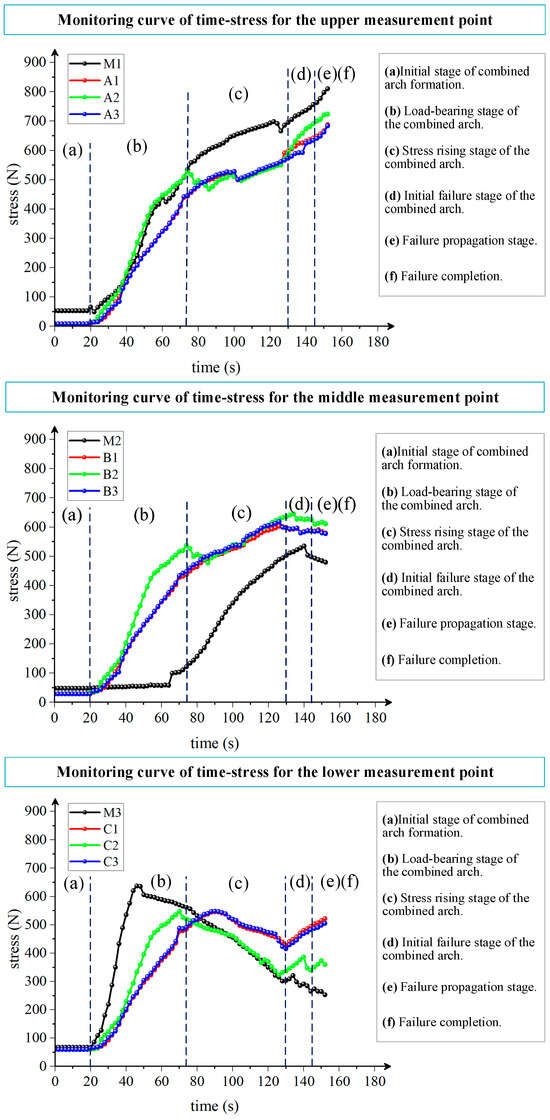
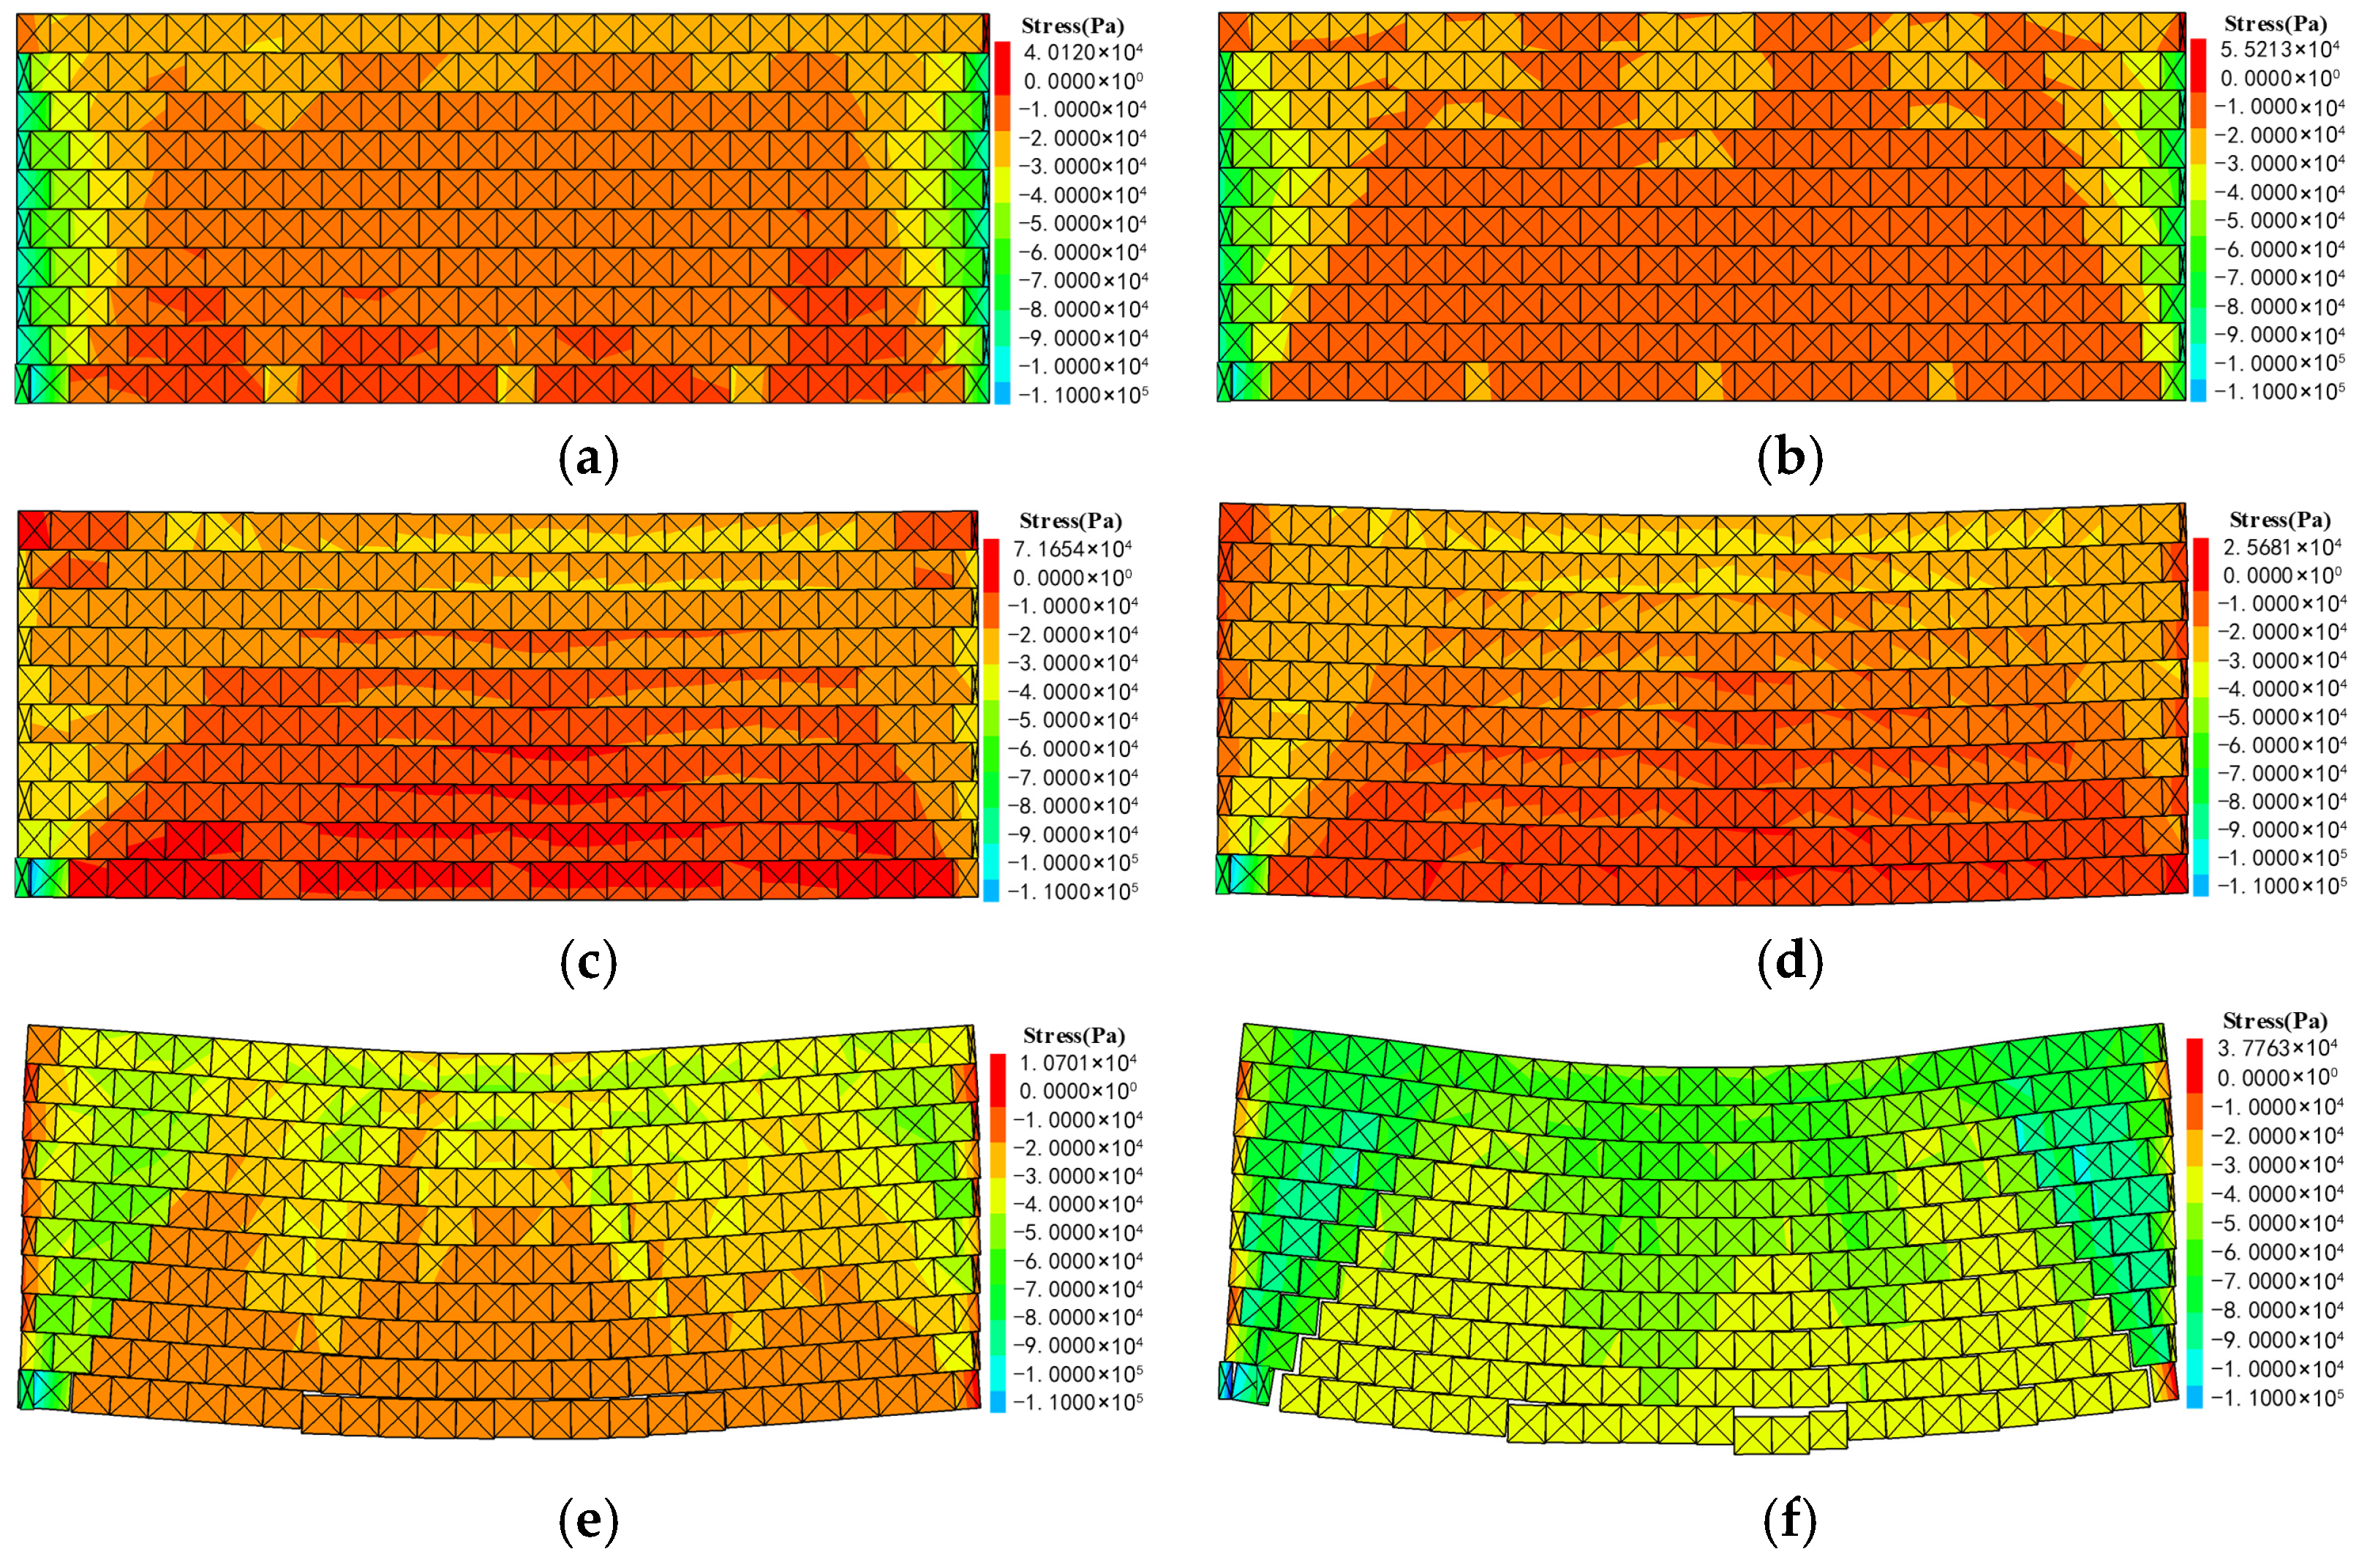
Figure 14 presents the stress distribution contours of the model during the entire compression process for a bolt spacing of 20 cm. Figure 15 shows the corresponding internal pressure variation curves at the measurement points of the anchored structure during compression in the laboratory test.
Figure 14.
Stress evolution stages during the failure process of the model with 20 cm bolt spacing. (a) Initial stage of combined arch formation. (b) Load-bearing stage of the combined arch. (c) Stress rising stage of the combined arch. (d) Initial failure stage of the combined arch. (e) Failure propagation stage. (f) Failure completion.
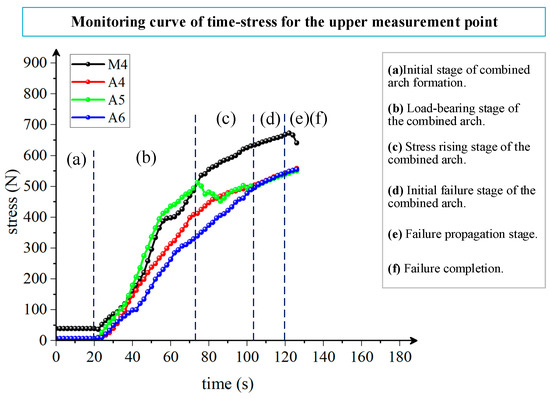
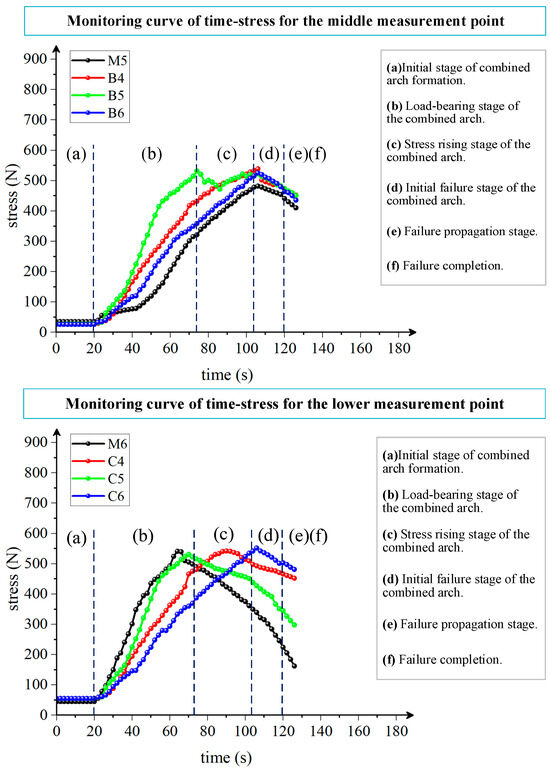
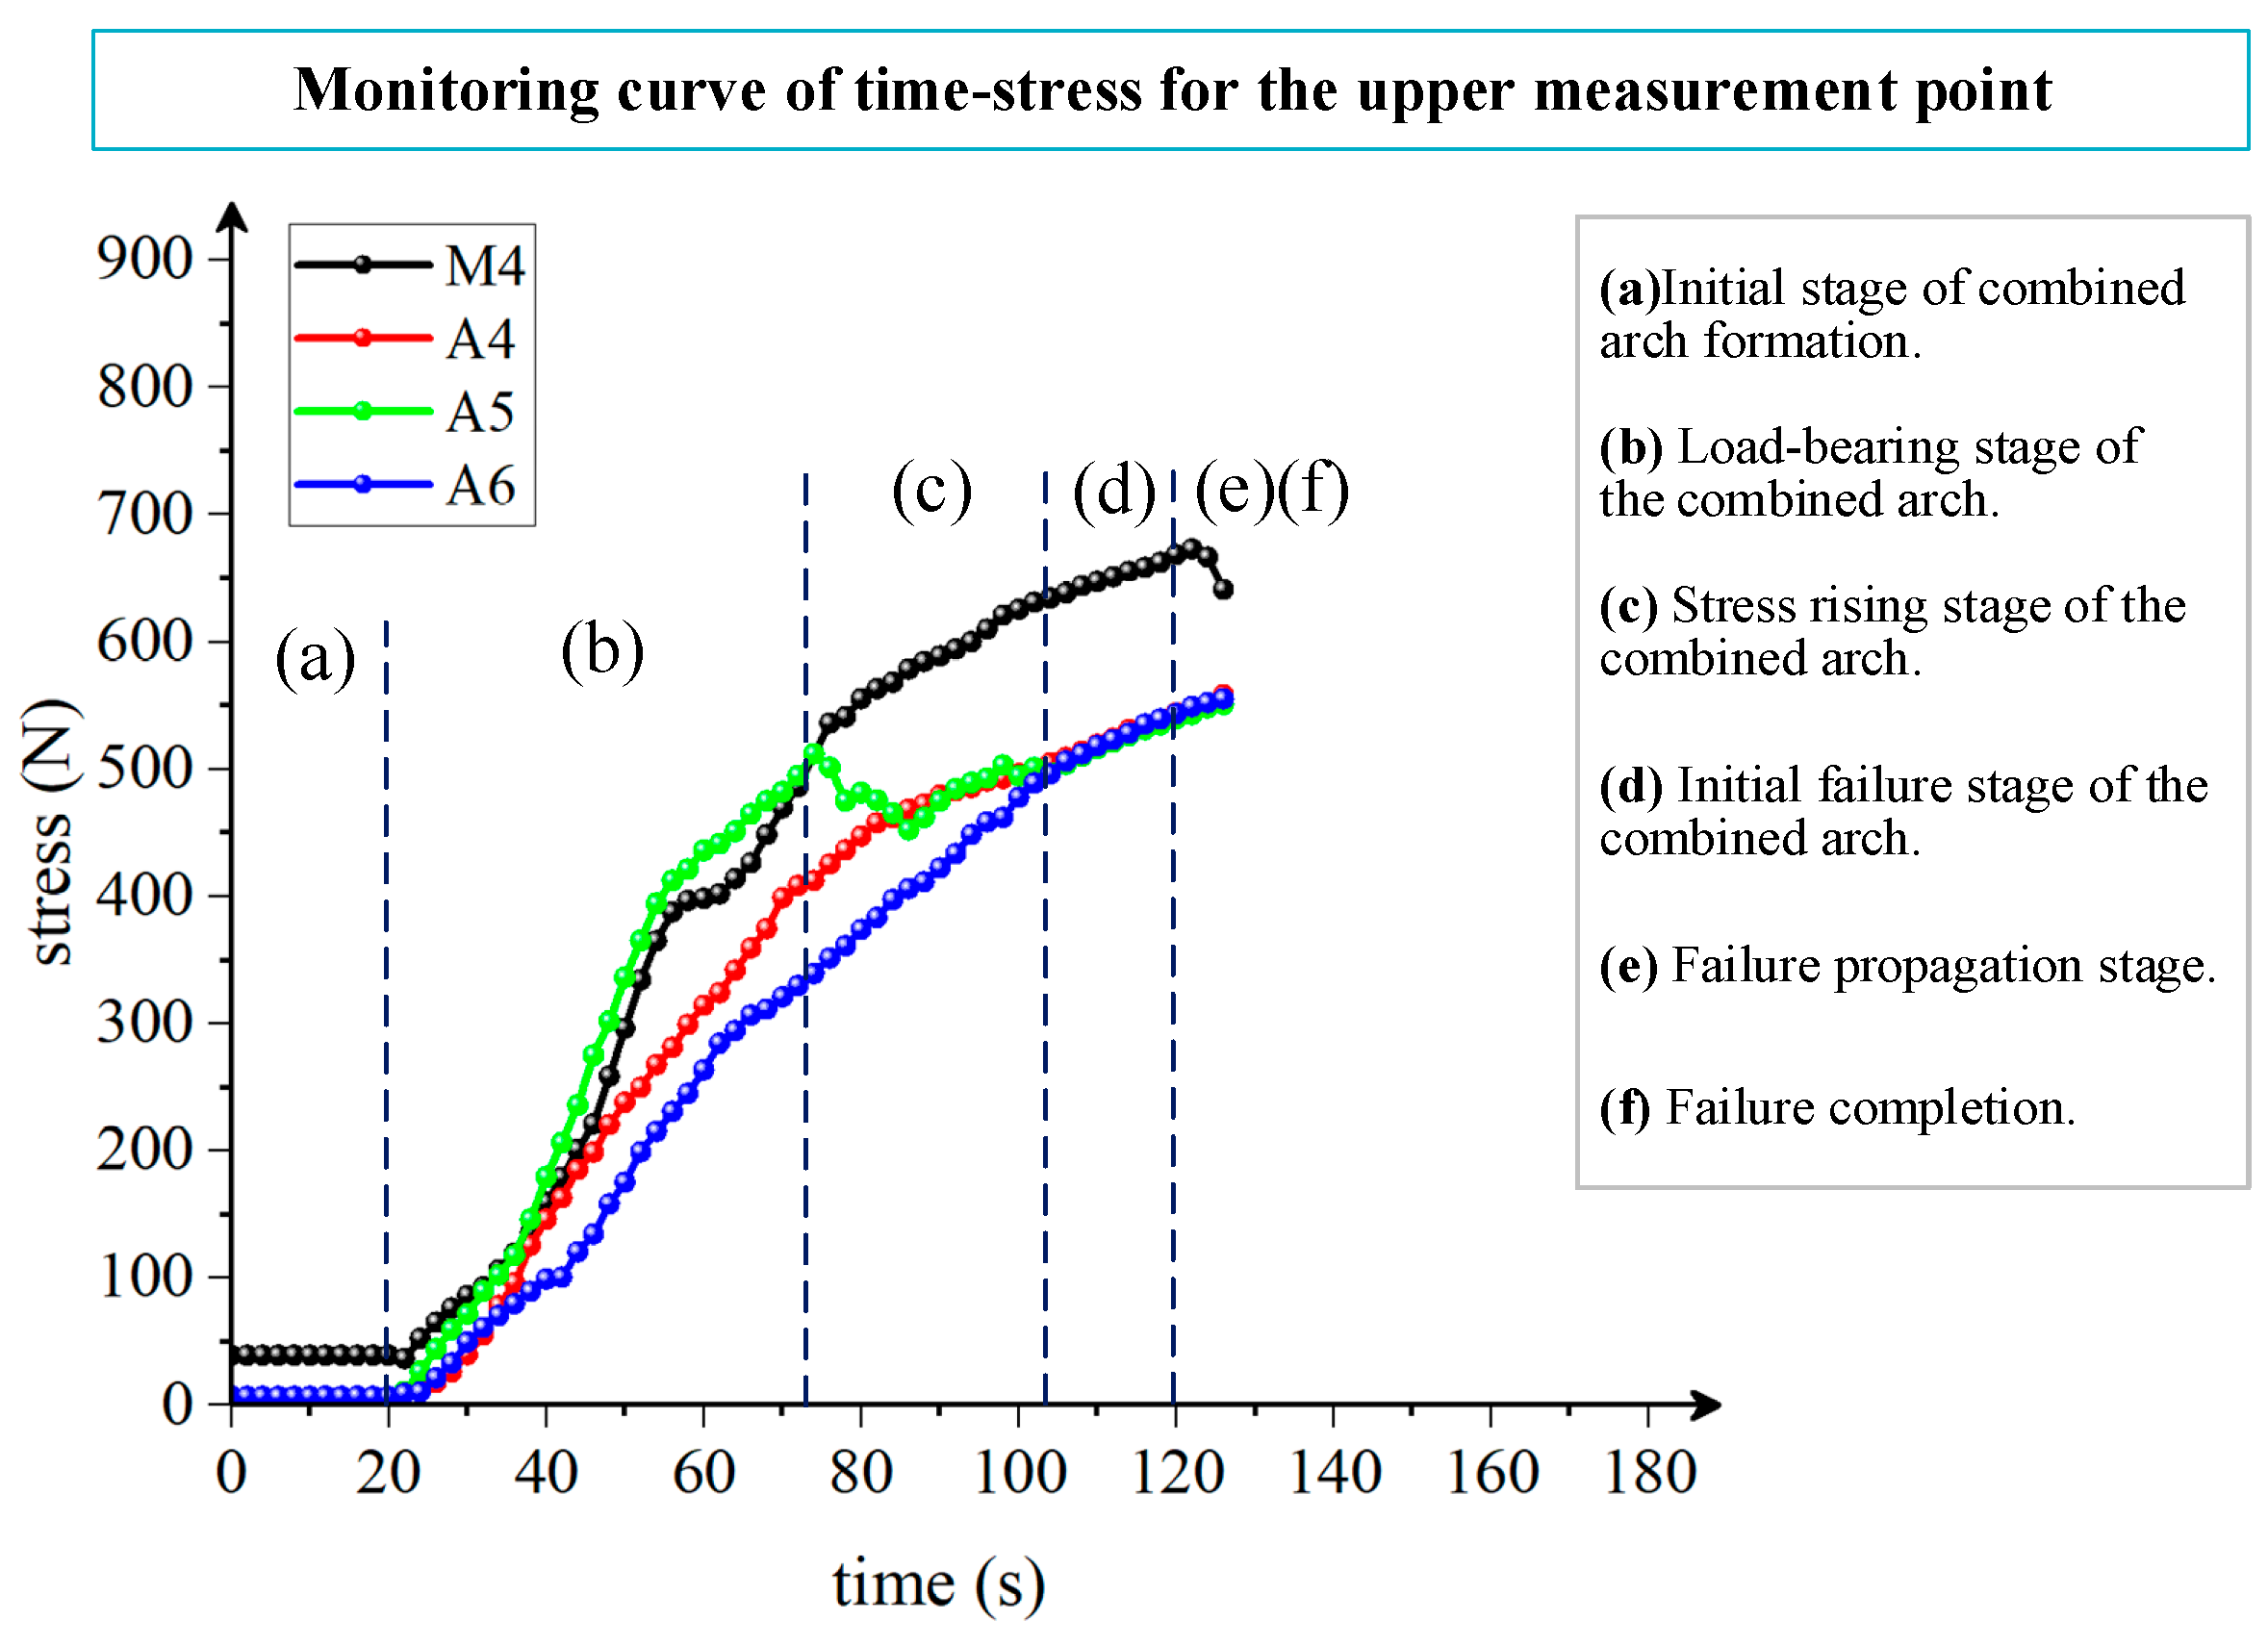
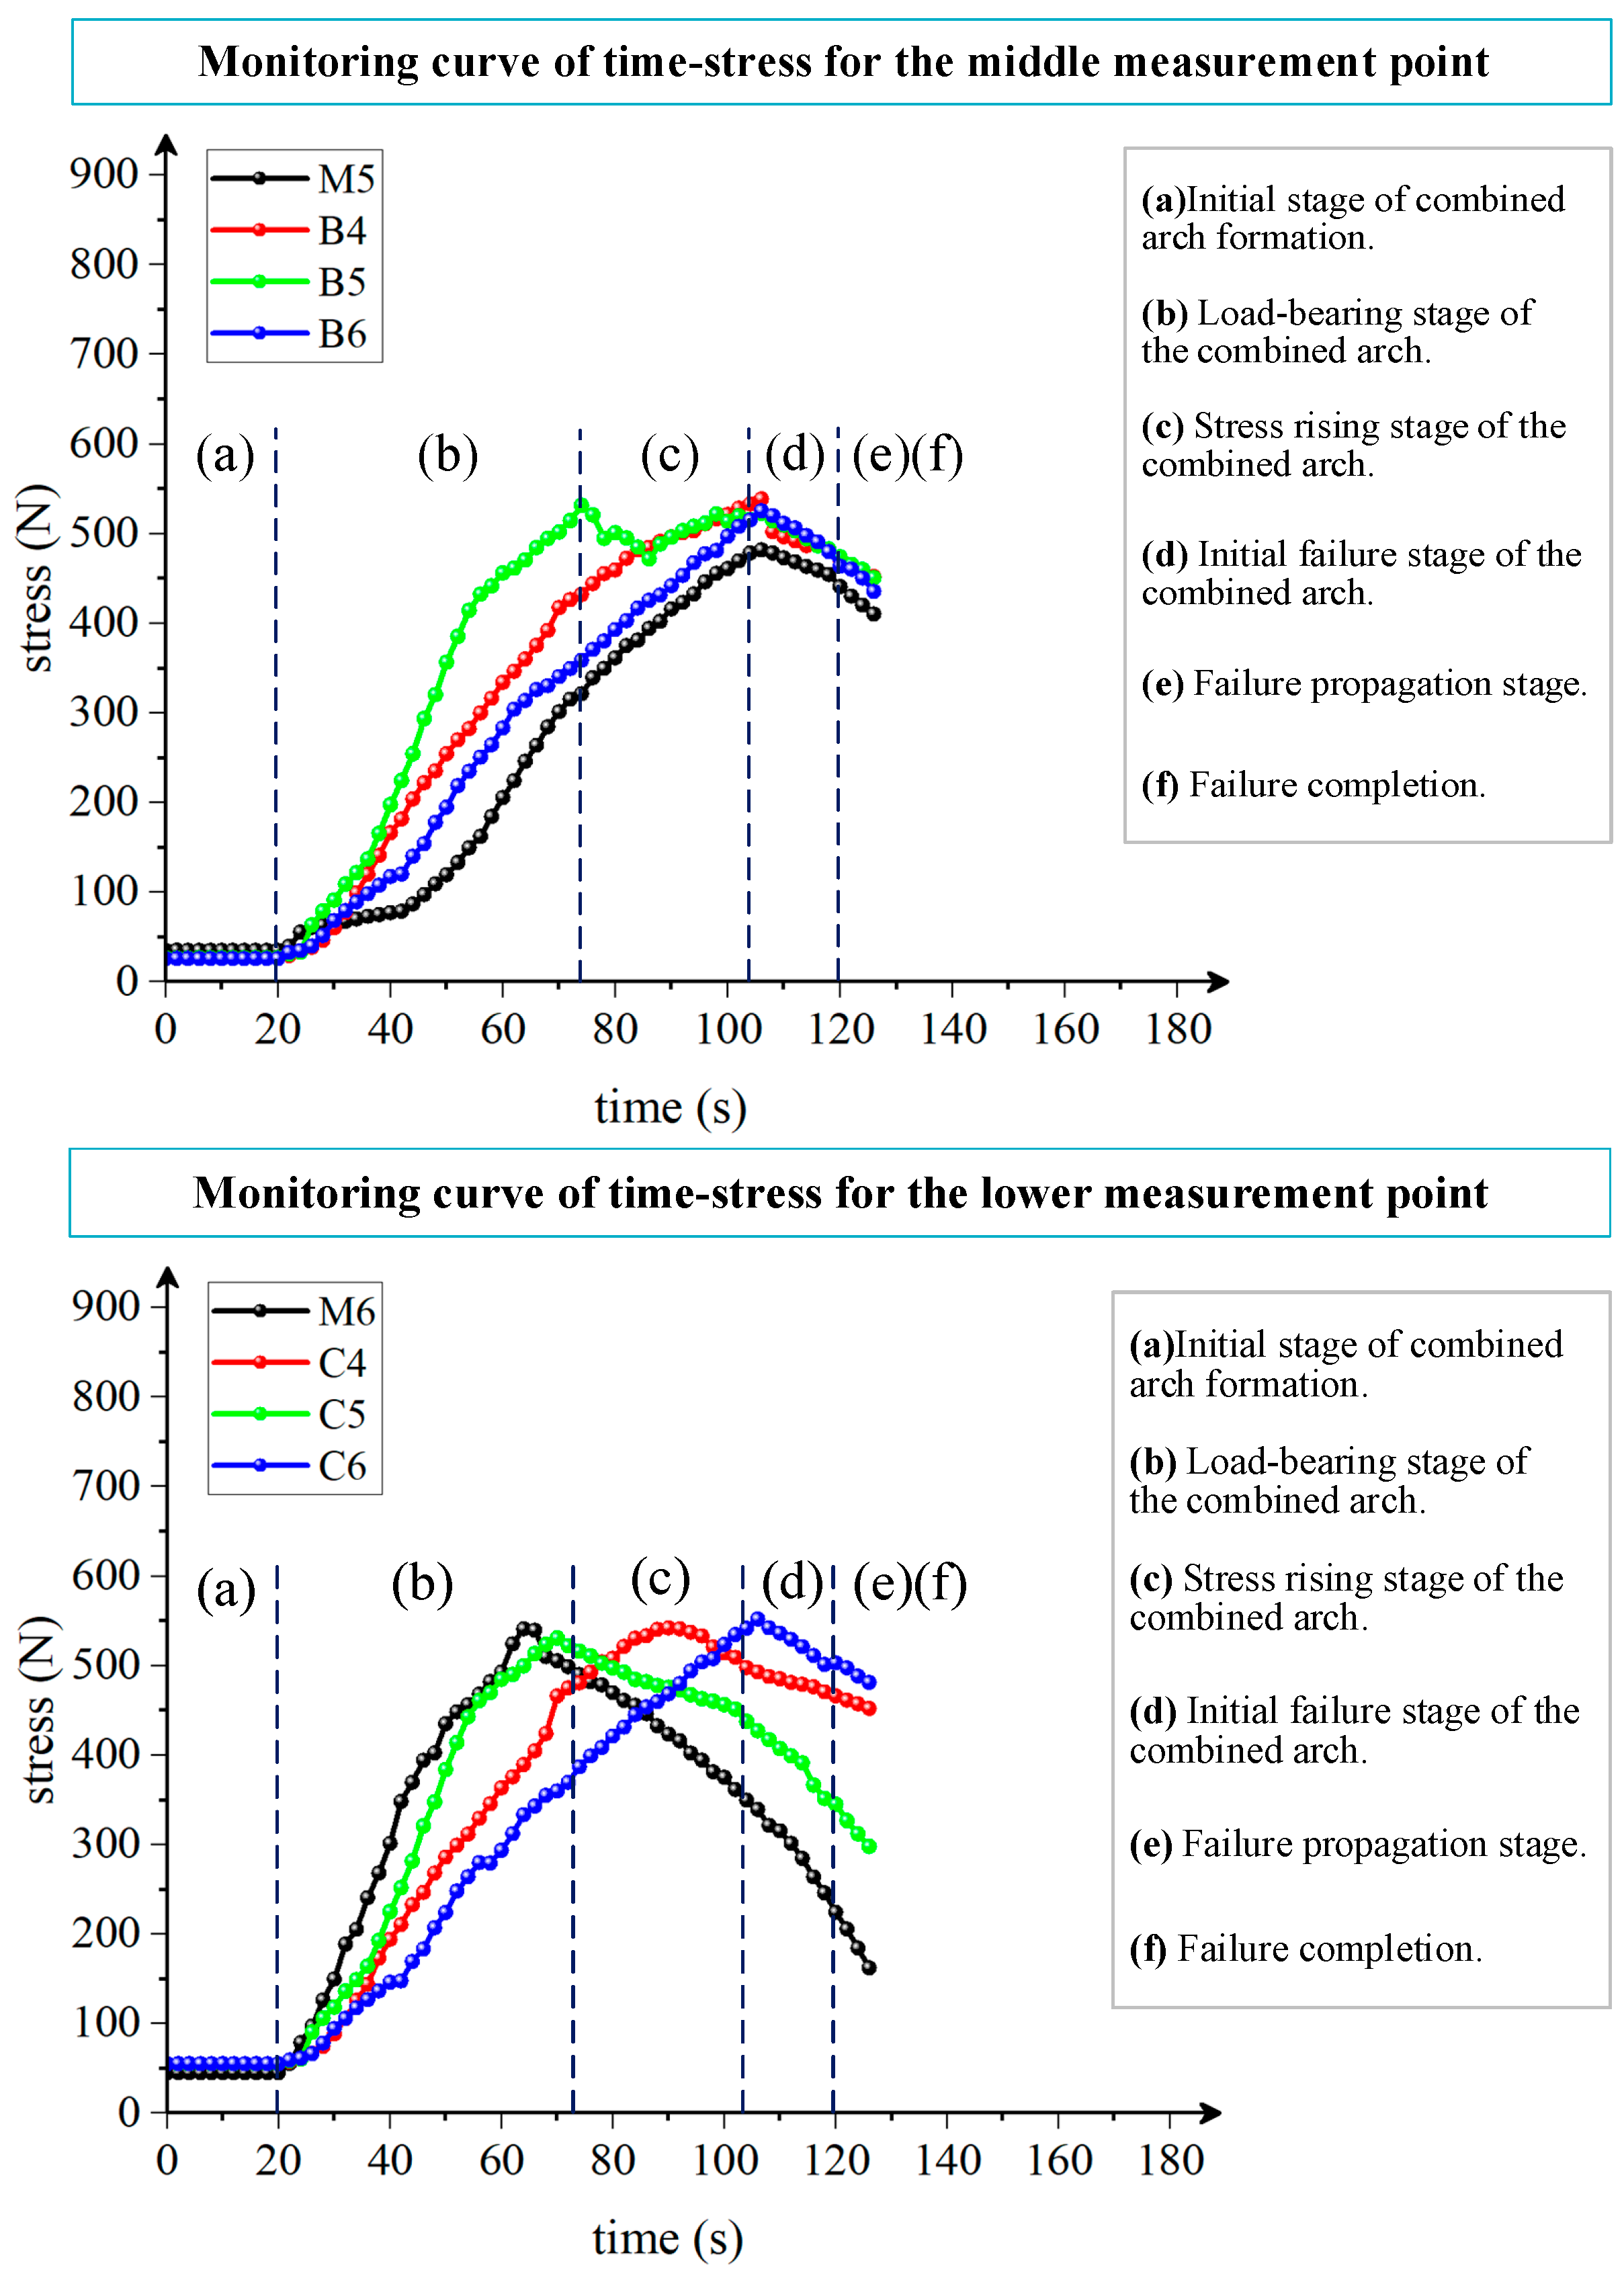
Figure 15.
Internal stress evolution curves of the anchored structure with a bolt spacing of 20 cm.
Figure 16 presents the stress distribution contours of the model during the entire compression process for a bolt spacing of 24 cm. Figure 17 shows the corresponding internal pressure variation curves at the measurement points of the anchored structure during compression in the laboratory test.
Figure 16.
Stress evolution stages during the failure process of the model with 24 cm bolt spacing. (a) Initial stage of combined arch formation. (b) Load-bearing stage of the combined arch. (c) Stress rising stage of the combined arch. (d) Initial failure stage of the combined arch. (e) Failure propagation stage. (f) Failure completion.
Figure 17.
Internal stress evolution curves of the anchored structure with a bolt spacing of 24 cm.
After the model was fully assembled, it was allowed to stabilize under no additional load for 30 min. Recording began 20 s before the application of pressure. The analysis follows the six stages of the combined arch “formation–loading–failure” process, as described below.
Initial formation stage of the combined arch (stress concentration and interconnection): The pressure readings at each measurement point represent the initial values before pressurization. As shown in Figure 14a and Figure 16a, local pressure zones appear around the bolts. This stage is the initial compaction phase after bolt pre-tension is applied, during which local stress concentrations form around the bolts. It corresponds to stage (a) marked on the curves.
Load-bearing development stage of the combined arch (stress diffusion and synergy): In this stage, stresses within the combined arch begin to diffuse, and the arch plays the main load-bearing role. The measurement curves (stage (b) marked on the curves) start to rise with a steep slope. During this stage, the concentration of vertical stress at measurement points for the 20 cm bolt spacing is clearly better than that for the 24 cm spacing. The horizontal stress at the middle-layer measurement points is more stable in this stage, indicating better load-bearing stability of the combined arch and lower shear stress within the arch during loading. The upper and lower layers of both models experience rapid growth in shear stress, and the shear stress at the lower layer reaches its peak. For the model with 24 cm spacing, the middle-layer measurement points remain relatively stable, and the combined arch bears the load more steadily.
Stress rising stage of the combined arch (peak stress): As the load further increases, the accumulated stress inside the anchored structure concentrates in the middle and lower parts, and deformation begins. At this point, the combined arch reaches its peak load-bearing capacity, with high internal stress concentration. The measurement curves (stage (c) marked on the curves) fluctuate. In this stage, although the vertical stress measurement points in the anchored structure for both bolt spacings show stress fluctuations, the degree of vertical stress concentration at the 20 cm spacing is significantly higher, indicating that this anchored structure has better overall load-bearing integrity. For both models, the horizontal stresses in the upper and middle layers rise steadily, while those in the lower layer begin to decrease, indicating that the model has started to undergo bending deformation.
Initial failure stage of the combined arch (load exceedance and local failure): At this stage, the load exceeds the ultimate load-bearing capacity of the combined arch, the integrity of the arch is compromised, and shear cracks gradually appear in the anchored structure. The accumulated stress inside the combined arch is gradually released, and part of the stress redistributes and transfers deeper. The increase in the upper-layer measurement curves slows down (stage (d) on the curves). For the model with 24 cm spacing, the vertical stress curves of the middle- and lower-layer measurement points begin to decrease, indicating that bedding separation has occurred in the model at this stage. For the model with 20 cm spacing, the middle-layer measurement curve tends to flatten, and although the lower-layer measurement curve shows considerable fluctuations, it still exhibits an overall upward trend, indicating that although failure cracks have developed, the model still retains some residual load-bearing strength. The horizontal stresses in the middle and lower layers of both models decrease, and the damage to the model further increases.
Failure propagation stage (transition to overall instability): The combined arch transitions from a whole structure to instability. The horizontal stresses at the upper- and lower-layer measurement points show obvious fluctuations (stage (e) on the curves). As shown in Figure 14e and Figure 16e, shear cracks at the arch feet propagate, the integrity of the combined arch begins to be damaged, the overall stiffness decreases, and the horizontal stresses in the middle and lower layers further decline. The model is at the critical threshold of instability.
Failure completion stage (complete collapse of the combined arch): After the curves enter the plastic phase, the model collapses, and the curves no longer change. Figure 14f and Figure 16f show the complete failure of the combined arch, with shear planes penetrating the entire model. At this point, the combined arch loses its load-bearing capacity, and the model undergoes instability failure.
In summary, during the internal stress evolution process, the anchored structure with a bolt spacing of 20 cm exhibits a generally higher degree of internal stress concentration during loading, and its load-bearing capacity is clearly superior to that of the anchored structure with a 24 cm spacing. In the measurement curves, because pressure is continuously applied, the pressure values at the upper measurement points increase steadily. The lower measurement points are located on the outer arc of the deforming roof, so they experience bedding separation first, leading to larger fluctuations in pressure readings. The middle-layer measurement points are situated in the central part of the combined arch, yielding relatively stable pressure data. Therefore, they are suitable for capturing the stress evolution patterns of the combined arch. Accordingly, pressure sensors installed in the mid-level of the roof can be used to monitor and provide early warning of roof failure.
4.4. Analysis of Failure Characteristics of the Combined Arch
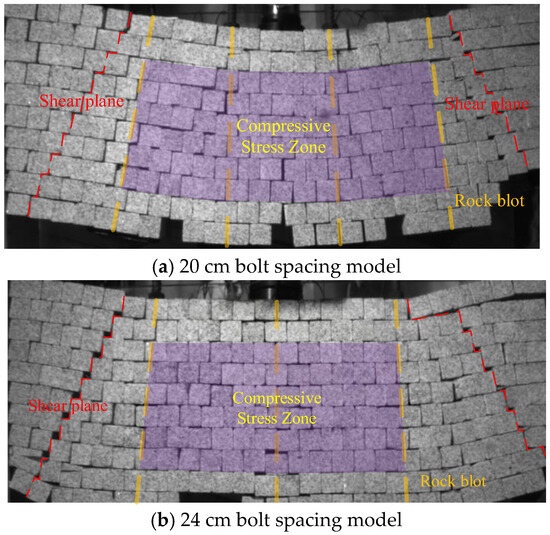
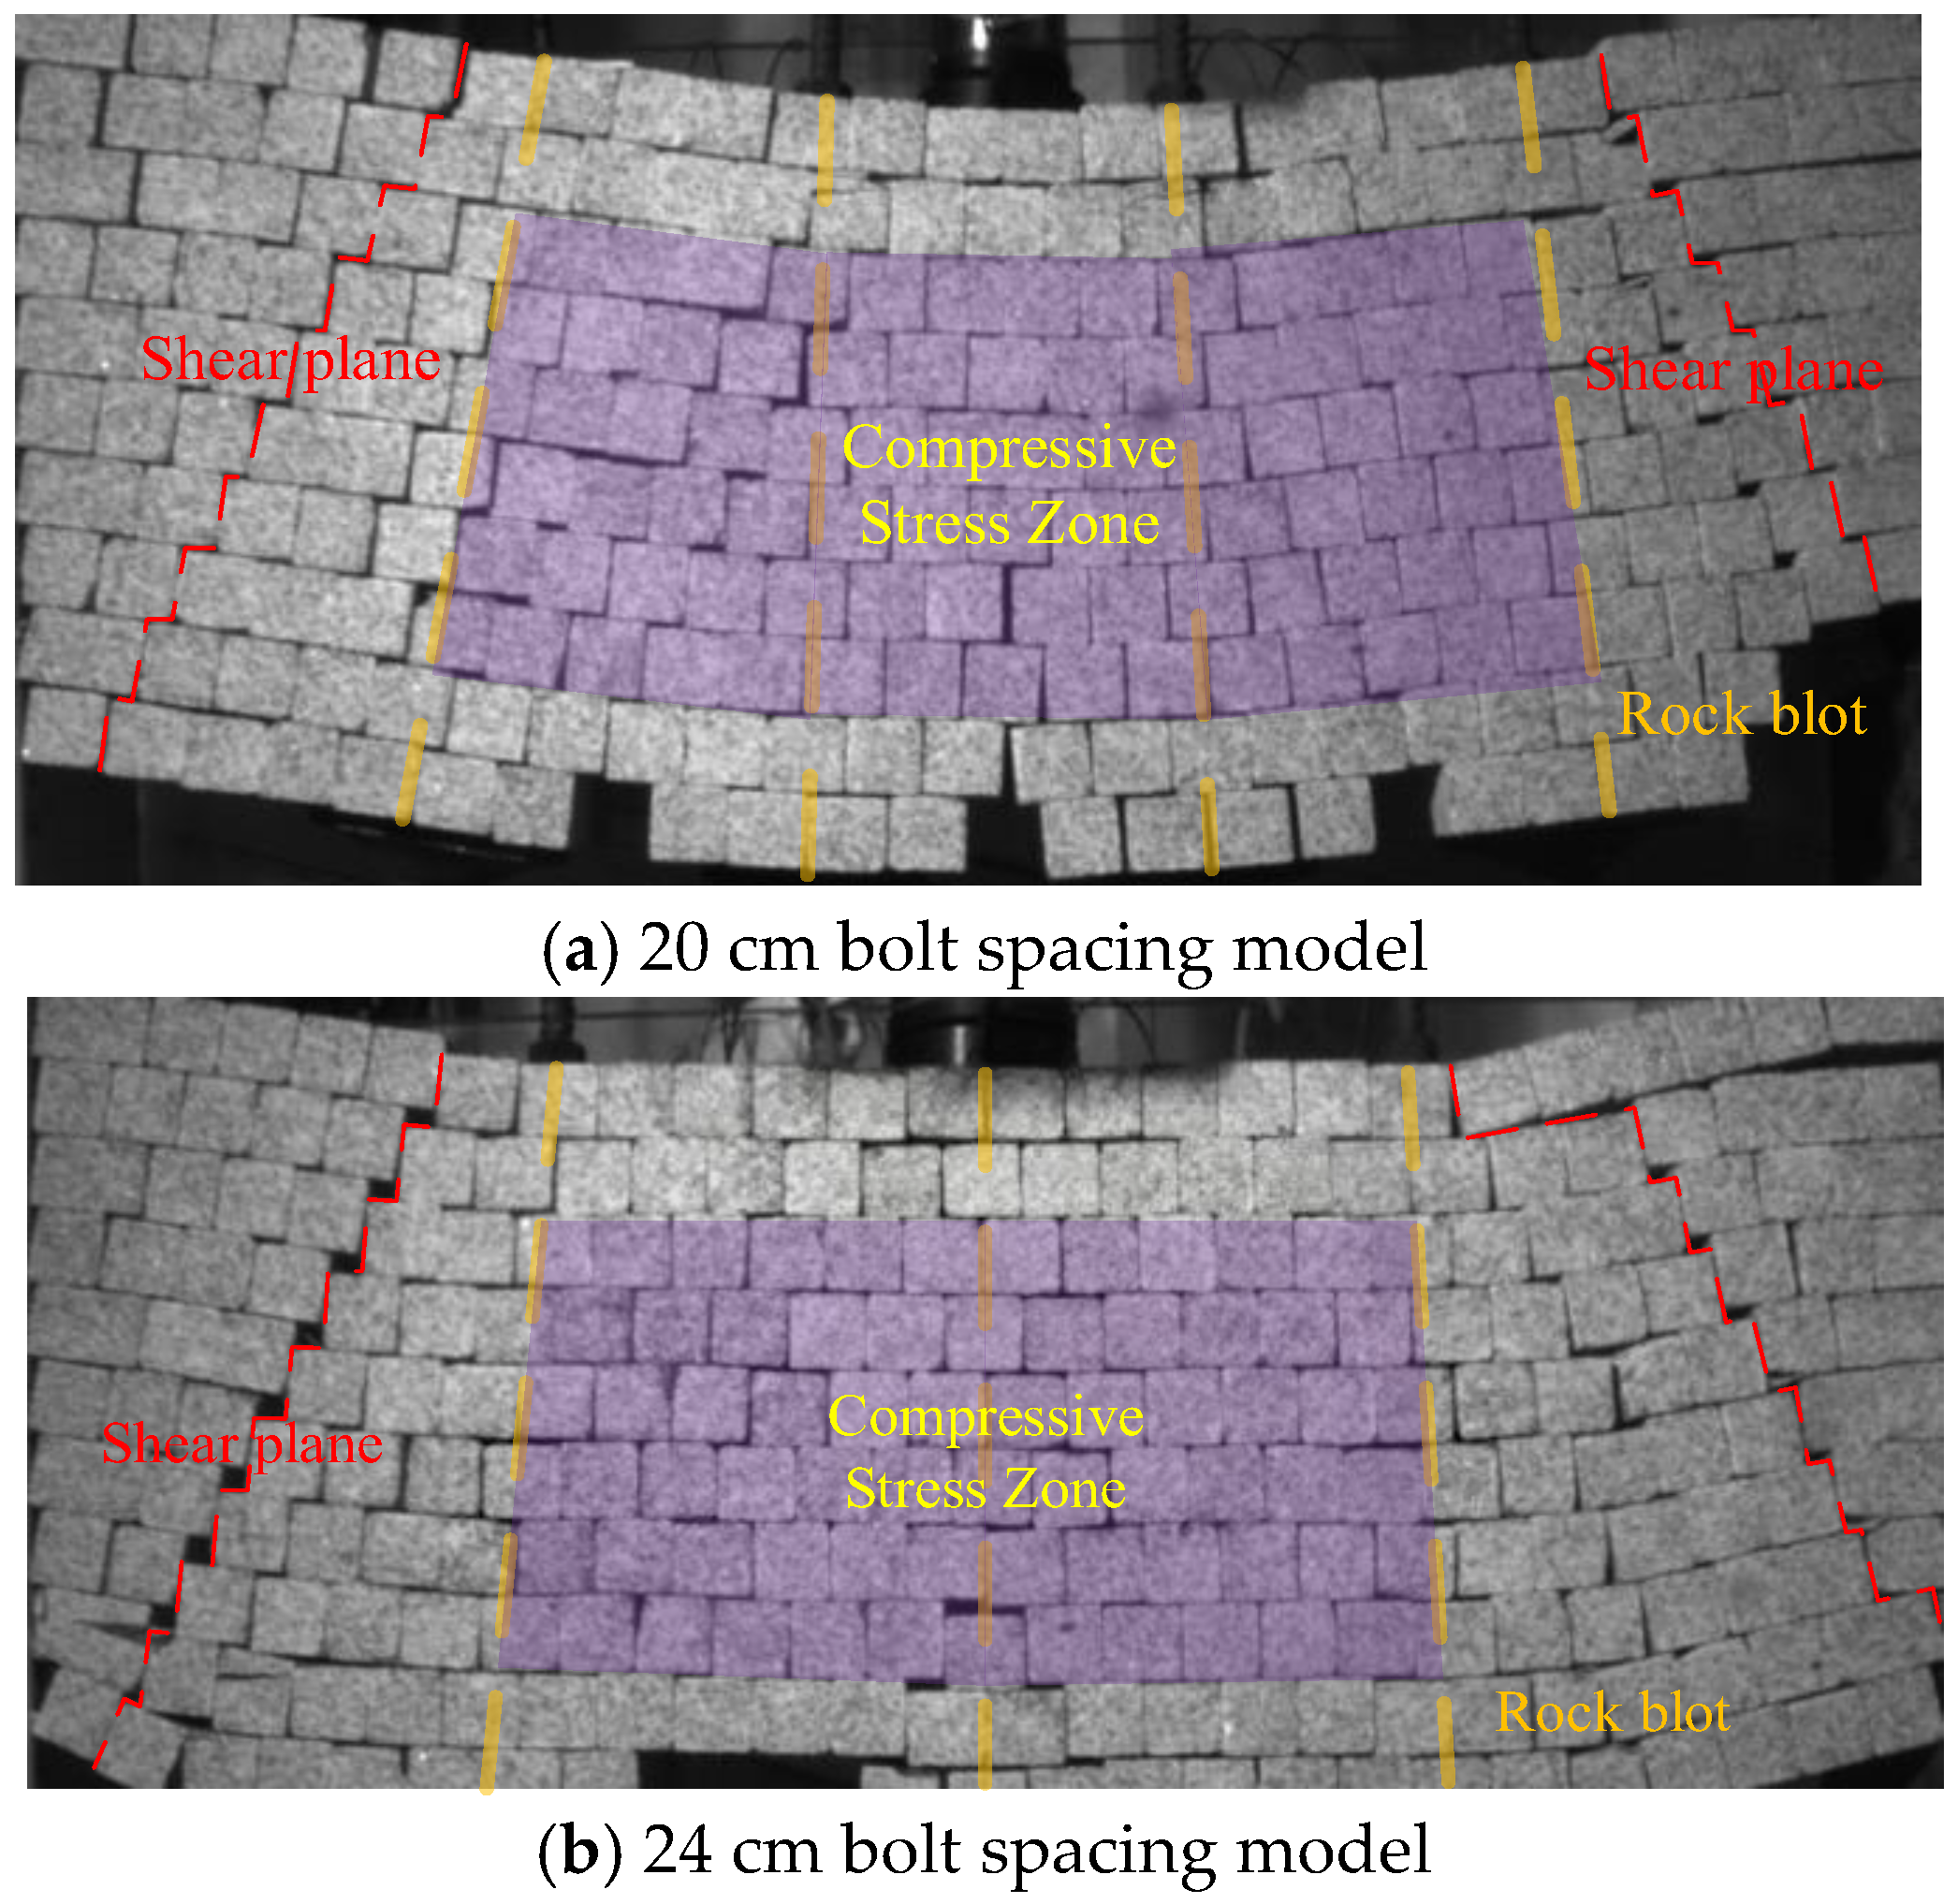
Figure 18 presents the actual failure pattern upon reaching the critical failure state under loading. This figure reveals the failure mode of the anchored combined arch support structure under ultimate load conditions. It can be observed that the shear planes inducing failure of the anchored structure are distributed at the arch feet. No major shear failure planes develop in the regions between adjacent bolts. This is because when the bolt density is sufficiently high, compressive stress zones form between adjacent bolts. These compressed areas constitute the core region that enhances the load-bearing performance of the anchored structure.
Figure 18.
Critical failure state of the anchored model.
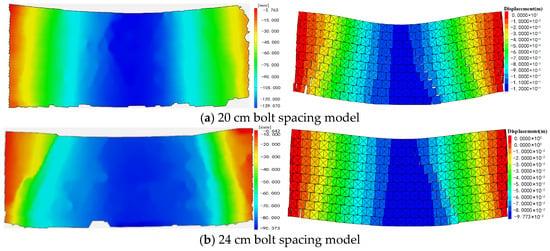
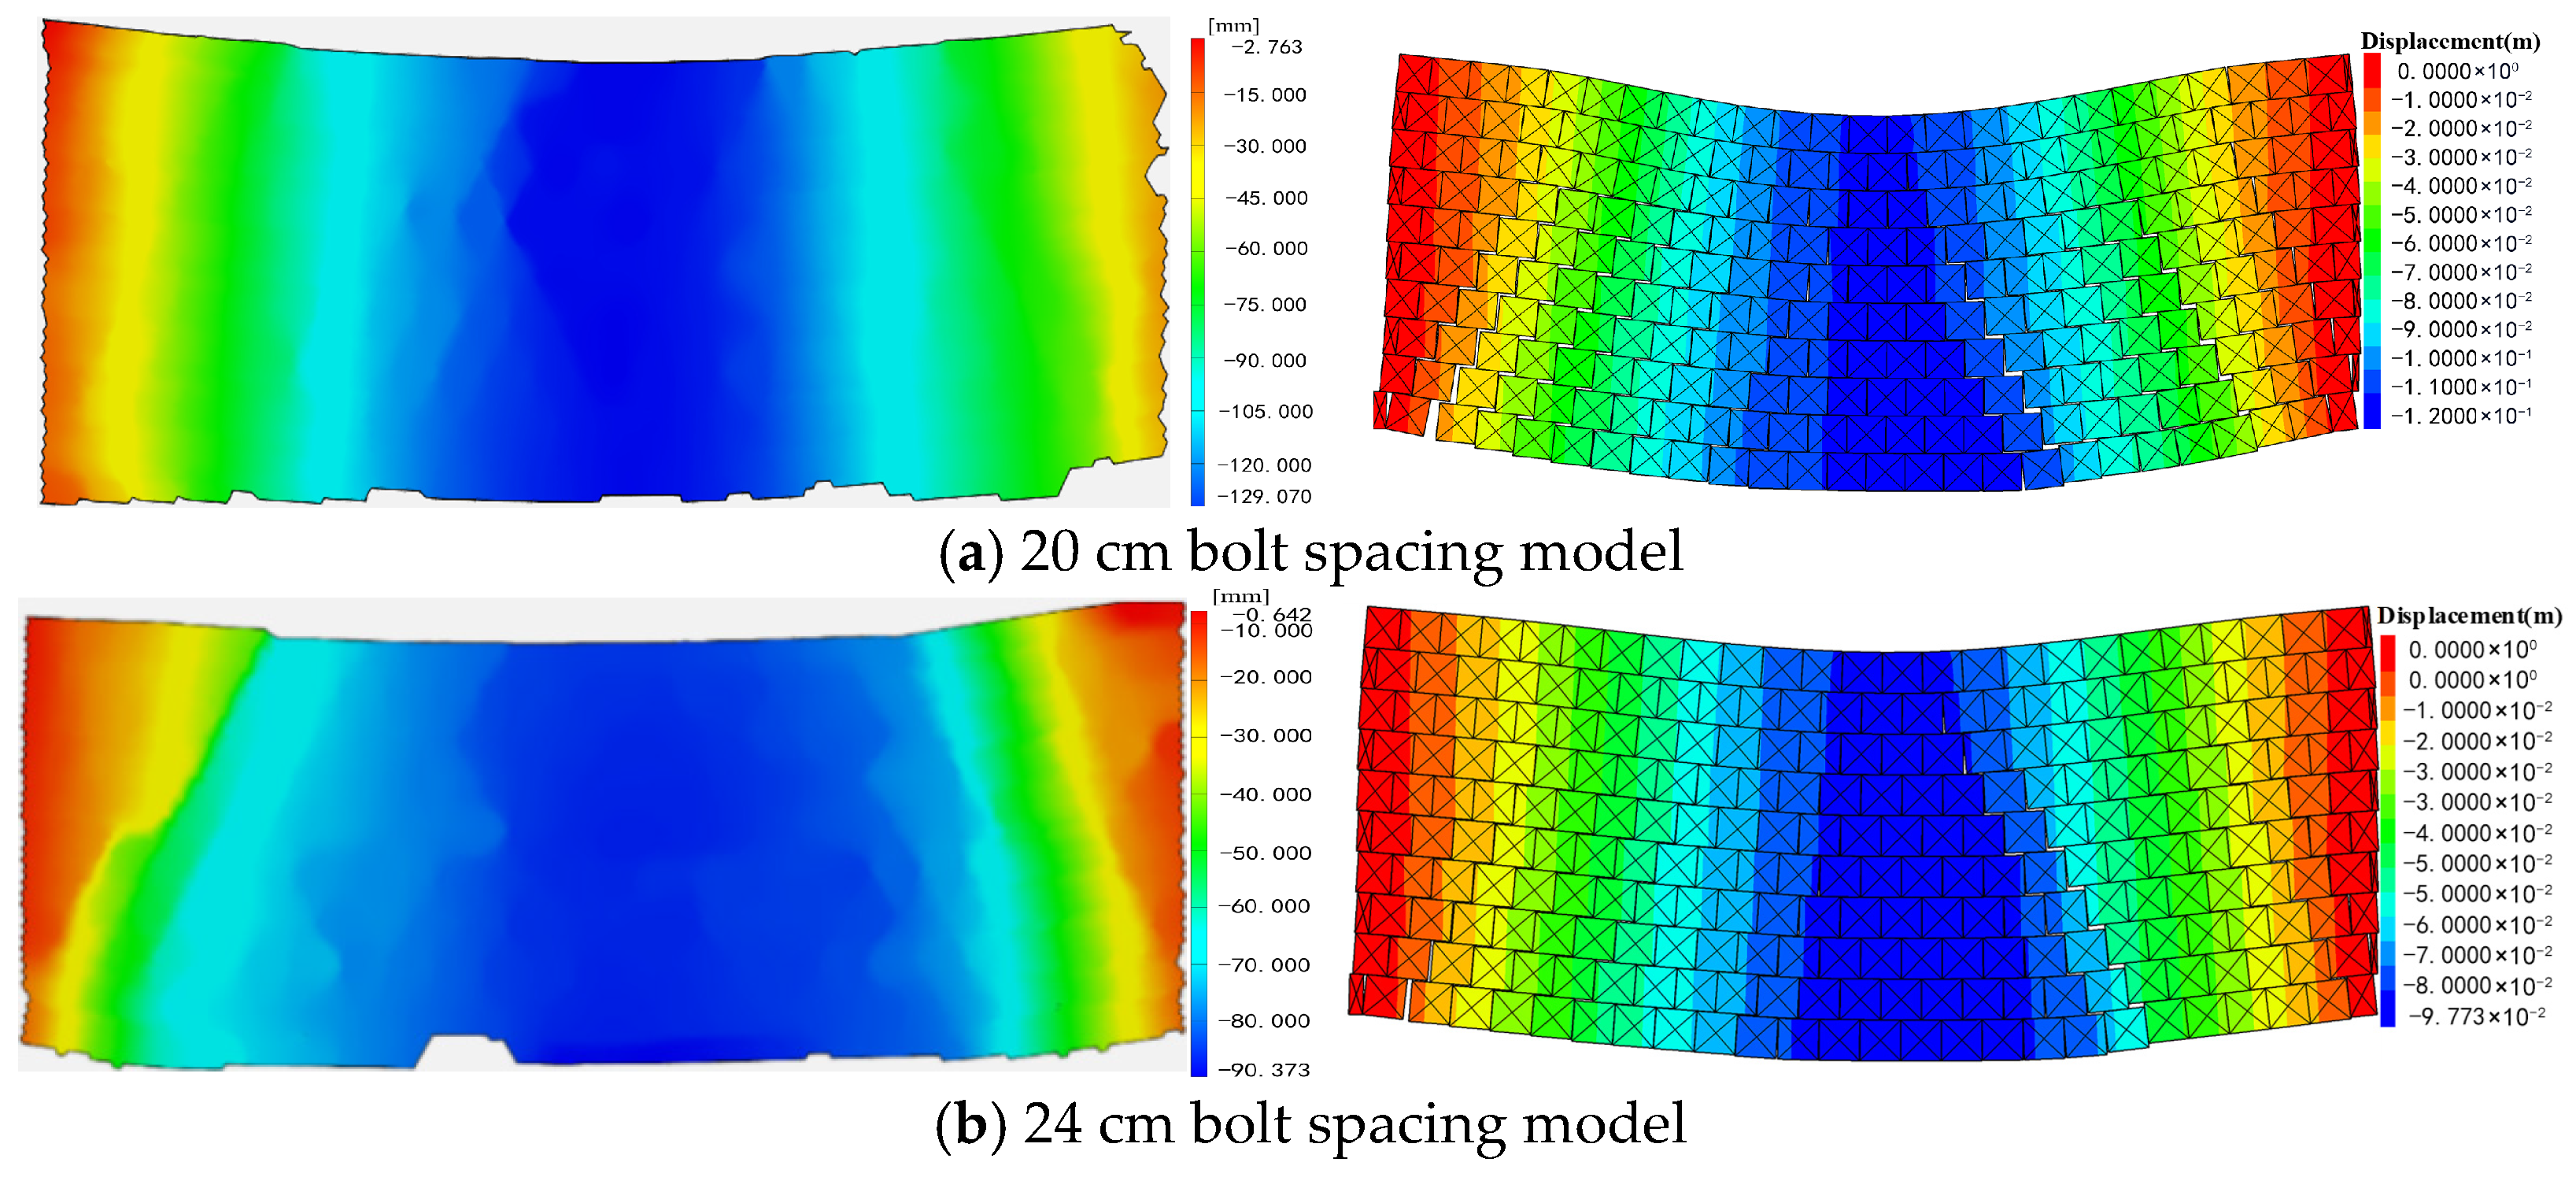
Figure 19 shows the displacement contours of the physical model under compression and those of the numerical simulation model.
Figure 19.
Failure displacement of the anchored structure.
Experimental data serve as a reliable basis for evaluating the validity of numerical model assumptions. Table 9 presents the failure displacements obtained from the laboratory test and the numerical simulation model.
Table 9.
Failure displacements of the laboratory model and numerical simulation model.
By comparison, the difference in maximum failure displacement between the physical model and the numerical simulation model falls within the range of 0 to 0.1 m. The numerical simulation results show good consistency with the experimental benchmark. Therefore, the adopted numerical assumptions can reasonably represent the mechanical process during the load-bearing failure of the combined arch, indicating that the established numerical model has high credibility.
Furthermore, at the critical failure state, the ultimate instability of the roof is characterized by shear sliding at the arch feet on both sides of the combined arch. The combined arch formed by bolt support transfers the roof load toward the arch feet, making the stress concentration zones at the arch feet the critical weaknesses. Consequently, during support design, special attention should be paid to strengthening the arch feet of the combined arch in the roadway roof. Reinforcement measures such as extending the bolts at the arch feet, adding cables, or grouting can enhance the load-bearing capacity at these locations, thereby improving the overall support effectiveness.
5. Engineering Application
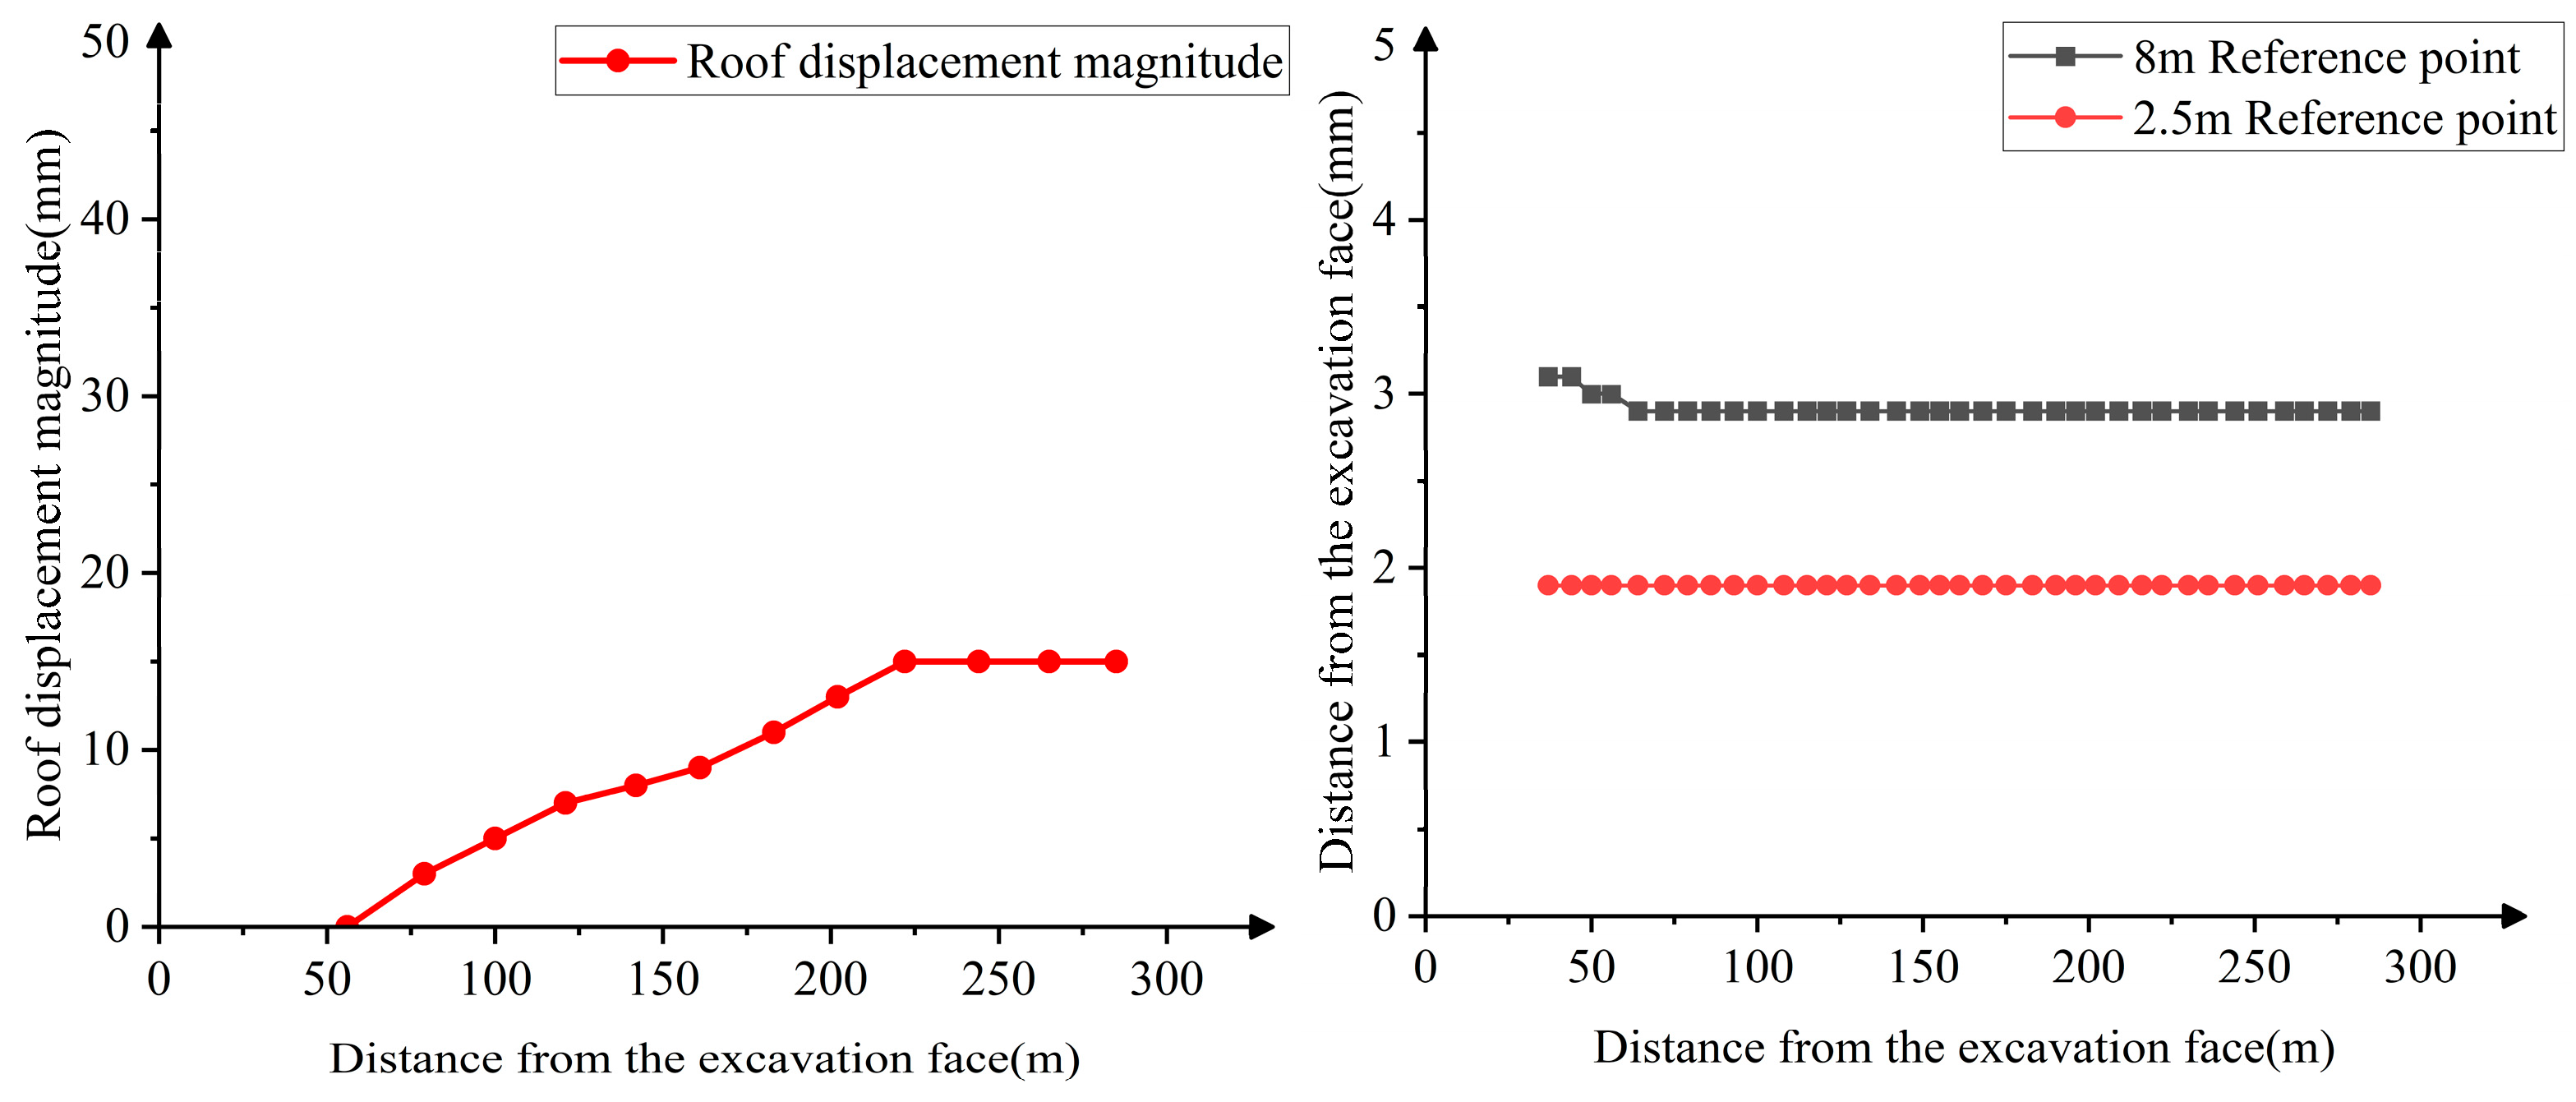
The final optimized support parameters are as follows: the bolts are Φ22 mm × 2600 mm right-hand threaded steel bolts, with a spacing of 700 mm and a row spacing of 1000 mm. Combined support using bolts, mesh, and cables is also adopted. Figure 20 shows the support layout for the coal mine roadway using the optimized parameters. During excavation, roof surface displacement monitoring points were arranged at the 150th row of bolts, and a roof separation indicator was installed at the 100th row. The deep anchor point was placed at a depth of 8 m, and the shallow anchor point at 2.5 m. After installation, the initial readings of both the deep and shallow anchor points were adjusted to 5–10 mm.
Figure 20.
Support effect diagram of the 11308 return airway.
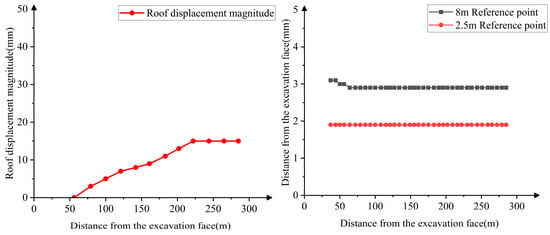
Figure 21 presents the monitoring results of roadway surface displacement and the roof separation indicator. The results show that the maximum roof surface settlement displacement is 15 mm. The maximum roof separation is 3 mm. The data from the deep and shallow anchor points are stable, with gentle variations, indicating that the overall integrity and stability of the roof have been significantly improved. The engineering application of the support scheme is effective.
Figure 21.
Monitoring results of roadway surface displacement and roof separation indicator.
6. Discussion
- (1)
- After introducing the correction factor, the theoretical model in this paper agrees well with the laboratory test results. However, it does not consider complex geological conditions such as in situ horizontal stress and mining-induced dynamic loads. Therefore, it is more suitable for application in continuous media.
- (2)
- Through the combination of laboratory tests and numerical simulations, it was found that failure structural planes tend to develop at the arch feet. Therefore, roadway support design should not focus solely on controlling deformation in the central roof; reinforcement of the arch feet should also be emphasized. Especially under loose and fractured surrounding rock conditions, the rock mass at the arch feet has low inherent strength and is more prone to shear failure. In future engineering practice, measures such as extending bolts at the arch feet or adding cables can be considered to enhance the overall support effectiveness.
- (3)
- The study found that the middle layer of the combined arch exhibits relatively stable behavior under compression. Future attempts could be made to install measurement points in the field for further verification. Moreover, current roadway roof monitoring mainly relies on displacement and bolt load measurements. Future work may consider integrating advanced technologies such as fiber Bragg grating sensing to achieve long-term online monitoring of internal roof stresses.
7. Research Results
- (1)
- In loose and fractured surrounding rock, a sufficiently high bolt density is the key factor for forming a combined arch. Accordingly, based on the mechanical model of an anchored combined arch in such rock, the bolt support parameters for the 11308 return airway of a coal mine in Inner Mongolia were designed, and the roof bolt spacing was reduced from 0.8 m to 0.7 m.
- (2)
- The “formation–loading–failure” process of the combined arch is as follows: bolt pre-tension creates the combined arch structure → the arch transfers the load downward → after the load exceeds the limit, the integrity of the arch is compromised. As bolt spacing decreases, the vertical stress concentration in the anchored structure increases, and its load-bearing capacity improves.
- (3)
- A smaller bolt spacing enhances the deformation resistance of the anchored structure. During the stage from load-bearing to failure of the combined arch, the variations in vertical and horizontal stresses become more stable, and the load-bearing capacity of the anchored structure increases significantly. The shear planes that cause failure of the anchored structure are mainly distributed at the arch feet. Therefore, strengthening the arch feet of the roadway roof can be considered in support design to improve the overall support effectiveness. The pressure changes in the middle layer of the combined arch are relatively stable, which could be verified in the future by arranging measurement points in the field. Field monitoring shows that the maximum roof surface settlement displacement is 15 mm, and the maximum separation at both the deep and shallow roof anchor points is 3 mm, confirming that the bolt support parameters can meet the roadway stability requirements.
Author Contributions
F.Y. wrote the theoretical analysis content, contributed to the conceptualization, and reviewed the manuscript. C.X. conducted similar material simulation experiments and numerical simulations, and drafted portions of the manuscript. L.X. proposed the numerical simulation method and carried out subsequent revisions of the manuscript. C.M. provided theoretical guidance and conducted the field investigation. C.Y. and X.Z. assisted with field investigations and engineering analysis. H.L. assisted in performing similar material simulation experiments and refining manuscript details. All authors reviewed the manuscript. All authors have read and agreed to the published version of the manuscript.
Funding
This work was supported by the Natural Science Foundation of Shandong Province (ZR2022ME158).
Institutional Review Board Statement
Not applicable.
Data Availability Statement
The data used to support the findings of this study are available from the corresponding author.
Acknowledgments
This research was financially supported by the Natural Science Foundation of Shandong Province (ZR2022ME158). The authors are grateful to Liangke XU for his insightful suggestions on the numerical simulation.
Conflicts of Interest
The authors declare that the authors have no competing interests or other interests that might be perceived to influence the results and/or discussion reported in this paper. Author Chengfu MA was employed by the company Beijing Haohua Energy Resource Co., Ltd. The remaining authors declare that the research was conducted in the absence of any commercial or financial relationships that could be construed as a potential conflict of interest.
References
- Kang, H.; Zhang, Z.; Huang, Z. Characteristics of roof disasters and controlling techniques of coal mine in China. Saf. Coal Mines 2020, 51, 24–33. [Google Scholar]
- Zuo, J.; Hong, Z.; Yu, M.; Liu, H.; Wang, Z. Research on gradient support model and classification control of broken surrounding rock. J. China Univ. Min. Technol. 2022, 51, 221–231. [Google Scholar]
- Wang, H.; Liu, L.; Li, S.; Wang, Q.; Li, W.; Meng, Q. An upper bound design method for roof bolting support in roadways with top coal. Arab. J. Geosci. 2021, 14, 790. [Google Scholar] [CrossRef] [Scilit]
- Geng, W.; Zhen, L.; Zhang, T.; Guo, S.; Huang, G.; Xiong, Y. Research on the Optimization of Mining Structure Parameters Based on the Pressure Arch Theory. Processes 2025, 13, 4069. [Google Scholar] [CrossRef] [Scilit]
- Ren, H.; Zhu, Y.; Yao, Q.; Li, P.; Wei, M. Study on the mechanism of anchoring parameters of anchor rods in cemented broken surrounding rock. Sci. Rep. 2025, 15, 28256. [Google Scholar] [CrossRef] [Scilit]
- Shen, D.B.; Ma, L. Application of Comprehensive Reinforce Technology in Soft and Crumbly Surrounding Rock in High Stress. Adv. Mater. Res. 2011, 393–395, 608–613. [Google Scholar] [CrossRef] [Scilit]
- Guo, T.; Yang, P.; Zhao, J.; Cheng, Z. Function of Bolts in Arching Process of Surrounding Rocks of Roadways and Its Application in Support Design for Large Section Gateways. Appl. Sci. 2025, 15, 10327. [Google Scholar] [CrossRef] [Scilit]
- Jin, C.; Shao, A.; Liu, D.; Han, T. Failure Mechanism of Highly Stressed Rock Mass during Unloading Based on the Stress Arch Theory. Int. J. Geomech. 2018, 18, 04018146. [Google Scholar] [CrossRef] [Scilit]
- Lang, T.A. Theory and practice of rock bolting. Trans. Am. Inst. Min. Metall. Eng. 1961, 220, 333–348. [Google Scholar]
- Wang, Y. Study on mine pressure behavior law of No.1206Face under goaf of close distance coal seam in Huacaotan Mine. Coal Chem. Ind. 2025, 48, 30–37. [Google Scholar]
- Li, Y.; Zhao, C.; Liu, Z. Research on layered evolution law of surrounding rock bearing layers and strength analysis of “layer-double arch” bearing structure. Chin. J. Rock Mech. Eng. 2020, 39, 217–227. [Google Scholar]
- Meng, B.; Jing, H.; Wu, J. Model test study on bearing mechanical properties of anchored gravels. Chin. J. Rock Mech. Eng. 2023, 42, 3020–3030. [Google Scholar]
- Wang, X. Effect of rock bolt pretension on anchoring and bearing characteristics of fractured rock mass. J. China Coal Soc. 2024, 49, 606–615. [Google Scholar]
- Wang, X.; Kang, H.; Gao, F. Analysis of pressure arch formation and rockbolt function in gravel bolting. J. China Coal Soc. 2021, 46, 3139–3147. [Google Scholar]
- Grindheim, B.; Li, C.C. Laboratory Tests of Large Scale Block Models on the Load Transfer and Failure Mechanisms of Rock Masses Subjected to Anchor Loading. Rock Mech. Rock Eng. 2024, 57, 8405–8428. [Google Scholar] [CrossRef] [Scilit]
- Grindheim, B.; Trinh, N.; Li, C.C. Investigating Load Arches and the Uplift Capacity of Rock Anchors: A Numerical Approach. Rock Mech. Rock Eng. 2024, 57, 7313–7342. [Google Scholar] [CrossRef] [Scilit]
- Zhang, G.; Liu, Y.; Zhao, W.; Liu, Z.; Liu, J.; Feng, B. Optimal arch shape of long-span open-spandrel arch bridges under vertical permanent loads. Structures 2022, 45, 1012–1030. [Google Scholar] [CrossRef] [Scilit]
- Olivieri, C.; Sibille, L.; Cocking, S.; Charandabi, R.N.; Fabbrocino, F.; Adriaenssens, S. Design of purely compressive shells under vertical and horizontal loads through Machine Learning-driven form-finding. Mech. Res. Commun. 2025, 148, 104491. [Google Scholar] [CrossRef] [Scilit]
- Li, C.C. Principles of rockbolting design. J. Rock Mech. Geotech. Eng. 2017, 9, 18–36. [Google Scholar] [CrossRef] [Scilit]
- Cheng, P.; Li, Z. Mechanical analysis of combined bearing action of surrounding rock and prestressed anchor support and optimization of support parameters. Chin. J. Rock Mech. Eng. 2025, 44, 134–142. [Google Scholar]
- Zhou, K.; Yu, F.; Tan, Y.; Zhao, W.; Xu, L. A Failure Mechanism of Supports in Weakly Cemented Soft Rock Roadways and the Synergistic Support Design. Rock Mech. Rock Eng. 2024, 57, 10631–10646. [Google Scholar] [CrossRef] [Scilit]
- Kang, H.; Wang, J.; Li, N. Study and applications of roadway support techniques for coal mines. J. China Coal Soc. 2010, 35, 1809–1814. [Google Scholar]
- Yu, H.; Tang, R.; Kong, L.; Niu, Z. Application of surrounding rock loose circle theory in roadway support designing. China Min. Mag. 2014, 23, 115–118. [Google Scholar]
- Cundall, P.A. UDEC—A Generalised Distinct Element Program for Modelling Jointed Rock; Report PACR-1–80, Contract DATA 37-79-C-0548; European Research Office and Defense Nuclear Agency: Fort Belvoir, VA, USA, 1980. [Google Scholar]
- Cundall, P.A.; Hart, R.D. Development of Generalized 2-d and 3-d Distinct Element Programs for Modeling Jointed Rock; Itasca Consulting Group Inc.: Minneapolis, MN, USA, 1985. [Google Scholar]

Disclaimer/Publisher’s Note: The statements, opinions and data contained in all publications are solely those of the individual author(s) and contributor(s) and not of MDPI and/or the editor(s). MDPI and/or the editor(s) disclaim responsibility for any injury to people or property resulting from any ideas, methods, instructions or products referred to in the content. |
© 2026 by the authors. Licensee MDPI, Basel, Switzerland. This article is an open access article distributed under the terms and conditions of the Creative Commons Attribution (CC BY) license.