


Abstract
Indoor speech propagation causes minute vibrations in surrounding objects, enabling remote speech recovery through passive eavesdropping. Unlike traditional methods that rely on acoustic waves, passive eavesdropping uses object vibrations, making it difficult to defend against, even in soundproof environments. However, weak vibration signals and noise interference make speech recovery challenging. Existing studies mainly focus on deep learning for signal reconstruction, requiring large datasets and high computational power, which complicates real-time, on-device deployment. To address this, we propose a lightweight passive speech recovery system based on millimeter-wave radar. Without prior knowledge of object locations or numbers, the system can adaptively fuse multi-source signals for real-time speech reconstruction. To counteract the noise characteristics of millimeter-wave radar and the weak amplitude of vibration signals, we designed a set of low-complexity noise suppression and signal enhancement algorithms, ensuring efficient operation on edge devices. Experimental results demonstrate that in single-target scenarios, the proposed system achieved a Mel Cepstral Distortion (MCD) of 3.923 and a Word Error Rate (WER) of 12.9%. In multi-target scenarios, the SNR improved by 3.65 dB, MCD decreased by an average of 1.52, and WER decreased by an average of 15.83%, making the method effective and practical in complex acoustic environments.
1. Introduction
Voice eavesdropping technology aims to obtain target voice information through various means, playing an important role in gathering intelligence, law enforcement actions, and business competition. Early voice eavesdropping primarily relied on active devices, such as recording pens, listening devices, or remote microphone arrays. Although these devices could provide high-quality voice recordings, they needed to be installed close to the sound source, which posed a risk of detection. To prevent voice leakage, people attempted to use soundproof materials, vacuum glass, and various privacy protection technologies. However, with the continuous improvement of sensor performance and signal processing technologies, voice eavesdropping methods are gradually evolving towards non-contact, long-distance, and intelligent approaches, significantly improving their concealment, making traditional protective measures less effective.
To improve concealment and environmental adaptability, researchers proposed the concept of Passive Eavesdropping. Unlike active eavesdropping, passive eavesdropping does not require direct contact with the sound source but instead recovers the voice signal by detecting environmental disturbances or micro-vibrations on object surfaces caused by sound propagation. These methods often utilize visible or invisible objects in the environment as “passive sound transmission media,” enabling voice acquisition without altering the environment or contacting the target. As a result, passive eavesdropping has attracted widespread attention in the context of growing demands for security and concealment.
In recent years, various passive eavesdropping methods based on different sensor media have been proposed. Optical methods use high-speed cameras or laser ranging systems to reconstruct voice signals by analyzing motion or phase changes in reflected light from object surfaces [1,2]. Wireless RF methods, such as WiFi and RFID technologies, indirectly recover voice signals by monitoring changes in Channel State Information (CSI) caused by sound wave disturbances [3,4]. Although these methods work well in specific scenarios, optical and laser methods are significantly affected by lighting conditions and are costly, while WiFi and RFID methods have limited resolution and are easily influenced by environmental noise, making stable, high-quality voice reconstruction in complex environments difficult.
In contrast, millimeter-wave radar (mmWave Radar), with its high resolution, strong penetration, anti-interference, and all-weather characteristics, provides a new approach to passive voice eavesdropping. mmWave radar can detect sub-millimeter-level vibrations and is not affected by lighting, allowing it to operate in vacuum and occlusion conditions. Previous studies, such as Milliear [5] and mmEavesdropper [6], demonstrated high-quality voice recovery in a conference room by actively illuminating speakers, proving the feasibility of mmWave for voice eavesdropping. However, these methods still have several limitations: first, they require the speaker to be within the radar’s field of view and remain stationary, making them unable to handle multiple targets or even more complex scenarios; second, they can only eavesdrop on a single sound source, failing to exploit the signal complementarity and robustness enhancement provided by multi-source fusion.
In conclusion, current schemes still lack a passive eavesdropping system that balances non-invasiveness, environmental adaptability, concealment, and lightweight deployment. Existing mmWave methods face challenges in vibration source localization, noise suppression, and multi-source fusion, limiting voice clarity and stability. Therefore, this study aims to address these critical challenges by designing an efficient and adaptive signal processing pipeline to achieve high-quality passive voice recovery.
In response to the above issues, this paper proposes a passive voice eavesdropping system based on FMCW (Frequency-Modulated Continuous Wave) mmWave radar, enabling adaptive voice acquisition and efficient reconstruction in multi-target scenarios. The system does not rely on deep learning models, nor does it depend on the visibility or stationary conditions of the speaker. By capturing micro-vibrations on object surfaces caused by sound wave propagation, the system achieves non-invasive voice recovery. Additionally, we design an adaptive material localization and signal fusion method that is able to identify and optimize high-quality reflected signals in multi-target and multi-material environments, thereby improving the quality and robustness of voice reconstruction. More importantly, the system adopts a lightweight signal processing architecture with low computational complexity and power consumption, enabling real-time operation on edge devices and providing a new approach for low-power voice perception and privacy protection research.
It is important to note that the passive voice eavesdropping problem addressed in this paper is essentially a signal recovery task based on physical modulation. The purpose is to recover the micro-vibrations of object surfaces caused by sound waves from the mmWave radar echoes, rather than performing semantic modeling or speech recognition. There exists a clear and modelable physical mapping relationship between sound waves, mechanical vibrations, and radar phase changes, allowing the problem to be solved through precise signal processing and statistical modeling.
The main contributions of this paper are as follows:
- Proposed an adaptive multi-target mmWave passive eavesdropping system that can automatically locate eavesdropping materials and extract their micro-vibration signals in complex scenarios, which can recover voice from multi-source fusion.
- Designed high-quality signal processing and fusion methods that effectively enhance the signal-to-noise ratio (SNR) and speech intelligibility without deep learning, large-scale data, or high computational power.
- Constructed a lightweight system architecture that can run in real time on edge devices, achieving low-complexity and high-efficiency voice reconstruction.
- Verified the system’s efficacy across multi-context experiments, wherein outcomes indicated a mean SNR gain of 3.65 dB, a decline in Mel-Cepstral Distortion (MCD) of 1.52, and a drop in Word Error Rate (WER) of 15.83%, which clearly surpasses the results of methods proposed before.
2. Related Work
Voice eavesdropping technology is chiefly divided into three categories according to sensing principles: approaches based on inertial measurement units, computer vision (CV), and wireless sensing. In this section, the limitations of each method are examined, while particular emphasis is placed on unresolved issues in millimeter-wave radar–based wireless sensing solutions, which in turn motivate the research presented in this work.
2.1. IMU-Based Eavesdropping
IMU-based eavesdropping is a contact-based method that involves attaching a device (such as an accelerometer or gyroscope) directly to a vibrating surface to sense sound waves. These devices typically have low sampling rates and cannot capture complete sound information. Therefore, existing studies [7,8,9,10,11] have only been able to classify a limited set of fixed vocabulary words. Moreover, the invasive installation requirements greatly limit the practical application scenarios and significantly increase the risk of exposure.
2.2. Computer Vision-Based Eavesdropping
This type of method uses optical devices such as high-speed cameras or LiDAR (Light Detection and Ranging) to non-invasively observe the surface vibrations of objects (e.g., glass windows, plastic bags) caused by sound, thus recovering voice signals, as seen in studies [1,2]. While achieving non-physical contact, these optical methods are heavily dependent on environmental lighting conditions, and they almost fail in dim or no-light environments. Additionally, high-frame-rate and high-resolution cameras or LiDAR devices are often expensive and bulky. Their significant physical size, complex deployment requirements, and low cost-effectiveness greatly weaken their practical value in real-world scenarios.
2.3. Wireless Sensing-Based Eavesdropping
Early studies utilizing Wi-Fi and RFID provided cost-effective and highly concealed eavesdropping solutions, as seen in works [12,13]. However, these technologies are limited by their inherent physical properties, with limited signal bandwidth that severely restricts the recovery of high-frequency voice details. The low spatiotemporal resolution leads to an insufficient signal-to-noise ratio (SNR) of the vibration signals. As a result, the reconstructed voice signals are unclear, with many critical semantic features lost. While it is possible to detect the presence of speech, accurate and reliable semantic recognition is difficult, which greatly limits its practical value in intelligence gathering and other real-world applications.
2.4. mmWave-Based Eavesdropping
In the past few years, millimeter-wave radar has attracted growing attention in this area, largely because it offers high spatial resolution, strong penetration capability, and stable performance under complex environmental conditions. Current studies in the literature generally fall into two main categories.
Active Eavesdropping:
Active eavesdropping refers to directly eavesdropping on the sound source, as seen in systems like Milliear, mmEavesdropper, and mmWave-Whisper [14]. The common premise of these methods is that the target sound source must be within the radar’s field of view and remain stationary. The typical application scenario is eavesdropping on the content played by speakers in a room, rather than on everyday human speech. More recent studies, such as mmEar [15] and mmHSE [16], have focused on wearable devices, exploring the eavesdropping capability of consumer-grade mmWave radar on these devices and improving attack performance through structural optimization and signal processing improvements. Although progress has been made under specific conditions, the application scenarios remain limited, and most of these solutions rely on complex deep learning models for signal post-processing, leading to insufficient system lightweighting and real-time performance.
Passive Eavesdropping:
Passive eavesdropping, on the other hand, recovers speech by detecting object vibrations caused by sound waves, relaxing the constraints on the location and movement of the sound source. mmEcho [17] is one of the few attempts at passive eavesdropping, but its approach has significant flaws in core signal processing. It uses simple moving averages and Wiener filtering, which have poor adaptability when dealing with complex acoustic signals. This often leads to artifacts such as “click” noise, severely impacting speech intelligibility.
In recent years, significant progress has been made in the field of passive voice eavesdropping and vibration sensing using millimeter-wave radar. For example, the end-to-end mmWave voice eavesdropping system proposed by Han and Huang [18] improved the signal processing pipeline to directly recover voice signals from mmWave echoes. Further research has focused on enhancing weak vibration signals in mmWave echoes. For instance, work [19] proposed a vibration signal enhancement scheme for mmWave-based voice eavesdropping to improve speech reconstruction quality.
Moreover, multi-antenna mmWave radar has been used to enhance the accuracy of sound-induced vibration sensing. Work [20] employed multi-antenna arrays to improve spatial resolution, thereby enhancing the extraction of vibration signals.
Although significant progress has been made in the direction of passive mmWave eavesdropping, most of these works depend on specific target structures, use fixed or short-range experimental scenarios, or focus on end-to-end system designs and specific application attacks. In contrast, this paper focuses on a more general reflection-based voice eavesdropping scenario, where high-precision phase extraction, multi-target fusion, and robust noise reduction strategies are applied to achieve stable voice signal recovery in complex environments without requiring specific target structures or prior training.
In summary, there is still a lack of a passive eavesdropping system that balances non-invasiveness, environmental adaptability, concealment, and lightweight deployment in the current field. Existing mmWave passive eavesdropping solutions still face rough handling in core aspects such as vibration source localization and noise suppression. Therefore, this study aims to address these critical challenges by designing an efficient and adaptive signal processing pipeline to achieve high-quality passive voice recovery.
3. Theoretical Foundation
3.1. Passive Acoustic Eavesdropping Theory
When an acoustic wave impinges on the surface of an object, it generates an acoustic pressure on the surface, which can be equivalently modeled as an external force acting on the effective stressed area:
where denotes the effective area subjected to the acoustic pressure. The resulting micro-vibration of the static object surface can be approximately modeled as a linear single-degree-of-freedom forced vibration system [21], whose equation of motion is given by
Here, represents the displacement of the object surface, while m, c, and k denote the equivalent mass, damping coefficient, and stiffness parameter, respectively, which depend on the material properties of the eavesdropping object. This equation describes how external acoustic excitation is converted into micro-scale mechanical vibrations on the target surface. In practical scenarios, however, the material properties and physical parameters of the target object are generally unknown, making it infeasible to accurately infer the absolute amplitude of the input acoustic pressure . Nevertheless, according to linear system theory, by applying the Fourier transform to both sides of Equation (2) and denoting as the frequency-domain representation of , the frequency response of the surface vibration can be expressed as
where denotes the frequency response of the acoustic pressure signal. Although the absolute amplitude scaling is unknown, the system preserves the spectral structure and waveform characteristics of the acoustic signal.
Therefore, the surface vibration can be regarded as an approximate representation of the original acoustic signal, denoted as , such that
Consequently, by accurately sensing the micro-vibrations of the object surface using millimeter-wave radar, it is possible to extract the vibration pattern of the object surface and use it to recover the acoustic signal. In our experiments, after phase demodulation, high-pass filtering, and denoising of the radar phase signal, a relatively clean acoustic waveform is obtained. This approach enables a direct approximation of the acoustic signal without requiring prior knowledge of system parameters, thereby laying the foundation for subsequent speech recognition and processing tasks.
3.2. Millimeter-Wave Radar Signal Fundamentals
Next, we outline the core mechanisms for deriving the vibration signatures from an object’s surface through millimeter-wave radar under single-source eavesdropping conditions in realistic application scenarios.
In the field of wireless communication, signals are categorized into three classes according to frequency: Radio Frequency (RF), Intermediate Frequency (IF), and Baseband systems.
RF is tasked with receiving and emitting high-frequency signals, whereas baseband manages the processing and storage of these signals.
IF serves as an intermediary between RF and baseband, enabling a seamless transition of the signal from high frequency to baseband.
The term “intermediate frequency” denotes a midrange position within the overall signal frequency spectrum range.
Millimeter-wave radar usually uses FMCW signals to measure distance; see Figure 1. The frequency difference between the Tx signal (Tx) and the RX signal (Rx) is the time taken by the signal to propagate and can then be used to compute the distance of the object. This measures the distance between the radar antenna and the moving object through, e.g., R(t), where the transmitted and received signals may be written as
where denotes the time delay between the transmitted (TX) and received (RX) signals, is the propagation speed of the electromagnetic wave, represents the path loss coefficient, and and denote the starting frequency and the frequency modulation slope of the FMCW signal, respectively. Subsequently, the carrier component of the received signal is removed by a mixer, yielding the intermediate-frequency (IF) signal :
Figure 1.
Chirp generation. Red line: transmitted signal (Tx); gray line: received signal (Rx); blue line: intermediate frequency (IF).
It can be observed that the IF signal of an FMCW radar consists of multiple cosine components. Each cosine component corresponds to the reflected signal from a target, whose frequency is determined by the distance between the target and the radar. By applying a fast Fourier transform (FFT) to the IF signal, the amplitude and phase information of each frequency component can be extracted, thereby generating multiple frequency channels (commonly referred to as frequency bins in radar signal processing, where a “bin” denotes the minimum frequency quantization unit).
According to Equation (2), if a target reflection exists at a distance , then after performing an FFT on the IF signal, a prominent peak will appear in the frequency bin corresponding to . Therefore, by examining the frequency spectrum obtained from the FFT of the IF signal, the distance of the target can be estimated. This operation of estimating target distance is referred to as range FFT (Range-FFT), and the frequency bins in the FFT output are called range bins.
By performing Range-FFT on each chirp (i.e., linear frequency-modulated signal), distance estimates at different time instances can be obtained, forming a range profile. According to Equation (2), the Range-FFT result at the range bin corresponding to a target located at distance can be expressed as:
The extracted phase directly encodes the displacement of the target induced by acoustic excitation. Specifically, the displacement variation is proportional to the phase variation and can be expressed as .
As an illustrative example, for a target undergoing a displacement of 1 mm, the resulting phase variation is approximately 1.03π when the carrier . In general, the phase variation caused by target motion can be written as , where denotes the time-varying displacement of the target. Since our objective is to recover the vibration of the object surface induced by sound, we define this displacement as . Accordingly, can be expressed as
where is a constant. This relationship indicates that the target surface vibration is linearly proportional to the extracted phase. Therefore, in acoustic eavesdropping scenarios, accurate phase extraction is of critical importance. Furthermore, in multi-source scenarios, precise phase extraction for each vibration source is also the key to ensuring the quality of the fused signal.
3.3. Multi-Source Fusion Theory
Traditional passive acoustic eavesdropping models are typically based on the assumption of a single vibration source. Under this model, the received radar baseband signal can be simplified as a function of the target displacement induced by acoustic excitation:
where denotes the signal amplitude, is the wavelength of the FMCW signal, and represents noise. In this model, the core task is to recover from and subsequently reconstruct the acoustic signal . However, in realistic indoor environments, an acoustic wave simultaneously induces micro-vibrations in multiple objects, forming a multi-vibration-source scenario. In this case, the signal received by the radar is a linear superposition of reflections from all vibration sources:
where denotes the number of vibration sources. This multi-source mixed signal cannot be directly used for speech recovery, as it contains coupled vibration information corresponding to different acoustic sources. Direct processing would result in severe interference in the reconstructed speech.
To address this issue, we propose a core theoretical framework: through separation and fusion, multiple vibration sources are integrated into a clearer and more complete speech stream. This theoretical model is based on the following two fundamental assumptions:
Independence: Different objects exhibit highly correlated vibration responses to the same acoustic stimulus, while the noise components they carry are relatively independent.
Complementarity: Due to differences in material properties, spatial locations, and orientations, the speech segments recovered from different vibration sources vary in quality. Some sources may exhibit higher signal-to-noise ratios in specific frequency bands or time intervals.
Based on these assumptions, our fusion strategy can be described as follows. From vibration sources, we recover speech streams , , , …, . The system aims to assign an appropriate weight to each speech stream at every time instant, where the weight is proportional to the instantaneous speech quality. The final enhanced fused speech is given by
4. System Overview
To achieve adaptive voice eavesdropping in multi-target, multi-material scenarios, we need to address the following three technical challenges:
Target Localization Difficulty: The vibrations induced by sound waves on the surface of objects are typically on the sub-millimeter scale, while commercial FMCW millimeter-wave radars offer a resolution of only about 4 cm in distance. Achieving high-precision localization of vibration sources and phase extraction under this resolution constraint is the primary challenge for voice reconstruction.
Multiple Object Vibrations and Material Differences: In real environments, sound waves often induce micro-vibrations in multiple objects. The reflection signals from different materials have differences in amplitude, phase, and noise characteristics. Directly combining these signals can lead to speech aliasing and interference, degrading voice clarity and intelligibility. Therefore, effectively identifying, selecting, and fusing multi-source signals to enhance voice quality is a key issue that the system must address.
Noise Interference After Localization and Fusion: Even after target localization and multi-source fusion, micro-vibration signals are still masked by thermal noise, phase noise, and environmental clutter. If signal processing is not handled properly, the reconstructed speech can be distorted or unintelligible. Therefore, noise reduction strategies are needed to ensure the clarity and stability of the speech.
To address these challenges, this paper designs four core modules that together form a complete voice reconstruction process, focusing on localization, signal processing, fusion, and noise reduction.
To facilitate understanding of the overall processing flow and the relationships between the modules, we first present the system’s overall technical roadmap, as shown in Figure 2. This roadmap starts with millimeter-wave radar echo acquisition, followed by target localization, phase recovery, multi-source fusion, and speech noise reduction, ultimately achieving passive voice reconstruction.
Figure 2.
Overall Technical Pipeline and System Architecture.
As shown in Figure 2, the eavesdropping material localization module first determines the distance-angle unit of the potential vibration target in the spatial domain, which defines the search range for subsequent phase extraction. The high-quality signal processing module then performs fine phase recovery only on the localized targets, converting the radar echo into a time-series signal that can be used for speech reconstruction. Subsequently, the multi-vibration-source fusion module performs quality assessment and weighted fusion of the speech signals recovered from the different material surfaces. Finally, the speech denoising module conducts perception-level post-processing. This process ensures end-to-end processing of the system, from spatial localization to speech output.
It should be noted that the method proposed in this paper does not use deep learning models. The reason is that millimeter-wave passive speech eavesdropping is essentially a signal recovery problem based on physical modulation. The micro-vibrations generated by sound waves acting on an object’s surface result in continuous and observable phase modulation in the radar echo. This process has clear physical meaning and statistical characteristics, which can be explicitly modeled through refined signal processing methods. By utilizing spatial constraints, phase recovery, and multi-source signal optimization, this system can achieve stable, interpretable, and low-complexity passive speech reconstruction without the need for training data or complex models.
Based on the overall process described above, the specific functions of the four core modules are as follows:
Eavesdropping Material Localization Module: By examining the radar echo’s distance, angle, and target clustering patterns, this module first performs a rough localization of potential vibration sources. Only after this preliminary step does it apply the CZT (Chirp-Z Transform) [22] algorithm for precise positioning and phase extraction of candidate targets, thereby enabling accurate identification of material surfaces suitable for eavesdropping, even in complex environments.
High-Quality Signal Processing Module: Because vibration signals are often weak and susceptible to interference, this module incorporates mechanisms to suppress intrinsic radar noise and algorithms to stabilize the signal phase. As a result, both the signal resolution and energy contrast are enhanced, producing high-SNR data crucial for subsequent speech reconstruction.
Multi-Vibration-Source Fusion Module: When multiple targets are present, materials tend to respond to the same sound source in complementary ways. Leveraging this, the module employs adaptive SNR estimation along with weighted fusion strategies to select and integrate the highest-quality signals. By fully exploiting redundant information across multiple sources, it significantly improves the clarity and robustness of the reconstructed speech.
Speech Denoising Module: Background and thermal noise are inevitable in practical systems. To mitigate their impact, this module applies a spectral thresholding approach to the reconstructed speech. In doing so, it effectively suppresses low-energy noise components, enhancing both the intelligibility and perceived quality of the output.
Through the coordinated operation of these modules, the system is able to complete the entire process from vibration detection to speech reconstruction without the use of deep learning models, achieving low complexity and high reliability for millimeter-wave passive eavesdropping. Next, we will describe each module in detail.
4.1. Location of Eavesdropping Materials
The module seeks to identify potential eavesdroppers through the use of different signal processing methods and different vibration sources. The objects in real-world situations are shown in Figure 3. And the configurations of FMCW Signal are shown in Table 1.
Figure 3.
Experimental Settings.
Table 1.
Configurations of FMCW Signal.
The steps:
(1) Clutter Removal: In order to locate the distance-angle unit corresponding to the vibrating object and reduce the influence of static object reflections and direct leakage in the room, the system employs a clutter removal algorithm. This algorithm subtracts the effects of static clutter and direct leakage from the background. It is important to note that the reflections from static objects can reasonably be assumed to remain constant over a certain time period, while the reflections from vibrating objects change over time. The background profile can be estimated by averaging the Channel Impulse Response (CIR) over the slow time. The calibrated CIR can be represented as:
where represents the CIR before calibration, M indicates the number of samples used for clutter removal, represents the distance between target and radar, represents the angle, and represents the slow-tune sampling point. Figure 4 shows the effect of background clutter removal: Figure 4a displays the CIR before clutter removal, while Figure 4b shows the calibrated CIR after clutter removal. It can be observed that clutter removal significantly reduces background noise. However, this process cannot remove the influence of moving objects, so sounds from such objects cannot be recovered. Similarly, for objects that exhibit slight movement but are not completely stationary (such as a person who is breathing), this method cannot fully handle the scenario. We will discuss these situations in more detail during the adaptive target selection section.
Figure 4.
Range-Azimuth Map.
(2) Coarse Localization: Since the placement of objects in the room is random, the radar’s angle relative to the eavesdropped object is unknown. To solve this problem, we adopt a search-based approach to explore possible angles and select candidate body parts. After performing Range-FFT, we obtain a four-dimensional complex matrix Q of shape F × C × A × R, where F is the number of frames (set at 1000 Hz), C is the number of pulses per frame, A is the number of angular units, and R is the number of distance units. To maintain the Chirp rate, we set the number of angular units to 4. Meanwhile, we set the number of distance units R to 256, enabling detection of objects within a 10 m range. We then apply the Minimum Variance Distortionless Response (MVDR) algorithm [23] to obtain angle profiles for each distance unit. MVDR is a super-resolution algorithm that requires multiple Chirps to estimate angles. Therefore, we set each frame to contain 19 Chirps. The measurement results for each frame are shown in Figure 4b. As shown in Table 2, the MVDR beamformer is implemented with a snapshot length of 64 for covariance matrix estimation. A diagonal loading factor of 0.05 is applied to ensure numerical stability. The filter order is set to 32 to balance spatial resolution and noise robustness.
Table 2.
Configurations of MVDR.
(3) Adaptive Target Selection: To detect signals reflected by these objects, we apply the Constant False Alarm Rate (CFAR) detection method [24] to both the distance and angle profiles. The CFAR algorithm adapts by comparing the amplitude of adjacent distance-angle units, identifying the presence of objects in a noisy background. The results are shown in Figure 5a. However, CFAR cannot eliminate moving targets, so we cannot recover sounds from these targets. To solve this, we accumulate along the time dimension to obtain a dynamic spatial profile D:
where W is the result of the 2D-CFAR, D is a real-valued matrix of shape R × A, and F is the number of frames (also the number of times we apply 2D-CFAR). We then set values in D that are below a threshold to 0 (indicating no detected static vibration target), and set the remaining values to 1 (indicating detection of a target). The detailed configurations of 2D-CFAR and DBSCAN are listed in Table 3.
Figure 5.
Adaptive Target Localization and Recognition.
Table 3.
Configurations of CFAR and DBSCAN.
This method is based on the fact that the position of stationary vibration targets remains nearly unchanged, while large moving targets cannot remain at the same point for extended periods. Therefore, by accumulating the 2D-CFAR results along the time axis, we can diminish large moving targets in the radar field of view. Stationary but non-eavesdroppable targets (such as a human in a breathing state) will be discussed further in Section 4.3. Finally, we apply the DBScan algorithm [25] to obtain clusters of vibrating objects, which helps suppress noise around the targets. The number of clusters calculated by DBScan is considered the number of targets detected in the radar field of view, and the center of each cluster is used as a coarse localization estimate for the target. The precise vibration pattern of the target is then obtained through CZT.
4.2. High-Quality Signal Process
(1) Sampling Rate Enhancement: As described in Section 4.1, after performing Range-FFT, we obtain a four-dimensional complex matrix Q of shape (F, C, A, R). The MVDR algorithm is then used to estimate the angle. To achieve a higher Chirp rate for audio eavesdropping, we select the odd-numbered Chirps from the 19 Chirp signals, totaling 10, and expand them. This process generates a three-dimensional complex matrix of shape (F × C, A, R) with a sampling rate of 10,000 Hz, which is sufficient for audio eavesdropping.
(2) Precise Phase Extraction: After performing coarse localization on each vibrating object, we need to further extract its corresponding high-precision phase information to achieve accurate reconstruction of the micro-vibrations. Traditional methods often perform a Discrete Fourier Transform (DFT) on the Instantaneous Frequency (IF) signal to determine the position of the vibrating target. However, according to the Nyquist Sampling Theorem [26], the frequency resolution of DFT is limited by the sampling rate and the number of sampling points, with a frequency interval given by:
where N is the number of sampling points and is the sampling rate. When the number of sampling points is limited, it is difficult to meet the high-precision phase extraction requirements. In micro-vibration sensing scenarios, the target’s frequency variation is often concentrated within a narrow frequency band. Uniformly sampling the entire frequency spectrum not only introduces computational redundancy but also limits further improvement of frequency resolution. Therefore, it is necessary to perform finer spectral analysis within the target frequency band. The CZT is a frequency-variable resolution spectral analysis method. The core idea is to calculate the Z-transform along any logarithmic spiral path on the complex plane, thus achieving high-precision sampling for a specified frequency range. Unlike FFT, which performs uniform sampling across the entire frequency band, CZT focuses on the frequency range of interest, effectively reducing computational complexity while maintaining spectral precision.
The calculation formula for CZT is as follows:
where M is the number of sampling points of CZT; N is the total number of sampling points of the signal; = 0, 1, 2, …, N − 1; m = 0, 1, 2, …, M − 1; is the fast sampling frequency of the radar; is the starting frequency of the band; and is the specified bandwidth of CZT. When and , CZT degenerates to FFT. From the above formula, the frequency accuracy of CZT can be expressed as:
The CZT parameters in our system are shown in Table 4.
Table 4.
CZT Parameters.
The CZT parameters are configured as follows: The target is initially detected by a coarse FFT to determine its center frequency . The CZT is then performed within a small frequency interval [ − /2, + /2], where B corresponds to 12 FFT bins to achieve high-resolution range refinement. Therefore, the accuracy of CZT is , which is significantly higher than that of DFT, without incurring excessive computational overhead. Therefore, CZT can achieve more accurate frequency estimation and phase extraction, and is particularly suitable for tasks such as micro-vibration perception and audio signal restoration.
(3) Phase refinement. Since the range of the phase value is only within [0, 2π], there may be a phenomenon of phase “jumps”. To address this, we need to expand the phase, and the formula is as follows:
(4) “Click” Removal. During the radar data acquisition process, we found that the higher the Chirp rate, the more likely data loss (packet loss) occurs. Since we collect data at a 10 kHz Chirp rate, packet loss is quite common during data acquisition. When packet loss occurs, mmWave Studio fills all the samples of the missing Chirp with zeros, resulting in a “click” in the data. If we directly filter out the packet loss data, the “click” will still appear in the result, as shown in Figure 6. In mmEcho, the approach to handling this issue is to use a sliding average filter. However, this introduces an echo effect in the speech signal, and when the “click” value is large, the sliding average filter performs poorly.
Figure 6.
Before Click Removal.
To solve this problem, we rewrote the radar data acquisition process in Python 3.10.9 and set the anomalous values to . We marked all the indices where the phase is , as well as the indices of the previous and next Chirps, as anomalous indices (zero_indices), because packet loss can also cause data anomalies in these cases. Subsequently, before unwrapping the phase, the following algorithm is executed to identify points where the phase is 0 and fill them with the average signal of the surrounding four points, effectively eliminating the impact of such anomalous points. The effect is shown in Figure 7. And the pseudocode is as follows.
Figure 7.
After Click Removal.
Complexity Analysis:
Algorithm 1 iterates over each anomalous value in the input array exactly once. For each anomalous point, it performs a fixed set of constant-time operations: checking neighboring values, computing the arithmetic mean, and deciding whether to fill or remove the point.
| Algorithm 1: Arithmetic Mean Filling for Anomalous Values | |
| Input: Array arr, anomalous value indices zero_indices, anomalous value outlier_value | |
| Output: Array arr with anomalous values filled using the arithmetic mean | |
| 1. | Step 1: Iterate through the anomalous value indices zero_indices. |
| 2. | Extract the values to the left and right of the anomalous points (if the index is less than 0, take 0). |
| 3. | Step 2: Check if there are any anomalous values on both sides of the extracted values’ indices. |
| 4. | If there are, do not fill the value; instead, directly remove the anomalous point. |
| 5. | Step 3: Fill the anomalous points using the arithmetic mean of the surrounding values. |
| 6. | Return arr. |
As a result, the time complexity is O(K), where K is the number of anomalous values. In practical radar signal processing scenarios, where K is typically much smaller than the total number of samples N, the overall runtime is effectively O(N) (linear with respect to the input array length).
The space complexity is O(1) (constant) for in-place filling, as no additional large data structures are required. If anomalous points are removed and the array is reallocated, the space complexity becomes O(N).
Edge-Case Handling:
When multiple consecutive chirps are lost (a contiguous block of anomalies), these points are directly removed from the array. Given the 10,000 Hz sampling rate of the speech signal, the loss of several or even dozens of consecutive frames has a negligible impact on speech quality. This avoids introducing biased interpolated values and maintains the integrity of the clean signal.
(5) Phase Drift Removal. After the “click” processing stage, we applied a high-pass filter [27] to remove all components below 20 Hz, as these components are generally imperceptible to the human auditory system. However, during subjective listening tests of the reconstructed speech, noticeable high-frequency noise was still observed. To further analyze this phenomenon, we plotted the short-time Fourier transform (STFT) spectrogram of the speech signal, as shown in Figure 8a.
Figure 8.
Phase Drift Removal.
The results indicate that the reconstructed speech contains high-frequency modulation components around 1000 Hz. By further magnifying the details of each speech frame, we observe a periodic fluctuation formed by every 10 sampling points (i.e., the number of samples per frame), as illustrated in Figure 9. Moreover, within each frame, a fixed phase offset exists between each chirp and the first chirp of that frame.
Figure 9.
Signal details. (The blue line represents the phase signal.)
This phase offset originates from phase errors caused by different chirp transmission paths or clock delays during the radar signal unfolding process within each frame, and can be regarded as a systematic bias. Although the IWR1843 resets the phase at the beginning of each frame, the high sampling rate required in our practical eavesdropping scenario leads to insufficient inter-chirp intervals. As a result, hardware-level phase resetting is not performed between chirps across frames. To address this issue, we use the first chirp of each frame as a reference and apply differential phase correction to the remaining chirps. After this processing, the high-frequency harmonics in the speech signal are effectively suppressed, and the speech quality is significantly improved, as shown in Figure 8b.
4.3. Multi-Vibration-Source Fusion
Signals collected from multiple materials exhibit the following characteristics:
Complementarity: Different materials have distinct frequency responses and reflection efficiencies. Some materials perform better in certain frequency bands, while others provide higher signal quality in different bands.
Independence: The noise components of signals from different materials are relatively independent. Fusing these signals can therefore improve the overall signal-to-noise ratio (SNR).
As a result, multi-source fusion not only integrates the advantages of individual signals and reduces single-source distortion, but also provides a theoretical basis for lightweight processing. Specifically, the system only needs to retain the fused speech information rather than storing all original signals, thereby reducing storage and computational costs.
In Section 4.1 and Section 4.2, we have obtained high-quality signals from individual vibration sources. Due to differences in physical properties, orientations, and reflection conditions among materials, the speech information carried by each signal varies in quality. Direct superposition may lead to signal aliasing or noise amplification, thus degrading speech reconstruction performance. To fully exploit the complementarity of multi-source signals while ensuring real-time performance and lightweight deployment on edge devices, we propose an adaptive multi-vibration-source fusion strategy.
(1) Signal Quality Assessment
The signal-to-noise ratio (SNR) is a commonly used metric for evaluating signal quality, defined as the ratio of signal power to noise power. In this study, the SNR is computed through the following steps:
First, speech and noise segments are accurately distinguished by jointly considering spectral flatness, zero-crossing rate (ZCR) [28], and short-time energy.
Next, the total signal power is calculated as the average of the squared values of all signal samples. Finally, the SNR is computed in logarithmic form (in dB) as the ratio of signal power to noise power. The corresponding pseudocode is below.
Complexity Analysis:
The time complexity of Algorithm 2 is O(N), where N is the number of samples in the input signal. This is dominated by iterating over all samples to compute the total signal energy and subsequent frame-based energy analysis. The space complexity is O(1), as only constant additional memory is required.
| Algorithm 2: SNR Estimation | |
| Input: Signal, sampling_rate, frame_size, hop_size | |
| Output: SNR | |
| 1. | Step 1: Compute the frame length and hop length. |
| 2. | Multiply the sampling rate sr by frame_size to obtain the frame length. |
| 3. | Multiply the sampling rate sr by hop_size to obtain the hop length. |
| 4. | Step 2: Compute as the total signal energy. |
| 5. | Treat the lowest 20% of the total energy as noise, and compute the corresponding noise energy and signal energy. |
| 6. | Step 3: Compute the SNR according to Equation (19). |
| 7. | Return the SNR value. |
(2) Weak Signal Rejection. Before fusing all signals, weak signals should be discarded. We remove all signals with an SNR lower than 5.5 dB. This threshold corresponds to the SNR measured directly at a distance of 1 m from the loudspeaker, and such signals are considered too weak to be clearly audible.
This strategy can effectively filter out incorrectly selected targets caused by human respiration. Since a high-pass filter has already been applied to retain only components above 20 Hz, and human respiration and heart rates are well below 20 Hz, signals obtained from incorrect targets exhibit very low SNR values. This makes them easy to distinguish from valid eavesdropping signals.
(3) Optimal Signal Fusion
After acquiring speech signals from different eavesdropping materials, we observe that simply summing them does not significantly improve signal quality. The signal fusion problem can be elegantly formulated as a weighted sum:
where denotes the fused signal, denotes the signals obtained from different eavesdropping materials, and represents the fusion weights to be optimized.
For unconstrained or constrained continuous optimization problems of this type, the BFGS (Broyden–Fletcher–Goldfarb–Shanno) [29] algorithm provides an efficient and stable solution method. BFGS is a quasi-Newton method that achieves fast convergence by iteratively updating the inverse approximation of the Hessian matrix, without the need to compute the full second-order derivatives.
This study compares the performance of various common linear fusion algorithms, nonlinear fusion algorithms, and iterative methods. The results show that the BFGS method performs best in optimizing signal quality. It not only achieves superior results in objective metrics such as MCD and WER, but also maintains high stability and precision across experiments with signals at various signal-to-noise ratios. Therefore, it is selected as the final fusion strategy for this system. Specific performance comparison results and analysis are detailed in Section 5.3.6.
4.4. Noise Reduction
After the above signal processing, only low-frequency noise and static thermal noise inherent to the radar’s electronic components remain. To eliminate low-frequency noise, we use a high-pass filter that retains components above 20 Hz (since these low-frequency components are inaudible to the human ear). Then, we apply the spectral thresholding method [30] to suppress the radar’s thermal noise.
5. Experiments
5.1. Experimental Setup
We implemented the proposed system on a commercial off-the-shelf (COTS) millimeter-wave radar system, which consists of the evaluation module iWR1843BOOST and the real-time acquisition card DCA1000EVM. We enabled one transmit antenna and four receive antennas. We first tested the system in a single-target scenario. As shown in Figure 10, the speaker was fixed 1 m away from the target, and the radar was placed at various locations. Subsequently, we tested the performance of the fusion algorithm in a multi-target scenario, with the experimental setup shown in Figure 3. The collected data was transferred to a Lenovo Y7000P laptop, equipped with an Intel Core i7 CPU and 16 GB of memory. The raw data was processed using Python.
Figure 10.
Single-Target Scenario.
In this study, we used the EARS open-source dataset [31], which includes 7 different styles of speech, with speakers ranging from 17 to 75 years old. For each participant, we selected 21 sentences, with a total of 4 speakers. This resulted in 84 sentences for each scenario, used to evaluate system performance.
Since the proposed method is based on traditional signal processing without deep learning, no training, validation, or test split is employed. All experiments are evaluated on the EARS dataset with 4 speakers and 84 sentences per scenario. The same sentences are used across all distances and materials for fair comparison. Each condition is repeated 5 times independently, and results are reported as the mean and standard deviation across runs and speakers. For WER computation, the pre-trained Whisper-large model is used with default settings (English language, no fine-tuning) to transcribe the reconstructed speech, and WER is calculated against the ground-truth transcripts.
5.2. Evaluation Metrics
Although MCD and WER were proposed as evaluation metrics in the early speech processing field, recent works like mmEcho, mmWave-Whisper, and mmHSE continue to use these metrics, indicating their widespread adoption in radar channel speech recovery. In this paper, we use MCD and WER to evaluate speech recovery performance. Below, we introduce these metrics.
MCD [32] is a distance metric based on Mel-cepstral coefficients (MCC), which reflects the difference between two speech signals in the Mel-cepstral feature space. Its calculation requires reference and synthesized speech. The formula for MCD is as follows:
where and are the MFCC features of the reference and synthesized speech of and [33], and and represent the frame and dimension of MFCC. Smaller MCD values are better, and when MCD is below 8, we consider the speech to be recognizable.
Word Error Rate (WER) [34] is a commonly used metric to measure the performance of semantic recognition systems, calculated as follows:
where D is the number of deleted words, I is the number of inserted words, S is the number of substituted words, and is the total number of words. We use OpenAI’s Whisper [35] to convert the reconstructed speech to text and compute the WER. Lower WER values indicate better performance. Whisper Parameters we used are shown in Table 5.
Table 5.
Whisper Parameters.
5.3. Experimental Results and Analysis
5.3.1. Stability Across Speakers and Utterances
In practical speech scenarios, the system must maintain consistent performance across diverse speakers and speech content, regardless of individual differences in voice characteristics or utterance variations. To evaluate this stability, we conducted a comprehensive analysis under our primary experimental condition (0° azimuth, 1 m distance), involving 4 speakers (2 male, 2 female) and 21 utterances per speaker. The corresponding distribution results are illustrated in Figure 11 and Figure 12. In these box plots, the circles represent outlier data points, indicating values that fall outside the typical range of the measured distribution.
Figure 11.
Distribution across 4 speakers (2 male, 2 female).
Figure 12.
Distribution across 21 utterances.
The findings show that, across all tested speakers and utterances, the system exhibits strong robustness in both speech quality (MCD) and recognition accuracy (WER). For speaker-wise analysis, the MCD values remain tightly clustered around 2.9–3.2, with WER values consistently within 9.0–10.5%, demonstrating minimal performance degradation across different genders and voice characteristics. As illustrated in Figure 11, which presents the distribution across 4 speakers (2 male, 2 female), the metrics remain stable and compact without significant gender-dependent bias. For utterance-wise analysis, the MCD and WER distributions remain stable around their respective mean values (≈3.1 for MCD, ≈10% for WER), with only minor fluctuations observed across different speech content, indicating insensitivity to variations in sentence structure, speaking rate, and intonation. As shown in Figure 12, which depicts the distribution across 21 utterances, the variations across different textual content are negligible, further validating the system’s robustness to linguistic and prosodic differences.
In the current experimental setup, we focused on a controlled 0°/1 m configuration to isolate and validate the system’s core stability, ensuring that the impact of speaker and utterance variability could be accurately quantified. This setup allowed us to confirm that the proposed method maintains reliable performance even when faced with natural variations in human speech. We acknowledge that real-world environments may introduce additional factors such as background noise and reverberation; however, the consistent performance observed in our controlled tests provides a strong foundation for extending the system to more complex scenarios.
For real-world deployment, the system’s inherent stability across speakers and utterances would directly translate to improved usability and reliability, as it can adapt to diverse users and speech inputs without significant performance loss. While our current evaluation focuses on a limited set of speakers and utterances, the consistent trends observed in the boxplot distributions suggest that the method is well-suited to handle the variability inherent in practical speech applications.
5.3.2. Effect of Distance and Angle
In practical applications, the relative position of the object to the radar—whether in terms of distance or angle—can vary significantly. This variability must therefore be taken into account when analyzing and evaluating system performance. In our study, we set the distance between the speaker and the reflector at 1 m, while the radar-to-reflector distance was adjusted between 0.5 m and 4 m, and the angles ranged from 0° to 60°. The corresponding experimental results are illustrated in Figure 13 and Figure 14.
Figure 13.
Effect of Different Distances.
Figure 14.
Effect of Different Angles.
Statistical significance was evaluated using two-tailed independent-samples t-tests, with 0.5 m as the baseline for distance and 0° as the baseline for angle. Significance markers are defined as: * p < 0.05, ** p < 0.01, *** p < 0.001, n.s. = not significant.
The findings show that, within a distance range of 0.5 to 3 m and angles up to 45°, the system exhibits strong robustness in recovery performance. Performance differences in these ranges are either non-significant or only weakly significant, confirming stable operation. Additionally, the recovery performance is positively correlated with the distance between the sound source and the reflector. However, when the distance exceeds 4 m or the angle goes beyond 60°, there is a noticeable deterioration in performance, as shown in Figure 13 and Figure 14. These degradations are statistically significant at the * p < 0.001 level, verifying the reliability of the observed trend. In the current experimental setup, the distance between the audio source and the radar was kept relatively short (1 m) to validate the system’s basic feasibility using commercial radar. This controlled environment helped minimize the influence of external variables, ensuring that the core performance of the system could be accurately assessed. However, we acknowledge that in practical applications, the distance between the radar and the audio source is typically larger, which may result in variations in signal strength.
For real-world deployment, radar systems would generally offer higher signal strength, which would help ensure that the recovery performance remains robust over longer distances. While the present experimental setup demonstrated the system’s performance within a limited range, commercial radars with greater signal power would allow for reliable system operation over larger distances. Therefore, the system’s performance in practical scenarios would likely benefit from this enhanced signal strength, leading to improved recovery accuracy and robustness.
5.3.3. Effect of Volume
The volume of the sound source is a key factor influencing the amplitude of the reflector, which consequently impacts the signal-to-noise ratio (SNR) of the received signal. In order to evaluate the system’s response to different sound intensities, we conducted tests within a range of 65 dB to 80 dB, covering typical conversational and loud speech volumes.
Statistical testing was performed using two-tailed independent-samples t-tests with 80 dB as the baseline. Significance levels follow: * p < 0.05, ** p < 0.01, *** p < 0.001, n.s. = not significant.
As shown in Figure 15, when the volume exceeds 65 dB, the system maintains a recovery performance within acceptable levels, thereby demonstrating its ability to effectively process medium to high volume sounds. Performance at 70 dB and 75 dB shows no statistically significant difference from 80 dB, indicating high robustness. However, should the volume decrease, weaker reflections and a reduced SNR are often observed, which can undermine the system’s capability to accurately recover and process the signal. At 65 dB, performance degradation becomes highly significant (* p < 0.001) compared to the 80 dB baseline.
Figure 15.
Effect of Volumes.
5.3.4. Effect of Reflective Material
Different reflective surfaces respond in distinct ways to sound waves and millimeter-wave signals, which consequently shape their capacity to reflect and amplify vibrations. To guarantee consistency and impartiality across the experiments, we selected three readily accessible materials as reflectors within a multi-target arrangement, meticulously maintaining comparable dimensions and positioning. Each reflector was situated roughly one meter from both the radar and the speaker, aligned coplanar with the radar.
Statistical comparisons were conducted using two-tailed independent-samples t-tests with Tinfoil as the baseline. Significance is denoted as: * p < 0.05, ** p < 0.01, *** p < 0.001, n.s. = not significant.
The chosen aluminum foil measured 20 μm in thickness and 20 cm in width. It was precisely trimmed and mounted onto a 20 × 20 cm plastic frame to preserve its flatness and steadiness. The findings demonstrated that aluminum foil surpassed the others, generating reflected sound waves of the greatest amplitude and affording the most intelligible speech recovery. This advantage is statistically significant at the * p < 0.001 level compared with both Chipbag and Cardboard. This superiority stems principally from its sleek, unbroken metallic surface, which exhibits pronounced reflectivity for both acoustic and electromagnetic waves, thereby curbing energy dissipation while strengthening the returning signals.
By contrast, the utilized potato chip bag was a commercially procured 70 g package composed of a layered material integrating metallized film and plastic. Although the bag manifested certain reflective characteristics, its conspicuous creases and textural features precipitated marginally inferior speech recovery relative to the foil. The difference between Chipbag and Tinfoil is significant at the p < 0.01 level. This outcome can plausibly be ascribed to surface imperfections and the material’s somewhat porous makeup, which induced heightened scattering phenomena and compromised the uniformity of the reflected sound wave’s phase and amplitude.
The cardboard employed for testing possessed a 6 mm thickness and was sheared to a 20 × 20 cm format to correspond with the other reflectors. Nevertheless, its coarse, unyielding surface yielded the least favorable performance. Cardboard shows the most significant performance gap relative to Tinfoil (* p < 0.001). The irregular constitution of the cardboard prompted substantial diffraction and dispersion of sound waves, diminishing both the reflection strength and the fidelity of the retrieved speech signal.
In summary, attributes such as surface polish, material homogeneity, and reflective efficiency prove pivotal in governing reflector performance for speech recovery. Among all examined materials, the sleek metallic surface of the aluminum foil furnished the optimal outcomes within this experimental configuration, as illustrated in Figure 16.
Figure 16.
Effect of Different Reflective Materials.
5.3.5. Effect of Denoising Algorithms
To obtain the best denoising performance, we extensively tested and compared several common denoising methods across different distances, including Wiener Filtering [36], Wavelet Transform [37], Subtraction [38], and Spectral Thresholding [39]. Below are the STFT spectrograms of signals denoised using different algorithms, with the sound source 1 m from the test object. The comparison results are shown in Figure 17.
Figure 17.
STFT Plots of Different Denoising Algorithms.
Our tests revealed distinct characteristics among the denoising methods. The subtraction approach notably suppressed noise in the lower frequency bands while preserving signal clarity, though it introduced noticeable distortion and residual noise near the signal edges. Wiener filtering handled stationary noise reliably, maintaining core signal components well. However, while it effectively reduced low-frequency noise, it allowed more high-frequency noise to remain. Wavelet denoising operates by breaking down the signal into multiple scale-dependent components, attenuating noise at each level. Both wavelet denoising and spectral thresholding managed to clean the signal without significant loss, particularly preserving finer details in the higher frequency range.
We further examined how these methods performed under varying distance conditions. When the signal source was closer (resulting in a higher signal-to-noise ratio), the differences between methods were marginal—both MCD and WER metrics came out similar. This is largely because the original signal was already clear, leaving little room for denoising to make a marked improvement. As distance increased and noise became more prominent, each technique responded differently. Wiener filtering and wavelet transforms delivered comparable outcomes across the board, consistently lowering distortion and error rates. Their lower MCD and WER scores confirmed a solid capacity for noise suppression.
The subtraction method worked adequately at moderate distances but faltered in longer-range scenarios, suggesting it may lack adaptability in high-noise settings. In contrast, spectral thresholding remained effective across most conditions, excelling especially in long-distance recovery. Overall, spectral thresholding demonstrated the most stable performance, keeping MCD and WER consistently low even as the distance extended. The results are shown in Figure 18.
Figure 18.
Effect of Different Denoising Algorithms.
5.3.6. Performance Comparison with Baseline Work
It is important to note that although numerous millimeter-wave speech eavesdropping studies emerged in recent years (2024–2025) [15,16,17,18,19,20,21], most of these works focus on specific targets (such as headphones or head-mounted devices) or adopt different experimental setups and attack assumptions, making direct quantitative performance comparison in a fully consistent general reflective scenario difficult. Therefore, we selected mmEcho as the most representative baseline method for general passive millimeter-wave speech eavesdropping for comparison and analysis.
To evaluate the benefits of the proposed system, we examined how distance affected speech recovery performance, keeping the experimental setup consistent with that of mmEcho. The reflector material was aluminum foil, the angle was fixed at 0°, and the sound source was set to 70 dB. We used MCD and WER to measure performance (see Table 6). The results indicated that as the distance increased, mmEcho’s performance dropped noticeably, while the proposed system showed consistently low MCD and WER, suggesting it remains highly robust and effective in speech recovery across different distances.
Table 6.
Performance Comparison.
The mmEcho baseline is re-implemented based on the original publication and evaluated under identical experimental conditions for a fair comparison.
5.3.7. Effect of Number of Targets
The experiments introduced earlier were based on a single-target scenario. Next, we tested the multi-target fusion module. In our system, any object in the scene capable of reflecting sound will be adaptively detected, capturing multiple eavesdropped speech signals with different noise distributions. These signals will then be fused to obtain higher-quality speech. To evaluate the fusion performance, we conducted experiments by controlling the number of targets, as shown in the setup in Figure 3b. The microphone was placed 1.75 m from the radar, and then potato chip bags, aluminum foil, and cardboard were placed at the following relative positions to the radar: ① 0.5 m, 50°; ② 0.75 m, −25°; ③ 1 m, 25°. Eavesdropped speech signals were collected from these three locations.
Subsequently, we fused the signals from ① and ②, ① and ③, and ② and ③, and finally fused the signals from all three positions. We calculated the average SNR, average MCD, and WER in these different scenarios, and the results are shown in Figure 19 and Figure 20. Based on the performance of cases 1 & 2, 1 & 3, and 2 & 3, we conclude that the quality of the source speech signal plays a key role in determining the degree of improvement. High-quality source signals provide more reliable and distinct features during the fusion process, enhancing the improvement effect. In contrast, if the eavesdropped signal quality is poor, the fusion effect may be limited by the propagation of noise or distortion. However, from combination of 1 & 2 & 3, we can see that the more targets involved, the better the performance.
Figure 19.
Performance of Fusing Different Targets.
Figure 20.
Performance Comparison of Different Fusion Algorithms.
5.3.8. Effect of Fusion Algorithms
Section 5.3.6 showed that fusing multiple eavesdropping targets can effectively improve performance. To obtain the best fusion effect, we compared eight typical fusion methods, including traditional weighting methods, namely, Energy Weighting [40], SNR-based Weighting [41], Weighted Median Fusion [42], Fuzzy Logic Weighting [43], and Cross-correlation-based Weighting [44], as well as iterative algorithms: Newton’s Method, BFGS algorithm, and L-BFGS-B algorithm [45]. The experiment evaluated speech quality (SNR, MCD), recognition accuracy (WER), and computational efficiency across three dimensions, with the results presented as follows.
In terms of SNR improvement (Figure 21), both BFGS and L-BFGS-B algorithms demonstrated optimal performance, with average SNR reaching 18.4 dB, significantly higher than those obtained by traditional weighting methods. This result verifies the advantages of quasi-Newton methods (BFGS/L-BFGS-B) in noise suppression and signal enhancement, where the core benefit lies in adaptively optimizing the weights by dynamically updating the inverse Hessian matrix.
Figure 21.
Performance Comparison of Different Iterative Methods.
The parameter configurations for these iterative optimizers are listed in Table 6. The convergence tolerances and iteration limits are set to balance optimization precision and computational efficiency: stricter thresholds for Newton’s method ensure higher accuracy at the cost of longer runtime, while BFGS and L-BFGS-B use moderate settings to maintain competitive performance with faster convergence. The limited memory size in L-BFGS-B is chosen to reduce memory overhead without sacrificing optimization stability.
It is noteworthy that since the iteration weight coefficients of BFGS and L-BFGS-B converge closely (less than 1% difference), computational efficiency becomes the key distinguishing factor. As summarized in Table 7 and validated by the experiment in Figure 20, in a 1000-run multi-target signal fusion task, BFGS only took 9.10 s, 29.3% faster than L-BFGS-B (12.85 s). This difference arises from: 1. Small-scale problem characteristics: When the fusion weight dimension is small (n < 4), BFGS directly calculates the dense inverse Hessian matrix more efficiently than L-BFGS-B’s limited memory management.
Table 7.
Parameter Configurations of BFGS, L-BFGS-B, and Newton Method.
2. Boundary constraint overhead: L-BFGS-B requires additional processing for non-negative weight constraints, increasing iteration costs.
Thus, BFGS is better suited for real-time or large-scale speech eavesdropping scenarios in terms of both accuracy and speed.
Figure 22 and Figure 23 compare the performance of different fusion algorithms on both MCD and WER: BFGS achieves the best performance in both metrics: 2.62 (23.2% lower than the second best) and 5.5% (80.8% higher than traditional energy weighting). This is clearly the benefit of BFGS weight optimization. On one hand, it ensures preservation of the spectral features of the speech signal (low MCD) by adjusting fusion weights, and on the other hand, it effectively detects the speech content (low WER). In particular, BFGS is stable on different test problems (standard deviation p < 0.15) and thus is reliable in real-world applications.
Figure 22.
Comparison of SNR Performance for Different Fusion Algorithms.
Figure 23.
Comparison of WER Performance for Different Fusion Algorithms.
From the above experimental results, we conclude that the BFGS algorithm is the optimal choice. Among the eight fusion algorithms compared, BFGS achieves the best balance of performance, efficiency, and stability. It delivers optimal results in key speech quality metrics (SNR, MCD) and speech intelligibility metrics (WER) (Figure 21, Figure 22 and Figure 23), and its computational time is significantly shorter than L-BFGS-B, which is also an iterative algorithm, showcasing greater real-time processing potential (Figure 22).
Implications for system design: This study provides clear guidance for selecting the fusion algorithm for the signal fusion module in eavesdropping localization systems. We recommend using the BFGS algorithm as the core fusion method. For edge devices with extremely limited computational resources, a slight performance loss may be acceptable, and weighted median fusion could be considered as a suboptimal solution, as it exhibits relatively good robustness among traditional methods (as shown in Figure 23 with moderate MCD values).
5.4. Ablation Study
To further validate the effectiveness of each core module in the proposed method, we conducted a comprehensive ablation study based on the strict control variable principle (i.e., only one module is removed at a time from the complete proposed method, and other conditions remain unchanged). This ensures that the performance difference is solely caused by the removal of the target module, making the experimental results more reliable. The ablation study focuses on five key modules: Chirp-Z Transform (CZT), click removal, phase drift correction, spectral gating method, and BFGS fusion. We evaluated the system performance using MCD and WER as the evaluation metrics. All experiments were carried out under the primary experimental configuration (0° azimuth, 1 m distance) with 4 speakers (2 male, 2 female) and 21 utterances per speaker. The corresponding experimental results are illustrated in Figure 24 and Figure 25.
Figure 24.
MCD distribution of ablation groups. (Circles in the box plots represent outlier data points.)
Figure 25.
WER Distribution of Ablation Groups.
5.4.1. Ablation Study Design (Strict Control Variable Principle: Only Single-Module Ablation)
The ablation study strictly adopts the “control variable method” with only single-module ablation operations: we first establish the complete proposed method (PM) as the baseline (containing all five key modules). Then, we remove only one module at a time from the complete method, while keeping all other experimental conditions (e.g., speaker, utterance, distance) unchanged. This design ensures that the performance degradation is directly attributed to the removal of the target module, fully complying with the requirement of only removing one module. The specific ablation groups are set as follows (all groups are based on the complete proposed method, and only one module is removed each time):
- -
- Proposed Method (PM, Baseline): Use the complete model containing all five key modules: CZT, click removal, phase drift correction, spectral gating, and BFGS fusion (serving as the reference baseline for all ablation experiments).
- -
- PM-CZT (Group A): Remove only the Chirp-Z Transform (CZT) module from the complete proposed method (all four other modules remain) to verify the impact of CZT on the system performance.
- -
- PM-Click Removal (Group B): Remove only the click removal module from the complete proposed method (all four other modules remain) to verify the impact of click removal on the system performance.
- -
- PM-Phase Drift Correction (Group C): Remove only the phase drift correction module from the complete proposed method (all four other modules remain) to verify the impact of phase drift correction on the system performance.
- -
- PM-Spectral Gating (Group D): Remove only the spectral gating method from the complete proposed method (all four other modules remain) to verify the impact of spectral gating on the system performance.
- -
- PM-BFGS Fusion (Group E): Remove only the BFGS fusion module from the complete proposed method (all four other modules remain) to verify the impact of BFGS fusion on the system performance.
This design strictly focuses on single-module ablation: i.e., all operations remove only one module at a time based on the complete proposed method. Each group only differs in one module, ensuring that the performance change is solely caused by the removal of the target module, making the ablation results more rigorous and reliable.
5.4.2. Ablation Study Results and Analysis
Figure 24 and Figure 25 show the MCD and WER results of all ablation groups. The key findings based on the single-module ablation control variable design are summarized as follows.
Among the five modules, CZT and spectral gating have the most significant impact on performance when removed. As observed from the boxplots, removing CZT or spectral gating leads to obvious performance degradation, while removing click removal, phase drift correction, or BFGS fusion results in relatively milder changes.
To further validate the effectiveness of the key design choices, we provide a short ablation comparison in Table 8, where we try to: replace CZT with standard FFT, omit phase drift correction, and replace BFGS fusion with simple SNR weighting.
Table 8.
Ablation study on key component replacements.
All alternative settings lead to clear performance drops compared with the proposed method, which confirms the superiority of CZT over conventional FFT, the necessity of phase drift correction, and the advantage of BFGS fusion over naive SNR weighting.
5.4.3. Summary
Based on the strict control variable principle with single-module ablation operations, the ablation study clearly verifies the effectiveness of each core module. Each module plays a unique role: CZT improves frequency resolution, click removal eliminates impulsive noise, phase drift correction compensates for signal distortion, spectral gating suppresses residual noise, and BFGS fusion optimizes multi-module integration. As shown in the boxplots, CZT and spectral gating have the most significant impact on system performance—removing either module leads to obvious deviation of the boxplot from the baseline. In contrast, the impact of click removal and phase drift correction is relatively mild, and the boxplots of PM-CZT and PM-Click Removal are highly similar, showing comparable degrees of influence. The complete proposed method (with all five modules) achieves the best performance, and its boxplot is the most stable and closest to the optimal performance range. Removing any single module leads to varying degrees of performance degradation, which confirms the necessity and rationality of each module in the proposed framework. This single-module ablation design also ensures the rigor and reliability of the experimental results, providing a solid basis for the practical application of the system.
5.5. Robustness to Noisy Scenarios
(Preliminary Results)
To demonstrate the robustness of the proposed method beyond clean speech, we evaluate its performance under two distinct noisy scenarios: 60 dB white noise (non-speech interference) and 60 dB background babble (multi-talker speech interference), with results broken down by speech level (65–80 dB). As validated in Table 9, under the 60 dB white noise scenario, the MCD and WER values only increase slightly compared with the clean baseline across all speech levels. This mild degradation indicates that the proposed method maintains reliable speech recovery performance against non-speech background interference, exhibiting strong robustness to additive noise. In contrast, under the 60 dB background babble scenario, the performance degradation becomes more pronounced. As detailed in Table 9, the MCD and WER rise significantly, especially at lower speech levels (65–70 dB). This more notable drop is mainly due to the lexical content in babble noise, which introduces extraneous speech fragments that interfere with the target utterance and lead to overestimated performance metrics.
Table 9.
Robustness evaluation under noisy scenarios (MCD and WER breakdown by speech level).
Note: These results for multi-talker speech interference are considered preliminary, as conventional signal processing approaches face fundamental limitations in addressing the cocktail party effect (i.e., separating overlapping speech from multiple talkers). Further improvements in multi-speaker recovery will be explored in our follow-up work using deep learning-based speech separation techniques.
Despite this, the proposed method still preserves consistent relative performance trends across all speech levels, demonstrating its capability to operate in realistic, speech-contaminated environments.
6. Ethics Considerations
Passive acoustic eavesdropping via millimeter-wave radar is a dual-use technology, so we explicitly address its ethical implications and mitigation strategies here, including concrete detection signatures, technical countermeasures, and governance recommendations for responsible use.
6.1. Privacy Risks and Misuse
The proposed method can recover speech from subtle vibration signals without physical contact or visible indicators, which poses significant privacy risks if misused—such as unauthorized eavesdropping in private spaces (homes, offices, vehicles) and violations of personal communication privacy. This research is strictly limited to academic exploration and legitimate public-security scenarios, and any unethical or illegal application is firmly opposed.
6.2. Concrete Detection Signatures
To enable identification of potential misuse, we summarize typical physical and signal-domain signatures of millimeter-wave speech-eavesdropping systems.
Characteristic frequency-swept FMCW waveforms in the 24 GHz/77 GHz industrial, scientific, and medical (ISM) bands. Periodic pulse patterns and consistent frame repetition rates are used for vibration estimation. High-sensitivity phase-demodulation structures target subtle surface vibrations. Narrowband spectral peaks correspond to human voice fundamental frequencies (80–300 Hz) and formant structures. High chirp rates: Unlike ordinary vehicle-mounted radars or medical radars (e.g., for breathing and heartbeat detection) that only require low to moderate chirp rates, radar systems for speech eavesdropping rely on significantly higher chirp rates to capture the subtle, high-frequency vibrations induced by speech, which is a distinct signature for identification. These signatures can be used by monitoring systems to detect and localize unauthorized radar-based eavesdropping devices.
6.3. Technical Countermeasures
To protect against passive speech recovery from millimeter-wave radar, we propose practical defensive countermeasures.
High-frequency detection and identification: Deploy spectrum monitoring devices to detect and distinguish radar signals with abnormally high chirp rates—since ordinary vehicle-mounted radars (for collision avoidance) and medical radars (for vital sign monitoring) do not require such high chirp rates, this can effectively screen out potential eavesdropping devices.
Acoustic–physical isolation: Use sound-absorbing materials and vibration-damping surfaces to weaken mechanical vibrations induced by speech.
Active interference: Emit low-power, wideband noise in the ISM band to disrupt phase-coherent demodulation of FMCW signals.
Environmental masking: Introduce controlled ambient vibration or white noise to reduce the signal-to-noise ratio of speech-related vibration components.
Detection and alerting: Deploy spectrum sensors to identify suspicious FMCW signals matching the aforementioned signatures (especially high chirp rates).
6.4. Data and Code Governance
To promote responsible and transparent research, we recommend the following governance principles for dual-use sensing technologies:
Data minimization: Collect, process, and retain only the minimum data necessary for algorithm validation; avoid storing full speech recordings.
Access control: Restrict dataset and code access to authorized researchers only, with usage logs and traceability.
Anonymization: Remove or encrypt any identifiable information from experimental data to prevent privacy leakage.
Openness with constraints: Publish core algorithms and evaluation pipelines while avoiding distribution of fully optimized end-to-end eavesdropping tools that could be easily misused.
Community norms: Establish shared academic guidelines for dual-use radar sensing, including ethical review before public release.
6.5. Overall Ethical Commitment
All experiments comply with relevant privacy laws and research ethics (e.g., GDPR, national data protection acts). We strictly restrict this technology to legitimate, authorized applications and oppose any malicious or unauthorized use. This work adheres to the principle of “technology for good” and is conducted entirely within legal and ethical frameworks.
7. Conclusions
This paper presents a lightweight, adaptive passive eavesdropping method based on millimeter-wave radar, which can perform speech reconstruction without deep learning and is capable of real-time processing. In addition, the system can adaptively identify eavesdropping targets and fuse speech signals when multiple targets are detected to achieve higher-quality output. Meanwhile, we designed a series of denoising algorithms, which not only further enhance signal quality but also ensure that the system can be efficiently deployed and run on edge devices. Experimental results demonstrate that this method performs well under various conditions.
In future work, we will further explore how to improve the physical accuracy of speech reconstruction. The current method approximates object vibration as sound signals, but the two are not fully equivalent in physical mechanisms. If we can establish an exact functional relationship between vibration and sound, it may significantly improve the reconstruction quality. Specifically, we plan to study how to actively excite target objects using known audio signals (such as ultrasonic frequencies) and combine echo analysis to estimate material parameters (e.g., Young’s modulus, density, etc.) in real time. This will allow for more accurate modeling of the vibration-sound mapping relationship. This approach holds the potential to achieve adaptive parameter estimation without prior material parameters, further enhancing the system’s eavesdropping performance and applicability in complex scenarios.
Additionally, this paper did not introduce noise into the dataset’s speech, instead simulating clean human speech for eavesdropping. Therefore, it is not applicable to scenarios such as multiple people speaking simultaneously in a cocktail party environment or in noisy scenarios, nor has it been tested with moving reflectors. In the future, we will conduct experiments in these challenging conditions:
- We will introduce cocktail-party scenarios with multiple simultaneous speakers and realistic background noise to evaluate the system’s robustness.
- We will fine-tune deep learning speech separation models originally designed for acoustic microphone signals to adapt to radar-derived speech signals, enabling better separation of overlapping speech and noise suppression.
- We will also test the system’s performance with moving reflectors to quantify its resilience to dynamic target conditions.
Author Contributions
Conceptualization, M.J. and Z.L.; methodology, M.J.; software, M.J.; validation, M.J., Z.L. and G.L.; formal analysis, M.J.; investigation, M.J.; resources, Z.L.; data curation, M.J. and G.L.; writing—original draft preparation, M.J.; writing—review and editing, M.J., Z.L. and G.L.; visualization, M.J.; supervision, Z.L.; project administration, Z.L.; funding acquisition, Z.L. All authors have read and agreed to the published version of the manuscript.
Funding
This research received no external funding.
Institutional Review Board Statement
Not applicable.
Informed Consent Statement
Not applicable.
Data Availability Statement
The data used to support the findings of this study are included within the article. Additional data can be obtained from the corresponding author upon reasonable request.
Conflicts of Interest
The authors declare no conflict of interest.
References
- Davis, A.; Rubinstein, M.; Wadhwa, N.; Mysore, G.J.; Durand, F.; Freeman, W.T. The visual microphone: Passive recovery of sound from video. ACM Trans. Graph. 2014, 33, 79. [Google Scholar] [CrossRef] [Scilit]
- Muscatell, R.P. Laser microphone. J. Acoust. Soc. Am. 1984, 76, 1284. [Google Scholar] [CrossRef] [Scilit]
- Wang, G.; Zou, Y.; Zhou, Z.; Wu, K.; Ni, L.M. We can hear you with Wi-Fi! In Proceedings of the 20th Annual International Conference on Mobile Computing and Networking; Association for Computing Machinery: New York, NY, USA, 2014; pp. 593–604. [Google Scholar] [CrossRef] [Scilit]
- Wei, T.; Wang, S.; Zhou, A.; Zhang, X. Acoustic eavesdropping through wireless vibrometry. In Proceedings of the 21st Annual International Conference on Mobile Computing and Networking; Association for Computing Machinery: New York, NY, USA, 2015; pp. 130–141. [Google Scholar] [CrossRef] [Scilit]
- Hu, P.; Ma, Y.; Santhalingam, P.S.; Pathak, P.H.; Cheng, X. Milliear: Millimeter-wave acoustic eavesdropping with unconstrained vocabulary. In IEEE INFOCOM 2022—IEEE Conference on Computer Communications; IEEE: Piscataway, NJ, USA, 2022; pp. 11–20. [Google Scholar] [CrossRef] [Scilit]
- Feng, Y.; Zhang, K.; Wang, C.; Xie, L.; Ning, J.; Chen, S. mmeavesdropper: Signal augmentation-based directional eavesdropping with mmwave radar. In IEEE INFOCOM 2023—IEEE Conference on Computer Communications; IEEE: Piscataway, NJ, USA, 2023; pp. 1–10. [Google Scholar] [CrossRef] [Scilit]
- Ba, Z.; Zheng, T.; Zhang, X.; Qin, Z.; Li, B.; Liu, X.; Ren, K. Learning-based Practical Smartphone Eavesdropping with Built-in Accelerometer. NDSS 2020, 2020, 1–18. [Google Scholar] [CrossRef] [Scilit]
- Anand, S.A.; Saxena, N. Speechless: Analyzing the threat to speech privacy from smartphone motion sensors. In 2018 IEEE Symposium on Security and Privacy (SP); IEEE: Piscataway, NJ, USA, 2018; pp. 1000–1017. [Google Scholar] [CrossRef] [Scilit]
- Zhang, L.; Pathak, P.H.; Wu, M.; Zhao, Y.; Mohapatra, P. Accelword: Energy efficient hotword detection through accelerometer. In Proceedings of the 13th Annual International Conference on Mobile Systems, Applications, and Services; Association for Computing Machinery: New York, NY, USA, 2015; pp. 301–315. [Google Scholar] [CrossRef] [Scilit]
- Michalevsky, Y.; Boneh, D.; Nakibly, G. Gyrophone: Recognizing speech from gyroscope signals. In Proceedings of the 23rd USENIX Security Symposium (USENIX Security 14), San Diego, CA, USA, 20–22 August 2014; pp. 1053–1067. Available online: https://www.usenix.org/conference/usenixsecurity14/technical-sessions/presentation/michalevsky (accessed on 10 January 2026).
- Hu, P.; Zhuang, H.; Santhalingam, P.S.; Spolaor, R.; Pathak, P.; Zhang, G.; Cheng, X. Accear: Accelerometer acoustic eavesdropping with unconstrained vocabulary. In 2022 IEEE Symposium on Security and Privacy (SP); IEEE: Piscataway, NJ, USA, 2022; pp. 1757–1773. [Google Scholar] [CrossRef] [Scilit]
- Adler, A.; Alvarez-Melis, D.; Tasnim, S. WiMic: Recovering Sound with Wireless Signals; MIT CSAIL: Cambridge, MA, USA, 2015. [Google Scholar]
- Chen, Y.; Yu, J.; Chen, Y.; Kong, L.; Zhu, Y.; Chen, Y.-C. RFSpy: Eavesdropping on online conversations with out-of-vocabulary words by sensing metal coil vibration of headsets leveraging RFID. In Proceedings of the 22nd Annual International Conference on Mobile Systems, Applications and Services; Association for Computing Machinery: New York, NY, USA, 2024; pp. 169–182. [Google Scholar] [CrossRef] [Scilit]
- Basak, S.; Padarthi, A.; Gowda, M. mmWave-Whisper: Phone Call Eavesdropping and Transcription Using Millimeter-Wave Radar. In ICASSP 2025–2025 IEEE International Conference on Acoustics, Speech and Signal Processing (ICASSP); IEEE: Piscataway, NJ, USA, 2025; pp. 1–5. [Google Scholar] [CrossRef] [Scilit]
- Xu, X.; Chen, Y.; Ling, Z.; Lu, L.; Luo, J.; Fu, X. mmEar: Push the limit of COTS mmWave eavesdropping on headphones. In IEEE INFOCOM 2024—IEEE Conference on Computer Communications; IEEE: Piscataway, NJ, USA, 2024; pp. 351–360. [Google Scholar] [CrossRef] [Scilit]
- Wang, L.; Chang, A.; Liu, B.; Yu, Z.; Hu, P.; Liu, J.; Zhang, Y.; Guo, B. mmHSE: Enhanced Eavesdropping Attack on Headsets Leveraging COTS mmWave Radar. In Proceedings of the ACM on Interactive, Mobile, Wearable and Ubiquitous Technologies; Association for Computing Machinery: New York, NY, USA, 2025; Volume 9, pp. 1–27. [Google Scholar] [CrossRef] [Scilit]
- Hu, P.; Li, W.; Spolaor, R.; Cheng, X. mmecho: A mmwave-based acoustic eavesdropping method. In Proceedings of the 2023 IEEE Symposium on Security and Privacy (SP), San Francisco, CA, USA, 21–25 May 2023; pp. 138–140. [Google Scholar] [CrossRef] [Scilit]
- Han, D.; Huang, T.; Ding, H.; Zhao, C.; Wang, F.; Wang, G.; Xi, W. We Can Hear You with mmWave Radar! An End-to-End Eavesdropping System. In Proceedings of the ACM on Interactive, Mobile, Wearable and Ubiquitous Technologies; Association for Computing Machinery: New York, NY, USA, 2025; Volume 9, pp. 1–23. [Google Scholar] [CrossRef] [Scilit]
- Wang, S.; Zhang, X. A Vibration Signal Enhancement Scheme for mmWave-Based Sound Eavesdropping. In IEEE INFOCOM 2024-IEEE Conference on Computer Communications Workshops (INFOCOM WKSHPS); IEEE: Piscataway, NJ, USA, 2024; pp. 1–6. [Google Scholar] [CrossRef] [Scilit]
- Li, W.; Spolaor, R.; Luo, C.; Sun, Y.; Chen, H.; Zhang, G.; Yang, Y.; Cheng, X.; Hu, P. Acoustic Eavesdropping from Sound-Induced Vibrations with Multi-Antenna mmWave Radar. IEEE Trans. Mob. Comput. 2025, 24, 7693–7708. [Google Scholar] [CrossRef] [Scilit]
- Thomson, W. Theory of Vibration with Applications; CRC Press: Boca Raton, FL, USA, 2018. [Google Scholar] [CrossRef] [Scilit]
- Scherr, S.; Ayhan, S.; Fischbach, B.; Bhutani, A.; Pauli, M.; Zwick, T. An efficient frequency and phase estimation algorithm with CRB performance for FMCW radar applications. IEEE Trans. Instrum. Meas. 2014, 64, 1868–1875. [Google Scholar] [CrossRef] [Scilit]
- Capon, J. High-resolution frequency-wavenumber spectrum analysis. Proc. IEEE 2005, 57, 1408–1418. [Google Scholar] [CrossRef] [Scilit]
- Fuhrmann, D.R.; Kelly, E.J.; Nitzberg, R. A CFAR adaptive matched filter detector. IEEE Trans. Aerosp. Electron. Syst. 1992, 28, 208–216. [Google Scholar] [CrossRef] [Scilit]
- Birant, D.; Kut, A. ST-DBSCAN: An algorithm for clustering spatial–temporal data. Data Knowl. Eng. 2007, 60, 208–221. [Google Scholar] [CrossRef] [Scilit]
- Shannon, C.E. Communication in the presence of noise. Proc. IRE 2006, 37, 10–21. [Google Scholar] [CrossRef] [Scilit]
- Alessio, S.M. IIR Filter Design. Digital Signal Processing and Spectral Analysis for Scientists: Concepts and Applications; Springer International Publishing: Cham, Switzerland, 2015; pp. 263–367. [Google Scholar]
- Gouyon, F.; Pachet, F.; Delerue, O. On the use of zero-crossing rate for an application of classification of percussive sounds. In Proceedings of the COST G-6 Conference on Digital Audio Effects (DAFX-00), Verona, Italy, 7–9 December 2000; Volume 5, p. 16. Available online: http://193.166.3.2/pub/sci/audio/dafx/2000/profs.sci.univr.it/%257Edafx/Final-Papers/pdf/GouyonPachetDelerue.pdf (accessed on 10 January 2026).
- Yuan, Y. A modified BFGS algorithm for unconstrained optimization. IMA J. Numer. Anal. 1991, 11, 325–332. [Google Scholar] [CrossRef] [Scilit]
- Sainburg, T.; Thielk, M.; Gentner, T.Q. Finding, visualizing, and quantifying latent structure across diverse animal vocal repertoires. PLoS Comput. Biol. 2020, 16, e1008228. [Google Scholar] [CrossRef] [Scilit]
- Richter, J.; Wu, Y.-C.; Krenn, S.; Welker, S.; Lay, B.; Watanabe, S.; Richard, A.; Gerkmann, T. EARS An anechoic fullband speech dataset benchmarked for speech enhancement and dereverberation. arXiv 2024, arXiv:2406.06185. [Google Scholar] [CrossRef] [Scilit]
- Kominek, J.; Schultz, T.; Black, A.W. Synthesizer voice quality of new languages calibrated with mean mel cepstral distortion. In SLTU; Carnegie Mellon University: Pittsburgh, PA, USA, 2008; pp. 63–68. Available online: https://www.cs.cmu.edu/~awb/papers/sltu2008/kominek_black.sltu_2008.pdf (accessed on 10 January 2026).
- Gupta, S.; Jaafar, J.; Ahmad, W.F.W.; Bansal, A. Feature extraction using MFCC. Signal Image Process. Int. J. 2013, 4, 101–108. [Google Scholar] [CrossRef] [Scilit]
- Wang, Y.Y.; Acero, A.; Chelba, C. Is word error rate a good indicator for spoken language understanding accuracy. In 2003 IEEE Workshop on Automatic Speech Recognition and Understanding (IEEE Cat.No.03EX721); IEEE: Piscataway, NJ, USA, 2003; pp. 577–582. [Google Scholar] [CrossRef] [Scilit]
- Radford, A.; Kim, J.W.; Xu, T.; Brockman, G.; McLeavey, C.; Sutskever, I. Robust speech recognition via large-scale weak supervision. International conference on machine learning. Proc. Mach. Learn. Res. 2023, 202, 28492–28518. [Google Scholar] [CrossRef] [Scilit]
- Fan, B.; Song, H.; Liu, M.; Wang, Y. The improvement and realization of speech enhancement algorithm based on wiener filtering. In 2015 8th International Congress on Image and Signal Processing (CISP); IEEE: Piscataway, NJ, USA, 2015; pp. 1116–1120. [Google Scholar] [CrossRef] [Scilit]
- Mallat, S.G. A theory for multiresolution signal decomposition: The wavelet representation. IEEE Trans. Pattern Anal. Mach. Intell. 2002, 11, 674–693. [Google Scholar] [CrossRef] [Scilit]
- Udrea, R.M.; Ciochina, S. Speech enhancement using spectral over-subtraction and residual noise reduction. In Signals, Circuits and Systems 2003. SCS 2003. International Symposium on; IEEE: Piscataway, NJ, USA, 2003; Volume 1, pp. 165–168. [Google Scholar] [CrossRef] [Scilit]
- Donoho, D.L.; Johnstone, I.M. Adapting to unknown smoothness via wavelet shrinkage. J. Am. Stat. Assoc. 1995, 90, 1200–1224. [Google Scholar] [CrossRef]
- Tian, Z.; Sadler, B.M. Weighted energy detection of ultra-wideband signals. In IEEE 6th Workshop on Signal Processing Advances in Wireless Communications 2005; IEEE: Piscataway, NJ, USA, 2005; pp. 1068–1072. [Google Scholar] [CrossRef] [Scilit]
- Ephraim, Y.; Malah, D. Speech enhancement using a minimum-mean square error short-time spectral amplitude estimator. IEEE Trans. Acoust. Speech Signal Process. 2003, 32, 1109–1121. [Google Scholar] [CrossRef] [Scilit]
- Kumar, B. Mean-median based noise estimation method using spectral subtraction for speech enhancement technique. Indian J. Sci. Technol. 2016, 9, 1–6. [Google Scholar] [CrossRef] [Scilit]
- Rostaghi, M.; Rostaghi, R.; Humeau-Heurtier, A.; Azami, H. Refined composite multivariate multiscale fuzzy dispersion entropy: Theoretical analysis and applications. Chaos Solitons Fractals 2024, 185, 115128. [Google Scholar] [CrossRef] [Scilit]
- Ianniello, J. Time delay estimation via cross-correlation in the presence of large estimation errors. IEEE Trans. Acoust. Speech Signal Process. 2003, 30, 998–1003. [Google Scholar] [CrossRef] [Scilit]
- Byrd, R.H.; Lu, P.; Nocedal, J.; Zhu, C. A limited memory algorithm for bound constrained optimization. SIAM J. Sci. Comput. 1995, 16, 1190–1208. [Google Scholar] [CrossRef] [Scilit]
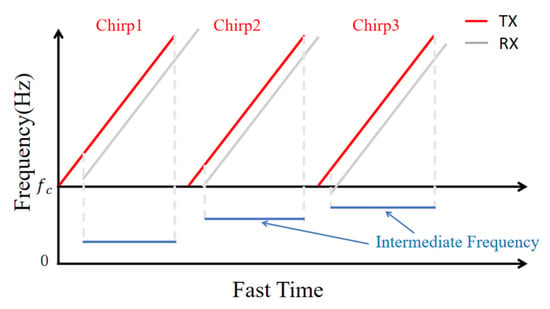
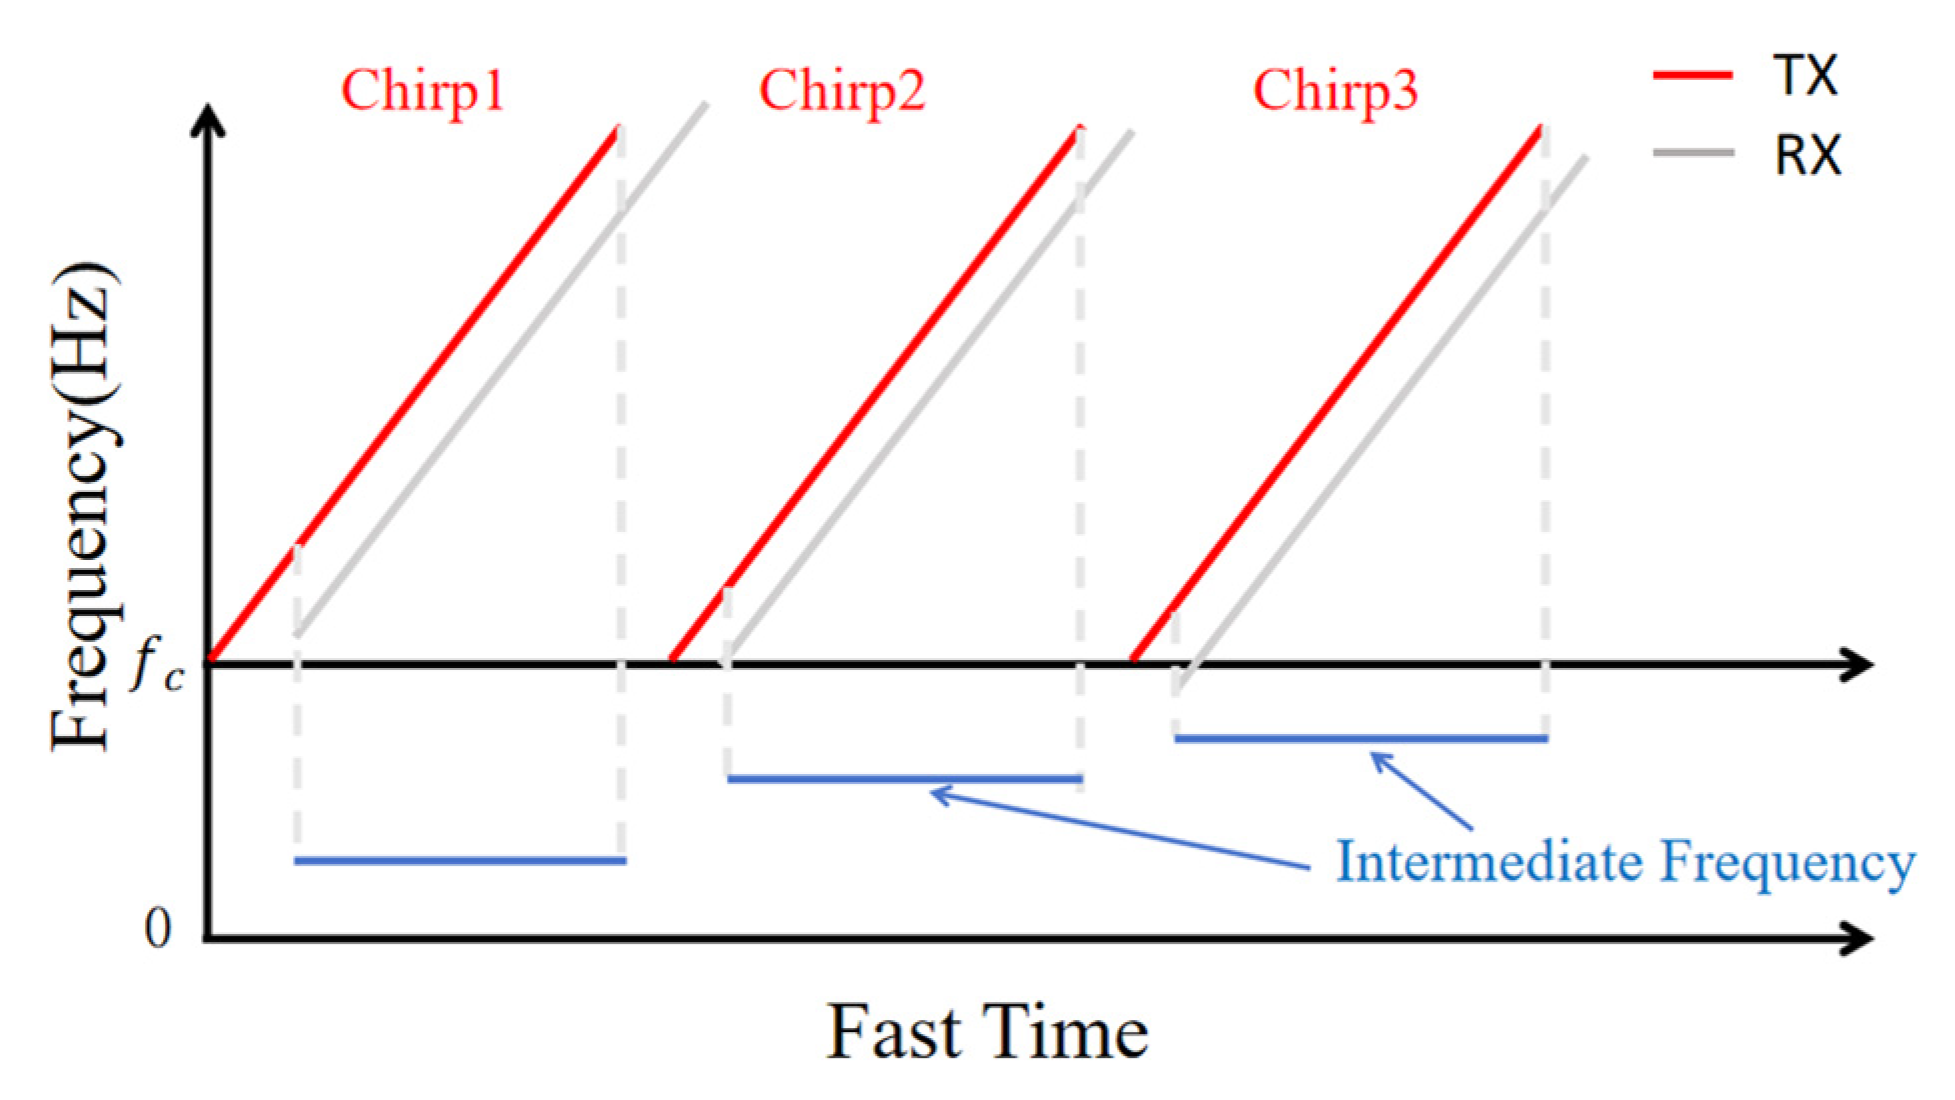
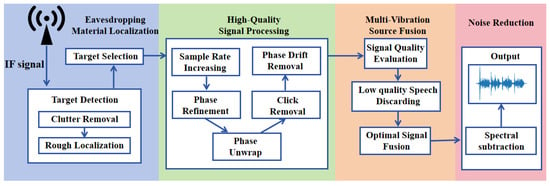
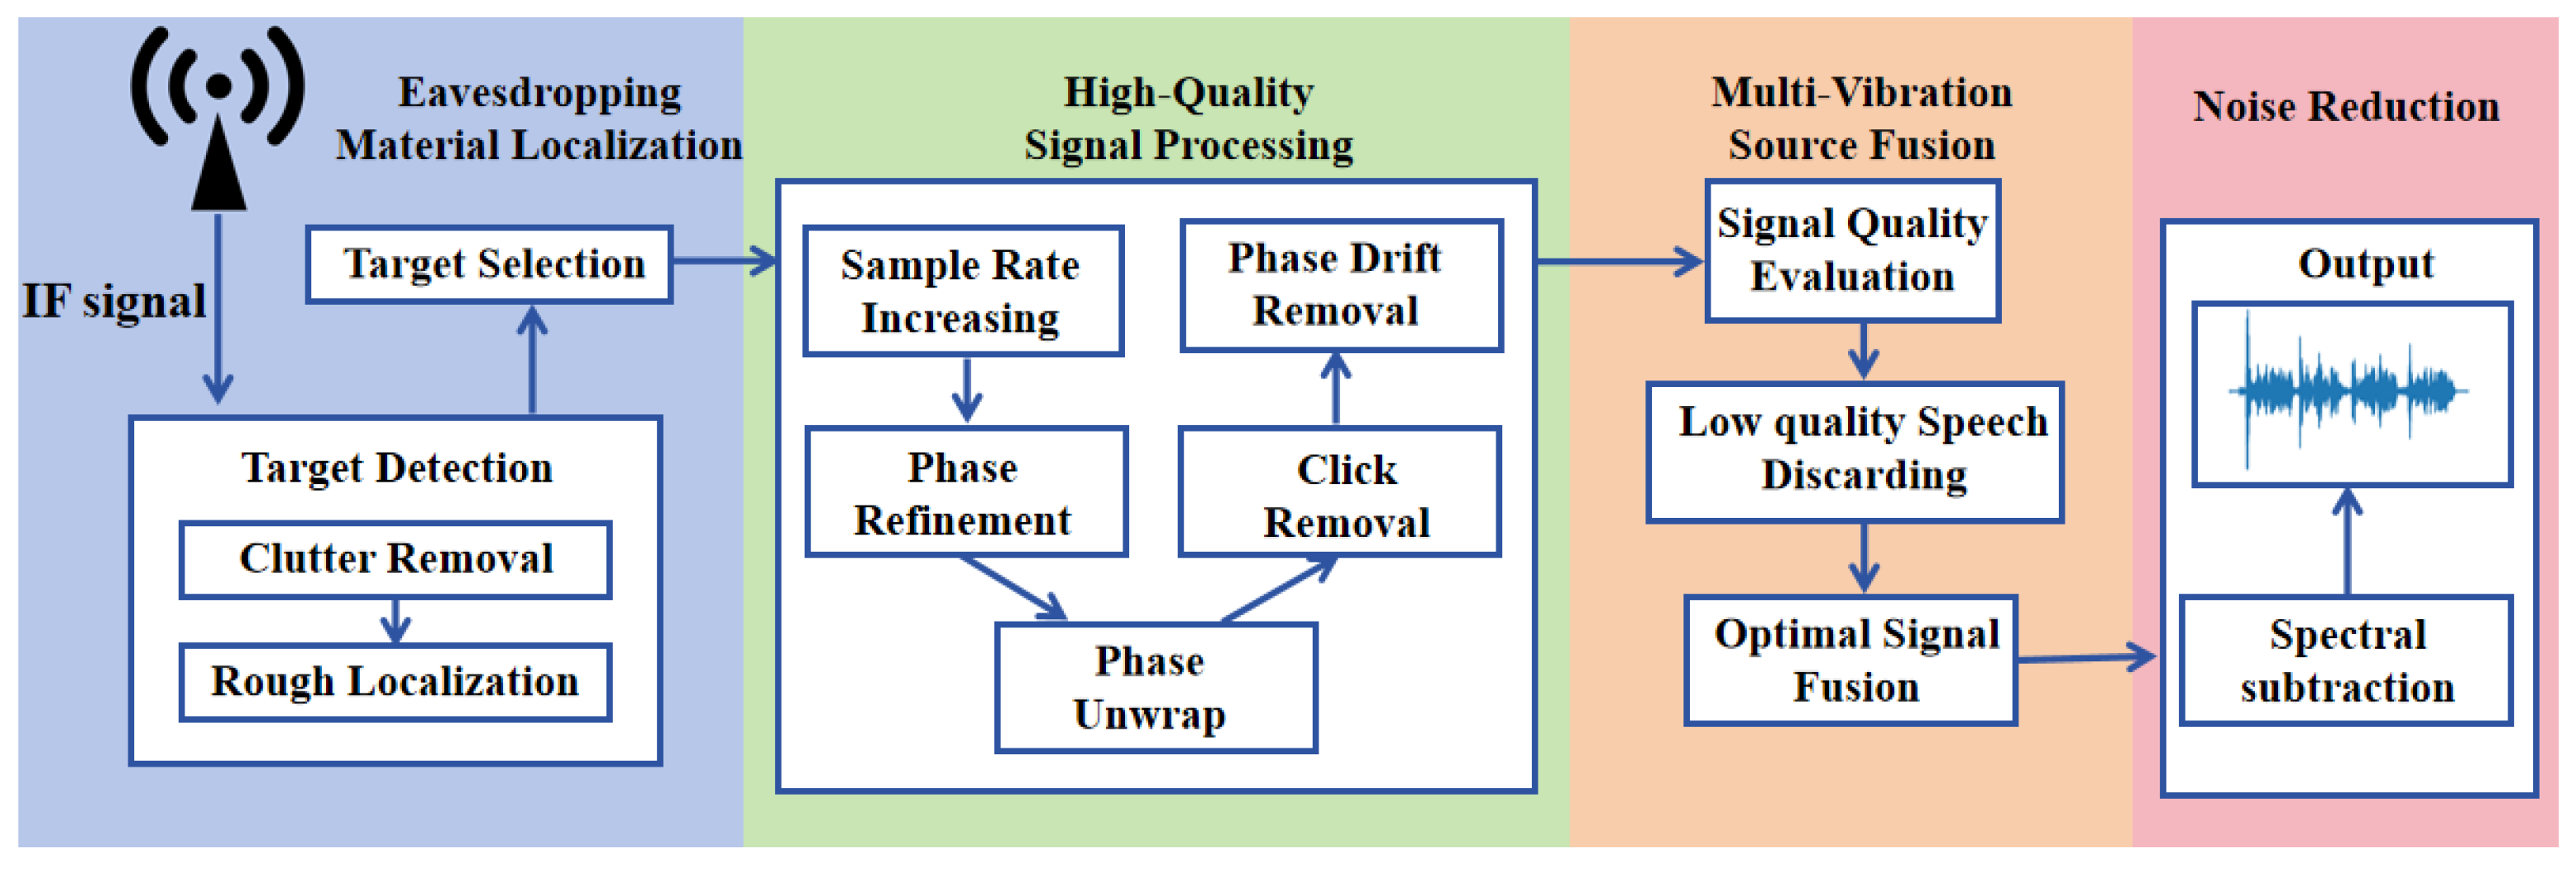
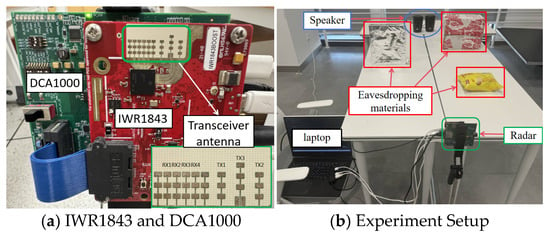
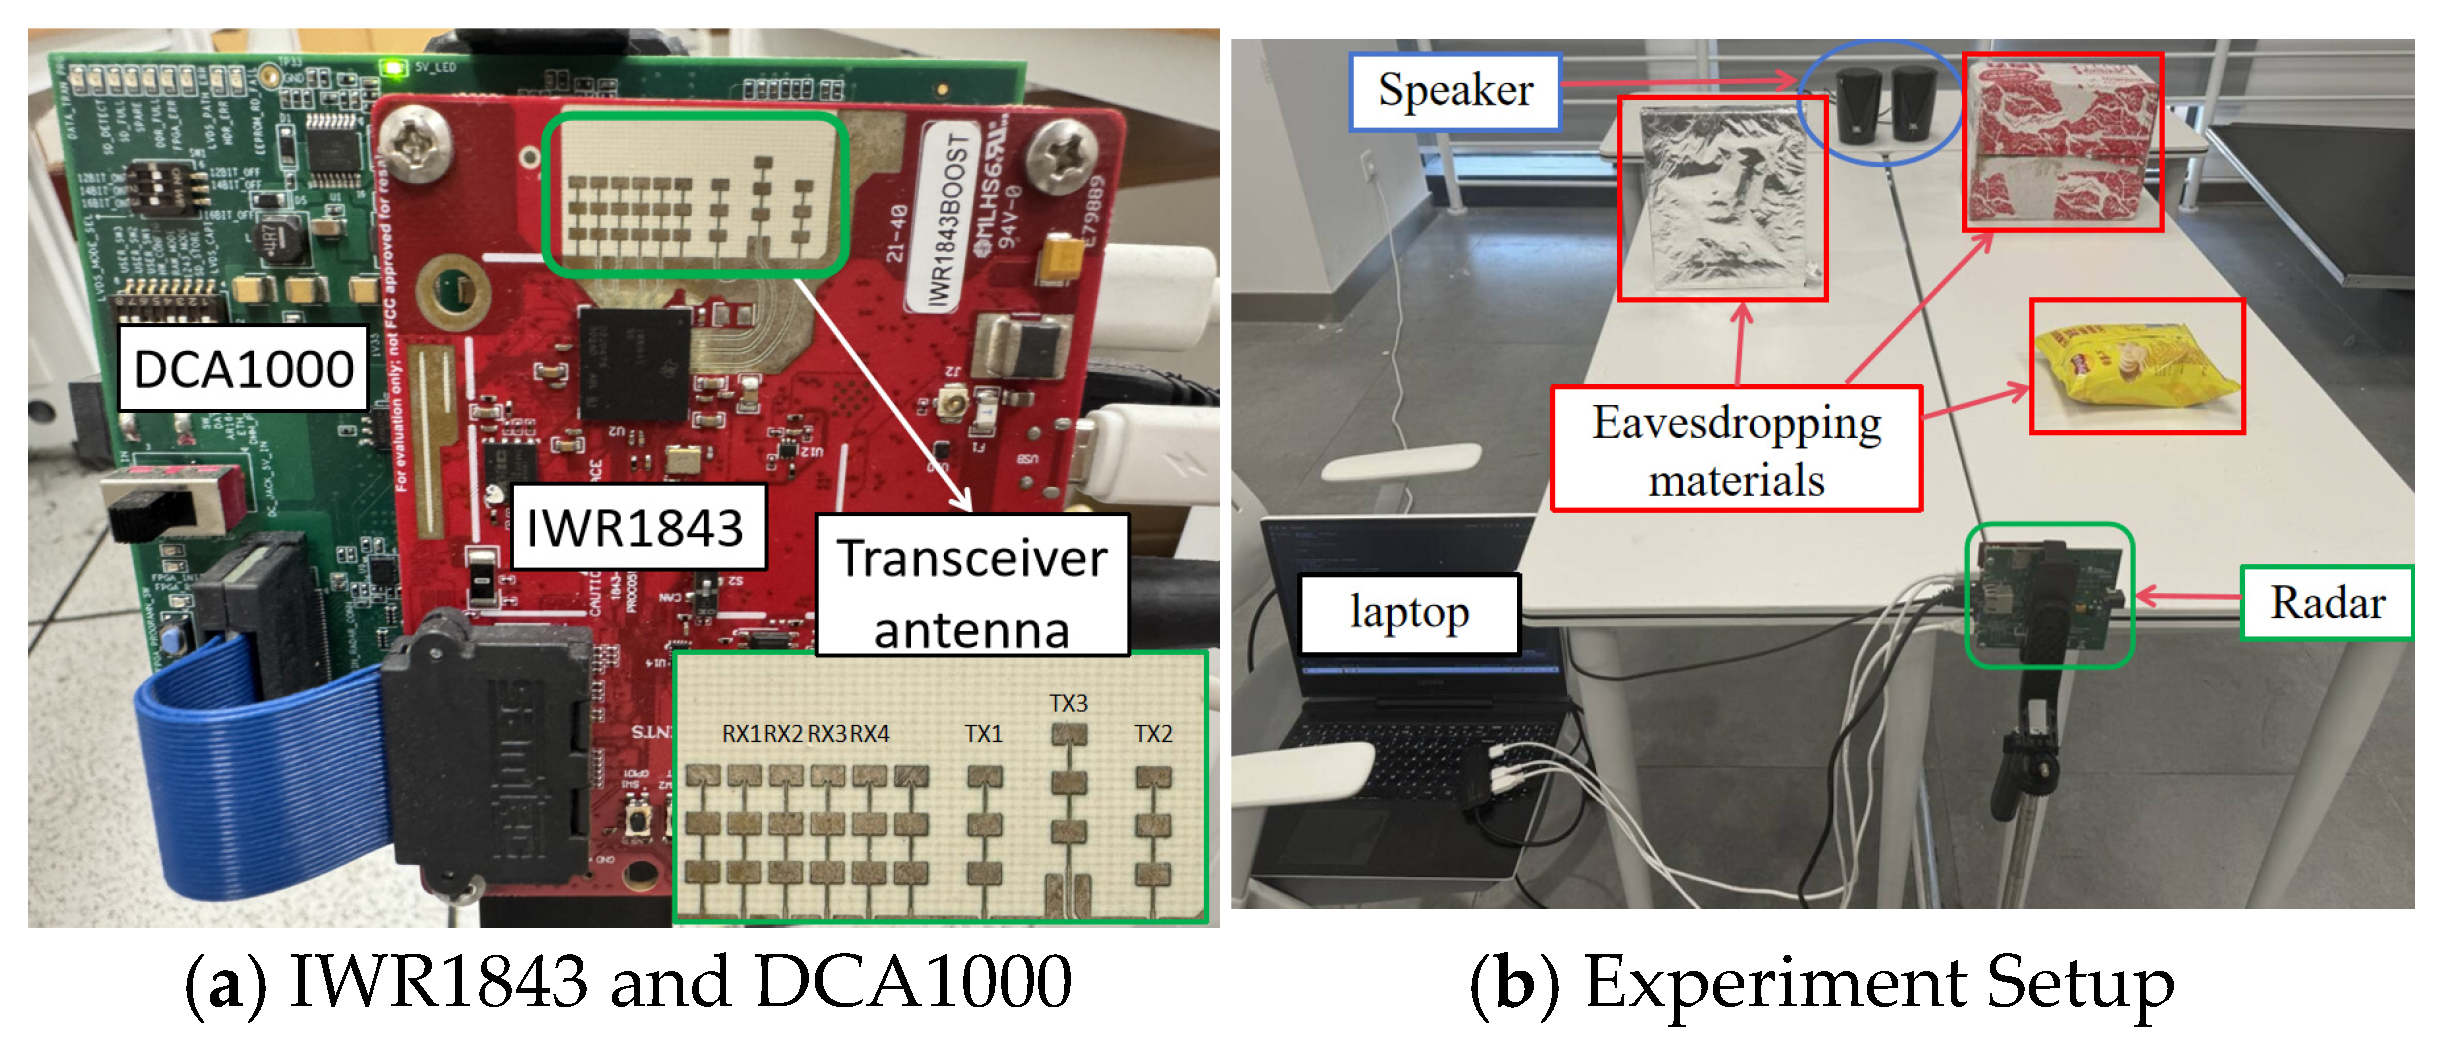
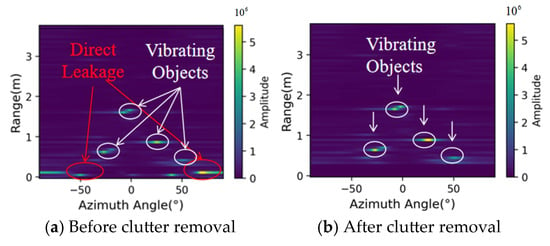
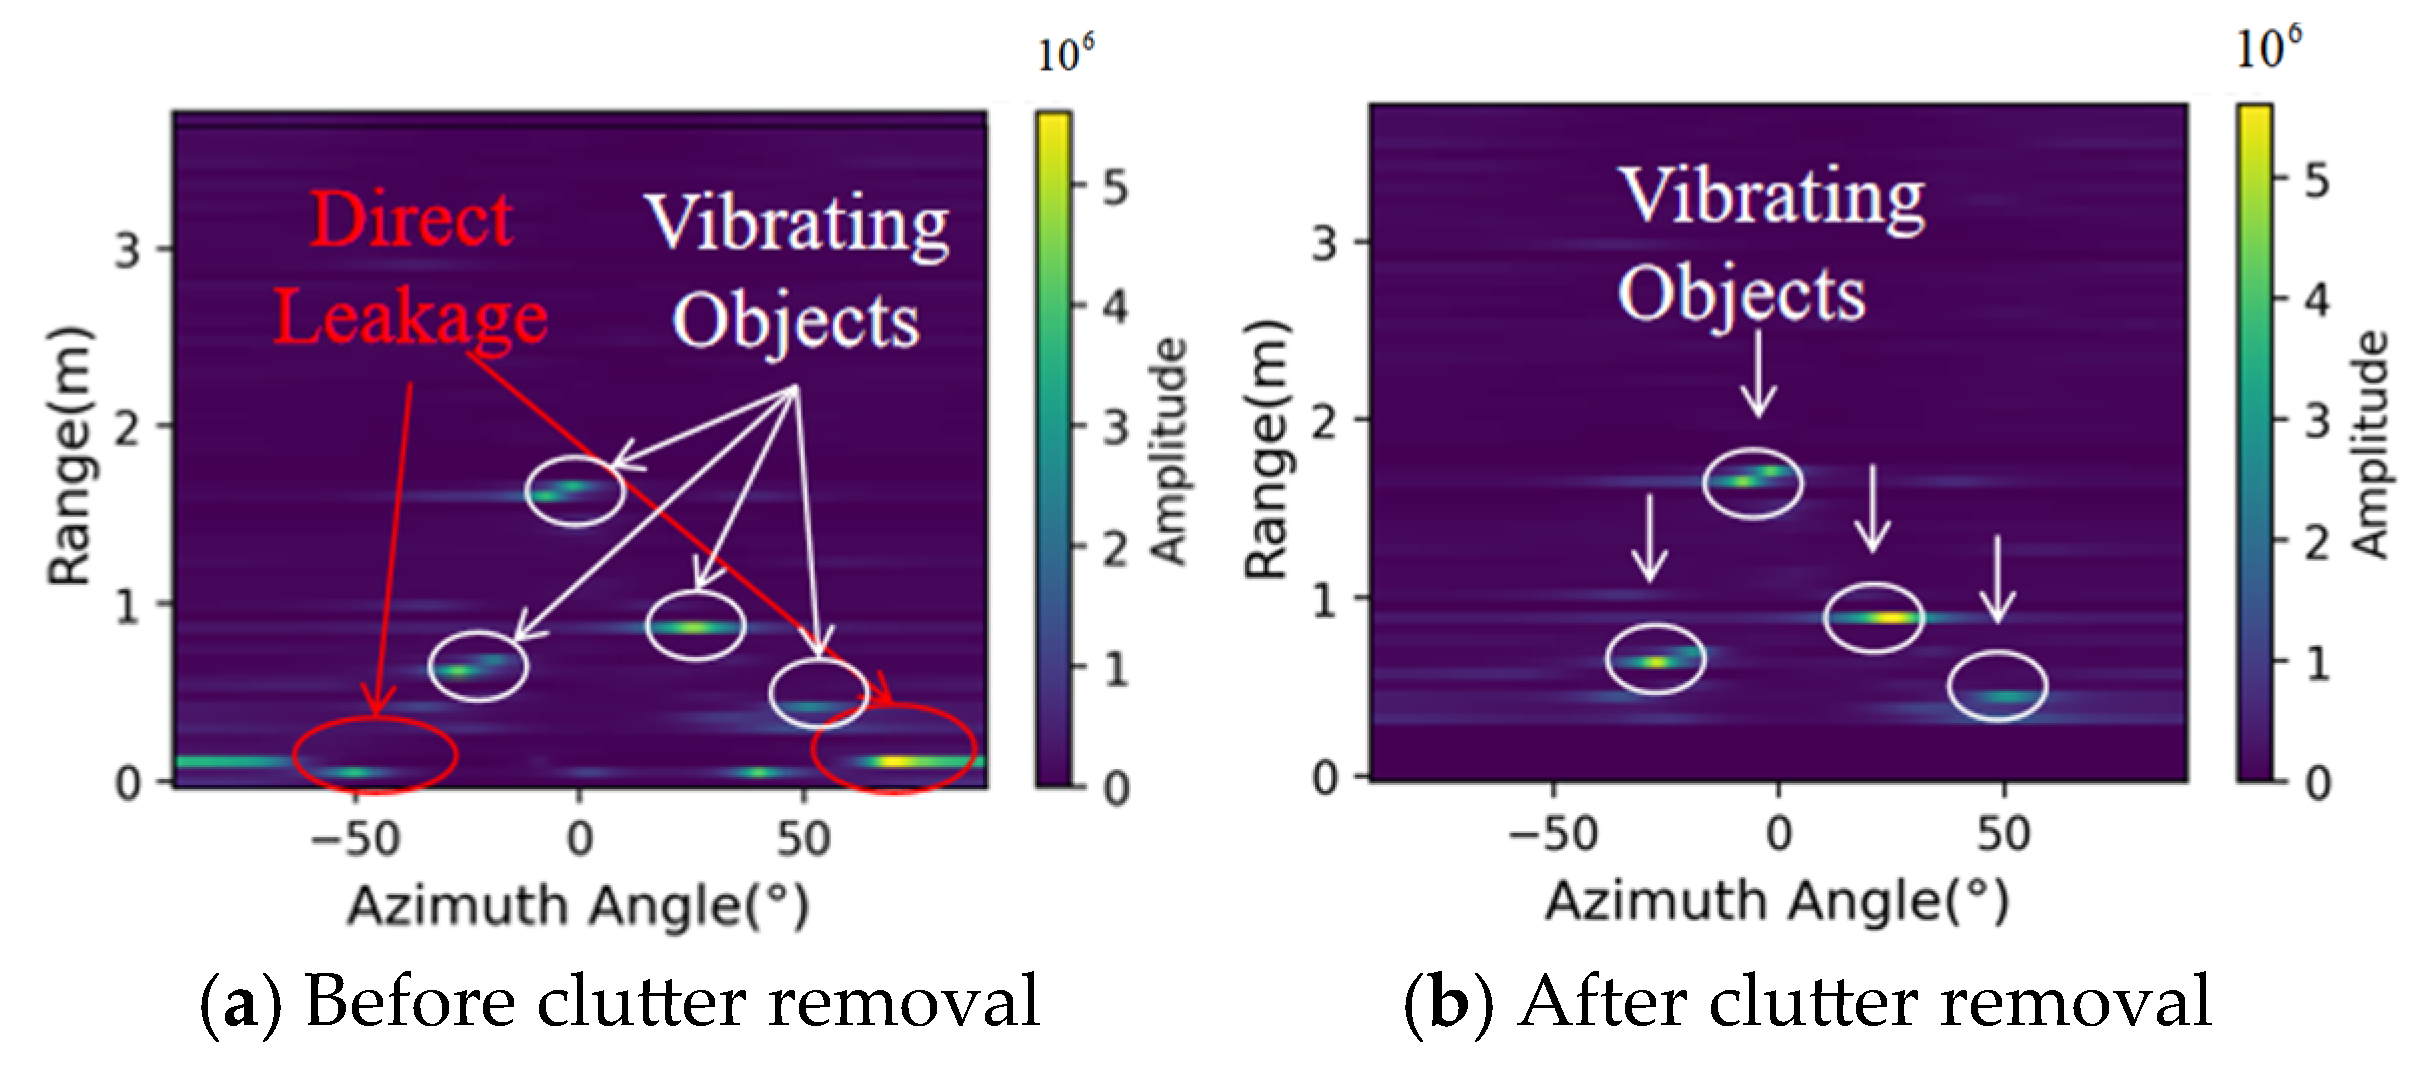
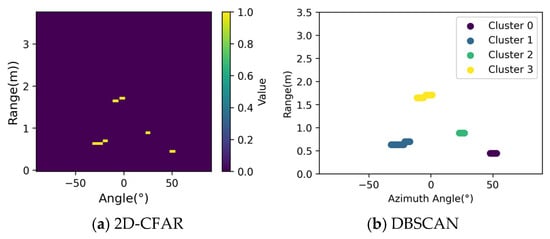
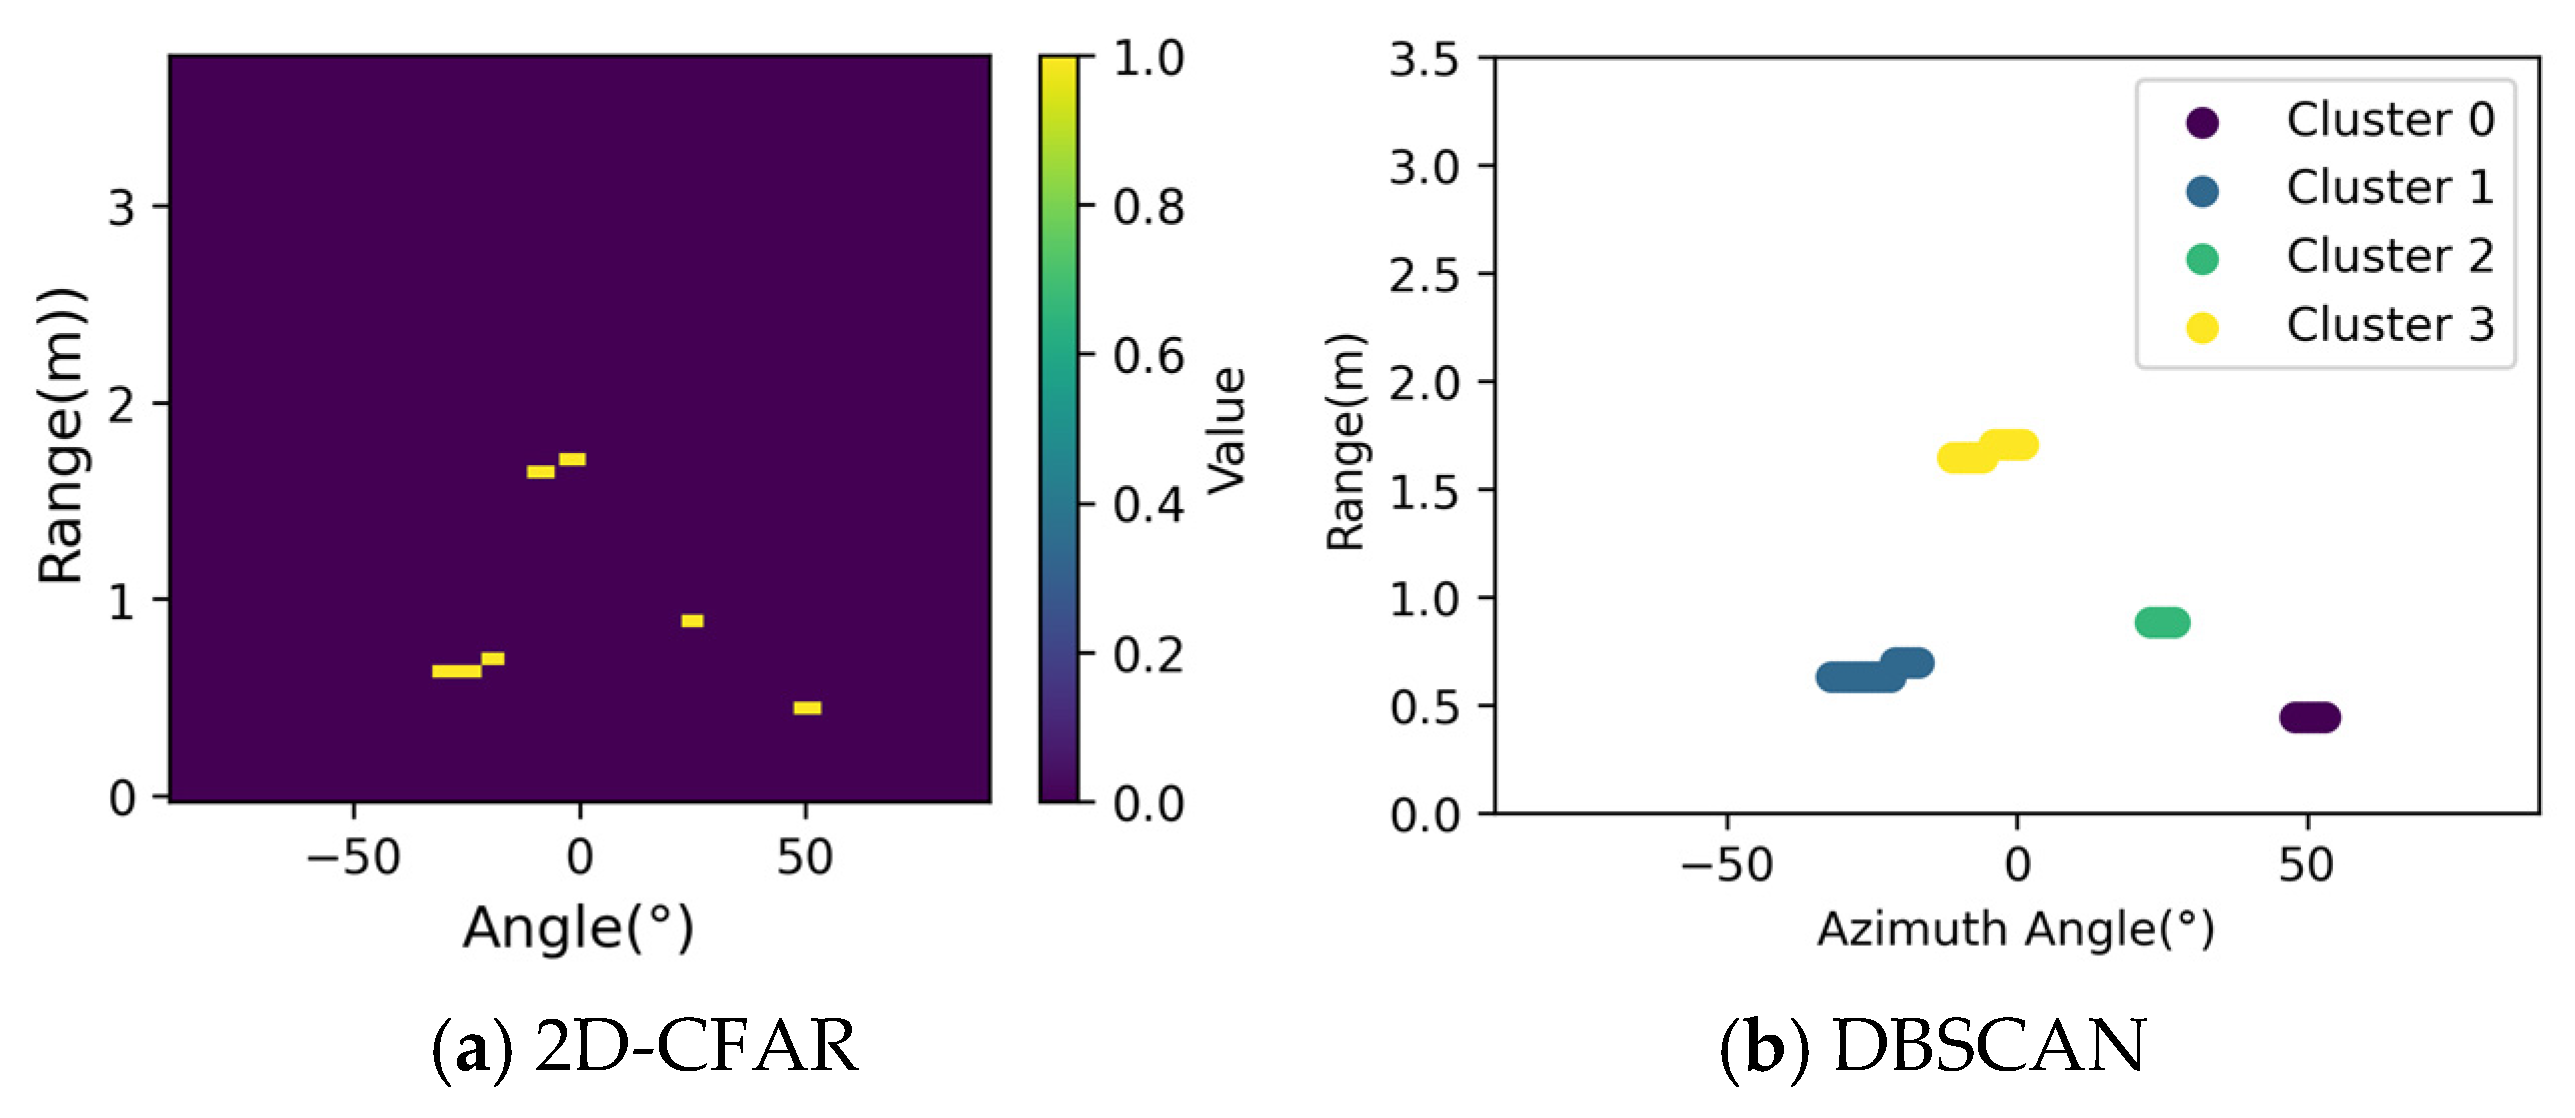
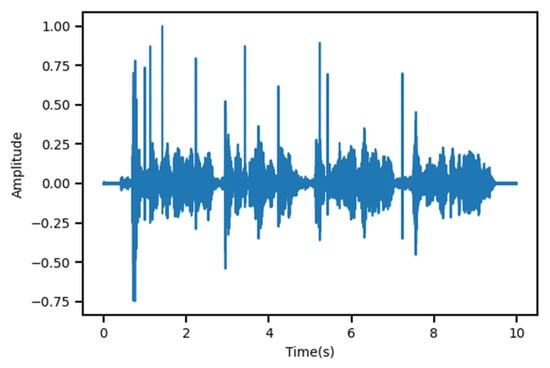
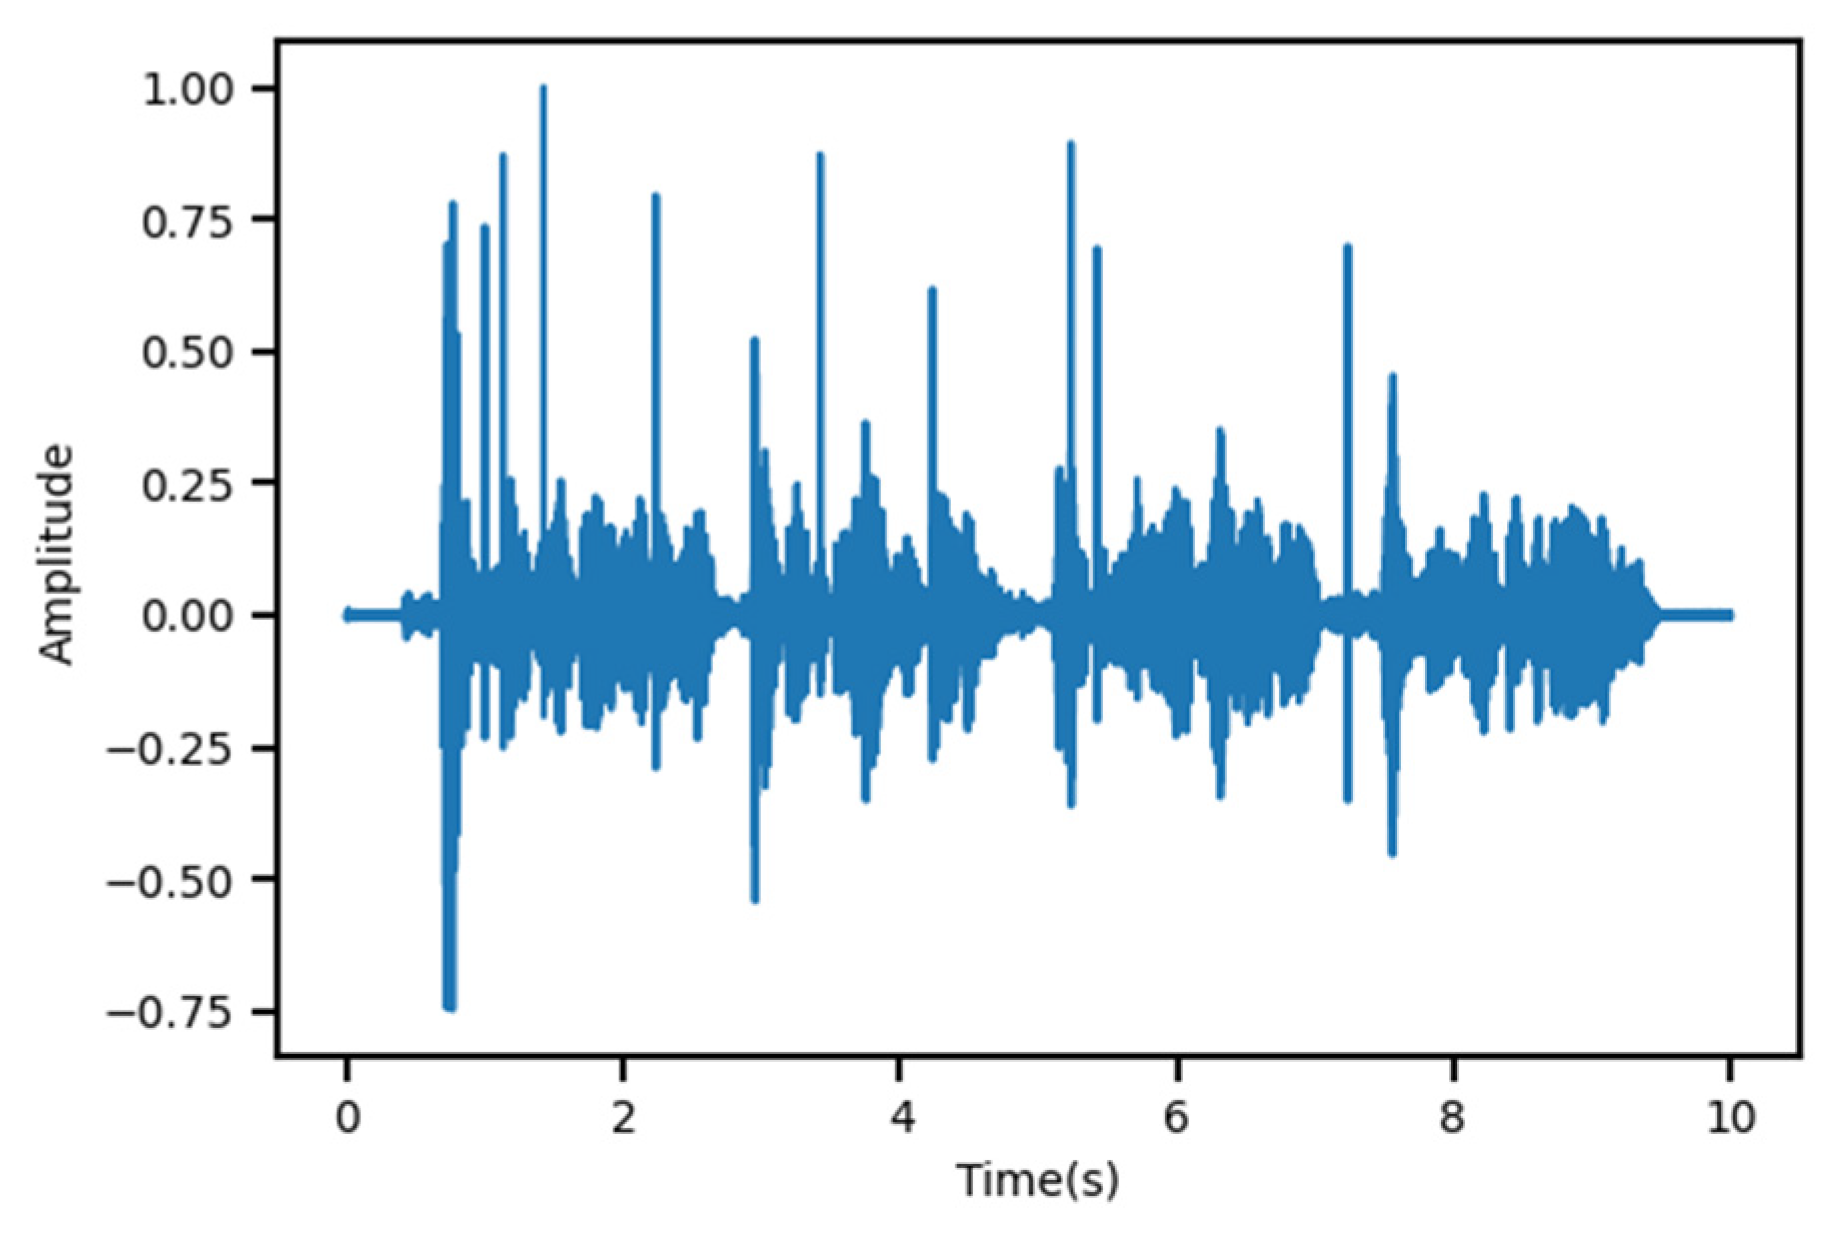
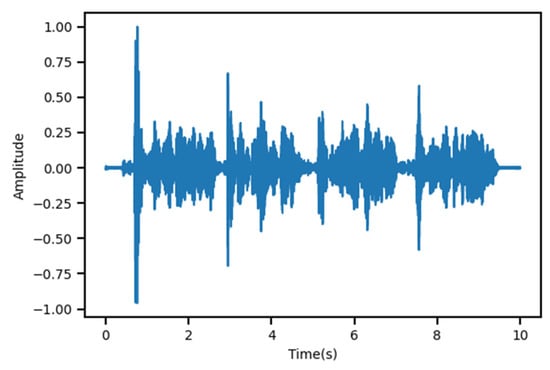
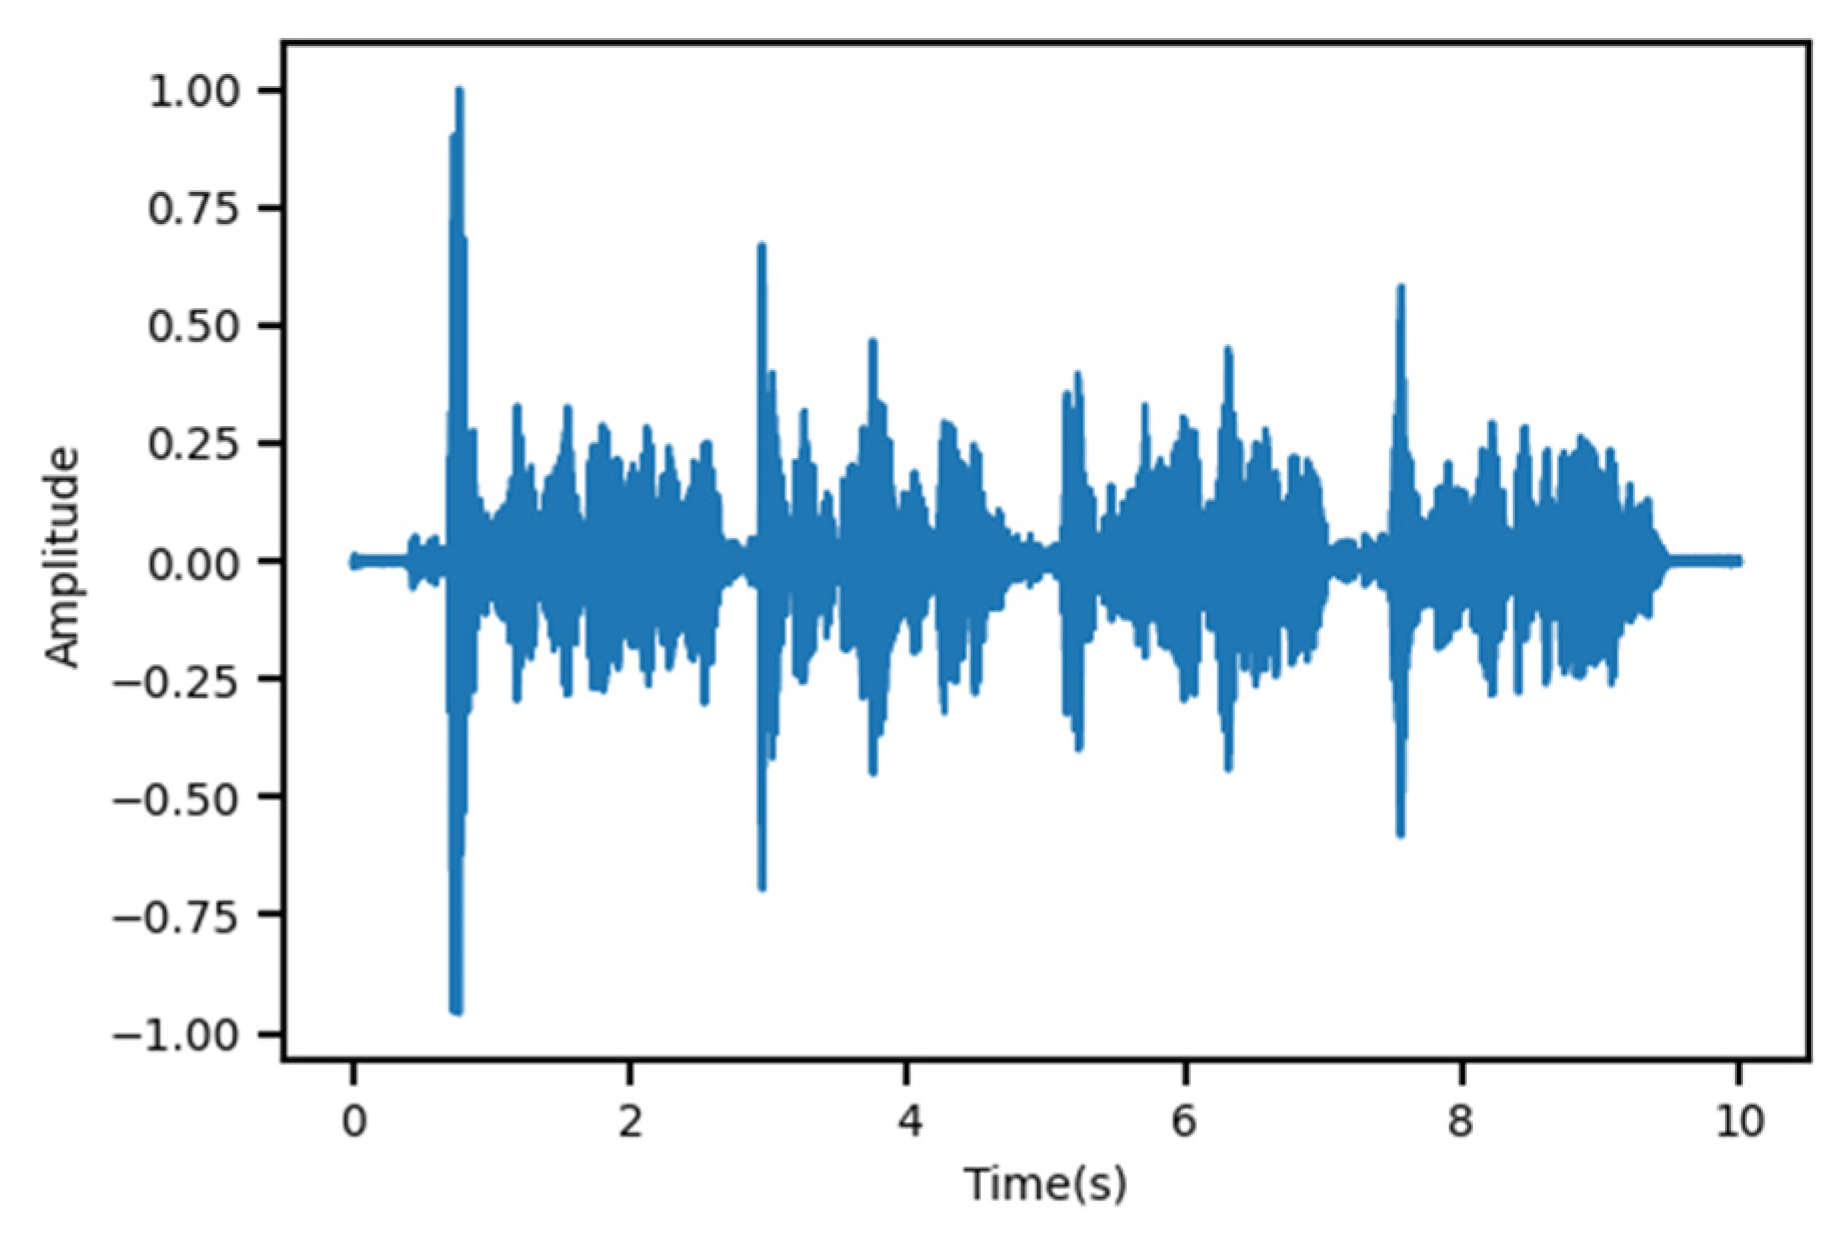
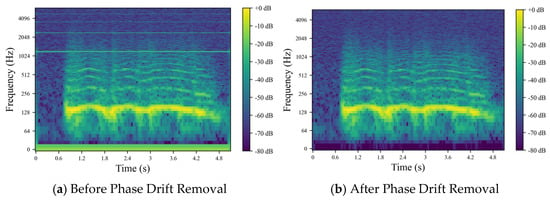
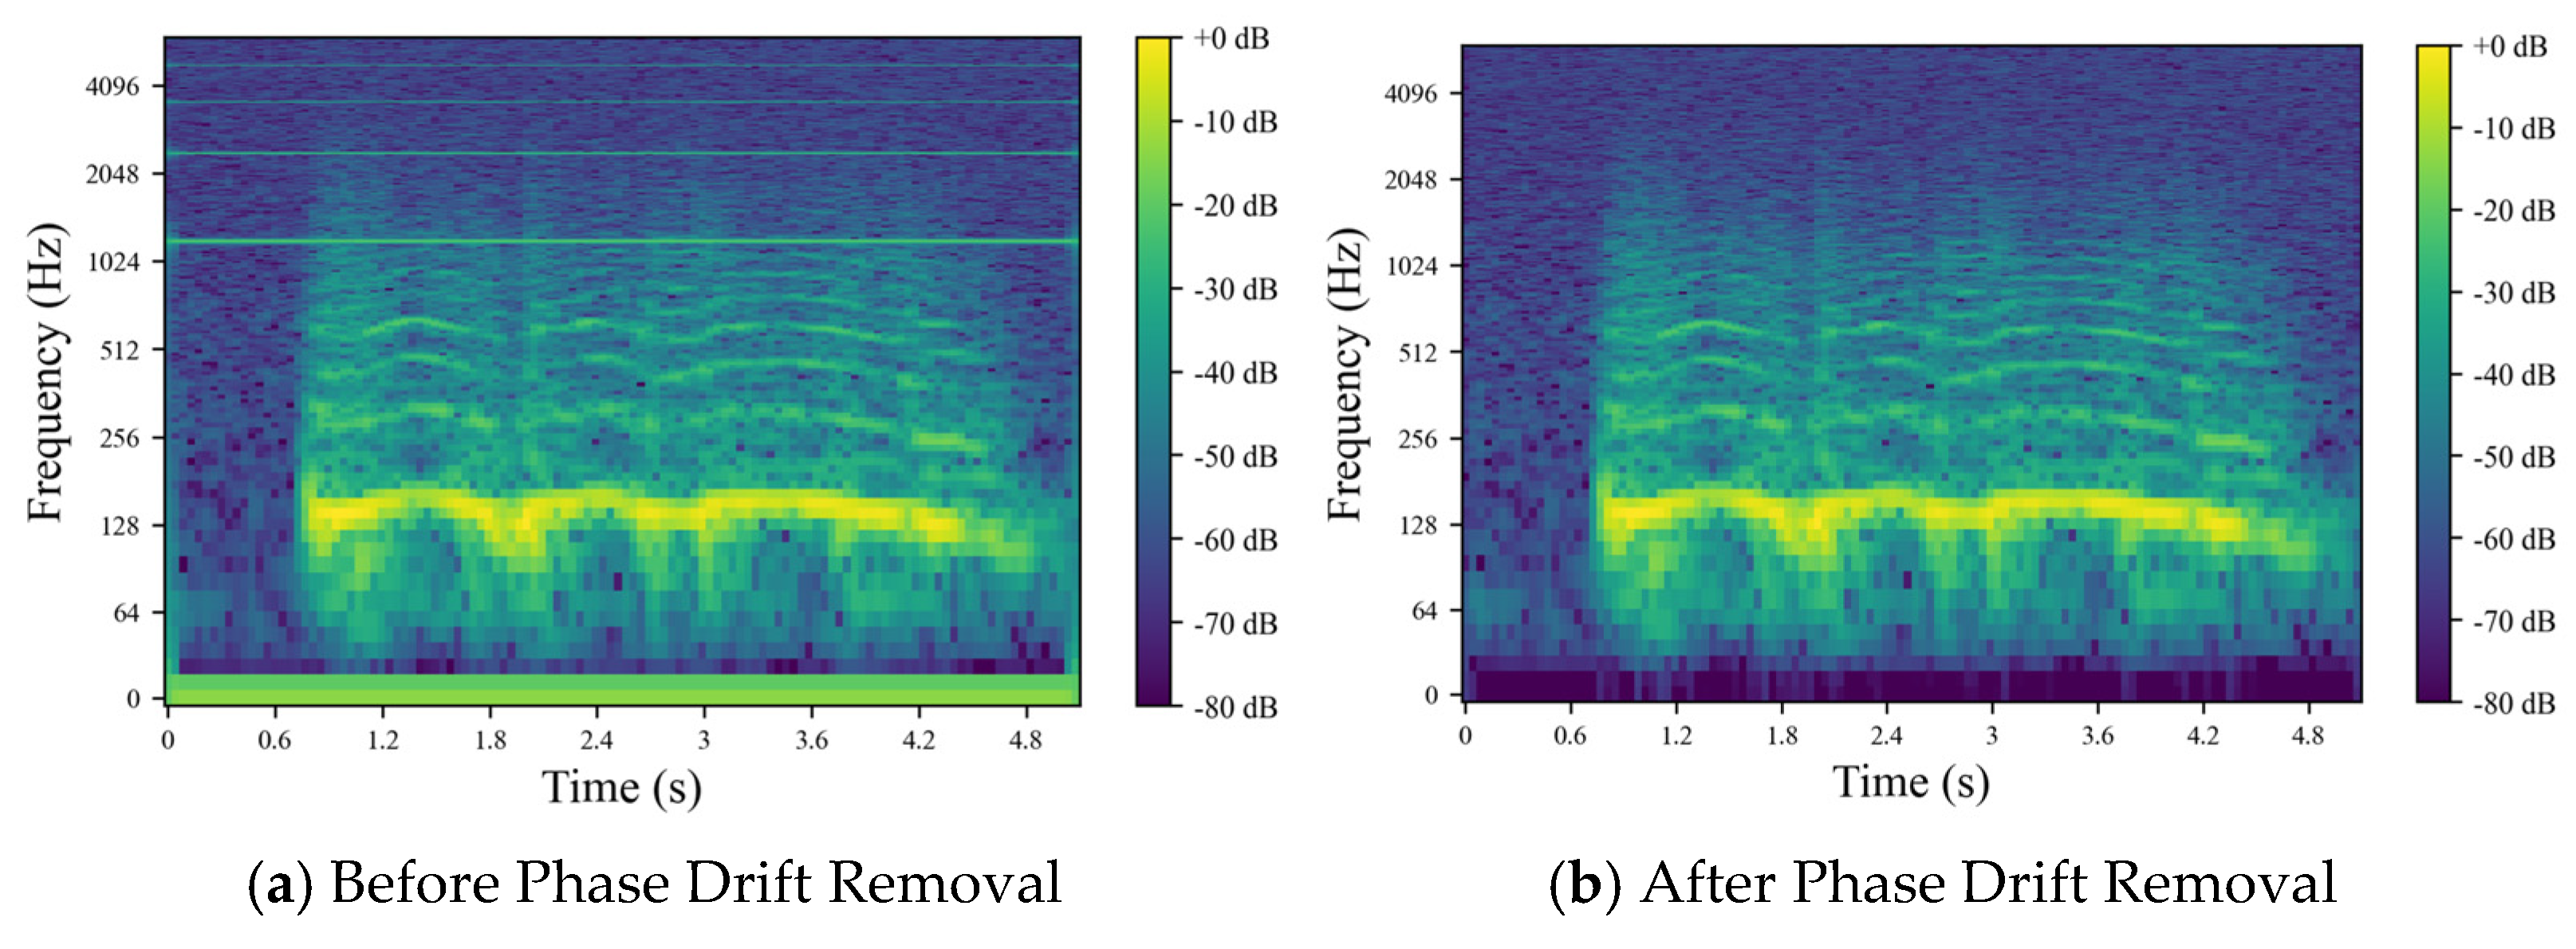
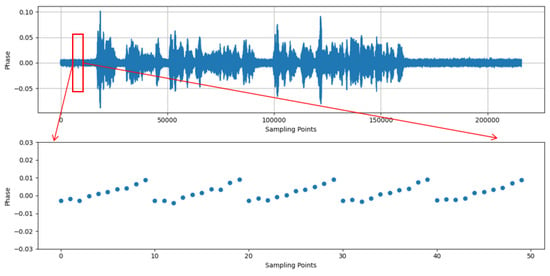
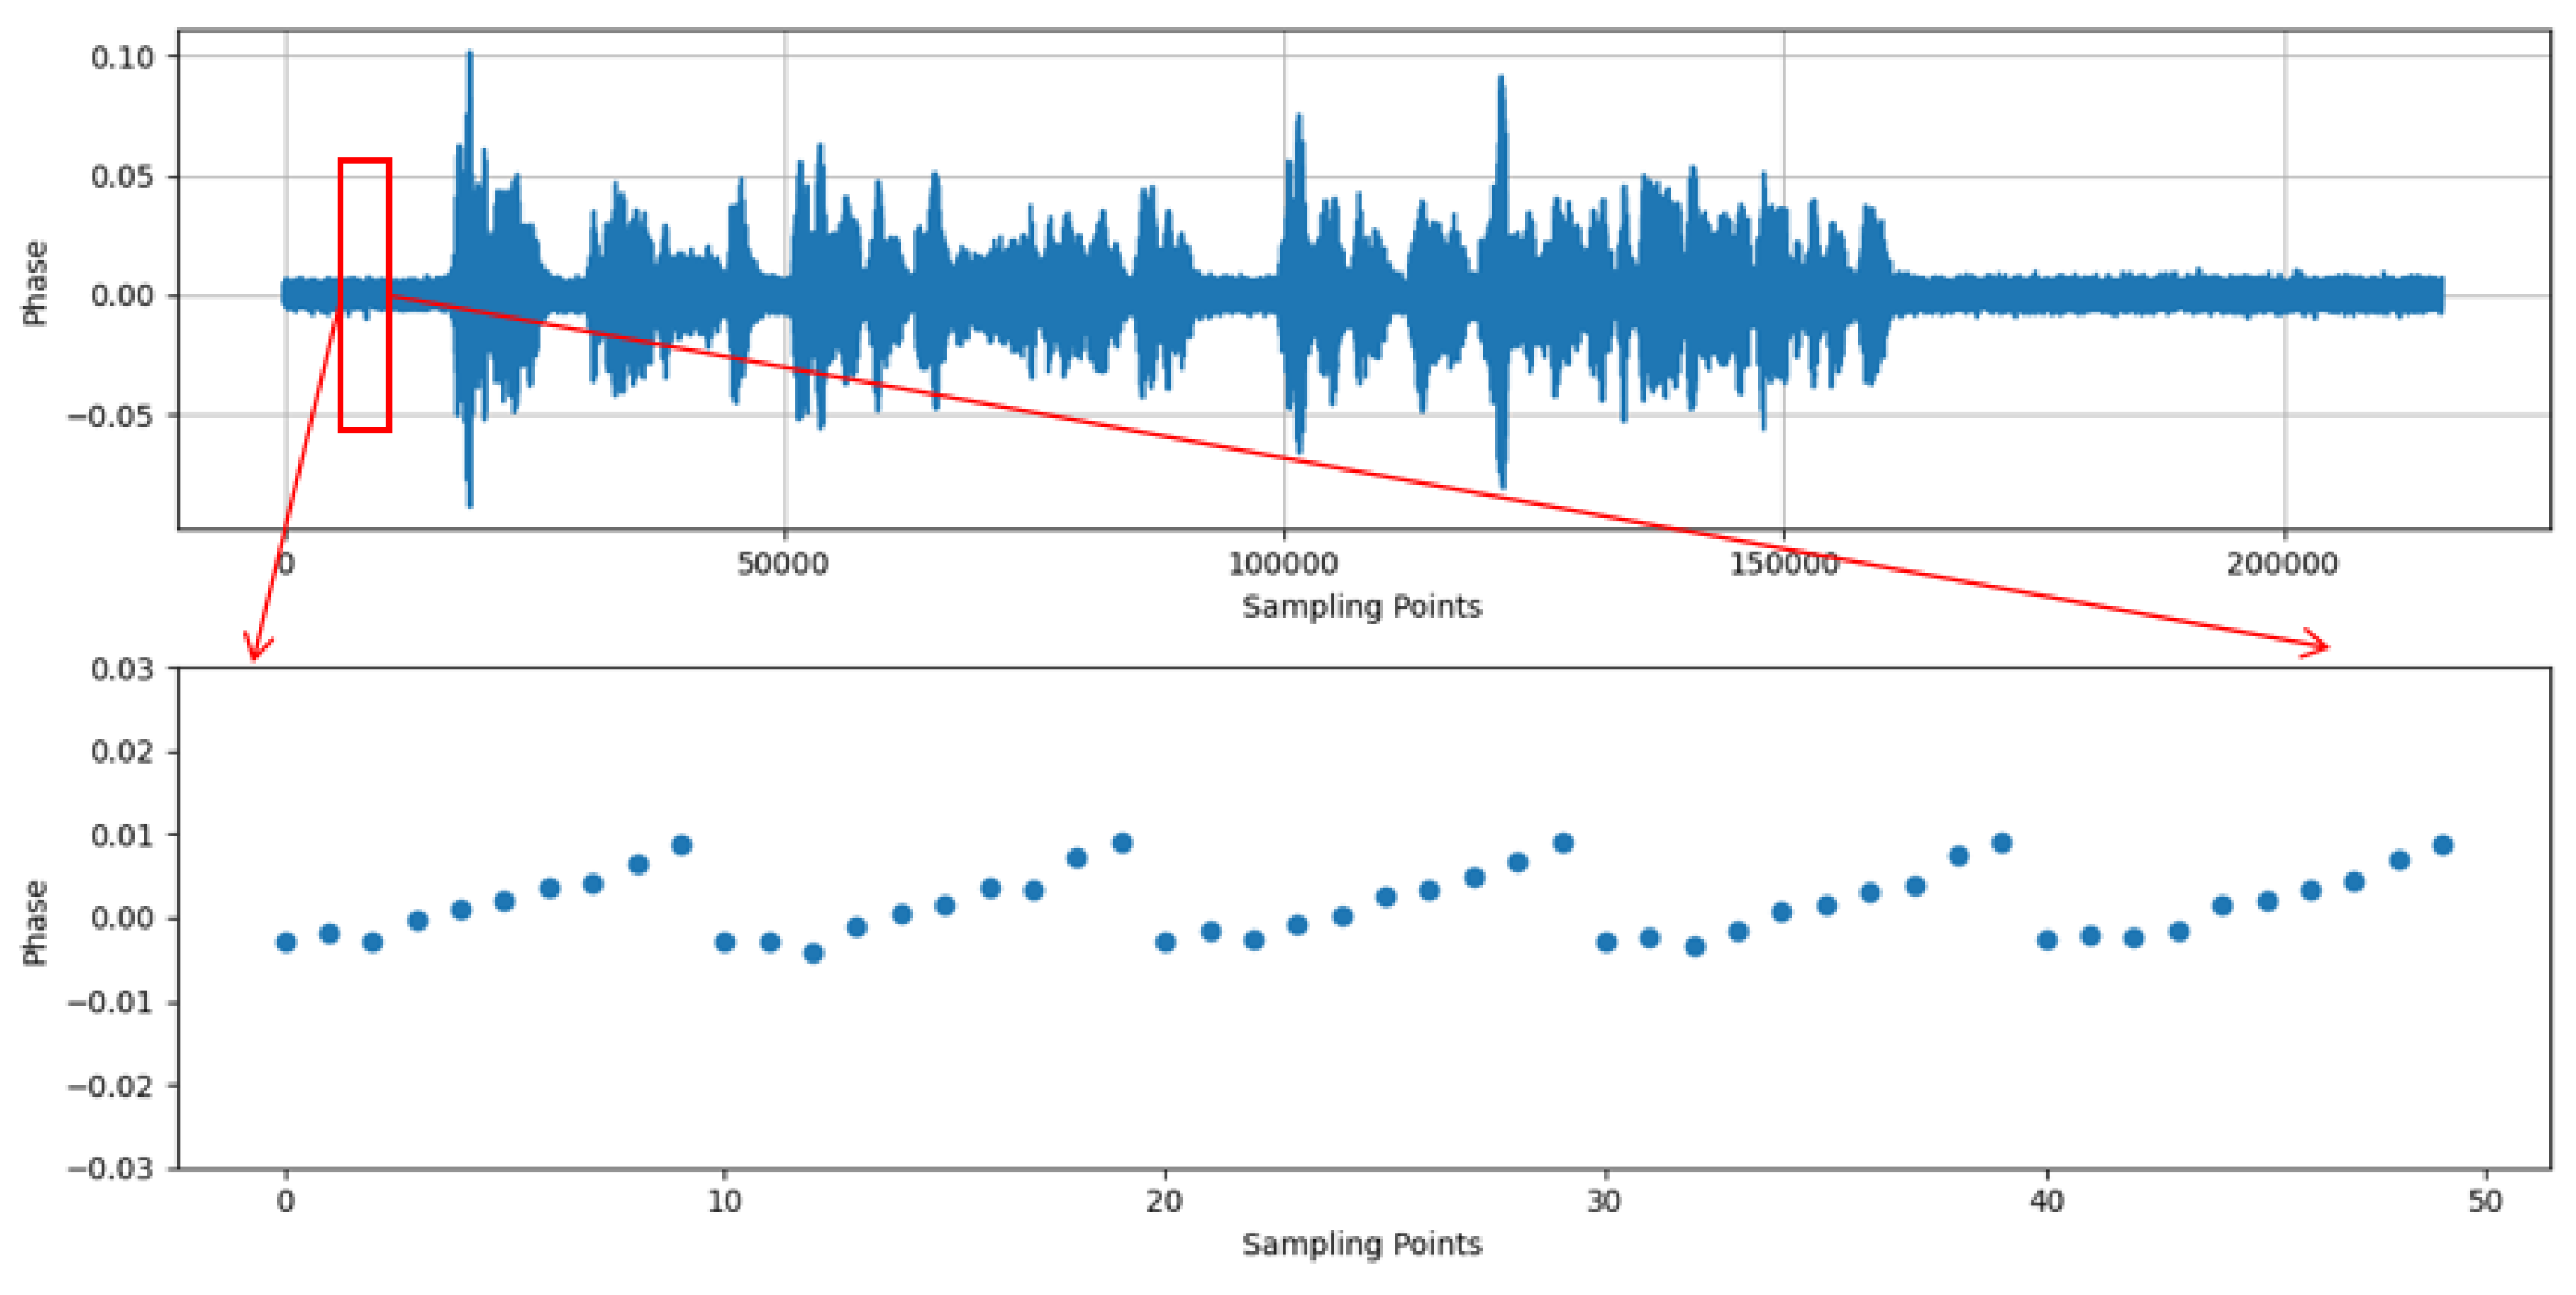
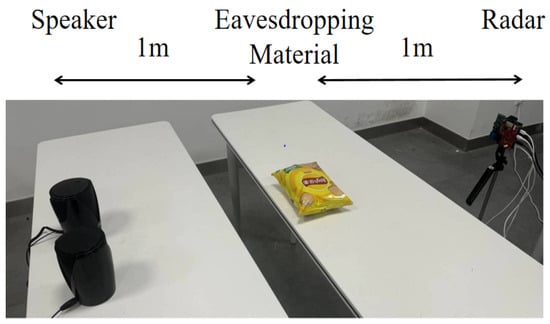
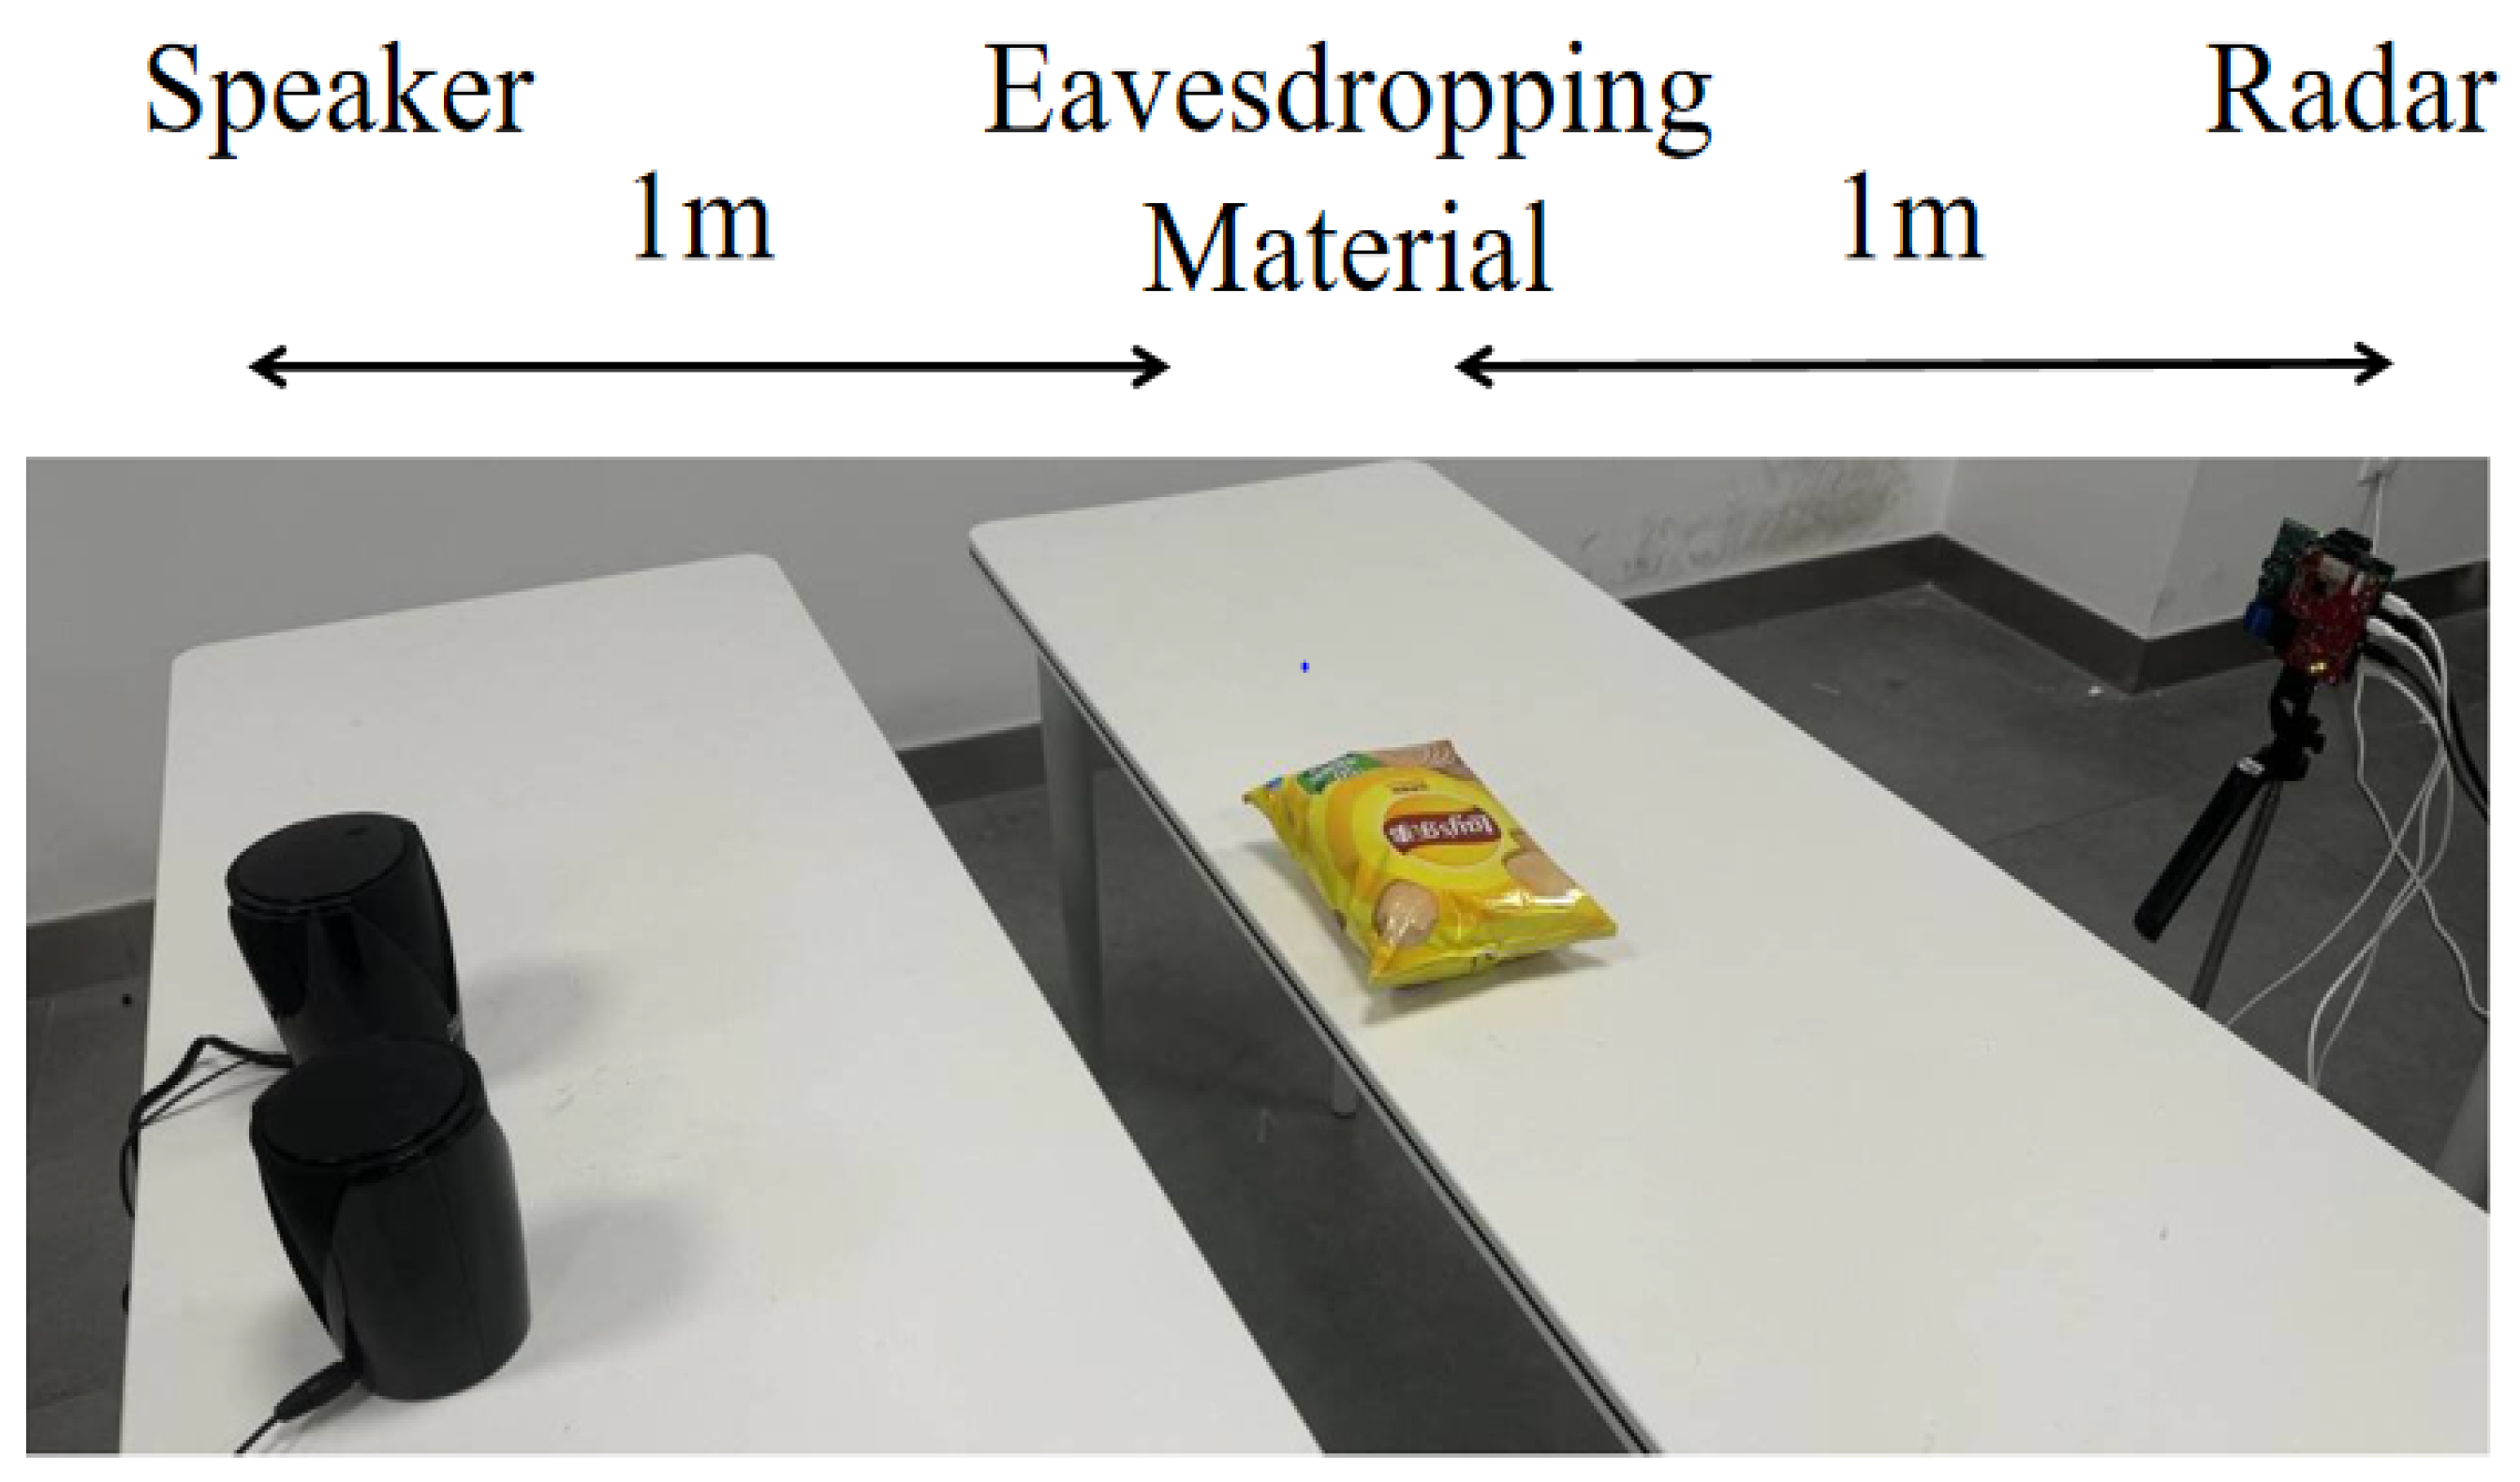
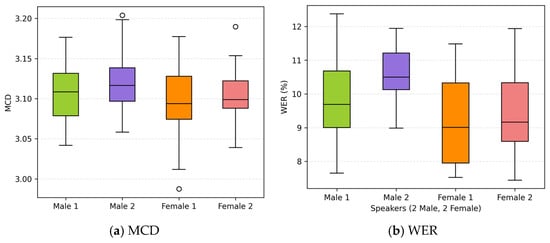
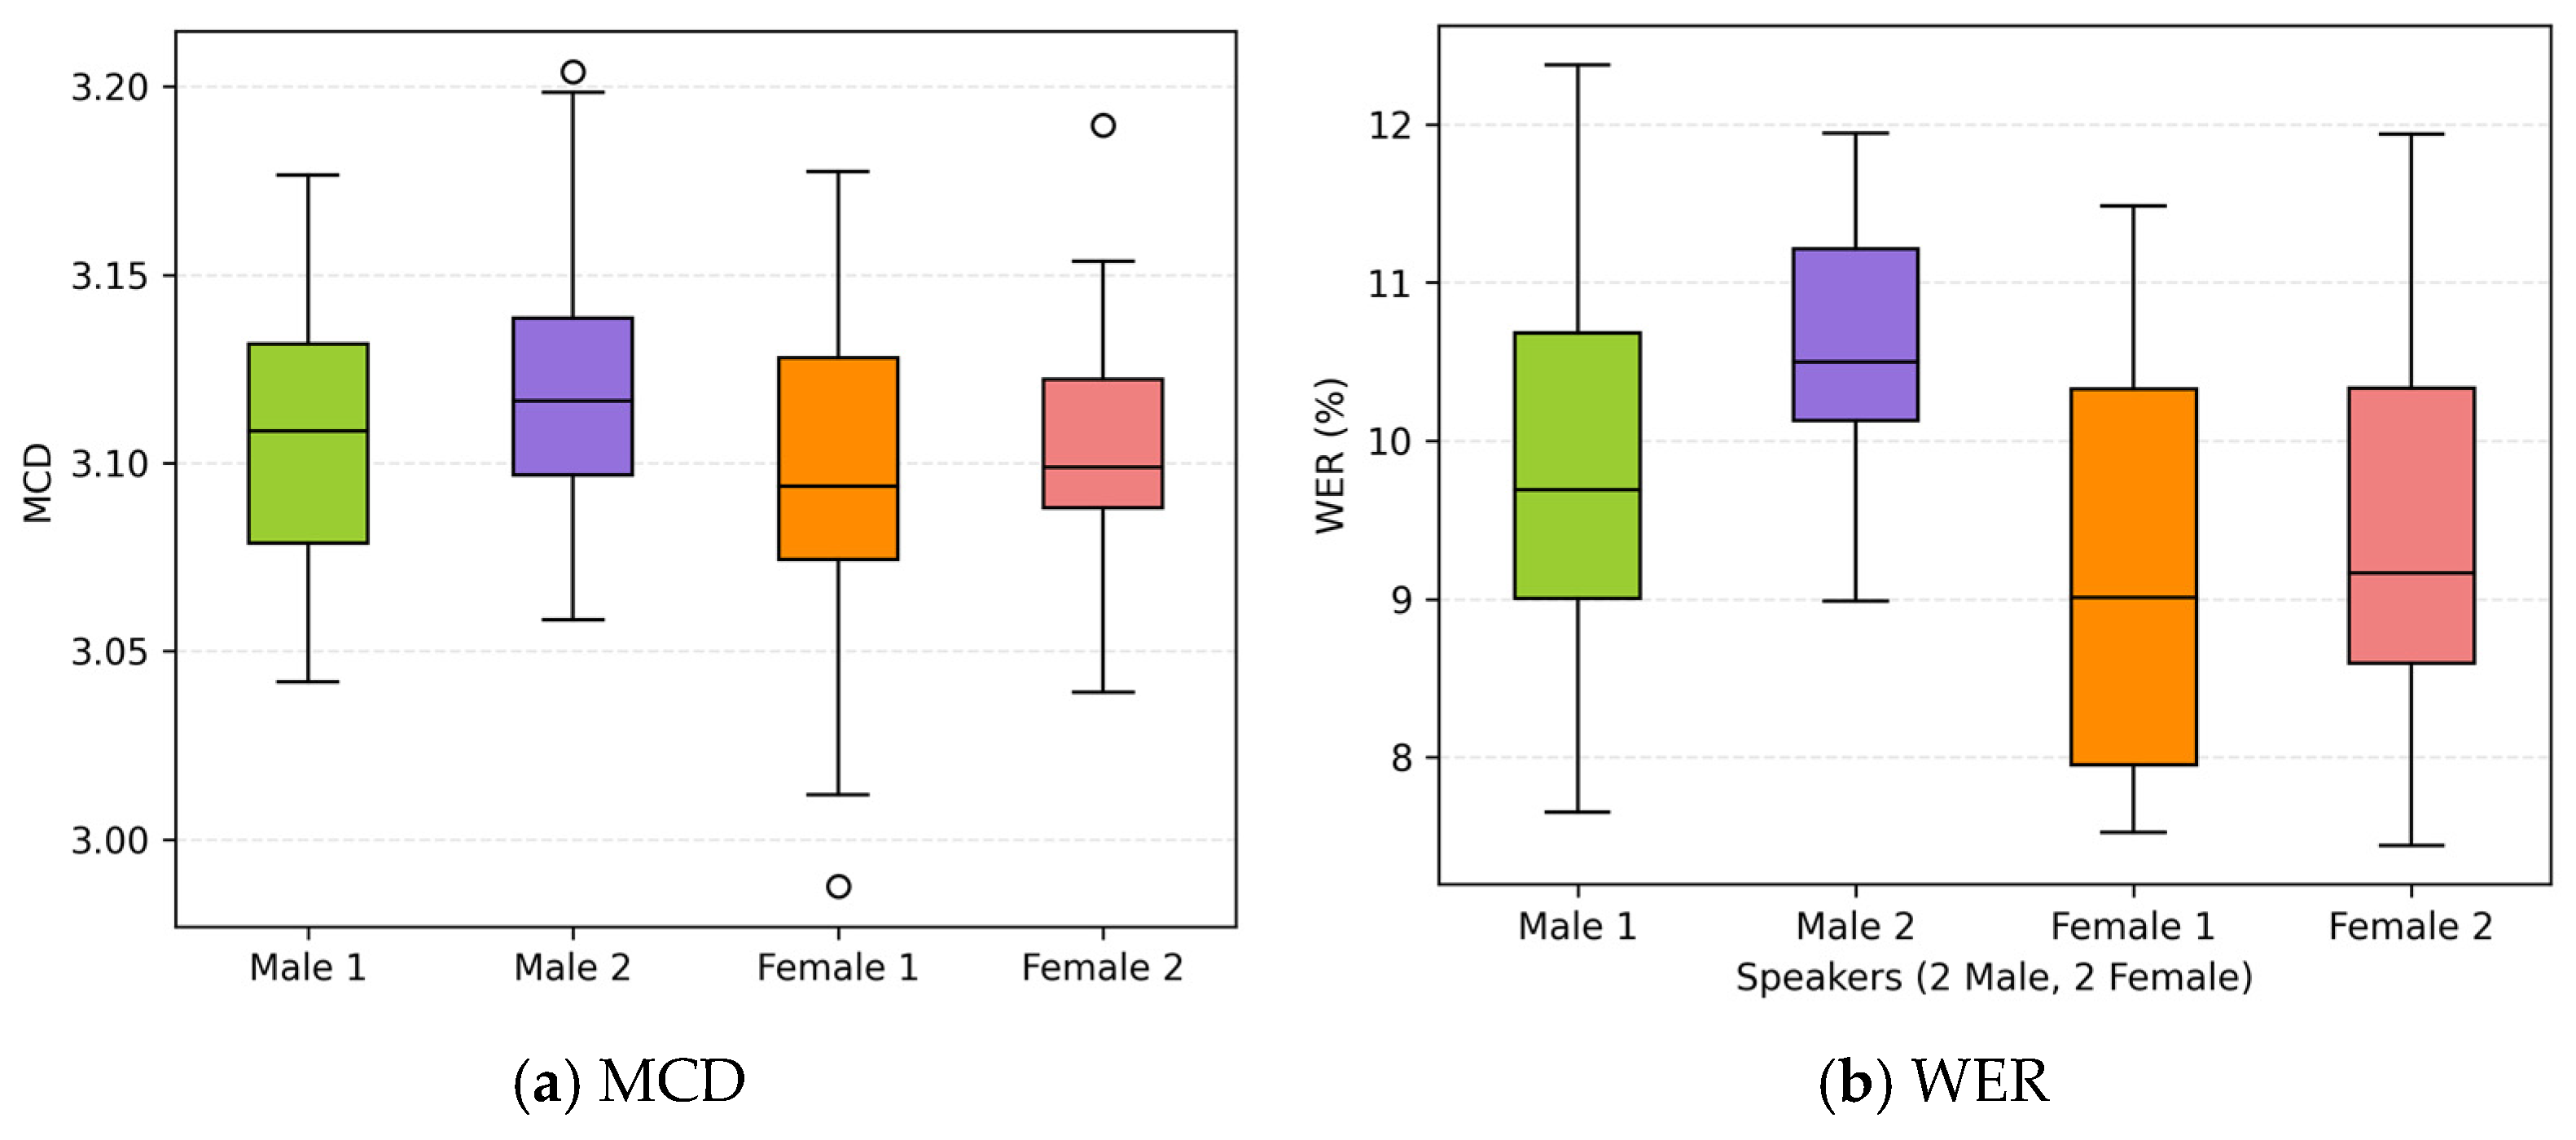
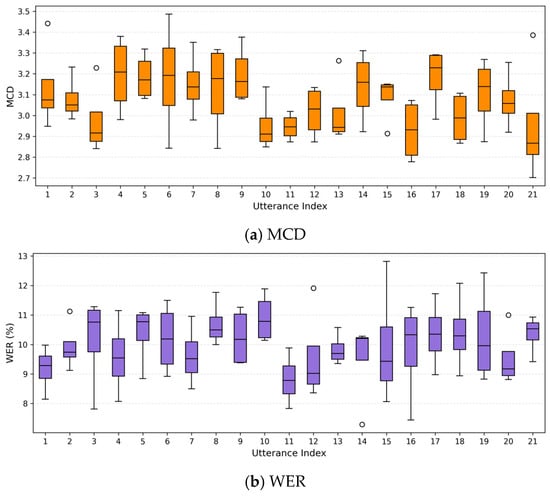
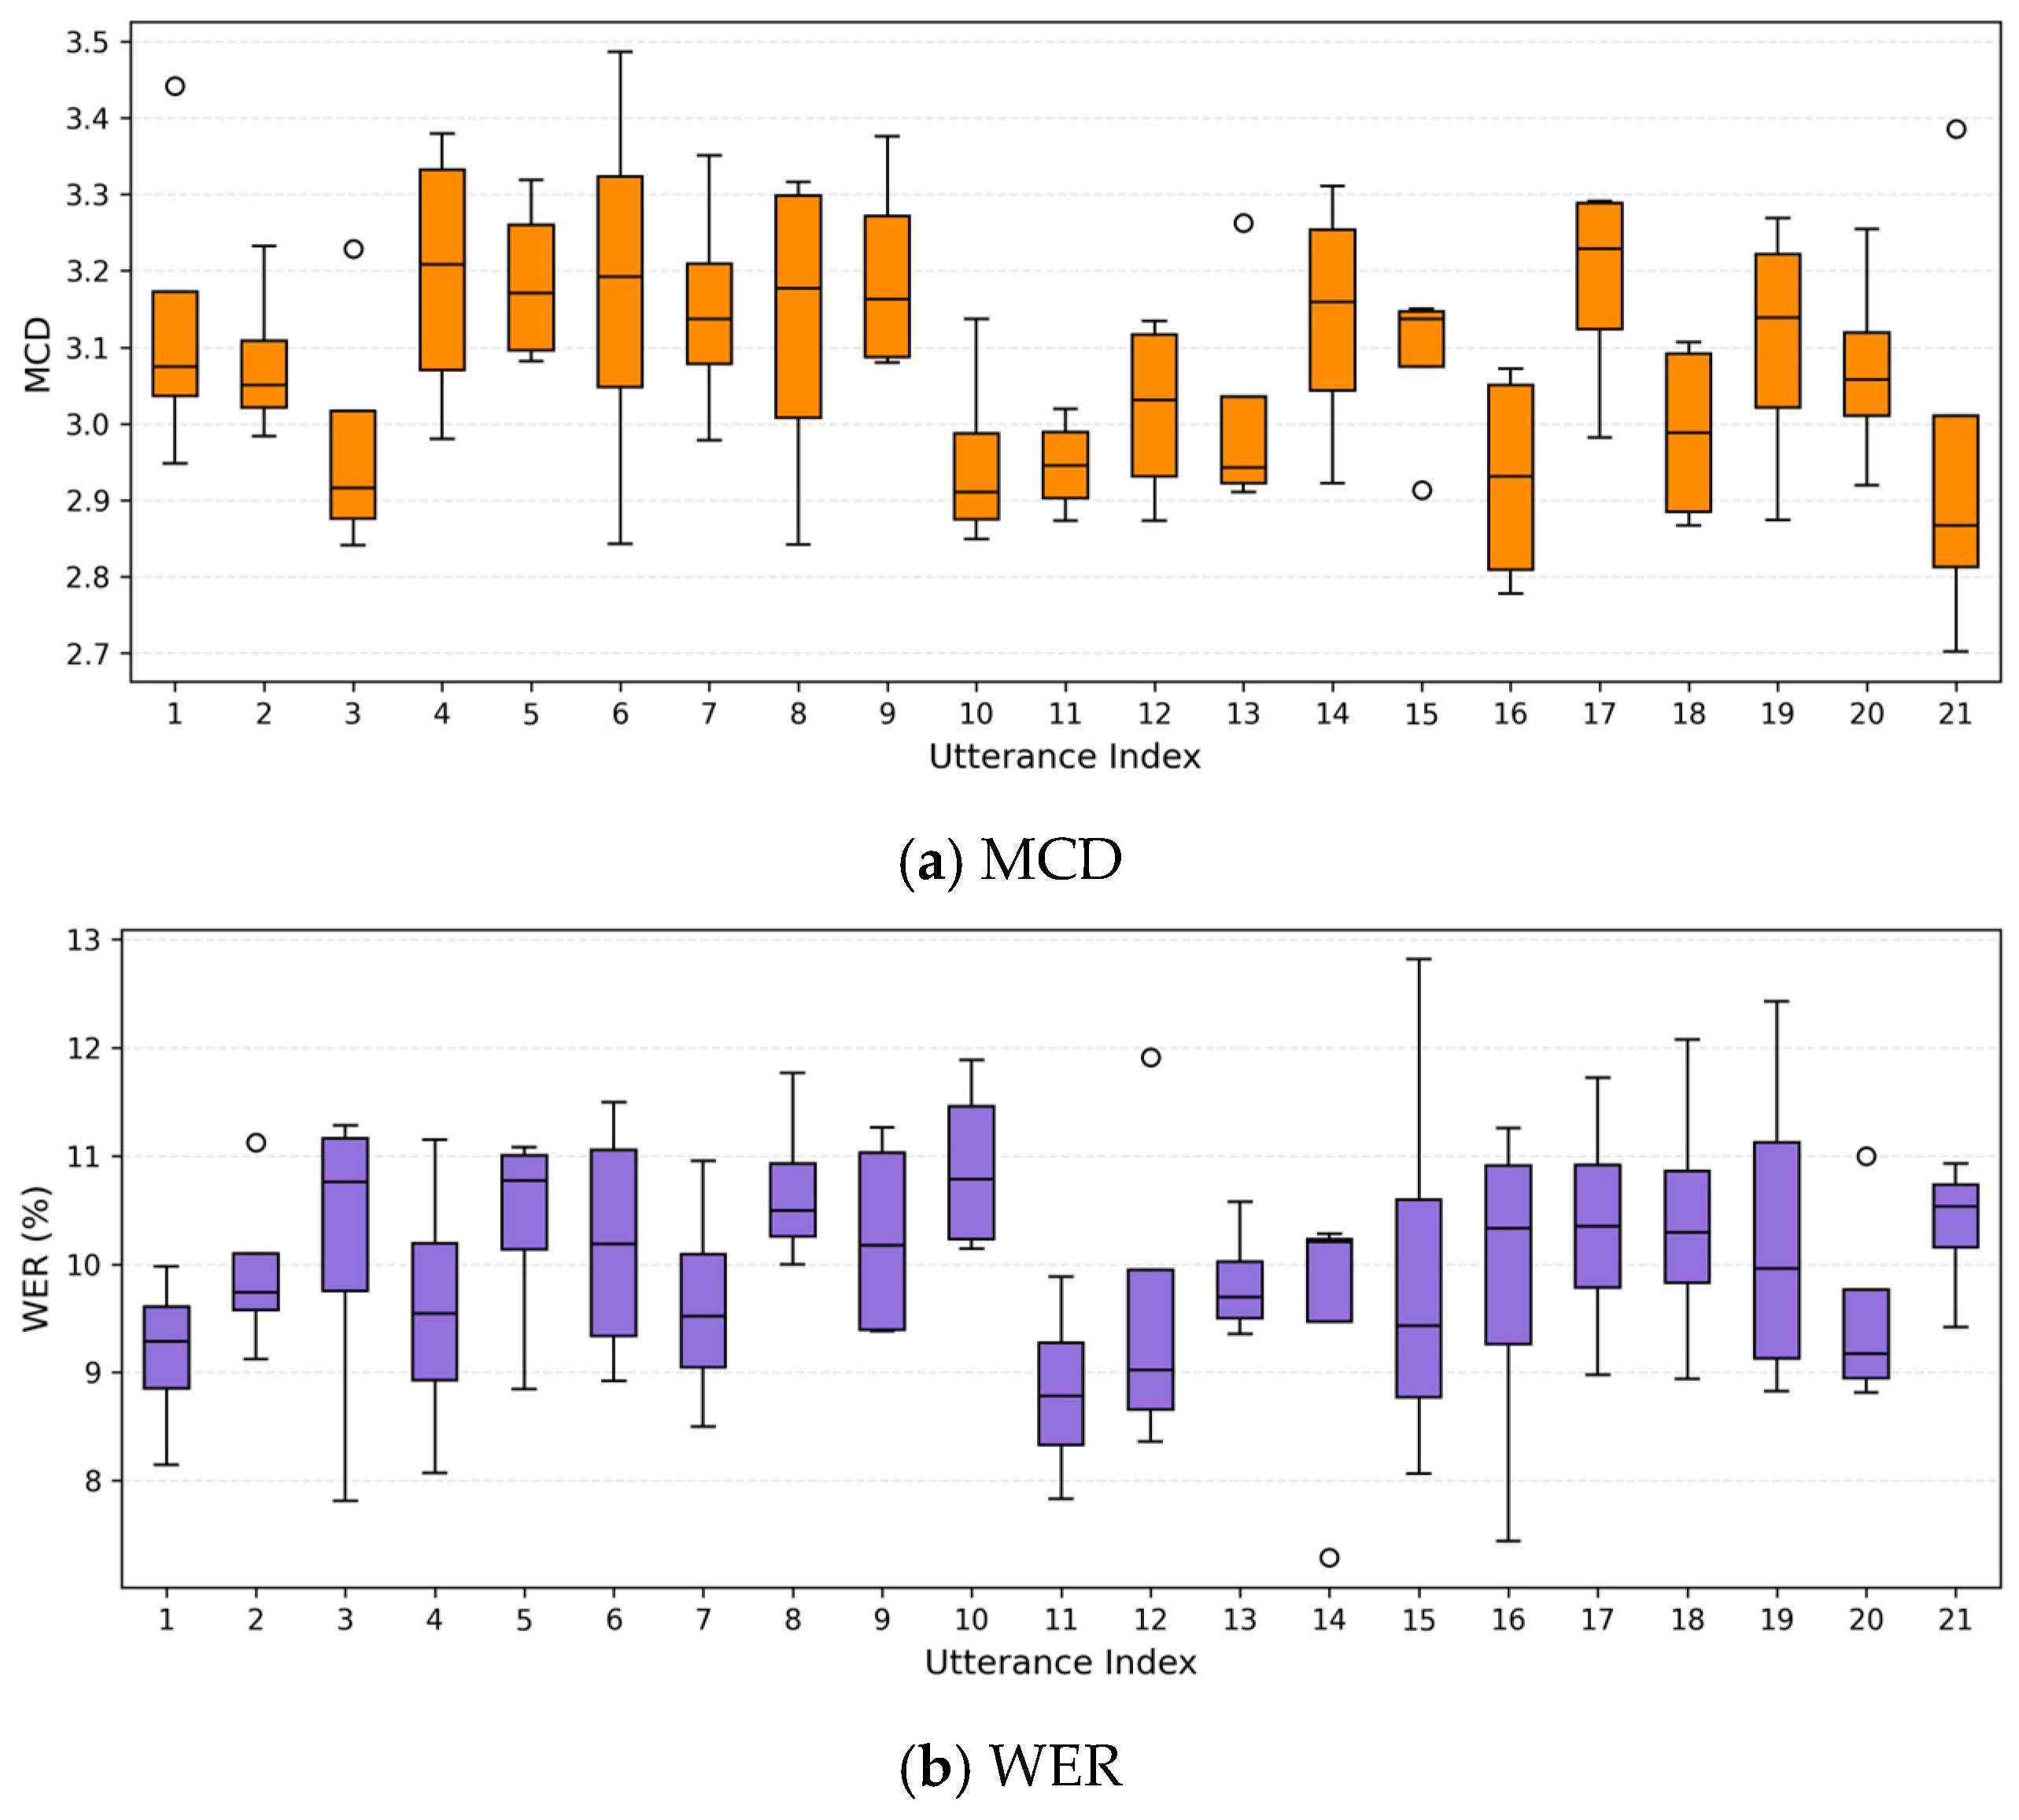
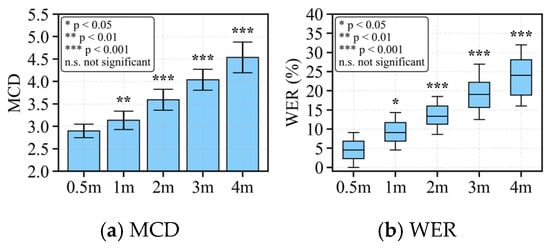
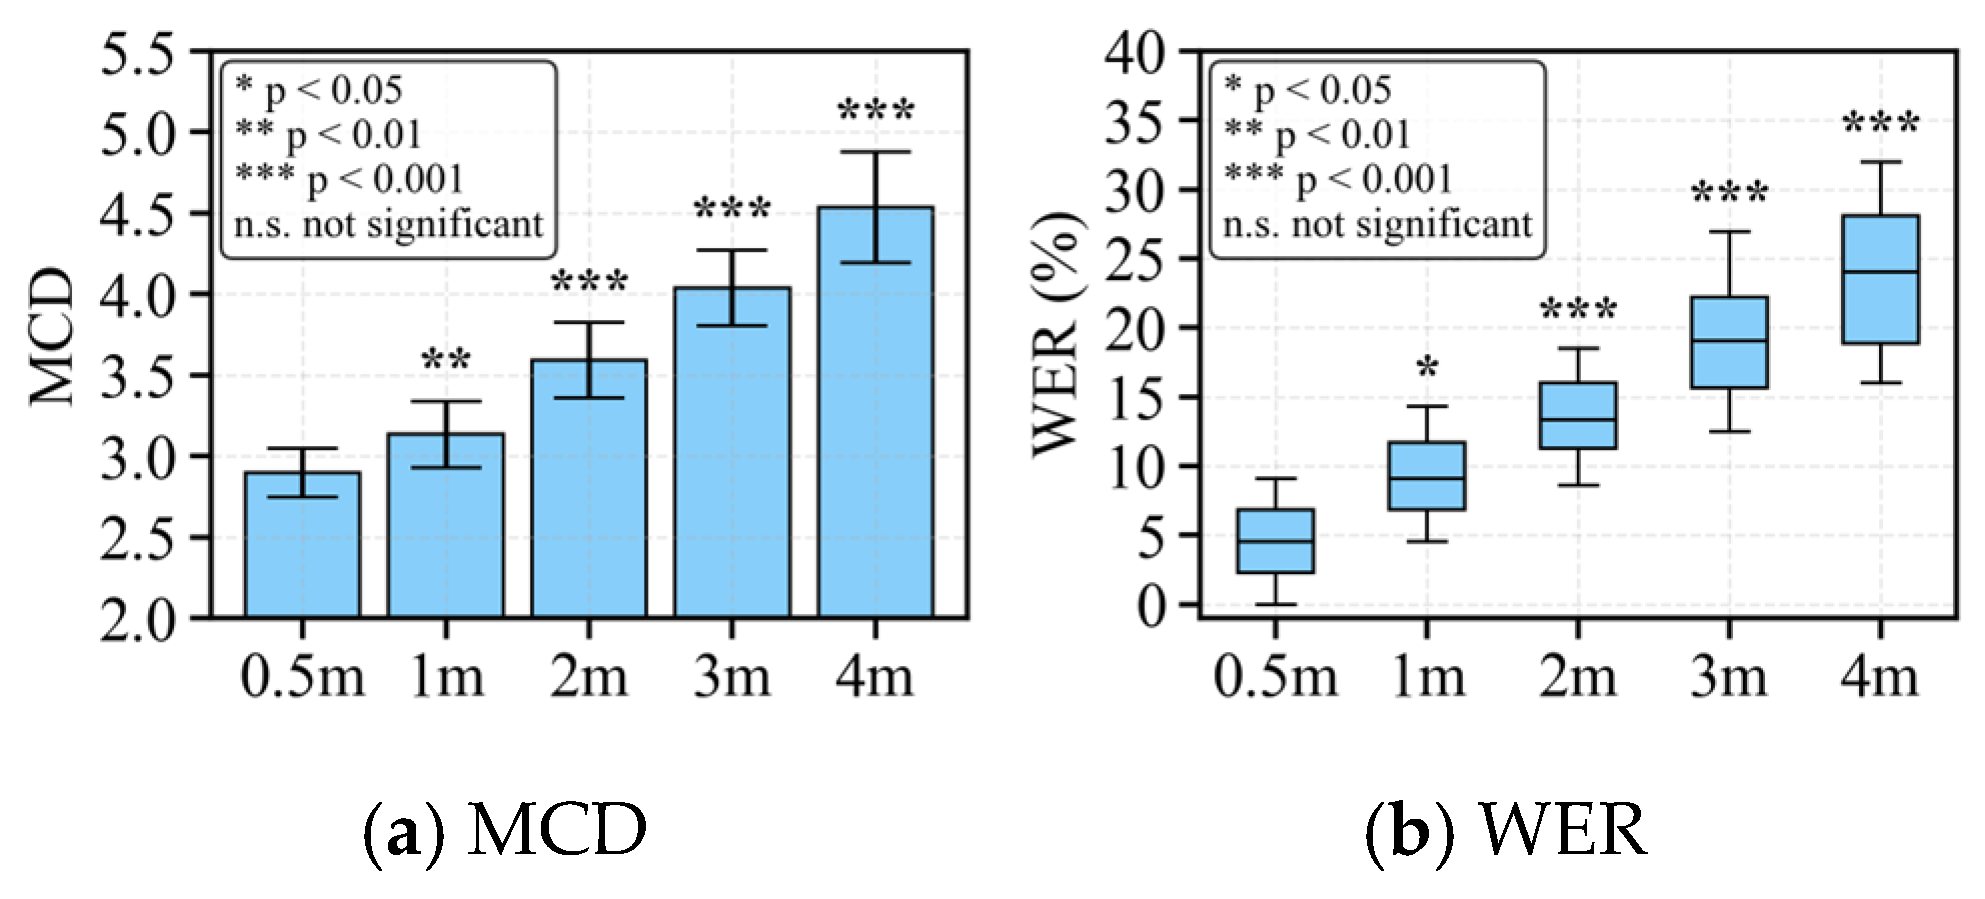
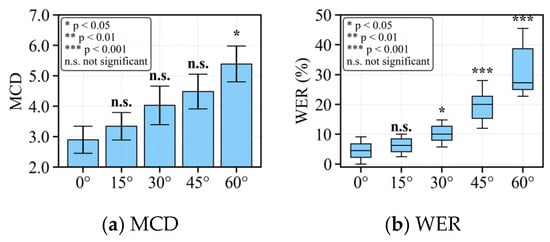
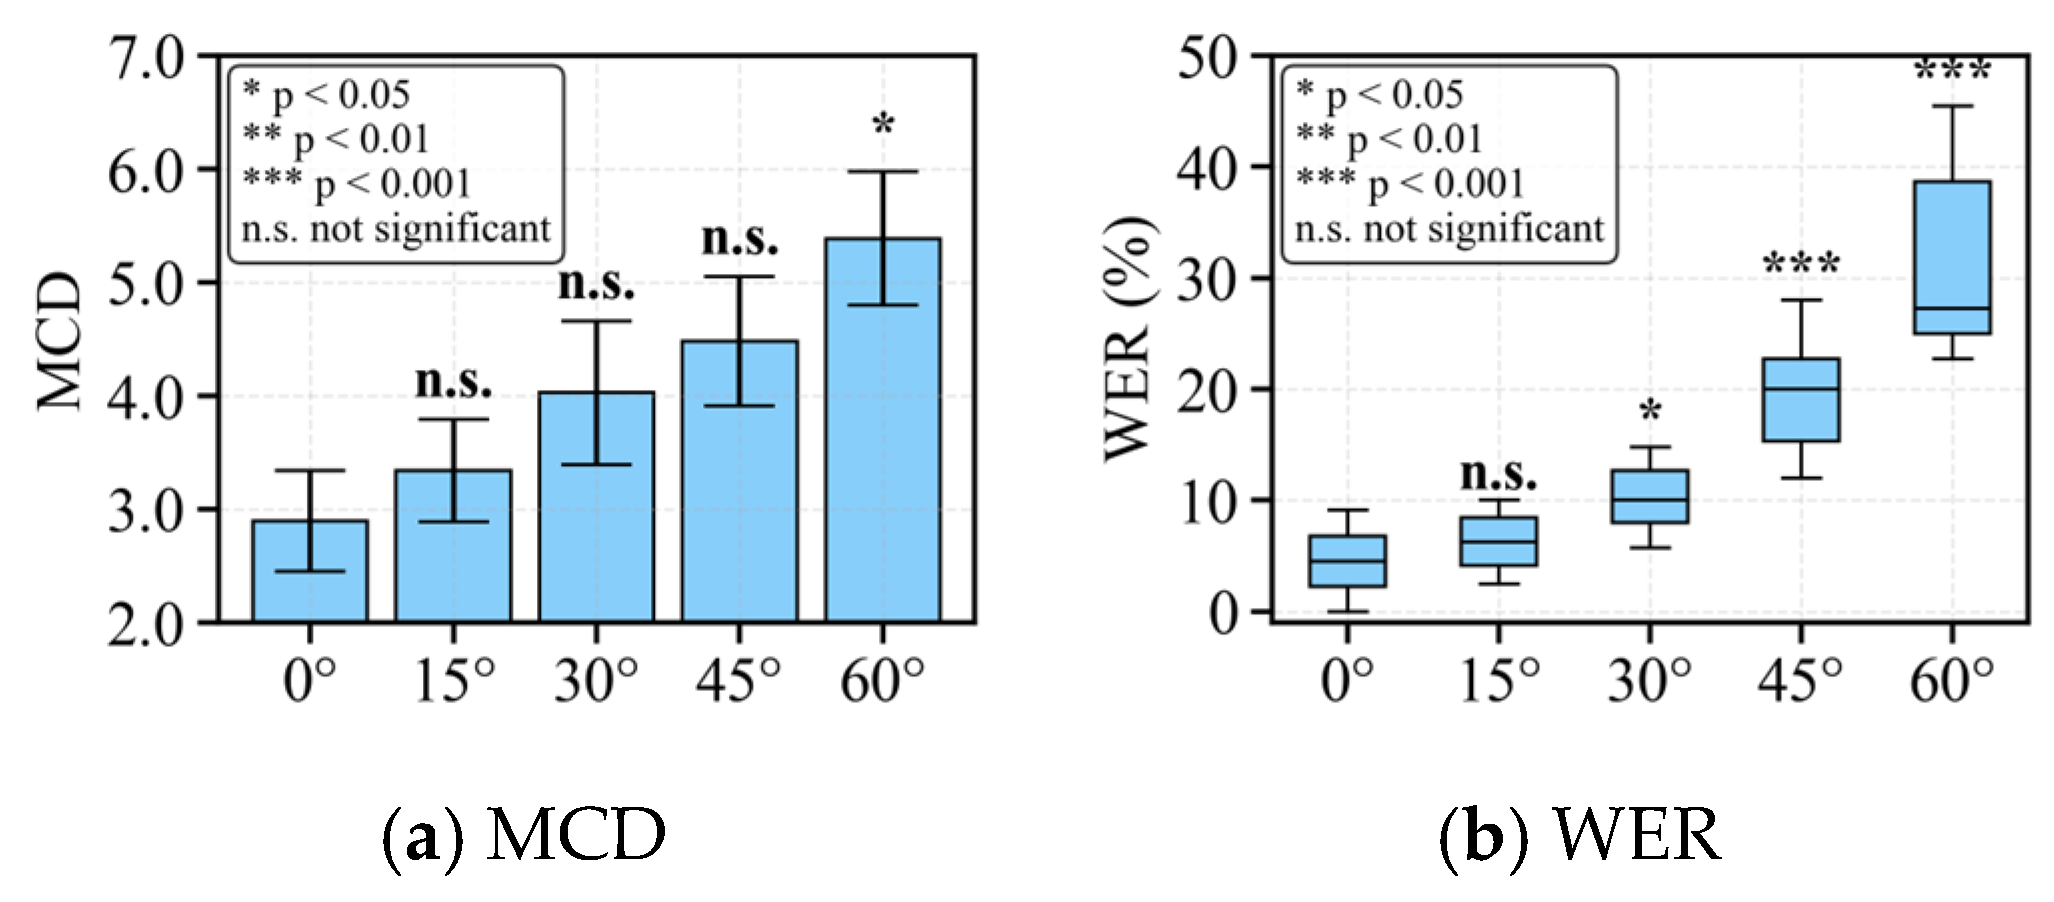
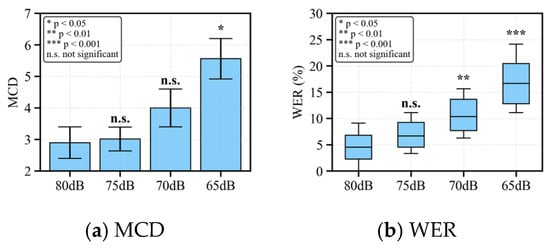
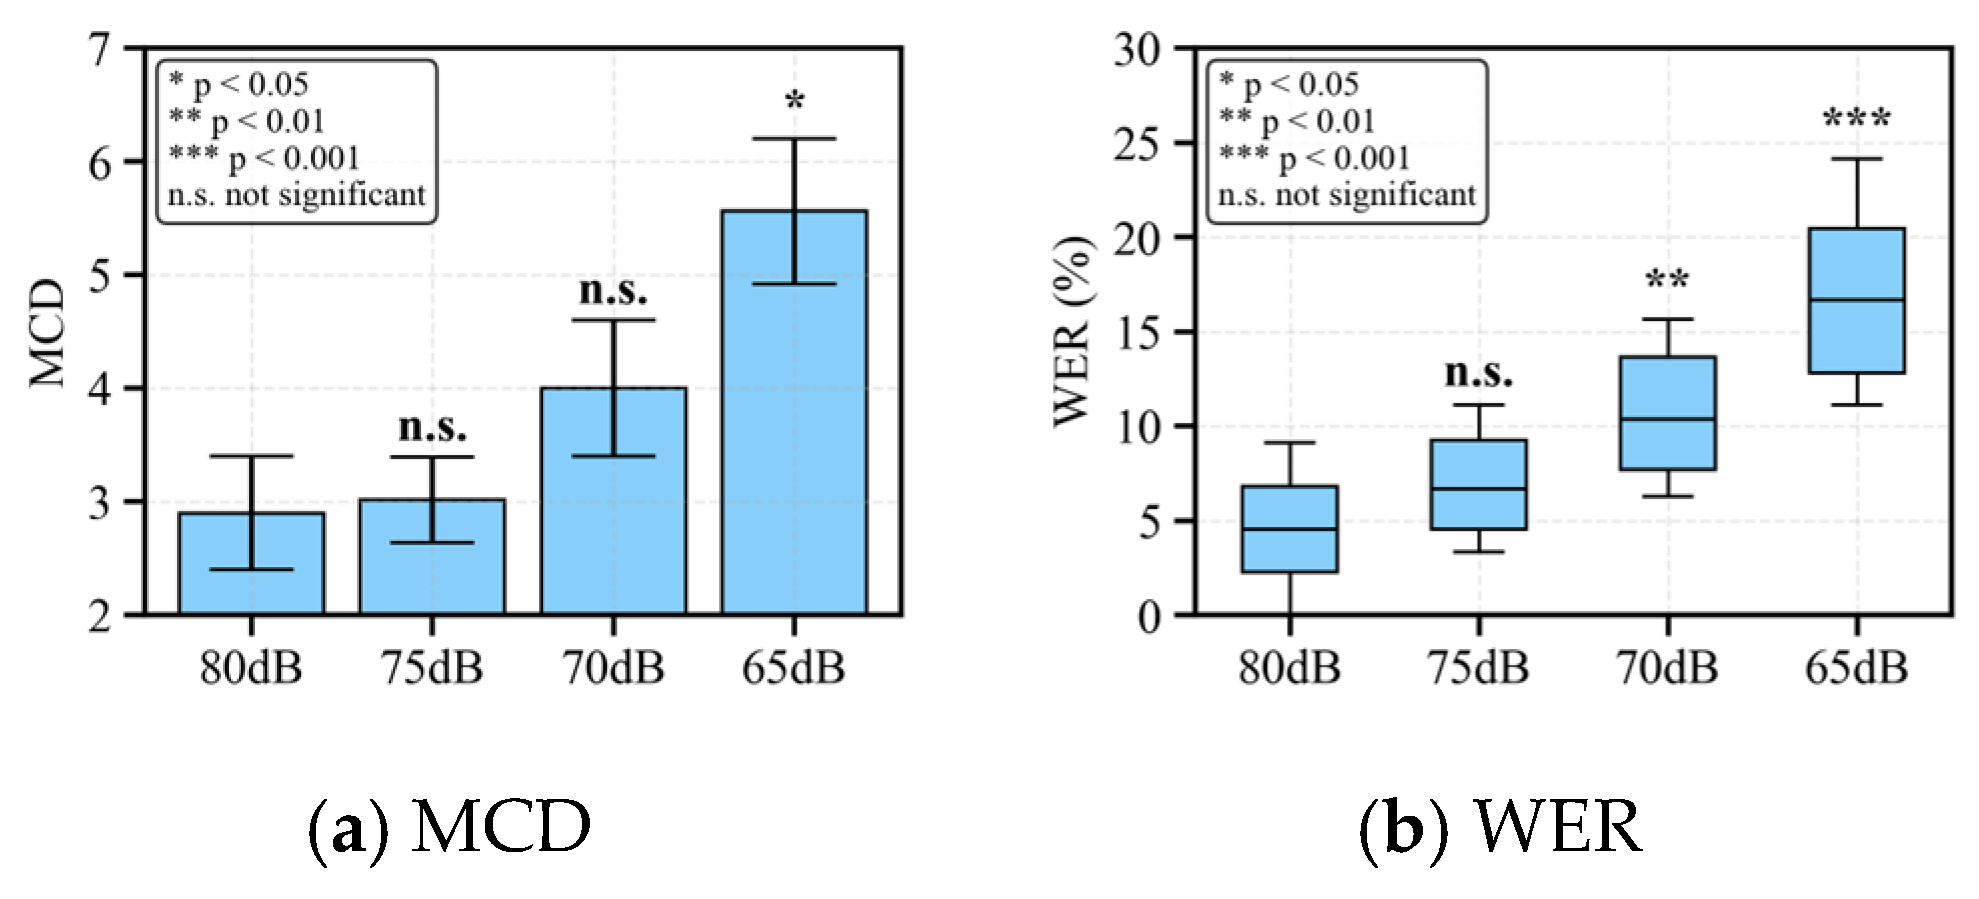
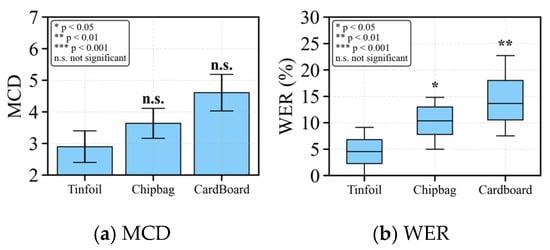
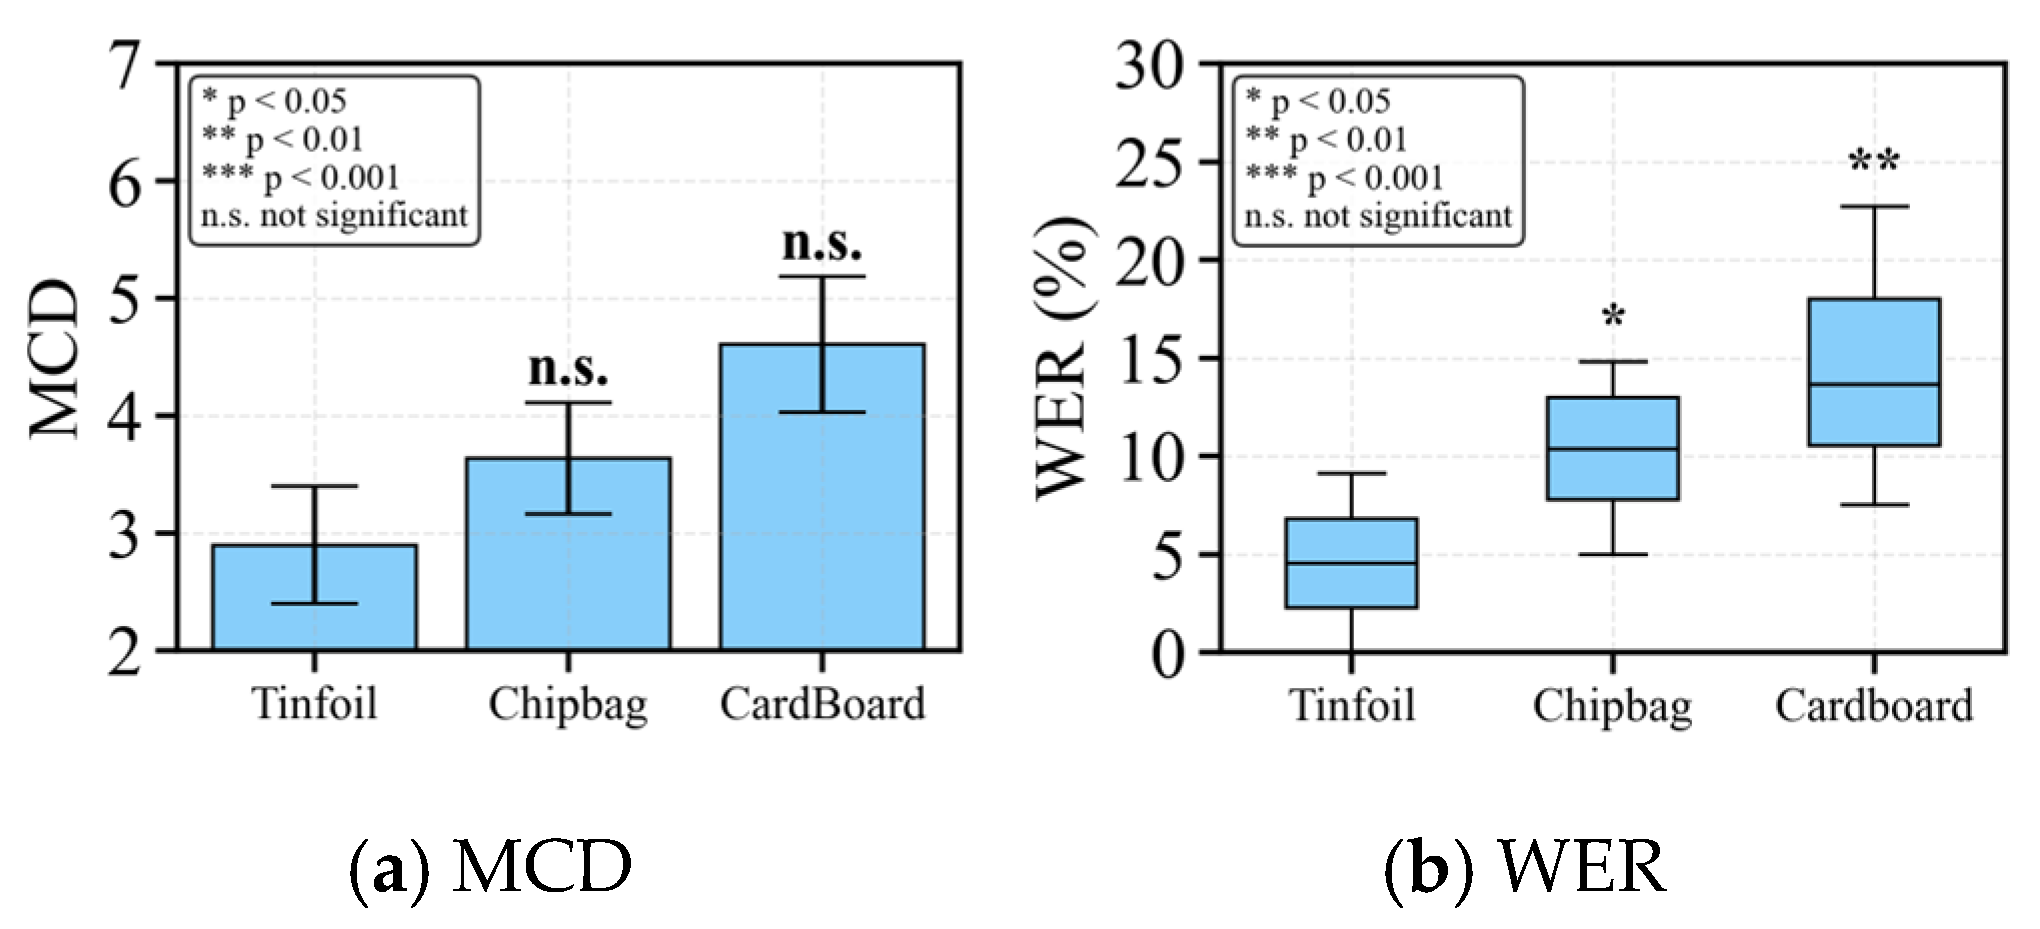
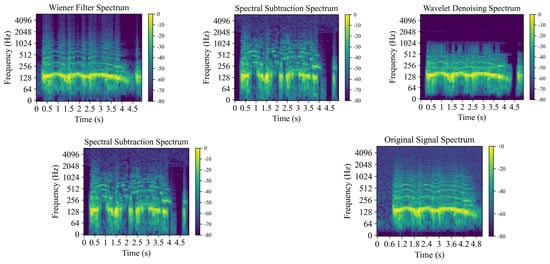
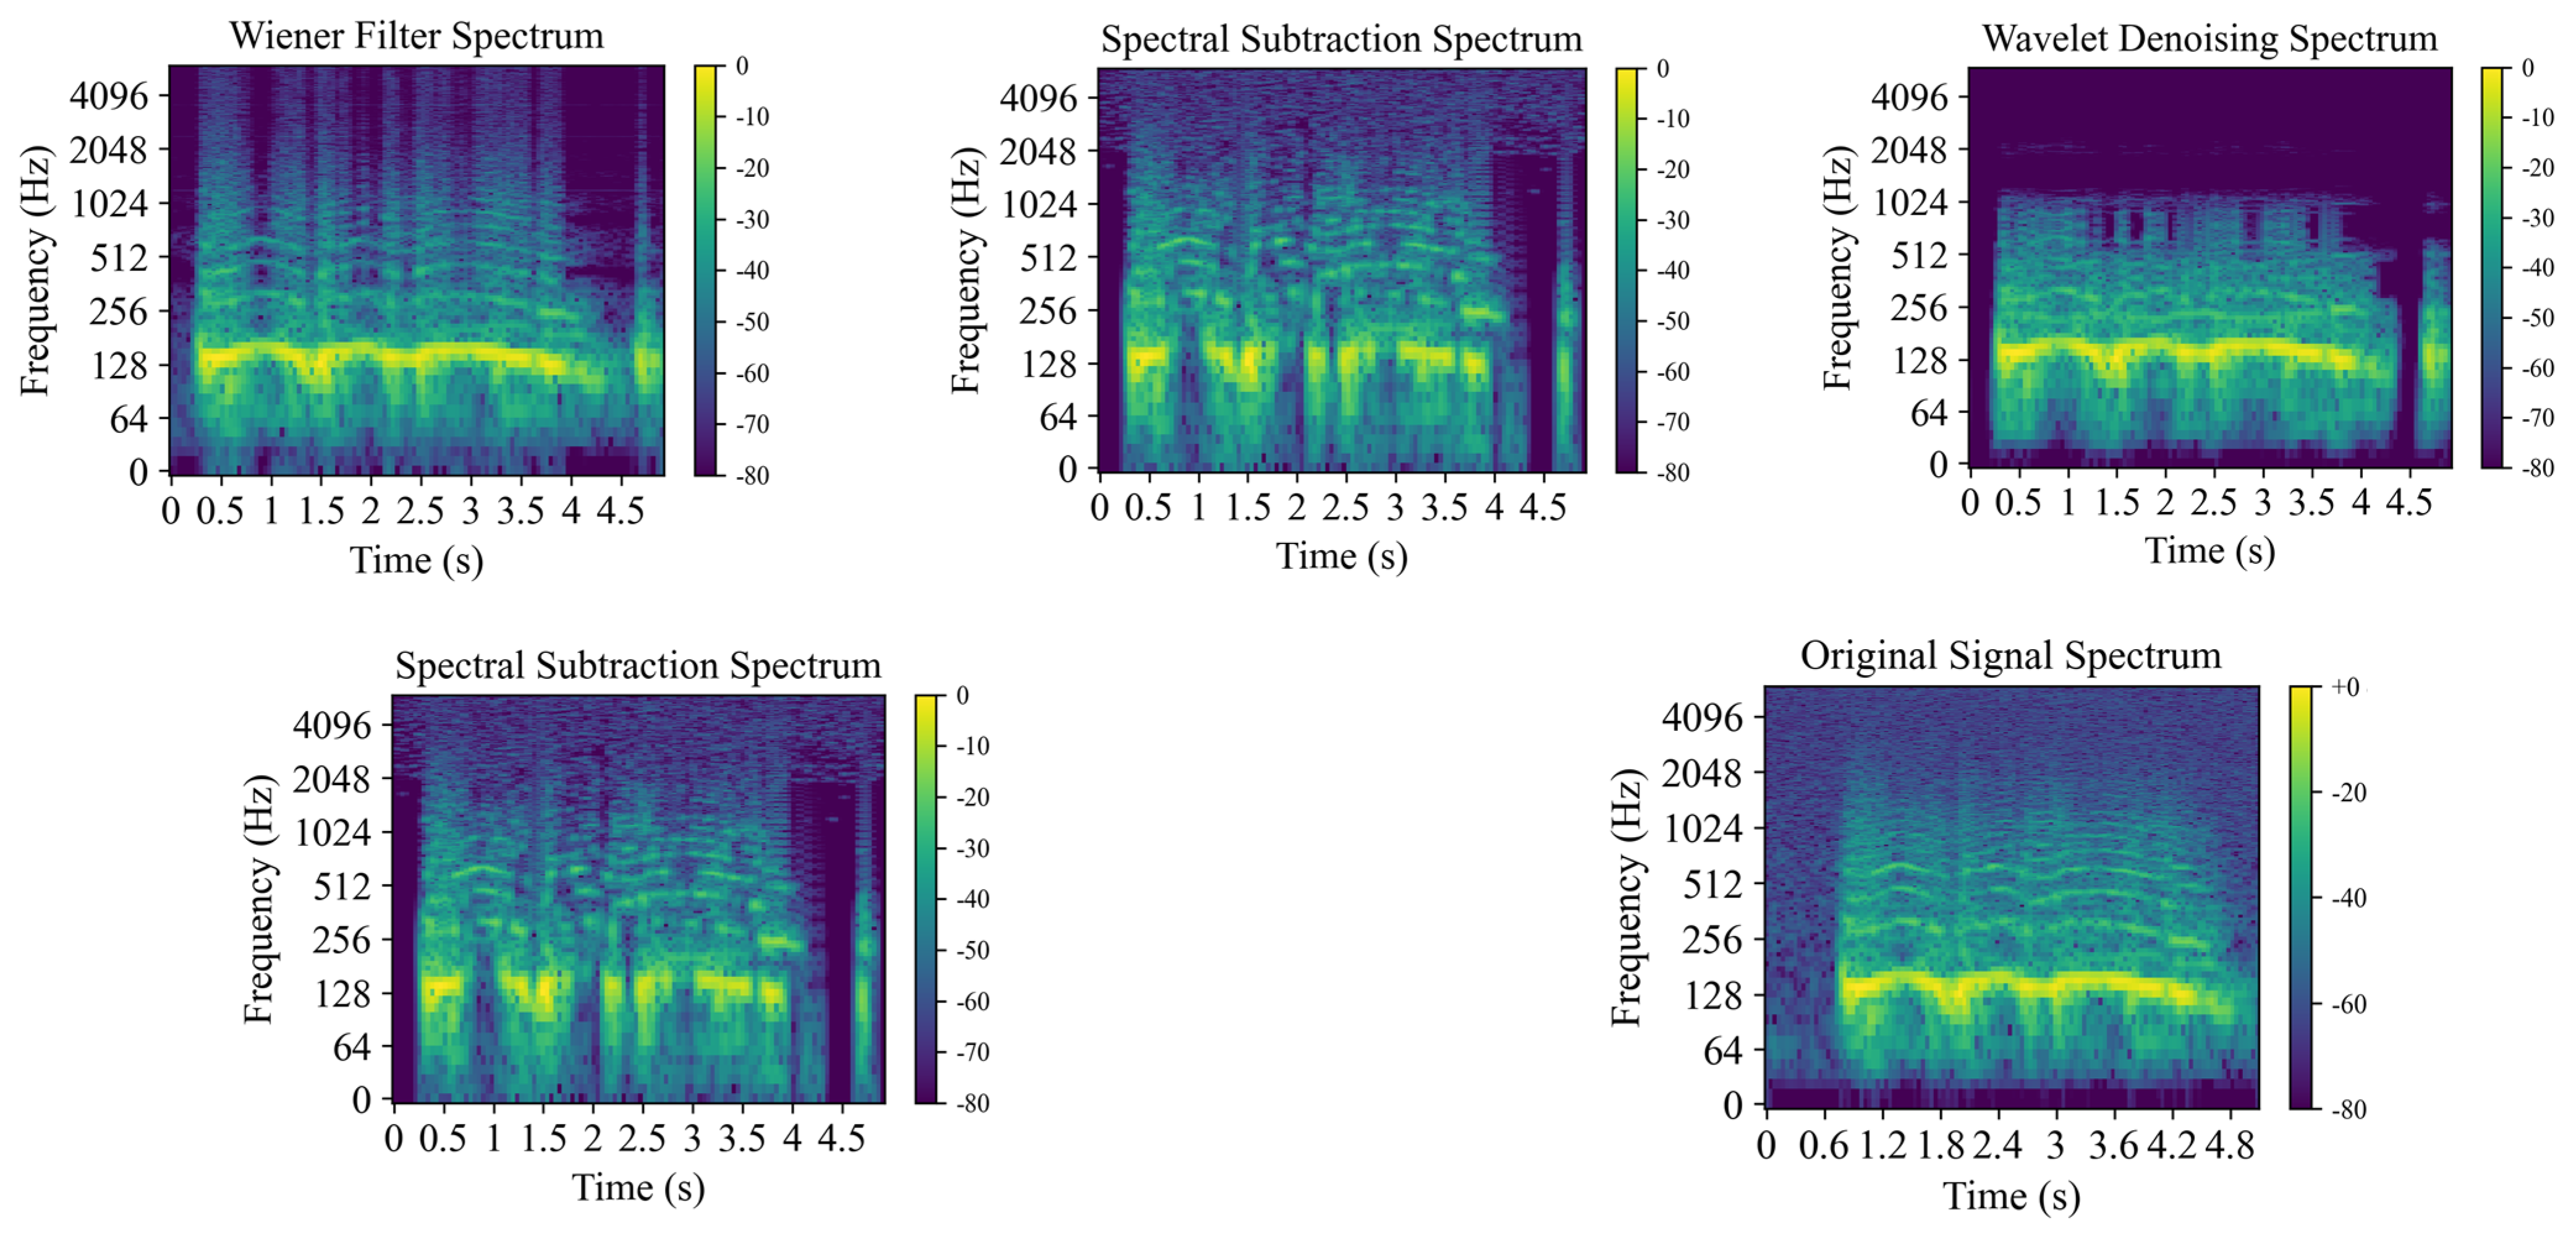
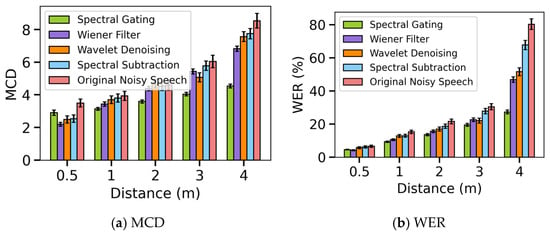
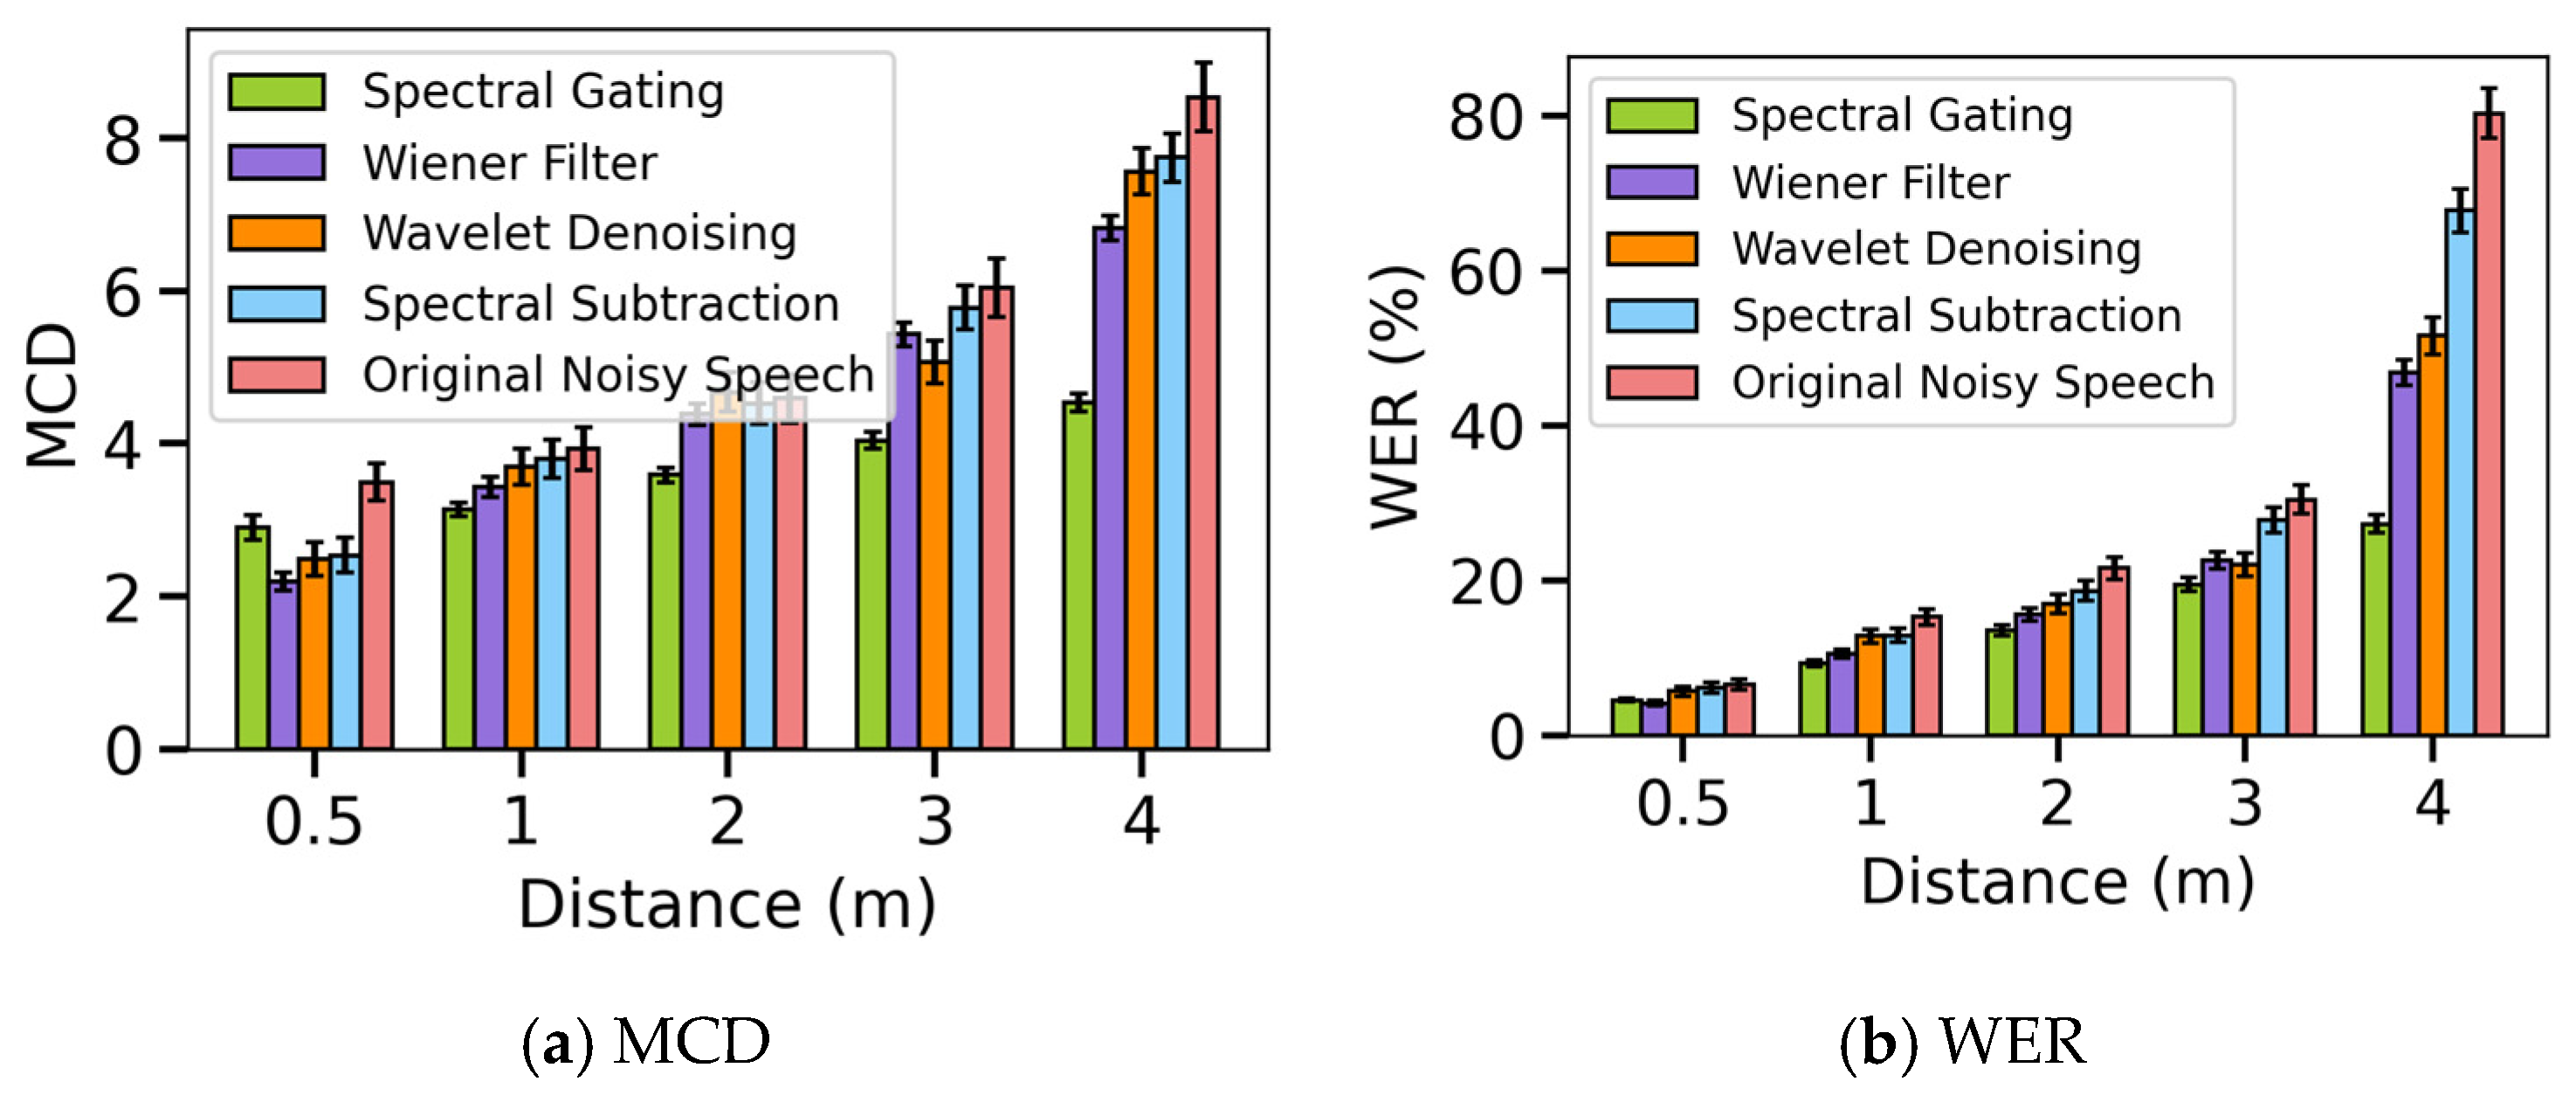
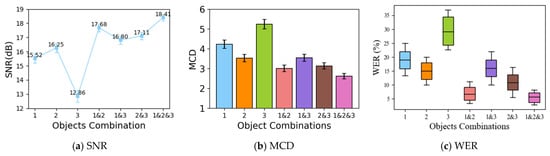
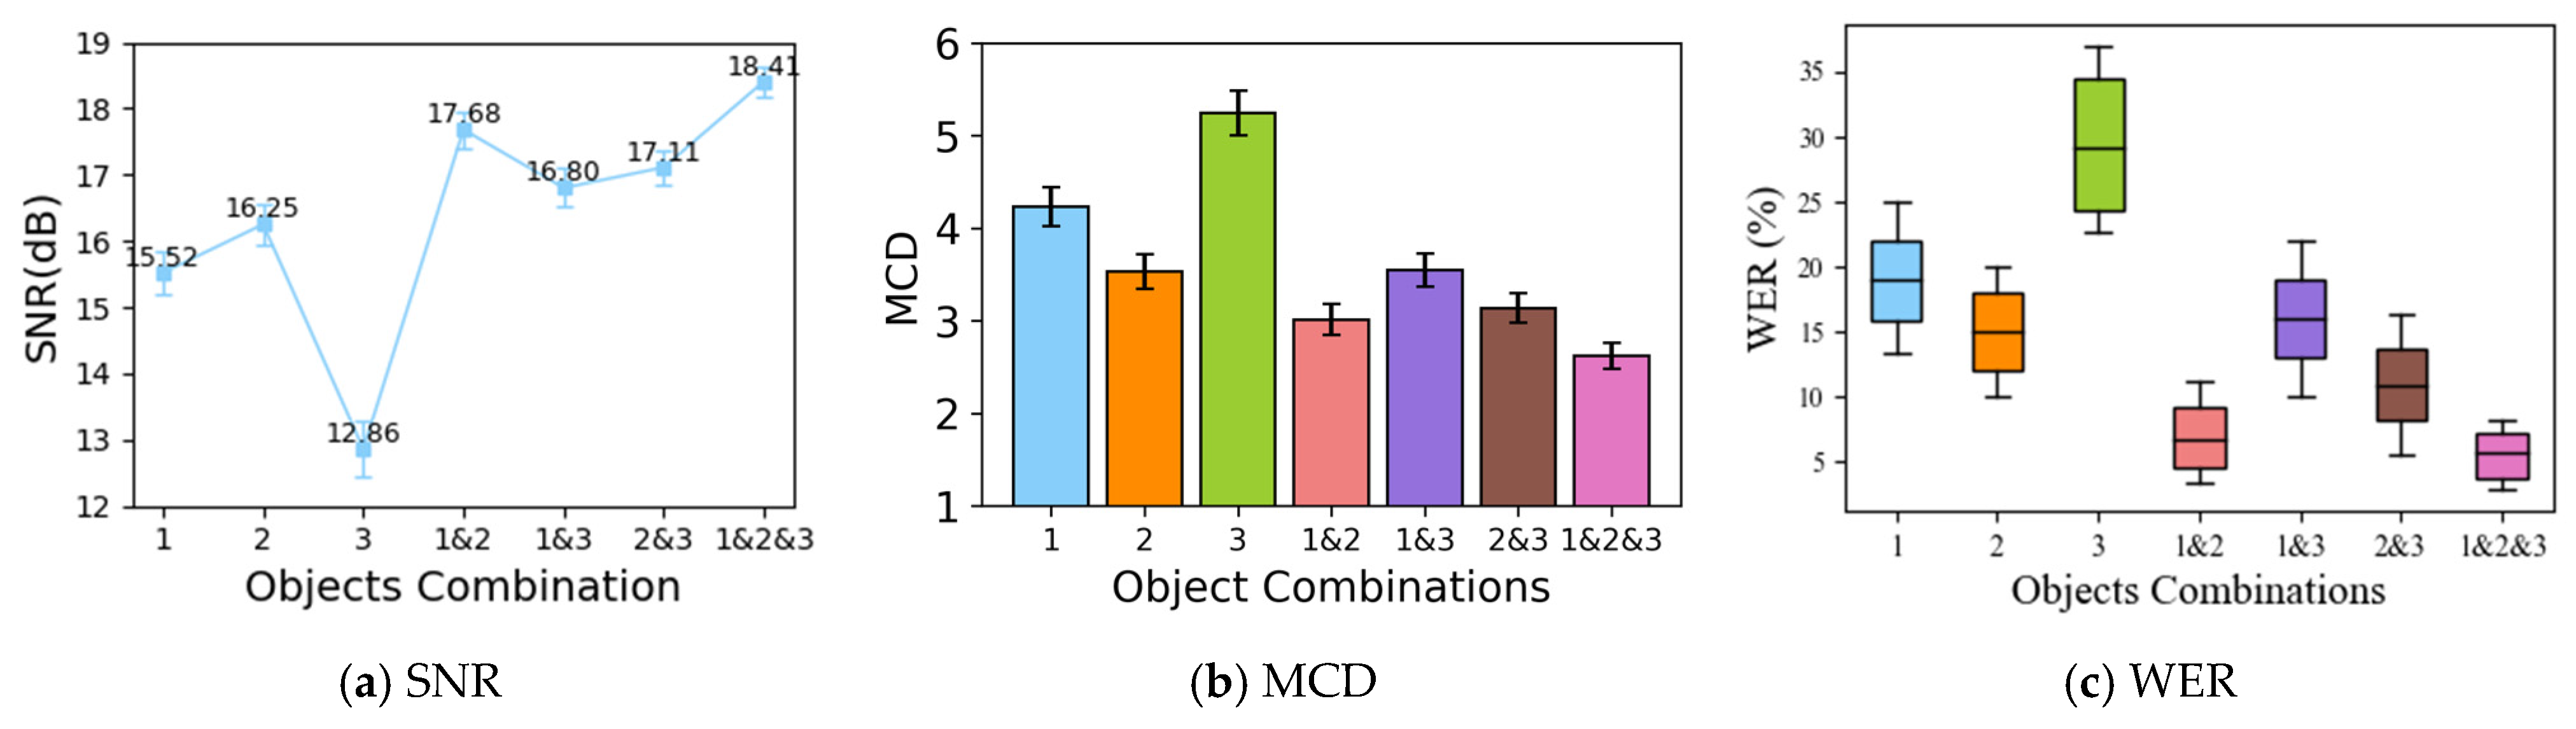
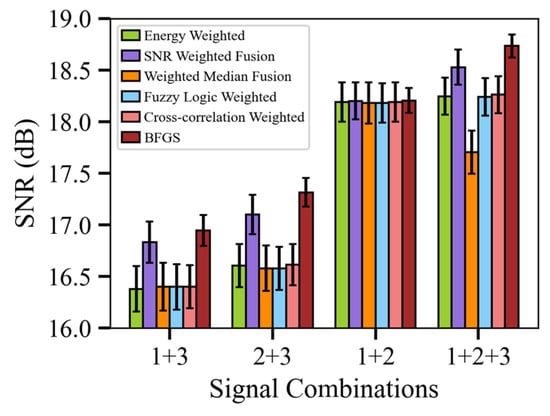
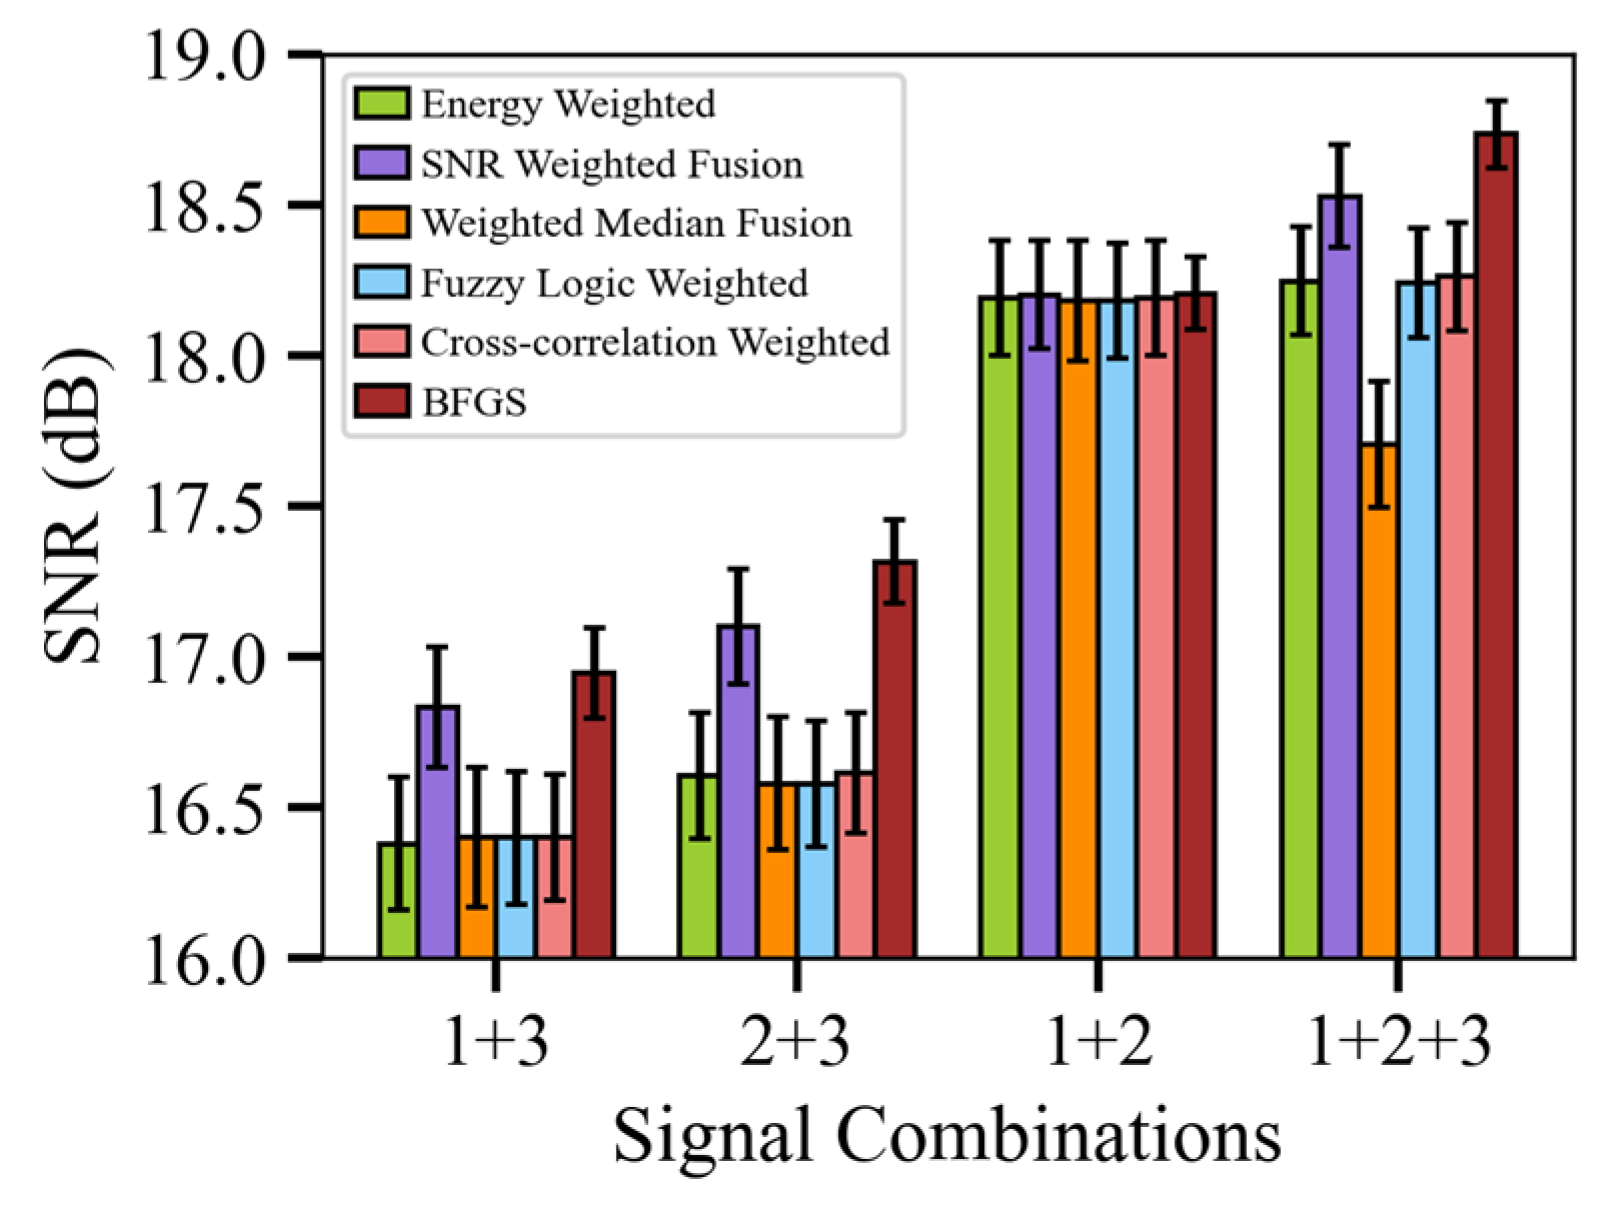
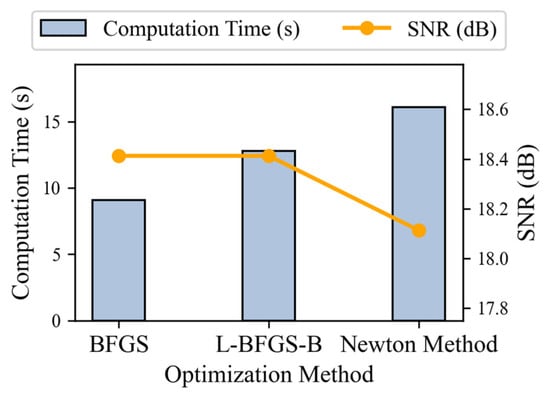
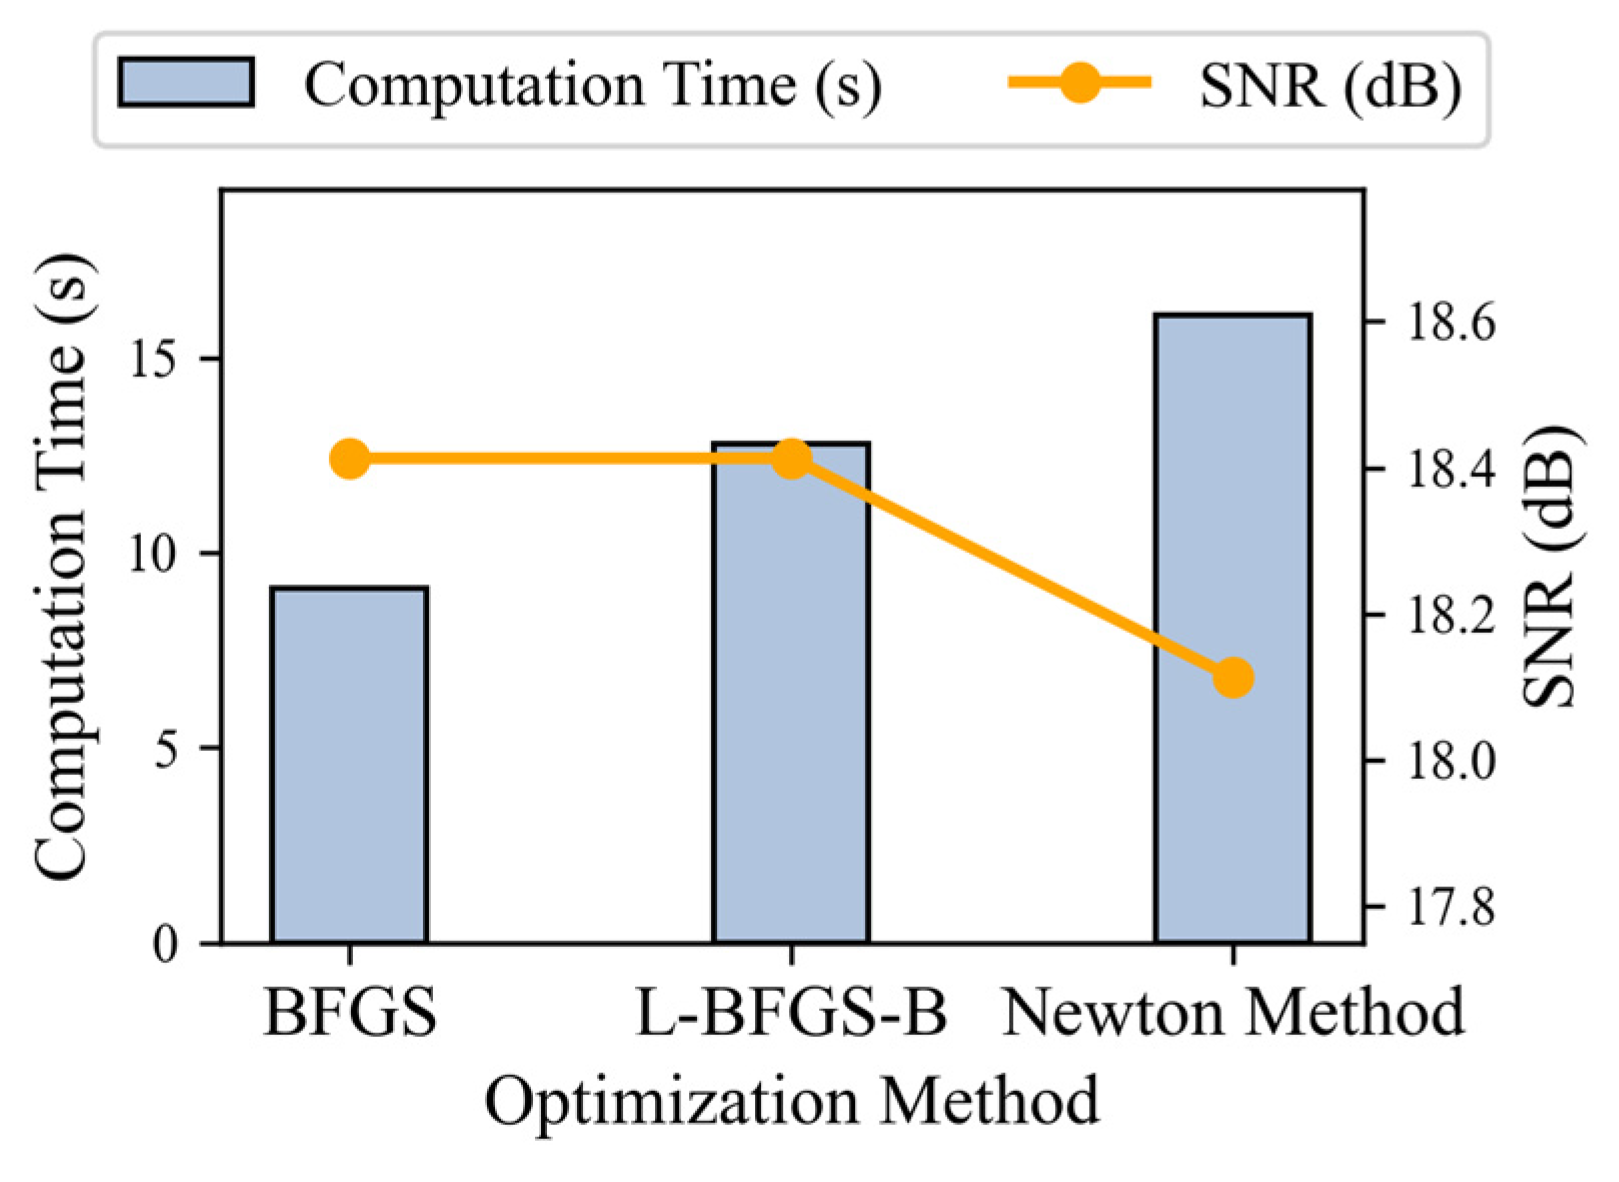
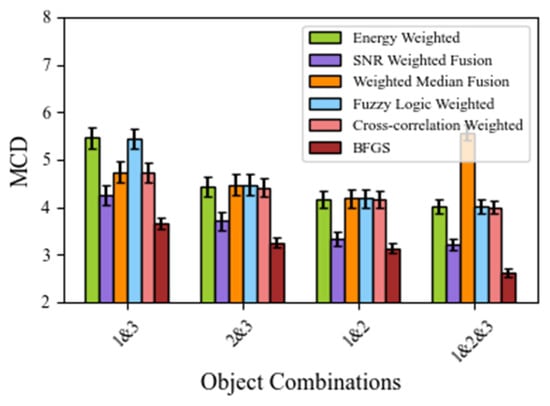
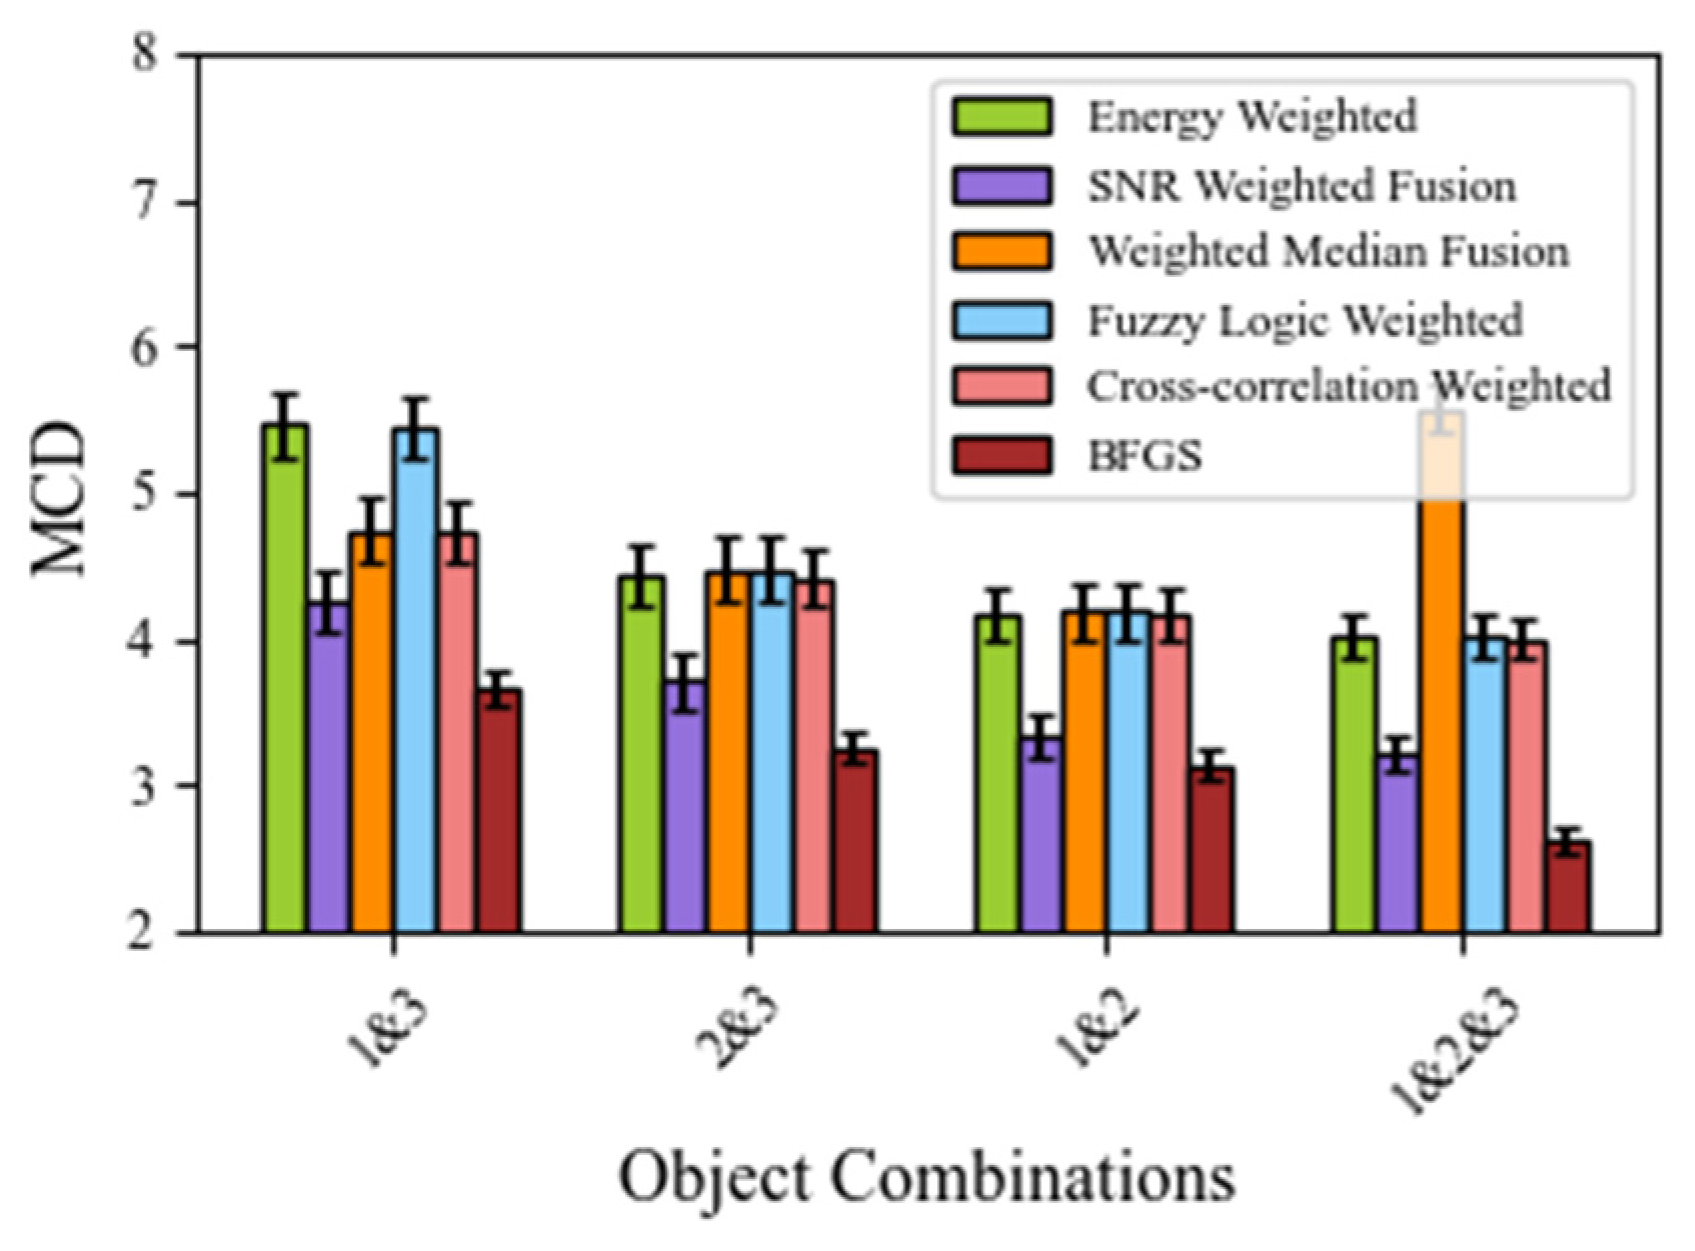
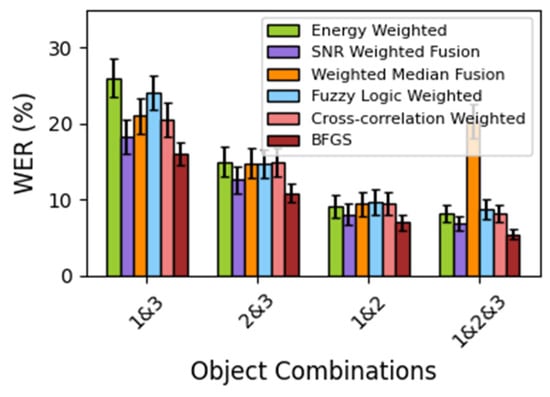
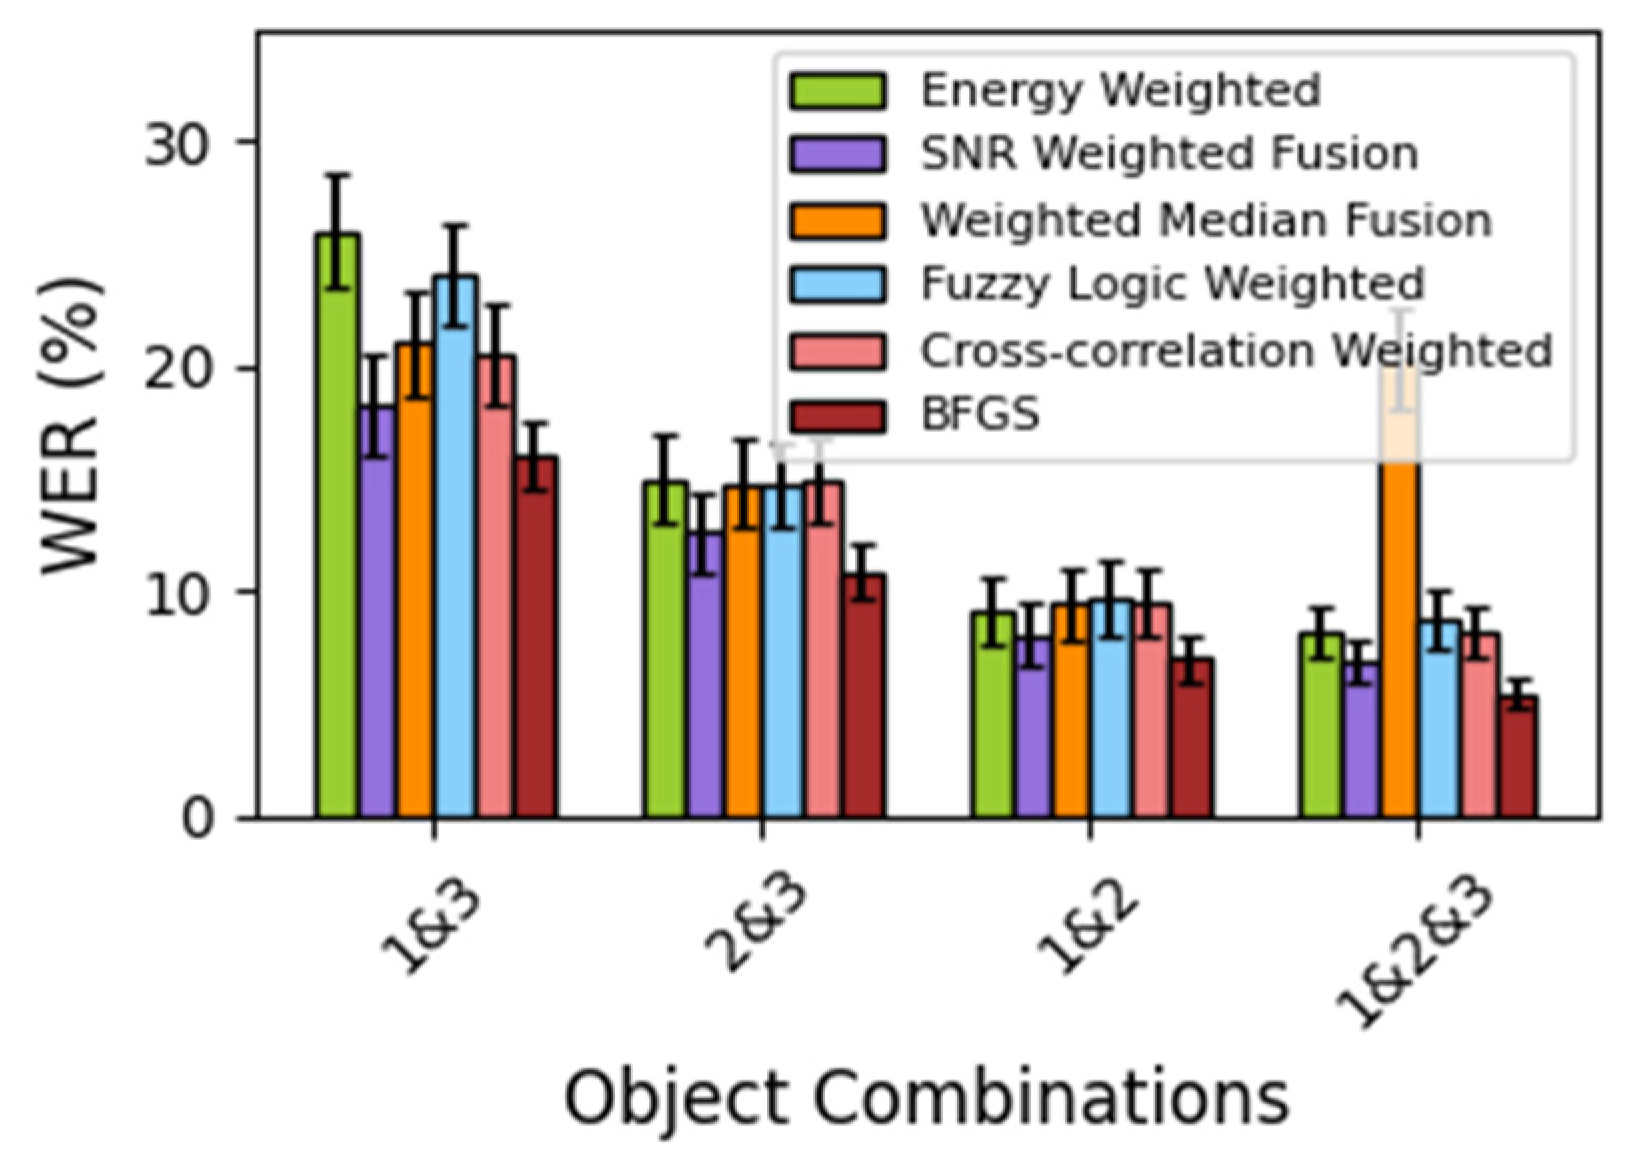
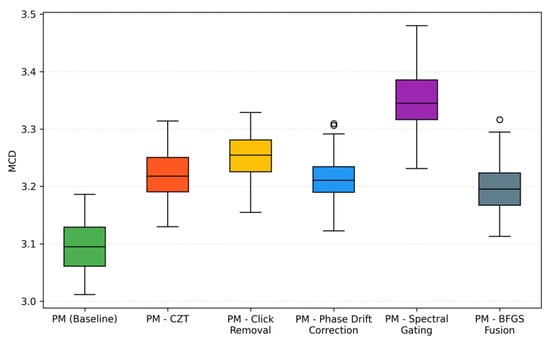
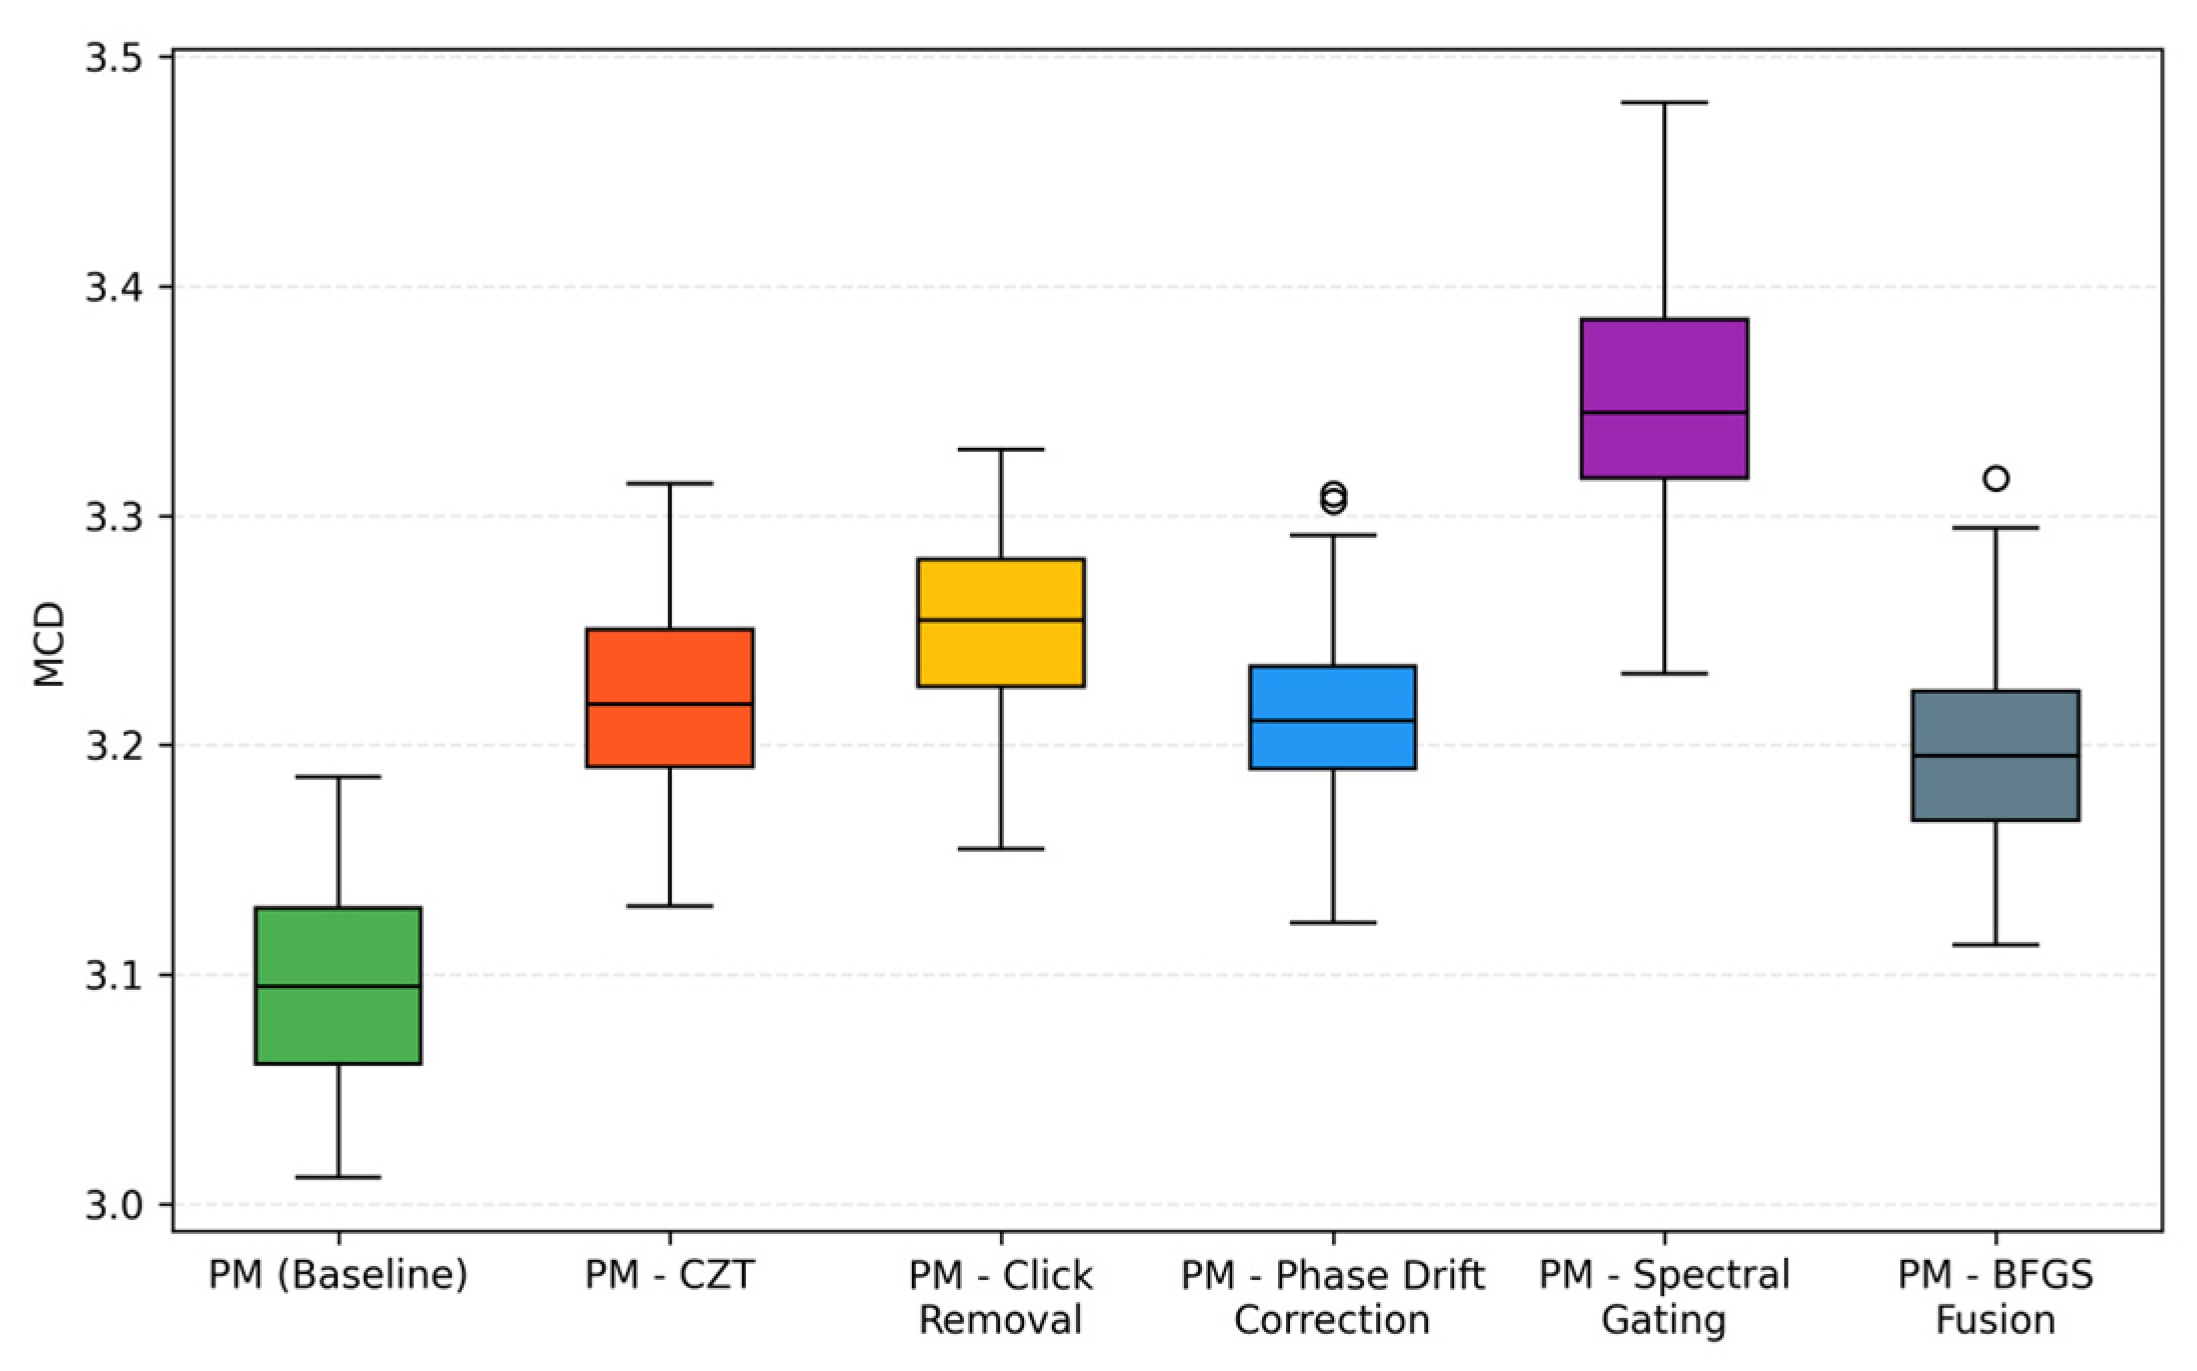
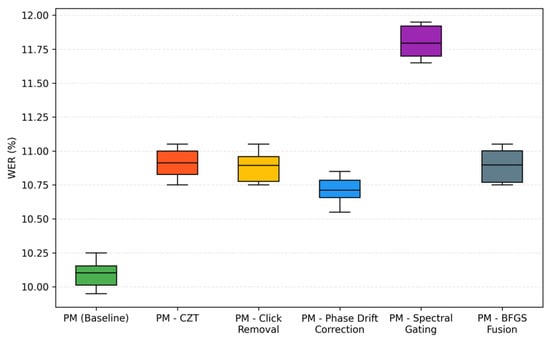
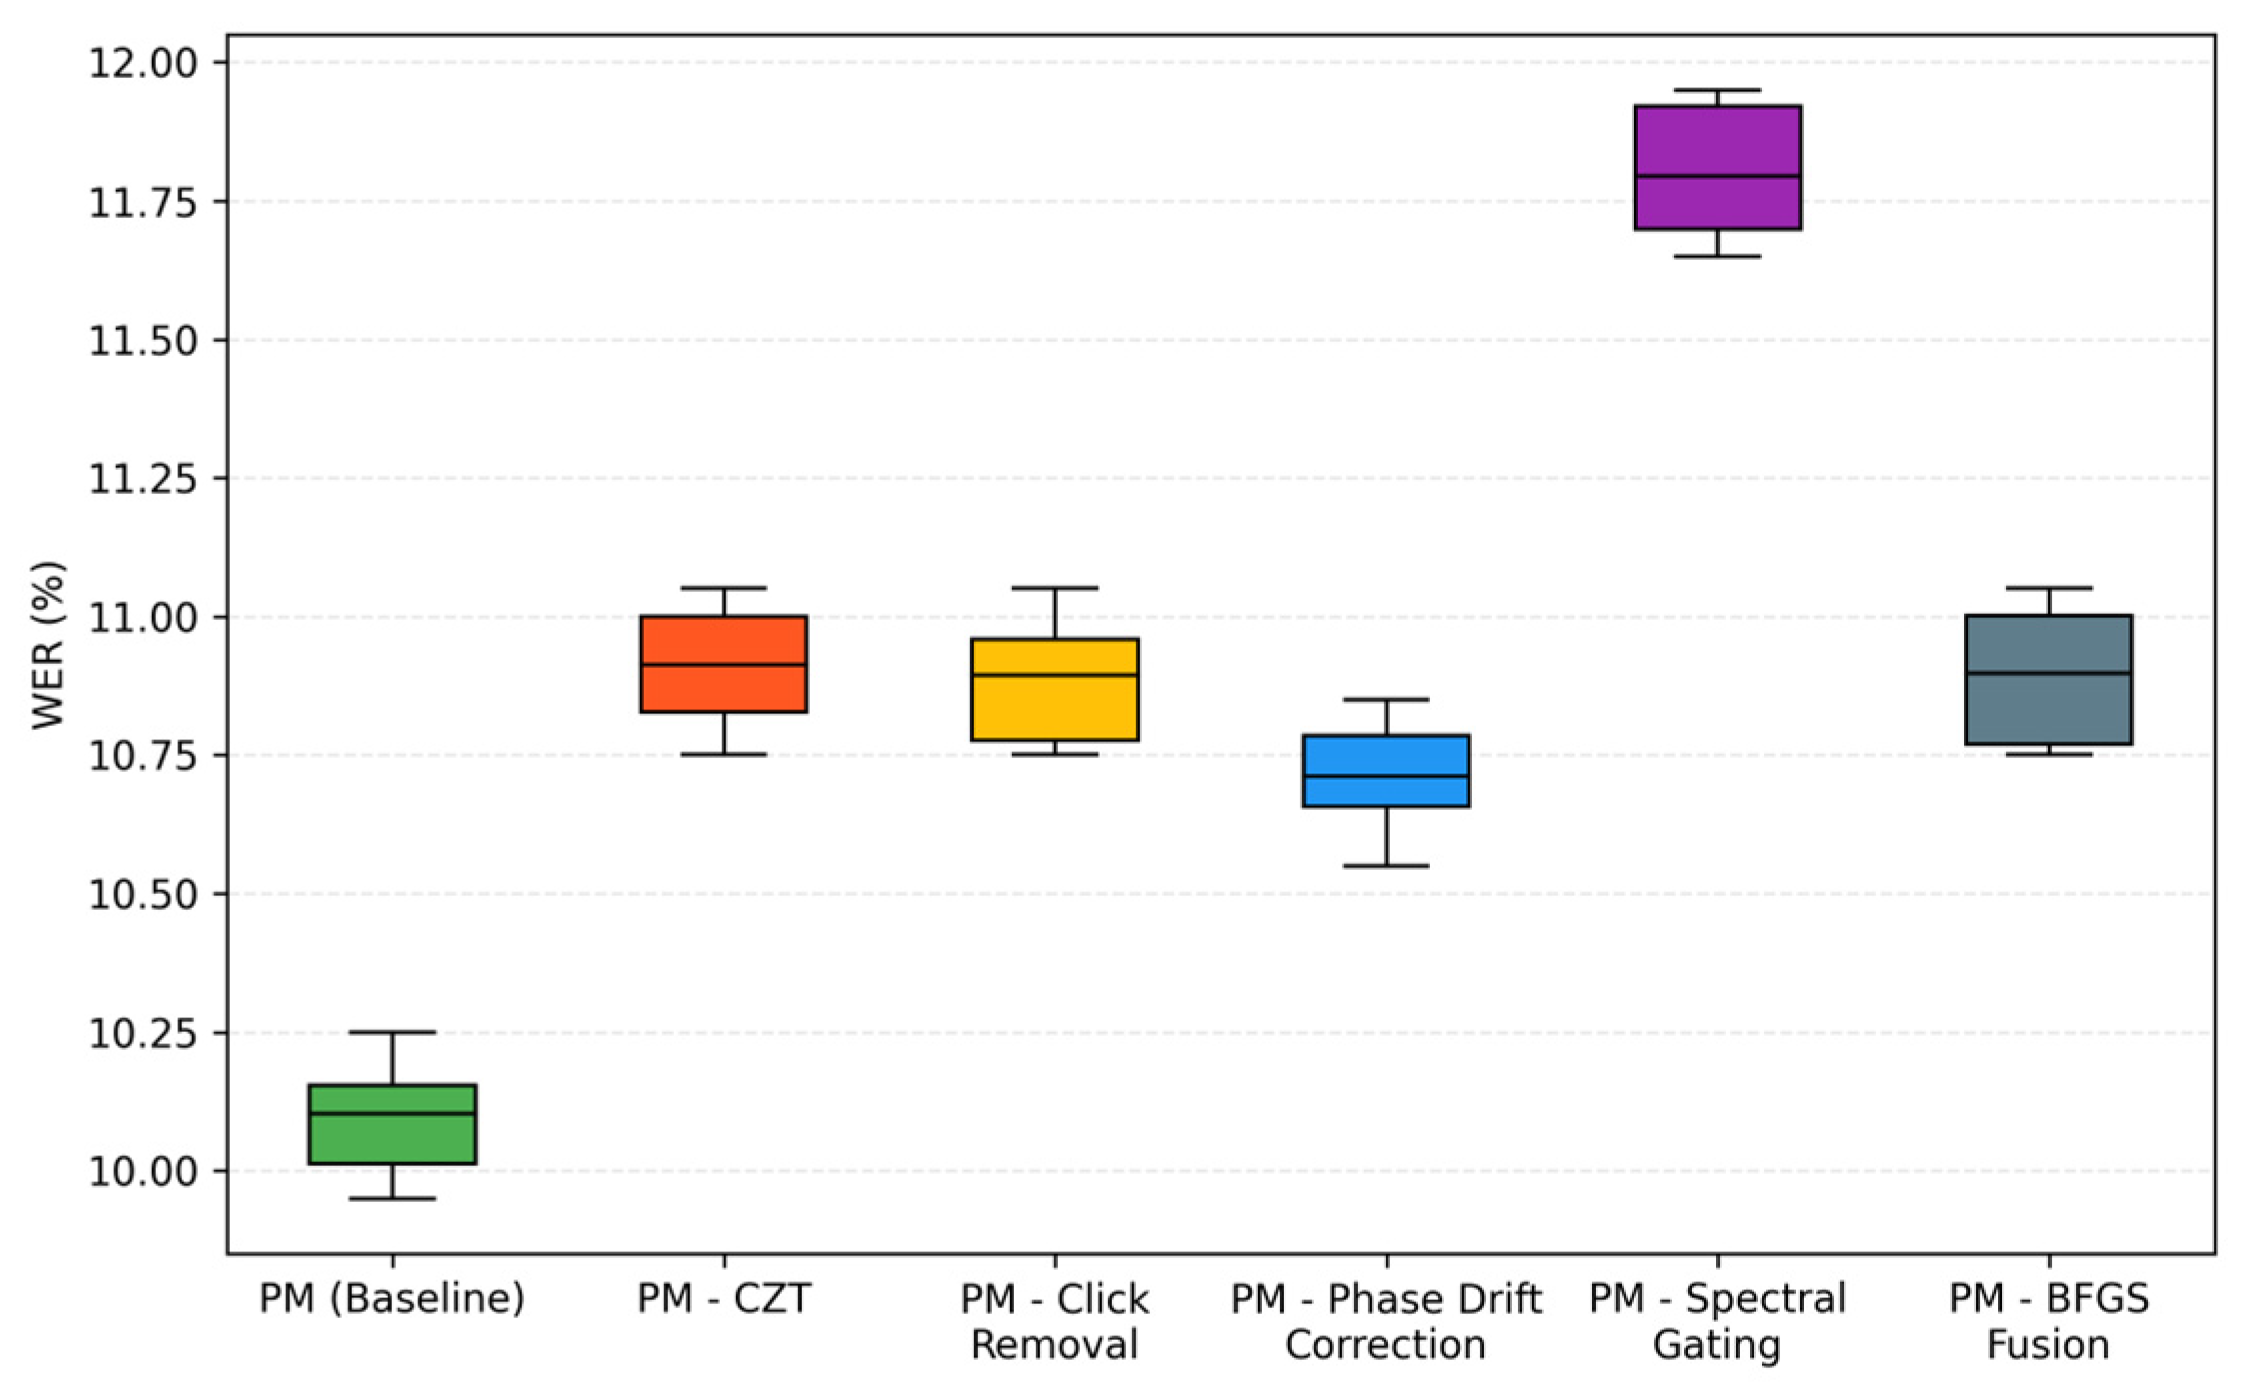

Disclaimer/Publisher’s Note: The statements, opinions and data contained in all publications are solely those of the individual author(s) and contributor(s) and not of MDPI and/or the editor(s). MDPI and/or the editor(s) disclaim responsibility for any injury to people or property resulting from any ideas, methods, instructions or products referred to in the content. |
© 2026 by the authors. Licensee MDPI, Basel, Switzerland. This article is an open access article distributed under the terms and conditions of the Creative Commons Attribution (CC BY) license.