


Abstract
Coastal cities are located at the critical interface of land–sea interaction, and scientifically assessing their ecological importance is essential for identifying conservation priority areas. Existing assessments focus primarily on static function while neglecting dynamic system processes and resilience characteristics. To address this limitation, this study developed an innovative “State-Interaction-Resilience” (SIR) assessment framework. It integrates ecosystem services (state), ecological connectivity and network supply-demand relationships (interaction), and social-ecological system adaptive capacity (resilience) and incorporates differentiated weighting based on the unique “sea–land gradient” pattern of coastal zones. Using Dongying City in the Yellow River Delta as a case study, the results show the following: (1) The SIR framework evaluation results demonstrate balanced and significant positive correlations with all dimensional indicators (r = 0.3~0.8), showing greater comprehensiveness and scientific validity than traditional evaluation methods, with 81% spatial agreement between identified extremely important areas and existing protected areas. (2) From 2000 to 2020, the overall ecological importance of Dongying City showed an upward trend, with the proportion of extremely important areas significantly increasing from 6.03% to 10.24%, while maintaining a stable spatial gradient pattern of “high along the coast, low inland”. (3) The improvement in ecological importance in coastal core areas mainly resulted from state improvement and resilience enhancement driven by restoration projects such as “aquaculture retreat and wetland restoration”, while inland areas were constrained by both habitat fragmentation and ecological supply-demand mismatch. This study confirms that the SIR framework can accurately capture the spatial heterogeneity of coastal zones. The proposed “core protection-corridor restoration-function enhancement” hierarchical and zonal spatial governance strategy provides scientific evidence and actionable spatial guidance for coastal territorial spatial planning, ecological protection redline optimization, and targeted ecological restoration.
1. Introduction
Coastal cities are located at the key interface between land and sea. They are among the most dynamic and complex regions in the world [1]. This unique location makes them active areas for material cycling and energy exchange. It also supports irreplaceable ecological functions, such as climate regulation, disaster buffering, and biodiversity maintenance [2]. Due to their advantages in resources and transportation, about 60% of the global population and more than two thirds of large cities are concentrated within 100 km of coastlines [3]. These areas contribute a similar share of global economic output and highlight their role as engines of global development. However, intensive socio-economic concentration has placed unprecedented pressure on native coastal ecosystems. Strong human activities, such as urban expansion [4], port construction [5], and land reclamation [6], have triggered a series of cascading ecological degradation problems. These problems include coastal wetland loss [7], artificial shoreline expansion [8], habitat fragmentation [9], biodiversity decline [10], and water eutrophication [11]. Therefore, how to scientifically identify and prioritize key ecological spaces under development pressure has become a global issue with both scientific urgency and practical importance. It is critical for maintaining the long-term health and resilience of coastal social–ecological systems.
Ecological importance assessment is a core scientific tool for addressing this challenge. Based on ecological principles, it aims to systematically quantify the comprehensive value of specific areas in terms of ecosystem service provision, environmental sensitivity, and biodiversity maintenance. The results provide a basis for differentiated spatial regulation and the delineation of ecological conservation priority areas [12,13]. Existing studies mainly follow two paradigms. The first paradigm is an attribute-based static assessment. It focuses on key ecosystem services, such as water conservation, soil conservation, and carbon storage. It also includes sensitivity indicators, such as soil erosion and habitat degradation. These indicators are spatially overlaid and classified to describe patterns of ecological importance [13,14]. Such studies effectively reveal the stock of ecosystem service supply and the inherent vulnerability of the environment. It has become an important basis for ecological functional zoning and conservation redline delineation. The second is a process-based dynamic assessment paradigm that emerged from landscape ecology. It recognizes that ecological functions depend not only on patch attributes but also on spatial connections and ecological flows [15]. Such studies usually identify areas with high ecosystem service value as ecological sources. They assess landscape connectivity by constructing resistance surfaces and simulating ecological processes, such as species dispersal. They then evaluate the importance of ecological units from the perspective of ecological network integrity [16,17]. This paradigm provides a new perspective for building ecological security patterns.
However, despite continuous research progress, the dominant paradigms still show clear theoretical limitations and practical shortcomings when applied to coastal zones with high dynamics and strong human–nature coupling. First, there is a separation between state and process in assessment dimensions. Static assessments are effective in describing current service supply. However, they often neglect the ecological processes and spatial connectivity that support these services [18]. In contrast, dynamic assessments focus on connectivity, but they often simplify it as a structural attribute. They lack a systematic integration of the complex spatial matching and feedback between ecosystem service supply and dynamic human demand [19]. As a result, an isolated patch with high service value may be overestimated. Its actual functional contribution and long-term stability within the regional ecological network are often overlooked [20]. Second, most studies lack consideration of ecological resilience. Current assessments mainly focus on functional or structural outputs at specific time points. They neglect the capacity of ecosystems to respond to disturbances such as storm surges, sea-level rise, and pollution events. This capacity includes resisting shocks, absorbing disturbances, and maintaining core functions and structural stability [21]. The neglect of resilience limits the usefulness of assessment results for long-term sustainability and climate adaptation planning. In recent years, some studies have attempted to integrate ecosystem services and ecological connectivity into ecological importance assessments [22]. However, most of these studies treat these factors as separate indicators and combine them directly, lacking a structured integration from a social-ecological system perspective. In addition, the interaction between human demand and ecosystem supply receives limited attention in existing evaluation frameworks. Most studies measure supply–demand relationships by calculating supply–demand ratios. The transmission and coupling processes of ecological supply–demand relationships within spatial networks are rarely analyzed in a systematic way. More importantly, current studies fail to fully incorporate the fundamental land–sea gradient differentiation of coastal zones [23]. Coastal ecosystems are jointly shaped by tides [24], salinity [25], and terrestrial inputs [26]. From the coastline to inland areas, habitat types, ecological processes, and human activities show continuous and regular gradient changes [27]. However, most assessments still treat coastal regions as homogeneous units and apply uniform indicator systems for evaluation [13]. This homogenized approach obscures spatial heterogeneity and often leads to spatial mismatch in management strategies.
To address the above systematic limitations, this study aims to move beyond the traditional state-process framework and proposes an integrated State-Interaction-Resilience (SIR) assessment framework. This framework integrates key concepts from social–ecological system theory, landscape ecology, and resilience science. It examines the ecological importance of coastal ecological spaces by addressing three sequential core questions: What is the baseline supply state of the system? How do interactions occur within the system and between humans and nature? What is the intrinsic resilience of the system in response to external disturbances? Specifically, this study selects key ecosystem services, such as carbon sequestration and water conservation, to represent the “state”. The study constructs an ecological supply-demand network to describe ecological interactions. Ecological connectivity is used to represent interactions within the natural system. The supply–demand relationship of ecological networks is used to represent human–nature interactions. Resilience is assessed from three aspects: resistance, adaptability, and recovery capacity.
To test the scientific validity and applicability of the framework, Dongying City in the Yellow River Delta of China is selected as a case study. Dongying City is a typical estuarine coastal city that combines rapid urbanization, major energy infrastructure, and national wetland nature reserves. Conflicts between ecological protection and development are prominent. Another key innovation of this study is that it transforms coastal–inland gradient zoning from an external descriptive tool into an internal structural assessment dimension. Based on differences in dominant ecological processes and human disturbance intensity across the coastal, transitional, and inland zones, the weights of the “State-Interaction-Resilience” indicators are set in a differentiated manner to achieve a precise alignment between assessment criteria and the spatial ecological baseline. This study aims to address two key questions: (1) How can an integrated assessment index system be developed that effectively couples ecological interaction processes with system resilience and is suitable for the complexity of coastal zones? (2) How can coastal–inland gradient patterns be structurally embedded into the entire assessment process to achieve a more refined and geographically realistic assessment of ecological importance across space and time? The results are expected to provide systematic, forward-looking, and operational scientific support for spatial planning, ecological conservation, restoration, and adaptive management in coastal cities.
2. Materials and Methods
2.1. Study Area
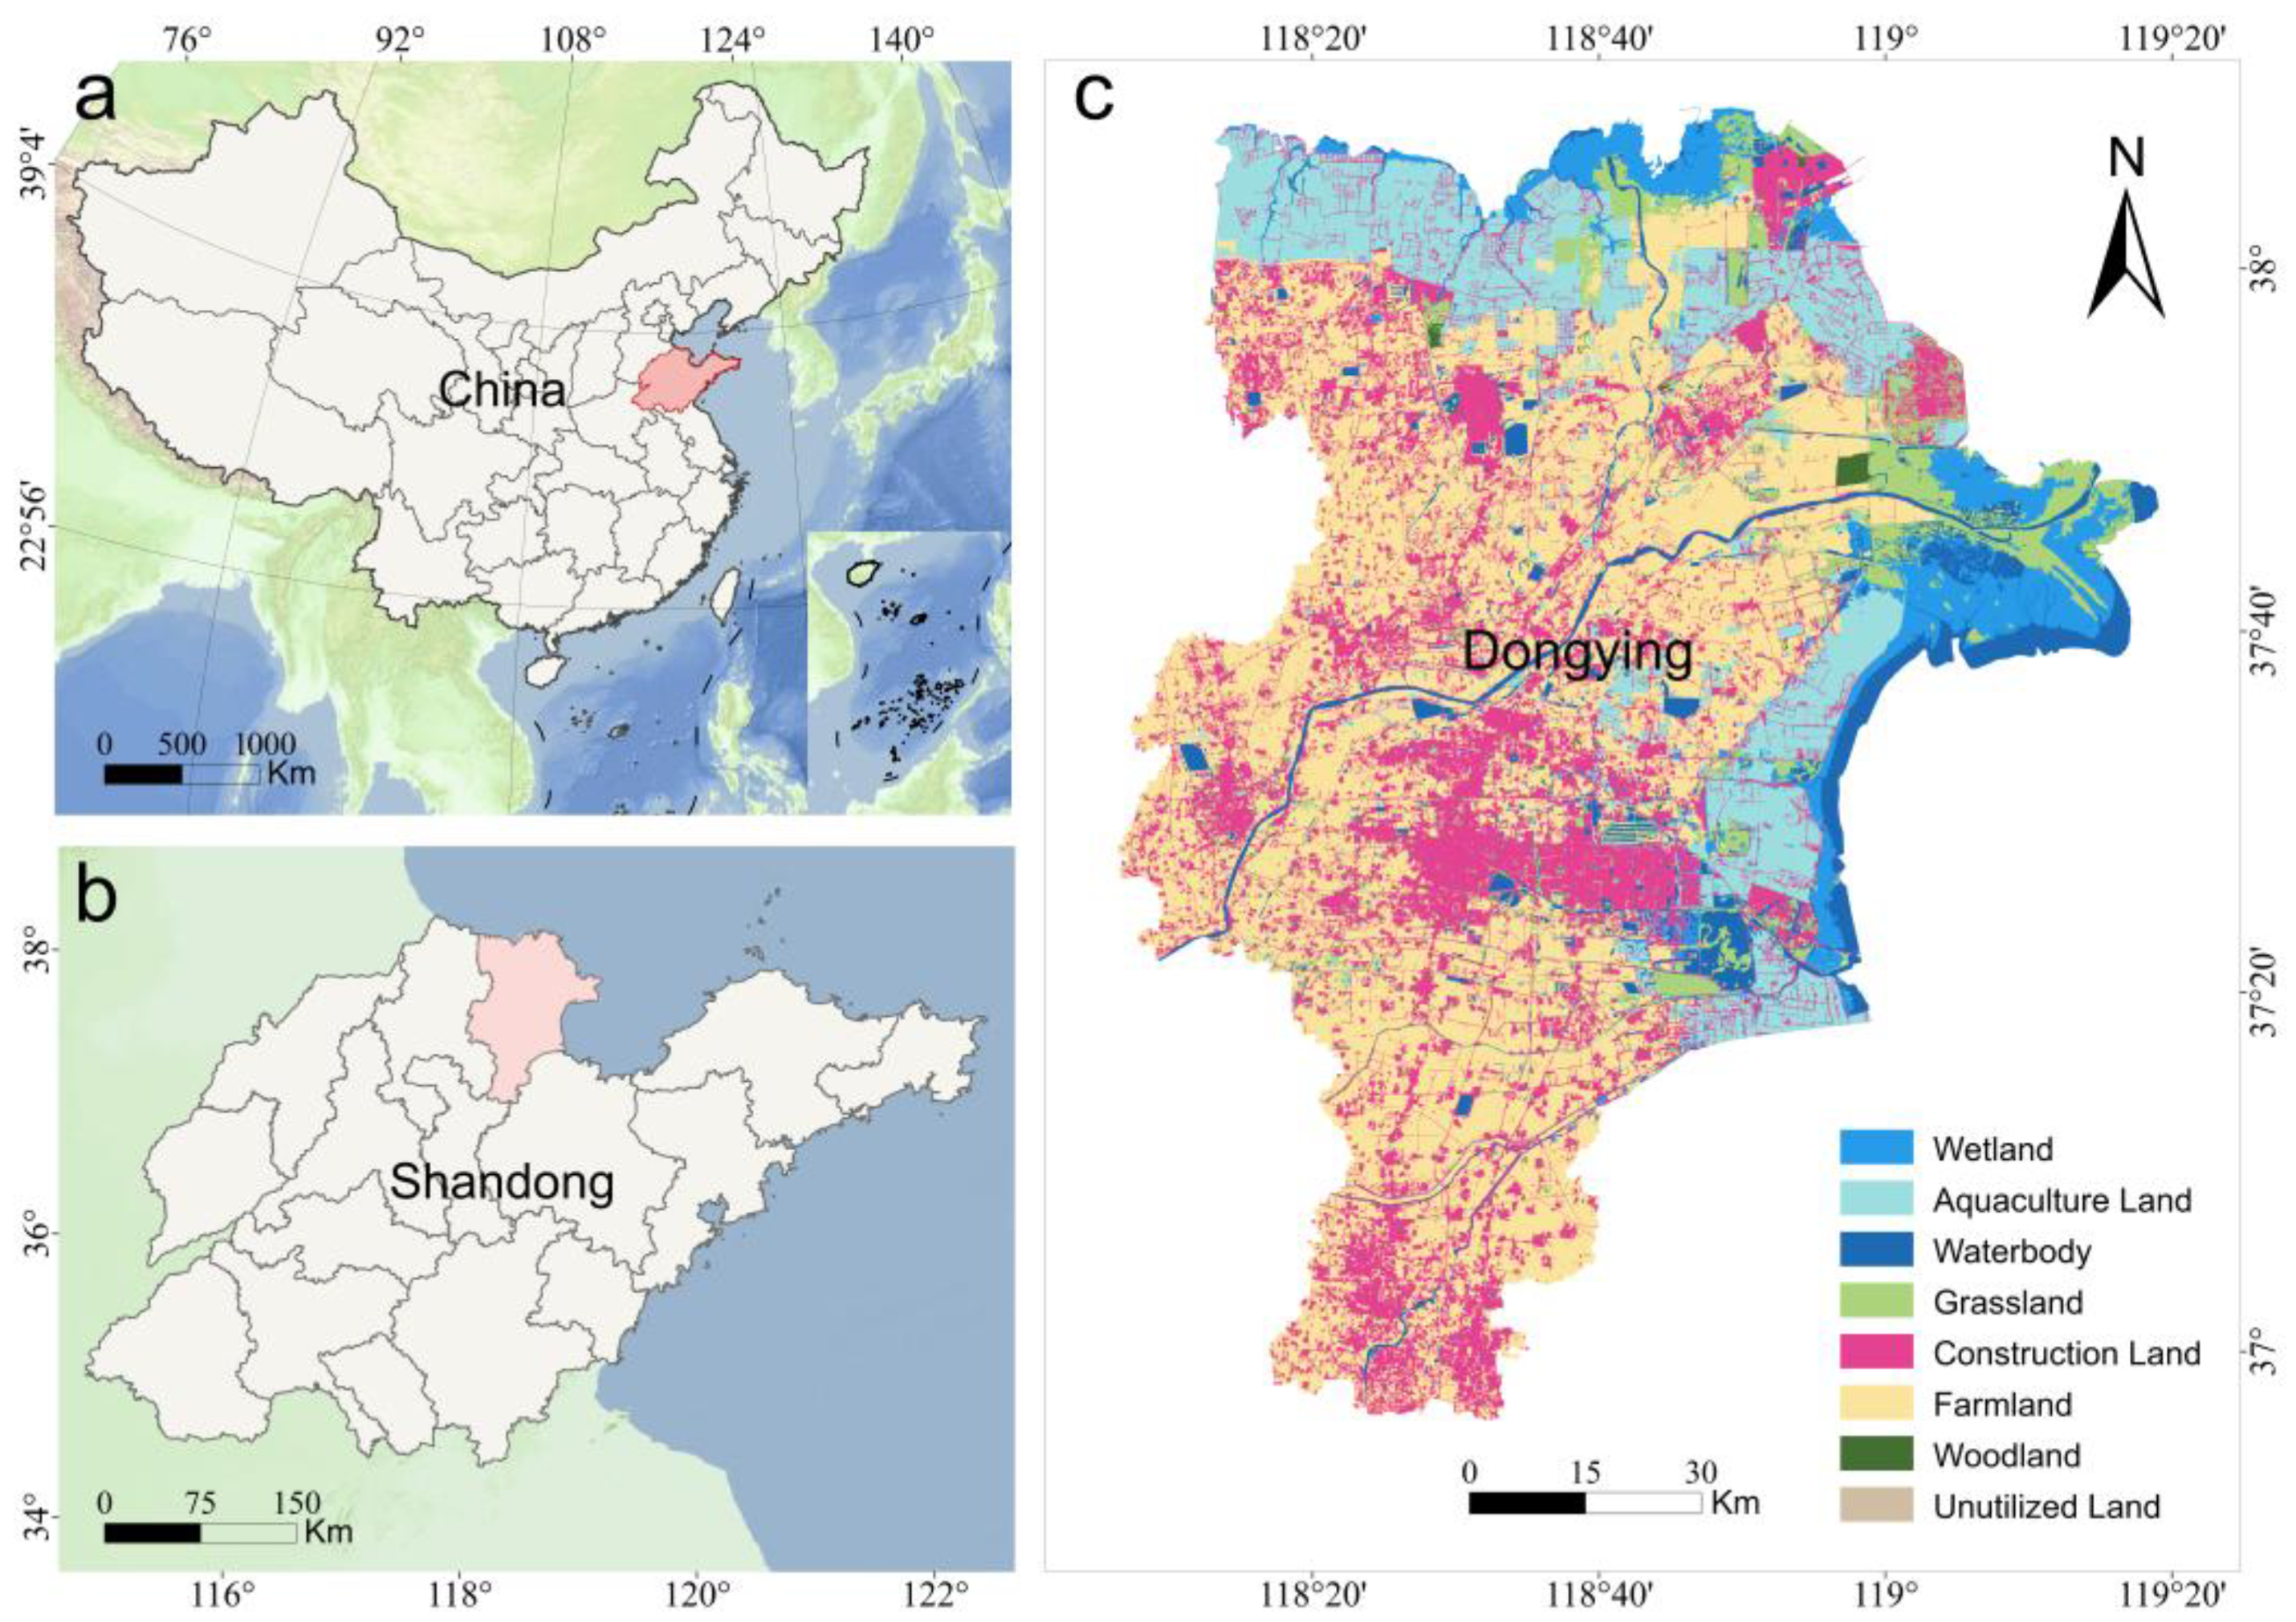
This study selects Dongying City as the case area. Dongying City is located in northeastern Shandong Province, China. It lies in the core area of the Yellow River Delta (37°24′–38°10′ N, 118°07′–119°10′ E), along the southern coast of Laizhou Bay in the Bohai Sea (Figure 1). Dongying is a typical coastal city shaped by land–sea interactions. Its ecosystems are jointly shaped by sediment and nutrient inputs from the Yellow River and by marine tides and hydrodynamic processes. Its ecosystems are jointly influenced by sediment and nutrient inputs from river runoff, as well as by marine tides and hydrodynamic forces. As a result, clear land–sea gradient patterns are observed in both landscape structure and ecological processes. This provides an ideal natural setting for exploring spatial differentiation of coastal ecological space.
Figure 1.
Overview of study area: (a) Shandong Province, China; (b) Dongying City, Shandong Province; (c) land use/land cover data for Dongying City.
At the same time, the socio-economic characteristics of Dongying City make it a typical case for studying human–land coupling and ecological resilience. On one hand, Dongying is an important oil-based resource city and an emerging marine economic zone in China. Rapid industrialization and urbanization have caused intensive land-use change. This is especially evident in coastal reclamation, port construction, and petrochemical development. These activities have led to wetland degradation, loss of natural shorelines, and habitat fragmentation. On the other hand, Dongying City has actively implemented an “ecology-first and green development” strategy in recent years. The city has promoted the establishment of the Yellow River Estuary National Park and large-scale wetland restoration projects. This complex context, where intensive human disturbance coexists with active ecological restoration, provides a valuable empirical setting. It is well suited for testing and developing an integrated assessment framework that considers ecosystem state, interaction, and resilience.
2.2. Data Sources
This study integrates multi-source spatiotemporal data. The data are grouped into three main categories: remote sensing imagery, natural environmental data, and socio-economic data. All datasets cover the entire area of Dongying City. The data include the years 2000, 2010, and 2020 to capture changes in ecological patterns during the study period. To ensure consistency in spatial analysis, all raster datasets are resampled to a spatial resolution of 30 m. The WGS 1984 UTM Zone 50N coordinate system is used for all subsequent processing. The electricity consumption and water consumption data did not contain detailed spatial information. Therefore, population density data were used for spatial allocation. The data were resampled to 30 m using ArcGIS 10.8. This step spatialized the data and matched the requirements of subsequent analysis. The crop yield data were used to revise the equivalent factor table for ecosystem services and were then used to calculate the ecosystem service value. The detailed data sources and descriptions are shown in Table 1.
Table 1.
Data Sources.
2.3. Methods
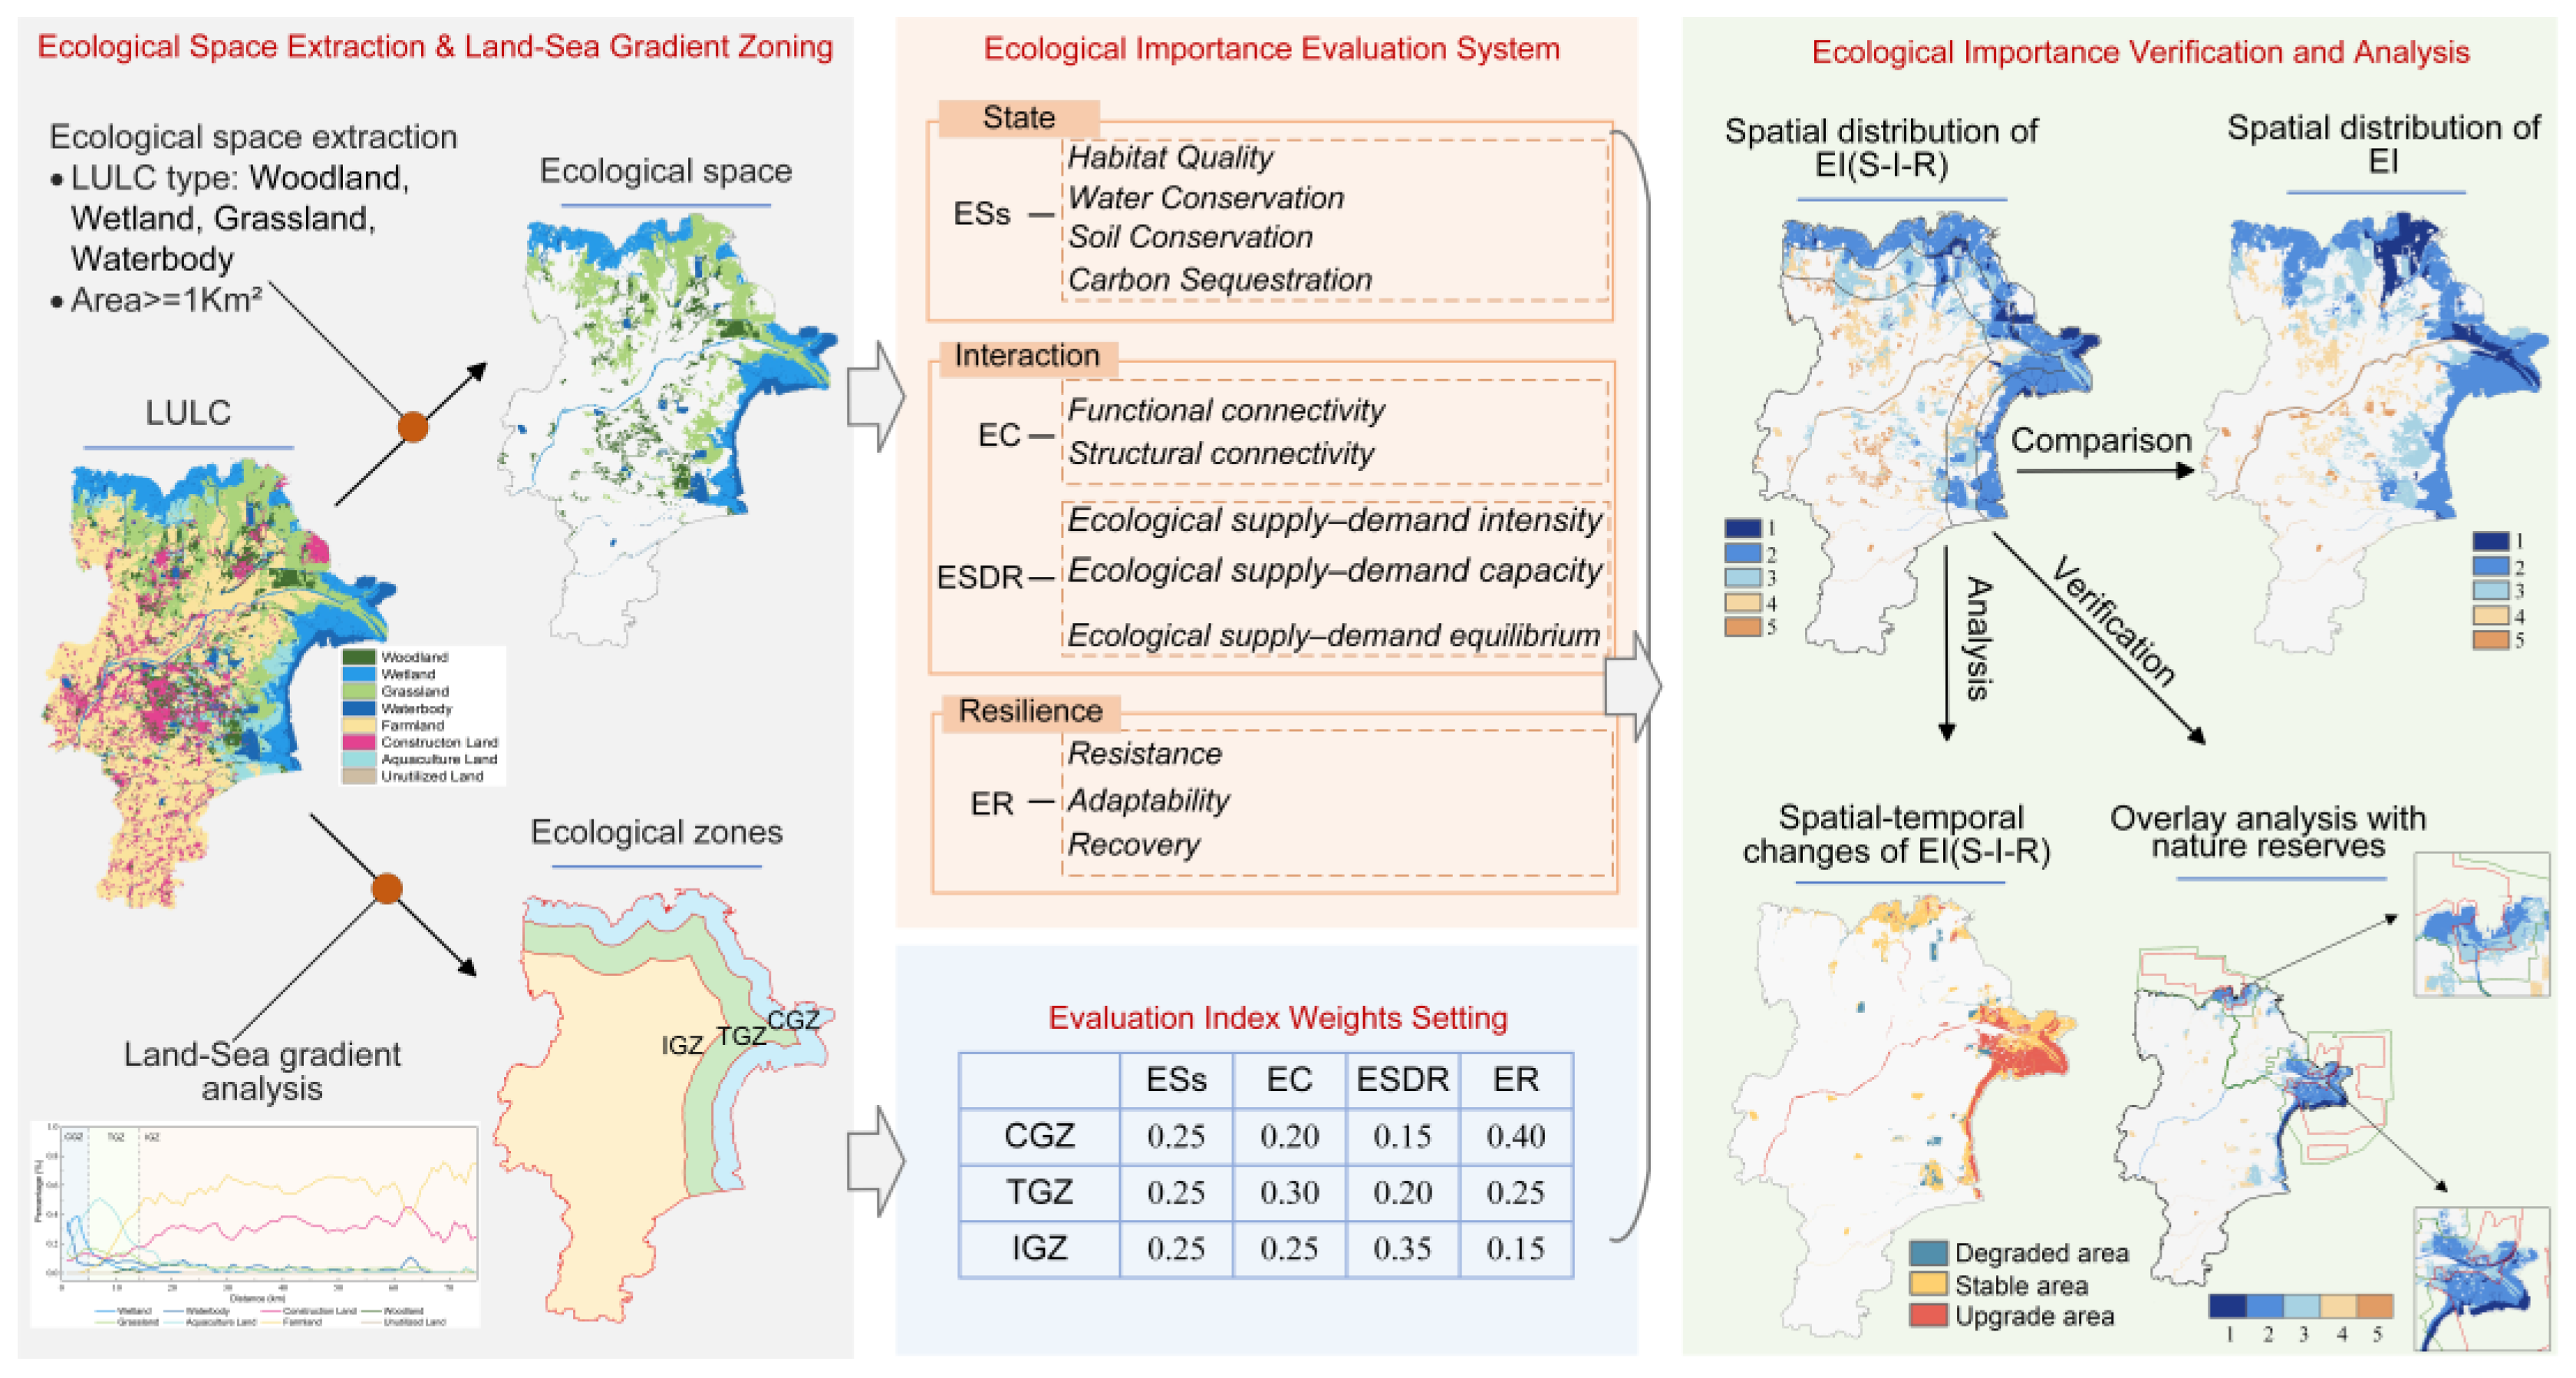
The core objective of this study is to construct and apply a “State-Interaction-Resilience” framework for evaluating ecological importance in coastal cities. The overall workflow includes four main steps (Figure 2). First, identify the core ecological spaces based on land use/land cover (LULC) data. Second, divide the study area into spatial zones according to the land–sea gradient of land-use structure. Third, construct and quantify an evaluation indicator system from three dimensions: “State”, “Interaction”, and “Resilience”. Finally, conduct a differentiated comprehensive evaluation of ecological importance based on the gradient zones and propose strategies for protecting ecological spaces.
Figure 2.
Technical Framework. ESs denotes ecosystem services, EC denotes ecological connectivity, ESDR denotes ecological supply-demand relationship, and ER denotes ecological resilience.
2.3.1. Extraction of Ecological Spaces
To focus on areas that substantially support regional ecological processes, this study extracts four types of natural and semi-natural ecosystems—wetlands, grasslands, forests, and water bodies—from the LULC classification system. These ecosystems are initially defined as ecological spaces [29]. To further ensure that the identified ecological space units have stable structure and function and can effectively participate in regional-scale ecological processes, a minimum patch area threshold is applied. Following previous studies [30], the threshold is set to 1 km2. Patches smaller than this threshold are removed. The remaining patches form the final ecological space dataset for subsequent analysis.
2.3.2. Land–Sea Gradient Zoning
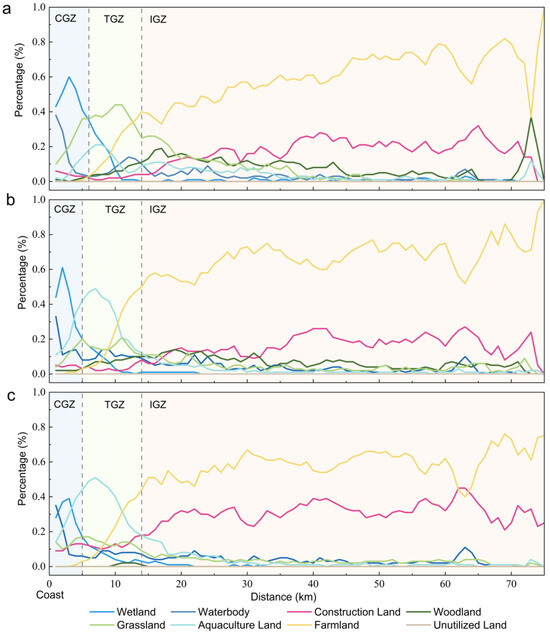
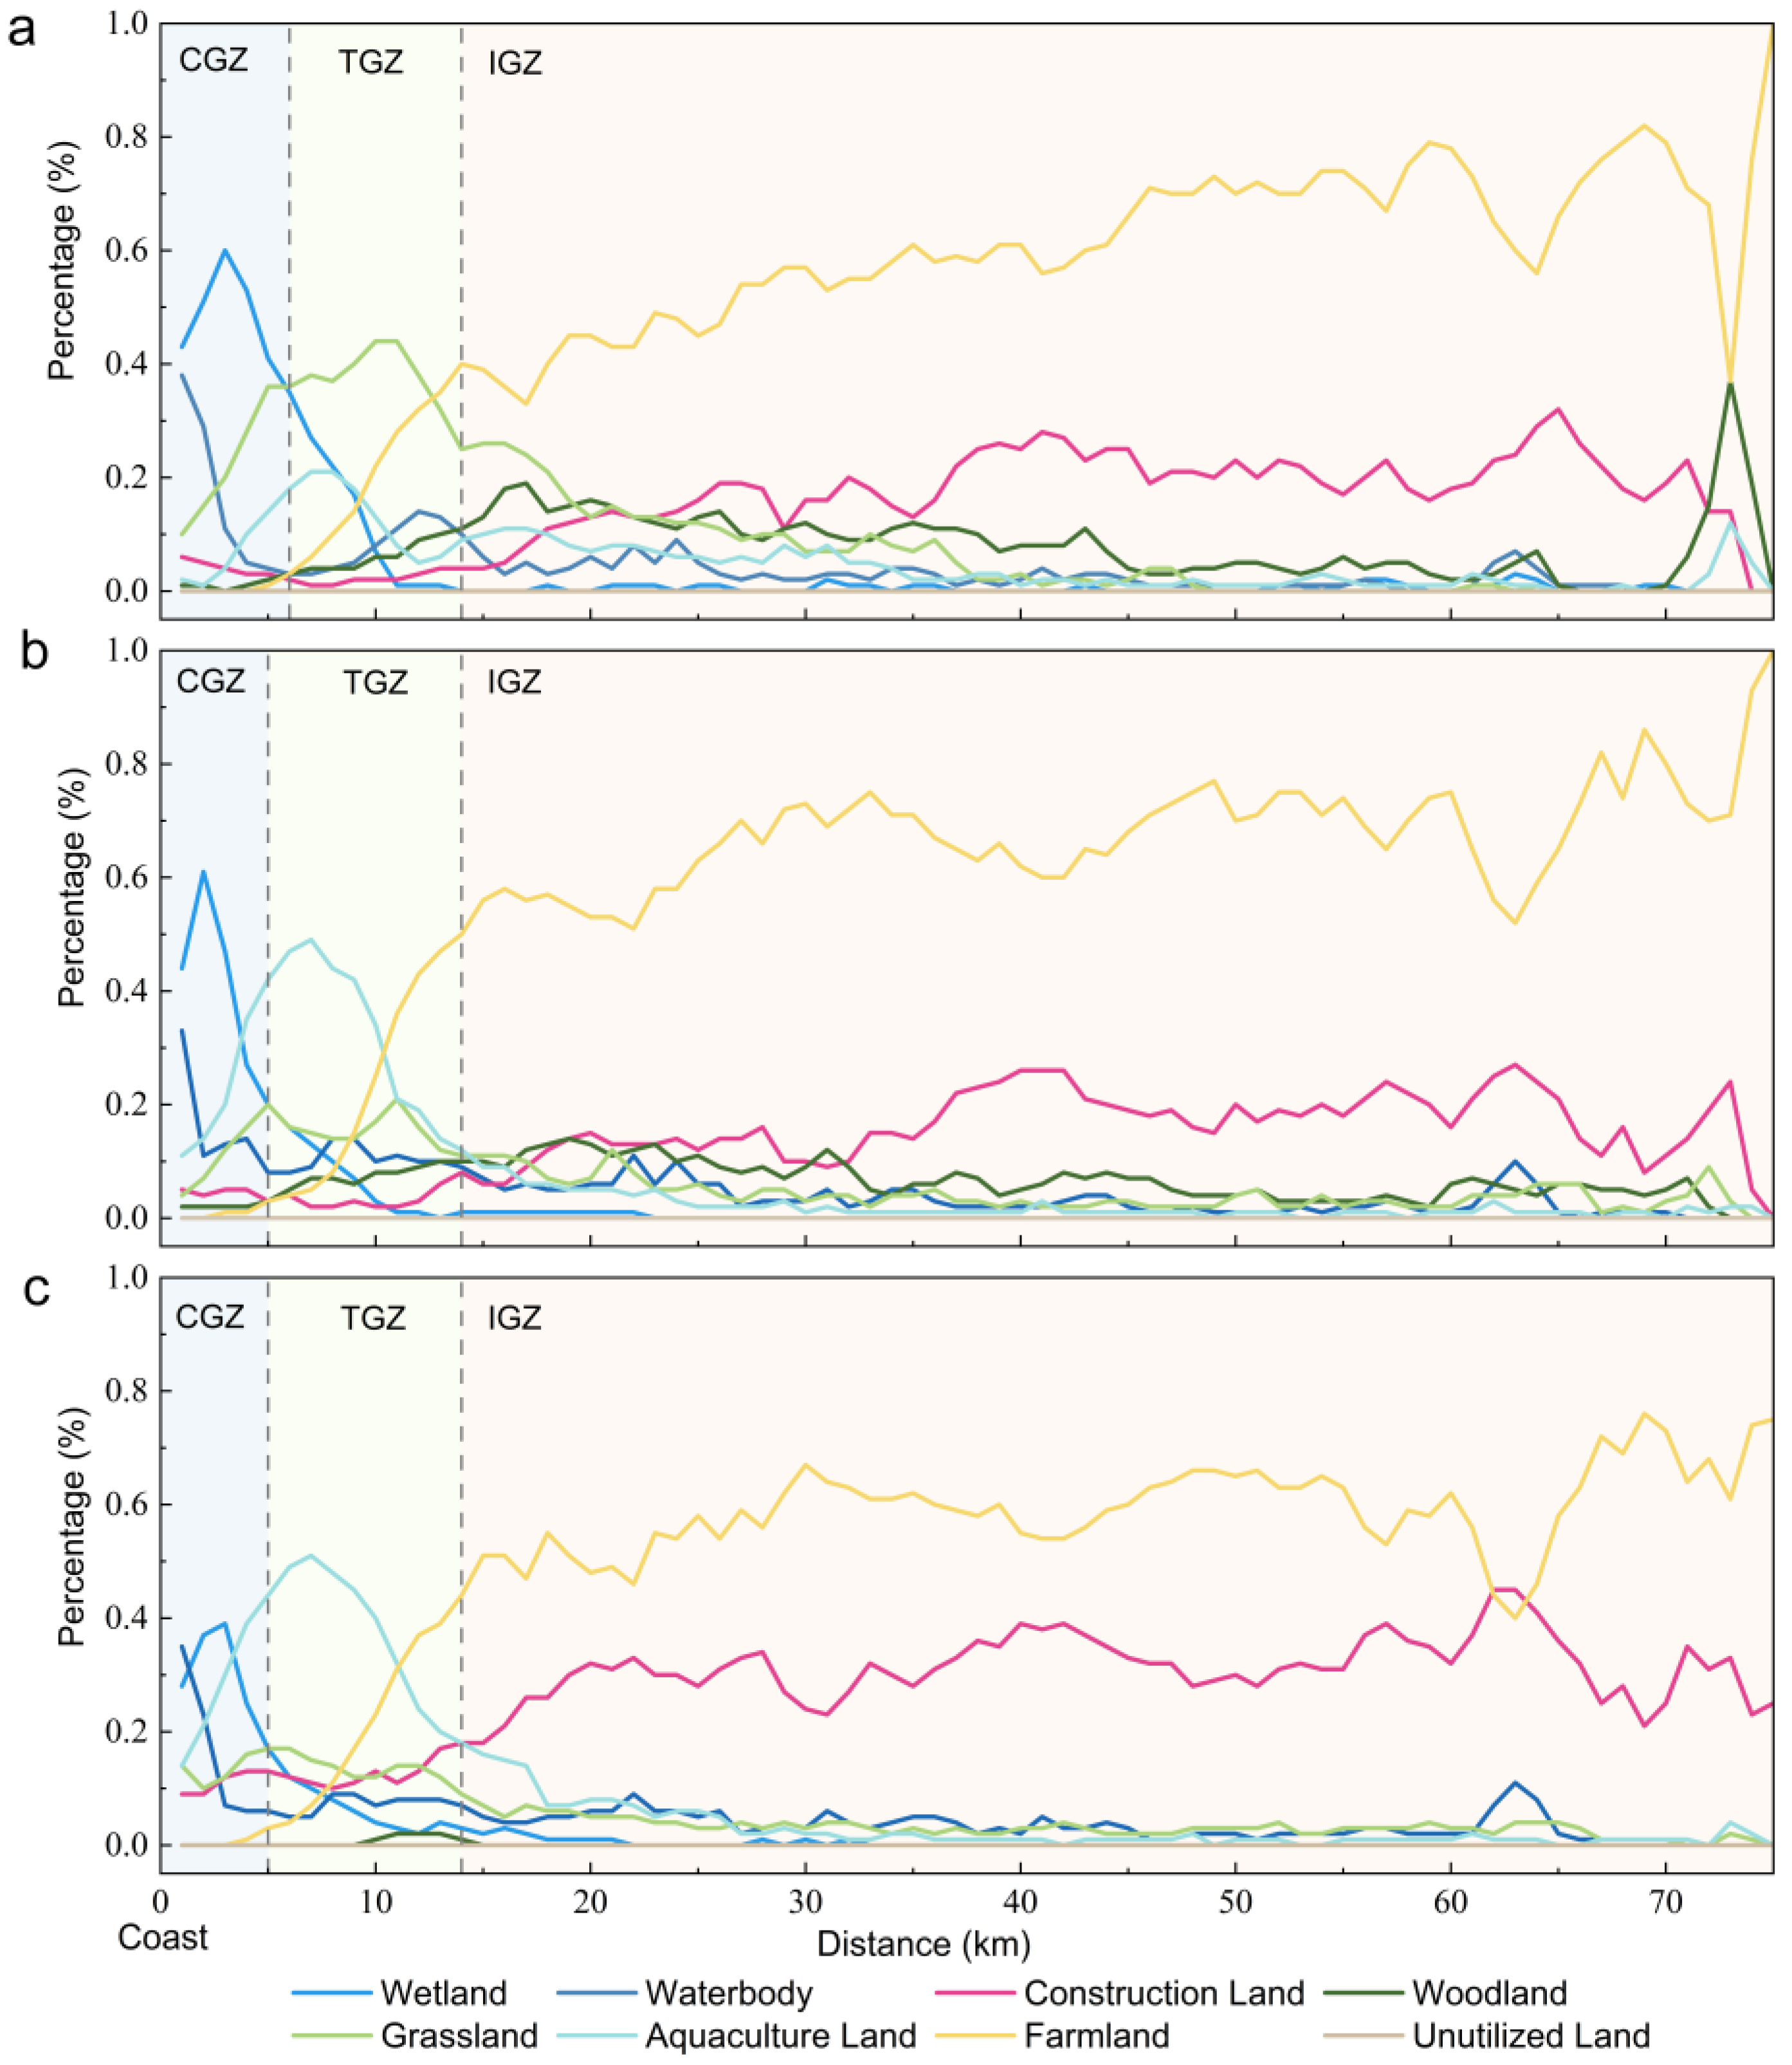
To capture spatial heterogeneity in coastal ecosystems, this study uses LULC data from 2000, 2010, and 2020 to generate a series of buffers at 1 km intervals from the coastline toward inland areas. The area proportions of major land-use types within each buffer are calculated. Curves describing land-use structure changes along the land–sea gradient are then plotted (Figure 3). Based on curve inflection points and land-use structure stability, the study area is divided into three gradient zones: the coastal gradient zone (CGZ), which is strongly influenced by marine processes and dominated by wetlands and water bodies [31]; the transitional gradient zone (TGZ), where natural and artificial land uses are interwoven and change rapidly [32]; and the inland gradient zone (IGZ), which is dominated by cropland and built-up land and shows relatively stable structure [33]. These zones serve as spatial units for subsequent differentiated assessment.
Figure 3.
LULC structure gradient curves along the sea–land gradient: CGZ denotes the coastal gradient zone, TGZ denotes the transitional gradient zone, and IGZ denotes the inland gradient zone; (a) LULC structure gradient curve in 2000; (b) LULC structure gradient curve in 2010; (c) LULC structure change curve along the land–sea gradient in 2020.
2.3.3. Construction of the Ecological Importance Evaluation System
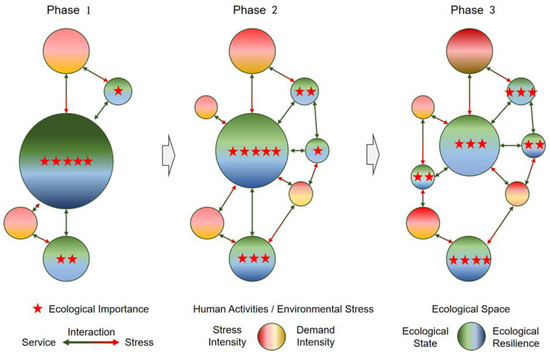
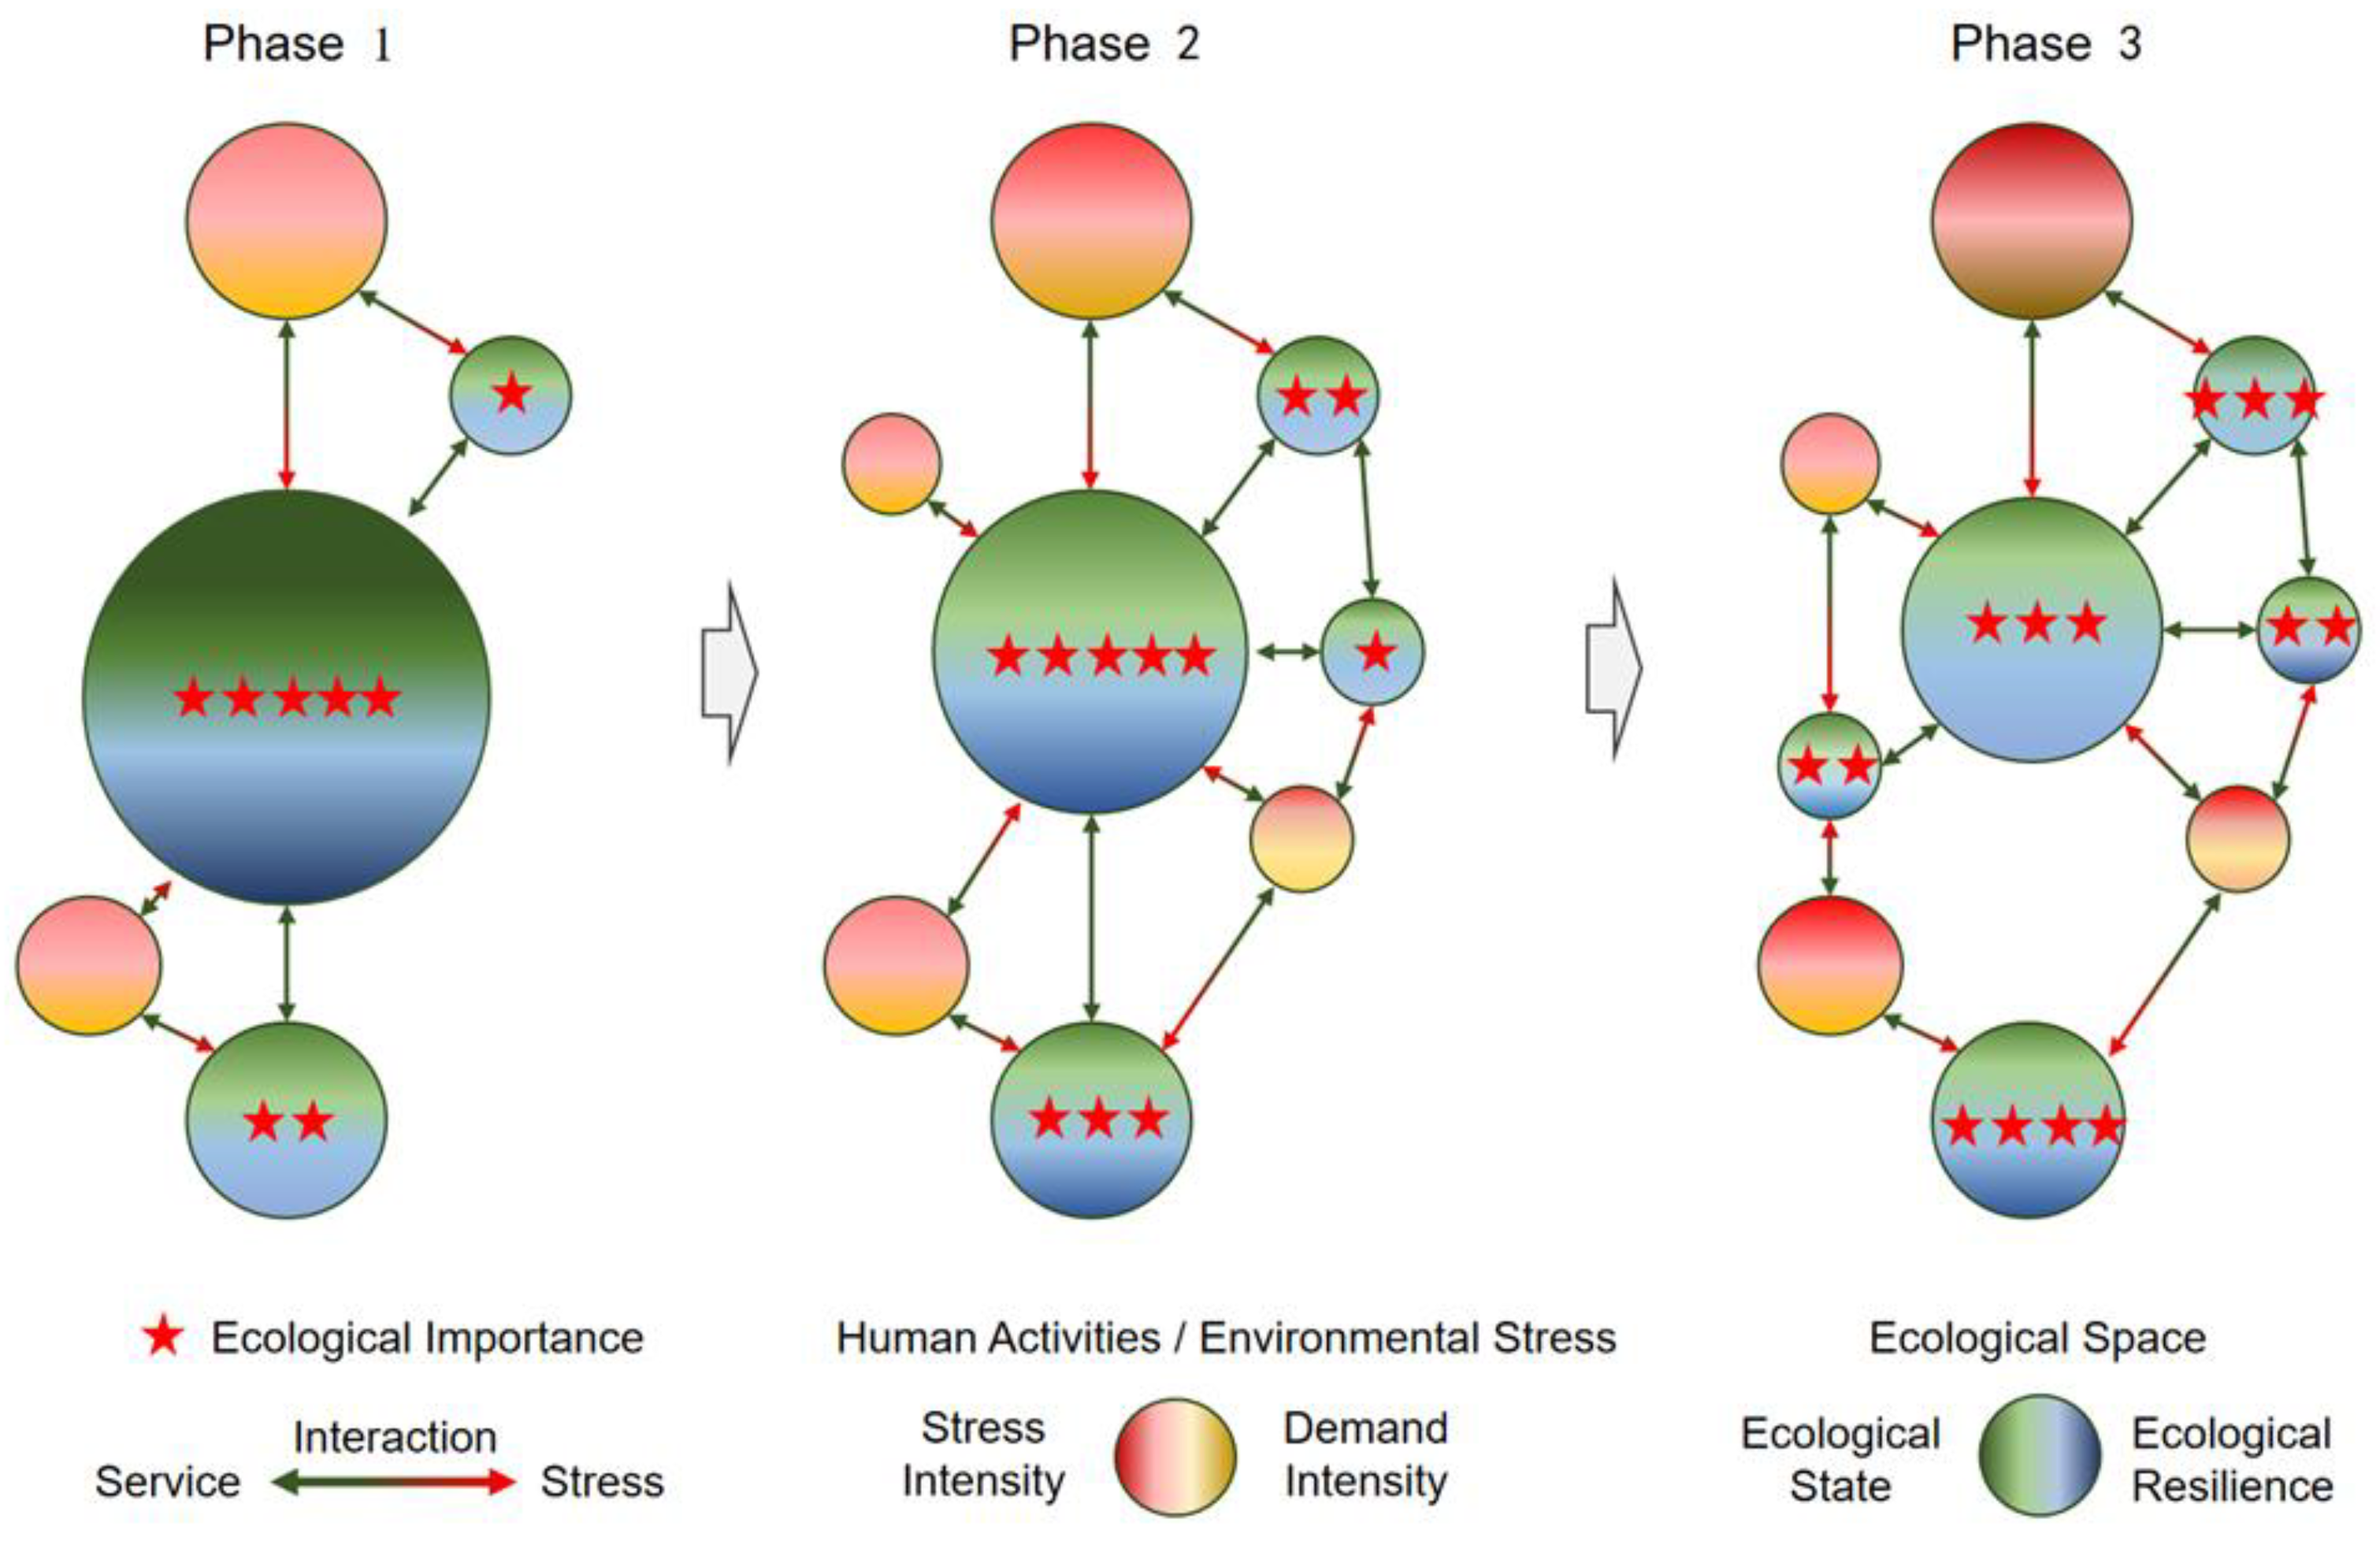
The proposed “State-Interaction-Resilience” framework (Figure 4) consists of four core indicators. Specifically, ecosystem services are used to represent the baseline state of ecological space. Ecological connectivity and ecological supply–demand relationships are used to characterize interaction processes within natural systems and between humans and nature. Ecological resilience reflects the ability of ecosystems to maintain stable structure and function under external disturbances. Based on social-ecological system theory, this study further develops a conceptual framework of ecological space dynamic evolution to explain how ecological importance forms under the influence of human activities and environmental pressures. Over time, increasing human activities and demands may alter the baseline state of ecological space, reshape ecological interaction processes, and influence system resilience. The coupling and feedback among these elements jointly drive changes in the structure and function of ecological space, which ultimately leads to spatial and temporal variations in ecological importance.
Figure 4.
Conceptual diagram of the “State-Interaction-Resilience” framework.
State Dimension: Ecosystem Services
The state dimension evaluates the baseline capacity of ecosystem service supply. Considering the characteristics of coastal cities and data availability, four key ecosystem services are selected: carbon storage, water conservation, soil conservation, and habitat quality. These services are quantified using the In VEST (Integrated Valuation of Ecosystem Services and Trade-offs) model. Detailed model parameters and input data are provided in Appendix A Table A1. To enable integration and comparison, the results of the four services are normalized using fuzzy membership functions in ArcGIS 10.8 (values range from 0 to 1). They are then combined with equal weights to calculate a comprehensive ecosystem service index for each raster cell.
Interaction Dimension: Ecological Connectivity and Ecological Supply-Demand Relationships
The “Interaction” dimension aims to characterize dynamic links within natural systems and between human and natural systems. This study integrates these interactions by constructing an ecological supply–demand network.
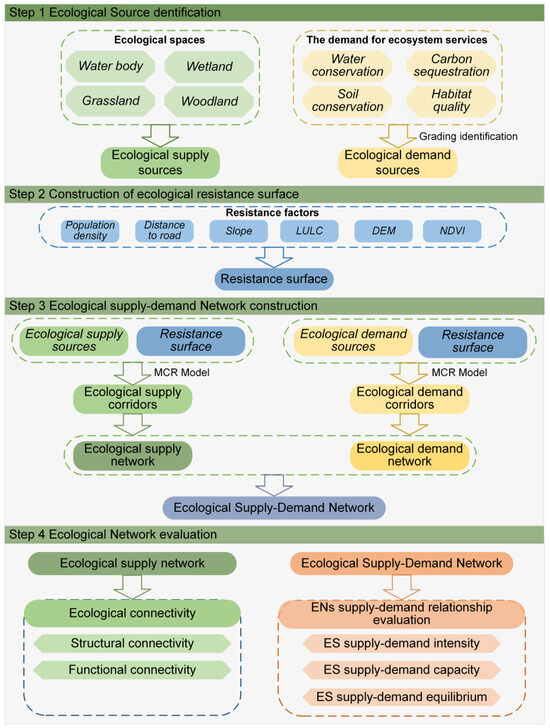
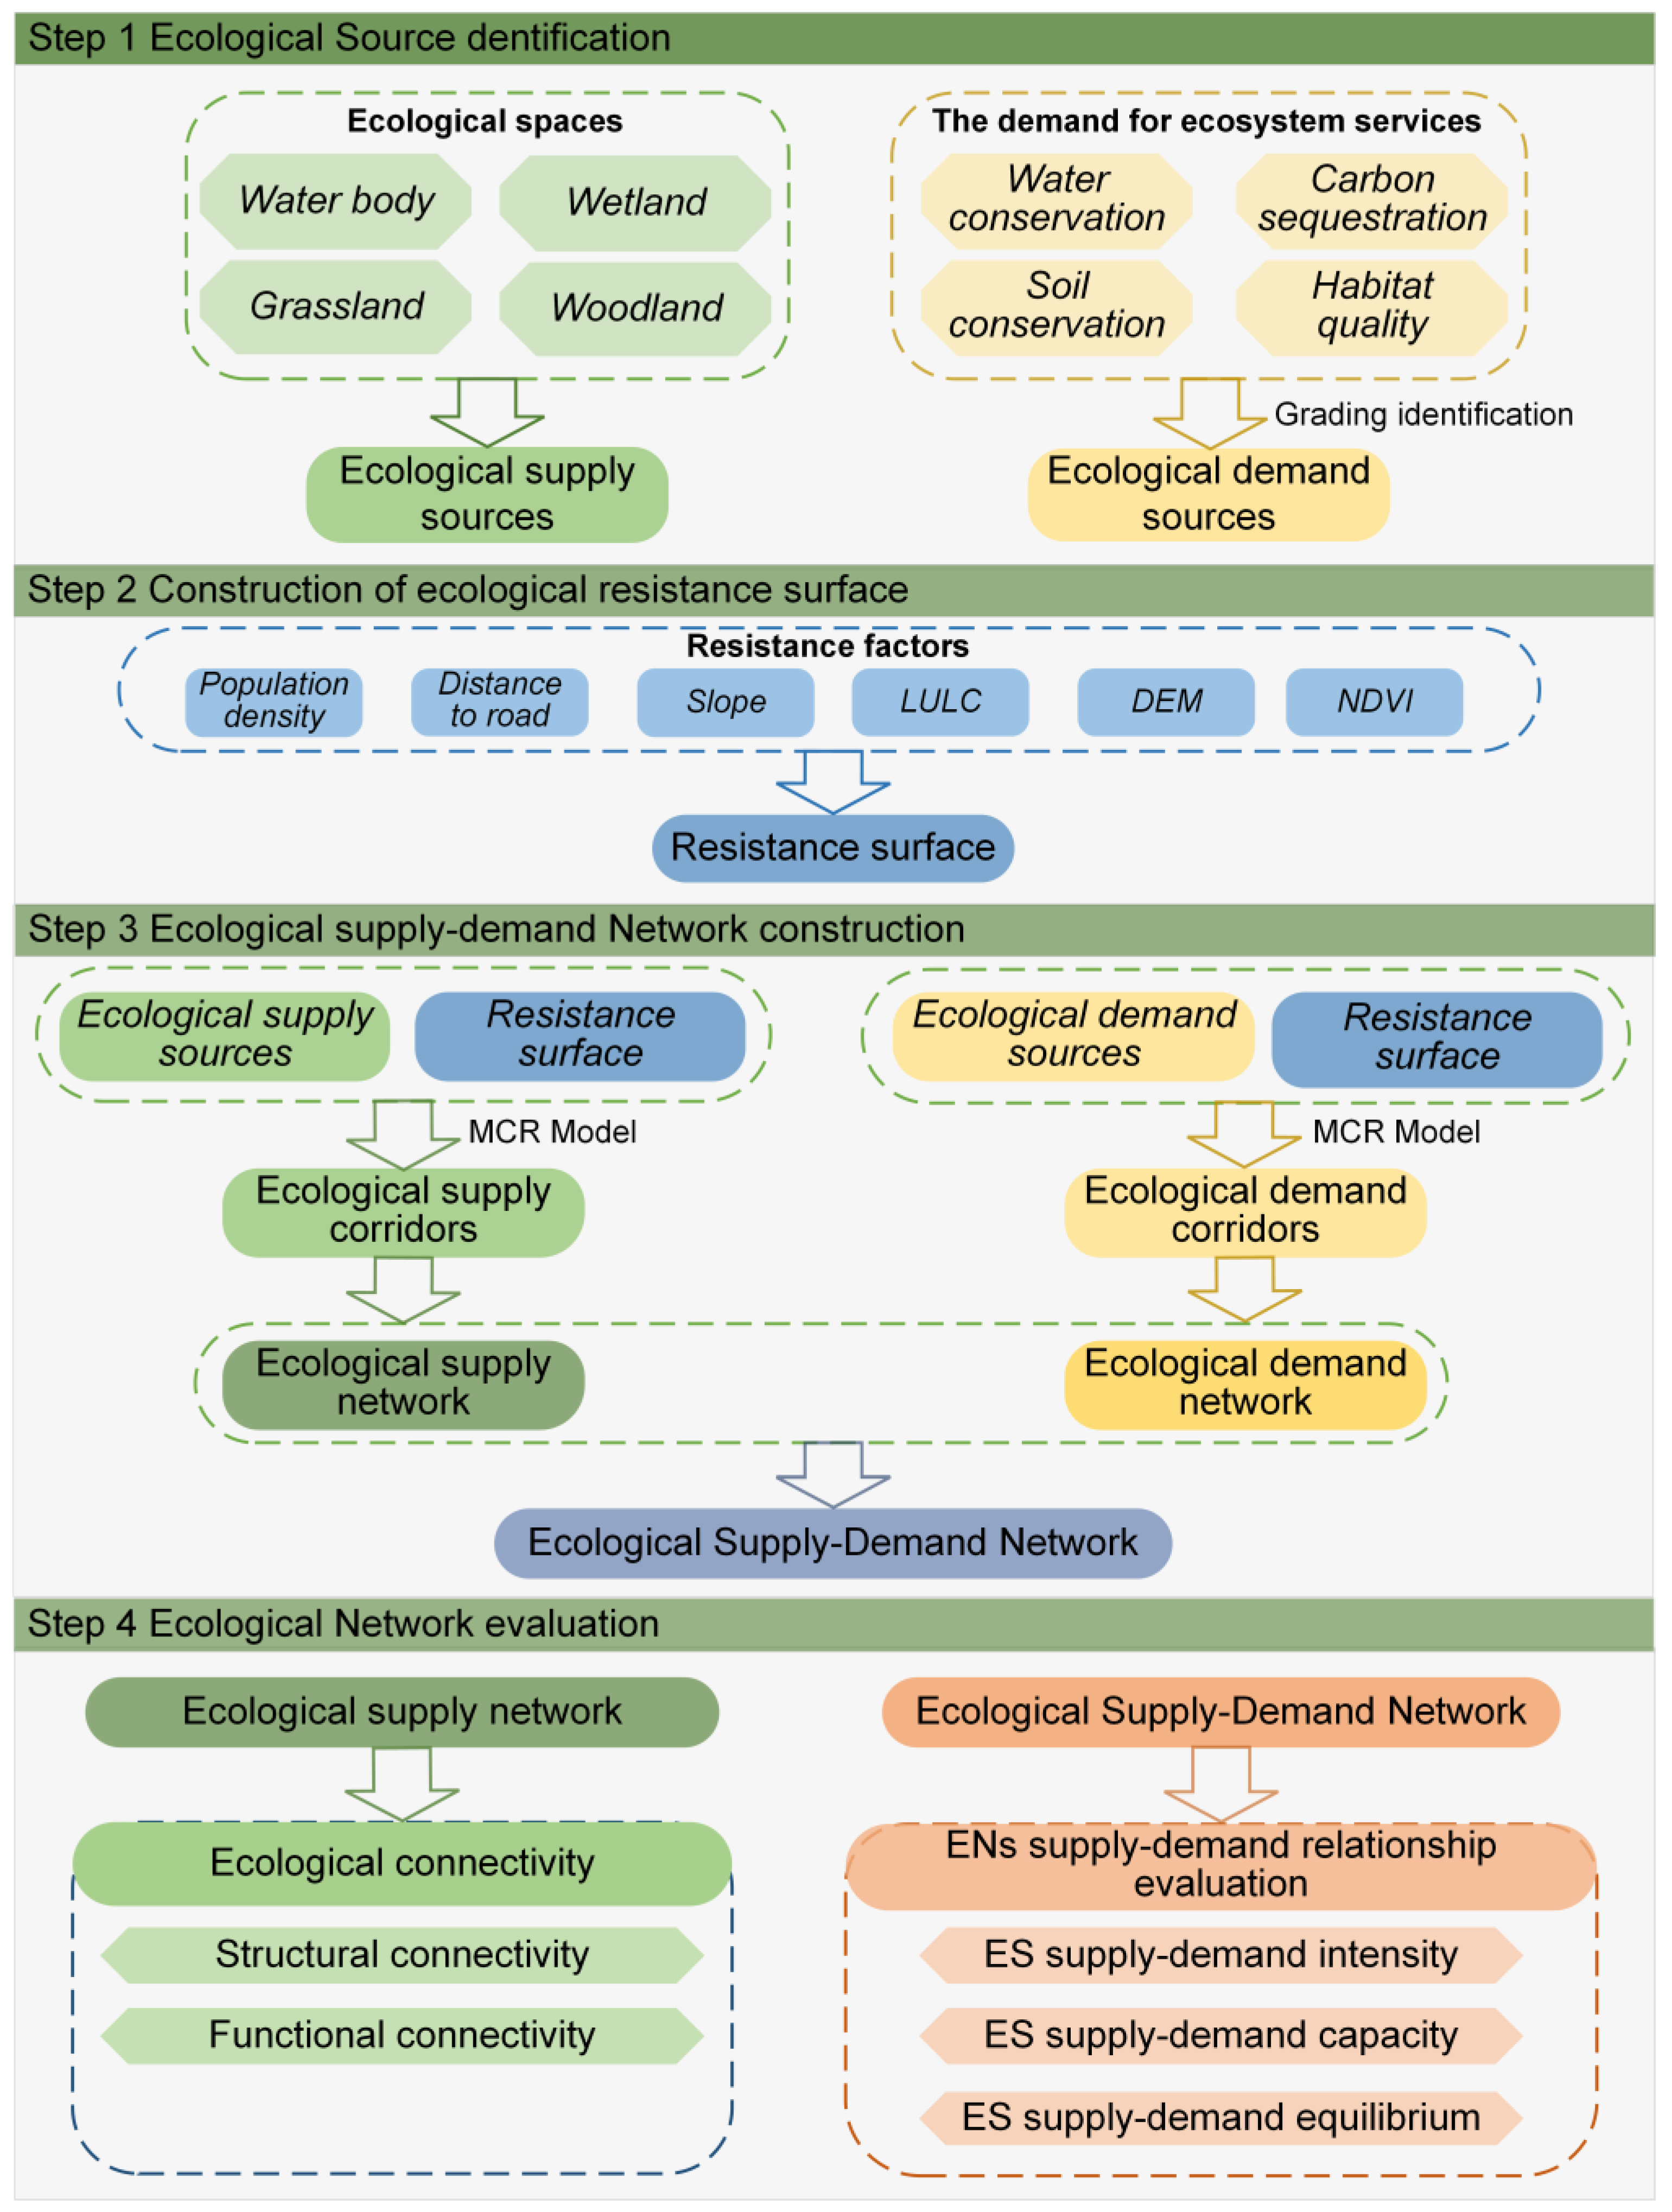
(1) Ecological network construction: The ecological network is constructed following the paradigm of “ecological sources identification-ecological resistance surface construction-ecological corridors extraction” [34]. The identified ecological spaces are defined as potential supply sources. The study assumed that only areas with high-demand functions generate large demand for ecosystem services. Therefore, these areas are the best representation of ecological demand sources. The results of ecosystem service demand were first normalized. They were then reclassified into five levels using a combination of the natural break method and manual classification. The demand patches in the two highest levels were selected as the “demand sources” [35]. The ecological resistance surface is constructed using a weighted overlay of the NDVI, elevation, slope, LULC, road impact intensity, and population intensity (Table A2 in Appendix A). The Minimum Cumulative Resistance (MCR) model [36] is used to identify key ecological corridors and supply–demand connection paths. This process results in an integrated ecological supply–demand network (Figure 5).
Figure 5.
Technical Framework for Ecological Network Construction and Evaluation.
(2) Ecological connectivity assessment: Ecological connectivity is assessed using the Probability of Connectivity (PC) index [37], which measures the structural importance of supply sources within the network (Formula (1)). In addition, a gravity model [38] is used to quantify functional interaction strength between pairs of sources (Formula (2)). The PC index and average interaction strength are normalized and combined with equal weights to obtain a comprehensive ecological connectivity index for each supply source.
where n represents the total number of landscape patches. and represent the areas of patch i and patch j, respectively. is the total landscape area of the study region. indicates the maximum product of probabilities for all paths between patch i and patch j. PC represents the potential connectivity of landscape patches. denotes the interaction strength between source areas. A larger value indicates stronger interaction between ecological sources and higher functional connectivity. and represent the weights of the two patches; denotes the normalized value of the potential corridor resistance between patch i and patch j; and represent the resistance values of patch i and patch j; and denote the areas of patch i and patch j; represents the cumulative resistance value of the corridor between patch i and patch j; and is the maximum resistance of all corridors within the study area.
(3) Evaluation of ecosystem supply–demand relationships: Based on the ecological network, ecosystem supply–demand relationships are evaluated following the method proposed by [39]. Three sub-dimensions are considered: supply–demand intensity, supply–demand capacity, and supply–demand equilibrium. All sub-dimension indicators are normalized. The equilibrium indicator is treated as an inverse index. The normalized indicators are summed with equal weights to generate a composite ecosystem supply–demand relationship index. Higher values indicate better spatial matching between ecosystem service supply and surrounding human demand.
Resilience Dimension: Ecological Resilience Assessment
Ecological resilience represents the ability of a system to resist, adapt to, and recover from disturbance [40]. This study calculates resilience based on three components: resistance, adaptability, and recovery.
(1) Resistance (R): Resistance is represented by ecosystem service value (ESV) per unit area. Based on the equivalent factor table revised by [41], ESV coefficients for different land-use types are adjusted to local conditions in Dongying City. Raster-scale ESVs are then calculated and normalized to represent the resistance index.
(2) Adaptability (A): A more stable ecosystem generally has higher adaptability [42]. Adaptability is evaluated based on landscape stability theory. A moving window analysis is applied to calculate a set of landscape metrics that reflect spatial heterogeneity, connectivity, and shape complexity. The selected indicators include Shannon’s Diversity Index (SHDI), Shannon’s Evenness Index (SHEI), landscape division index (DIVISION), contagion index (CONTAG), landscape shape index (LSI), and area-weighted mean shape index (AWMSI) (Table 2) [43]. These indicators are combined with equal weights to generate the adaptability index.
Table 2.
Landscape indices and weights.
(3) Recovery (): Recovery capacity is evaluated by assigning resilience coefficients to different land-use types based on previous studies (Table 3) [44]. Using LULC data, the weighted sum of resilience coefficients for dominant land-use types within each raster cell is calculated to obtain the recovery capacity index (Formula (3)).
where R represents ecological recovery; represents the area proportion of land-use type m; and denotes the elasticity coefficient for n land-use types, with coefficients referenced from prior research.
Table 3.
LULC elasticity coefficients.
Finally, the normalized resistance, adaptability, and recovery indices are combined with equal weights to calculate the comprehensive ecological resilience index.
Ecological Importance Index
The Ecological Importance Index (EII) is calculated by weighted aggregation of four criterion-level indicators. Coastal cities usually show clear sea–land gradient characteristics, and the dominant ecological processes vary across gradient zones. Therefore, based on the equal-weight baseline (0.25), the weights of the indicators were moderately adjusted according to the ecological characteristics of the coastal, transitional, and inland gradient zones in Dongying City. This adjustment aimed to reflect a context-specific evaluation approach. Specifically, ecosystem services were used to represent the baseline state of ecological space. They play a fundamental role across all three gradient zones. Therefore, the baseline weight (0.25) was assigned. In the coastal gradient zone, ecosystems are strongly influenced by natural disturbances. System stability and the ability to resist external disturbances are particularly important. Therefore, the weight of ecological resilience was increased to 0.40 to reflect its key role in coping with disturbances such as sea-level rise. The transitional gradient zone lies in the land–sea interface and functions as an important corridor for ecological flows and spatial connections. Therefore, ecological connectivity was assigned a relatively higher weight (0.30). In the inland gradient zone, human activity intensity is relatively high, and the conflict between ecological supply and demand is more prominent. Therefore, a higher weight was assigned to the ecological supply–demand relationship (0.35). To ensure the rationality of the weight adjustments, all indicator weights were modified within a range close to the equal-weight baseline. The weights were further refined based on consultation with experts in ecology and territorial spatial planning. This process produced the final weighting schemes for different gradient zones (Table 4). Finally, EII values are classified into five levels (Table 5) to identify extremely important, highly important, and other ecological spaces.
Table 4.
Weight assignment.
Table 5.
Ecological importance grading.
The weighted overlay Formula (4) is as follows:
where represents the comprehensive ecological importance evaluation result for band m; denotes the normalized evaluation index for category i; indicates the weight value for category i’s evaluation index; and n is the number of ecological importance evaluation indices.
3. Results
3.1. Spatiotemporal Changes in Ecological Spaces
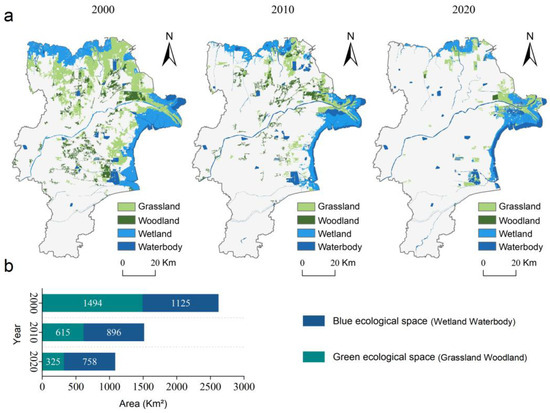
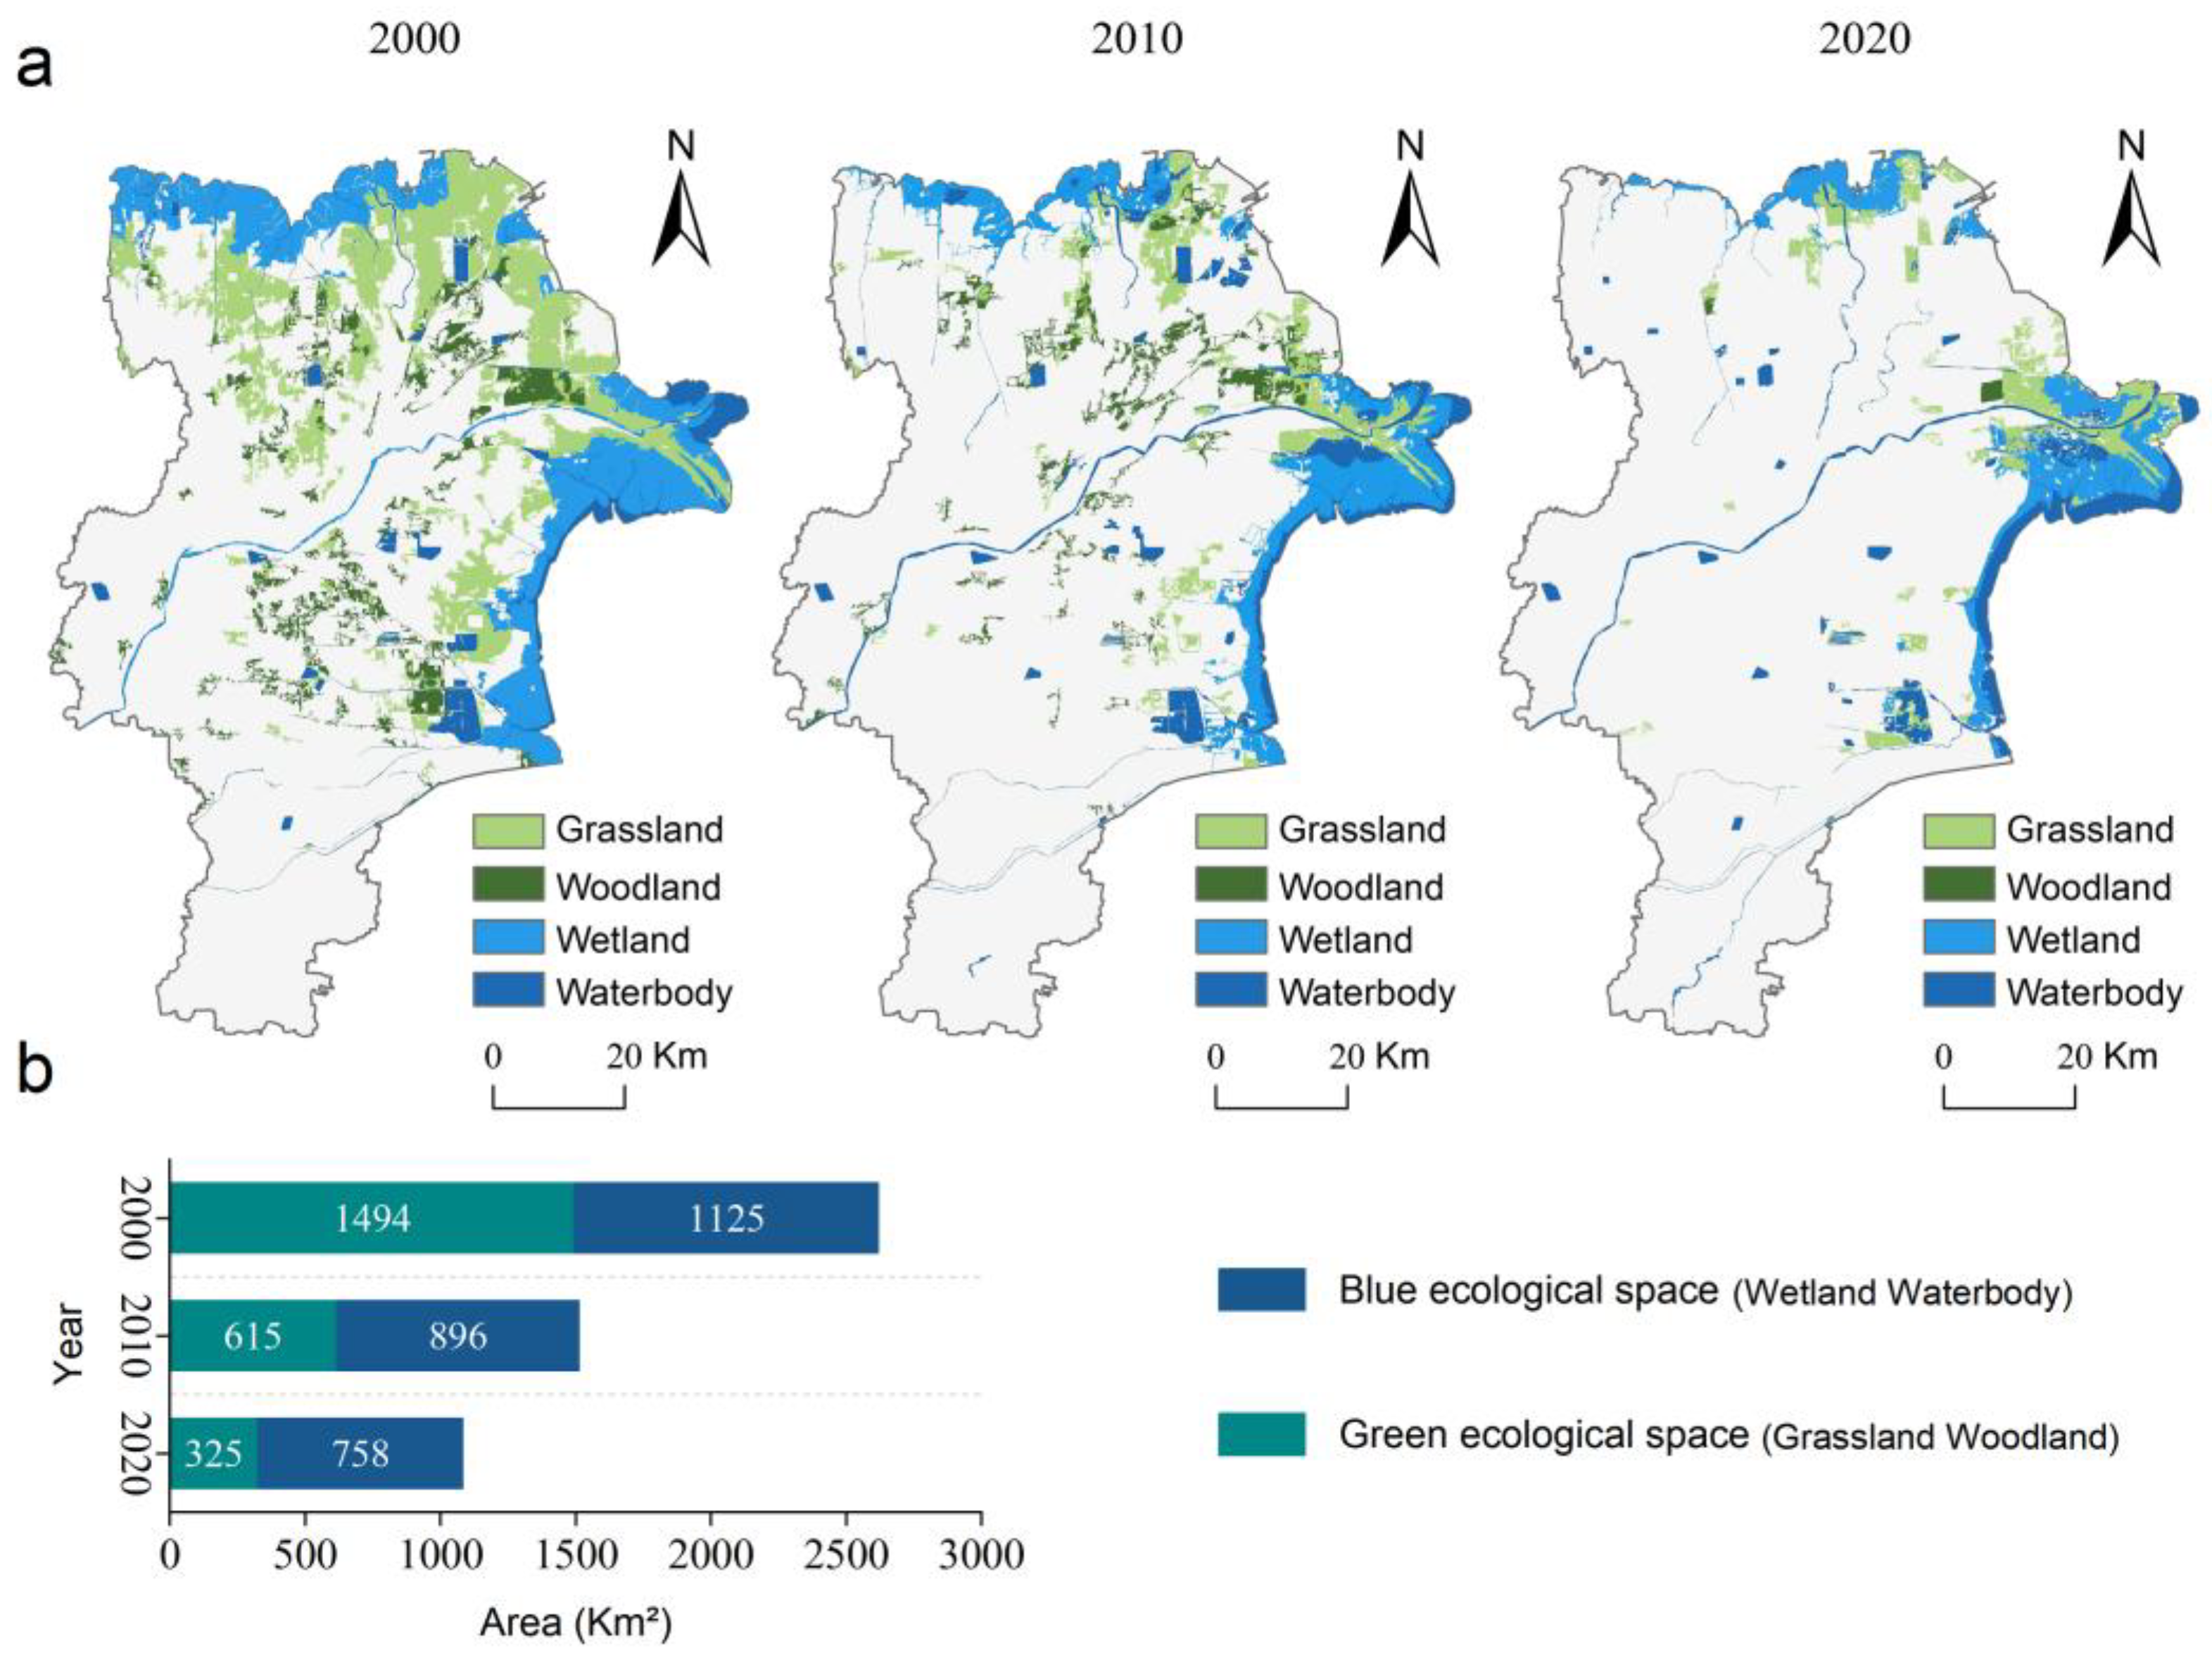
From 2000 to 2020, the distribution of ecological spaces (wetlands, grasslands, woodlands, and water bodies) in Dongying City showed significant spatial heterogeneity and dynamic changes (Figure 6a). Overall, the total area of ecological spaces continuously decreased, from 2619 km2 in 2000 to 1083 km2 in 2020, a reduction of 58%. Spatially, the loss of ecological spaces mainly occurred in two regions. The first was the central urban area and its surroundings. Rapid urbanization directly occupied ecological land. Construction land expanded sharply. Original ecological patches were fragmented or replaced. The second was the eastern coastal zone. This loss was mainly affected by coastal activities, such as land reclamation for aquaculture and oil and gas development.
Figure 6.
Spatiotemporal changes in ecological spaces. (a) Distribution of ecological spaces in Dongying City, 2000–2020; (b) trends in blue and green space changes in Dongying City, 2000–2020.
Further analysis of “blue” spaces (wetlands and water bodies) and “green” spaces (grassland and forest) revealed different trends and drivers (Figure 6b). The area of blue spaces decreased from 1125 km2 in 2000 to 758 km2 in 2020, a reduction of 32.6%. The loss was concentrated in aquaculture zones and port areas along Laizhou Bay. Green spaces declined more severely. Green space area sharply dropped from 1494 km2 to 325 km2, a decrease of 78.2%. This change mainly occurred in Kenli District and Hekou District, where agricultural reclamation was intensive and soil salinization was serious. These patterns indicate that changes in ecological spaces in Dongying City were jointly influenced by urban expansion, agricultural development, and coastal industrial activities.
3.2. Spatiotemporal Changes in Ecosystem Service Functions
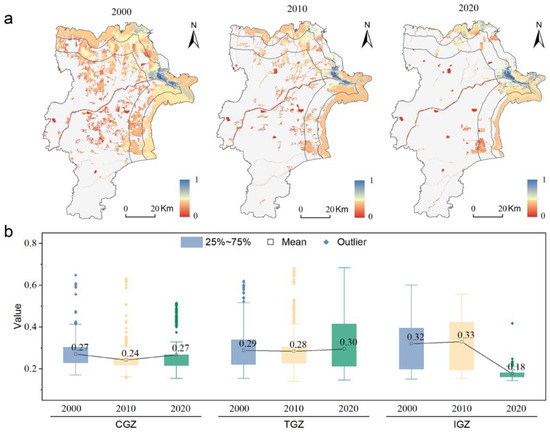
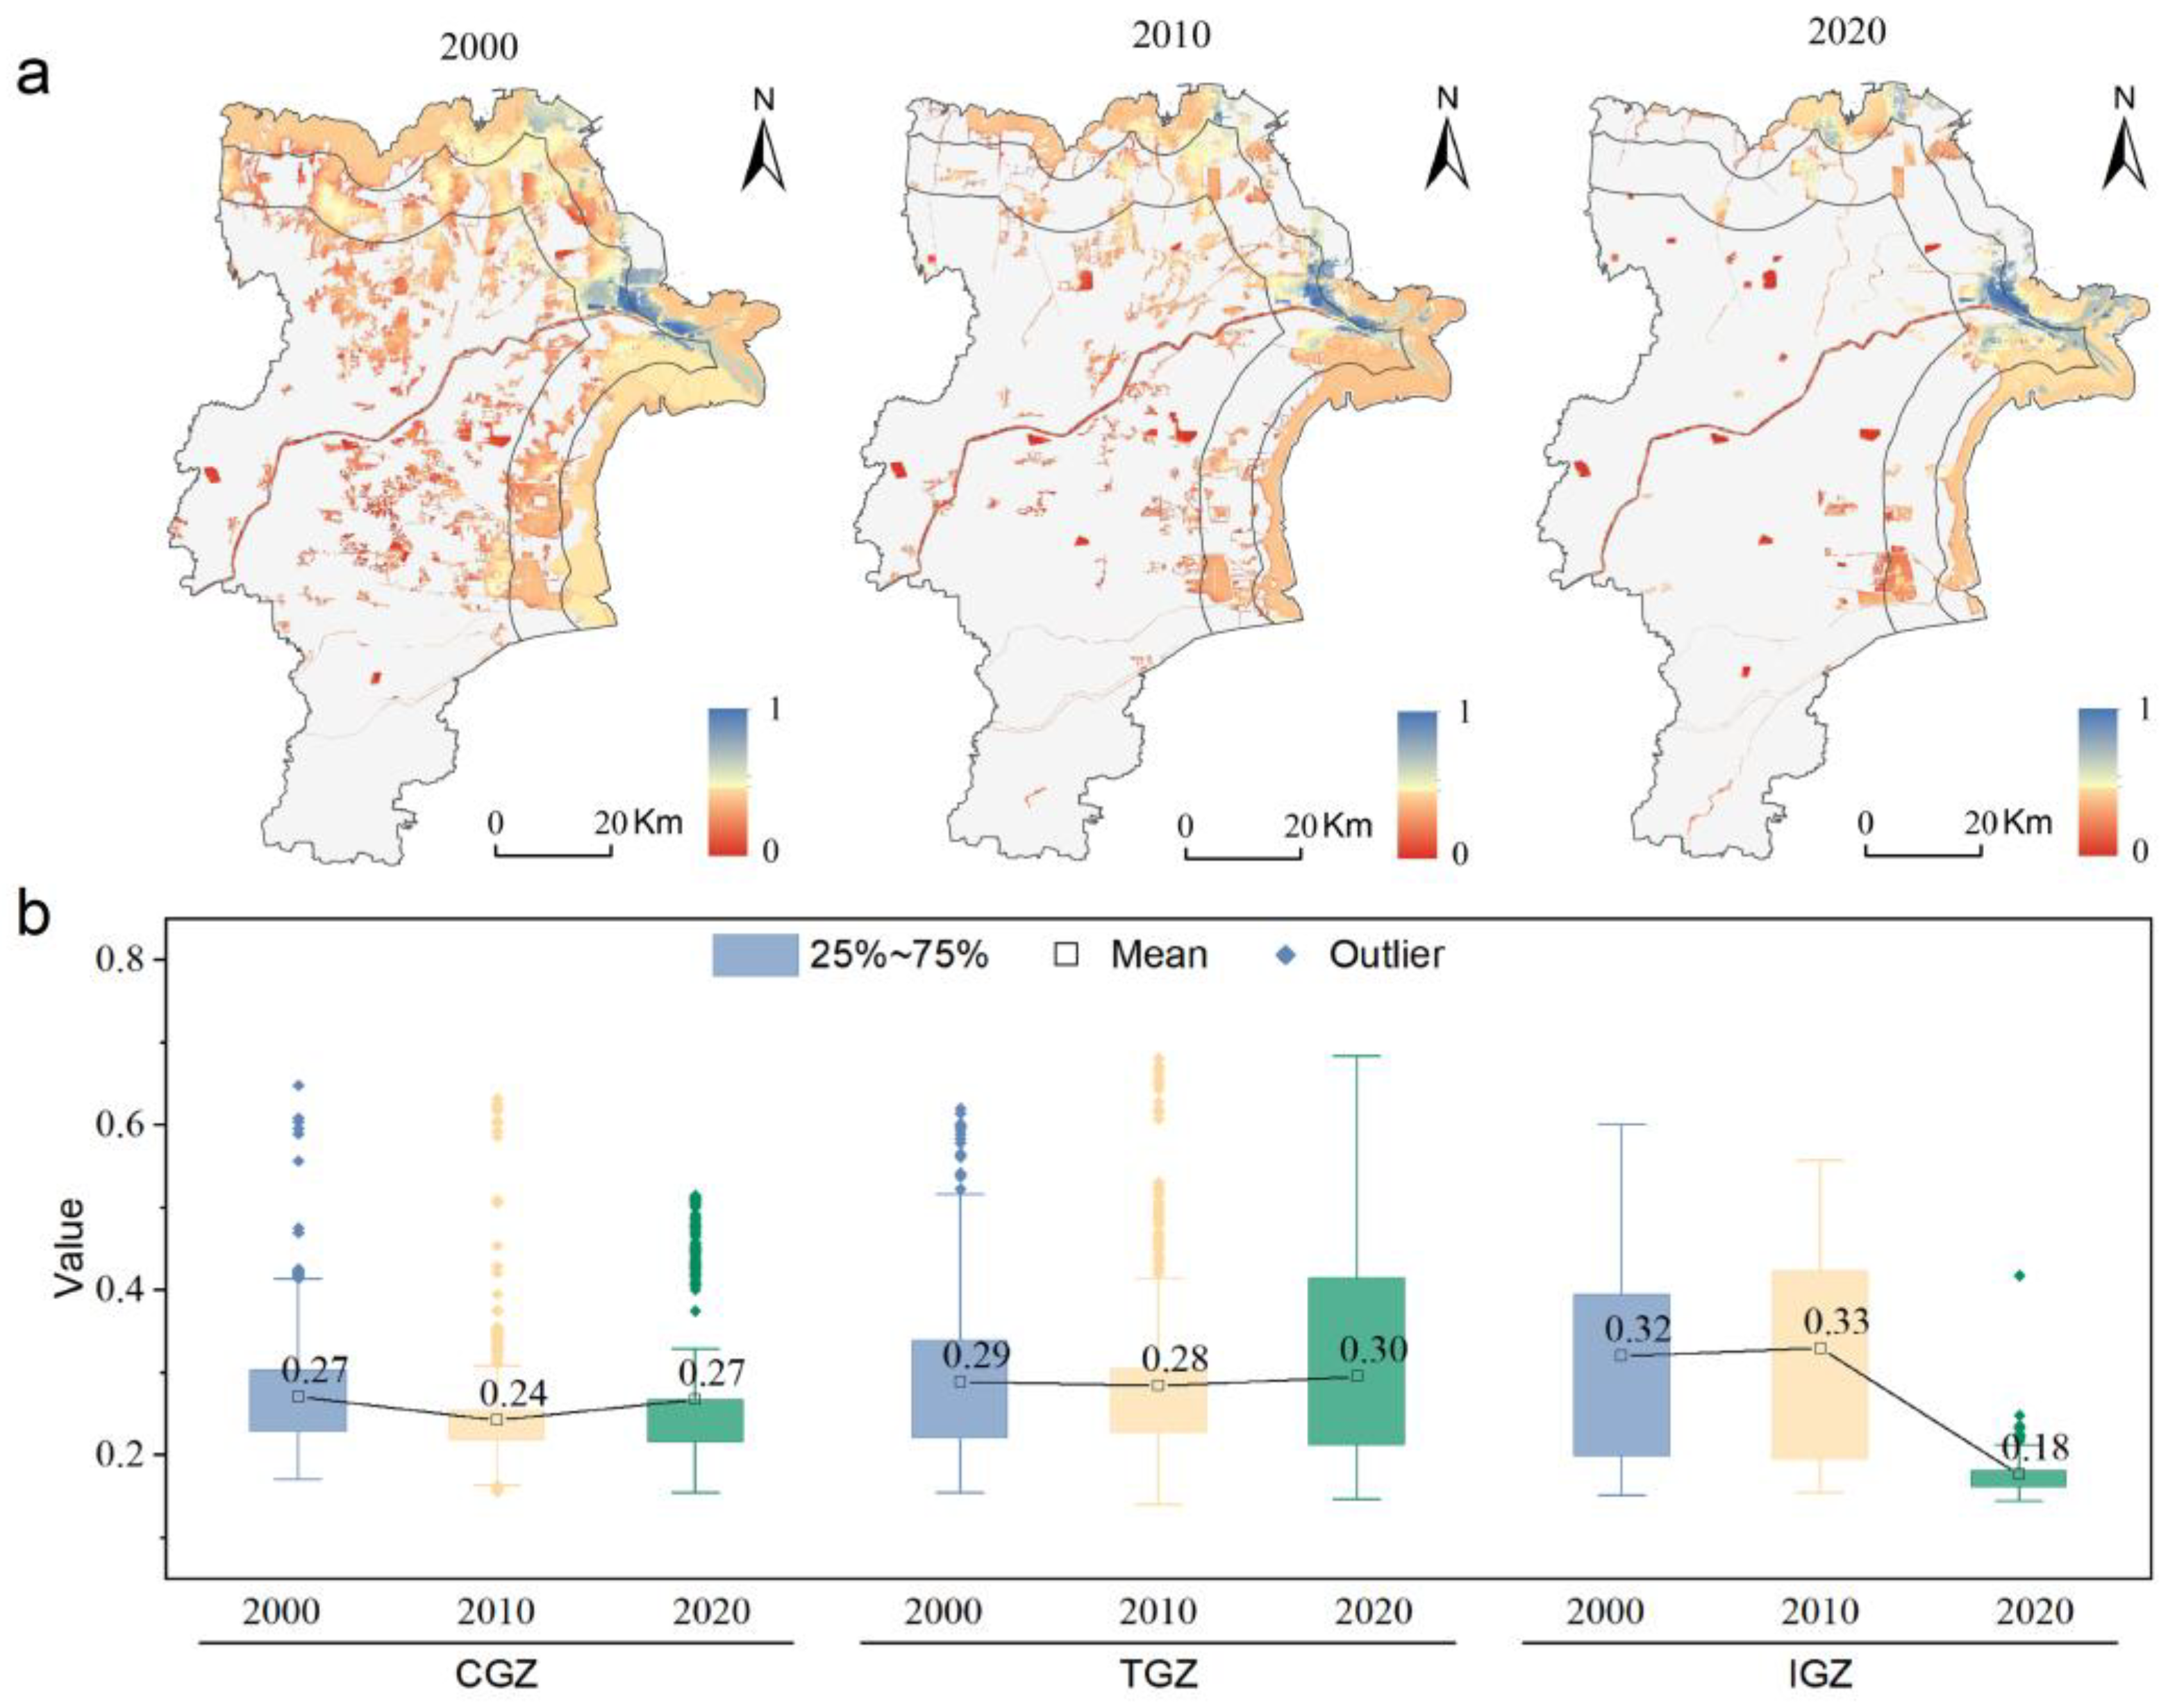
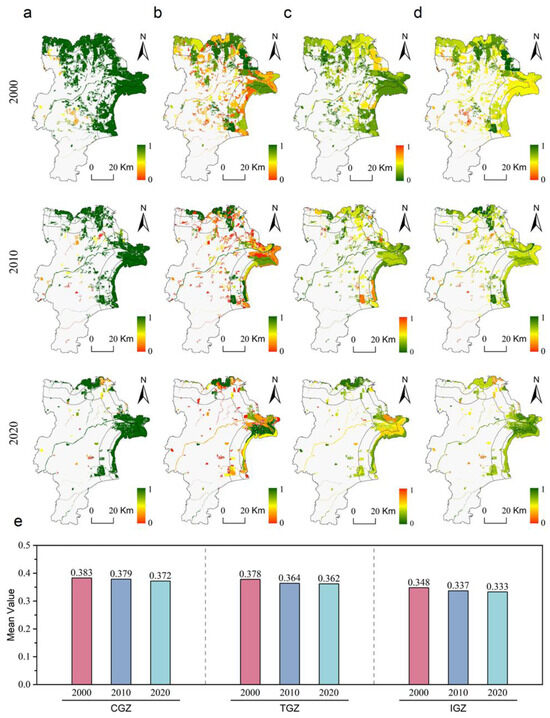
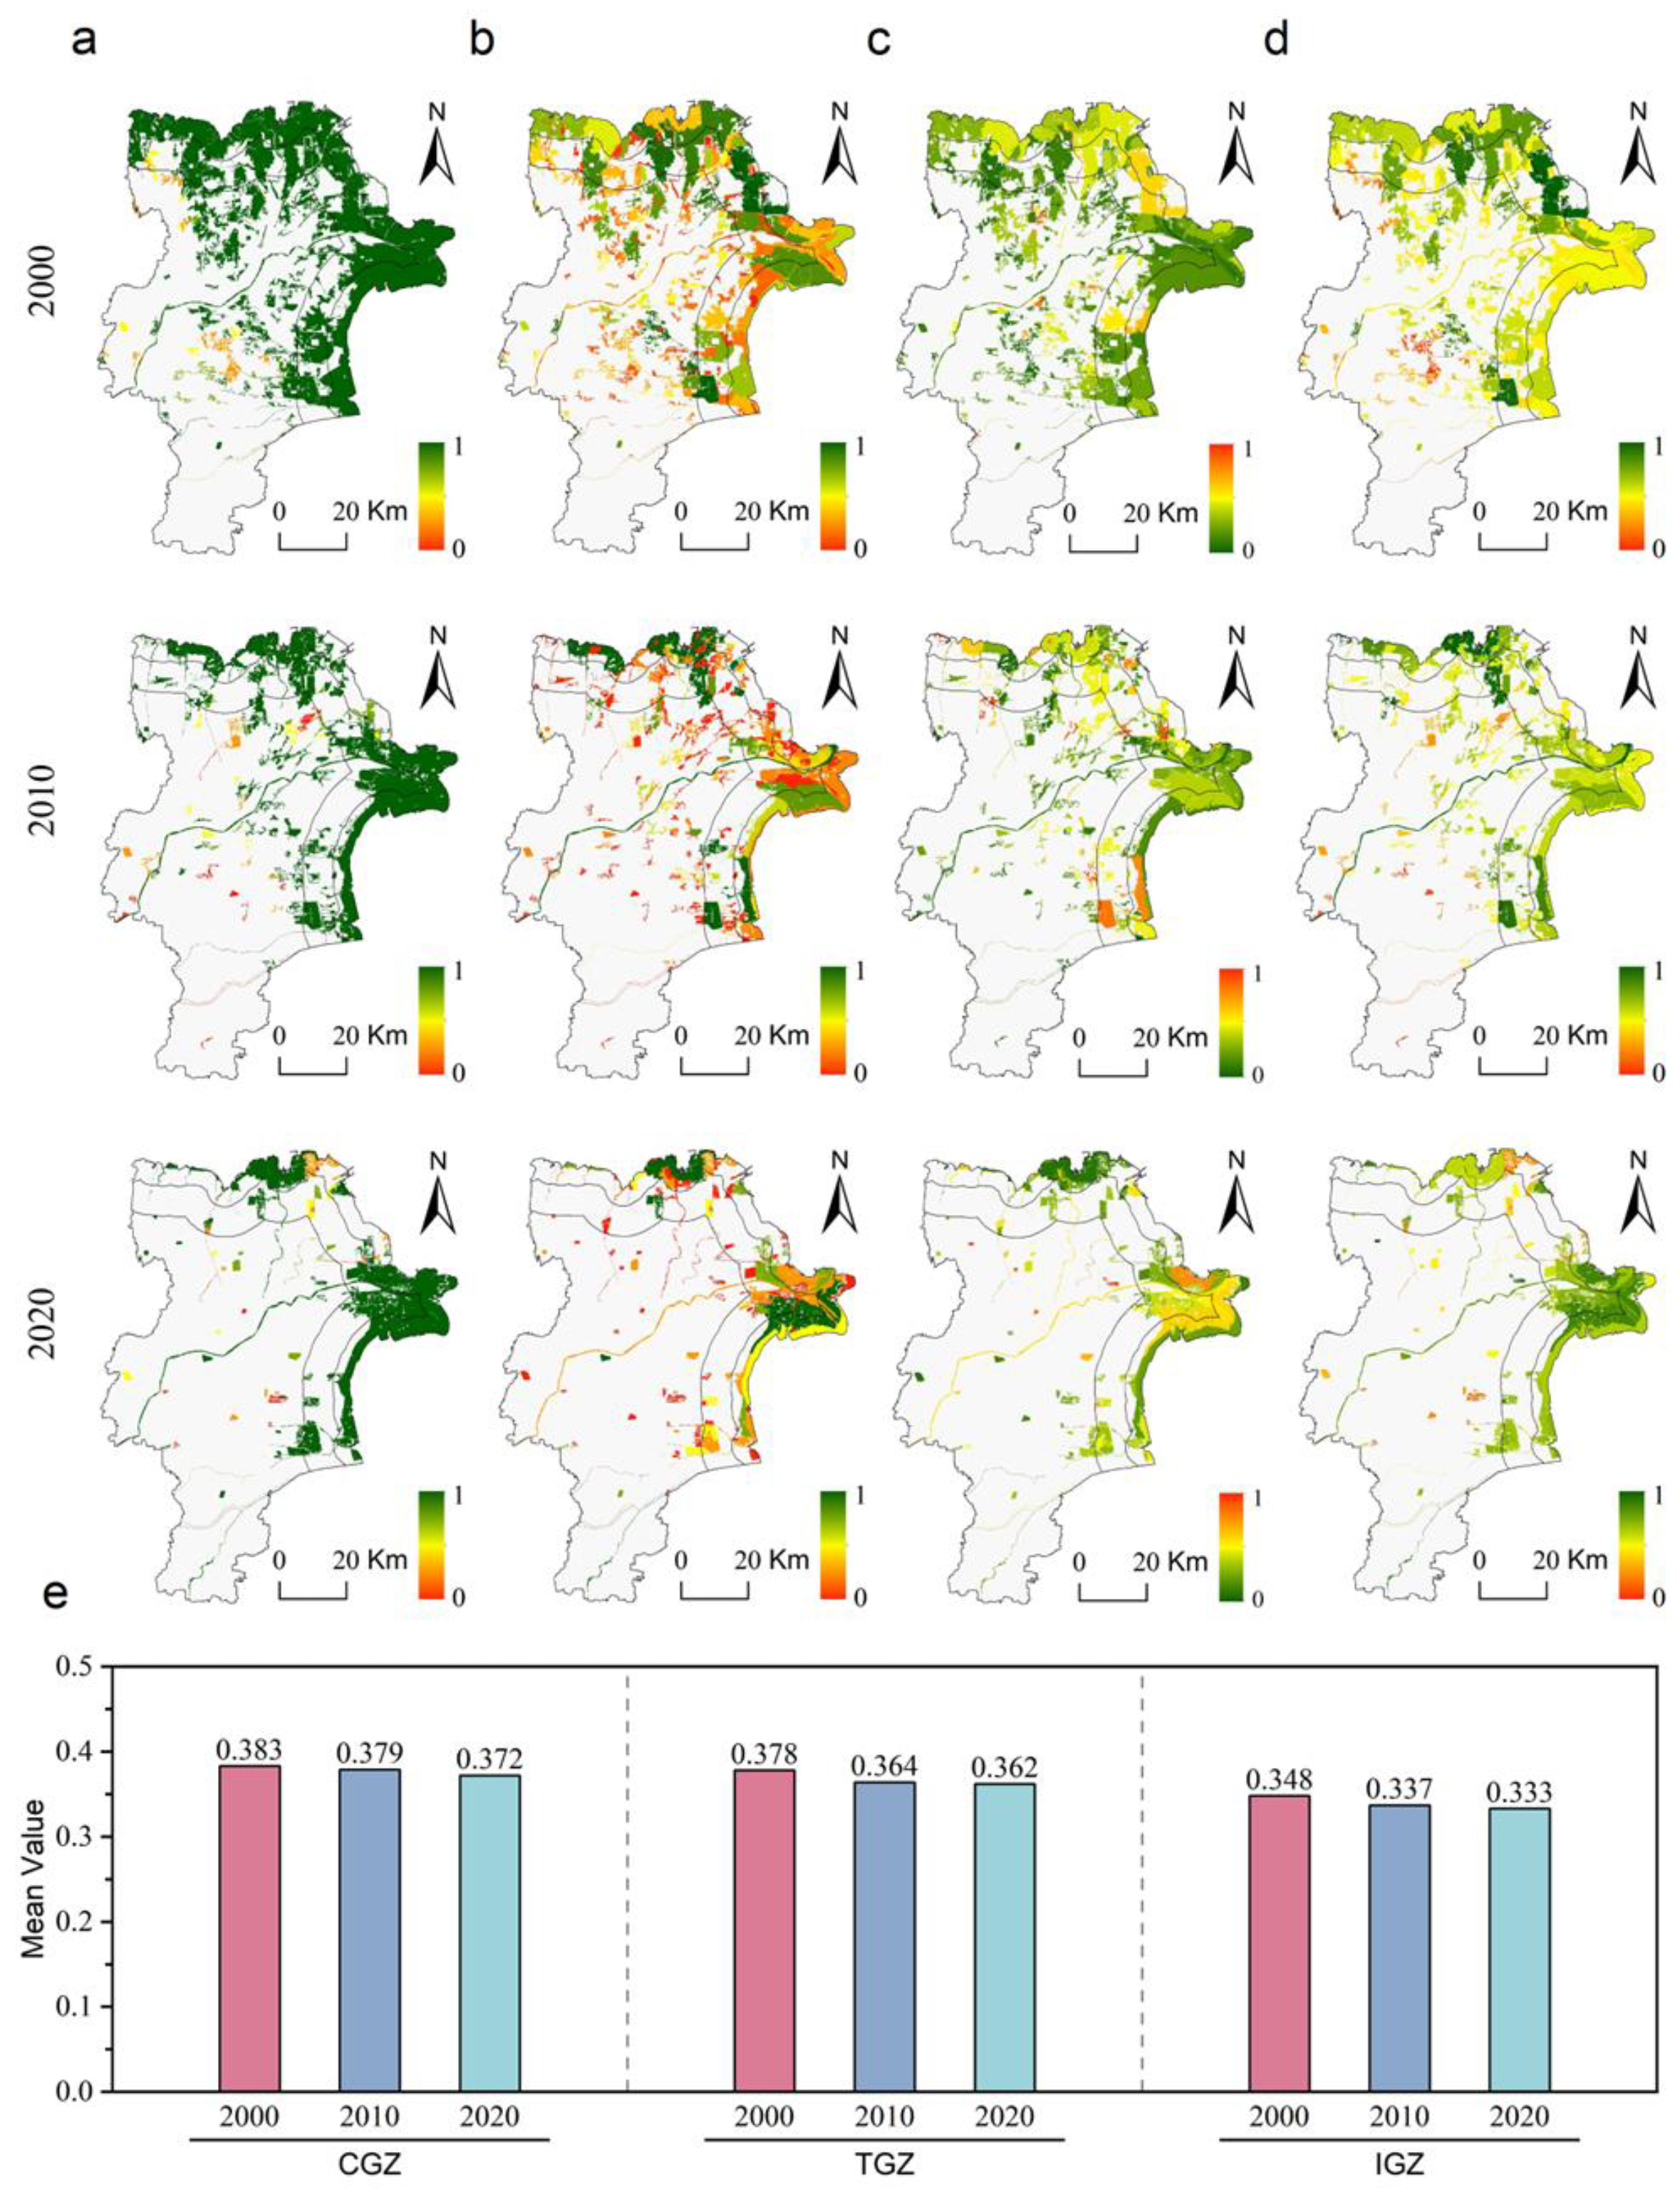
The integrated ecosystem service assessment results are shown in Figure 7a. From 2000 to 2020, the overall ecosystem service supply capacity in Dongying City showed a declining trend. Clear differences existed along coastal–inland gradient zones. Spatially, areas with high service supply remained stable in the eastern coastal wetlands. These areas were centered on the Yellow River Delta National Nature Reserve. Low-value areas largely overlapped with built-up urban areas and intensive agricultural zones.
Figure 7.
Spatiotemporal changes in ecosystem service functions. (a) Spatial distribution of ecosystem services in Dongying City from 2000 to 2020; (b) quantitative statistics of ecosystem services in the land–sea gradient zones of Dongying City from 2000 to 2020.
Quantitative statistics further revealed gradient differences (Figure 7b). The inland gradient zone showed the largest decline in the ecosystem service index. For example, it decreased from 0.32 in 2000 to 0.18 in 2020. This decline mainly resulted from the direct loss of forest and grassland caused by urban expansion. The coastal gradient zone also experienced a clear decline. The main driver was the conversion of coastal wetlands into aquaculture ponds, which weakened carbon sequestration and regulation functions. The transitional gradient zone remained relatively stable. This result suggests that its buffer function between land and sea was maintained for a certain period.
3.3. Spatiotemporal Changes in Ecological Interactions
3.3.1. Ecological Connectivity
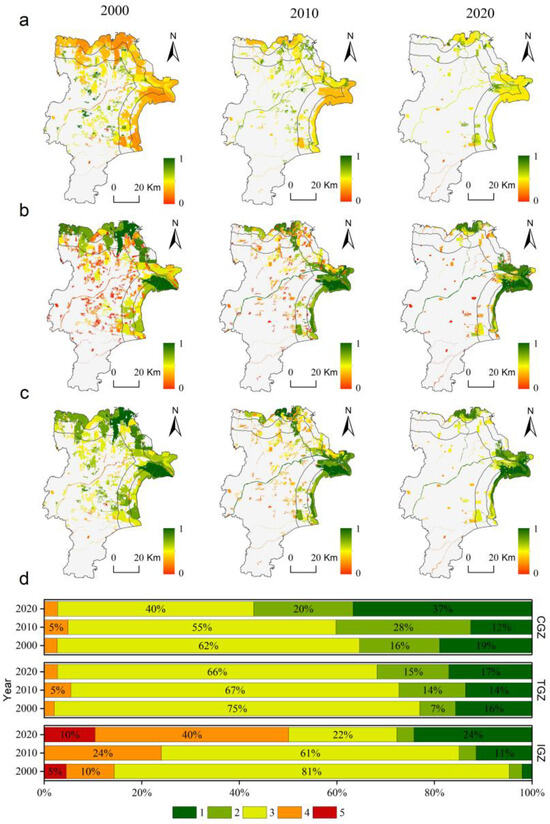
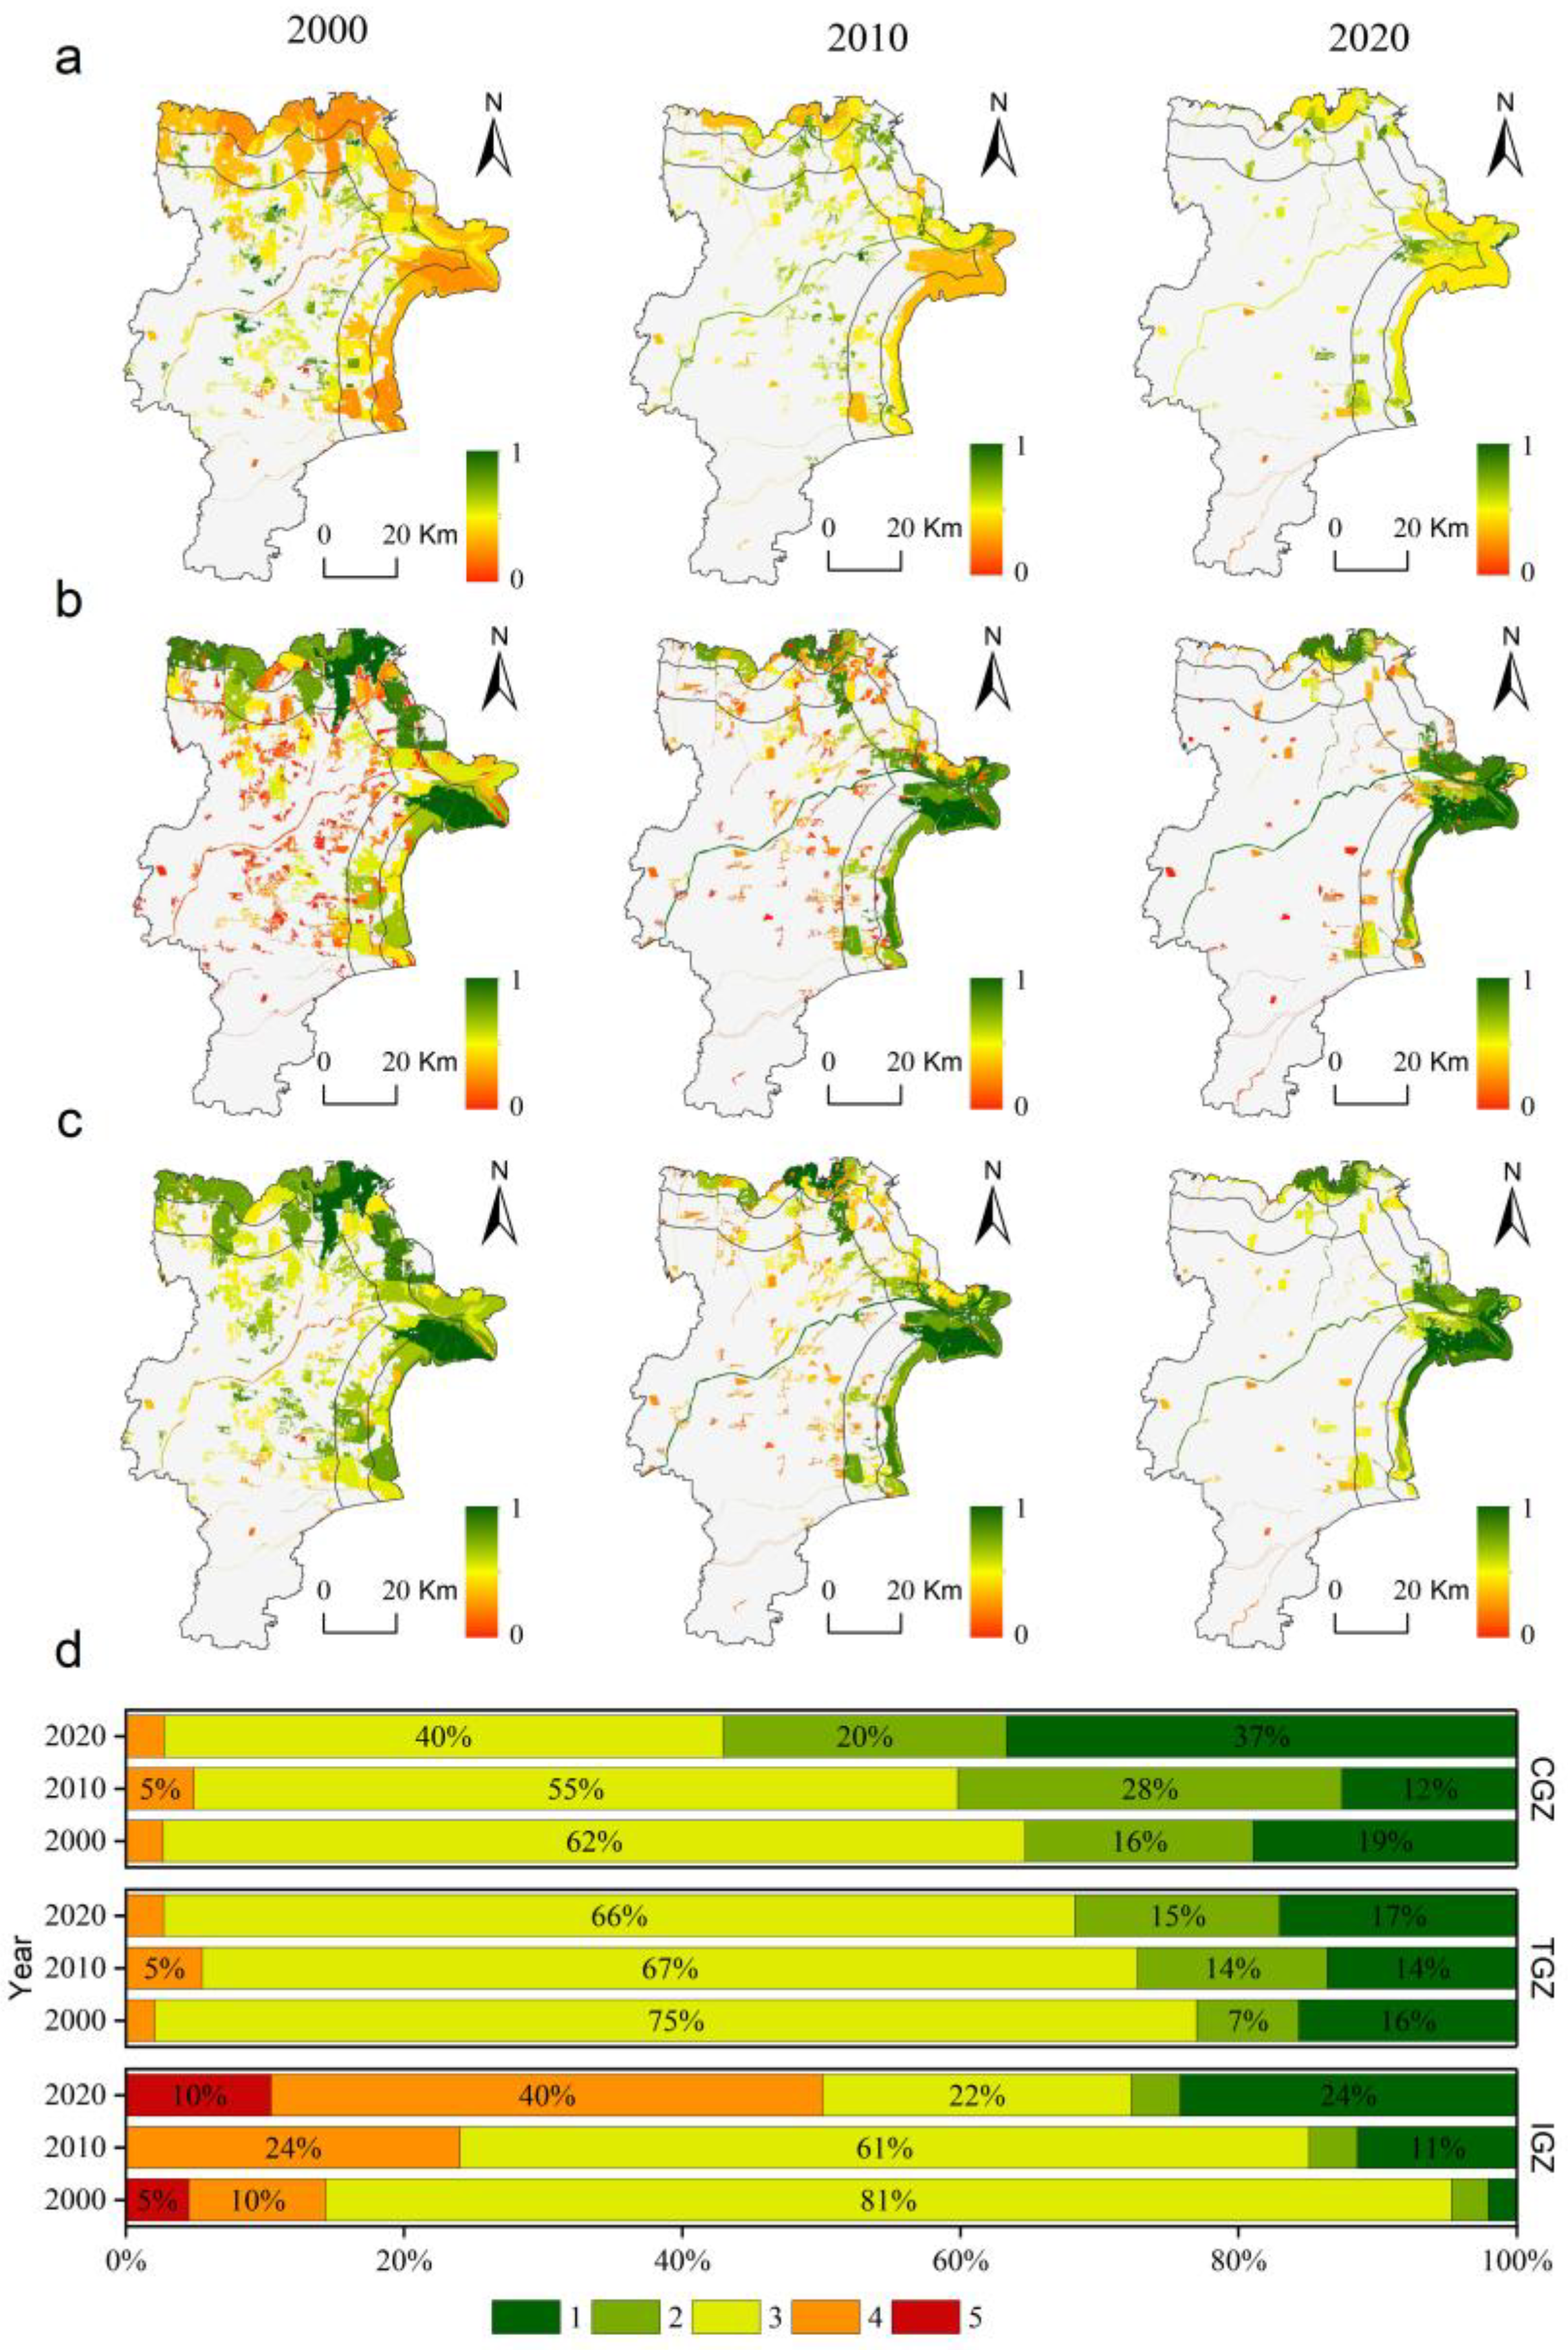
Ecological network analysis showed strong spatial heterogeneity in ecological connectivity in Dongying City (Figure 8c). Highly connected ecological sources were mainly clustered in the Yellow River estuary and the adjacent coastal wetlands. These areas had large and high-quality patches, forming the core of a structurally complete and functionally strong ecological network. In contrast, ecological sources in inland areas existed but were fragmented and isolated due to roads, towns, and farmland, resulting in very low connectivity.
Figure 8.
Spatiotemporal changes in ecological connectivity. (a) Spatiotemporal evolution of functional connectivity in Dongying City, 2000–2020; (b) spatiotemporal evolution of structural connectivity in Dongying City, 2000–2020; (c) spatiotemporal evolution of ecological connectivity in Dongying City, 2000–2020; (d) changes in the proportion of ecological space across different levels of ecological connectivity from 2000 to 2020; the colors represent the Ecological importance grades 1 to 5.
Over the time series (Figure 8d), the overall pattern of ecological connectivity remained stable, but local positive changes occurred. From 2000 to 2020, the proportion of high-connectivity sources (top 20%) in the coastal gradient zone increased from 19% to 37%. This increase was especially clear in northern areas. Ecological restoration projects promoted wetland patch expansion and connection. However, the proportion of extremely low-connectivity sources in inland areas continued to increase. This result indicates that fragmentation was not effectively controlled, and resistance to ecological flows kept rising.
3.3.2. Ecological Supply–Demand Relationship
The spatial patterns of the sub-indicator evaluation results of ecological supply-demand relationships and the overall evaluation results are shown in Figure 9a–d. The coastal gradient zone has the highest comprehensive supply–demand index. Its average value across three time points was 2.7% and 11.5% higher than those of the other two gradient zones. This result indicates a good spatial match between ecosystem supply and relatively low human demand. The transitional gradient zone ranks second. The inland gradient zone showed the weakest supply–demand relationship. This pattern reflects the typical conflict between high demand and low supply in rapidly urbanizing areas.
Figure 9.
Spatiotemporal changes in ecological supply–demand relationships in Dongying City, 2000–2020. (a) Ecological network supply-demand intensity; (b) ecological network supply-demand capacity; (c) ecological network supply-demand equilibrium; (d) overall ecological supply-demand relationships; (e) quantitative statistics of evaluation results for Sea–Land gradient zones.
Over time (Figure 9e), the supply-demand index in all gradient zones showed a slight downward trend. From 2000 to 2020, the index declined by 2.9%, 4.2%, and 4.3% in the coastal, transitional, and inland zones, respectively. This indicates that coordination is facing challenges. The inland gradient zone shows the most pronounced decline. This change was mainly caused by the continuous loss or degradation of ecological supply sources during urban expansion. At the same time, population and economic growth increased ecological demand. This process widened the supply–demand gap. In contrast, the coastal gradient zone maintained a relatively high supply-demand level due to protection policies and ecological background support.
3.3.3. Spatiotemporal Changes in Ecological Resilience
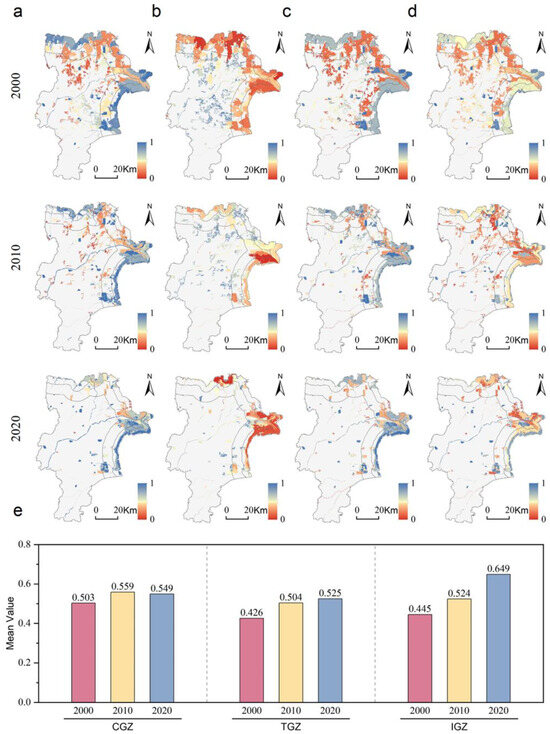
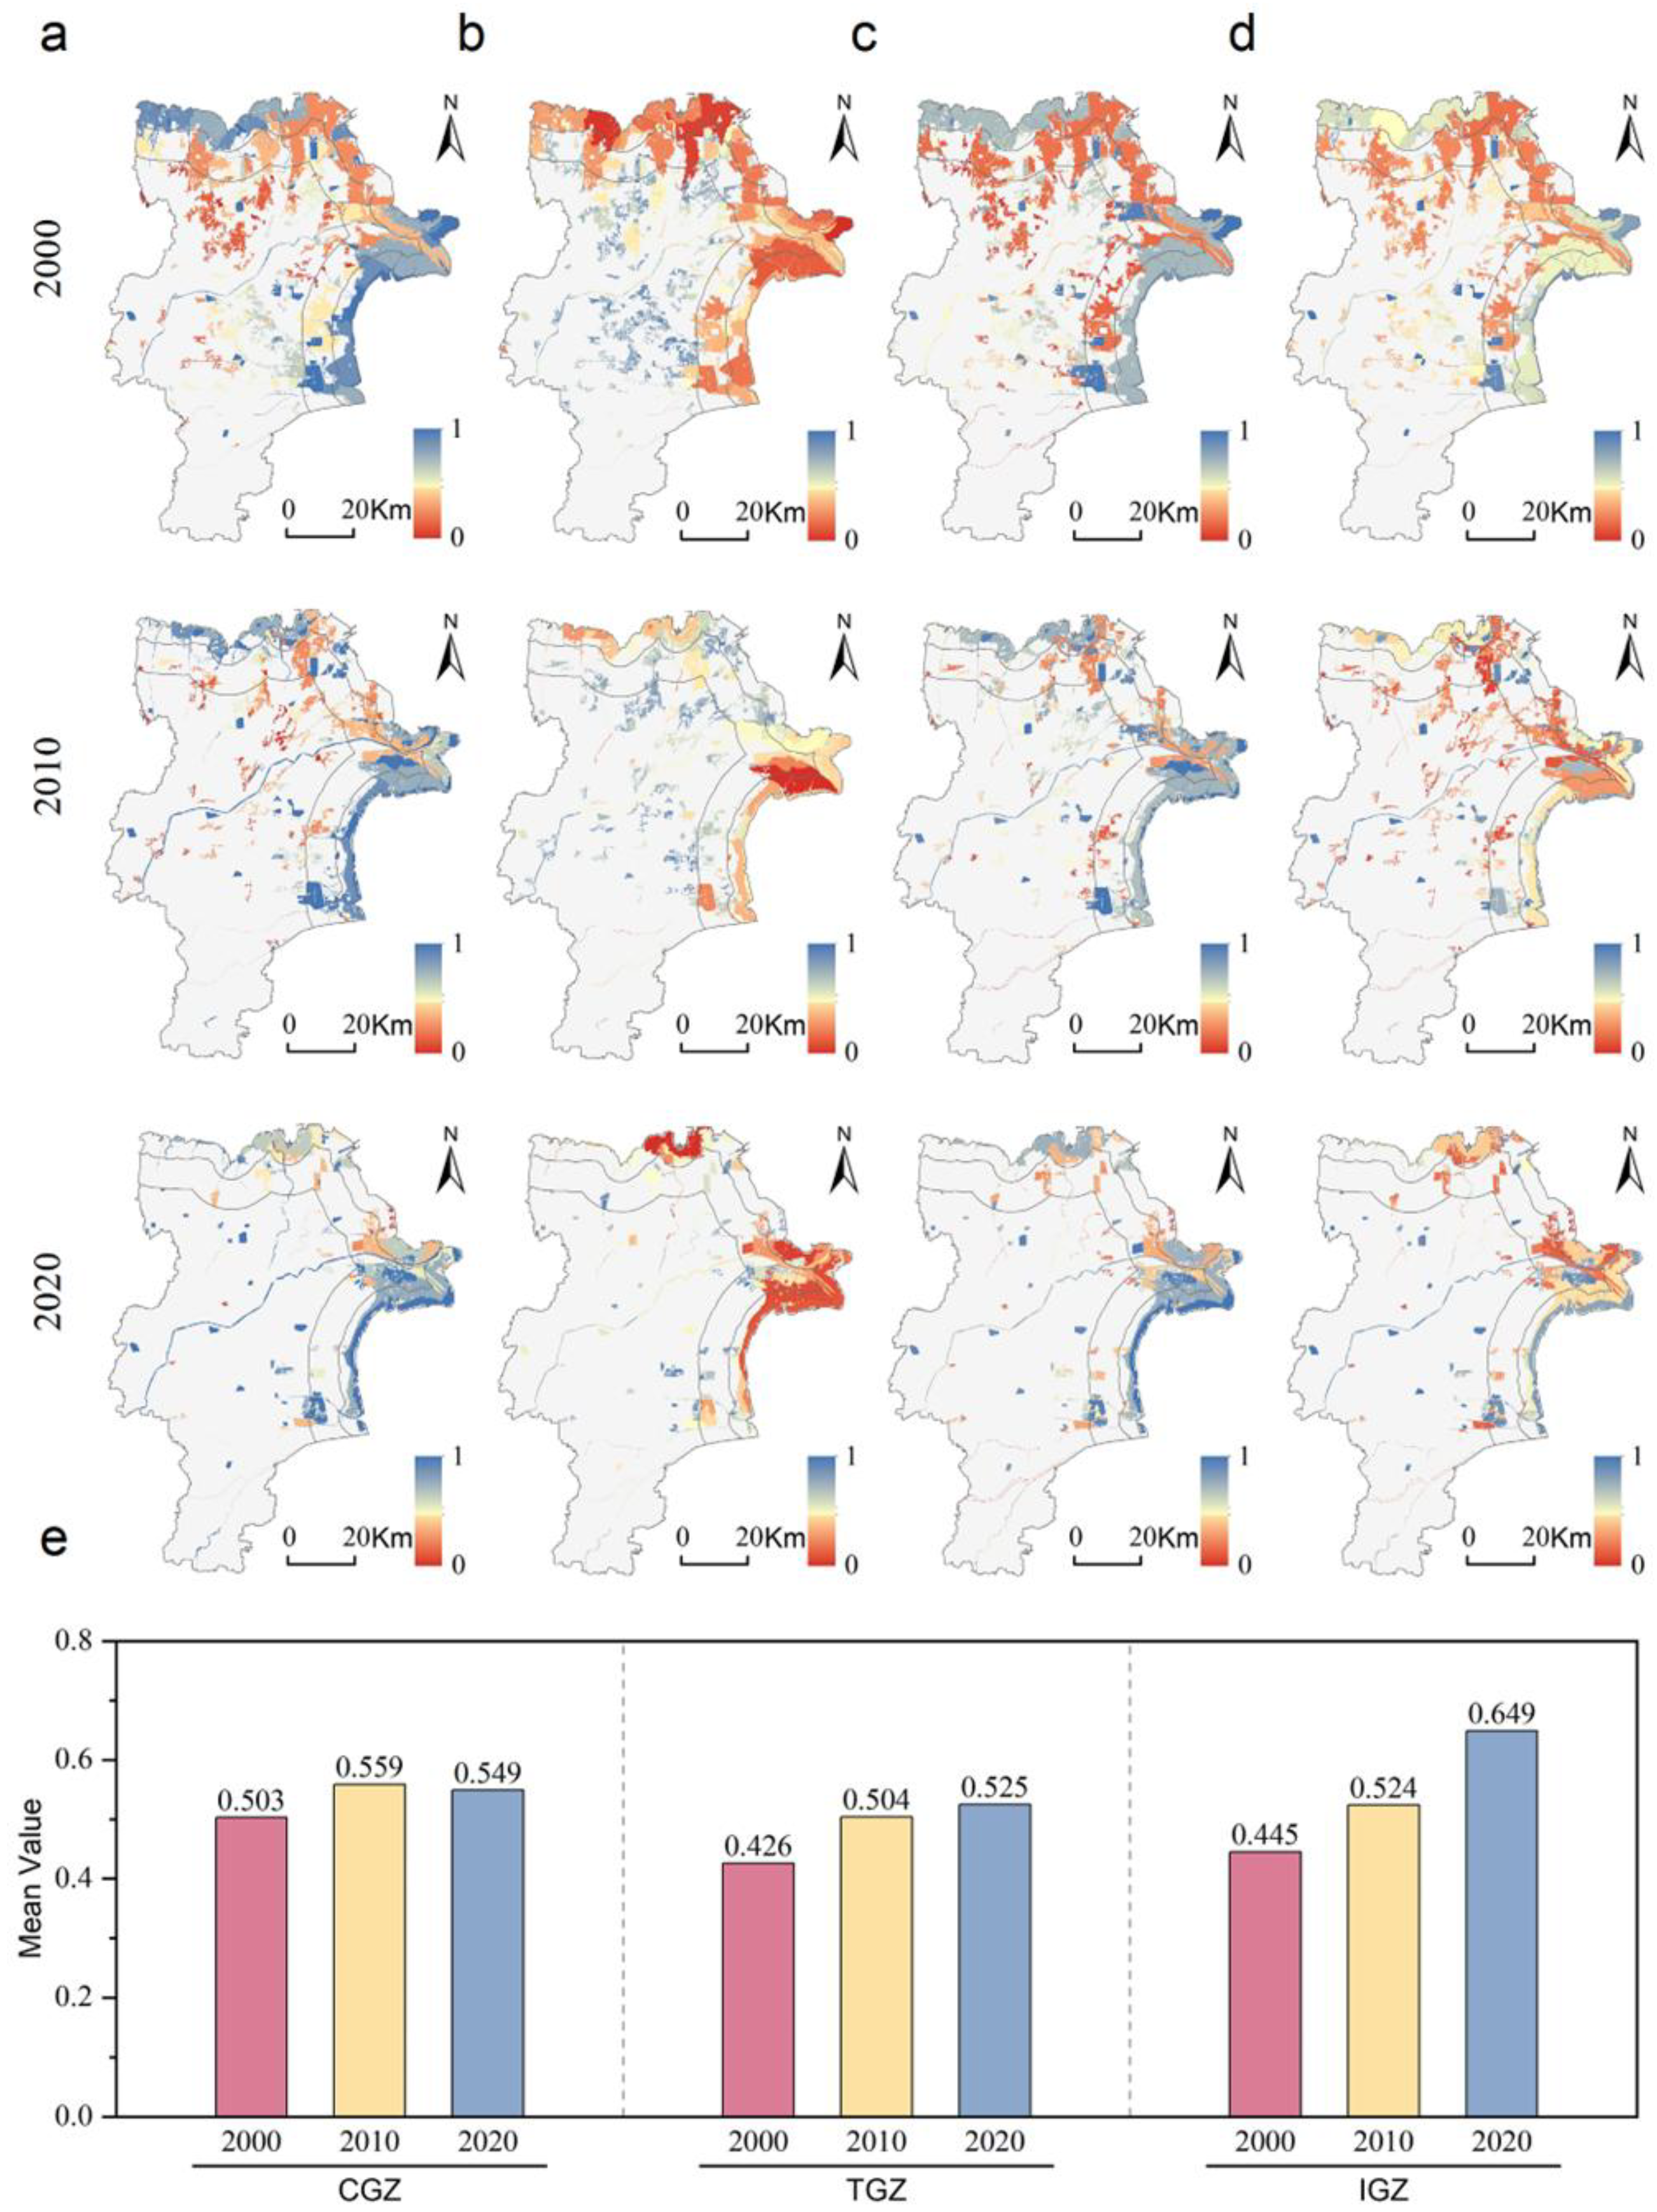
The spatial distribution of ecological resilience in Dongying City showed a clear coastal–inland gradient (Figure 10a–d). Resilience was high in coastal areas and low in inland areas. High-resilience zones (>0.6) were mainly distributed in coastal wetlands, salt marshes, and nearshore waters. These ecosystems have complex structures and strong self-recovery capacity. Low-resilience zones (<0.3) closely overlapped with urban built-up areas and industrial land.
Figure 10.
Spatiotemporal changes in ecological resilience. (a) Spatiotemporal evolution of resistance in Dongying City, 2000–2020; (b) spatiotemporal evolution of adaptability in Dongying City, 2000–2020; (c) spatiotemporal evolution of resilience in Dongying City, 2000–2020; (d) spatiotemporal evolution of ecological resilience in Dongying City, 2000–2020; (e) quantitative statistics of ecological resilience results for land–sea gradient zones in Dongying City, 2000–2020.
From 2000 to 2020, the average ecological resilience index increased from 0.458 to 0.574 (Figure 10e). This result indicates an overall improvement. This improvement is mainly due to two processes. First, in coastal areas, strict protection and restoration strengthened wetland integrity and stability. Second, in inland urban areas, natural ecological space declined. However, resistance and recovery per unit area improved through urban green space expansion and ecological infrastructure construction. Despite this improvement, absolute resilience levels in inland areas remained much lower than those in coastal zones.
3.4. Spatiotemporal Changes in Ecological Importance
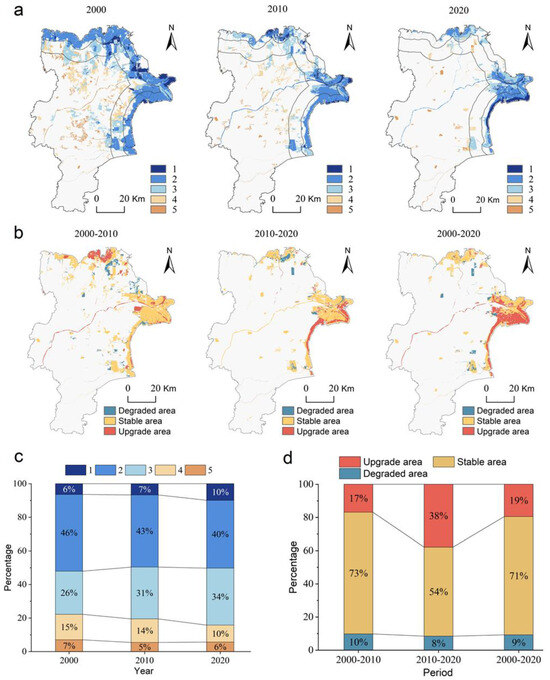
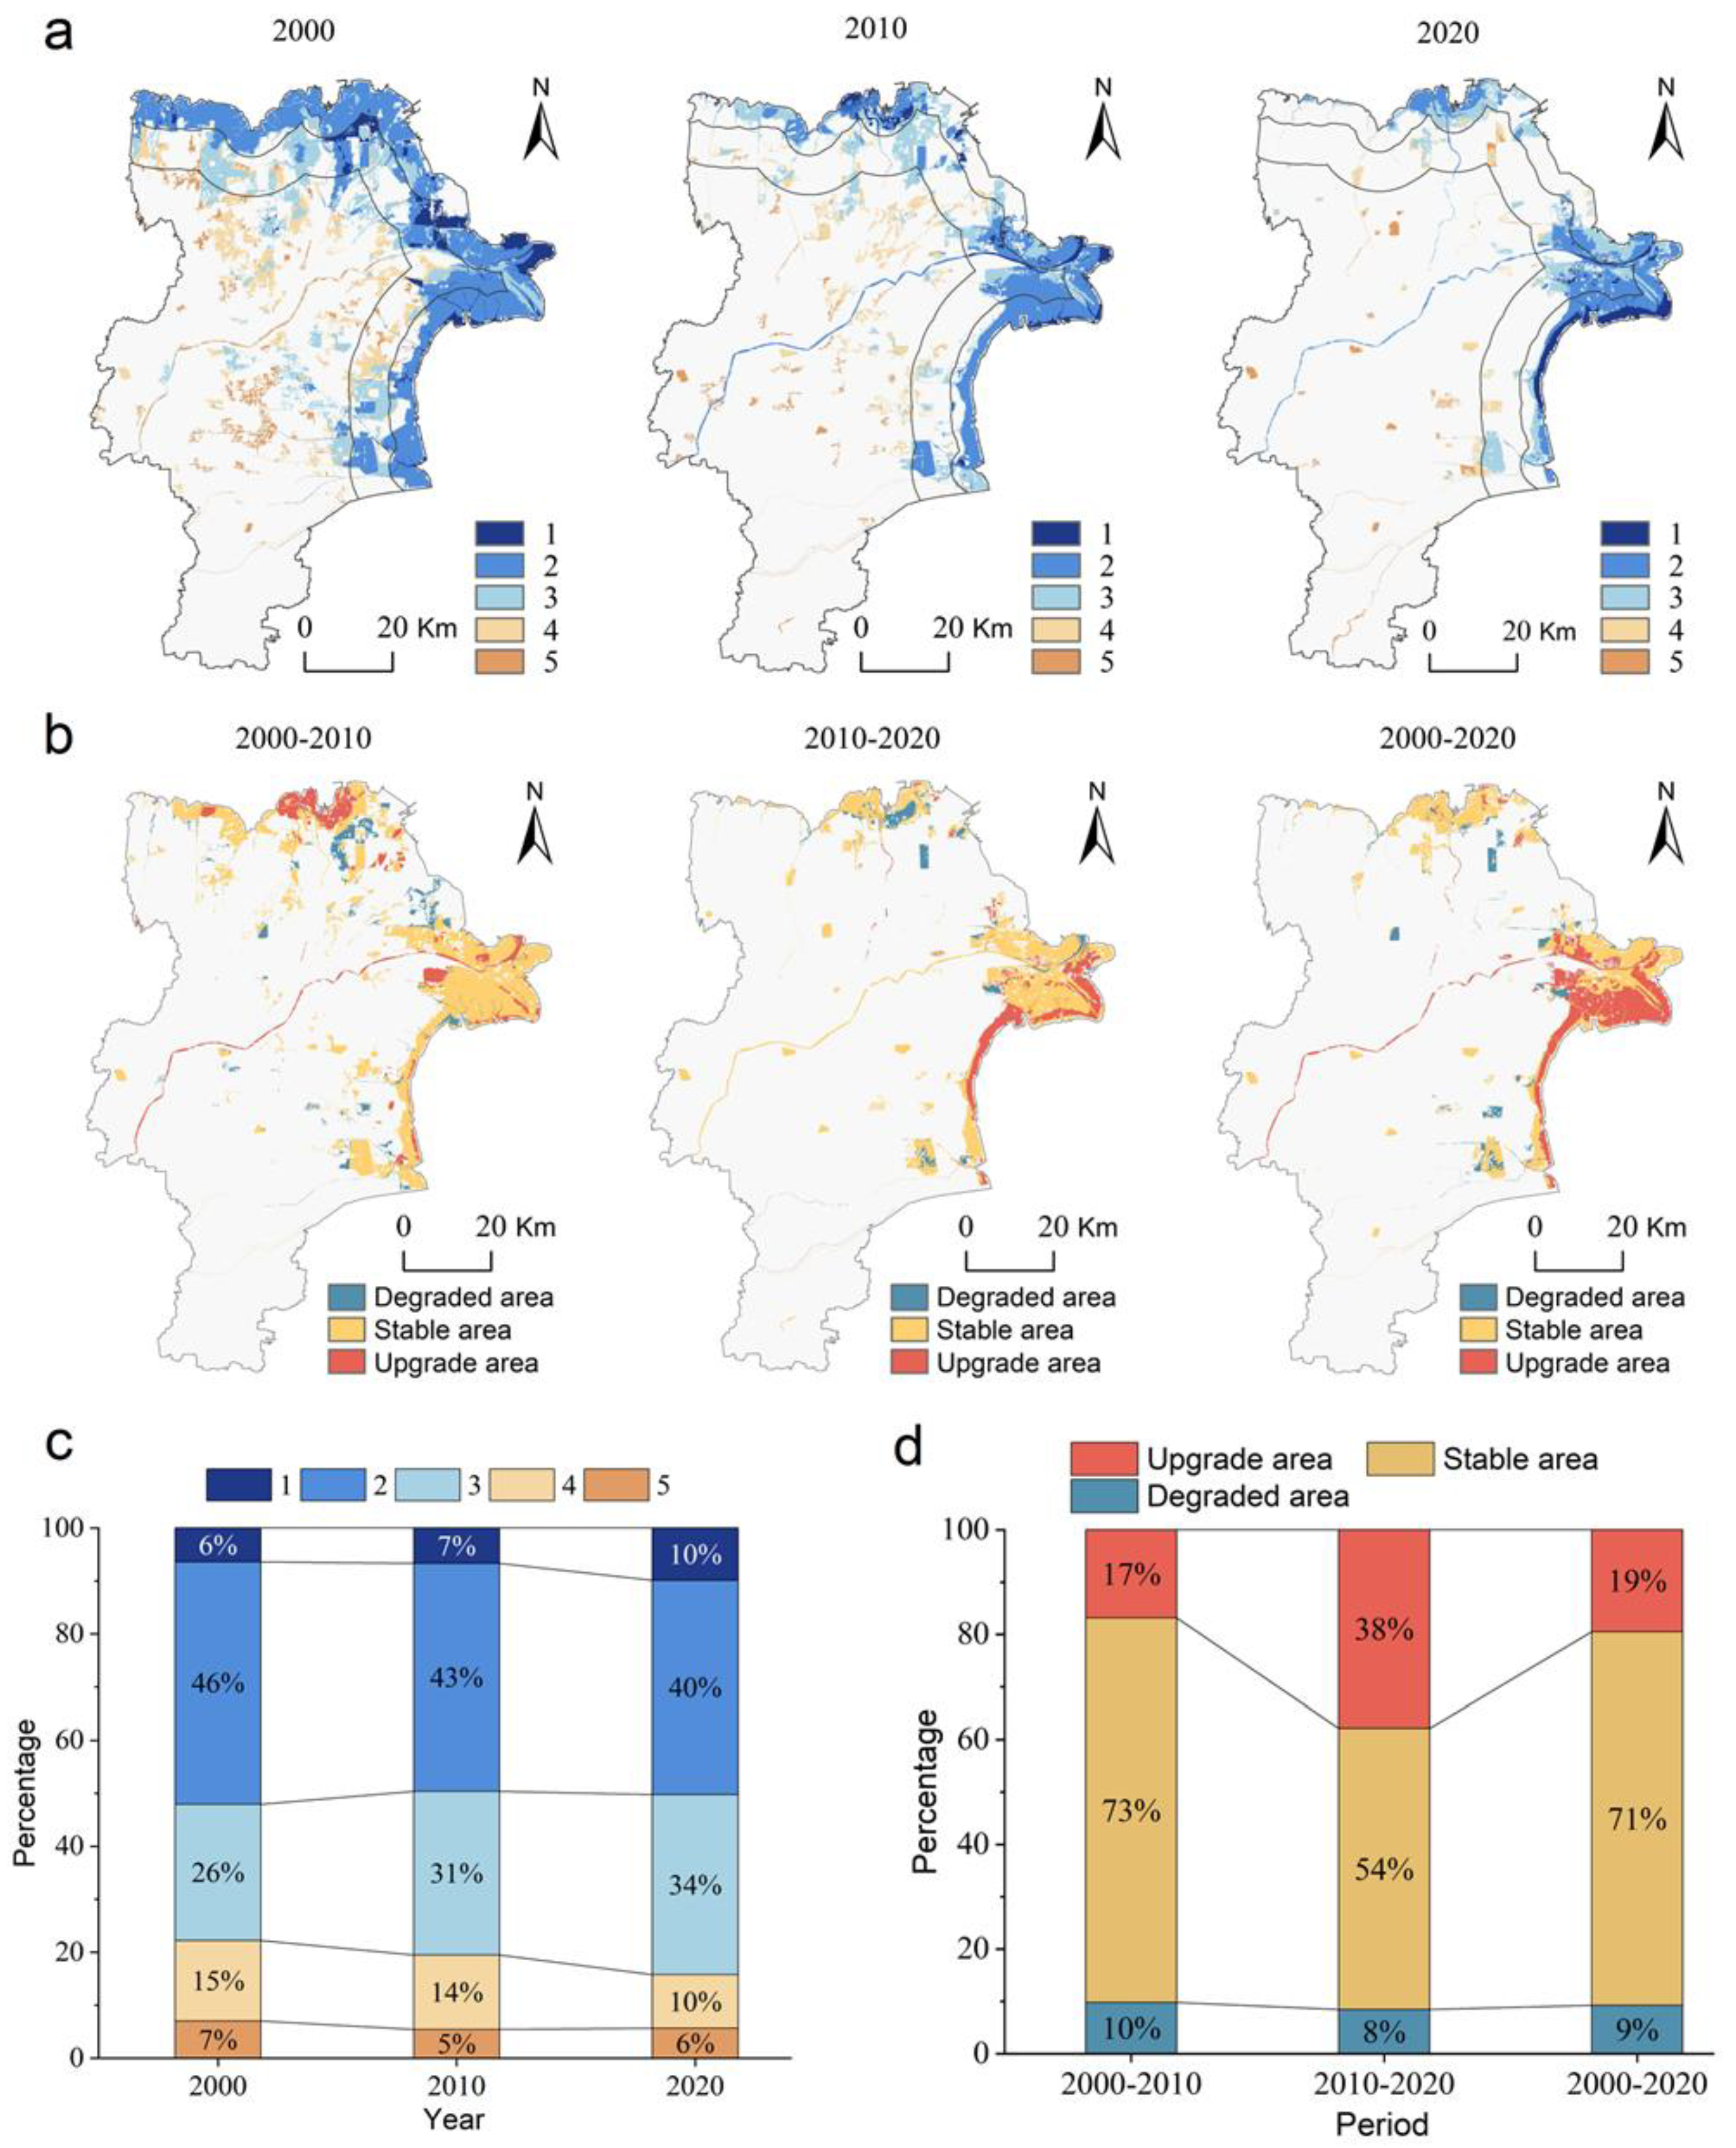
Based on the “State–Interaction–Resilience” framework and gradient-based weights, an integrated ecological importance map of Dongying City was produced (Figure 11a). The spatial pattern clearly shows that areas classified as “extremely important” and “highly important” were strongly concentrated in the Yellow River Delta and adjacent coastal zones. These areas formed a continuous ecological conservation core. The transitional gradient zones were mainly classified as “moderately important” or “relatively important.” They played key corridor functions. The inland gradient zones were dominated by “generally important” zones, where ecological functions were limited.
Figure 11.
Spatiotemporal changes in ecological importance. (a) Spatiotemporal evolution of ecological importance in Dongying City from 2000 to 2020; (b) spatiotemporal trends in ecological importance changes in Dongying City from 2000 to 2020; (c) statistical results of ecological importance grade proportions in Dongying City from 2000 to 2020; (d) statistical results of ecological importance change proportions in Dongying City from 2000 to 2020.
From 2000 to 2020, the structure of ecological importance levels showed favorable changes (Figure 11c). The proportion of extremely important areas increased significantly, from 6.03% to 10.24%. This increase mainly resulted from wetland restoration projects, such as the conversion of aquaculture ponds back to wetlands in the Yellow River estuary. These projects promoted the upgrading of moderately important areas to higher levels. At the same time, the proportion of generally important areas continuously declined. Change detection results (Figure 11d) further confirmed that between 2010 and 2020, the area of “upgraded” ecological importance (38%) was much larger than that in 2000–2010. These upgraded areas were concentrated in coastal wetlands, while scattered “degraded” areas were mainly in ecologically fragile inland zones.
Notably, between 2000 and 2020, the area of ecological space and the supply of ecosystem services in the study area generally declined. However, ecological resilience and the levels of ecological importance increased. This was mainly related to the spatial variation in indicators. Coastal wetlands in the Yellow River Delta enhanced ecological structure integrity and recovery capacity under protection and restoration measures. Connectivity between some coastal wetland patches also improved. Because this study’s ecological importance evaluation considers three dimensions—ecological state, interactions, and resilience—the improvement of ecological quality and structural function in coastal areas played a dominant role in the overall assessment. This led to an increase in the area of high-level ecological importance zones.
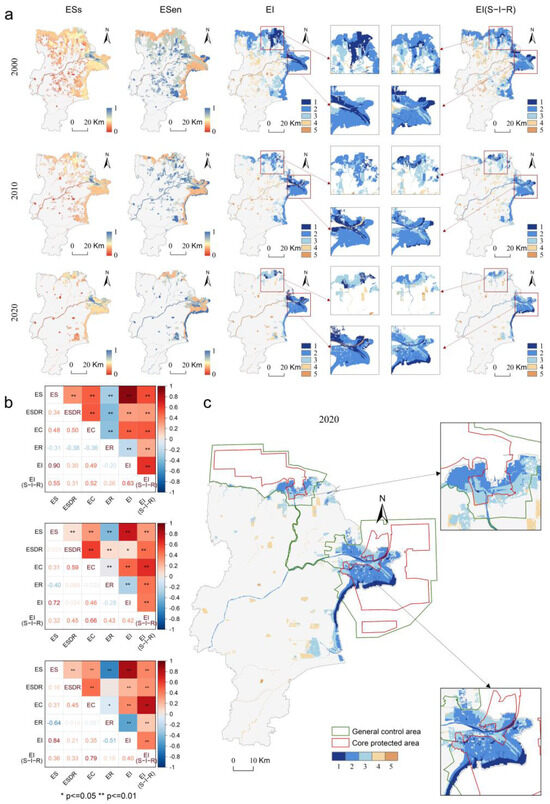
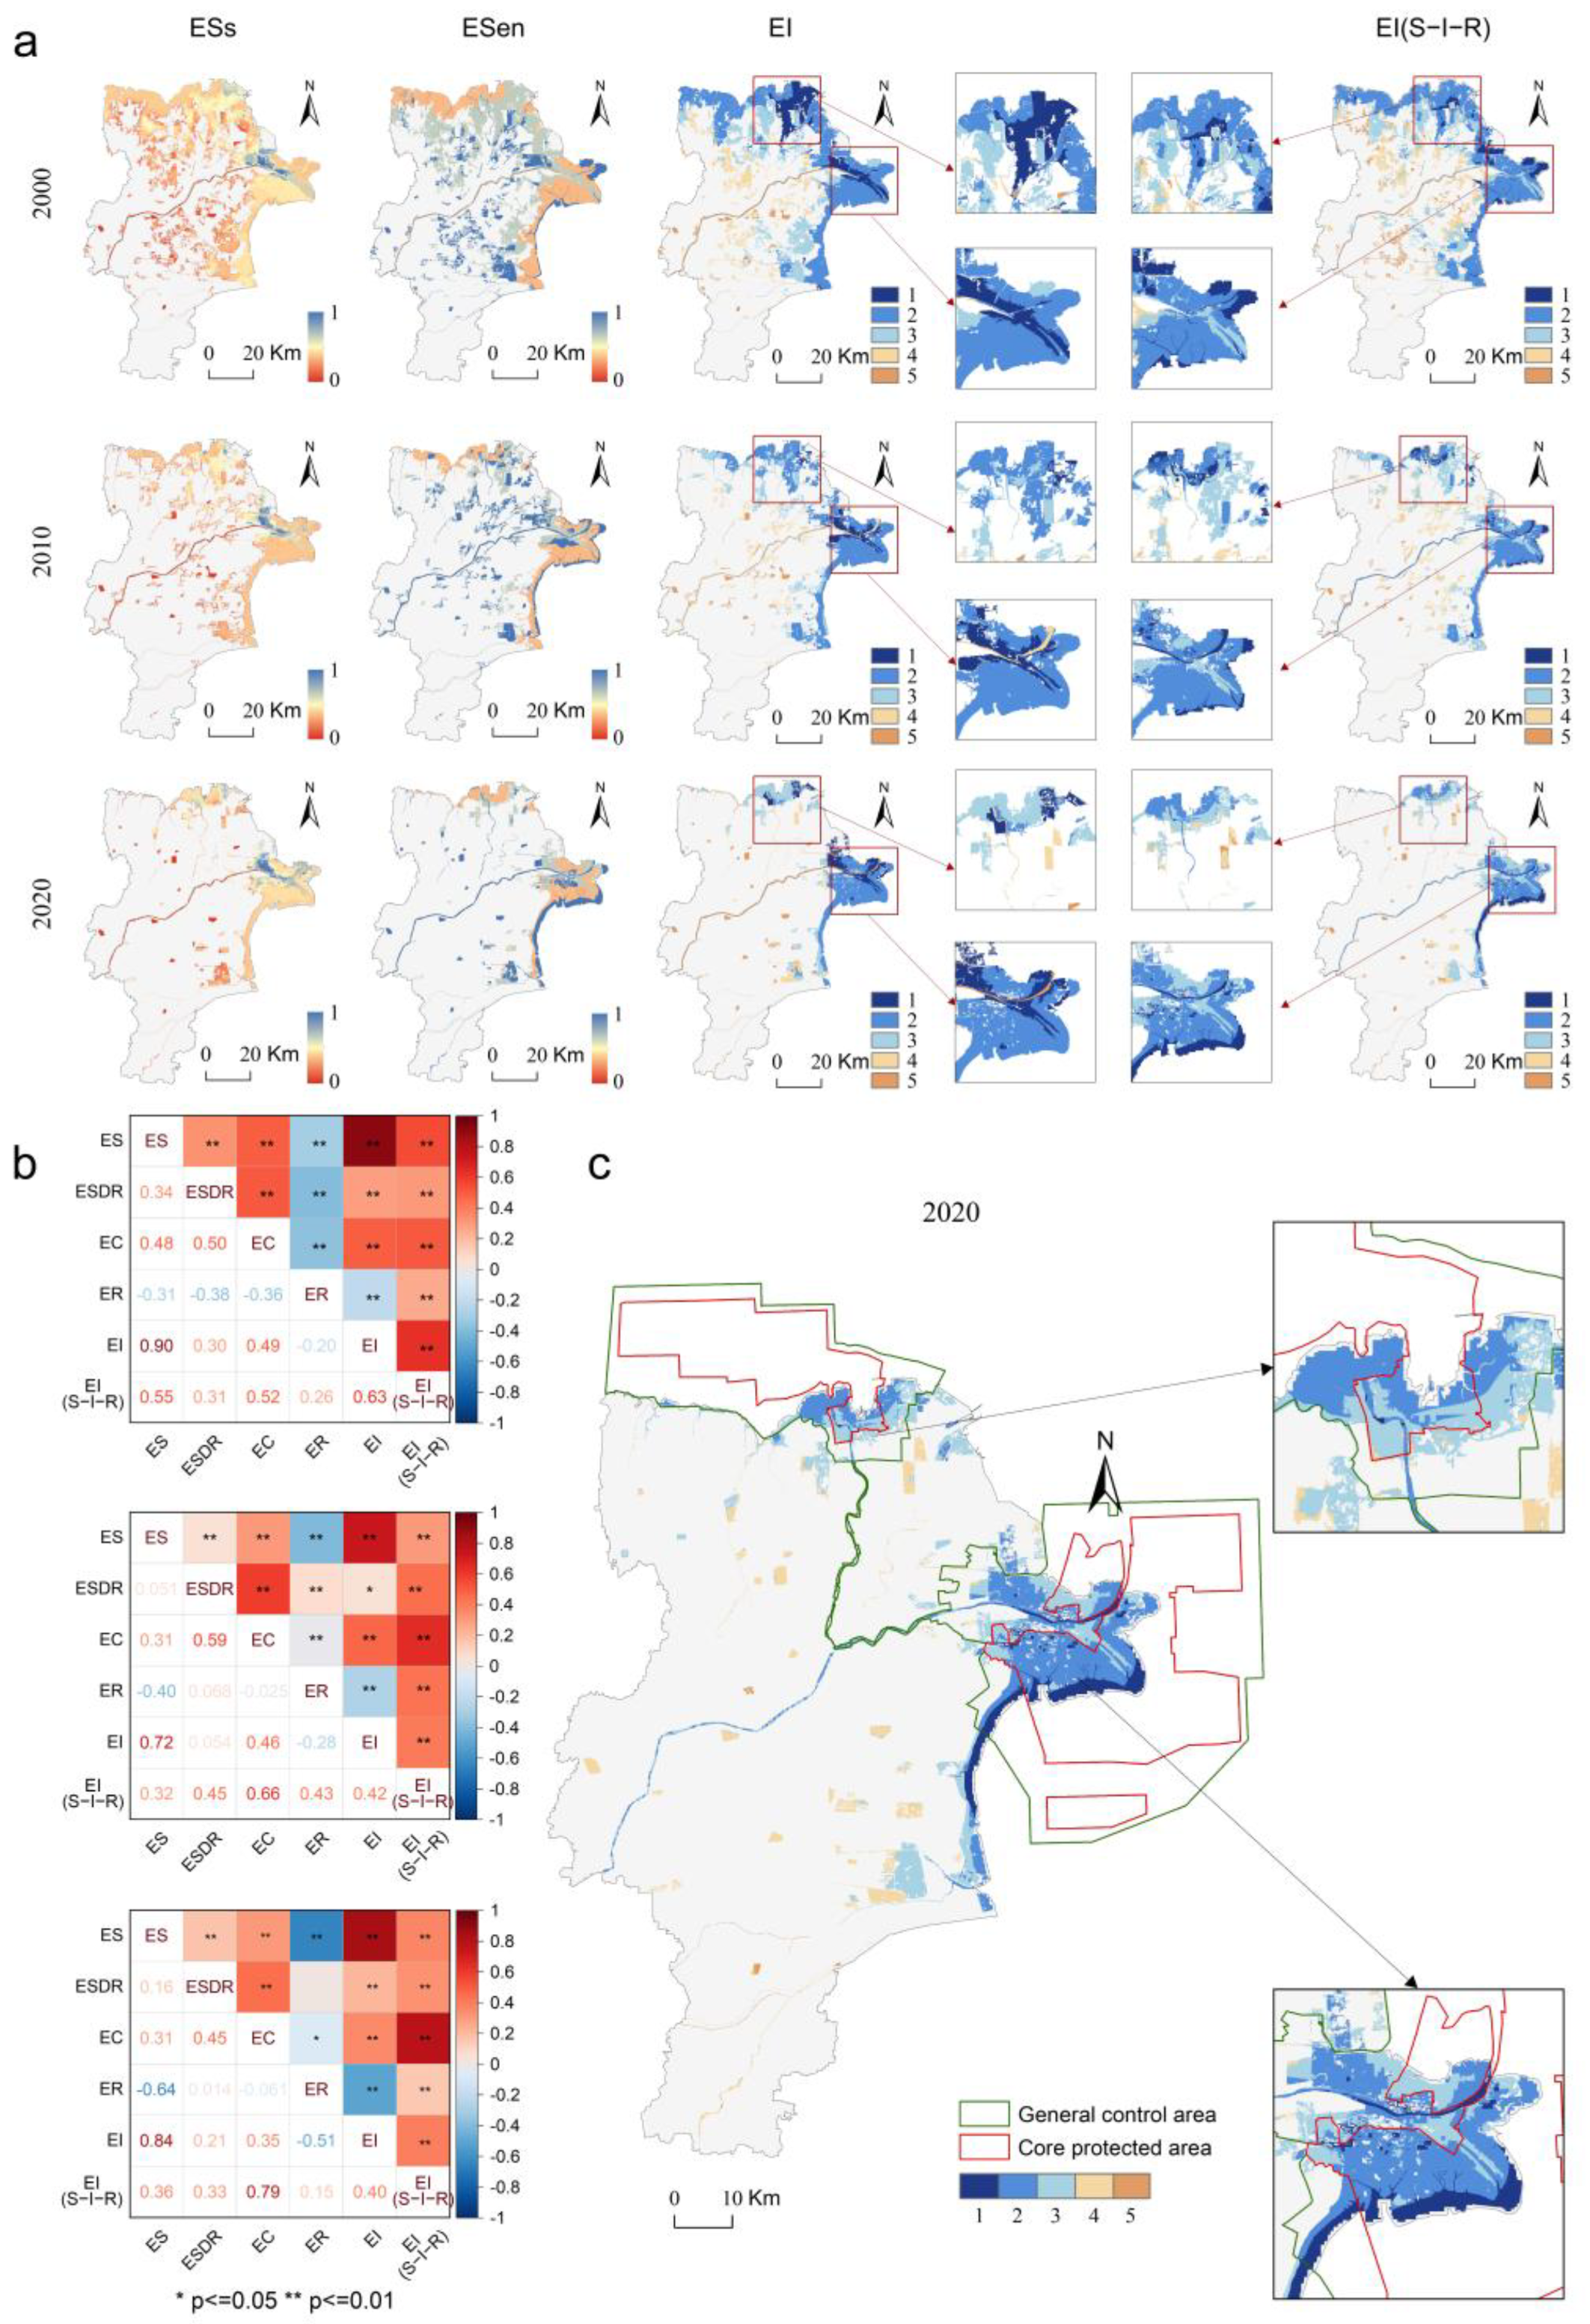
To verify the advantages of the new framework, its results were compared with the traditional “Ecosystem Services–Ecological Sensitivity” framework (Figure 12a). Both methods identified coastal areas as high-importance zones at the macro scale. However, the new framework provided finer spatial differentiation and reclassified the importance of several key areas. For example, some coastal salt marshes and intertidal zones were rated as “relatively important” under the traditional framework. Under the new framework, they were upgraded to “highly important” due to their high connectivity and resilience.
Figure 12.
Comparison analysis. (a) Comparison with the traditional method in Dongying City from 2000 to 2020; (b) correlation analysis between indicators and results from 2000 to 2020; (c) comparative analysis of ecological importance versus nature reserves in Dongying City in 2020.
Correlation analysis provided quantitative evidence (Figure 12b). Results from the traditional framework were highly correlated with ecosystem service indicators alone (r > 0.82). Their correlations with ecological resilience and supply–demand relationship were weak (r < 0.33 and r < 0.19). This result indicates strong dependence on a single dimension. In contrast, results from the new framework showed balanced and significant positive correlations with indicators of state, interaction (connectivity and supply–demand), and resilience. Correlation coefficients ranged from 0.3 to 0.8. This pattern confirms that the new framework effectively integrates multiple dimensions and provides a more comprehensive assessment.
The ecological importance results for 2020 were further compared with the zoning of the Yellow River Delta National Park (Figure 12c). The extremely important and highly important areas showed high consistency with existing protected zones. About 81% of extremely important areas were located within nature reserves, and 55% were within core protection zones. About 86% of highly important areas were within nature reserves, and 50% were within core zones. This spatial overlap demonstrates strong agreement between assessment results and current protection patterns. It also confirms the reliability of the ecological importance evaluation.
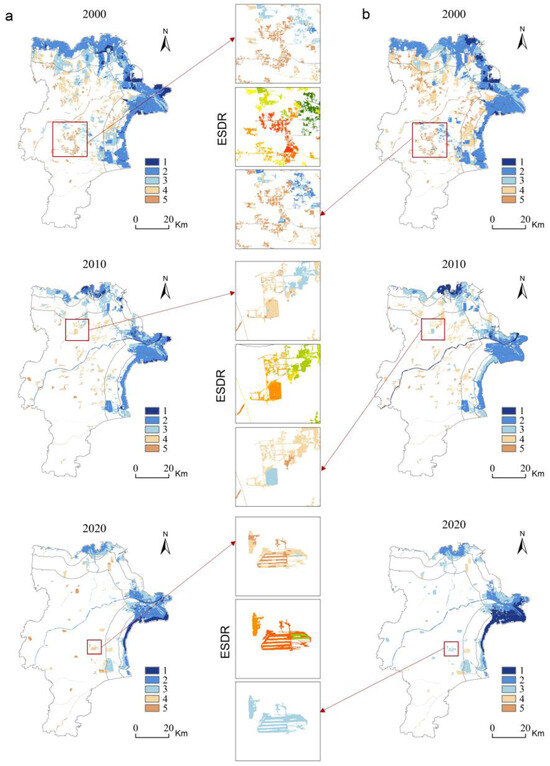
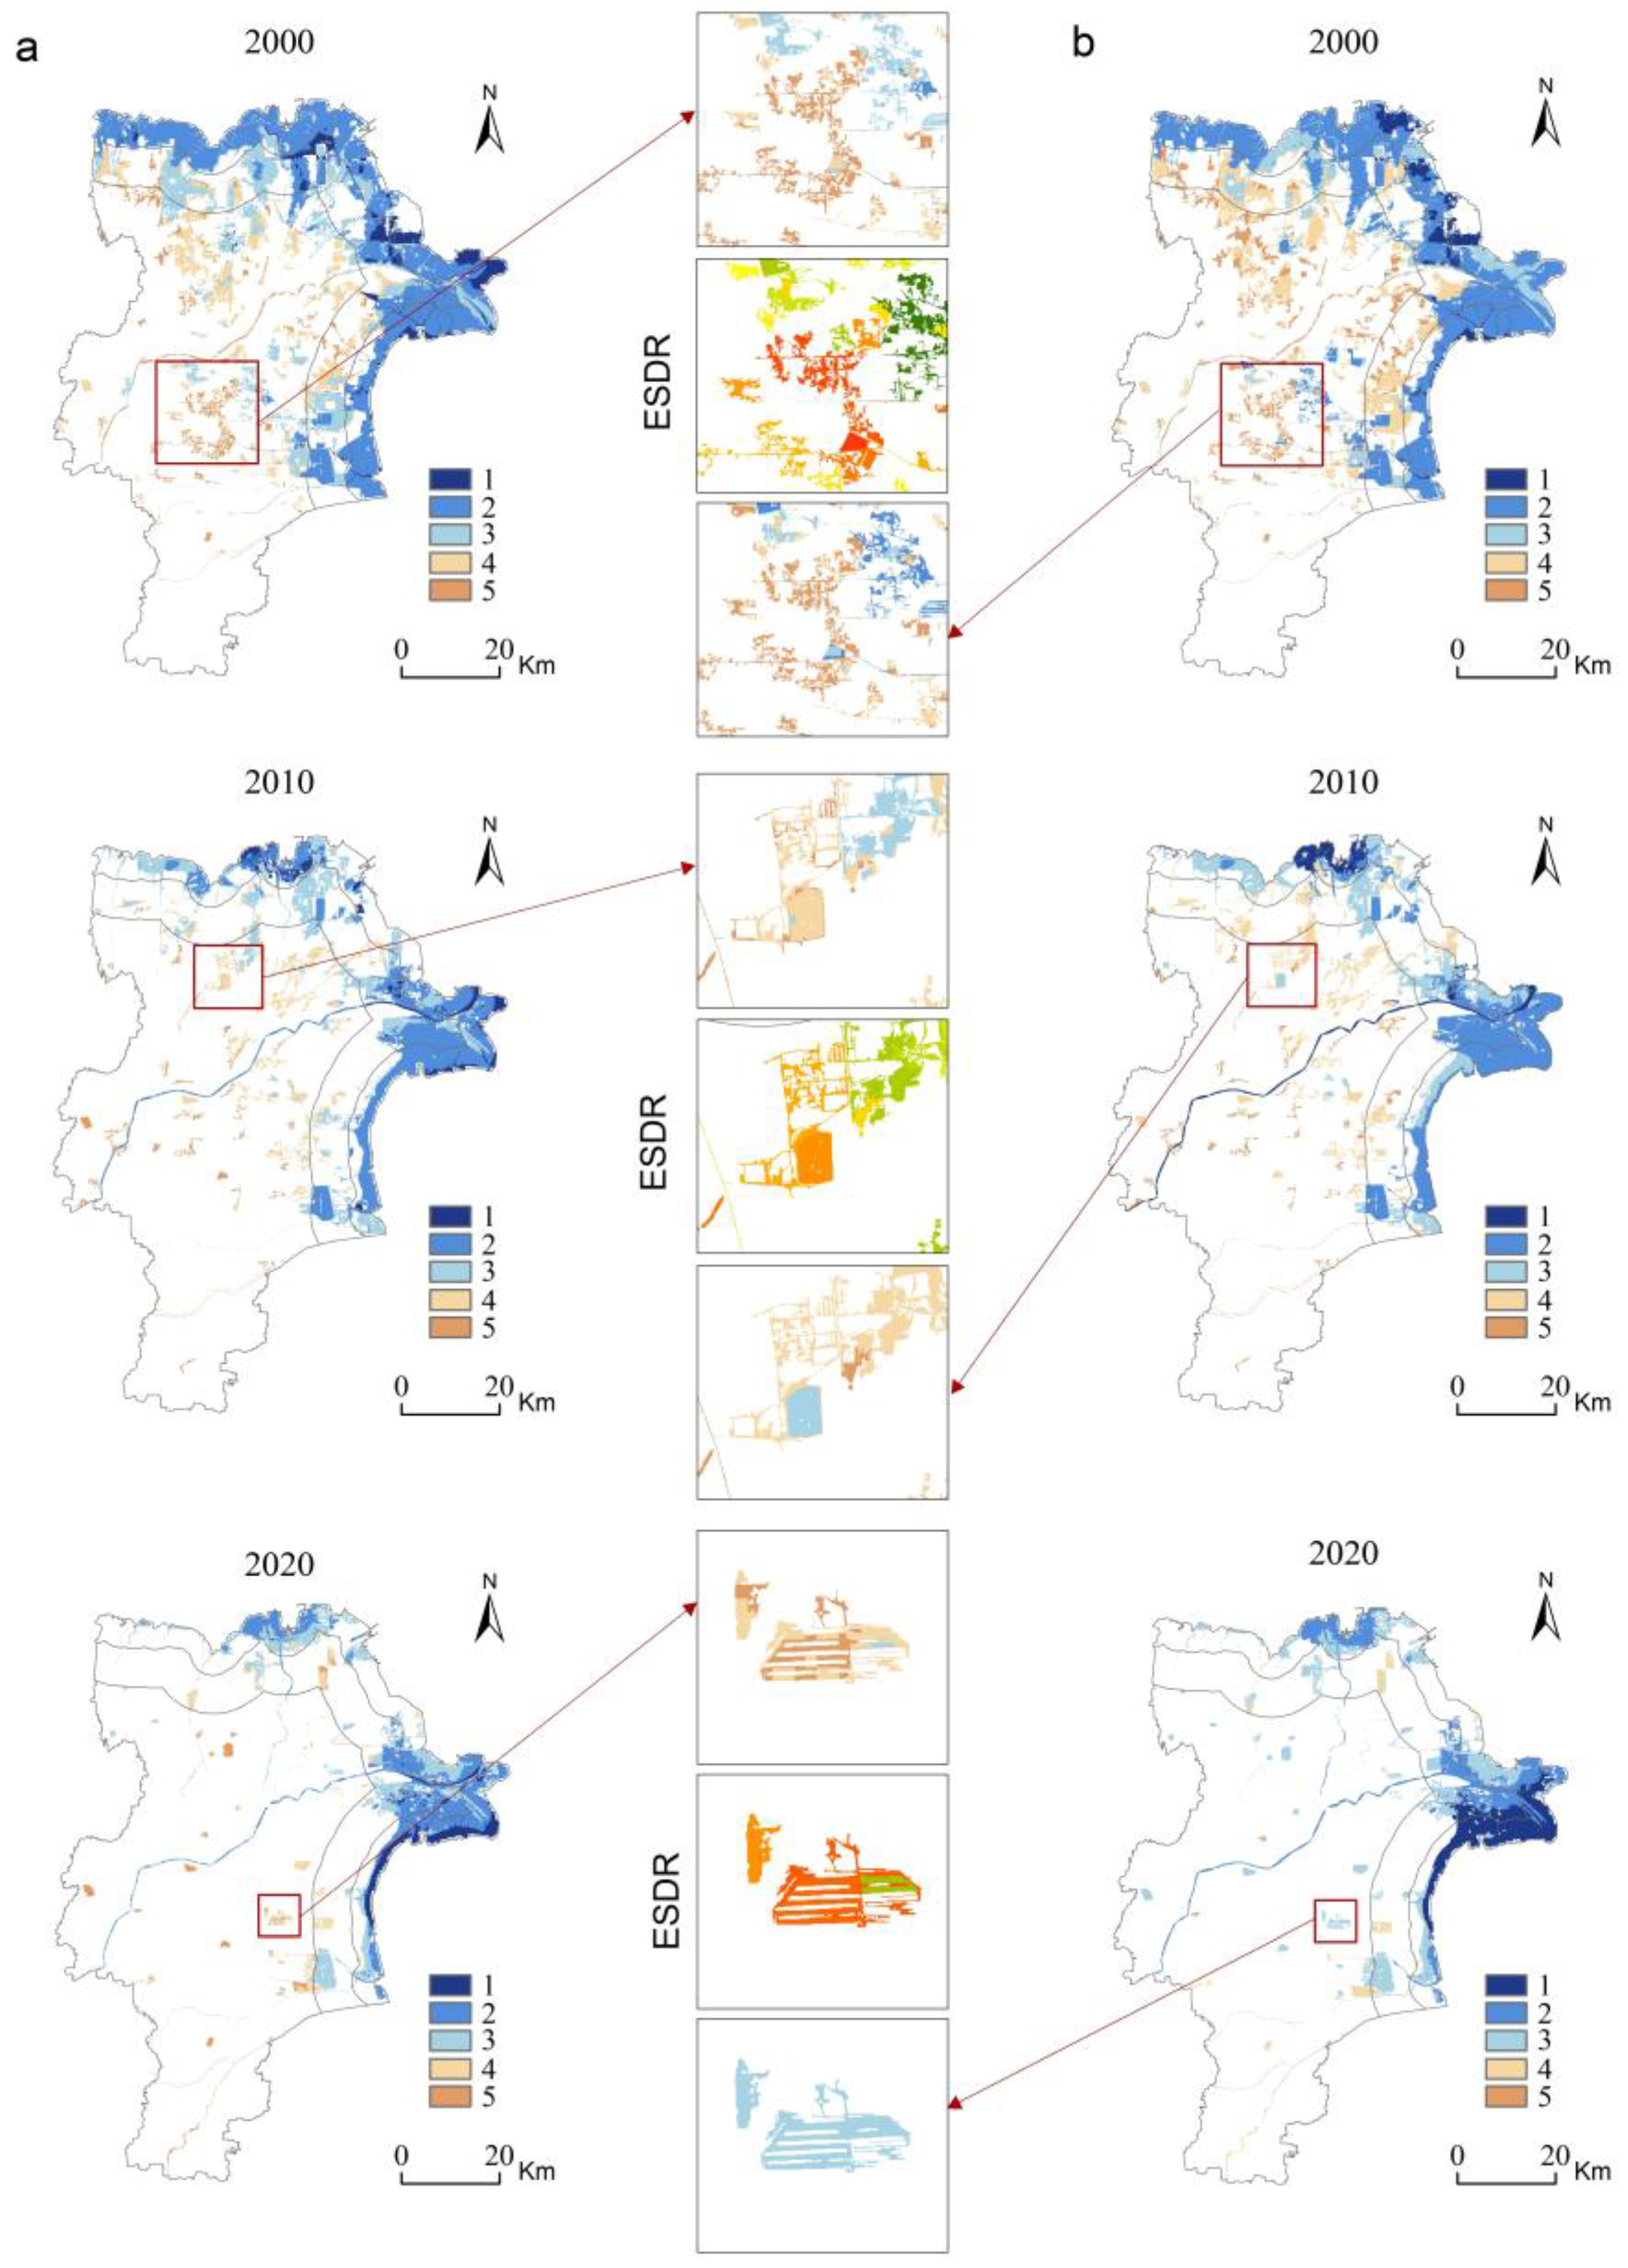
To examine the sensitivity of the ecological importance evaluation to weight settings, a robustness test was conducted. All indicators were assigned equal weights without distinguishing sea–land gradient zones, and the results were compared with those obtained from the gradient-based weighting scheme (Figure 13). The comparison shows a high degree of consistency in the overall spatial pattern, suggesting that the evaluation results are relatively robust to weight settings. However, some local differences remain. In the inland gradient zone, the equal-weight scheme tends to increase the ecological importance level in several areas where ecological supply–demand conflicts are pronounced. By contrast, the gradient-based weighting scheme better captures the spatial differences in ecological functions and ecological pressures across regions.
Figure 13.
Robustness test of ecological importance evaluation under different weighting schemes in Dongying City. (a) Ecological importance based on gradient-specific differentiated weights; (b) ecological importance based on equal weights; enlarged areas compared with the ecological supply-demand relationship, showing that the equal-weight scheme increases the importance level in some inland areas with strong ecological supply-demand conflicts. The color scheme of the inset maps is consistent with that used in the ecological importance results under the two weighting schemes and the ecosystem supply–demand relationship result.
4. Discussion
4.1. Multidimensional Drivers of Ecological Importance Patterns
Ecological importance in Dongying City shows a stable pattern of being high in coastal areas and low in inland areas. From 2000 to 2020, importance in the coastal core zone increased significantly. The proportion of extremely important areas rose from about 6% to 10%. In contrast, inland areas improved slowly. This spatiotemporal differentiation results from the combined effects of multiple dimensions in the State-Interaction-Resilience framework, which vary along the land–sea gradient.
The formation and strengthening of the high-importance coastal core areas reflect the positive coupling of high ecosystem service supply, excellent ecological connectivity, and strong ecological resilience. First, the Yellow River estuary coastal wetlands provide outstanding services, such as carbon storage, habitat provision, and hydrological regulation [45,46]. Second, the area is strictly protected as a nature reserve, with low landscape fragmentation. The low resistance between ecological sources forms an efficient ecological network, ensuring key processes such as material flow and species migration (Interaction dimension—internal natural connectivity) [47,48]. Third, restoration projects, such as converting aquaculture ponds back to wetlands, increased vegetation cover and habitat quality. They also restored ecosystem structure and self-maintenance capacity. As a result, resistance and recovery under disturbance improved significantly. This change represents the resilience dimension [49,50]. The synergy of these three factors allows coastal areas to stand out in the comprehensive evaluation and achieve dynamic improvement.
The low importance and slow improvement in inland areas mainly result from constraints in the interaction and resilience dimensions. Rapid urbanization and agricultural expansion have highly fragmented natural ecological spaces. Landscape fragmentation directly weakens physical and functional connections between ecological patches (Interaction dimension—connectivity loss) [51,52]. At the same time, population growth and economic concentration sharply increased demand for ecosystem services. However, ecological supply space continued to shrink. This mismatch created a clear pattern of high demand and low supply. It reflects human–land supply–demand conflict within the interaction dimension [53,54]. These two negative interaction processes overlapped. They not only reduce the current ecological function benefits but also strongly limit the potential of ecosystems to recover and adapt to disturbances (Resilience dimension impaired) [55,56], creating a situation where ecological importance is difficult to improve.
4.2. Advantages of the Proposed Framework
Traditional ecological importance assessments usually follow two main approaches. The first focuses on static attributes, such as ecosystem service value and ecological sensitivity [19]. The second emphasizes dynamic processes, such as landscape structure and connectivity [57]. The first approach can identify high-value areas but cannot reflect long-term sustainability or network contribution. The second approach reveals spatial structure but often ignores human demand pressure and system stability. The key innovation of this study lies in integrating State (static attributes), Interaction (dynamic processes, including natural connectivity and human–nature supply–demand relationships), and Resilience (long-term maintenance capacity) into a unified analytical framework. This integration bridges gaps between structure and function, nature and humans, and current state and future potential. It provides a more complete perspective for understanding the ecological importance of complex coastal social–ecological systems.
Methodologically, this study achieves a precise alignment between evaluation criteria and geographic spatial heterogeneity through the design of differentiated weights across land–sea gradient zones. This design allows the assessment results to better reflect the dominant ecological conflicts and conservation needs of different locations. It provides direct and operational spatial guidance for zoned and targeted ecological management. Compared with studies that apply uniform criteria or only describe gradients after analysis [13], this approach represents an important methodological advancement.
In addition, this study confirms that the land–sea gradient is the primary spatial factor shaping coastal ecological patterns. This finding is consistent with [58]. However, this study further transforms this understanding from a descriptive background into a structured evaluation parameter. It achieves a transition from theoretical recognition to methodological application. When evaluating the interaction dimension, this study considers not only natural connectivity, as emphasized in ecological network studies [19], but also integrates spatial matching between ecological supply and demand. This approach provides a more comprehensive characterization of the intensity and contradictions of human–nature coupling. It represents an important extension of existing interaction-based ecological evaluation studies.
4.3. Implications for Coastal Spatial Management and Ecological Restoration
The designation and optimization of ecological protection red lines should not rely only on ecological sensitivity or service functions. This study suggests that areas with high ecological importance, high connectivity, and high resilience should form the core structure of ecological protection redlines. These areas correspond to extremely important zones in this study and should receive the strictest protection. For transition areas with relatively high importance but critical connectivity roles or pronounced supply–demand conflicts, their functions as ecological corridors or strategic reserve areas should be clearly defined. This can be achieved within ecological protection red lines or in surrounding ecological control zones, with development strictly limited and space reserved for restoration. The expansion of urban development boundaries should actively avoid these key ecological spaces in order to reduce conflicts at the source.
Restoration planning should be guided by the dominant limiting factors identified in this study. In coastal core areas, restoration should focus on natural recovery and conservation, with strict protection of ecological baselines. In transition gradient zones, restoration should focus on improving landscape connectivity. Measures include building ecological bridges and restoring key stepping stones to reconnect land–sea ecological flows. In inland built-up areas and peri-urban zones, restoration should address ecological supply–demand mismatches. Green infrastructure, such as urban forests, sponge facilities, and eco-friendly farmland, should be developed to enhance local services like climate regulation and stormwater retention, thereby strengthening urban resilience.
Finally, the gradient-based evaluation approach proposed in this study provides a methodological reference for coastal integrated planning. It highlights that planners must recognize and respond to systematic differences along the land–sea gradient. Differentiated land-use control rules and development intensity guidelines should be formulated to achieve precise spatial alignment and functional coordination between conservation and development.
4.4. Limitations and Prospects
Despite the progress made, this study has several limitations that point to future research needs. First, the spatial accuracy of supply-demand assessment in the interaction dimension depends on the scale of population and socioeconomic data [59]. In addition, the measurement of resilience, especially thresholds for adaptability and recovery, still relies heavily on literature and expert judgment. Future studies may integrate multi-source big data, such as mobile phone signaling or social media data, to improve demand-side estimation [60]. They can also combine long-term ecological monitoring data or process-based models to calibrate resilience indicators [61].
Second, in this study, indicator weights were adjusted based on equal-weight benchmarks. We considered the land–sea gradient and expert consultation. This adjustment aimed to reflect differences in ecological processes among zones. However, weight settings may still be influenced by regional characteristics and expert judgment. This introduces some uncertainty. Future research could optimize weights further. Possible approaches include sensitivity analysis or data-driven methods, such as the entropy method or machine learning. These approaches could improve the robustness of ecological importance assessments.
Finally, this framework is validated in Dongying City, which is located on an accretionary coast at the Yellow River estuary. Other coastal types, such as rocky coasts or lagoon–bay systems, have different ecological processes, human pressures, and gradient characteristics [62,63]. Future comparative case studies across diverse coastal cities are needed. These studies can test, adjust, and extend the indicator system and weighting logic. The final goal is to develop a more general and flexible framework for coastal ecological importance assessment.
5. Conclusions
This study addresses the lack of attention to dynamic ecological processes and long-term system stability in coastal ecological importance assessments. It proposed a new three-dimensional framework based on state, interaction, and resilience. The framework integrates ecosystem functional capacity (State), ecological connections and supply–demand relationships (Interaction), and resistance and recovery ability (Resilience). Methodologically, it couples land–sea gradient zoning with differentiated weights. This design aligns evaluation criteria with coastal spatial heterogeneity. An empirical case study in Dongying City shows that: (1) The framework more comprehensively identifies key ecological units that are critical for maintaining the integrity and long-term stability of regional ecological networks. Its results show balanced correlations with indicators across all dimensions, which confirms its scientific validity and integrative capacity. (2) From 2000 to 2020, ecological importance in Dongying City maintained a stable pattern of being high in coastal areas and low in inland areas. Importance in coastal core zones increased significantly. This pattern results from positive synergy among state, interaction, and resilience in coastal areas, driven by strong ecological conditions, protection policies, and restoration projects. In contrast, inland areas were constrained by habitat fragmentation and supply-demand mismatch, which jointly limited interaction and resilience. (3) Based on the assessment results, this study proposed a zoned spatial governance strategy of core protection, corridor restoration, and functional enhancement. This strategy provides direct scientific support and spatial guidance for coastal spatial planning, optimization of ecological protection redlines, and targeted ecological restoration. The key contribution of this study is the development of a new ecological importance assessment paradigm. This paradigm responds to the complexity, dynamics, and spatial heterogeneity of coastal social–ecological systems. It offers a practical theoretical tool and implementation pathway for integrated land–sea management and sustainable coastal spatial governance.
Author Contributions
Conceptualization, Y.S. (Yingjun Sun), Y.S. (Yanshuang Song) and F.W.; methodology, Y.S. (Yingjun Sun), Y.S. (Yanshuang Song) and F.W.; software, Y.S. (Yingjun Sun) and Y.S. (Yanshuang Song); validation, Y.S. (Yingjun Sun), Y.S. (Yanshuang Song), F.W. and F.Y.; formal analysis, Y.S. (Yingjun Sun) and Y.S. (Yanshuang Song); investigation, Y.S. (Yingjun Sun), Y.S. (Yanshuang Song), F.W., F.Y. and Y.W.; resources, Y.S. (Yingjun Sun) and F.W.; data curation, Y.S. (Yanshuang Song); writing—original draft preparation, Y.S. (Yingjun Sun) and Y.S. (Yanshuang Song); writing—review and editing, Y.S. (Yingjun Sun), Y.S. (Yanshuang Song) and F.W.; visualization, Y.S. (Yingjun Sun), Y.S. (Yanshuang Song) and F.Y.; supervision, Y.S. (Yingjun Sun) and F.W.; project administration, Y.S. (Yingjun Sun); funding acquisition, F.W. All authors have read and agreed to the published version of the manuscript.
Funding
This research was funded by the National Natural Science Fund of China (42301320).
Institutional Review Board Statement
Not applicable.
Informed Consent Statement
Not applicable.
Data Availability Statement
The original contributions presented in this study are included in the article. Further inquiries can be directed to the corresponding author.
Acknowledgments
The authors sincerely thank the experts involved in the reviewing, editing, publishing, and dissemination of this work.
Conflicts of Interest
The authors declare no conflicts of interest.
Abbreviations
The following abbreviations are used in this manuscript:
| S-I-R | State-Interaction-Resilience |
| EI | Ecological importance |
| ESs | Ecosystem services |
| EC | Ecological connectivity |
| ESDR | Ecological supply-demand relationship |
| ER | Ecological resilience |
| CGZ | Coastal gradient zone |
| TGZ | Transitional gradient zone |
| IGZ | Inland gradient zone |
Appendix A
Table A1.
Quantification methods and formulas for the supply and demand functions of Ess.
Table A2.
Weight settings for resistance factors.
References
- Ogie, R.I.; Adam, C.; Perez, P. A review of structural approach to flood management in coastal megacities of developing nations: Current research and future directions. J. Environ. Plan. Manag. 2020, 63, 127–147. [Google Scholar] [CrossRef]
- Botero, C.M.; Milanes, C.B.; Robledo, S. 50 years of the Coastal Zone Management Act: The bibliometric influence of the first coastal management law on the world. Mar. Policy 2023, 150, 105548. [Google Scholar] [CrossRef]
- Jing, T.; Wang, H.; Yang, Y.; Jin, Y.; Yu, W.; Zhong, Y. Achieving sustainable development in coastal cities: Exploring the synergies between urban resilience and high-quality development. Sustain. Cities Soc. 2026, 136, 107112. [Google Scholar] [CrossRef]
- Chan, F.K.S.; Chen, W.Y.; Sang, Y.; Chen, Y.D.; Huang, W.; Chen, W.-Q.; Griffiths, J.; Li, J.; Peng, Y.; Cai, X.; et al. Build in prevention and preparedness to improve climate resilience in coastal cities: Lessons from China’s GBA. One Earth 2021, 4, 1356–1360. [Google Scholar] [CrossRef]
- Gong, W.; Duan, X.; Sun, Y.; Zhang, Y.; Ji, P.; Tong, X.; Qiu, Z.; Liu, T. Multi-scenario simulation of land use/cover change and carbon storage assessment in Hainan coastal zone from perspective of free trade port construction. J. Clean. Prod. 2023, 385, 135630. [Google Scholar] [CrossRef]
- Yan, F.; Wang, X.; Huang, C.; Zhang, J.; Su, F.; Zhao, Y.; Lyne, V. Sea Reclamation in Mainland China: Process, Pattern, and Management. Land Use Policy 2023, 127, 106555. [Google Scholar] [CrossRef]
- Liu, N.; Ma, Z. Ecological restoration of coastal wetlands in China: Current status and suggestions. Biol. Conserv. 2024, 291, 110513. [Google Scholar] [CrossRef]
- Zhang, Y.; Li, H.; Hou, X.; Guo, P.; Guo, J. Coastline protection and restoration: A comprehensive review of China’s developmental trajectory. Ocean Coast. Manag. 2024, 251, 107094. [Google Scholar] [CrossRef]
- Fan, J.; Wang, Q.; Ji, M.; Sun, Y.; Feng, Y.; Yang, F.; Zhang, Z. Ecological network construction and gradient zoning optimization strategy in urban-rural fringe: A case study of Licheng District, Jinan City, China. Ecol. Indic. 2023, 150, 110251. [Google Scholar] [CrossRef]
- Ke, L.; Zhao, Y.; Wang, Q.; Yin, S.; Liu, W. Construction of coastal zone ecological network based on the perspective of land-sea integration: A case study of Jinzhou City, China. Ocean Coast. Manag. 2024, 254, 107204. [Google Scholar] [CrossRef]
- Bryhn, A.C.; Dimberg, P.H.; Bergström, L.; Fredriksson, R.E.; Mattila, J.; Bergström, U. External nutrient loading from land, sea and atmosphere to all 656 Swedish coastal water bodies. Mar. Pollut. Bull. 2017, 114, 664–670. [Google Scholar] [CrossRef] [PubMed]
- Chi, Y.; Zhang, Z.; Wang, J.; Xie, Z.; Gao, J. Island protected area zoning based on ecological importance and tenacity. Ecol. Indic. 2020, 112, 106139. [Google Scholar] [CrossRef]
- Zhang, P.; Duan, Q.; Dong, J.; Piao, L.; Cui, Z. Ecological Importance Evaluation and Ecological Function Zoning of Yanshan-Taihang Mountain Area of Hebei Province. Sustainability 2024, 16, 10233. [Google Scholar] [CrossRef]
- Jin, X.; Wei, L.; Wang, Y.; Lu, Y. Construction of ecological security pattern based on the importance of ecosystem service functions and ecological sensitivity assessment: A case study in Fengxian County of Jiangsu Province, China. Environ. Dev. Sustain. 2021, 23, 563–590. [Google Scholar] [CrossRef]
- Gu, T.; Tong, Y.; Wang, S.; You, Z.; Li, D.; Jiang, Y.; Rafaqat, A.; Wang, C.; Zhang, Q. Identifying the priority areas for ecological protection considering ecological connectivity and ecosystem integrity: A case study of Xianyang City, China. Ecol. Indic. 2024, 163, 112102. [Google Scholar] [CrossRef]
- Zhou, G.; Huan, Y.; Wang, L.; Lan, Y.; Liang, T.; Shi, B.; Zhang, Q. Linking ecosystem services and circuit theory to identify priority conservation and restoration areas from an ecological network perspective. Sci. Total Environ. 2023, 873, 162261. [Google Scholar] [CrossRef]
- Zhang, Y.; Yang, R.; Sun, M.; Lu, Y.; Zhang, L.; Yin, Y.; Li, X. Identification of spatial protection and restoration priorities for ecological security pattern in a rapidly urbanized region: A case study in the Chengdu-Chongqing economic Circle, China. J. Environ. Manag. 2024, 366, 121789. [Google Scholar] [CrossRef]
- Tao, H.; Hu, G.; Fan, Y.; Bai, Y.; Liu, P.; Zhou, C. Assessing the value and sensitivity of ecosystem services based on land use in the middle and lower reaches of the Shiyang River. Environ. Res. Commun. 2024, 6, 35014. [Google Scholar] [CrossRef]
- Tang, Y.; Shen, S.; Zhan, W.; Lu, Y.; He, P.; Cheng, H. Ecological Importance Evaluation of the Changzhutan Ecological Green Heart. Wirel. Commun. Mob. Comput. 2022, 2022, 2711719. [Google Scholar] [CrossRef]
- Chen, H.; Yan, W.; Li, Z.; Wende, W.; Xiao, S. A framework for integrating ecosystem service provision and connectivity in ecological spatial networks: A case study of the Shanghai metropolitan area. Sustain. Cities Soc. 2024, 100, 105018. [Google Scholar] [CrossRef]
- Shen, X.; Ke, C.-Q.; Cai, Y.; Li, H.; Xiao, Y. Enhanced Carbon Accumulation in China’s New Coastal Wetlands Over the 21st Century. Earth’s Future 2024, 12, e2024EF004500. [Google Scholar] [CrossRef]
- Sun, Z.; Jia, Y.; Zhou, D.; Huang, X.; Jiang, J.; Zhu, X.; Zhang, J. Constructing an ecological security pattern by integrating ecosystem service values and ecological sensitivity: A case study of the Hexi Region, China. Environ. Sustain. Indic. 2026, 29, 101070. [Google Scholar] [CrossRef]
- Samhouri, J.F.; Shelton, A.O.; Williams, G.D.; Feist, B.E.; Hennessey, S.M.; Bartz, K.; Kelly, R.P.; O’Donnell, J.L.; Sheer, M.; Stier, A.C.; et al. How much city is too much city? Biodiversity and ecosystem functioning along an urban gradient at the interface of land and sea. Front. Mar. Sci. 2022, 9, 931319. [Google Scholar] [CrossRef]
- Specht, M. Methodology for Performing Bathymetric and Photogrammetric Measurements Using UAV and USV Vehicles in the Coastal Zone. Remote Sens. 2024, 16, 3328. [Google Scholar] [CrossRef]
- Pan, R.; Zhang, N.; Li, J.; Xiao, X.; Wu, H.; Dang, X.; Hu, S. Vertical migration characteristics of polychlorinated biphenyls (PCBs) in estuarine and coastal zones under complex environmental conditions. Mar. Pollut. Bull. 2025, 212, 117520. [Google Scholar] [CrossRef]
- Sanromualdo-Collado, A.; Ferrer, N.; Marrero-Rodríguez, N.; Hernández-Cordero, A.I.; García-Romero, L. Indicators of geomorphological connectivity facing management fragmentation in coastal protected areas: The case of Guguy (Canary Islands). Ocean Coast. Manag. 2025, 269, 107839. [Google Scholar] [CrossRef]
- Zhai, T.; Wang, J.; Fang, Y.; Qin, Y.; Huang, L.; Chen, Y. Assessing ecological risks caused by human activities in rapid urbanization coastal areas: Towards an integrated approach to determining key areas of terrestrial-oceanic ecosystems preservation and restoration. Sci. Total Environ. 2020, 708, 135153. [Google Scholar] [CrossRef]
- Resource and Environmental Science Data Platform, IGSNRR, CAS. Resource and Environmental Science Data Platform. 2017. Available online: https://www.resdc.cn/DOI/ (accessed on 15 March 2025). [CrossRef]
- Zheng, S.; Yang, S.; Ma, M.; Dong, J.; Han, B.; Wang, J. Linking cultural ecosystem service and urban ecological-space planning for a sustainable city: Case study of the core areas of Beijing under the context of urban relieving and renewal. Sustain. Cities Soc. 2023, 89, 104292. [Google Scholar] [CrossRef]
- Tulloch, A.I.T.; Barnes, M.D.; Ringma, J.; Fuller, R.A.; Watson, J.E.M. Understanding the importance of small patches of habitat for conservation. J. Appl. Ecol. 2016, 53, 418–429. [Google Scholar] [CrossRef]
- Liu, B.; Zhang, F.; Kumar, P.; Meraj, G.; Johnson, V.C.; Orooji, Y.; Chan, N.W.; Wang, P.; Wei, L.; Ma, X.; et al. Dynamic changes in the sea-land convergence zone: Long-term coastal wetland dynamics, landscape pattern evolution, and human-activity impacts in Zhejiang. Ecol. Indic. 2026, 182, 114583. [Google Scholar] [CrossRef]
- Shi, H.; Lu, J.; Zheng, W.; Sun, J.; Li, J.; Guo, Z.; Huang, J.; Yu, S.; Yin, L.; Wang, Y.; et al. Evaluation system of coastal wetland ecological vulnerability under the synergetic influence of land and sea: A case study in the Yellow River Delta, China. Mar. Pollut. Bull. 2020, 161, 111735. [Google Scholar] [CrossRef] [PubMed]
- Yan, J.; Geng, J.; Su, F. Estimation of the Ecosystem Service Value of the Yellow River Delta-Laizhou Bay Coastal Zone Considering Regional Differences and Social Development. Environ. Manag. 2024, 74, 192–205. [Google Scholar] [CrossRef] [PubMed]
- Bai, Y.; Liu, Q.; Ou, M. Construction and optimization of composite functional urban ecological network: Integrating “ecological-recreational” functions of urban ecological space. J. Environ. Manag. 2025, 395, 127818. [Google Scholar] [CrossRef] [PubMed]
- Zhang, Z.; Wang, Q.; Feng, Y.; Sun, Y.; Liu, N.; Yan, S. The spatio-temporal evolution of spatial structure and supply-demand relationships of the ecological network in the Yellow River Delta region of China. J. Clean. Prod. 2024, 471, 143388. [Google Scholar] [CrossRef]
- Wang, T.; Li, H.; Huang, Y. The complex ecological network’s resilience of the Wuhan metropolitan area. Ecol. Indic. 2021, 130, 108101. [Google Scholar] [CrossRef]
- Zhang, R.; Zhang, Q.; Zhang, L.; Zhong, Q.; Liu, J.; Wang, Z. Identification and extraction of a current urban ecological network in Minhang District of Shanghai based on an optimization method. Ecol. Indic. 2022, 136, 108647. [Google Scholar] [CrossRef]
- Wang, C.; Wang, Q.; Liu, N.; Sun, Y.; Guo, H.; Song, X. The impact of LUCC on the spatial pattern of ecological network during urbanization: A case study of Jinan City. Ecol. Indic. 2023, 155, 111004. [Google Scholar] [CrossRef]
- Zhang, Z.; Wang, Q.; Yan, F.; Sun, Y.; Yan, S. Revealing spatio-temporal differentiations of ecological supply-demand mismatch among cities using ecological Network: A case study of typical cities in the “Upstream-Midstream-Downstream” of the Yellow River Basin. Ecol. Indic. 2024, 166, 112468. [Google Scholar] [CrossRef]
- Baho, D.L.; Allen, C.R.; Garmestani, A.S.; Fried-Petersen, H.B.; Renes, S.E.; Gunderson, L.H.; Angeler, D.G. A quantitative framework for assessing ecological resilience. Ecol. Soc. 2017, 22, 17. [Google Scholar] [CrossRef]
- Xie, G.; Zhang, C.; Zhen, L.; Zhang, L. Dynamic changes in the value of China’s ecosystem services. Ecosyst. Serv. 2017, 26, 146–154. [Google Scholar] [CrossRef]
- Peng, H.; Lou, H.; Liu, Y.; He, Q.; Zhang, M.; Yang, Y. Spatial and Temporal Evolution Assessment of Landscape Ecological Resilience Based on Adaptive Cycling in Changsha–Zhuzhou–Xiangtan Urban Agglomeration, China. Land 2025, 14, 709. [Google Scholar] [CrossRef]
- Tang, J.; Li, Y.; Cui, S.; Xu, L.; Ding, S.; Nie, W. Linking land-use change, landscape patterns, and ecosystem services in a coastal watershed of southeastern China. Glob. Ecol. Conserv. 2020, 23, e01177. [Google Scholar] [CrossRef]
- Wang, H.; Wang, Y.; Ding, X.; Tang, J.; Li, R.; Li, K. Spatio-temporal evolution and driving mechanisms of ecological resilience: The Guanzhong Plain Urban Agglomeration case. Environ. Sustain. Indic. 2026, 30, 101229. [Google Scholar] [CrossRef]
- Chi, Y.; Zheng, W.; Shi, H.; Sun, J.; Fu, Z. Spatial heterogeneity of estuarine wetland ecosystem health influenced by complex natural and anthropogenic factors. Sci. Total Environ. 2018, 634, 1445–1462. [Google Scholar] [CrossRef]
- Yang, J.; Zhan, C.; Li, Y.; Zhou, D.; Yu, Y.; Yu, J. Effect of salinity on soil respiration in relation to dissolved organic carbon and microbial characteristics of a wetland in the Liaohe River estuary, Northeast China. Sci. Total Environ. 2018, 642, 946–953. [Google Scholar] [CrossRef]
- Yang, W.; Kedron, P.; Frazier, A.E. Percentage of area protected can substitute for more complicated structural metrics when monitoring protected area connectivity. Ecol. Indic. 2024, 158, 111387. [Google Scholar] [CrossRef]
- Mu, H.; Guo, S.; Li, X.; Zhou, Y.; Lü, Y.; Du, X.; Huang, J.; Ma, C.; Zhang, X.; Xia, Z.; et al. Quantifying landscape connectivity gaps between protected area and natural habitat. J. Clean. Prod. 2024, 437, 140729. [Google Scholar] [CrossRef]
- Jacob, L.M.; Irvine, K.N.; Beza, B.B.; Chua, L.H. Adaptive resilience in wetlands: An integrative review of principles, research gaps, and ways forward for better adaptive management. Ecol. Eng. 2025, 220, 107720. [Google Scholar] [CrossRef]
- Qin, H.; Ye, Y. Resilient Strategies for Disaster Prevention and Ecological Restoration of River and Lake Benggang and Bank Erosion. Water 2025, 17, 2744. [Google Scholar] [CrossRef]
- Hou, W.; Zhang, J.; Peng, Z.; Walz, U. Assessing habitat fragmentation in highly urbanized area: Implications for mitigating landscape dissection and habitat restoration. Int. J. Appl. Earth Obs. Geoinf. 2025, 139, 104557. [Google Scholar] [CrossRef]
- Li, H.; Wu, M.; Huang, X.; Zhuang, Y.; Chen, H.; Zhan, F.; Liu, Z. Identification of green patches prioritized for urban expansion as a supplementary approach to mitigating landscape connectivity loss. J. Environ. Manage. 2025, 392, 126913. [Google Scholar] [CrossRef] [PubMed]
- Jia, Q.; Jiao, L.; Lian, X.; Wang, W. Linking supply-demand balance of ecosystem services to identify ecological security patterns in urban agglomerations. Sustain. Cities Soc. 2023, 92, 104497. [Google Scholar] [CrossRef]
- Zhou, X.; Zhang, X.; Peng, H.; Ren, W.; Zou, Q. Bridging the ecosystem service supply-demand imbalance: Spatial flow patterns and driving forces in the Yangtze River midstream urban agglomeration, China. Ecol. Indic. 2025, 175, 113531. [Google Scholar] [CrossRef]
- Ren, X.; Li, Y.; Zhang, Y.; Yang, L.; Wu, X.; Luo, G.; Huang, J. From vulnerability to sustainability: The evolution of rural social-ecological system in karst mountainous areas of Southwest China. J. Clean. Prod. 2025, 516, 145712. [Google Scholar] [CrossRef]
- Wang, C.; Meng, J.; Zhu, L. Assessing urban drought vulnerability in northwest China using a social-ecological-technological framework. Sustain. Cities Soc. 2025, 134, 106925. [Google Scholar] [CrossRef]
- Liu, Z.; Gan, X.; Dai, W.; Huang, Y. Construction of an Ecological Security Pattern and the Evaluation of Corridor Priority Based on ESV and the “Importance–Connectivity” Index: A Case Study of Sichuan Province, China. Sustainability 2022, 14, 3985. [Google Scholar] [CrossRef]
- Han, Y.; Zhu, J.; Wei, D.; Wang, F. Spatial–temporal effect of sea–land gradient on landscape pattern and ecological risk in the coastal zone: A case study of Dalian City. Open Geosci. 2024, 16, 20220722. [Google Scholar] [CrossRef]
- Sun, X.; Liu, H.; Liao, C.; Nong, H.; Yang, P. Understanding recreational ecosystem service supply-demand mismatch and social groups’ preferences: Implications for urban–rural planning. Landsc. Urban Plan. 2024, 241, 104903. [Google Scholar] [CrossRef]
- Li, T.; Xiang, Z.; Li, Y. POIs-based public preferences mapping on imbalanced supply-demand of recreation services can support sustainable coastal beach management. Front. Mar. Sci. 2024, 11, 1288112. [Google Scholar] [CrossRef]
- Bathiany, S.; Bastiaansen, R.; Bastos, A.; Blaschke, L.; Lever, J.; Loriani, S.; de Keersmaecker, W.; Dorigo, W.; Milenković, M.; Senf, C.; et al. Ecosystem Resilience Monitoring and Early Warning Using Earth Observation Data: Challenges and Outlook. Surv. Geophys. 2025, 46, 265–301. [Google Scholar] [CrossRef]
- Yin, Y.; Shao, Y.; Lu, H.; Han, Y. Environmental drivers of the vital urban coastal zones: An explorative case study based on the data-driven multi-method approach. Front. Ecol. Evol. 2022, 10, 962299. [Google Scholar] [CrossRef]
- Zheng, Z.; Wu, Z.; Chen, Y.; Yang, Z.; Marinello, F. Exploration of eco-environment and urbanization changes in coastal zones: A case study in China over the past 20 years. Ecol. Indic. 2020, 119, 106847. [Google Scholar] [CrossRef]

Disclaimer/Publisher’s Note: The statements, opinions and data contained in all publications are solely those of the individual author(s) and contributor(s) and not of MDPI and/or the editor(s). MDPI and/or the editor(s) disclaim responsibility for any injury to people or property resulting from any ideas, methods, instructions or products referred to in the content. |
© 2026 by the authors. Licensee MDPI, Basel, Switzerland. This article is an open access article distributed under the terms and conditions of the Creative Commons Attribution (CC BY) license.