


Abstract
Increasingly frequent extreme rainfall commonly leads to water accumulation on the road surface, elevating vehicle tire hydroplaning to a major threat to driving safety. Existing research mainly focused on tire model optimization or predicting critical hydroplaning speed features based on empirical formulas and numerical simulations. However, there is a lack of systematic validation of the tire–water–pavement coupling interaction under realistic pavement conditions, with particular insufficient attention paid to pavement dynamic responses. In this study, numerical simulation and field full-scale accelerated loading methods were applied to investigate dynamic response characteristics of the tire–water–pavement coupling interaction system. Parametric analyses were first performed to investigate the influences of vehicle speed, vehicle load, water-film thickness, and tire lateral position on the mechanical behaviors of the fluid–structure interaction for a moving vehicle tire. Subsequently, field-measured dynamic responses’ features were used to validate the numerical model, which was then further applied to predict critical conditions of vehicle tire hydroplaning. Finally, the mechanisms of hydroplaning and corresponding mitigation measures were discussed. The study revealed that increasing vehicle speed and water-film thickness, as well as decreasing vehicle load, would reduce the pavement supporting force. The tire–pavement contact stress and strain decreased from the vehicle tire’s center position towards its shoulders. The predicted critical hydroplaning condition suggested that increasing vehicle load mitigated hydroplaning by reducing the proportion of water-induced hydrodynamic lifting force relative to the total vehicle load. When the water depth is relatively shallow, the hydroplaning risk increases rapidly with water depth, while the water’s adverse impact on tire–pavement contact force gradually diminishes as water depth continues to increase. It implies that a vehicle with a relatively low axle load driving on the pavement with a thin thickness of retained water in light rain will still face the hydroplaning risk, as the pavement’s supporting force may be substantially reduced in this weather. The findings provide theoretical foundations and experimentally supported insights on driving safety assessment and anti-skid design of water-covered pavement.
1. Introduction
Against the backdrop of intensifying global warming, increasingly frequent extreme rainfall occurs and, thus, makes water accumulation on urban and highway pavements increasingly common. When a vehicle drives fast on water-covered pavement, it is prone to inducing vehicle tire hydroplaning and causing a severe traffic accident. Vehicle tire hydroplaning is primarily caused by the water-induced hydrodynamic lifting force generated by the retained water film between the vehicle tire and pavement. The water-induced hydrodynamic lifting force reduces the contact area of tire–pavement interaction and diminishes its friction force. Vehicle tire hydroplaning is not only critical for highway driving safety but also holds significant engineering implications for high-speed transportation facilities such as airport runways. Therefore, systematically exploring mechanisms of vehicle tire hydroplaning and accurately evaluating its influential factors represent pressing challenges in the fields of road engineering and traffic safety.
Existing research studies concerning hydroplaning primarily focused on two aspects. On one hand, theoretical analysis and empirical formulas were usually employed to predict the critical hydroplaning speed of vehicle tires. On the other hand, finite element modeling and computational fluid dynamics modeling methods were commonly utilized to simulate the mechanical features between the moving vehicle tire and water-covered pavement. Critical occurrence conditions of vehicle tire hydroplaning were often discussed, and influential factors such as tire inflation pressure, tire dimension, and water depth also received considerable attention. Feng et al. [1] developed a numerical model of a patterned tire moving on a water-covered pavement. They analyzed tire–pavement contact forces at speeds of 40 km/h, 80 km/h, and 100 km/h under varying water depths, and the critical speeds for hydroplaning were also predicted. Zhu et al. [2] constructed a tire–water–pavement coupling numerical model based on pavement texture features obtained from surface scanning of the asphalt mixture. They evaluated the influence of pavement texture on the friction coefficient between aircraft tires and airport runways. Sun et al. [3] and Zhou et al. [4] explored the effects of tire tread patterns on fluid–structure interaction features. Ding et al. [5] analyzed the influence of vehicle load on critical hydroplaning speed. To develop tire–water–pavement coupling models with more detail, Seta et al. [6] incorporated complex tread patterns into their tire models. Koishi et al. [7] simulated tire-water interactions during the vehicle moving process indirectly using a water flow impact method.
Several research studies attempted to use experiments to validate the effectiveness of tire-water-pavement coupling numerical simulations. Hermange et al. [8] and Browne [9] embedded transparent glass plates into the top layer of a water-covered pavement and installed a high-speed camera beneath to record instantaneous characteristics of tire–water–pavement coupling interactions. Maleska et al. [10] established a 200 m straight trial road, and a smart tire was applied to monitor key indicators such as tire slip rate and contact forces during tire–water–pavement coupling interactions. Jung et al. [11] validated the effectiveness of numerically predicted critical hydroplaning speeds by driving a specially designed trailer over the water-covered pavement. Considering the difficulty of conducting field hydroplaning-related tests, some research studies combined empirical formulas with numerical simulations for relevant analysis. Horne et al. [12] developed a model for predicting the critical tire hydroplaning speeds. On the basis of summarizing previous research achievements, Dunlap et al. [13] conducted extensive hydroplaning experiments and compared them with theoretical models, establishing a critical speed prediction model that incorporated factors such as tread texture and water depth.
Based on the analysis above, existing research studies generally exhibit three aspects that need to be paid more attention. Firstly, research studies concerning numerical simulation often relied on empirical models or idealized pavement assumptions, which often lacked essential validation by real field pavement experiments. Secondly, major concerns lied on critical speed and mechanical characteristics of the vehicle tire itself, but insufficient attention had been paid to the dynamic responses of the water-covered pavement structure. Thirdly, due to the complexity and high cost of field experiments involving tire-water–pavement coupling interactions, there is a comparative lack of experimental data to validate and calibrate related numerical simulation models and predictive mathematical formulas. In fact, the variation in pavement supporting force on a vehicle tire is a direct indicator to characterize the hydroplaning phenomenon, and this variation can be reflected using features of pavement dynamic responses [14]. Therefore, it is meaningful and effective to explore the mechanism of vehicle tire hydroplaning from the perspective of pavement dynamic responses using the full-scale accelerated loading test facility. It contributes to a systematic understanding of tire-water-pavement coupling interaction process [10].
Focused on vehicle tire hydroplaning, this study applied numerical simulation and full-scale field accelerated loading methods to investigate dynamic response characteristics of the tire–water–pavement coupling interaction system. Parametric analyses were first performed to investigate the influences of vehicle speed, vehicle load, water–film thickness, and tire lateral position on the mechanical behaviors of the fluid–structure interaction for a moving vehicle tire. Subsequently, field-measured dynamic responses of tire–water–pavement coupling interaction were used to validate the numerical model, which was then further applied to predict critical conditions of vehicle tire hydroplaning. Finally, mechanisms of hydroplaning and corresponding mitigation measures were discussed.
2. Numerical Simulation
This study employed the coupled Eulerian–Lagrangian model to investigate hydraulic-mechanical characteristics of tire–water–pavement coupling interactions. Specifically, both the vehicle tire and pavement were modeled using the Lagrangian mesh, where the grid moved with the solid material. Water was modeled using the Eulerian mesh, where the grid remained fixed in space and did not follow the fluid motion.
2.1. Vehicle Tire Model
The vehicle tire model was constructed based on the 12.00R20 tire for numerical analysis, which was also employed in the full-scale accelerated loading device in this study. The tire’s cross-sectional dimensions were determined according to actual measurements (12 inches tire width, 20 inches rim diameter, 0.24 m tire tread width, 0.56 m tire radius, 0.015 m depth and width of tread grooves) and relevant standards. The tire was further subdivided into different zones based on the rubber and reinforcement structure [15]. The tire mesh was discretized using CGAX4R or CGAX3R element, i.e., reduced-integration axisymmetric quadrilateral or triangular element with hourglass control. The rubber element also employed a reduced-integration axisymmetric quadrilateral or triangular element with enhanced hourglass control. The tire’s material parameters were adopted from relevant values obtained through uniaxial tensile tests in the cited reference [16]. The rubber was characterized using the Mooney–Rivlin constitutive model, with parameters C10 = 621,000, C01 = 205,000, and D1 = 5.085 × 10⁻⁸.
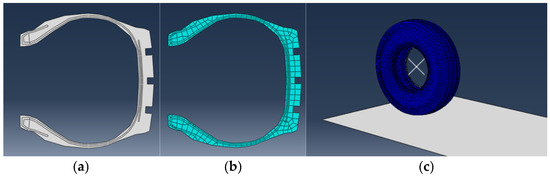
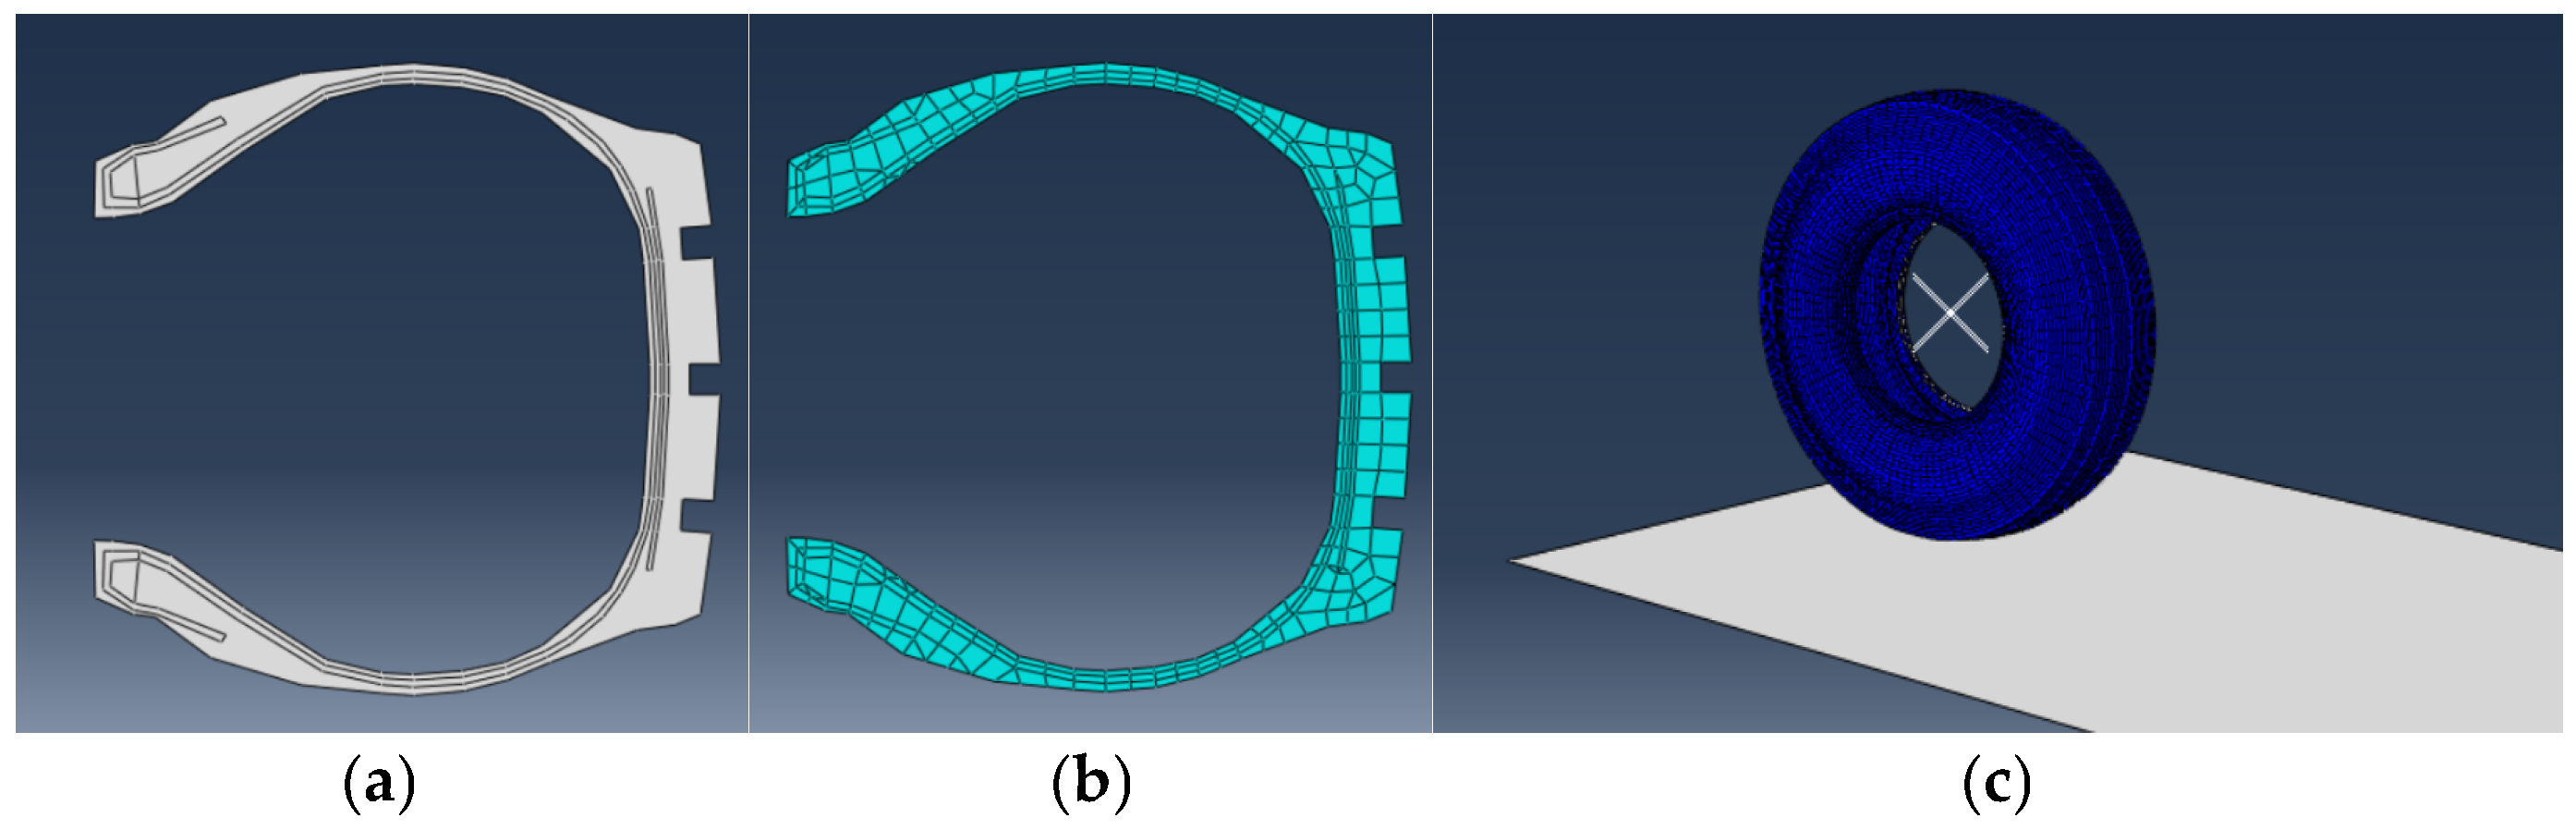
Different materials’ features were assigned to each region on the partitioned tire cross-section, and the mesh was generated subsequently, as shown in Figure 1a,b. Boundary conditions were applied to the tire by constraining displacements at the rim region. A standard inflation pressure of 760 kPa was applied to the inner surface of the 12.00R20 tire [17]. Thus, a two-dimensional inflated tire numerical model was obtained, which was further rotated 360 degrees to form a complete three-dimensional tire model. Subsequently, a pavement component was added, and the tire-pavement contact was established. An initial standard vertical load of 30 kN was applied to the tire to obtain a balanced tire-pavement contact model, as shown in Figure 1c.
Figure 1.
Vehicle tire model: (a) Regional division in 2D model; (b) Mesh generation; (c) Tire-pavement contact model at equilibrium.
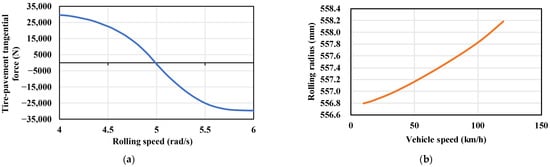
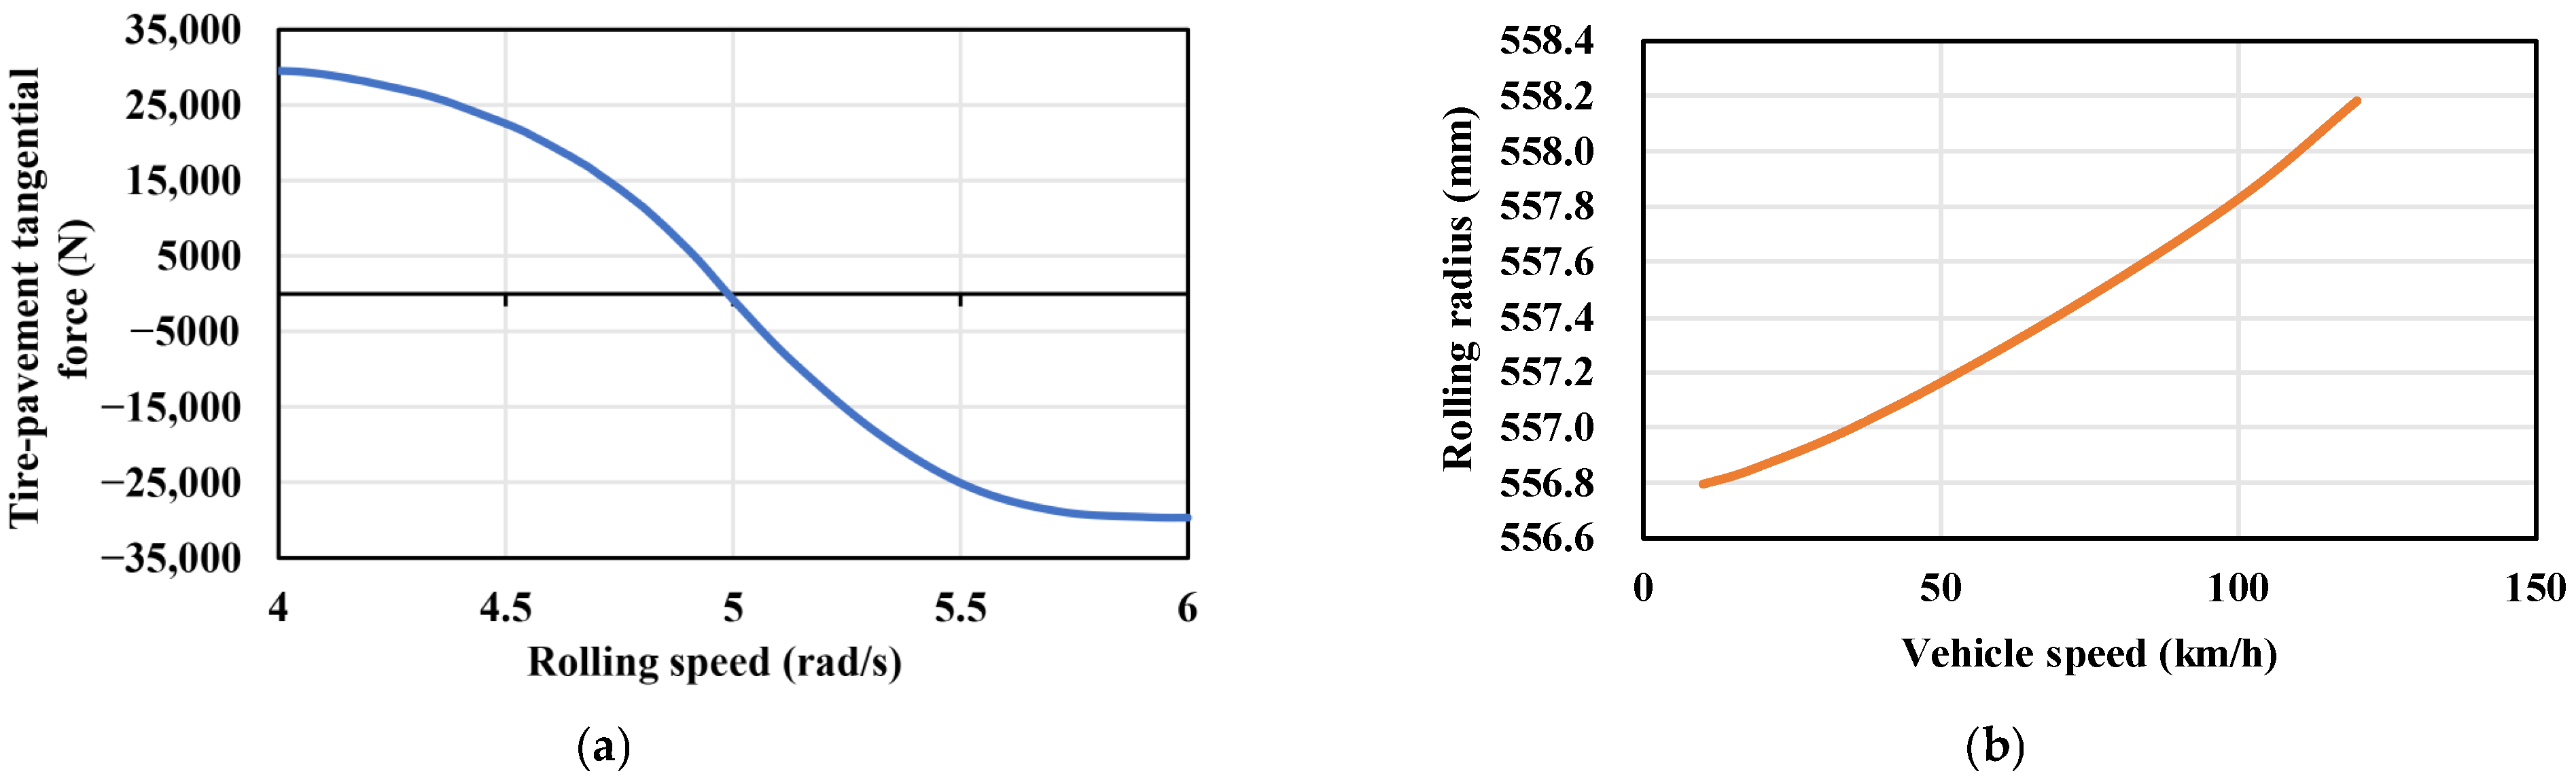
The tire was set to undergo steady-state rolling, and its rolling speed was determined. A hard contact condition was defined in the vertical direction between the pavement and the tire’s outer surface, while separation after contact was allowed. The friction coefficient was assigned as 0.7 in the tangential direction. When the tire moved forward at a specified speed, e.g., 10 km/h, the variations in tire-pavement tangential force with tire rolling speed could be obtained, as shown in Figure 2a. The tire–pavement tangential force decreased continuously with increasing rotational speed. Notably, when the tangential force reached zero, it indicated free rolling of the tire without friction with the pavement. Thus, both free-rolling speed and rolling radius of the tire at various vehicle speeds could be calculated. By adjusting both vehicle speed and rolling speed, the free-rolling angular velocity at each vehicle speed could be determined, which was further applied to calculate corresponding rolling radii, as shown in Figure 2b. The curve showed that the tire’s free-rolling radius increased as the vehicle speed increased. It implied that the tire would gradually lift off as vehicle speed increased, while tire-pavement contact area reduced and both pavement supporting force and tangential friction would decrease accordingly. Consequently, the vehicle tire became more prone to slipping on the water-covered pavement as the vehicle speed gradually increased.
Figure 2.
Variations in vehicle tire movement features: (a) Tire–pavement tangential force (10 km/h vehicle speed); (b) Tire rolling radius.
2.2. Water Model
The water accumulated on the pavement surface was treated as an incompressible fluid material in the coupled Eulerian–Lagrangian model and was modeled using the Eulerian mesh. The Mie–Grüneisen state equation was adopted to characterize water [18], as shown in Equation (1). Γo was a material constant; ρo was the standard water’s density; η was a correction factor; Em was the specific internal energy; co represented the sound speed in fluid; and s was a constant in the uS-uP equation. The density ρ, sound velocity in water co, and dynamic viscosity coefficient at 20 °C were 1000 kg/m3, 1480 m/s, and 0.00101 N·s/m2, respectively. The equation constant, s, and material constant, Γo, were 0. The dynamic viscosity property was also taken into account for water to simulate the flow, splashing, and uplift processes of water during the tire impacts.
2.3. Tire–Water–Road Coupling Model
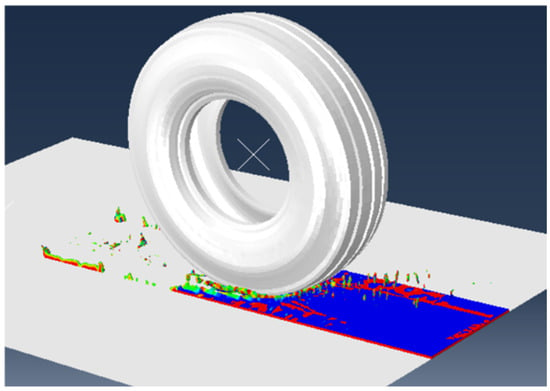
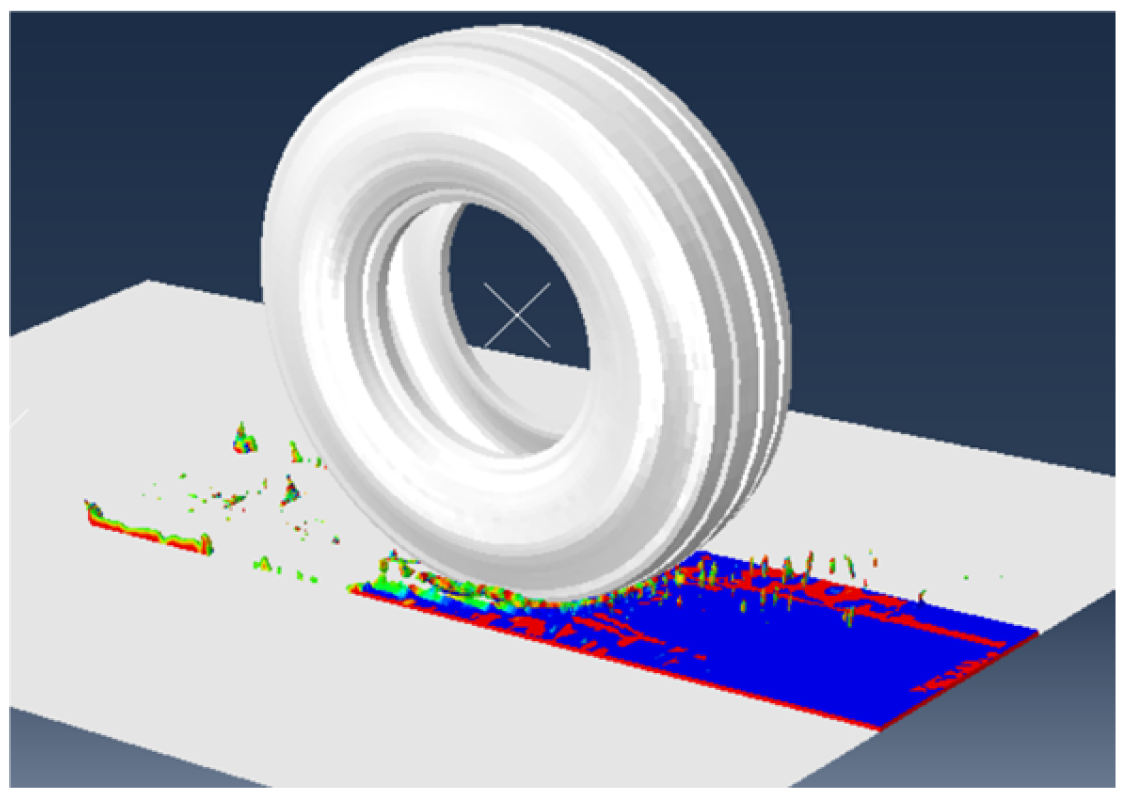
The tire–pavement model was established within the implicit analysis framework. After completing the mechanical analysis of the tire model, the results were further transferred into the explicit analysis to implement the explicit formulation for the Eulerian component in the coupled Eulerian–Lagrangian model adopted in this study. In the explicit analysis, both pavement, parts’ surfaces, and constraints should be redefined, while the Eulerian mesh for water, as well as its material parameters and boundary conditions, were simultaneously introduced. In constructing the water model, not only the water itself but also the air above it were considered. Since water was represented using the Eulerian mesh, within which the water material moved, the Eulerian domain was designed to cover all potential regions of water movement as comprehensively as possible. Water was modeled using the EC3D8R element (eight-node reduced-integration element). A single rectangular Eulerian domain was established and subdivided into a number of smaller units. The node order of the element was batch-processed via MATLAB R2024a. An Eulerian mesh section with dimensions of 2.5 m in length, 0.5 m in width, and 0.1 m in height was generated, which included both the water domain and the air domain. The pavement was modeled as a rigid body using the R3D4 element (three-dimensional tetrahedral element). A pavement section with 3 m in length and 2 m in width was constructed beneath a vehicle tire, while the pavement surface was assumed to be smooth and rigid. In this study, a rolling tire model was employed as the constrained boundary condition for establishing the tire–water–pavement coupling model, as shown in Figure 3.
Figure 3.
The tire–water–pavement coupling model.
2.4. Numerical Simulating Protocol
Different boundary conditions were applied to the established fluid–structure interaction model of the tire–water–pavement system, and simulations under various conditions were submitted for analysis in ABAQUS software (version 6.14-1) (https://www.3ds.com/products/simulia/abaqus, accessed on 29 March 2026). The parameter combination of 30 kN vehicle tire load, 760 kPa tire pressure, 10 mm water depth, and 10 km/h vehicle speed was referred to as the controlled standard condition. Controlled variable simulations were conducted by individually varying each parameter. The effects of vehicle tire load (22.5, 25, and 27.5 kN), water depth (5, 15, and 20 mm), and vehicle speed (20, 40, 70, 100, and 120 km/h) on hydraulic-mechanical characteristics of tire-water-pavement coupling interactions were individually analyzed. Specifically, two conditions of 10 and 70 km/h vehicle speed were, respectively, analyzed when the effects of variable parameters of vehicle tire load and water depth were discussed.
3. Full-Scale Accelerated Loading Test
This study applied field tests using the full-scale accelerated loading method to systematically characterize the dynamic responses of tire–water–pavement coupling interaction. Parameters of vehicle speed, vehicle load, water film thickness, and tire lateral position were taken into account to analyze their influences on the mechanical behaviors of water-covered pavement.
3.1. Preparation for Field Accelerated Loading Test
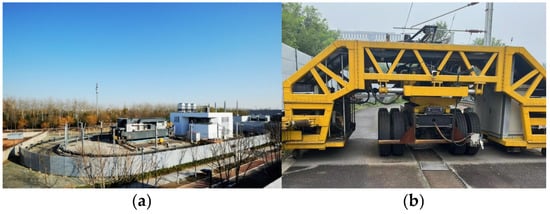
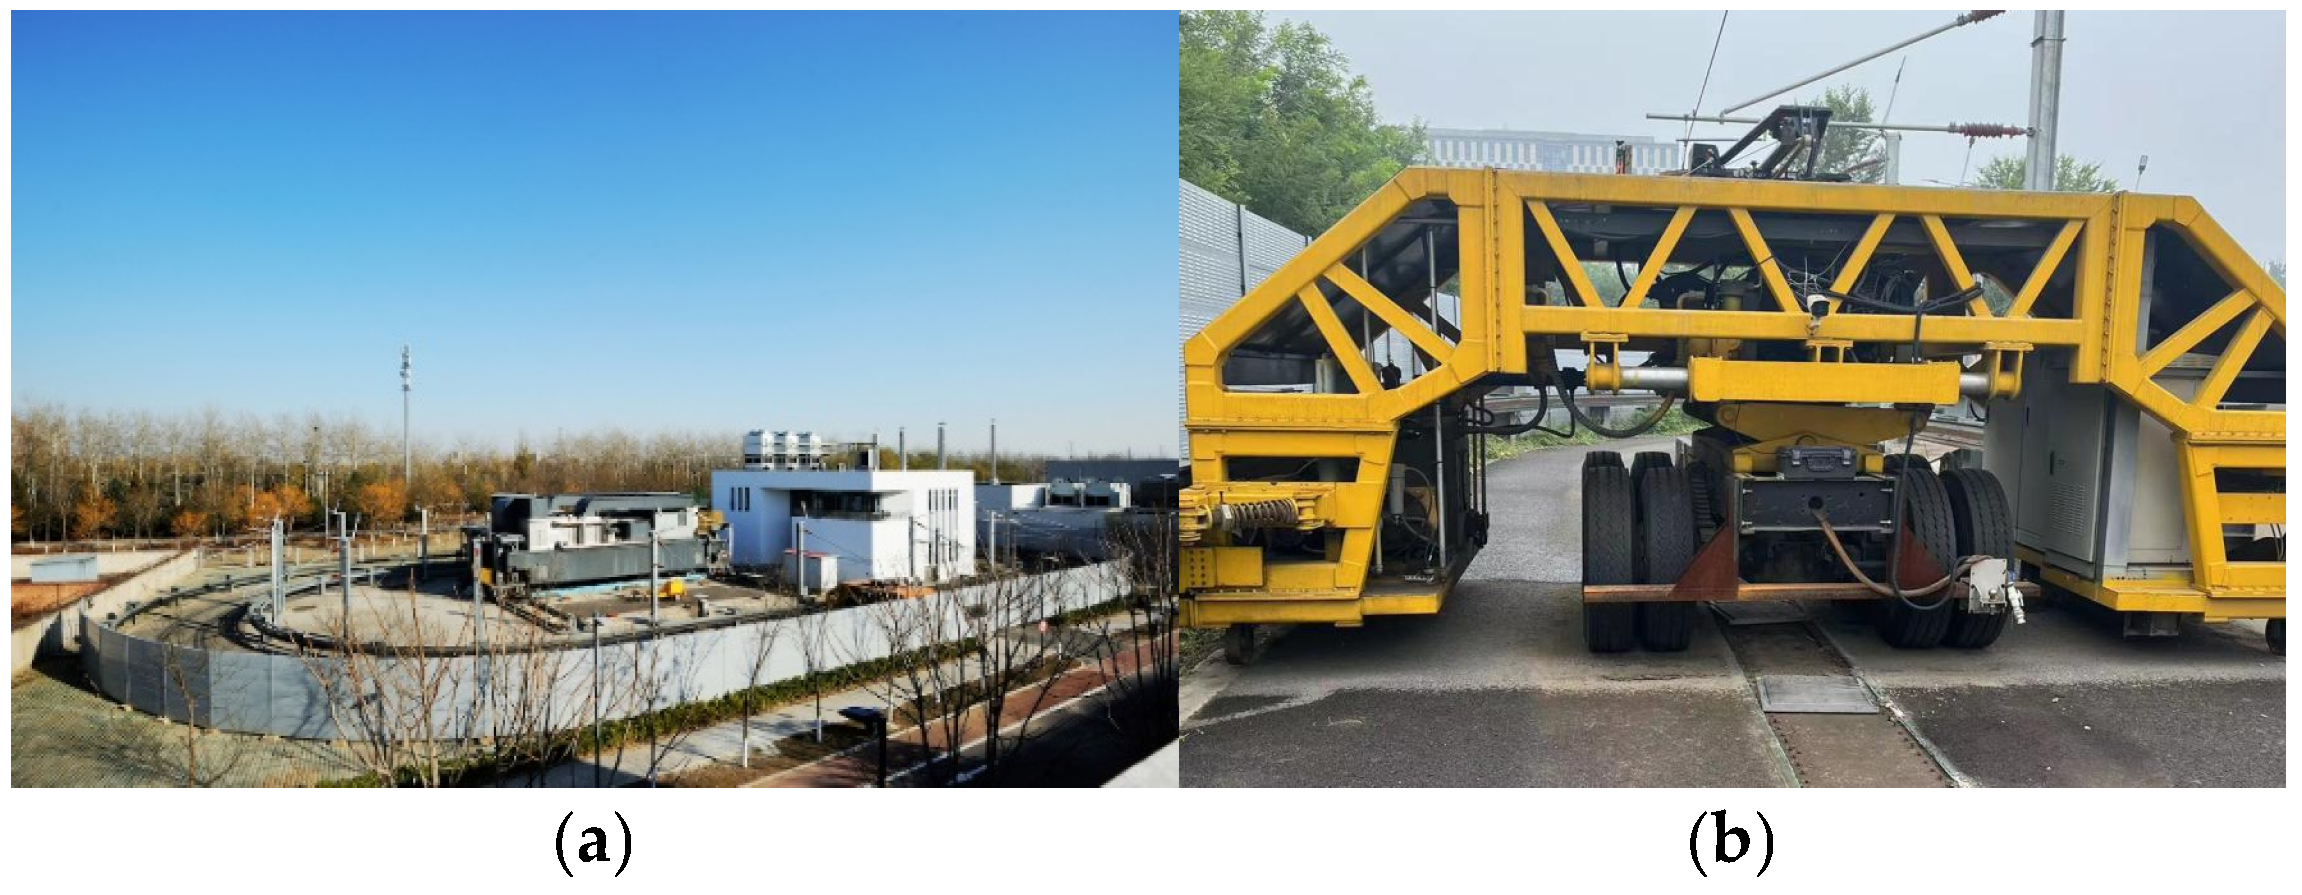
The field tests were conducted using the full-scale Natural Environment-Automatically Loaded Track (NE-ALT) system [19], which is mainly composed of a 200 m loop testing track and a standard tandem-axle eight-wheel vehicle simulator, as shown in Figure 4. More information about the full-scale NE-ALT system can be found in the previous studies [20,21].
Figure 4.
Full-scale accelerated loading test system: (a) Overhead view; (b) Vehicle simulator.
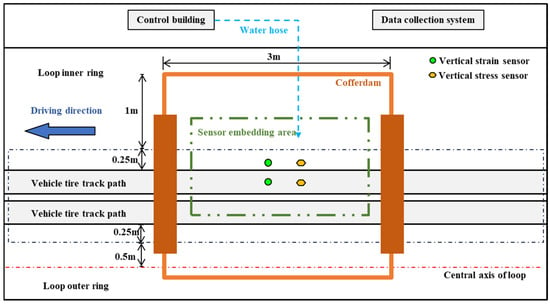
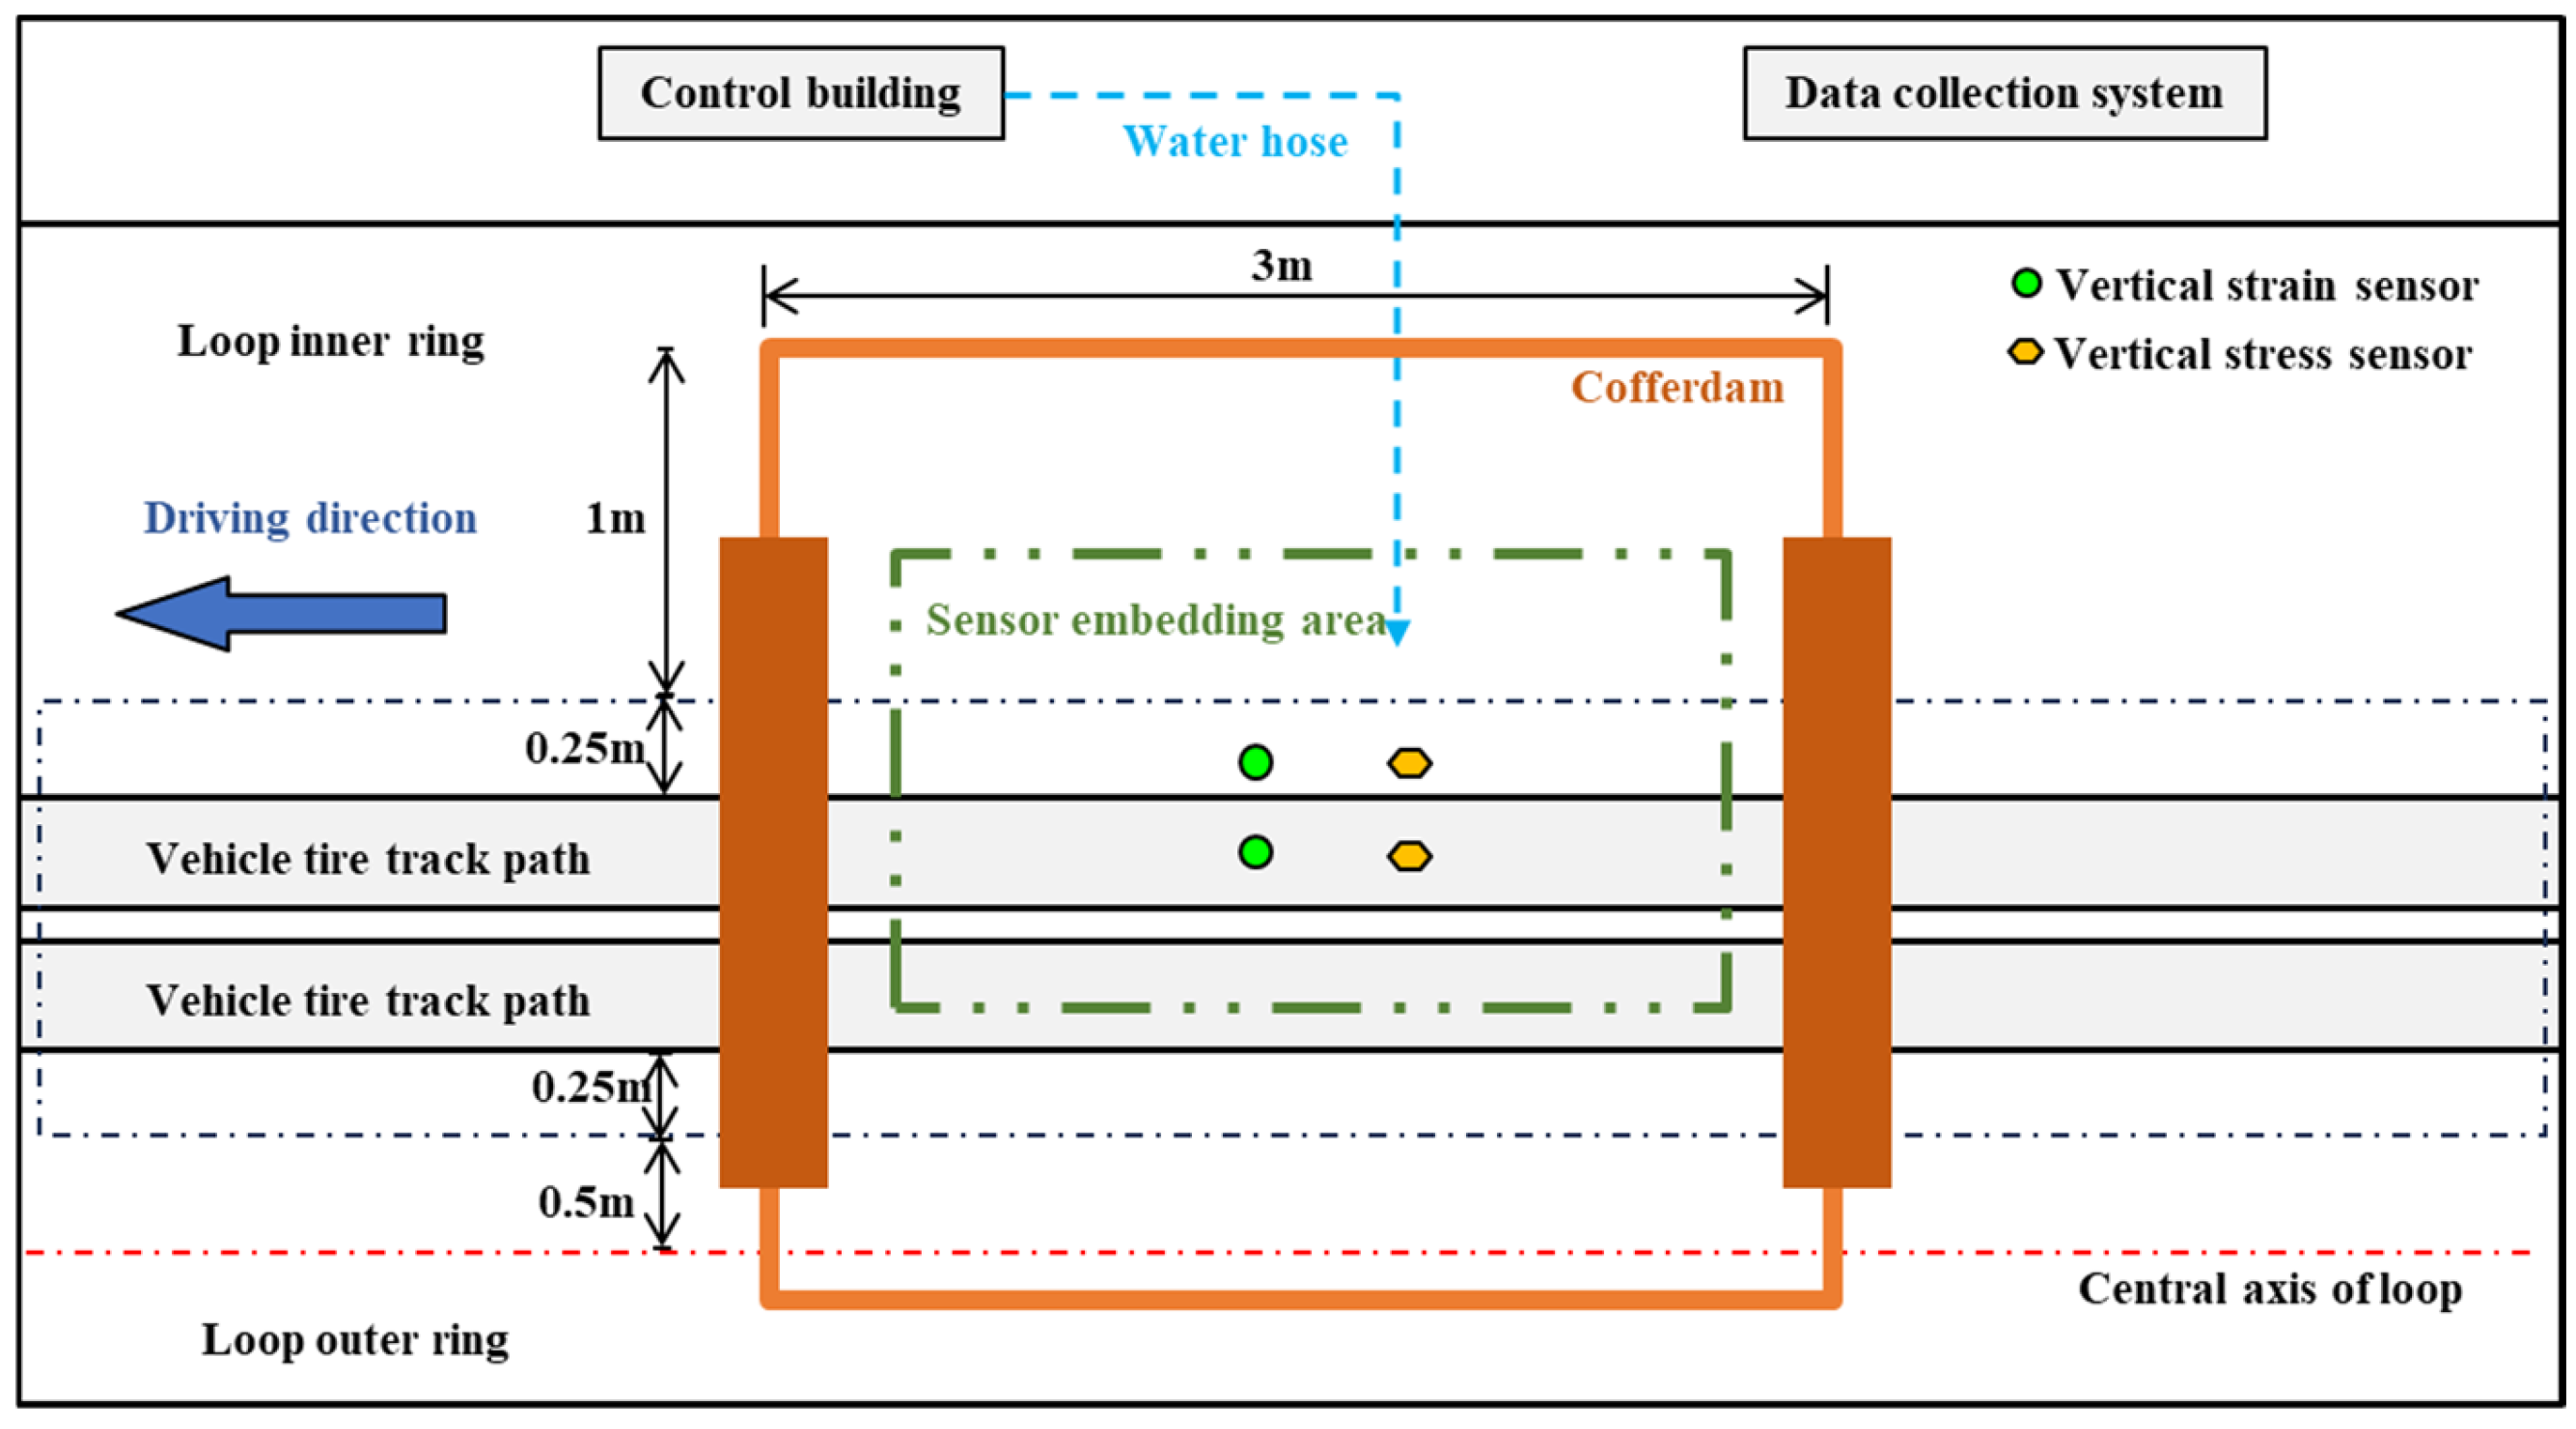
The field test section was established in the middle region of the straight segment of the loop track. This section offered favorable pavement smoothness conditions, stable vehicle passing speeds, and proximity to the water source from the control building. It facilitated water supply connections for controlling water depth in the test section. The layout of the field test section and sensor placement was illustrated in Figure 5. Two sets of sensors were installed at the center and outside of the vehicle tire track path, respectively. Each set included a vertical strain sensor and a vertical stress sensor to enable real-time monitoring of changes in pavement dynamic response signals as the vehicle tire passed the water-covered pavement. The sensors located at the center of the tire track path monitored dynamic responses directly beneath the vehicle tire. When the tire passed over the water-covered pavement, impact-induced water splashing outside the tire also led to changes in dynamic responses. Therefore, a second set of sensors was placed outside the tire track path, at a distance of 20 cm from the tire track path centerline. All sensors were spaced 50 cm apart to prevent mutual interference during installation and testing and then embedded at the surface level of the test pavement. Fine asphalt mixture was used to level the bottom of the drilled holes and backfill the holes, ensuring that the sensor bases were uniformly horizontal and their top surfaces were flush with the pavement surface. SBS-modified asphalt was applied to seal the gaps after sensors’ cable being laid. After the completion of sensors installation, field tests were conducted in the controlled standard condition to verify sensor functionality and data stability.
Figure 5.
Layout of the field test section.
3.2. Controlling Water Depth in Field Test
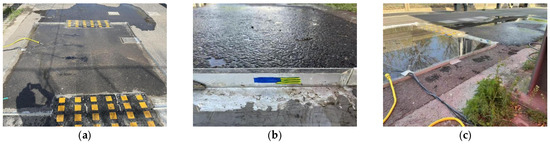
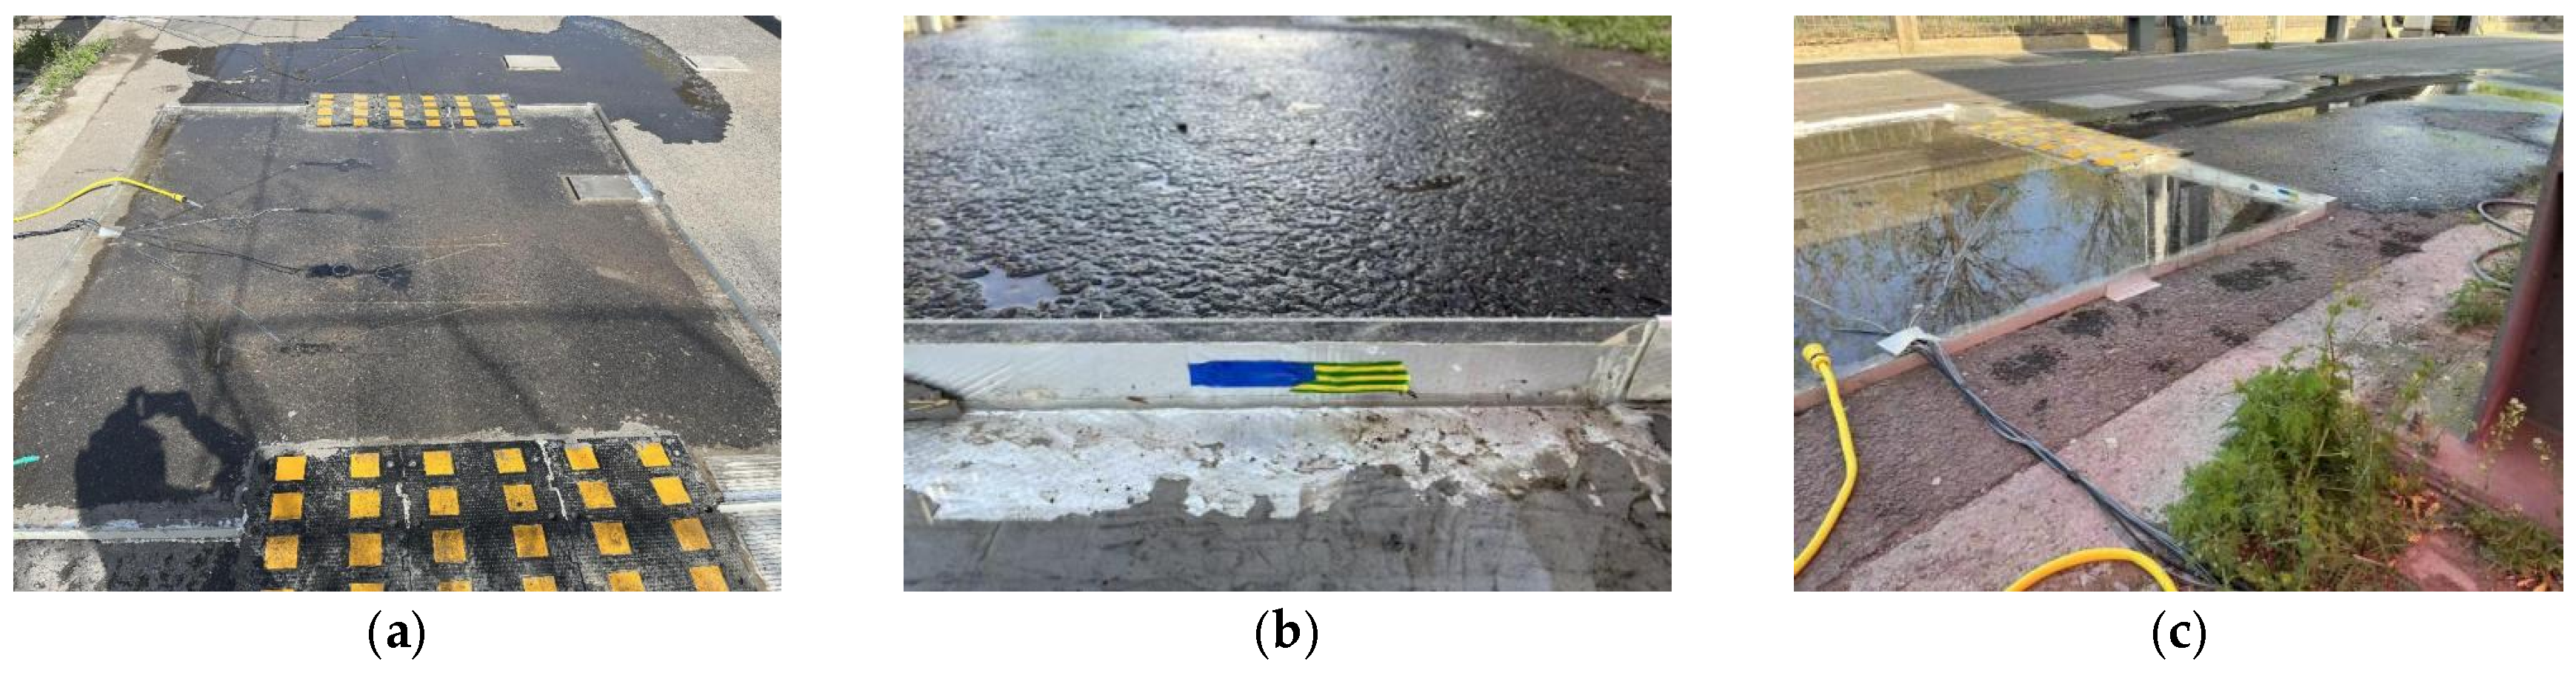
Barriers were constructed around the field test section to form a small-scale cofferdam. By pouring water into the cofferdam, different accumulated water depths were controlled to create the accelerated loading test conditions on water-covered pavement. The left and right sides of the test section’s cofferdam were designed as vertical barriers, while the front and rear sides were set as trapezoidal ramps to allow the vehicle simulator to pass smoothly. The cofferdam barriers’ joints were tightly sealed using waterproof tape and waterproof putty, as shown in Figure 6a. Water was supplied to the cofferdam via a pipeline connected to the control building. Since water was inevitably taken away by the tire when the vehicle simulator passed through the test section, timely replenishment of water was necessary via the pipeline. The label-marked water level method was employed to control water depth within the test section, as shown in Figure 6b,c. Observing the water level inside the cofferdam remotely from the roadside, a dynamically stable water depth was maintained by turning on or off the water supply promptly. Water depths above the top surface of each embedded sensor might be different. A cross-sectional ruler was used to measure the elevation differences among the top surfaces of embedded sensors in the test section based on a selected zero-elevation reference point.
Figure 6.
Field water-covered pavement test section: (a) Water-accumulated section; (b) Pasting water level labels; (c) Remote observation of water level.
3.3. Field Accelerated Loading Protocol
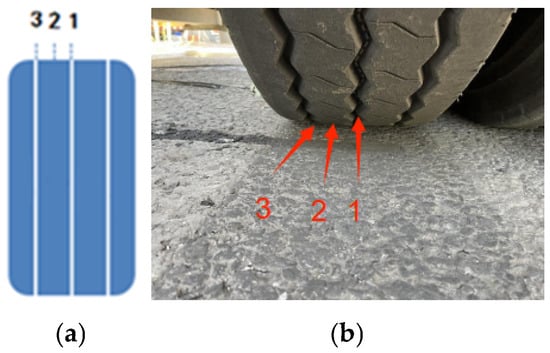
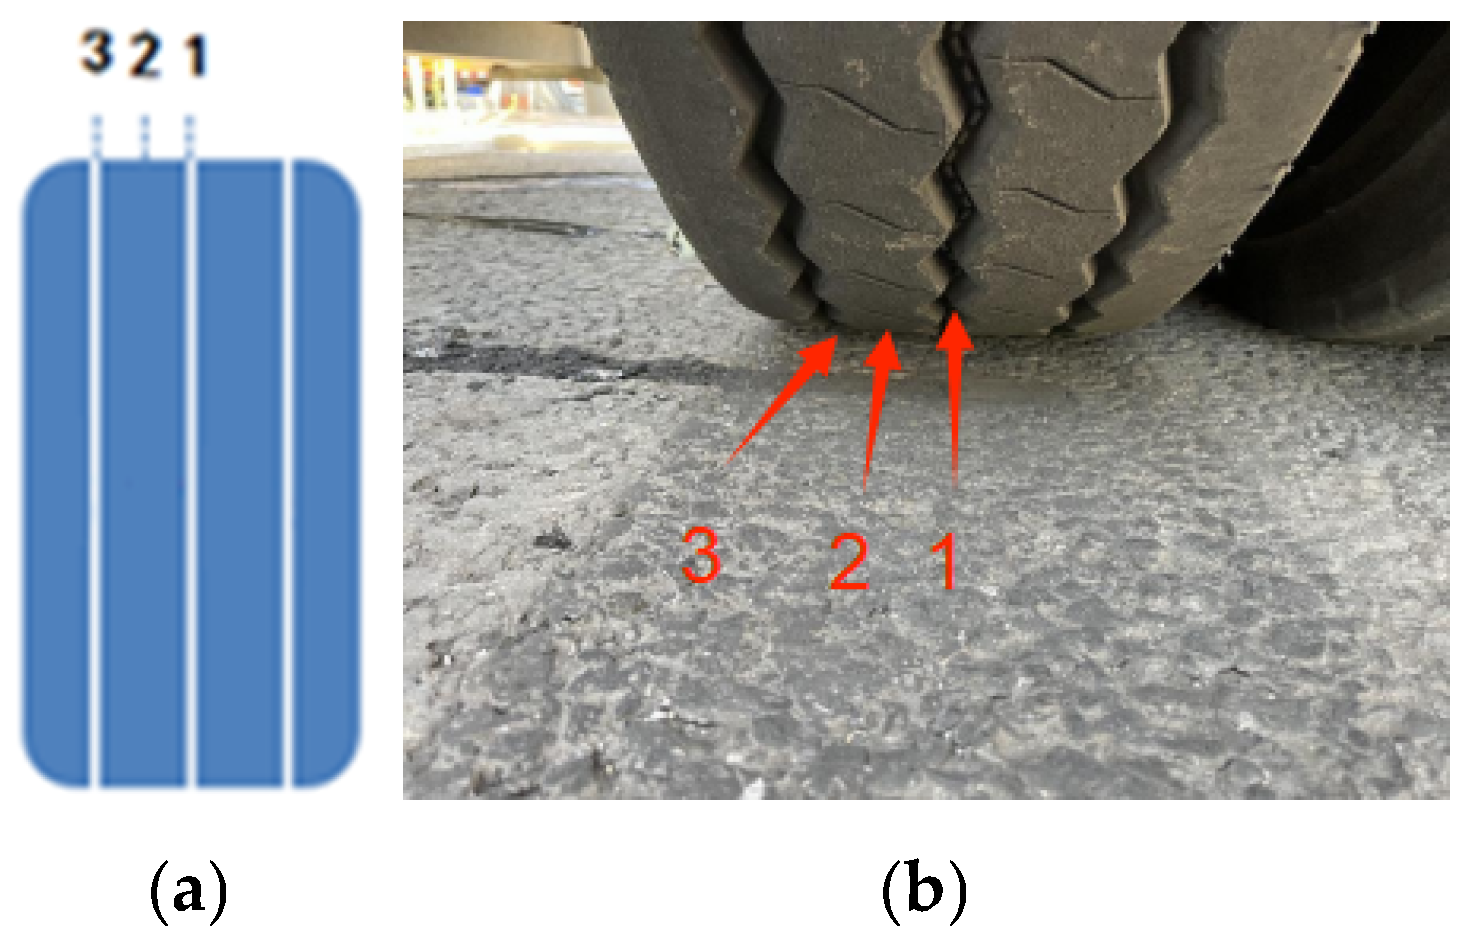
This study took four variable parameters into account in field accelerated loading tests, which included vehicle speed, vehicle axle load, water depth, and tire transverse position. The adjustable ranges for vehicle speed and vehicle axle load were 0–30 km/h and 100–280 kN, respectively. In particular, the vehicle axle load was evenly distributed and borne by the vehicle simulator’s eight tires, and the vehicle tire load was, namely, adjustable within the range of 12.5–35 kN. The vehicle tire’s transverse position could be moved within ±30 cm. The 12.00R20 all-steel radial truck tire was employed to assemble the vehicle simulator. The parameter combination of 10 km/h vehicle speed, 30 kN vehicle tire load, 10 mm water depth, and +50 mm tire transverse position was referred to as the controlled standard condition. Controlled variable approach was conducted to investigate the influence of each factor on dynamic responses of tire–water–pavement coupling interactions. The tire tread pattern made both structural dynamic responses and water flow field characteristics within and around the tire–water–pavement contact region complex. As shown in Figure 7, the tire tread pattern was simplified into three measuring zones. By adjusting the tire’s transverse position, the embedded sensors could be moved and positioned at different transverse locations relative to the tire.
Figure 7.
Controlling transverse positions of vehicle simulator: (a) Simplified tire tread pattern; (b) Real tire tread pattern.
Changes in structural dynamic response signals were monitored as the vehicle simulator passed the water-covered pavement test section. A high-speed camera was applied to record instantaneous states of the tire-water-pavement coupling interaction. As a standard tandem-axle eight-wheel frame was employed to assemble the vehicle simulator, the embedded sensors would capture two segments of dynamic response signals generated successively by the front and rear tires when the vehicle simulator passed through the test section. Three parallel tests for each testing condition to minimize possible random errors. The parameter combination of 30 kN vehicle tire load, 10 mm water depth, 10 km/h vehicle speed, and +50 mm transverse position was referred to as the controlled standard condition. Controlled variable field tests were conducted by individually varying each parameter. The effects of vehicle tire load (25, 27.5, and 30 kN), water depth (10, 15, and 20 mm), vehicle speed (5, 10, and 15 km/h), and transverse position (−20, +15, and +50 mm) on structural dynamic response were individually analyzed.
4. Results and Discussions
Dynamic response characteristics of tire-water-pavement coupling interaction obtained from numerical simulation and field tests were presented individually and then combined to validate the numerical model. Critical conditions of vehicle tire hydroplaning were then predicted, and their mechanisms with corresponding mitigation measures were discussed.
4.1. Characteristics of Tire-Water-Road Coupling Simulation
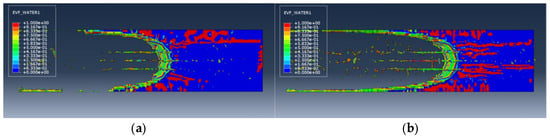
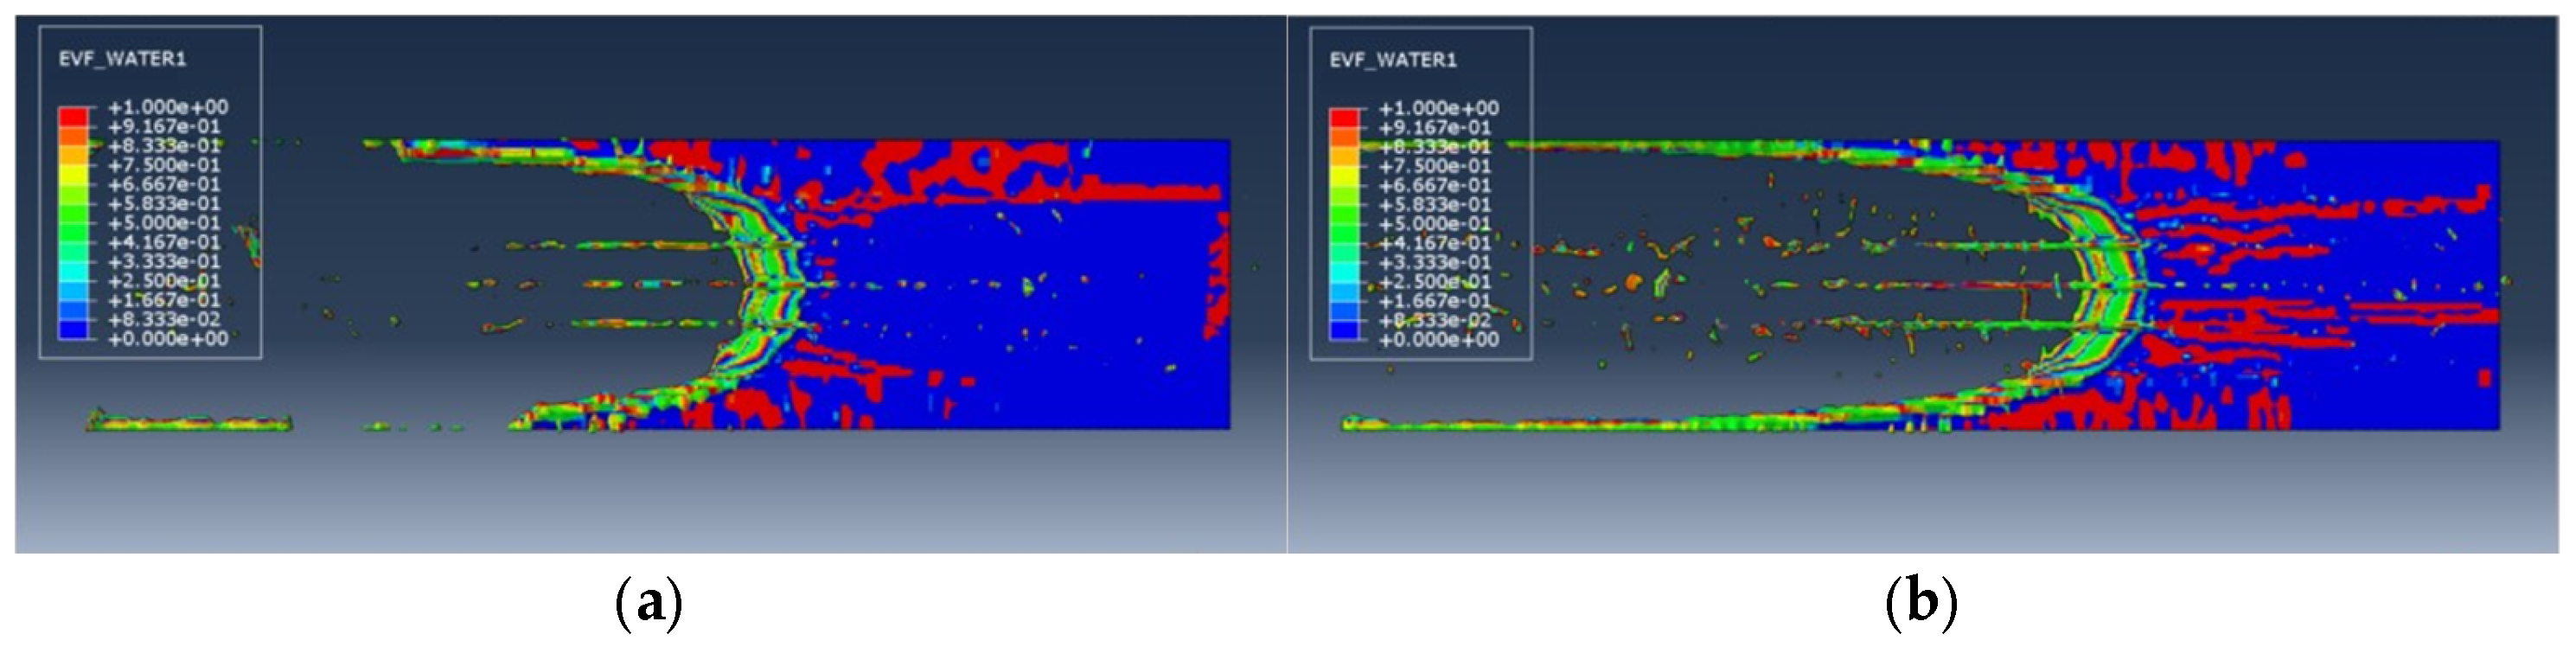
At different vehicle speeds, the contour plots of water volume fraction are shown in Figure 8. The water volume splashing in front of the tire became more extensive and covered a larger area as the vehicle speed increased. Therefore, a larger tire–water contact area would generate an increasing upward hydrodynamic lifting force on the tire, which consequently made the pavement supporting force progressively offset by water. As speed continually increased, tire–pavement friction decreased, and pavement supporting force diminished until it approached zero, at which point vehicle tire hydroplaning occurred. Comparing low-speed and high-speed conditions in Figure 8, e.g., 10 km/h versus 120 km/h, the extent of water splashing on both sides of the vehicle tire increased with speed. It indicated that a high-speed tire interacting with water on pavement would cause water to be rapidly squeezed away to both sides of the tire path. Additionally, the cavities formed between the tire tread pattern and pavement surface also served as channels for water drainage. This emphasized the importance of precisely controlling the tire path in field tests due to the high sensitivity of monitored signal accuracy to tire transverse positions.
Figure 8.
The contour plots of water volume fraction at different vehicle speeds (30 kN-10 mm): (a) 10 km/h; (b) 120 km/h.
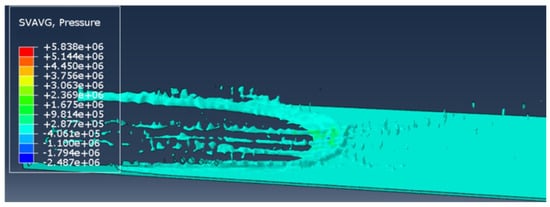
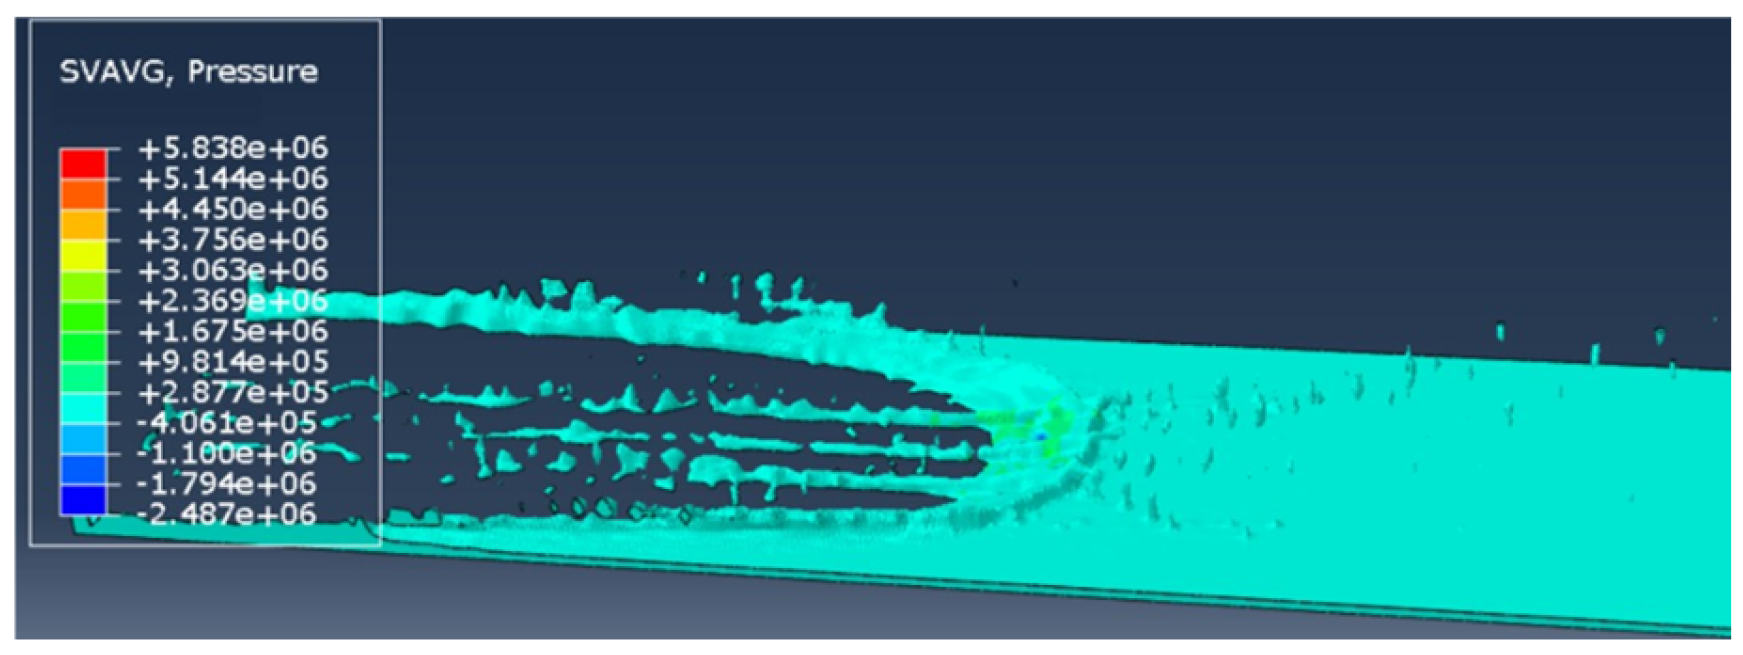
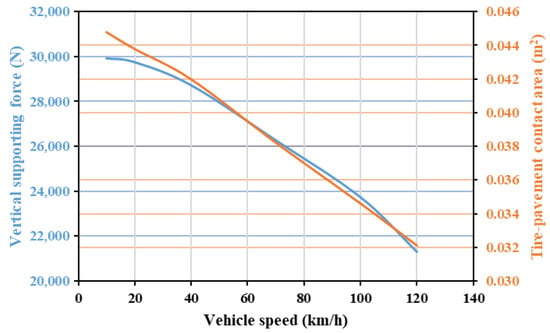
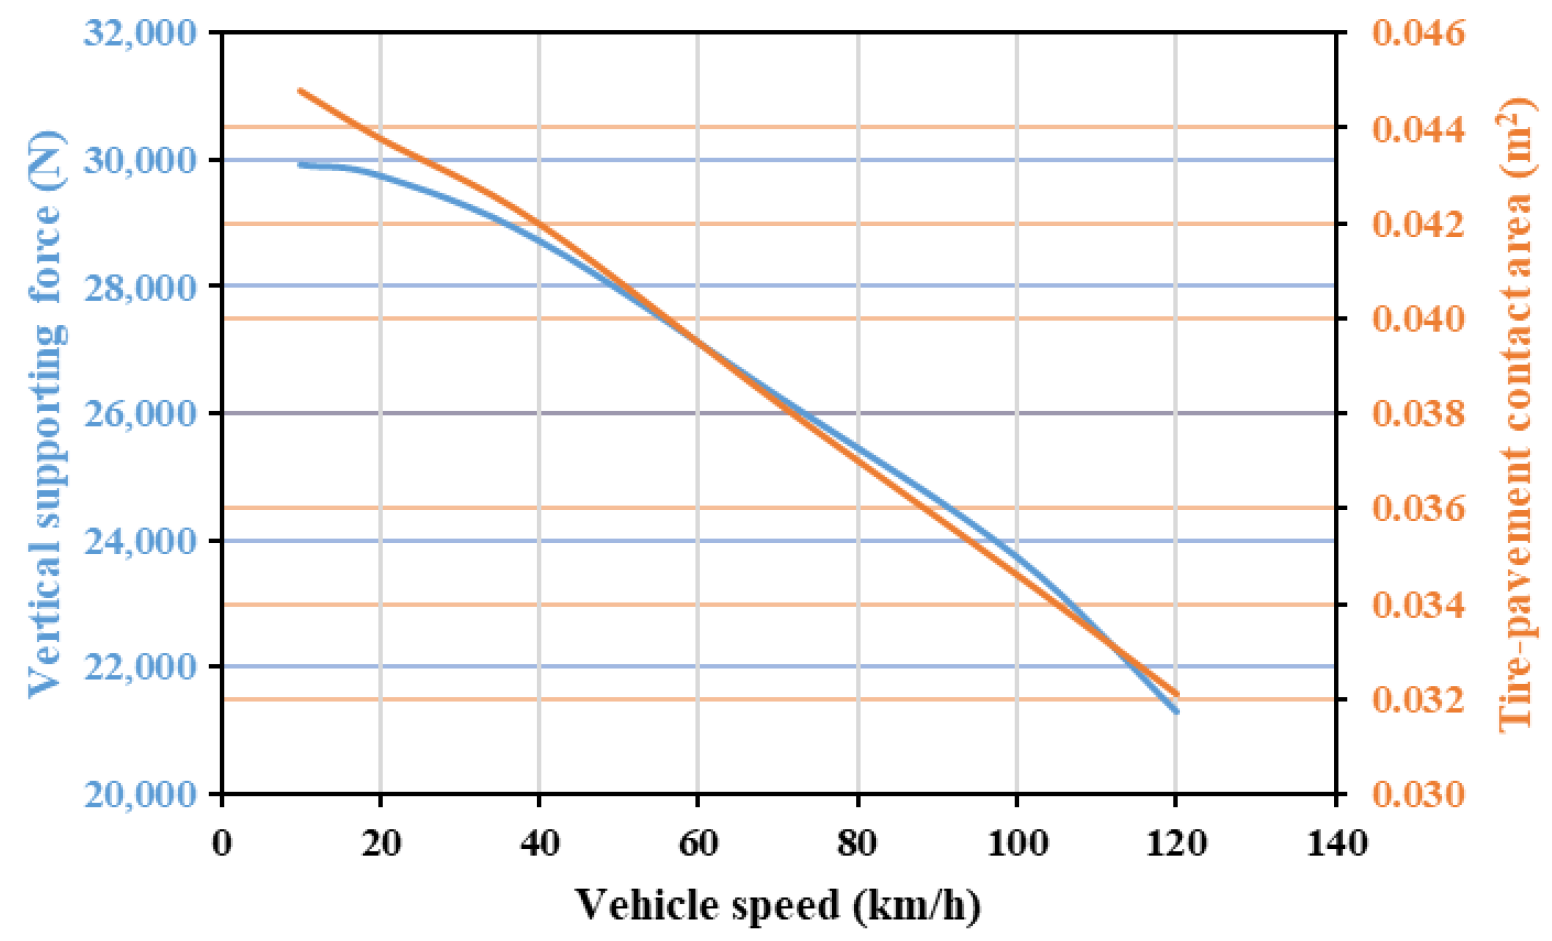
The contour plot of dynamic water pressure at 120 km/h vehicle speed is shown in Figure 9. The lifting effect of water on the tire was clearly observed, which was primarily concentrated in the water ahead of the tire. It implied that water in front of the tire played a critical role in the supporting force on the tire. The faster the vehicle speed, the larger the tire–water contact area and the larger the water-induced hydrodynamic lifting force. Pavement supporting force and tire-pavement contact area were further determined under various vehicle speed conditions, as shown in Figure 10. Results showed that these two indicators gradually decreased as vehicle speed increased. The average contact pressure between tire and pavement was defined as the ratio of pavement supporting force on the tire to the tire–pavement contact area. Thus, the tire–pavement average contact pressure fluctuated around approximately 0.68 MPa in the presence of water, while this indicator increased with vehicle speed and could reach around 0.75 MPa under dry conditions (without water). It could be concluded that the introduction of water reduced the tire-pavement contact pressure, and the influence of water became more pronounced as vehicle speed increased, which in turn made the tire more prone to hydroplaning. This conclusion aligned well with practical observations.
Figure 9.
The contour plot of dynamic water pressure (120 km/h).
Figure 10.
Variations in vertical supporting force and contact area with vehicle speed.
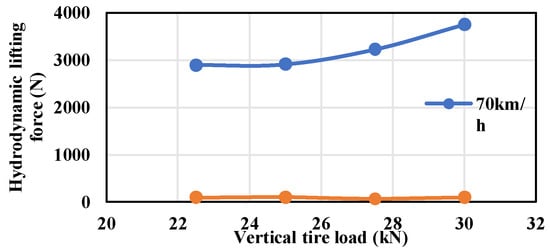
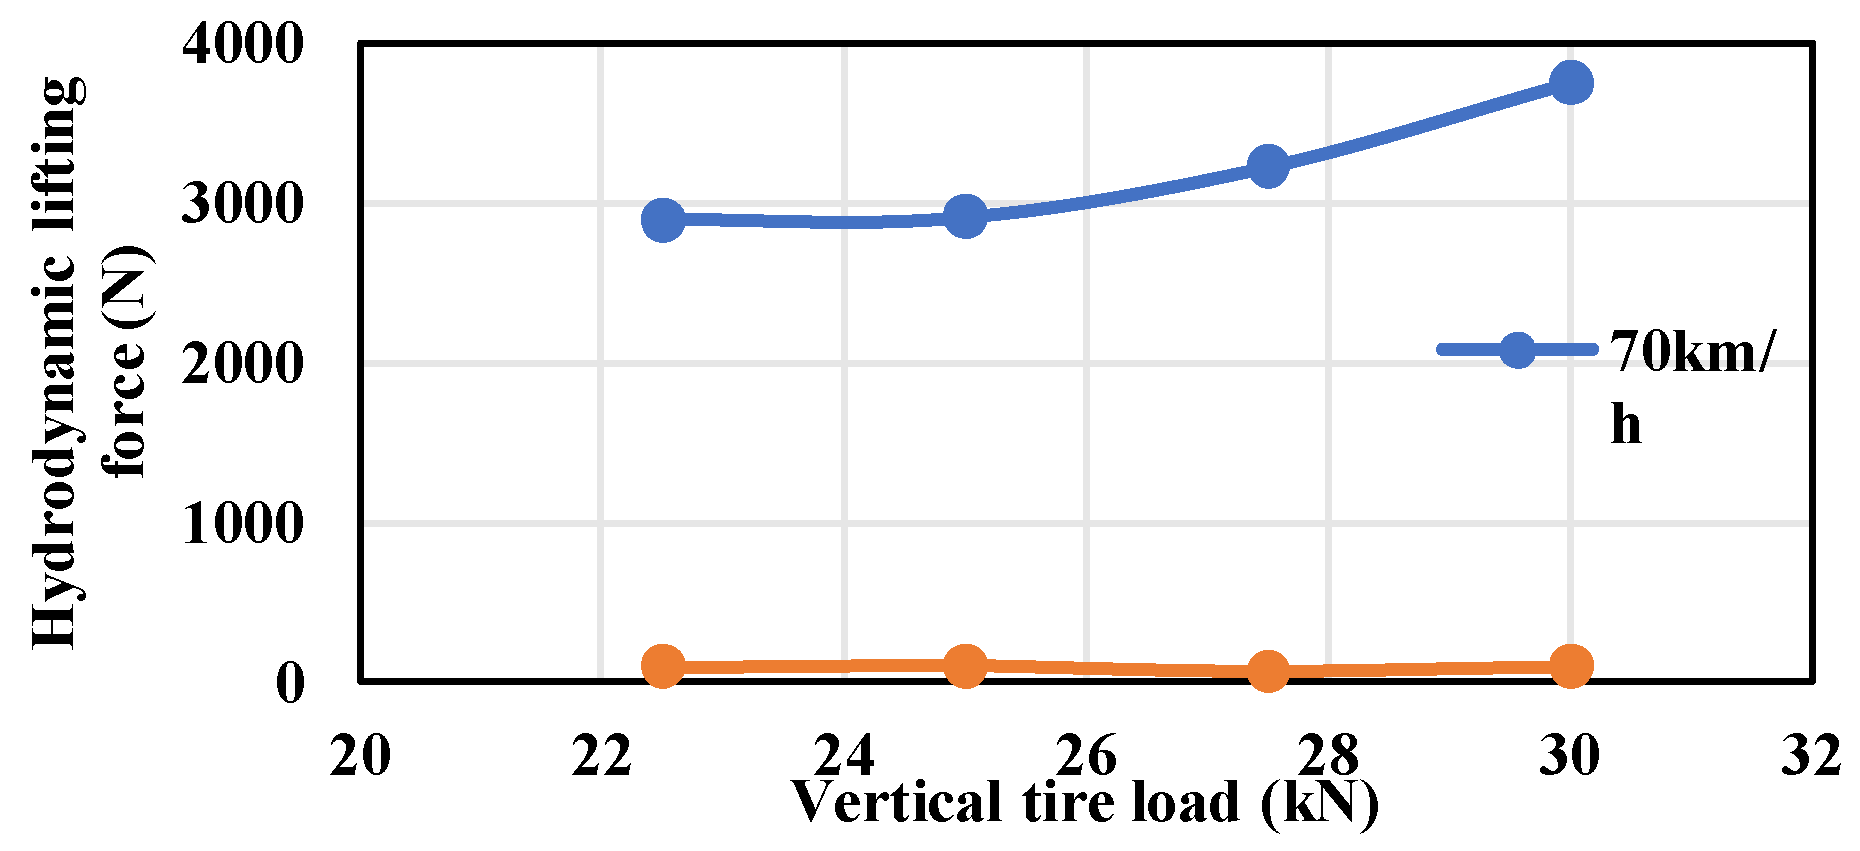
To evaluate the influential factor of vehicle tire load, relevant variations of the hydrodynamic lifting force are shown in Figure 11. The hydrodynamic lifting force was less influenced by tire load at the relatively low speed of 10 km/h, which basically remained around 100 N. As vehicle speed increased, the impact of tire load on hydrodynamic lifting force became more significant. When the vehicle speed reached 70 km/h, the hydrodynamic lifting force increased with the vehicle tire load. The tire’s impact on water was relatively small at a small vehicle speed, such as 10 km/h, which resulted in a generally low hydrodynamic lifting force that showed little sensitivity to vehicle tire load. The tire’s impact on water would increase at a large vehicle speed, such as 70 km/h, and the influence of vehicle tire load became more pronounced. Therefore, a larger vehicle tire load led to a larger compressive force exerted by the tire on water, which in turn increased the tire–water interaction area and ultimately manifested as a larger water-induced hydrodynamic lifting force.
Figure 11.
Variations in water-induced hydrodynamic lifting force with vehicle tire load (10 mm).
At different water depths, relevant contour plots of water volume fraction with both 10 km/h and 70 km/h were shown in Figure 12. The thinner the water depth, the thinner the wedge-shaped water film formed ahead of the vehicle tire as it passed over the water-covered pavement, resulting in a smaller hydrodynamic lifting force. As water depth increased, the contact area of the water film region in front of the vehicle tire gradually became larger, leading to a larger hydrodynamic lifting force. Therefore, tire–pavement contact force decreased and made the tire more prone to slipping.
Figure 12.
The contour plots of water volume fraction at different water depths (30 kN): (a) 10 km/h-5 mm; (b) 70 km/h-5 mm; (c) 10 km/h-20 mm; (d) 70 km/h-20 mm.
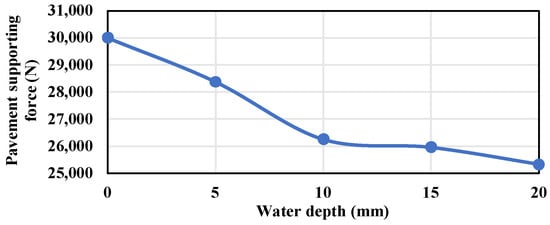
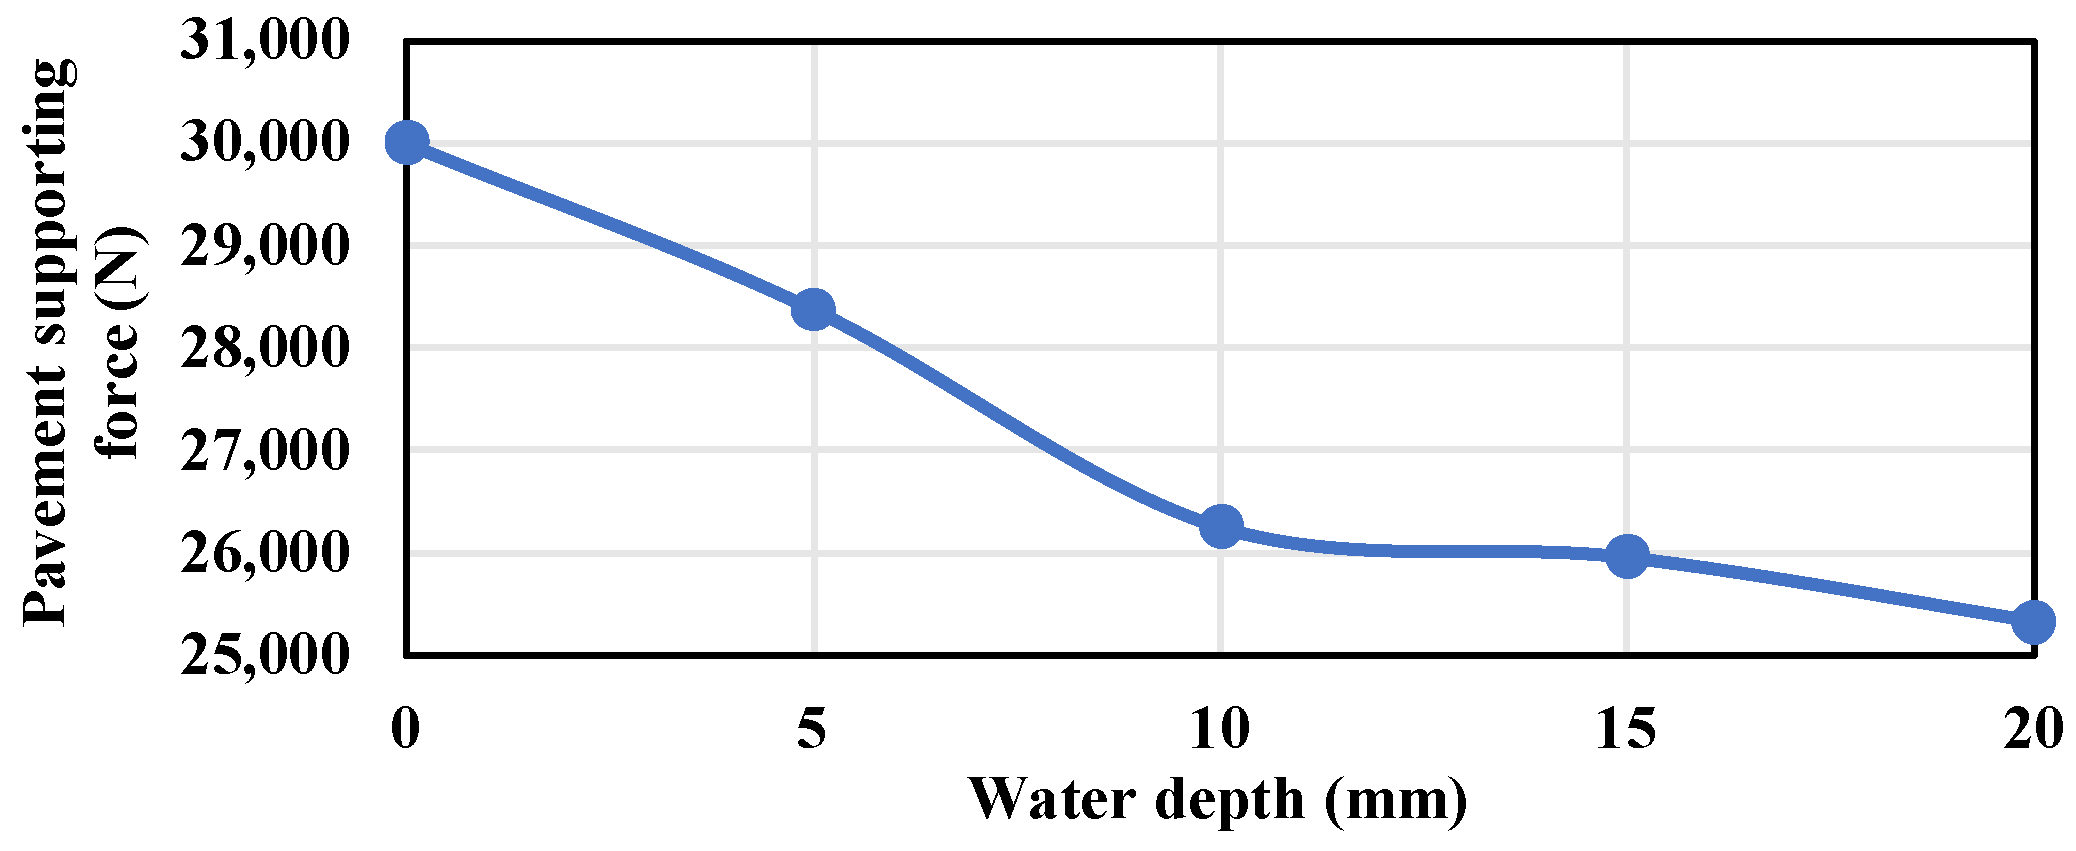
Pavement supporting forces were calculated for different water depths. At 10 km/h, pavement supporting forces remained approximately around 29.9 kN for all water depths. It indicated that water depth had little influence on the tire at this small vehicle speed because water could be rapidly squeezed away by the tire. At 70 km/h, pavement supporting forces varied with water depth, as shown in Figure 13, and the force gradually decreased as water depth increased. When the accumulated water is shallow, the pavement’s supporting force changes rapidly as water depth increases. However, once the water depth reached 10 mm, the change rate in pavement supporting force slowed down. A possible explanation was that a thin water film would be easily formed on the pavement surface in a shallow accumulated water condition. The thin water film was difficult to break due to surface tension, which allowed it to maintain a relatively large tire–water contact area and generated sufficient lifting force. In the relatively deep accumulated water condition, the retained water was more easily squeezed away by the tire impact, which prevented the formation of a large and continuous water film. As a result, changes in pavement supporting force became less pronounced as water depth further increased. Indeed, the supporting force generated by the water film was time-dependent during the tire–water interaction process. At the initial stage of tire contact with the water film, hydrodynamic pressure was rapidly generated as the water was compressed and expelled from the contact region. During this period, the water film could temporarily provide a relatively large supporting force. However, as the water flowed away through the tread grooves and lateral directions, the hydrodynamic pressure gradually stabilized, and the supporting force reached a quasi-steady state. Therefore, the high supporting force provided by the water film mainly occurred during the transient stage of the interaction process.
Figure 13.
Variations in pavement supporting force with water depth (70 km/h-30 kN).
4.2. Field-Measured Characteristics of Tire–Water–Road Coupling Dynamic Responses
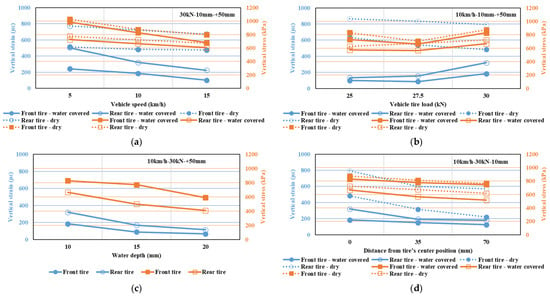
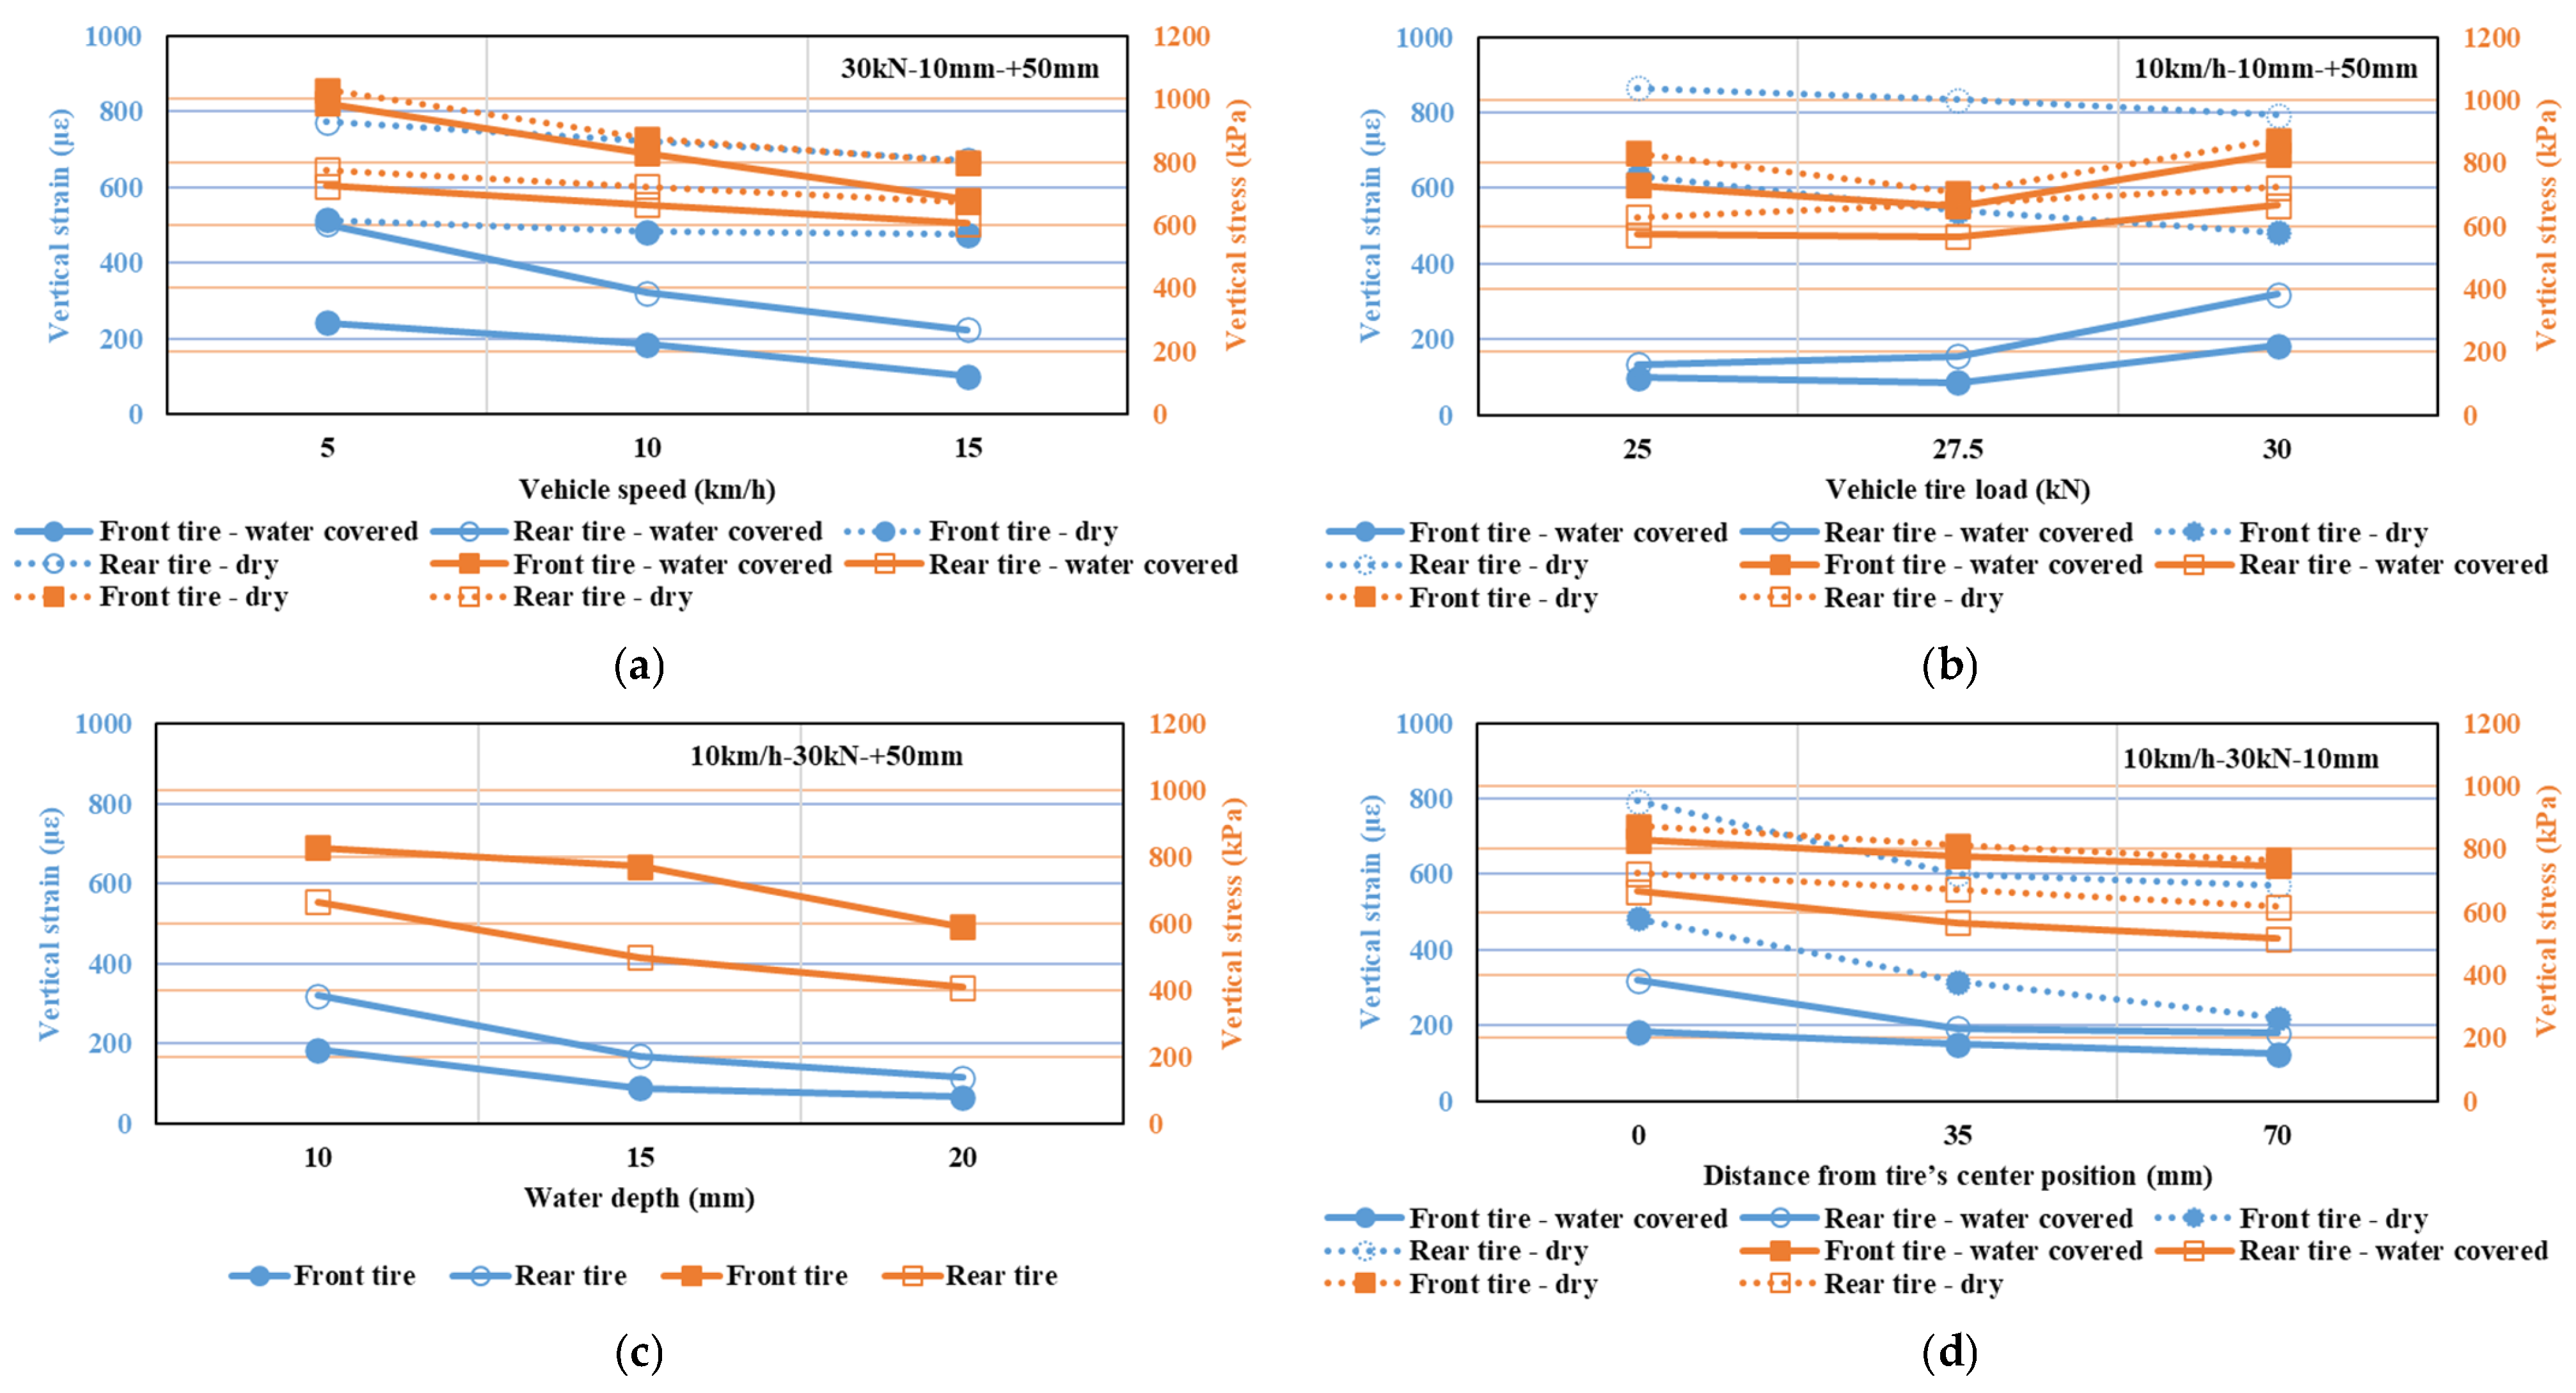
The full-scale accelerated loading test facility NE-ALT was employed to systematically conduct field experiments under the precise control of the vehicle tire track path. The parameter combination of 10 km/h vehicle speed, 30 kN tire load, 10 mm water depth, and +50 mm tire transverse position was set as the standard condition. The effects of these parameters on the dynamic response of dry and water-covered pavements were analyzed by individually varying each parameter. Variations in structural dynamic responses with variable parameters in field tests were summarized in Figure 14.
Figure 14.
Variations in structural dynamic responses with variable parameters in field tests: (a) Vehicle speed; (b) Tire load; (c) Water depth; (d) Transverse position.
As vehicle speed increased in Figure 14a, both vertical stress and vertical strain continuously decreased, which implied that the pavement supporting force might gradually diminish. However, in both dry and water-accumulated conditions, vertical strain induced by the front tire was smaller than that induced by the rear tire, whereas vertical stress exhibited inverse trend for the front and rear tires According to the previous measurements of vehicle tire load distribution between front and rear tires [20,21], the rear tire typically borne a slightly larger share of the vehicle tire load compared to the front axle. Nevertheless, the inverse trend observed for vertical stress might be attributed to the interaction between the vehicle tire and the trapezoidal ramp. When the vehicle simulator was passing the field test section, the moment the front tire located on the vertical stress sensor’s position, the rear tire might just locate on the trapezoidal ramp, which might make the front tire temporarily carry a relatively larger portion of the vehicle tire load. But when the rear tire moved on the vertical strain sensor’s position, the front tire was still within the test section, which led to the observed phenomenon that vertical stress induced by the front tire exceeded that induced by the rear tire.
To assess the influential parameter of vehicle tire load, as shown in Figure 14b, it could be observed that changes in vehicle tire load did not significantly affect both vertical stress and vertical strain under the constant vehicle speed and water depth. This conclusion was also obtained in dry conditions. It implied that vehicle tire load had a relatively limited influence on field structural dynamic responses at 10 km/h vehicle speed. This finding aligned with the conclusion of numerical simulations that at low vehicle speeds, the values of pavement supporting force were less sensitive to changes in vehicle tire load. Nevertheless, the field experimental results remained valid, as the vertical strain induced by the rear tire remained larger than that of the front tire, while the vertical stress from the front tire exceeded that of the rear tire. It indicated that changes in hydroplaning risk were not solely governed by tire load variations but must be analyzed in conjunction with vehicle speed and water depth.
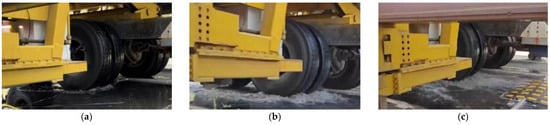
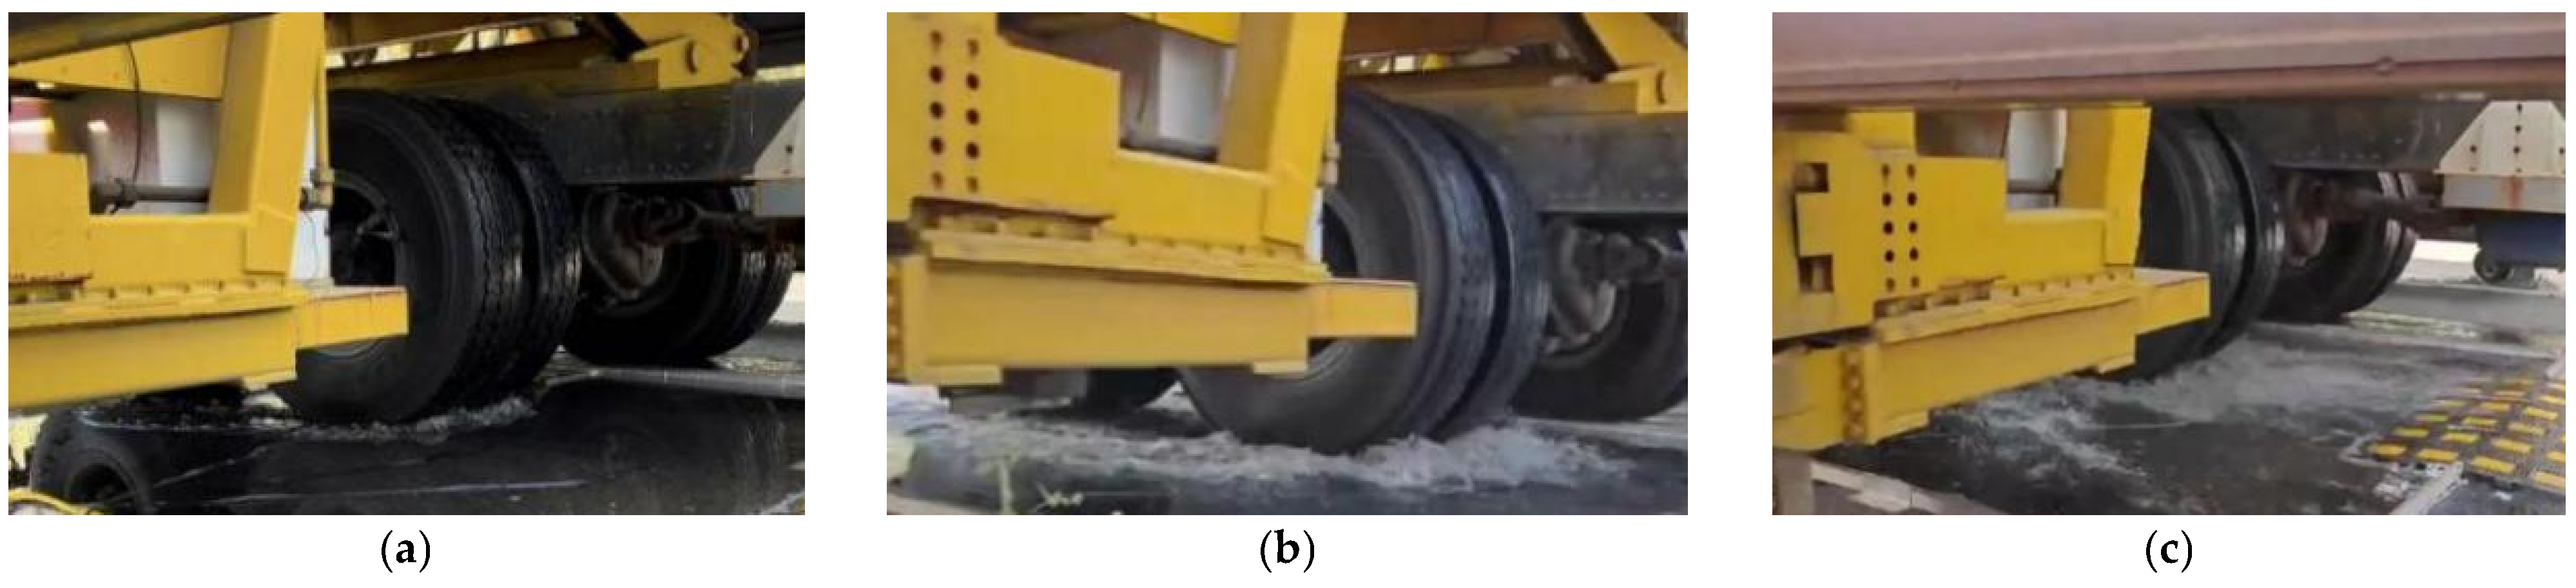
As water depth increased in Figure 15, the instantaneous amount of water displaced in front of the front tire (squeezing effect) and splashed behind the rear tire (suction effect) intensified obviously as water depth increased. The larger the water squeezed and splashed, the larger the contact area between water and vehicle tire, which resulted in a stronger water-induced hydrodynamic lifting force. As shown in Figure 14c, it can be seen that both vertical stress and vertical strain decreased significantly as water depth increased. It was illustrated that a larger water depth enlarged the tire-water interaction area, which enhanced water-induced hydrodynamic lifting force and thereby reduced pavement supporting force on the vehicle tire. As water depth further increased, variations in structural dynamic responses gradually tended to level off, which indicated a nonlinear relationship between water depth and its influence on pavement supporting force.
Figure 15.
Instantaneous states of tire-water-pavement coupling interaction with different water depths in field tests: (a) 10 mm; (b) 15 mm; (c) 20 mm.
Adjusting the vehicle tire’s relative transverse positions, variations in tire–water–pavement coupling dynamic responses were shown in Figure 14d. Specifically, these three transverse positions corresponded to the three position-markers illustrated in Figure 7. Along the vehicle tire’s lateral direction, both vertical stress and vertical strain decreased gradually from the tire center toward its outer sides. It was consistent with the characteristics of typical contact stress distribution between the vehicle tire and the pavement surface in both dry and water-covered conditions. It indicated that the fundamental contact morphology between the vehicle tire and the pavement surface remained unchanged in the presence of water, while the overall stress level was reduced.
4.3. Validation of Tire–Water–Road Coupling Model Using Field Measurements
In the tire–water–pavement coupling numerical simulations conducted in this study, the index of pavement supporting force was used as a benchmark reference to evaluate the effects of parameter variations under different conditions on hydraulic-mechanical characteristics of tire-water-pavement coupling interactions. In the field experiments, stress and strain sensors were mainly employed and embedded to monitor structural dynamic response signals as the vehicle simulator drove on the water-covered pavement. Consequently, it was necessary to further calculate the changes in tire-pavement contact stress in numerical simulations, which needed to be compared with dynamic response indicators obtained from field tests to validate the effectiveness of the numerical model. Specifically, dynamic responses caused by two tires in one track path were chosen from the field vehicle with eight tires to validate the effectiveness of the single tire numerical model.
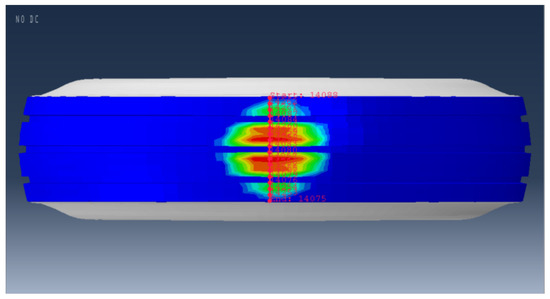
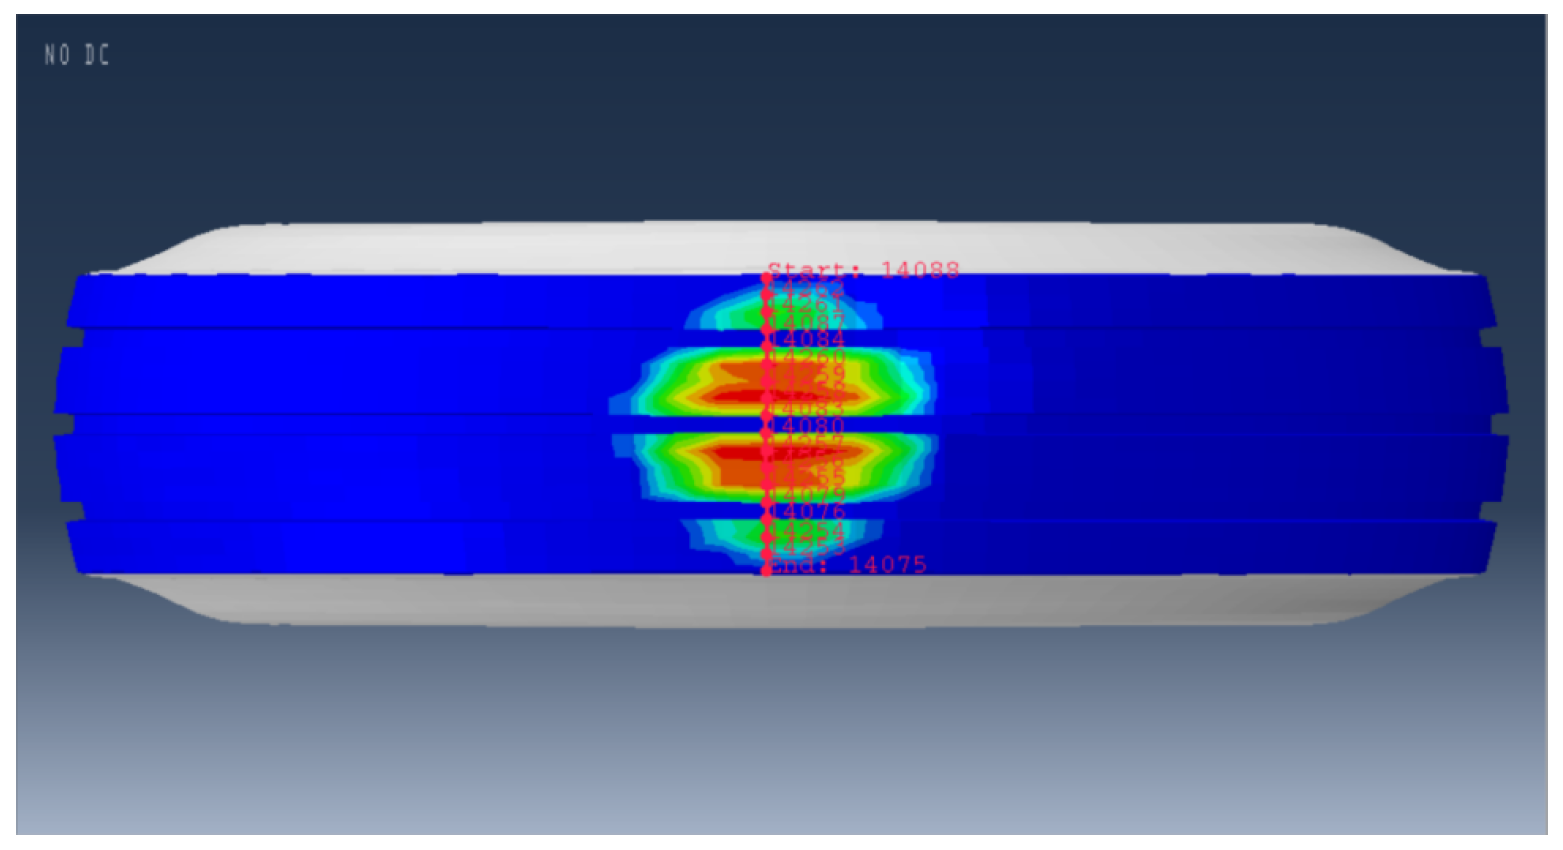
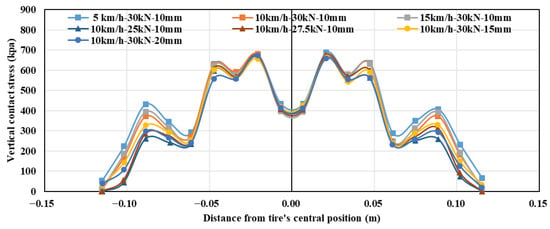
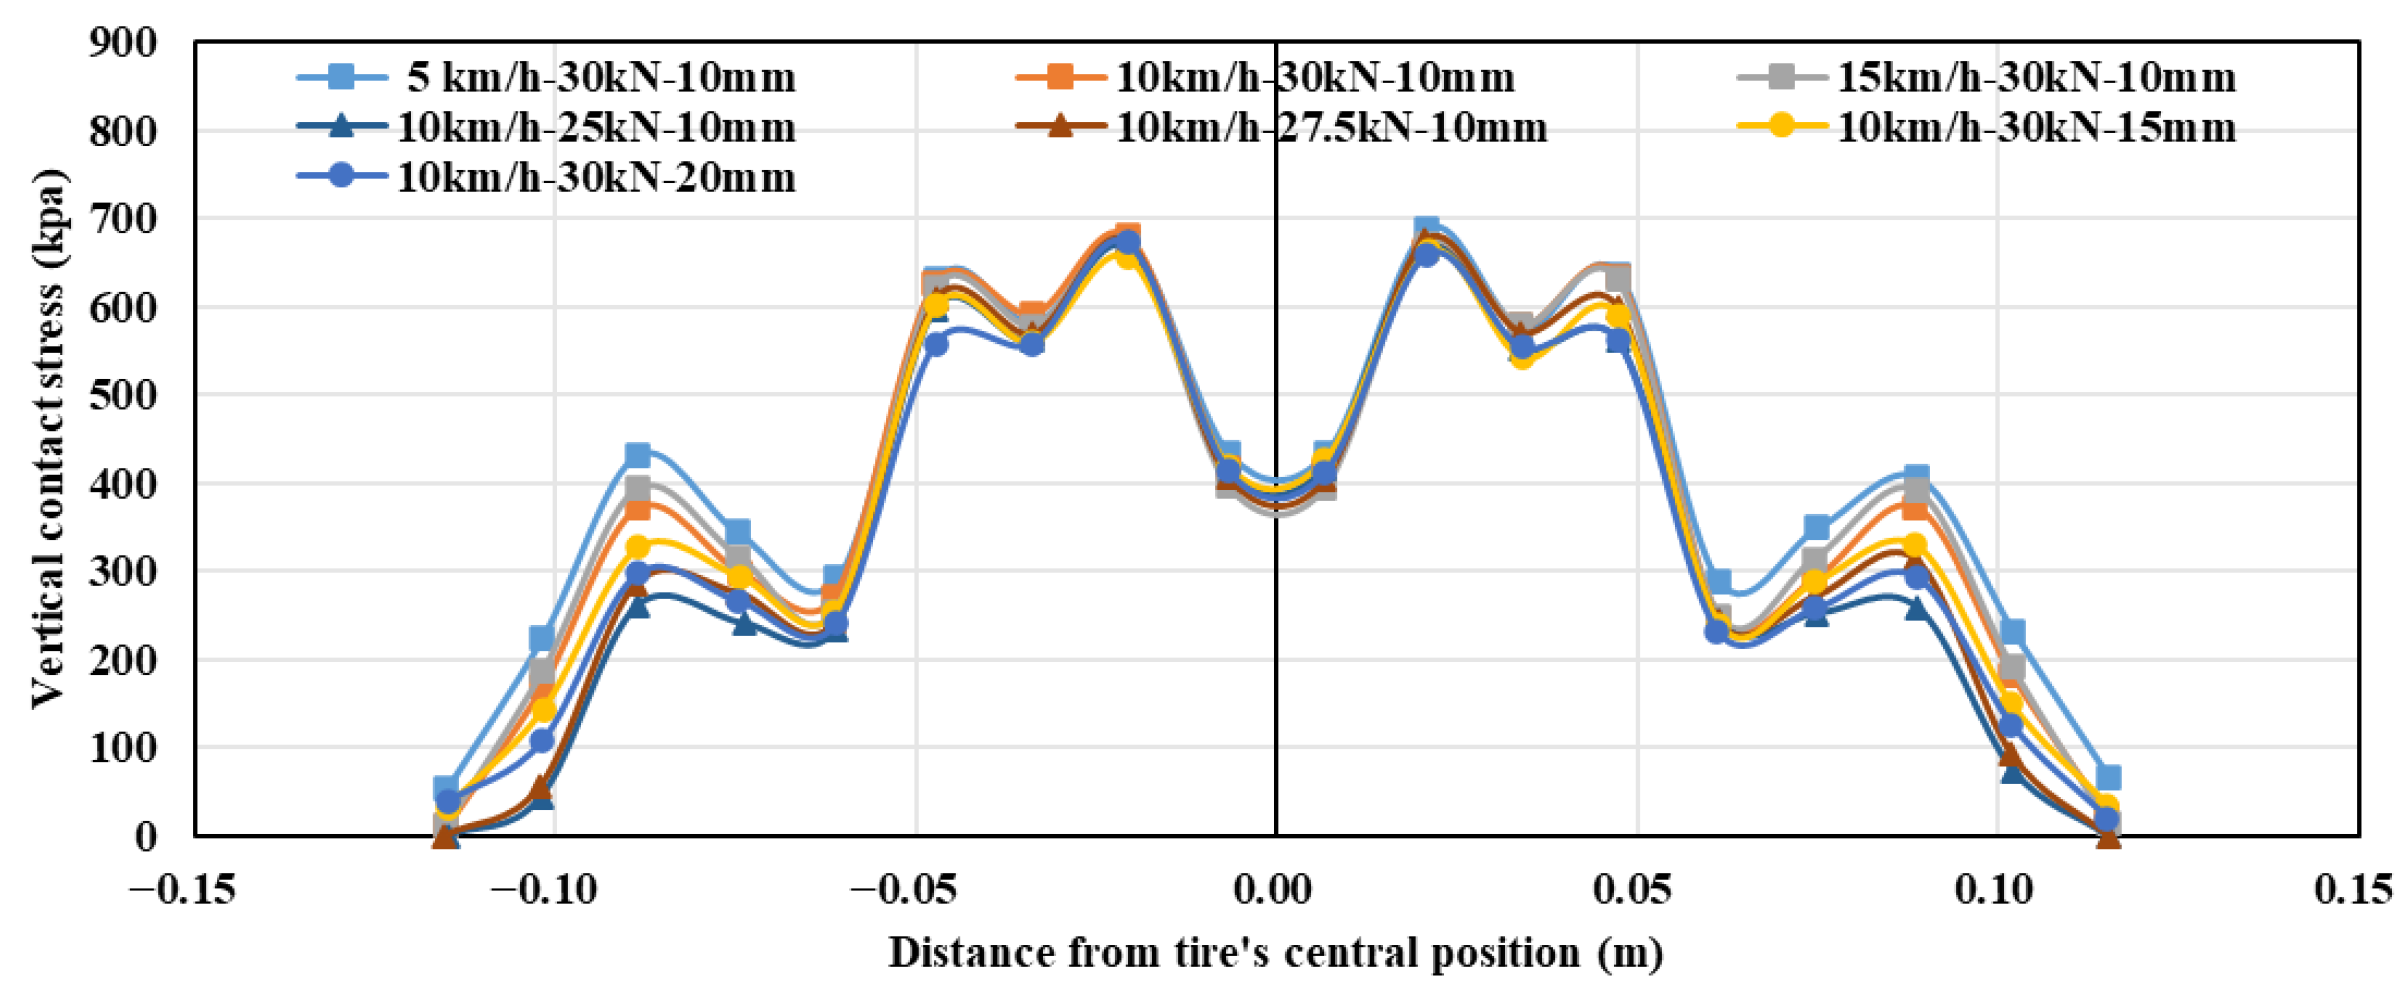
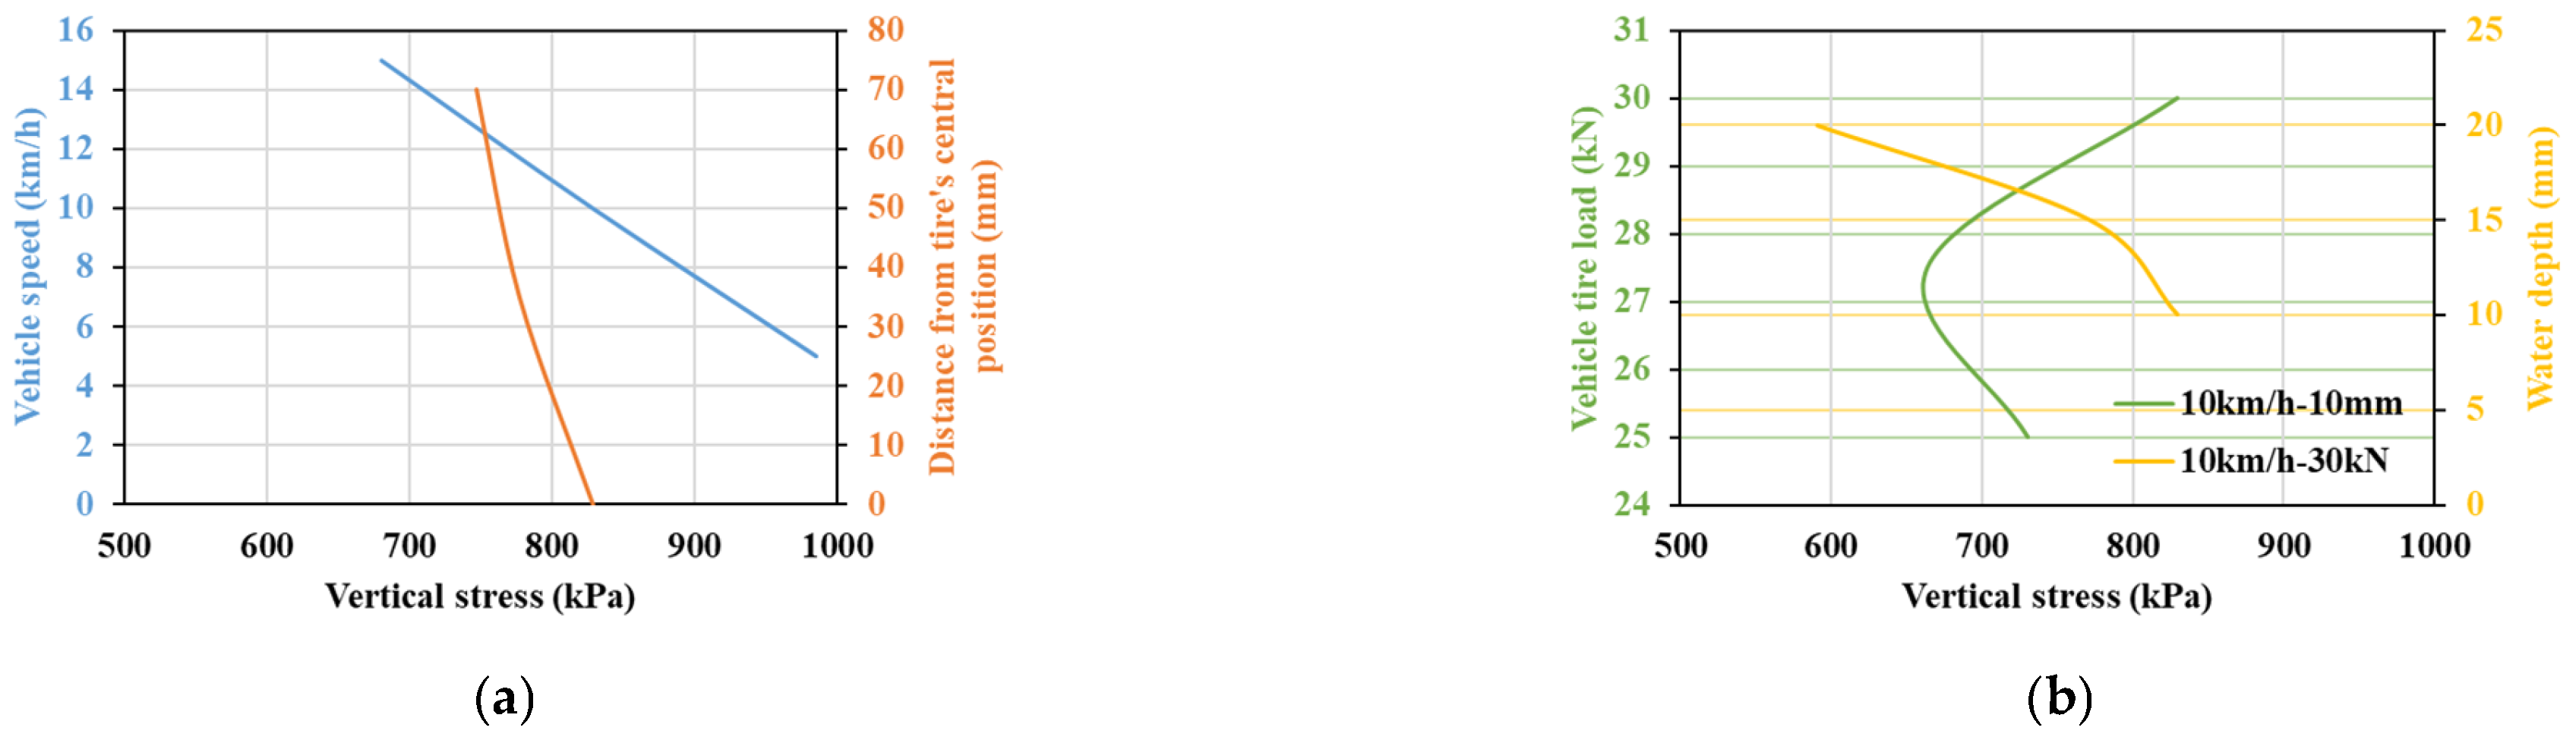
A contour plot of the vertical contact stress distribution of tire–pavement interaction is shown in Figure 16, and a path was defined at the section with the most sufficient contact. Then, vertical stress within the most sufficient contact of tire–pavement interaction was further calculated. Taking the tire’s central contact region as the origin point, the distribution curve of vertical stress along the transverse direction was determined. Since the vehicle tire moved on pavement in a dynamic rolling state, 3–5 frames of the numerical simulation results were selected to compute the lateral distribution separately, and then the average was taken, as shown in Figure 17. Data on vertical stress indicators in field experiments were extracted, and their relationships with variable parameters were established, as presented in Figure 18. The 10 km/h-30 kN-10 mm was set as the standard condition, and controlled variable analysis was conducted by individually varying each parameter.
Figure 16.
Vertical contact stress distribution and path selection of tire–pavement interaction.
Figure 17.
Transverse distributions of contact vertical stress with variable parameters of vehicle speed, tire load, and water depth in numerical simulation.
Figure 18.
Variation in contact vertical stress with variable parameters in field tests: (a) Speed (30 kN-10 mm); (b) Tire load (10 km/h-10 mm) and water depth (10 km/h-30 kN).
Figure 16 showed that the numerical values of vertical stress in tire–pavement contact region were around 0.7 MPa. The field-monitored values of vertical stress were within the range of 0.5 MPa to 1 MPa. It indicated that both field experimental and numerical simulation results were of the same order of magnitude with relatively minor differences. As vehicle speed increased, both numerically calculated values and field-monitored signal values of vertical stress at the tire’s central position exhibited the same decreasing trend by comparing Figure 17 and Figure 18a. Their transverse distributions along the tire cross-section both showed a decreasing trend from the tire center toward the outer side. These findings suggested that the results of numerical simulation aligned well with the actual field observations. As the vehicle tire load decreased, numerically analyzed vertical stress at the vehicle tire’s central position in Figure 17 changed only slightly and remained around 0.7 MPa, while the reduction mainly occurred in the regions near tire edges. The trend shown by field experimental vertical stress data in Figure 18b was also not pronounced, with values ranging from 0.5 MPa to 1 MPa. Overall, the tire-pavement contact area gradually shrank as the vehicle tire load decreased, which led to the reduction in vertical stress at the tire’s side region and an overall decrease in the total pavement supporting force. As water depth increased, numerically analyzed vertical stress in the tire’s central region in Figure 17 changed only slightly, while the stress exhibited a clear decreasing trend from the center toward both sides. This trend aligned with field-measured data in Figure 18b, and the magnitudes were consistent.
Based on the quantitative analysis above, it could be concluded that the tire-water-pavement coupling numerical model developed in this study was valid and effectively captured the hydraulic-mechanic characteristics of tire–water–pavement coupling interactions and their evolution with varying parameters. Therefore, the valid numerical model could be further employed to predict critical conditions for vehicle tire hydroplaning.
4.4. Prediction of Vehicle Tire Hydroplaning
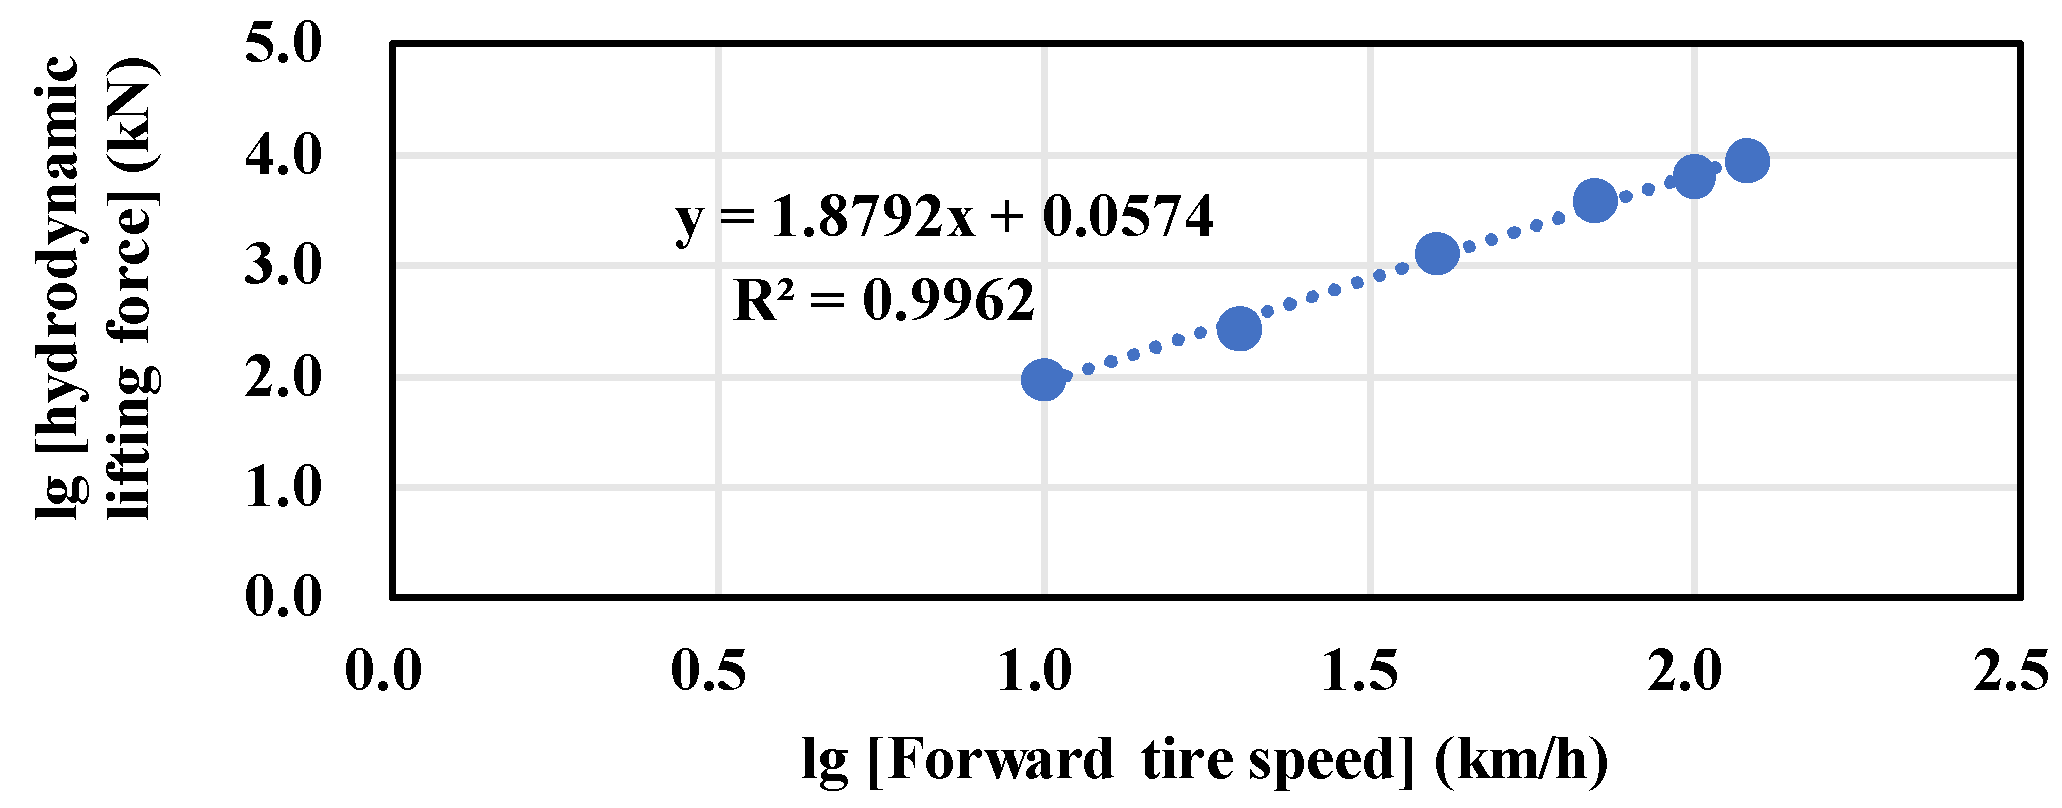
Critical vehicle speed of tire hydroplaning was predicted based on the numerical model in this study. The pavement supporting force, which gradually decreased as vehicle speed increased, equaled the difference between the vehicle tire load and hydrodynamic lifting force. Therefore, the hydrodynamic lifting force could, thus, be determined. Controlling 30 kN vehicle tire load and 10 mm water depth, structural dynamic responses of tire-water-pavement coupling interactions were numerically analyzed as the tire passed the water-covered pavement at 5 km/h, 10 km/h, and 15 km/h. The relationship between the hydrodynamic lifting force F and vehicle speed v in the logarithmic coordinate system is shown in Figure 19. An obvious linear relationship between hydrodynamic lifting force F and vehicle speed v was observed, and a speed-dependent predictive model was obtained, as expressed in Equation (2). It was generally acknowledged that the hydrodynamic lifting force was linearly proportional to the square of vehicle speed, and this relationship was basically consistent with the derived formula obtained in this study. It was predicted that when the hydrodynamic lifting force equaled the vehicle tire load of 30,000 N, the critical vehicle speed of tire hydroplaning was 224.86 km/h.
Figure 19.
Relationship between water-induced hydrodynamic lifting force and vehicle speed in a logarithmic coordinate system.
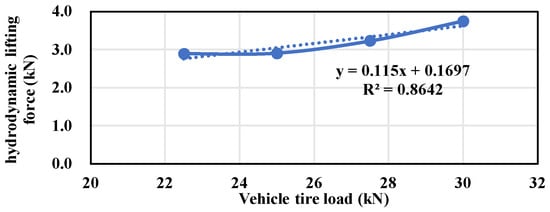
The relationship between vehicle tire load and hydroplaning was further predicted. Previous analysis indicated that changes in vehicle tire load had little effect on tire hydroplaning at a relatively low vehicle speed, while a clear trend emerged when the vehicle speed reached 70 km/h. Therefore, the discussion primarily focused on the 70 km/h condition. Controlling 70 km/h vehicle speed and 10 mm water depth, structural dynamic responses of tire-water-pavement coupling interactions were numerically analyzed as the vehicle tire passed the water-covered pavement at vehicle tire loads of 25 kN, 27.5 kN, and 30 kN. The relationship between the hydrodynamic lifting force F and vehicle tire load L was simplified to a linear relationship, as shown in Figure 20. By dividing both sides of the relationship equation by tire load L, the F/L was obtained, which represented the proportion of hydrodynamic lifting force F relative to vehicle tire load L. The relationship between F/L and L was given by Equation (3). It could be predicted that the proportion of hydrodynamic lifting force gradually decreased as tire load increased, and the proportion F/L eventually approached 0.115. Thus, it could be concluded that a larger vehicle tire load made the tire less prone to slipping at a relatively high vehicle speed.
Figure 20.
Variation in water-induced hydrodynamic lifting force with vertical tire load (70 km/h).
The relationship between water depth and hydroplaning was predicted. The results of numerical simulation and field tests indicated that the larger the water depth, the smaller the pavement supporting force. But the magnitude of this trend diminished as water depth increased beyond 1 cm. In a practical service environment, pavement drainage facilities were assembled, so it was, thus, rare for water to accumulate on the pavement surface to reach a depth of more than 2 cm. In field tests, hydroplaning would not occur for the heavy-duty vehicle simulator if its speed could even reach 70 km/h. Figure 12b,d showed numerical contour plots of water volume fraction distribution for a 30 kN-70 km/h vehicle tire passed 5 mm and 20 mm water depths, respectively. Figure 15 presented instantaneous states of water splashing during field tests with different water depths. It could be observed that substantial water splash was generated as the tire passed water-covered pavement. The amount of water squeezed and splashed by the tire increased as the water depth increased. After the tire passed the test section, the displaced water on the pavement tended to reaccumulate, which would lead to a temporary, sudden increase in water depth at that location. If a following vehicle passed this position immediately, it might cause the instable risk of hydroplaning. However, if a tandem-axle vehicle drove on water-covered pavement and its front tire squeezed away the accumulated-water, the rear tire might pass the testing position quickly before the water had enough time to fully reaccumulate, thereby avoiding hydroplaning. In summary, there existed a balanced interplay among parameters of water depth, vehicle speed, and vehicle load, while sufficiently deep water could still lead to vehicle tire hydroplaning even at a moderate speed.
4.5. Mechanism and Prevention of Tire Hydroplaning
The contact relationship between the vehicle tire and the pavement surface consisted of two main components: vertical supporting force exerted by pavement on tire, and horizontal friction force generated due to vertical tire–pavement interaction. The key factor determining whether hydroplaning occurred lay in whether the action of water on tire counteracted the forces exerted by pavement on tire, that was the relationship between pavement supporting force and hydrodynamic lifting force. Since the pavement–tire friction force was directly positively correlated with vertical supporting force, a larger pavement supporting force led to a higher friction force, which made the vehicle tire less prone to slipping. Therefore, the mechanism of vehicle tire hydroplaning was typically analyzed from the viewpoint of pavement supporting force.
Hydroplaning primarily occurred when a vehicle tire drove on a water-covered pavement; the tire would impact the retained water, which could not be quickly displaced. This resulted in tire-water contact and generated a hydrodynamic resistance effect due to the retained water’s impact force, which also provided an upward lifting force on the vehicle tire. As vehicle speed increased, the retained water’s impact force on the tire became larger, which led to a larger hydrodynamic lifting force. As vehicle tire load increased, although the tire-water contact area would be added and, thus, might increase the water-induced hydrodynamic lifting force, the pavement supporting force would also be increased and thereby enhanced the friction. Since the increased extent of water-induced hydrodynamic lifting force caused by the larger vehicle tire load did not match the increased extent in the pavement supporting force, the vehicle tire with a larger axle load was less prone to hydroplaning. A deeper water layer accumulated on the pavement surface would increase the longitudinal contact between vehicle tire and water, resulting in larger water impact effect and hydrodynamic lifting force. When water depth was shallow, a thin water film would form on pavement surface. The thin water film was difficult to rupture due to surface tension, which caused the pavement’s supporting force to change significantly with small variations in water depth. As water depth increased, the thin water film became easier to break, and the change in pavement support force with water depth diminished. In summary, the primary cause of hydroplaning was the tire-water contact. Changes in different conditions ultimately altered the extent and magnitude of the tire-water contact. The larger the contact area and force, the greater the water impact force.
Since hydroplaning is fundamentally caused by tire-water interaction, reducing or preventing this contact and minimizing contact area could mitigate the risk of tire slipping.
(1) For drivers, reducing speed in rainy weather was crucial. As shown in Figure 13, when a heavy vehicle with a 30 kN tire load traveled at 70 km/h on water-covered pavement with different water depths, the pavement supporting force decreased rapidly at first and then more slowly as water depth increased. Specifically, the reduction in pavement supporting force reached 5.4% and 12.5% at the water depths of 5 mm and 10 mm, respectively. It indicated that even a thin layer of accumulated water on pavement during light rain could significantly reduce pavement supporting force, which would increase hydroplaning risk. Therefore, it was essential to control driving speed, particularly for vehicles with relatively light loads such as passenger cars, which were more vulnerable to hydroplaning.
(2) For vehicles, optimizing tire tread patterns to enhance drainage capacity and minimize tire-water contact could help mitigate hydroplaning. Increasing vehicle load was also an effective measure to reduce hydroplaning risk.
(3) For asphalt pavements, improving drainage capacity to prevent water accumulation during rainfall was critical. Additionally, optimizing pavement surface texture could facilitate better water displacement when tires pass over. It also served as an important measure to reduce the tire–water interactions for extending the service life of asphalt pavement materials [22].
5. Conclusions
From the perspective of the vehicle tire hydroplaning phenomenon, this study numerically and experimentally investigated tire–water–pavement coupling dynamic responses of asphalt pavement with accumulated surface runoff. Based on the analysis discussed above, the following conclusions could be obtained.
(1) Based on fluid–structure interaction numerical analysis, it was found that both higher vehicle speed, lower vehicle tire load, and deeper water depth all reduced the pavement supporting force on the vehicle tire, which increased the risk of hydroplaning.
(2) Both vertical stress and vertical strain at the tire–pavement contact interface in field tests decreased with increasing vehicle speed and water depth, which were less sensitive to vehicle tire load. Decreasing trends in contact stress and strain were observed from the tire center toward the lateral edges, and the front and rear tires generated differential structural responses.
(3) The numerical model was validated by field tests, which were further applied to predict the critical vehicle speed of tire hydroplaning. The increase in tire load would reduce the proportion of hydrodynamic lifting force, thereby suppressing hydroplaning. A shallow water depth caused significant water film effect, but its adverse impact on contact force gradually diminished as water depth increased.
(4) Hydroplaning mechanism mainly focused on the weakening effect of hydrodynamic lifting force on pavement supporting force. Vehicle speed and water depth were the dominant factors influencing hydroplaning, while tire load played a relatively minor role. Recommendations from the views of drivers, vehicles, and pavements were provided to reduce hydroplaning risk by controlling tire–water contact.
(5) A heavy vehicle that passed 5 mm and 10 mm water depth with a 30 kN tire load and 70 km/h speed would receive 5.4% and 12.5% reduction in pavement supporting force, respectively. This indicated that even a thin layer of water on pavement during light rain could substantially reduce pavement supporting force and cause a hydroplaning risk, and thus vehicle speed control was necessary.
(6) Further attempts can be made in the future to improve the accuracy of hydraulic-mechanical characterization of tire–water–pavement coupling interactions, which include the consideration of texture features on pavement surface and the direct measurements of water depth and dynamic pore water pressure.
Author Contributions
Conceptualization, W.W.; methodology, W.W. and H.R.; software, W.W. and H.R.; resources, W.W.; data curation, W.W. and H.R.; writing—original draft preparation, X.H.; writing—review and editing, W.W. and X.H.; supervision, Y.M. and L.W. All authors have read and agreed to the published version of the manuscript.
Funding
The authors acknowledge the financial support of Fundamental Research Funds for the Central Universities (Project No. FRF-TP-26-086), Beijing Natural Science Foundation (Project No. 8244054), Interdisciplinary Research Project for Young Teachers of USTB (Fundamental Research Funds for the Central Universities) (Project No. FRF-IDRY-23-017), and China Postdoctoral Science Foundation (Project No. 2021M690356).
Institutional Review Board Statement
Not applicable.
Informed Consent Statement
Not applicable.
Data Availability Statement
The original contributions presented in this study are included in the article. Further inquiries can be directed to the corresponding authors.
Conflicts of Interest
Author Hua Rong was employed by the company Wuzhou Engineering Group Corporation Co., Ltd., Beijing, China. The remaining authors declare that the research was conducted in the absence of any commercial or financial relationships that could be construed as a potential conflict of interest.
References
- Feng, X.; Zhu, Z.; Wang, Y.; Zhou, J. Study on simulation technology for passenger-car tire hydroplaning phenomenon. Rubber Sci. Technol. 2017, 15, 19–24. Available online: http://www.rubbertire.cn/gy/xjkj/ch/reader/view_abstract.aspx?file_no=KJ20170804&flag=1 (accessed on 4 January 2026).
- Zhu, X.; Pang, Y.; Yang, J.; Zhao, H. Numerical analysis of hydroplaning behaviour by using a tire–water-film–runway model. Int. J. Pavement Eng. 2020, 21, 122–133. [Google Scholar] [CrossRef] [Scilit]
- Sun, X.; Lu, J.; Wang, X.; Wang, A.; Wang, W. Analysis of hydroplaning characteristics of tires with different tread patterns. Rubber Ind. 2019, 66, 809–813. [Google Scholar] [CrossRef]
- Zhou, H.; Zhen, J.; Bai, J.; Hao, W.; Guo, W.; Hao, Q. Optimization of tire tread pattern based on flow characteristics to improve hydroplaning resistance. Proc. Inst. Mech. Eng. Part D J. Automob. Eng. 2020, 234, 2961–2974. [Google Scholar] [CrossRef] [Scilit]
- Ding, Y.; Wang, H. Computational investigation of hydroplaning risk of wide-base truck tires on roadway. Int. J. Pavement Eng. 2020, 21, 122–133. [Google Scholar] [CrossRef] [Scilit]
- Seta, E.; Nakajima, Y.; Kamegawa, T.; Ogawa, H. Hydroplaning analysis by FEM and FVM: Effect of tire rolling and tire pattern on hydroplaning. Tire Sci. Technol. 2000, 28, 140–156. [Google Scholar] [CrossRef] [Scilit]
- Koishi, M.; Okano, T.; Olovsson, L.; Saito, L.H.; Makino, M. Hydroplaning simulation using Fluid-Structure Interaction in LS-DYNA. In Proceedings of the 3rd European LS-DYNA Users Conference, Paris, France, 18–19 June 2001. [Google Scholar]
- Hermange, C.; Todoroff, V.; Biesse, F.; Le-Chenadec, Y. Experimental investigation of the leading parameters influencing the hydroplaning phenomenon. Veh. Syst. Dyn. 2021, 60, 2375–2392. [Google Scholar] [CrossRef] [Scilit]
- Browne, A.L. Tire deformation during dynamic hydroplaning. Tire Sci. Technol. 1975, 3, 16–28. [Google Scholar] [CrossRef] [Scilit]
- Maleska, M.; Petry, F.; Fehr, D.; Schuhmann, W.; Böhle, M. Longitudinal hydroplaning performance of passenger car tires. Veh. Syst. Dyn. 2021, 59, 415–432. [Google Scholar] [CrossRef] [Scilit]
- Jung, H.C.; Jung, M.D.; Jeong, K.M.; Lee, K.H. Verification of tire hydroplaning phenomenon using coupled FSI simulation by CFD and FEM. Open J. Appl. Sci. 2020, 10, 417–431. [Google Scholar] [CrossRef]
- Horne, W.B.; Dreher, R.C. Phenomena of pneumatic tire hydroplaning. In NASA Technical Note D-2056; National Aeronautics and Space Administration: Washington, DC, USA, 1963. [Google Scholar]
- Dunlap, D.F.; Fancher, P.S., Jr.; Scott, R.E. Pavement skid-resistance requirements. Transp. Res. Rec. 1976, 584, 15–21. [Google Scholar]
- Nazari, A.; Chen, L.; Battaglia, F.; Ferris, J.B.; Flintsch, G.; Taheri, S. Prediction of Hydroplaning Potential Using Fully Coupled Finite Element-Computational Fluid Dynamics Tire Models. J. Fluids Eng. 2020, 142, 101202. [Google Scholar] [CrossRef] [Scilit]
- Lu, B. FEM Simulation Analysis of Tire Braking Distance on Dry Pavement; South China University of Technology: Guangzhou, China, 2011. [Google Scholar]
- Wang, Y.J. Finite Element Analysis of Tire Rolling Resistance Based on ADINA; Qingdao University of Science and Technology: Qingdao, China, 2015. [Google Scholar]
- Deng, T.; Wang, S.; Cheng, D.; Zheng, L.; Ren, L. Effects of Driving Conditions on Tire Hydroplaning Performance. Lubricants 2025, 13, 76. [Google Scholar] [CrossRef] [Scilit]
- Hua, C.; Wen, H.; Xian, W.; Ming, J.; Zhi, H. Measurement of the Mie–Grüneisen equation of state for polyimide. Chin. Sci. Bull. 2013, 58, 585–588. [Google Scholar] [CrossRef] [Scilit]
- Special Regional Environmental Structural Material Test Equipment [EB/OL]. Available online: https://ncms.ustb.edu.cn/kxzz/lmgcykxsyz/32649293fa804f31960eee8ad99bdfa4.htm (accessed on 4 January 2026).
- Wang, W.; Zhao, K.; Li, J.; Luo, R.; Wang, L. Characterization of dynamic response of asphalt pavement in dry and saturated conditions using the full-scale accelerated loading test. Constr. Build. Mater. 2021, 312, 125355. [Google Scholar] [CrossRef] [Scilit]
- Wang, W.; Yan, G.; Zhao, K.; Wang, L. Numerical simulation and experimental measurements of dynamic responses of asphalt pavement in dry and saturated conditions under full-scale accelerated loading. Appl. Sci. 2022, 12, 12291. [Google Scholar] [CrossRef] [Scilit]
- Wang, W.; Wang, L.; Xiong, H.; Luo, R. A review and perspective for research on moisture damage in asphalt pavement induced by dynamic pore water pressure. Constr. Build. Mater. 2019, 204, 631–642. [Google Scholar] [CrossRef] [Scilit]


Disclaimer/Publisher’s Note: The statements, opinions and data contained in all publications are solely those of the individual author(s) and contributor(s) and not of MDPI and/or the editor(s). MDPI and/or the editor(s) disclaim responsibility for any injury to people or property resulting from any ideas, methods, instructions or products referred to in the content. |
© 2026 by the authors. Licensee MDPI, Basel, Switzerland. This article is an open access article distributed under the terms and conditions of the Creative Commons Attribution (CC BY) license.