


Abstract
As critical infrastructures, long, large-diameter shield tunnels require a reliable long-term seismic safety assessment. This study investigates the coupled effects of spatially non-uniform ground motions and bolt corrosion on the seismic response of long, large-diameter shield tunnels. Three types of non-uniform seismic waves (coherent, traveling, and coherent traveling) consistent with the design spectrum were generated, and a 3D discontinuous finite element model was used to analyze tunnel response under various corrosion locations and rates. Results show that non-uniform excitation significantly amplifies the seismic response in the order coherent traveling waves > traveling waves > coherent waves > uniform waves, with coherent traveling waves amplifying key seismic responses by up to 10 times compared with uniform excitation. Corrosion at circumferential joints causes more substantial responses than at longitudinal joints, and combined longitudinal corrosion shows a greater effect than single-joint corrosion. Under coherent traveling waves with high corrosion rates, the seismic response exhibits a distinct “top stronger than bottom” distribution. This study concludes that accurate seismic performance evaluation requires consideration of both variability in spatial ground motion and bolt corrosion, thereby supporting the seismic design and long-term maintenance of such structures.
1. Introduction
The development and operation of long-distance underground transportation networks, including intercity railways and metro systems, have advanced considerably in recent years. Shield tunneling, favored for its construction efficiency and reduced environmental impact, is now widely adopted in these projects. As critical infrastructure with a long service life, shield tunnels are inevitably subject to material degradation, notably corrosion in joint bolts [1,2,3]. Furthermore, the coherent and traveling wave effects during seismic wave propagation and incidence [4,5] may lead to significant spatial variations in seismic motion. This spatial variability in seismic excitation can markedly amplify structural dynamic responses, thereby challenging the tunnel’s overall seismic safety. Consequently, studying the seismic performance of long shield tunnels under the coupled action of non-uniform ground motion and bolt corrosion is essential for ensuring their long-term operational safety.
Field investigations have identified water leakage as a primary defect in tunnels, frequently occurring at bolt holes and segment joints. This leakage contributes to time-dependent corrosion of the connecting bolts, characterized by significant spatial randomness [6,7]. As critical connectors between segments, bolts directly affect the load-bearing capacity of the tunnel through their mechanical performance. Liu et al. [8] examined the structural risks in operational urban metro shield tunnels, highlighting how corrosion amplifies segment joint displacement and plastic deformation, and elucidating the spatially variable pattern. Using a refined 3D finite element model, Yin et al. [3] demonstrated that increased bolt corrosion leads to greater tunnel convergence, higher stress levels, and larger longitudinal joint opening. Zhang et al. [9] assessed the time-dependent reliability of shield tunnels based on the corrosion state of reinforcement and bolts, quantifying the associated increase in failure probability. Nevertheless, current research has predominantly addressed the influence of bolt corrosion on static tunnel performance. The coupling mechanism between seismic excitation and bolt corrosion, along with its implications for the dynamic seismic response of the tunnel system, requires further in-depth investigation.
As elongated structures with longitudinal dimensions far exceeding the seismic wavelengths, shield tunnels are simultaneously subjected to the combined effects of coherent and traveling waves, as well as site-specific conditions during seismic wave propagation. These factors lead to spatially variable ground motions along the tunnel axis, which critically influence its seismic response [10,11,12]. Regarding the simulation of such non-uniform excitation, Hao et al. [13] proposed a multi-point seismic motion synthesis method based on the trigonometric series expansion, extending from single-point non-stationary synthesis. Qu et al. [14,15] refined a point-by-point synthesis strategy and proposed site-specific power spectrum models. Ding et al. [16] introduced a simulation approach for modeling physical amplitude and phase spectra. Lin et al. [17] developed a Fourier-based non-stationary coherence function model that effectively captures both the non-stationarity of the coherence function and site variations. Meanwhile, researchers have extensively studied the influence of non-uniform seismic excitation on structures such as long-span bridges [18,19], above-ground buildings [20,21], and dams [22]. However, existing research predominantly concentrates on continuous models and above-ground structures. Studies concerning shield tunnels—a type of underground discontinuous system assembled from discrete segments—remain scarce. Moreover, there is limited research on generating non-uniform ground motions that comply with the design response spectra specified in the Chinese seismic design code, and even fewer that couple such motions with bolt corrosion defects.
Currently, systematic investigations into the impact of bolt corrosion on the seismic response of shield tunnels remain scarce. In the seismic performance assessment of long, large-diameter tunnels, the coupled effects between spatially non-uniform ground motions and localized corrosion damage are frequently underestimated. Existing studies on simulating non-uniform ground motions frequently rely on traditional models, which cannot accurately match the design response spectrum specified in the current Chinese seismic design code. Moreover, most numerical models simplify the tunnel lining as a homogeneous continuum, failing to realistically represent the discrete contact behavior among lining segments, connecting bolts, and the surrounding rock. This simplification introduces deviations in predictions of key performance metrics, such as segment joint opening and bolt stress. Furthermore, due to varying soil conditions and the spatial characteristics of seismic excitation, distinct sections within a long shield tunnel exhibit markedly different seismic responses. The rapid expansion of underground transportation networks presents urgent scientific challenges. Therefore, it’s necessary to develop methods for synthesizing non-uniform seismic motions that align with the code response spectrum and account for the time-dependent effects of bolt corrosion, followed by a thorough analysis of the seismic response of long shield tunnels under such coupled conditions.
To address these research gaps, this study adopts a long, large-diameter shield tunnel of an intercity railway as an engineering case. The dynamic response of the tunnel under the coupled effects of spatially non-uniform seismic excitation and bolt corrosion is systematically investigated. Based on power spectral density, coherence, and envelope functions, a magnitude-iteration algorithm is employed to synthesize non-uniform ground-motion time histories compatible with the response spectrum specified in the Chinese seismic design code. A three-dimensional discontinuous finite element model capable of accurately simulating the interactions among lining segments, connecting bolts, and the surrounding rock is established in ANSYS 16.0. Multiple coupled scenarios that consider corrosion location, corrosion rate, and spatial seismic motions are analyzed. By comparing tunnel responses under uniform and non-uniform excitations, this study elucidates the influence of bolt corrosion on key indicators, including segment contact behavior and bolt stress. The results provide a theoretical foundation and practical guidance for the seismic design and safety assessment of similar long, large-diameter shield tunnels.
2. Theory of Bolt Corrosion and Spatially Non-Uniform Ground Motion
2.1. Time-Dependent Effects of Bolt Corrosion
In complex hydrogeological environments, groundwater infiltrating segment joints and bolt holes carries corrosive agents, such as chloride ions, which can induce corrosion in the connecting bolts. To characterize the time-dependent progression of bolt corrosion, this study adopts empirical data from inspection results of tunnel segment joint bolts reported by Yuan et al. [23].
The simplified formula for calculating the time-dependent corrosion depth of the bolt is as follows:
where denotes the corrosion depth of the bolt; represents the annual corrosion rate, taken as 0.025 mm/year; stands for the service time of the tunnel; is the corrosion initiation time; and m is the corrosion exponent constant, usually taken as 1.
The cross-sectional area loss rate of the bolt after corrosion can be expressed as:
where refers to the cross-sectional area loss rate; is defined as the initial diameter of the bolt; and indicates the corrosion depth of the bolt.
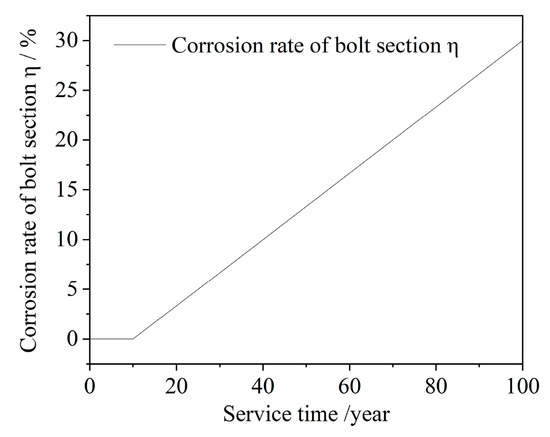
According to Equation (2), corrosion is assumed to initiate after 10 years of tunnel operation. The relationship between the bolt cross-sectional corrosion rate and the service time is illustrated in Figure 1.
Figure 1.
Relationship between and t.
Following corrosion, the bolts’ yield strength degrades progressively [24]. The residual yield strength is expressed as:
where is the residual yield strength of the bolt; represents a strength reduction coefficient (taken as 0.0054); and denotes the initial yield strength of the bolt.
This study considers corrosion rates of 10%, 20%, and 30%, with the corresponding material parameters detailed in Table 1.
Table 1.
Mechanical Parameters of Corroded Bolts.
2.2. Synthesis of Spatially Non-Uniform Ground Motions
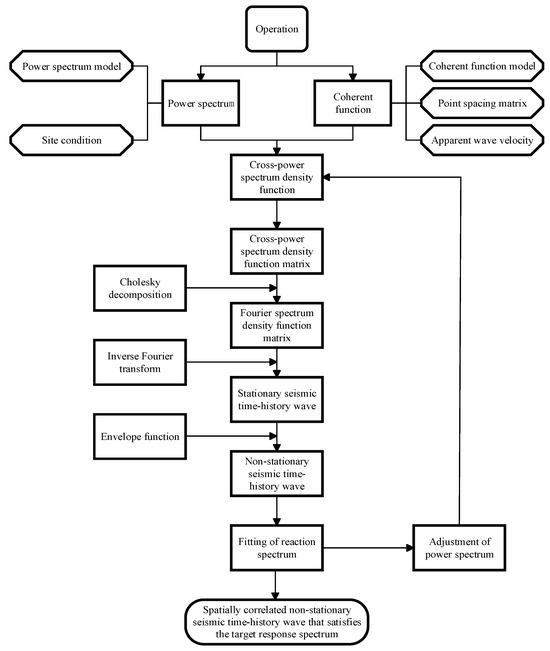
To synthesize spatially non-uniform ground motions at multiple support points, a cross-spectral matrix is first constructed. This matrix integrates the auto-spectral and cross-spectral density functions for all points, defined by a coherency function and a stationary seismic power spectrum [25,26,27]. Applying Cholesky decomposition to this matrix yields the Fourier amplitude spectra for the motions at each point. These spectra are subsequently converted into acceleration time histories using the inverse Fourier transform, incorporating an envelope function to account for non-stationary characteristics. Finally, an amplitude iteration algorithm is iteratively applied to ensure that the response spectra of the synthesized multi-point motions closely align with the target design spectrum [28]. The complete procedure for synthesizing spatially non-uniform ground motions is summarized in Figure 2.
Figure 2.
Flowchart of non-uniform ground motion synthesis.
In this study, it is assumed that the tunnel is situated in a region with a seismic design intensity of Grade 7, corresponding to a peak ground acceleration of 0.10 g. The site is classified as Site Class II within the second design earthquake group, with a characteristic period of 0.40 s. For a 400-m tunnel model, 21 observation points are arranged at 20-m intervals along the tunnel axis, as illustrated in Figure 3.
Figure 3.
Layout of ground motion observation points (unit: m).
Based on the design seismic acceleration response spectrum specified in the Code for Seismic Design of Urban Rail Transit Structures (GB 50909-2014) [29], the corresponding power spectral density function (PSD) is established. The initial PSD is derived from the design response spectrum according to Vanmarcke’s theory in Equation (4):
where denotes the initial power spectral density function; ζ represents the damping ratio (taken as 0.05 in this study); Sa(ω, ζ) refers to the acceleration response spectrum at angular frequency ω with damping ratio ζ; T is the duration of the ground motion; and P is the probability of non-exceedance (taken as 0.85).
An iterative calibration is then performed: in each iteration, the acceleration response spectrum calculated from the current PSD is compared with the target code spectrum, and the PSD is updated to reduce the discrepancy. The iteration converges when the maximum relative error between the two spectra is less than 5%, yielding a PSD that is consistent with the target design response spectrum. This calibrated PSD is then used to construct the power spectral density matrix.
To characterize the spatial variation in earthquake ground motions, this study adopts the coherency function model proposed by Harichandran based on SMART-1 array data [30]. This model quantitatively describes the loss of coherence between spatial ground motions as a function of separation distance and frequency, and is widely used to generate spatially varying seismic excitations.
The modulus of the coherence function is expressed as:
where the frequency-dependent scale function is given by:
where d is the separation distance between two points, and ω represents the circular frequency. The model parameters are fitted from the SMART-1 array data, with specific values listed in Table 2.
Table 2.
Parameters of the Harichandran Coherence Function.
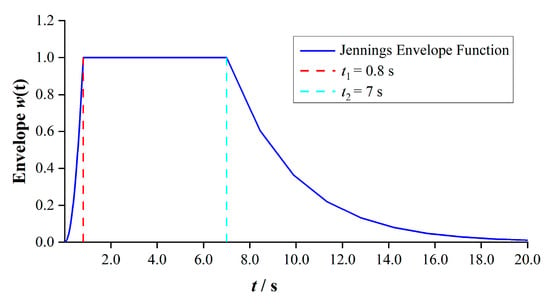
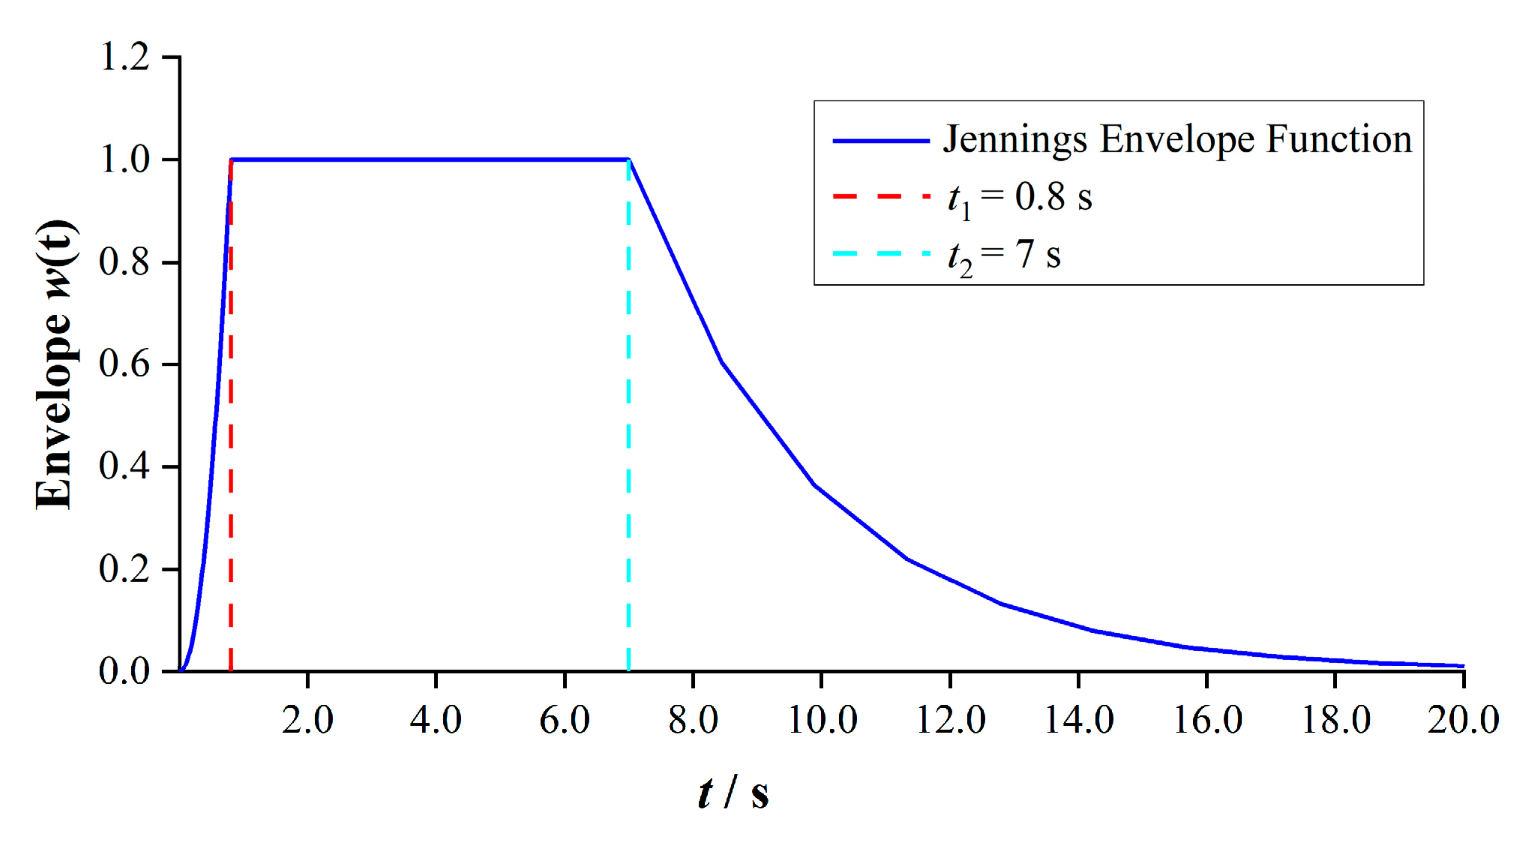
Jennings proposed a three-stage acceleration envelope function based on the three phases of ground motion time histories [31]. The model is given in Equation (7) and Figure 4:
where t1 is the rise time, representing the duration of the initial increase; t2 marks the transition from the stationary phase to the decay phase; and c refers to the decay coefficient, controlling the rate of intensity attenuation. Their recommended values for different site classes are listed in Table 3.
Figure 4.
Jennings envelope function.
Table 3.
Parameters of the Jennings Envelope Function.
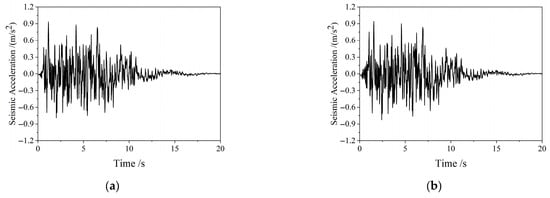
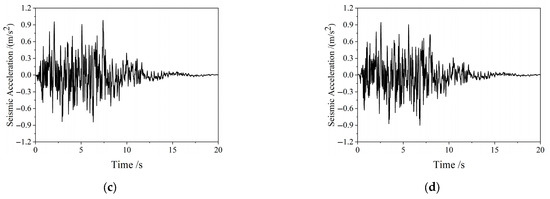
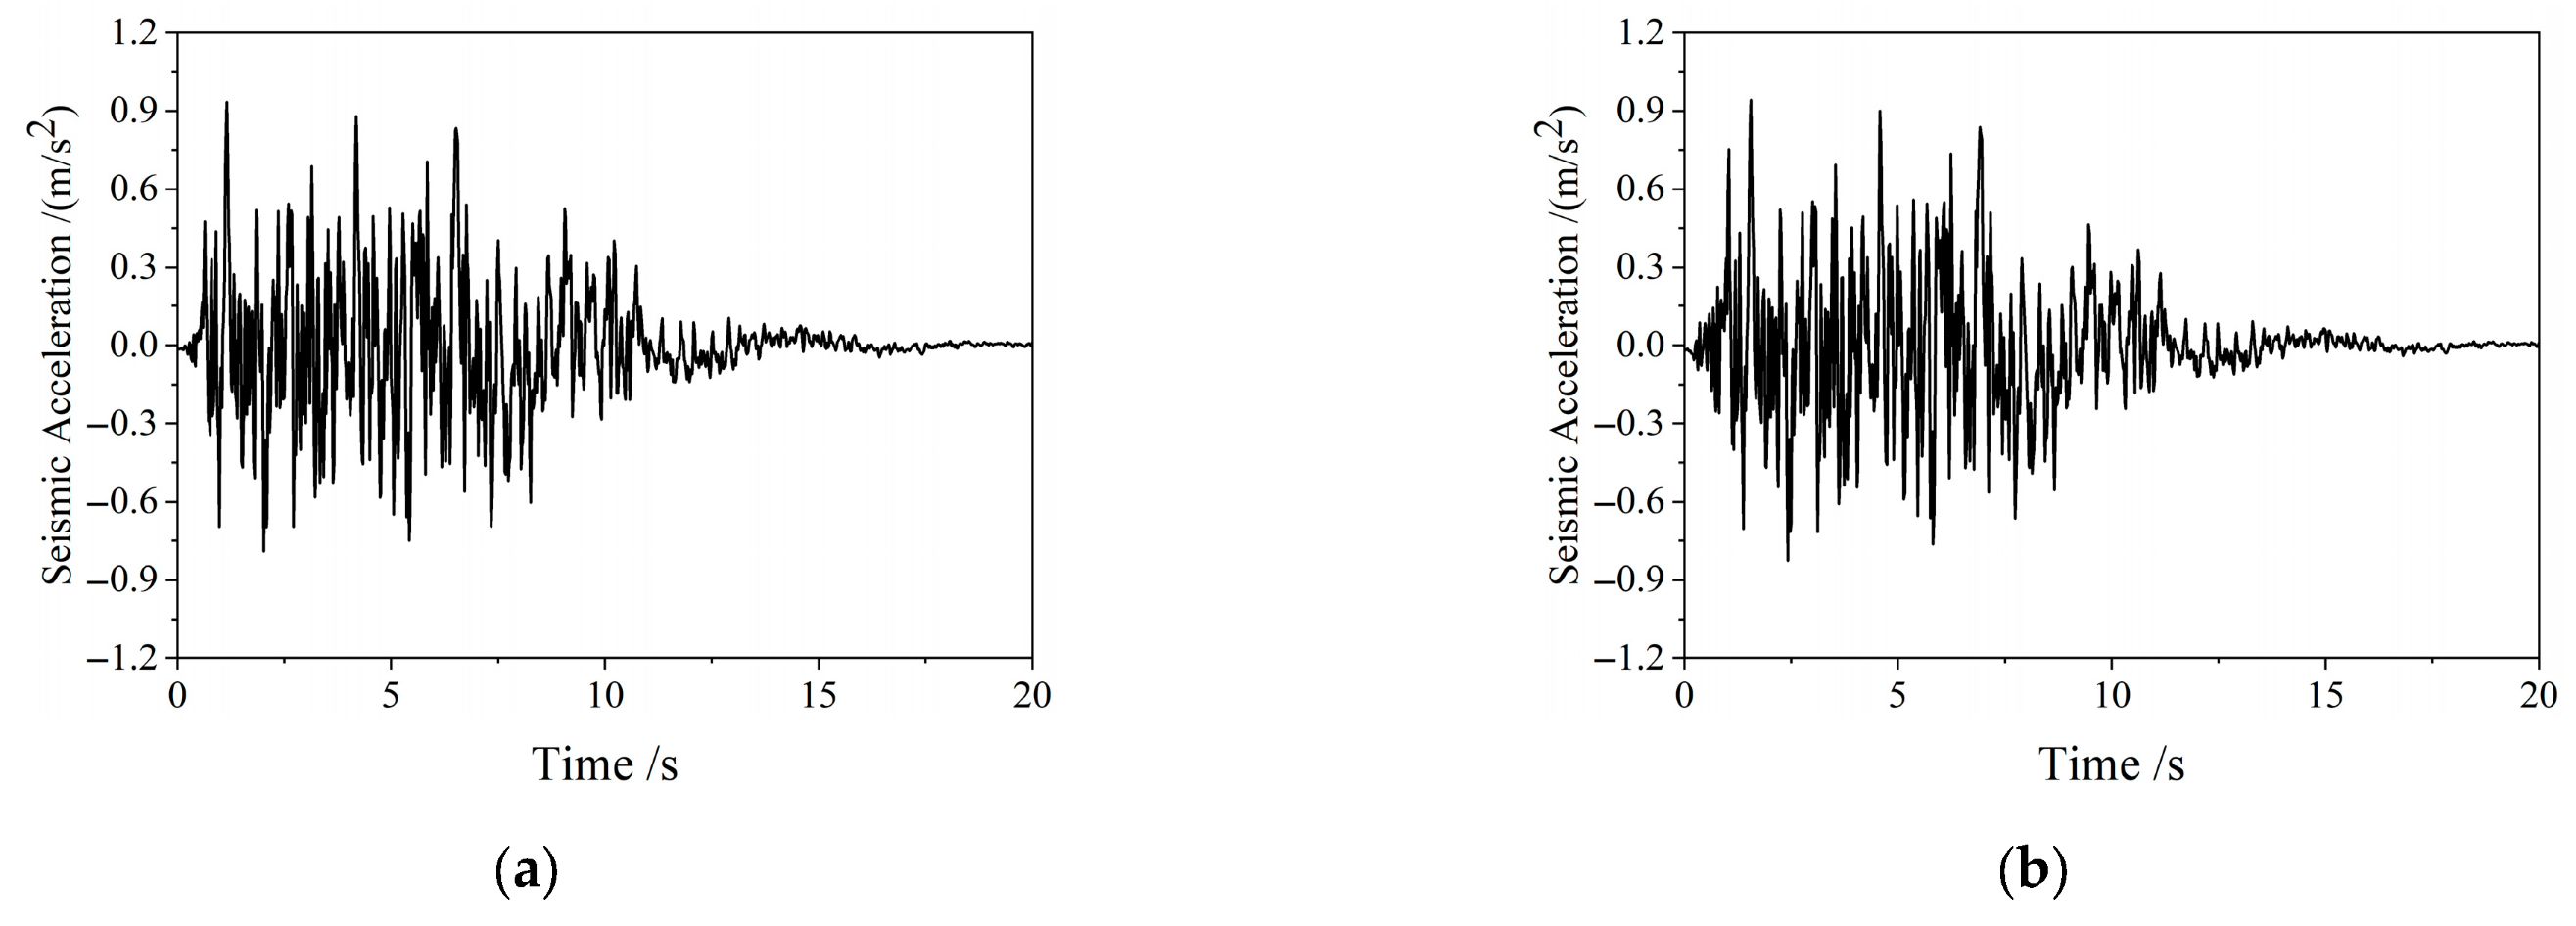
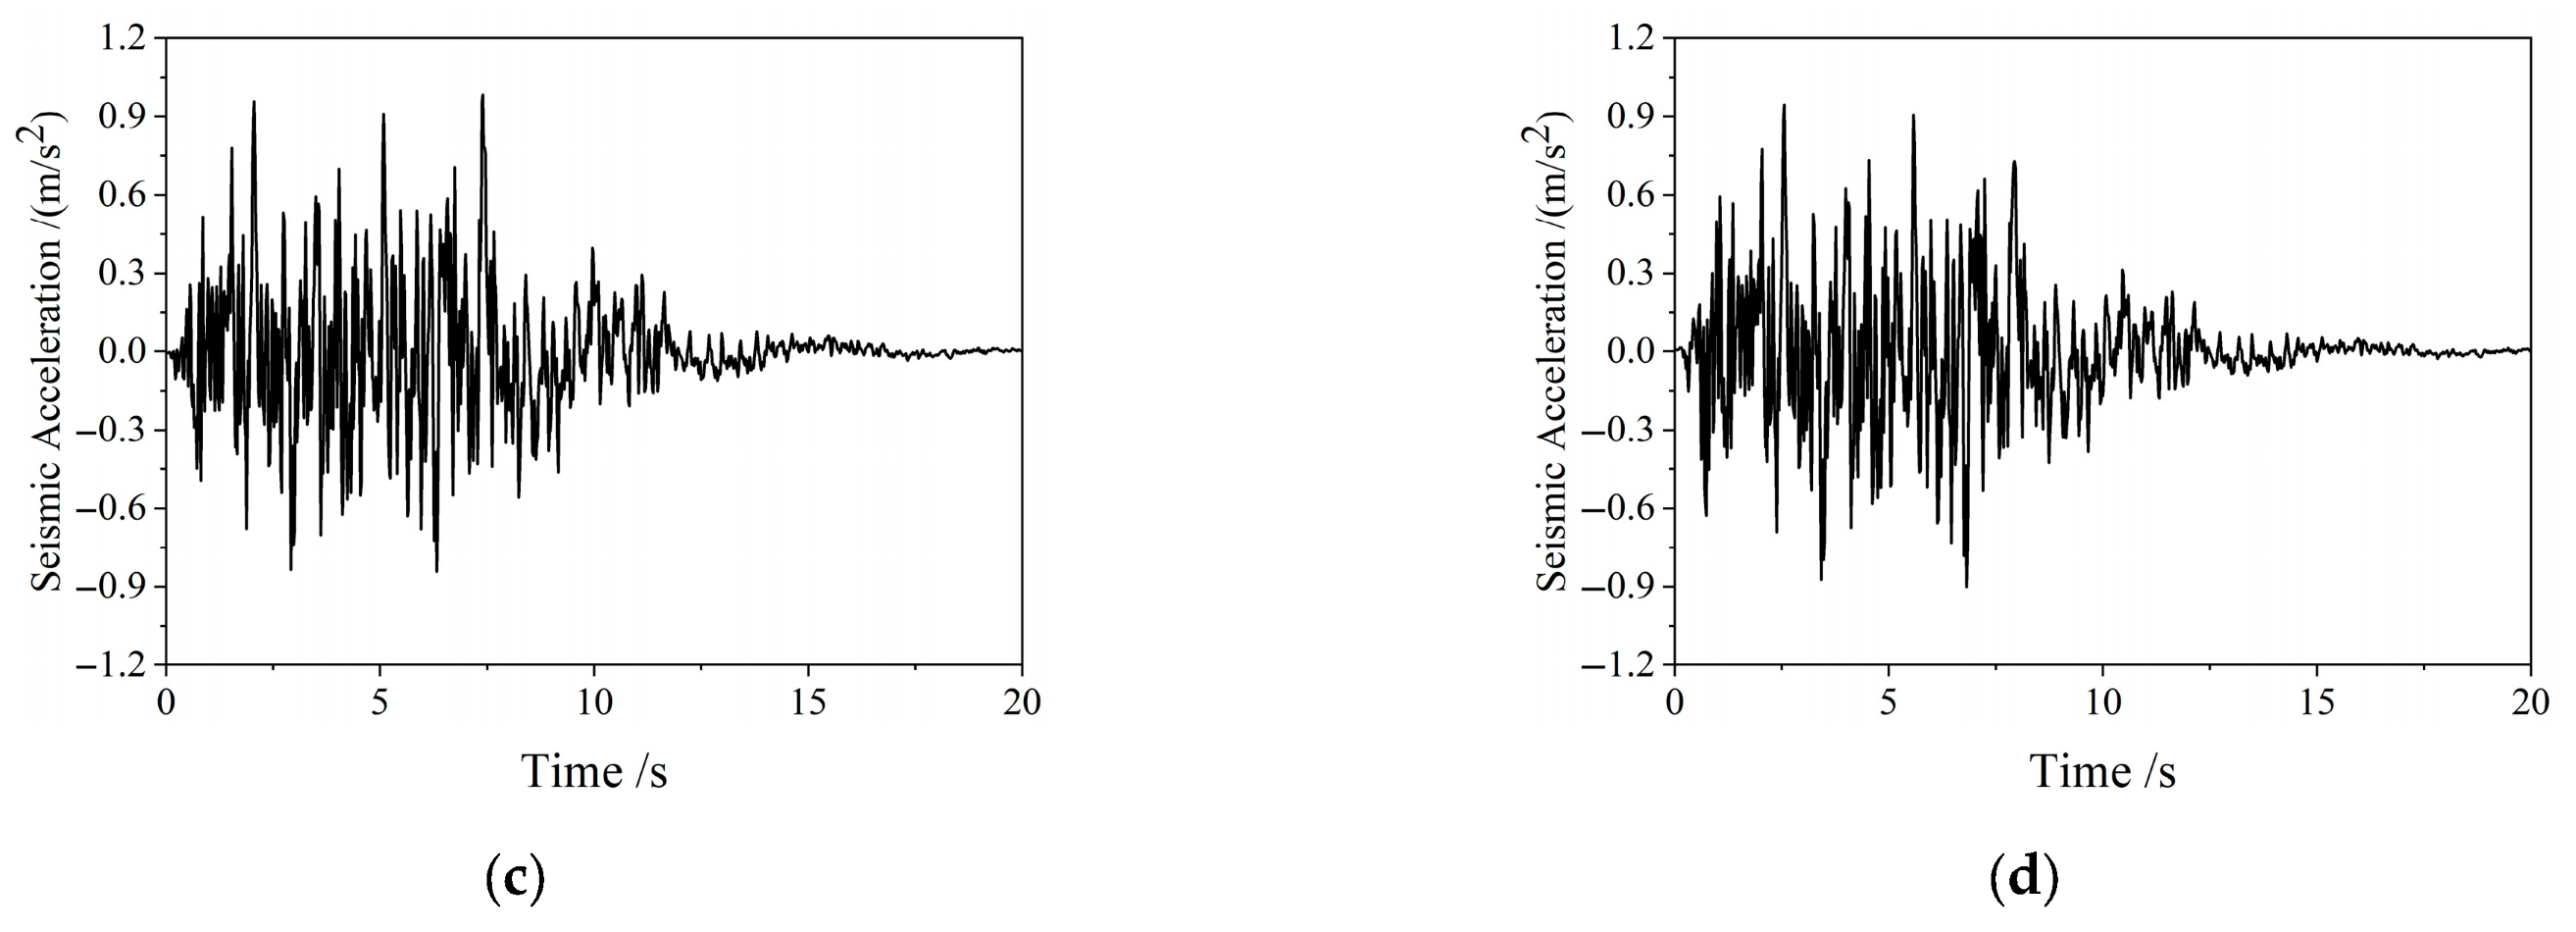
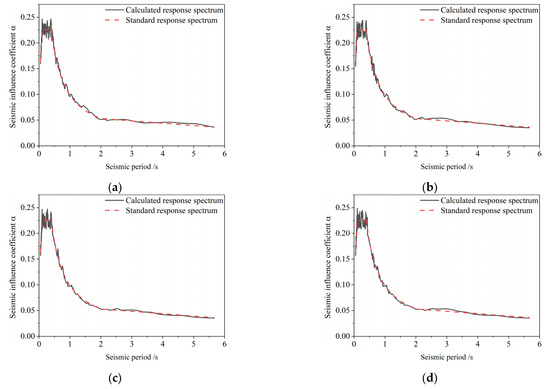
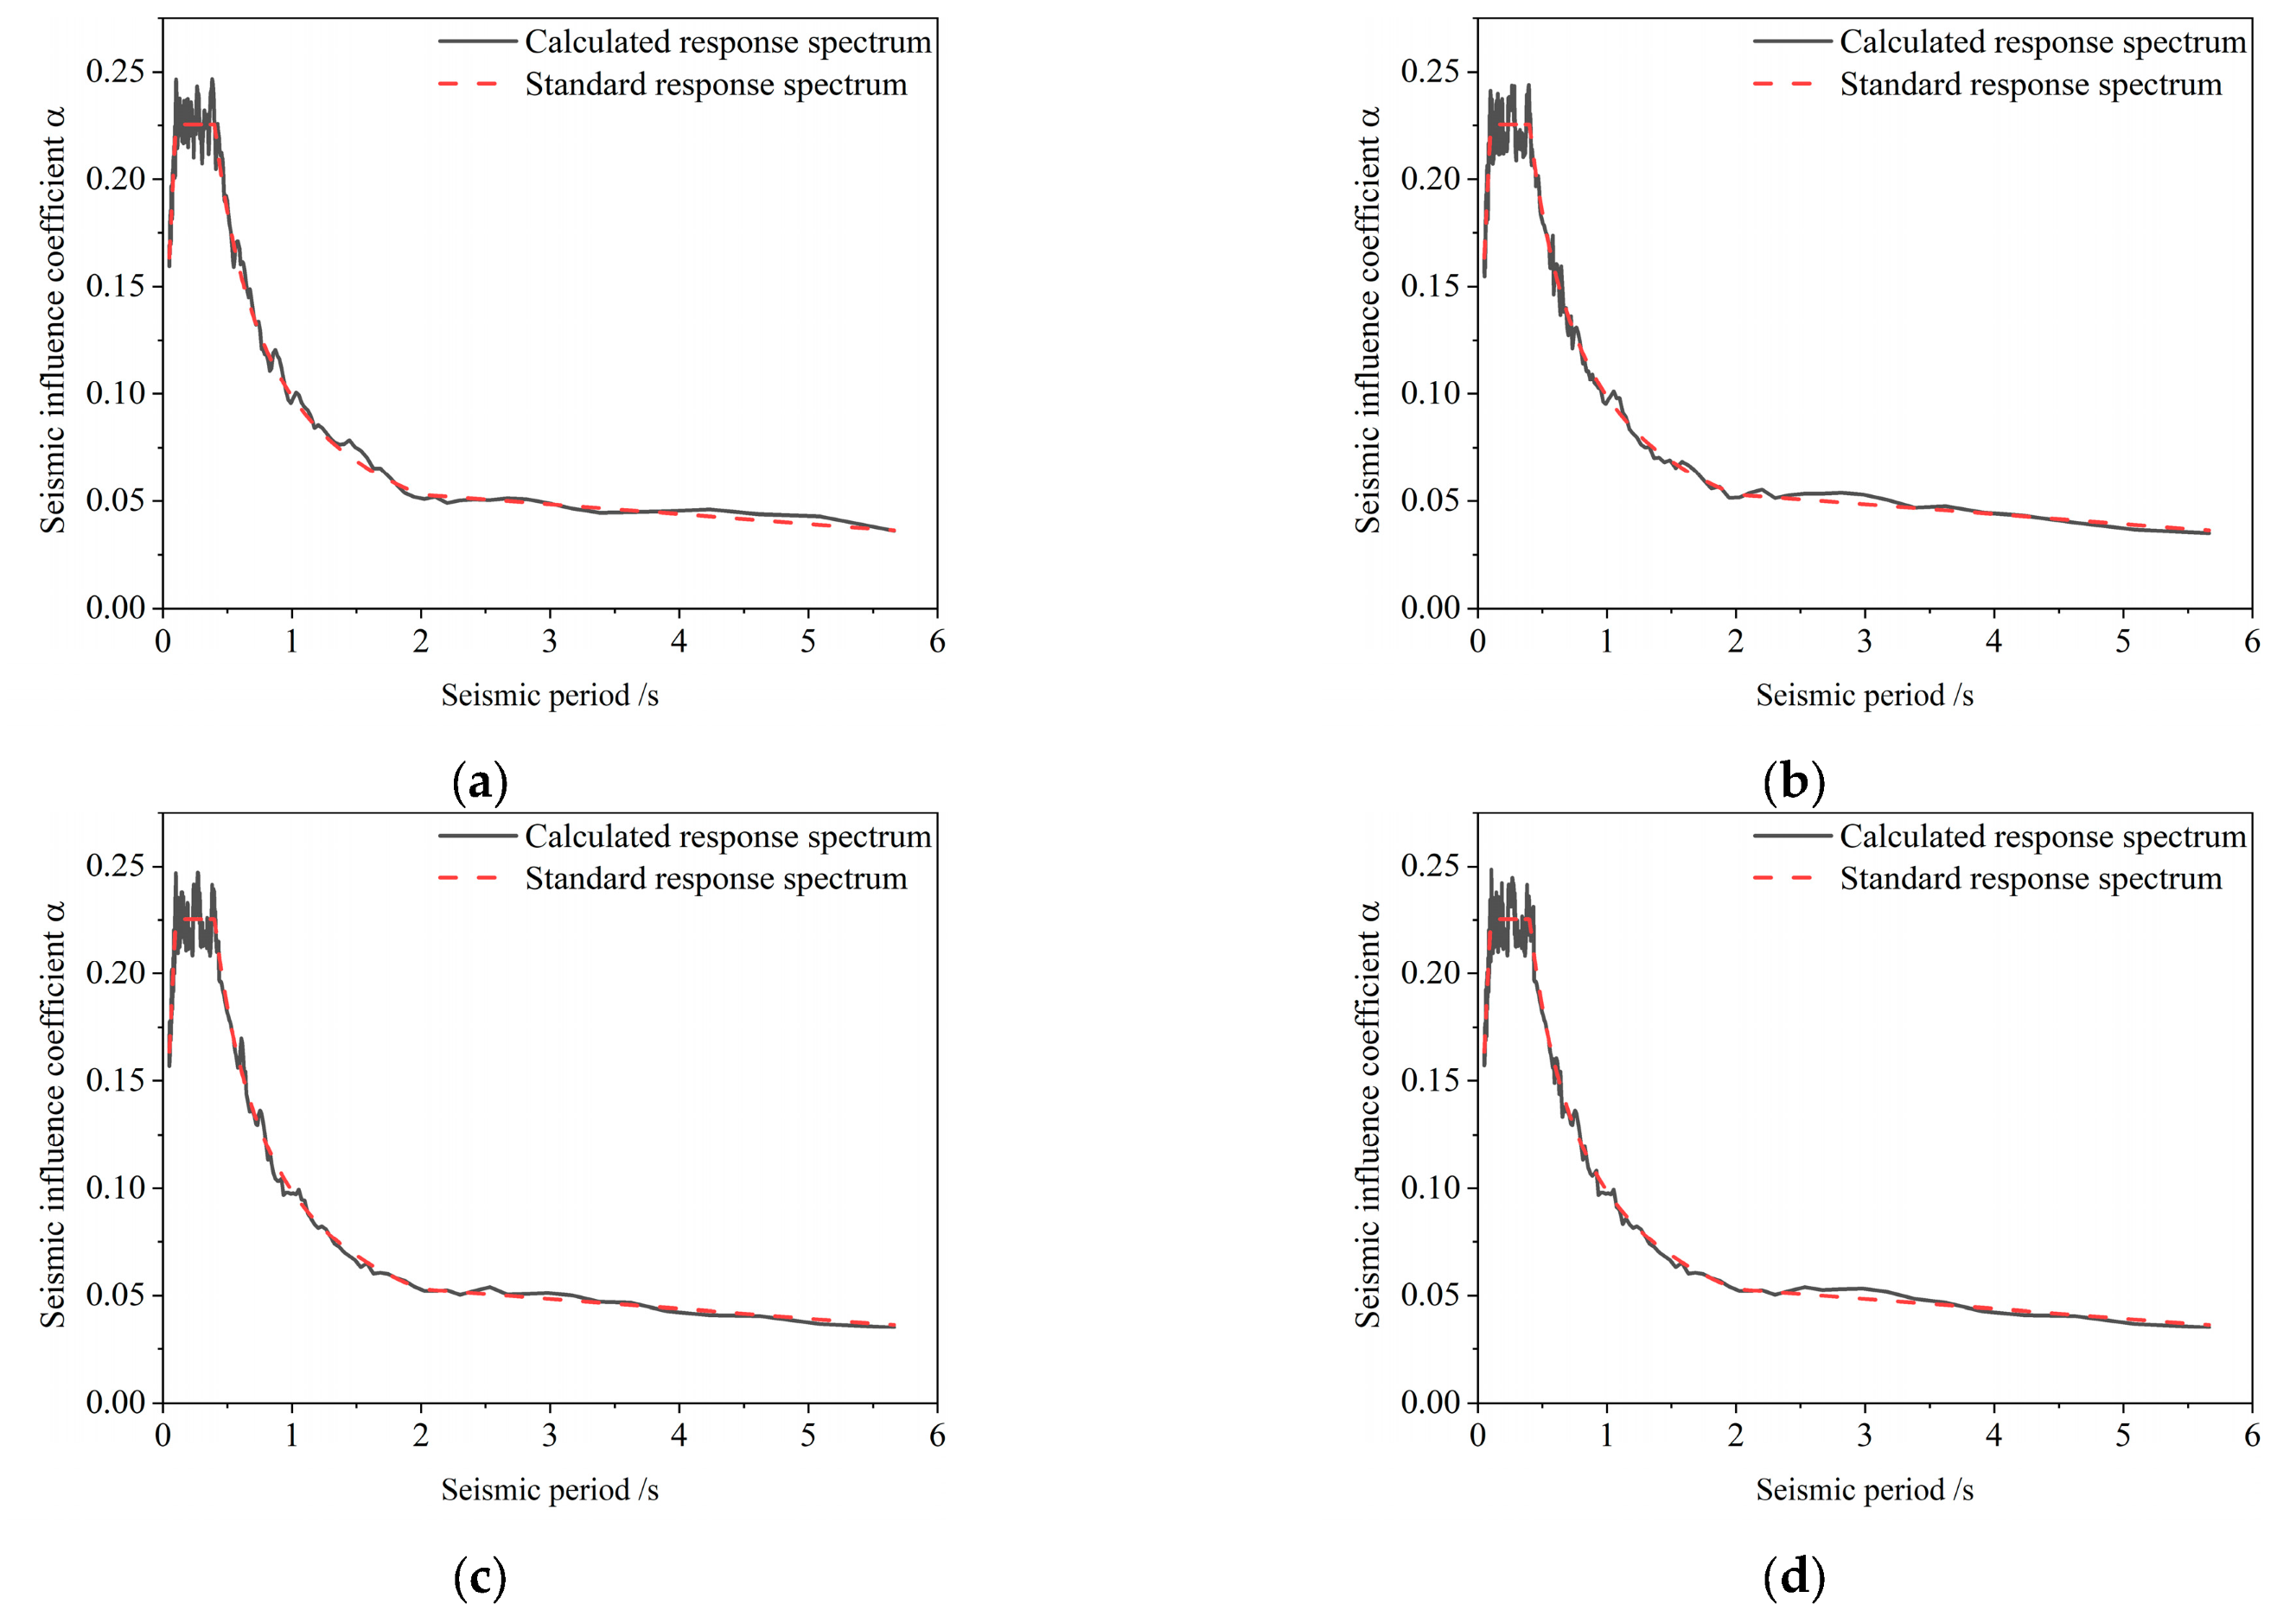
A comprehensive batch-processing program was developed in MATLAB R2022b to generate non-uniform time histories of seismic motion for 20 spatial points. Each wave lasts 20 s and incorporates both coherence and traveling wave effects. To evaluate the accuracy of the synthesized ground motions, four typical observation points—A1, A5, A10, and A15—are selected. The acceleration time histories at these points under coherent traveling wave excitation are presented in Figure 5. A comparison between the calculated response spectra and the design spectrum stipulated in the seismic code is shown in Figure 6. After iterative adjustment, the relative error at each period did not exceed 5%, indicating close agreement between the two spectra. This result verifies that the generated non-uniform ground motion time histories satisfy the requirements of the seismic design code.
Figure 5.
Acceleration time-history of coherent traveling wave. (a) Acceleration time-history at observation point A1. (b) Acceleration time-history at observation point A5. (c) Acceleration time-history at observation point A10. (d) Acceleration time-history at observation point A15.
Figure 6.
Calculated versus design code response spectrum. (a) Response spectrum at observation point A1. (b) Response spectrum at observation point A5. (c) Response spectrum at observation point A10. (d) Response spectrum at observation point A15.
3. Finite Element Modeling
3.1. Finite Element Model
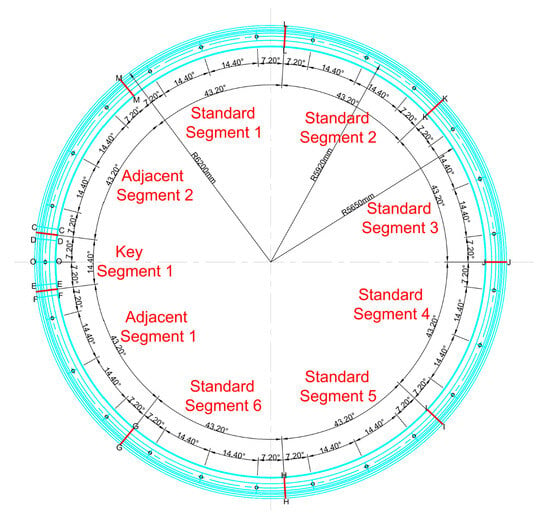
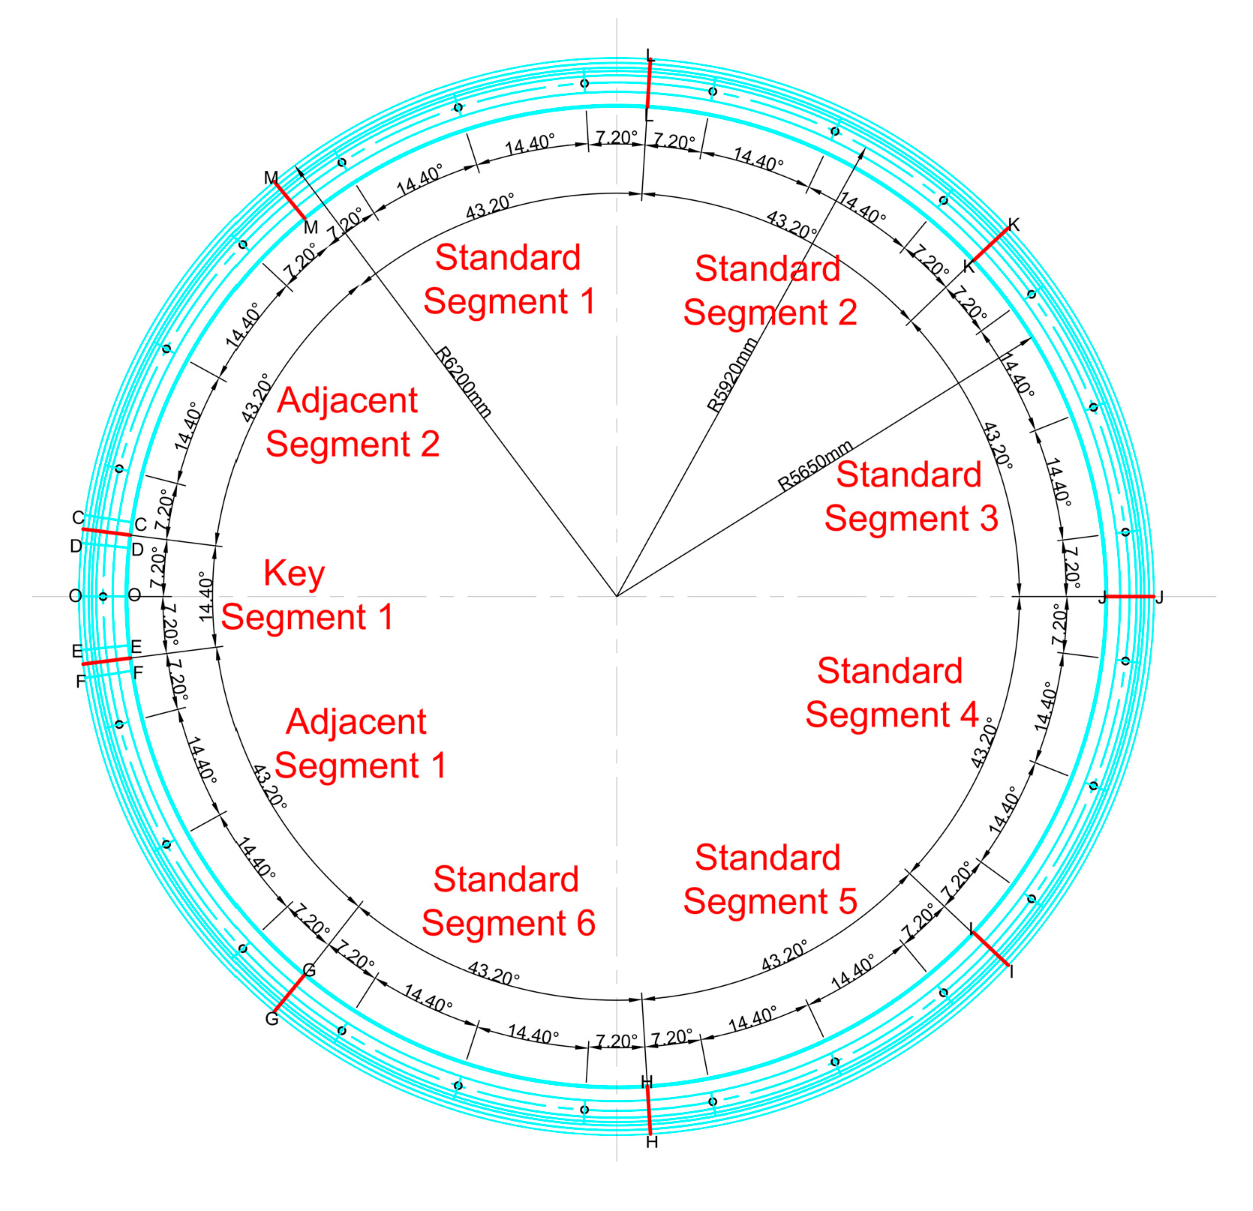
The shield tunnel has a total length of 11.144 km, with an outer diameter of 12.40 m, a lining thickness of 0.55 m, and a segment ring width of 2.0 m, as shown in Figure 7. Each lining ring comprises one key segment, two adjacent segments, and six standard segments. Neighboring segments within the same ring and adjacent lining rings are connected using high-strength bolts.
Figure 7.
Tunnel cross-section.
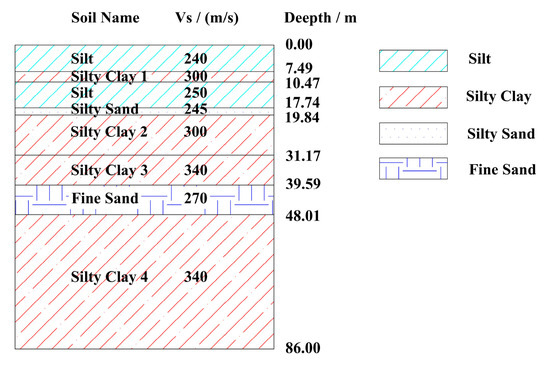
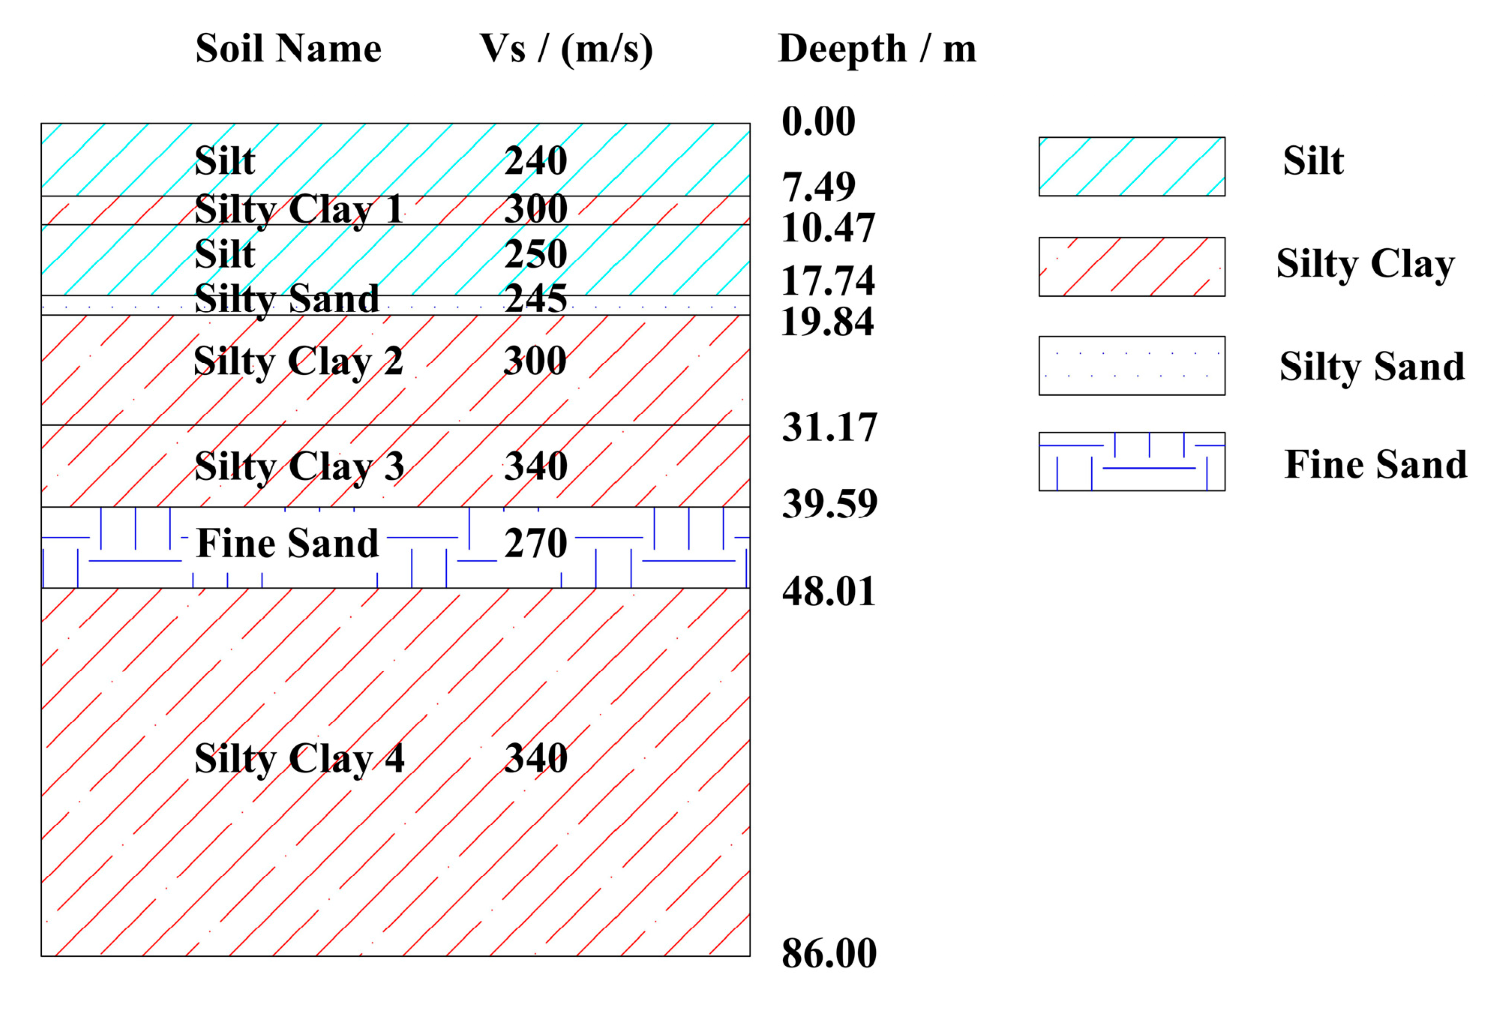
The material parameters of the tunnel lining and high-strength bolts are summarized in Table 4, where the lining adopts C50 concrete and the bolts are Grade 8.8 M36 high-strength steel. Table 5 lists the physical and mechanical parameters of the surrounding rock, all of which are determined in accordance with relevant engineering standards and geotechnical investigation reports. To intuitively show the stratum distribution, a simplified geological cross-section diagram is given in Figure 8. This figure corresponds to the soil layer parameters in Table 5, showing that the site soil layers are mainly composed of silt, silty clay, silty sand, and fine sand. No soft soil, weak interlayer, or liquefiable layer is found within the exploration depth.
Table 4.
Tunnel material parameter.
Table 5.
Rock material parameter.
Figure 8.
Simplified geological cross-section.
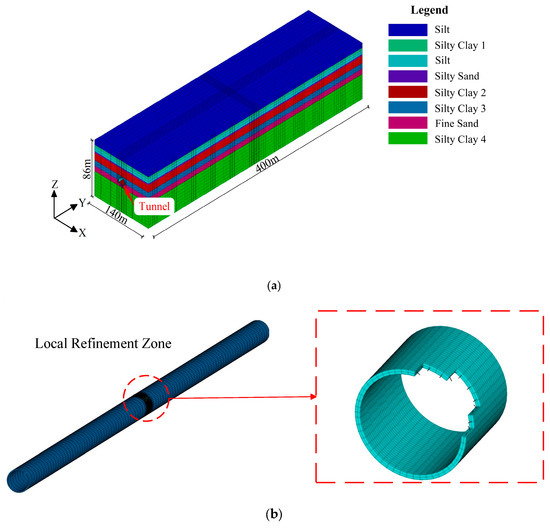
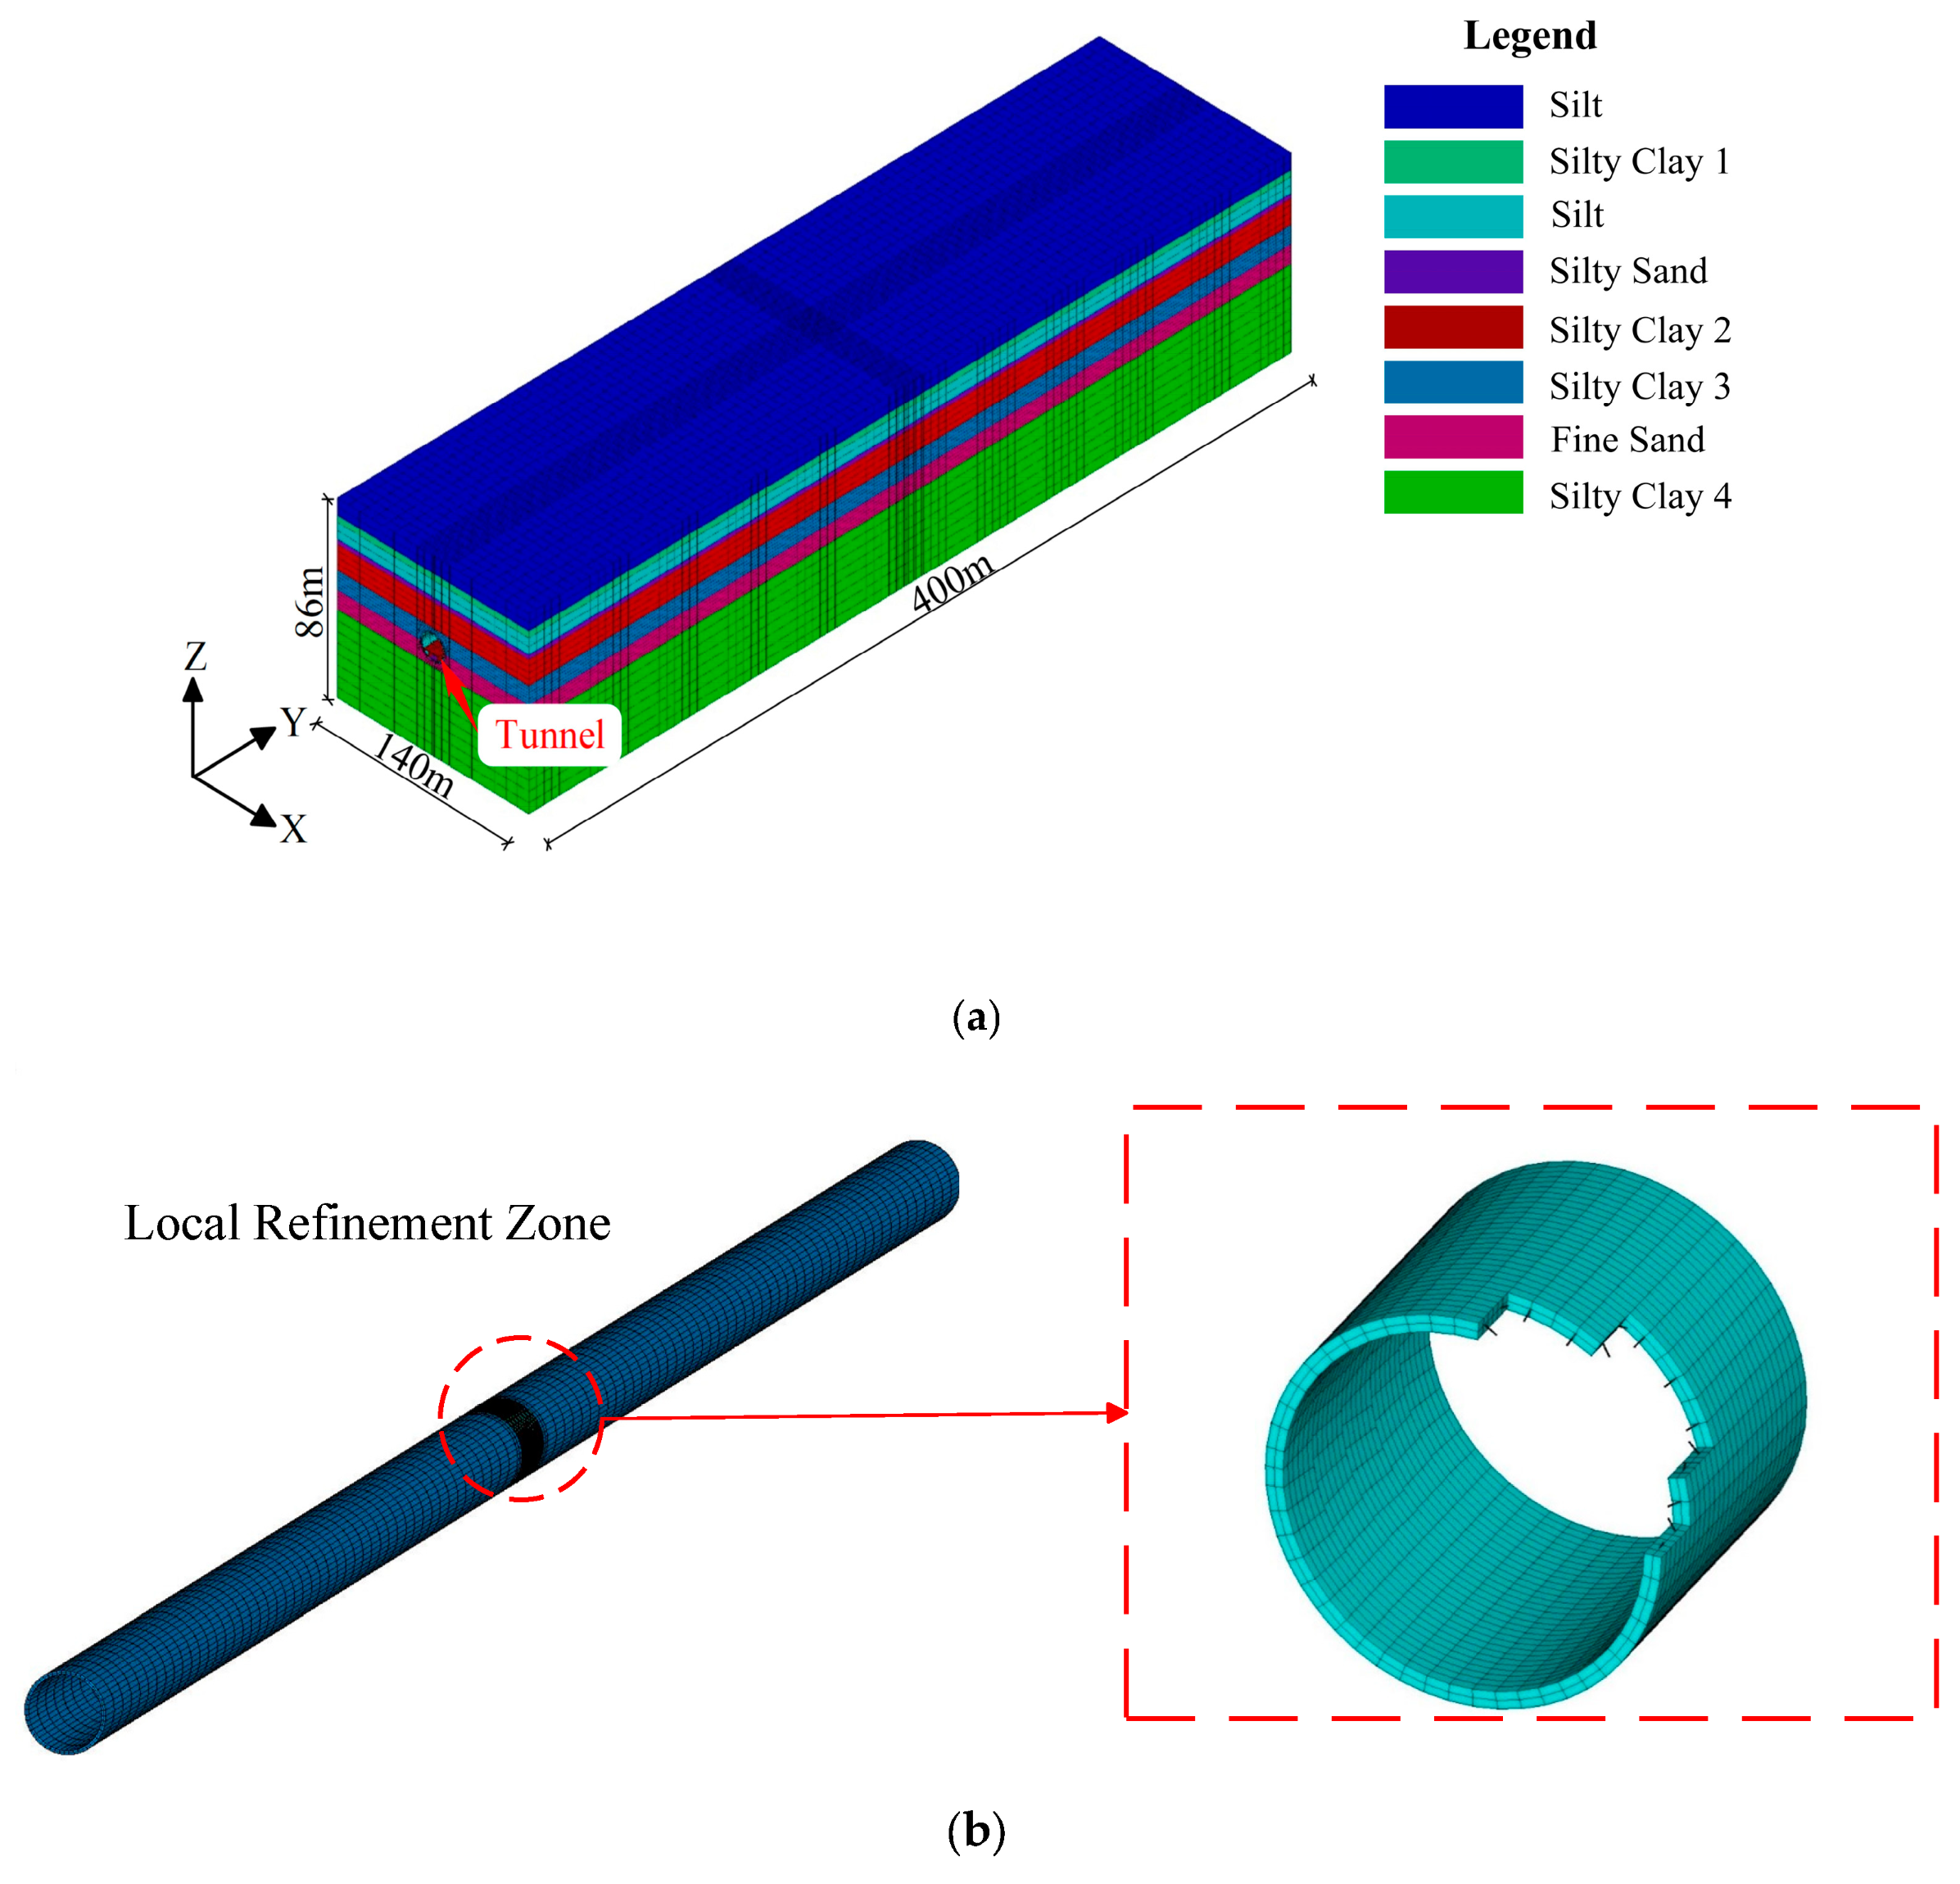
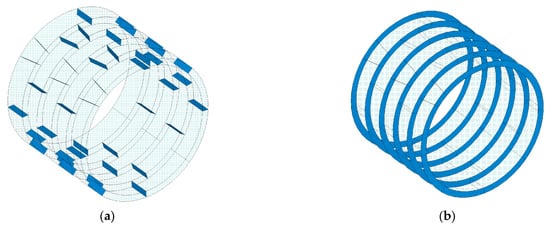
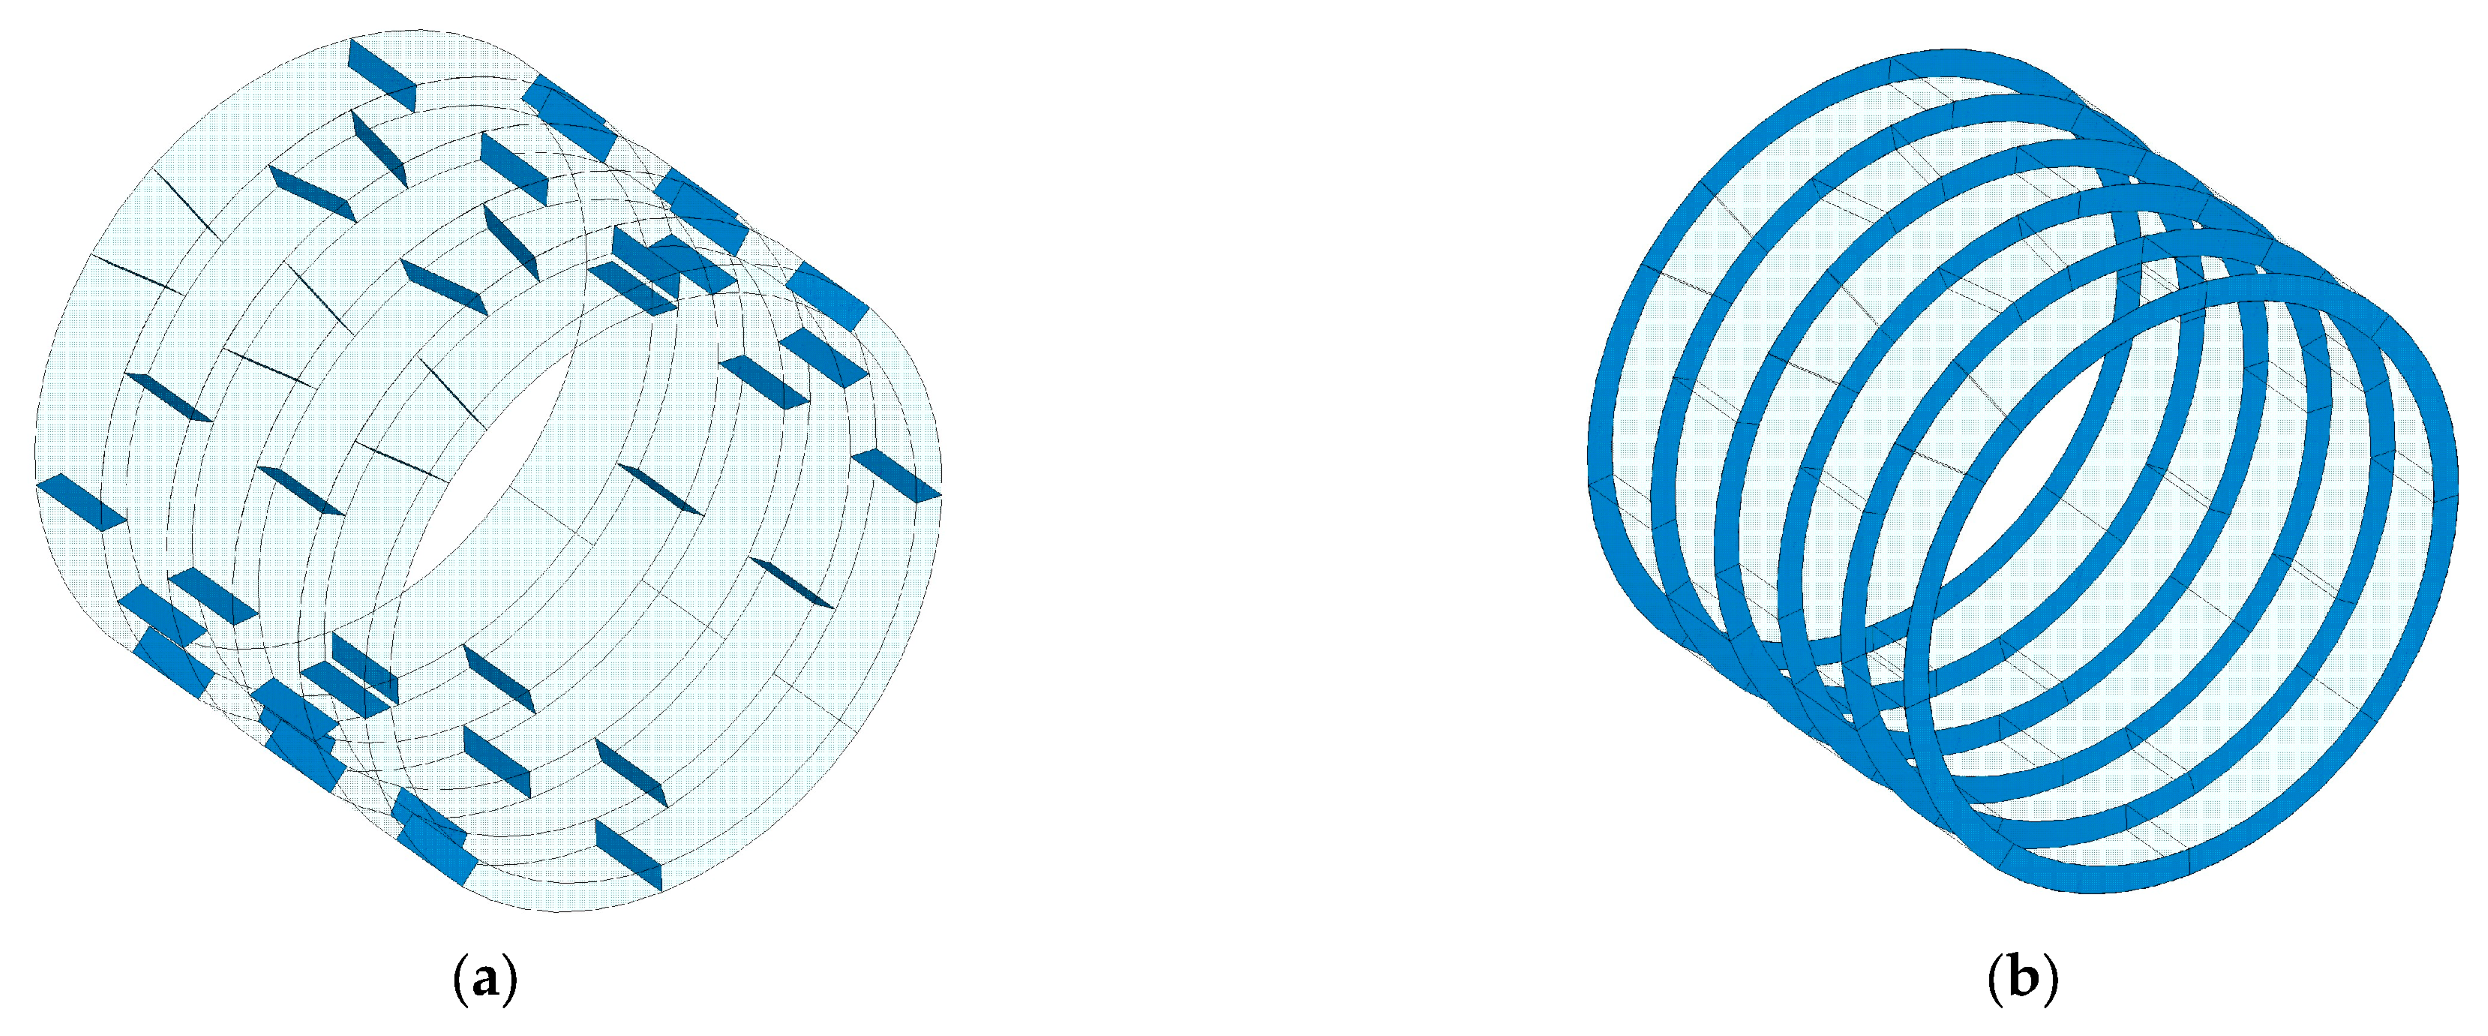
To simulate the dynamic response of a shield tunnel under non-uniform seismic excitation, a three-dimensional coupled numerical model incorporating the tunnel, bolts, and surrounding rock was developed in ANSYS. A representative 400 m segment of the tunnel was selected for detailed analysis. The overall model dimensions are 140 m (width, X-direction), 86 m (height, Y-direction), and 400 m (length, Z-direction), as shown in Figure 9a [32,33]. The X-axis points laterally to the right, the Y-axis vertically upward, and the Z-axis aligns with the tunnel’s longitudinal direction. The top boundary of the model is free, while viscoelastic boundaries are applied to the lateral and bottom surfaces. The tunnel lining and surrounding rock were modeled with SOLID185 solid elements, whereas the connecting bolts were simulated with BEAM188 beam elements (see Figure 9b). A linear elastic model was adopted for both the lining and bolts, while the Drucker–Prager elastoplastic model [34] was used for the surrounding rock. The contact interactions between segment-to-segment and segment-to-surrounding rock were simulated with TARGE170 and CONTA174 elements. The distribution of longitudinal and circumferential joint surfaces within the lining is illustrated in Figure 10. The penalty function method was used for the contact algorithm, employing hard contact in the normal direction and Coulomb friction in the tangential direction. The friction coefficient between segments was set to 0.6, and the friction coefficient between segments and surrounding rock was determined with reference to pile-soil interaction principles [35,36]. The bolts were connected to the segments using a constraint equation coupling method.
Figure 9.
Tunnel finite element model. (a) Overall calculation model. (b) Local calculation model.
Figure 10.
Segment Joint Surface. (a) Longitudinal segment joint surface. (b) Circumferential ring-to-ring joint surface.
3.2. Seismic Input
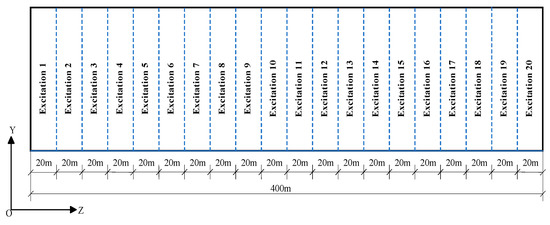
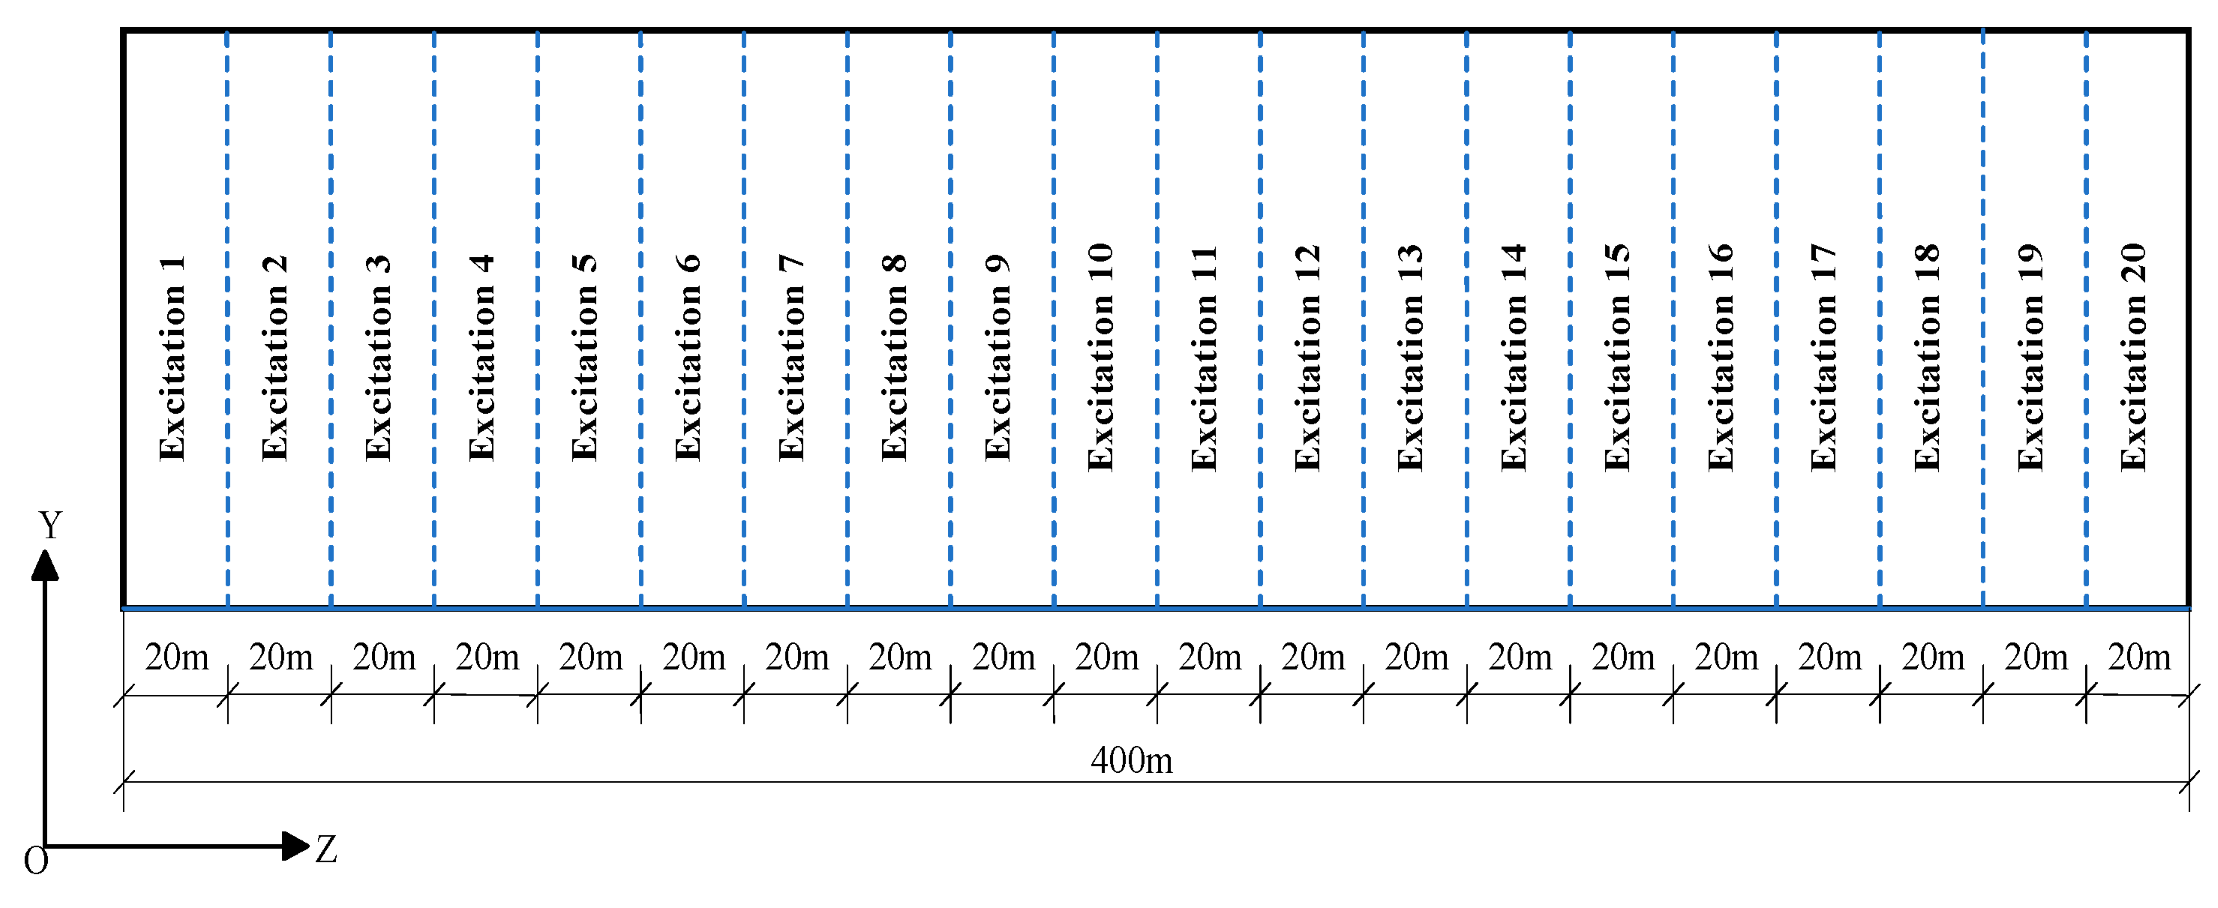
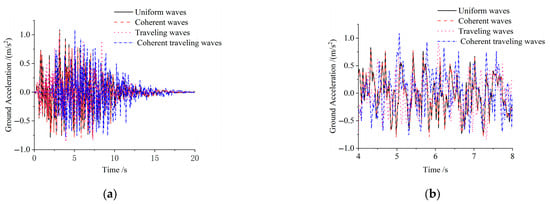
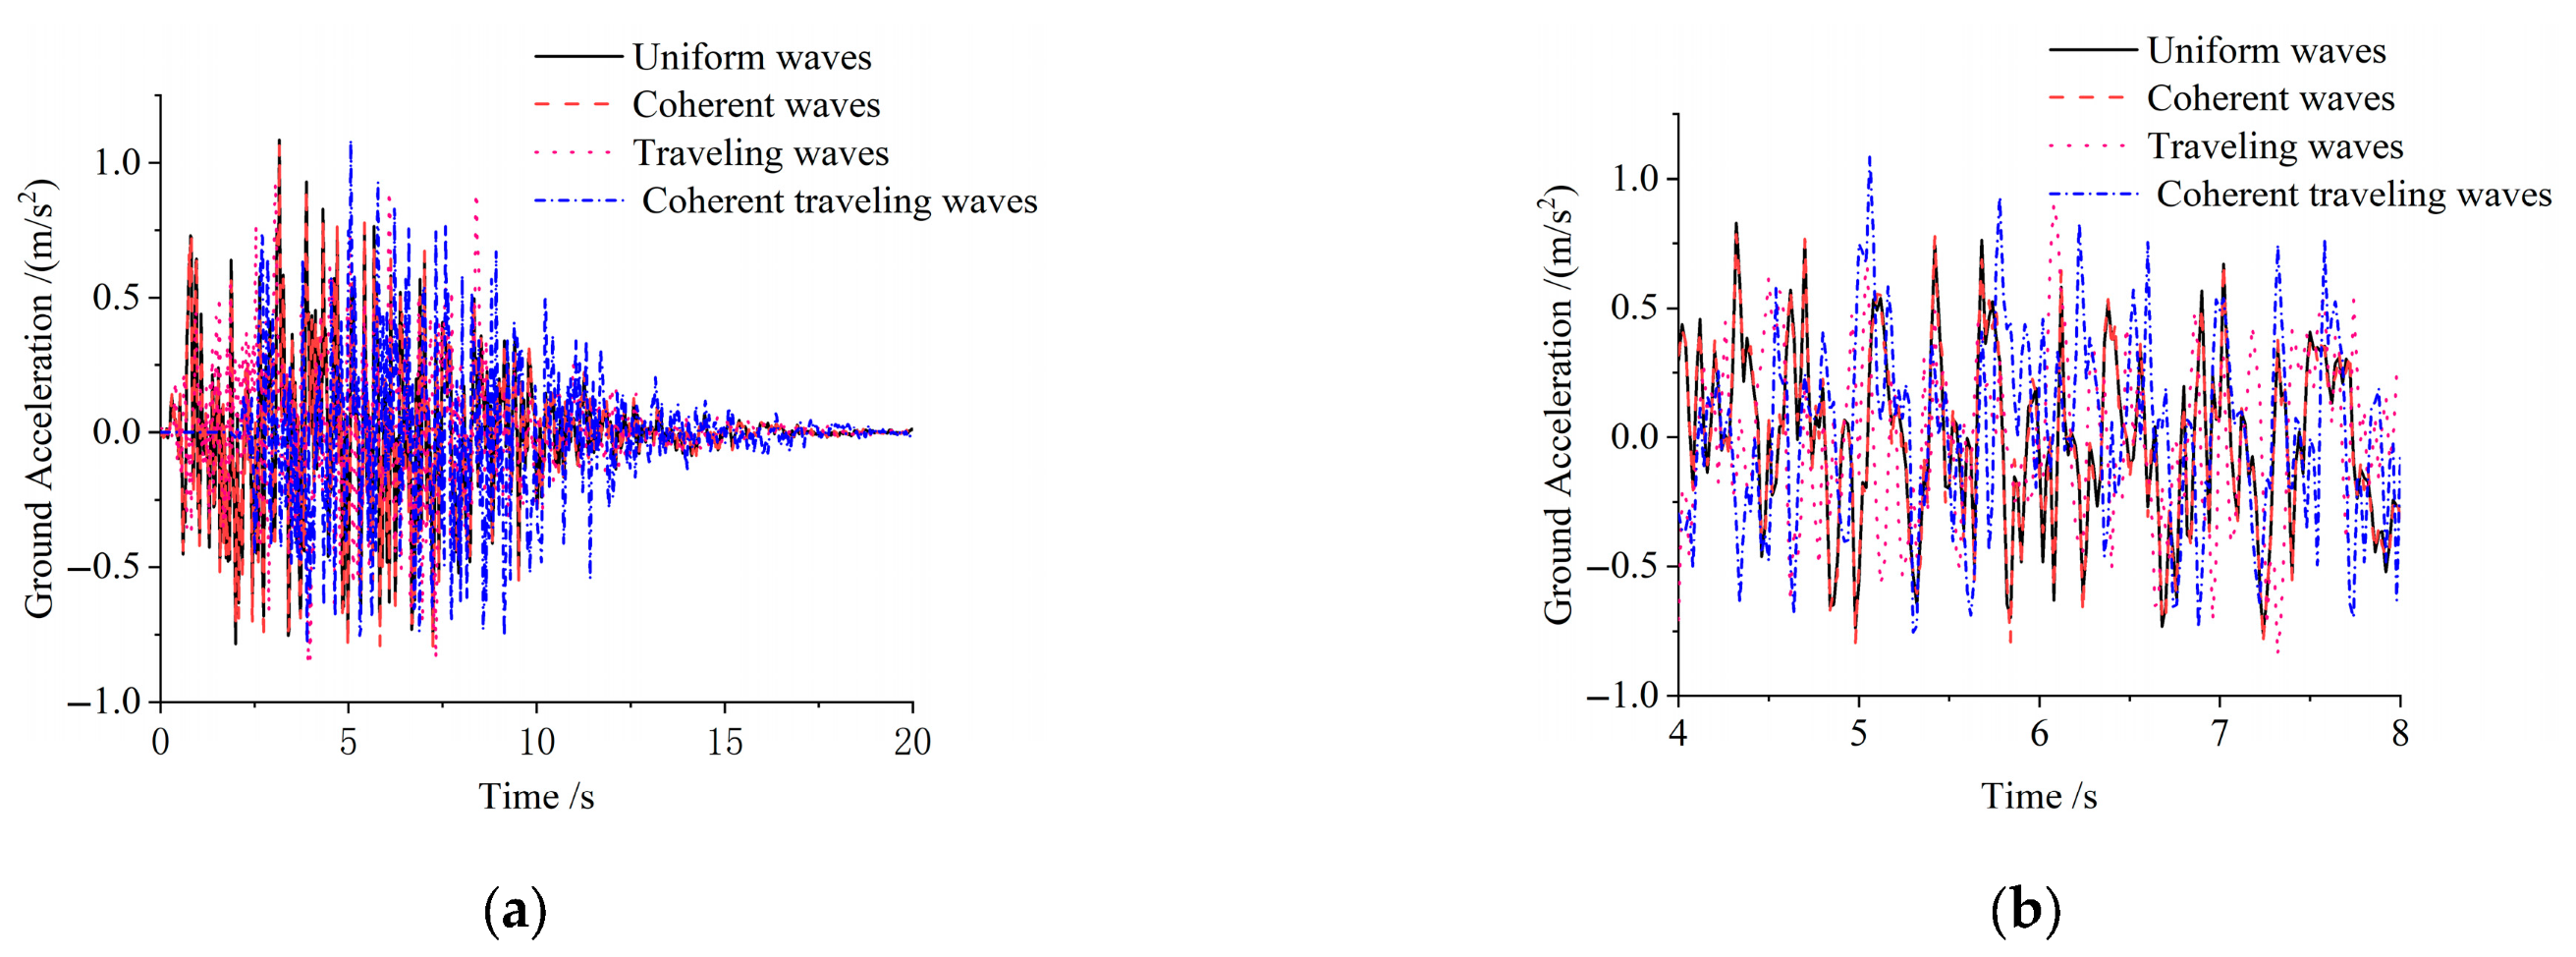
Based on the theory of viscoelastic artificial boundaries [37,38], the seismic time histories were converted into equivalent nodal loads applied at the model base. The seismic waves were input simultaneously along both the longitudinal (Z) and transverse (X) directions, with a proportional amplitude ratio of 1:0.85. Transverse excitation was applied uniformly, whereas spatially non-uniform excitation was implemented along the longitudinal direction. The tunnel was divided into 20 excitation zones, each subjected to region-specific non-uniform motion, as illustrated in Figure 11. Notably, the 20th zone, characterized by the most pronounced longitudinal non-uniformity, utilized a suite of seismic records including uniform, traveling, coherent, and coherent traveling waveforms. As shown in Figure 12a, the acceleration time histories for these four input models were compared and analyzed. The local amplification curves in Figure 12b (4–8 s window) exhibit a marked separation among the four waveforms. The coherent traveling waves show a distinct peak delay relative to the other models, and their amplitude is particularly prominent during the intense shaking phase.
Figure 11.
Distribution of longitudinal ground motion input.
Figure 12.
Four seismic time-history curves in section 20. (a) Comparison of seismic time-history. (b) Local amplification curves of seismic time-history (4–8 s).
3.3. Computational Cases
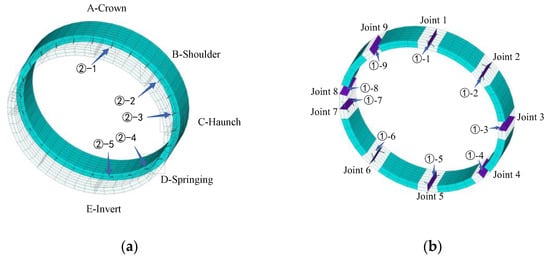
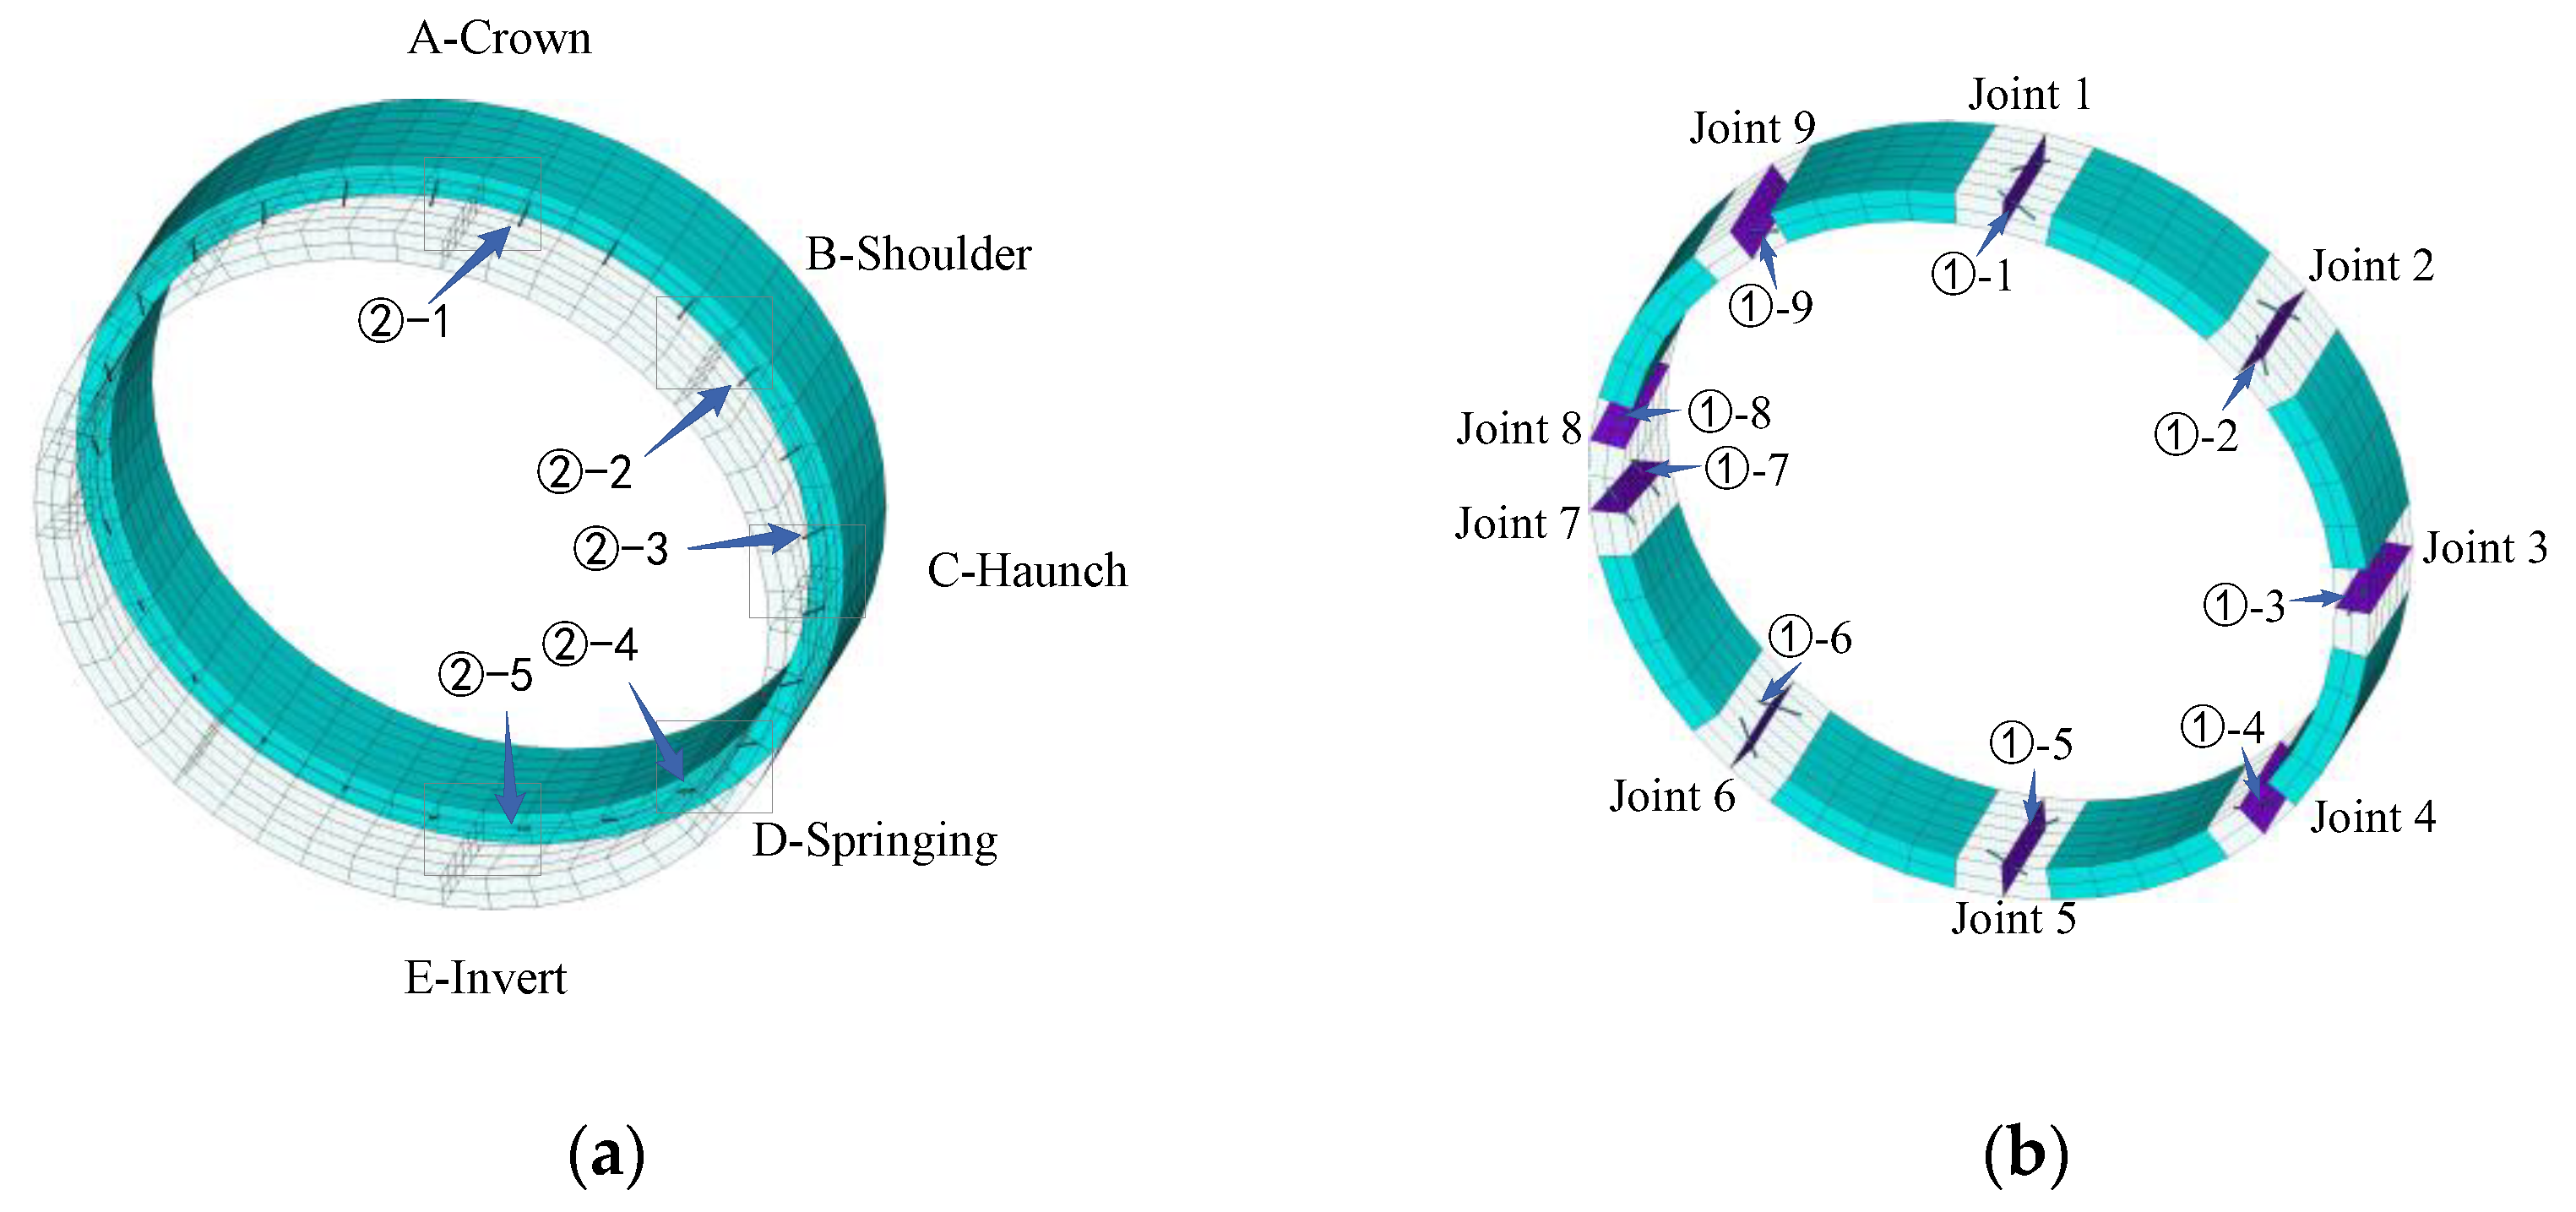
To systematically characterize the structural seismic response, the longitudinal joint surfaces of the lining were numbered sequentially from 1 to 9 in a clockwise direction, with the corresponding connecting bolts labeled as ①-1 to ①-9. The circumferential joint surfaces were divided into five regions: Crown (A), Shoulder (B), Haunch (C), Springing (D), and Invert (E), with the associated bolts labeled as ②-1 to ②-5 (see Figure 13). This study comprehensively considered the coupled effects of bolt corrosion and non-uniform seismic excitation by establishing four computational cases: Case 1 (no bolt corrosion), Case 2 (corrosion at a single longitudinal joint), Case 3 (corrosion at combined longitudinal joints), and Case 4 (corrosion at a circumferential joint). These cases were designed to analyze the influence mechanisms of corrosion location, corrosion rate, and spatial non-uniform seismic motions on the tunnel’s seismic response, as summarized in Table 6.
Figure 13.
Lining segment joint and bolt layout. (a) Longitudinal joint and bolt layout. (b) Circumferential joint and bolt layout.
Table 6.
Computational Cases and Parameters.
4. Analysis and Discussion of Tunnel Seismic Response
The lining adjacent to the longitudinal section at Z = 200 m was selected as the primary focus area. Key seismic response parameters under both uniform and non-uniform seismic excitations, including joint contact stress, joint opening, and bolt stress, were extracted. A comparative analysis was conducted to elucidate the seismic response patterns and potential failure risks of the shield tunnel with bolt corrosion.
4.1. Case 1: Effect of No Bolt Corrosion
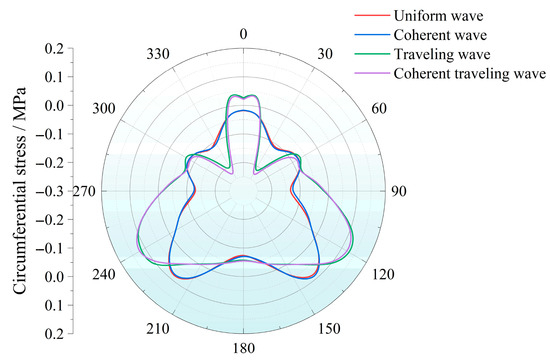
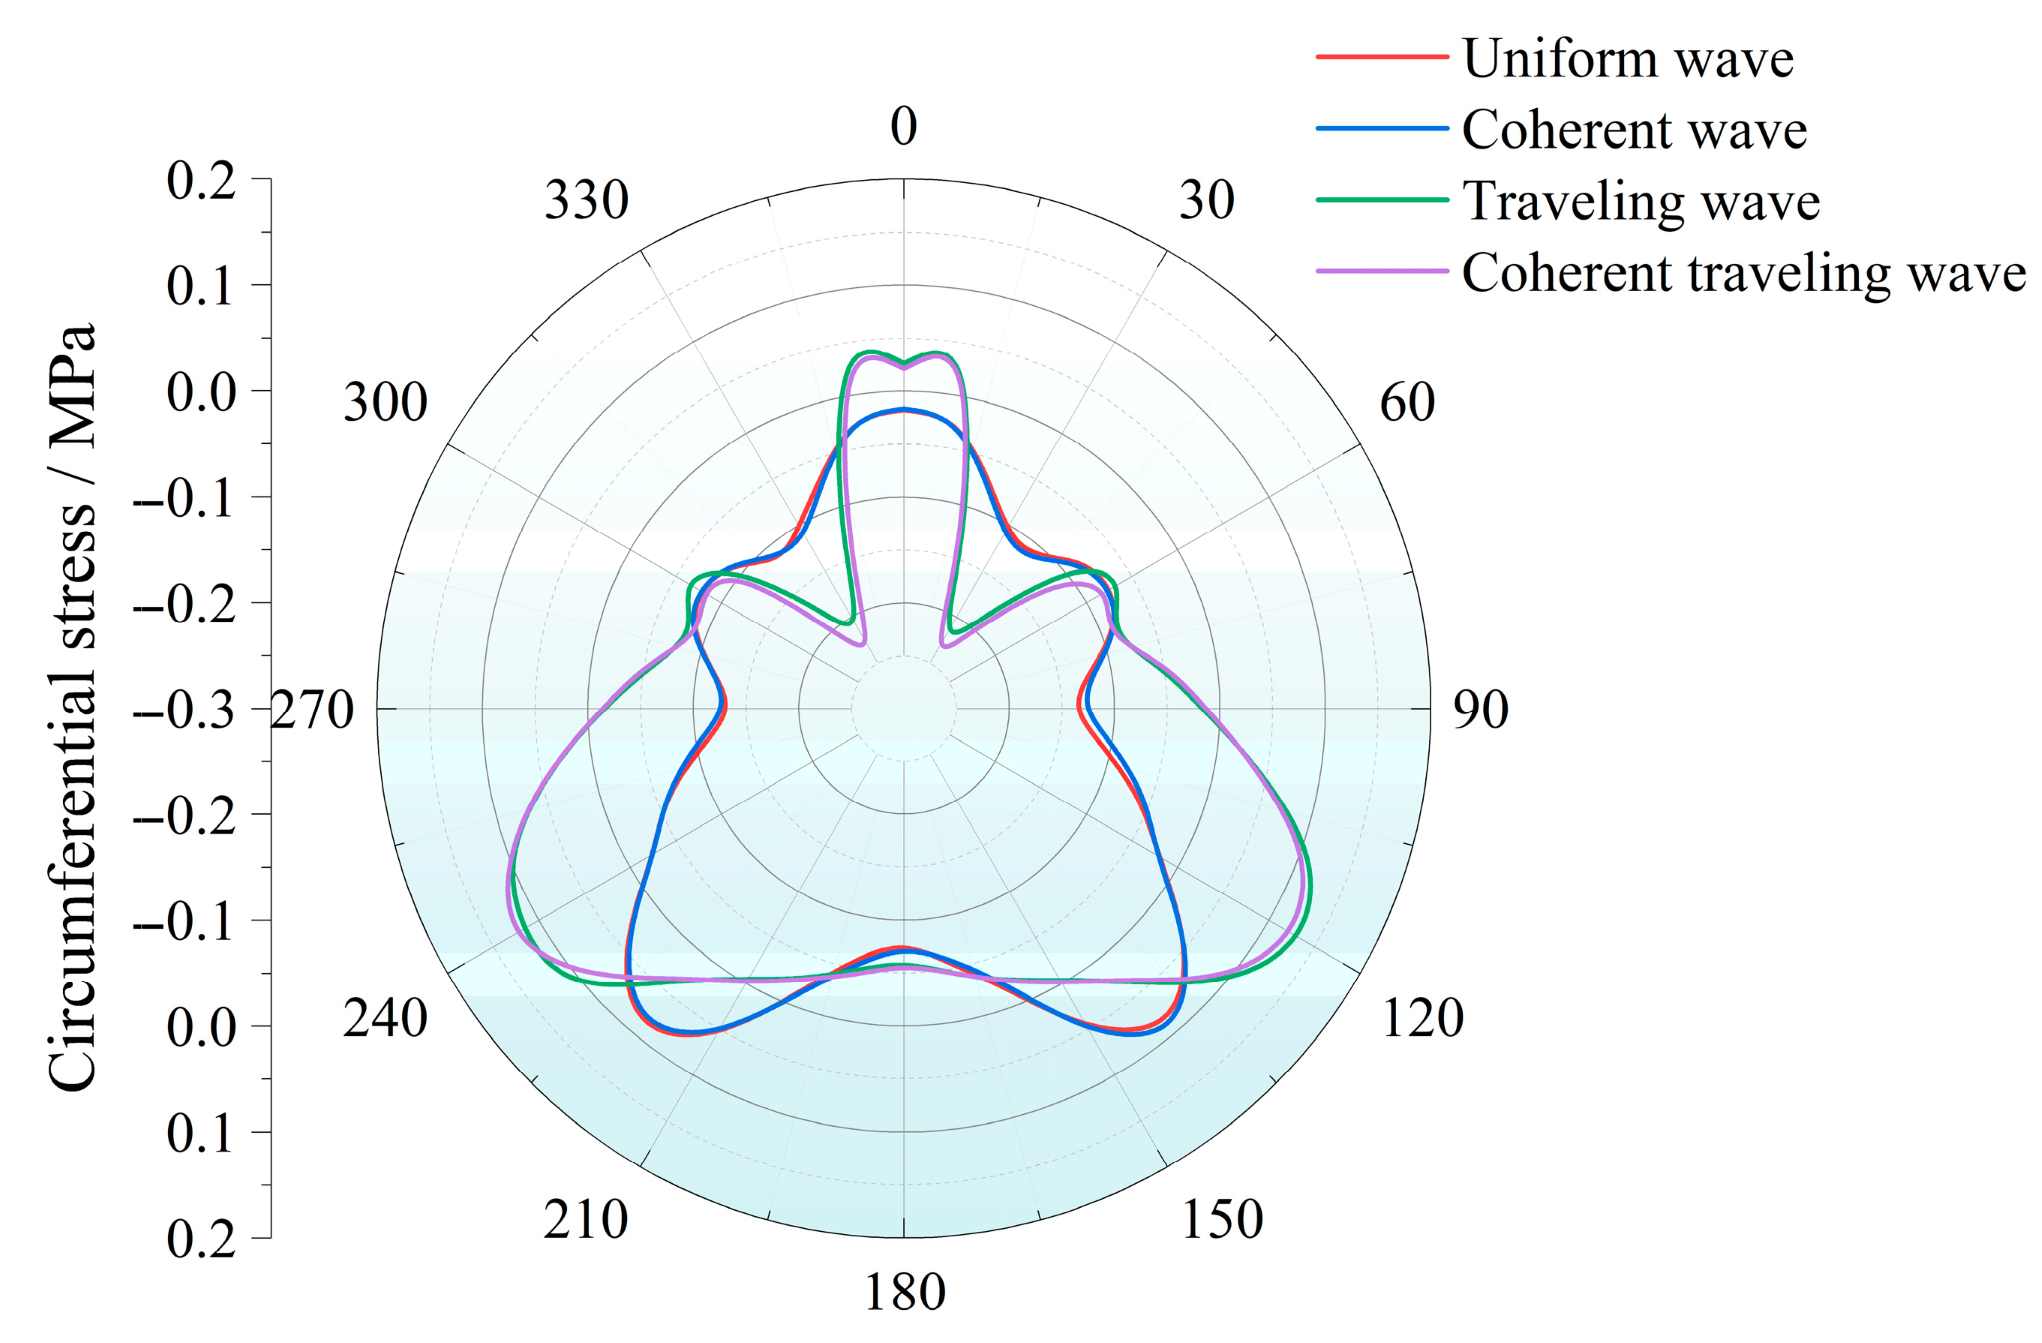
Case 1 examines the seismic response of the tunnel without bolt corrosion under four types of input motion: uniform, traveling, coherent, and coherent traveling waves. Figure 14 presents the envelope of peak circumferential stresses in the lining induced by these four excitations (tensile stress is positive; compressive stress is negative). The circumferential stress distribution is approximately symmetric around the tunnel cross-section under all loading conditions. However, the stress levels induced by traveling and coherent traveling waves are significantly higher than those caused by uniform and coherent waves. This difference is most pronounced at the crown and the springing regions. According to the stresses at five key observation points (crown, shoulder, haunch, springing, and invert) listed in Table 7, all circumferential stresses remain relatively low, with a maximum tensile stress of only 0.096 MPa, which is well below the tensile strength of the lining. Under traveling and coherent traveling wave excitations, the springing area exhibits a relatively local concentration of tensile stress. This result indicates that the spatial non-uniform ground motions can locally intensify the tunnel stress response.
Figure 14.
Peak circumferential lining stress under four seismic waves.
Table 7.
Peak circumferential lining stress at key observation points.
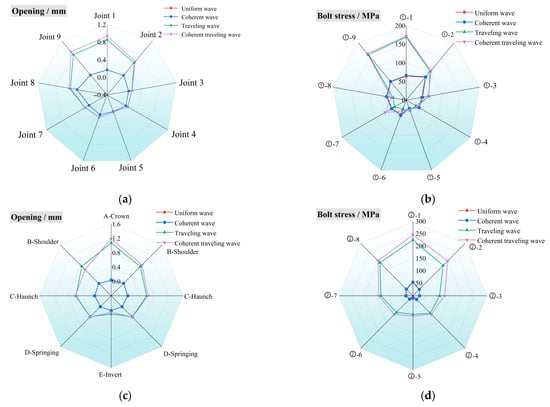
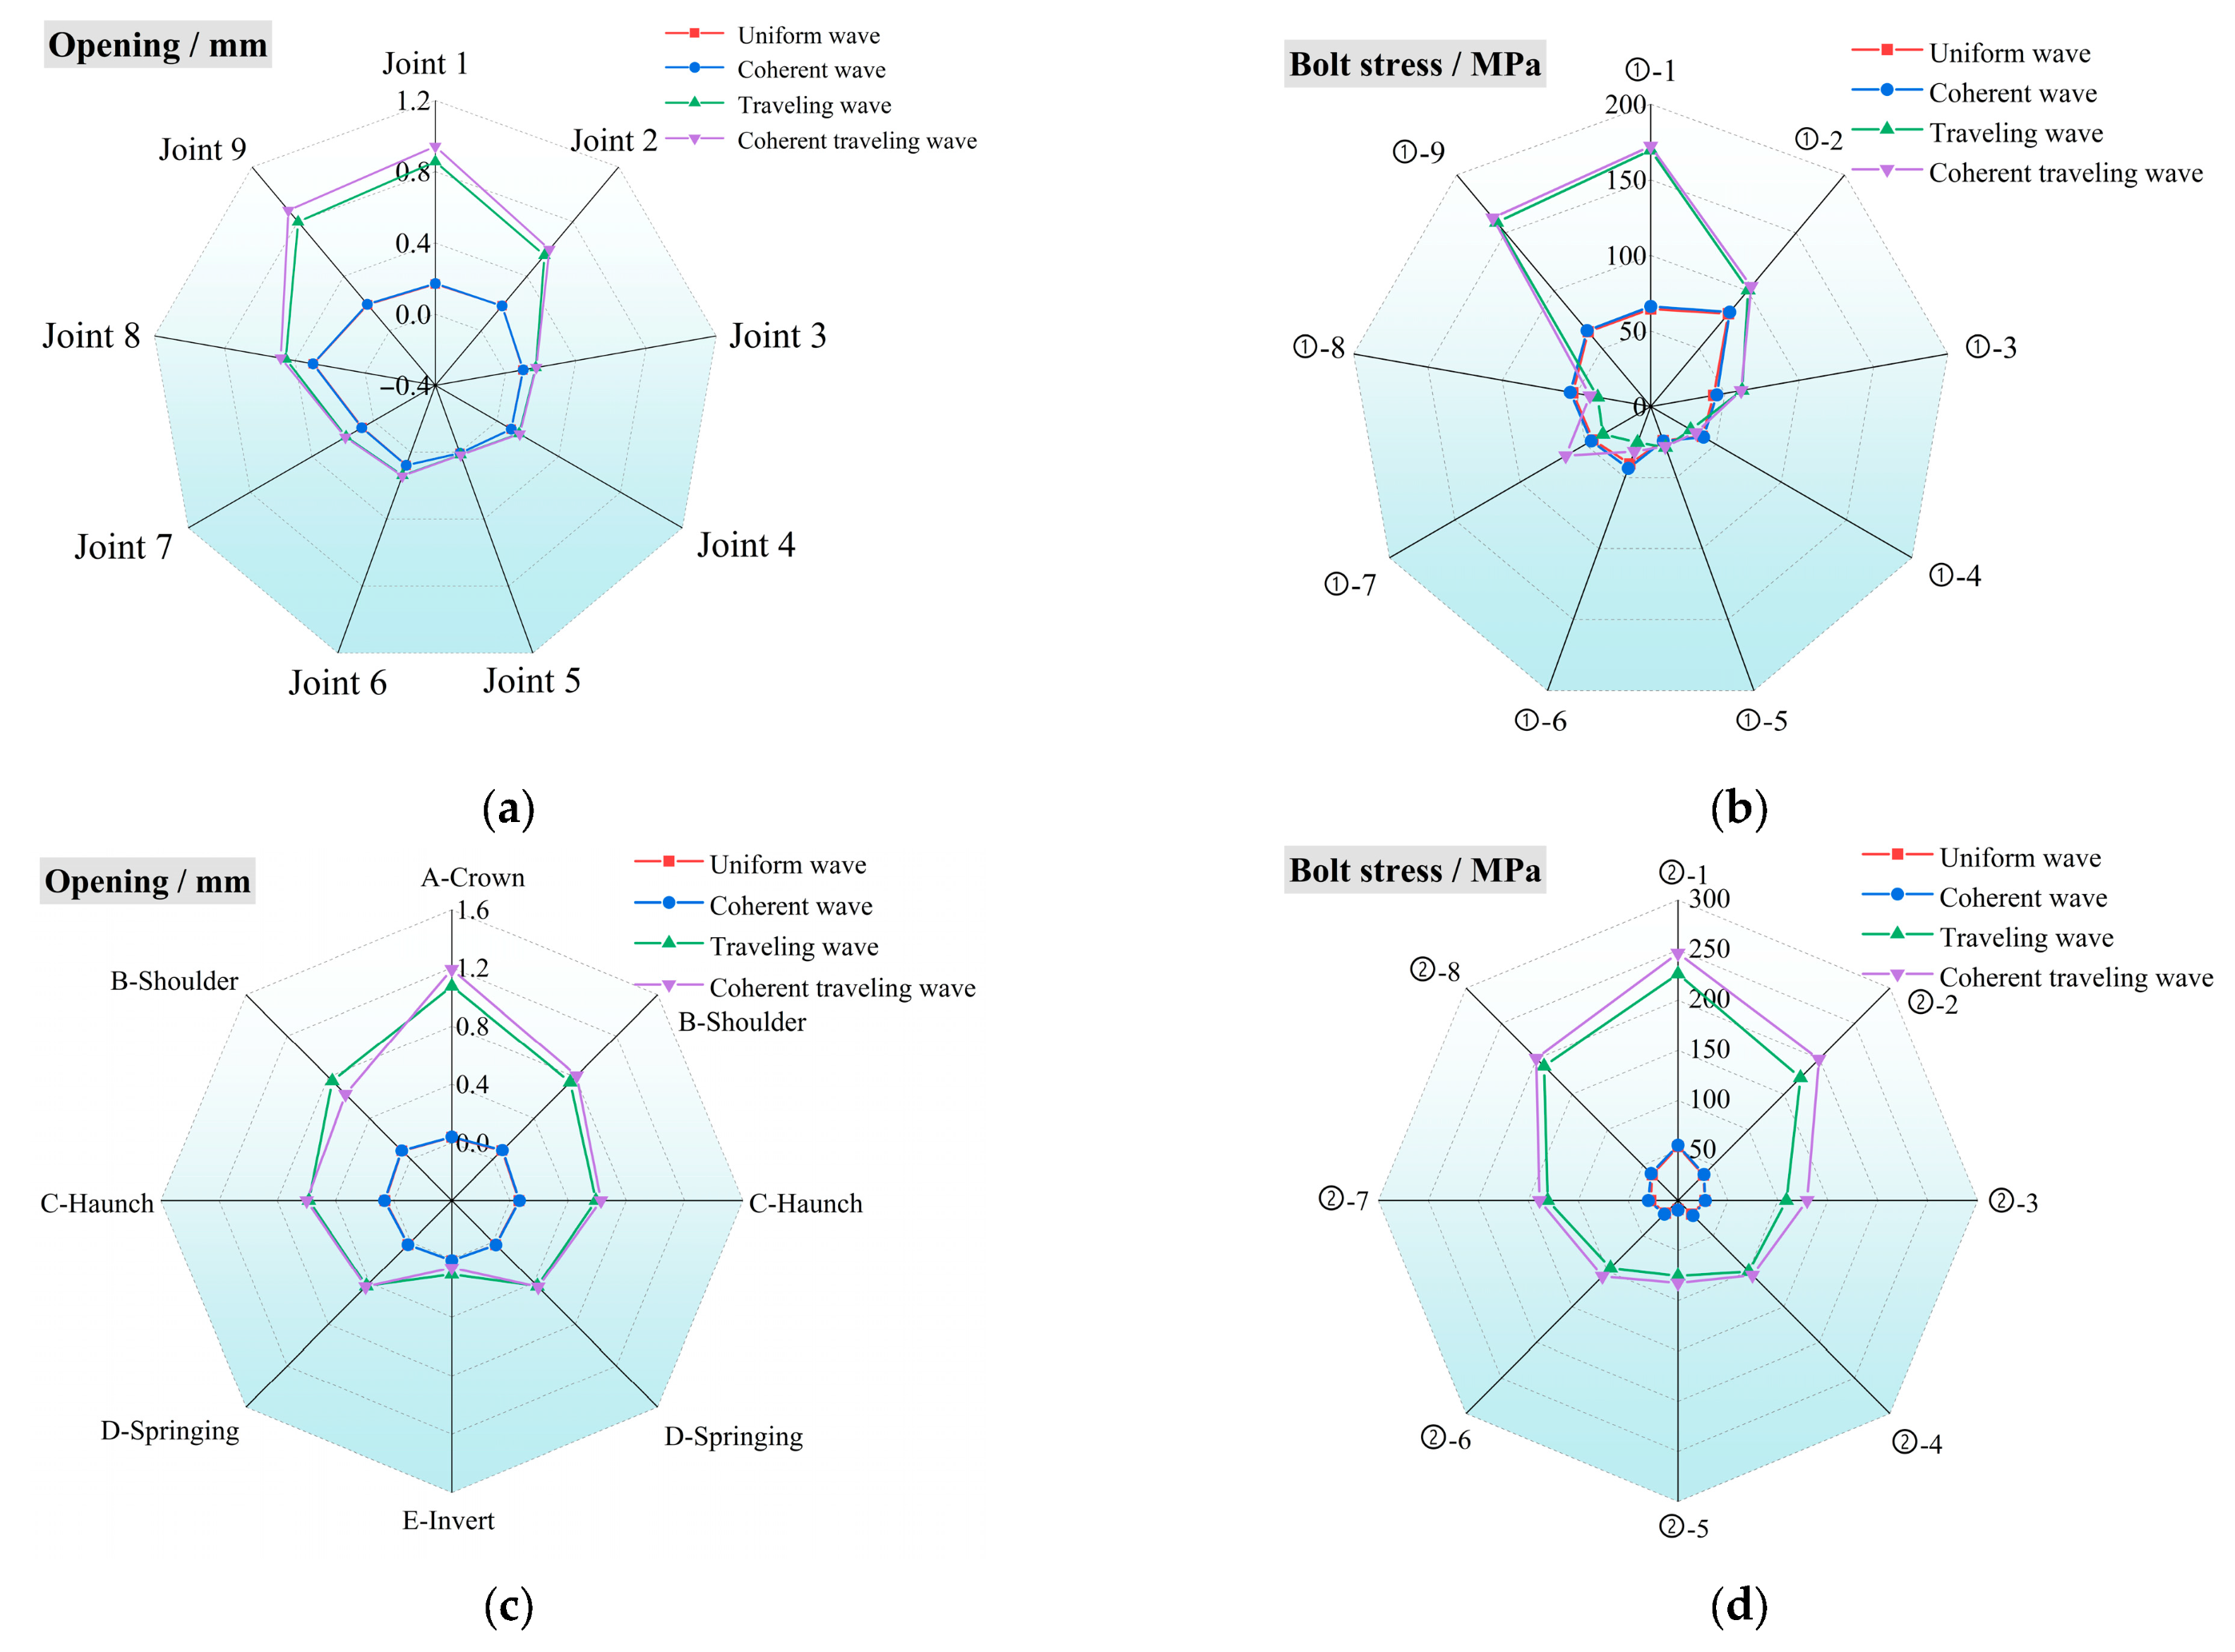
As shown in Figure 15, the spatially non-uniform ground motions significantly affect the contact characteristics between segments, resulting in a consistent pattern where the contact force response in the upper part exceeds that in the lower part. Regarding the response at longitudinal joints, the peak opening displacements at joint 1 (crown) under uniform and coherent wave excitation are similar, measuring 0.295 mm and 0.297 mm, respectively. Under traveling and coherent traveling wave excitation, these values rise to 0.856 mm and 0.942 mm, representing increases of 190.2% and 217.2%, respectively. This amplification in joint opening displacement directly correlates with an increase in bolt tensile stress. Under uniform and coherent wave excitation, the peak tensile stresses in bolt ①-1 (crown) are 64.6 MPa and 66.3 MPa, respectively. These stresses rise to 169.6 MPa and 172.3 MPa under traveling and coherent traveling wave excitation, corresponding to increases of 162.6% and 166.7%. For the circumferential peak response, the joint opening displacement in Crown Zone A reaches 1.189 mm under coherent traveling wave excitation, which is a 1267% increase compared to uniform wave excitation. Meanwhile, the tensile stress in Bolt Crown ②-1 rises to 246.9 MPa, an increase of 358.9%, further confirming the clear positive correlation between bolt stress and joint opening displacement.
Figure 15.
Peak seismic response of tunnel joints: Case 1. (a) Peak opening of longitudinal joints. (b) Peak bolt stress of longitudinal joints. (c) Peak opening of circumferential joints. (d) Peak bolt stress of circumferential joints.
Due to phase differences during wave propagation, coherent traveling waves and traveling waves generate a waveform superposition effect along the tunnel’s longitudinal axis. This effect amplifies the overall seismic response of the tunnel and leads to pronounced stress concentrations in the longitudinal and circumferential joints near the crown. In contrast, the invert and springing regions, which are more constrained by geometric confinement, exhibit relatively smaller responses. The influence of the various seismic excitations on the tunnel’s dynamic response is as follows: coherent traveling wave > traveling wave >> coherent wave > uniform wave, with the coherent traveling wave having the greatest effect.
4.2. Case 2: Effect of Bolt Corrosion at Longitudinal Joint
Based on the results of Case 1, where the peak circumferential stresses in the lining remain minimal under all seismic excitations, the coherent traveling wave generates the most pronounced response. Therefore, this case focuses on a comparative analysis of the longitudinal joint response under uniform wave and coherent traveling wave excitations. Specifically, the study investigates the response patterns of joint opening displacement and bolt stress for varying bolt corrosion rates of 0%, 10%, 20%, and 30% on a single longitudinal joint surface.
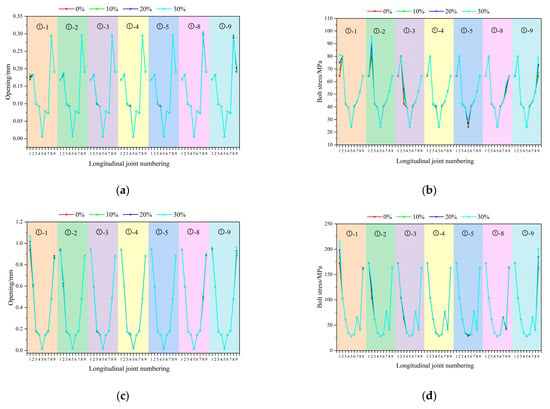
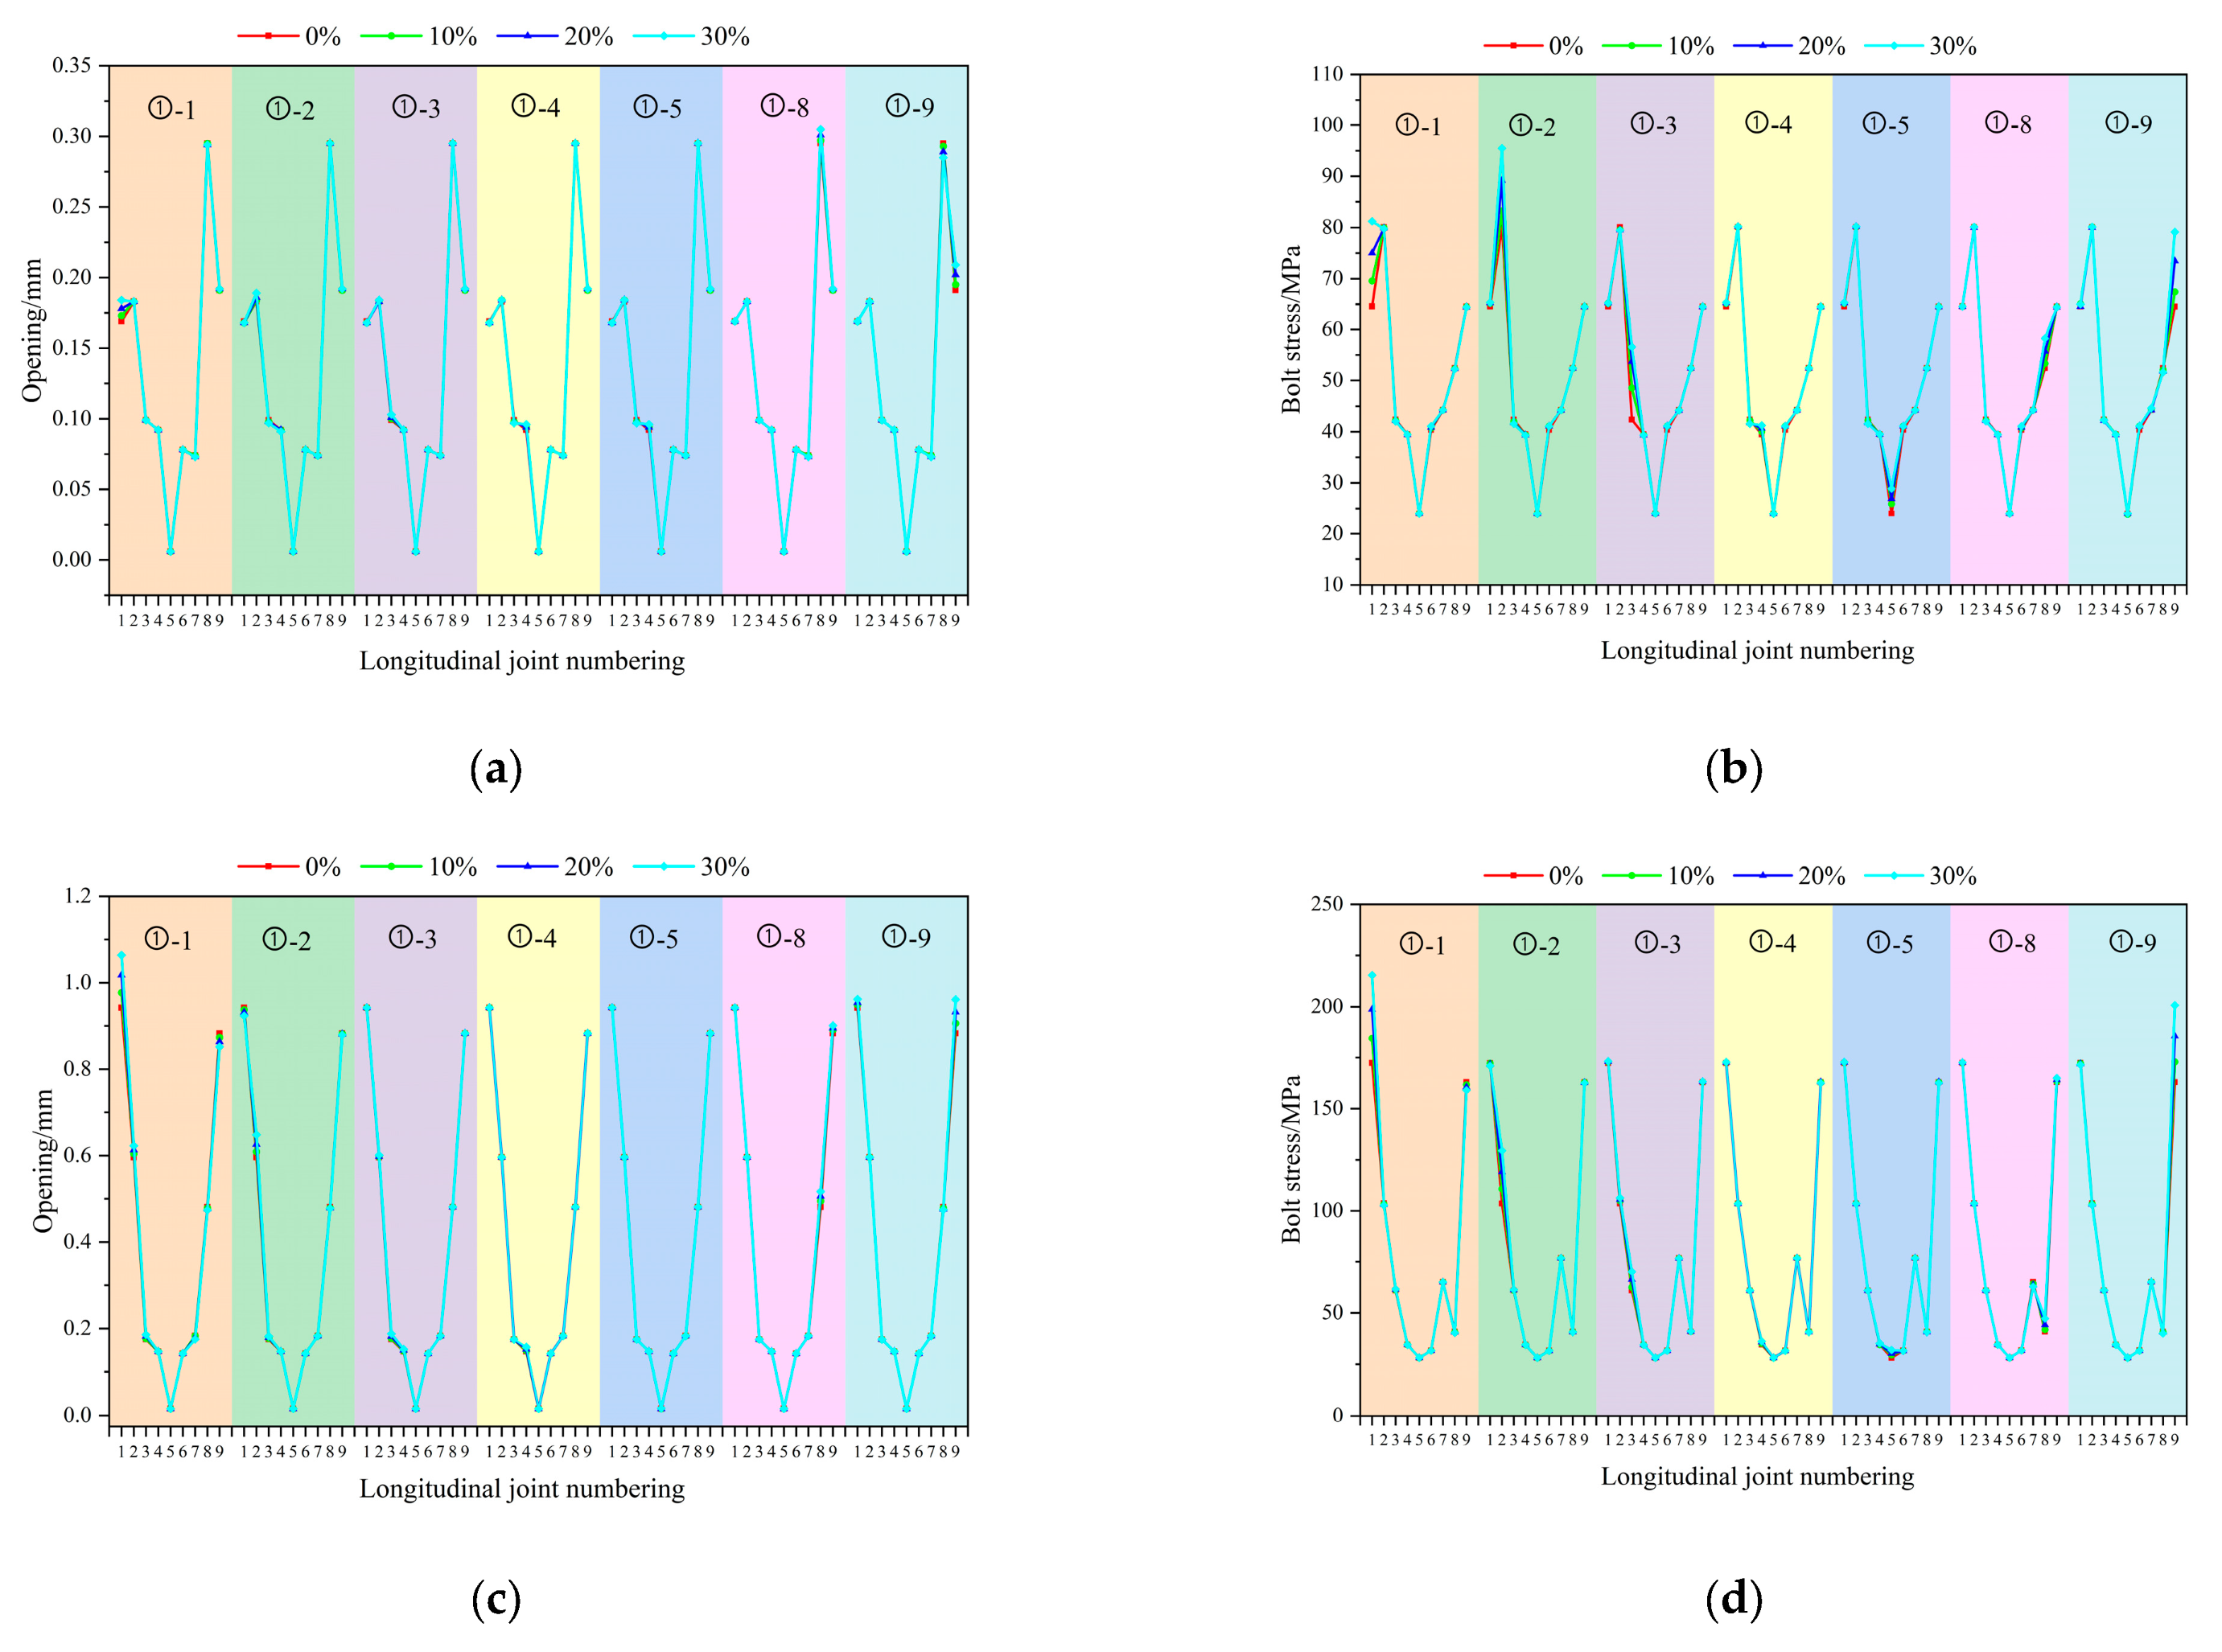
Figure 16a,b illustrate that the influence of bolt corrosion on the longitudinal joint response under uniform wave excitation exhibits a localized characteristic. As the corrosion rate of bolt ①-1 increases from 0% to 30%, the opening at the joint expands to 0.184 mm, representing an increase of 8.9%, while the stress in bolt ①-1 escalates to 81.2 MPa, a 25.7% rise. The responses of other joints and bolts exhibit minimal variations. When bolt ①-2 is corroded, its stress increases to 95.5 MPa, an increase of 19.2%. Corrosion of bolt ①-8 leads to an opening at joint 8 of 0.305 mm, representing a 3.4% increase. Overall, under this type of excitation, the more significant responses are concentrated in the shoulder region, where joint 8 exhibits the largest opening and bolt ①-2 experiences relatively high stress.
Figure 16.
Peak seismic response of tunnel longitudinal joints: Case 2. (a) Peak opening of longitudinal joints under uniform wave. (b) Peak bolt stress of longitudinal joints under uniform wave. (c) Peak opening of longitudinal joints under coherent traveling wave. (d) Peak bolt stress of longitudinal joints under coherent traveling wave.
Figure 16c,d reveal that under coherent traveling wave excitation, the amplifying effect induced by corrosion on the tunnel’s seismic response becomes more pronounced. When the corrosion rate of bolt ①-1 reaches 30%, the opening at joint 1 expands to 1.064 mm, a 13.0% rise, while the stress in the associated bolt rises to 215.5 MPa, a 12.5% increase. With corrosion at bolt ①-9, the opening at joint 9 grows to 0.961 mm, an 8.8% increase, and the tensile stress in the bolt escalates to 200.8 MPa, a 23.3% rise. Under this excitation, joint 1 exhibits the largest opening, while joint 9 records the highest bolt stress. The more significant responses are primarily concentrated in the crown (joint 1) and shoulder (joint 9) regions.
An increase in the bolt corrosion rate elevates both the longitudinal joint opening and the bolt tensile stress, with the effect localized primarily around the corroded bolt. Furthermore, under non-uniform seismic excitation, the dynamic response at the contact surfaces is 2 to 3 times greater than under uniform excitation, indicating that the spatial variability of ground motions significantly intensifies the localized response near corroded bolt areas.
4.3. Case 3: Effect of Combined Bolt Corrosion at Multiple Joints
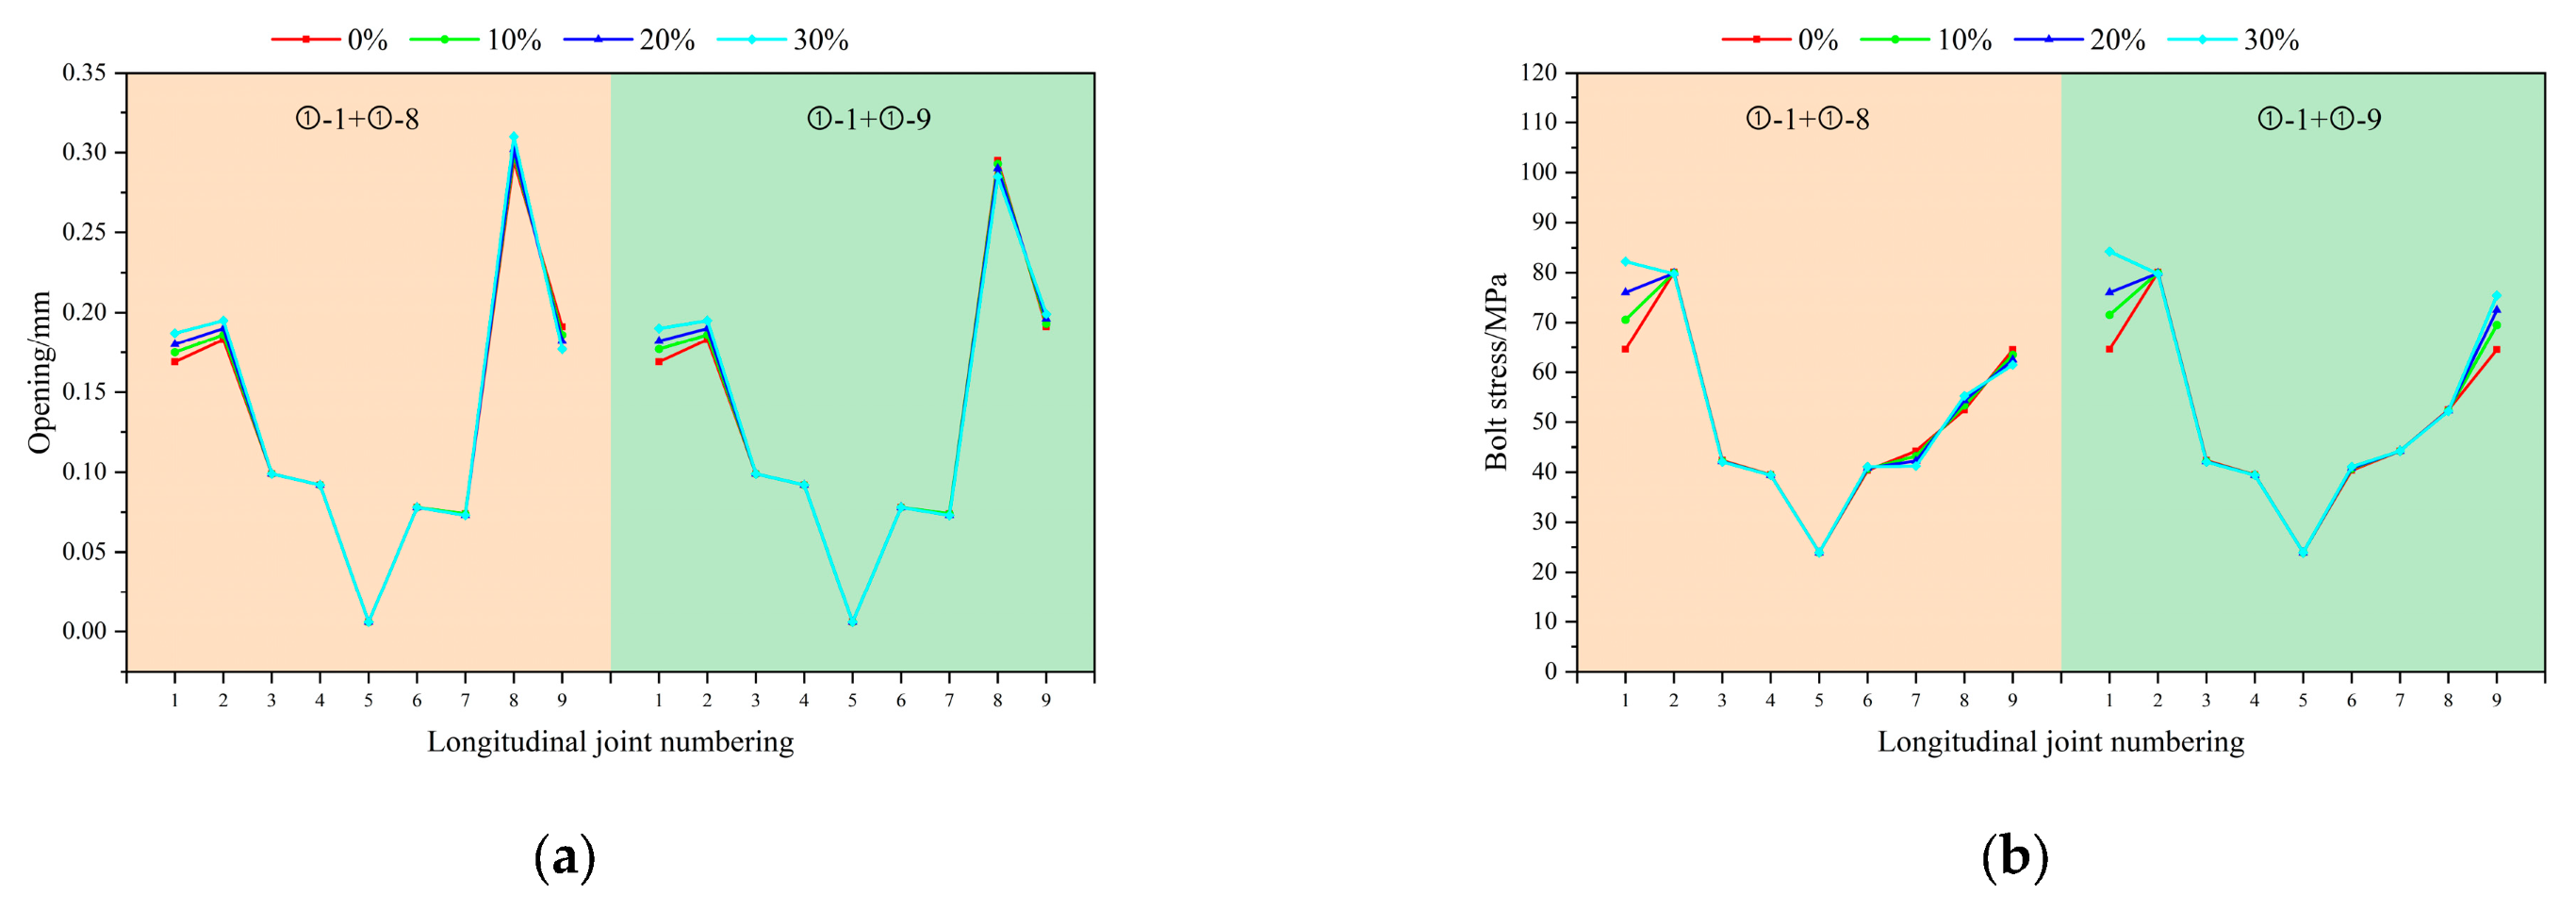
Building on the investigation of single-bolt corrosion, this case examines the impact of combined corrosion at multiple joints. A comparative analysis is performed to clarify the response patterns of joint opening displacement and bolt stress when the dynamically responsive bolt ①-1 corrodes in combination with either bolt ①-8 or bolt ①-9 under both uniform wave and coherent traveling wave excitations.
As illustrated in Figure 17a,b, under uniform wave excitation, when the corrosion rates of bolts ①-1 and ①-8 increase from 0% to 30%, the opening at longitudinal joint 1 grows to 0.187 mm (an increase of 10.7%), while the tensile stress in bolt ①-1 rises to 82.2 MPa (a 27.3% increase). Concurrently, the opening at longitudinal joint No. 8 reaches 0.310 mm, representing a 5.1% rise. When bolts ①-1 and ①-9 are corroded, the opening at joint 8 increases to 0.295 mm (a 3.9% increase), and the stress in bolt ①-9 rises to 75.5 MPa (a 16.9% increase). Under this excitation, the dynamic response remains concentrated in the crown (joint 1) and shoulder regions (joints 8/9), with joint 8 exhibiting the largest opening and bolt ①-1 experiencing the highest stress.
Figure 17.
Peak seismic response of tunnel combined longitudinal joints: Case 3. (a) Peak opening of combined longitudinal joints under uniform wave. (b) Peak bolt stress of combined longitudinal joints under uniform wave. (c) Peak opening of combined longitudinal joints under coherent traveling wave. (d) Peak bolt stress of combined longitudinal joints under coherent traveling wave.
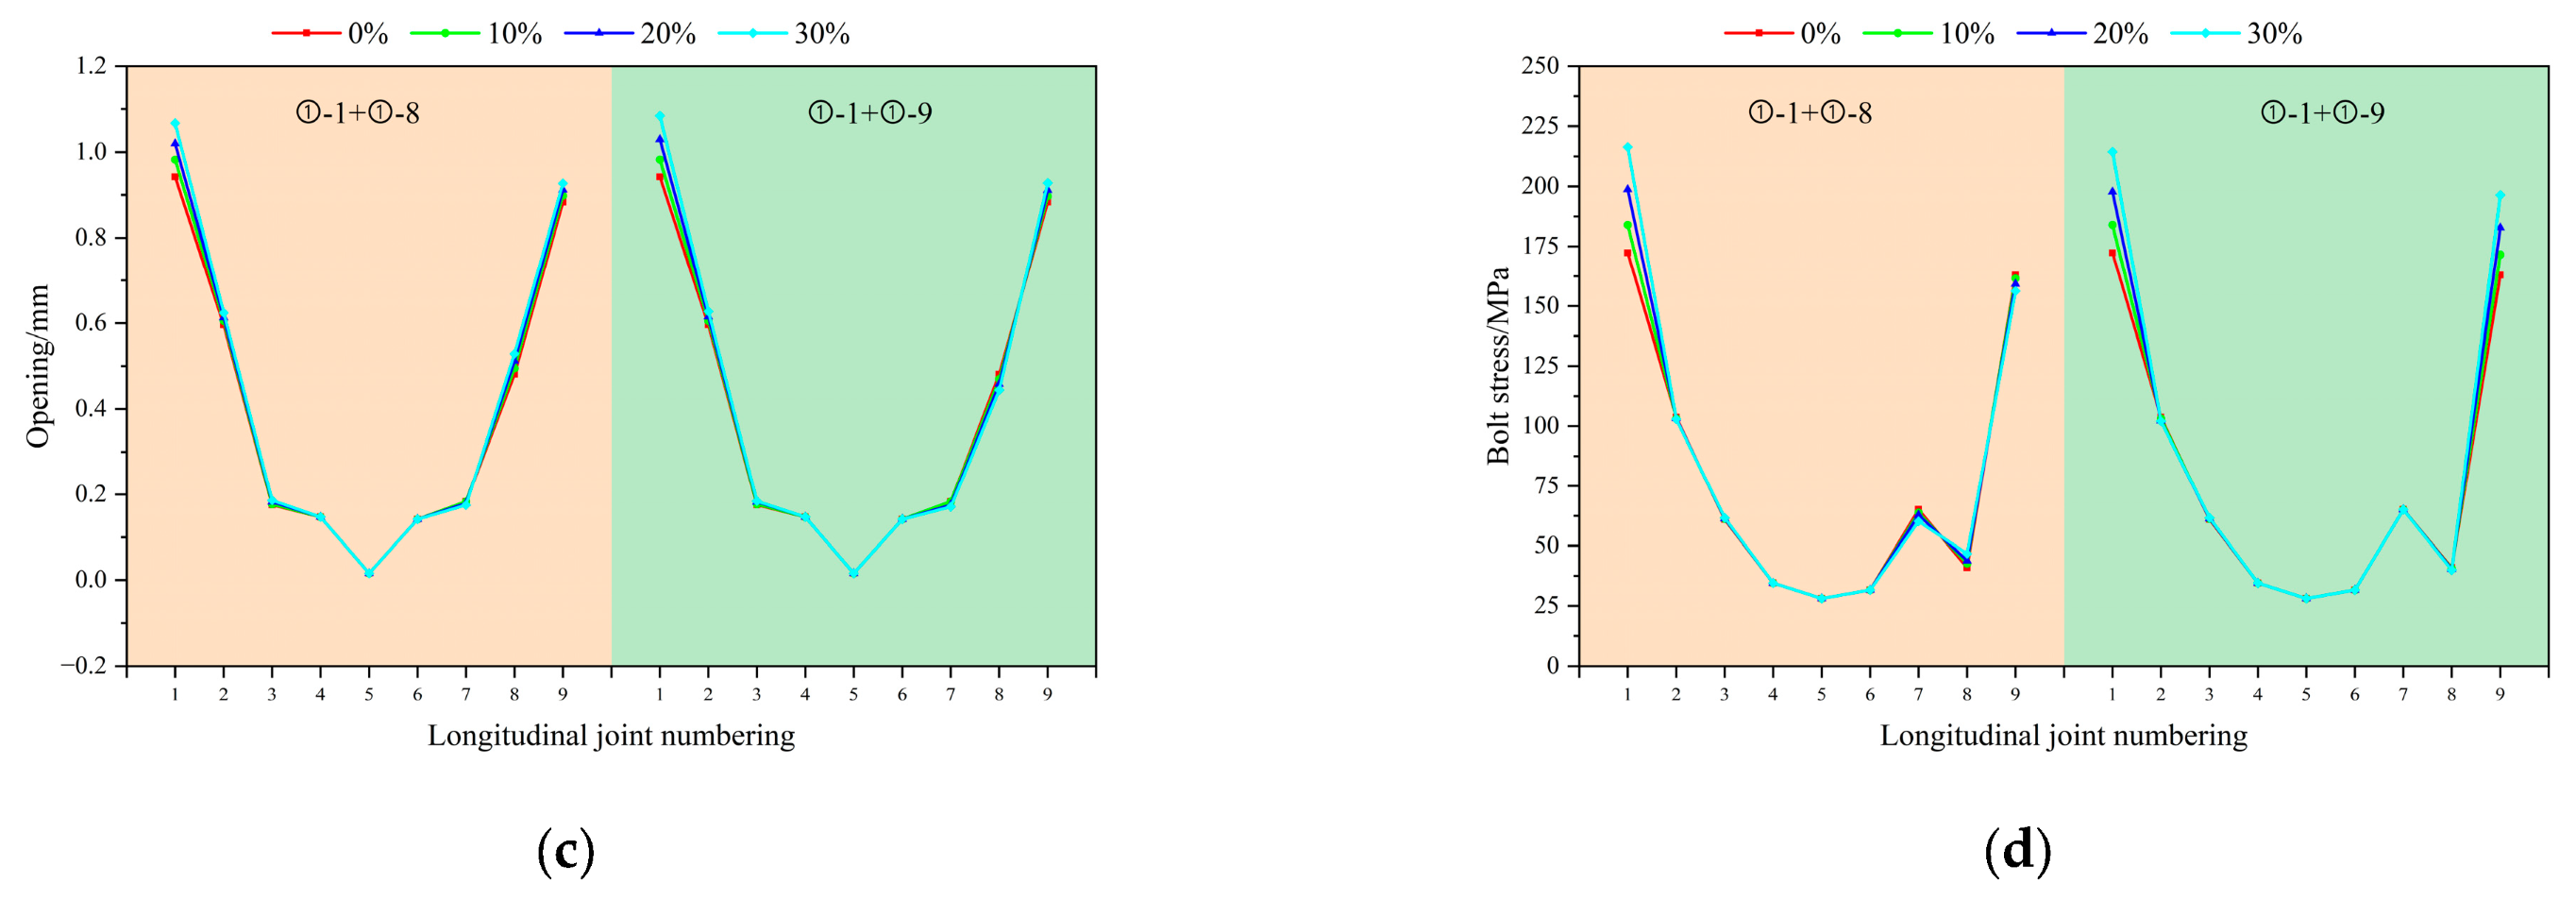
As shown in Figure 17c,d, under coherent traveling wave excitation, when bolts ①-1 and ①-8 are corroded, the opening at joint 1 increases to 1.067 mm (a 13.3% rise) and the stress in bolt ①-1 rises to 216.4 MPa (a 25.6% increase). The opening at joint 9 reaches 0.928 mm, representing a 5.1% increment. When bolts ①-1 and ①-9 are corroded, the opening at longitudinal joint 1 grows to 1.084 mm (a 15.1% increase), and the stress in bolt ①-1 increases to 217.5 MPa (a 26.2% rise). Simultaneously, the stress in bolt ①-9 rises to 196.4 MPa, a 20.6% increment. Under this excitation, the responses become further concentrated in the lining of the shoulder. Joint 1 exhibits the largest opening, bolt ①-1 experiences the highest stress, followed by the response at joint 9.
A comparison reveals that under combined bolt corrosion, the opening at joint 1 (1.084 mm) and the stress in bolt ①-1 (217.5 MPa) are slightly higher than those under single-bolt corrosion. However, this does not lead to a pronounced additive effect on the overall response of the lining; rather, the enhancement remains localized—primarily affecting the corroded bolts and the adjacent joints. Consistent with single-corrosion cases, the dynamic response under coherent traveling wave excitation is approximately 2–3 times higher than under uniform wave excitation. This further confirms the decisive amplifying role of spatially non-uniform ground motion on the seismic response in corroded regions.
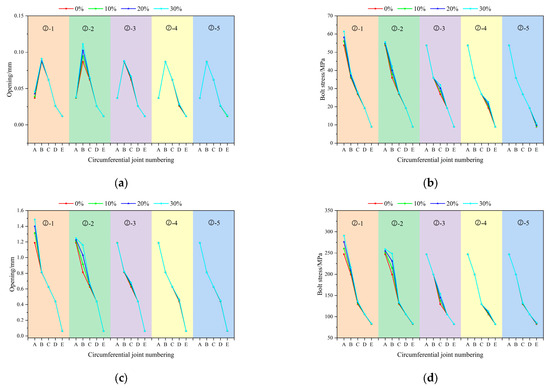
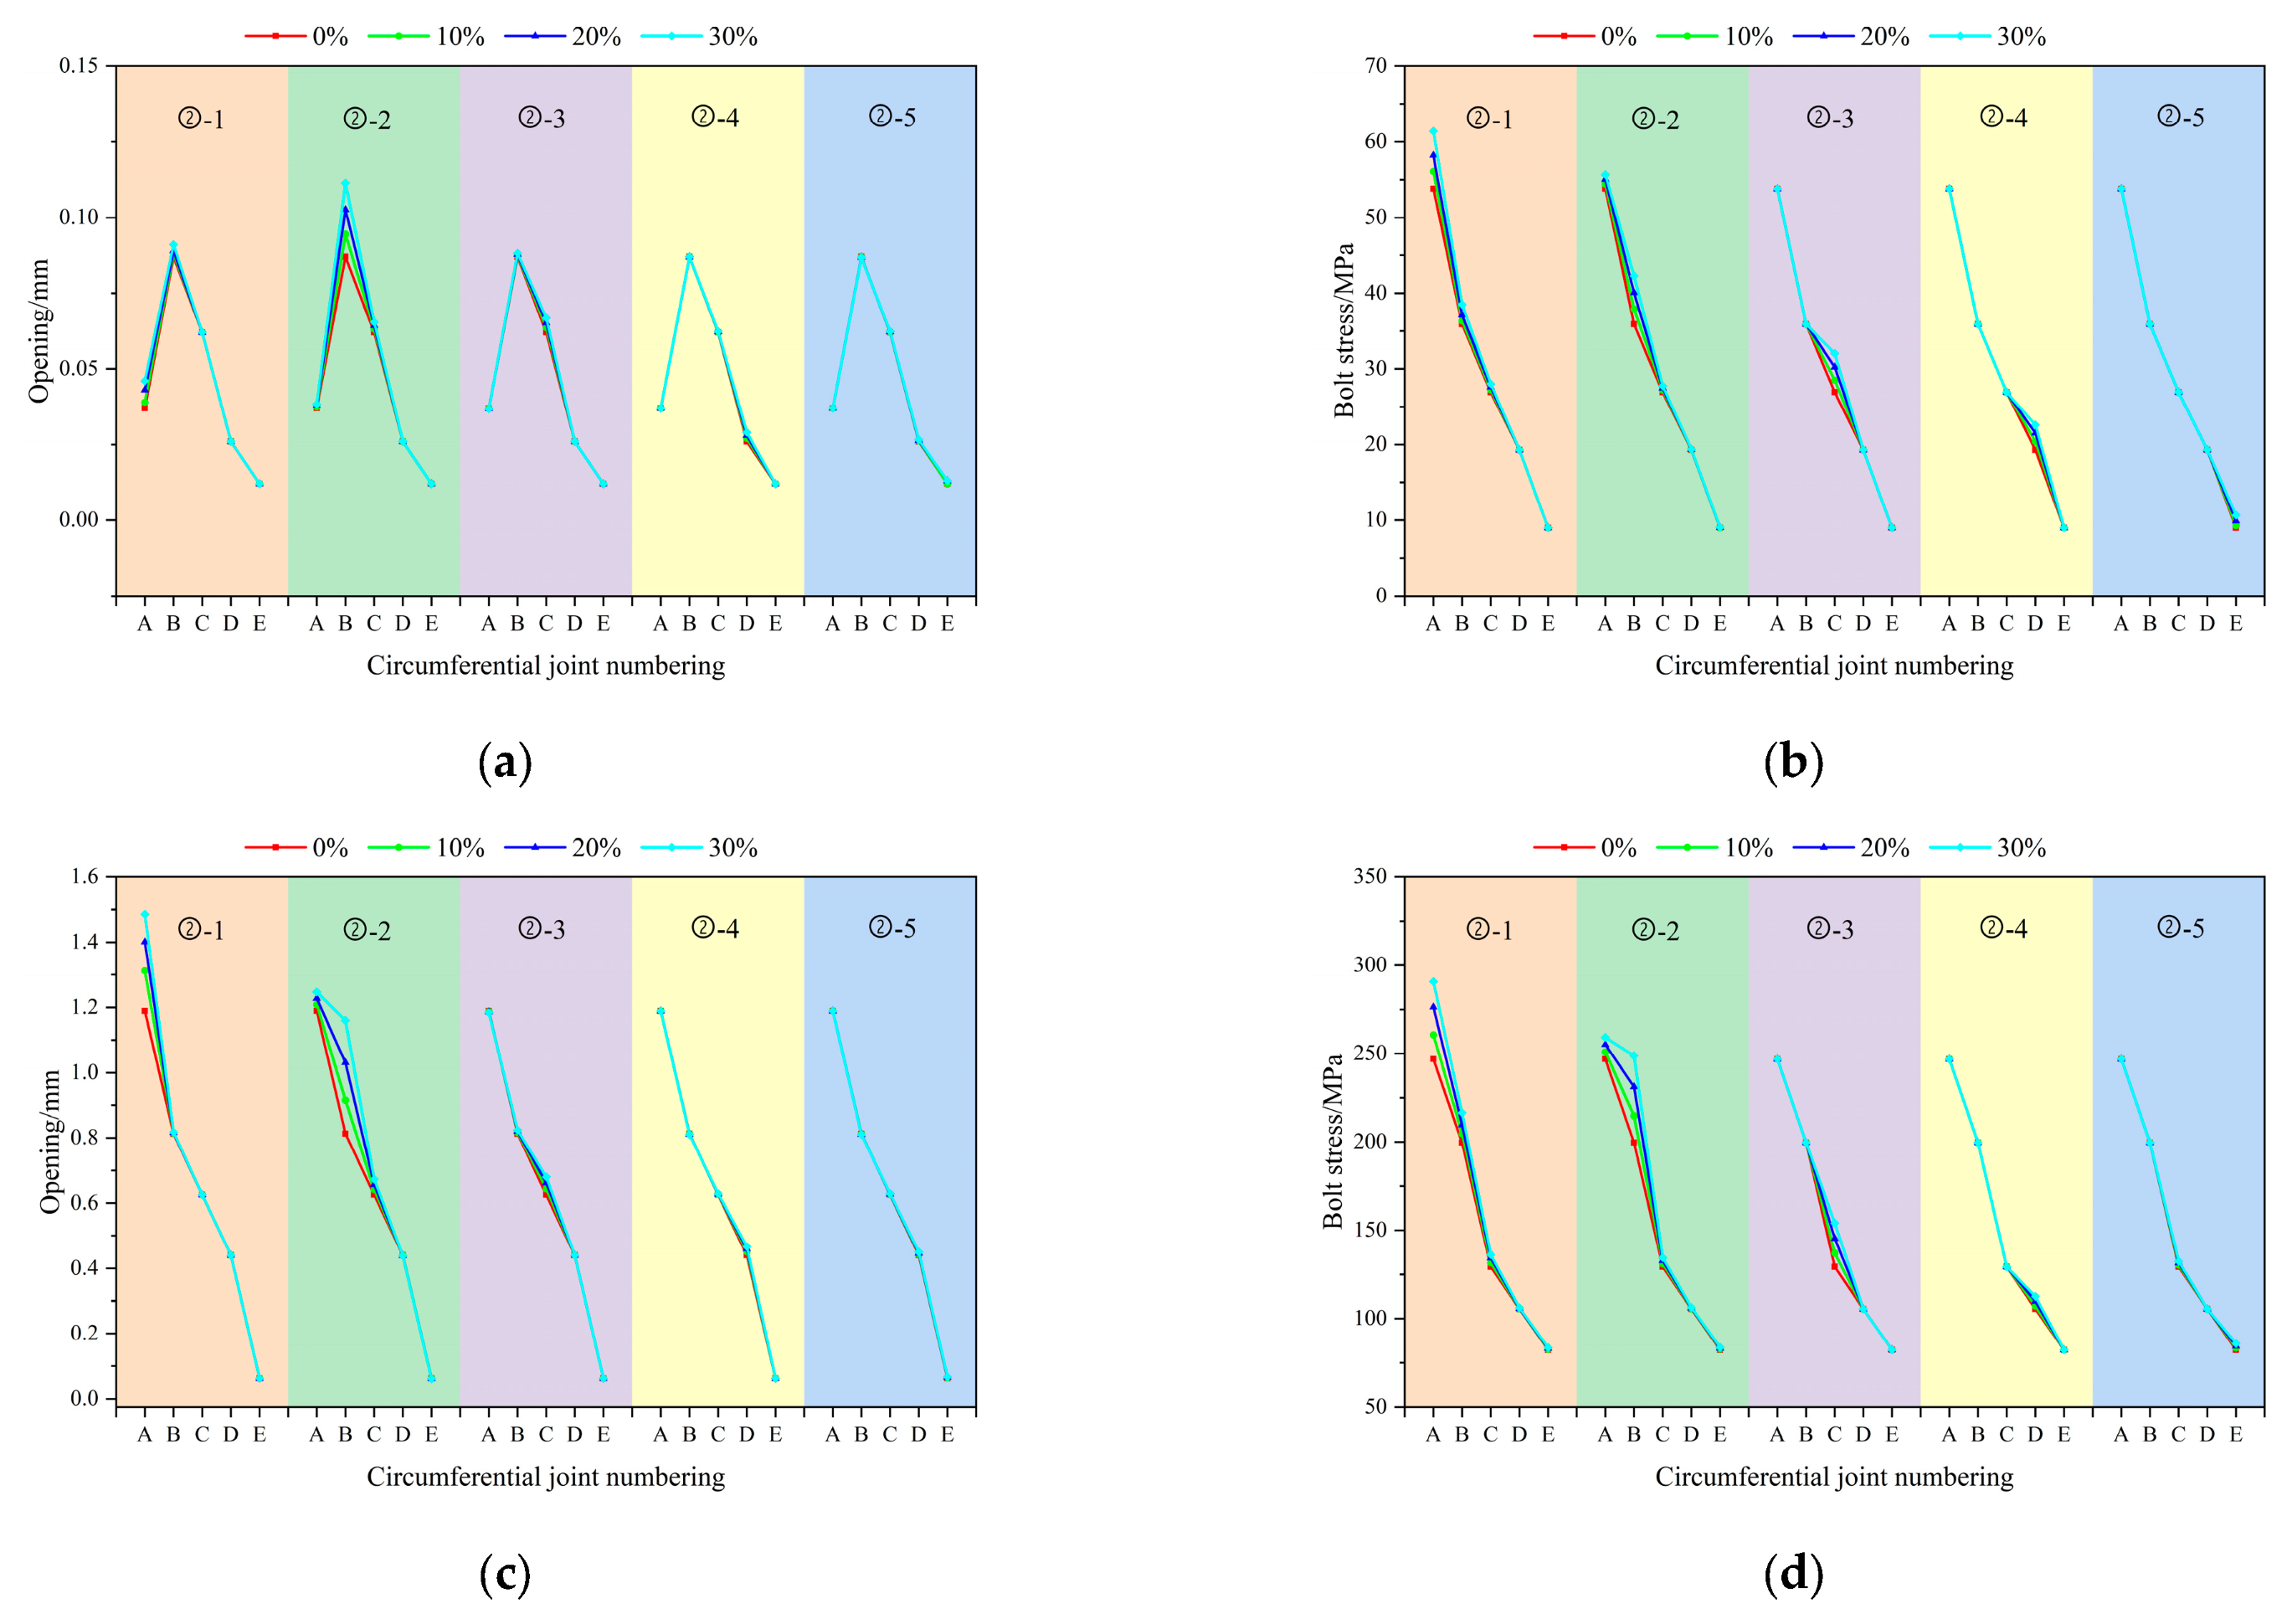
4.4. Case 4: Effect of Bolt Corrosion at Circumferential Joint
Figure 18a,b reveal that the influence of circumferential bolt corrosion exhibits a distinct spatial distribution pattern. Under uniform wave excitation, as the corrosion rate of the crown bolt (②-1) increases, the opening displacement of the circumferential joint in Zone B rises to 0.046 mm, representing a 21.1% increase, while the stress in bolt ②-1 escalates to 61.4 MPa, a 14.1% increment. The stress magnitude decreases progressively from the crown to the invert. With an increased corrosion rate of bolt ②-2, the opening at the circumferential joint in Zone B reaches 0.111 mm, also corresponding to a 21.1% increase. Under this excitation, the areas of higher response remain concentrated in the crown and shoulder regions: Zone B exhibits the relatively largest joint opening, and bolt ②-1 experiences the highest stress. However, the overall response level is lower compared to longitudinal bolt corrosion cases.
Figure 18.
Peak seismic response of tunnel circumferential joints: Case 4. (a) Peak opening of circumferential joints under uniform wave. (b) Peak bolt stress of circumferential joints under uniform wave. (c) Peak opening of circumferential joints under coherent traveling wave. (d) Peak bolt stress of circumferential joints under coherent traveling wave.
Figure 18c,d illustrate that under coherent traveling wave excitation, the effect of bolt corrosion at circumferential joints is markedly amplified, exhibiting a response that decreases sharply from the crown toward the invert. When bolt ②-1 is corroded, the opening in Zone A increases to 1.486 mm—a rise of 25.0%—while the stress in bolt ②-1 jumps to 290.8 MPa, corresponding to a 17.8% increase. Under this excitation, both the joint opening in Zone A and the stress in bolt ②-1 reach the maximum values, and the overall response level exceeds that observed in the longitudinal joint bolt corrosion cases.
A comparative analysis indicates that under circumferential joint bolt corrosion, both the joint opening in Zone A (crown) (1.486 mm) and the stress in bolt ②-1 (290.8 MPa) exceed those observed in longitudinal joint bolt corrosion cases. Moreover, the response essentially follows a decreasing distribution from the crown to the invert. Under coherent traveling wave excitation, the crown joint opening and bolt stress induced by circumferential joint corrosion can reach up to 10 times and 5 times the levels observed under uniform wave excitation, respectively. These amplification factors are markedly higher than those for longitudinal joint corrosion (2–3 times). To evaluate safety performance, the maximum responses are compared with typical engineering limits. The crown joint opening of 1.486 mm is below the allowable deformation of waterproof gaskets (2–3 mm), indicating no immediate leakage under the considered seismic excitation. The bolt stress of 290.8 MPa is about 45% of the yield strength of Grade 8.8 bolts (640 MPa), confirming that the bolts remain elastic and structural integrity is ensured. However, such significant stress amplification highlights the importance of corrosion protection. With continued corrosion, bolt stress may approach the yield limit during extreme earthquakes. Meanwhile, the concentrated response at the crown may cause uneven load redistribution, increasing the risk of progressive damage under repeated seismic loading. Therefore, when assessing the seismic performance of tunnels, it is essential to distinguish between the damage mechanisms associated with longitudinal and circumferential connection corrosion. Particular attention should be given to the amplification effect of spatially non-uniform ground motion on circumferential joint corrosion at the crown.
5. Conclusions
This study synthesized spatially non-uniform ground motion time histories compatible with the response spectrum specified in the Chinese seismic design code and developed a refined three-dimensional model capable of simulating the contact behavior between corroded bolts and the tunnel lining. A systematic analysis was conducted to investigate the seismic response of a long, large-diameter shield tunnel under the coupled effects of spatially non-uniform seismic excitation and time-dependent bolt corrosion. The main findings are summarized as follows.
- (1)
- A synthesis method was developed for spatially non-uniform ground motions that conform to the response spectrum stipulated in the Chinese seismic design code. The results confirm that such motions produce a pronounced amplification effect compared to uniform excitation. Owing to phase differences and asynchronous effects, coherent traveling waves amplify the tunnel’s vibration amplitude, inducing certain seismic responses up to 10 times greater than those under uniform waves. Traveling waves rank second, followed by coherent waves. This demonstrates that the spatial non-uniformity of ground motions is a critical factor in the seismic assessment of long, large-diameter tunnels.
- (2)
- Bolt corrosion markedly intensifies the seismic response of the tunnel, with the corrosion location being a critical factor influencing the contact behavior at the bolt–lining interface. Under spatially non-uniform seismic excitation, both the joint opening and bolt stress increase notably as the bolt corrosion rate rises. The seismic response induced by corrosion at circumferential joints is generally greater than that at longitudinal joints, and corrosion at combined longitudinal joint surfaces produces a stronger effect than that at a single longitudinal surface.
- (3)
- The seismic response of the shield tunnel exhibits a distinct spatial distribution pattern, with the crown region being the most critical. Under identical excitation and corrosion conditions, pronounced stress concentrations occur at the crown and shoulder, where both joint opening and bolt stress reach the maximum values. Under the typical cases examined in this study, the crown joint opening reaches 1.486 mm—below the waterproof gasket limit (2–3 mm)—and the bolt stress reaches 290.8 MPa, approximately 45% of the yield strength of Grade 8.8 bolts (640 MPa), thus confirming structural integrity. In contrast, the invert and springing regions show weaker responses, resulting in an overall pattern of stronger upper and weaker lower sections. Nevertheless, the significant corrosion-induced amplification underscores the need for corrosion protection, as more severe corrosion may exceed safety limits during strong or repeated earthquakes.
- (4)
- Several limitations of the present model should be acknowledged and addressed in future work. This study considered only far-field ground motions; however, near-field pulse-like excitations characterized by long-period velocity pulses may impose more severe seismic demands on long tunnels. Further investigation is warranted by employing spatially non-uniform pulse-like ground motion models. In addition, the current study assumes relatively uniform environmental conditions along the tunnel, which represents a simplification of real-site conditions. In practice, aggressive groundwater (e.g., low pH, marine environments) and vehicle exhaust in high-humidity conditions can significantly accelerate bolt corrosion. Future research should quantify the coupled effects of near-field pulse characteristics and spatially variable corrosion environments on tunnel joint damage, thereby providing more reliable guidance for the seismic design and long-term maintenance of long, large-diameter shield tunnels under complex service conditions.
Author Contributions
Conceptualization, H.W. and S.Z.; methodology, X.L. and Z.C.; validation and data curation, P.Z. and C.L.; writing—original draft preparation, P.Z. and H.W.; writing—review and editing, H.W. and X.L.; supervision and funding acquisition, S.Z. and C.L. All authors have read and agreed to the published version of the manuscript.
Funding
This research was funded by the First-Class Discipline Innovation Team of Henan, China, grant number CXTDPY-6, and Key Scientific and Technological Research Projects of Henan Province, China, grant number 242102320325.
Institutional Review Board Statement
Not applicable.
Informed Consent Statement
Not applicable.
Data Availability Statement
The original contributions presented in the study are included in the article; further inquiries can be directed to the corresponding author.
Conflicts of Interest
Author Panpan Zhao was employed by the company China Construction Second Engineering Bureau Second Construction Engineering Co., Ltd. The remaining authors declare that the research was conducted in the absence of any commercial or financial relationships that could be construed as a potential conflict of interest.
References
- Yu, S.; Jin, H.; Cao, M.; Liu, C. Effect of straight bolt corrosion on mechanical properties of shield tunnel under DC stray current. Structures 2022, 45, 1607–1620. [Google Scholar] [CrossRef] [Scilit]
- Yi, D.; Xue, H.; Yang, S.; Yu, B.; Feng, K.; Lin, G. Analysis of the influence of bolt failure of shield tunnel segment structure on transverse seismic response. Mod. Tunn. Technol. 2025, 62, 174–181. [Google Scholar] [CrossRef]
- Yin, J.; Jin, H.; Gong, Q.; Zhou, S. Effect of circumferential bolt corrosion on ultimate bearing capacity of shield tunnel. Chin. J. Undergr. Space Eng. 2020, 16, 508–515. [Google Scholar] [CrossRef]
- Suo, X.; Liu, L.; Qiao, D.; Xiang, Z.; Zhou, Y. Nonlinear seismic response of tunnel structures under traveling wave excitation. Buildings 2024, 14, 2940. [Google Scholar] [CrossRef] [Scilit]
- Wang, Z.; Cai, H.; Zhang, Y.; Hu, S.; Hong, G.; Xu, J.; Yu, Z.; Sun, Z. Numerical analysis of seismic vulnerability and dynamic response of underground interchange structures under traveling wave effects. Appl. Sci. 2025, 15, 12264. [Google Scholar] [CrossRef] [Scilit]
- Dong, F.; Fang, Q.; Zhang, D.; Xu, H.; Li, Y.; Niu, X. Analysis on defects of operational metro tunnels in Beijing. Civ. Eng. J. 2017, 50, 104–113. [Google Scholar] [CrossRef]
- Liu, H.; Song, K.; Ye, Z.; Wang, C.; Liu, H. Seismic fragility analysis of in-service shield tunnels considering surface building and joint-bolt corrosion. Soil Dyn. Earthq. Eng. 2022, 162, 107455. [Google Scholar] [CrossRef] [Scilit]
- Liu, H. Transverse Seismic Response of In-Service Shield Tunnel Considering Influences of Frame Structure. Ph.D. Thesis, Huazhong University of Science and Technology, Wuhan, China, 2023. [Google Scholar]
- Zhang, D.; Chen, C. Time-dependent reliability analysis of shield tunnel structure under corrosion conditions of segment rebars and bolts. Mod. Tunn. Technol. 2021, 58, 111–120. [Google Scholar] [CrossRef]
- Qu, T.; Wang, Q. Responses of underground pipeline to multi-support longitudinal excitations. Earthq. Eng. Eng. Vib. 1993, 13, 39–46. [Google Scholar] [CrossRef]
- Li, N.; Chen, H.; Li, Z. An improved displacement input method for non-uniform seismic excitation: Error analysis and application. J. Vib. Shock 2022, 41, 85–92. [Google Scholar] [CrossRef]
- Liu, H.; Yan, W.; Chen, Y.; Feng, J.; Li, D. Seismic response analysis of hydraulic tunnels under the combined effects of fault dislocation and non-uniform seismic excitation. Water 2024, 16, 3060. [Google Scholar] [CrossRef] [Scilit]
- Hao, H.; Oliveira, C.S.; Penzien, J. Multiple-station ground motion processing and simulation based on SMART-1 array data. Nucl. Eng. Des. 1989, 111, 293–310. [Google Scholar] [CrossRef] [Scilit]
- Qu, T.; Wang, Q. Simulation of spatial correlative time histories of multi-point ground motion, Part I: Fundamental formulas. Earthq. Eng. Eng. Vib. 1998, 18, 8–15. [Google Scholar] [CrossRef]
- Qu, T.; Wang, Q. Simulation of spatial correlative Time Histories of Multi-point ground motion, Part II: Application of fundamental formulas. Earthq. Eng. Eng. Vib. 1998, 18, 25–32. [Google Scholar] [CrossRef]
- Ding, Y.; Xu, Y.; Miao, H. Simulation of strong earthquake ground motions based on the phase derivative. Buildings 2024, 14, 2048. [Google Scholar] [CrossRef] [Scilit]
- Lin, Q.; Peng, G.; Zhang, Q.; Chen, D.; Chen, Z.; Xu, W. Non stationary coherence functions related to sites and their engineering applications. J. Vib. Shock 2023, 42, 144–152. [Google Scholar] [CrossRef]
- Lei, H.; Li, S.; Huang, B. Train-bridge coupling vibration of long-span railway cable-stayed bridge under non-uniform seismic excitation. Earthq. Eng. Eng. Dyn. 2022, 42, 213–221. [Google Scholar] [CrossRef]
- Li, Y.; Ji, W.; Chen, H. Comparative analysis and research on seismic response for uniform excitation and non-uniform excitation of large-span railway suspension bridge. Chin. Railw. 2021, 9, 53–59. [Google Scholar] [CrossRef]
- Lv, Y.; Wang, Y. Response analysis of large-span truss stringstructure under non-uniform ground motion excitation. Build. Struct. 2025, 55, 15–20+49. [Google Scholar] [CrossRef]
- Deng, J.; Zhao, Q.; Lin, Z.; Peng, X. Seismic response of ultra-long steel reinforced concrete structures under spatial effects. J. Vib. Shock 2024, 43, 163–176. [Google Scholar] [CrossRef]
- He, W.; Song, J.; Xu, Y.; Du, X.; Wu, H. Influence of earthquake input models on seismic response analysis for gravity dams. J. Hydroelectr. Eng. 2025, 44, 134–142. [Google Scholar] [CrossRef]
- Yuan, Y.; Bai, Y.; Liu, J. Assessment service state of tunnel structure. Tunn. Undergr. Space Technol. 2012, 27, 72–85. [Google Scholar] [CrossRef] [Scilit]
- Du, Y.; Clark, L.; Chan, A. Residual capacity of corroded reinforcing bars. Mag. Concr. Res. 2005, 57, 135–147. [Google Scholar] [CrossRef]
- Wang, G.; Ba, F.; Sun, F.; Yuan, M.; Hao, P. Seismic response analysis of long shield tunnels under non-uniform excitation. Chin. J. Geotech. Eng. 2020, 42, 1228–1237. [Google Scholar] [CrossRef]
- Liu, T.; Hong, H. Simulation of multiple-station ground motions using stochastic point-source method with spatial coherency and correlation characteristics. Bull. Seismol. Soc. Am. 2013, 103, 1912–1921. [Google Scholar] [CrossRef] [Scilit]
- Zhou, P.; Chao, S. Parameters research on seismic power spectrum model based on the new seismic design code for buildings. Build. Struct. 2013, 43, 430–435. [Google Scholar] [CrossRef]
- Lin, Y.; Liu, T.; Su, B. Parameter study of an improved K-T power spectrum model corresponding to the acceleration spectrum in GB50011-2010. Earthq. Resist. Eng. Retrofit. 2021, 43, 135–143+134. [Google Scholar] [CrossRef]
- GB 50909-2014; Code for Seismic Design of Urban Rail Transit Structures. China Architecture & Building Press: Beijing, China, 2014.
- Yu, R.; Wang, S.; Yu, Y. Reviewing of stochastic description of the spatial variation of ground motion and coherence function model. Rev. Geophys. Planet Phys. 2021, 52, 194–204. [Google Scholar] [CrossRef]
- Jennings, P.; Housner, G.; Tsai, N. Simulated Earthquake Motions; Earthquake Engineering Research Laboratory, California Institute of Technology: Pasadena, CA, USA, 1968. [Google Scholar]
- Li, F.; Si, P.; He, Y.; Wang, H.; Zhang, Z.; Zhao, S. Numerical analysis of the single-directionally misaligned segment behavior of hydraulic TBM tunnel. Buildings 2024, 14, 2198. [Google Scholar] [CrossRef] [Scilit]
- Chen, M.; Yan, Z.; Jing, X.; Ou, J.; Wu, S.; Liu, T. Numerical Analysis and Safety Assessment of Dynamic Response of Natural Gas Pipelines Under Vibration Loads from High-Speed Railway Tunnels. Appl. Sci. 2026, 16, 585. [Google Scholar] [CrossRef] [Scilit]
- Deng, C.; He, G.; Zheng, Y. Studies on Drucker-Prager yield criterions based on M-C yield criterion and application in geotechnical engineering. Chin. J. Geotech. Eng. 2006, 28, 735–739. [Google Scholar] [CrossRef]
- Zhao, W.; Zhong, K.; Chen, W.; Xie, P. A quasi-static finite element approach for seismic analysis of tunnels considering tunnel excavation and P-waves. Earthq. Struct. 2022, 22, 349–359. [Google Scholar] [CrossRef]
- Li, F.; Si, P.; He, Y.; Wang, H.; Zhang, Z. Case studies of the load-bearing performance of shield tunnel segment with misaligned defects. Sci. Rep. 2024, 14, 17370. [Google Scholar] [CrossRef] [Scilit]
- Liu, J.; Lv, Y. A direct method for analysis of structure foundation dynamic interaction. Civ. Eng. J. 1998, 31, 55–64. [Google Scholar] [CrossRef]
- Ding, Z.; Chen, Y.; Zi, H. Study on artificial boundary and ground motion input method in tunnel seismic response. Earthq. Eng. Eng. Vib. 2022, 42, 52–61. [Google Scholar] [CrossRef]



Disclaimer/Publisher’s Note: The statements, opinions and data contained in all publications are solely those of the individual author(s) and contributor(s) and not of MDPI and/or the editor(s). MDPI and/or the editor(s) disclaim responsibility for any injury to people or property resulting from any ideas, methods, instructions or products referred to in the content. |
© 2026 by the authors. Licensee MDPI, Basel, Switzerland. This article is an open access article distributed under the terms and conditions of the Creative Commons Attribution (CC BY) license.