


Featured Application
The proposed framework optimizes ridesplitting services for mega-events with reservation-based travel. It enhances service rates and controls passenger delays by efficiently matching vehicles and passengers through offline grouping and online dispatching algorithms, aiding event mobility management.
Abstract
Ridesplitting is a promising strategy to enhance vehicle efficiency in urban mobility services during mega-events. However, designing dispatching algorithms that effectively balance high service rates with acceptable passenger delays under high-demand, reservation-based scenarios remains a significant challenge. To address this issue, this study proposes a novel two-stage dispatch framework: Offline Grouping and Online Matching (OGOM). In the offline stage, the request grouping problem is formulated as a weighted hypergraph maximum matching (WHMM) problem. A sequence inference (SI) method is introduced to accelerate the construction of candidate ridesplitting trips, and the WHMM problem is solved optimally using the Gurobi solver. In the online stage, the dispatch process is completed within an event-based simulation environment built with MATSim. The framework is validated through a comprehensive case study of the Hangzhou Asian Games. The results demonstrate that the proposed OGOM framework achieves a mean service rate of 92.12%, representing an 8.74% improvement over a rolling horizon batching benchmark. Concurrently, the average passenger delay is maintained between 2 and 4 min across all simulation runs. Furthermore, the framework reduces the average request completion distance by over 30% compared to a non-ridesplitting baseline. The proposed SI method also shows a 49.35% reduction in computation time for hypergraph construction compared to conventional methods. These findings confirm that the OGOM framework provides an effective and scalable operational strategy for mega-event ridesplitting services, simultaneously improving service quality through optimized supply–demand matching and controlled passenger delays.
1. Introduction
The 19th Asian Games in Hangzhou attracted participants and spectators from all over the world. To provide high-quality transportation services for guests, athletes, coaches, and technicians, the 19th Asian Games Hangzhou 2022 Organizing Committee has arranged more than 2000 vehicles to provide transportation services, including a mobility reservation service where passengers can book rides in advance [1]. Upon receiving aggregated reservations, the platform must efficiently coordinate the limited transportation supply with concentrated travel demand.
For mega-events like the Asian Games, the quality of transportation services is crucial for passengers’ travel experience and the event’s success [2]. Nationwide planned special events in the U.S. generate 93.4 to 186.8 million hours of annual travel delay, with an average delay of 0.8–1.7 h per traveler, resulting in congestion losses of $1.7–3.4 billion [3]. These quantitative data clearly demonstrate the importance of traffic organization and planning during mega-events. A central challenge for mobility service platforms is accommodating overflowing demand with limited vehicle supply. As a type of green, efficient, and sustainable ride service, ridesplitting can suit transportation needs. Ridesplitting is a form of ridesourcing service that allows passengers with nearby origins and/or destinations to match the same vehicle in real time and share a trip segment [4]. Ridesplitting can improve vehicle efficiency, bringing benefits such as reducing vehicle mileage [5], alleviating traffic congestion [6], reducing fossil fuel consumption and exhaust emissions [7], etc. Therefore, many transportation network companies have launched ridesplitting services, such as DiDi ExpressPool and UberPool. Although there are many benefits, ridesplitting has a drawback that cannot be ignored: vehicles take additional detours, leading to increased passenger waiting time and delay [8]. Therefore, for reservation-based event transportation, it is critical to design dispatching algorithms that can simultaneously achieve a high service rate and control passenger delays within an acceptable range.
To address the above challenges, this paper focuses on two core questions: (a) How to improve the service rate of requests while maintaining a low-level passenger delay? (b) How to solve the ridesplitting dispatching problem efficiently?
Accordingly, we propose a novel two-stage dispatch framework: Offline Grouping and Online Matching (OGOM). This framework divides the dispatching process into two stages: offline grouping and online matching. In the grouping stage, we propose a sequence inference (SI) method to calculate candidate ridesplitting trips and construct the corresponding hypergraph. Then, the grouping problem of requests is transformed into a weighted hypergraph maximum matching (WHMM) problem and solved by Gurobi, combining requests into ridesplitting trips. In the matching stage, we employ MATSim software to establish an event-based simulation model. Then, we dispatch vehicles to ridesplitting trips in the simulation environment.
We use a numerical case study of the 19th Asian Games in Hangzhou to validate the effectiveness of the proposed framework at mega-events. First, compared with the benchmark, the service rate of the proposed framework can be improved by 8.74%, while the average passenger delay remains at a low level. Second, the average completion distance of requests can be decreased by over 30%. Third, the computational efficiency of the SI method proposed in this paper is significantly higher than benchmarks.
The main contributions of this paper can be summarized as follows:
(a) Domain-Specific Investigation. We systematically investigate the application of ridesplitting to large-scale, reservation-based event transportation. Through tailored modeling and simulation, we generate novel operational insights into the efficiency potential of ridesplitting in this specific context.
(b) Algorithmic Innovations. To tackle the computational complexity of the problem, we design and implement a key algorithmic enhancement within a two-stage dispatch framework, namely the SI Method.
(c) Practical Implications. Based on comprehensive simulation experiments, we derive practical insights for event mobility management, such as the quantitative benefits of ridesplitting on service rate and vehicle utilization.
The remainder of the paper is as follows. Section 2 reviews the related literature on transportation management for mega-events, ridesplitting optimization, and traffic simulation. Section 3 elaborates on the primary process of ridesplitting dispatching in mobility reservation scenarios. Section 4 proposes a two-stage dispatch framework of ridesplitting based on the MATSim simulation model. Section 5 describes the experimental configuration. Section 6 presents the main results of the simulation experiments and sensitivity analysis. Section 7 discusses the main findings of the experiments. Finally, Section 8 draws conclusions and provides an outlook on future research.
2. Literature Review
2.1. Mobility Planning for Mega-Events
Hosting mega-events is a significant test of urban transportation systems [9,10]. Under limited infrastructure conditions, mobility services are crucial for improving transportation system efficiency. Event participants consider these services essential, making their improvement a priority for organizers [11].
Early studies mainly focused on infrastructure expansion and the improvement of public transit network utilization. At the 2016 Rio de Janeiro Olympics, Xu and González [12] integrated considerable data resources to estimate the impact of mega-events on urban transportation deeply and proposed a series of strategies aimed at the collective good of the city. The results indicated that even if a few people switched from private cars to public transportation, the underlying total travel time could be significantly reduced. Pereira [13] analyzed the transportation system transformation in Rio de Janeiro in preparation for the 2014 World Cup and 2016 Olympics, including expanding public transportation infrastructure, adjusting service levels, and restructuring bus lines. The results indicated that these developments successfully increased the accessibility of Olympic venues.
However, merely relying on infrastructure expansion and increasing public transport usage is no longer sufficient to fully meet transport demand for mega-events nowadays. Recent research increasingly emphasizes on-demand ride services and shared mobility as essential components of event mobility strategies. Ballarano et al. [14] conducted a systematic review of sustainable mega-event transport, identifying on-demand mobility such as ridesourcing, ridesplitting, and intelligent information systems as particularly effective in reducing reliance on private cars. Borghetti et al. [15] analyzed the impact of transportation planning for hosting mega-events on urban development, examined the specific characteristics of different solutions, explored new transportation modes, and provided customized intelligent transportation options to meet travel demands. Zhao et al. [16] conducted an online stated preference survey on the travel process for the Hangzhou 2022 Asian Games, discussing the potential application of Mobile as a Service (MaaS) in mega-events. The survey results showed that about 80% of respondents were willing to subscribe to bundle services (e.g., public transit plus metro). Ranjbarnia et al. [17] proposed an event-tailored MaaS solution for the Brisbane 2032 Olympics, stressing that integrated ticketing, differentiated services, and flexible scheduling are crucial for handling peak event demand.
Beyond infrastructure and on-demand ride services, recent studies have explored other planning perspectives. At the governance level, Covelli Garrido et al. [18] applied a living lab approach, showing that decision-support systems are more effective when combined with participatory planning and stakeholder engagement. Additionally, An et al. [19] proposed a distributionally robust optimization model for flexible scheduling of customized buses, explicitly addressing demand uncertainty in mega events.
In summary, extant research has effectively outlined a strategic shift in mega-event mobility—from infrastructure-centric expansion to on-demand ride services. However, these studies reveal a critical operational gap: a main focus on what services to provide, with insufficient attention to how to manage and optimize the fleets that provide these services efficiently under extreme, event-driven demand. Therefore, this paper focuses on addressing this fleet operation and management challenge, which is crucial for modern mega-event mobility services.
2.2. Ridesplitting Dispatching
Implementing ridesplitting service offers a key method to better manage and optimize vehicle fleets under peak demand. By improving vehicle utilization rates, ridesplitting enables a smaller fleet to meet more travel demands, thereby increasing the user base while also strengthening users’ willingness to share rides with strangers [20]. However, ridesplitting’s inherent drawbacks, such as detours and passenger delays, may negatively affect the user experience. As a result, numerous studies have focused on improving the quality of ridesplitting services by increasing service rates, reducing waiting times, minimizing detours, and lowering travel costs [4,21].
Recent analytical studies on ridesplitting have aimed to quantify its efficiency gains while also revealing critical operational challenges. Bilali et al. [22] proposed an analytical model and verified it through simulation to evaluate the impact of factors such as delay and reservation time on the shared rate. Ouyang et al. [23] formulated an analytical model with limited waiting time and detours in reservation scenarios and used approximate formulas to represent the service rate, expected vehicle travel distance, and passenger travel distance. The numerical experimental results indicated that ridesplitting reduced the vehicle mileage of all users. From the energy consumption perspective, Dai et al. [24] designed an autonomous taxi ridesharing system for commuting trips. The case study showed that the taxi ridesharing service model required fewer vehicles than the private car travel model and was superior to traditional taxi service models in terms of fuel consumption. For the shared autonomous vehicle (SAV) service in the reservation scenario, Narayanan et al. [25] constructed a bilevel model based on game theory and proposed a solution method based on iterative optimization and assignment so that both road users and SAV service operators could obtain the optimal solution by reaching a Nash equilibrium. The results indicated that the SAV system reduced travel time and vehicle kilometers traveled and alleviated traffic congestion problems. Based on real-world demand data from New York City and a stated preference study on traveler behavior from the Netherlands, the numerical experiments conducted by Bujak and Kucharski [26] emphasized the critical role of heterogeneous riders in non-deterministic ridesplitting environments. Their findings reveal that failing to account for this heterogeneity can lead to overestimated system efficiency. Park et al. [27] introduced order dispatching with walking points, showing that modest passenger walking expands feasible matches and increases assignment rates without harming service quality. Simulation results indicate that even short walking allowances can significantly reduce unmatched requests, suggesting a promising strategy to enhance pooling efficiency in dense urban settings.
The optimization of ridesplitting dispatching has been addressed in the literature through several key methodological approaches. Zhan et al. [21] used a modified artificial bee colony algorithm to solve the ride-hailing sharing problem and a contraction hierarchies algorithm to determine the optimal path of vehicles. Mühle et al. [28] developed an analytical framework to model ridesplitting efficiency and required fleet size, linking VRP formulations with capacity and demand variability. In parallel to these VRP-based formulations, a significant body of research has explored the use of the shareability network to efficiently compute ridesplitting strategies for large-scale request datasets. Santi et al. [29] defined a shareability network and applied it to a dataset of millions of taxi trips in New York City and obtained the optimal ridesharing plan in the reservation scenario. Alonso Mora et al. [5] proposed a request-trip-vehicle graph based on the shareability network and constructed an integer linear programming model for the ridesplitting dispatching problem in real time, thereby dynamically generating the optimal path based on requests and vehicle positions. They conducted simulation experiments based on the New York City taxi dataset and found that the proposed algorithm could significantly reduce fleet size while maintaining the service level. To explore the potential of ridesplitting during peak hours, Tu et al. [30] developed a ridesplitting trip identification algorithm based on a shareability network and evaluated the gap between the potential and actual scale of ridesplitting using ridesourcing data provided by DiDi Chuxing. Pavone et al. [31] modeled applications similar to ridesplitting and delivery as an online hypergraph matching problem, maximizing utility and minimizing cost as optimization objectives. Bujak & Kucharski [32] examined the shareability network, clarifying how network topology affects feasible pooling opportunities and offering insights for pruning and batching. Their study highlights those structural properties, such as degree distribution and clustering, that directly determine the density of feasible matches and, thus, the overall scalability of ridesplitting systems.
Similar to ridesplitting, demand-responsive transit (DRT) has developed sophisticated strategies for optimizing operational efficiency and service equity, which provide valuable methodological insights. For instance, studies have utilized data-driven models like the Gaussian Mixture Model (GMM) to classify heterogeneous user groups (e.g., individuals with disabilities) and tailor dedicated vehicle routing solutions, significantly improving service equity and wait times [33]. Concurrently, advancements in real-time optimization, such as Gene Expression Programming (GEP)-based ride insertion policies, have demonstrated high efficiency in dynamic environments by learning optimal insertion rules, offering a pathway to reduce computational overhead for online dispatch [34]. Furthermore, comprehensive frameworks that integrate time-dependent travel times, electric vehicle charging constraints, and shared mobility objectives highlight the importance of multi-faceted modeling in complex urban systems [35].
In recent years, simulation has become a cornerstone in modeling and optimizing transportation systems, providing a virtual testbed for evaluating complex operational strategies [36]. To solve the matching problem between drivers and passengers in a dynamic ridesharing context, Agatz et al. [37] developed optimization-based approaches and conducted a simulation study based on travel demand data from metropolitan Atlanta. Pan et al. [38] developed a simulator for evaluating ridesplitting algorithms and provided a set of benchmarks to test various scenarios encountered in the real world. Sun et al. [39] analyzed ridesplitting’s efficiency and environmental benefits using SUMO simulation software. Zhan et al. [40] developed a discrete-time simulation model for simulating the operation of electric ridesourcing vehicles and charging stations and used the artificial bee colony algorithm and CPLEX to solve the vehicle charging problem and ridesourcing matching problem, respectively. Limited by safety issues, SAVs have not been widely used in the real world. Therefore, many studies use simulation models to assess the impact of SAVs on urban transport systems, including the impact on urban congestion [41], fleet size [42], operational strategies [43] and urban parking demand [44,45]. Yao et al. [46] proposed a data-driven agent-based modeling and simulation framework and comprehensively tested the mixed scenarios with different penetration rates of autonomous vehicles.
In summary, while current research on ridesplitting has made substantial progress for regular urban scenarios, studies specifically addressing the unique challenges of mega-events—characterized by explosive demand surges with strict spatiotemporal constraints—remain limited. This paper addresses this gap by proposing a two-stage dispatch framework that advances prior work in three key aspects: (1) adapting the shareability network/hypergraph model to the mega-event context; (2) introducing novel offline grouping approaches for proactive, large-scale optimization, differing fundamentally from purely real-time reactive systems; and (3) integrating optimization with traffic simulation for end-to-end, operational evaluation. This tailored framework aims to provide an efficient and scalable solution for ridesplitting dispatch in mega-events.
3. Problem Statement
This paper addresses the ridesplitting dispatching problem at mega-events within the context of mobility reservations. Before dispatching, the platform combines the received reservation requests into trips, including ridesplitting trips and non-ridesplitting trips. Subsequently, the platform assigns these trips to a fixed-scale fleet to complete the dispatch process. Meanwhile, the waiting time and delay of passengers are strictly limited, and once the waiting time exceeds the preset maximum threshold, the request will be canceled. Furthermore, the dynamic evolution of vehicle allocation over time presents a complex dynamic optimization problem.
We divide the ridesplitting dispatching problem into two subproblems: (a) How to combine requests into ridesplitting trips (i.e., request grouping); (b) How to match ridesplitting trips with vehicles (i.e., vehicle dispatching). The objective is to maximize the number of requests satisfied by a fixed-scale fleet. This section mainly introduces the problem assumptions and variable notations used in this paper and the primary process of ridesplitting dispatching in reservation scenarios.
3.1. Variable Notation
Variable notations are shown in Table 1.
Table 1.
Notation.
3.2. Assumptions
The ridesplitting dispatching problem is based on the following assumptions:
(a) Once the ridesplitting dispatching process begins, the newly added requests are not considered and only idle vehicles can participate in the process.
(b) All considered requests are ridesplitting requests.
3.3. Ridesplitting Dispatching Process
In mobility reservation scenarios, the ridesplitting platform combines requests that can share a ride based on the spatiotemporal information of the requests and then performs subsequent supply–demand matching. Therefore, we divide the ridesplitting dispatching process into the following two stages:
Stage 1: Offline Grouping. All requests are combined into trips, including ridesplitting trips and non-ridesplitting trips (single request trips that cannot be combined).
Stage 2: Online Matching. Trips are matched to idle vehicles during each matching period.
For illustrative purposes, Figure 1 shows the ridesplitting dispatching process. Figure 1a shows an example of ridesplitting in an urban road network. The ridesplitting platform has three vehicles , and receives five requests with a reserved departure time within the period . The positions of origins and destinations are represented by black half-body portraits and red markers, respectively, while the position of is represented by black vehicle icons.
Figure 1.
Ridesplitting dispatching process. (a) Initial request routing (yellow lines) with destinations (–), origins (–), and vehicles (–); (b) Mapping of Candidate Ridesplitting Trips (–) to hyperedges (–); (c) Hypergraph matching with nodes – and hyperedges , ; (d) Routes of CRTs (red = , blue = ); (e) Task assignment (solid arrows link and to / and /); (f) Vehicle routes ( in red, in blue).
Figure 1b–d corresponds to the primary process of Stage 1. The essence of offline grouping is to select several trips with no common requests between pairs from , and these trips form trip set . This process is similar to the act of selecting a matching from a hypergraph. The matching refers to a subset of the edge set (for simplicity, we use “edge” as an abbreviation for “hyperedge” when it is clear that we are discussing a hypergraph).
The left side of Figure 1b is a set of candidate ridesplitting trips, represented by . Each candidate’s ridesplitting trip consists of two or three requests, namely:
These requests meet the restrictions on ridesplitting, which means that passengers’ waiting time and delay are less than the pickup and drop-off time window . Given hypergraph , vertex in corresponds to . A hyperedge is a set composed of several vertices. Edge and the candidate ridesplitting trip correspond one by one, as shown in Figure 1b. Figure 1c is a schematic diagram of , where black dots represent and dashed boxes represent . Each edge has a weight, and the weight function is related to the optimization objective.
A matching of corresponds to a grouping strategy for requests. The optimal grouping strategy corresponds to the maximum weighted matching of , which is the matching with the maximum sum of edge weights. Therefore, the request grouping problem can be transformed into a weighted hypergraph maximum matching problem. For example, Figure 1c shows a maximum weighted matching of , where colored boxes represent the edges included in , namely . These two edges correspond to two candidate ridesplitting trips . Therefore, in Stage 1, two trips are obtained through offline grouping, and they will enter Stage 2 for online matching with vehicles.
Figure 1d shows the routes of in different colors. Each route passes through the origin and destination of each request included in the corresponding trip. Taking the red route of as an example, it passes through four locations in sequence (), thus completing two requests.
Figure 1e corresponds to the primary process of Stage 2. First, we renumber the trips as (). Second, we model the matching process between and as a task assignment problem and obtain the optimal matching solution, which is the solid lines in Figure 1e.
Figure 1f shows the vehicle routes in different colors, where dashed lines represent routes to trip origins, and solid lines represent routes delivering passengers. Taking the route of completing as an example, first follows the red dashed line to reach the origin of and picks up the passenger, and then completes the request task along the red solid line.
4. Materials and Methods
Based on Section 3, the critical problem in Stage 1 is to construct a hypergraph and solve the WHMM problem, and the key problem in Stage 2 is to model and solve the task assignment problem. This section proposes the methods to tackle the above two subproblems.
4.1. Framework
We establish an offline grouping and online matching (OGOM) framework for ridesplitting dispatch, as shown in Figure 2, including three parts: simulation model, optimization modules, and ridesplitting dispatching optimization process. The simulation model is mainly used to compute the trip completion process, consisting of basic data, model calibration, and simulation environment. The optimization modules are used to solve the two subproblems in Stage 1 and Stage 2, consisting of the request grouping module and supply–demand matching module. The ridesplitting dispatching optimization process is the main flow of the ridesplitting service.
Figure 2.
Two-stage framework for ridesplitting dispatch.
4.2. Simulation Model
As shown in Figure 2, an event-based simulation model is built for computing the traveling and routing of vehicles when they are working on trip tasks (pick up and deliver passengers according to planned routes) or are idle. We use the simulation software MATSim 13.0 to build the simulation model. The basic data used for model development include road network data, cellular signaling data and travel time dataset. The simulation model takes into account the background travel demand of private cars and is calibrated with travel time obtained from the navigation API service. The main steps for constructing and calibrating the simulation model are as follows:
First, the road network in the simulation model is constructed, and the background traffic demand in the simulation model is generated based on cellular signaling data. Second, the travel time of important roads is selected as the calibration object for comparing the simulated travel time with the ground truth. The simulation model is calibrated by adjusting the traffic demand of key OD pairs until the following criterion is met:
where Equation (3) indicates that the normalized root mean square error (NRMSE) is less than , which is an acceptable threshold for traffic model calibration. is the number of calibration objects, is the actual travel time and is the simulated travel time. The calibrated simulation model will serve as the simulation environment for algorithm testing.
4.3. Optimization Modules
4.3.1. Request Grouping Module
The request grouping module is the primary optimizer in Stage 1, with the main steps including hypergraph construction and solving the WHMM problem.
In the request grouping module, the first step is to construct hypergraph , where vertex set corresponds to request set . Determining edge set depends on whether the requests corresponding to these nodes can be combined into a candidate ridesplitting trip.
Identifying a ridesplitting trip hinges on establishing the sequence of origins and destinations for the requests, reflecting the order of passenger pickups and drop-offs. As shown in Figure 3, there is only one sequence mode for the two-request trip: reach the two requests’ origins and then reach their destinations. There are two sequence modes for the three-request trip. Mode 1 reaches the three requests’ origins first and then reaches their destinations. Mode 2 arrives at the origins of two requests, reaches the destination of one request, goes to the origin of the third request, and then reaches the destinations of the remaining two requests.
Figure 3.
Illustration of ridesplitting trips. (a) Two-request trip; (b) Three-request trip (mode 1); (c) Three-request trip (mode 2).
The mutual sequence between origins (destinations) can be changed in each sequence mode. Taking a two-request trip as an example, there are 4 sequence situations: (), (), (), and (). The sequence situations of three-request trips are even more complex, with 60 different situations.
The requests can be combined into a candidate ridesplitting trip as long as there is one sequence situation meeting the following constraints:
These two constraints indicate that the vehicle must arrive at the origin and destination of each request within , representing the maximum waiting time and maximum delay that passengers can accept. As shown in Figure 3, () on the time axis are all located to the left of (). represents the reserved departure time of , and represents the expected arrival time of without ridesplitting. and represent the departure and arrival time of in the candidate ridesplitting trip. , and need to call the optimal path module for calculation. When calculating candidate ridesplitting trips, the first request departs on time, i.e., .
Given request set with reserved departure time during period , there are many methods for calculating candidate ridesplitting trips (Appendix A). However, both the exhaustive method and rolling time window (RTW) method exhaustively list 60 sequence situations when calculating three-request trips, resulting in a long computation time. To address this issue, we propose an SI method that infers the sequence of three-request trips based on the sequence of two-request trips. The SI method also adopts a rolling time window approach to accelerate the calculation speed. Figure 4 shows two examples of inferring the sequence of three-request trips. Given requests , and , first determine if they can be combined pairwise. The three requests in Figure 4a can be combined pairwise, corresponding to mode 1 in Figure 3b. In Figure 4b, two requests cannot be combined, corresponding to mode 2 in Figure 3c. Then, infer the sequence of the three-request trips based on the sequence of the two-request trips. For example, if comes before in the sequence of the trip , then also comes before in the sequence of trip . After testing, the proposed SI method can reduce the computation time by 49.35% compared to the benchmark (Appendix A.3).
Figure 4.
Sequence inference of three-request trips. (a) Three-request trip; (b) Three-request trip (The red cross represents that cannot be combined).
After calculating candidate ridesplitting trips using the above methods, it can be determined which vertices have hyperedges, thereby obtaining edge set and constructing hypergraph , where is the vertex set, is the edge set, and the weight of each edge in is . The WHMM problem refers to determining matching that maximizes the sum of weights of all edges:
Simultaneously, it is necessary to meet the definition of hypergraph matching, which means that any two edges in do not have a common vertex.
The edge weight in the hypergraph quantifies the overall utility of grouping the requests in hyperedge into a shared ride. To holistically evaluate a ridesplitting combination, we define as a composite function that balances two critical operational objectives: maximizing trip consolidation, minimizing passenger delay. Let be a hyperedge representing a candidate ridesplitting trip. Its weight is calculated as:
where represents the number of requests in and represents the total delay of all requests in . The coefficient is a weighting parameter that reflects the trade-off between the two objectives.
Many studies employ optimization solvers for tackling the WHMM problem, particularly for manageable problem scales [5,29]. Following this established approach, we adopt Gurobi to solve the WHMM problem in our framework (Algorithm 1). The solution process is formalized as a 0–1 integer programming model, which preserves the original objective of maximizing the sum of selected edge weights (Equation (6)). A binary decision variable is associated with each hyperedge , where indicates that is included in the matching , and otherwise. The core constraint of the model ensures that for any vertex , at most one incident hyperedge is selected into the matching, which is expressed mathematically as . The complete model definition is as follows:
| Algorithm 1 Algorithm with Solver. |
| : |
Although the WHMM problem is NP-complete [29], optimization solvers like Gurobi are preferred for their ability to deliver provably optimal or near-optimal solutions. Consequently, the matching obtained from Gurobi is used to select the corresponding candidate trips from , which are then passed to the subsequent online matching stage. This approach ensures solution quality at the grouping stage, providing a solid foundation for the overall dispatch performance.
4.3.2. Supply Demand Matching Module
The supply–demand matching module is the primary optimizer in Stage 2. We model the matching problem as a task assignment problem, and its definition is as follows:
Given vehicle set and trip set participating in the matching during the current period , it finds an optimal task assignment scheme that minimizes the total cost . The mathematical formulation for the assignment problem is as follows:
This assignment problem minimizes the vehicle’s pickup time while ensuring that trips with earlier expected departure times are picked up first. The first term of the cost function represents the travel time of vehicle from the current position to the origin of trip . The second term represents the time difference between the expected departure time of , (i.e., the reserved departure time of the starting request) and current matching period . The decision variable is 0–1 binary variable. indicates that is not assigned to complete , while indicates that is assigned to complete . Constraint (10) indicates that each trip must be completed only by one vehicle. Constraint (11) indicates that each vehicle must complete only one trip.
It should be noted that the original problem is a generalized assignment problem, where the number of vehicles and the number of trips may not be equal. Therefore, we determine that both the number of vehicles and the number of trips are and transform the original problem into the standard form of the assignment problem. If , some virtual trips are added. If , some virtual vehicles are added. The cost related to virtual trips and virtual vehicles is set to 0.
When calculating cost function , it is necessary to determine whether and meet the following constraints:
Constraint (13) indicates that the upper limit of the vehicle’s pickup time is . Constraint (14) indicates the upper limit of the waiting time for the trip is , i.e., waiting time for the starting request. If the above constraints are not met, then will equal a sufficiently large constant .
We employ the Kuhn–Munkres algorithm [47,48] as the solution algorithm for the assignment problem. Based on the solution and trip information, vehicle travel plans can be developed.
4.3.3. Utility Modules
Optimal Path Module: The optimal path module is mainly used to calculate the shortest path between two nodes and provide corresponding travel time, travel distance, path sequence, and other information. Constructing the optimal path module requires exporting road network parameters (including node and road segment data) and dynamic travel time data of road segments every 10 min from the simulation environment. Node and road segment data are used to construct the road network in the optimal path module, and the dynamic travel time of road segments is the weight of road segments required to calculate the optimal path. The optimization modules require multiple calls to the optimal path module, especially the request grouping module. We employ the contract hierarchies (CH) algorithm [49] as the optimal path algorithm, which can preprocess the original road network and calculate some shortcuts between nodes in advance. Therefore, the CH algorithm can reduce the number of road segments and simplify the road network, improving computational efficiency.
Vehicle Cruising Module: After the supply–demand matching is completed, some idle vehicles may not be successfully matched. In the dispatching process, it is necessary to call the vehicle cruising module to formulate the cruising route for each idle vehicle. First, the real-time location of the idle vehicle is obtained as origin . Second, randomly select a location as the cruising destination . Finally, the optimal path module is used to calculate the cruising route of each idle vehicle. The vehicle cruising module can improve the vehicle location distribution and promote ridesplitting efficiency.
4.4. Optimization Process
The most crucial part of the proposed framework is the ridesplitting dispatching optimization process in Algorithm 2.
| Algorithm 2 Ridesplitting Dispatching Optimization Process. |
| Input: Requests 2. Initialize the simulation environment 3. , 4. while do (Trips with too long waiting time) in advance) 8. 14. Termination |
First, the request grouping module is called to combine the entire matching period’s request set into trip set . Second, , and the simulation environment are initialized. Third, in each matching period , the trips for the currently matching period is selected from and the trips with too long a waiting time are deleted from . Then, the supply–demand matching module is called to match and . The matched vehicles’ travel plans are input into the simulation environment. Finally, , and are updated. When the loop ends, the entire ridesplitting dispatching process is completed.
5. Experiment
This section presents the experimental setup and evaluation of the proposed OGOM framework, using the Hangzhou Asian Games as a case study. As shown in Figure 5, the study area highlighted by the red line is located in Xiaoshan District and Binjiang District of Hangzhou, China. Three yellow five-pointed stars indicate the location of important venues for the 19th Asian Games. The evaluation involves two main steps: (1) constructing a traffic simulation environment for the event area using MATSim, and (2) executing the ridesplitting dispatching process within this environment using synthesized travel demand data. All simulations were performed on a workstation equipped with a 16-core Intel Core i7-11800 CPU at 2.3 GHz.
Figure 5.
Study area in Hangzhou.
5.1. Data Sources and Processing
The simulation experiments rely on four primary data sources: road network data, background traffic demand data, calibration data, and synthesized request data. Their processing steps are detailed below.
Road network data: The road network for the simulation was constructed using data from OpenStreetMap (OpenStreetMap is open source map data. https://www.openstreetmap.org/, accessed on 28 January 2026) (OSM). To enhance computational efficiency, preprocessing involved the removal of lower-level road segments (e.g., residential paths, service roads) and ensuring network connectivity at the area boundaries. The final processed network contains 10,478 nodes and 12,861 segments. Key attributes include node IDs with coordinates (longitude, latitude) and segment IDs with associated start/end nodes and lengths.
Background traffic demand data: To simulate realistic background traffic, we utilized an anonymized cellular signaling dataset provided by a major mobile network operator in Hangzhou. This dataset records trip counts between mobile base stations within the main urban area during the morning peak period (7:00–9:00). The study area encompasses 7710 base stations. The raw data, containing fields for base station ID, geographical coordinates, and cross-station trip volumes, was processed to remove invalid records (e.g., trips with identical origin and destination stations). The valid signaling records are generated into the MATSim trip plan, which obtains about 290,000 trips. As the market coverage rate of this operator is about 70%, an expansion factor of 1.43 was applied to inflate the 290,000 trips to approximately 410,000 OD trips, which served as the initial travel demand for model calibration.
Calibration data: The simulation model’s travel times were calibrated against real-world data to ensure validity. Travel times for key road segments, including highways, expressways, and major arterials within the study area, were obtained as ground truth using the navigation API service from Amap (Amap provides navigation API services. https://www.amap.com/, accessed on 28 January 2026), a leading digital map provider in China. These segments were selected because they carry over most of the total vehicle-miles traveled in the region and form the primary corridors for ridesplitting vehicles, making their travel time accuracy critical for the evaluation.
Synthetic request data: A set of 10,000 reservation requests was synthetically generated to represent travel demand specific to the mega-event scenario. The main fields of the request data include request ID, origin, destination, and reserved departure time. The temporal and spatial characteristics were designed as follows:
The reserved departure times of the request data are generated within the operational period from 7:00 to 10:00. Their distribution is determined by the associated hub, travel direction, and temporal phase relative to the events. We employ four stochastic models to capture key demand patterns: a Normal distribution models the morning outbound peak from the Asian Games Village; Uniform distributions model dispersed returns to the village, random spectator departures before events end, and random late arrivals after events start; Poisson processes generate the stochastic arrival times of spectators before events, from which request departure times are derived by subtracting simulated travel time; and a Shifted Exponential distribution captures the sharp demand surge in departures immediately after the events end. The complete configuration for request departure time generation is detailed in Table 2. The overall distribution of departure times for all synthesized requests is visualized in Figure 6a.
Table 2.
Temporal distribution models for synthetic request data generation.
Figure 6.
Temporal-spatial distributions of request data. (a) Temporal distribution of requests; (b) Spatial distribution of origins; (c) Spatial distribution of destinations.
The spatial attributes of the requests are determined by a hub-based rule. For inbound requests, the destination is the designated hub, and the origin is generated uniformly at random within the study area. Conversely, for outbound requests, the origin is the hub, and the destination is uniformly randomly selected. This uniform random sampling for the non-hub location models the spatially dispersed nature of event-driven travel, where participants originate from or depart to widespread locations across the city. The resulting spatial distributions of request origins and destinations are visualized in Figure 6b and Figure 6c, respectively.
5.2. Simulation Environment
Based on the datasets described in Section 5.1, a simulation model was built according to the steps in Section 4.2. First, OSM data were used to construct a simulated road network in MATSim, as shown in Figure 7. Second, approximately 410,000 trips were obtained with the cellular signaling dataset as the initial background traffic demand. Finally, the travel time of important roads is calibrated by adjusting the traffic demand of key OD pairs. The calibration objective was to minimize the NRMSE (Equation (3)) between simulated and observed travel times across multiple time intervals. The acceptance threshold was set at α = 0.3. This threshold aligns with common practice in simulation model calibration, where an NRMSE below 0.3 is often considered indicative of a good fit between model and reality [50,51]. The calibration was performed by iteratively adjusting the traffic demand (trip departure times and routes) of a subset of key Origin–Destination (OD) pairs. The process reduced the system-wide NRMSE from 1.29 to 0.29, meeting the predefined threshold. The calibrated simulation model will serve as the simulation environment for the ridesplitting dispatching optimization process.
Figure 7.
Road network of the simulation model.
5.3. Parameters Setting
The basic experimental parameters for the simulation and dispatching framework are set in Table 3. The selection of these values is based on a combination of industry service standards and computational considerations for the matching horizon.
Table 3.
Parameter setting and operational interpretation.
5.4. Experimental Procedure
The primary objective of the experiments is to rigorously validate the proposed Offline Grouping and Online Matching (OGOM) framework against realistic and strong operational baselines.
To ensure the statistical robustness of our findings, all simulation experiments are conducted with multiple independent replications. For each experiment, the proposed OGOM framework and all benchmark algorithms are evaluated under identical conditions. The core parameters are set according to Table 3. The vehicle fleet is initialized with random positions uniformly distributed across the study area. This random initialization mitigates the impact of any advantageous or disadvantageous initial vehicle clustering on the results. Each configuration is run n = 10 times with different random seeds. These seeds control the stochastic generation of the initial random distribution of vehicles.
To comprehensively evaluate the OGOM framework, we conduct three sets of comparative experiments, ecompassing the following algorithms and scenarios:
Non-Ridesplitting (NRS)—This scenario serves as the primary baseline, where ridesplitting is disabled. Each request must be served by a dedicated vehicle. The performance of NRS quantifies the fundamental efficiency gain attributable to enabling ridesplitting, isolating the benefit of vehicle sharing from algorithmic sophistication.
Rolling Horizon Batching (RHB)—This algorithm represents an operationally feasible benchmark that employs a simpler, real-time ridesplitting strategy. The RHB algorithm operates by accumulating incoming requests within a short, fixed time window (e.g., 60 s), then performing a greedy, batch matching of the accumulated requests based on spatiotemporal feasibility constraints (similar to Equations (4) and (5)), and finally dispatching the matched trips to vehicles.
Proposed OGOM Framework—The full implementation of our methodology, as described in Section 4.
Based on the above setup and benchmarks, an overall performance comparison and a sensitivity analysis are performed, with results presented in Section 6.
6. Results
6.1. Comparative Analysis with Benchmark Algorithms
To evaluate the proposed OGOM framework, we compare it against a non-ridesplitting (NRS) scenario and rolling horizon batching (RHB) algorithm.
The comparative results are presented in Table 4. The proposed OGOM framework achieves a service rate and shared rate better than that of the RHB algorithm. It substantially outperforms the NRS baseline in service rate, validating the efficacy of its optimized offline grouping stage. The high shared rate leads to two significant outcomes: first, the average request completion distance is shorter than that of benchmarks; second, the average passenger delay under the proposed framework, while slightly higher than that of the benchmarks, remains within an acceptable range, representing a reasonable trade-off for the substantial gains in system efficiency and service capacity.
Table 4.
Performance comparison with the benchmarks.
6.2. Sensitivity Analysis
We conducted a sensitivity analysis to evaluate and compare the performance of the proposed OGOM framework by systematically varying two key operational parameters: the total request quantity and the maximum pickup and drop-off time window .
6.2.1. Request Quantity
Figure 8 presents the experimental results across four key metrics. In Figure 8a, the service rate under the NRS baseline drops sharply with increasing request quantity , from nearly 100% at to approximately 40% at , while OGOM maintains the highest service rate throughout, followed closely by RHB. Figure 8b shows that OGOM achieves the highest shared rate, reaching nearly 90% at before slightly declining, significantly outperforming RHB and NRS. Regarding efficiency in Figure 8c, the average request completion distance for OGOM is the lowest and remains stable around 10 km, whereas NRS exhibits the longest and most variable distances, indicating that OGOM’s high shared rate translates into reduced travel kilometers. In Figure 8d, the average delay increases with for all algorithms, with OGOM showing the highest delays (reaching ~160 s at ) compared to RHB and NRS, though still within a practical operational range. These results confirm that OGOM delivers superior service and shares performance at the cost of marginally higher delays.
Figure 8.
Comparison of metrics with respect to request quantity. (a) Service rate; (b) Shared rate; (c) Average completion distance; (d) Average delay.
6.2.2. Pickup and Drop-Off Time Window
Figure 9 presents the sensitivity analysis of the OGOM framework under varying maximum pickup and drop-off time windows (). In Figure 9a, the service rate improves for all three algorithms as increases, with OGOM consistently achieving the highest service rate across the evaluated range, demonstrating its superior ability to utilize extended time windows to match more requests. Figure 9b shows that the shared rate also increases with , and OGOM maintains a clear advantage, achieving a shared rate close to 90% at , significantly higher than that of RHB and NRS. In Figure 9c, the average completion distance decreases for all methods as grows, and OGOM achieves the shortest average distance, indicating higher operational efficiency through optimized ridesplitting. Regarding passenger experience in Figure 9d, the average delay increases with for all algorithms, and while OGOM results in slightly higher delays compared to RHB and NRS, the increase remains within an acceptable practical range. These results confirm the robustness of the OGOM framework and its ability to deliver balanced performance gains across key metrics as operational constraints are relaxed.
Figure 9.
Comparison of metrics with respect to . (a) Service rate; (b) Shared rate; (c) Average completion distance; (d) Average delay.
6.3. Spatially Disaggregated Performance Analysis
To investigate potential spatial inequities in service quality, we partition the study area into three concentric zones relative to the main event cluster: core zone (within 2 km), buffer zone (2–5 km), and peripheral zone (>5 km). We calculate key performance indicators—service rate, average delay, and request cancellation rate—for requests originating in each zone. The results are summarized in Table 5.
Table 5.
Performance metrics by spatial zone.
The analysis reveals a spatial gradient in service quality. While the core zone enjoys excellent service, performance degrades towards the periphery, with a lower service rate and higher delays/cancellations. This is primarily due to longer vehicle travel times to reach peripheral origins, which more frequently exceed the maximum pickup time constraint, and a lower density of idle vehicles.
7. Discussion
This study proposes and validates a two-stage dispatch framework for reservation-based ridesplitting services during mega-events. Comparative simulations and sensitivity analyses based on the Hangzhou Asian Games case study yield the following key insights.
7.1. Interpretation of Framework Performance
The proposed framework’s effectiveness, evidenced by a mean service rate of 92.12% (an 8.74% improvement over the benchmark) while maintaining average passenger delay between 2 and 4 min, is intrinsically linked to its design.
The core advantage stems from utilizing advanced reservation information. This allows the computationally intensive request grouping problem to be formulated as a Weighted Hypergraph Maximum Matching (WHMM) problem and solved offline with a solver like Gurobi. This proactive, global optimization of request pooling for shared rides is fundamentally more efficient than purely real-time, reactive dispatching strategies, especially under the high-demand, spatiotemporally concentrated conditions typical of events.
The proposed Sequence Inference (SI) method addresses a key computational bottleneck. By inferring feasible sequences for three-request trips from pre-computed two-request pairs, it reduces the time for constructing the candidate trip hypergraph by 49.35% compared to the Rolling Time Window method. This enhancement is crucial for handling large-scale request datasets practically.
The OGOM framework successfully manages the inherent trade-off between service capacity and passenger experience. Ridesplitting significantly boosts the service rate compared to a non-ridesplitting (NRS) baseline and reduces the average request completion distance by over 30%, indicating higher vehicle utilization and lower system-wide vehicle kilometers traveled. This is achieved while controlling the additional delay imposed on passengers due to sharing within a strictly bounded, acceptable range (2–4 min in our experiments).
7.2. Operational Boundaries and Sensitivity
The performance of the OGOM framework is not universal but is shaped by operational parameters and contextual constraints, as revealed by the sensitivity analysis.
The sensitivity analysis on request quantity () underscores the framework’s performance boundaries. As increases against a fixed fleet size, the service rate for all methods declines, with the NRS baseline experiencing the sharpest drop. While the OGOM framework maintains the highest service rate throughout, the concurrent increase in average delay for all algorithms highlights the fundamental tension between demand volume and service quality under constrained supply.
Performance metrics improve with a larger maximum pickup/drop-off time window (), as it allows for more flexible and efficient trip combinations. The sensitivity analysis reveals the characteristics of the trade-off between service rate and average passenger delay. The observed trends indicate a relationship of diminishing returns: initial increases in yield substantial gains in service rate, but further relaxations bring progressively smaller benefits while passenger delays continue to rise. This qualitative insight still provides a valuable basis for service level agreement design, helping operators identify the best point of balanced operation aligned with their priorities.
Besides, service quality degrades for requests originating in peripheral zones compared to core areas near event venues, highlighting a spatial equity challenge due to longer vehicle access times and lower vehicle density.
7.3. Limitations and Future Research Directions
The current framework, while effective, is built upon several simplifying assumptions that define its scope and point toward valuable future work.
First, the model assumes a fixed, known set of reservation requests and that all passengers are willing to share, with a uniform delay threshold. Future work should relax these to incorporate dynamic request arrivals, cancellations, and heterogeneous user preferences (e.g., willingness to share, service tiers), requiring online re-grouping and re-matching algorithms. Second, the framework is built upon the simplifying assumption of a fixed fleet size, which isolates algorithm performance but does not reflect the dynamic nature of real-world operations where vehicle availability fluctuates due to shift changes, zone entry/exit, or repositioning. Future research should integrate a time-varying or stochastic vehicle supply model—potentially using real-time data feeds or modeling driver availability as a stochastic process—and couple it with a dynamic fleet management module. Third, the offline grouping stage optimizes request pooling without considering the real-time spatial distribution of vehicles, which is determined in the subsequent online matching stage. The two-stage decoupling process represents a fundamental trade-off between computational tractability and operational fidelity. Building directly on this limitation, a promising direction is to investigate feedback mechanisms or integrated models that couple these stages more closely to enhance real-world feasibility. Fourth, the current primary objective is system-level efficiency (service rate under delay constraints). Future research should integrate multi-faceted objectives such as service equity across different zones, operator profitability, and environmental impact into a comprehensive decision-support framework. Besides, future work should explore online extensions that incorporate dynamic request insertion and vehicle re-routing. Insights from intelligent clustering and learning-based resource balancing strategies in distributed systems, as discussed in the context of large-scale optimization under resource constraints [52], could inform the design of adaptive, real-time re-grouping and re-matching algorithms to handle such dynamism. Lastly, future work should involve testing with real-world, city-scale datasets and exploring distributed computing algorithms to further accelerate the offline grouping module for even larger problem instances, paving the way for practical deployment.
In conclusion, the OGOM framework demonstrates a viable and efficient strategy for managing ridesplitting services in mega-events. It translates the unique characteristic of advance reservations into a computational advantage, achieving a superior balance between serving more passengers and maintaining service quality compared to benchmark strategies. The insights and limitations identified provide a clear roadmap for both operational application and further academic research.
8. Conclusions
This study proposed a two-stage framework, Offline Grouping and Online Matching (OGOM), to address the ridesplitting dispatching problem for reservation-based travel during mega-events. The framework was developed, tested, and validated through a comprehensive case study of the Hangzhou Asian Games, leading to the following principal conclusions:
The OGOM framework effectively leverages advanced reservation information. By decomposing the complex problem into an offline weighted hypergraph maximum matching (WHMM) stage for optimal request grouping and an online simulation-based matching stage, it achieves a superior balance between high service rates and controlled passenger delays. Validation results demonstrated a mean service rate of 92.12%, representing an 8.74% improvement over a rolling horizon batching benchmark, while maintaining the average passenger delay between 2 and 4 min.
Ridesplitting, as optimized by the proposed framework, demonstrates a significant advantage in meeting the concentrated, high-volume travel demand characteristic of mega-events. Compared to a non-ridesplitting (NRS) scenario, it enables the completion of substantially more requests with comparable service quality. A key efficiency gain is the reduction in the average request completion distance by over 30%, indicating higher vehicle utilization and lower system-wide vehicle kilometers traveled.
The methodological enhancement developed for the framework—the Sequence Inference (SI) method for constructing the candidate ridesplitting hypergraph—proved crucial for scalability. It reduced the computation time by 49.35% compared to a conventional rolling time window method, enabling the efficient processing of large-scale request datasets.
The sensitivity analyses revealed the operational boundaries and fundamental trade-offs managed by the framework. Performance is positively influenced by a larger maximum pickup/drop-off time window and is strongest for requests originating near event hubs. The framework navigates the inherent trade-off between maximizing the service rate and minimizing passenger delay, providing practical insights for setting service-level agreements.
In summary, this work provides an effective, simulation-validated operational strategy for enhancing shared mobility services during mega-events. The findings highlight the potential of ridesplitting to meet more travel demand with greater efficiency, offering valuable guidance for event organizers, mobility platform operators, and urban transport planners seeking to improve service quality and sustainability.
Future research should focus on extending the framework’s realism and robustness. Key directions include: (1) developing online algorithms to handle dynamic request arrivals and cancellations; (2) incorporating heterogeneous user preferences and mixed vehicle fleets; and (3) expanding the optimization objectives to include multi-faceted goals such as service equity, economic profitability, and environmental impact. Testing the framework with real-world, city-scale datasets will be a critical step toward practical deployment.
Author Contributions
Conceptualization, J.Z. and Z.Z.; methodology, J.Z. and H.W.; validation, J.Z. and H.W.; data curation, J.Z.; writing—original draft preparation, J.Z.; writing—review and editing, H.W. and Z.Z.; visualization, J.Z. and H.W.; supervision, Z.Z. All authors have read and agreed to the published version of the manuscript.
Funding
This research received no external funding.
Institutional Review Board Statement
Not applicable.
Informed Consent Statement
Not applicable.
Data Availability Statement
The data presented in the study is available on request from the corresponding author due to privacy.
Conflicts of Interest
The authors declare no conflicts of interest. The funders had no role in the design of the study; in the collection, analyses, or interpretation of data; in the writing of the manuscript; or in the decision to publish the results.
Abbreviations
The following abbreviations are used in this manuscript:
| WHMM | Weighted hypergraph maximum matching |
| OSM | OpenStreetMap |
| NRMSE | Normalized root mean square error |
| RTW | Rolling time window |
| SI | Sequence inference |
| VKT | Vehicle kilometers traveled |
Appendix A. Hypergraph Construction Methods
Appendix A.1. Exhaustive Method
The exhaustive method is a method of exhaustively listing all sequence situations. First, take any two requests from to form all possible binaries and traverse these binaries in time order. For each binary, it is necessary to exhaustively list up to 4 different sequence situations to determine whether these two requests can be combined. Second, traverse the triplet formed by any three requests from . For each triplet, it is necessary to exhaustively list up to 60 different sequence situations to determine whether these three requests can be combined.
Appendix A.2. Rolling Time Window (RTW) Method
The commonly used method to solve the problem of long computation time in exhaustive methods is the RTW method. First, we decompose the total matching duration into several grouping time windows with a duration of , and use the exhaustive method to calculate candidate ridesplitting trips for requests with reserved departure times in each grouping time window. The RTW method can reduce the number of requests involved in each calculation, thereby accelerating the calculation speed, but it will lead to an increase in requests that cannot be combined. Therefore, we will postpone the requests that cannot be combined to the next time window for recalculation.
Appendix A.3. Method Comparison
We conducted comparative tests on the methods for calculating candidate ridesplitting trips with 500 randomly selected requests. The comparison results of the methods for calculating candidate ridesplitting trips are shown in Table A1. The number of edges calculated by the exhaustive method is much greater than the other two methods, especially for edges of size 3, as shown in the column. However, the computation time of the exhaustive method increases exponentially in the number of requests. The sequence inference (SI) method performs the best in computation time, with a 49.35% reduction compared to the RTW method. The proposed SI method is the best for meeting the needs of large-scale request datasets.
Table A1.
Comparison of different hypergraph construction methods.
Appendix A.4. Complexity and Practical Scalability
The computational complexity of the Sequence Inference (SI) method is anchored in its worst-case scenario: when all possible request pairs are spatiotemporally feasible. In this extreme theoretical case, the number of candidate triplets scales as , where is the number of requests in a time window, leading to a worst-case time complexity of . The primary contribution of the SI method in this context is not to alter this asymptotic bound, but to drastically reduce the constant factor within it. Compared to an exhaustive enumeration method that must evaluate all 60 possible sequences for each triplet, the SI method intelligently infers triplet feasibility from pre-computed pairwise sequences, thereby eliminating the vast majority of redundant sequence checks for three-request trips.
In practice, however, this worst-case scenario (all pairs being feasible) is highly improbable in real-world mega-event operations. Stringent spatiotemporal constraints—namely the maximum wait/delay tolerance and the maximum pickup time—severely limit the number of requests that can be feasibly combined. Therefore, the actual number of feasible pairs and triplets is far smaller than the theoretical maximum, making the average-case performance significantly more favorable. Nevertheless, acknowledging that computation can become intensive for very large , we note that for scenarios with extremely high concurrent demand, a practical deployment strategy would involve partitioning the problem by time windows or geographical sectors and employing high-performance or parallel computing resources to meet operational latency requirements.
References
- The 19th Asian Games. Handover Ceremony Takes Place in Hangzhou for the Vehicles Officially Designated for Hangzhou Asian Games. Available online: https://www.hangzhou2022.cn/En/presscenter/spotnews/latestnews/202309/t20230905_71105.shtml (accessed on 24 January 2026).
- de Menezes, T.R.; de Souza, J.F. Transportation and urban mobility in mega-events: The case of Recife. Procedia-Soc. Behav. Sci. 2014, 162, 218–227. [Google Scholar] [CrossRef] [Scilit]
- U.S. Department of Transportation. Executive Summary. Available online: https://ops-dr.fhwa.dot.gov/publications/fhwahop08022/exec_sum.htm (accessed on 17 March 2026).
- Shaheen, S.; Cohen, A.; Zohdy, I. Shared Mobility: Current Practices and Guiding Principles (No. FHWA-HOP-16-022); Federal Highway Administration: Washington, DC, USA, 2016; pp. 101–104.
- Alonso-Mora, J.; Samaranayake, S.; Wallar, A.; Frazzoli, E.; Rus, D. On-demand high-capacity ride-sharing via dynamic trip-vehicle assignment. Proc. Natl. Acad. Sci. USA 2017, 114, 462–467. [Google Scholar] [CrossRef] [Scilit]
- Hong, Z.; Chen, Y.; Mahmassani, H.S.; Xu, S. Commuter ride-sharing using topology-based vehicle trajectory clustering: Methodology, application and impact evaluation. Transp. Res. Part C Emerg. Technol. 2017, 85, 573–590. [Google Scholar] [CrossRef] [Scilit]
- Yu, B.; Ma, Y.; Xue, M.; Tang, B.; Wang, B.; Yan, J.; Wei, Y.M. Environmental benefits from ridesharing: A case of Beijing. Appl. Energy 2017, 191, 141–152. [Google Scholar] [CrossRef] [Scilit]
- Fielbaum, A.; Alonso-Mora, J. Unreliability in ridesharing systems: Measuring changes in users’ times due to new requests. Transp. Res. Part C Emerg. Technol. 2020, 121, 102831. [Google Scholar] [CrossRef] [Scilit]
- Kassens-Noor, E. Transportation planning and policy in the pursuit of mega-events: Boston’s 2024 Olympic bid. Transp. Policy 2019, 74, 239–245. [Google Scholar] [CrossRef] [Scilit]
- Yamawaki, Y.; Castro Filho, F.M.D.; Costa, G.E.G.D. Mega-event transport legacy in a developing country: The case of Rio 2016 Olympic Games and its Transolímpica BRT corridor. J. Transp. Geogr. 2020, 88, 102858. [Google Scholar] [CrossRef] [Scilit]
- Chen, M.C.; Hsu, C.L.; Huang, C.H. Applying the Kano model to investigate the quality of transportation services at mega events. J. Retail. Consum. Serv. 2021, 60, 102442. [Google Scholar] [CrossRef] [Scilit]
- Xu, Y.; González, M.C. Collective benefits in traffic during mega events via the use of information technologies. J. R. Soc. Interface 2017, 14, 20161041. [Google Scholar] [CrossRef] [Scilit]
- Pereira, R.H. Transport legacy of mega-events and the redistribution of accessibility to urban destinations. Cities 2018, 81, 45–60. [Google Scholar] [CrossRef] [Scilit]
- Ballarano, D.; Patella, S.M.; Asdrubali, F. Sustainable transportation for events: A systematic review. Sustainability 2022, 14, 15815. [Google Scholar] [CrossRef] [Scilit]
- Borghetti, F.; Longo, M.; Mazzoncini, R.; Somaschini, C. Preliminary evaluation of infrastructure and mobility services in mega-event: The Italian case study. Transp. Res. Procedia 2023, 69, 464–471. [Google Scholar] [CrossRef] [Scilit]
- Zhao, Z.; Sun, Y.; He, Y.; Li, Y. The application potential of Mobility as a Service (MaaS) at mega events: A case study of Hangzhou 2022 Asian Games. J. Clean. Prod. 2023, 427, 139211. [Google Scholar] [CrossRef] [Scilit]
- Ranjbarnia, B.; Leung, A.; Burke, M.I.; Scott, P. Developing a Brisbane 2032 MaaS Solution: Learnings from a narrative review. In Proceedings of the Australasian Transport Research Forum 2024, Melbourne, Australia, 27–29 November 2024. [Google Scholar]
- Covelli Garrido, C.I.; Giovannini, A.; Mangone, A.; Silvestri, F. Managing urban mobility during big events through living lab approach. Sustainability 2023, 15, 14566. [Google Scholar] [CrossRef] [Scilit]
- An, X.; Li, X.; Zhang, B. Flexible scheduling of customized bus for green mega-events: A distributionally robust optimization approach. Comput. Oper. Res. 2025, 185, 107249. [Google Scholar] [CrossRef] [Scilit]
- Liu, H.; Devunuri, S.; Lehe, L.; Gayah, V.V. Scale effects in ridesplitting: A case study of the City of Chicago. Transp. Res. Part A Policy Pract. 2023, 173, 103690. [Google Scholar] [CrossRef] [Scilit]
- Zhan, X.; Szeto, W.Y.; Shui, C.S.; Chen, X.M. A modified artificial bee colony algorithm for the dynamic ride-hailing sharing problem. Transp. Res. Part E Logist. Transp. Rev. 2021, 150, 102124. [Google Scholar] [CrossRef] [Scilit]
- Bilali, A.; Dandl, F.; Fastenrath, U.; Bogenberger, K. An analytical model for on-demand ride sharing to evaluate the impact of reservation, detour and maximum waiting time. In Proceedings of the 2019 IEEE Intelligent Transportation Systems Conference (ITSC), Auckland, New Zealand, 27–30 October 2019. [Google Scholar]
- Ouyang, Y.; Yang, H.; Daganzo, C.F. Performance of reservation-based carpooling services under detour and waiting time restrictions. Transp. Res. Part B Methodol. 2021, 150, 370–385. [Google Scholar] [CrossRef] [Scilit]
- Dai, R.; Ding, C.; Gao, J.; Wu, X.; Yu, B. Optimization and evaluation for autonomous taxi ride-sharing schedule and depot location from the perspective of energy consumption. Appl. Energy 2022, 308, 118388. [Google Scholar] [CrossRef] [Scilit]
- Narayanan, S.; Chaniotakis, E.; Antoniou, C. Modelling reservation-based shared autonomous vehicle services: A dynamic user equilibrium approach. Transp. Res. Part C Emerg. Technol. 2022, 140, 103651. [Google Scholar] [CrossRef] [Scilit]
- Bujak, M.; Kucharski, R. Ride-pooling service assessment with heterogeneous travellers in non-deterministic setting. Transportation 2024, 1–24. [Google Scholar] [CrossRef] [Scilit]
- Park, S.Y.; Joo, Y.J.; Kim, D.K. Order dispatching in ride-pooling with walking points search. Transp. Res. Procedia 2024, 2678, 666–677. [Google Scholar] [CrossRef] [Scilit]
- Mühle, S. An analytical framework for modeling ride pooling efficiency and minimum fleet size. Multimodal Transp. 2023, 2, 100080. [Google Scholar] [CrossRef] [Scilit]
- Santi, P.; Resta, G.; Szell, M.; Sobolevsky, S.; Strogatz, S.H.; Ratti, C. Quantifying the benefits of vehicle pooling with shareability networks. Proc. Natl. Acad. Sci. USA 2014, 111, 13290–13294. [Google Scholar] [CrossRef] [Scilit]
- Tu, M.; Li, Y.; Li, W.; Tu, M.; Orfila, O.; Gruyer, D. Improving ridesplitting services using optimization procedures on a shareability network: A case study of Chengdu. Technol. Forecast. Soc. Change 2019, 149, 119733. [Google Scholar] [CrossRef] [Scilit]
- Pavone, M.; Saberi, A.; Schiffer, M.; Tsao, M.W. Online hypergraph matching with delays. Oper. Res. 2022, 70, 2194–2212. [Google Scholar] [CrossRef] [Scilit]
- Bujak, M.; Kucharski, R. Network structures of urban ride-pooling problems and their properties. Soc. Netw. Anal. Min. 2023, 13, 89. [Google Scholar] [CrossRef] [Scilit]
- Lee, E.H.; Jeong, J. Accessible taxi routing strategy based on travel behavior of people with disabilities incorporating vehicle routing problem and Gaussian mixture model. Travel Behav. Soc. 2024, 34, 100687. [Google Scholar] [CrossRef] [Scilit]
- Yang, M.C.; Chen, W.N.; Wei, F.F.; Zhang, J. Gene Expression Programming-Based Ride Insert Policy for Online Electric Vehicle Ride-Hailing Optimization. IEEE Trans. Intell. Transp. Syst. 2025, 16, 22136–22150. [Google Scholar] [CrossRef] [Scilit]
- Yazdiani, A.; Bafandkar, S.; Elmi, A.; Shafahi, Y. An optimization framework for the time-dependent electric vehicle routing problem with shared mobility: A step toward smart cities. arXiv 2025, arXiv:2509.12623. [Google Scholar] [CrossRef] [Scilit]
- Feng, S.; Chen, T.; Zhang, Y.; Ke, J.; Zheng, Z.; Yang, H. A multi-functional simulation platform for on-demand ride service operations. Commun. Transp. Res. 2024, 4, 100141. [Google Scholar] [CrossRef] [Scilit]
- Agatz, N.; Erera, A.L.; Savelsbergh, M.W.; Wang, X. Dynamic ride-sharing: A simulation study in metro Atlanta. Procedia Soc. Behav. Sci. 2011, 17, 532–550. [Google Scholar] [CrossRef] [Scilit]
- Pan, J.J.; Li, G.; Hu, J. Ridesharing: Simulator, benchmark, and evaluation. Proc. VLDB Endow. 2019, 12, 1085–1098. [Google Scholar] [CrossRef] [Scilit]
- Sun, R.; Wu, X.; Chen, Y. Assessing the impacts of ridesharing services: An agent-based simulation approach. J. Clean. Prod. 2022, 372, 133664. [Google Scholar] [CrossRef] [Scilit]
- Zhan, X.; Szeto, W.Y.; Chen, X.M. A simulation-optimization framework for a dynamic electric ride-hailing sharing problem with a novel charging strategy. Transp. Res. Part E Logist. Transp. Rev. 2022, 159, 102615. [Google Scholar] [CrossRef] [Scilit]
- Fagnant, D.J.; Kockelman, K.M. Dynamic ride-sharing and fleet sizing for a system of shared autonomous vehicles in Austin, Texas. Transportation 2018, 45, 143–158. [Google Scholar] [CrossRef] [Scilit]
- Fagnant, D.J.; Kockelman, K.M. The travel and environmental implications of shared autonomous vehicles, using agent-based model scenarios. Transp. Res. Part C Emerg. Technol. 2014, 40, 1–13. [Google Scholar] [CrossRef] [Scilit]
- Hu, Q.; Yang, B.; Zhang, K.; Macias, J.E.; Chen, X.M.; Ouyang, Y.; Hu, S. Sustainable operational strategies for mixed fleets: Integrating autonomous and human-driven taxis with heterogeneous energy types. Commun. Transp. Res. 2025, 5, 100171. [Google Scholar] [CrossRef] [Scilit]
- Zhang, W.; Wang, K. Parking futures: Shared automated vehicles and parking demand reduction trajectories in Atlanta. Land Use Policy 2020, 91, 103963. [Google Scholar] [CrossRef] [Scilit]
- Zhang, W.; Guhathakurta, S.; Fang, J.; Zhang, G. Exploring the impact of shared autonomous vehicles on urban parking demand: An agent-based simulation approach. Sustain. Cities Soc. 2015, 19, 34–45. [Google Scholar] [CrossRef] [Scilit]
- Yao, F.; Zhu, J.; Yu, J.; Chen, C.; Chen, X.M. Hybrid operations of human driving vehicles and automated vehicles with data-driven agent-based simulation. Transp. Res. Part D Transp. Environ. 2020, 86, 102469. [Google Scholar] [CrossRef] [Scilit]
- Kuhn, H.W. The Hungarian method for the assignment problem. Nav. Res. Logist. Q. 1955, 2, 83–97. [Google Scholar] [CrossRef] [Scilit]
- Munkres, J. Algorithms for the assignment and transportation problems. J. Soc. Ind. Appl. Math. 1957, 5, 32–38. [Google Scholar] [CrossRef] [Scilit]
- Geisberger, R.; Sanders, P.; Schultes, D.; Delling, D. Contraction hierarchies: Faster and simpler hierarchical routing in road networks. In Proceedings of the 7th International Workshop, WEA 2008, Provincetown, MA, USA, 30 May–1 June 2008. [Google Scholar]
- Argota Sánchez-Vaquerizo, J. Getting real: The challenge of building and validating a large-scale digital twin of Barcelona’s traffic with empirical data. ISPRS Int. J. Geo-Inf. 2022, 11, 24. [Google Scholar] [CrossRef] [Scilit]
- He, W.; Yang, J.Y.; Drury, C.F.; Smith, W.N.; Grant, B.B.; He, P.; Qian, B.; Zhou, W.; Hoogenboom, G. Estimating the impacts of climate change on crop yields and N2O emissions for conventional and no-tillage in Southwestern Ontario, Canada. Agric. Syst. 2018, 159, 187–198. [Google Scholar] [CrossRef] [Scilit]
- Raparthi, M.; Dodda, S.B.; Maruthi, S.; Keshta, I.; Agarwal, A. Optimal Cluster and Node Balancing Technique Using K-Mean Based on Q-Learning for Wireless Sensor Network. In International Conference on Intelligent Computing and Networking; Springer Nature: Singapore, 2024. [Google Scholar]
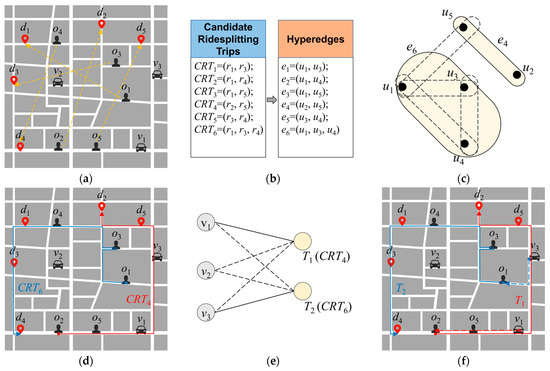
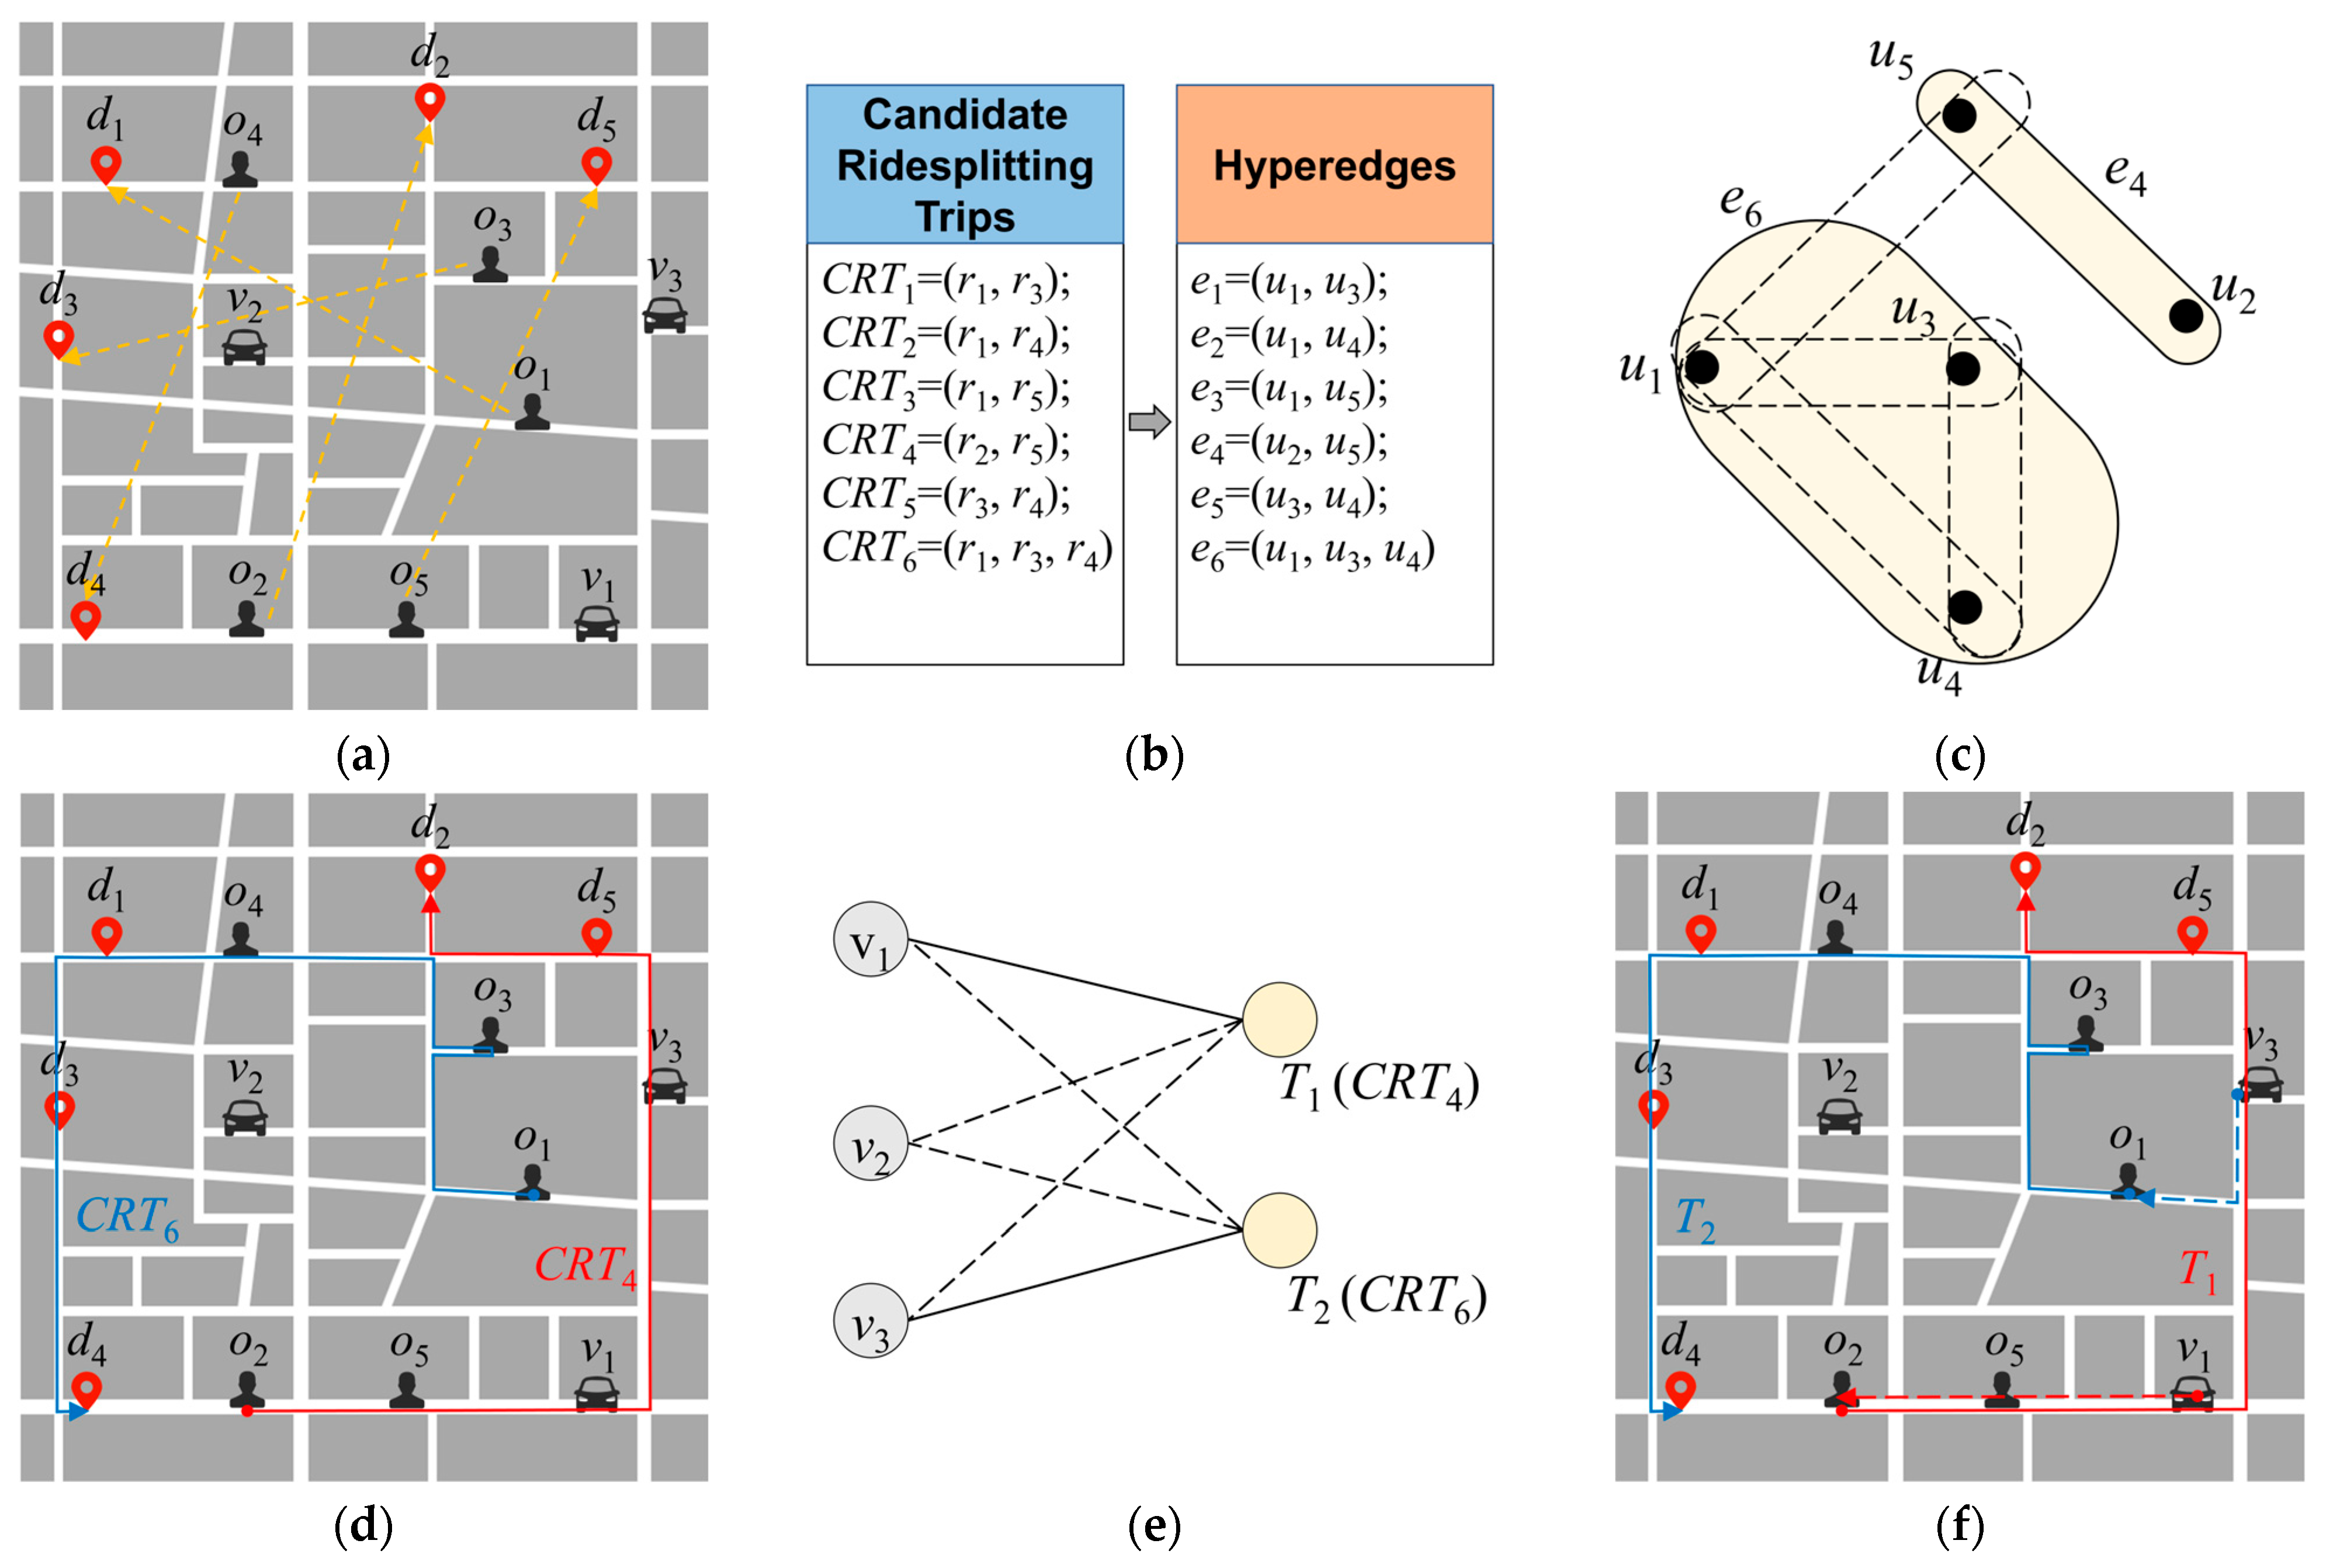
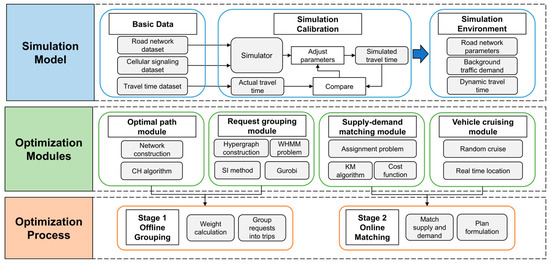
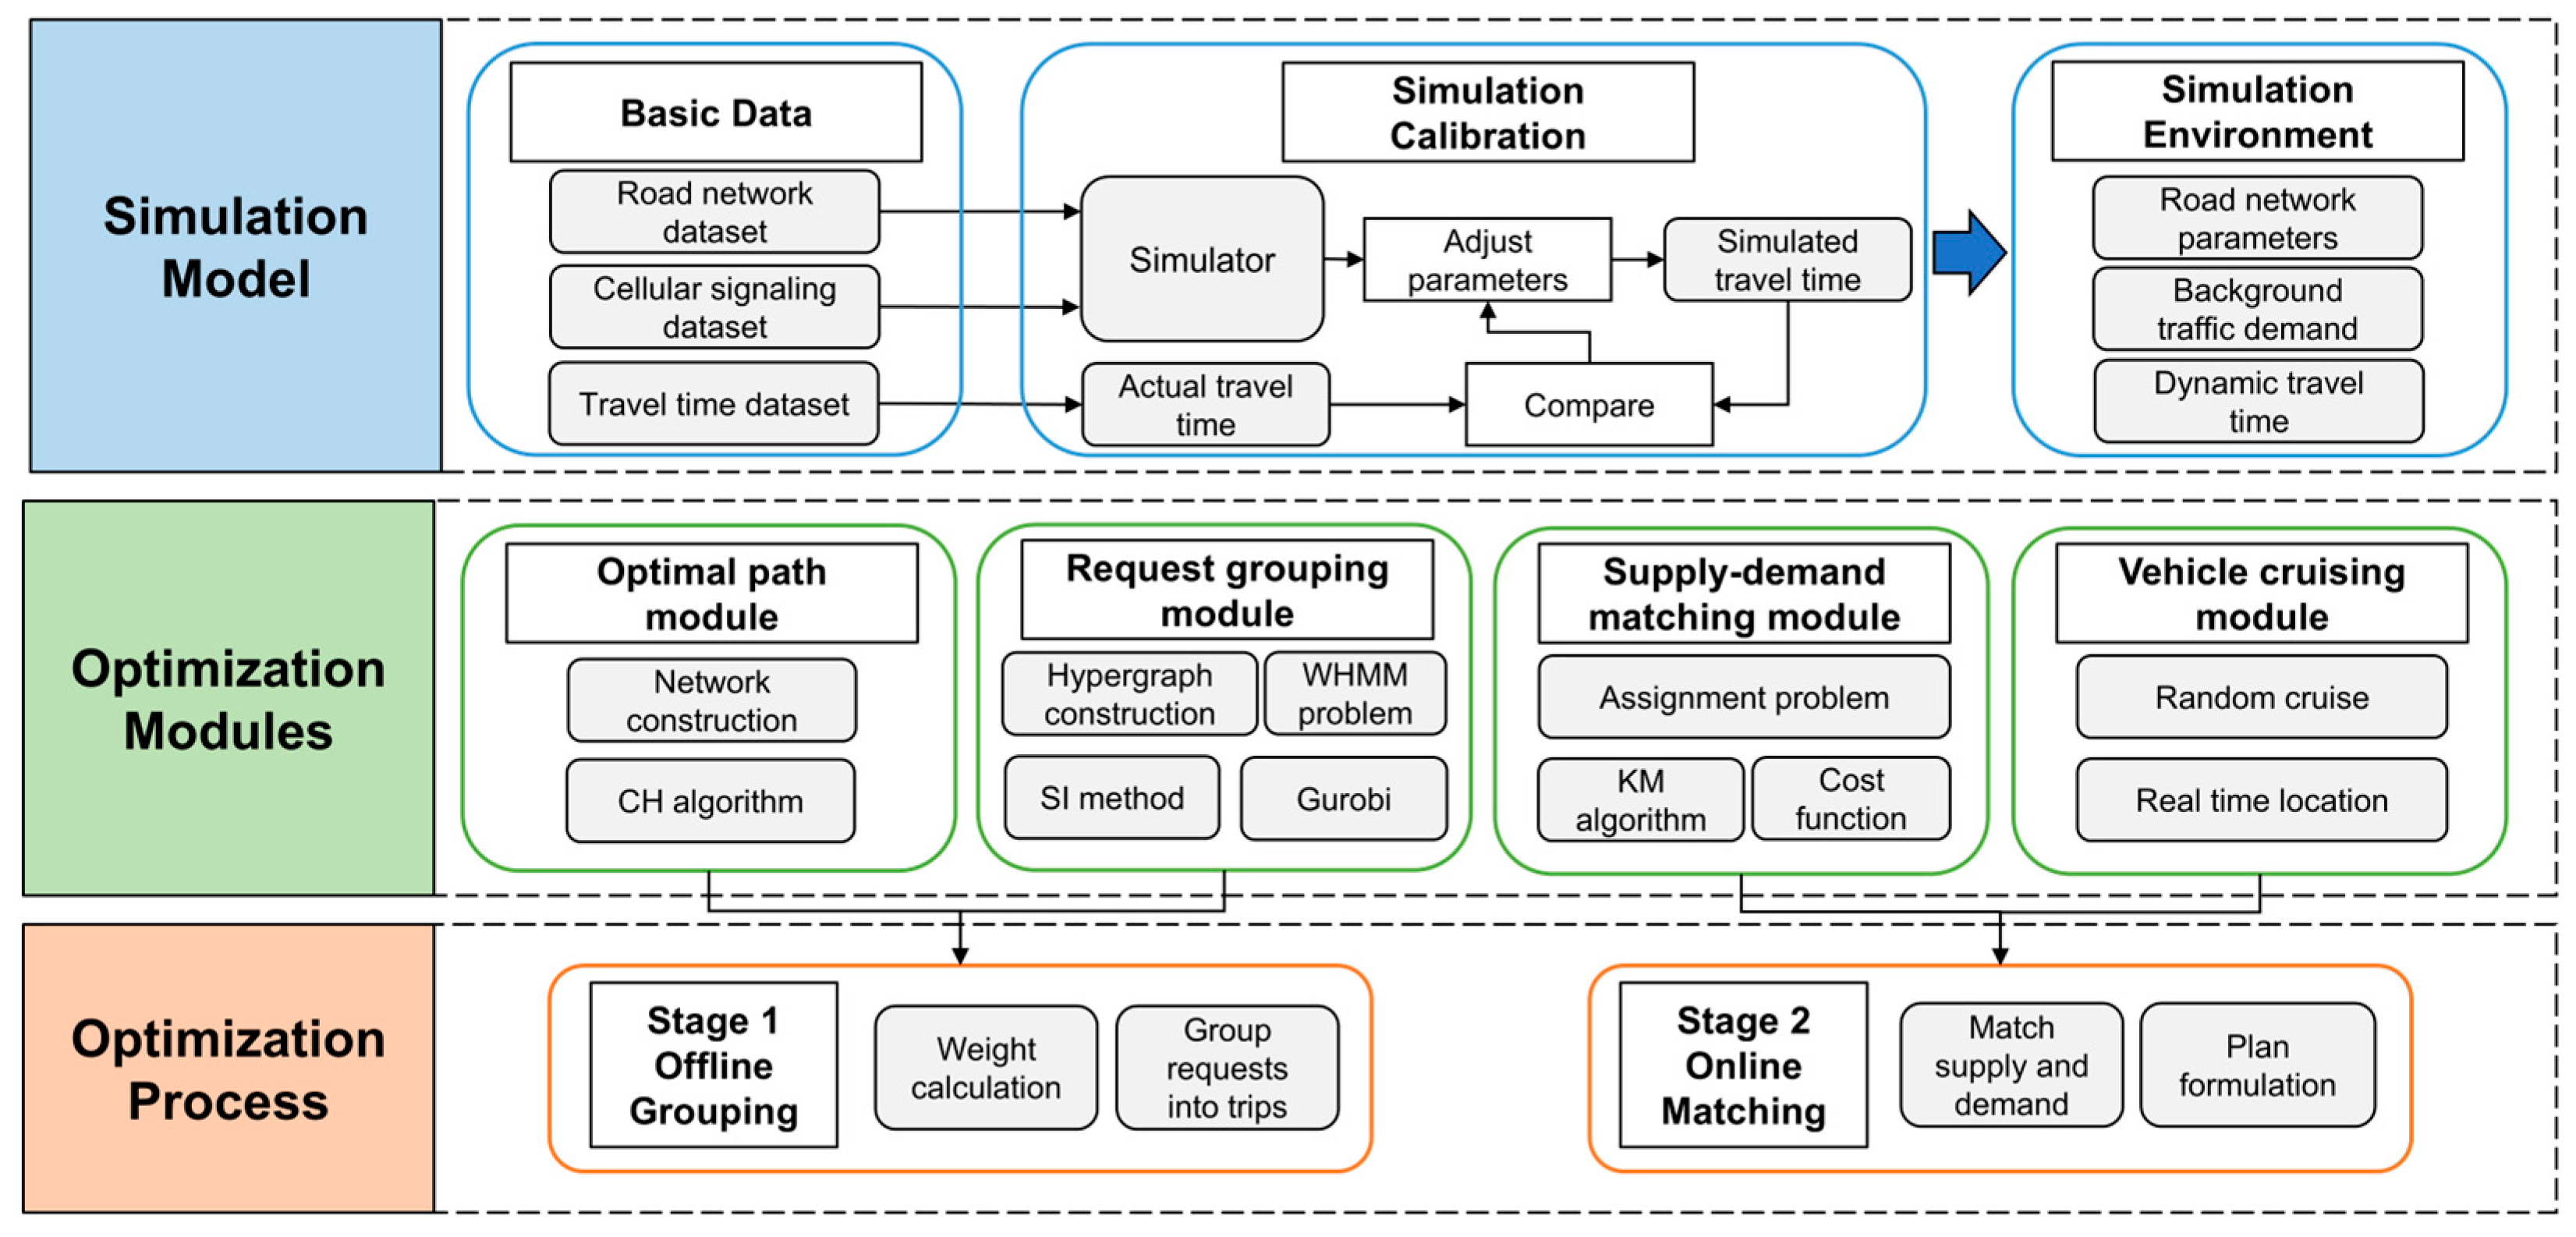
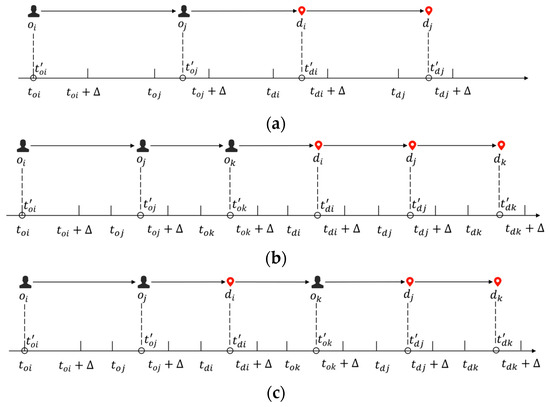
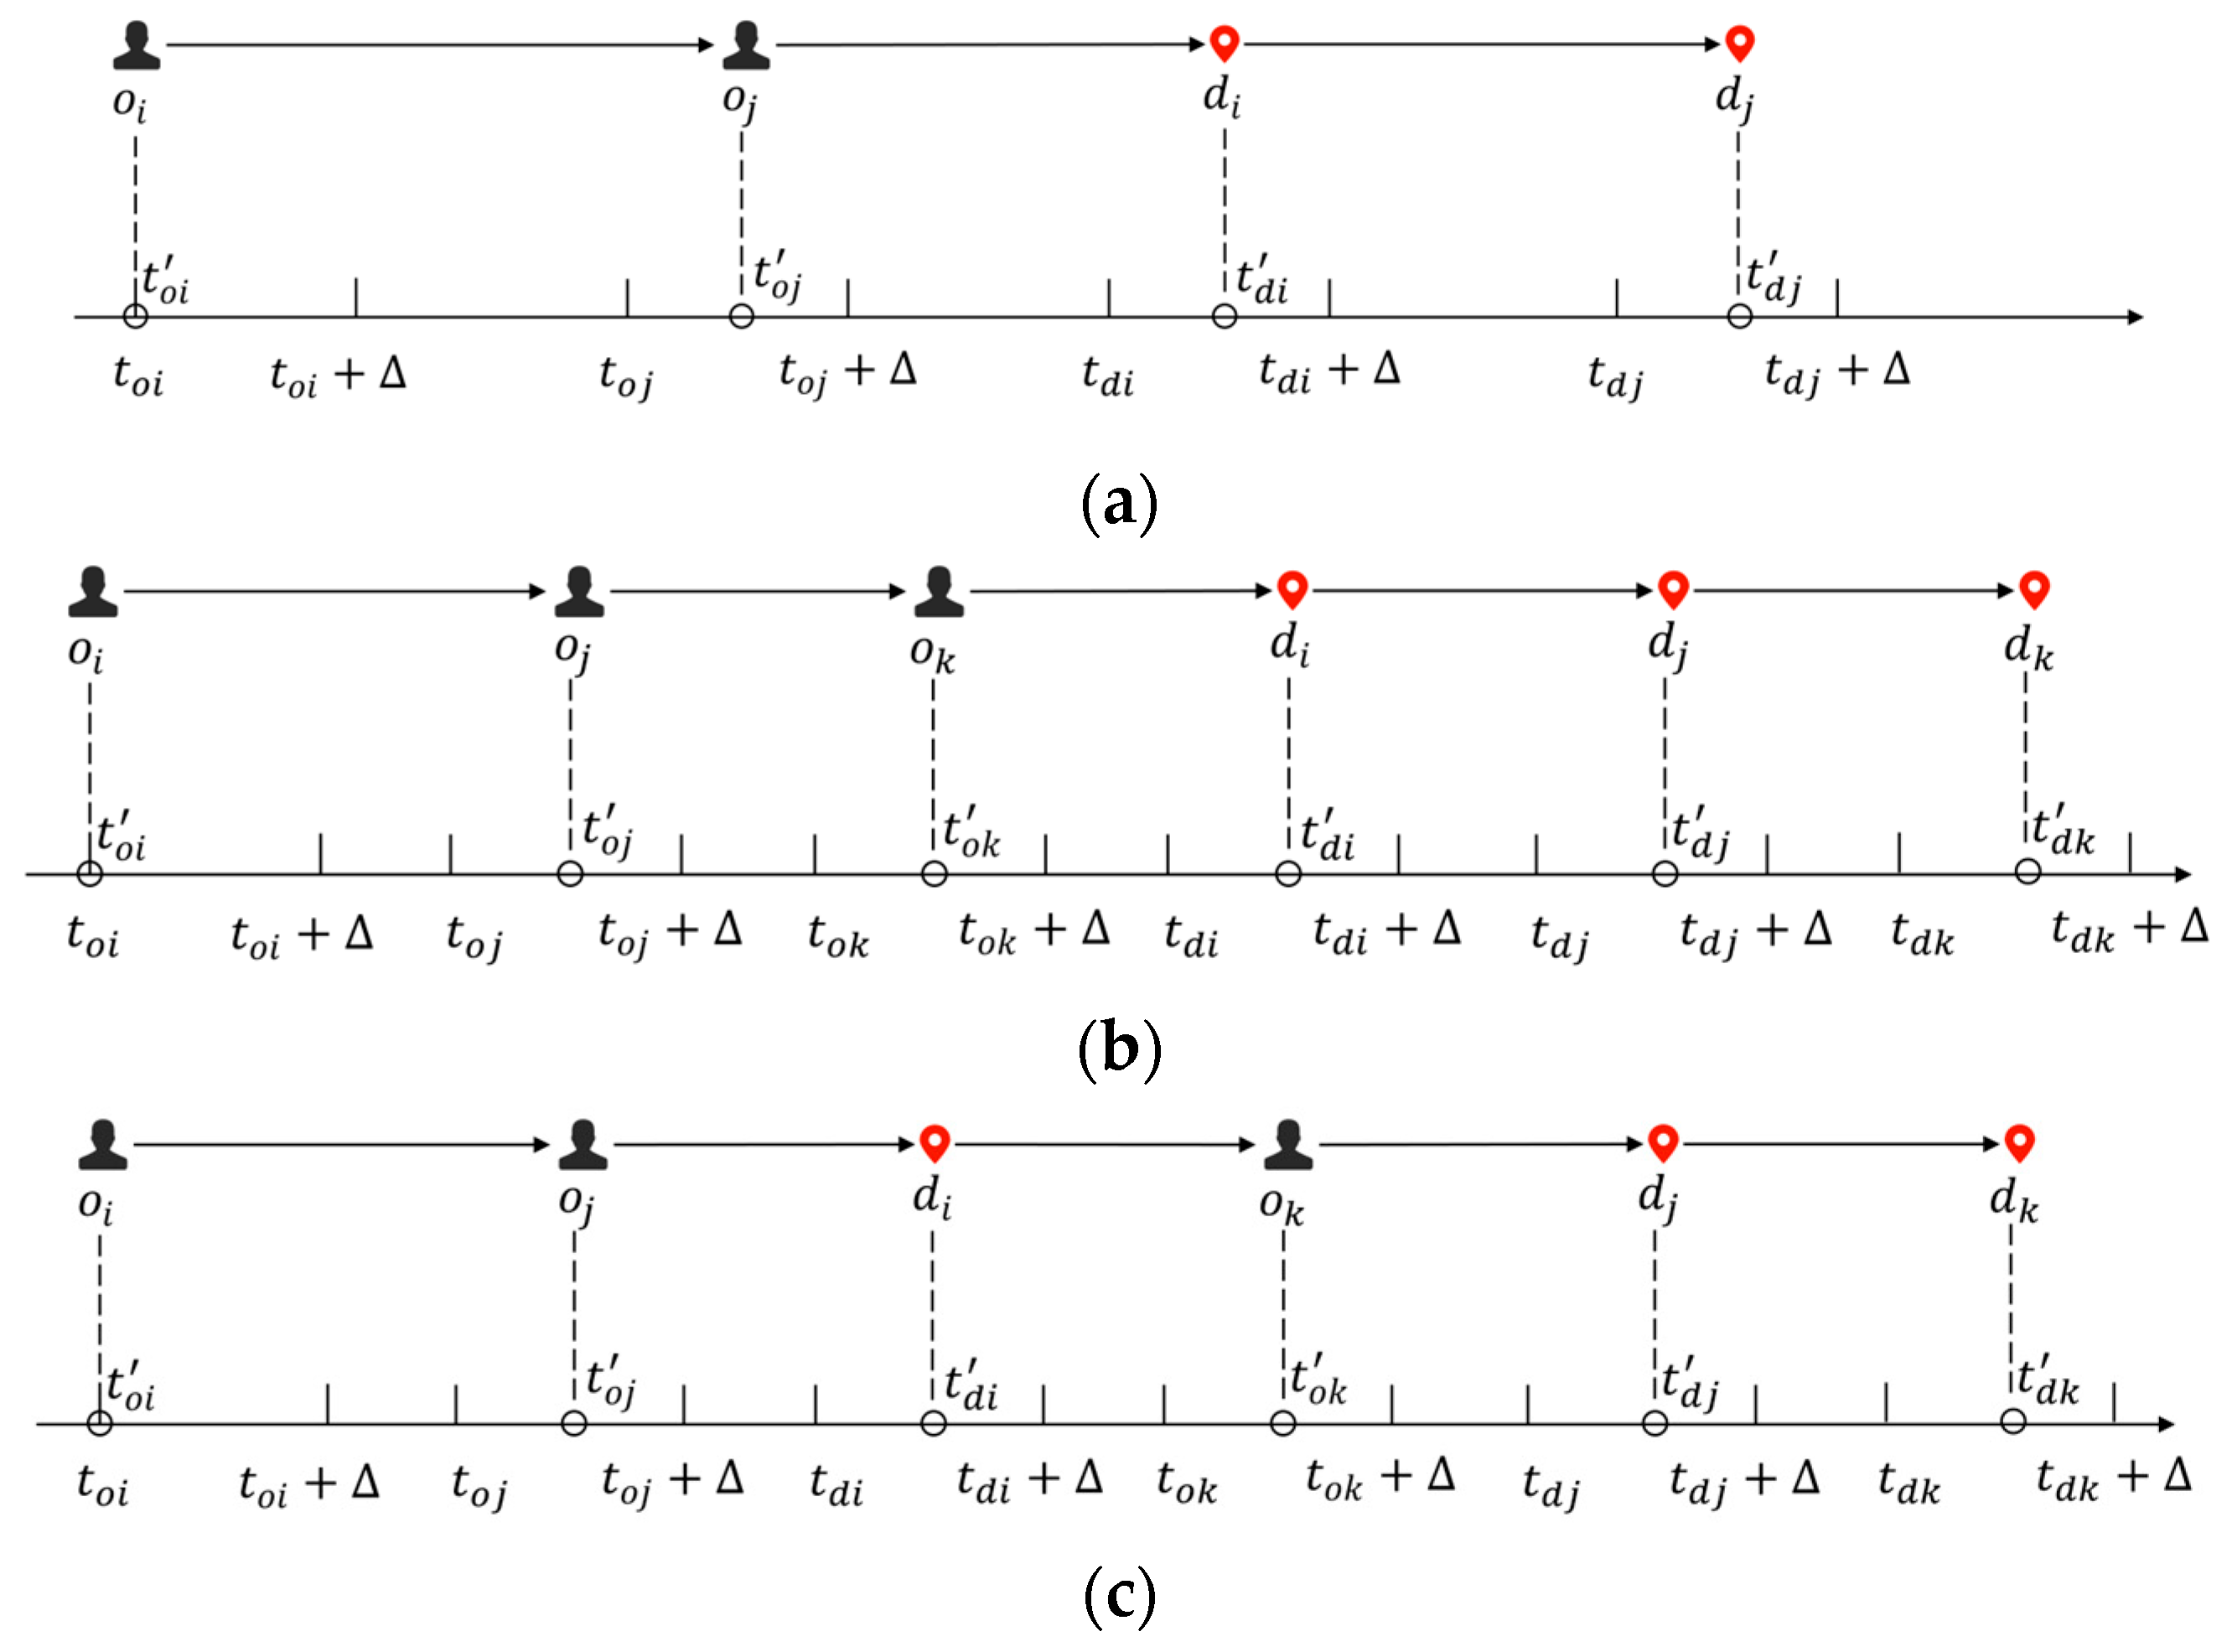
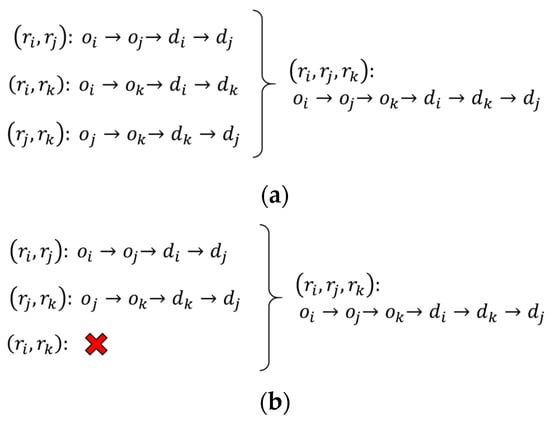
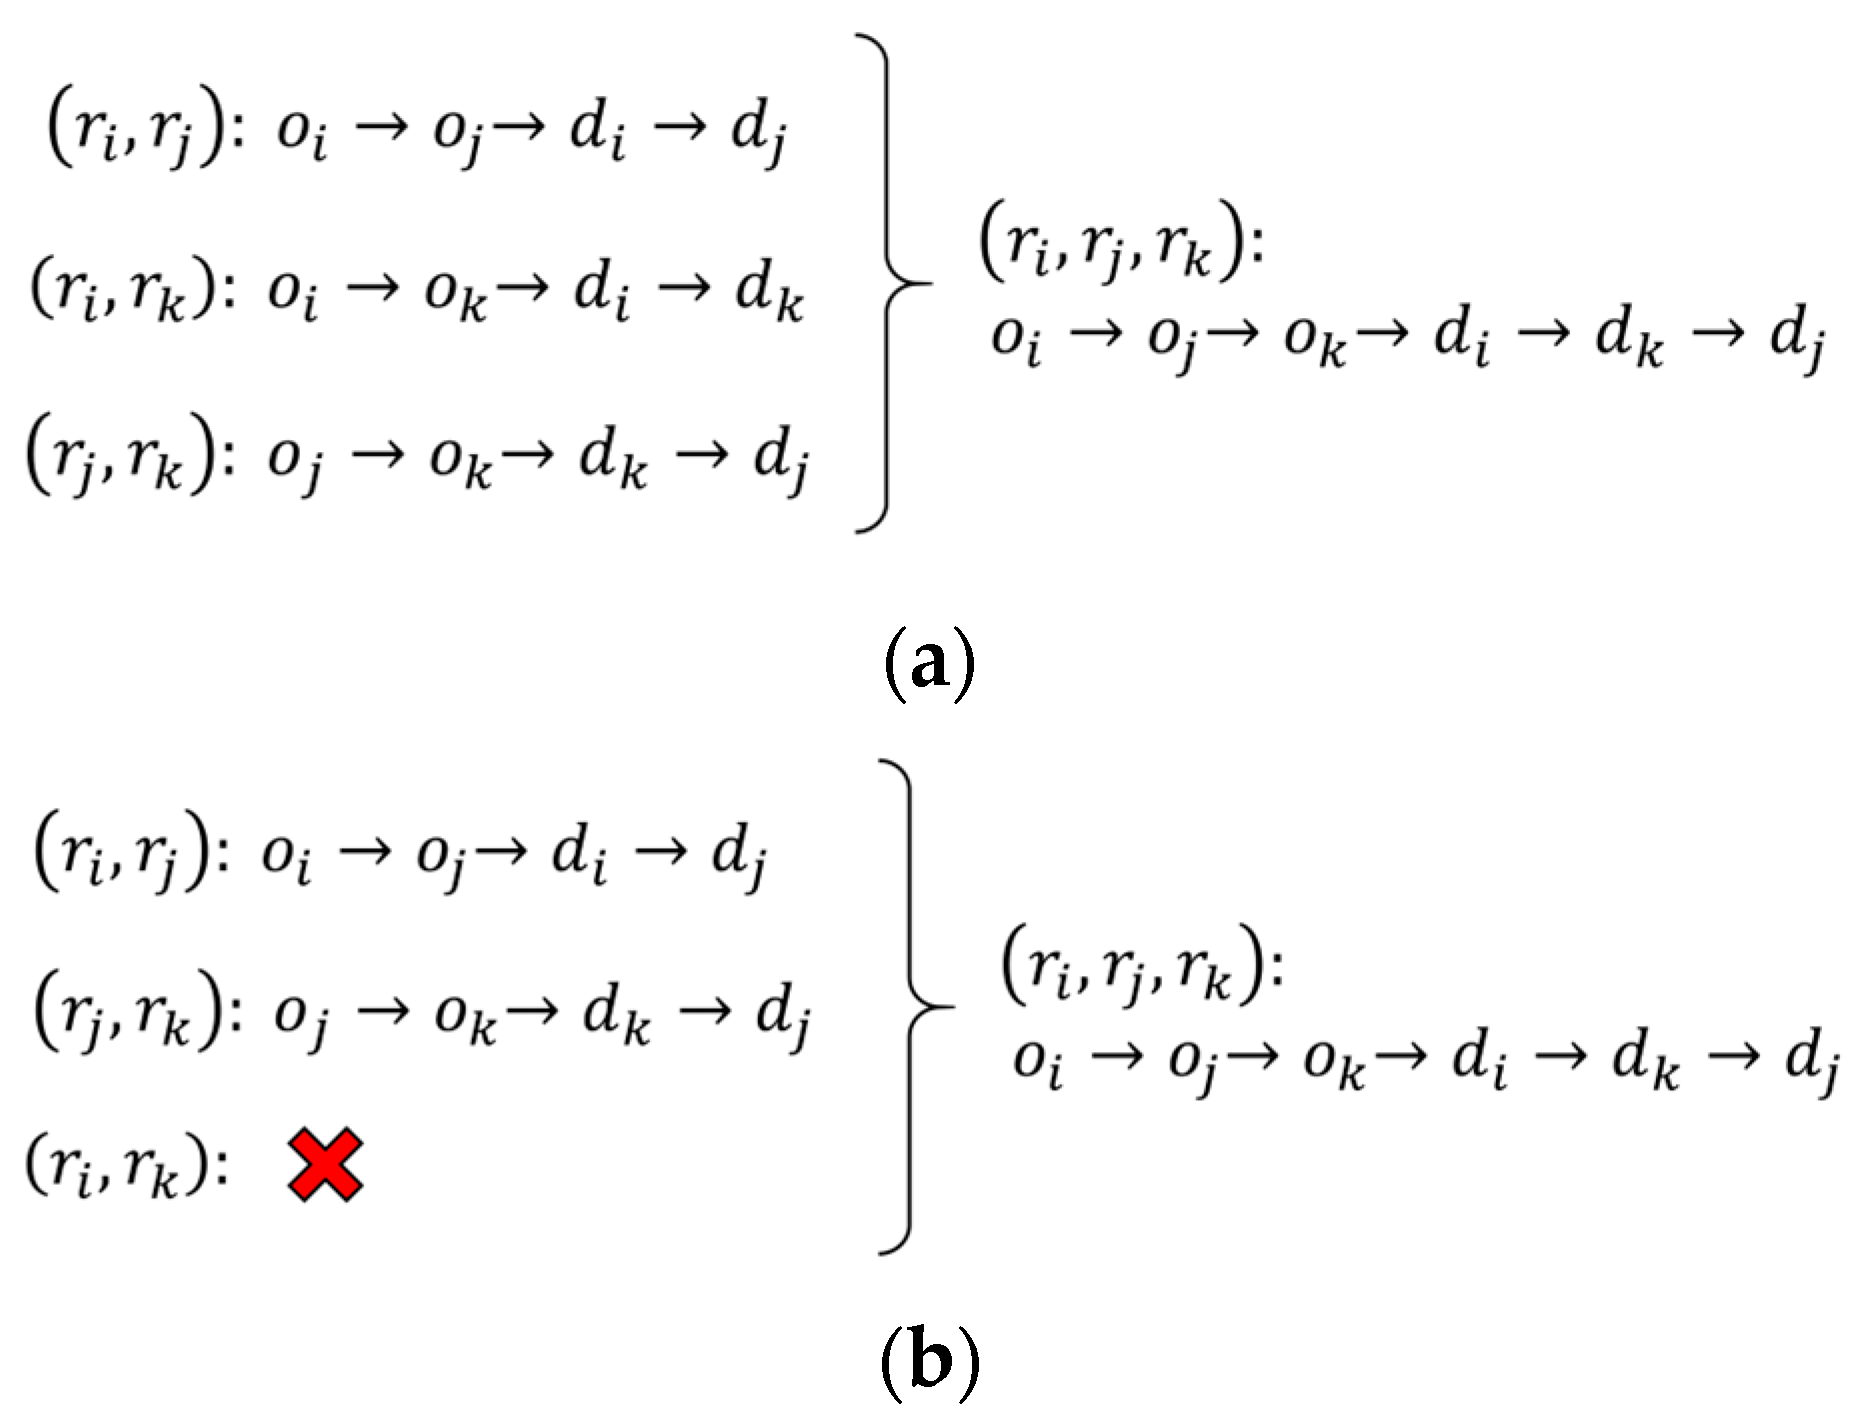
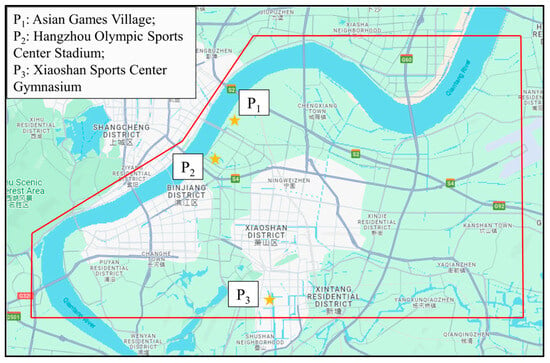
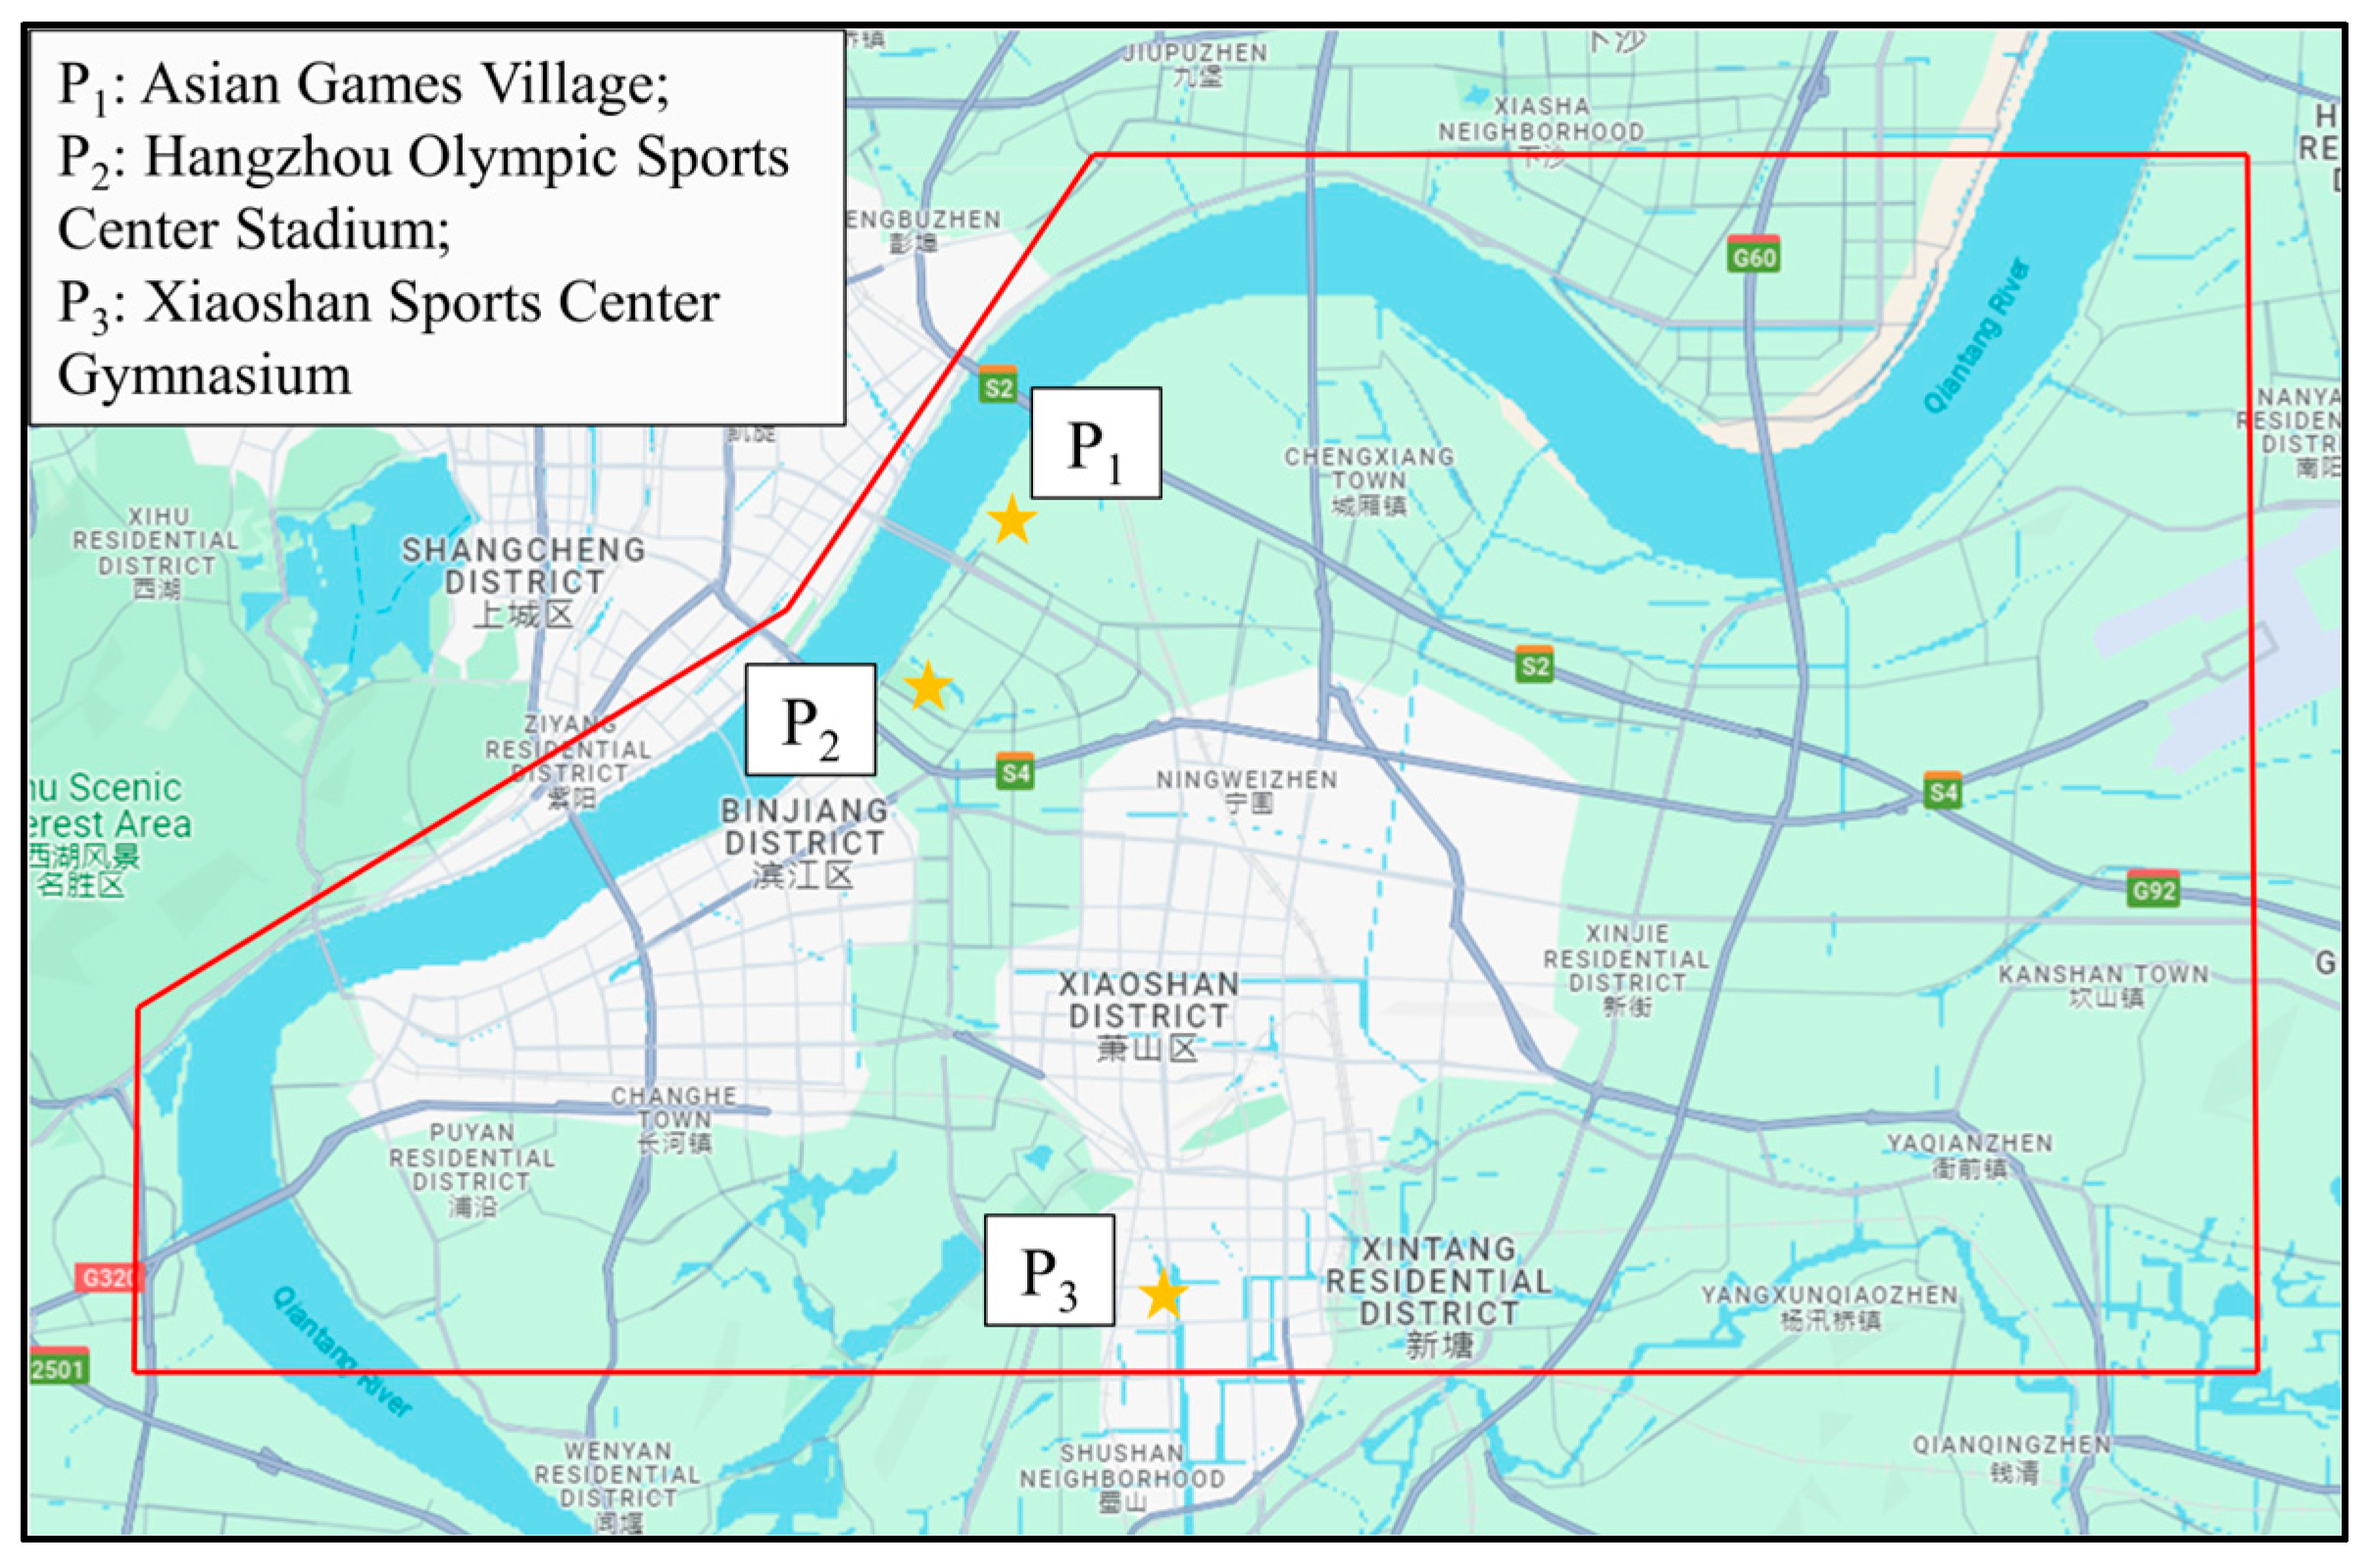
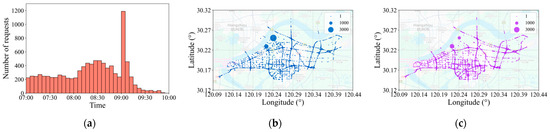
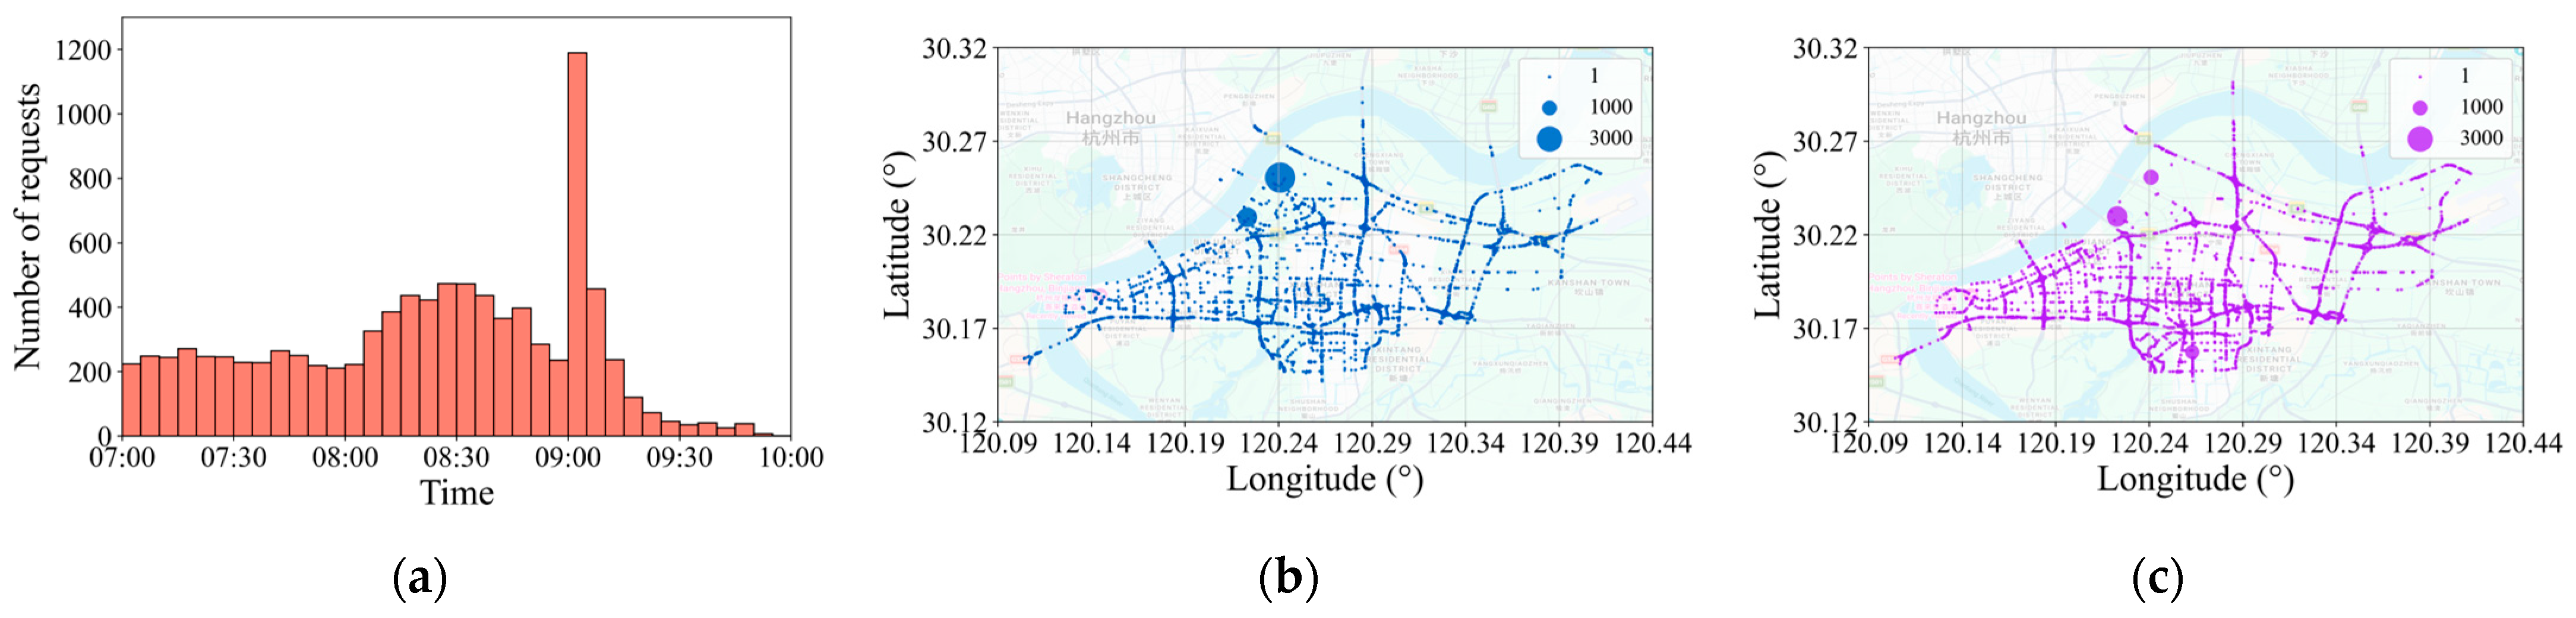
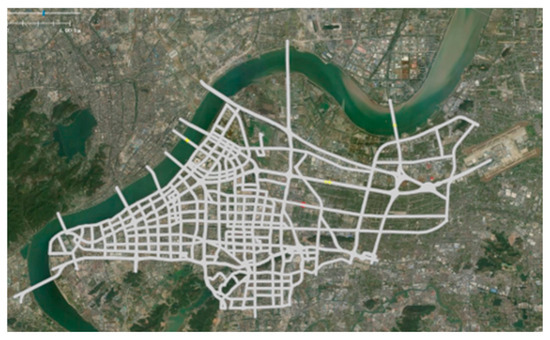
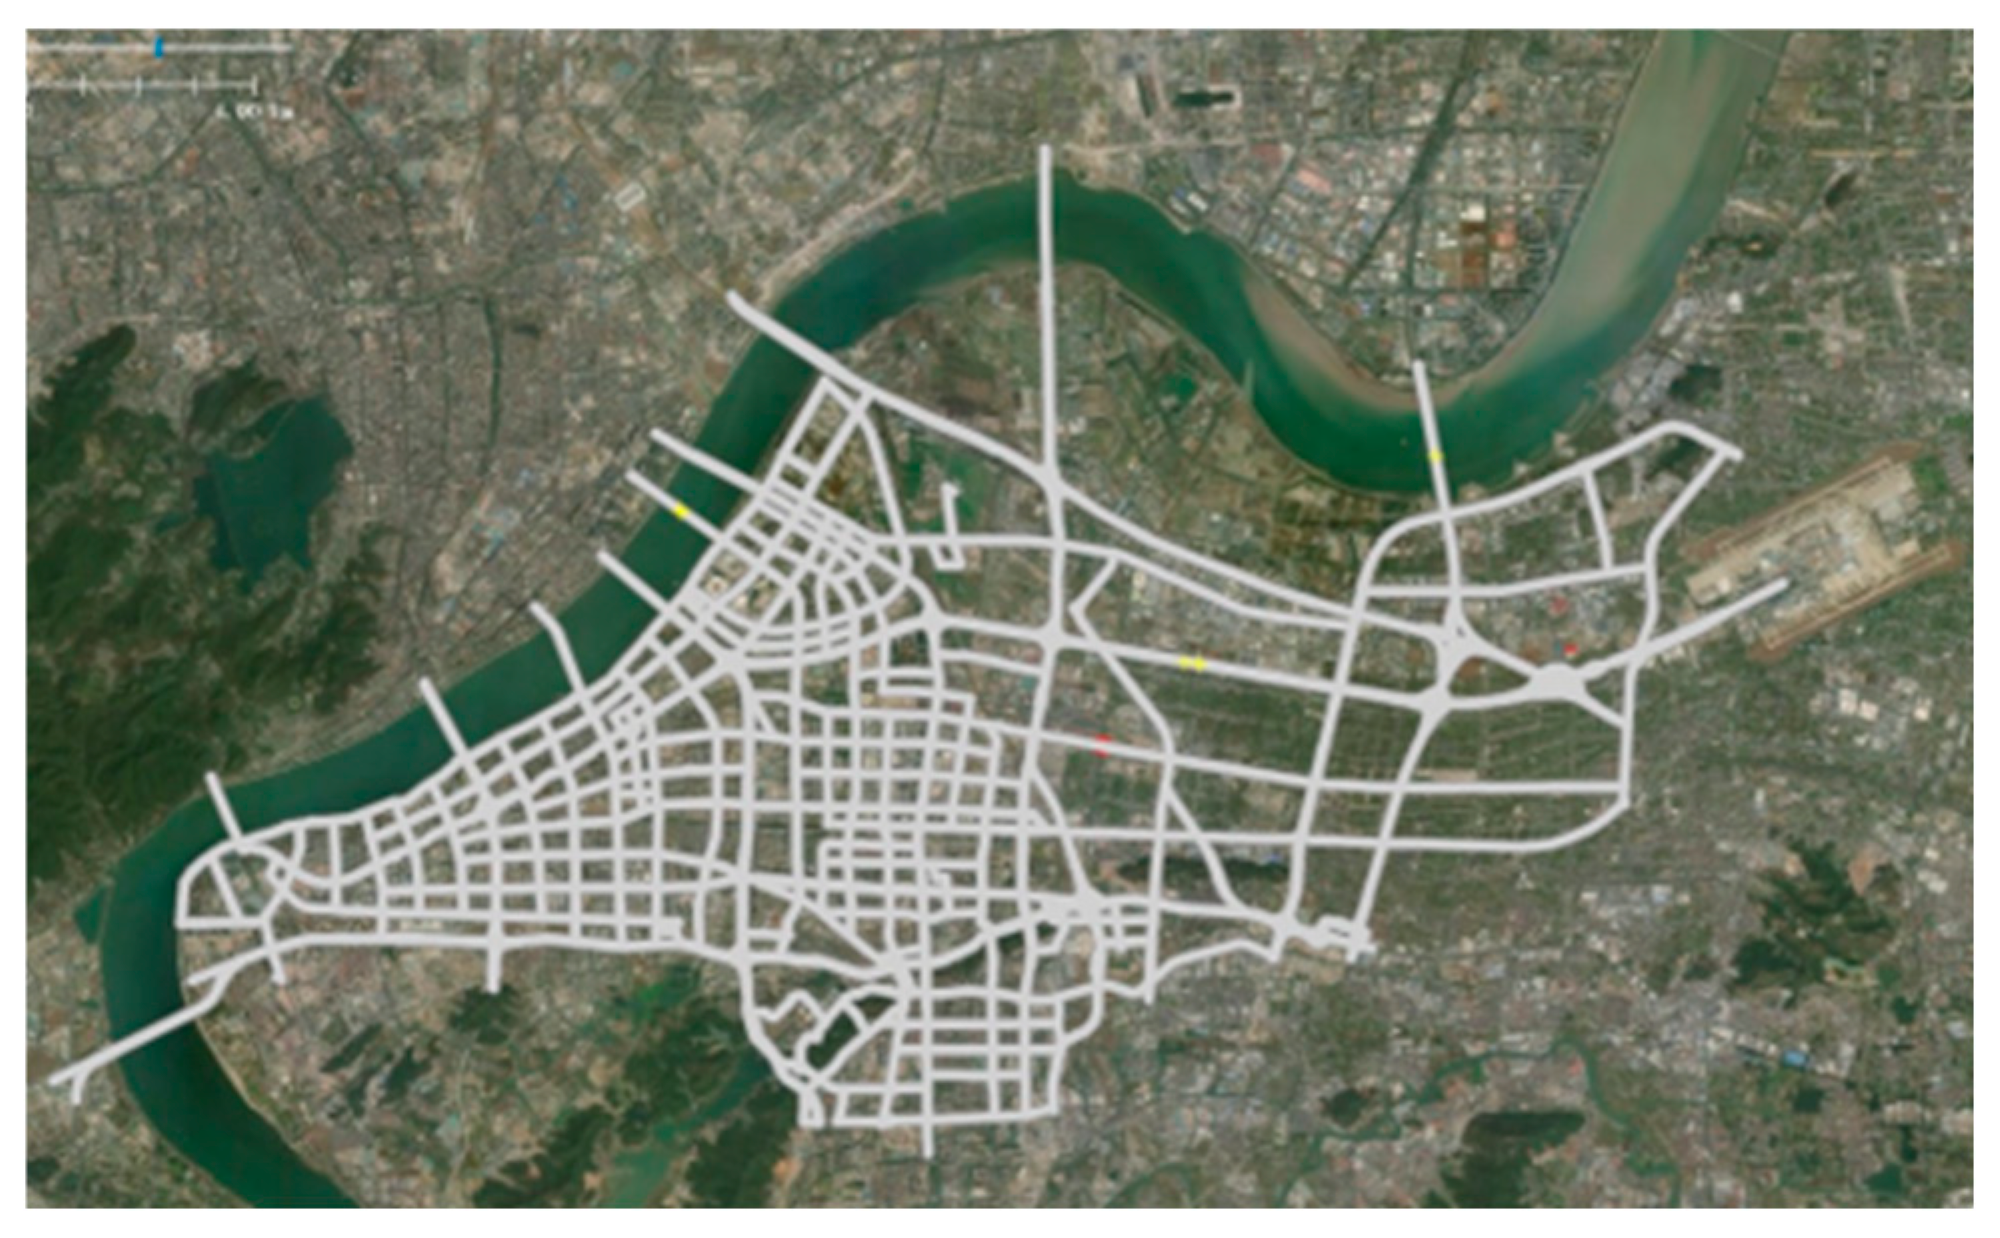
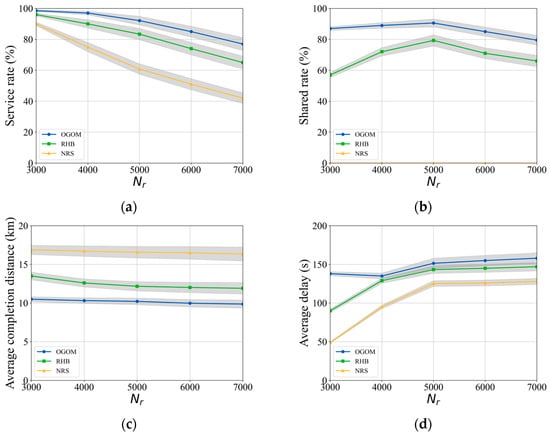
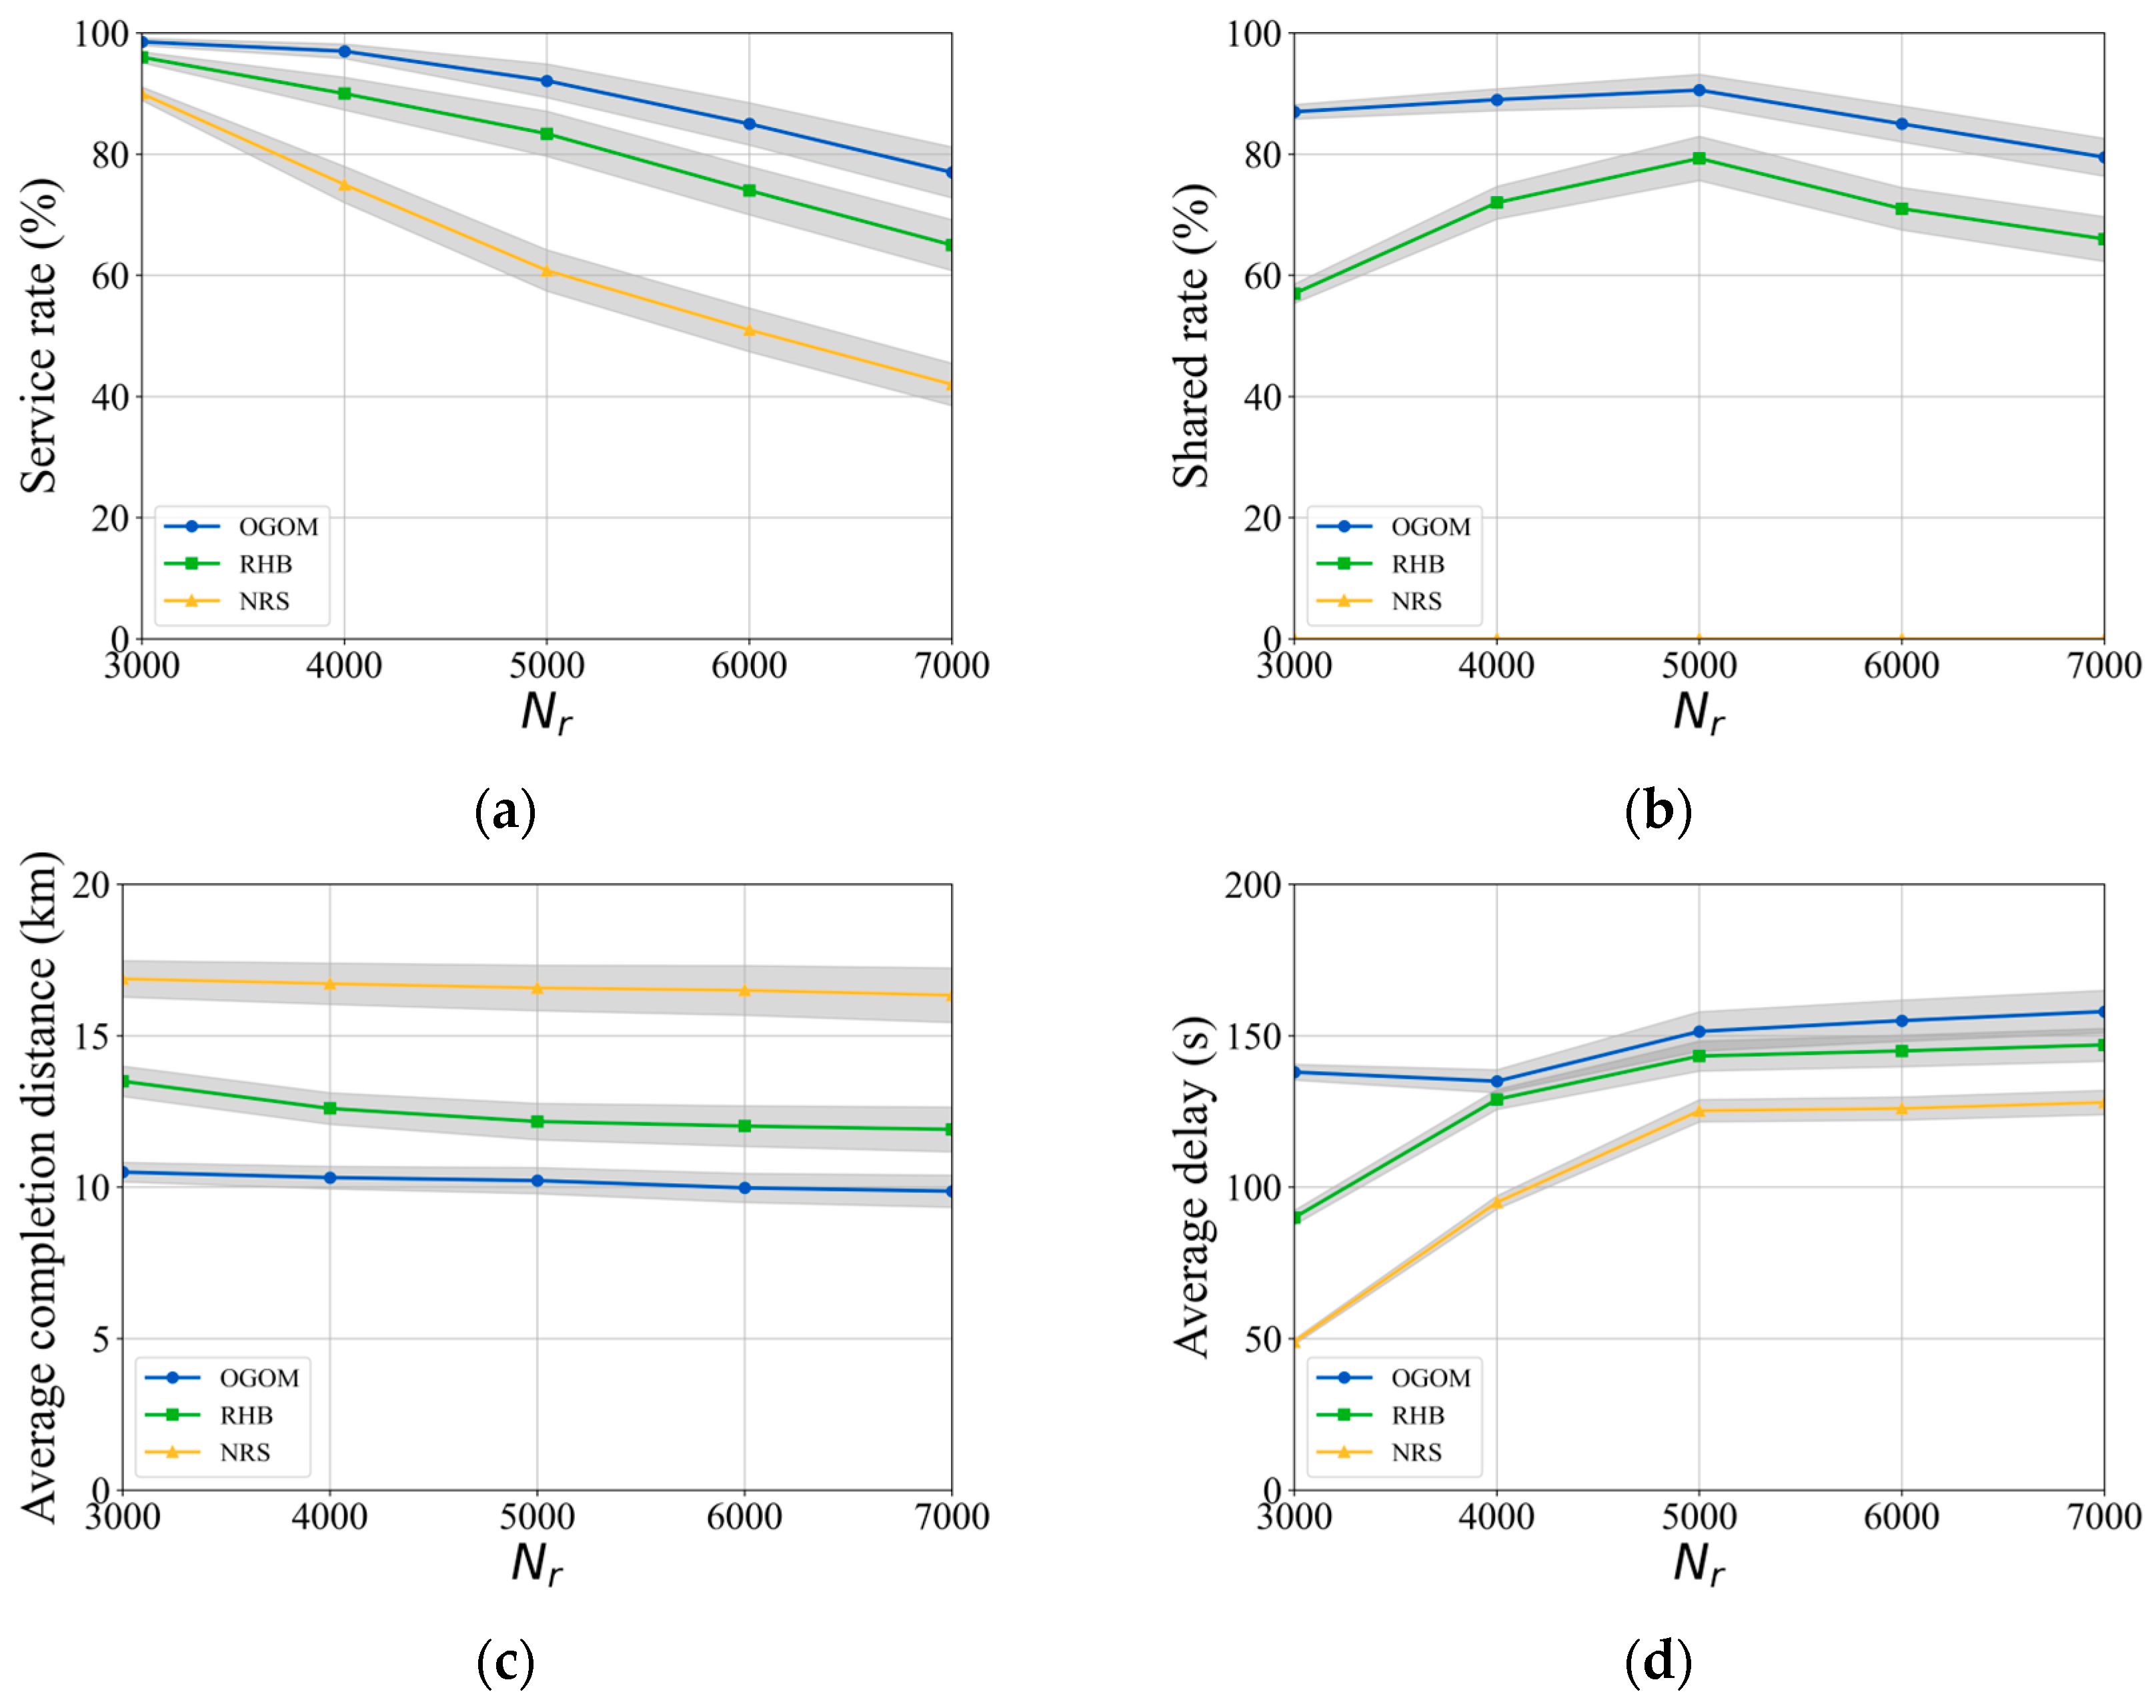
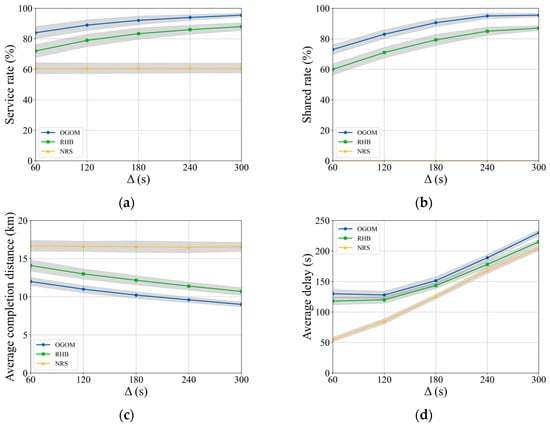
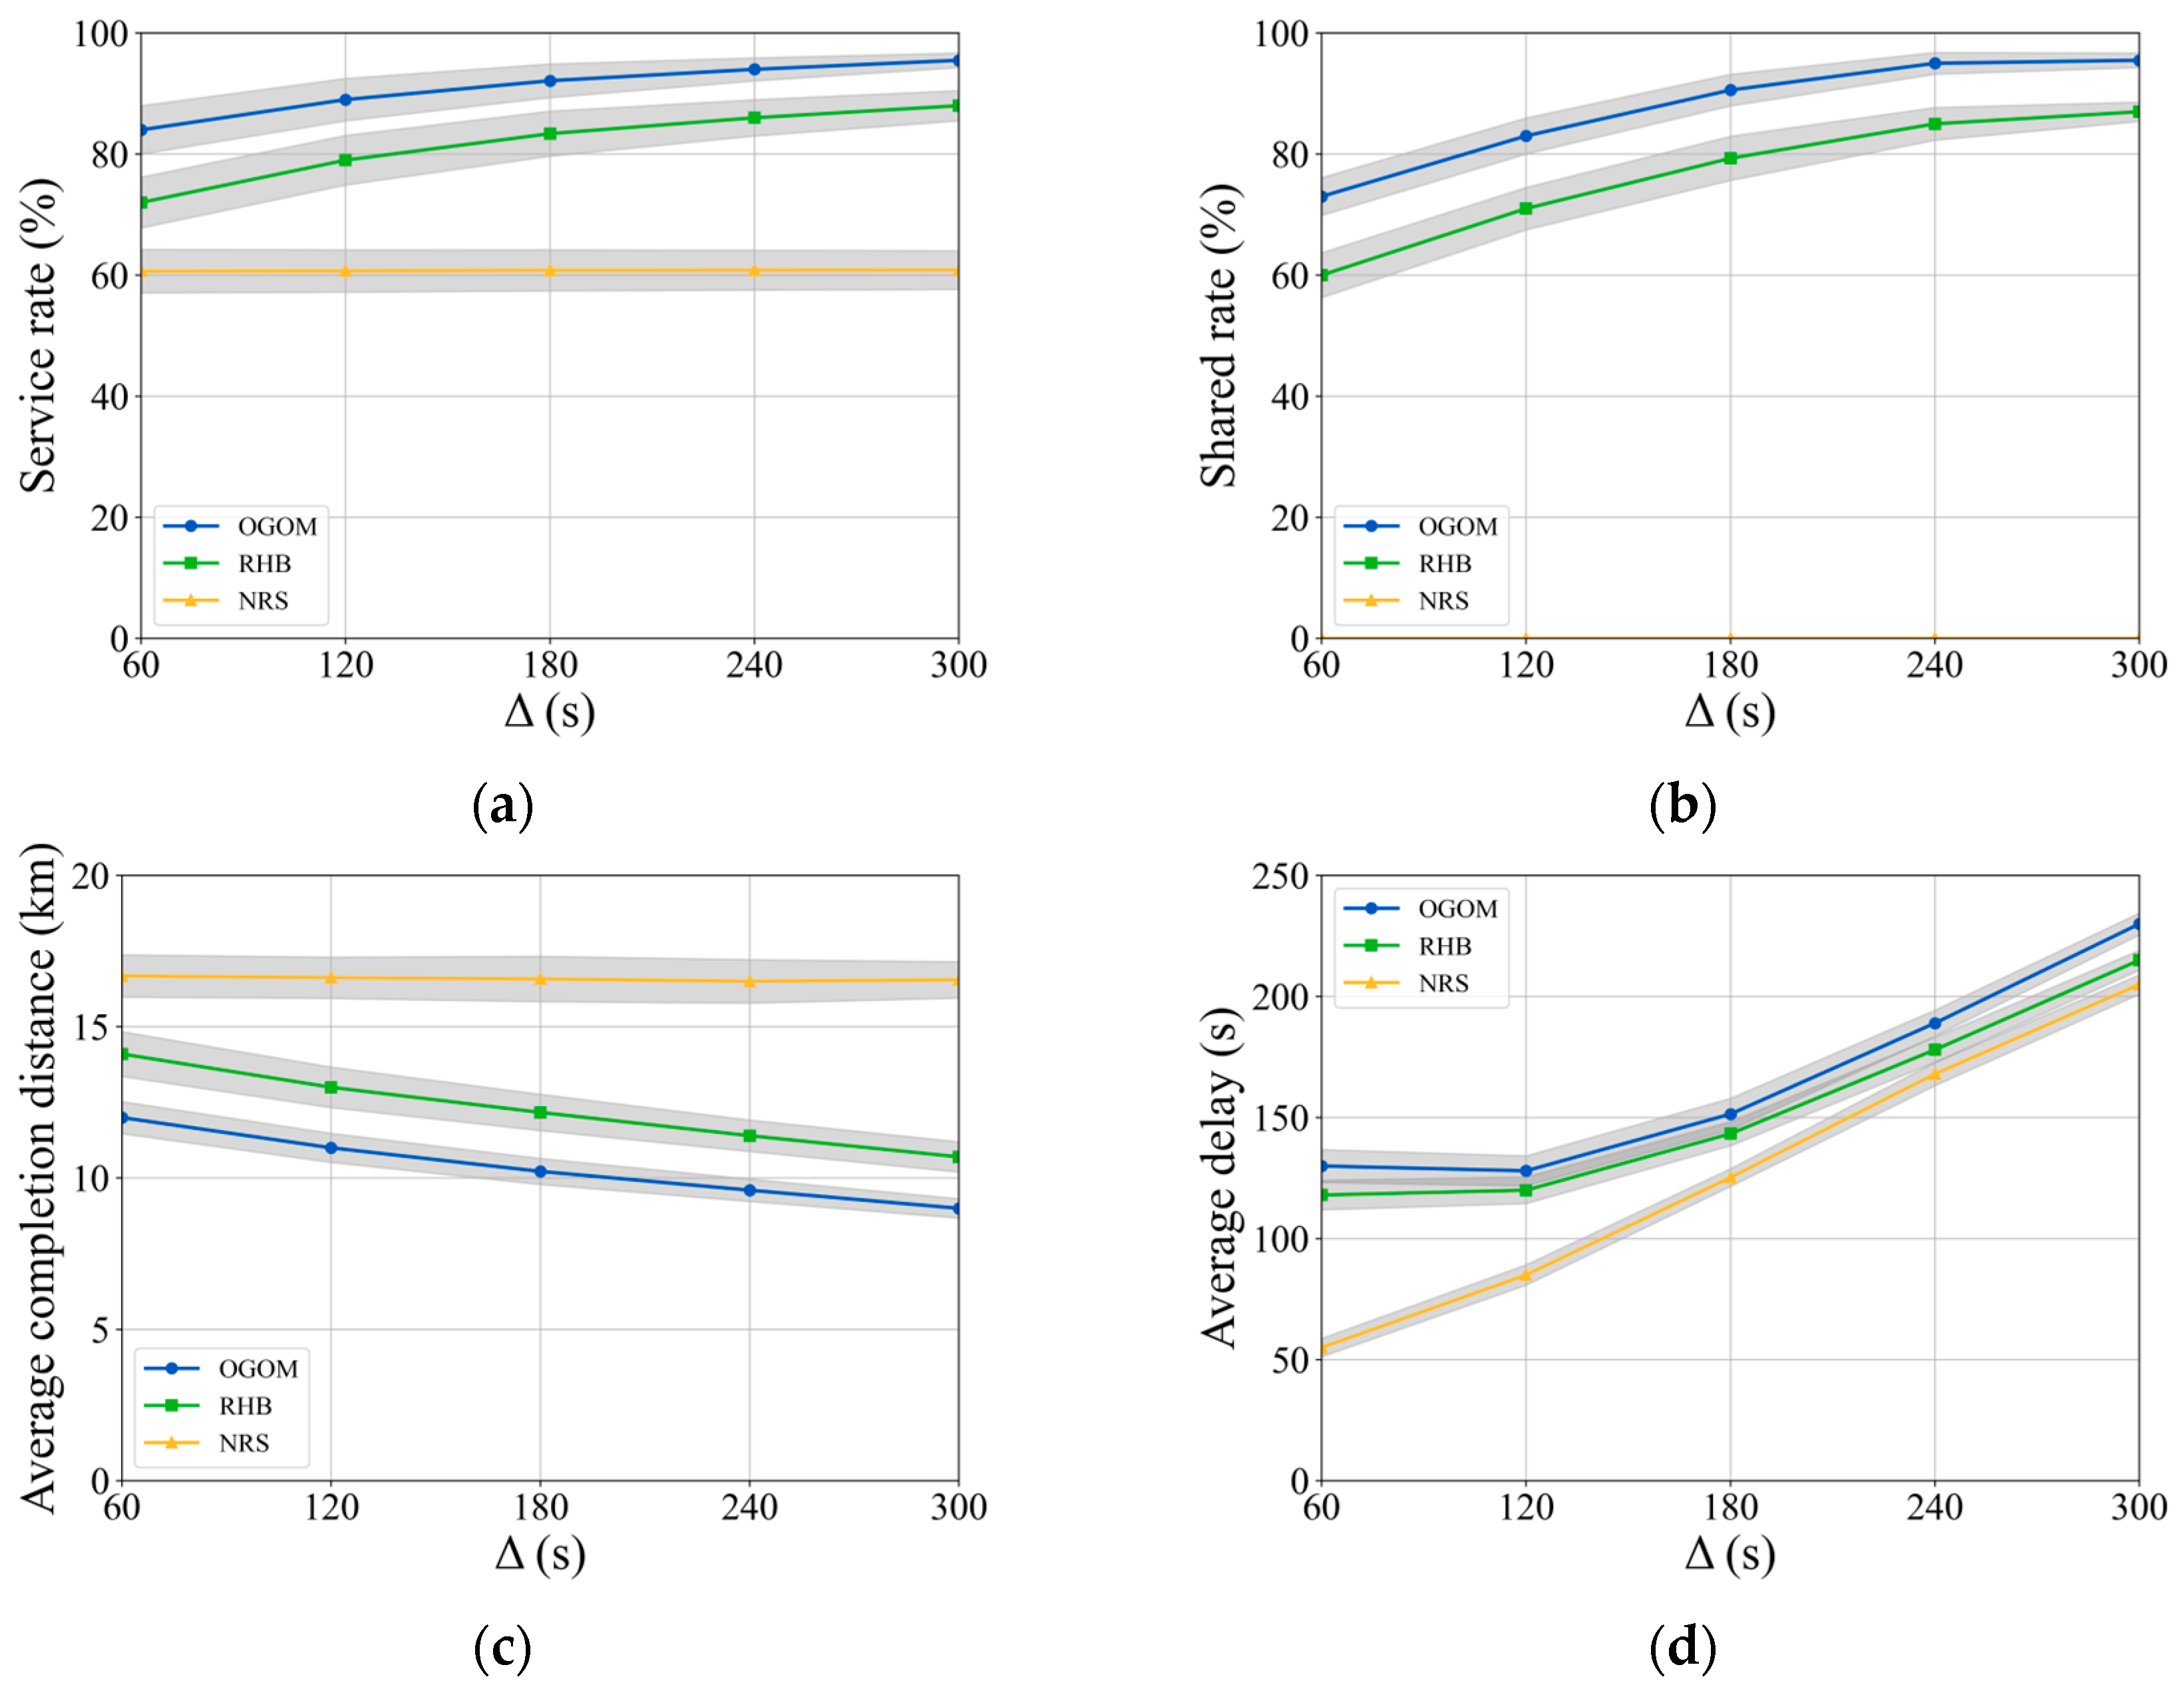

Disclaimer/Publisher’s Note: The statements, opinions and data contained in all publications are solely those of the individual author(s) and contributor(s) and not of MDPI and/or the editor(s). MDPI and/or the editor(s) disclaim responsibility for any injury to people or property resulting from any ideas, methods, instructions or products referred to in the content. |
© 2026 by the authors. Licensee MDPI, Basel, Switzerland. This article is an open access article distributed under the terms and conditions of the Creative Commons Attribution (CC BY) license.