


Abstract
External defects considerably reduce the quality, consumer acceptance, and market value of citrus fruits. Therefore, a rapid and reliable, non-destructive inspection method is necessary for postharvest processing. In this study, a non-destructive approach for external defect classification of citrus fruits is developed by combining visible–near infrared hyperspectral imaging (HSI) with effective wavelength selection (EWS) algorithms. First, 1702 spectral samples of normal and defective regions on citrus fruit surfaces were collected. A partial least squares discriminant analysis (PLS-DA) model was developed using the full wavelength range (400–1000 nm), which achieved 99.02% prediction accuracy. Four EWS algorithms—weighted regression coefficients, variable importance in projection, sequential forward selection (SFS(5, 10, 15)), and random frog—were evaluated for optimal spectral dimensionality and computational efficiency. The SFS15-PLS-DA model, which selected 15 optimal variables out of the initial 300 and used maximum normalization preprocessing, achieved the highest prediction accuracy of 99.80%. This model demonstrated near-perfect classification while reducing the total number of wavelengths by 95.0% (from 300 to 15 wavelengths). Further, a pixel-wise image classification algorithm was implemented using the optimal model, which effectively detected physical damage, pest infestation, and fungal decay. These results demonstrate that combining HSI with EWS enables compact, interpretable, and high-performance models suitable for real-time postharvest sorting. This approach has strong potential to enhance automation, speed, and reliability in commercial citrus quality assessment.
1. Introduction
Citrus fruits, rich in nutrients, are among the most widely consumed fruits in Korea [1]. Among their quality attributes, external appearance significantly influences consumer purchasing decisions. Common defects such as depressions, scratches, softening, and pest damage often occur during cultivation and post-harvest handling, compromising product safety and marketability. These defects can also accelerate decay or cross-contamination during storage or distribution. Accurate post-harvest classification based on external quality is therefore essential to enhance the safety and profitability of the citrus supply chain [2].
Currently, external defects in citrus fruits are typically assessed through manual visual inspection, which is inherently subjective, labor-intensive, and inconsistent [3]. To address these limitations, automated vision-based technologies, including RGB and hyperspectral imaging (HSI), have been explored. RGB imaging, while effective for color-based assessments, often fails to identify subtle or early-stage defects such as softening or decay that lack clear visual cues [4].
Hyperspectral imaging, which combines conventional imaging and spectroscopy, provides spatially resolved spectral information for every pixel and enables non-destructive and early detection of quality-related changes [5]. HSI has been successfully applied for detecting early bruising in pears [6] and various defects in jujube fruits [7].
However, the high dimensionality of hyperspectral data presents significant challenges for real-time application. Redundant and highly correlated adjacent wavelengths can lead to increased computation time, multicollinearity, and reduced model robustness. Therefore, effective wavelength selection (EWS) is crucial for reducing data dimensionality, minimizing redundancy, and improving model robustness and processing speed [8].
EWS techniques are typically categorized into interval-based and point selection methods. Interval-based methods select continuous wavelength ranges, whereas point selection methods identify discrete, non-contiguous wavelengths, offering improved model efficiency. Representative point-based algorithms include weighted regression coefficient (WRC), variable importance in projection (VIP), sequential forward selection (SFS), and random frog (RF). These methods differ in their selection strategies: WRC prioritizes spectral variables with high regression coefficients [9]; VIP evaluates variable importance within the projection space [10]; SFS adds features incrementally to minimize classification error [11]; and RF combines random sampling and Markov Chain Monte Carlo methods for robust selection in high-dimensional contexts [12].
Integrating HSI with EWS has been shown to improve defect classification accuracy while significantly reducing computation [13]. This is especially critical for real-time agricultural product sorting systems where throughput exceeds 5 fruits per second. Lightweight models built on a small set of informative wavelengths enable faster inference, lower hardware costs, and greater scalability in industrial environments.
In recent years, advanced machine learning and deep learning models such as support vector machines (SVM) and convolutional neural networks (CNN) have been increasingly employed in hyperspectral image classification, demonstrating high accuracy and robustness in complex scenarios. However, these methods typically require large labeled datasets, high computational resources, and often lack interpretability regarding the contribution of individual wavelengths. In contrast, partial least squares discriminant analysis (PLS-DA) provides a computationally efficient and interpretable alternative, particularly well-suited for dimensionality reduction and real-time deployment. Therefore, PLS-DA was adopted in this study for its balance of accuracy, simplicity, and explainability, making it suitable for practical integration into sorting systems for citrus fruits.
This study aims to develop a rapid and accurate external defect classification model for citrus fruits by integrating visible–near infrared (Vis-NIR) hyperspectral imaging with four EWS algorithms—WRC, VIP, SFS, and RF. The spectral characteristics of citrus fruit defects are analyzed, effective wavelengths are identified using each algorithm, and the classification performance of PLS-DA models based on both full-spectrum and reduced-spectrum data is evaluated to determine the most effective and efficient configuration for real-world deployment.
2. Material and Methods
2.1. Experimental Samples
Satsuma mandarin (Citrus unshiu Marcow)—a variety of citrus fruit—was selected for experiments. A total of 259 Satsuma mandarin fruits were obtained through the Agricultural Processing Center (APC) in Seogwipo-si, Jeju Island, over three collection periods between September and October 2023. Because the APC aggregates fruits from multiple farms within the region, the collected samples did not originate from a single orchard and therefore included a certain degree of variability in cultivation conditions.
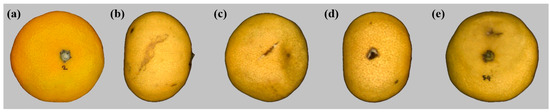
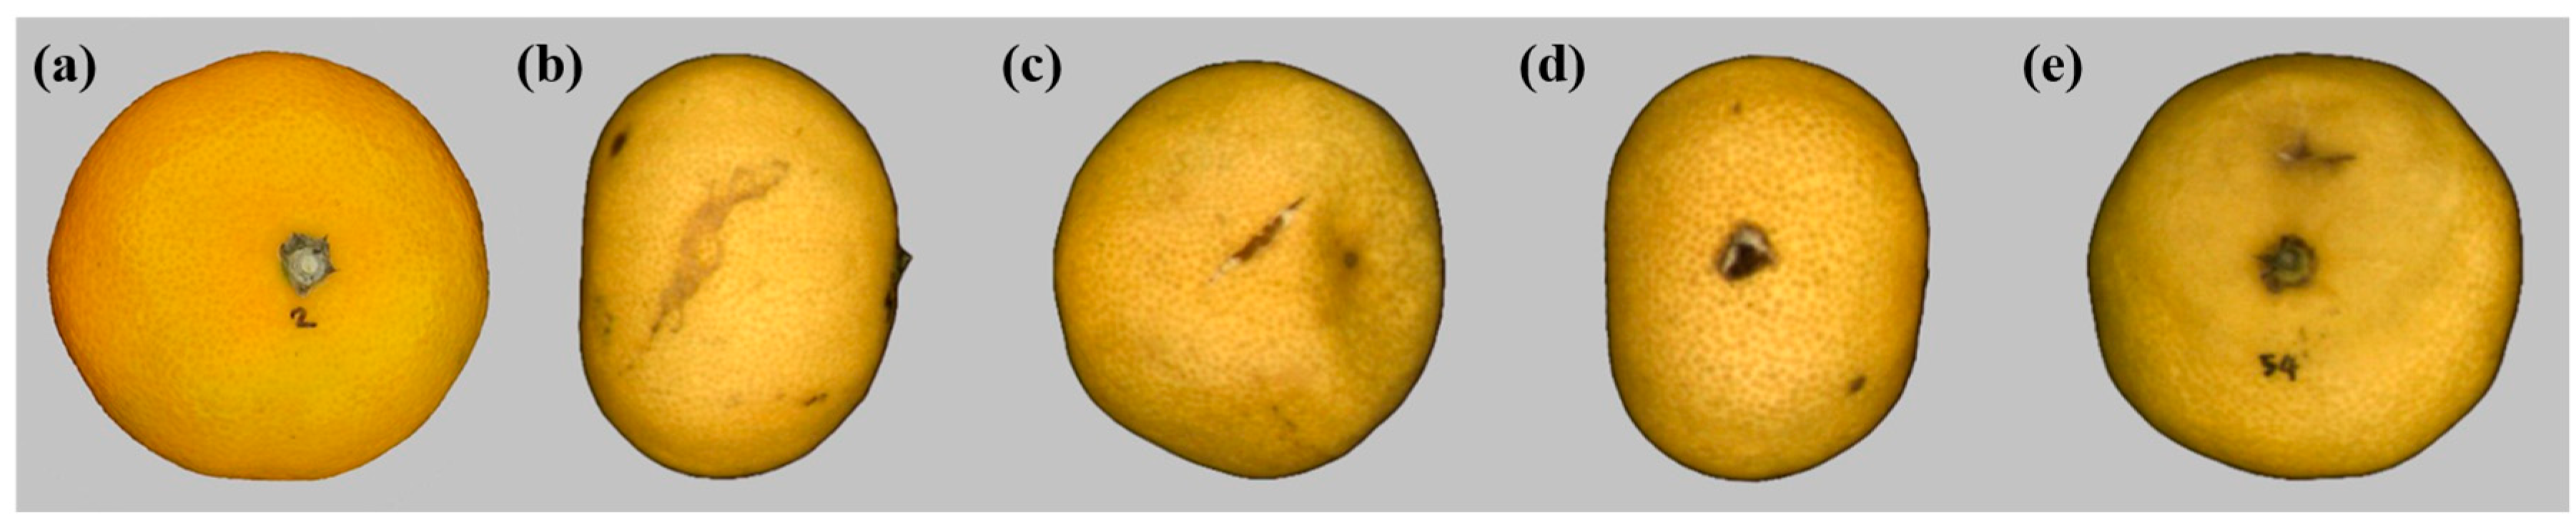
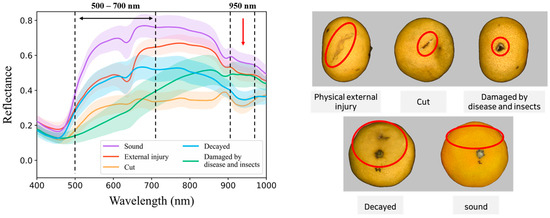
Among these, 76 fruits showed no visible defects and were categorized as sound samples (Figure 1a), whereas 183 fruits exhibited various external defects, including physical injury, cut, disease and insect damage, and decay (Figure 1b–e). Physical damages such as abrasion, bruising, and cutting were attributed to mechanical factors, softening was associated with environmental stress, and pest damage resulted from biotic factors. All samples were stored at 4 °C and tempered at 20 °C for 4 h prior to hyperspectral imaging to minimize temperature differences within the imaging environment.
Figure 1.
Representative RGB images of citrus fruits: (a) sound fruit, (b) physical injury, (c) cut, (d) disease and insect damage, and (e) decay.
2.2. Hyperspectral Imaging System and Data Acquisition
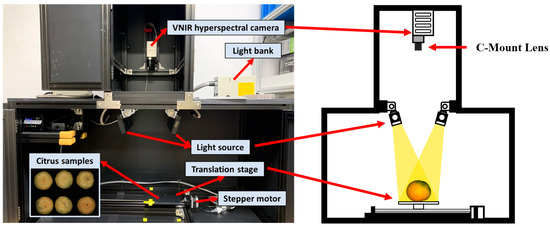
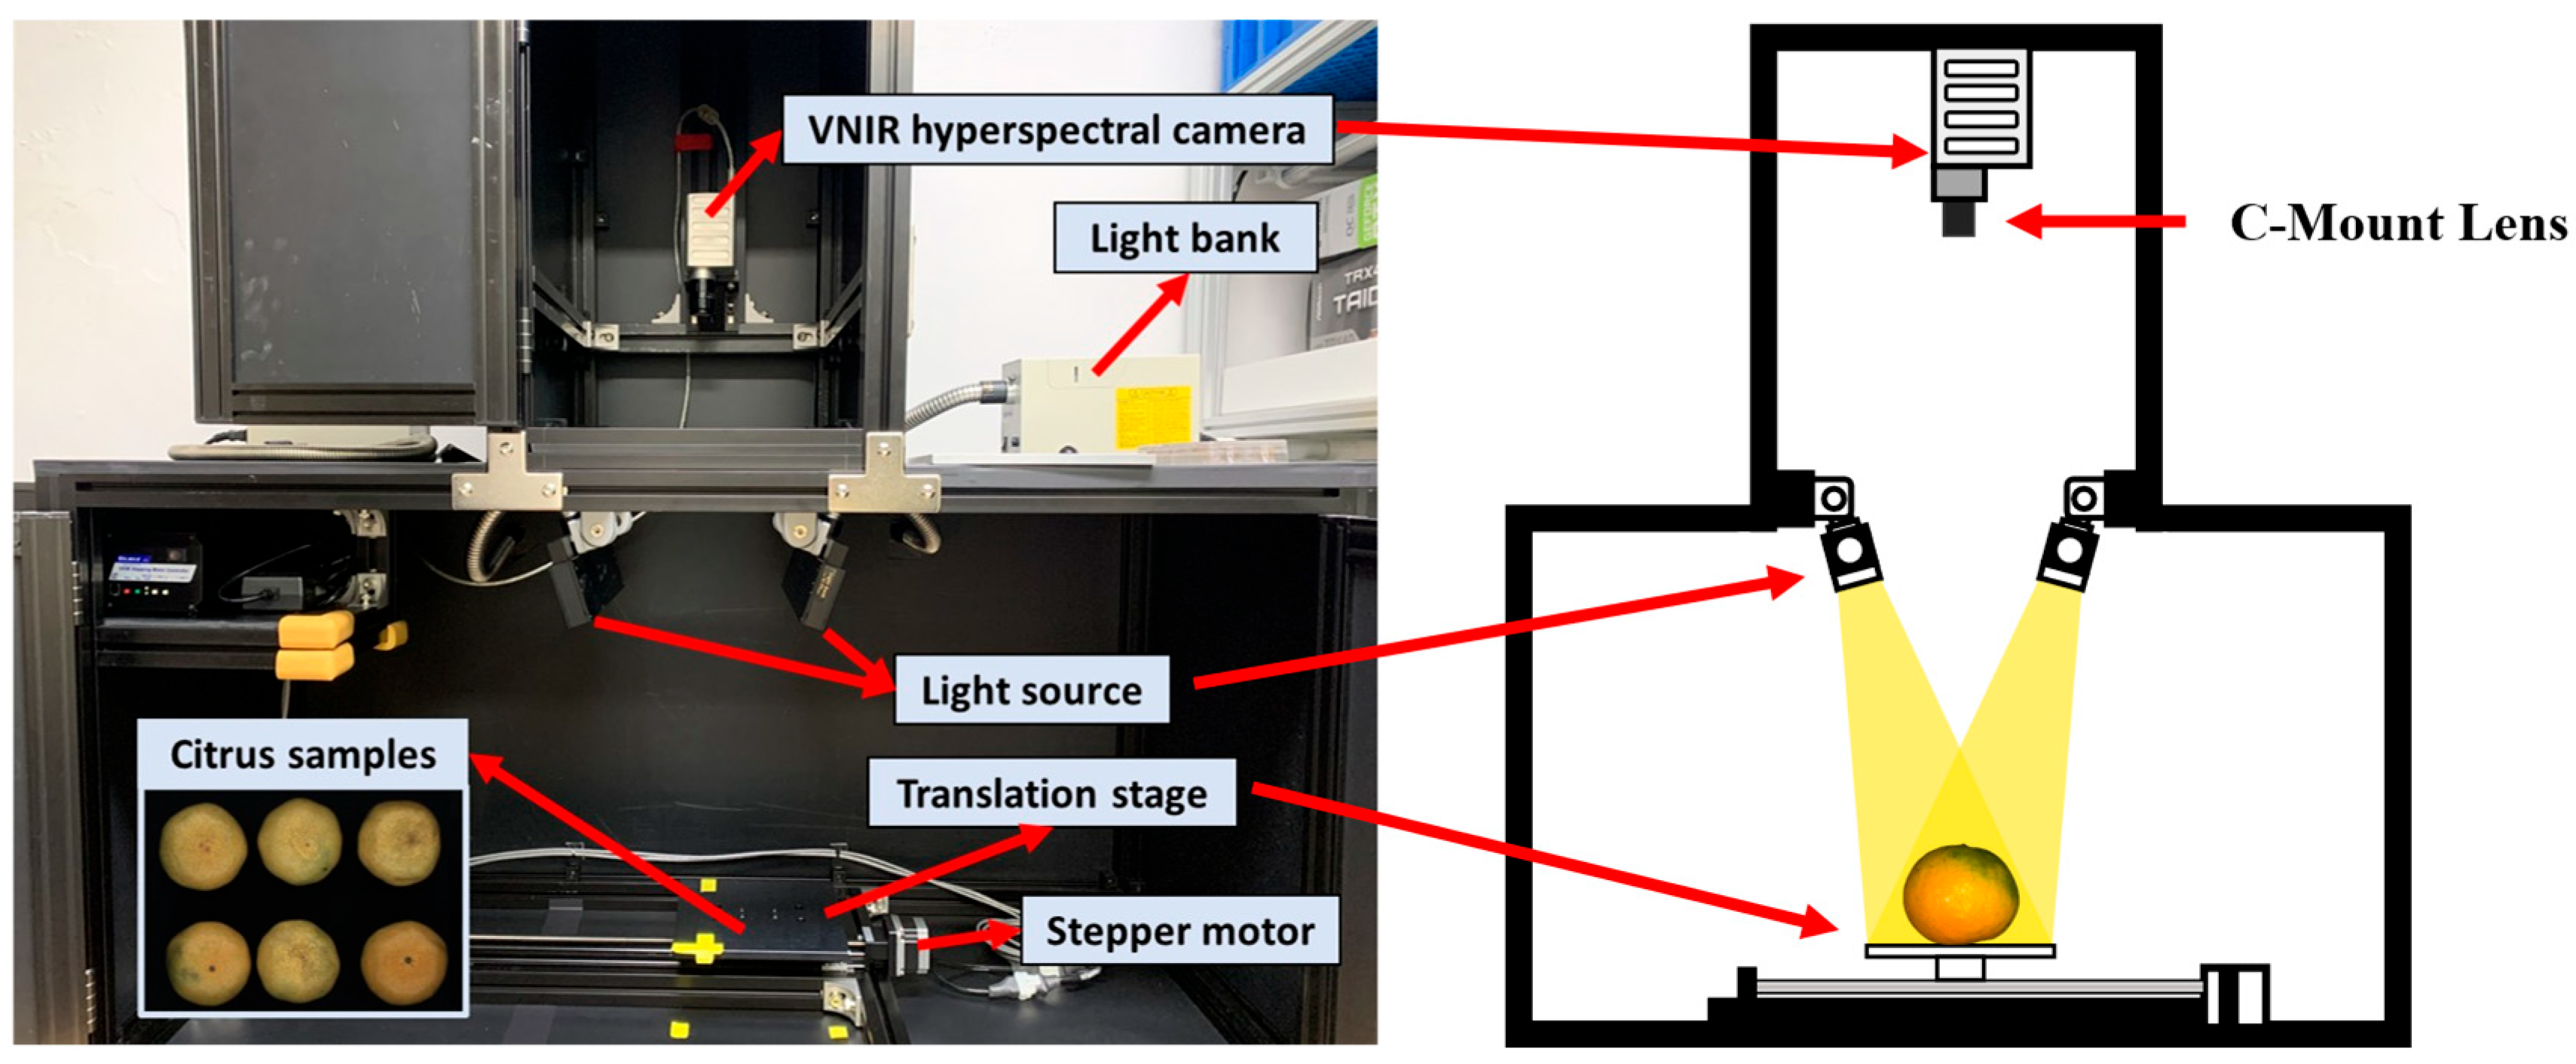
The hyperspectral imaging (HSI) system comprised a hyperspectral camera, light source, and a motorized sample conveyor, as shown in Figure 2. The hyperspectral camera (microHSI™ Hyperspectral Sensor, Corning®, New York, NY, USA) was equipped with a C-mount lens (Schneider Optics, Hauppauge, NY, USA), covering a wavelength range of 400–1000 nm with a spectral resolution of 2 nm (300 wavelength bands). Illumination was provided by a pair of 100 W quartz tungsten halogen line lights. The conveyor system included a stepping motor (PK264-03A-P1, Oriental Motor, Tokyo, Japan) and a sample table.
Figure 2.
Schematic configuration of the Vis-NIR hyperspectral imaging system.
Hyperspectral images of citrus fruits were acquired using a line-scan (pushbroom) method in a darkroom, with an exposure time of 6 ms, a step interval of 0.5 mm, and 600 measurement lines. The camera-to-sample distance was set to 205 mm, based on the focal length and resolution considerations. To ensure stable and uniform illumination, the light source was preheated for 1 h before imaging. For each measurement, twelve samples were arranged in a 3 × 4 array. Hyperspectral images were acquired of all 259 fruits in 23 sample trays (each tray containing 12 fruits arranged in a 3 × 4 grid). Each fruit was imaged from multiple orientations, including the stem end, calyx end, and visible defect surfaces, ensuring defective regions were perpendicular to the camera axis.
2.3. Hyperspectral Image Correction
Dark and white reference images were acquired to correct for dark current noise and illumination non-uniformity. Dark references were obtained by blocking the light source with the lens cap, and white references were obtained using a 99.99% diffuse reflectance standard (Labsphere, North Sutton, NH, USA). Hyperspectral images of citrus samples were corrected using these reference images according to Equation (1). The raw hyperspectral images were converted from intensity to reflectance, and variations in line light intensity across positions were corrected during this process.
where Ir is the corrected hyperspectral image, I is the original hyperspectral image, D is the dark reference hyperspectral image, W is the white reference hyperspectral image, and λnm represents the λth wavelength image.
2.4. Hyperspectral Spectrum Extraction
Regions of interest (ROIs) corresponding to sound and defective areas were manually selected from the corrected hyperspectral images. To ensure consistency and minimize subjective bias, all ROI selections were performed by a single trained researcher following standardized criteria. For defective samples, ROIs were defined to include only defective regions by targeting the center of symptomatic areas while avoiding boundary edges, shadows, and adjacent sound tissues (Figure 3). The pixel size of the selected ROIs varied depending on the extent of the defect, ranging from approximately 50 to 7700 pixels. This protocol ensured consistent ROI selection and minimized potential operator-dependent variability. ROIs for sound areas were selected with comparable pixel dimensions. Spectral data from each ROI were averaged to obtain representative reflectance spectra, yielding 852 spectra from defective regions and 850 from sound regions (total 1702 spectra). ROI selection and spectral extraction were performed using MATLAB (R2022a, MathWorks, Natick, MA, USA).
Figure 3.
Workflow for extracting reflectance spectra from citrus fruit surfaces using HSI: (a) raw HSI, (b) corrected HSI, (c) ROI selection, and (d) average spectrum extracted from each ROI.
2.5. Spectral Preprocessing
Spectral data acquired from hyperspectral imaging are often affected by environmental noise, baseline drift, and scattering, which can hinder both model performance and effective wavelength selection. To mitigate these distortions and improve model robustness, several spectral preprocessing methods were employed. These included smoothing, first-order derivative (Savitzky–Golay), maximum normalization, mean normalization, range normalization, standard normal variate (SNV), and multiplicative scatter correction (MSC). Smoothing with a moving average improves the signal-to-noise ratio by eliminating random spectral noise, while the first derivative removes baseline drift and enhances spectral resolution. Normalization reduces errors from sample preparation, and SNV and MSC correct spectral variations caused by light scattering. In this study, the smoothing window size was optimized by testing several candidate window sizes. A 10 nm window was selected because it provided the best balance between reducing high-frequency noise and preserving important spectral features associated with citrus defects. Larger window sizes resulted in excessive spectral smoothing, whereas smaller window sizes were less effective in reducing noise.
Smoothing (10 nm window) was applied first, followed sequentially by the other preprocessing techniques. All data processing and analysis, including spectral preprocessing, effective wavelength selection, and PLS-DA model development, were implemented using Python (version 3.10, Python Software Foundation) and MATLAB (R2022a, MathWorks, Natick, MA, USA)
2.6. Effective Wavelength Selection Algorithm
In hyperspectral images, adjacent wavelengths are often highly correlated, and continuous spectral bands may contain redundant information, potentially causing collinearity problems [14]. Additionally, some uncorrelated wavelengths may still provide useful information. To address these issues, key wavelengths contributing most to classification or prediction must be identified. Selecting a small number of effective wavelengths (EWs) can improve model performance, reduce computational costs, and save time [15]. Accordingly, this study employed four effective wavelength selection algorithms: WRC, VIP, SFS, and RF. Previous studies have reported high-performance PLS models using 15 or more variables, as well as predictive models with fewer than 10 variables [16]. For example, ref. [15] selected 15 variables out of 237 to predict beef color, pH, and shear force, and only 5 out of 256 variables to predict meat deterioration. In this study, the number of selected variables was limited to 15 or fewer, based on physicochemical relevance and prior research.
2.6.1. WRC—Effective Wavelength Selection
The WRC method selects effective wavelengths based on the regression coefficients (β-coefficients) derived from the full-spectrum PLS-DA model. The β-coefficient indicates the degree to which a variable contributes to model construction, with higher absolute values representing greater importance. This approach is widely used for wavelength selection in hyperspectral imaging applications [17]. In this study, variables with the highest absolute β-coefficient values were prioritized, and peak variables within this group were selected as the final effective wavelengths.
2.6.2. VIP—Effective Wavelength Selection
The VIP method determines effective wavelengths based on VIP scores, which quantify the influence of individual X variables on the PLS model [18]. These scores are calculated as the weighted sum of squares of the PLS weights, considering the proportion of y variance explained by each extracted latent variable (dimension). For a given model and dataset, a single VIP score vector summarizes the importance of all variables across all components and y variables. They provide a criterion for identifying variables that make the most significant contribution to explaining y variance [18]. It has been widely adopted as an effective variable selection technique in chemometrics and classification modeling and was also employed in this study. The equation for calculating the VIP score for variable j is given as follows:
where wjf is the weight of the j variable in the f-th component, SSYf is the sum of squares of the variance in y explained by the f-th component, and J is the total number of X variables. SSYtotal is the total sum of squares explained for the dependent variable, and F is the total number of components. The term represents the importance of the j-th variable in the f-th component, and VIPj measures the overall contribution of the j-th variable in the PLS model.
A VIP value greater than 1.0 is generally considered indicative of a variable with strong explanatory power [19]. Therefore, in this study, variables with VIP values of 1.0 or higher were selected as effective wavelengths for model development.
2.6.3. SFS–Effective Wavelength Selection
The SFS method is a wrapper-based feature selection algorithm that incrementally adds variables to construct an optimal model [20]. It comprises two key components: a criterion function and a sequential search algorithm [21]. The process begins with an empty set of variables. In the first step, all unselected variables are evaluated as potential candidates and scored using the criterion function, which typically estimates the misclassification rate of the classifier [22]. Variables that significantly improve model performance when added are incorporated into the set. The process is then repeated for the remaining variables until a predefined number of features is reached.
In this study, a fixed-number strategy was adopted as the stopping criterion for the SFS algorithm. The number of effective wavelengths was limited to 5, 10, and 15 to evaluate the feasibility of developing cost-effective multispectral imaging systems with a limited number of spectral bands. A 20-fold cross-validation method with random sampling was used to compute the classification error during the selection process. For each target number of wavelengths, the algorithm sequentially evaluated all remaining candidate wavelengths, and the wavelength yielding the lowest classification error was added to the selection set. This approach enabled the development of PLS-DA models with varying complexity while ensuring optimal selection of effective spectral variables. It also facilitated the identification of the point at which classification performance began to stabilize, indicating an optimal balance between model complexity and predictive performance.
2.6.4. RF—Effective Wavelength Selection
The RF method is a stochastic variable selection technique that integrates randomized sampling with MCMC to identify important variables from high-dimensional datasets [12]. In this study, the algorithm was configured with 10,000 iterations ( 10,000) and an initial variable set size of 2 () to ensure thorough exploration of the spectral space and convergence of selection probabilities.
Starting from a random initial variable set, inclusion probabilities are iteratively updated based on contributions to model performance. At each iteration, subsets of variables are randomly perturbed and evaluated using an objective function, utilizing 3-fold cross-validation to minimize the classification error. Variables consistently improving performance are assigned higher selection probabilities. By conducting extensive sampling across the variable space, the RF algorithm obtains a globally optimal subset of features rather than being trapped in local optima.
This method is particularly effective when nonlinear relationships or interactions between variables are relevant, making it suitable for complex datasets. Its capacity to manage high-dimensional spectral data while isolating only the most influential variables reduces dimensionality and enhances computational efficiency. After 10,000 iterations, the ten variables with the highest selection probabilities—as determined through RF iterations—were selected as effective wavelengths for PLS-DA model development.
2.7. Development of Citrus Fruit External Defect Discrimination Model
A partial least squares-discriminant analysis (PLS-DA) model was developed to classify external defects in citrus fruits using both full-spectral data (FW-PLS-DA) and variable-selected spectra (VIP-PLS-DA, WRC-PLS-DA, SFS-PLS-DA, and RF-PLS-DA). All models were built using preprocessed spectra data.
PLS-DA reduces multi-dimensional predictors into latent variables while preserving their covariance with responses, making it suitable for hyperspectral data with strong multicollinearity [23,24]. As a classification-oriented extension of partial least squares regression (PLSR) [25], PLS-DA projects spectral data into latent space to maximize interclass separation while mitigating collinearity. It also enables identification of key wavelengths through variable selection [16].
Spectra from sound citrus (n = 850) and defective regions (n = 852) were labeled as class 0 and class 1, respectively. The dataset was split into a calibration set (70%, 1192 spectra) and a prediction set (30%, 510 spectra). To avoid potential data leakage and ensure an unbiased evaluation, the data partitioning was performed at the individual fruit level. All spectra extracted from the same fruit were assigned exclusively to either the calibration or the prediction set. Specifically, 111 fruits (45 sound and 66 defective) were allocated to the calibration set, while 49 fruits (20 sound and 29 defective) were used for the independent prediction set (Table 1). This strategy ensures that no spectra from the same fruit appear in both datasets. Robustness was further evaluated using 20-fold cross-validation (~85 samples per fold). PLS-DA was then employed to decompose the predictor matrix (X) and response vector (Y) into latent variables (LVs), with a classification threshold of 0.5.
Table 1.
Data distribution and partitioning of citrus samples into calibration and prediction sets for PLS-DA modeling.
Here, X denotes the independent variable matrix (spectral data), Y is the dependent variable vector indicating class labels. T and U are the score matrix corresponding to X and Y, respectively. P and Q are the loading matrices (eigenvectors) of the independent and dependent variables, respectively. EX, EY, and E are residual matrices, and β represents the PLS regression coefficients.
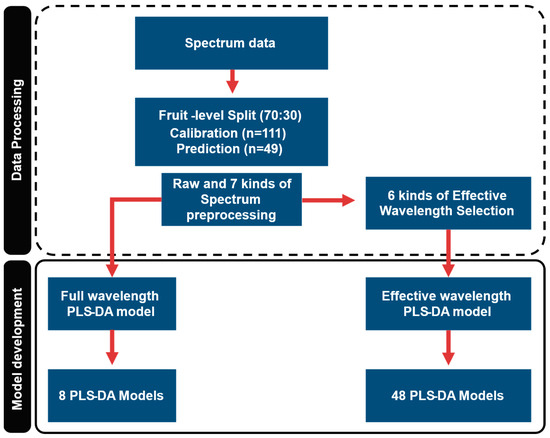
The workflow for model development using full vs. effective wavelength selection is shown in Figure 4.
Figure 4.
Schematic overview of PLS-DA model development process: Comparison between models built using the full spectral range and those constructed using effective wavelength selection based on various selection algorithms and preprocessing methods.
A total of 56 models were evaluated: eight full-spectrum PLS-DA models and 48 EW-PLS-DA models. For each model, the optimal number of LVs was determined by identifying the inflection point (knee point) on the RMSECV curve obtained via 20-fold cross-validation. This selection strategy aimed to identify the point where the rate of error reduction stabilized, thereby adhering to the principle of parsimony. By selecting LVs at the inflection point rather than the absolute minimum RMSECV, the risk of overfitting was reduced while maintaining model robustness. The selected LVs were kept consistent across calibration and prediction steps to ensure model stability.
2.8. Performance Metrics
The performance of the developed PLS-DA models was evaluated using three standard classification metrics: accuracy, precision, and specificity. These metrics were calculated using the following equations:
Here, TP denotes True Positive (the number of correctly classified sound citrus samples), TN denotes True Negative (the number of correctly classified defective citrus samples), FP denotes False Positive (the number of defective citrus samples incorrectly classified as sound citrus samples), and FN denotes False Negative (the number of sound citrus samples incorrectly as defective samples).
Each metric provides insight into a different aspect of model performance. Accuracy reflects the overall correctness of classification across both classes. Precision indicates the model’s ability to reliably identify sound citrus fruits without misclassifying defective ones. Specificity assesses the model’s capacity to correctly reject defective samples, avoiding false acceptances.
3. Results and Discussion
3.1. Spectral Characteristics of Citrus Defects
The spectral characteristics of sound and defective regions were analyzed using reflectance spectra extracted from Vis-NIR hyperspectral images of citrus fruits. Figure 5 shows the mean reflectance spectra along with standard deviations in the 400–1000 nm range for both sound and defective areas.
Figure 5.
Mean raw reflectance spectra (±standard deviation) of citrus fruits by sound and various defect types.
Defective regions exhibited significantly lower reflectance in the 550–700 nm range, primarily associated with carotenoid absorption [26]. Previous studies have shown that higher carotenoid content generally results in increased reflectance at approximately 550 and 700 nm [27]. The lower reflectance observed in defective areas suggests a reduction in carotenoid content, likely due to degradation of chlorophyll or other pigment components in the peel [28]. Defects caused by pests and diseases showed even more pronounced reductions in reflectance, which may be attributed to carotenoid breakdown in infected peel tissues [29].
A distinct absorption peak was observed at approximately 950 nm, corresponding to the second overtone of O–H bonds in water molecules [30]. This feature was particularly prominent in samples with cutting and softening defects. In cutting defects, it is attributed to the exposure of high-moisture flesh, while in softening defects, it may result from moisture accumulation caused by enzymatic degradation of cell walls during fungal infection [31].
3.2. Results of External Defect Discrimination Model Development in Citrus
3.2.1. FW-PLS-DA Model
A PLS-DA model to identify external defects in citrus was developed using the full wavelength range of 400–1000 nm. Eight PLS-DA models, including one using raw spectra and seven using different preprocessing methods, were evaluated, with the results summarized in Table 2.
Table 2.
Performance summary of PLS-DA models for detecting external defects in citrus using full wavelength range under different preprocessing methods.
The PLS-DA model built with raw spectral data demonstrated excellent classification performance, achieving 99.25% accuracy in both calibration and cross-validation, and 99.25% accuracy in the independent prediction set using seven latent variables (LVs).
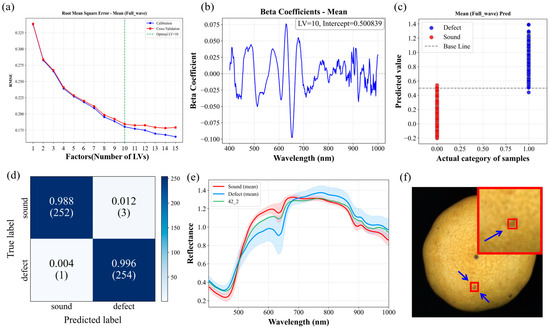
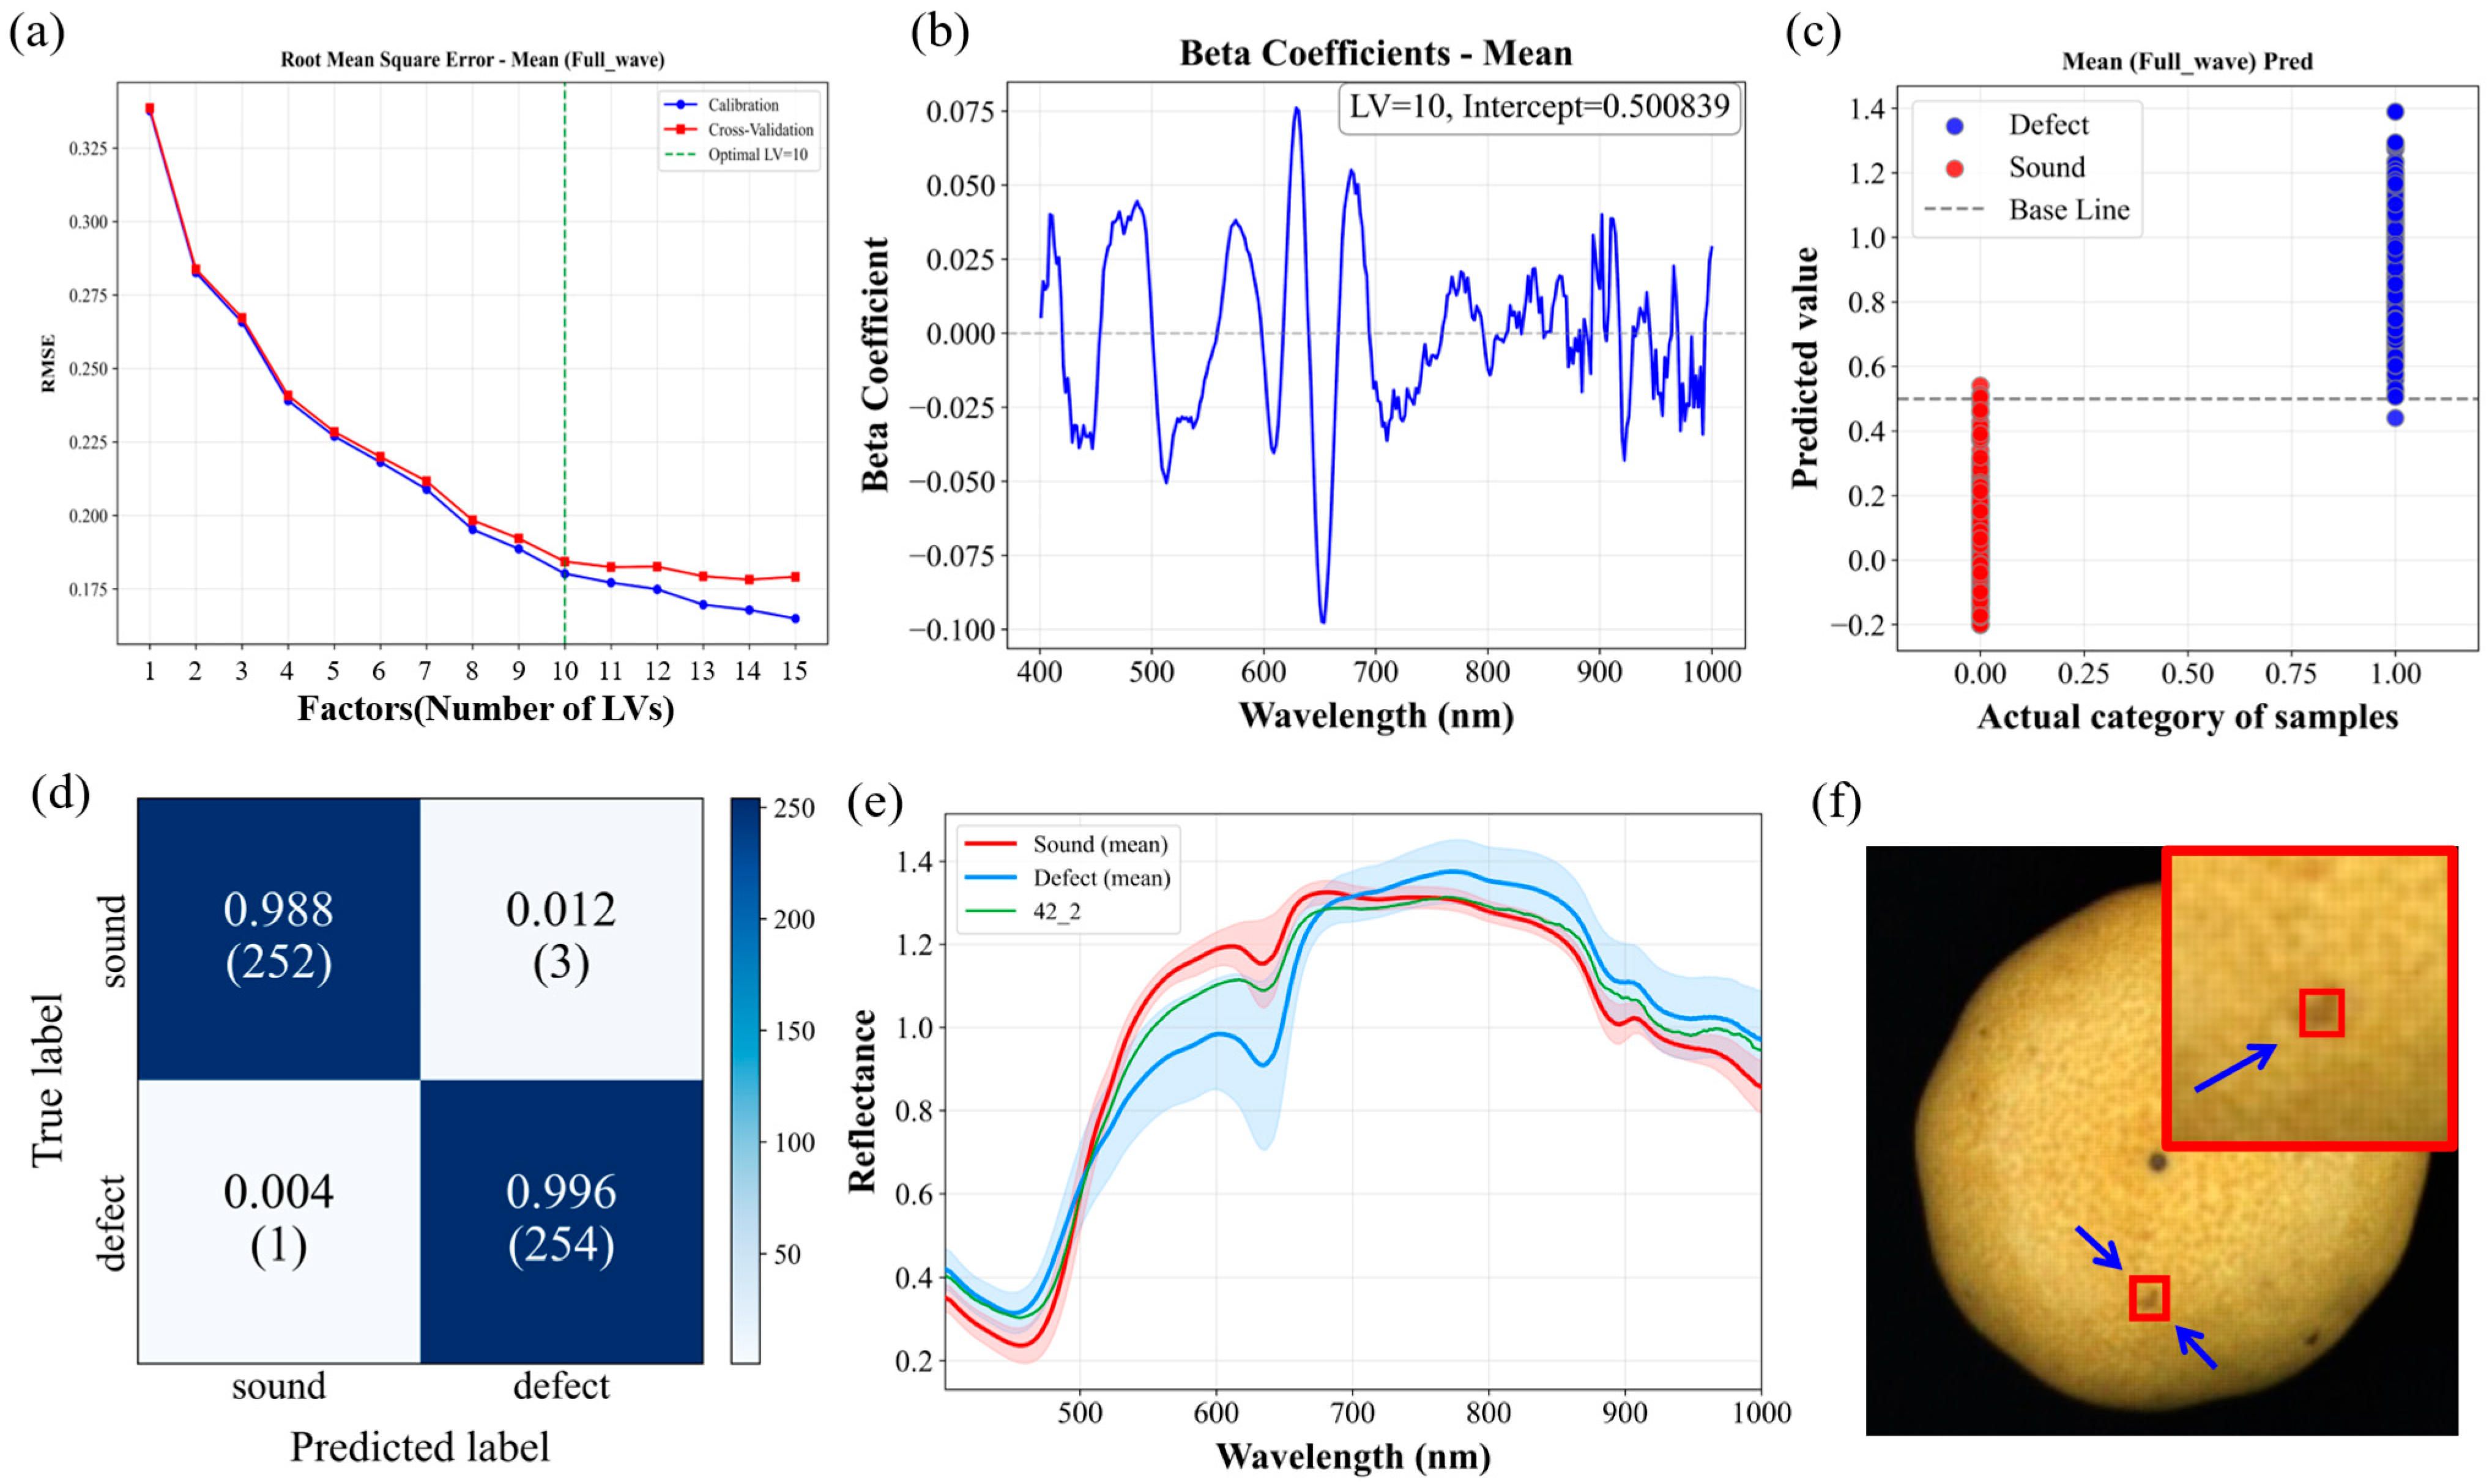
Among the preprocessing methods, the mean normalization achieved the highest performance, with calibration accuracy, specificity, and precision of 99.41%, 99.83%, 99.83%, cross-validation accuracy of 99.33%, and prediction accuracy of 99.22%. Figure 6 presents the model results: (a) cross-validation results, (b) weighted regression coefficients, (c) prediction plots, (d) confusion matrix for the prediction, (e) spectra of the misclassified sample, and (f) corresponding RGB image.
Figure 6.
Performance of the full-wavelength PLS-DA model with mean normalization: (a) root mean square error (RMSE) curves for the selection of the optimal number of latent variables (LVs); (b) weighted beta coefficients; (c) prediction plots; (d) confusion matrix (the color bar indicates the frequency of classification); (e) reflectance spectra of the misclassified sample (No. 42); and (f) visual image of the misclassified sample.
In the independent prediction set, four samples were misclassified, including one defective sample that was incorrectly classified as sound. This sample (No. 42) exhibited a minor physical defect. Analysis of the misclassified spectra (Figure 6e) revealed notable reflectance differences around 480 nm, 650 nm, and 680 nm, which correspond to prominent peaks in the weighted regression coefficient plot (Figure 6b), highlighting their importance in defect classification.
A systematic review of the misclassified cases indicated that errors were frequently associated with specific defect types, particularly small physical abrasions and shallow surface scars. These defects often exhibit spectral signatures that closely overlap with those of healthy peel, especially when the affected area is small or lacks significant chemical degradation. This observation suggests that spectral-based approaches alone may face limitations in distinguishing minor physical blemishes from sound tissue. Integrating morphological features—such as defect shape, size, and surface texture—with spectral information could potentially reduce these misclassifications by providing structural context that pixel-level spectral data alone may not capture.
3.2.2. Selection of Effective Wavelengths for External Defect Discrimination
To enable real-time application and reduce system complexity, effective wavelength selection (EWS) was implemented to develop lightweight PLS-DA models. Four wavelength selection algorithms—WRC, VIP, SFS, and RF—were applied in combination with optimal preprocessing methods. The best-performing results for each method are summarized in Table 3.
Table 3.
Selected wavelengths for identifying citrus external defects using different variable selection methods.
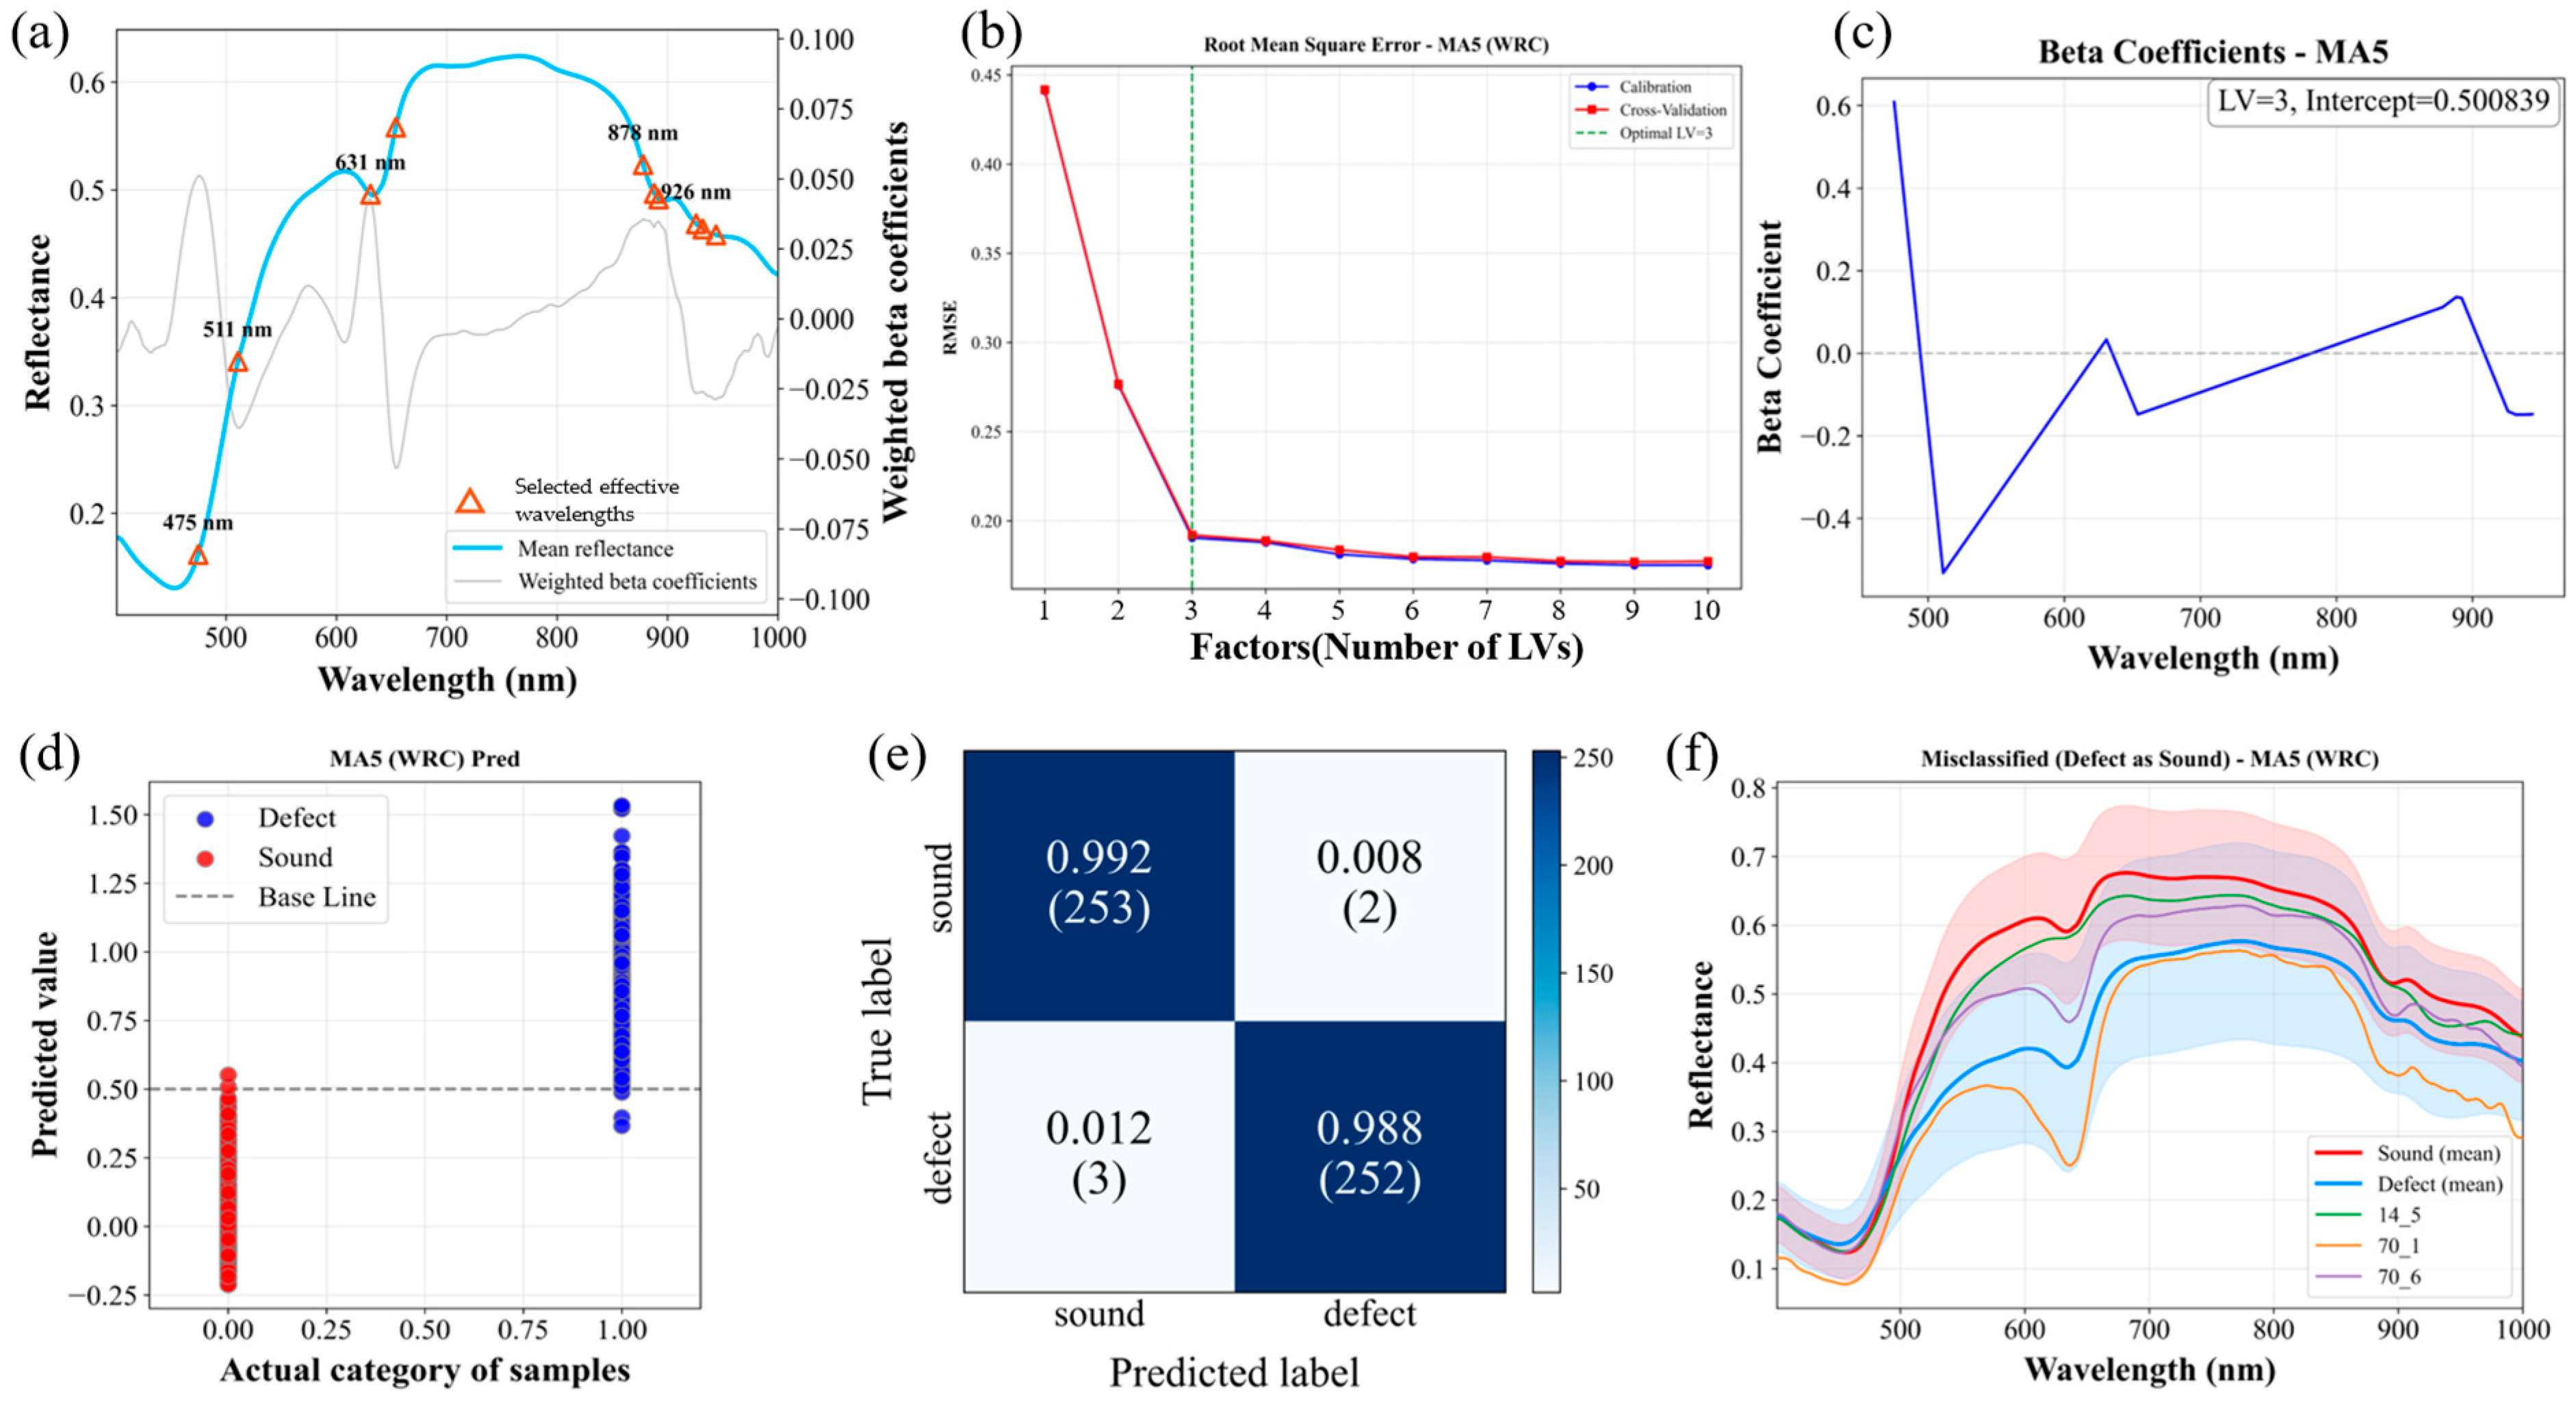
The WRC method selected effective wavelengths by assessing the importance of predictor variables through weighted regression coefficients, with peaks and valleys indicating key spectral regions for differentiating sound from defective citrus. Moving average (10 nm window) was identified as the optimal preprocessing method, yielding ten selected wavelengths: 475, 511, 631, 654, 878, 888, 892, 926, 932, and 944 nm.
The VIP algorithm quantified each variable’s contribution to the PLS model as a score, with values above 1.0 considered highly influential [16]. Using maximum normalization, the VIP model included 145 wavelengths (spanning 401–495, 529–690, and 920–950 nm) with VIP scores above 1.0.
The SFS algorithm selected wavelengths sequentially by evaluating their effect on classification error, testing sets of 5 (SFS05), 10 (SFS10), and 15 (SFS15) wavelengths. Misclassification rates were calculated via 20-fold cross-validation. The optimal preprocessing for all SFS models was the first-order derivative. The selected wavelengths were: 503, 756, 876, 904, and 916 nm for SFS05; 453, 501, 561, 603, 736, 872, 880, 892, 902, and 918 nm for SFS10; and 413, 449, 451, 453, 501, 561, 583, 635, 754, 762, 878, 896, 898, 908, and 918 nm for SFS15. Notably, prediction accuracy increased with the number of variables, reaching 99.80% for SFS15 and 99.22% for SFS10, respectively.
The RF algorithm, based on MCMC for probabilistic variable selection, estimated variable importance through repeated PLS model training. Using raw spectral data, RF selected ten effective wavelengths: 479, 483, 511, 513, 515, 629, 631, 648, 894, and 948 nm.
The effective wavelengths identified across different selection methods (Table 2) consistently correspond to the primary biochemical components of citrus fruit. Specifically, wavelengths in the 450–550 nm and 630–680 nm ranges are associated with the absorption characteristics of carotenoids and chlorophylls, respectively, reflecting pigment degradation in defective tissues. Furthermore, wavelengths selected in the 900–950 nm region align with the second overtone of O-H stretching, which is indicative of moisture content variations and cellular structural changes in areas affected by physical injury or decay. The consistency of these physiologically meaningful spectral bands across different wavelength selection methods indicates that the developed PLS-DA models capture biologically relevant spectral information rather than relying on stochastic noise or spurious correlations.
3.2.3. EW-PLS-DA Models for Citrus Fruit External Defect Classification
This section presents the development and comparative evaluation of EW-PLS-DA models based on four effective wavelength selection algorithms—WRC, VIP, SFS, and RF—for discriminating external defects in citrus fruits.
WRC-PLS-DA Model
For the WRC-PLS-DA model, effective wavelengths were selected from the peaks with the highest absolute β-coefficients and their physicochemical relevance identified in the full-wavelength PLS-DA model. The optimal set was derived from the first-derivative FW-PLS-DA model, which achieved the highest discrimination performance.
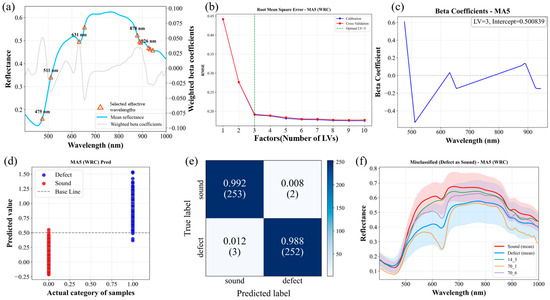
The selected wavelengths under first-derivative preprocessing are listed in Table 2 and shown in Figure 7a. Among them, 475 nm and 511 nm correspond to absorption bands related to carotenoid–chlorophyll complexes [32]. The wavelengths of 630 nm, and 650 nm were associated with chlorophyll overtone absorption [32]. In addition, 880 nm is associated with second overtone of C–H bonds [33] and 926 nm corresponds to second overtone of O–H bonds in water molecules [34].
Figure 7.
Results of the WRC-PLS-DA model with moving average (10 nm window) preprocessing: (a) weighted beta coefficients and selected effective wavelengths; (b) root mean square error (RMSE) curves for the selection of the optimal number of latent variables (LVs); (c) beta coefficients of the PLS-DA model developed using the selected wavelengths; (d) prediction plots showing actual versus predicted categories; (e) confusion matrix for the prediction results (the color bar indicates the frequency of classification); and (f) reflectance spectra of defective samples misclassified as sound.
The performance of the WRC-PLS-DA models using different pretreatment methods is summarized in Table 4. Using these wavelengths and moving average preprocessing, the WRC-PLS-DA model achieved 98.57% calibration accuracy and 99.02% prediction accuracy, slightly lower than the FW-PLS-DA model (99.22%). Classification performance (Figure 7c,d) shows that sound and defective samples were generally well-separated. However, three out of 255 defective samples were misclassified as sound. Analysis of the misclassified spectra (Figure 7e) suggests that these errors occurred because the minor physical damage on those specific samples exhibited reflectance characteristics highly similar to the mean spectrum of sound fruits. This spectral similarity made it challenging for the model to achieve perfect discrimination, even with the optimized effective wavelengths.
Table 4.
Performance of WRC-PLS-DA model for citrus external defects discrimination using different pretreatment methods with selected wavelengths.
VIP-PLS-DA Model
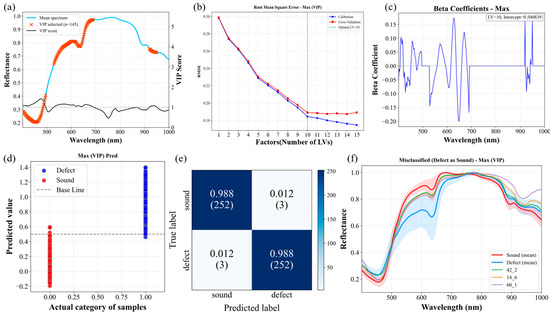
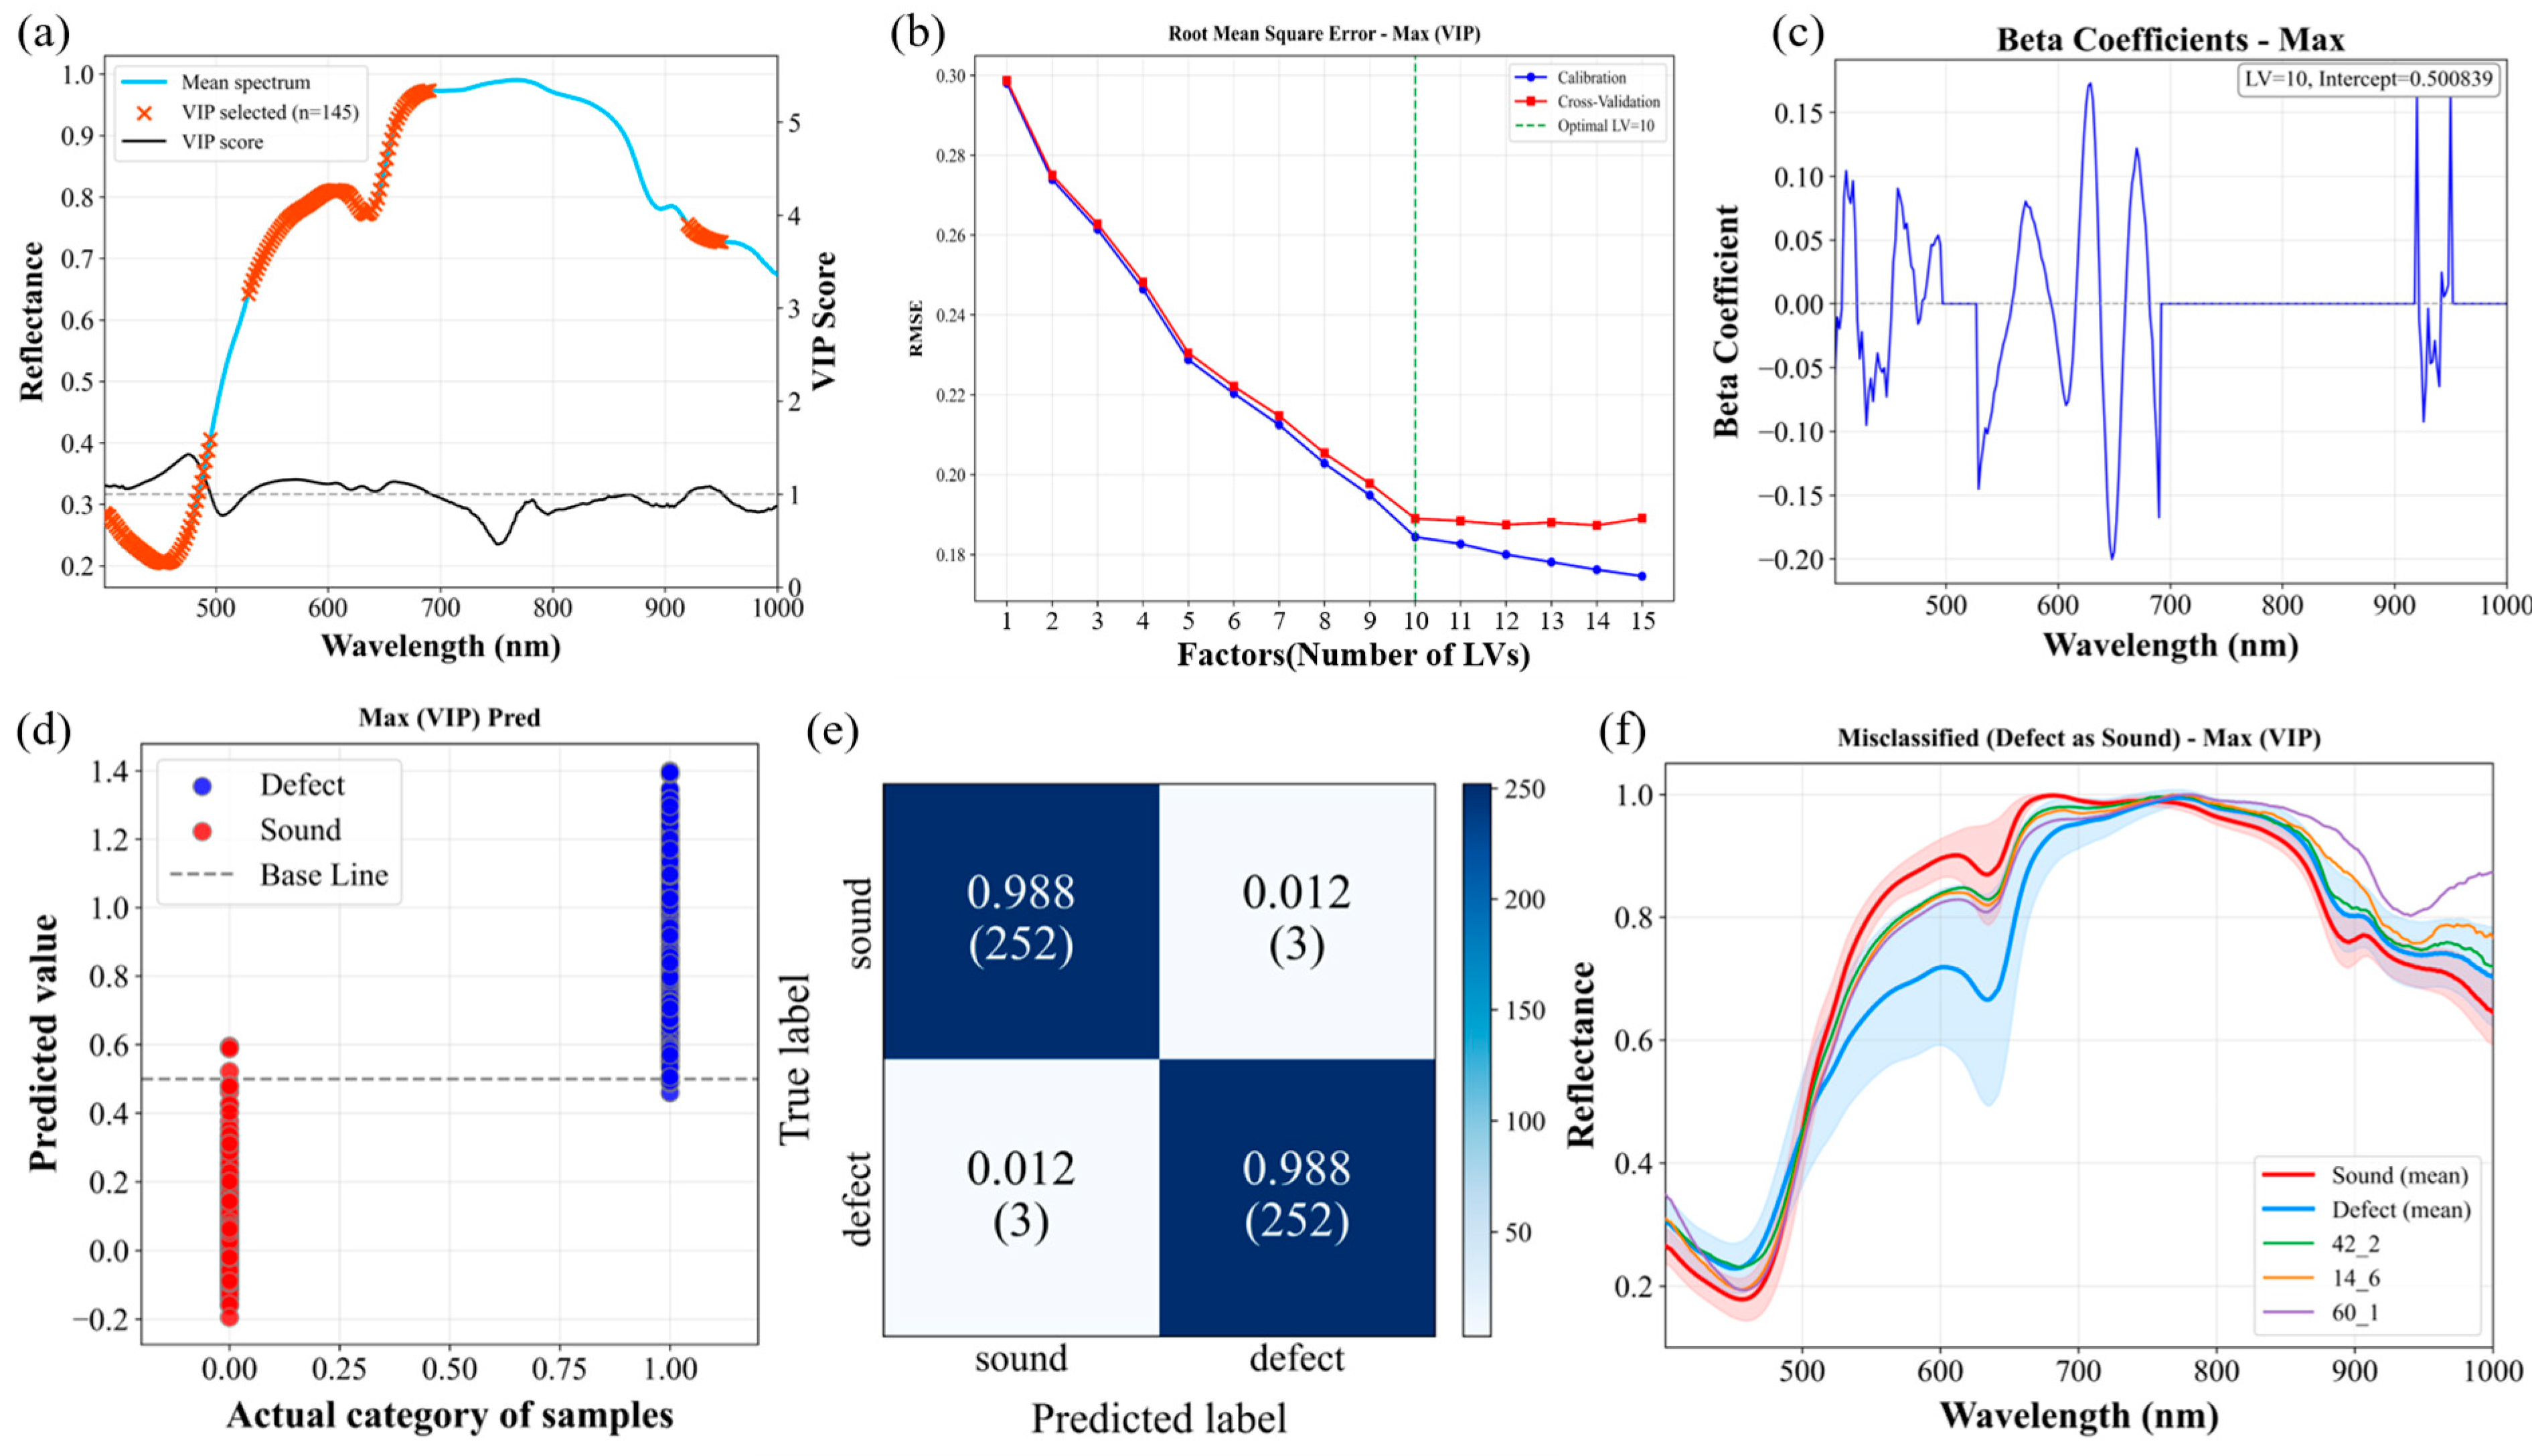
The classification performance of the VIP-based PLS-DA models is summarized in Table 5. The VIP-based PLS-DA model retained all spectral variables with VIP scores ≥ 1.0, resulting in 145 selected wavelengths. Maximum normalization provided the highest prediction accuracy at 98.82%. Figure 8a shows that these variables were concentrated in continuous bands particularly near 450, 600, and 800–1000 nm. This broad selection is attributed to the nature of the VIP method, which identifies all variables with significant cumulative influence on the model’s explanatory power, whereas iterative algorithms like SFS or SPA prioritize the elimination of redundancy. These regions are essential for capturing pigment degradation (such as the breakdown of carotenoids and chlorophylls during decay) and moisture variations (O-H overtones) in the citrus peel, providing a comprehensive biochemical profile of the defects. While this approach limited dimensionality reduction compared to other algorithms, it ensured the inclusion of all critical spectral features. Figure 8d,e show the classification results and confusion matrix for the prediction set, where only six samples were misclassified. This validates the utility of VIP-PLS-DA for identifying essential spectral regions in high-dimensional data, even with slightly lower accuracy than the FW-PLS-DA model.
Table 5.
Performance of VIP-PLS-DA model for citrus fruit external defects discrimination using different pretreatment methods with selected wavelengths.
Figure 8.
Results of the VIP-PLS-DA model with maximum-normalization: (a) VIP scores and selected effective wavelengths; (b) RMSE curves for the selection of the optimal number of LVs; (c) beta coefficients for the selected wavelengths; (d) prediction plots; (e) confusion matrix for the prediction set (the color bar indicates the frequency of classification); and (f) reflectance spectra of misclassified samples.
SFS-PLS-DA Models
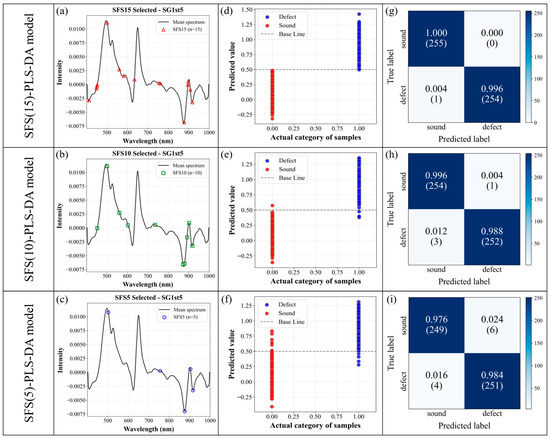
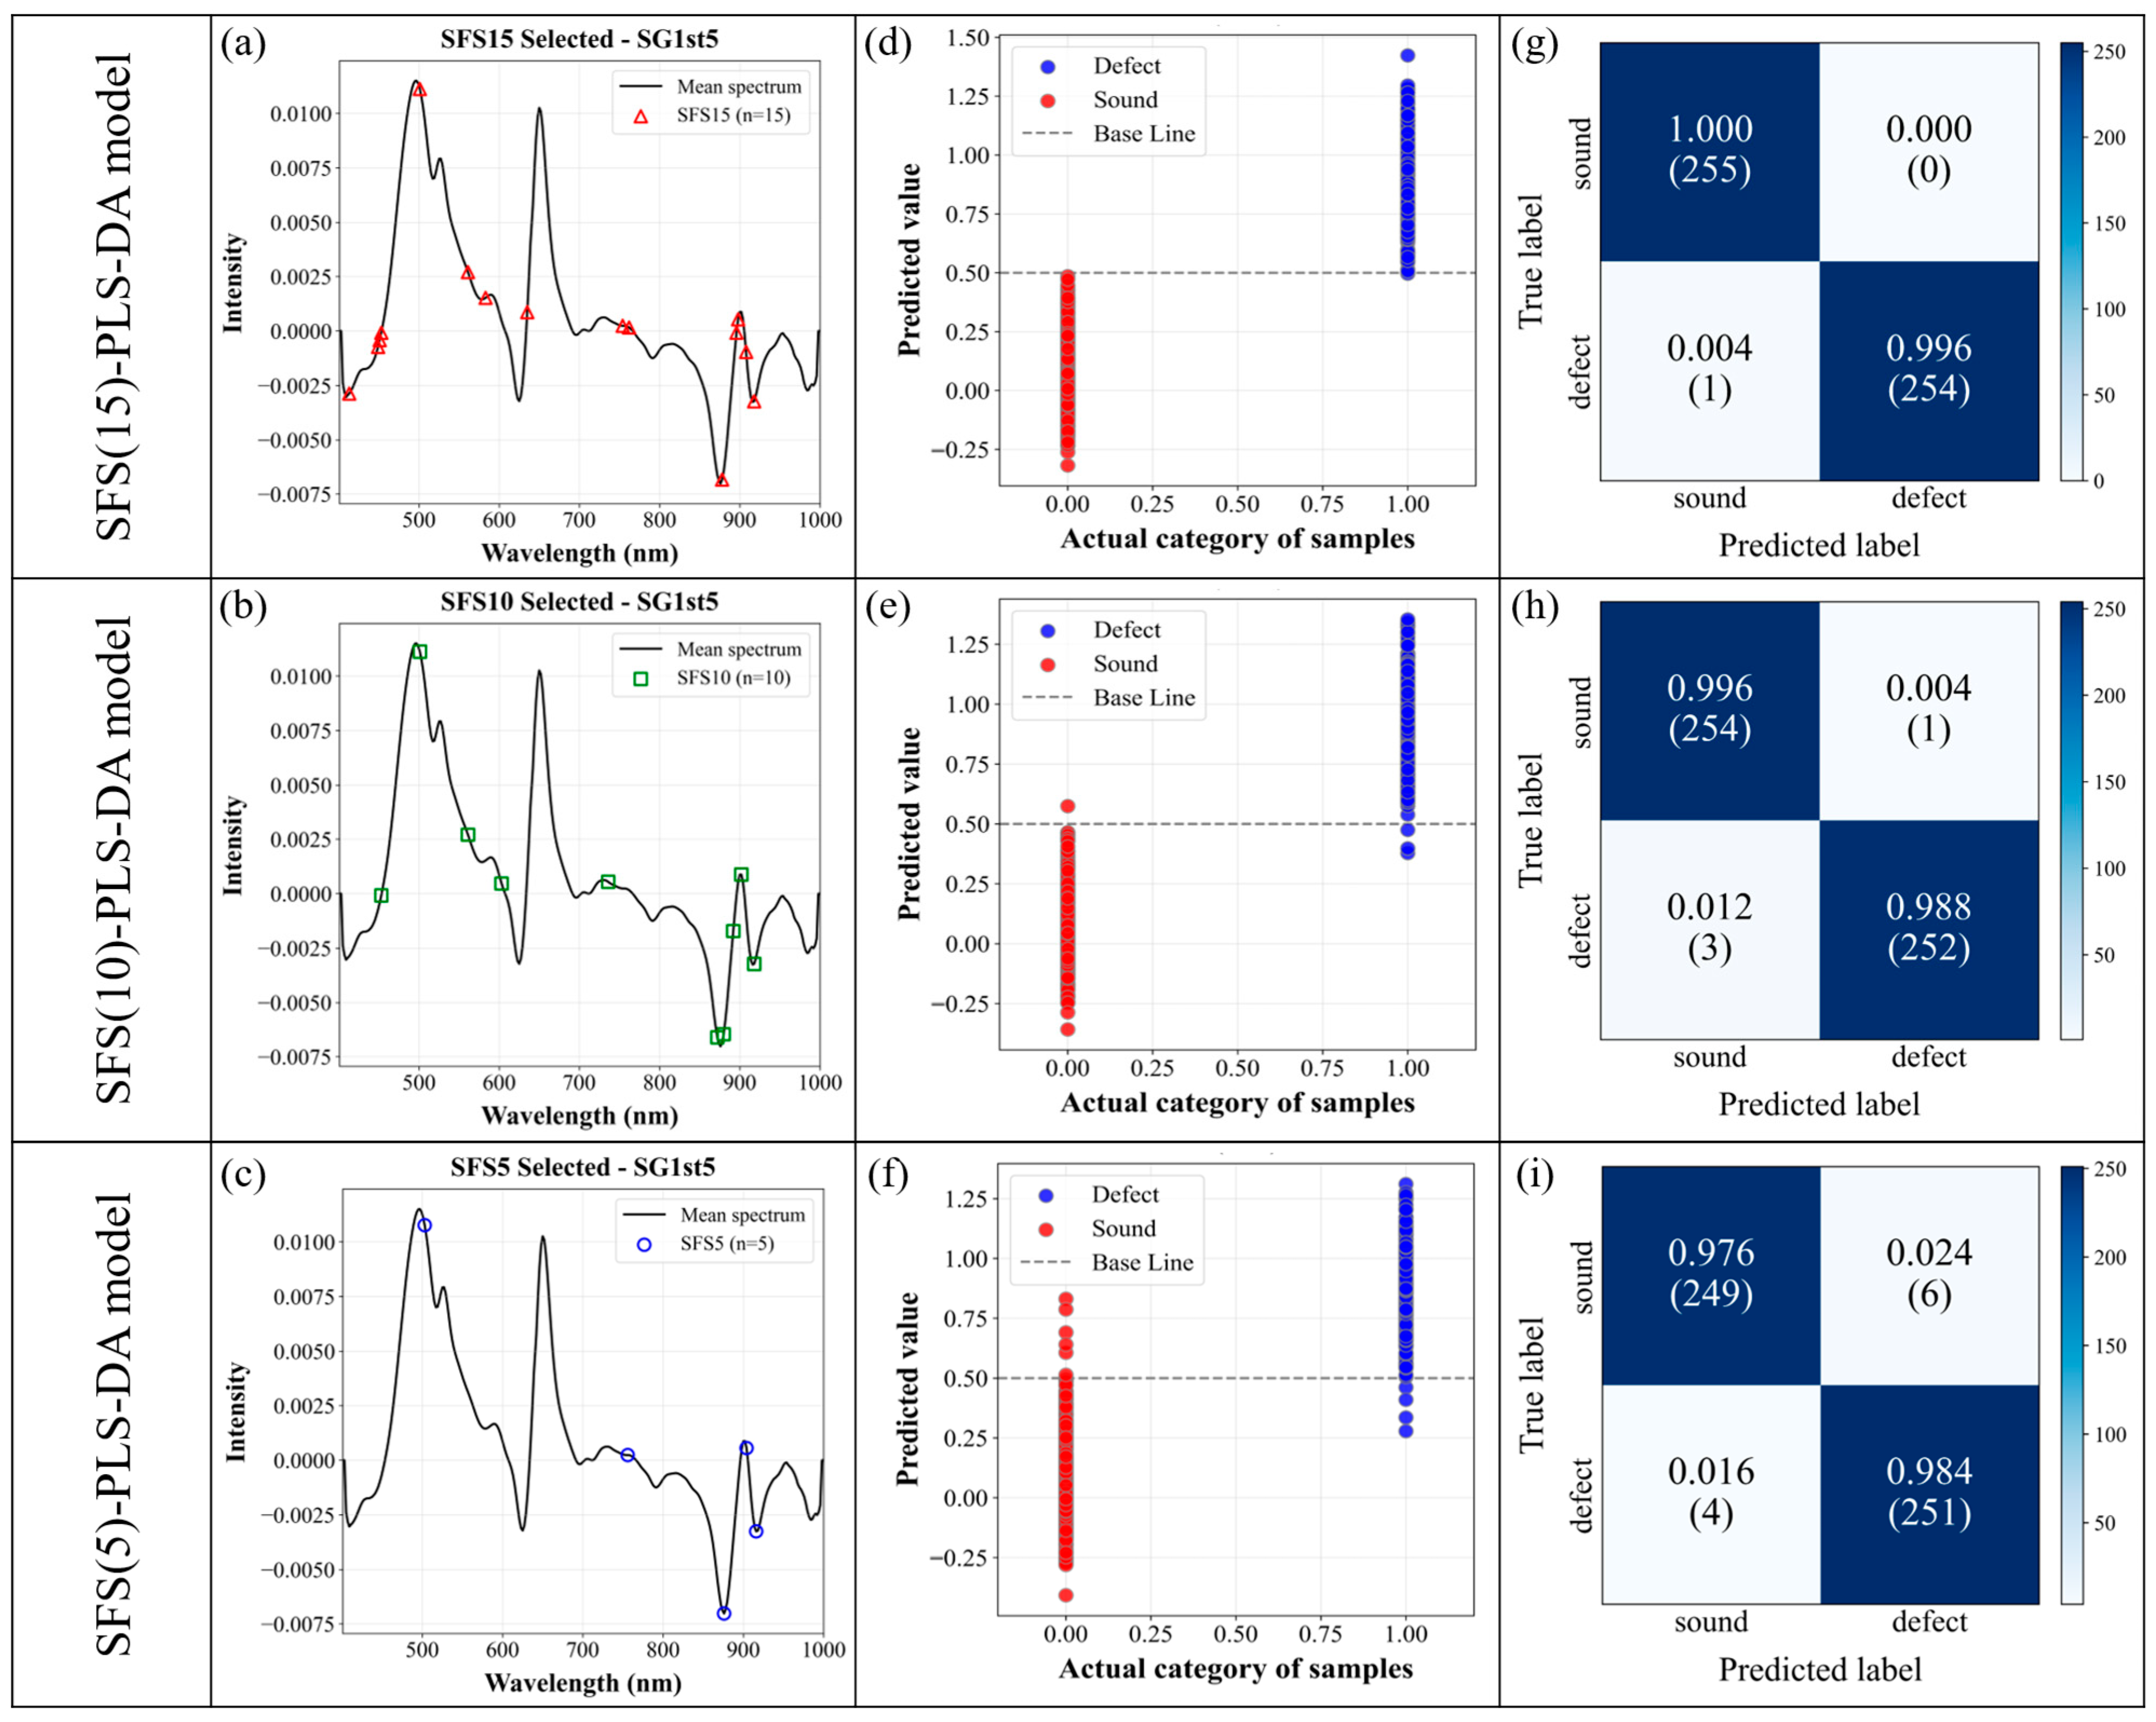
The SFS-based PLS-DA models were developed by selecting 5, 10, and 15 effective wavelengths, referred to as SFS05-PLS-DA, SFS10-PLS-DA, and SFS15-PLS-DA, respectively. The performance of these models with various preprocessing methods is summarized in Table 6, and visual results are presented in Figure 9.
Table 6.
Performance of SFS-PLS-DA Model for citrus fruit external defects discrimination using different pretreatment methods and selected effective wavelengths.
Figure 9.
Results of SFS-based PLS-DA models with 5, 10, and 15 selected wavelengths for citrus external defect discrimination: (a–c) Effective wavelengths selected for SFS15, SFS10, and SFS05 models, respectively; (d–f) classification performance plots of each model; and (g–i) confusion matrices corresponding to each model’s prediction results (the color bar indicates the frequency of classification).
The SFS15-PLS-DA model demonstrated the most superior performance among all evaluated models using first-order derivative preprocessing, achieving a near-perfect discrimination accuracy of 99.80%. Fifteen effective wavelengths were selected, as listed in Table 2 and shown in Figure 9a. According to the confusion matrix (Figure 9g), only one defective sample out of 255 was misclassified as sound, while all sound samples were correctly identified. This single missed defect exhibited a minor physical injury with reflectance characteristics highly similar to normal peel regions, as evidenced by its position near the classification threshold in Figure 9d.
The SFS10-PLS-DA model also achieved excellent results with a prediction accuracy of 99.22% using the first-order derivative. This result outperformed the FW-PLS-DA model (99.02%) despite using only 10 wavelengths, demonstrating the high efficiency of the selection algorithm. Selected wavelengths for this model are shown in Table 2 and Figure 9b.
The SFS05-PLS-DA model, using only five variables, achieved a discrimination accuracy of 98.04% with the same preprocessing. Across all SFS models, misclassified defects were primarily limited to fine cuts or minor injuries that presented spectral similarities to sound areas.
Overall, the SFS15-PLS-DA model demonstrated superior classification accuracy while reducing the number of input variables by more than 95% (from 300 to 15 wavelengths), enhancing computational efficiency and highlighting its suitability for real-time defect detection in citrus sorting systems.
Results of RF-PLS-DA Model
The RF-based PLS-DA model was developed by calculating the RMSECV for each variable across the full wavelength range and selecting the top 10 variables with the lowest RMSECV values, aiming to retain only the most influential spectral features.
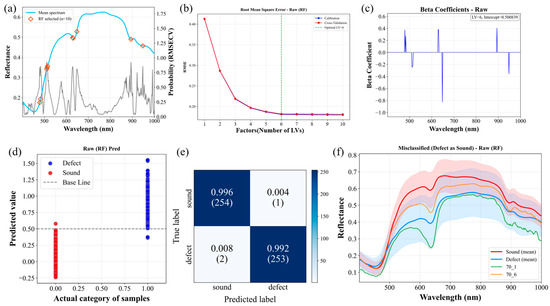
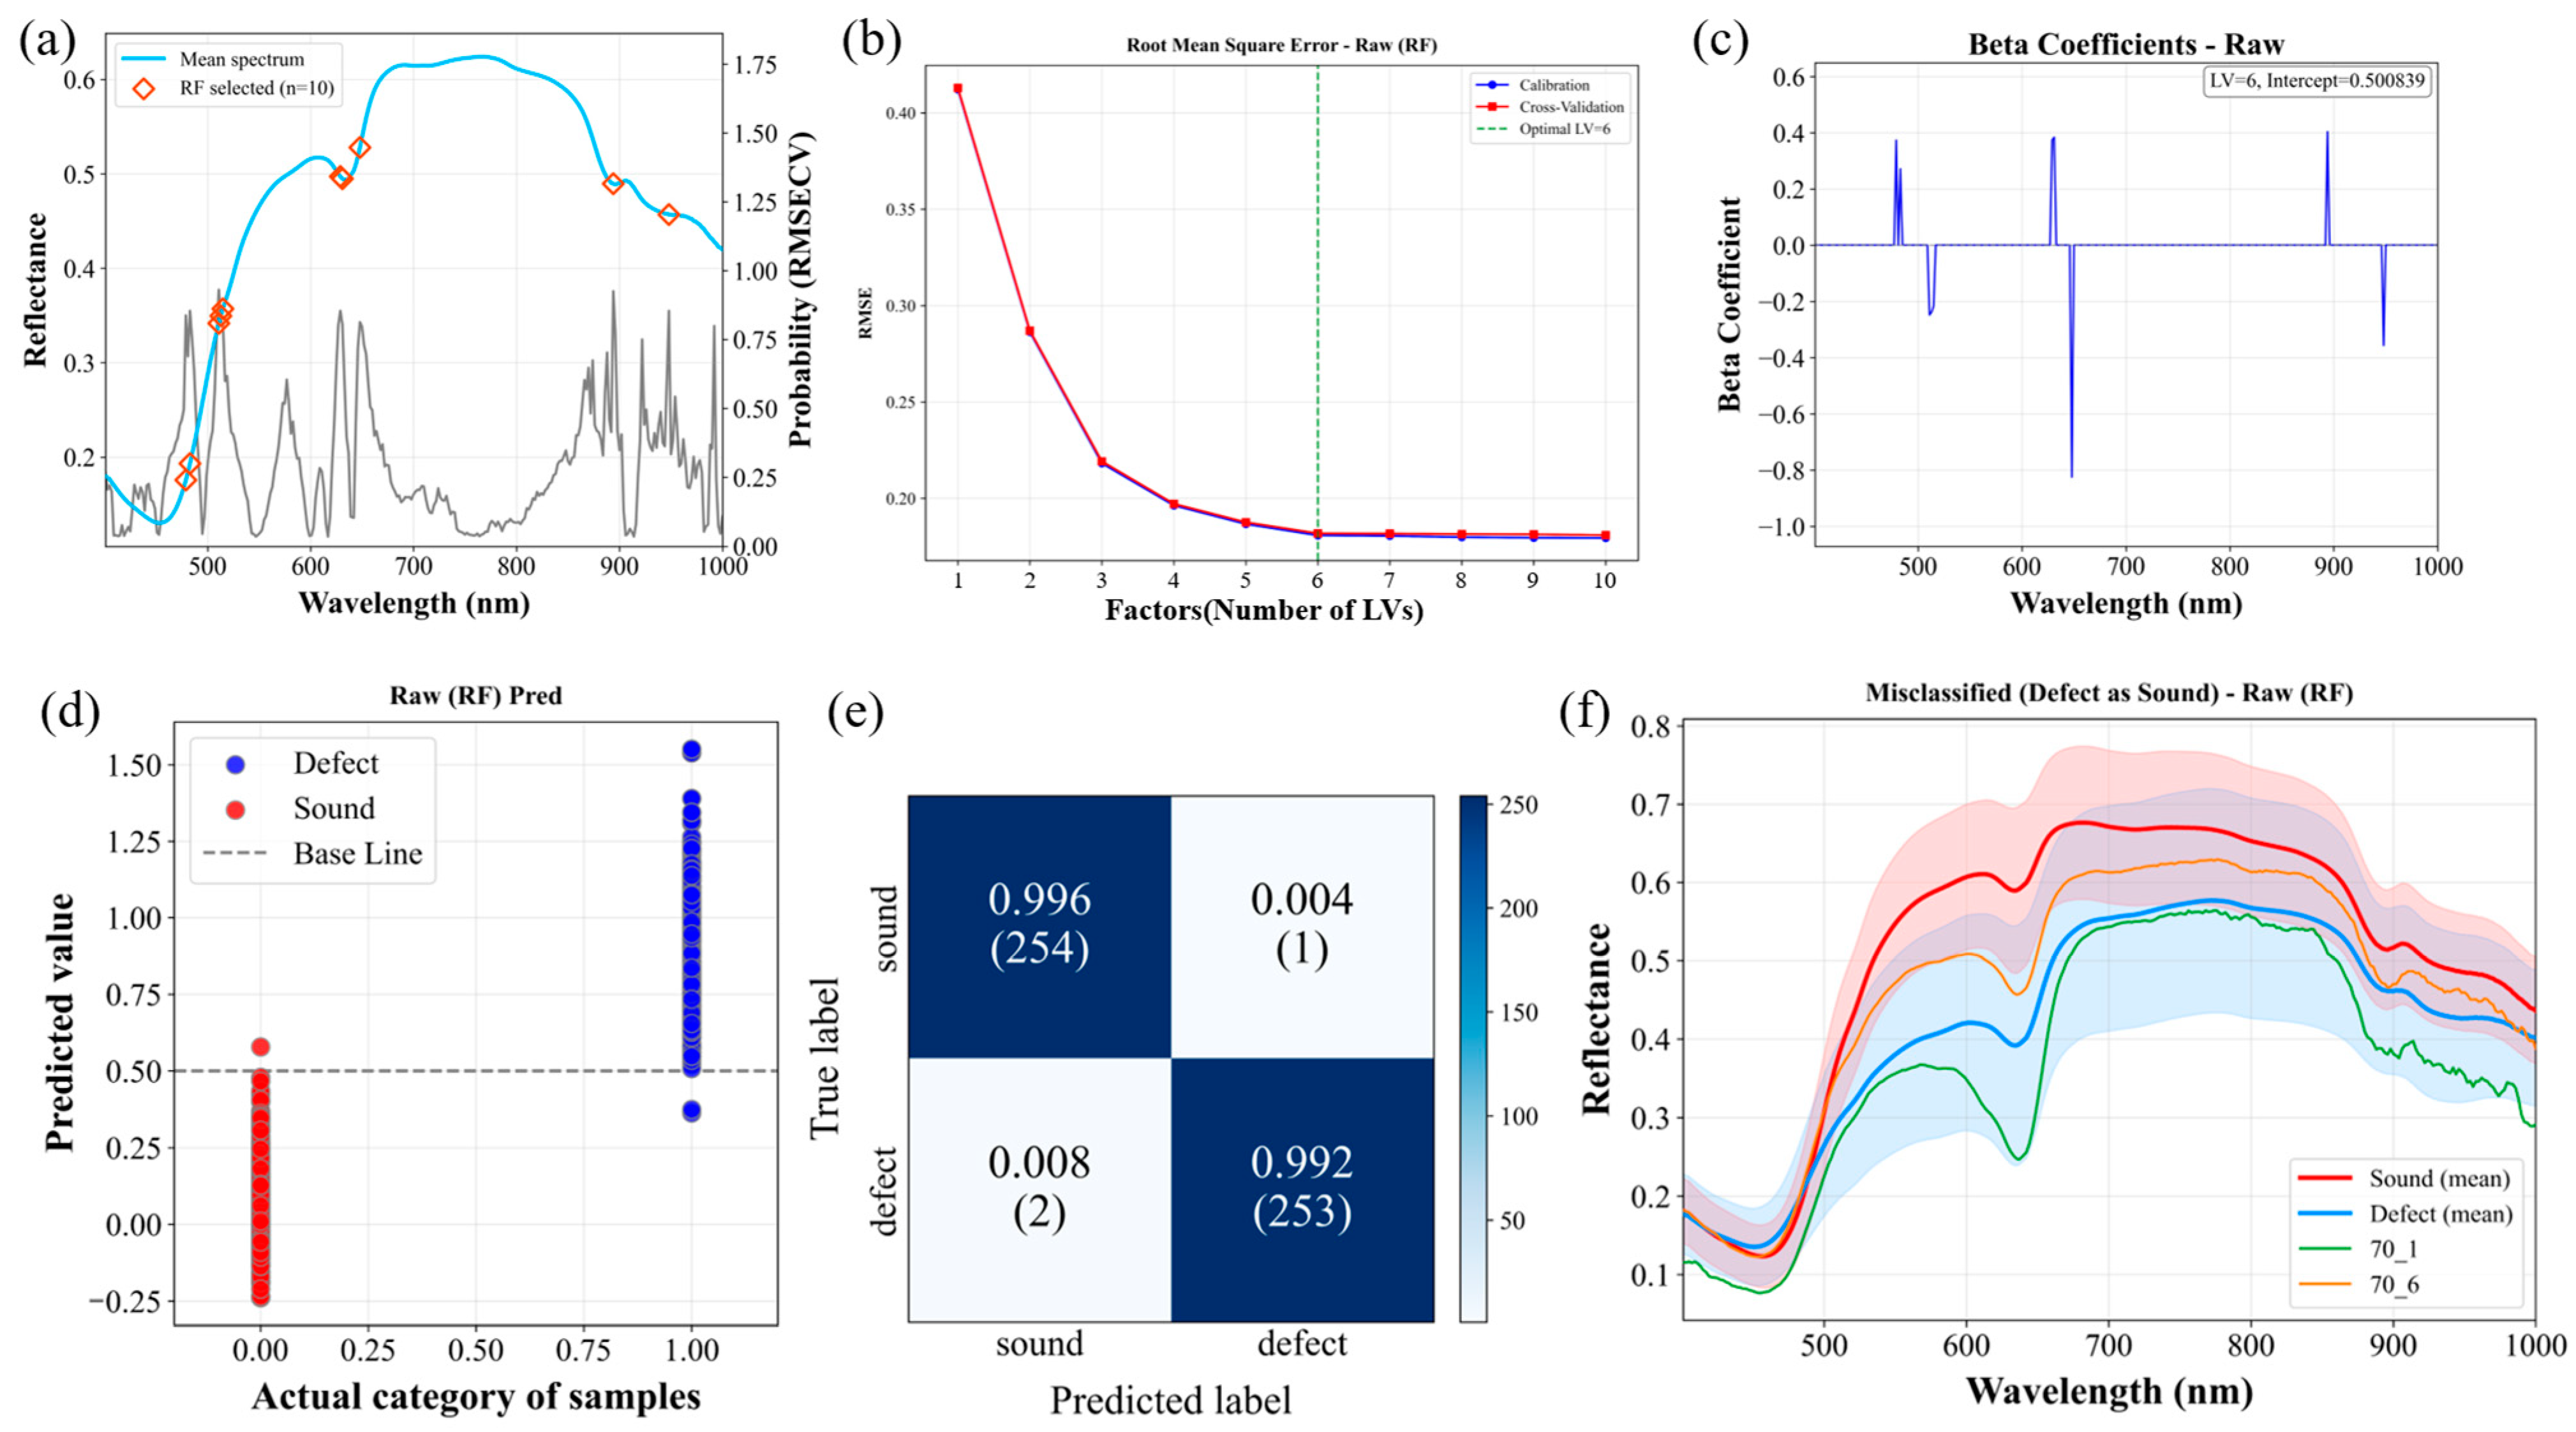
Among RF-PLS-DA models with different preprocessing methods, raw spectral data yielded the lowest prediction error, achieving an external defect discrimination accuracy of 99.41%. Selected wavelengths are listed in Table 2 and illustrated in Figure 10a. These wavelengths span the visible and near-infrared regions, corresponding to pigment-related absorption and structural characteristics relevant for citrus peel quality assessment.
Figure 10.
Results of the RF-PLS-DA model with raw spectral data: (a) selection probabilities and selected effective wavelengths; (b) root mean square error (RMSE) curves for the selection of the optimal number of latent variables (LVs); (c) beta coefficients of the PLS-DA model developed using the selected wavelengths; (d) prediction plots showing actual versus predicted categories; (e) confusion matrix for the prediction results (the color bar indicates the frequency of classification); and (f) reflectance spectra of defective samples misclassified as sound.
Classification performance (Figure 10d,e) shows high accuracy, particularly for sound samples. However, some defective samples—especially small or visually ambiguous defects—were misclassified as normal. In total, three samples were misclassified in the prediction set. Specifically, two defective samples were misclassified as sound, while one sound sample was misclassified as defective. As shown in the misclassified spectra (Figure 10f), these errors were mainly due to minor defects producing spectral patterns highly similar to sound regions, making them difficult to distinguish even with the prioritized wavelengths.
Summary of EW-PLS-DA Model Results
The best-performing PLS-DA models developed using EWS algorithms across various preprocessing methods are summarized in Table 7. Among the four EWS algorithms (WRC, VIP, SFS, RF), the SFS15-PLS-DA model, which employed first-order derivative preprocessing and selected 15 wavelengths, achieved the highest overall discrimination accuracy of 99.80% in the prediction set.
Table 7.
RF-PLS-DA model for the identification of external defects in citrus fruits using different pretreatment methods with selected wavelengths.
The overall classification performance of the PLS-DA models using various wavelength selection methods is summarized in Table 8. This performance significantly surpassed the highest accuracy of the FW-PLS-DA models (99.22%) using the full wavelength range, despite reducing the total number of wavelengths by 95.0% (from 300 to 15 wavelengths). Furthermore, the SFS10-PLS-DA model demonstrated exceptional efficiency by achieving a prediction accuracy of 99.22%, which is identical to the peak performance of the full-spectrum model while using only 10 wavelengths—representing a 96.7% reduction in spectral data.
Table 8.
Summary of PLS-DA Models using different effective wavelength selection methods for citrus fruit external defect classification.
This substantial reduction, achieved while maintaining or even enhancing classification accuracy, demonstrates the model’s efficiency in distinguishing various external defects, including physical damage, environmental stress, and pest- or disease-related defects, in citrus fruits.
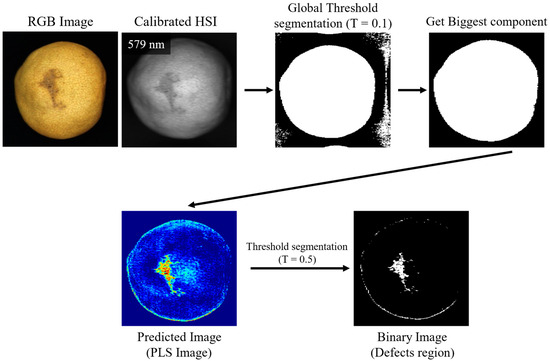
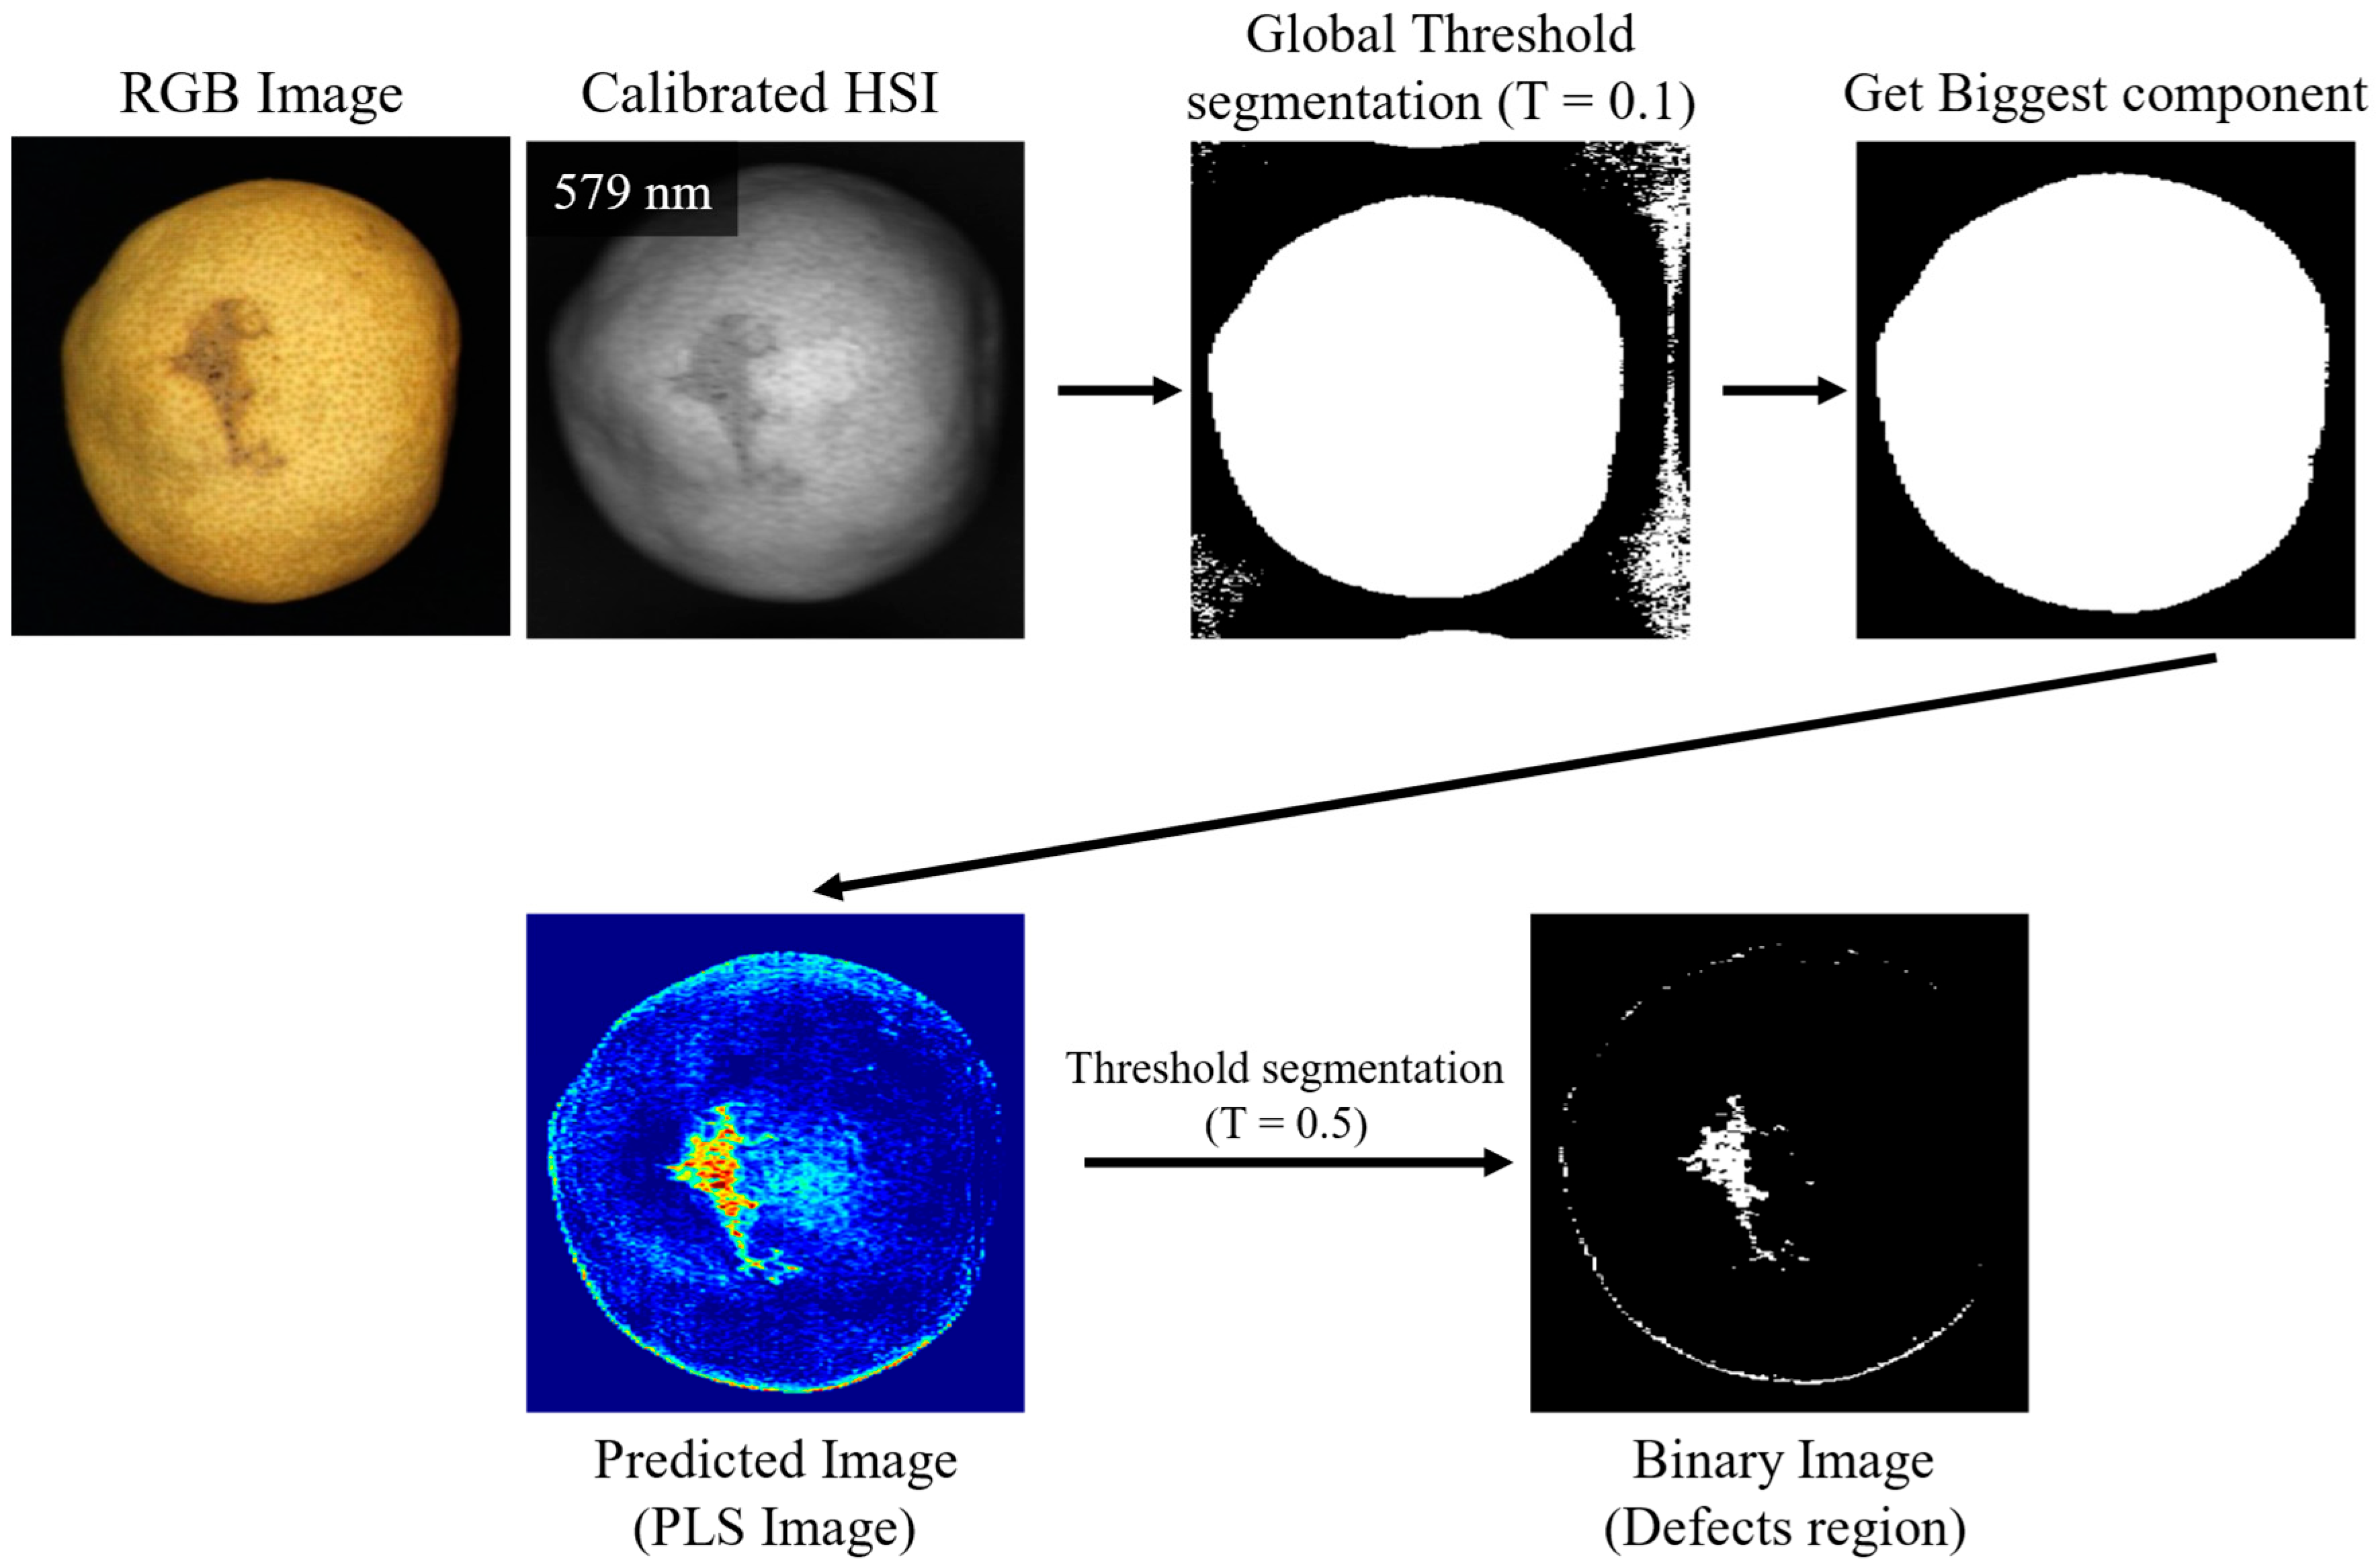
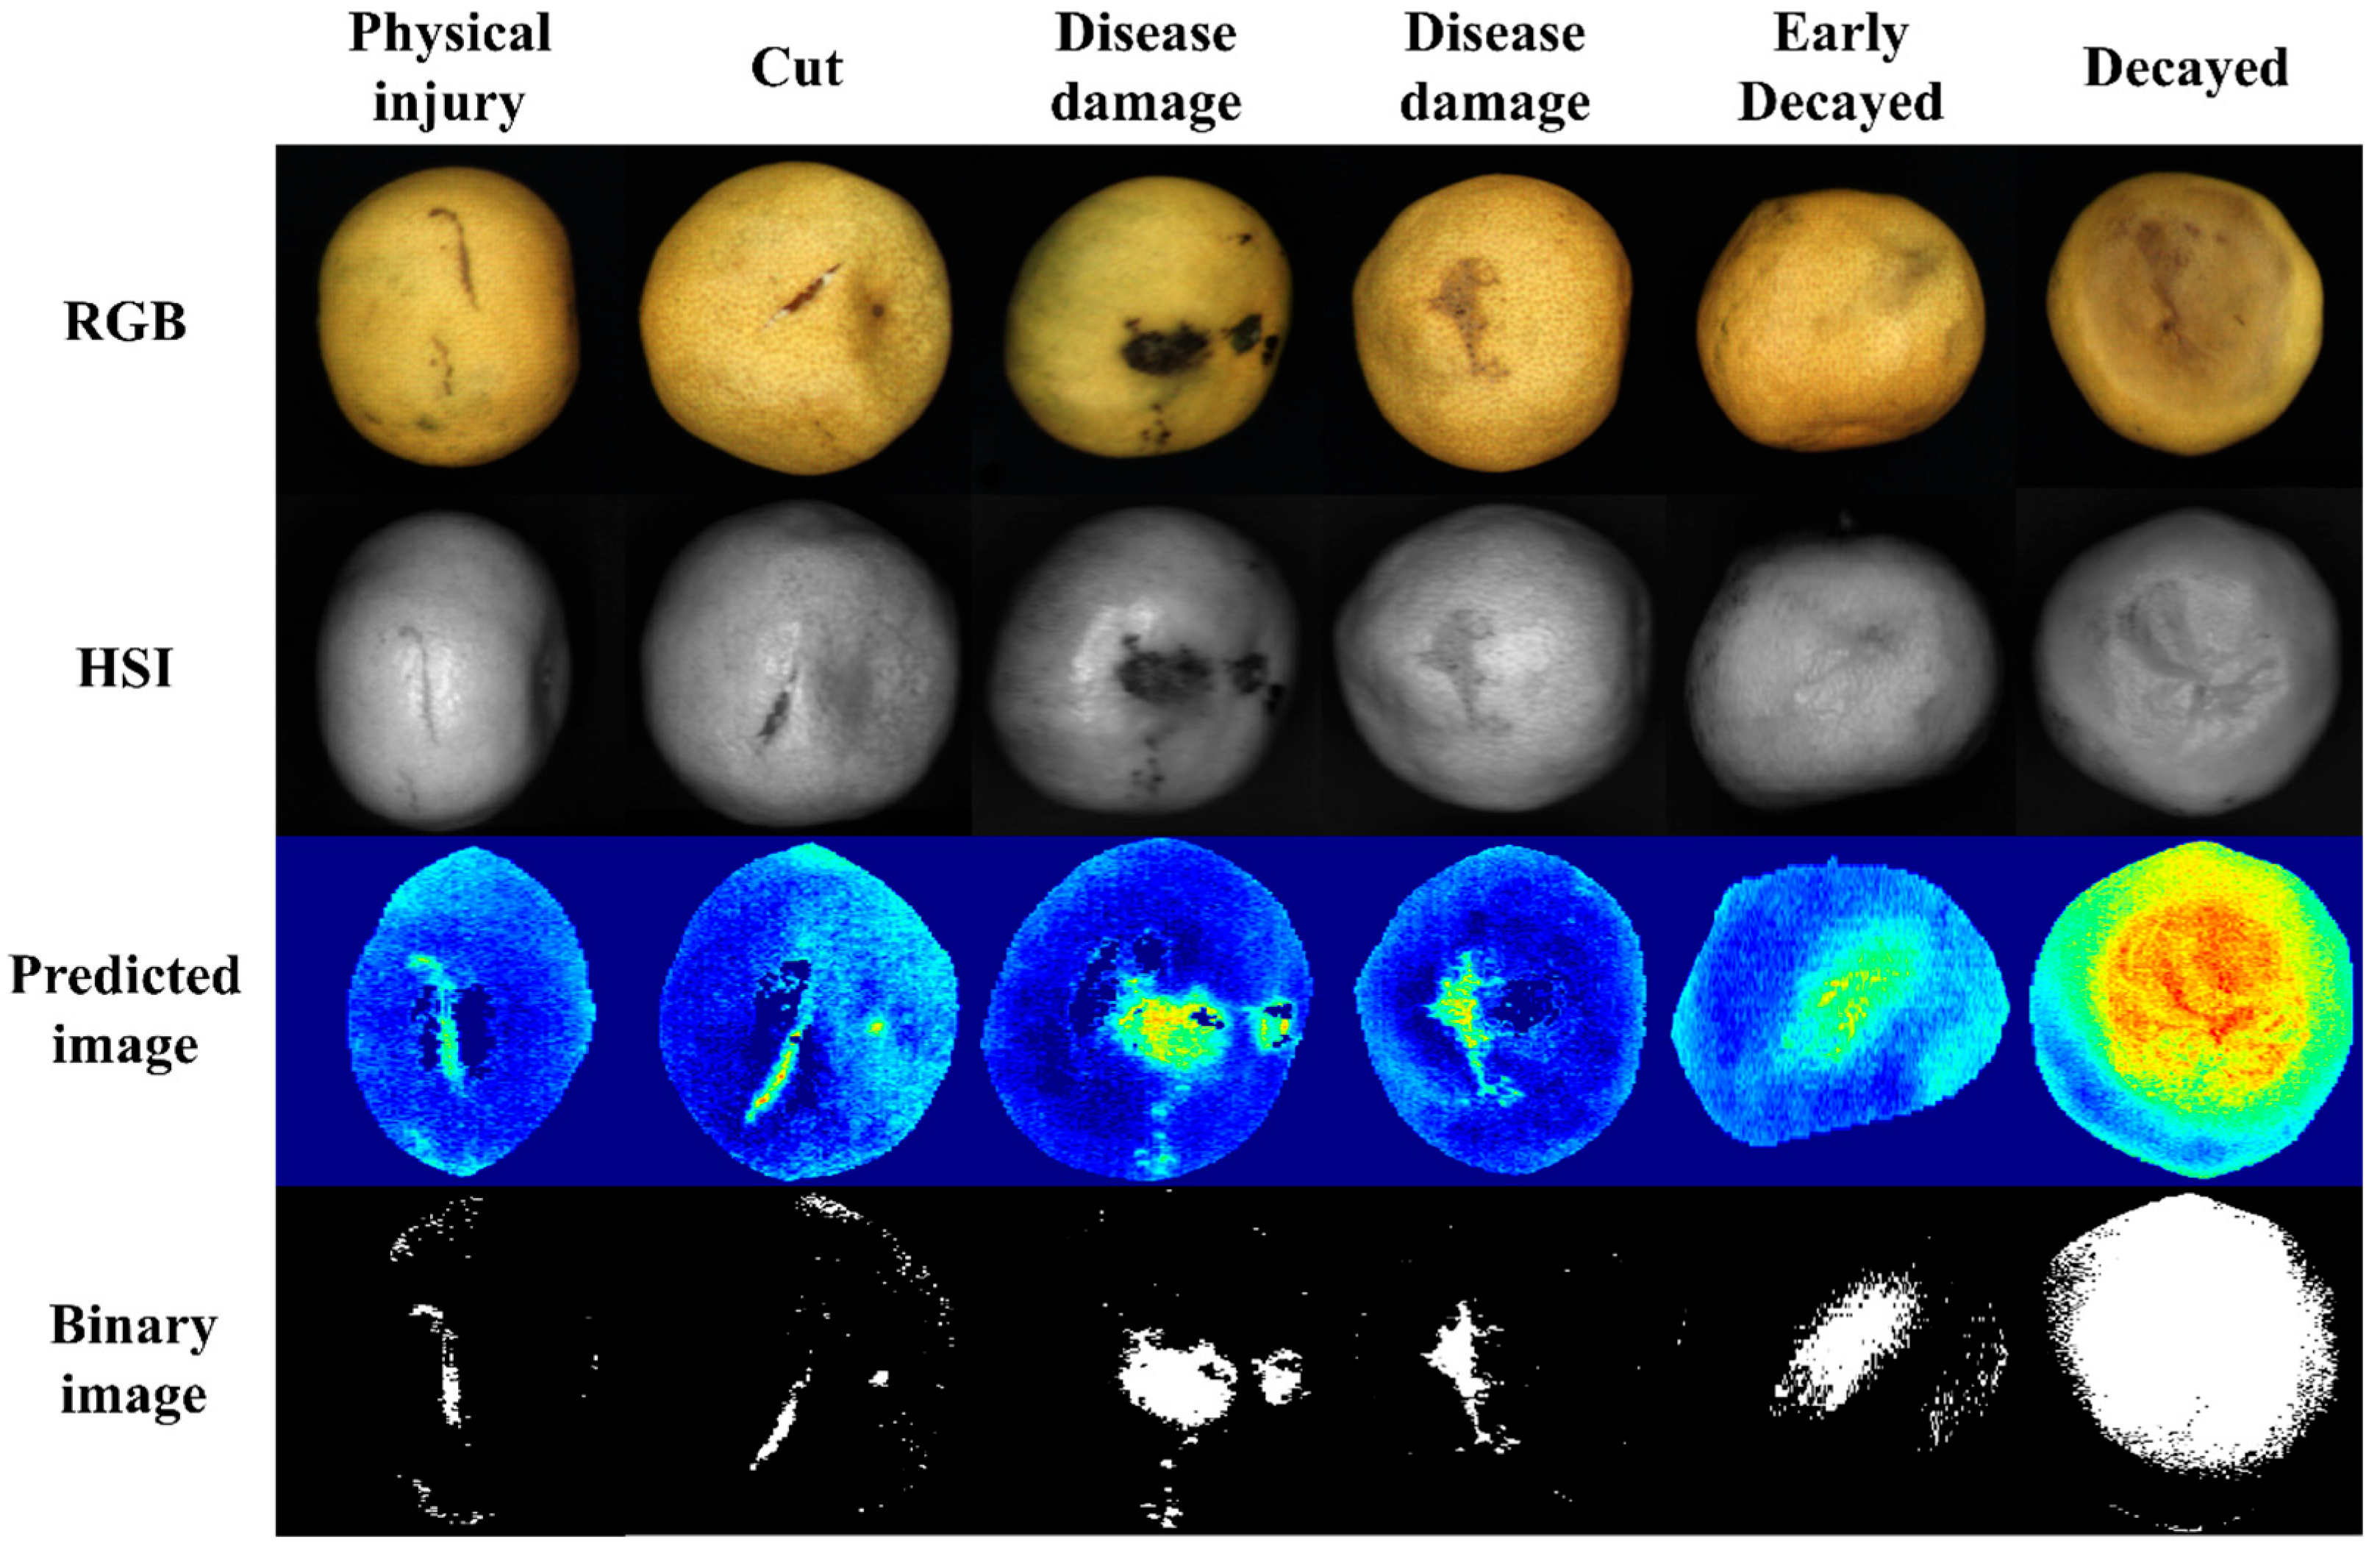
To validate the practical applicability of the optimal SFS15-PLS-DA model, an image processing algorithm was developed for the automated detection of external defects in citrus. The workflow is illustrated in Figure 11 and consists of the following steps: (a) acquire hyperspectral images, (b) perform calibration of the hyperspectral images, (c) create a binary image by applying a threshold value (>0.1) to the image at 561 nm, (d) apply masking based on the binary image, (e) generate a PLS image using the equation from the developed SFS15-PLS-DA model, and (f) discriminate external defects in citrus.
Figure 11.
Flowchart of the image processing algorithm for citrus fruit external defect discrimination based on the SFS15-PLS-DA model.
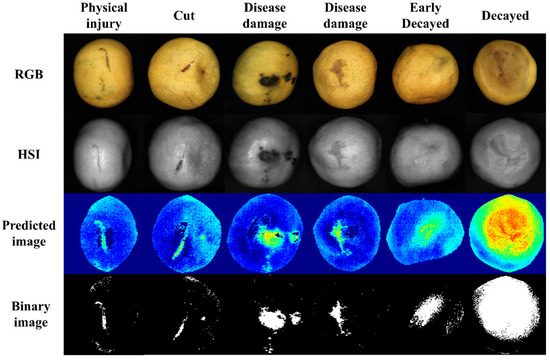
Figure 12 shows classification results for various defect types including physical, environmental, and pest- or disease-related damage. The algorithm accurately segmented defect areas, supporting the model’s robustness and generalizability. These results demonstrate that the integration of Vis-NIR hyperspectral imaging with EWS algorithms can enable compact, high-speed, and accurate defect detection systems suitable for non-destructive, real-time citrus sorting with reduced hardware complexity and cost.
Figure 12.
Representative segmentation results of citrus fruit external defects using the proposed SFS15-PLS-DA-based image processing algorithm.
However, it should be noted that all samples used in this study were collected with the same growing season. Although the fruits were sourced through an APC that aggregates products from multiple farms, the dataset still represents limited seasonal and varietal variability. Therefore, the absence of independent external validation—such as citrus samples from different orchards, growing seasons, or cultivars—remains a limitation of this study.
Future research should incorporate more diverse datasets to systematically evaluate the robustness and generalizability of the proposed model under real-world agricultural conditions. In addition, the current binary classification framework may have limitations for direct application to commercial grading systems, which often require discrimination among multiple defect categories (e.g., mechanical damage, pest injury, decay, and sunburn). The proposed hyperspectral framework could be extended to multi-class classification models by incorporating additional labeled datasets representing different defect types, enabling more detailed defect-specific grading in commercial sorting systems.
Although ROIs were manually selected during the model development stage to obtain representative spectral signatures, the proposed approach can be extended to a fully automated framework. The pixel-wise classification results demonstrated in this study indicate that defect regions can be automatically localized across the fruit surface, enabling automated ROI identification without manual intervention. Binary classification results can be directly translated into fruit-level grading decisions by aggregating pixel-level predictions across the fruit surface. In practical applications, this approach could be implemented by combining fruit segmentation, pixel-wise spectral classification, and defect region aggregation to achieve automated defect detection at the fruit level.
Although the proposed model shows potential for real-time citrus sorting, the present study did not directly assess processing speed, hardware implementation, or economic feasibility compared with existing RGB-based grading systems. However, the substantial reduction in spectral variables achieved through effective wavelength selection significantly decreases the dimensionality of the input data, which is expected to reduce computational complexity in practical implementations. Furthermore, this reduction provides a practical basis for implementing compact multispectral imaging systems with a limited number of optical filters. These aspects should be further investigated under practical commercial conditions.
4. Conclusions
This study developed a PLS-DA model to discriminate external defects in citrus fruits using Vis-NIR hyperspectral imaging combined with effective wavelength selection algorithms. Multiple preprocessing techniques and four variable selection algorithms (WRC, VIP, SFS, RF) were systematically applied to enhance model accuracy while reducing the number of spectral variables.
The FW-PLS-DA model achieved a high peak external defect discrimination accuracy of 99.22% in the prediction set. Among the EW-PLS-DA models developed through effective wavelength selection, the SFS15-PLS-DA model combined with first-order derivative preprocessing exhibited the highest overall accuracy of 99.80%. This demonstrates that superior classification performance can be achieved using only 15 wavelengths out of 300, representing a substantial reduction of approximately 95.0% of the spectral data.
These results indicate that a minimal set of effective wavelengths can successfully discriminate diverse types of citrus external defects, including those caused by physical damage, environmental stress, pests, and diseases. This capability underscores the potential for significant improvements in classification speed and cost efficiency in real-time, non-destructive sorting systems.
Future work should focus on integrating the SFS15-PLS-DA model into high-speed hardware systems and validating its performance under dynamic field conditions. Because the model relies on only a small number of selected wavelengths, it can potentially be implemented using a compact multispectral imaging system rather than a full hyperspectral sensor, which would significantly reduce computational load and system cost. To address the challenge of localized, non-uniform defects in commercial settings, future research will explore the implementation of rotating roller conveyors or multi-camera systems. Such hardware configurations would ensure a 360-degree inspection of the fruit surface, eliminating blind spots and allowing the model to detect defects regardless of their orientation. In addition, the reduced number of wavelengths enables faster processing of multiple viewing angles, which is advantageous for real-time sorting systems. Deploying the model in a real-time prototype or automated citrus sorting system will further enhance its practical impact and accelerate adoption in commercial postharvest operations. These developments could support the commercialization of smart, high-efficiency, non-destructive sorting systems for citrus and other agricultural products.
Author Contributions
Data curation, W.-H.Y. and H.L.; formal analysis, W.-H.Y.; investigation, W.-H.Y., M.-J.K. and A.L.; methodology, W.-H.Y., M.-J.K., B.-K.C., H.L. and C.M.; software, H.-G.L.; validation, W.-H.Y. and M.-J.K.; writing—original draft, W.-H.Y.; conceptualization, W.-H.Y., B.-K.C., H.L. and C.M.; writing—review and editing, C.M.; supervision, C.M.; project administration, C.M.; funding acquisition, C.M. All authors have read and agreed to the published version of the manuscript.
Funding
This work was carried out with the support of “Cooperative Research Program for Agriculture Science & Technology Development (Project No. RS-2022-RD010265)” Rural Development Administration, Republic of Korea. “This research was supported by the MSIT (Ministry of Science and ICT), Republic of Korea under the Innovative Human Resource Development for Local Intellectualization support program (IITP-2026-RS-2023-00260267) supervised by the IITP (Institute for Information & communications Technology Planning & Evaluation)”.
Institutional Review Board Statement
Not applicable.
Informed Consent Statement
Not applicable.
Data Availability Statement
The datasets presented in this article are not readily available because the data are part of an ongoing study. Requests to access the datasets should be directed to corresponding author.
Conflicts of Interest
The authors declare no conflicts of interest.
References
- Kim, K.S.; Park, S.M.; Park, K.J.; Kim, S.S.; Hyun, J.W.; Hwang, R.Y. Status of the Citrus Industry in Republic of Korea. IX Int. Symp. Temp. Zone Fruits Trop. Subtrop. 2014, 1059, 51–58. [Google Scholar] [CrossRef] [Scilit]
- Hu, W.X.; Xiong, J.T.; Liang, J.H.; Xie, Z.M.; Liu, Z.Y.; Huang, Q.Y.; Yang, Z.G. A Method of Citrus Epidermis Defects Detection Based on an Improved YOLOv5. Biosyst. Eng. 2023, 227, 19–35. [Google Scholar] [CrossRef] [Scilit]
- Wang, B.; Yang, H.; Zhang, S.; Li, L. Detection of Defective Features in Cerasus Humilis Fruit Based on Hyperspectral Imaging Technology. Appl. Sci. 2023, 13, 3279. [Google Scholar] [CrossRef] [Scilit]
- Zhang, H.; Chen, Y.; Liu, X.; Huang, Y.; Zhan, B.; Luo, W. Identification of Common Skin Defects and Classification of Early Decayed Citrus Using Hyperspectral Imaging Technique. Food Anal. Methods 2021, 14, 1176–1193. [Google Scholar] [CrossRef] [Scilit]
- Tian, X.; Fan, S.; Huang, W.; Wang, Z.; Li, J. Detection of Early Decay on Citrus Using Hyperspectral Transmittance Imaging Technology Coupled with Principal Component Analysis and Improved Watershed Segmentation Algorithms. Postharvest Biol. Technol. 2020, 161, 111071. [Google Scholar] [CrossRef] [Scilit]
- Fu, X.; Wang, M. Detection of Early Bruises on Pears Using Fluorescence Hyperspectral Imaging Technique. Food Anal. Methods 2022, 15, 115–123. [Google Scholar] [CrossRef] [Scilit]
- Wu, L.; He, J.; Liu, G.; Wang, S.; He, X. Detection of Common Defects on Jujube Using Vis-NIR and NIR Hyperspectral Imaging. Postharvest Biol. Technol. 2016, 112, 134–142. [Google Scholar] [CrossRef] [Scilit]
- Guo, Z.; Zhang, J.; Ma, C.; Yin, X.; Guo, Y.; Sun, X.; Jin, C. Application of Visible-near-Infrared Hyperspectral Imaging Technology Coupled with Wavelength Selection Algorithm for Rapid Determination of Moisture Content of Soybean Seeds. J. Food Compos. Anal. 2023, 116, 105048. [Google Scholar] [CrossRef] [Scilit]
- Kamruzzaman, M.; Elmasry, G.; Sun, D.W.; Allen, P. Non-Destructive Prediction and Visualization of Chemical Composition in Lamb Meat Using NIR Hyperspectral Imaging and Multivariate Regression. Innov. Food Sci. Emerg. Technol. 2012, 16, 218–226. [Google Scholar] [CrossRef] [Scilit]
- Kandpal, L.M.; Lohumi, S.; Kim, M.S.; Kang, J.S.; Cho, B.K. Near-Infrared Hyperspectral Imaging System Coupled with Multivariate Methods to Predict Viability and Vigor in Muskmelon Seeds. Sens. Actuators B Chem. 2016, 229, 534–544. [Google Scholar] [CrossRef] [Scilit]
- Shafiee, S.; Lied, L.M.; Burud, I.; Dieseth, J.A.; Alsheikh, M.; Lillemo, M. Sequential Forward Selection and Support Vector Regression in Comparison to LASSO Regression for Spring Wheat Yield Prediction Based on UAV Imagery. Comput. Electron. Agric. 2021, 183, 106036. [Google Scholar] [CrossRef] [Scilit]
- Li, H.D.; Xu, Q.S.; Liang, Y.Z. Random Frog: An Efficient Reversible Jump Markov Chain Monte Carlo-like Approach for Variable Selection with Applications to Gene Selection and Disease Classification. Anal. Chim. Acta 2012, 740, 20–26. [Google Scholar] [CrossRef] [Scilit]
- Xia, Z.; Zhang, C.; Weng, H.; Nie, P.; He, Y. Sensitive Wavelengths Selection in Identification of Ophiopogon Japonicus Based on Near-Infrared Hyperspectral Imaging Technology. Int. J. Anal. Chem. 2017, 2017, 6018769. [Google Scholar] [CrossRef] [Scilit]
- Rahman, A.; Faqeerzada, M.A.; Cho, B.K. Hyperspectral Imaging for Predicting the Allicin and Soluble Solid Content of Garlic with Variable Selection Algorithms and Chemometric Models. J. Sci. Food Agric. 2018, 98, 4715–4725. [Google Scholar] [CrossRef] [Scilit]
- Elmasry, G.; Sun, D.W.; Allen, P. Near-Infrared Hyperspectral Imaging for Predicting Colour, PH and Tenderness of Fresh Beef. J. Food Eng. 2012, 110, 127–140. [Google Scholar] [CrossRef] [Scilit]
- Wold, S.; Sjöström, M.; Eriksson, L. PLS-Regression: A Basic Tool of Chemometrics. Chemom. Intell. Lab. Syst. 2001, 58, 109–130. [Google Scholar] [CrossRef] [Scilit]
- ElMasry, G.; Kamruzzaman, M.; Sun, D.W.; Allen, P. Principles and Applications of Hyperspectral Imaging in Quality Evaluation of Agro-Food Products: A Review. Crit. Rev. Food Sci. Nutr. 2012, 52, 999–1023. [Google Scholar] [CrossRef] [Scilit]
- Chong, I.G.; Jun, C.H. Performance of Some Variable Selection Methods When Multicollinearity Is Present. Chemom. Intell. Lab. Syst. 2005, 78, 103–112. [Google Scholar] [CrossRef] [Scilit]
- Mehmood, T.; Liland, K.H.; Snipen, L.; Sæbø, S. A Review of Variable Selection Methods in Partial Least Squares Regression. Chemom. Intell. Lab. Syst. 2012, 118, 62–69. [Google Scholar] [CrossRef] [Scilit]
- Reunanen, J. ReunanenJuha Overfitting in Making Comparisons between Variable Selection Methods. J. Mach. Learn. Res. 2003, 3, 1371–1382. [Google Scholar]
- Jain, A. Feature Selection: Evaluation, Application, and Small Sample Performance. IEEE Trans. Pattern Anal. Mach. Intell. 1997, 19, 153–158. [Google Scholar] [CrossRef] [Scilit]
- Ghayab, H.R.A.; Li, Y.; Abdulla, S.; Diykh, M.; Wan, X. Classification of Epileptic EEG Signals Based on Simple Random Sampling and Sequential Feature Selection. Brain Inform. 2016, 3, 85–91. [Google Scholar] [CrossRef] [Scilit]
- Brereton, R.G.; Lloyd, G.R. Partial Least Squares Discriminant Analysis: Taking the Magic Away. J. Chemom. 2014, 28, 213–225. [Google Scholar] [CrossRef] [Scilit]
- Lee, L.C.; Liong, C.Y.; Jemain, A.A. Partial Least Squares-Discriminant Analysis (PLS-DA) for Classification of High-Dimensional (HD) Data: A Review of Contemporary Practice Strategies and Knowledge Gaps. Analyst 2018, 143, 3526–3539. [Google Scholar] [CrossRef] [Scilit]
- Ballabio, D.; Consonni, V. Classification Tools in Chemistry. Part 1: Linear Models. PLS-DA. Anal. Methods 2013, 5, 3790–3798. [Google Scholar] [CrossRef] [Scilit]
- Solovchenko, A.; Chivkunova, O.; Gitelson, A.; Merzlyak, M. Non-Destructive Estimation Pigment Content Ripening Quality and Damage in Apple Fruit with Spectral Reflectance in the Visible Range. Sch. Nat. Resour. Fac. Publ. 2010, 4, 91–102. [Google Scholar]
- Hu, W.; Sun, D.W.; Blasco, J. Rapid Monitoring 1-MCP-Induced Modulation of Sugars Accumulation in Ripening ‘Hayward’ Kiwifruit by Vis/NIR Hyperspectral Imaging. Postharvest Biol. Technol. 2017, 125, 168–180. [Google Scholar] [CrossRef] [Scilit]
- Abbott, J.A.; Lu, R.; Upchurch, B.L.; Stroshine, R.L. Technologies for Nondestructive Quality Evaluation of Fruits and Vegetables. Hortic. Rev. (Am. Soc. Hortic. Sci.) 2010, 20, 1–120. [Google Scholar] [CrossRef] [Scilit]
- Kim, M.; Park, Y.; Yun, S.K.; Kim, S.S.; Joa, J.; Moon, Y.E.; Do, G.R. The Anatomical Differences and Physiological Responses of Sunburned Satsuma Mandarin (Citrus Unshiu Marc.) Fruits. Plants 2022, 11, 1801. [Google Scholar] [CrossRef] [Scilit]
- Khaled, A.Y.; Ekramirad, N.; Donohue, K.D.; Villanueva, R.T.; Adedeji, A.A. Non-Destructive Hyperspectral Imaging and Machine Learning-Based Predictive Models for Physicochemical Quality Attributes of Apples during Storage as Affected by Codling Moth Infestation. Agriculture 2023, 13, 1086. [Google Scholar] [CrossRef] [Scilit]
- Qian, X.; Yang, Q.; Zhang, Q.; Abdelhai, M.H.; Dhanasekaran, S.; Serwah, B.N.A.; Gu, N.; Zhang, H. Elucidation of the Initial Growth Process and the Infection Mechanism of Penicillium Digitatum on Postharvest Citrus (Citrus Reticulata Blanco). Microorganisms 2019, 7, 485. [Google Scholar] [CrossRef] [Scilit] [PubMed]
- Li, M.; Pullanagari, R.; Yule, I.; East, A. Segregation of ‘Hayward’ Kiwifruit for Storage Potential Using Vis-NIR Spectroscopy. Postharvest Biol. Technol. 2022, 189, 111893. [Google Scholar] [CrossRef] [Scilit]
- Li, M.; Pullanagari, R.R.; Pranamornkith, T.; Yule, I.J.; East, A.R. Quantitative Prediction of Post Storage ‘Hayward’ Kiwifruit Attributes Using at Harvest Vis-NIR Spectroscopy. J. Food Eng. 2017, 202, 46–55. [Google Scholar] [CrossRef] [Scilit]
- Giovanelli, G.; Sinelli, N.; Beghi, R.; Guidetti, R.; Casiraghi, E. NIR Spectroscopy for the Optimization of Postharvest Apple Management. Postharvest Biol. Technol. 2014, 87, 13–20. [Google Scholar] [CrossRef] [Scilit]



Disclaimer/Publisher’s Note: The statements, opinions and data contained in all publications are solely those of the individual author(s) and contributor(s) and not of MDPI and/or the editor(s). MDPI and/or the editor(s) disclaim responsibility for any injury to people or property resulting from any ideas, methods, instructions or products referred to in the content. |
© 2026 by the authors. Licensee MDPI, Basel, Switzerland. This article is an open access article distributed under the terms and conditions of the Creative Commons Attribution (CC BY) license.