


Abstract
Seasonal hydrological fluctuations strongly influence riparian habitats in the middle Yangtze River, yet the relationships of inundation duration with soil properties and riparian vegetation remain insufficiently understood in representative riparian sections. Here, field surveys and laboratory analyses were conducted to examine (1) inundation–soil associations and (2) soil–vegetation relationships. Soil moisture (W), pH, particle-size composition, soil organic carbon (SOC), total nitrogen (TN), and total phosphorus (TP) were measured, and vegetation parameters were compared among inundation-duration zones. Partial redundancy analysis (pRDA) was used to evaluate the relationships between environmental factors and vegetation parameters after controlling for elevation and shoreline distance. Vegetation occurrence, coverage, and diversity decreased with increasing inundation duration, and no vascular plants were recorded in the severe-inundation zone. After accounting for topographic factors, TN and gravel were the main soil variables associated with vegetation variation. Overall, inundation duration was closely associated with soil variation, whereas vegetation variation was mainly associated with selected soil environmental factors. These findings provide site-based evidence for riparian ecological restoration in representative riparian sections of the middle Yangtze River.
1. Introduction
The middle reaches of China’s Yangtze River spans approximately 955 km in total length, flowing through Hubei Province, Hunan Province, and Jiangxi Province, and functioning as a core area for ecological security and economic development within the Yangtze River Basin. This region is characterized by a subtropical monsoon climate, with an average annual precipitation of 1200–1600 mm. However, precipitation is distributed unevenly across space and time, which results in significant seasonal fluctuations in the hydrological regimes of riparian zones. Driven by these hydrological fluctuations, the physical and chemical properties of riparian soils and the distribution of riparian vegetation undergo dynamic variations [1,2], thereby exerting an impact on the ecological stability of these riparian zones.
Riparian ecosystems form the ecotone between terrestrial and aquatic systems and are strongly shaped by river stage fluctuations. They play a key role in river–floodplain connectivity by mediating exchanges of materials and energy, while supporting bank stability and multiple ecosystem services [3]. Globally, riverbank flooding is a pervasive disturbance, and flood regime attributes (timing, duration, frequency, and depth) are widely recognized as major controls on floodplain ecosystem structure and functioning [4]. Consistent with this framework, international syntheses and meta-analyses show that inundation duration and depth are closely associated with riparian plant performance, community composition, and diversity across regions [5,6]. In China, the riparian zones of large rivers such as the Yangtze experience pronounced intra-annual water-level fluctuations driven by monsoon hydrology and river regulation. Studies in the Three Gorges Reservoir (TGR) have linked riparian vegetation dynamics to climatic and hydrological conditions and documented flood-driven variation in riparian soil properties (e.g., nutrients and pH) along elevational gradients [7,8,9]. Despite these advances, field-based evidence remains limited for herbaceous-dominated riverbanks in the middle Yangtze River that simultaneously quantifies paired vegetation metrics (cover, richness/diversity) and soil physicochemical traits (e.g., moisture, pH, SOC, TN, TP, and texture descriptors) across clearly defined average inundation-duration zones. Moreover, because inundation duration often covaries with edaphic gradients (especially moisture and particle-size composition), the relationships between inundation duration, soil conditions, and herbaceous community patterns remain insufficiently understood.
However, in the riparian zones of the middle reaches of the Yangtze River, the relationships of inundation duration with soil physicochemical properties and the associations of soil environmental factors with riparian vegetation characteristics remain insufficiently quantified. Clarifying these two aspects is important for understanding vegetation distribution patterns and for improving restoration strategies in riverfront zones. Therefore, this study aimed to: (1) examine how inundation duration is associated with soil physicochemical properties along the riparian gradient, and (2) identify which soil environmental factors are most strongly associated with riparian vegetation variation after controlling for elevation and shoreline distance. By separating inundation–soil associations from soil–vegetation relationships, this study provides a more cautious basis for interpreting riparian habitat differentiation in the middle reaches of the Yangtze River.
2. Materials and Methods
2.1. Study Area
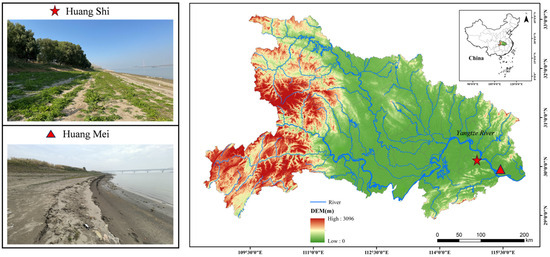
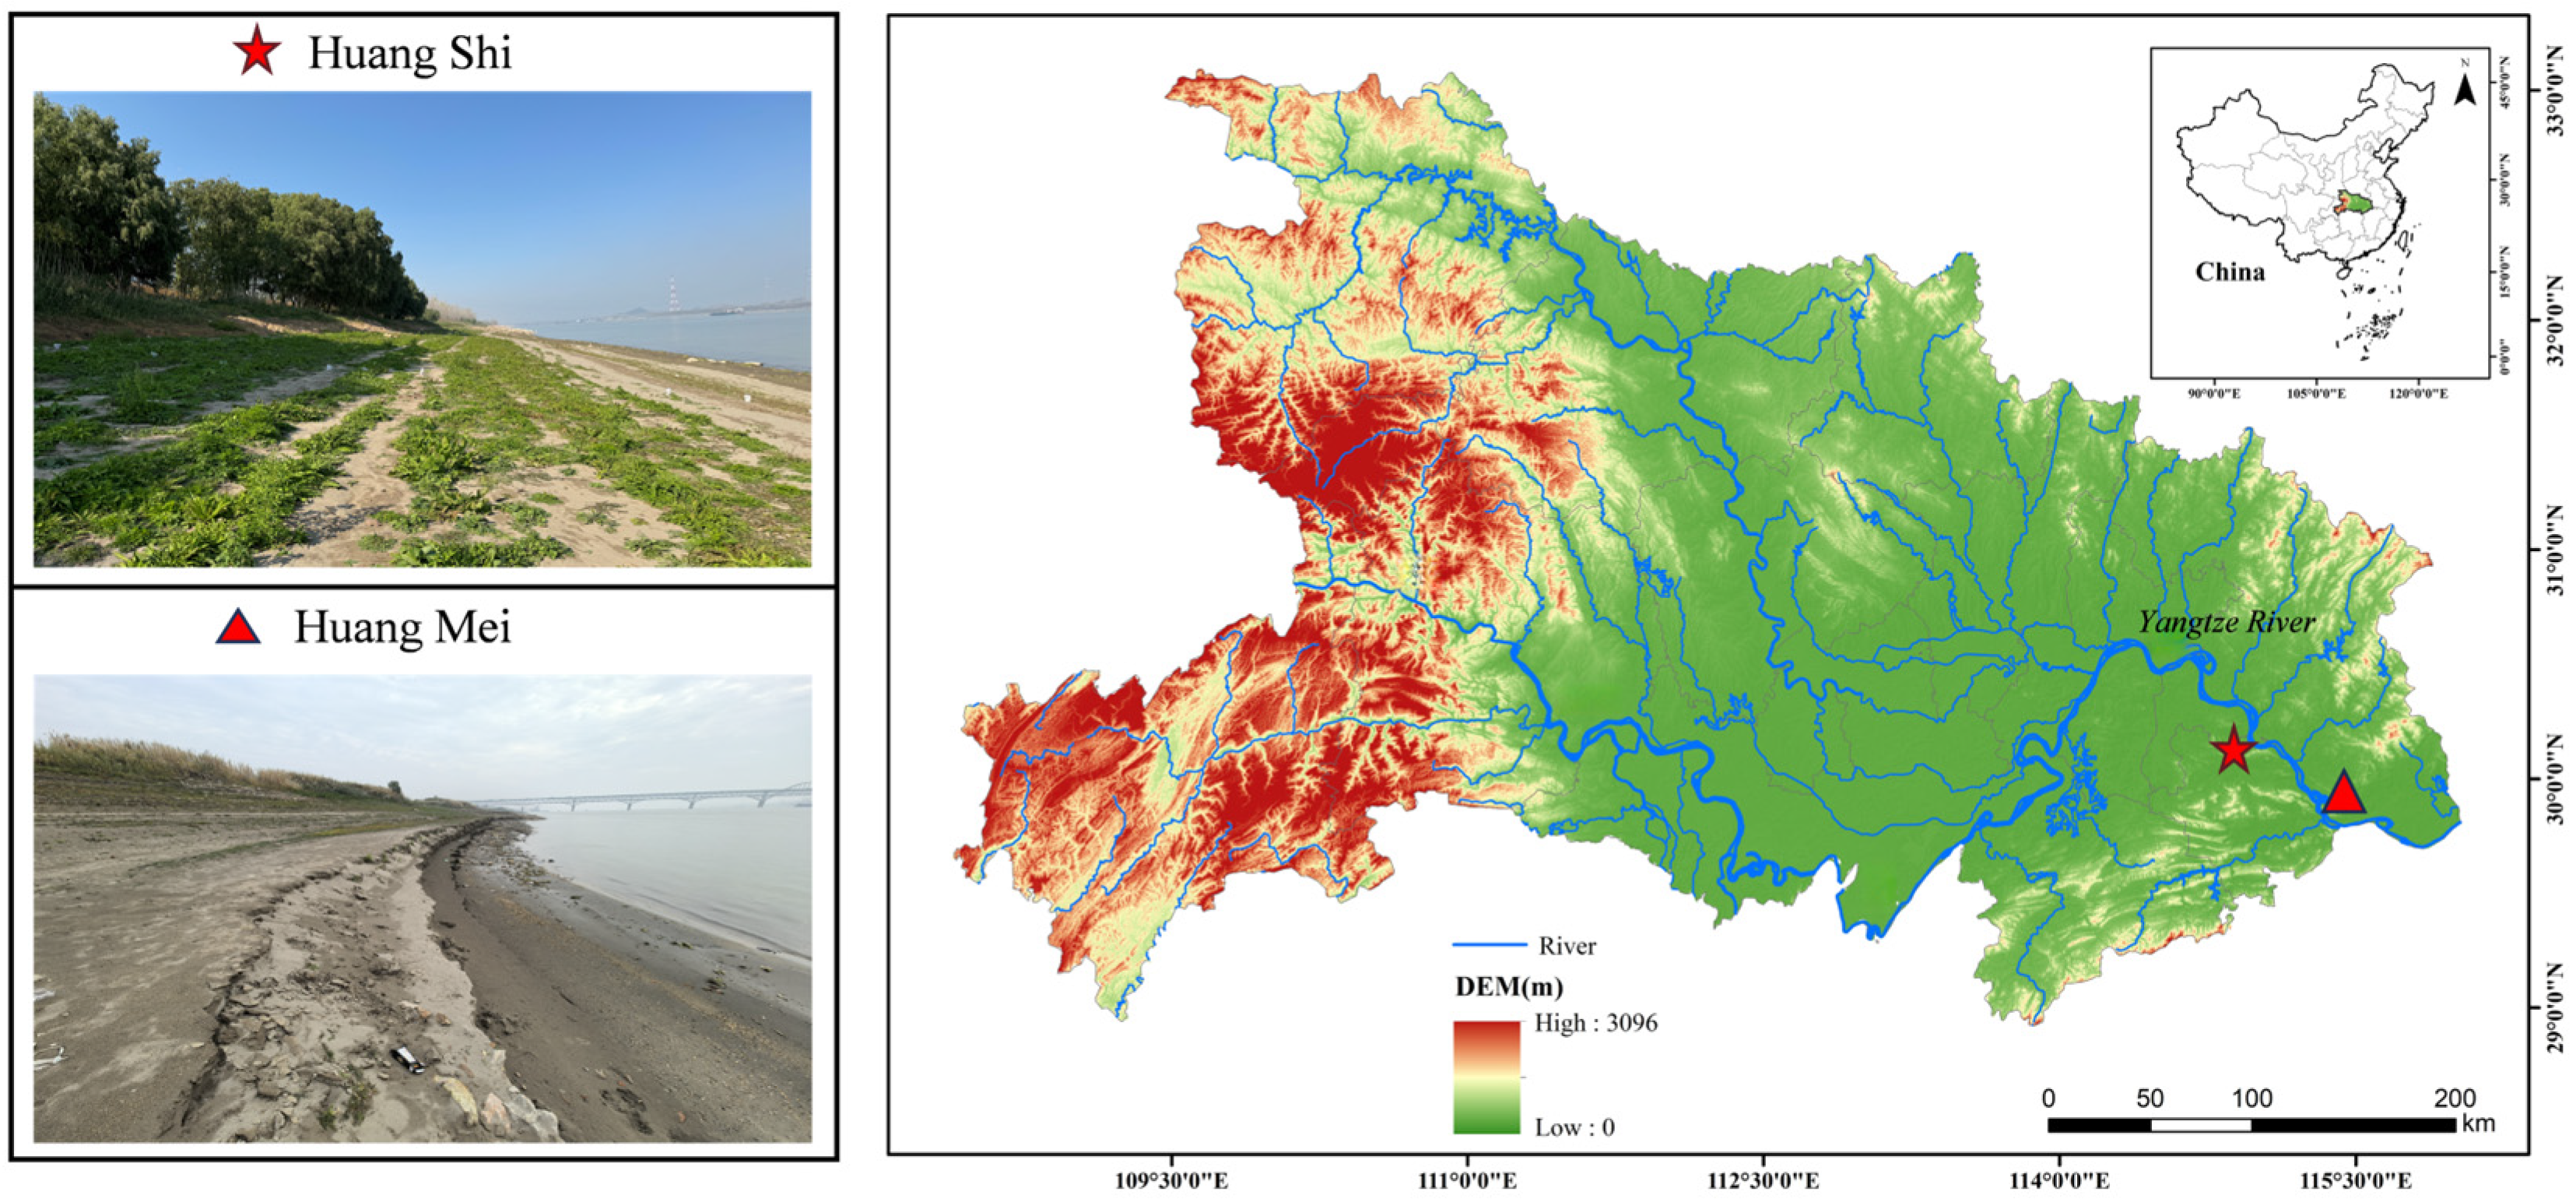
Field sampling was conducted in early December 2024 (starting on 5 December 2024) across 13 representative river sections in the middle reaches of the Yangtze River, with the Huang Mei section on the northern bank and the Huang Shi section on the southern bank of the middle Yangtze River plain selected as key research areas. This sampling period coincides with the regional dry season and the annual low-water stage in the middle Yangtze River, during which the entire riparian drawdown belt is exposed above the waterline, enabling safe and standardized access to all inundation-duration zones along the elevation gradient. This timing minimizes within-campaign hydrological variability and ensures that vegetation and soil measurements are collected under consistent post-inundation conditions, facilitating robust among-zone comparisons of herbaceous vegetation cover and richness. These two regions are affected by seasonal fluctuations in the Yangtze River’s water levels—specifically, alternating periods of flooding and drought—resulting in changes in the duration of flooding events [10]. The local soil, hydrologic, and climatic conditions provide a representative environment that supports vegetation growth, making it highly suitable for examining the effects of inundation duration and soil type on vegetation coverage and spatial distribution within the riparian ecosystem. This area holds significant scientific value for establishing “retreating aquatic vegetation ecosystems” and serves as a crucial component of the Yangtze River ecological restoration efforts. Consequently, the Huang Mei and Huang Shi sections have been designated as primary research sites (Figure 1).
Figure 1.
Location of the study area and sampling sections in the middle Yangtze River basin. The red star and triangle mark the Huang Shi and Huang Mei sites, respectively; photos show representative riverbank conditions during the low-water season.
Based on the geomorphic setting and bank-surface exposures (Figure 1), the riverbank soils at Huang Mei and Huang Shi were interpreted as predominantly Fluvisols under the WRB–FAO framework [11]. Local variation in inundation and drainage conditions may produce some spatial heterogeneity along the elevation gradient.
2.2. Inundation Duration and Soil Sampling
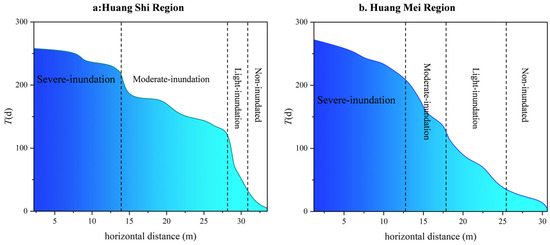
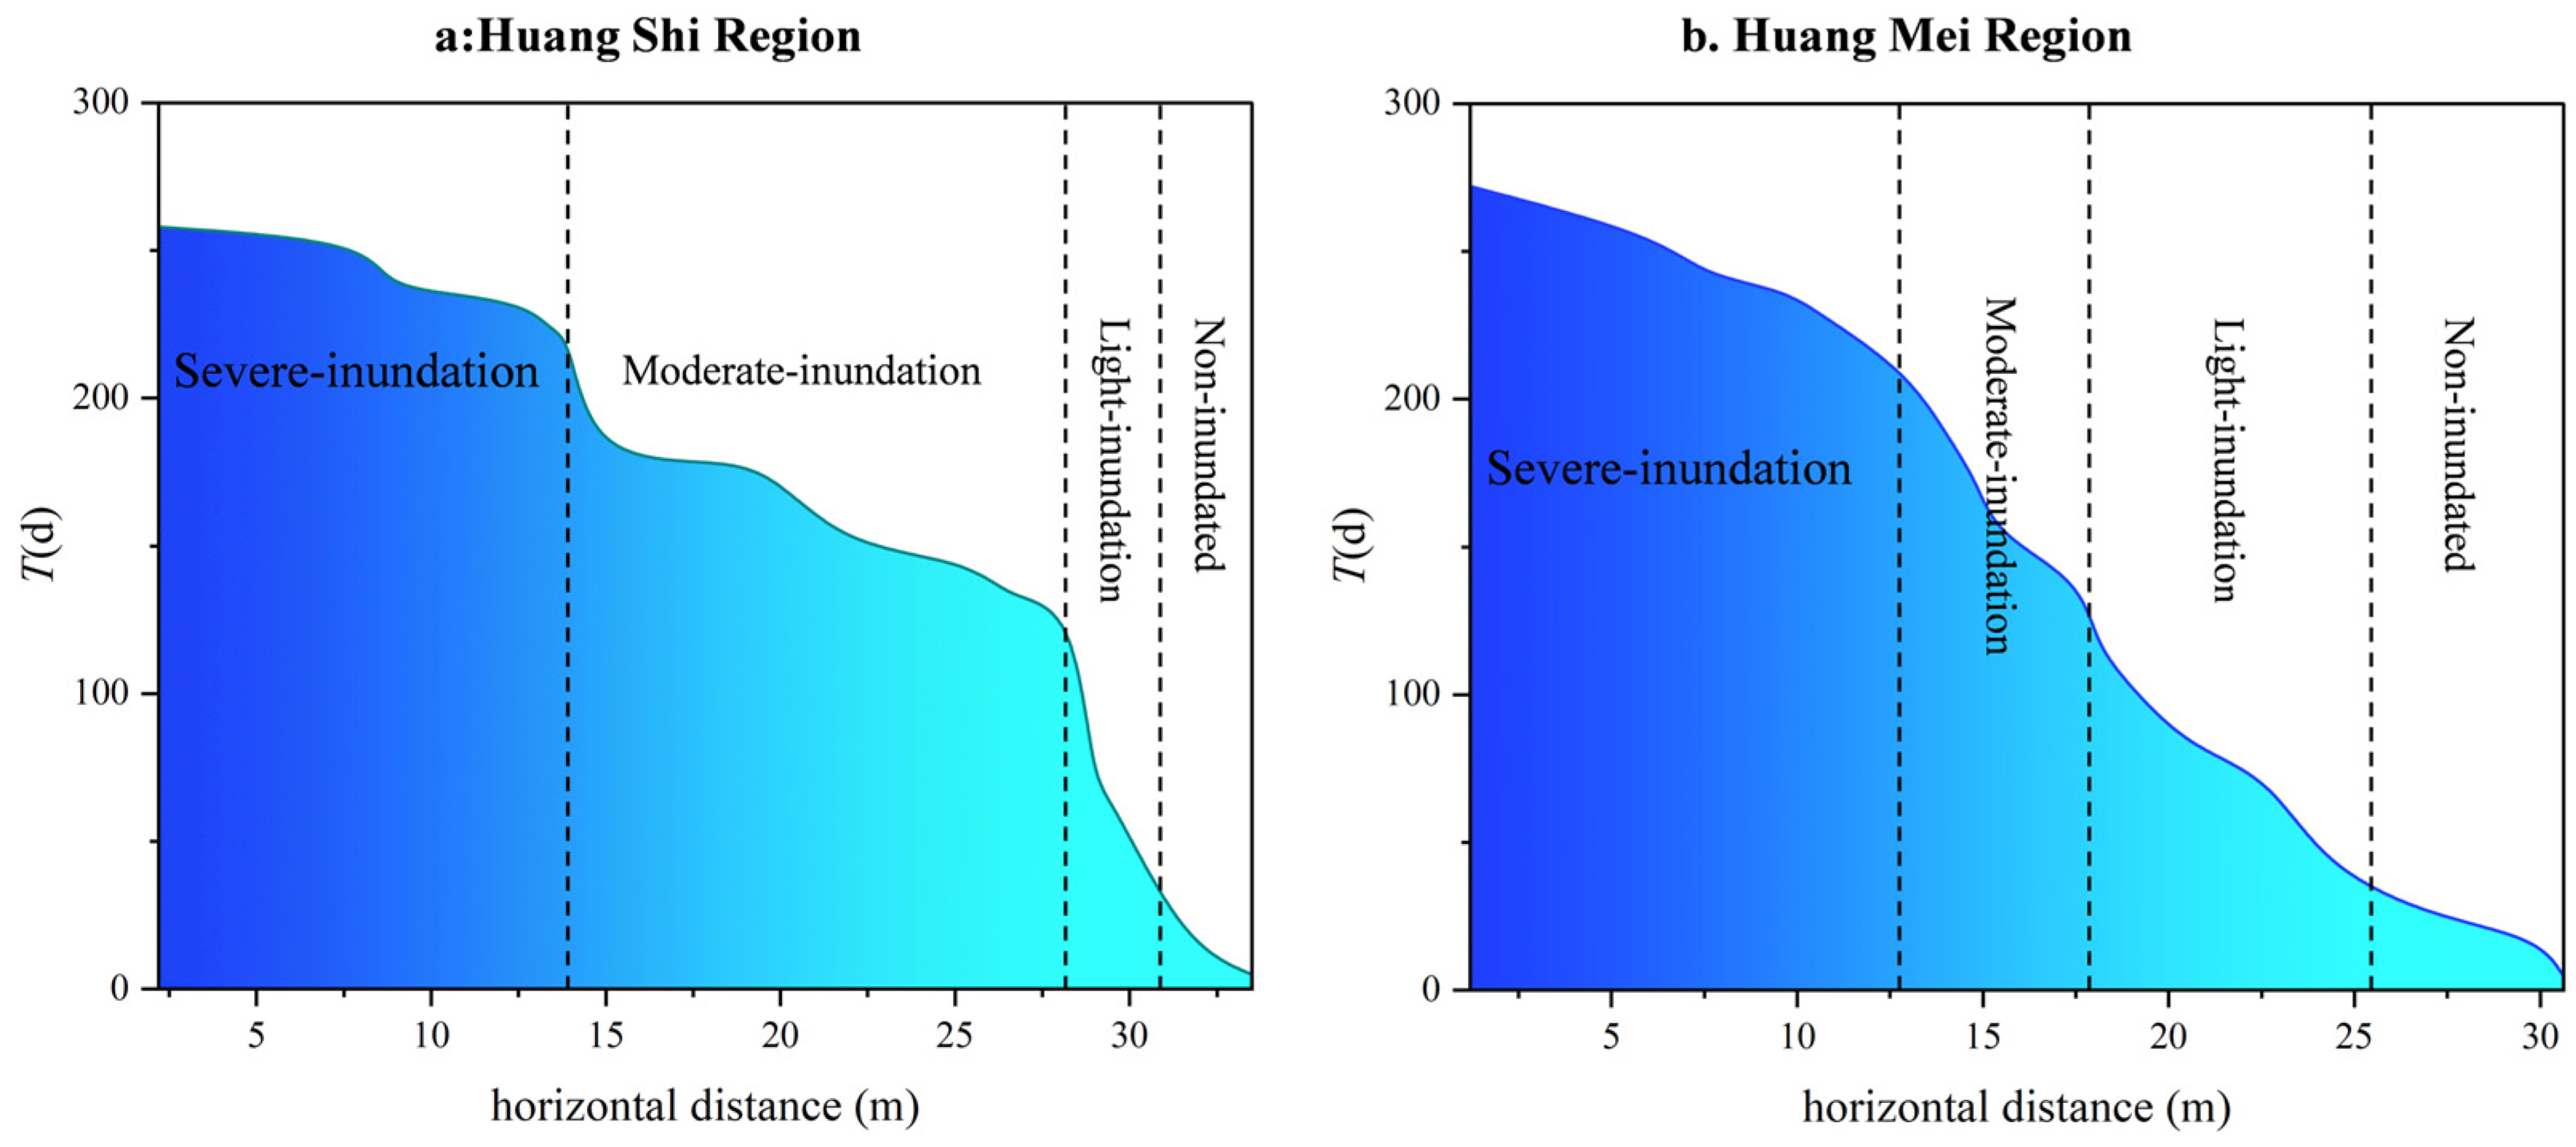
The distribution of vegetation along the riverbank displays a clear altitudinal gradient [12], indicating that elevation is a critical factor in evaluating post-inundation vegetation recovery [13]. In this study, spatially varying water-level data for different elevations were obtained from the China Water Network [14]. Using the 2014–2024 daily water-level record, we estimated the annual average inundation duration at each riverbank elevation (Figure 2). All water-level and elevation data were referenced to a consistent vertical datum. For each elevation, a day was classified as inundated when the recorded daily water level was equal to or higher than that elevation; otherwise, it was classified as exposed. Annual inundation duration T was calculated as the total number of inundated days per year, and the multi-year mean T was computed across 2014–2024. The riverbank was then classified into four inundation-duration zones: severe inundation, where T was greater than 200 days; moderate inundation, where T was between 120 and 200 days; light inundation, where T was between 30 and 120 days; and non-inundated, where T was 30 days or less [15].
Figure 2.
Regional average annual inundation duration (T) along the riparian transect for (a) HuangShi Region and (b) Huang Mei Region. Dashed vertical lines delineate the four inundation-duration zones (severe-, moderate-, light-inundation, and non-inundated).
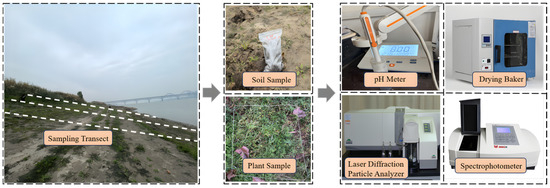
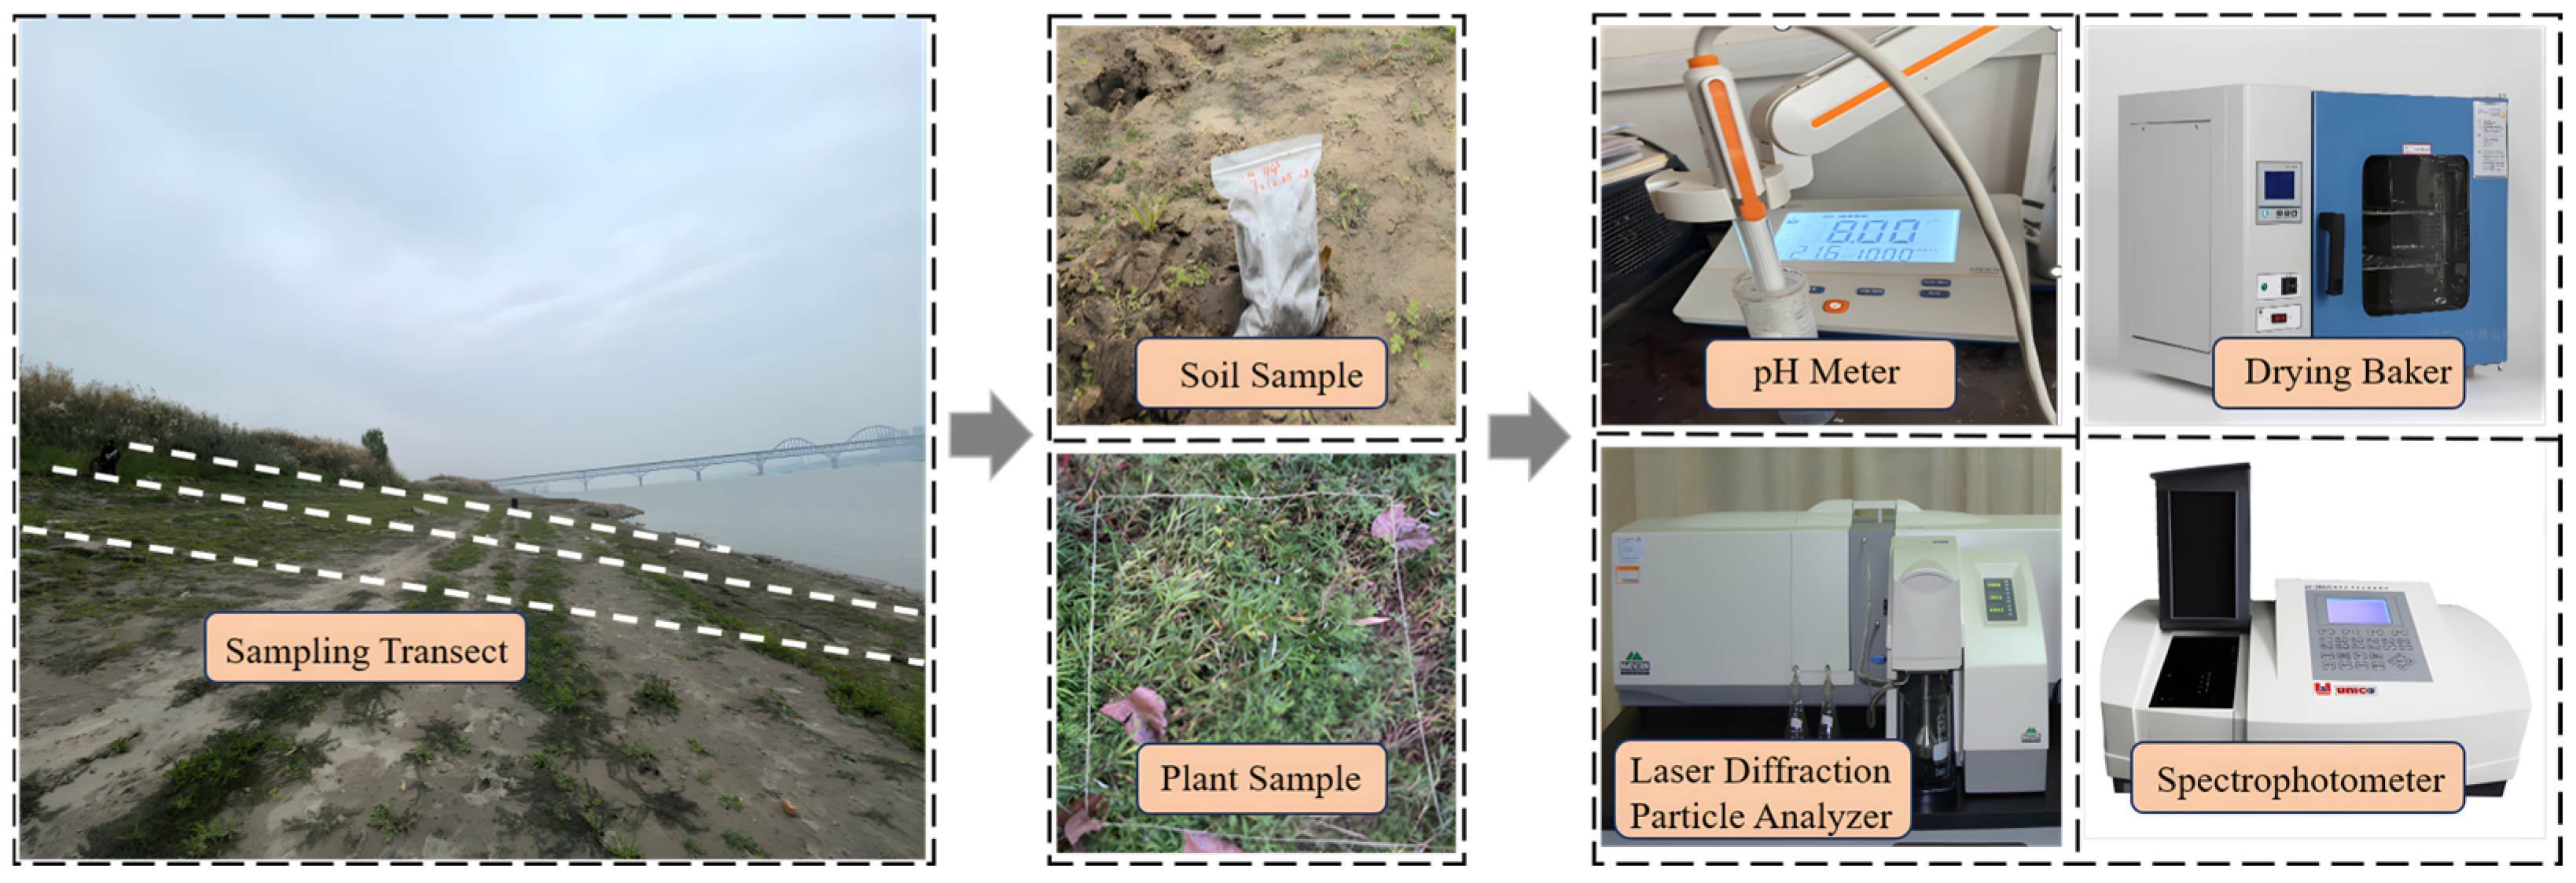
Taking the Huang Mei riverbank section as an example: A total of 18 sampling points were established along the bank-perpendicular profile line covering the full elevation gradient (Figure 3). At each sampling point, topsoil (0–20 cm) was collected, with three parallel subsamples taken horizontally at 20 cm intervals perpendicular to the sampling transect to characterize micro-scale spatial heterogeneity. All samples were immediately placed in sealed bags to preserve sample integrity. In total, 54 soil samples were obtained. The three subsamples at each point were analyzed individually, and their mean value was used to represent the soil properties of the corresponding sampling point in subsequent statistical analyses. All samples were recorded with detailed location metadata (Table 1 and Table 2, e.g., HM-10.72). Here, “HM” denotes the Huang Mei section, and the numeric value indicates the horizontal distance (m) from the sampling point to the shoreline along the transect.
Figure 3.
Field sampling and laboratory workflow. Photos show the riparian sampling transect, paired soil and plant sampling, and the main instruments used for soil physicochemical analyses.
Table 1.
Location information of soil sampling sites in Huang Shi.
Table 2.
Location information of soil sampling sites in Huang Mei.
2.3. Vegetation Data Collection
Along the Huang Shi and Huang Mei riverbanks, vegetation is dominated by herbaceous plants and was surveyed using 1 m × 1 m quadrats. To establish direct correspondence between soil and vegetation data, each soil sampling point was treated as a paired soil–vegetation sampling unit. Around each soil sampling point, three vegetation quadrats were established within the same inundation-duration zone and at comparable bank elevation in order to capture small-scale vegetation heterogeneity in the local habitat. Therefore, a total of 108 quadrats were surveyed across the two study areas. Within each quadrat, species composition, coverage, density, and abundance were recorded. For each soil sampling point, vegetation measurements from the three associated quadrats were averaged to represent the vegetation characteristics of that point. In this way, both soil variables and vegetation variables were standardized to the sampling-point level for subsequent statistical analyses. Based on the field survey data, vegetation cover, species richness, and community diversity were calculated. Equations (1)–(3) were used to determine vegetation coverage, representative species thresholds, and McNaughton’s dominance index [16]. In this study, M represents the total vegetation coverage; m denotes the coverage of an individual plant species; and S refers to the total area of the sample plot. The relative density (A) of a species is calculated as (number of individuals of the species/total number of individuals of all species) × 100%. The relative frequency (B) is defined as (frequency of the species/sum of frequencies of all species) × 100%. The relative coverage (C) is given by (coverage of the species/total coverage of all species) × 100%. The importance value of species *i* (Qi) is defined as: Qi = (density frequency of species *i*/total density frequency of all species) × 100%; Fi represents the frequency of species *i*, Here, Ki denotes the importance value of species *i*, and Ii denotes the intensity value of species *i*.
Community structure was characterized using indices of species richness, diversity, and dominance, including the Patrick index, the Shannon–Wiener index, and the Simpson index [17]. Specifically, the Patrick index (P) was employed to assess species richness, representing the total number of species present in a sample. The Shannon–Wiener index (H) was used to evaluate species diversity, reflecting the complexity of community structure. The Simpson index (D) was applied to quantify species dominance, indicating the degree to which one or a few species dominate the community. Here, S refers to the total number of species in the sample, and Pi denotes the proportion of individuals belonging to species *i* relative to the total number of individuals in the sample.
2.4. Determination of Soil Properties
The water content of the soil was determined in accordance with the Chinese Standard for Geo technical Testing Methods [18]. A representative soil sample was selected and placed in a pre-weighed container, and its initial weight was recorded. The sample was then placed in a drying oven maintained (DHG-9245A, Shanghai Yiheng Technology Instrument Co., Ltd., Shanghai, China) at 105 °C (Figure 3) and dried until a constant weight was achieved. After drying, the sample was reweighed to obtain the dry mass. The water content (W) was calculated using Formula (7), based on the mass of the moist soil (m1) and the mass of the dry soil (m2).
The soil pH value was determined via the potentiometric electrode method [19]. Briefly, soil samples were mixed with distilled water at a fixed soil-to-water mass ratio (1:2.5, w/w), followed by thorough stirring to form a homogeneous soil–water suspension. After equilibration for 30 min (a standard step to stabilize the suspension pH), a calibrated pH glass electrode was immersed into the supernatant (Figure 3) to measure the potential difference. This potential difference was automatically converted to the corresponding pH value by the internal circuitry of the pH meter (PHS-3C, Shanghai Leici Instrument Factory, Shanghai, China), which was then displayed on the instruments’ screens. The particle size distribution (PSD) of soil samples was determined using a laser diffraction particle size analyzer (Mastersizer 3000, Malvern Panalytical Ltd., Malvern, UK). Prior to analysis, air-dried samples were gently disaggregated and sieved to separate the gravel fraction (>2000 μm), which was weighed to obtain its dry-mass percentage, whereas the <2000 μm fine-earth fraction was used for laser diffraction measurement. According to the USDA particle-size classification standard, soils were divided into clay (<2 μm), silt (2–50 μm), sand (50–2000 μm), and gravel (>2000 μm) fractions [20]. Soil organic carbon (SOC) was determined following Standard HJ 615-2011 [21]. For total nitrogen (TN), soil samples were digested with alkaline potassium persulfate, and TN in the digest solution was determined by UV spectrophotometry (UV-1800, Shimadzu Corporation, Kyoto, Japan) according to Standard HJ 636-2012 [22]. Total phosphorus (TP) was analyzed following Standard HJ 632-2011 [23].
2.5. Data Statistical Analysis
To examine the bivariate relationships between inundation duration (T) and soil physicochemical properties, the distribution of T and each soil variable was first tested in SPSS 25.0 using the Shapiro–Wilk normality test. Because most variables did not meet the normality assumption, Spearman’s rank correlation was used to assess monotonic associations between T and soil variables, and the corresponding correlation coefficients (ρ) and p-values were calculated. In these analyses, the soil sampling point was treated as the statistical unit, and each point was represented by the mean of its three parallel soil subsamples.
To analyse the multivariate relationships between vegetation attributes and environmental factors, detrended correspondence analysis (DCA) was first performed to determine the appropriate ordination method. Because the length of the first DCA axis was <3 standard deviation units, partial redundancy analysis (pRDA) was selected as a linear constrained ordination method. For vegetation–environment ordination, both vegetation and environmental data were matched at the sampling-point level. Specifically, the vegetation measurements from the three quadrats associated with each soil sampling point were first averaged to obtain point-level vegetation parameters. The response matrix used in the pRDA therefore consisted of vegetation parameters at the sampling-point level, including vegetation coverage, dominance-related indices, and diversity indices, whereas the explanatory matrix consisted of the corresponding soil physicochemical variables measured at the same sampling points. Thus, both the response matrix and the environmental matrix were constructed using the sampling point as the common observational unit.
Before ordination, all explanatory variables were standardized to reduce the influence of differences in measurement scales. Since the relationships between T and soil physicochemical properties had already been examined separately, T was not included in the ordination model to avoid redundancy and reduce collinearity with soil variables. The initial environmental variables included elevation, shoreline distance, pH, soil water content (W), soil organic carbon (SOC), total nitrogen (TN), total phosphorus (TP), and soil particle-size fractions (clay, silt, sand, and gravel). Variance inflation factor (VIF) analysis was used to diagnose multicollinearity, and silt and TP were removed after screening. Elevation and shoreline distance were entered as conditional variables to control for background topographic heterogeneity. The final pRDA model therefore included pH, W, SOC, TN, clay, sand, and gravel as explanatory variables, with elevation and shoreline distance as covariates. All retained explanatory variables had VIF values below 10, indicating acceptable collinearity. The significance of the overall model, canonical axes, and individual explanatory variables was tested using Monte Carlo permutation tests with 999 permutations. All ordination analyses were conducted in Canoco 5.0, and the results were interpreted as patterns of association rather than direct causal relationships.
3. Results and Analysis
3.1. Vegetation Patterns Across Inundation-Duration Zones
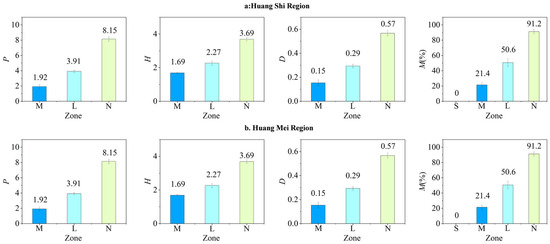
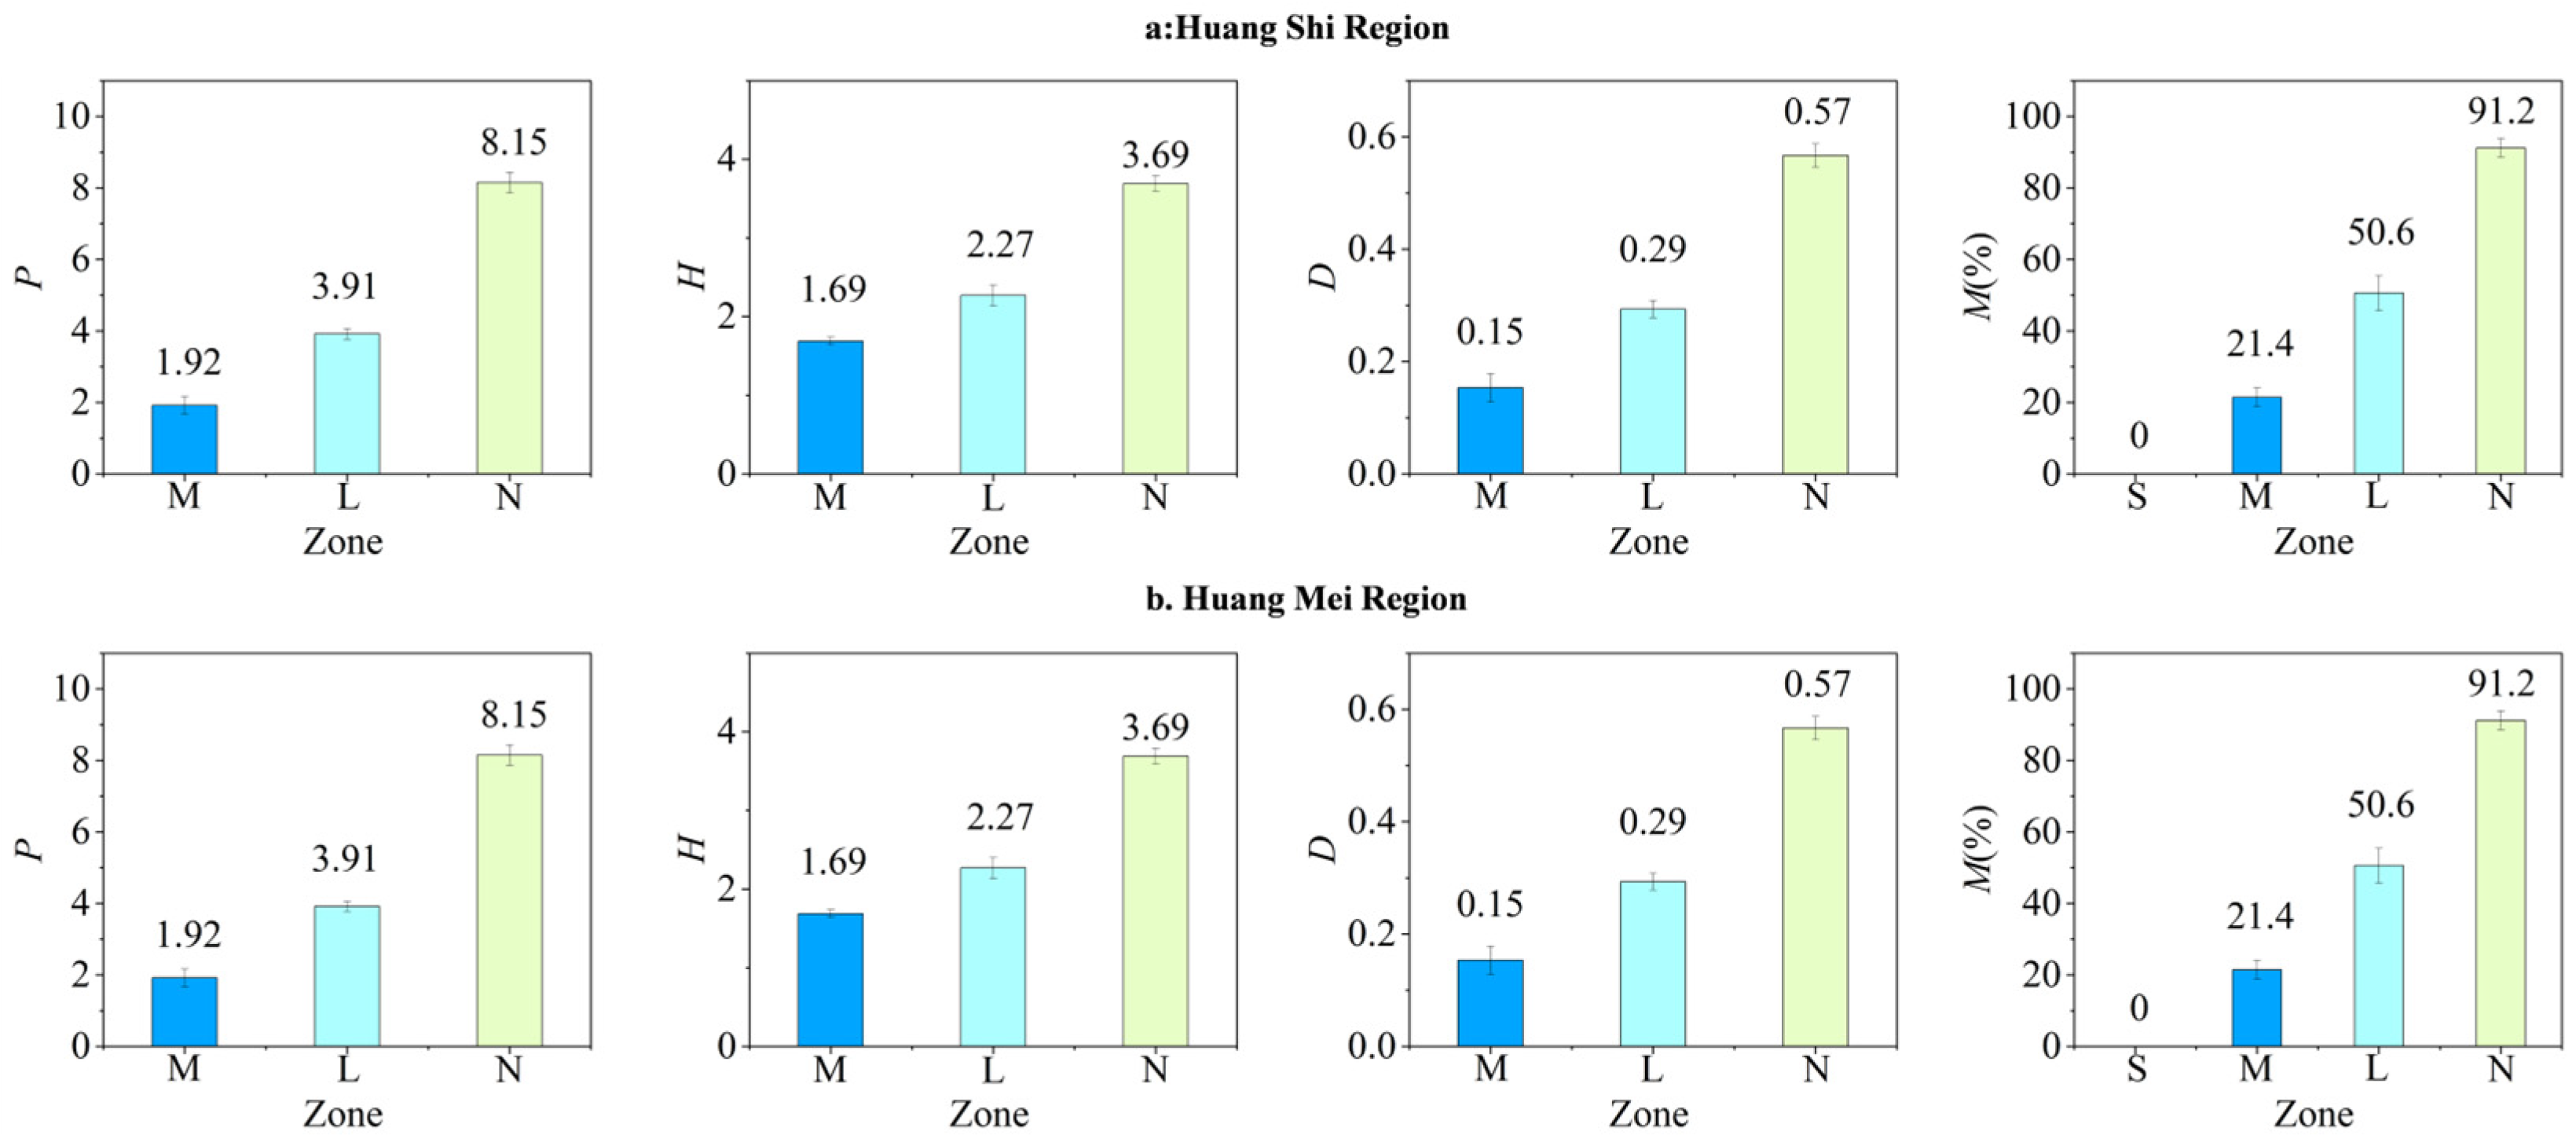
Vegetation dominance refers to the status and role of species in the community. Species with a dominance value > 0.1 are considered absolutely dominant, while those >0.01 are major dominant species [24]. For each soil sampling point, vegetation data from the three associated quadrats were first averaged to obtain point-level vegetation characteristics, and these point-level values were then summarized within different inundation-duration zones to describe zone-level vegetation patterns (Table 3; Figure 4). Using Formulas (1)–(3), vegetation parameters such as dominance and vegetation coverage were calculated for riparian vegetation. With increasing inundation duration, vegetation coverage gradually decreased from 45% in the moderate-inundation zone to 0% in the severe-inundation zone. This indicates that prolonged submergence beyond a certain threshold severely inhibits vegetation growth. This may be because prolonged inundation creates anaerobic soil conditions, and vascular plants are further threatened by hydraulic pressure and mechanical scouring [25].
Table 3.
Vegetation characteristics in different inundation-duration zones.
Figure 4.
Vegetation indices—Patrick richness (P), Shannon–Wiener diversity (H), Simpson diversity (D), and vegetation cover (M)—across inundation zones (S: severe inundation, M: moderate inundation, L: light inundation, N: non-inundated) in the Huang Shi (a) and Huang Mei (b) riparian areas.
The vegetation composition also differed among inundation-duration zones. After averaging quadrat data at the sampling-point level and summarizing them within zones, the moderate-inundation zone showed the simplest species composition, mainly including Rorippa palustris, Artemisia annua, and Rumex acetosa, whereas no vascular plants were recorded in the severe-inundation zone. In contrast, the light-inundation zone supported a richer species assemblage, including Rumex acetosa, Polygonum amplexicaul, Artemisia annua, Carex giraldiana, Cynodon dactylon, and Eleusine indica. The non-inundated zone exhibited the highest overall diversity, with dominant and accompanying species including Phragmites australis, Carex giraldiana, Eleusine indica, Cynodon dactylon, Rumex acetosa, Rorippa palustris, Polygonum amplexicaul, and Artemisia annua. This pattern indicates that inundation stress strongly constrains plant establishment and survival, while lower inundation frequency allows the development of more complex riparian plant communities [26].
The composition of plant life forms also varied with inundation duration. The moderate-inundation zone was dominated by annual herbs, whereas perennial herbs accounted for about 90% in the non-inundated zone [26]. As inundation duration decreased, the dominant species shifted from Rorippa palustris (relative area = 0.251) in the moderate-inundation zone to Rumex acetosa (0.232) in the light-inundation zone and then to Phragmites australis (0.312) in the non-inundated zone [27,28].
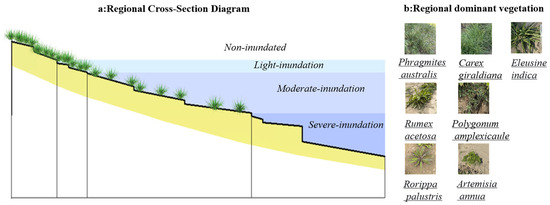
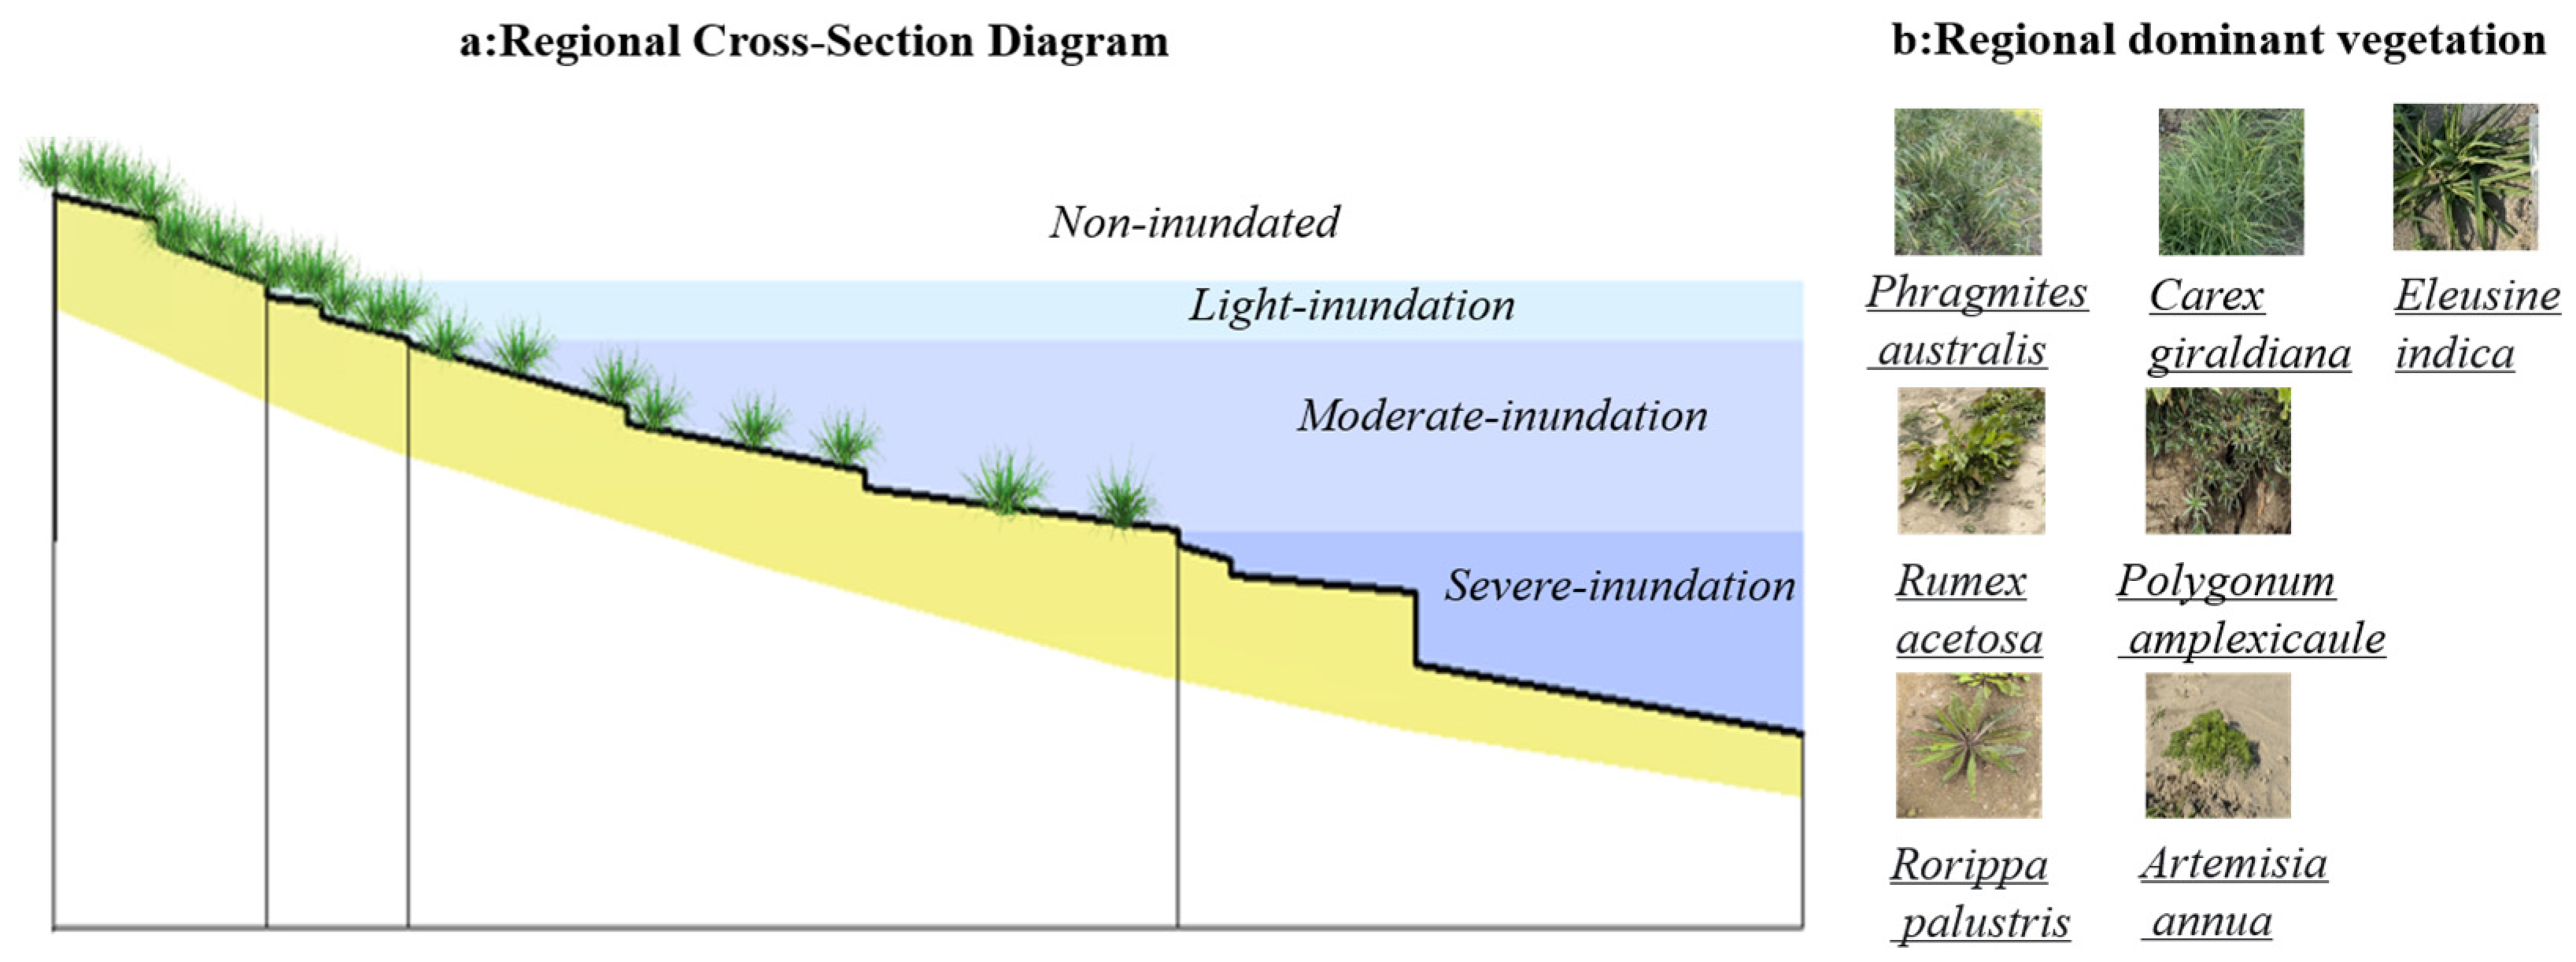
These results indicate that vegetation distribution along the riparian zone showed clear zonation characteristics under different inundation regimes. Overall, vegetation structure in the middle Yangtze River riparian zone was strongly associated with inundation intensity. Severe inundation (>200 days) resulted in near-complete vegetation loss, moderate inundation (120–200 days) supported species-poor communities with low cover, light inundation (30–120 days) allowed relatively higher diversity but still limited cover, and non-inundated zones (<30 days) supported the highest cover and a successional shift toward communities dominated by Phragmites australis and Carex giraldiana (Figure 5). Although the same general gradient pattern was observed at both sites, Huang Shi showed higher overall vegetation cover and species richness than Huang Mei, particularly in the moderate- and light-inundation zones, suggesting that local habitat conditions may also influence vegetation performance under comparable inundation duration.
Figure 5.
Schematic distribution of herbaceous vegetation along the inundation-duration gradient. Colored bands indicate the four zones (non-inundated, light inundation, moderate inundation, and severe inundation), and photographs show representative herbaceous species occurring in each zone.
3.2. Patterns of Soil Parameters with Changes in Inundation Duration
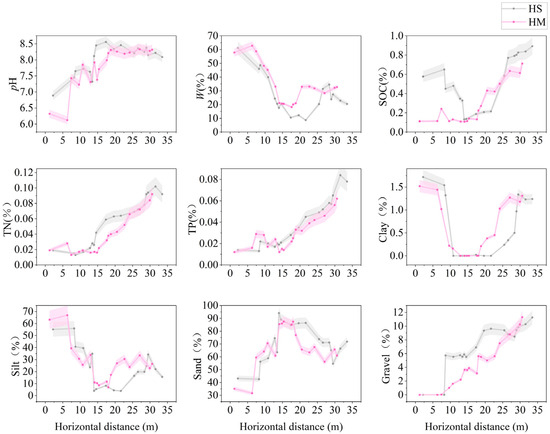
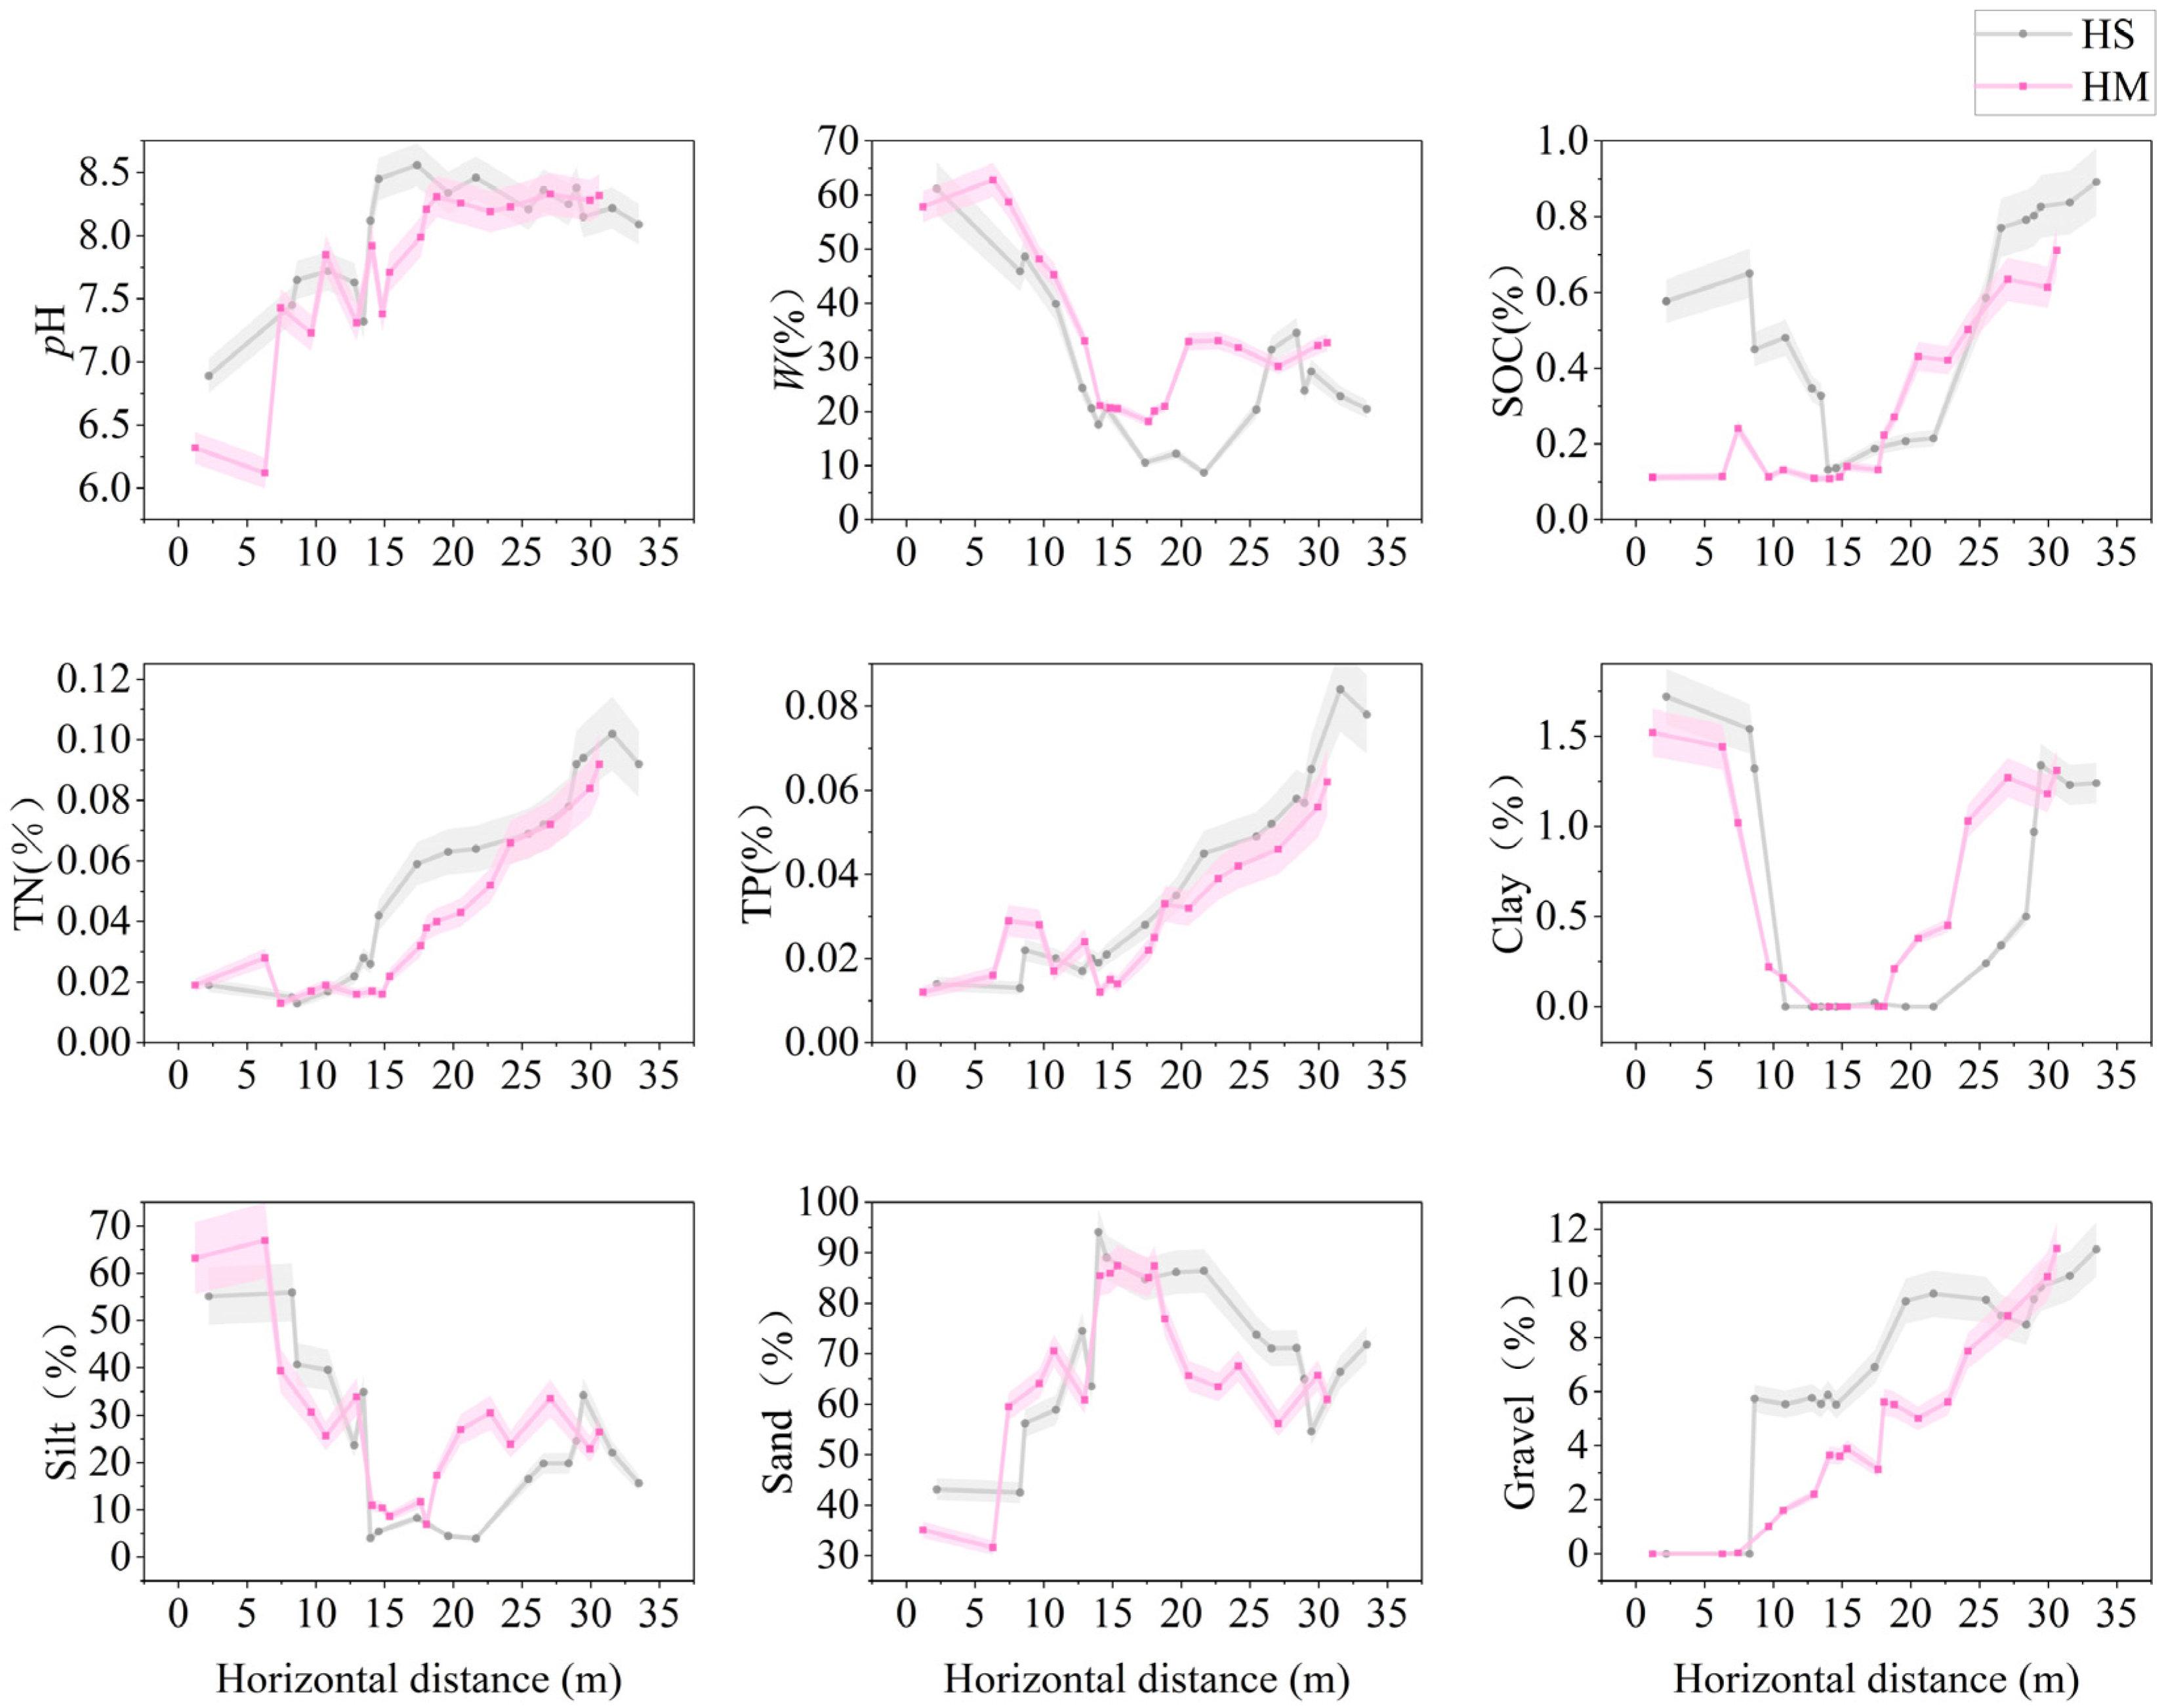
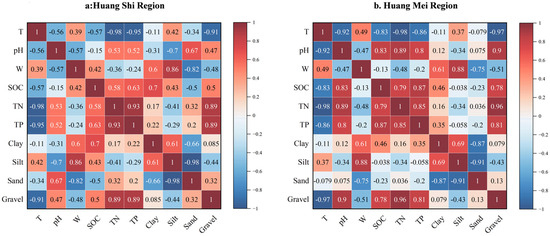
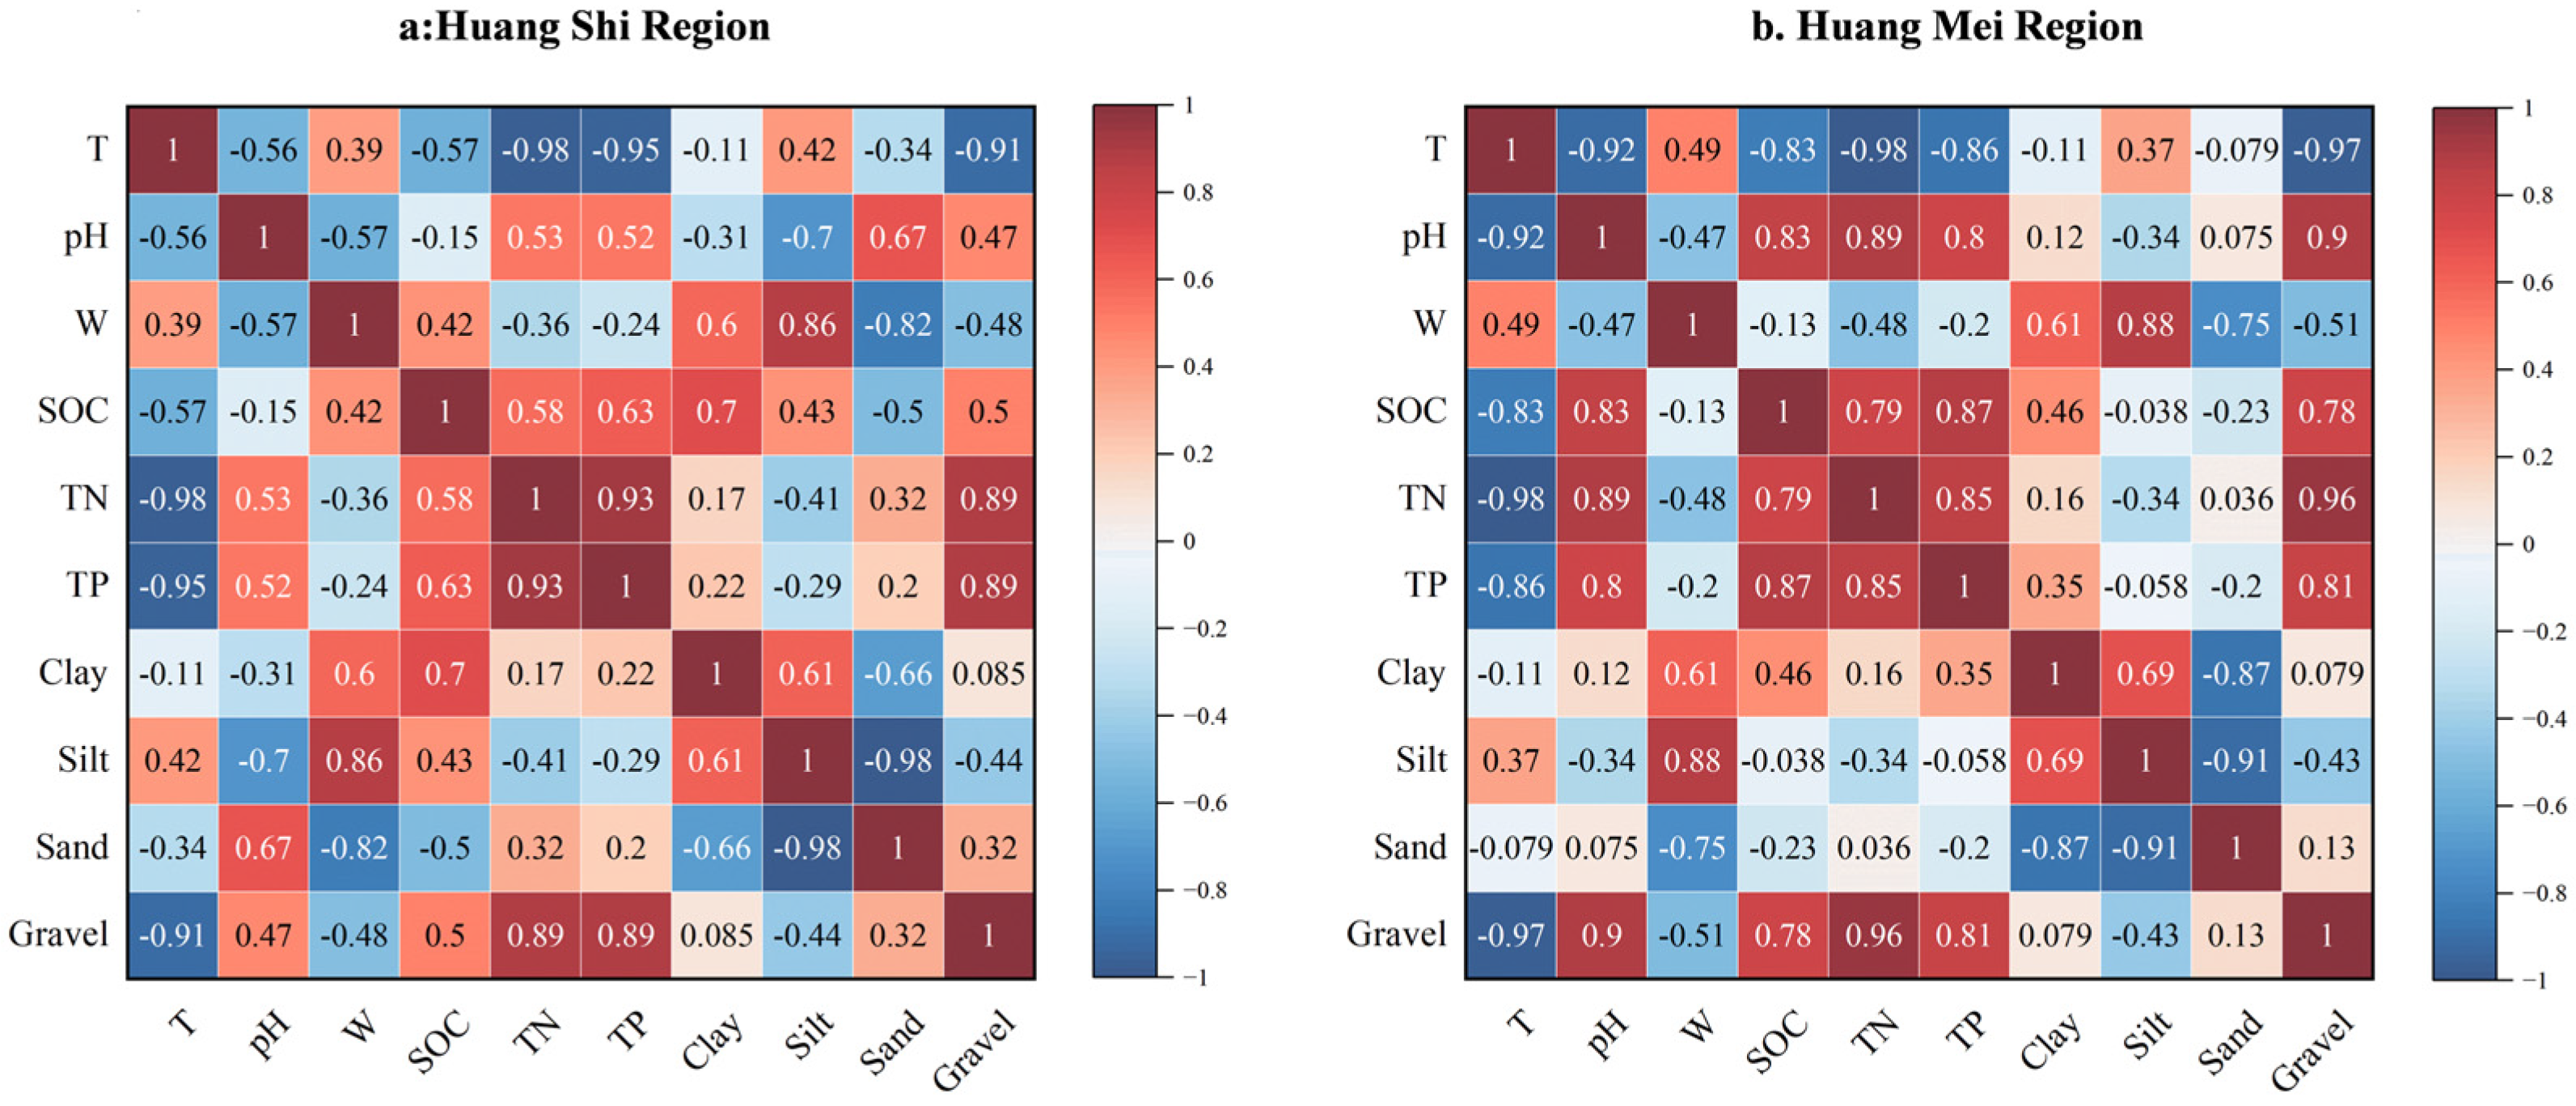
Based on laboratory assays, variation curves of soil physicochemical properties were derived for soil samples from distinct inundation zones (Figure 6), and Spearman’s rank-correlation analysis was subsequently conducted (Figure 7). Together, these results indicate that inundation duration (T) is significantly associated with multiple soil physicochemical properties, as detailed below.
Figure 6.
Spatial variation (mean ± SD) of soil physicochemical properties and particle-size fractions along the horizontal distance gradient in the Huang Shi (HS) and Huang Mei (HM) riparian zones.
Figure 7.
Spearman’s rank correlation heatmaps of inundation duration (T) and soil physicochemical properties (pH, W, SOC, TN, TP, and particle-size fractions) for the Huang Shi (a) and Huang Mei (b) riparian areas.
A significant positive association was observed between soil water content and inundation duration (T), suggesting that soil water content tends to increase with longer inundation. For example, at sampling site HS-2.2 m (T = 258 days), soil water content reached 61.2%, whereas at HS-33.49 m (T = 5 days), it was 20.48%. This pattern is consistent with the expectation that longer inundation periods are accompanied by more prolonged pore-water saturation, while longer exposure periods may enhance evaporation and reduce soil moisture [29]. Overall, soils in Severe-inundation zones maintained higher moisture, whereas Moderate-inundation zones exhibited more rapid drainage and moisture loss; when inundation duration was <150 days, soil moisture generally declined below 30%, indicating a transition from saturated to unsaturated conditions. In addition, soil pH showed a significant negative association with inundation duration. At HS-2.2 m (T = 258 days), soil pH was 6.89, while at HS-31.56 m (T = 15 days), it increased to 8.22.
Spearman rank-correlation analysis (Figure 7) further shows that T is strongly associated with several key soil properties in both study areas. In particular, T shows very strong negative correlations with soil nutrients, especially TN (Huang Shi: ρ = −0.98; Huang Mei: ρ = −0.98) and TP (Huang Shi: ρ = −0.95; Huang Mei: ρ = −0.86). The association between T and SOC differs between regions, being moderate in Huang Shi (ρ = −0.57) but strong in Huang Mei (ρ = −0.83). In line with these correlations, nutrient contents decrease along the inundation gradient: in Huang Shi, TN declines from 0.098% (non-inundated) to 0.025% (severe inundation), and SOC from 0.865% to 0.424%; in Huang Mei, TN decreases from 0.101% to 0.019%, and SOC from 0.654% to 0.153%, respectively. In addition, T covaries with soil moisture and texture-related variables, showing positive correlations with W (Huang Shi: ρ = 0.39; Huang Mei: ρ = 0.49) and silt (Huang Shi: ρ = 0.42; Huang Mei: ρ = 0.37), and strong negative correlations with gravel (Huang Shi: ρ = −0.91; Huang Mei: ρ = −0.97), suggesting coordinated changes in soil conditions along the inundation-duration gradient.
The particle-size composition of riparian soils in the Huang Shi and Huang Mei sections also shows systematic variation along the inundation-duration gradient (T), with clear zonal patterns and inter-regional differences. Overall, clay constitutes only 0–1.72% of the soil mass and contributes little in absolute terms; however, clay content is relatively higher in the Severe-inundation zone than in the other zones, indicating clay enrichment rather than clay dominance. Silt tends to increase with inundation duration (Huang Shi: ρ = 0.42; Huang Mei: ρ = 0.37), and its proportion is generally elevated in Severe-inundation soils (23.69–66.95%). Sand remains the dominant fraction (typically >60% of total mass), reaching its highest proportion in the Moderate-inundation zone (71.04–89.05%). In contrast, gravel is strongly and negatively associated with inundation duration (Huang Shi: ρ = −0.91; Huang Mei: ρ = −0.97), with lower values in heavily inundated zones (0–5.88%) and higher values in non-inundated zones (8.80–11.29%). Collectively, the four inundation zones display a consistent texture gradient: Severe-inundation soils are relatively enriched in fine fractions (clay and silt), Moderate-inundation soils are sand-rich, and Light-inundation to Non-inundated soils show a more even distribution among fractions, consistent with hydrodynamic sorting and transport processes along the riparian elevation–inundation gradient [30]. Notably, gravel content is generally higher in Huang Shi than in Huang Mei, suggesting stronger coarse-particle retention or supply in the Huang Shi riparian setting.
3.3. Relationships Between Environmental Factors and Vegetation Parameters
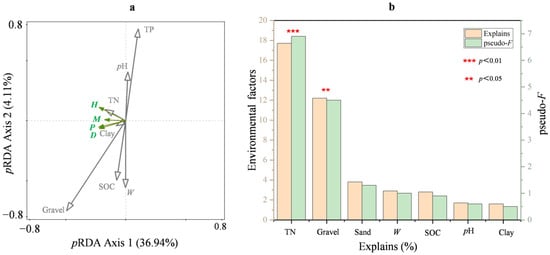
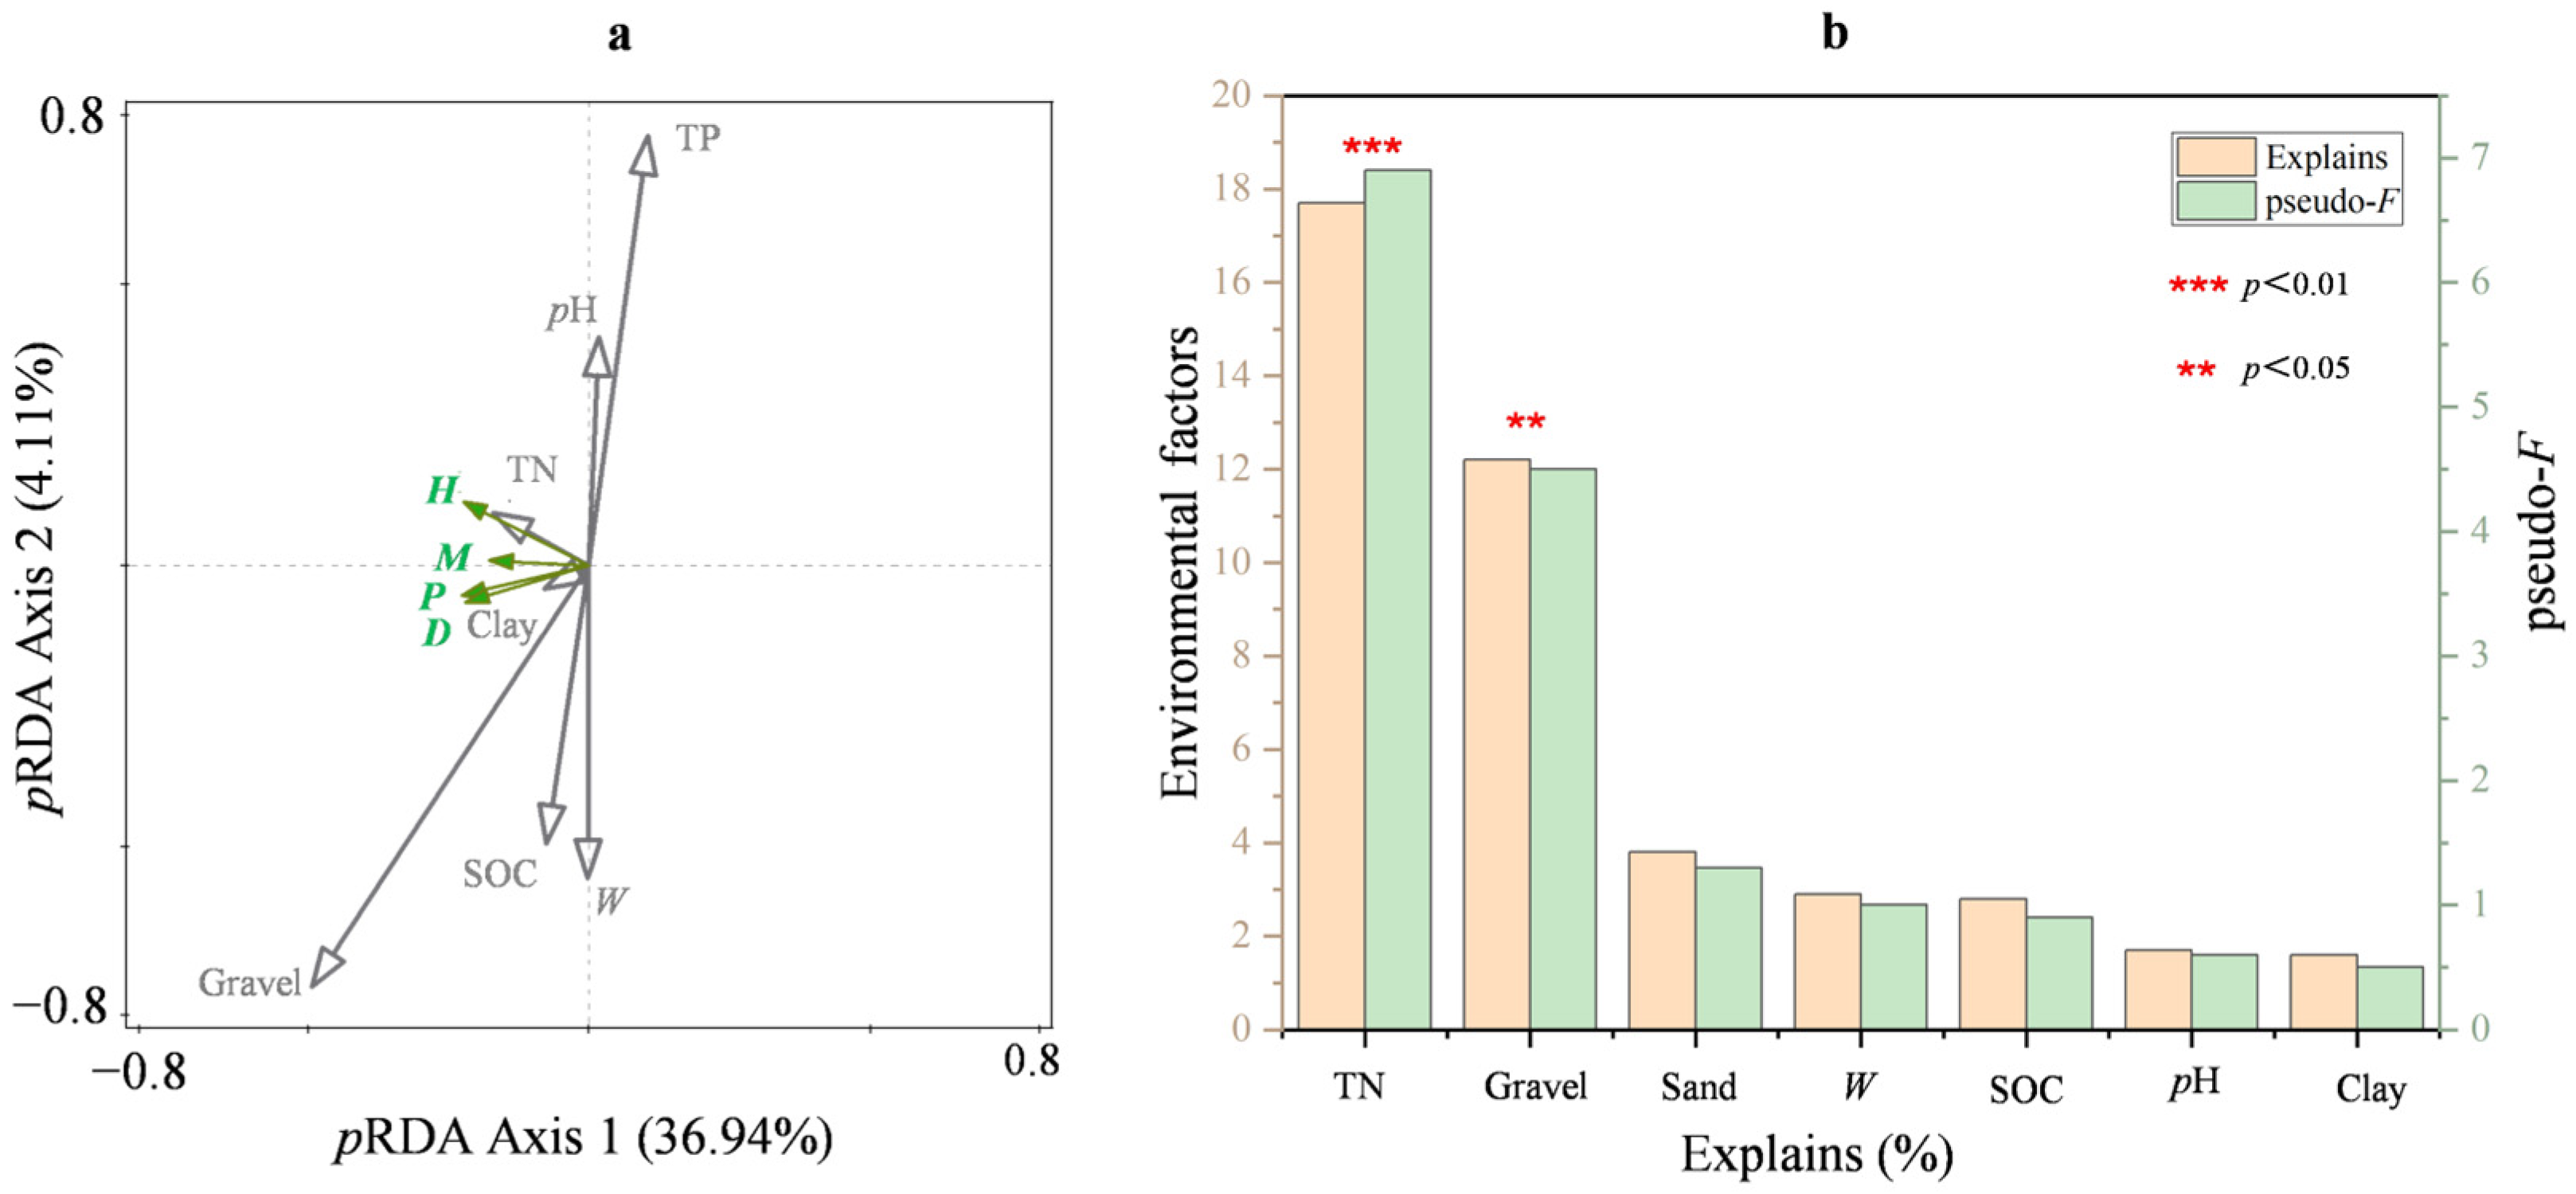
Based on the partial redundancy analysis (pRDA) ordination plot (Figure 8), after controlling for the background effects of elevation and shoreline distance, the retained environmental factors explained 43.6% of the variation in vegetation characteristics, with an adjusted explained variation of 28.4%. The first canonical axis explained 36.94% of the cumulative constrained variation, whereas the second axis explained an additional 4.11%, indicating that Axis 1 represented the major vegetation–environment gradient.
Figure 8.
pRDA ordination of vegetation and environmental factors (a) and the explanatory power of environmental factors, with significance indicated by permutation-test p values (b).
The ordination biplot showed that the retained environmental factors differed in their associations with vegetation characteristics. Among them, TN and gravel were the main significant explanatory factors. Simple term effects indicated that TN explained 17.7% of the variation in vegetation characteristics (pseudo-F = 6.9, p= 0.007), making it the strongest significant explanatory factor in the final model. Gravel explained 12.2% of the variation (pseudo-F = 4.5, p = 0.027) and was also significant. In contrast, sand explained only 3.8% of the variation (p = 0.260), while W (2.9%, p = 0.334), SOC (2.8%, p = 0.354), pH (1.7%, p = 0.494), and clay (1.6%, p = 0.554) showed weak and non-significant independent associations.
Although W did not show a significant independent contribution in the final pRDA model, its vector in the ordination still suggested an association with the main vegetation–environment gradient. Excessively high soil water content may be associated with reduced root aerobic respiration and nutrient uptake, which could help explain its relationship with vegetation characteristics [31,32]. Similarly, pH showed only a weak contribution and low statistical significance, suggesting that its direct association with vegetation characteristics was limited in the study area and may instead be indirect through its influence on soil nutrient availability, for example by reducing phosphorus availability under alkaline conditions [33]. Among the measured factors, TN showed the clearest association with vegetation variation, consistent with its relatively strong explanatory power and significant simple-term effect. This result suggests that nutrient status was closely associated with vegetation patterns. In addition, gravel emerged as another significant explanatory factor, and its relatively high explanatory power suggests that coarse-particle content was closely associated with soil physical structure and habitat conditions for riparian vegetation establishment and growth.
Overall, the pRDA results indicated that, after removing the confounding effects of topographic heterogeneity, soil total nitrogen and gravel content were the principal environmental factors associated with vegetation characteristics, whereas the independent associations of sand, W, SOC, pH, and clay were comparatively limited. These findings suggest that vegetation patterns in the riparian zone were more strongly related to soil nutrient conditions and coarse-particle composition than to the other measured environmental factors.
4. Discussion
4.1. Inundation Duration as a Primary Filter of Riparian Vegetation
The field survey showed a clear decline in vegetation occurrence, coverage, and diversity with increasing inundation duration, indicating that prolonged flooding acted as a strong environmental filter in the riparian zone. In the severe-inundation zone, no vascular plant community was recorded, whereas the moderate-, light-, and non-inundated zones supported progressively higher vegetation cover and richer species composition. This pattern suggests that when inundation duration exceeds the tolerance range of most species, only a very limited number of flood-tolerant plants can persist, mainly through dormancy, rapid regeneration, or other avoidance strategies [34,35]. This result is consistent with previous studies showing that flooding duration is a major constraint on riparian vegetation recovery and community simplification in drawdown environments [36,37,38,39,40]. In the present study, the zonal distribution of vegetation also supports this interpretation: species were absent from the most strongly flooded sites, sparse in the moderate-inundation zone, and more abundant in the light- and non-inundated zones. Therefore, inundation duration should be regarded as a primary determinant of whether vegetation can establish in the first place, while the structure of communities that do establish is further associated with local substrate and soil conditions.
4.2. Soil–Vegetation Relationships Along the Inundation Gradient
Although inundation duration was the primary factor associated with vegetation occurrence across zones, the results also indicated that vegetation variation was related to differences in soil conditions under different inundation regimes. Along the inundation gradient, prolonged flooding was associated with higher soil moisture and generally less favorable nutrient and substrate conditions, whereas reduced flooding stress corresponded to greater vegetation coverage and diversity. The pRDA further showed that, after controlling for elevation and shoreline distance, environmental factors explained a considerable proportion of the variation in vegetation characteristics, with TN and gravel emerging as the main explanatory variables. Taken together, these results suggest that vegetation patterns in the middle Yangtze riparian zone were mainly associated with variation in nutrient availability and substrate structure under different inundation conditions, rather than directly demonstrating a complete causal pathway among inundation, soil, and vegetation.
High soil moisture may reduce soil aeration and thereby constrain root oxygen supply and nutrient uptake [31,32], whereas the weak contribution of pH suggests that its role in vegetation differentiation was likely indirect, for example through its influence on nutrient availability [35]. By contrast, the stronger contribution of TN indicates that nutrient status was closely associated with vegetation differentiation across zones, while gravel likely reflected substrate structure and microsite stability important for plant establishment. This interpretation is consistent with regional studies showing that moderate inundation can support vegetation development under suitable habitat conditions [12], and that flooding stress interacts with edaphic conditions to influence riparian habitat quality [13]. Overall, the present results, together with previous studies, support the view that soil nutrient availability and substrate structure are important environmental correlates of riparian vegetation variation along inundation gradients.
4.3. Restoration Strategies for Riverfront Zones
Restoration implications should be linked to observed species distribution and hydromorphological feasibility. In the present study, no vegetation was recorded in the severe-inundation zone, indicating that this zone is unsuitable for direct large-scale planting. Here, priority should be given to bank stability, erosion risk, and substrate condition; vegetation measures should only be considered after site stability is improved [41,42,43,44]. The moderate-inundation zone is a more realistic target for staged restoration, but species selection should be limited to taxa actually recorded in the field, such as Rorippa palustris, Artemisia annua, and Rumex acetosa. The light-inundation and non-inundated zones showed higher restoration feasibility because they already supported greater vegetation cover and species richness. In these zones, restoration should prioritize natural recovery supplemented by locally observed species, including Carex giraldiana, Cynodon dactylon, and Phragmites australis. More broadly, successful riparian restoration depends not only on vegetation measures but also on hydrological connectivity and suitable site conditions [45]. In addition, restoration planning should be compatible with channel dynamics and hydromorphological processes, rather than relying on planting alone [46].
5. Conclusions
This study showed that inundation duration was strongly associated with riparian habitat differentiation along the middle reaches of the Yangtze River. Vegetation occurrence, coverage, and diversity decreased with increasing inundation duration, and no vascular plants were recorded in the severe-inundation zone, indicating that prolonged flooding imposed strong constraints on vegetation establishment. Inundation duration was also significantly associated with several soil physicochemical properties, with longer inundation generally corresponding to higher soil moisture and less favorable nutrient and substrate conditions. After controlling for elevation and shoreline distance, the pRDA further showed that TN and gravel were the main soil environmental factors associated with vegetation variation. Overall, the present study separately revealed inundation–soil associations and soil–vegetation relationships in the riparian zone of the middle Yangtze River. These findings provide a more cautious empirical basis for riparian ecological restoration and suggest that restoration planning should account for inundation stress, substrate conditions, and site-specific vegetation composition.
Author Contributions
Conceptualization, S.H., Z.Z., W.Z. and X.C.; Methodology, S.H., Z.Z., W.Z. and X.C.; Software, R.Z. and W.L.; Validation, S.H., R.Z. and W.L.; Formal analysis, S.H. and R.Z.; Investigation, S.H., R.Z. and W.L.; Resources, H.X.; Writing—original draft, R.Z.; Writing—review & editing, S.H. and H.X.; Supervision, S.H. and H.X.; Project administration, H.X.; Funding acquisition, H.X. All authors have read and agreed to the published version of the manuscript.
Funding
This research was supported by the National Key R&D Program of China (2025YFE0123000), the Joint Funds of the National Nature Science Foundation of China (No. U22A20232), the National Natural Science Foundation of China (No. 42407272, No. 52578409), the Hubei Provincial Central Guidance Local Science and Technology Development Project (2025CSA123), the Innovation Research Group Project of the Hubei Provincial Department of Science and Technology (No. 2025AFA020), and the Innovation Research Team Project of the Hubei Provincial Department of Science and Technology (T2024006).
Institutional Review Board Statement
Not applicable.
Informed Consent Statement
Not applicable.
Data Availability Statement
The data that support the findings of this study are available from the corresponding author upon reasonable request.
Conflicts of Interest
The authors declare that they have no known competing financial interests or personal relationships that could have appeared to influence the work reported in this paper.
References
- Zou, F.; Li, J.Q.; Han, L.L.; Ma, Y.T.; Wang, B.H.; Ge, G.; Wu, L. Response of soil microbial activity to interannual hydrological changes in the Poyang Lake wetland. J. Lake Sci. 2019, 31, 551–559. [Google Scholar]
- Zhao, K.P. Effects of Seasonal Flooding on Vegetation and Soil Nutrients in Typical River Tender Beaches of the Middle and Lower Reaches of the Yellow River. Master’s Thesis, Henan University, Kaifeng, China, 2024. (In Chinese) [Google Scholar]
- Gregory, S.V.; Swanson, F.J.; McKee, W.A.; Cummins, K.W. An ecosystem perspective of riparian zones: Focus on links between land and water. BioScience 1991, 41, 540–551. [Google Scholar] [CrossRef] [Scilit]
- Junk, W.J.; Bayley, P.B.; Sparks, R.E. The flood pulse concept in river–floodplain systems. In Proceedings of the International Large River Symposium (LARS); Canadian Special Publication of Fisheries and Aquatic Sciences; Dodge, D.P., Ed.; Canadian Science Publishing: Ottawa, ON, Canda, 1989; Volume 106, pp. 110–127. [Google Scholar]
- Nilsson, C.; Svedmark, M. Basic principles and ecological consequences of changing water regimes: Riparian plant communities. Environ. Manag. 2002, 30, 468–480. [Google Scholar] [CrossRef] [Scilit]
- Garssen, A.G.; Baattrup-Pedersen, A.; Voesenek, L.A.C.J.; Verhoeven, J.T.A.; Soons, M.B. Riparian plant community responses to increased flooding: A meta-analysis. Glob. Change Biol. 2015, 21, 2881–2890. [Google Scholar] [CrossRef] [Scilit]
- Fu, B.; Burgher, I. Riparian vegetation NDVI dynamics and its relationship with climate, surface water and groundwater in the Three Gorges Reservoir area. J. Arid. Environ. 2015, 113, 59–68. [Google Scholar] [CrossRef] [Scilit]
- Shen, Y.; Cheng, R.; Xiao, W.; Zeng, L.; Wang, L.; Sun, P.; Chen, T. Temporal dynamics of soil nutrients in the riparian zone: Effects of water fluctuations after construction of the Three Gorges Dam. Ecol. Indic. 2022, 139, 108865. [Google Scholar] [CrossRef] [Scilit]
- Ye, C.; Chen, C.; Butler, O.M.; Rashti, M.R.; Esfandbod, M.; Du, M.; Zhang, Q. Spatial and temporal dynamics of nutrients in riparian soils after operation of the Three Gorges Reservoir, China. Sci. Total Environ. 2019, 664, 841–850. [Google Scholar] [CrossRef] [Scilit] [PubMed]
- Han, J.Q.; Sun, Z.H.; Yang, Y.P. Variation characteristics of flood and dry water levels in the middle reaches of the Yangtze River after the operation of the Three Gorges Reservoir. J. Lake Sci. 2017, 29, 1217–1226. [Google Scholar]
- IUSS Working Group WRB. World Reference Base for Soil Resources 2022, 4th ed.; International Union of Soil Sciences (IUSS): Vienna, Austria, 2022. [Google Scholar]
- Chen, Z.L.; Yuan, X.Z.; Roß-Nickoll, M.; Hollert, H.; Schäffer, A. Moderate inundation stimulates plant community assembly in the drawdown zone of China’s Three Gorges Reservoir. Environ. Sci. Eur. 2020, 32, 113. [Google Scholar] [CrossRef] [Scilit]
- Liu, Y.; Ma, M.H.; Ran, Y.G.; Yi, X.M.; Wu, S.J.; Huang, P. Disentangling the effects of edaphic and vegetational properties on soil aggregate stability in riparian zones along a gradient of flooding stress. Geoderma 2021, 385, 114883. [Google Scholar] [CrossRef] [Scilit]
- Yangtze River Water Resources Commission Hydrological Bureau. Yangtze River Hydrological Network. Available online: http://www.cjh.com.cn/swyb_syqbg.html (accessed on 1 February 2026).
- Zhang, J.Y.; Zhou, Z.; Ye, X. Study on the allelopathic potential of Carex thunbergii on three Poaceae species. Acta Prataculturae Sin. 2020, 29, 103–111. [Google Scholar]
- Li, Y.; Wang, D.M.; Xin, Z.B.; Wang, J.; Ren, Y. Vegetation diversity and soil characteristics in different inundation zones of the Lijiang River aquatic–terrestrial ecotone. Acta Ecol. Sin. 2015, 35, 5121–5130. [Google Scholar]
- Jiang, W.; Pan, H.M.; Yang, N.; Xiao, H.L. Inundation duration as a dominant constraint on riparian vegetation recovery. Sci. Total Environ. 2023, 904, 166427. [Google Scholar] [CrossRef] [Scilit] [PubMed]
- GB/T 50123-2019; Standard for Geotechnical Testing Methods. National Standard of the People’s Republic of China: Beijing, China, 2019.
- HJ 1147-2020; Water Quality—Determination of pH—Electrode Method. Ministry of Ecology and Environment of the People’s Republic of China: Beijing, China, 2021.
- Soil Survey Staff. Soil Survey Manual; USDA Handbook No. 18; United States Department of Agriculture: Washington, DC, USA, 1951.
- HJ 615-2011; Soil—Determination of Organic Carbon—Potassium Dichromate Oxidation Spectrophotometric Method. Ministry of Ecology and Environment of the People’s Republic of China: Beijing, China, 2011.
- HJ 636-2012; Water Quality—Determination of Total Nitrogen—Alkaline Potassium Persulfate Digestion UV Spectrophotometric Method. Ministry of Ecology and Environment of the People’s Republic of China: Beijing, China, 2012.
- HJ 632-2011; Soil—Determination of Total Phosphorus by Alkali Fusion–Mo-Sb Anti Spectrophotometric Method. Ministry of Ecology and Environment of the People’s Republic of China: Beijing, China, 2012.
- Jiang, W.; Zha, Z.X.; Xiao, H.L. Phenotypic plasticity and adaptation strategies of absolute dominant vegetation in the hydro-fluctuation belt of Guanyinyan Reservoir on the Jinsha River. J. Lake Sci. 2024, 36, 261–273. [Google Scholar]
- Guo, Y.; Shen, Y.F.; Cheng, R.M.; Xiao, W.F.; Yang, S.; Wang, L.J. Effects of sustained waterlogging stress on photosynthetic characteristics and physiological and biochemical properties of Pinus elliottii. For. Res. 2021, 34, 141–148. [Google Scholar]
- Jiang, Q.; Qiu, D.P.; Wang, Z.; Li, Z.; Yao, X. Research progress on local adaptation in plants. Plant Sci. J. 2021, 39, 559–570. [Google Scholar]
- Solari, L.; Van Oorschot, M.; Belletti, B.; Hendriks, D.; Rinaldi, M.; Vargas-Luna, A. Advances in modelling riparian vegetation–hydromorphology interactions. River Res. Appl. 2016, 32, 164–178. [Google Scholar] [CrossRef] [Scilit]
- Du, H.X.; Wang, L.; Zhang, J. Root system characteristics of Phragmites australis in urban riparian zones and their relationships with water and soil factors. Grassl. Turf 2024, 44, 134–143. [Google Scholar]
- Wei, X.S. Mechanism and Prediction-Early Warning Research on Rainfall-Induced Shallow Landslides in the Qinling-Daba Mountain Area. Master’s Thesis, Chang’an University, Xi’an, China, 2020. (In Chinese) [Google Scholar]
- Feng, Z.Y.; Deng, A.J.; Le, M.H.; Lv, R.R.; Tang, Y. Calculation method for ultimate scour of pebble-sand mixed riverbed based on the bed load exchange process. Adv. Eng. Sci. 2025, 2025, 1–12. [Google Scholar]
- Li, X.; Yu, J.; Li, F.; Hu, C.; Zeng, J. Effects of different water levels and competition patterns on the ecological stoichiometric characteristics of typical wetland vegetation. J. Lake Sci. 2019, 31, 1651–1661. [Google Scholar]
- Yi, Y.J.; Xie, H.Y.; Song, J.; Yang, Z.F. Simulation of suitable habitats for vegetation communities in the Yellow River Estuary salt marsh wetlands II: Application. J. Hydraul. Eng. 2021, 52, 401–408. [Google Scholar]
- Pradhan, A.K.; Shandilya, Z.M.; Sarma, P.; Bora, R.K.; Regon, P.; Vemireddy, L.N.R.; Tanti, B. Concurrent effects of aluminum toxicity and phosphorus deficiency on root growth of aluminum-tolerant and sensitive rice cultivars. Acta Physiol. Plant. 2019, 41, 109. [Google Scholar] [CrossRef] [Scilit]
- Baskin, C.; Baskin, J.M.; Chester, E.W. Effect of inundation on the annual dormancy cycle and on germination of seeds of the summer annual Schoenoplectus purshianus (Cyperaceae). Aquat. Bot. 2000, 67, 109–116. [Google Scholar] [CrossRef] [Scilit]
- Hendry, G.A.F.; Crawford, R.M. Oxygen and environmental stress in plants—An overview. Proc. R. Soc. Edinb. Sect. B Biol. Sci. 1994, 102, 1–17. [Google Scholar] [CrossRef] [Scilit]
- Bashar, K.K.; Tareq, M.Z.; Amin, M.R.; Honi, U.; Tahjib-Ul-Arif, M.; Sadat, M.A.; Hossen, Q.M.M. Phytohormone-mediated stomatal response, escape and quiescence strategies in plants under flooding stress. Agronomy 2019, 9, 43. [Google Scholar] [CrossRef] [Scilit]
- Loreti, E.; van Veen, H.; Perata, P. Plant responses to flooding stress. Curr. Opin. Plant Biol. 2016, 33, 64–71. [Google Scholar] [CrossRef] [Scilit]
- Visser, E.J.W.; Voesenek, L.A.C.J.; Vartapetian, B.B. Flooding and plant growth. Ann. Bot. 2003, 91, 107–109. [Google Scholar] [CrossRef] [Scilit]
- Matzke, M.A.; Matzke, A.J.M.; Pruss, G.J.; Vance, V.B. RNA-based silencing strategies in plants. Curr. Opin. Genet. Dev. 2001, 11, 221–227. [Google Scholar] [CrossRef] [Scilit]
- Su, X.L.; Nilsson, C.; Pilotto, F.; Liu, S.; Shi, S.; Zeng, B. Soil erosion and deposition in the new shorelines of the Three Gorges Reservoir. Sci. Total Environ. 2017, 599–600, 1485–1492. [Google Scholar] [CrossRef] [Scilit] [PubMed]
- Xiang, M.L.; Ji, F.; Xu, N.; Huang, Y.; Zhang, T.; Gao, W.; Li, J.; Cui, Y. Ecological water level regulation based on aquatic plant restoration in large reservoirs: A case study of Wangying Reservoir. Ecohydrol. Hydrobiol. 2025, 25, 438–445. [Google Scholar] [CrossRef] [Scilit]
- Zheng, J.; Arif, M.; Zhang, S.L.; Yuan, Z.X.; Zhang, L.M.; Li, J.; Ding, D.; Li, C. Dam inundation simplifies plant community composition. Sci. Total Environ. 2021, 801, 149827. [Google Scholar] [CrossRef] [Scilit] [PubMed]
- Lei, B.; Wang, Y.C.; You, Y.F.; Zhang, S.; Yang, C.H. Diversity and structure of herbaceous plant communities in typical water-level-fluctuation zones with different elevation gradients in the Three Gorges Reservoir. J. Lake Sci. 2014, 26, 600–606. [Google Scholar]
- Rong, Y.; Liu, J.; Liu, Q. Types of ecological revetments in hydraulic engineering. J. Landsc. Res. 2018, 10, 1–4. [Google Scholar]
- Hohensinner, S. River morphology, channelization, and habitat restoration. In Riverine Ecosystem Management; Springer: Cham, Switzerland, 2018. [Google Scholar]
- Greet, J.; Fischer, S.; Walsh, C.J.; Sammonds, M.J.; Catford, J.A. Restored river–floodplain connectivity promotes riparian tree maintenance and recruitment. For. Ecol. Manag. 2022, 506, 119952. [Google Scholar] [CrossRef] [Scilit]

Disclaimer/Publisher’s Note: The statements, opinions and data contained in all publications are solely those of the individual author(s) and contributor(s) and not of MDPI and/or the editor(s). MDPI and/or the editor(s) disclaim responsibility for any injury to people or property resulting from any ideas, methods, instructions or products referred to in the content. |
© 2026 by the authors. Licensee MDPI, Basel, Switzerland. This article is an open access article distributed under the terms and conditions of the Creative Commons Attribution (CC BY) license.