


Abstract
For a deep-buried complex cavern with complex geological conditions, it is difficult to determine the critical warning deformation of surrounding rock. A determination method for warning deformations based on rock strength is proposed to study the warning status of the surrounding rock of the Baihetan left-bank underground powerhouse. Three warning levels—blue, yellow, and red—are numerically established based on crack initiation stress, dilatancy stress, and uniaxial compressive strength of the rock mass. These warning deformations are influenced not only by the critical stresses but also by the cavern shape, rock position, deformation properties and in situ stresses. The in situ stresses were inversely analyzed by a three-dimensional geological model orthogonal to the principal stresses and present a high determination coefficient of 0.834 with the measured results. However, the complex geological conditions could bring great uncertainties to the simulation results and significantly reduce the warning deformations. Thus, the monitored deformations that reflect these uncertainties, instead of the simulated stresses or deformations, were used to predict the warning state of the surrounding rock, which was analyzed by comparing the on-site monitored deformations with the critical warning deformations. The warning results demonstrated that the proposed methodology enables prediction of warning location, timing and grades, and 85.9% of monitoring points obtained correct warning signals.
1. Introduction
With the continuous development of underground engineering, underground caverns are increasingly encountering complex geological environments. Multiple factors, including in situ stress, rock mechanical properties, geological structures, temperature, and hydrological conditions, can significantly affect the stability of surrounding rock [1,2,3,4,5]. Due to the complex and unpredictable nature of these influencing factors, accurate prediction of surrounding rock stability during construction remains challenging. Consequently, to ensure construction safety, it is imperative to achieve rapid and precise prediction and control of surrounding rock deformation based on real-time monitoring data.
In recent years, significant research efforts have been devoted to monitoring the stability of surrounding rock in underground caverns. Current monitoring methods can be broadly categorized into geophysical methods and rock mechanics methods, distinguished by their monitoring targets and underlying principles [6]. Geophysical methods predominantly rely on the detection of various signals emitted by rock masses, including elastic waves, acoustic emissions, electromagnetic waves, and other geophysical responses, encompassing microseismic (MS) monitoring, acoustic emission (AE) techniques, electromagnetic radiation (EMR) methods, and seismic computed tomography (CT). These methodologies not only facilitate real-time monitoring but also enable predictive assessments of surrounding rock stability and potential failure mechanisms. For example, Dai et al. [2,7] investigated early warning systems through a comprehensive analysis of the evolution patterns of MS parameters. Huang et al. [8] analyzed the AE parameters based on the critical slowing down (CSD) and AE b-value theoretical methods, in order to investigate the precursor characteristics of failure in weathered granite. The MS approach is particularly effective for high-energy and low-frequency events, where a characteristic downward shift in frequency band energy distribution serves as a reliable precursor to rock burst phenomena [9,10,11]. Conversely, AE monitoring specializes in detecting low-energy, high-frequency events, with a sudden increase in acoustic emission energy providing critical warning signals for imminent rock bursts [12]. While both MS and AE techniques monitor vibration signatures from rock fracturing processes, they differ substantially in monitoring range. The MS technique offers superior monitoring ranges and high position accuracy, so it is applicable for regional-scale monitoring, whereas the AE technique has limited coverage and reduced position precision. Frid and Vozoff [13], Wang et al. [14,15], and He et al. [16] applied the EMR method to predict coal bumps. By analyzing the propagation characteristics of seismic waves, seismic CT technology can detect subsurface geological structures and reveal the mechanical properties of rock mass. Cai et al. [17] used it to estimate stress redistribution in rock mass and predict failure risks in surrounding rock. Wang et al. [18] developed a new rockburst strain energy index and seismic velocity tomography and investigated stress concentration and energy release before the rockburst of a coal mine. EMR signals reflect energy accumulation within rock masses, while MS signals reveal dual characteristics of stress concentration and energy release, so electromagnetic radiation and microseismic monitoring can be integrated to predict rockbursts [19].
Rock mechanics methods primarily focus on monitoring stress variations, deformation changes, and kinetic characteristics (e.g., velocity and acceleration) in surrounding rock. These methods were widely applied in stability assessments of underground caverns. The stability of surrounding rock is widely evaluated by comparing the monitored parameters with empirically determined critical warning thresholds. For example, Zhang et al. [20] thought the changes in axial load of rock bolts could reflect the stress adjustments in surrounding rock, and utilized 60–80% of the yield load of rock bolts as a warning criterion to predict the stability states of surrounding rock. Xu et al. [21] established a set of empirical kinetic warning indicators, including deformation, velocity, and acceleration, for real-time stability alerts of surrounding rock. Xu et al. [22] developed an intelligent self-feedback safety warning method for underground caverns using Backpropagation (BP) neural networks and finite element modeling (FEM). In their method, deformation of surrounding rock served as the primary warning indicator, and the deformation thresholds were defined either by standards or directly input by analysts within the program. Tian et al. [23] designed an intelligent warning system that predefines thresholds of different indicators based on national or regional standards.
However, underground geological conditions are inherently complex and unpredictable, and traditional approaches often rely on empirical knowledge. These empirical warning thresholds may fail in the stability prediction of an underground cavern under complex and unpredictable conditions. To address this limitation, several scholars have proposed some mechanics-based and data-driven warning systems that minimize empirical dependence. For instance, Chen et al. [24] put forward a Modified Deterioration Reduction Calculation (MDRC) method to determine warning deformation thresholds for large-scale underground caverns based on the strength reduction method. Lu et al. [25] recommended using vibration velocity as a rockburst warning indicator and determined its thresholds by numerical simulations. Ren et al. [1] evaluated the stability of surrounding rock by defining the initial thresholds of deformation, velocity and acceleration according to standards and experience, and then dynamically adjusted them by analyzing real-time monitoring data. The above methods do not explicitly integrate rock strength in the determination of deformation thresholds. Luo et al. [26] established a complex function method to determine the deformation thresholds based on the strength of surrounding rock and applied it to the stability assessment of the Baihetan left-bank underground caverns. Due to the simplification of geological conditions by the complex function method, they did not fully address the influence of the intricate geological structures on the deformation thresholds.
In deep underground engineering, complex geological structures such as faults, joints, and cracks have a significant impact on the stability and failure process of surrounding rocks [27,28,29,30,31]. Tang et al. [32] found that stress concentration is evident near structural discontinuities such as faults or joints, and suggested that structural planes should be the focus of rock burst monitoring. Zhou et al. [33] found that small-scale structural planes near the tunnel play an important role in controlling rock bursts in the deeply buried tunnel of Jinping II hydropower station. Fault slip can induce stress redistribution and localized energy release, potentially triggering rock failure. Li [34] introduced an innovative analytical model to quantify strain energy variations induced by fault-slip seismicity, revealing how seismic fault slip influences strain energy evolution in deep longwall mining. Zhang et al. [35] observed that while fault-slip rock bursts exhibit stress concentration, their primary characteristic is failure triggered by shear sliding. Fault-slip rock bursts primarily manifest as shear sliding failure and tensile failure [36]. The rock burst induced by structural planes is often larger and more destructive, and the study of rock bursts induced by structural planes has important engineering significance. Numerical simulation is widely used in the study of unstable rock failure and rock burst [37,38,39,40,41,42,43,44]. Meanwhile, numerical simulations can also effectively study the impact of complex geological structures on the failure of surrounding rock in underground caverns [45,46,47]. Zhang et al. [48] studied the rock damage caused by faults around a diversion tunnel and found that the main structural planes have a significant impact on the damage evolution of the surrounding rock, as well as the location of the damage. Manouchehrian and Cai [49] used the explicit finite element method (FEM) to study the influence of geological structures on rock bursts of underground caverns. Wu et al. [50] studied the excavation process of hard rock tunnels that have various structural planes and found that the rock between the structural plane and the excavation boundary will fail rapidly after excavation.
Based on the strength-related determination method of warning deformation proposed by Luo et al. [26], this study employs numerical simulation, instead of the complex function method that simplifies geological structure and three-dimensional effect, to investigate the influences of complex geological conditions on the warning deformation thresholds of underground caverns. The remainder of this article is structured as follows. Section 2 briefly introduces the principles and methodologies for determining warning deformation thresholds, as well as the determination process of warning deformation thresholds that vary with position and excavation. Section 3 displays the complex geological structures of the Baihetan hydropower station’s left-bank underground powerhouse and its in situ stress inversion analysis. Section 4 shows the simulation results of stress and deformation of the surrounding rock during construction, as well as the influence of geological structures on the deformation flexibility of the surrounding rock. Section 5 presents the application of the warning deformation determination method to the underground powerhouse and the demonstration of its feasibility and effectiveness. Finally, Section 6 summarizes some key conclusions.
2. Determination Method of Warning Deformations Related to Position and Excavation
2.1. Determination Method of Warning Deformation Based on Strength Theory
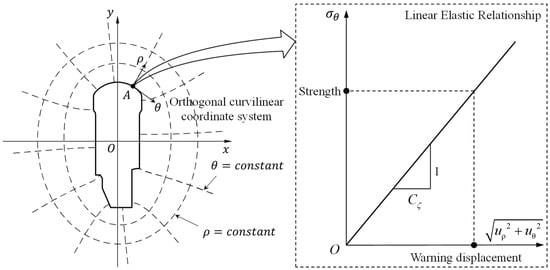
Under the assumptions of continuity, linear elasticity, homogeneity, and small deformation, and based on the linear elastic complex function theory, Luo et al. [26] demonstrated that the resultant displacement at any point on excavation boundary increases linearly with the increase in circumferential stress:
where and are coordinates in the orthogonal curvilinear coordinate system as illustrated in Figure 1, and are displacement components, is circumferential stress, and is deformation flexibility of surrounding rock. Deformation flexibility is not a material constant but is related to deformation parameters of rock mass, shape of underground cavern, in situ stresses, and position of analysis point.
Figure 1.
Relationship between stress and deformation of surrounding rock.
This equation indicates that surrounding rock deformation linearly reflects stress changes. If a stress state corresponding to a deformation does not exceed rock strength, the surrounding rock would not break; otherwise, it breaks. Thus, there is a critical deformation that is related to rock strength and can be treated as warning deformation, and the warning displacement of surrounding rock can be determined as:
where is the warning strength of surrounding rock. Thus, the warning displacement of surrounding rock can be determined by the product of warning strength and deformation flexibility.
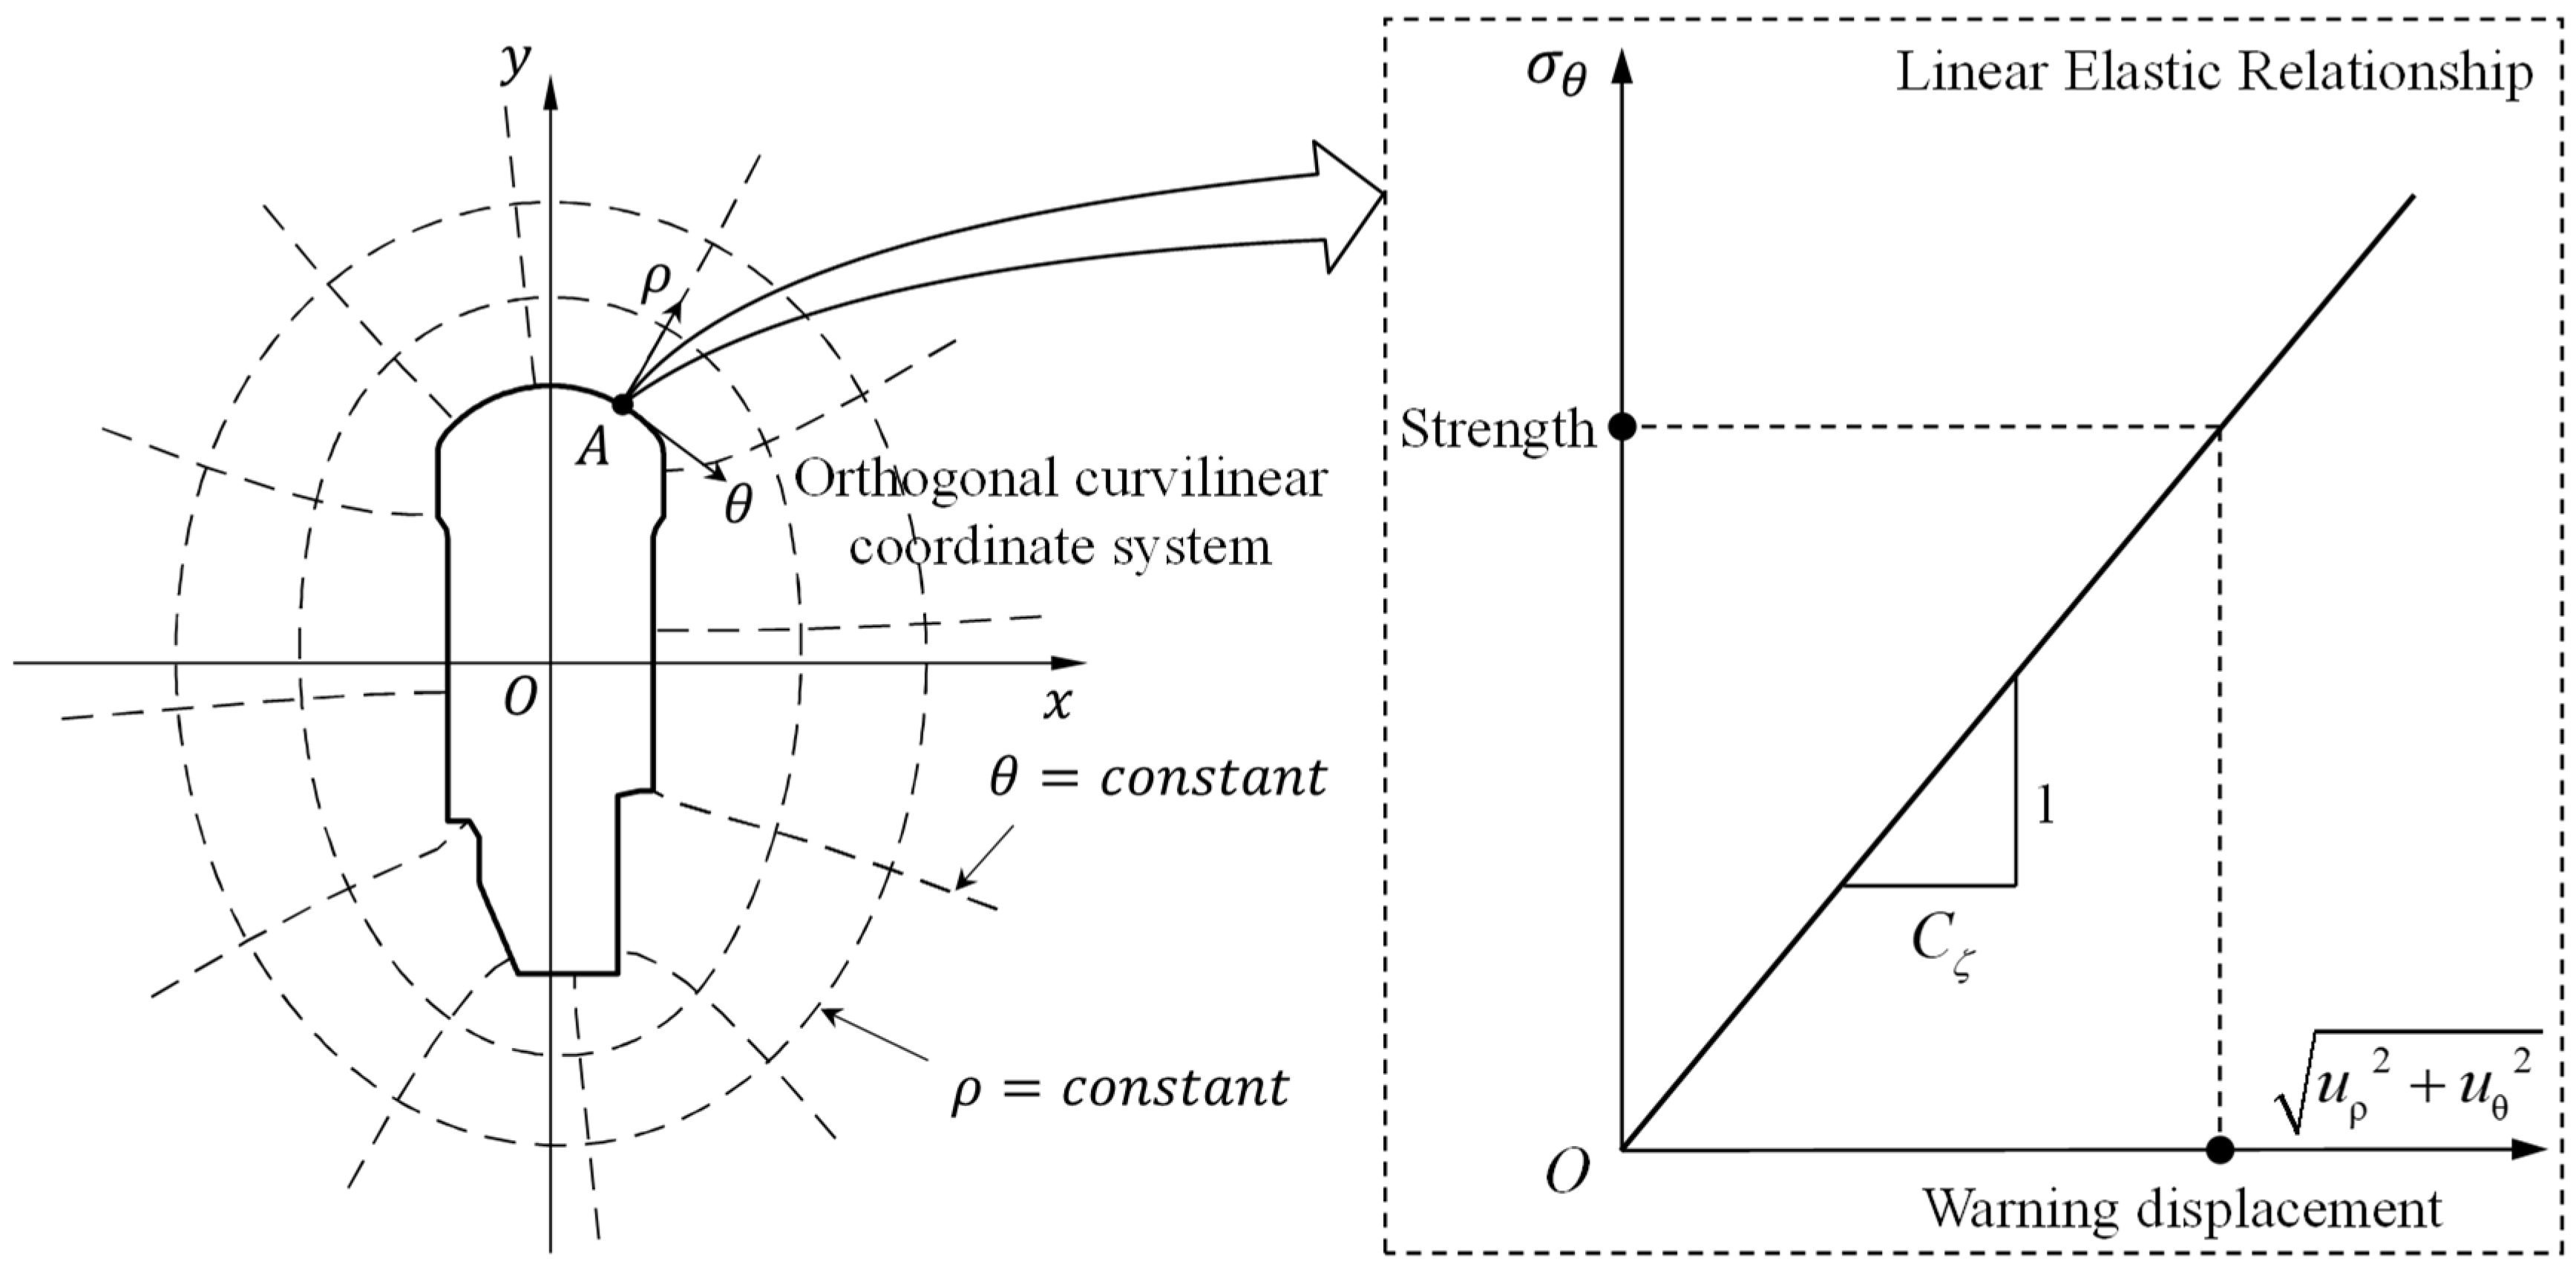
After excavation, the near-boundary stress state around underground openings can be transformed into circumferential, radial, and axial stresses. Due to the influence of excavation unloading, the radial stress is approximately equal to 0, and only circumferential and axial stresses remain. Then, under the assumption of neglecting axial stress, this study compares circumferential stress with uniaxial thresholds, as illustrated in Figure 2. The strength of rock under biaxial compression is higher than that under uniaxial compression, so using uniaxial thresholds for warning underestimates the strength of surrounding rock and also increases a certain safety reserve. Within the uniaxial compressive stress–strain curve, three key characteristic stress values can be identified sequentially: the crack initiation stress, the dilatancy stress, and the uniaxial compressive strength. These three values correspond to progressive stages of rock damage, ranging from mild to severe, and are therefore established as the stress thresholds for graded warning. Exceeding the crack initiation stress triggers the onset and propagation of microcracks, leading to irreversible deterioration. Once the dilatancy stress is surpassed, crack development accelerates, indicating a heightened damage state. When the stress reaches or exceeds the uniaxial compressive strength, cracks coalesce rapidly, forming macroscopic fractures that result in complete failure. Corresponding warning displacements at the excavation boundary are established based on these thresholds, designated as crack initiation warning displacement, dilatancy warning displacement, and failure warning displacement. These are respectively classified as blue, yellow, and red alerts, representing escalating warning levels. Together, these three displacement thresholds delineate four warning statuses for the surrounding rock: safety, blue warning, yellow warning, and red alert.
Figure 2.
Four levels of safety state determined from uniaxial compressive stress–strain curve of rock.
2.2. Implementation Process
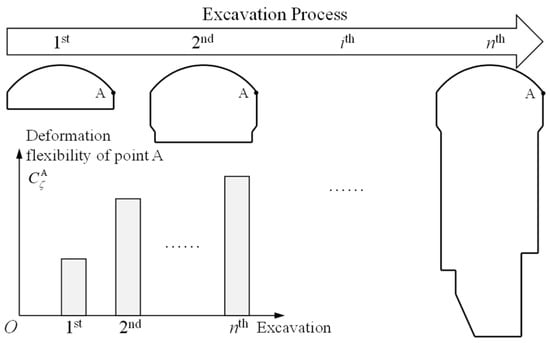
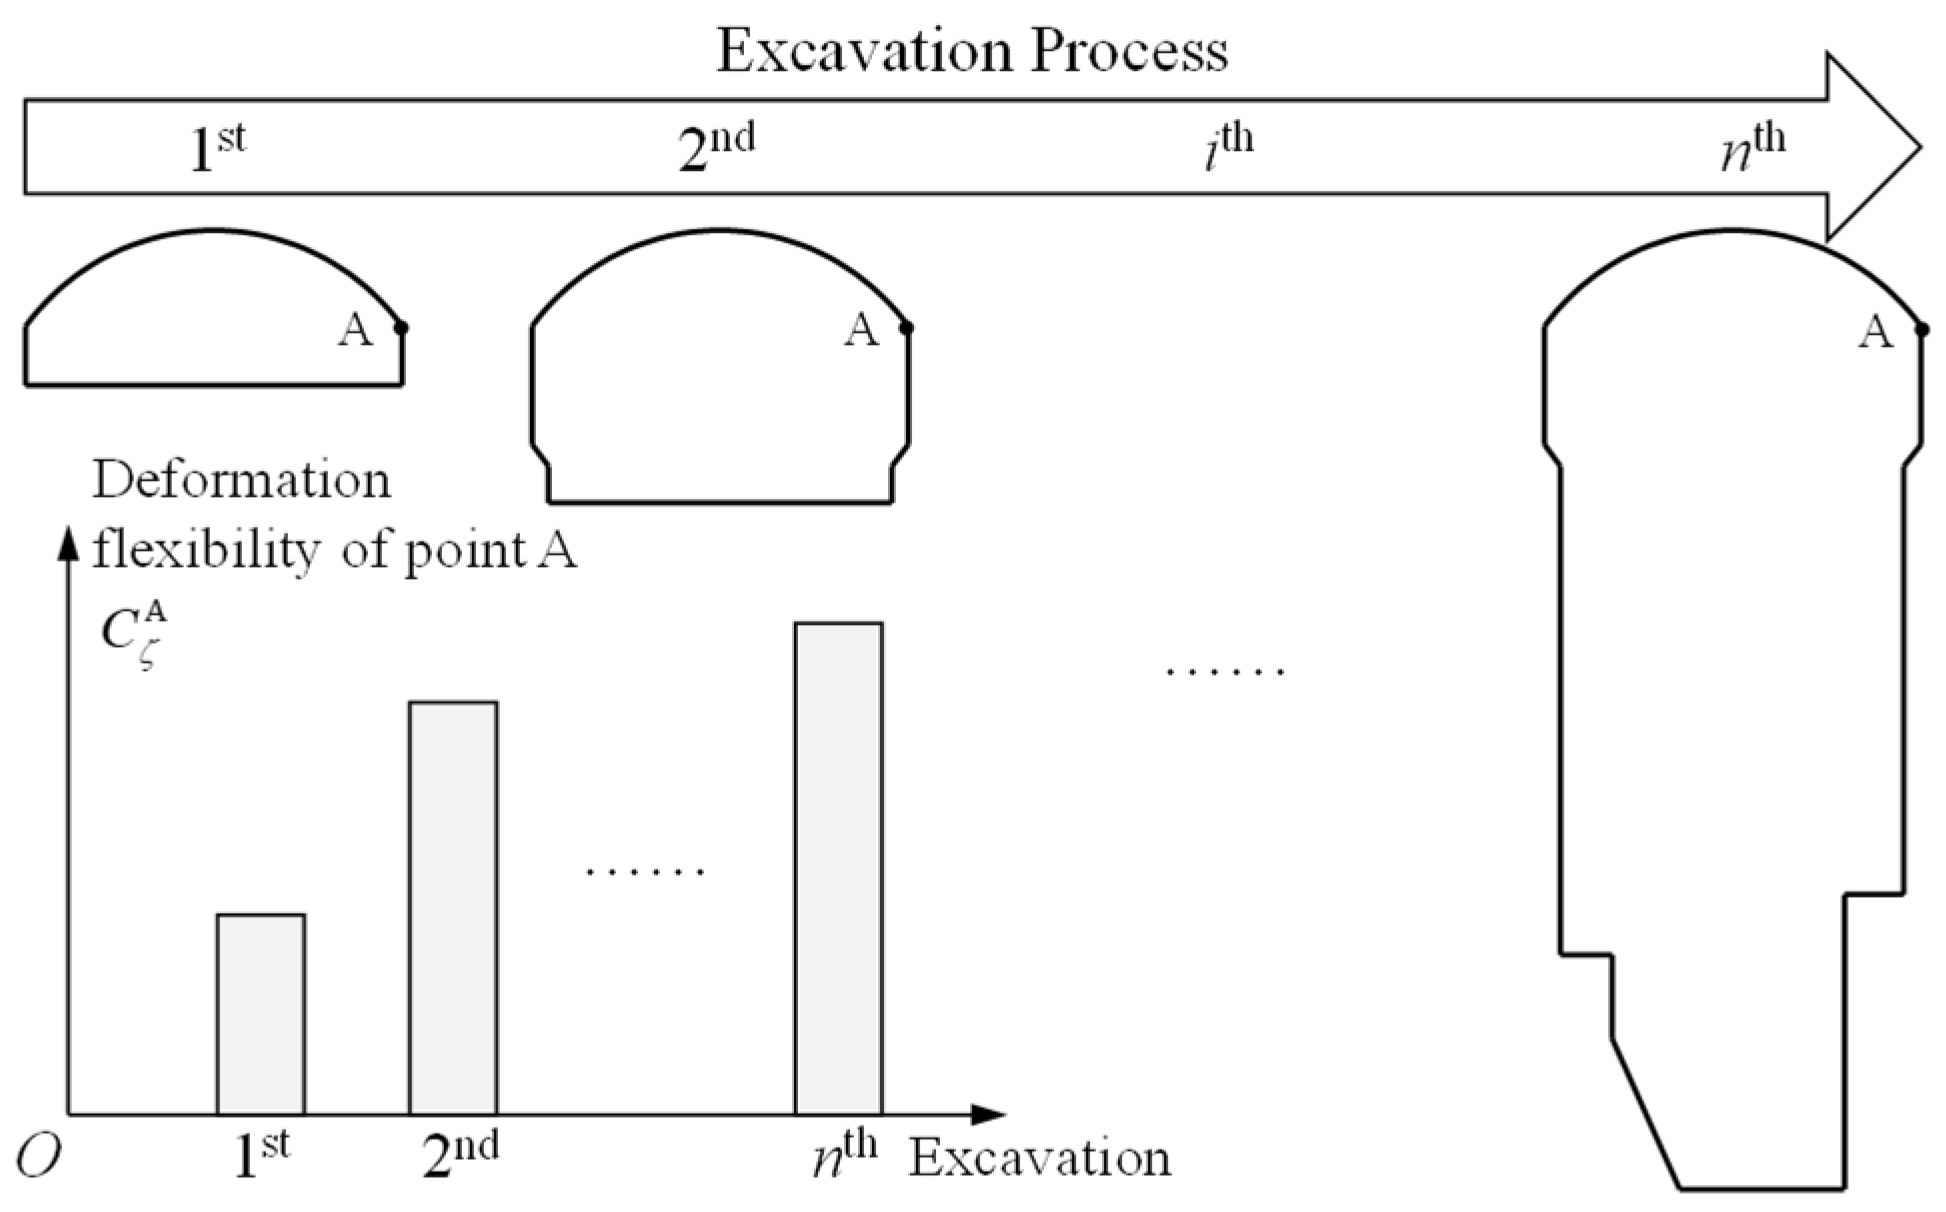
In addition to the uniaxial stress–strain curve of rock, the deformation flexibility of surrounding rock is another important factor that needs to be determined. Within an excavation step, deformation flexibility varies with point locations; similarly, for the same monitoring point, deformation flexibility varies with excavation steps. The deformation flexibility reflects the relationship between deformation and stress of surrounding rock. The purpose of introducing it is to explain why the monitored deformation is different from the simulated deformation. If the monitored deformation is greater than the simulated deformation, it indicates that the stress in the surrounding rock is greater than the simulated stress. Thus, the warning is achieved based on this concept.
A set of stress and deformation analyses with progressive excavation boundaries must be carried out for a specific cavern to solve its deformation flexibilities for each step of excavation, as shown in Figure 3. The deformation flexibility is cumulative (total) during staged excavation. After a stage of excavation, total deformation and total stress were used to calculate the deformation flexibility. For complex cavern and surrounding rock conditions, it is necessary to rely on numerical simulation to back-calculate the deformation flexibility. Luo et al. [26] conducted these analyses using the complex function theory. Here, numerical analyses were carried out in FLAC3D to consider the 3D effect and complex geological structures.
Figure 3.
Analysis of deformation flexibility for each excavation.
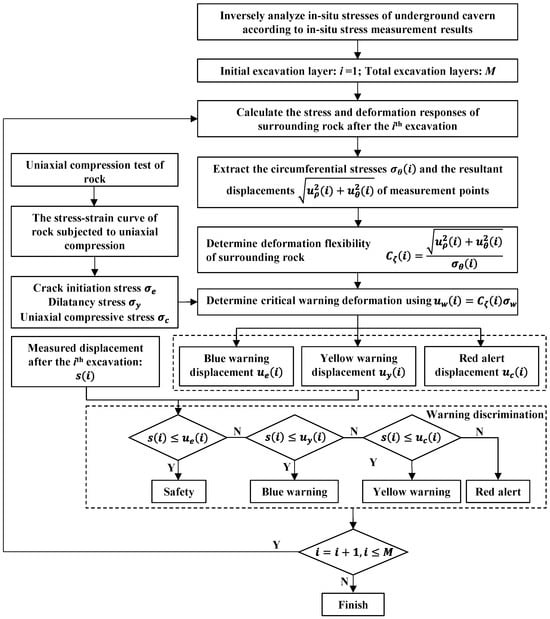
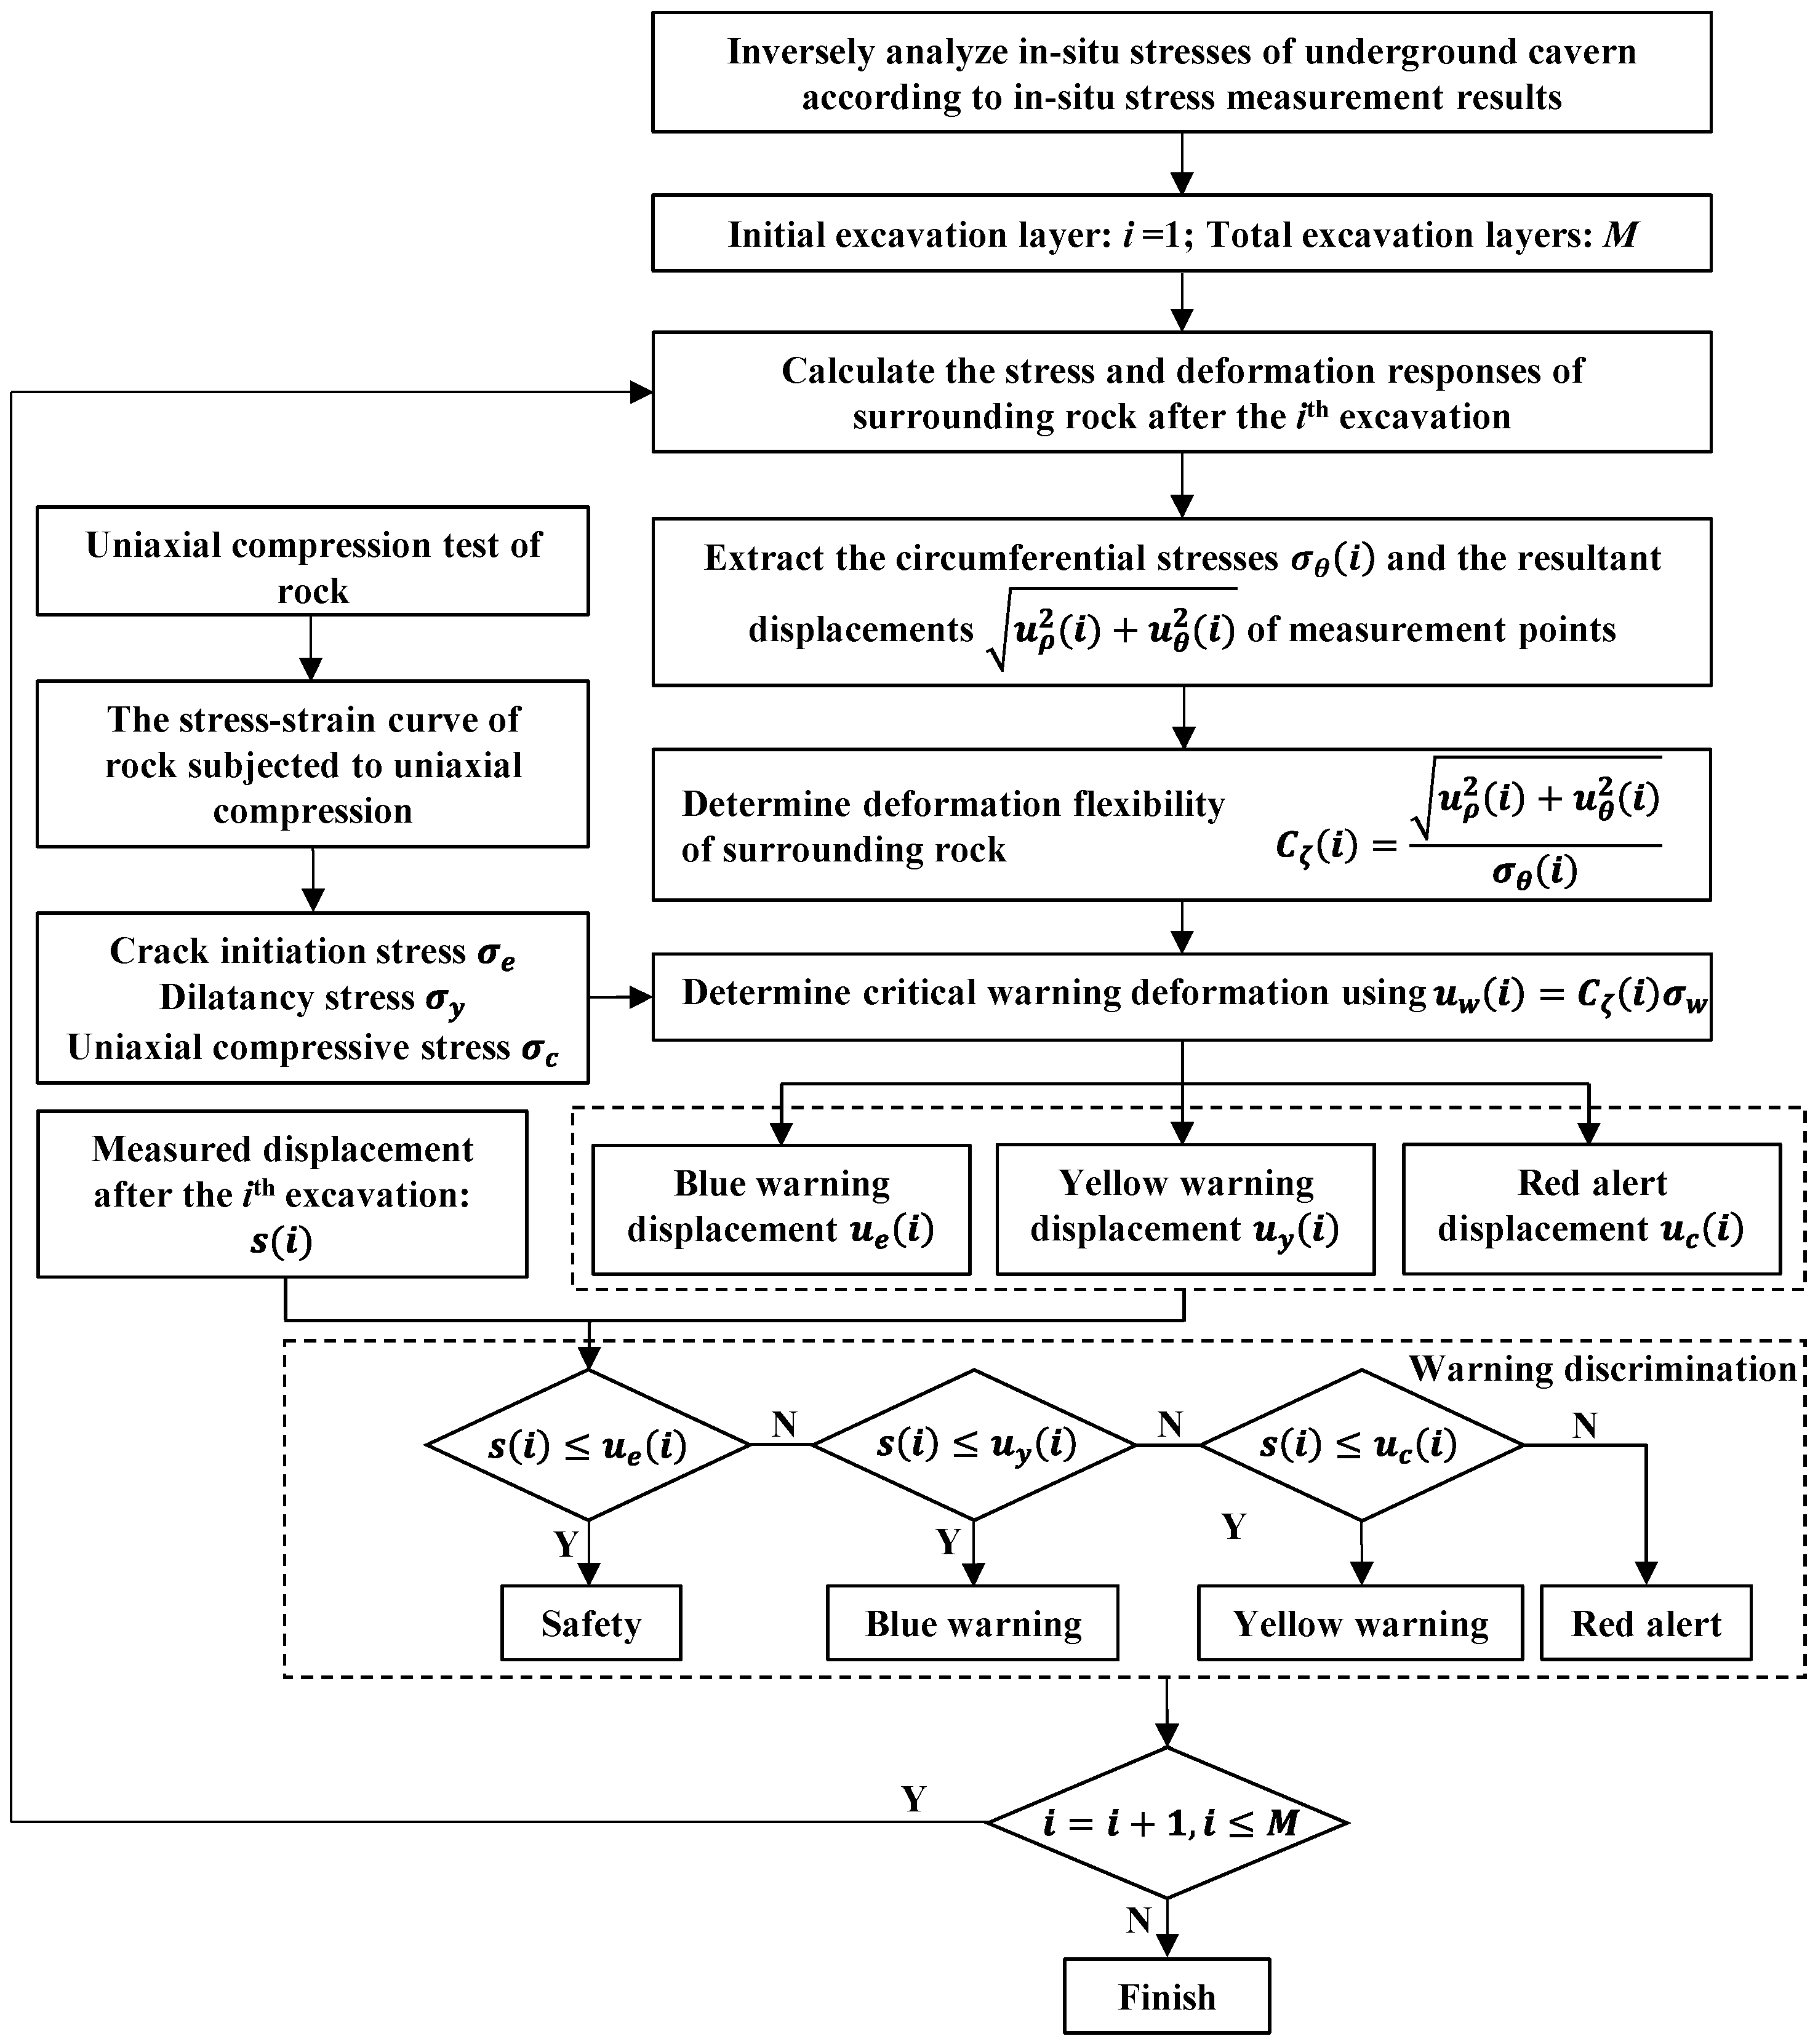
The determination process of warning deformations and on-site warning statuses is illustrated in Figure 4. In situ stress is very important for the determination of warning deformations, so boundary conditions of numerical simulation should be inversely analyzed according to the measurement results of in situ stress. Then, the simulation of excavation should be carried out to obtain the circumferential stress and resultant displacement of various points on the cavern boundary during excavation. For every excavation, the computed circumferential stress and corresponding displacement at a given point are then used to solve its deformation flexibility. By integrating the deformation flexibility and three critical rock strengths, including crack initiation stress, dilatancy stress, and uniaxial compressive strength, three warning displacements can be determined for each point on the cavern boundary. The warning status at a given point is assessed by comparing measured displacements against the corresponding warning thresholds. When the measured displacement at a monitoring point falls below its blue warning threshold, the surrounding rock is considered to be in a safe state. A measurement between the blue and yellow warning thresholds indicates a blue warning condition. If the displacement lies between the yellow and red alert thresholds, a yellow warning is triggered. Once the measured displacement exceeds the red alert threshold, the surrounding rock is classified as being in a red alert state. Because the warning displacements vary with the excavation process, the determination process of warning deformations and on-site warning statuses must be repeated for each excavation.
Figure 4.
The determination process of warning deformations and on-site warning statuses.
3. Back Analysis of In Situ Stresses for an Underground Cavern
3.1. Engineering Overview
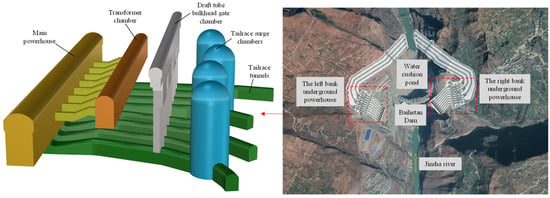
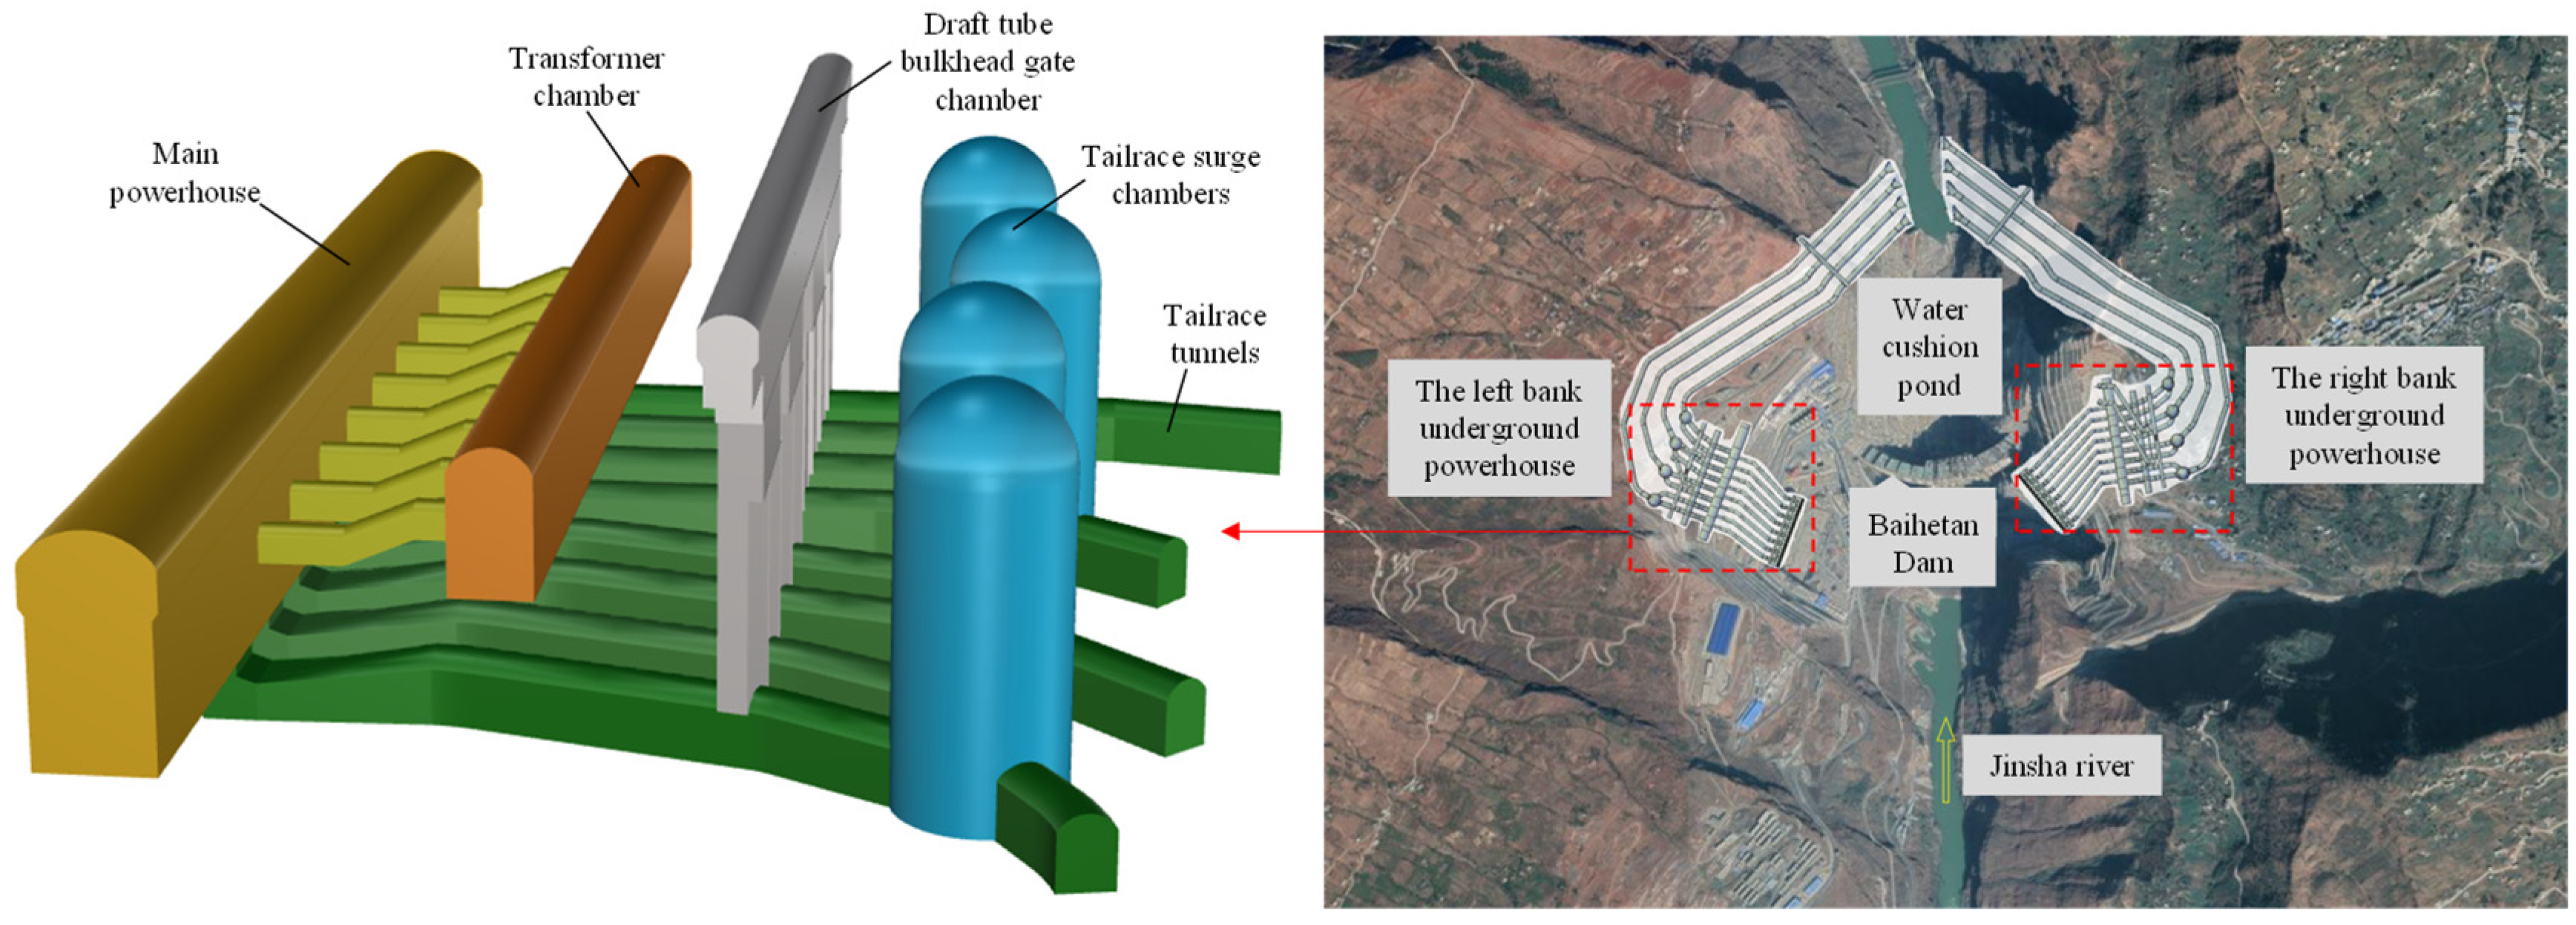
The Baihetan hydropower station is situated on the lower reaches of the Jinsha River at the border between Sichuan province and Yunnan province of China. It is the second cascade in the four-stage hydropower development plan of the Jinsha River lower reaches. The station includes underground powerhouses on both banks, and this study focuses on the left-bank underground powerhouse. As shown in Figure 5, the left-bank powerhouse comprises four major parallel caverns: the main powerhouse, the transformer chamber, the draft tube bulkhead gate chamber, and the tailrace surge chambers. Characterized by numerous interconnected caverns, large spans, and high sidewalls, these underground structures intersect both horizontally and vertically and form a colossal and intricately arranged underground cavern group. The underground powerhouse is located in the upstream mountain of the dam shoulder. The horizontal burial depth of the underground cavern group is 600–1000 m, and the vertical burial depth is 260–330 m. The axis direction of the left-bank caverns is NE20°. The main powerhouse cavern extends 438 m in length, stands 88.7 m high, and features a cross-sectional width transitioning from 31.0 m below the rock anchor beam to 34.0 m above it, while simultaneously holding the world record for the largest span of the top arch excavation. The transformer chamber extends 368 m in length with a cross-section measuring 21 m in width and 39.5 m in height, strategically positioned at a space of 60.65 m from the main and auxiliary powerhouse caverns. The draft tube bulkhead gate chamber extends 374.5 m longitudinally while featuring a span ranging from 12.1 to 15.0 m and vertical wall heights between 30.5 and 31.5 m. The tailrace surge chambers have four chambers and exhibit an excavated diameter varying from 42 to 48 m and excavation heights spanning 57.92 to 93 m vertically, and each of them serves two generating units.
Figure 5.
Schematic diagram of the underground powerhouse on the left bank.
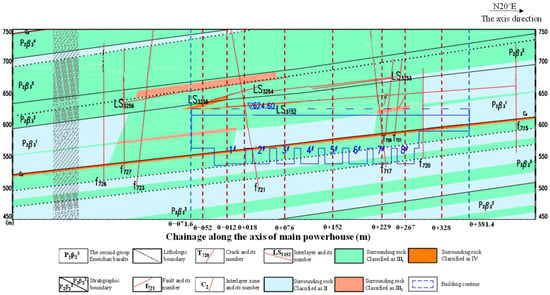
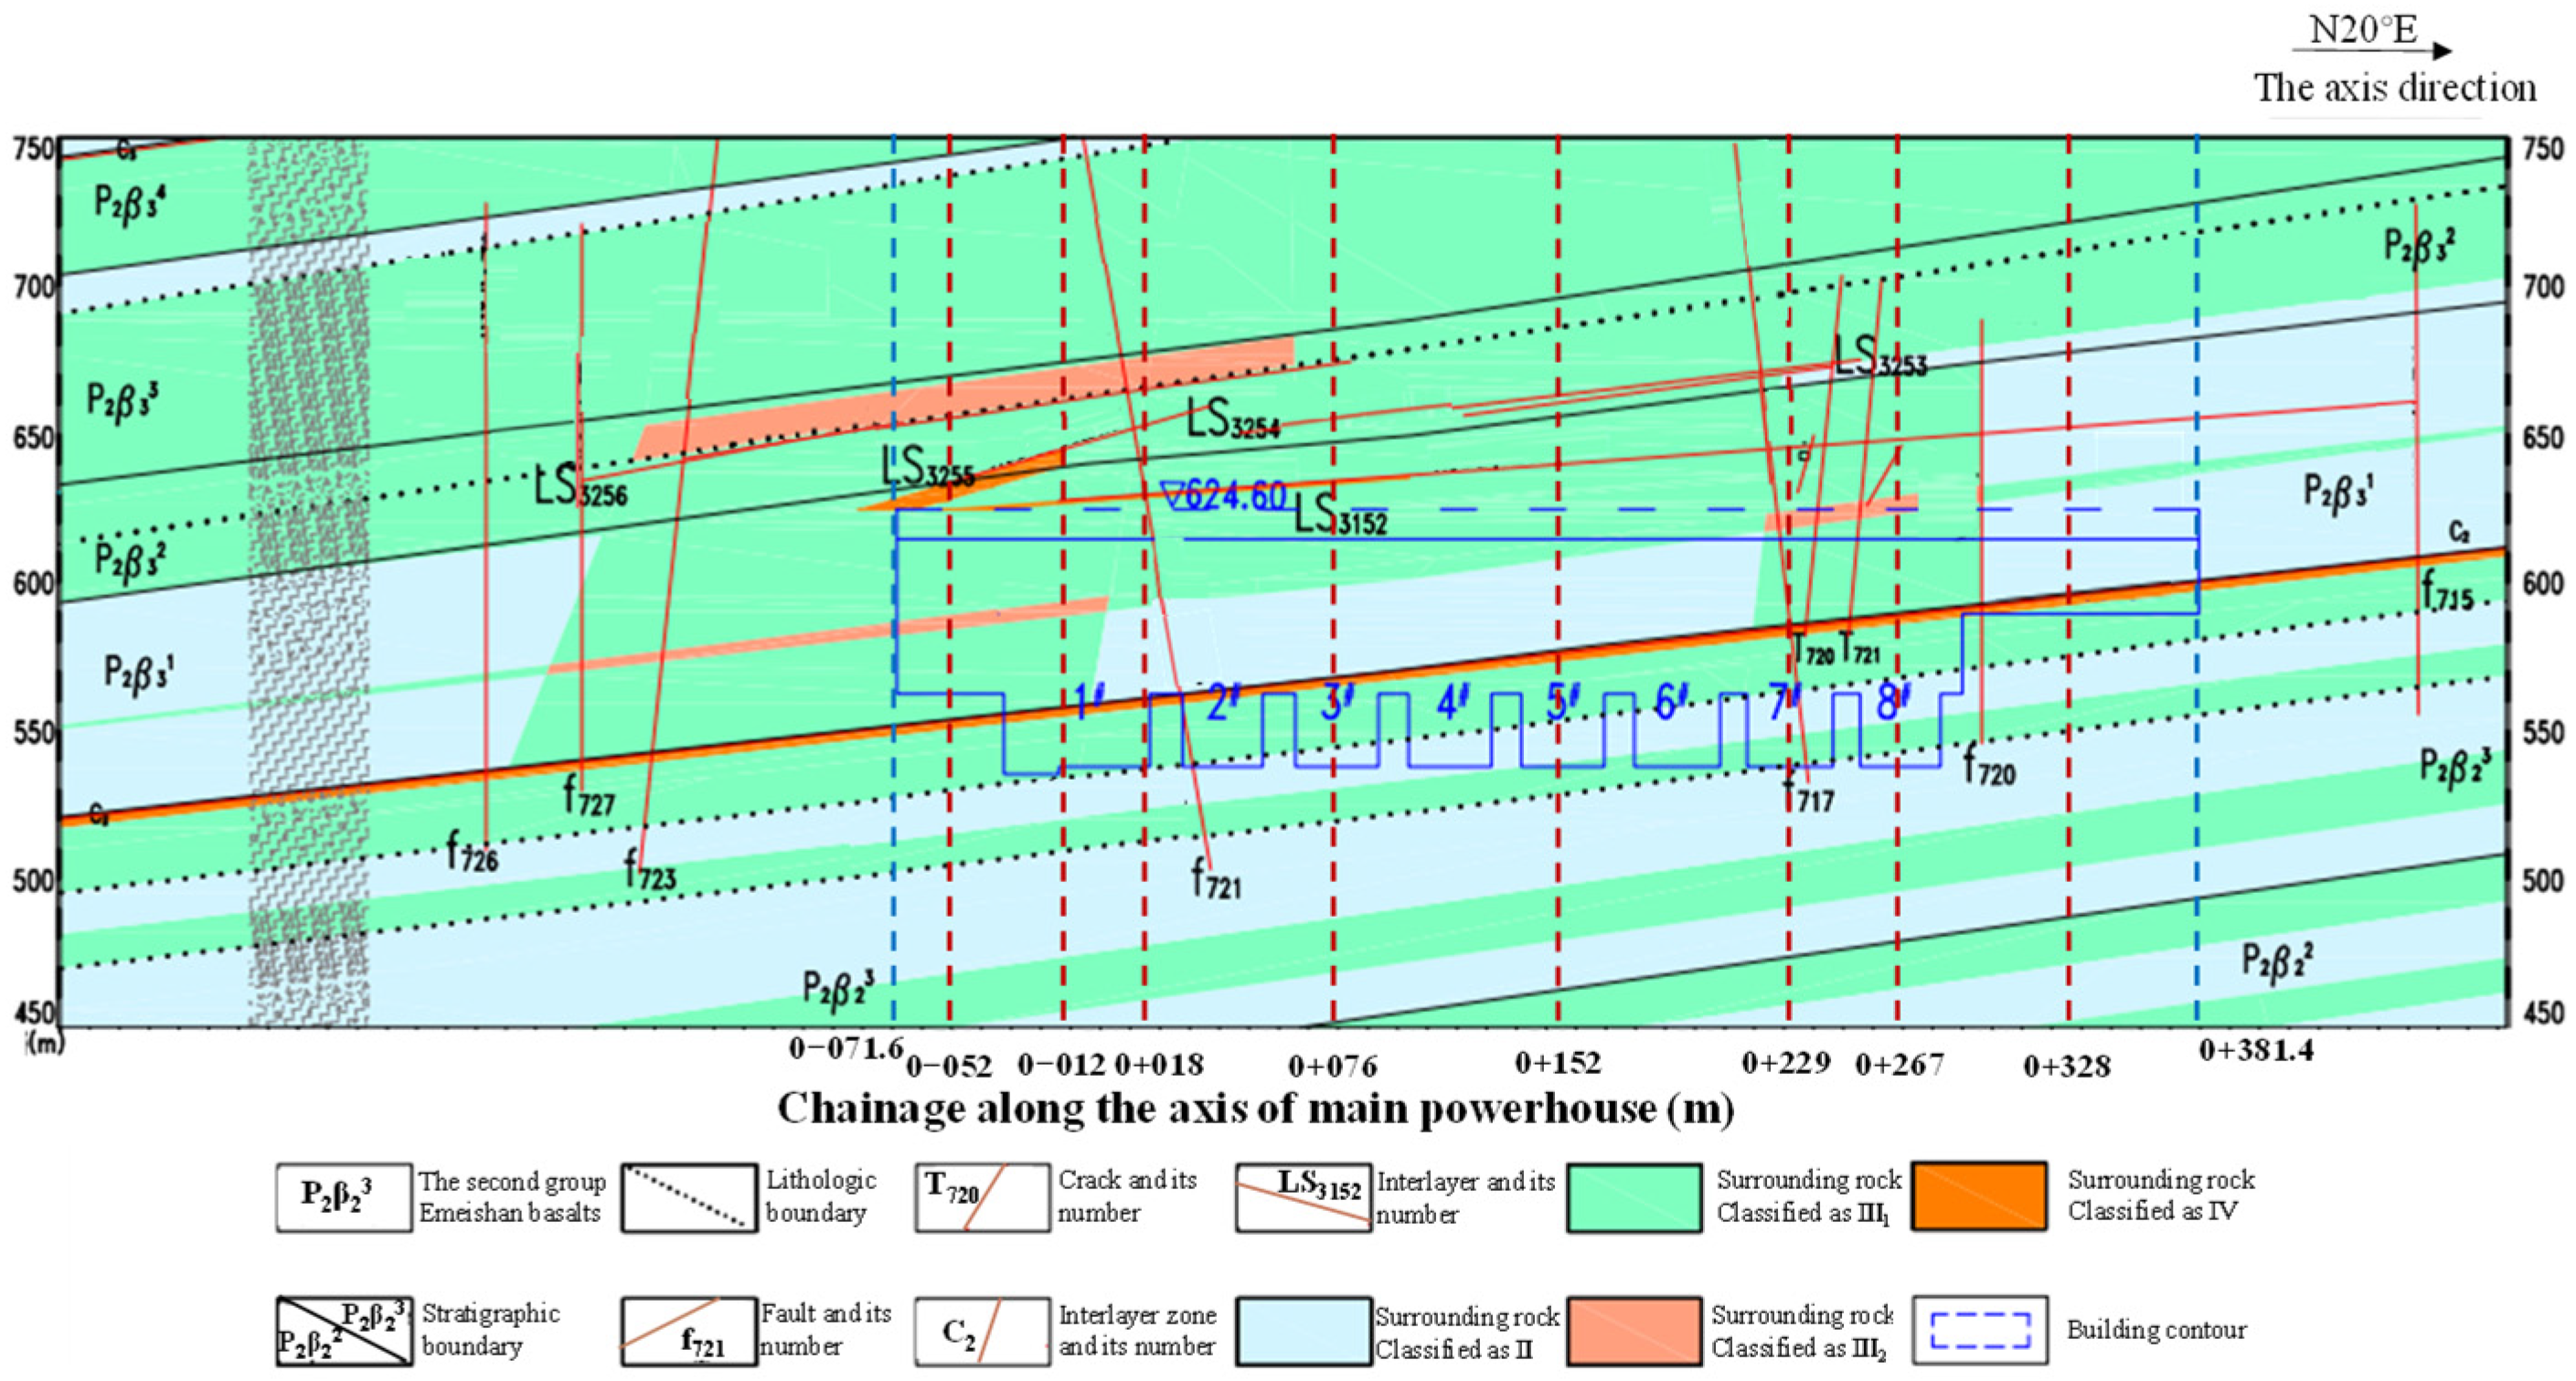
The geological profile of the left-bank powerhouse is shown in Figure 6. The underground cavern group on the left bank sequentially intersects strata P2β42, P2β41, P2β3, P2β24, P2β23, and P2β22 in the downstream direction, and the lithologies include cryptocrystalline basalt, oblique porphyry basalt, almond-shaped basalt, breccia lava and tuff. Among them, the tuff layer in the P2β24 has a thickness of 60~80 cm and is exposed along the mid-lower sections of the powerhouse sidewall, the bottom of the southern end wall, the bottom of the installation room, and the upper-middle elevations of the 1#–3# turbine pits. The large-scale faults around the underground caverns include F13, F14, F17, and the small faults exhibiting fracture apertures of 5–20 cm mainly include f717, f718, f719, f720, f721, f722, f723, etc. The interlayer staggered zone C2 is exposed along the side walls of the powerhouse and transformer chamber and has an average thickness of 20 cm. The intra shear zones in the layer include LS3152 and LS3255~LS3257. The LS3152 has a bandwidth of 2 cm and is exposed around the top arch of the powerhouse at the chainages from 0–071.6 to 0–038 m.
Figure 6.
Geological profile of the left-bank powerhouse. The blue dashed straight line represents the boundary in the axial direction of the main powerhouse, and 1#–8# represent turbine pits with different numbers.
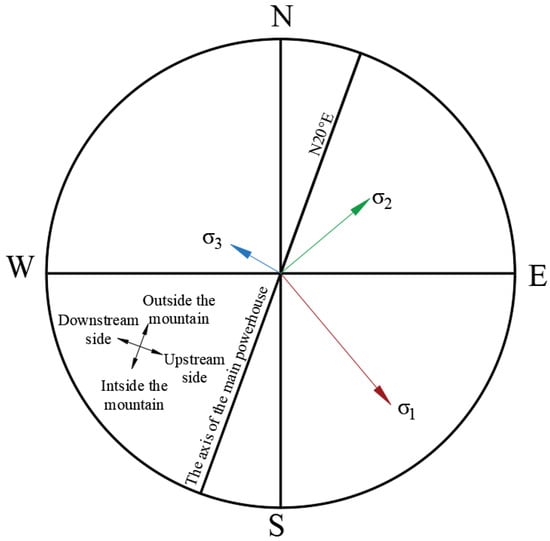
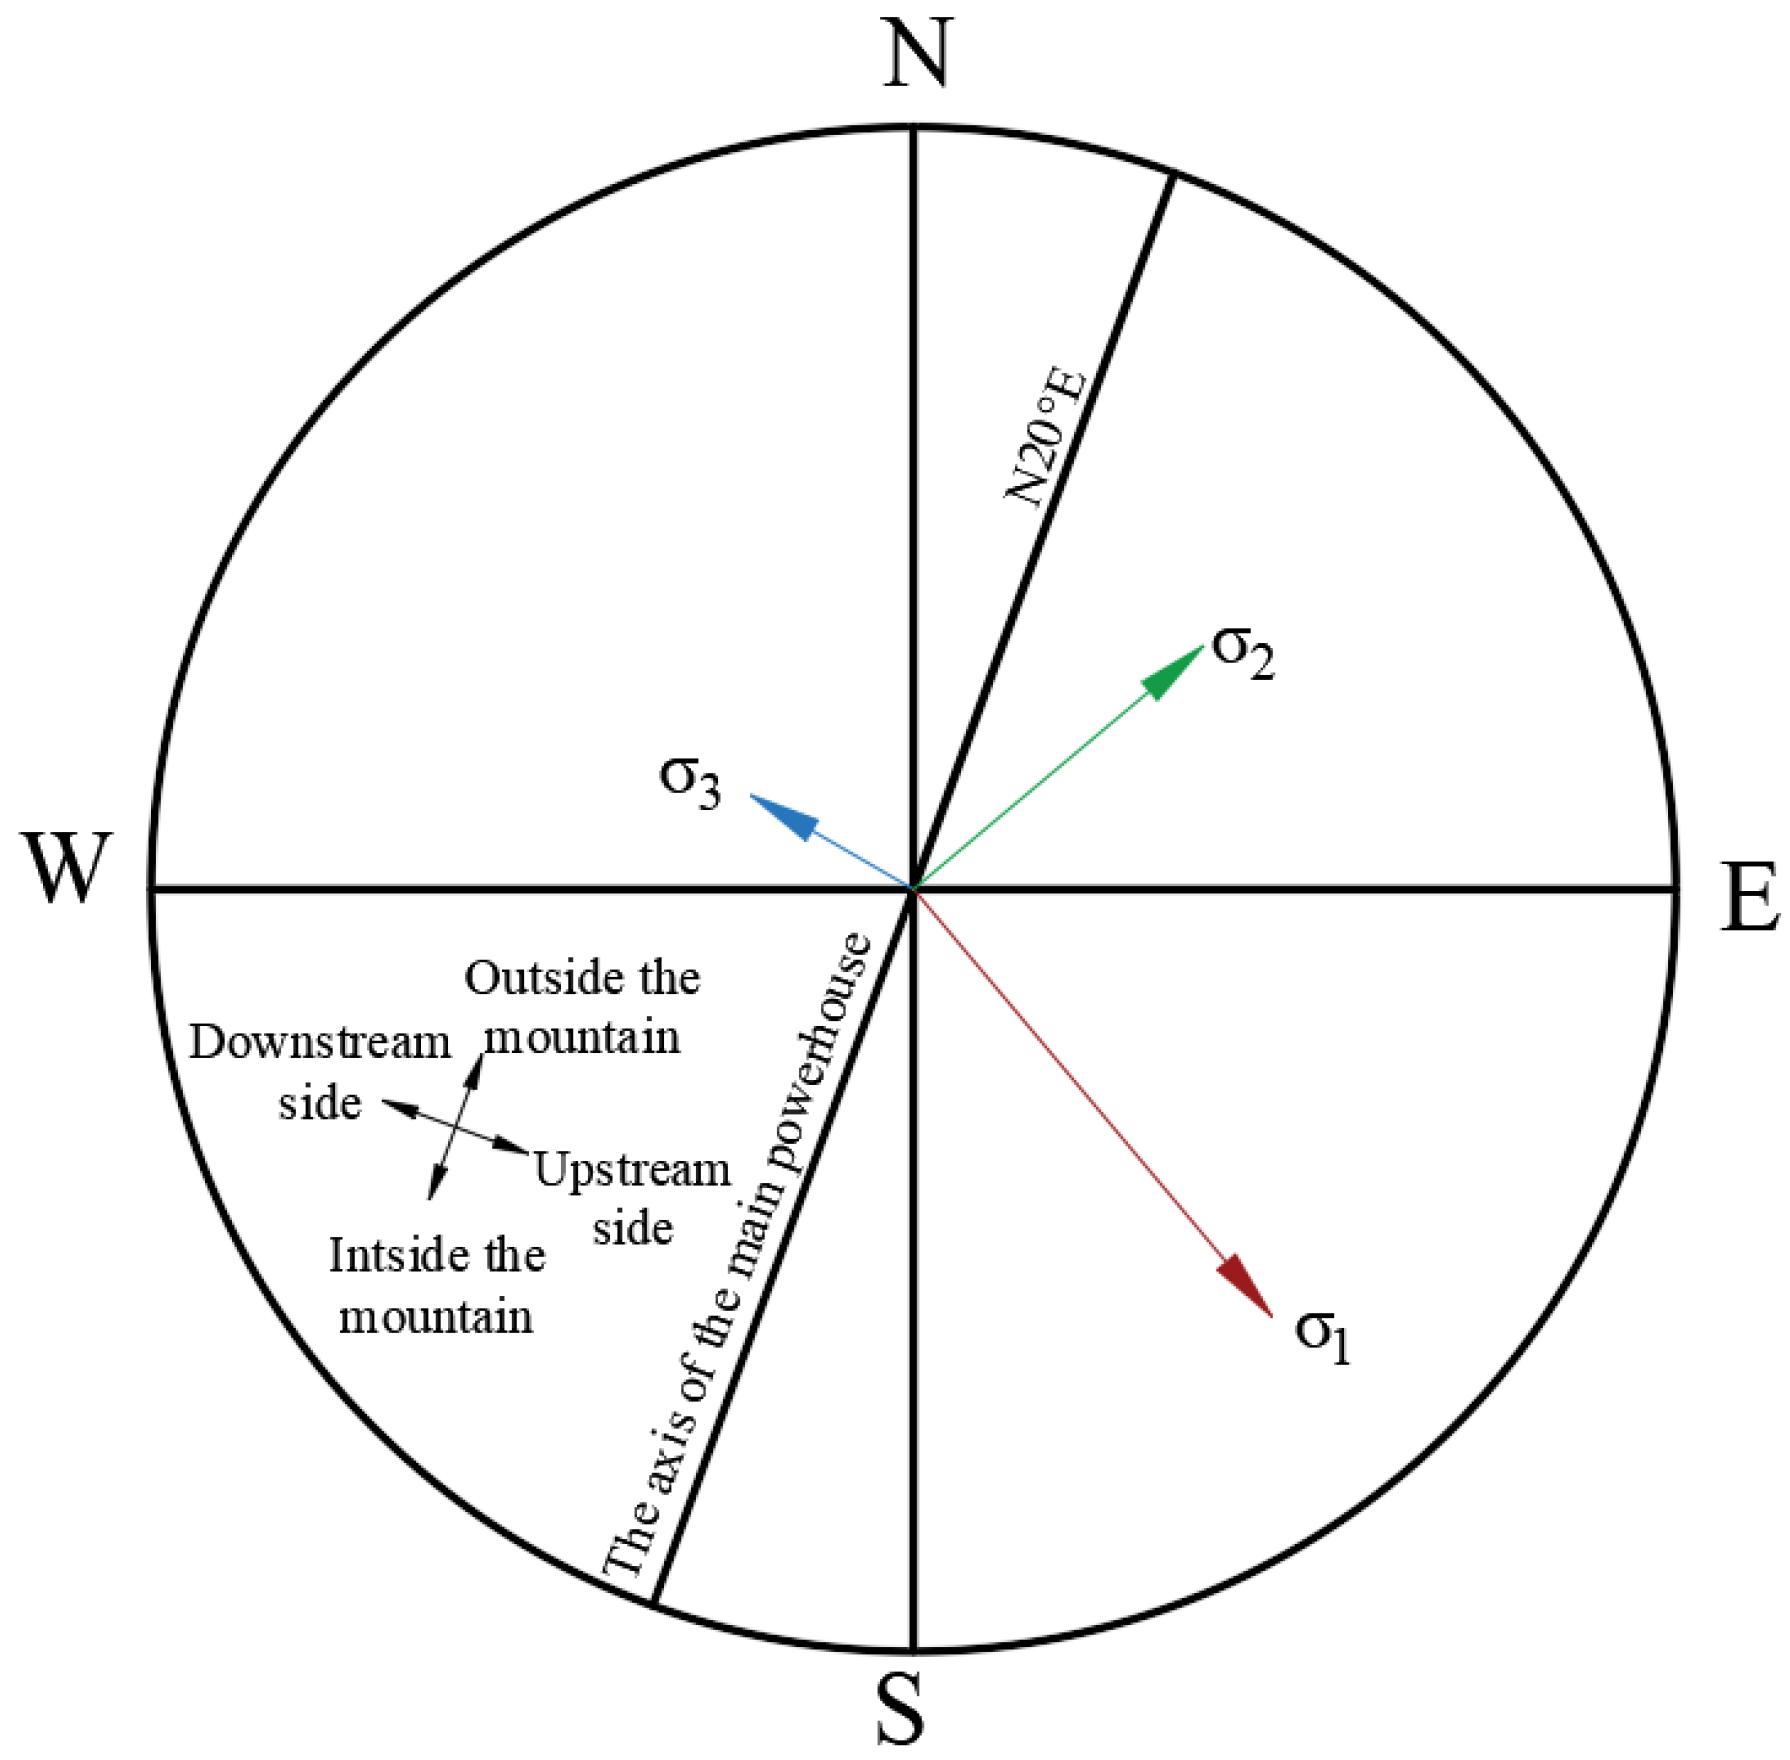
The in situ stress in the left bank is dominated by tectonic stress, so the horizontal stress is greater than the vertical stress. The first principal stress has a magnitude of 19–23 MPa, a direction of N 30°–50° W, and a dip angle of 5–13°, and it intersects the axis of the underground powerhouse at 50–70°. The second principal stress has a magnitude of 13–16 MPa. The third principal stress has a nearly vertical direction and a magnitude of 8.2–12.2 MPa, which aligns closely with the stress derived by overburden weight. The directions of in situ stresses in the left bank are shown in Figure 7. Overall, the in situ stress condition belongs to high in situ stresses.
Figure 7.
Directions of in situ stresses in the left bank.
3.2. Numerical Model
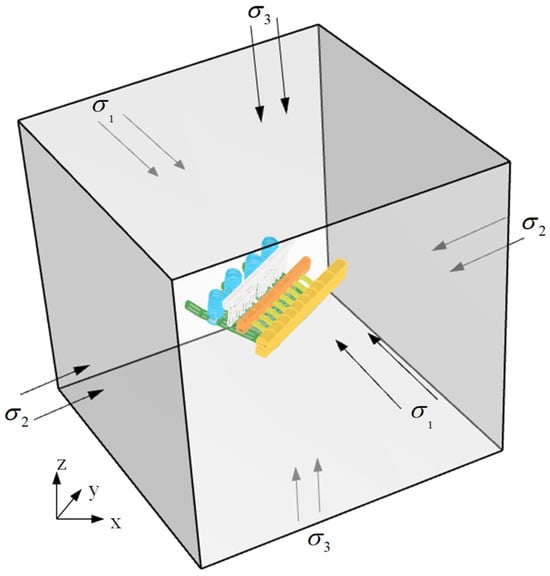
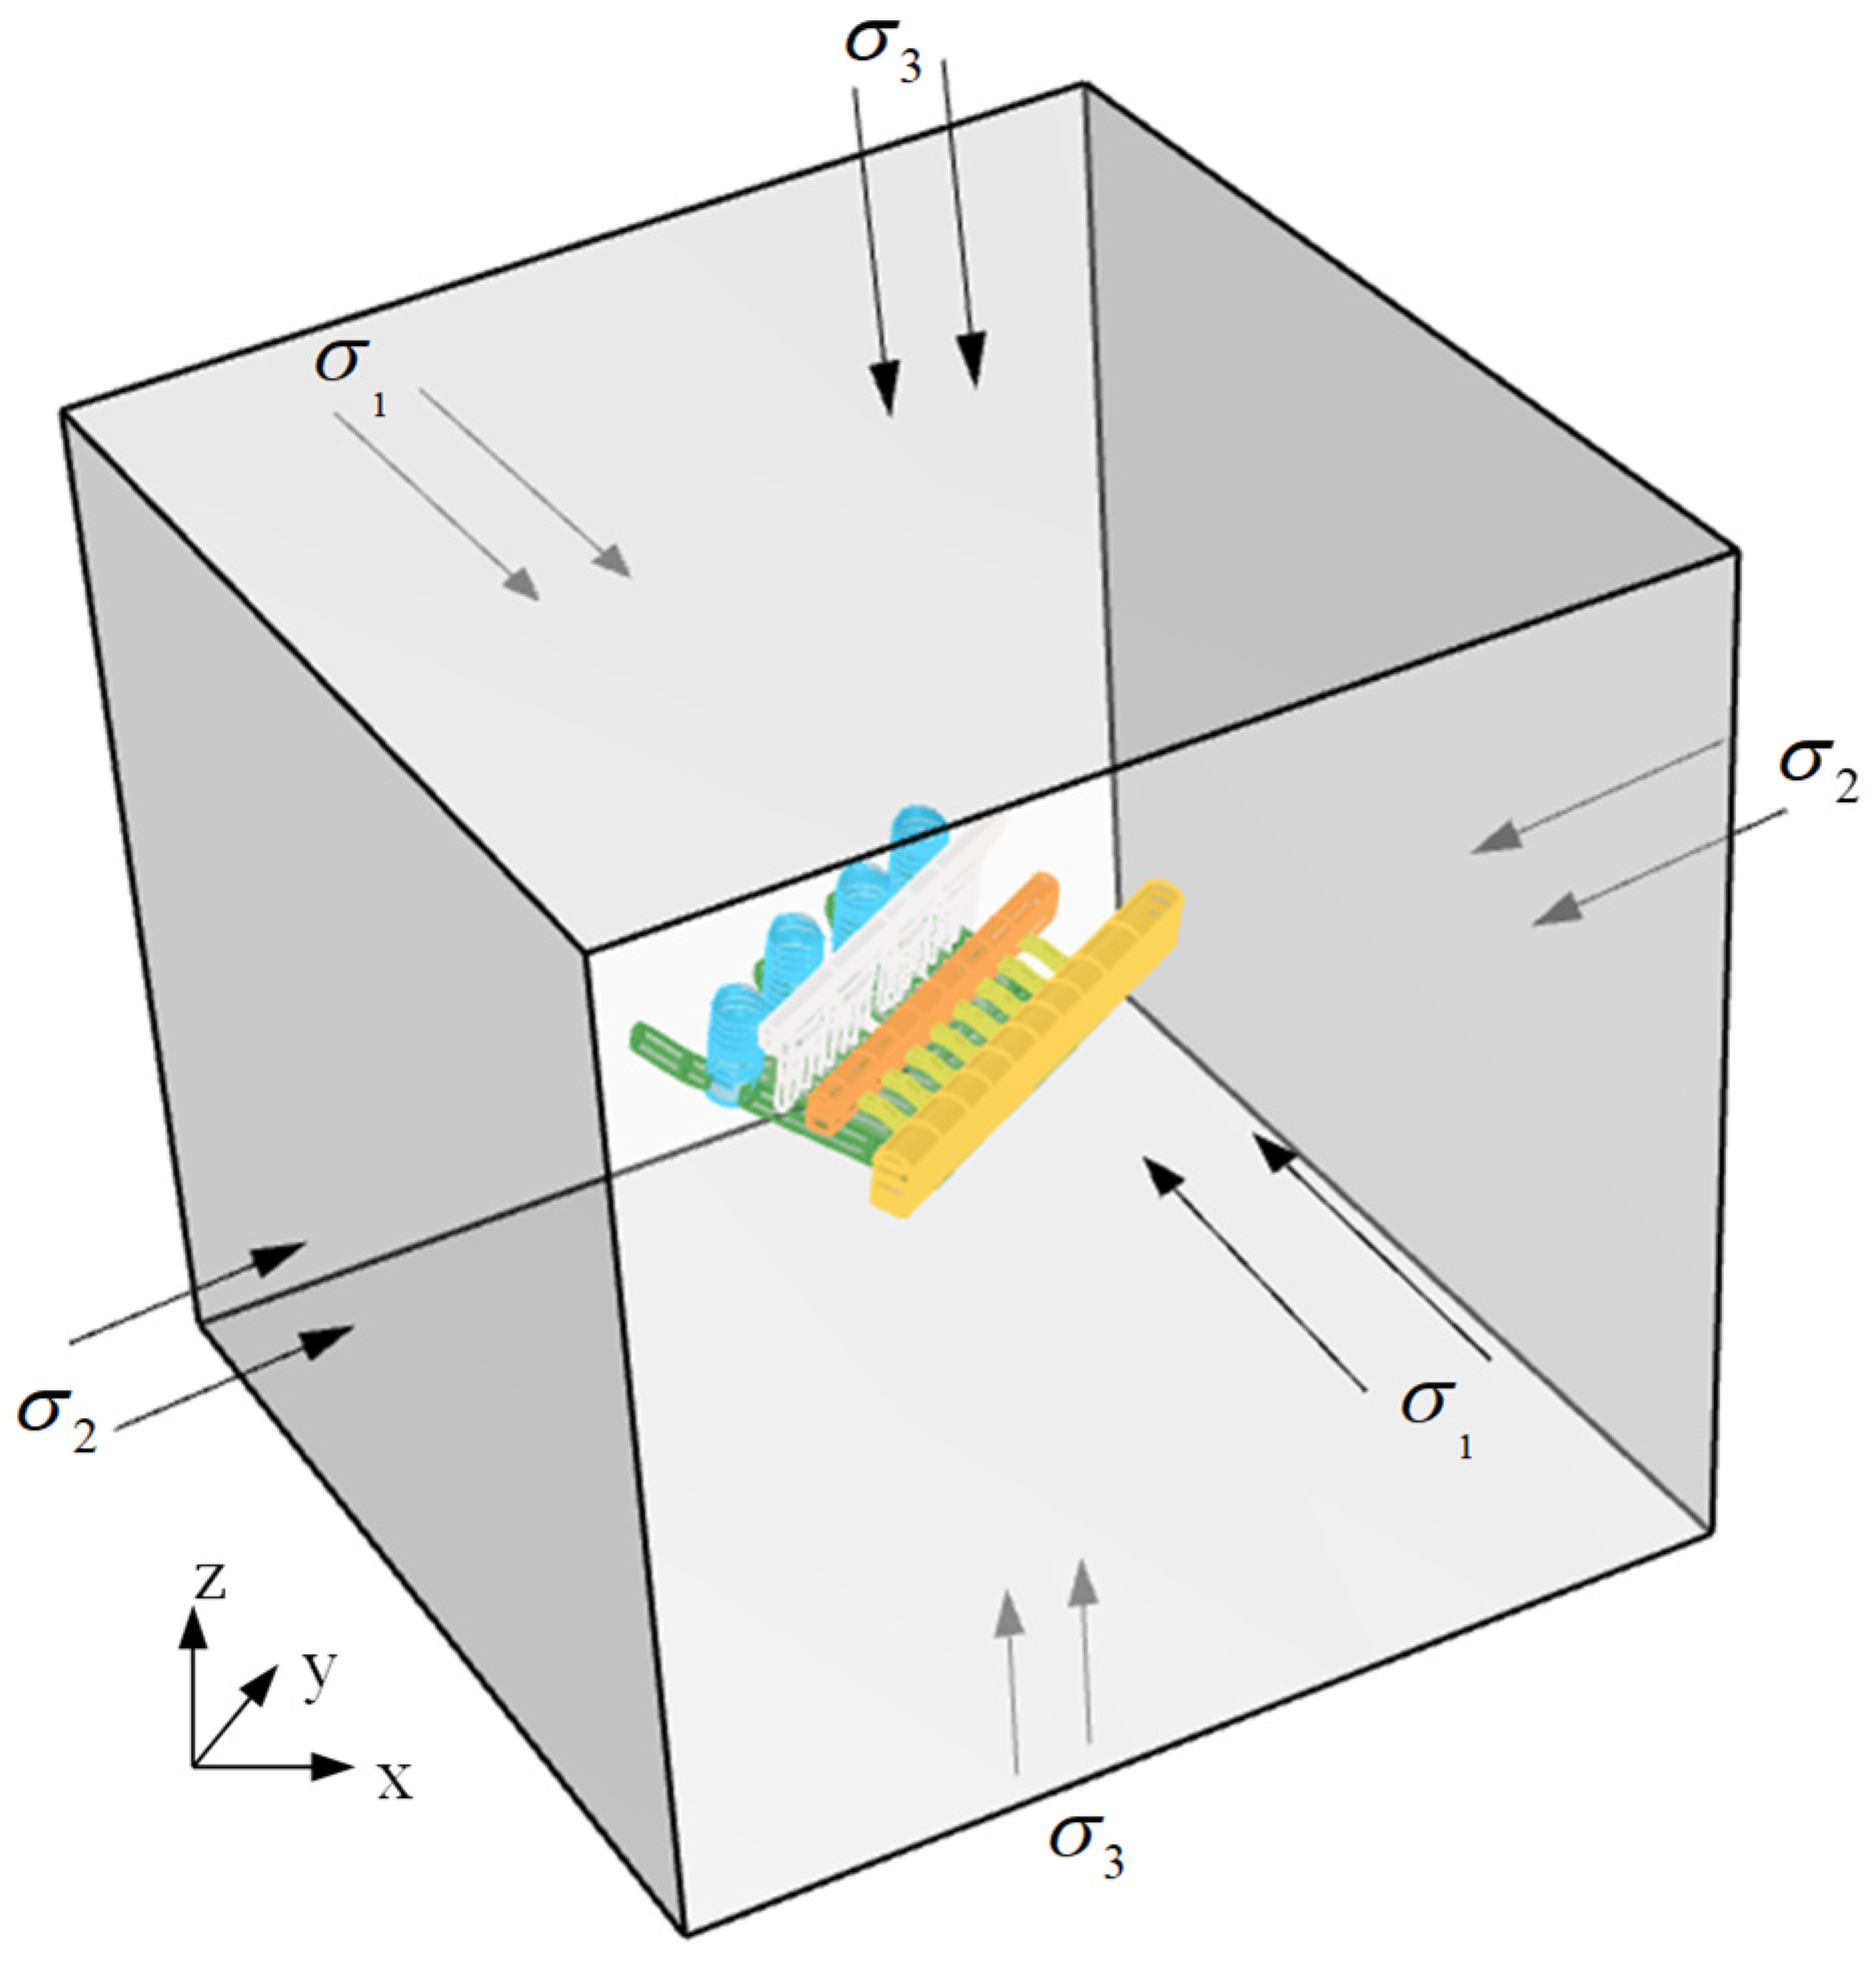
To avoid back analysis of shear stresses on the boundaries of the numerical model, a numerical model with boundaries perpendicular to the principal stress directions was established according to the tested in situ stress. In this model, the local coordinate system of the model boundaries is consistent with the orthogonal coordinate system of the principal stresses, while the global coordinate system of the model is consistent with the axis coordinate system of the underground powerhouse, as shown in Figure 8. In the global coordinate system, the Y-axis is the horizontal axis of the underground powerhouse, and the Z-axis is the vertical direction. The local coordinate system of the model boundaries was determined according to the directions of the in situ stresses. The normal vector of the model’s front face has a dip direction of 140.3° and a dip angle of −7.8°, the normal vector of the model’s side face has a dip direction of 49.7° and a dip angle of −4.5°, and the normal vector of the model’s top face has a dip direction of 110° and a dip angle of 80°. Such a numerical model facilitates the simulation of principal stress effects and could generate a more accurate in situ stress field.
Figure 8.
Geometric model of the underground powerhouse. The yellow, orange, white, blue, and green chambers respectively represent the main powerhouse, the transformer chamber, the draft tube bulkhead gate chamber, the tailrace surge chambers, and the tailrace tunnels.
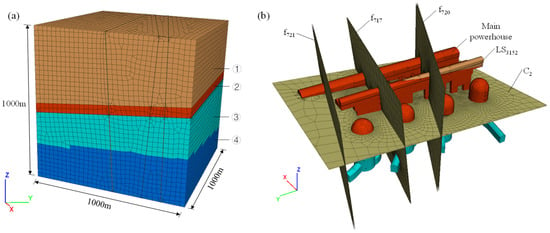
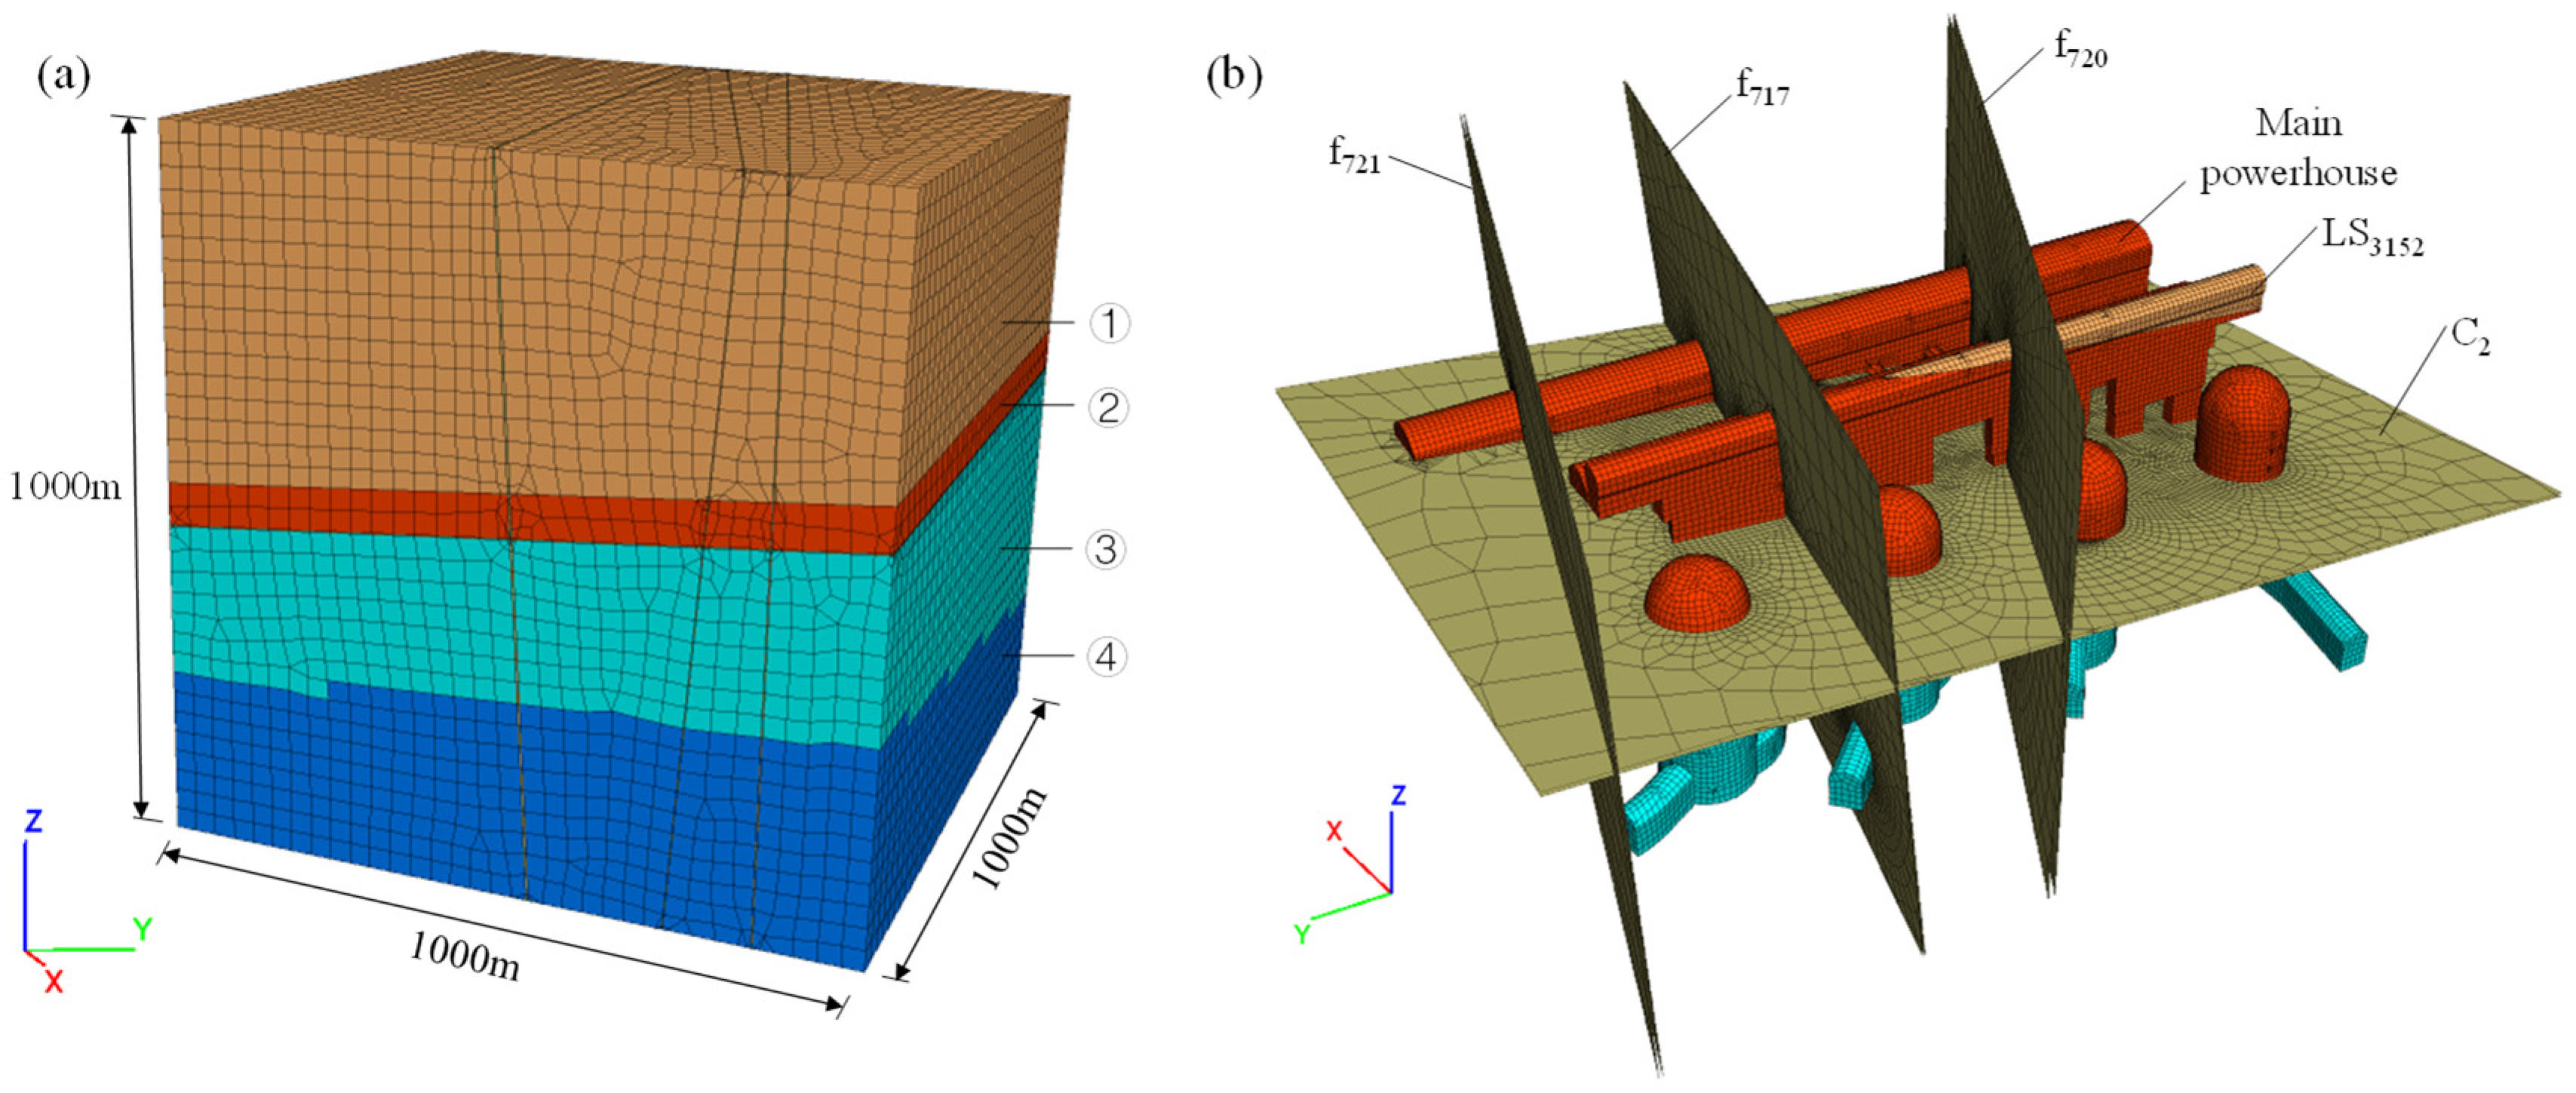
The lithology and geological structure were considered in the numerical model to analyze the influences of complex geological conditions. The surrounding rock mainly consists of moderately fresh basalt, which can be divided into four layers based on the integrity of the rock mass, as shown in Figure 9a. Layer ① exhibits blocky to sub-blocky structures. Layer ② demonstrates greater structural integrity than layer I. Layer ③ and layer ④ exhibit massive to blocky structures, and layer ④ is more integral than layer ③. According to a Chinese national standard GB/T 50218-2014 [51], layers I and II are identified as class III1 rock, and layers III and IV are identified as class II rock. Furthermore, some geological structures exhibiting significant influence on caverns are also established in the model, including interlayer staggered zone C2 and LS3152, along with major faults f717, f720 and f721, as shown in Figure 9b. All the geological structures were modeled by a layer of solid element, respectively, and the thicknesses of these layers are equal to the real thicknesses of these geological structures. Isotropic material properties were assigned to these layers of elements. LS3152 is identified as class III2 rock, and other geological structures are identified as class IV rock. The underground caverns considered in the model include the main powerhouse, transformer chamber, draft tube bulkhead gate chamber, tailrace surge chambers and some auxiliary tunnels, such as bus tunnels and tailrace tunnels. The model domain extends 1000 m along each principal stress orientation to minimize boundary effects while maintaining sufficient clearance between excavations and domain limits. The model consists of 564,801 nodes and 1,128,478 elements, and the mesh is mainly composed of eight-node hexahedral elements, which exhibit uniform dimensions and excellent morphology. Critical refinement operations were applied to the excavation zones to enhance computational accuracy.
Figure 9.
Numerical model of the underground powerhouse: (a) overall model and (b) main caverns and geological structures. The characters ①–④ represent four layers divided according to the integrity of the rock mass.
According to the geological survey report of the Baihetan hydropower station, the surrounding rock of the underground caverns is mainly classified as class II-IV rock. The mechanical parameters, including unit weight, elastic modulus, Poisson’s ratio, and strength parameters, are listed in Table 1.
Table 1.
Physical and mechanical parameters of surrounding rock.
3.3. Inversion Analysis of In Situ Stresses
The numerical model was established with boundaries perpendicular to the orientations of principal stresses. Principal stresses can be normally applied to the boundaries to avoid inversion analysis of shear stresses on the boundaries. This approach transforms the inversion analysis of six stress components into an inversion analysis of three orthogonal principal stress components. Because the in situ stresses measured from different positions are different, the normal loads applied on the boundaries must be inversely analyzed to minimize the errors between the simulated and measured in situ stresses.
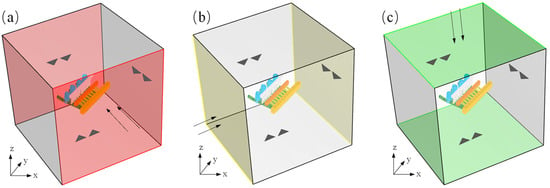
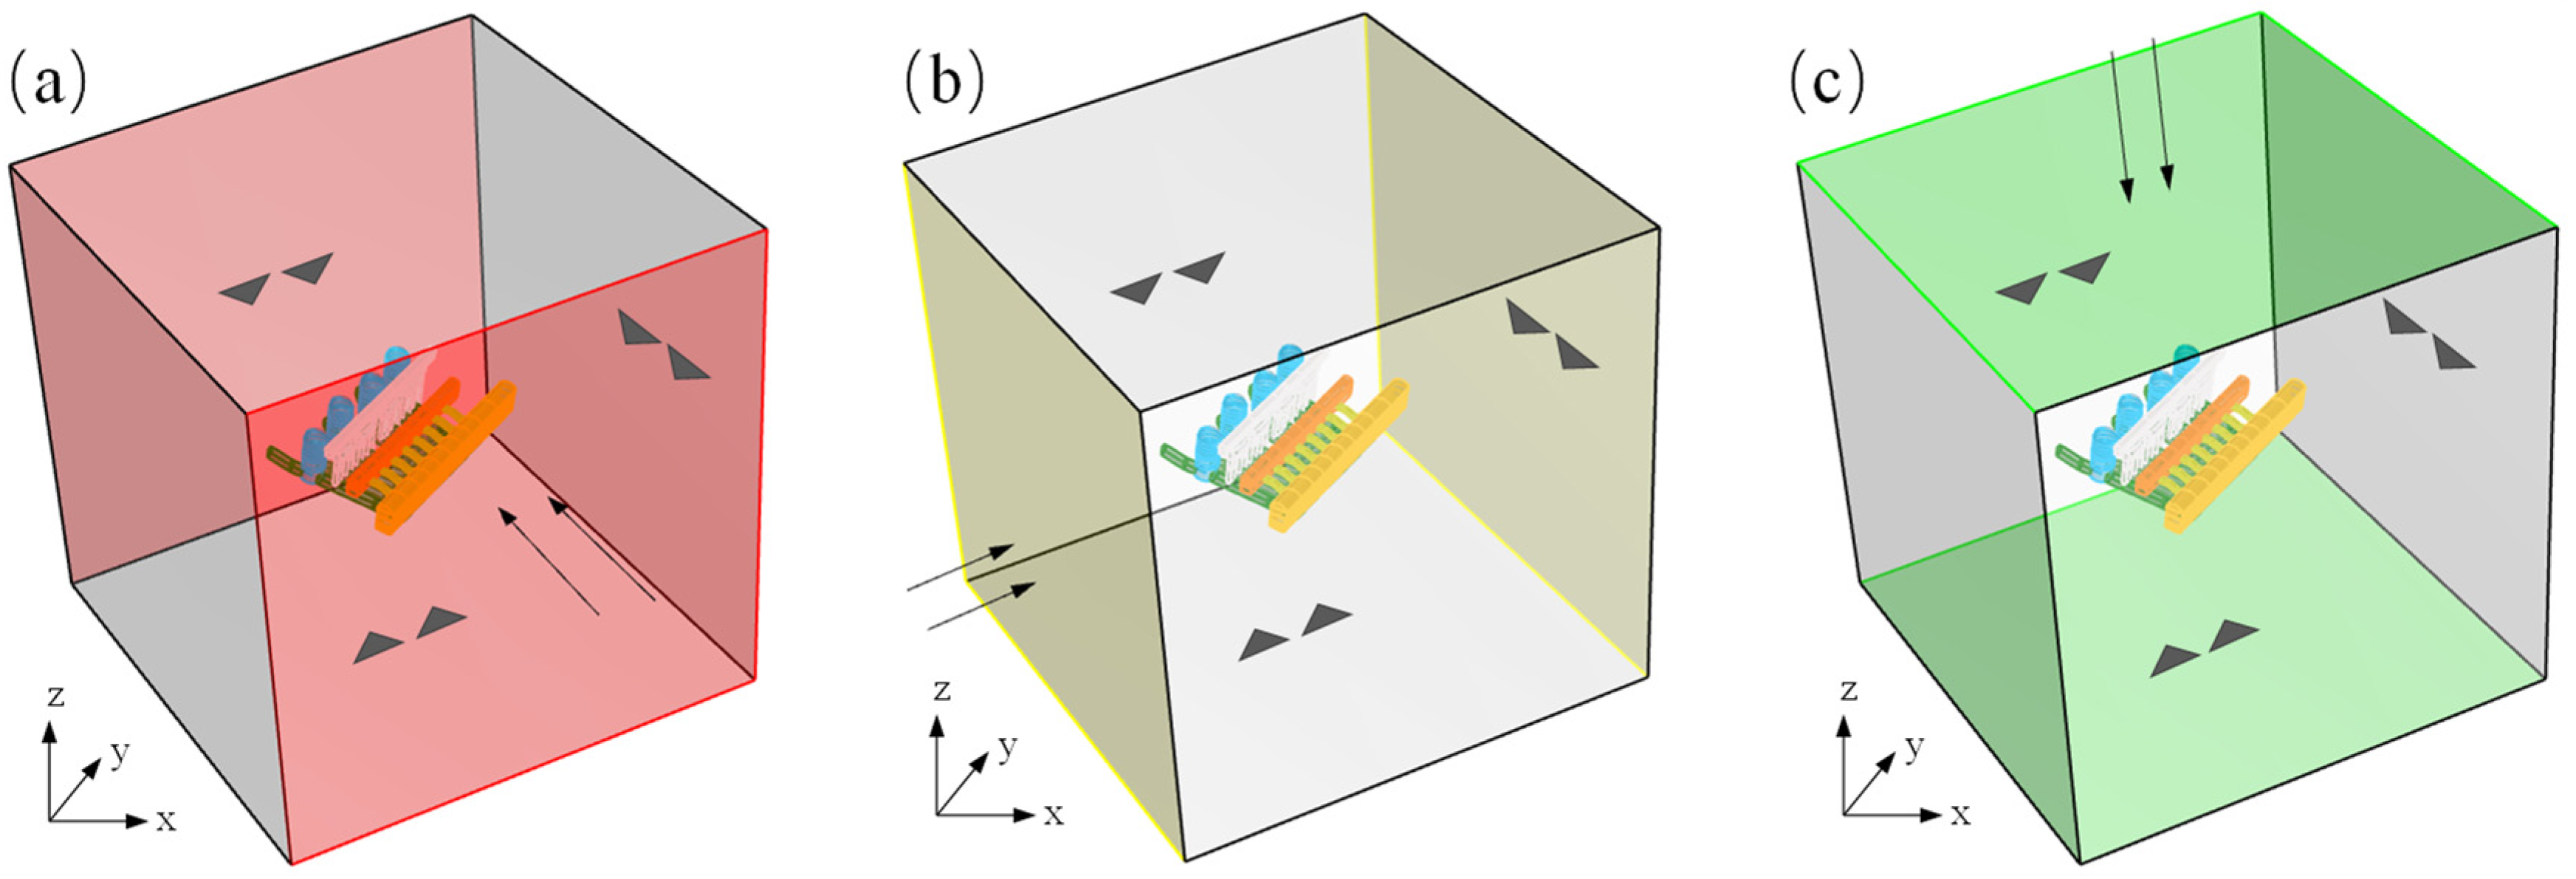
The steps of inversion analysis are as follows. Three independent simulations should be conducted by applying unit stress on three boundaries, as shown in Figure 10. The simulated stresses caused by each unit boundary stress at each measurement point of in situ stresses can be extracted after simulation. Based on the measured in situ stresses of measurement points, a linear regression equation system can be established between the simulated and measured in situ stresses. Then, optimization solving is performed to get the coefficients of the linear regression equation system, which are the final values of boundary stresses.
Figure 10.
Boundary conditions of the numerical model in the inversion analysis of in situ stresses. (a) Unit boundary stress applied in the direction of σ1, (b) unit boundary stress applied in the direction of σ2, and (c) unit boundary stress applied in the direction of σ3. The arrows represent the loading directions, and the triangles represents the constraints.
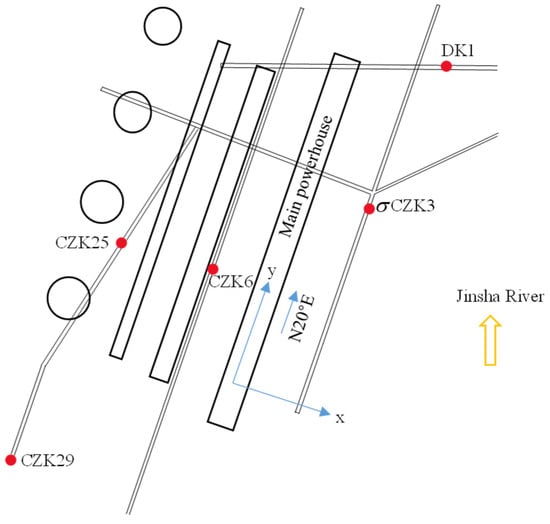
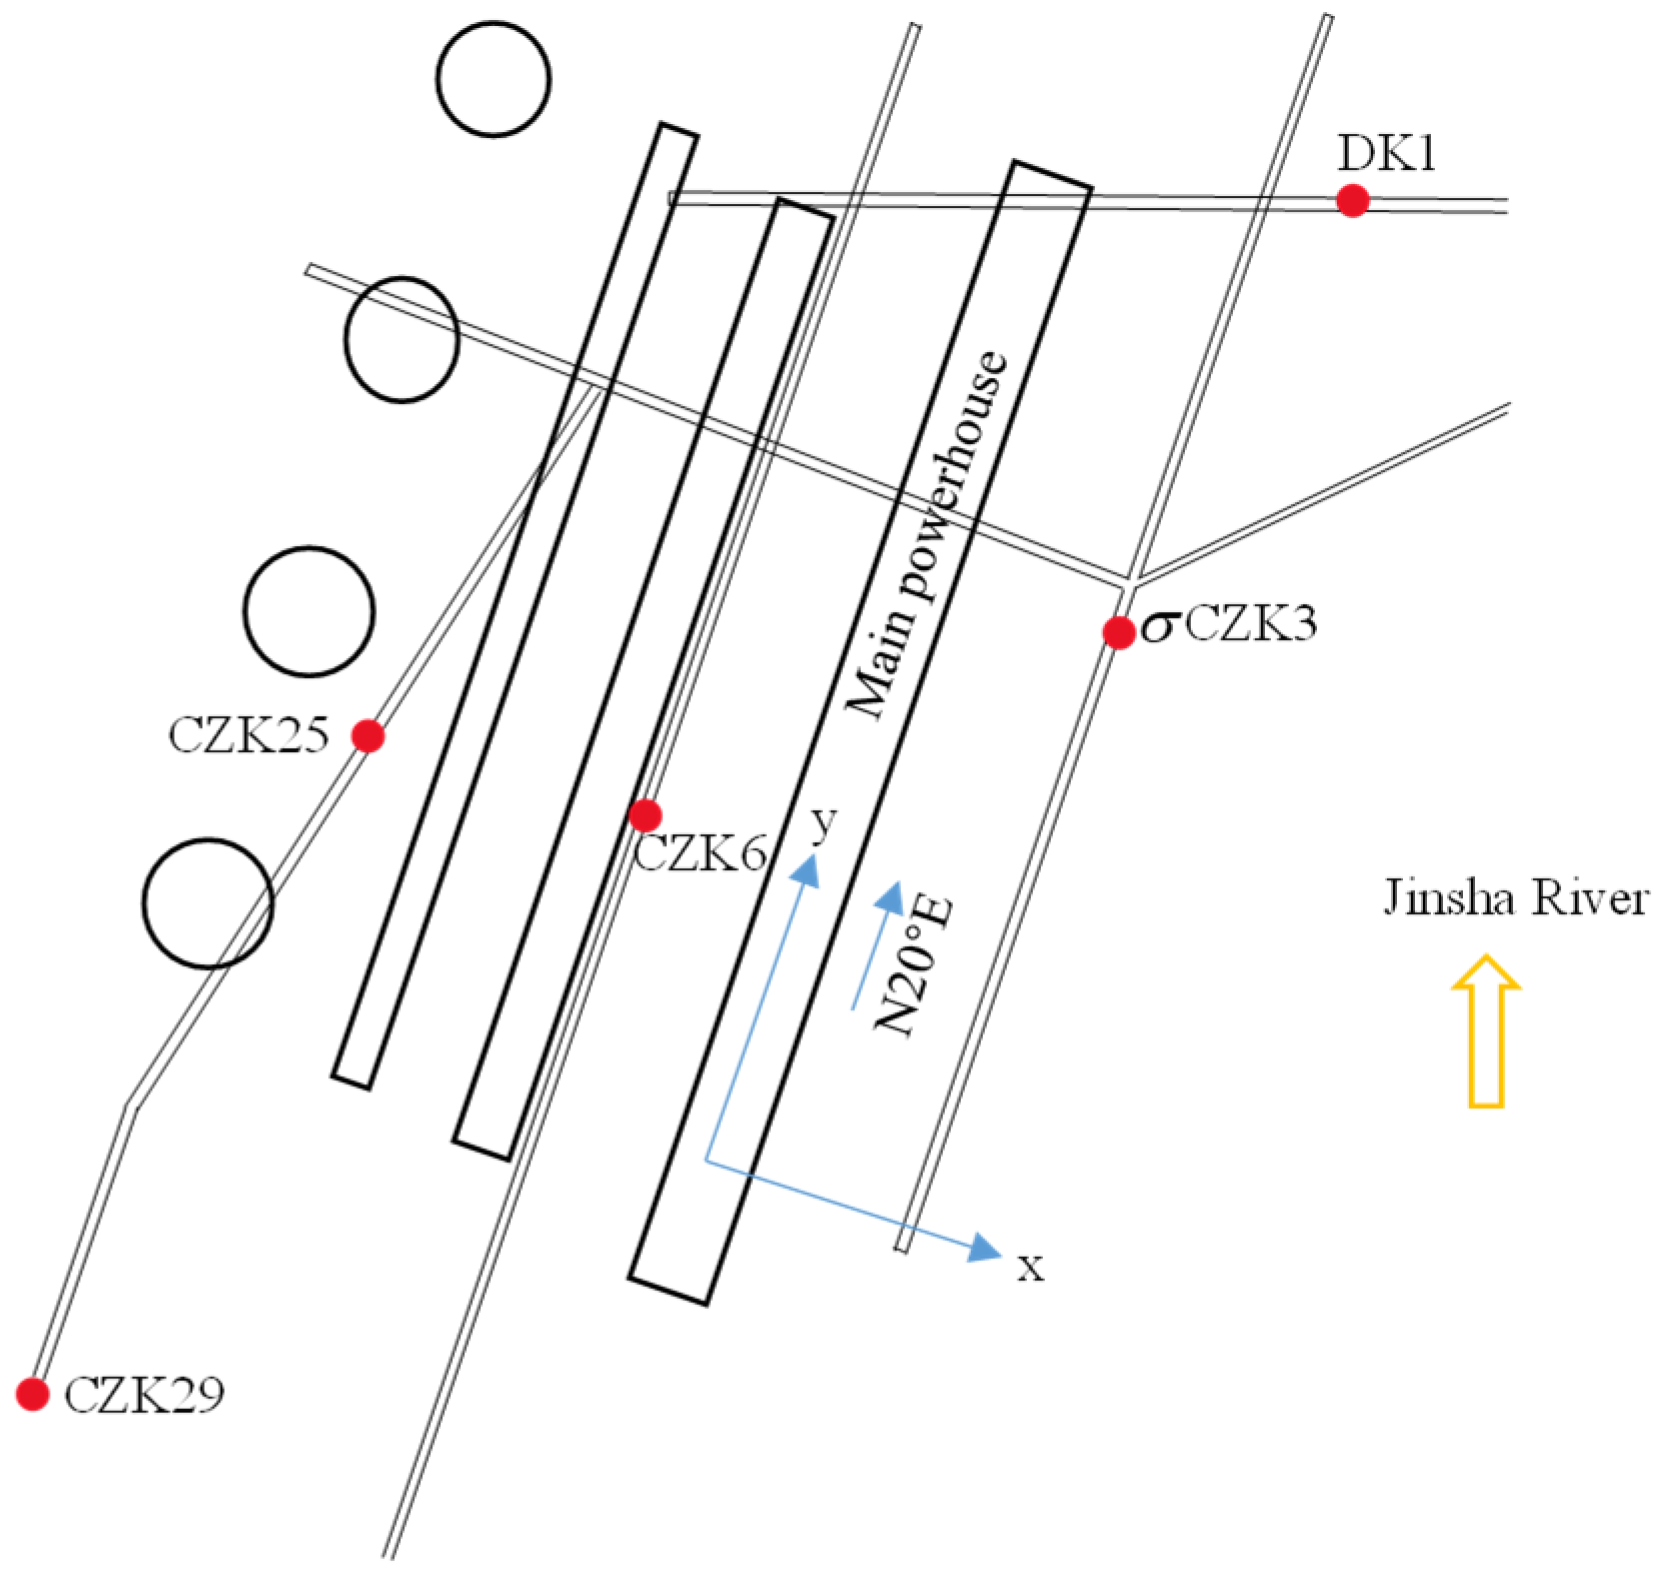
Figure 11 illustrates the distribution of in situ stress measurement points around the left-bank underground caverns. Among these measurement points, the two-dimensional hydraulic fracturing method was utilized to measure in situ stress at CZK6, CZK25, and CZK29, while the three-dimensional hydraulic fracturing method was employed to measure in situ stress at DK1 and σCZK3. The measured in situ stresses at each measurement point are presented in Table 2. Three-dimensional monitoring points exhibit underestimated horizontal in situ stress magnitudes and significant discrepancies in principal stress orientations, so they fail to reliably indicate the actual stress regime around the powerhouse. Consequently, only vertical stresses from boreholes DK1 and σCZK3 were incorporated into the inversion analysis of in situ stresses.
Figure 11.
Distribution of in situ stress measurement points. The character next to each point represents its borehole number.
Table 2.
Measured in situ stresses at each measurement point.
To linearly superimpose the stress fields formed by three boundary stresses, it is assumed that the surrounding rock is elastic. If the stress fields , , and represent the stress fields formed by unit boundary stress in the σ1 direction, σ2 direction, and σ3 direction, respectively, the in situ stresses at a measurement point can be expressed as:
where , is the number of in situ stress measurement points, is the in situ stress components at measurement point k, and , , are the regression coefficients of boundary stresses.
This equation can be established for every measured in situ stress component, so a linear equation system for the in situ stress regression analysis can be obtained:
Denoted as . on the left and right sides of the equation are the measured and simulated in situ stresses, respectively.
Because there are 8 measurement points and a total of 20 measured stress components, as listed in Table 2, the number of equations is 20. It is greater than the number of regression coefficients to be solved, so the equation system is overdetermined. To ensure that the obtained regression coefficients achieve an overall optimal fit for the entire equation system, the least squares method is generally used for optimization:
Solving the above overdetermined equation system is essentially a multiple linear regression problem. The coefficient of determination is generally used to evaluate the regression performance:
where is measured in situ stress, is back-analyzed in situ stress, and is the mean value of measured in situ stresses.
After performing regression calculations, the regression equation for the in situ stress is obtained as follows:
Thus, the boundary stresses are calculated as follows: σ1 = 22.7762 MPa, σ2 = 14.5814 MPa, σ3 = 10.7227 MPa.
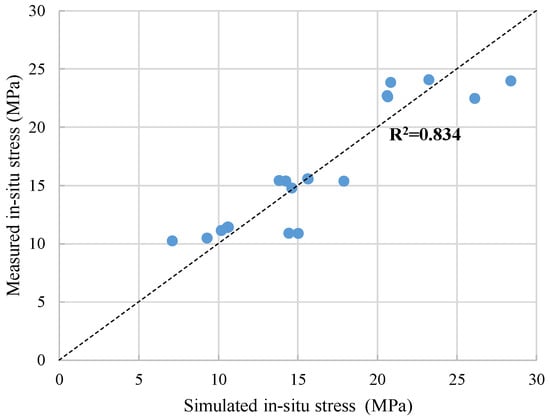
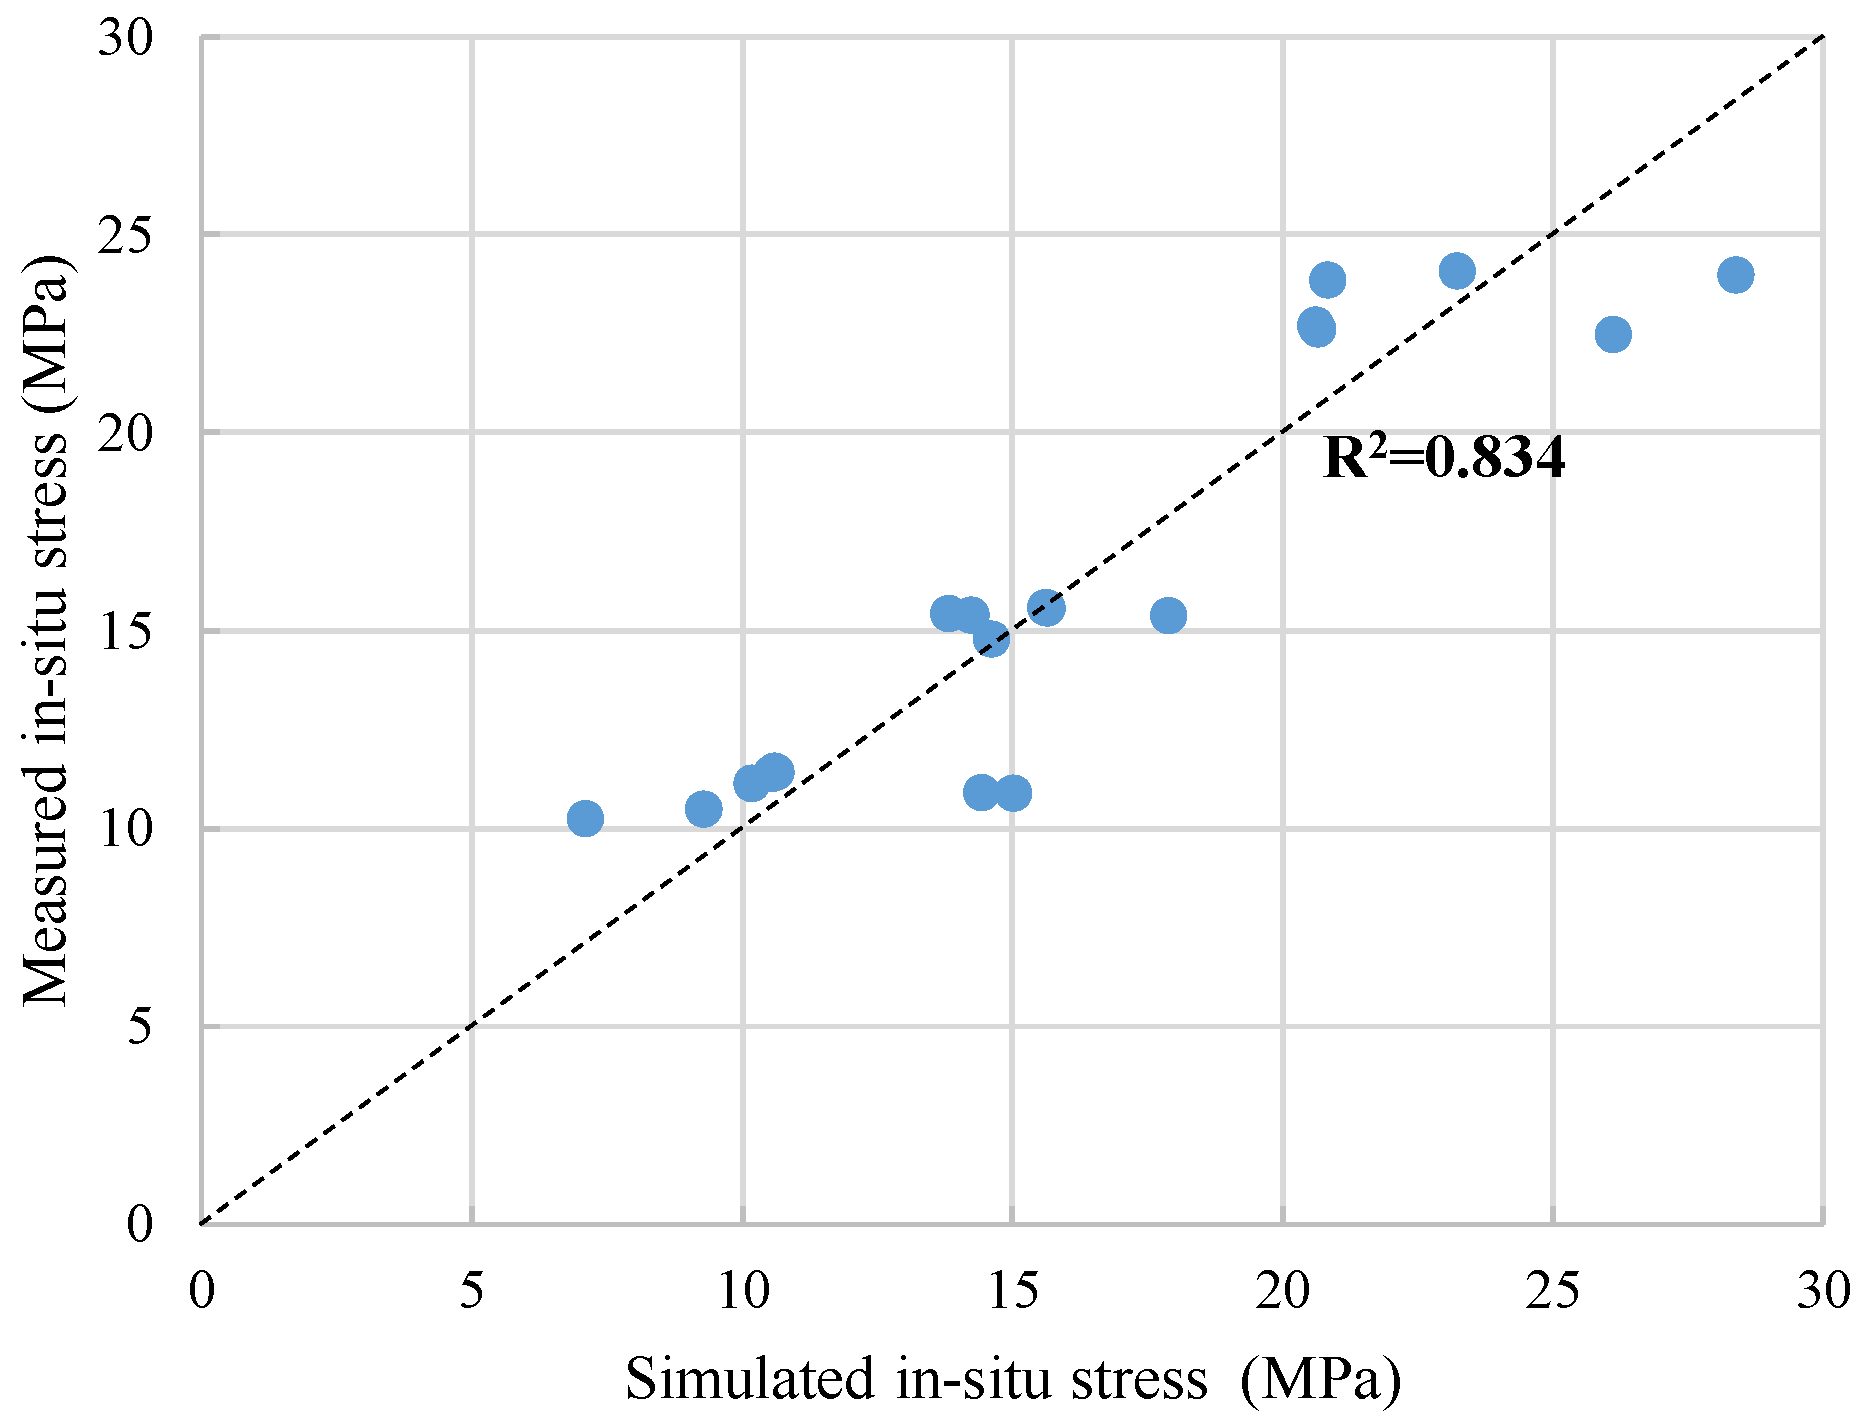
To verify the accuracy of the determined boundary conditions, a validation analysis was conducted by simultaneously applying three boundary stresses on the numerical model. Table 3 presents the measured and simulated in situ stresses for each measurement point. It shows that the simulated in situ stresses, including the maximum horizontal principal stress, the minimum horizontal principal stress, and the vertical stress at each measurement point, are generally close to the measured values, and the average relative error is about 12.21%. Overall, the simulated mean values of the three stresses are very close to the measured mean values, indicating that the overall stress magnitude obtained from the regression analysis aligns well with the measured condition. Figure 12 provides a comparison between the simulated stresses and the measured stresses. The dashed line represents that the two stresses are equal. It shows that the stresses at each measurement point are distributed near the dashed line. The coefficient of determination is about 0.834, so the simulated in situ stresses are almost consistent with the measured results.
Table 3.
Comparison of measured and simulated in situ stresses.
Figure 12.
Comparison between the measured and simulated in situ stresses. Each dot corresponds to each monitoring point.The dashed line represents that the two stresses are equal.
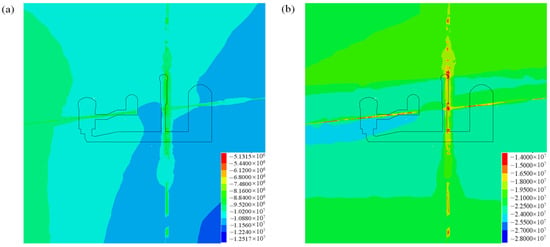
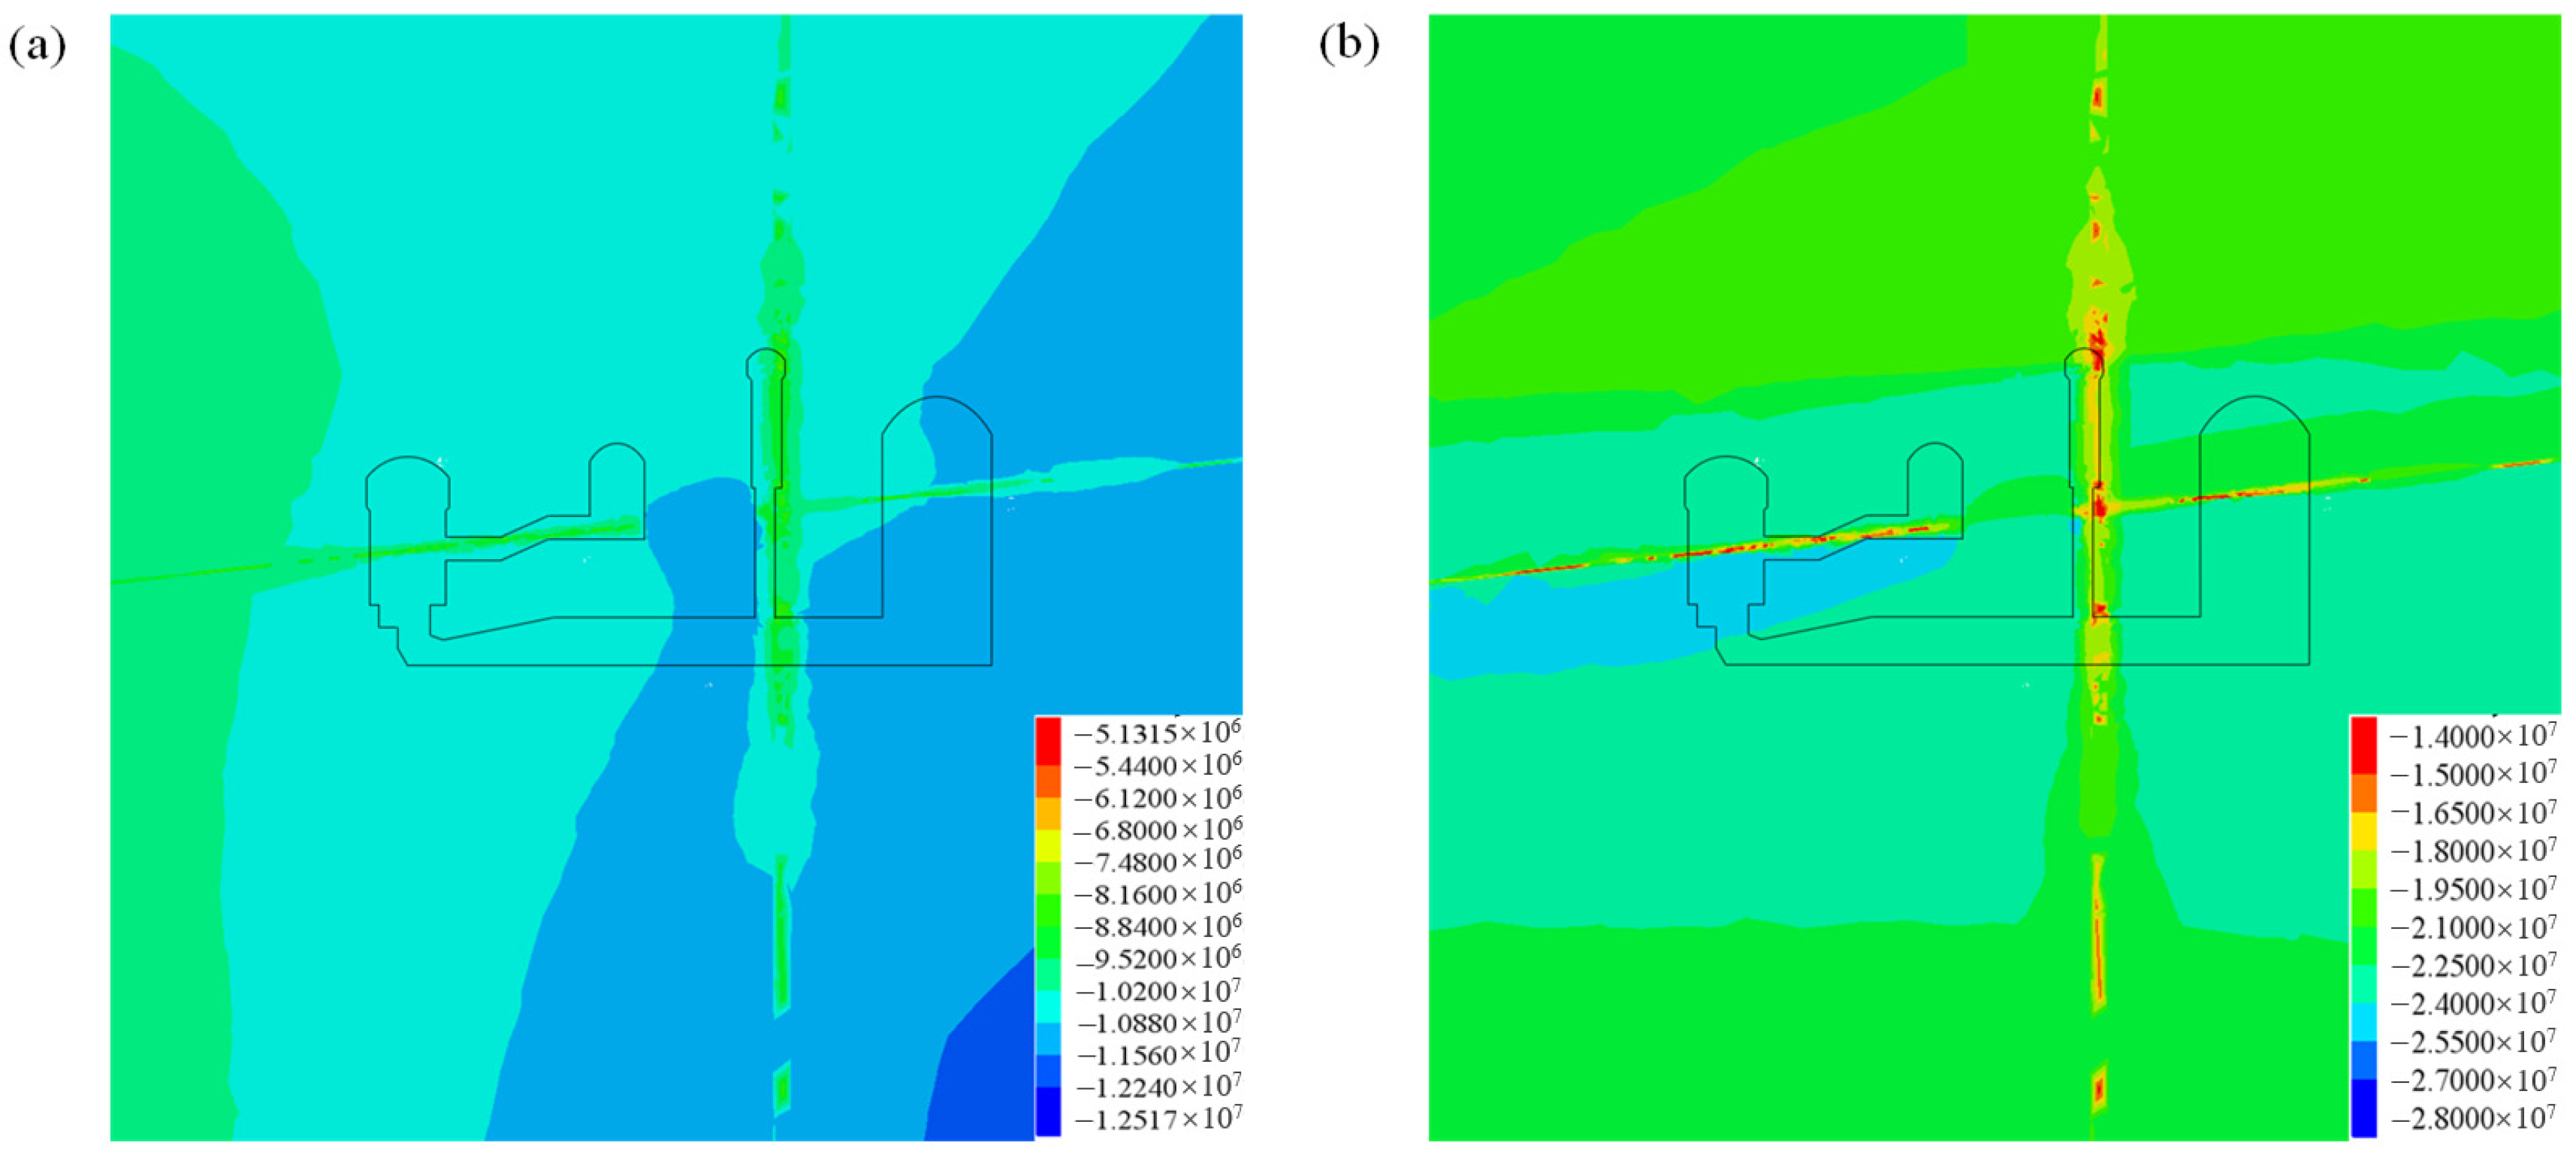
Figure 13 presents the contour of the simulated in situ stress for the domain around underground caverns, whose excavation boundary is marked with a line. It shows that faults and interlayer staggered zones significantly affect the stress distribution of the surrounding rock. The contour of the first and the third principal stresses exhibits a gentle dip towards upstream. In the excavation area of the underground caverns, the first principal stress ranges from −12 to −9 MPa, and the third principal stress ranges from −23 to −20 MPa. The magnitude and distribution of the simulated in situ stress near the underground caverns are reasonable, so the inversion analysis results agree well with the measured stresses.
Figure 13.
Contour of the first and the third principal stresses around the underground caverns (Unit: Pa): (a) the first principal stress and (b) the third principal stress.
4. Stress and Deformation of Surrounding Rock During Excavation
4.1. Stress Distribution Characteristics of Surrounding Rock
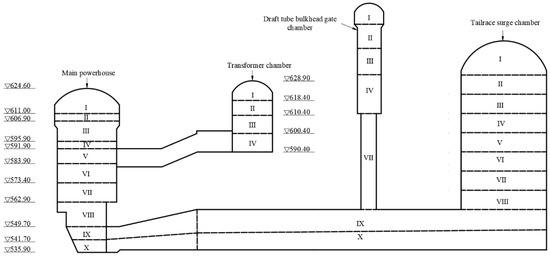
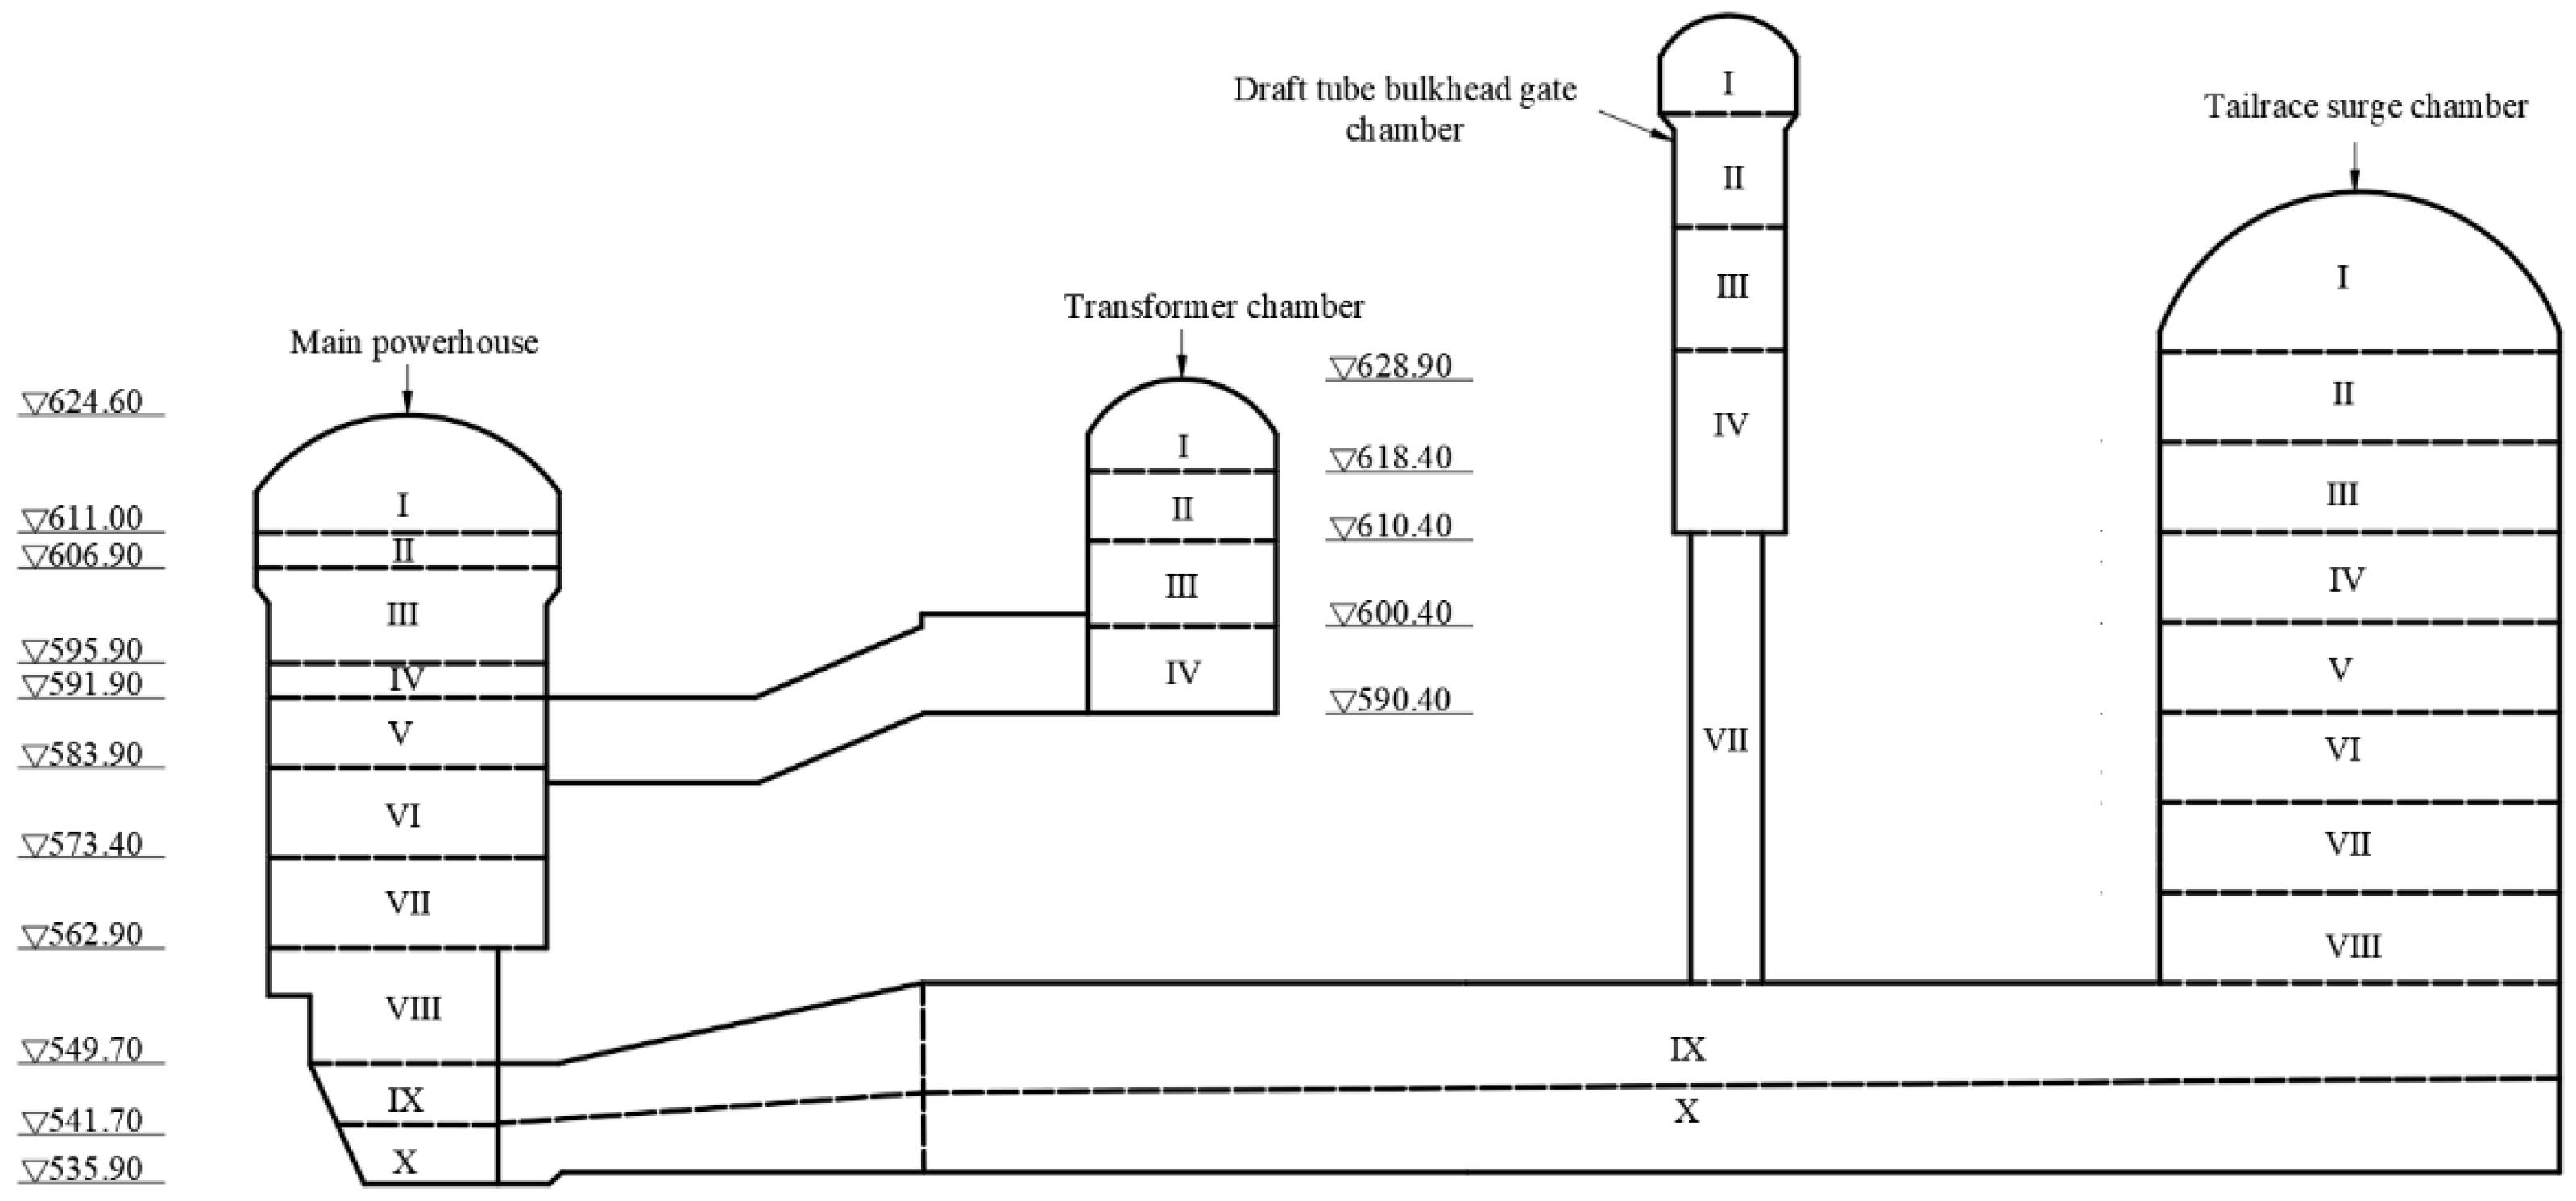
After the inversion analysis of the in situ stresses, the simulation of excavation was carried out. As shown in Figure 14, the underground caverns were excavated in 10 layers from top to bottom. The first layer was excavated from the elevation of 624.60 m in May 2014, and the entire excavation was completed at the elevation of 535.90 m in June 2018.
Figure 14.
Excavation sequence of the underground caverns. The letters I–X represent the numbers of excavation layer, and triangle represents elevation.
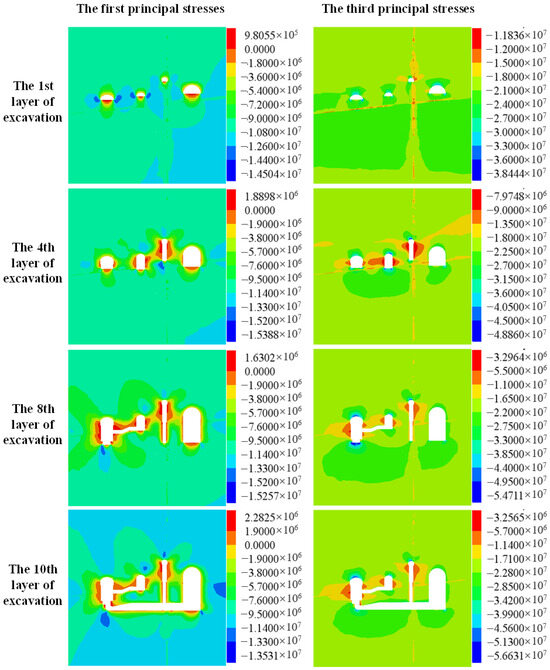
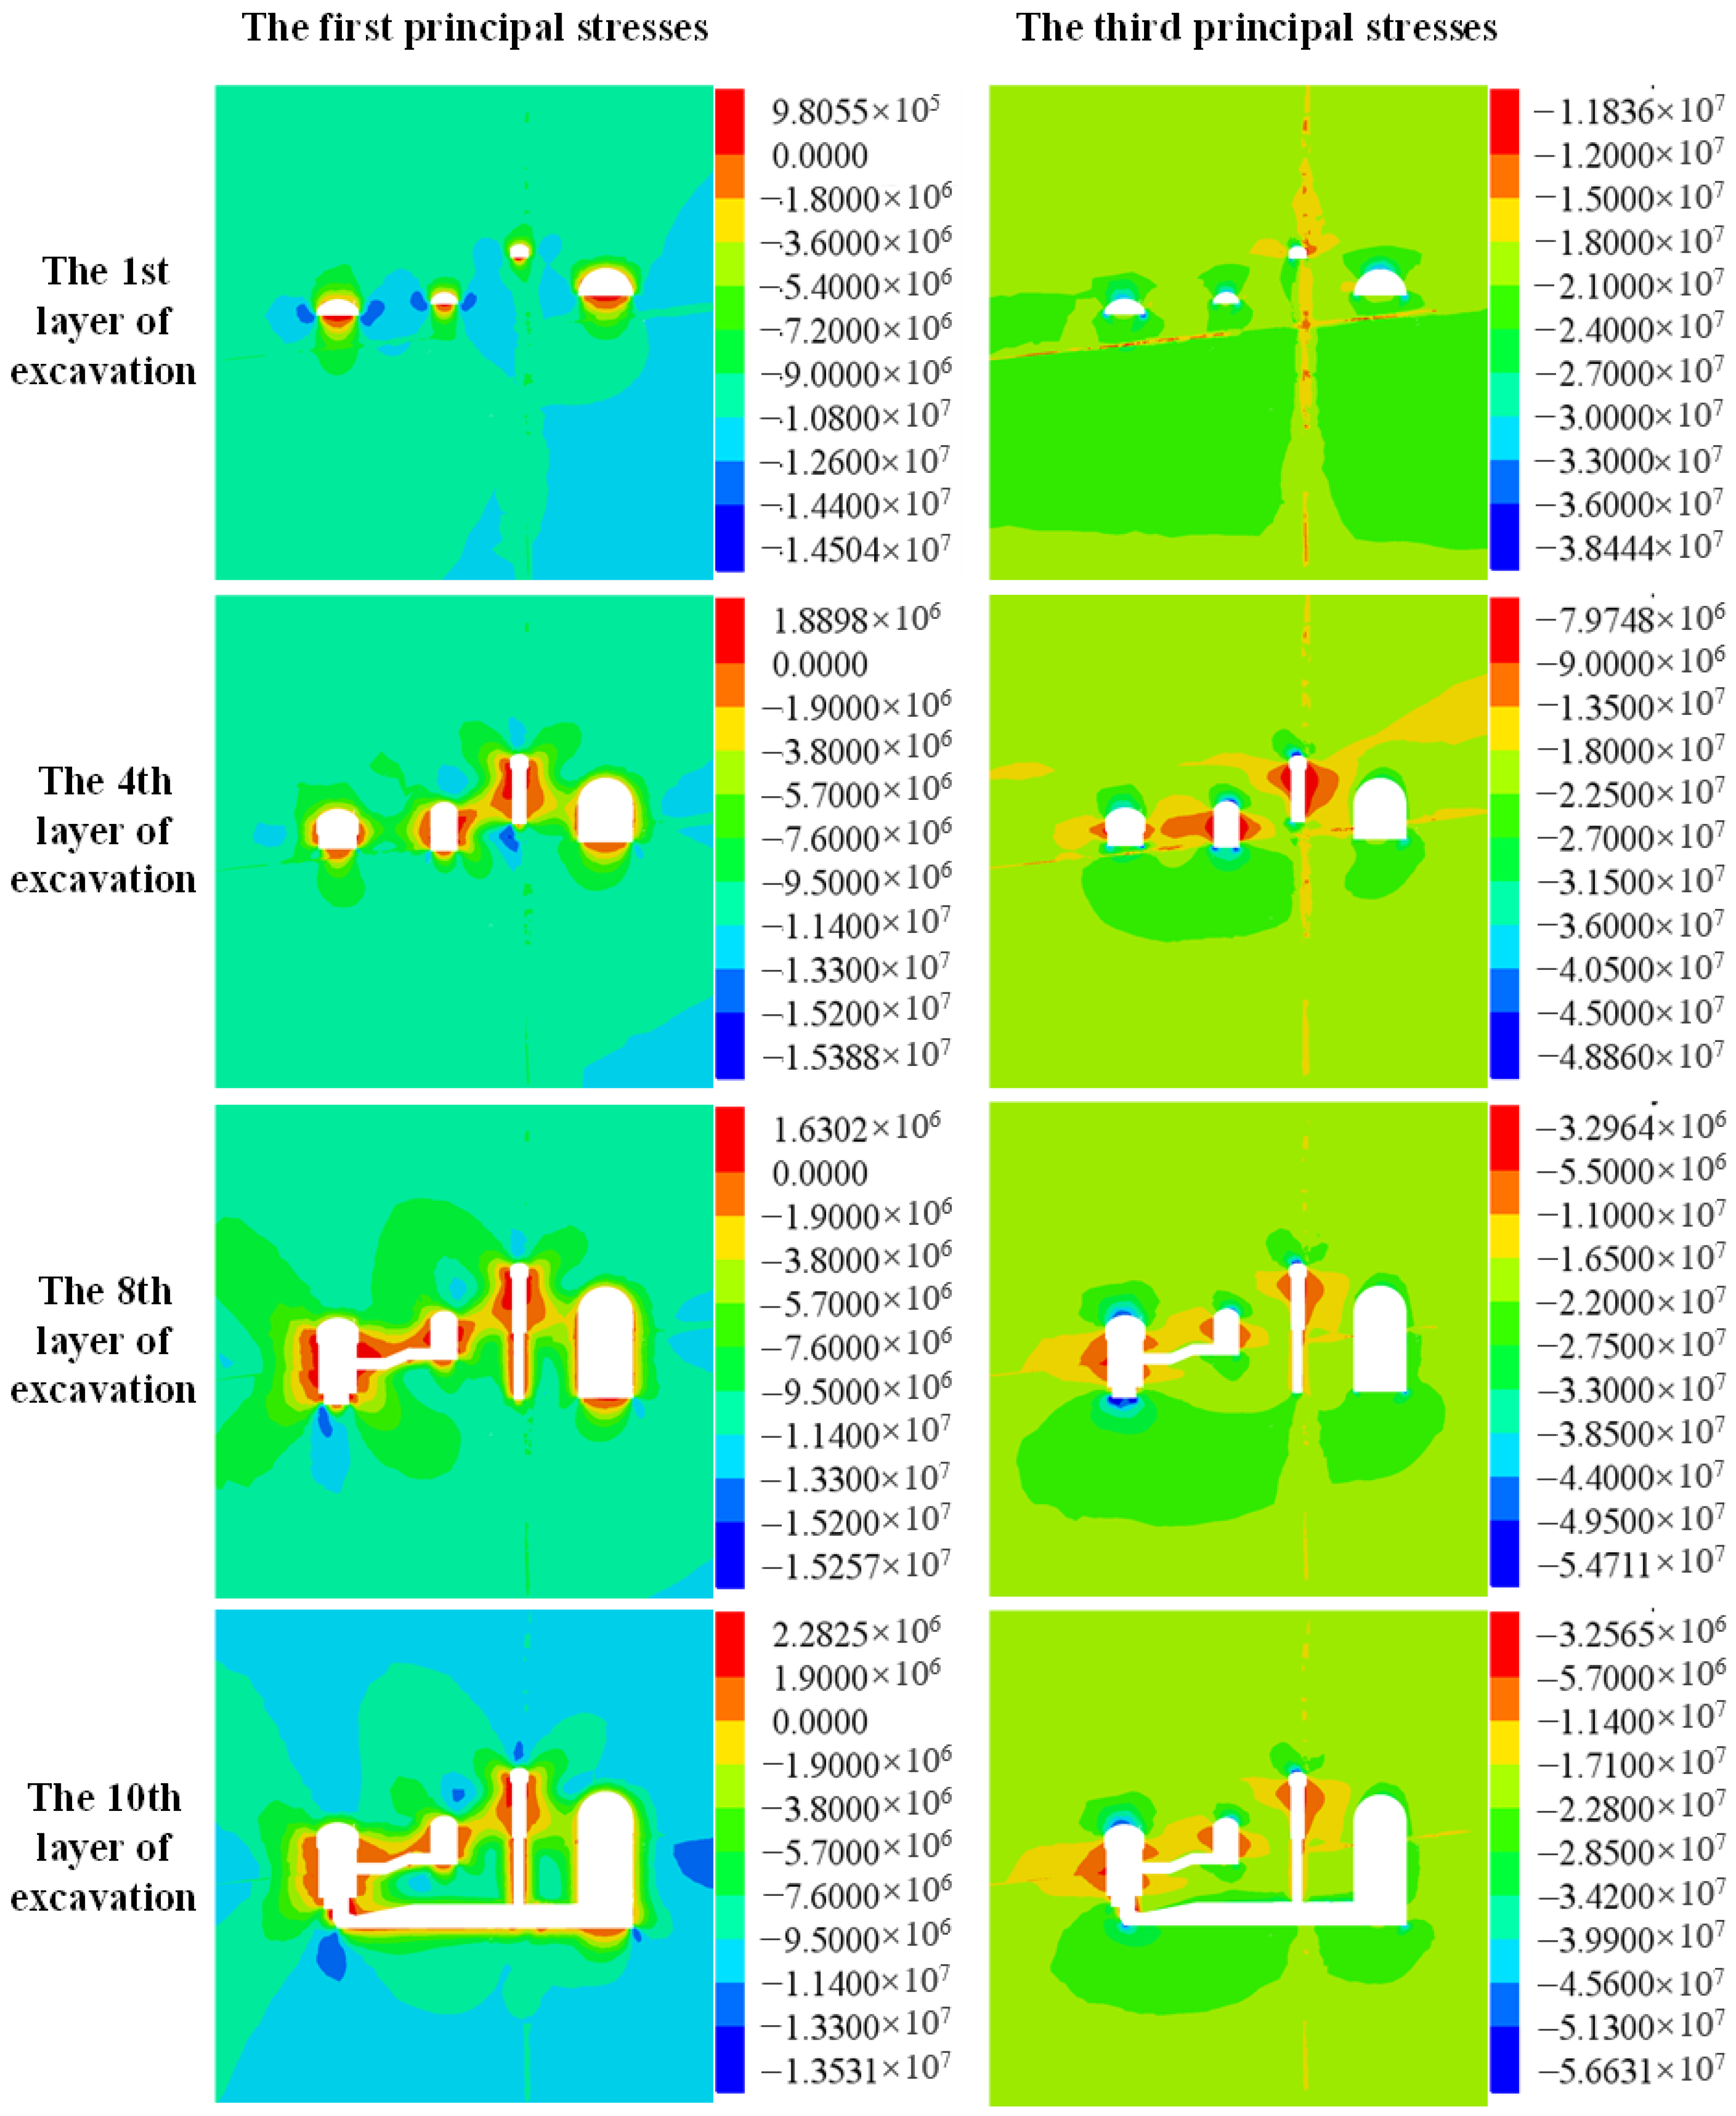
Taking the transverse section at chainage 0 + 114 m as an example, the distributions of principal stresses in the surrounding rock after the 1st, 4th, 8th, and 10th layer of excavation are illustrated in Figure 15. It shows that compressive stress concentrates at the crown arch and wall foot regions after the 1st layer of excavation. The maximum compressive stress is about 36 MPa and localized at the upstream crown arch. As the excavation proceeds, the maximum compressive stress at the upstream crown arch gradually increases. The maximum compressive stress reaches about 52 MPa after the 7th layer of excavation and 56 MPa after the entire excavation. In addition, compressive stress also concentrates at other regions, such as the wall feet and the floor.
Figure 15.
Distribution of the first and third principal stresses in the surrounding rock at chainage 0 + 114 m after the 1st, 4th, 8th, and 10th layer of excavation.
As illustrated by the principal stress distributions, the maximum compressive stress of the surrounding rock is 56 MPa. Although this stress does not exceed the uniaxial compressive strength of basalt, the surrounding rock has suffered different degrees of damage. This may be caused by the following reasons. Firstly, the failure of the surrounding rock may be controlled not by the uniaxial compressive strength but by the crack initiation stress of basalt, which is about 50 MPa, as illustrated in the following analysis. The maximum compressive stress exceeds the crack initiation stress, so the surrounding rock with excessive stress suffered failure. Secondly, the actual stress in the surrounding rock is greater than the simulated result under the influence of various uncertain factors. The difference between the monitoring and simulated displacements indicates that the actual stress of the surrounding rock is different from the simulated stress, because the displacement of the surrounding rock could linearly reflect its stress, as demonstrated in Section 2.
Therefore, predicting surrounding rock failure solely by comparing simulated stresses with rock strength proves unreliable. It is suggested to predict the surrounding rock failure by comparing measured displacement that reflects the influence of various uncertain factors with three levels of warning displacements determined by the proposed method.
4.2. Deformation of Surrounding Rock
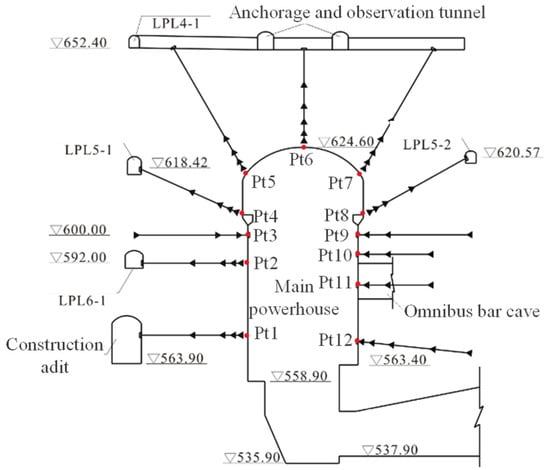
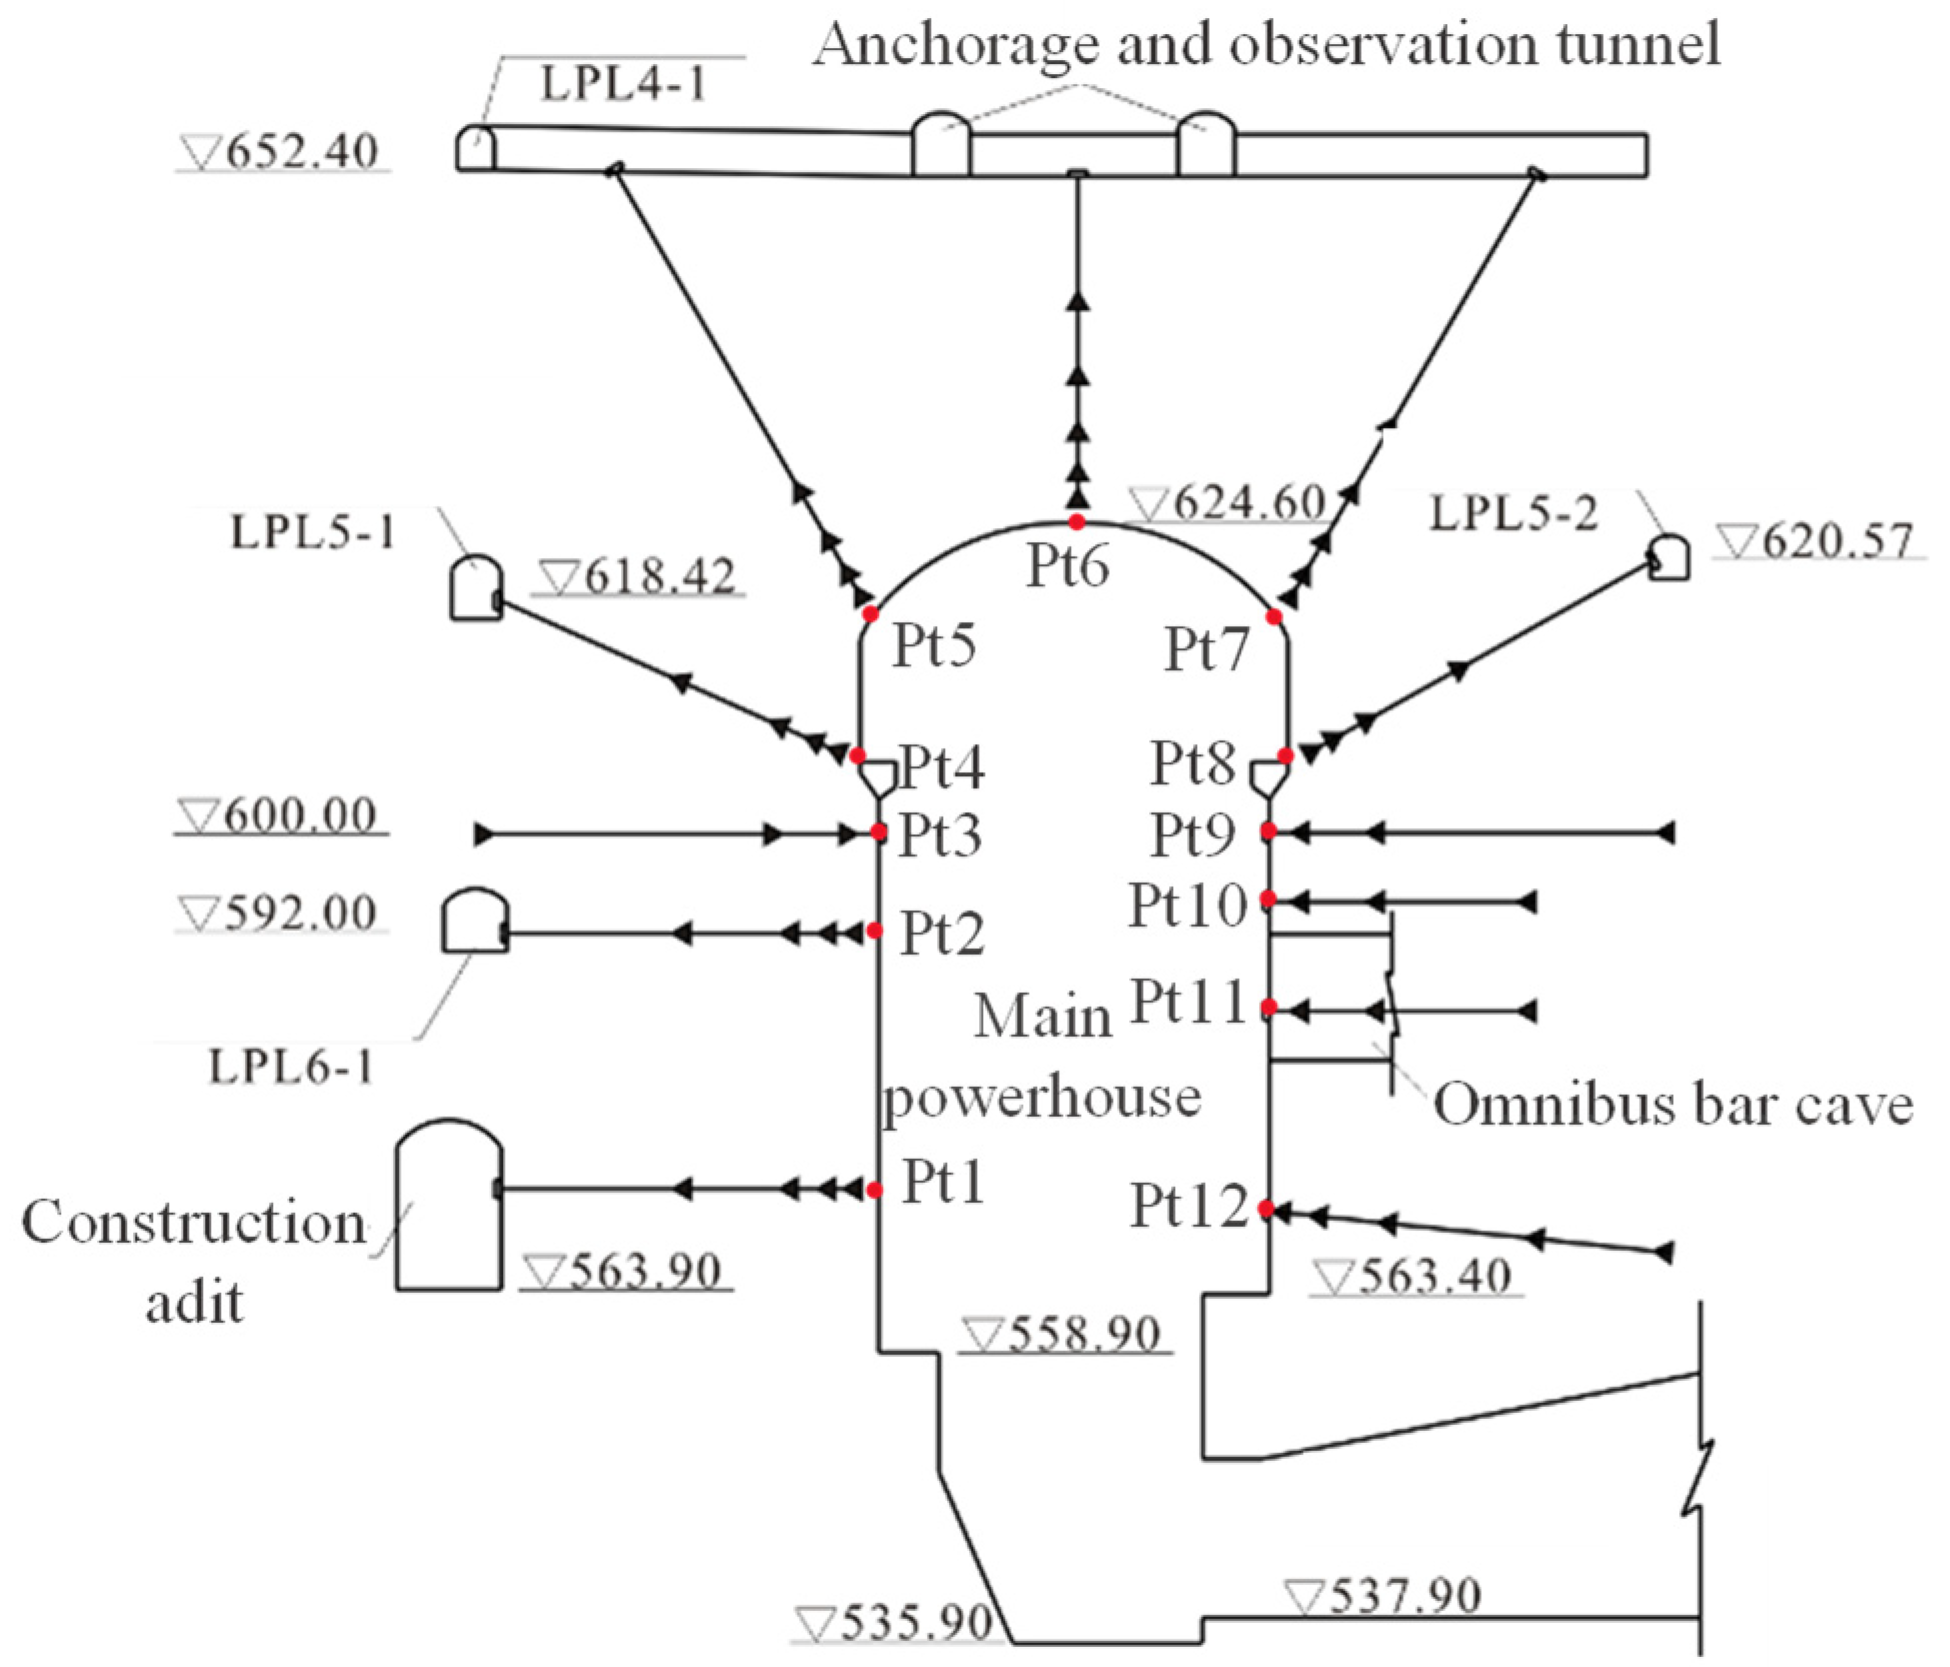
Along the left-bank main powerhouse axis, eight monitoring sections (0 − 052 m, 0 − 012 m, 0 + 018 m, 0 + 076 m, 0 + 152 m, 0 + 229 m, 0 + 267 m, and 0 + 328 m) were instrumented with multi-point displacement extensometers, as shown in Figure 6. A typical configuration at section 0 + 076 m is shown in Figure 16.
Figure 16.
Layout of multi-point borehole extensometers in the typical cross-section at 0 + 076 m. The arrows represent multi-point displacement extensometers, and red dots represent monitoring points.
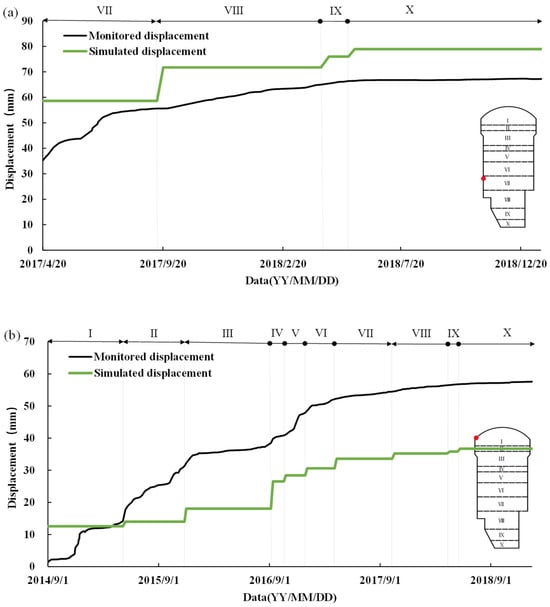
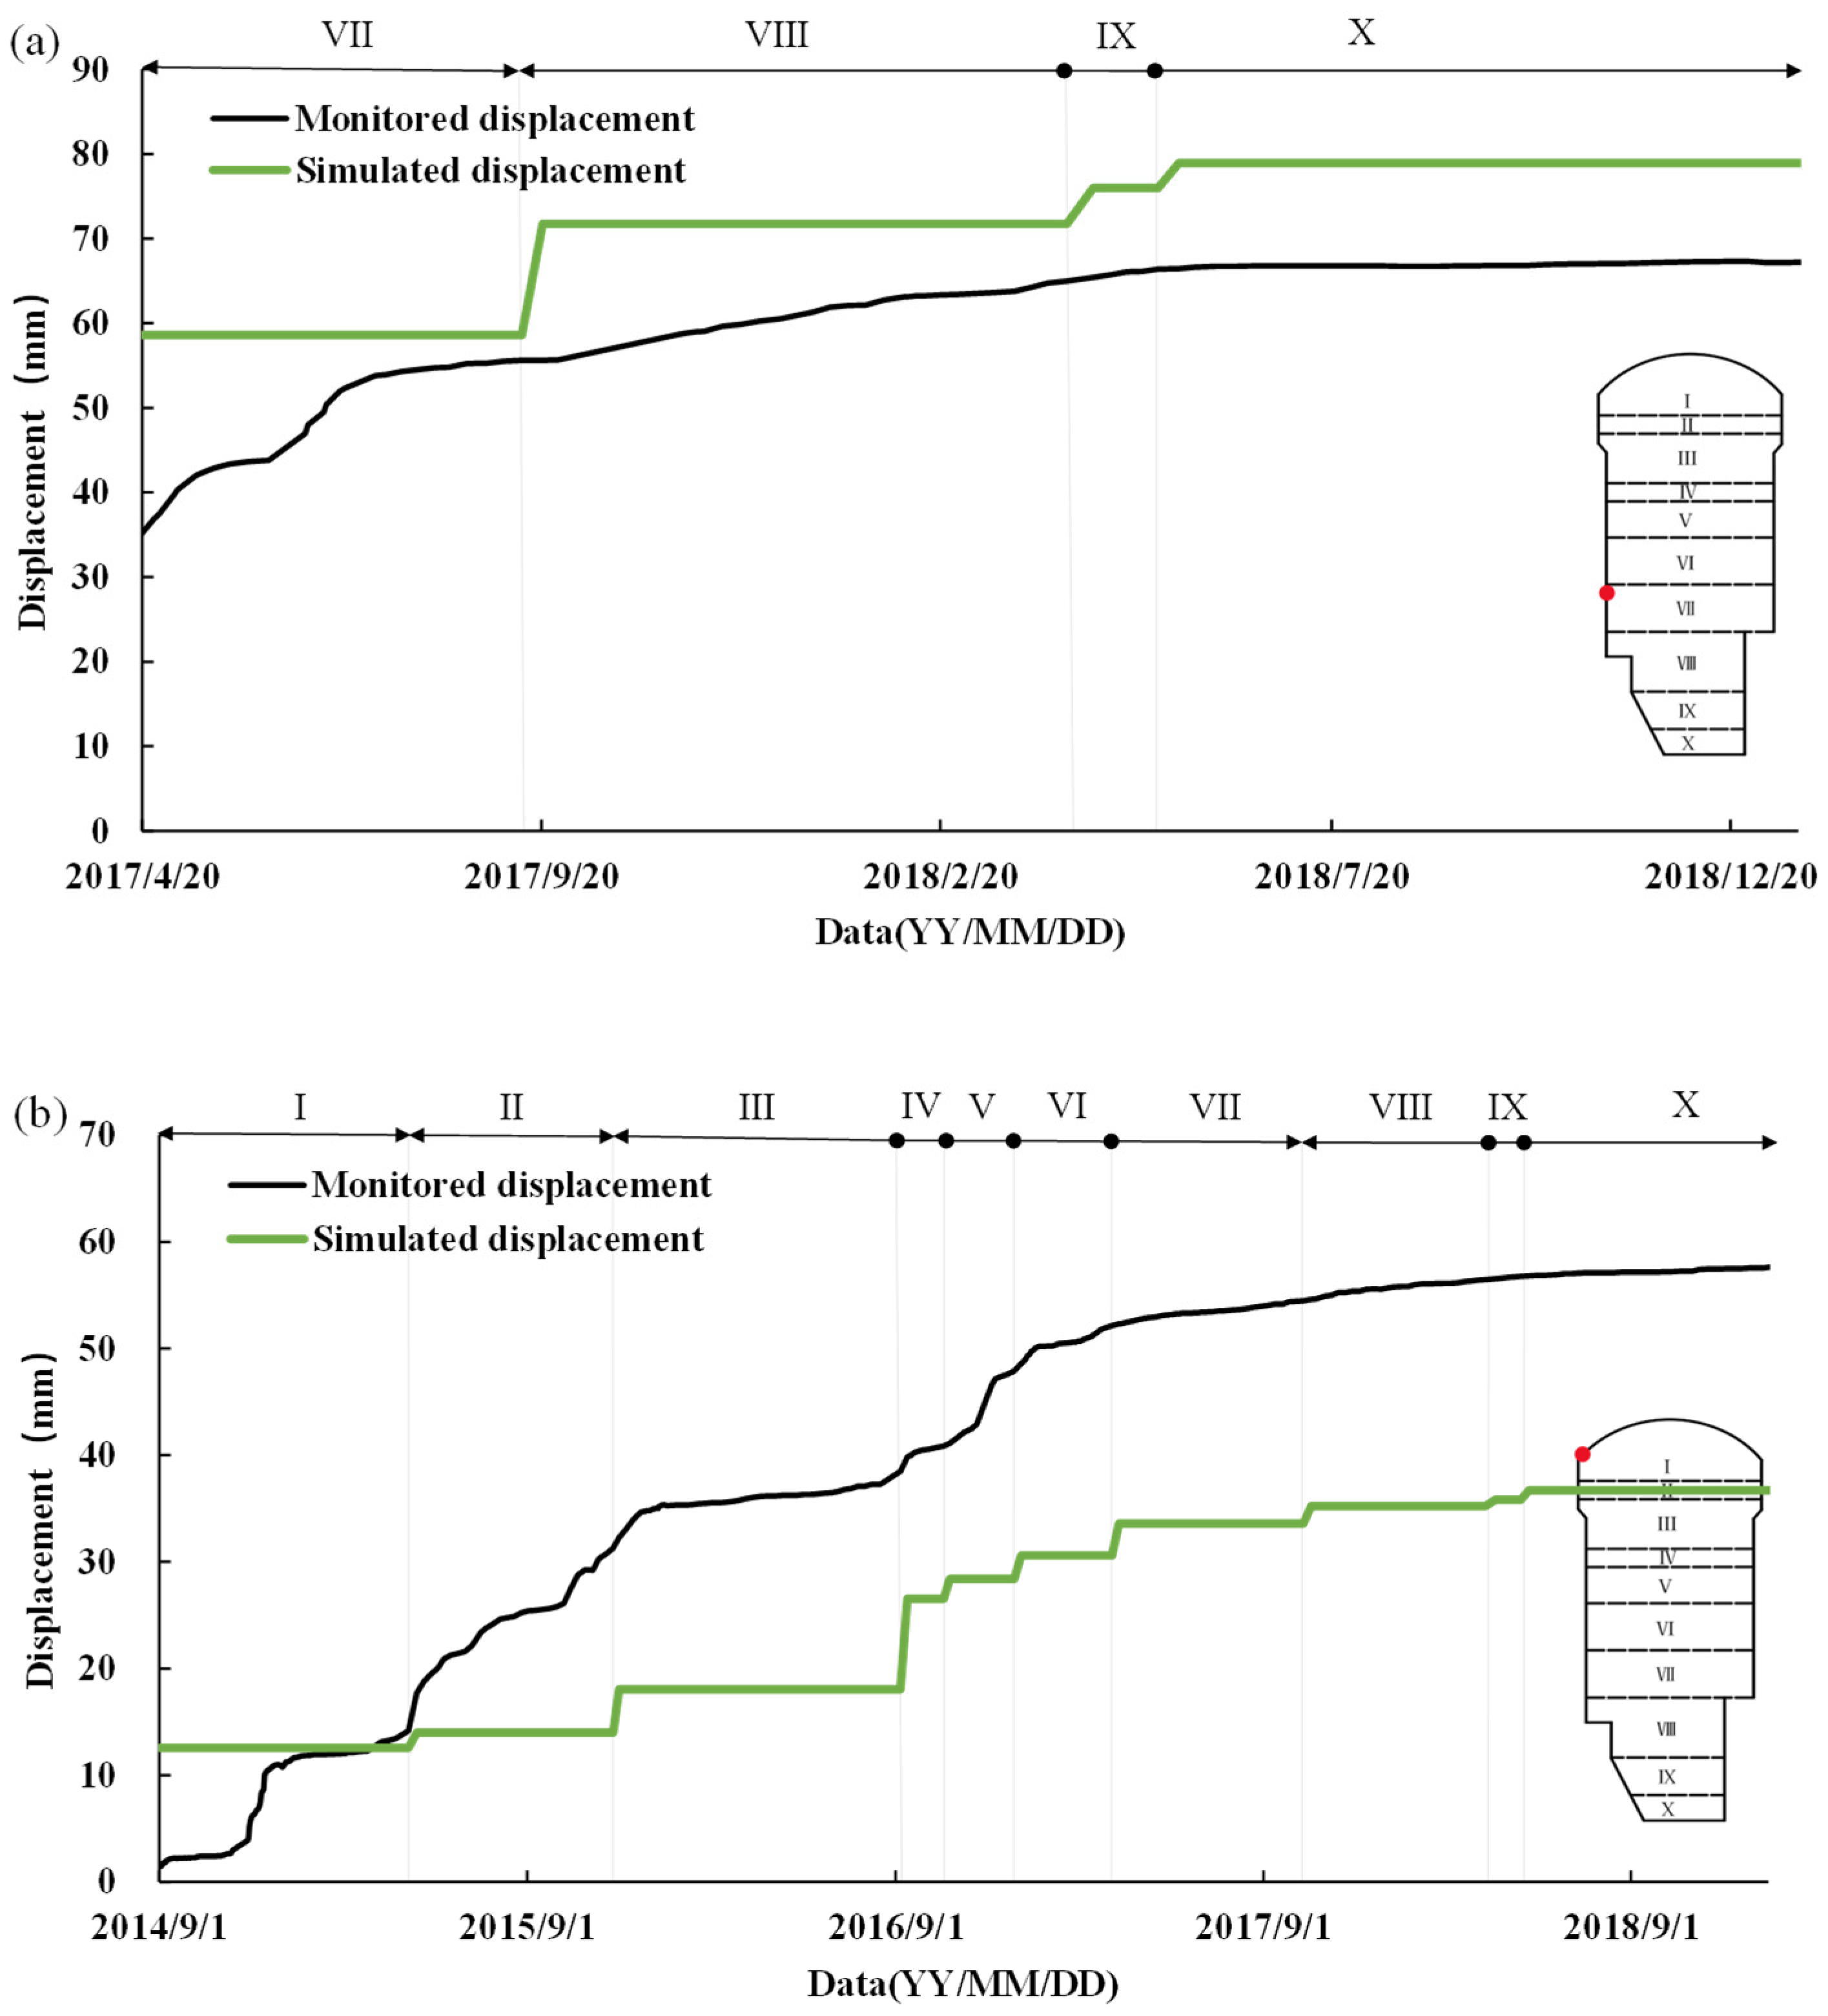
To investigate deformation characteristics during excavation, monitored and simulated displacements were compared at monitoring points in section 0 + 018 m: the upstream side wall and the upstream spandrel. Figure 17a illustrates the deformation at the upstream side wall monitoring point (elevation 571.9 m) increases during the excavation. The monitored displacements were close to the simulated displacements, so the simulated results could roughly represent the on-site state of the surrounding rock. The simulation reveals that the maximum circumferential stress at this monitoring point during excavation was 10.79 MPa, which did not exceed the crack initiation stress of the surrounding rock, so the surrounding rock was in an elastic state. The monitored and simulated displacements of another point at the upstream spandrel are presented in Figure 17b. Although both its monitored and simulated displacements increase during the excavation, the monitored displacements were significantly larger than the simulated displacements, so the simulated results differ significantly from the on-site situation. The maximum simulated circumferential stress at this point during excavation is 55.70 MPa, and the greater monitored displacement demonstrates that the on-site stress of the surrounding rock is much greater than the simulated stress. This can be verified by the on-site failure observations, which show that severe spalling failure occurred around this monitoring point. There are differences between the monitored and simulated displacements because the geological conditions are more complicated than expected. No matter how finely numerical simulations are considered, it is still difficult to accurately reflect the on-site geological conditions. Thus, the safety state of the surrounding rock must be predicted by comparing monitoring displacements with warning displacements, but not by comparing simulated stress with rock strength or comparing simulated displacement with warning displacements.
Figure 17.
The monitored and simulated displacements of two monitoring points in the section 0 + 018 m: (a) upstream side wall at the elevation of 571.9 m and (b) upstream spandrel at the elevation of 616.9 m. The letters I–X represent the numbers of excavation layer, and red dot represents monitoring point.
4.3. Deformation Flexibility of Surrounding Rock
Deformation flexibilities at monitoring points were calculated using the method detailed in Section 2.2. Because deformation flexibility depends on not only in situ stresses and deformation parameters of surrounding rock, but also excavation shape and position of surrounding rock, its magnitude and evolutionary trends during excavation vary significantly with positions around the cavern. For example, deformation flexibilities in the section 0 + 018 m are presented in Table 4. During progressive excavation, most of the monitoring points show an increasing trend with the excavation process, while the crown monitoring point exhibits a progressively decreasing trend.
Table 4.
Deformation flexibilities in the section 0 + 018 m.
5. Deformation Warning of the Baihetan Left-Bank Underground Powerhouse
5.1. Analysis of Warning Stresses
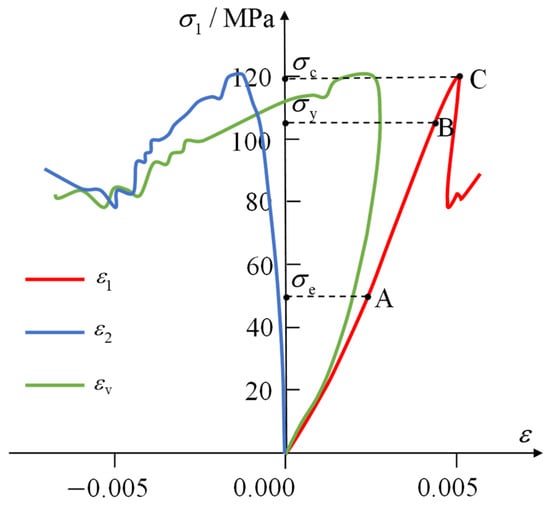
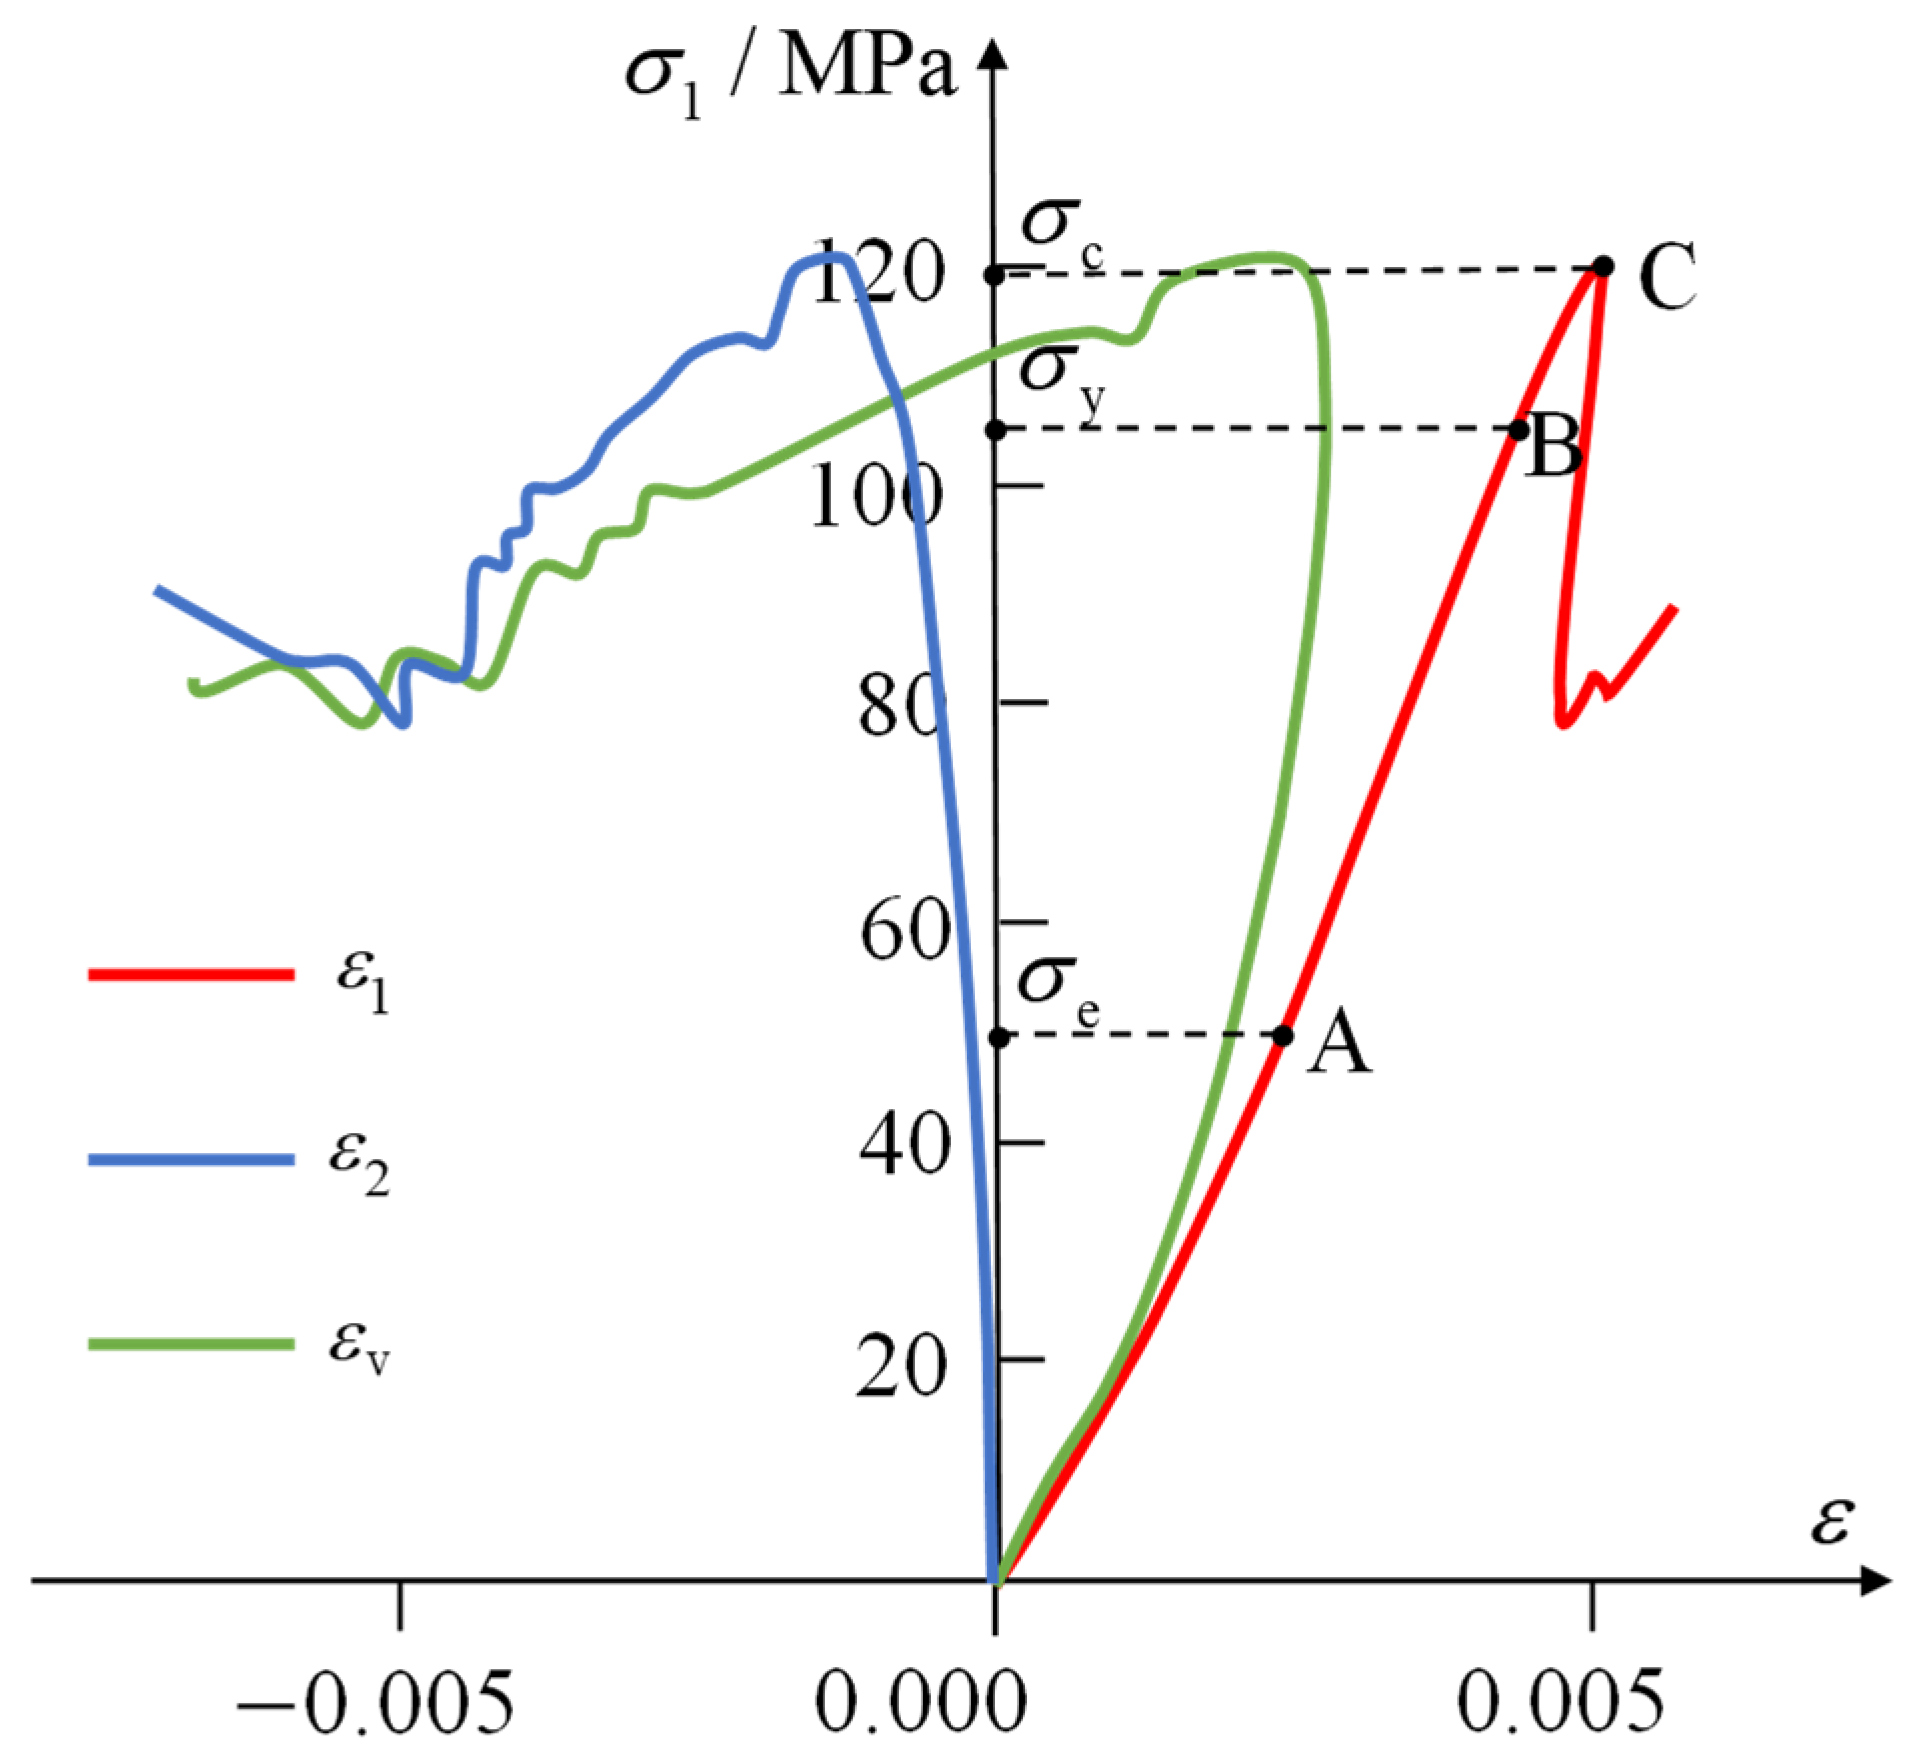
The stress–strain curves of the Baihetan basalt [52] are shown in Figure 18. From the figure, it can be seen that the crack initiation stress, dilatancy stress, and uniaxial compressive strength are 50 MPa (point A), 105 MPa (point B), and 119 MPa (point C), respectively.
Figure 18.
Stress–strain curves of the Baihetan basalt under uniaxial compression. Points A, B, and C correspond to the crack initiation stress, expansion stress, and uniaxial compressive strength, respectively.
Following the determination of the warning stresses, circumferential stresses at all the monitoring points after each layer of excavation were extracted from numerical simulations. Table 5 lists these stresses at section 0 + 018 m. As excavation proceeded, circumferential stresses at the vault and upstream spandrel showed continuous increases, while stresses elsewhere decreased. By the seventh excavation layer, the vault stress had gradually accumulated and finally exceeded the blue warning stress. Upon its exposure, the upstream spandrel also registered circumferential stress above the blue warning threshold. When first exposed, the circumferential stresses at the downstream side wall (el. 592 m) and downstream spandrel monitoring points approximated the blue warning stress, but these stresses declined with advancing excavation. The circumferential stresses of other positions in this section remained below the blue warning stress.
Table 5.
Circumferential stresses simulated at monitoring points in section 0 + 018 m.
5.2. Analysis of Warning Displacements
Based on the warning stresses and deformation flexibilities discussed above, warning displacement thresholds were calculated for each excavation layer. Table 6 summarizes these thresholds for all monitoring points in section 0 + 018 m. These thresholds exhibit significant spatial heterogeneity due to distinct monitoring locations. Meanwhile, for any given monitoring point, the threshold varies across excavation layers. The warning displacement of the vault gradually decreases, while warning displacements at other monitoring points increase with excavation. Due to the greater deformation flexibility of the side walls, their warning displacements are significantly larger than those of the top arch.
Table 6.
The warning displacements at the monitoring points in the section of 0 + 018 m.
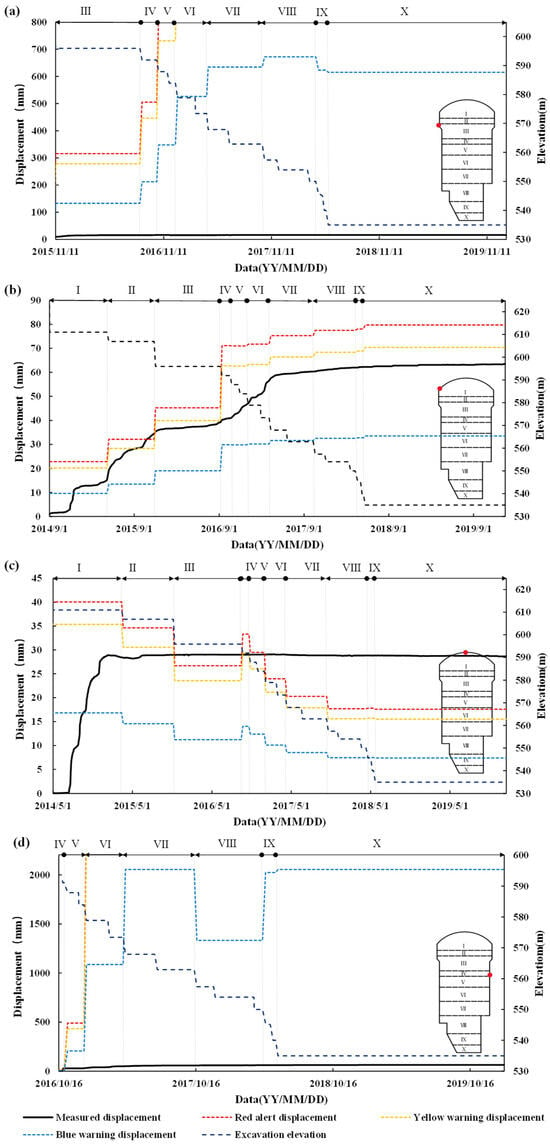
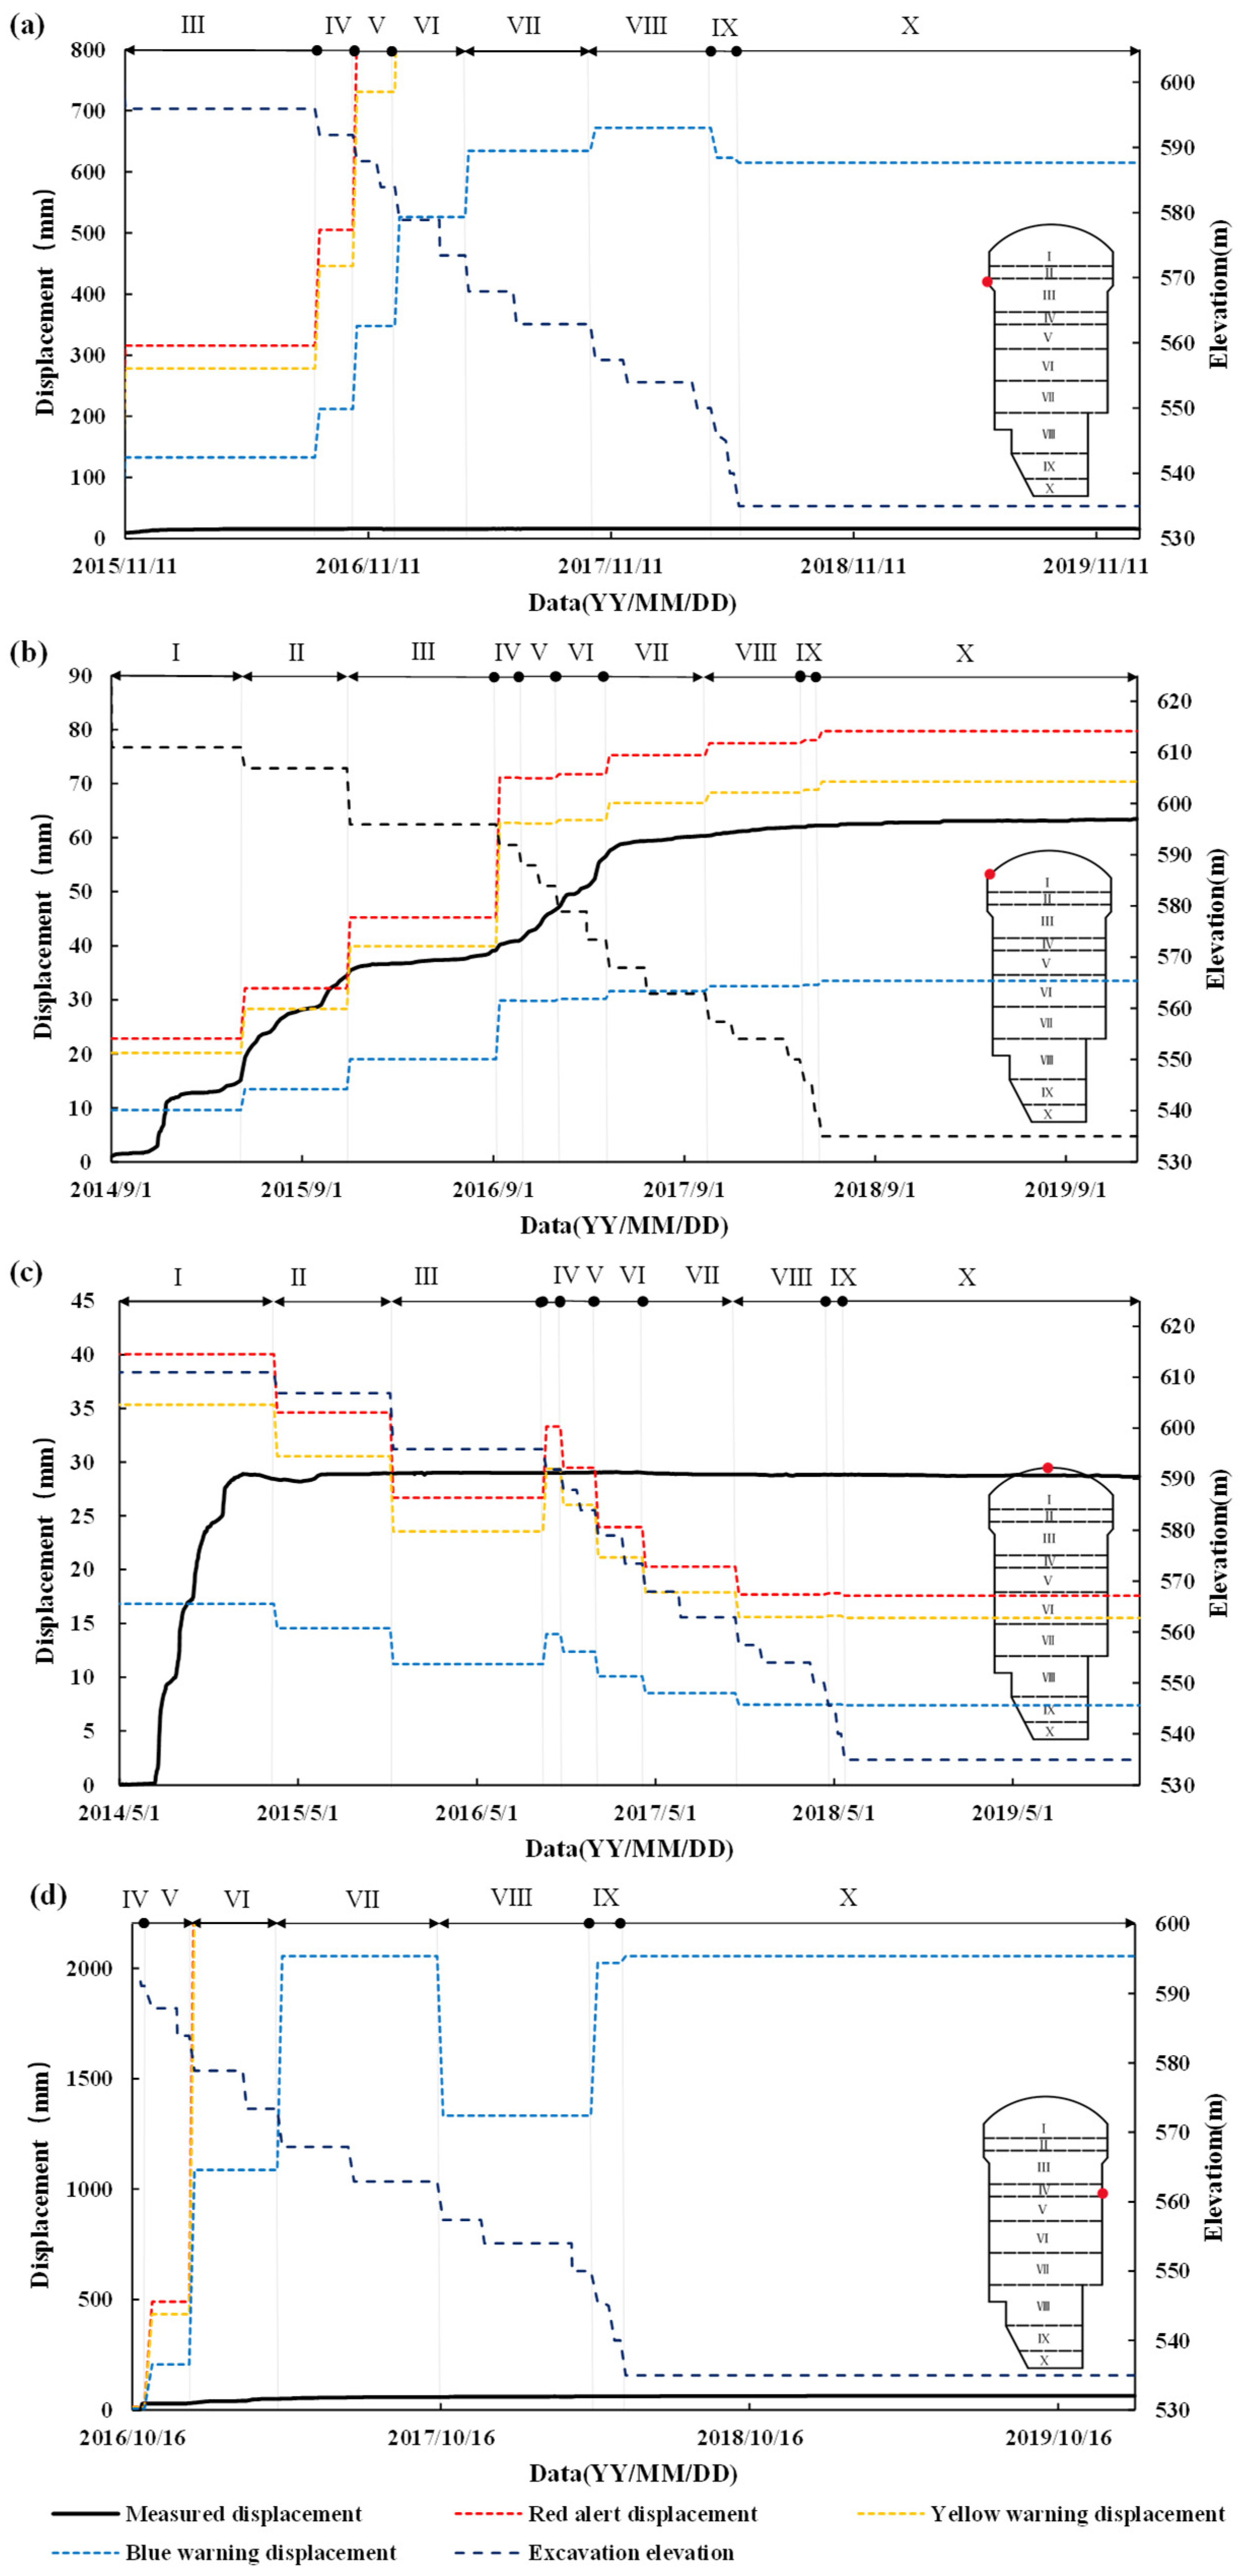
Determination of surrounding rock warning status relies on comparison between monitored displacement against warning displacement. Safety status is assigned when displacement remains below the blue warning threshold, blue warning status triggers when displacement falls between the blue and yellow thresholds, yellow warning status activates when displacement falls between yellow and red thresholds, and red alert status is declared when displacement exceeds the red threshold. For illustration, Figure 19 demonstrates the warning status evaluation of four monitoring points in the section 0 + 018 m by comparing their monitored displacements against the corresponding warning displacements.
Figure 19.
Monitored deformation and warning deformation curves of some monitoring points in the section of 0 + 018 m: (a) Pt4, (b) Pt5, (c) Pt6, and (d) Pt9. The letters I–X represent the numbers of excavation layer.
As indicated in Figure 19a, the monitored displacements at Pt4 (elevation 605.7 m) on the upstream side wall consistently remained below the blue warning threshold, indicating the rock condition is stable. As shown in Figure 19b, the displacement at Pt5 exceeded the blue warning limit after the first excavation layer, suggesting potential crack initiation. It further surpassed the red alert threshold following the second excavation layer, dropped to the yellow warning threshold following the third excavation layer, and subsequently stabilized within the blue warning range during later excavation stages. The red alert at the upstream spandrel following the second excavation layer confirmed severe damage to the surrounding rock during this phase. Figure 19 c reveals that the vault (Pt6) triggered blue warnings during the 1st, 2nd, and 4th layers of excavation. Consequently, cracking likely developed around the vault during the excavation from elevation 624.6 m to 606.9 m, while displacements exceeded the red alert displacement during the 3rd and 6th–10th layers of excavation, indicating potential critical damage. In Figure 19d, downstream side wall point Pt9 initiated a blue warning during the 4th excavation layer (excavation to elevation 591.9 m), when its displacement exceeded the blue warning threshold. Following the fifth excavation layer, the warning status returned to safe.
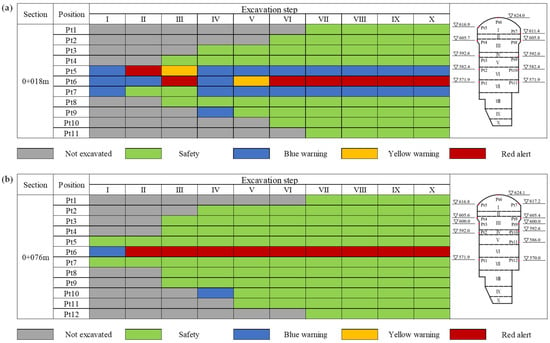
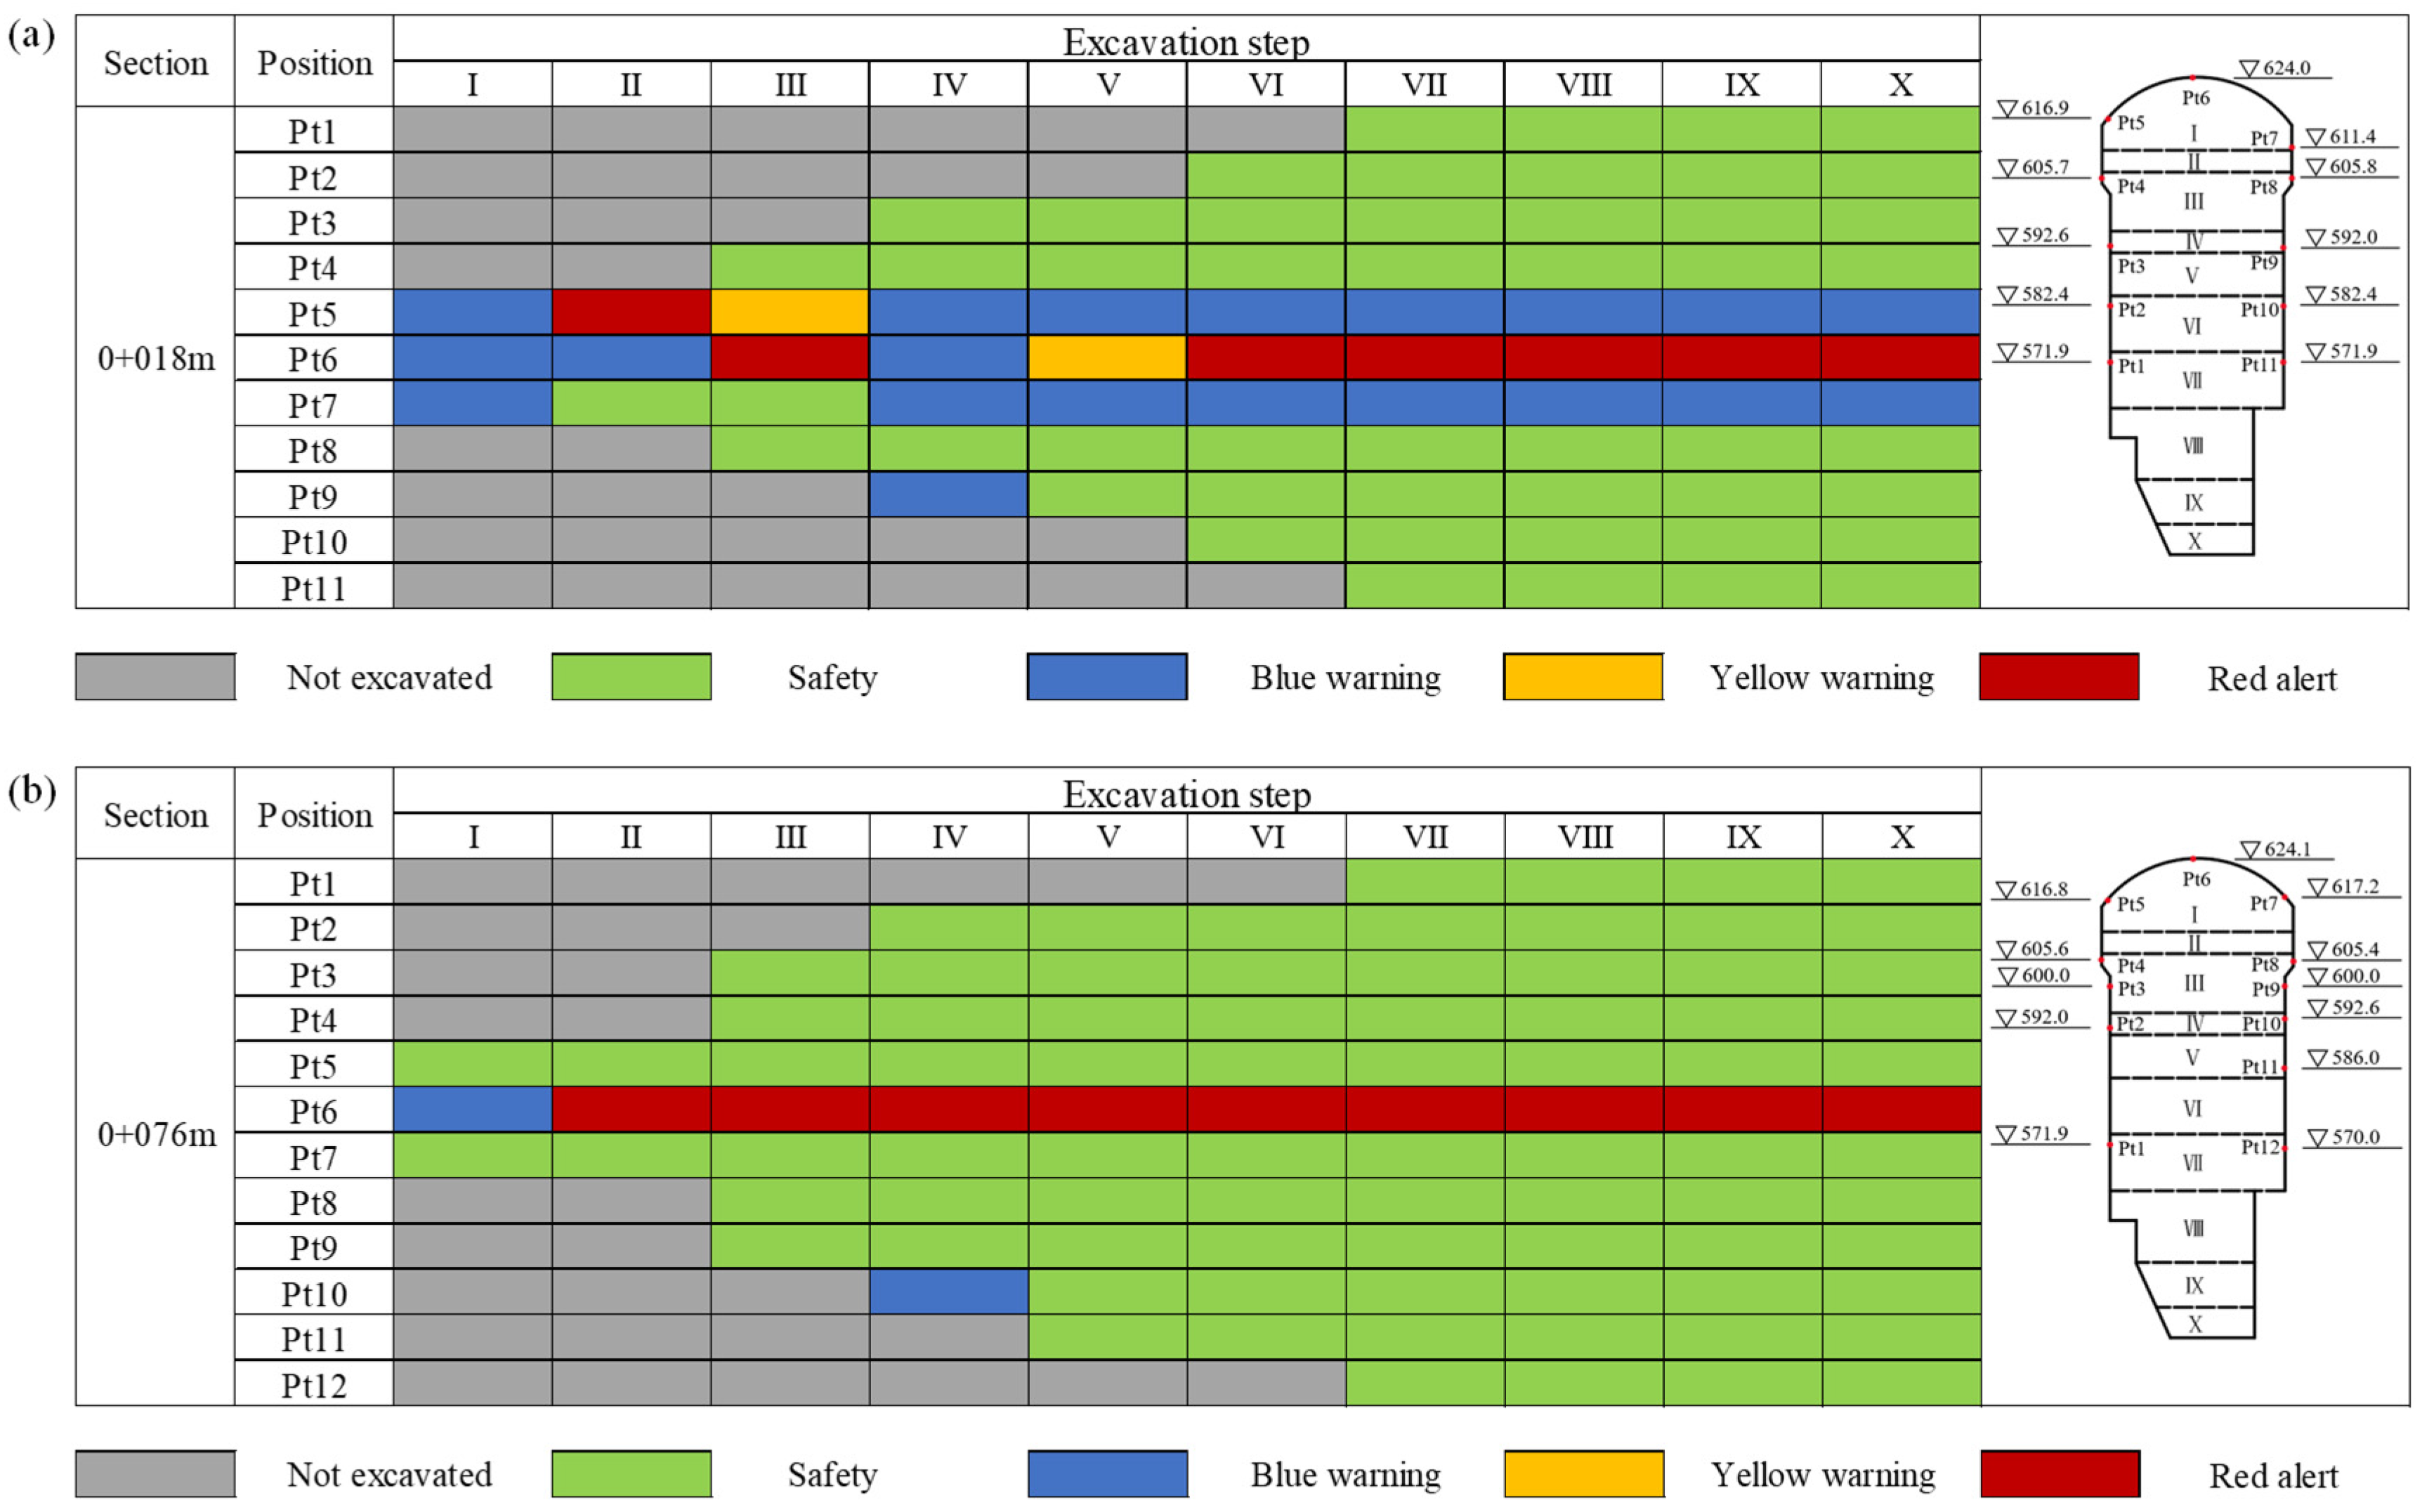
To further analyze warning statuses, monitoring sections of 0 + 018 m and 0 + 076 m were selected to compare monitored deformations at all monitoring points against the warning thresholds. Figure 20 displays the warning statuses of these points after each layer of excavation. It reveals that the upstream spandrel at the section of 0 + 018 m triggered multiple warnings during excavation, including red alerts, which indicates frequent and severe damage to the surrounding rock. The vault also repeatedly activated red alert throughout excavation, which suggests critical rock failure. Additionally, blue warnings were triggered at the downstream spandrel and Pt9, when they were first exposed during excavation, signifying crack initiation and minor damage. All other positions in the section 0 + 018 m remained consistently safe. At the section of 0 + 076 m, the rock around the vault consistently reached red alert during the entire excavation process, which confirms severe damage. The Pt9 initiated a blue warning during the fourth excavation layer when newly exposed, and it initially showed minor cracking and subsequently stabilized to safe conditions in later excavation stages. All remaining monitoring points in the section maintained safe statuses throughout excavation.
Figure 20.
Warning statuses of the monitoring points in the sections: (a) the section 0 + 018 m and (b) the section 0 + 076 m. The letters I–X represent the numbers of excavation layer, and the red dots represent monitoring points.
5.3. Comparison with On-Site Failure of Surrounding Rock
The surrounding rock is predominantly composed of brittle rock and exhibits in situ stresses generally ranging from 19 to 23 MPa. The maximum measured horizontal stress reaches 33.39 MPa, which falls into the high in situ stress level. Such high stress induced some failures of the surrounding rock, which mainly manifested as spalling, crack failure, and relaxation collapse.
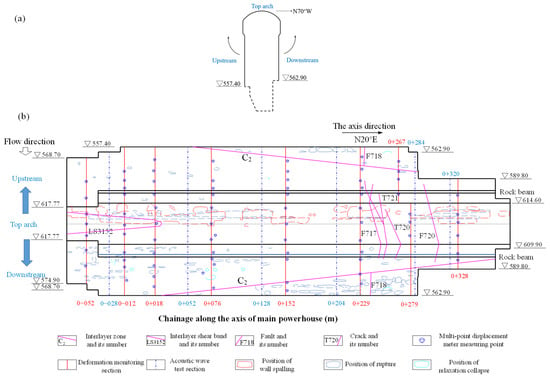
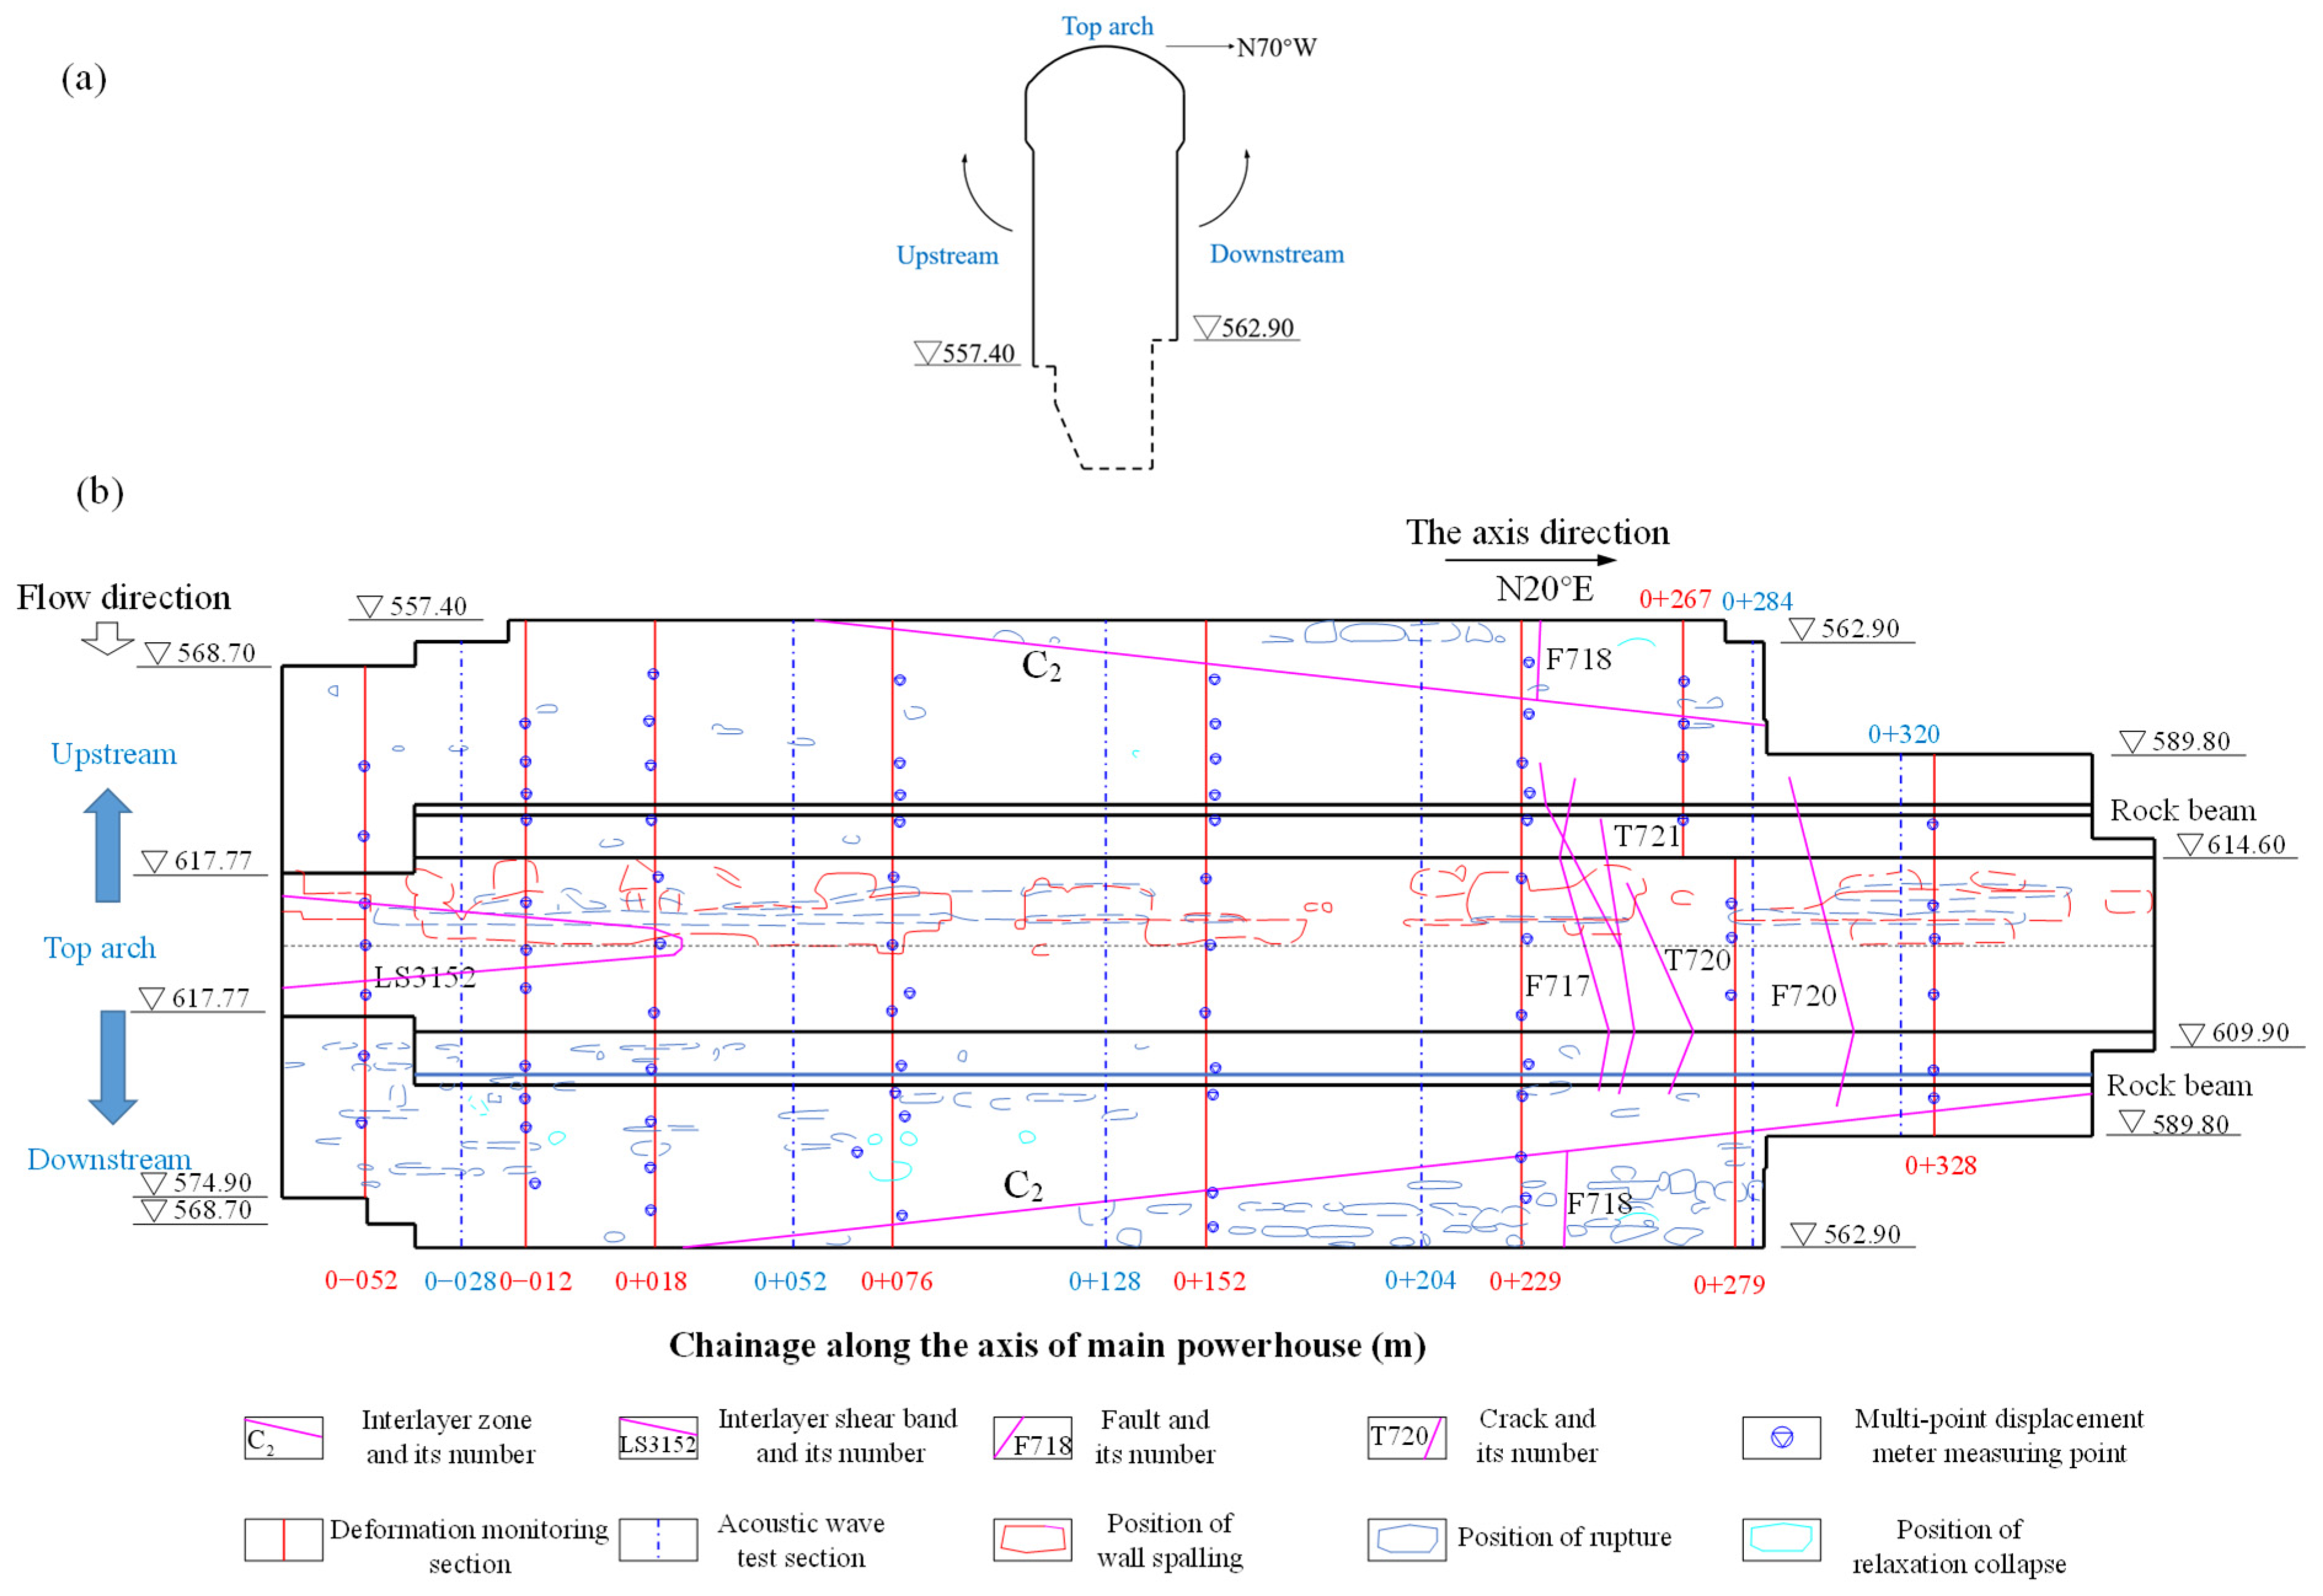
To assess the accuracy of the warning predictions, the results were compared against actual on-site rock failures. The powerhouse was unfolded into a plane to clearly visualize the surrounding rock failure, as shown in Figure 21a. Figure 21b shows the distribution of the failures. Red closed curves signify spalling areas, where spalling frequently occurred during construction and was occasionally accompanied by rock bursting sounds. The spalling depth initially ranged from 10 to 30 cm after excavation, and the depth of some spalling failures reached 50–70 cm or increased to a maximum of 200 cm. The spalling commonly occurred in the vault near the spandrel and was continuously distributed along the axis, and the spalling width perpendicular to the cavern axis was generally 3–5 m (up to 8 m). This is because the first principal stress direction intersects the powerhouse axis at a large angle and dips gently toward the upstream side wall, which causes stress concentration around the upstream spandrel. Blue closed curves represent crack failure zones, which refer to rock failures caused by high in situ stresses and mainly occurred in intact or relatively intact rock masses. Crack failures are concentrated at the upstream crown arch, the downstream bottom corners of the excavation, and the upstream side wall. The failure surfaces are nearly parallel to the free face and dip toward the free face at a moderate angle. The crack depth is 10–30 cm (up to 50–150 cm). Cyan closed curves denote relaxation collapse zones. Relaxation collapses mainly occurred in some sections of the main and auxiliary powerhouses. It is caused by poor integrity of the surrounding rock and untimely support after excavation; consequently, it is beyond the proposed method’s analysis scope.
Figure 21.
On-site failure distribution around the main powerhouse: (a) illustration of the unfolding method, and (b) on-site distributions of failures on the unfolded plane. Dashed lines represent arch lines, and triangle represent elevation.
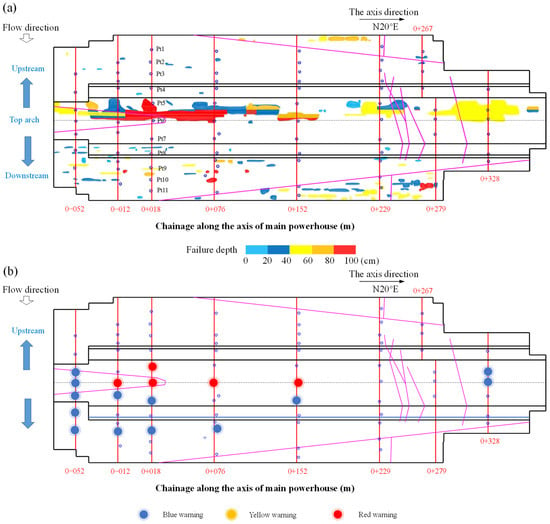
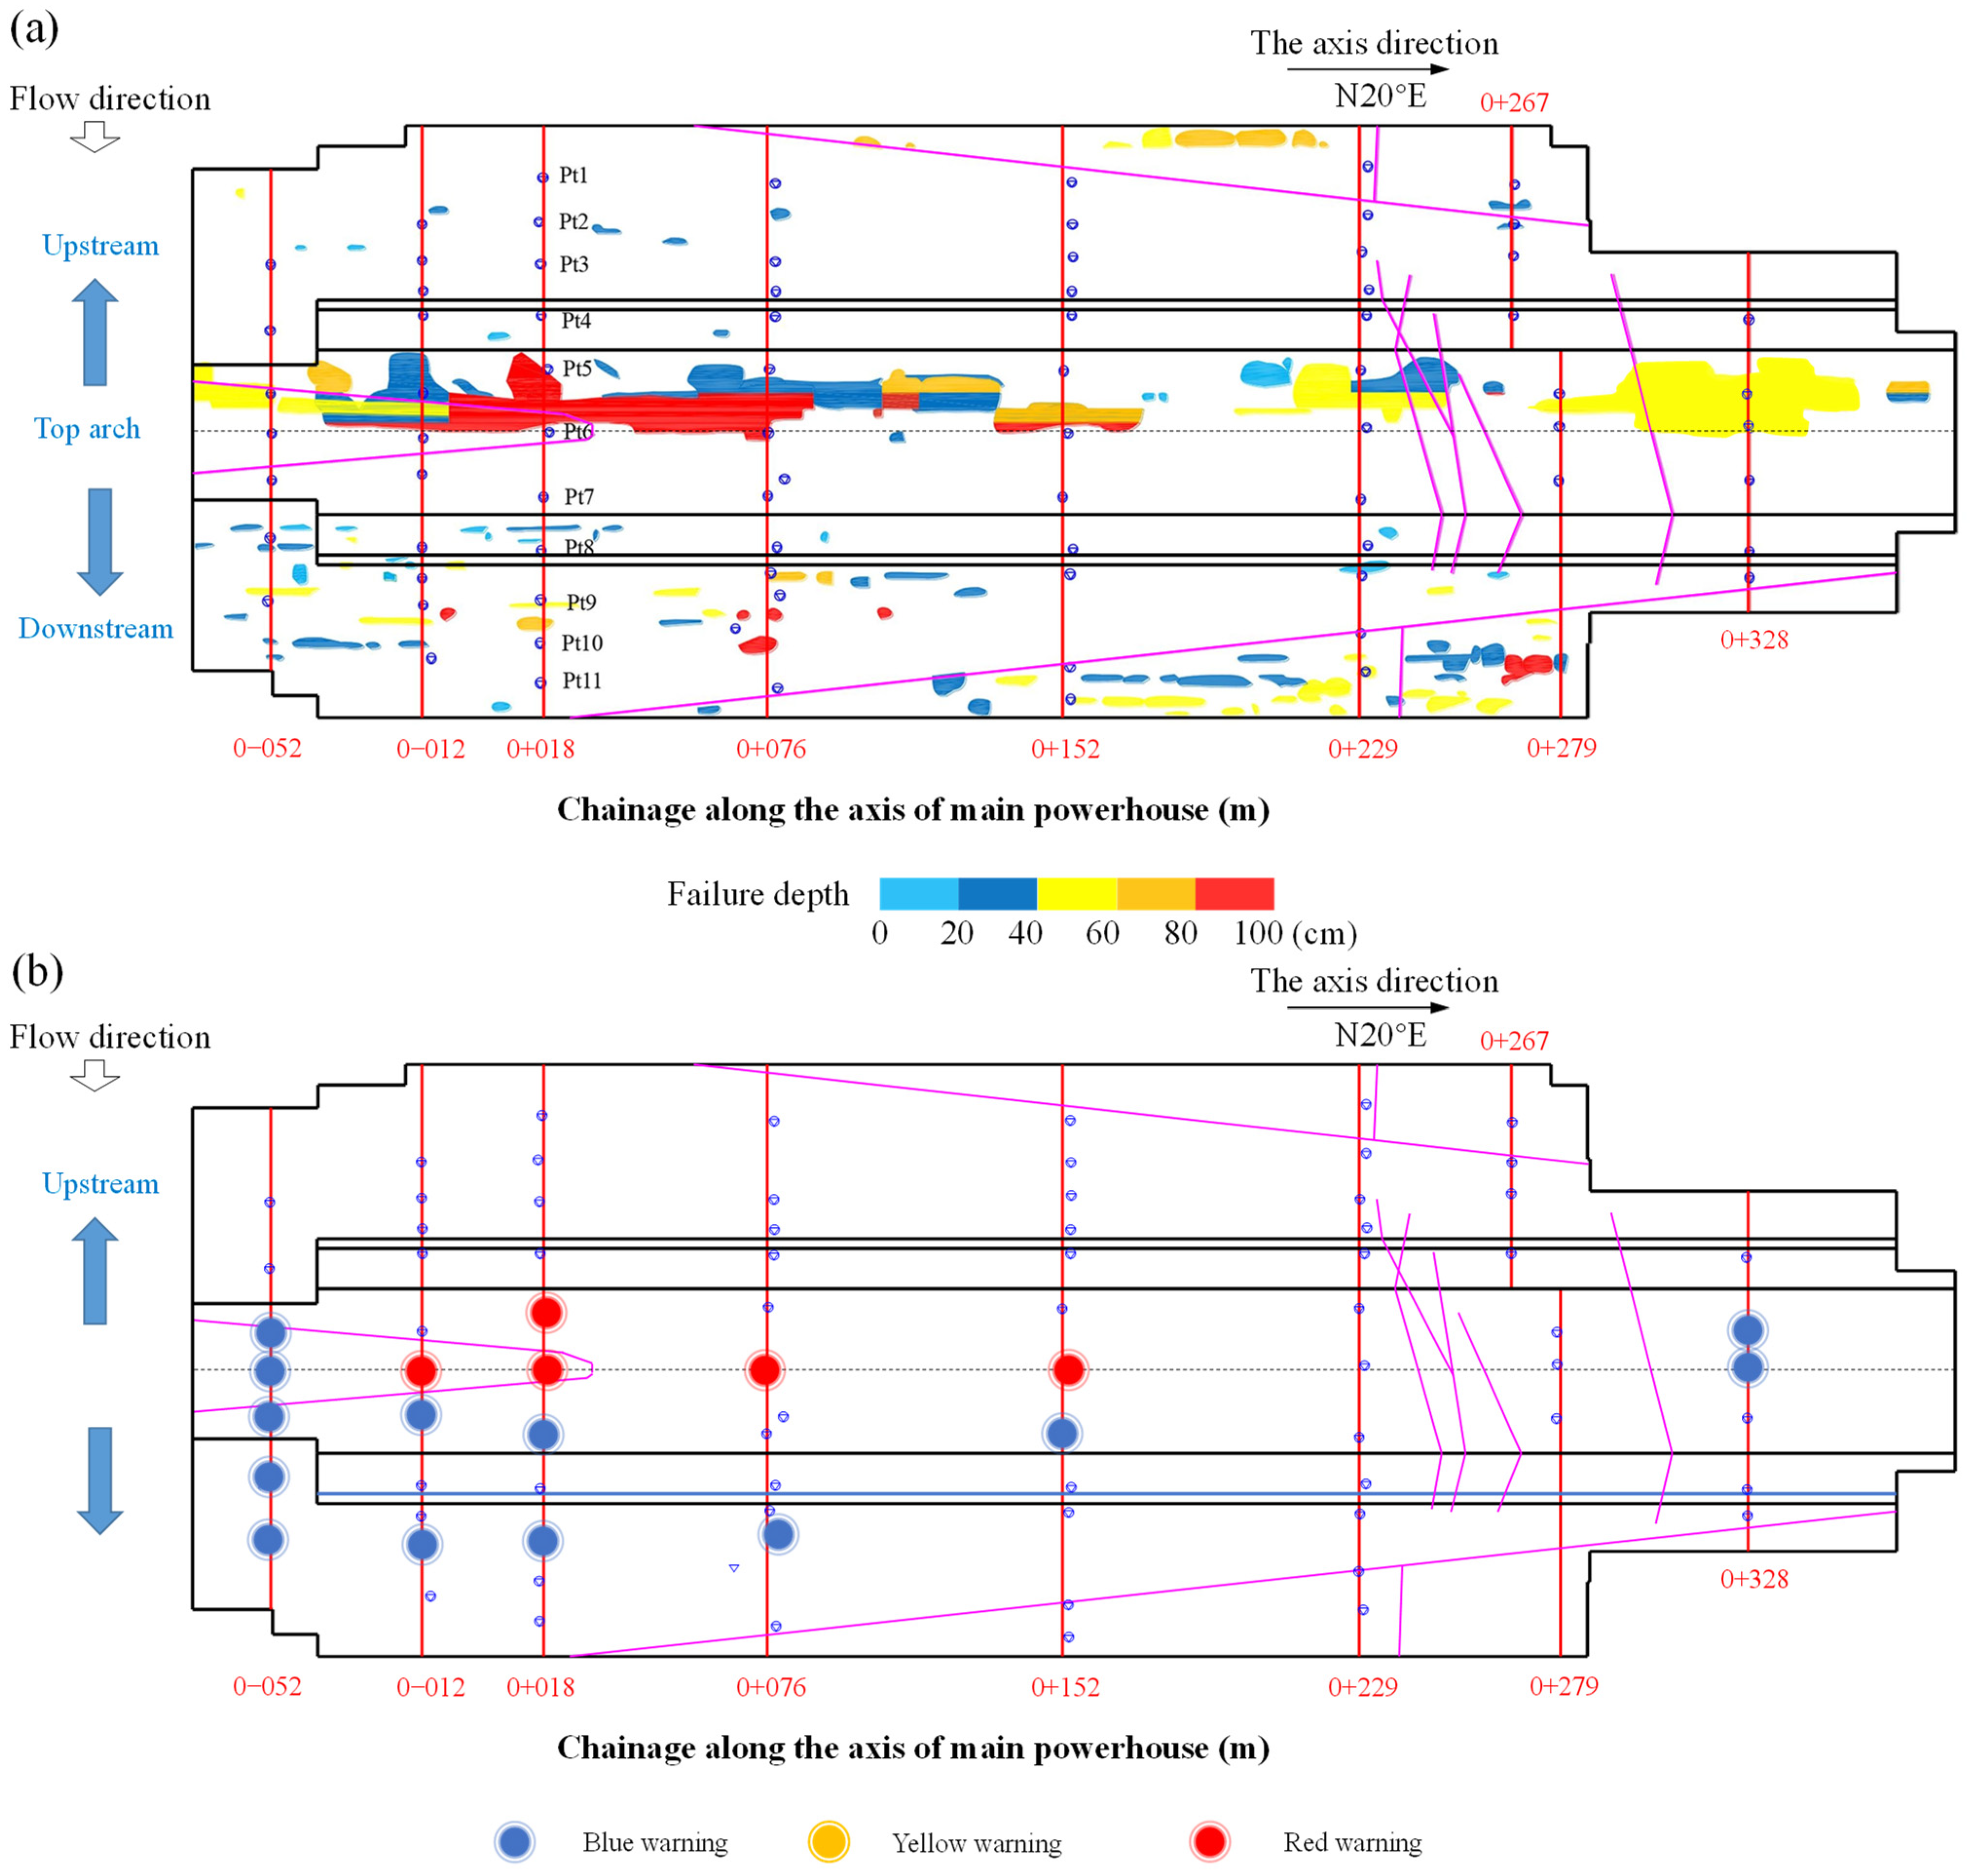
Taking the section 0 + 018 m as an example, the accuracy and reliability of the warning status were verified. Spalling occurred in the surrounding rock near the vault and has a failure depth of 80–100 cm. According to the proposed warning method, the corresponding warning status at the time of failure was red alert, which accurately reflected the extent of on-site damage. Crack failure occurred at the downstream side wall (elevation 592.0 m) with a failure depth of 40–60 cm, and the most severe warning status obtained by the proposed method was a blue warning, which also well reflected the on-site failure. To further assess whether the warning results for all monitoring points are consistent with on-site failure conditions, the maximum failure depths of on-site failures are represented by different colors in Figure 22a and compared with the warning statuses. Because the warning signal of a monitoring point changes with time, as shown in Figure 20, only the most serious warning signal was compared with the corresponding failure depth in the determination of the correctness. The most serious warning signals of all the monitoring points are shown in Figure 22b.
Figure 22.
Comparison between the maximum on-site failure depths and the warning statuses. (a) The maximum on-site failure depth, and (b) the warning statuses. Magenta lines represent geological structural planes, red straight lines indicate deformation monitoring section, triangle represent elevation, dashed lines represent arch lines, and blue circles represent monitoring points.
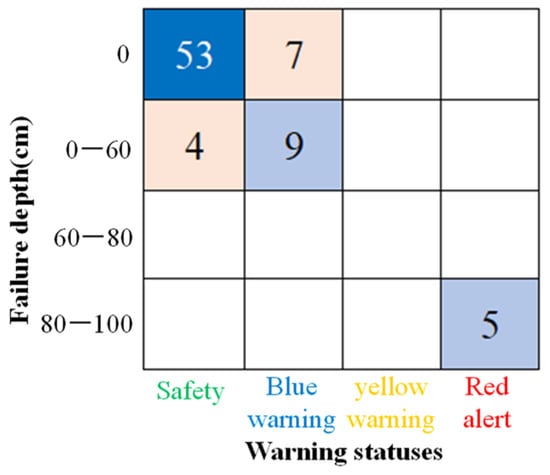
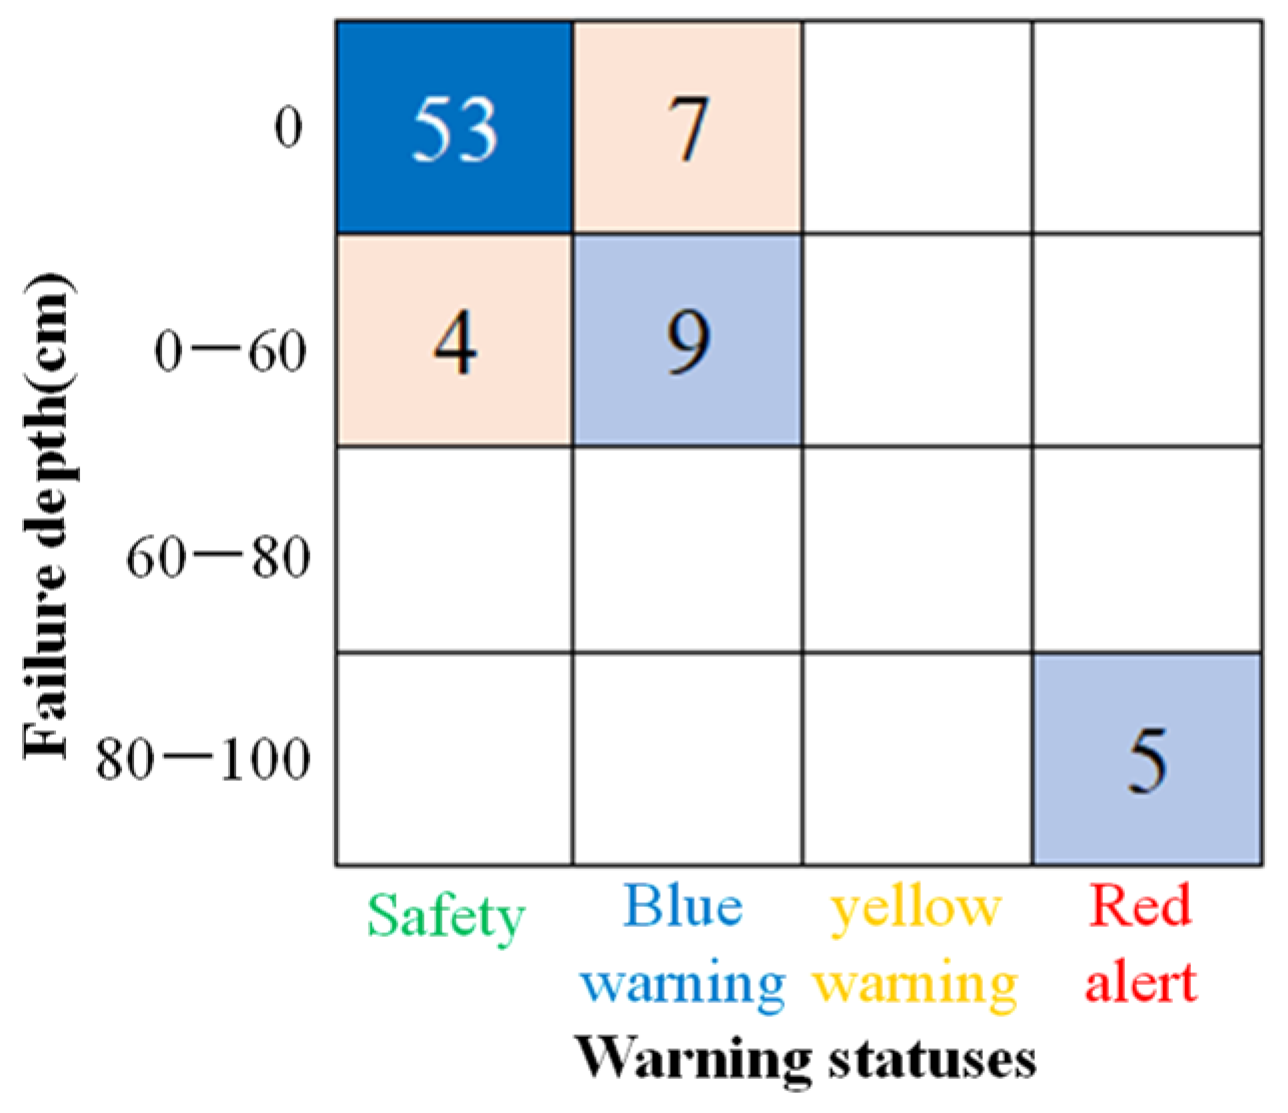
As shown in Figure 22a, different colors represent varying failure depths. A failure depth of less than 60 cm generally corresponds to cracking failure. Depths of 60–80 cm denote more severe failure, and depths greater than 80 cm signify very severe failure, typically associated with spalling. Among the 78 monitoring points in the main powerhouse, 21 exhibited rock failure to varying degrees. Figure 22b reveals that warnings during excavation were primarily triggered around the upstream spandrel and downstream side wall, which closely aligns with the on-site failures illustrated in Figure 22a. To enable intuitive comparison between predicted warning levels and observed failure severity, and to explicitly distinguish false positive and false negative predictions, a confusion matrix is provided in Figure 23. As illustrated, 14 of the 21 failed monitoring points generated reasonable warning signals, with a warning signal accuracy rate of approximately 66.7% for warning signals. Among the remaining 57 non-failed monitoring points, 53 monitoring points obtained safe signals, with a safety signal accuracy rate of approximately 93.0%. Thus, the overall accuracy regarding warning locations is approximately 85.9%. The figure shows that the distribution of warning status agrees well with the statistical distribution of on-site failure. Spalling concentrated on the vault of the 0 – 038 m to 0 + 087 m section, and it has a length of 125 m, a width of 3–8 m, and a depth of 50–80 cm, so it belongs to severe failure. The vault points of the three monitoring sections (0 − 012 m, 0 + 018 m, and 0 + 076 m) within this area all triggered a red alert. Spalling occurred at the vault around the 0 + 152 m section, and the corresponding measuring point also triggered a red alert. Blue warnings mainly occur around the downstream side wall and upstream spandrel of the main powerhouse, and the locations of blue warnings in most monitoring sections well correspond to on-site cracking failures with a failure depth less than 40 mm.
Figure 23.
Confusion matrix for accuracy evaluation of the proposed model.
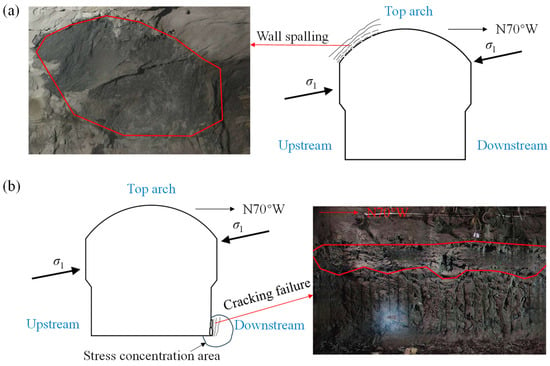
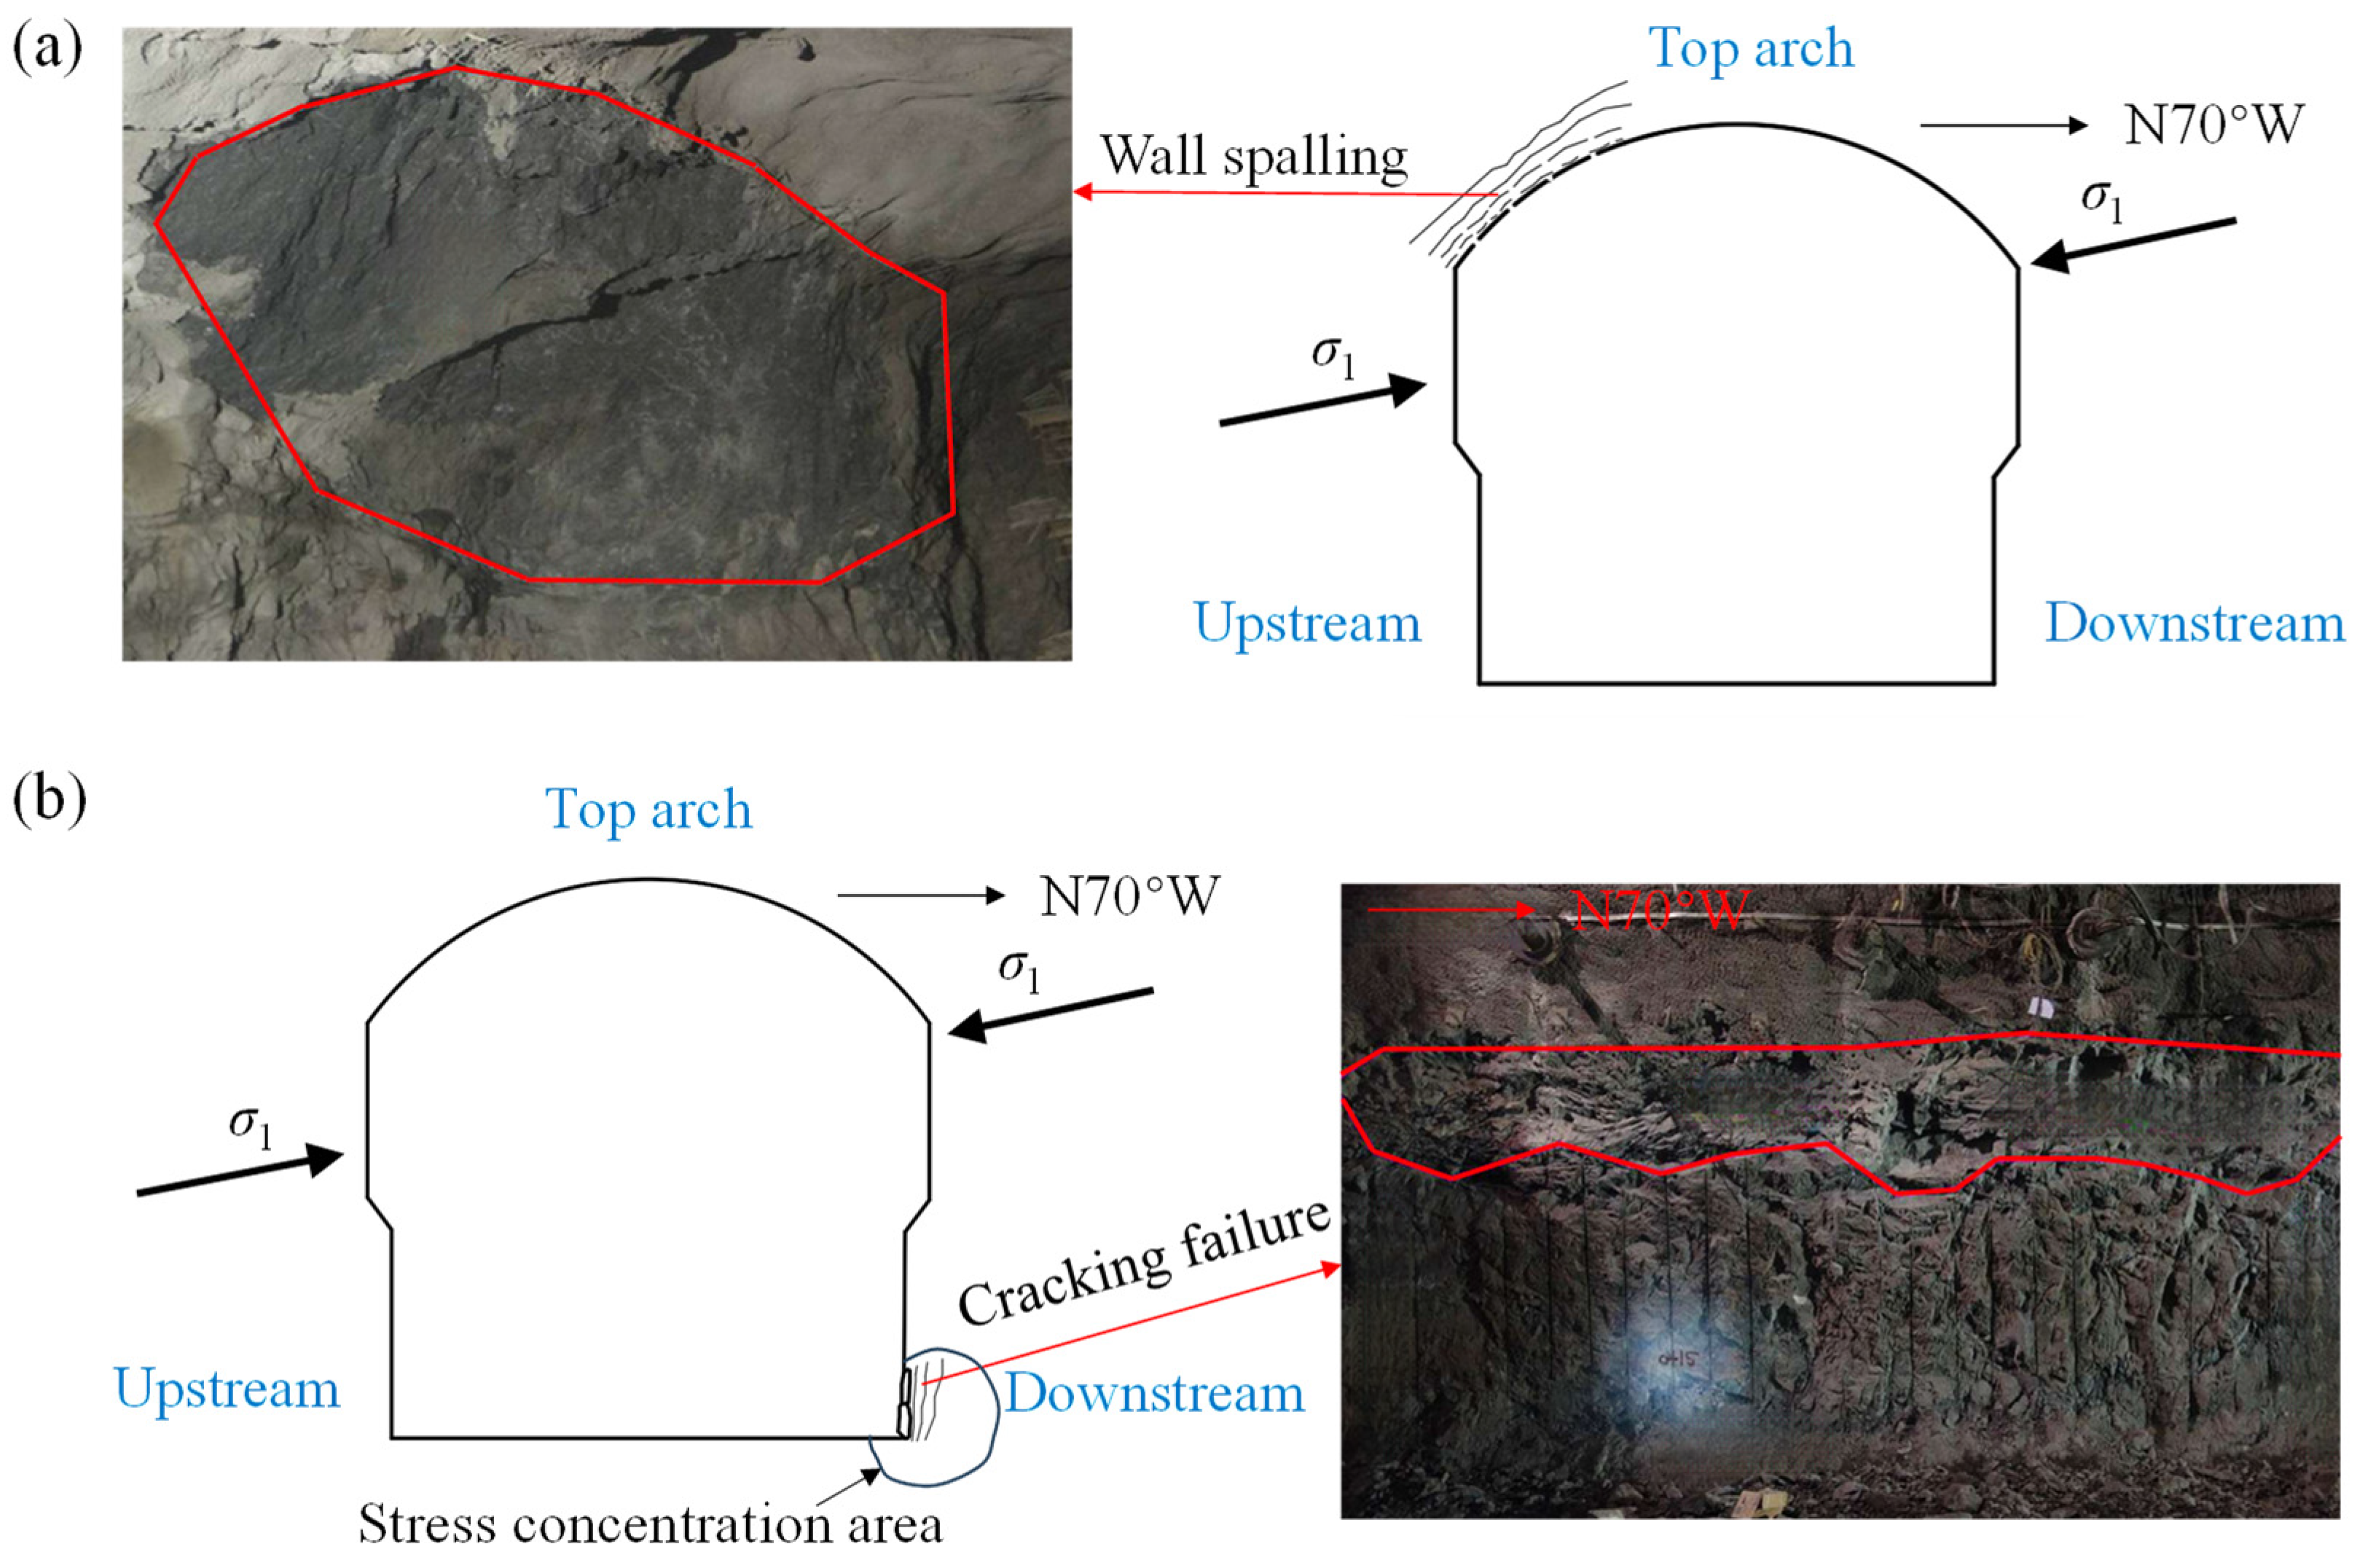
The proposed methodology enables the prediction of not only warning locations but also timing. In the section 0 + 018 m, the upstream spandrel triggered a blue warning following the first excavation layer and a red alert following the second, and the timing accurately coincides with field observations. Following the first excavation layer, stress concentration at the vault and upstream spandrel exceeded crack initiation stress without visible damage manifestation. During the second excavation layer, intensified stress concentration surpassed the tensile strength and caused spalling, as shown in Figure 24a. Progressive stress concentration during later excavation exacerbated the rock spalling. Based on the displacement analysis at Pt5, the blue and yellow warning displacements were determined as 10 mm and 20 mm, respectively, after the first layer of excavation. The monitored displacement reached about 12 mm, which marginally exceeded the blue warning threshold and triggered a blue warning. After the second excavation layer, the monitored displacement is 34 mm, which surpassed the red alert threshold that is determined as 32 mm and activates a red alert.
Figure 24.
Two observed failures within section 0 + 018 m.: (a) spalling at Pt5, and (b) cracking at Pt9. The red line represents the outline of the failure area.
A second validation case at section 0 + 018 m involves point Pt9 on the downstream side wall. Following the fourth excavation layer, Pt9 triggered a blue warning, and this also temporally coincides with the observed damage. Exposure of Pt9 at the downstream wall toe localized stress concentration that exceeded the crack initiation stress, resulting in cracking damage, as documented in Figure 24b. The yellow warning threshold at Pt9 after the fourth excavation layer was determined to be 12 mm; the measured displacement of approximately 12 mm approached this threshold, leading to visible damage. The observed failure zone extended 10 m along the powerhouse axis, spanned 2 m perpendicular to the wall, and reached 30–50 cm in depth. The warning timings demonstrated precise temporal alignment with the actual damage occurrences, and the warning levels accurately predicted the extent of on-site damage.
6. Influence of Geological Structures on Warning Results
To further analyze the influence of complex geological conditions, such as faults, on warning results, the warning outcomes with and without the geological structures were compared.
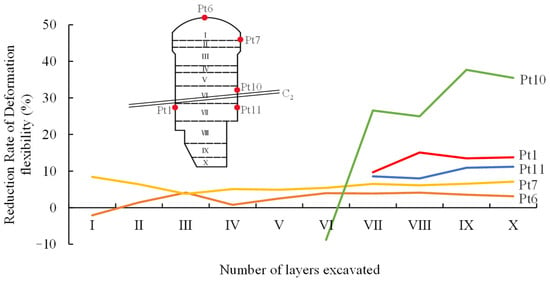
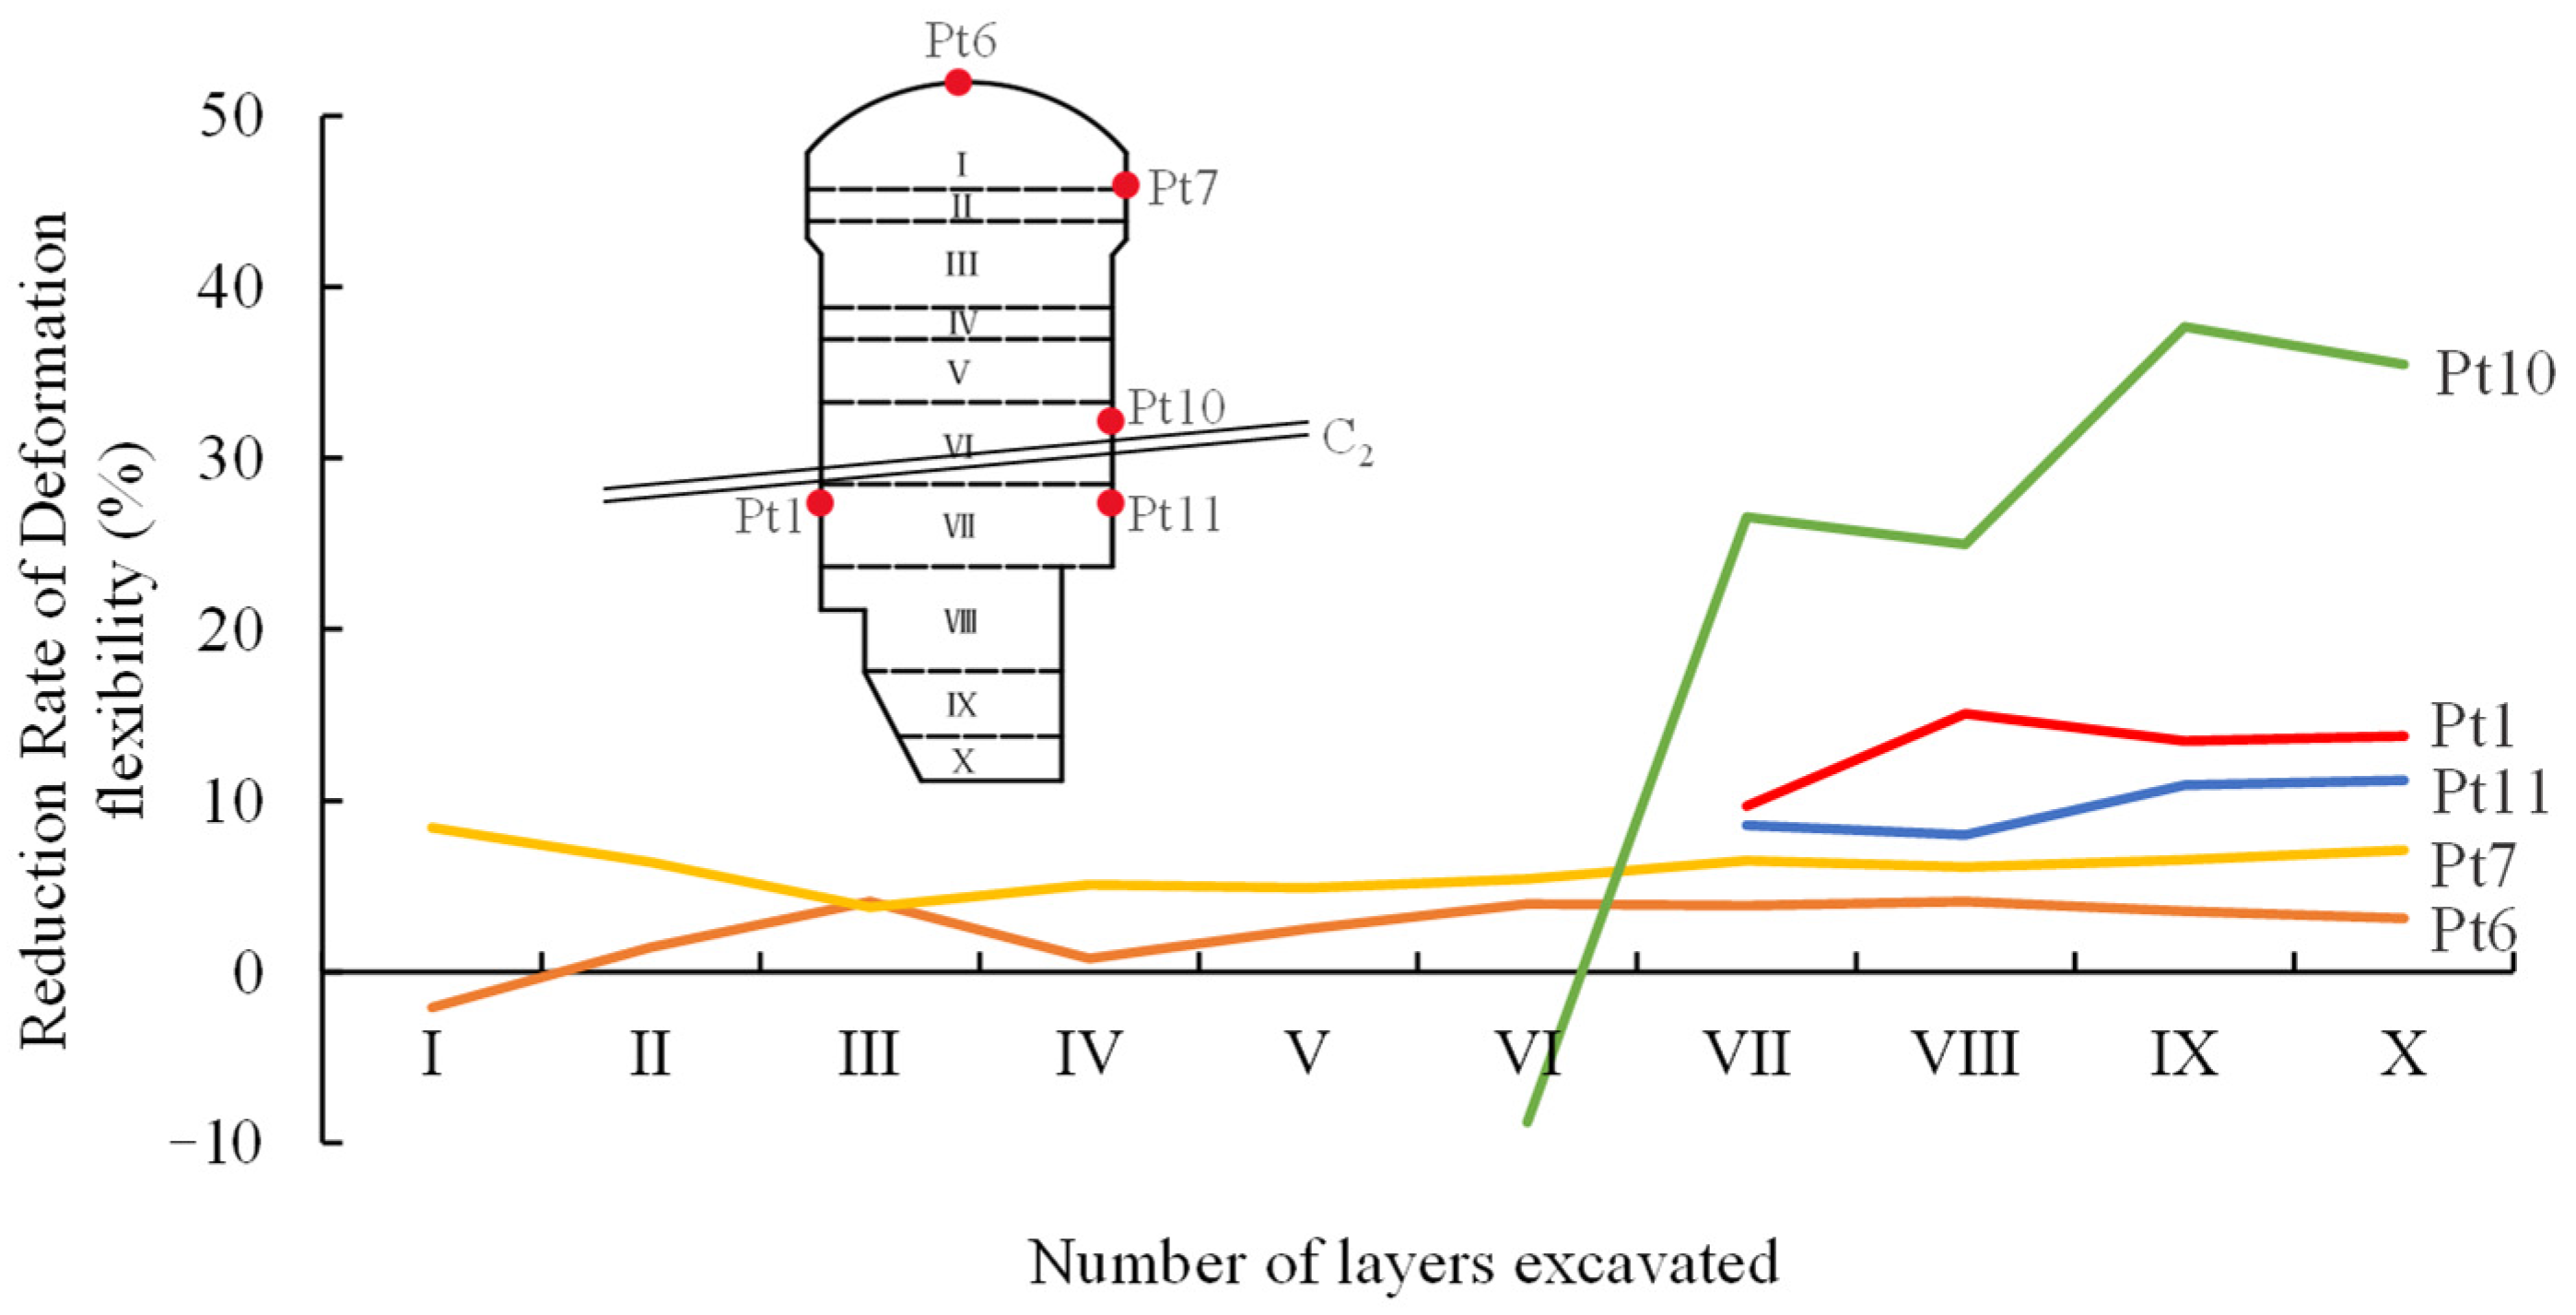
Deformation flexibilities were recalculated without considering geological structures. Table 7 lists the results for points in section 0 + 018 m. Comparative analysis was conducted and reveals an average 10.29% reduction in deformation flexibility when the geological structures are incorporated, so the geological structural network decreases the deformation flexibility of the surrounding rock around the excavation boundary. To further investigate the influences of geological structure on the deformation flexibilities of different measuring points, five measuring points, including Pt1, Pt6, Pt7, Pt10, and Pt11 at different distances from the interlayer dislocation zone C2, were selected in section 0 + 018 m. The reduction rates of their deformation flexibilities after considering structures are shown in Figure 25. It shows that the monitoring points closer to the interlayer dislocation zone C2 exhibit more significant reductions in deformation flexibility. For example, Pt10 and Pt1, which are closer to the interlayer dislocation zone C2, show an average reduction of 23.18% and 13.00%, respectively. In contrast, Pt6, which is the farthest away from the interlayer dislocation zone C2, has an average reduction rate of only 2.54% in deformation flexibility.
Table 7.
Deformation flexibilities of surrounding rock at monitoring points in section 0 + 018 m without geological structures.
Figure 25.
Deformation flexibility reduction rates of the monitoring points Pt1, Pt6, Pt7, Pt10, and Pt11 in section 0 + 018 m after considering the geological structures. The letters I–X represent the numbers of excavation layer.
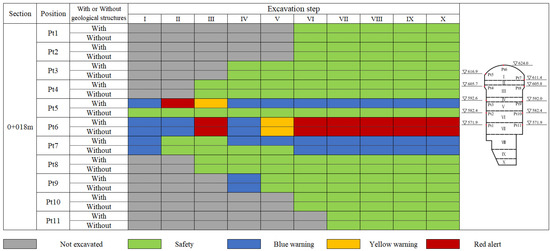
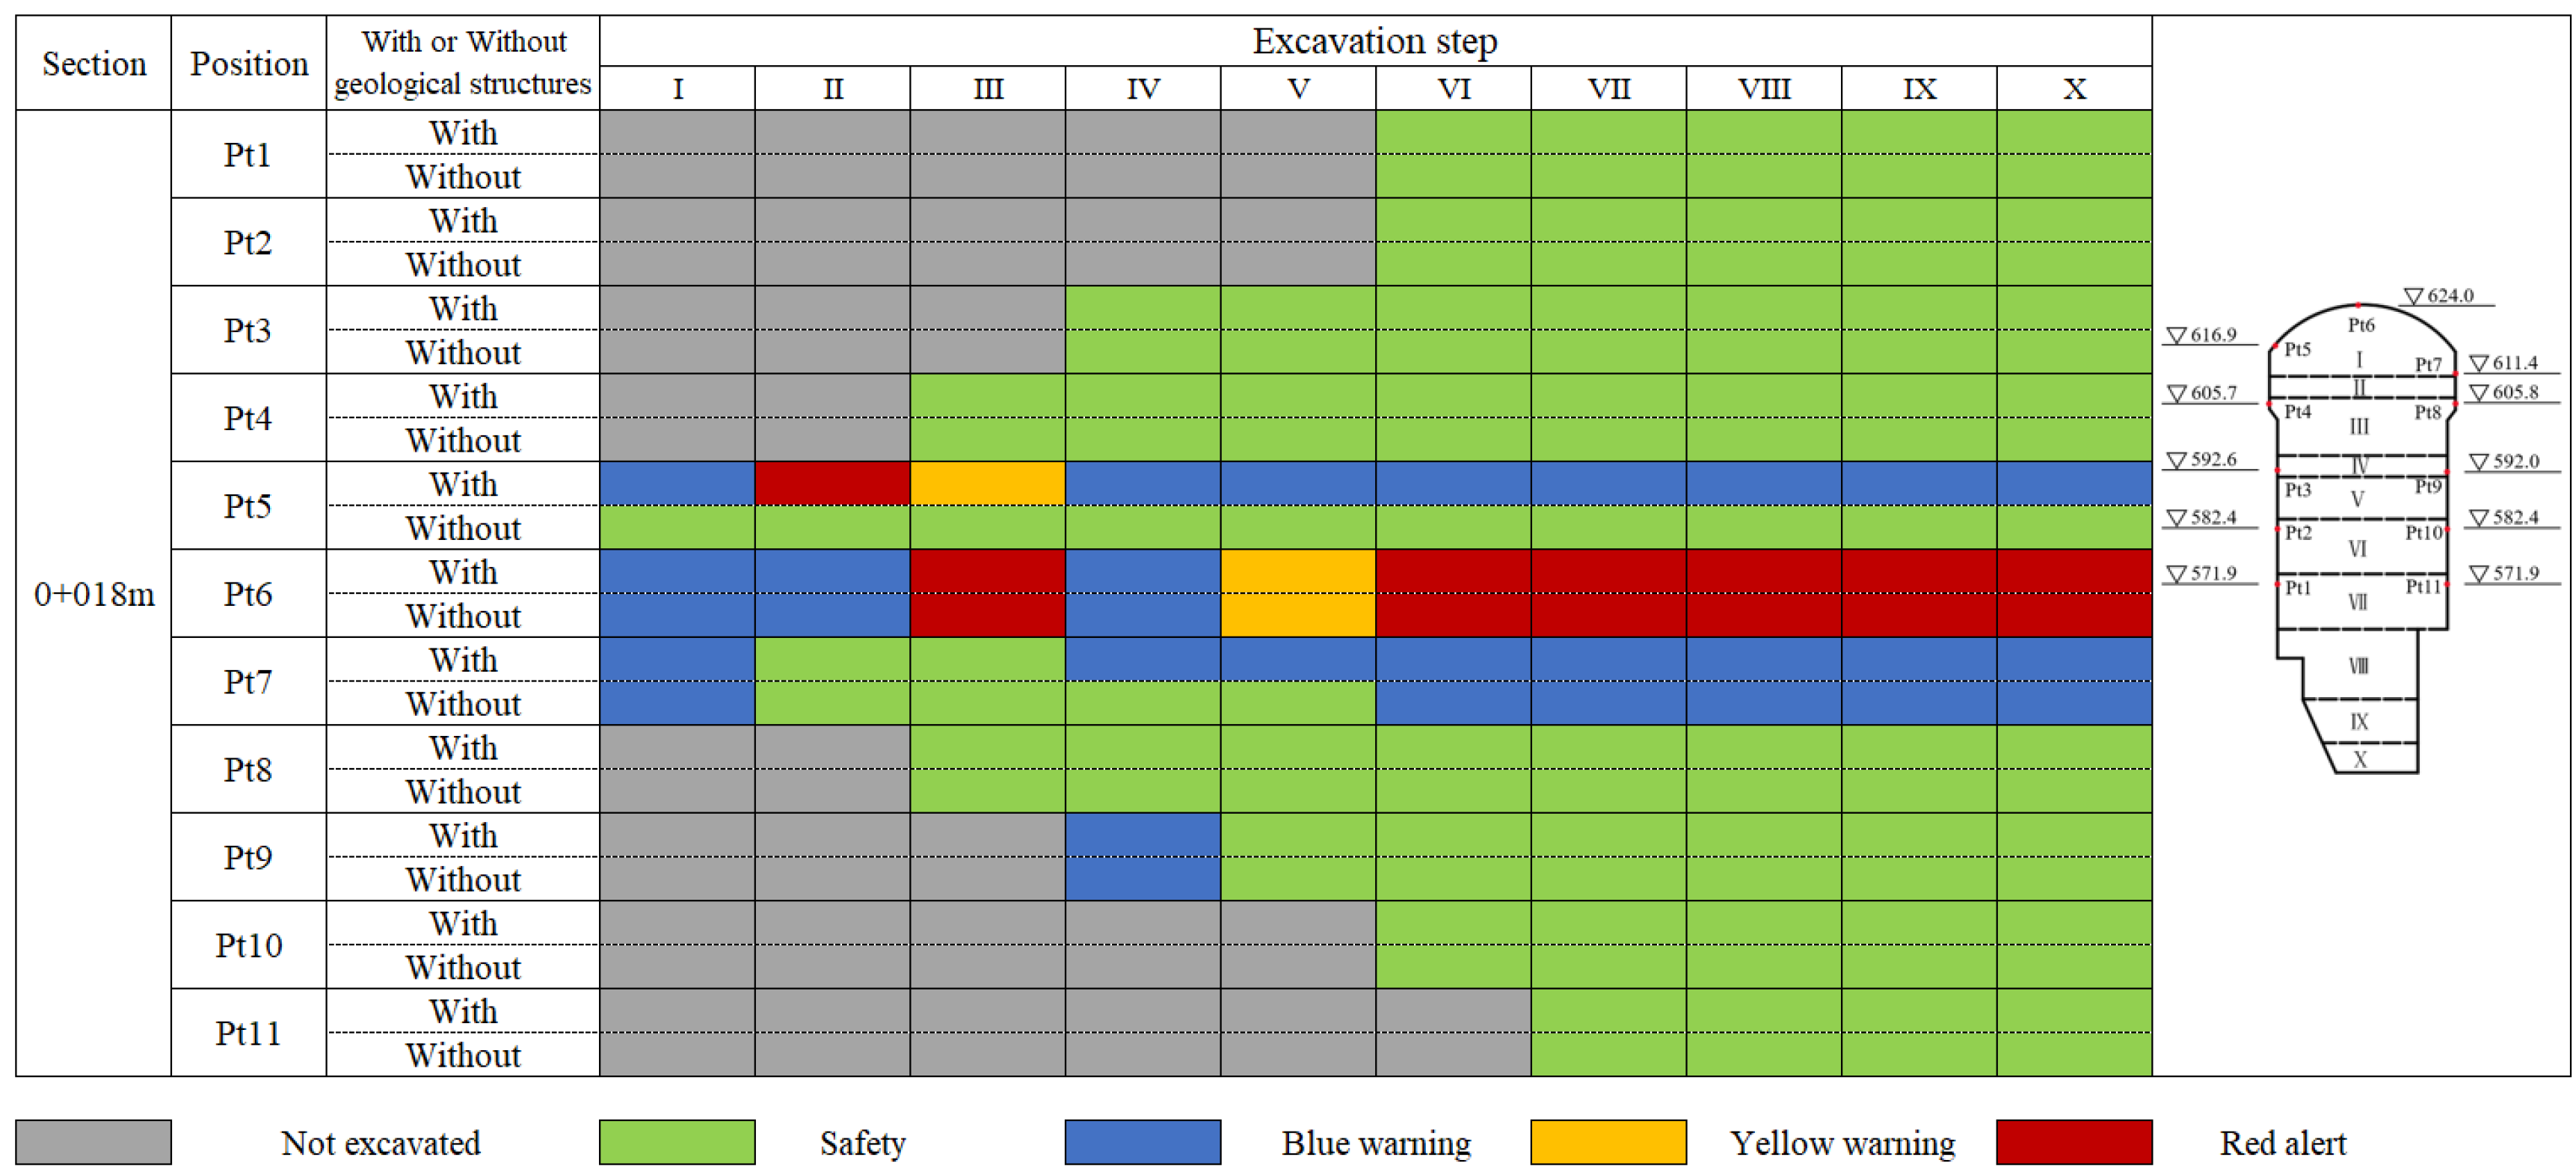
Figure 26 compares the warning status of all monitoring points after each excavation layer with and without the geological structures. When the geological structures are considered, the most severe warning status at the upstream spandrel (Pt5) is red warning. In contrast, without considering the geological structures, the warning status at the upstream spandrel remains safe throughout the excavation process, and the warning state of the downstream spandrel (Pt7) also changes from blue warning to a safe state after the fourth and fifth layers of excavation. In addition, the warning results without considering the geological structures cannot match the on-site failures. Overall, without considering the geological structures, the warning results at each measuring point tend to be overly safe and significantly reduce the warning accuracy.
Figure 26.
Comparison of warning status for monitoring points in the section 0 + 018 m during excavation with and without geological structures. The letters I–X represent the numbers of excavation layer, and the triangle indicates elevation.
Due to the influence of geological structures, the deformation flexibility of surrounding rock significantly decreases, and this reduction will further lead to a reduction in warning displacements under the same warning strength. Thus, complex geological structures could make surrounding rock more likely to reach warning displacements and more prone to failure, and the failure risk of surrounding rock during excavation is also increasing. This demonstrates that adverse geological structures have a significant impact on the stability and failure process of surrounding rock in underground engineering. Therefore, it is necessary to fully consider the influence of adverse geological structures to ensure the accuracy of warning results.
7. Discussion and Conclusions
7.1. Discussion
The proposed method is based on the linear elasticity assumption. Compared with the actual plastic behavior of rock, warning displacements calculated under elastic conditions are smaller, yielding more conservative warning results and providing a certain safety margin. Second, this method relies on uniaxial compression test results and is therefore applicable only to surrounding rock at the cavern wall, making it unable to warn against failures in deep surrounding rock. Finally, although the method accounts for adverse geological structures by explicitly modeling various discontinuities and assigning corresponding parameters, slip along these geological features can significantly increase deformation and stress in the surrounding rock, leading to failure. The current method does not effectively simulate fault slip or accurately capture its triggering effect on rock bursts.
Future work could consider incorporating discontinuity slip into numerical simulations, while reasonably accounting for the three-dimensional stress–strain behavior of deep rock masses, thereby further optimizing this method for broader engineering applications. Furthermore, the spatial variability inherent in natural rock masses exerts a substantial influence on warning displacement thresholds, representing an ongoing challenge in underground engineering research. Future work may further explore the effects of rock mass spatial variability on warning deformation.
7.2. Conclusions
Based on the linear elasticity assumption, the proposed method calculates warning displacements using characteristic stresses and deformation flexibility, establishing an approach for evaluating surrounding rock stability. The main research conclusions are as follows.
- (1)
- The in situ stresses of the Baihetan left-bank underground powerhouse were inversely analyzed by a three-dimensional geological model orthogonal to the principal stresses to avoid the back analysis of shear stresses on the model boundaries. The back analysis result shows that the determination coefficient between the simulated and monitored in situ stresses is about 0.834. Based on the back-analyzed in situ stresses, the simulated stress and deformation distributions during excavation are reasonable, which lays the foundation for correctly solving the deformation flexibilities and warning deformations of surrounding rock.
- (2)
- The warning status of the surrounding rock is analyzed by comparing the on-site monitored deformations with the critical warning deformations. The warning results demonstrated that the proposed methodology enables prediction of warning location, timing and grades. The blue warning, yellow warning, and red alert could reflect a failure depth below 40 mm, between 40 and 80 mm, and above 80 mm, respectively, and 85.9% of monitoring points obtained correct warning signals.
- (3)
- The complex geological conditions could significantly reduce the warning deformations of surrounding rock and make it more prone to failure. In addition, they also bring great uncertainties to the stress and deformation of surrounding rock, and the real behaviors of surrounding rock may be very different from the simulated results, so the monitored deformations that reflect these uncertainties, instead of the simulated stresses or deformations, can be used to predict the warning status of surrounding rock.
The contribution of this study to engineering lies in correlating deformation with stress of surrounding rock, thereby converting the characteristic stress including strength of surrounding rock into deformation thresholds. This provides a scientific method for determining the warning value of deformation.
Author Contributions
Conceptualization, Q.H. and H.-Z.L.; methodology, M.-L.X. and H.-Q.X.; software, J.-L.P.; validation, L.Z.; formal analysis, Q.H.; resources, L.Z.; data curation, Q.H. and M.-L.X.; writing—original draft preparation, Q.H.; writing—review and editing, M.-L.X., H.-Z.L., H.-Q.X., L.Z. and J.-L.P.; funding acquisition, M.-L.X., H.-Z.L. and H.-Q.X. All authors have read and agreed to the published version of the manuscript.
Funding
This study was funded by the Natural Science Foundation of Sichuan Province, China (No. 2024NSFSC0836), the National Natural Science Foundation of China (No. 52479106) and the Construction S&T Project of Department of Transportation of Sichuan Province (No. 2023A02).
Institutional Review Board Statement
Not applicable.
Informed Consent Statement
Not applicable.
Data Availability Statement
The datasets used in the current study are available from the corresponding author upon reasonable request.
Acknowledgments
The authors sincerely acknowledge Jiang-Da He and Ao-Ying Luo for their help in analyzing the data.
Conflicts of Interest
The authors declare that they have no known competing financial interests or personal relationships that could have appeared to influence the work reported in this paper.
References
- Ren, Q.; Xu, L.; Zhu, A.; Shan, M.; Zhang, L.; Gu, J.; Shen, L. Comprehensive Safety Evaluation Method of Surrounding Rock during Underground Cavern Construction. Undergr. Space 2021, 6, 46–61. [Google Scholar] [CrossRef] [Scilit]
- Dai, F.; Li, B.; Xu, N.; Zhu, Y. Microseismic Early Warning of Surrounding Rock Mass Deformation in the Underground Powerhouse of the Houziyan Hydropower Station, China. Tunn. Undergr. Space Technol. 2017, 62, 64–74. [Google Scholar] [CrossRef] [Scilit]
- Feng, G.-L.; Feng, X.-T.; Chen, B.-R.; Xiao, Y.-X.; Zhao, Z.-N. Effects of Structural Planes on the Microseismicity Associated with Rockburst Development Processes in Deep Tunnels of the Jinping-II Hydropower Station, China. Tunn. Undergr. Space Technol. 2019, 84, 273–280. [Google Scholar] [CrossRef] [Scilit]
- Li, F.; Jin, H.; Hu, D.; Wang, B.; Jia, Y. Influence of Temperature and Roughness of Surrounding Rocks on Mechanical Behavior of Rock Bolts. Soil. Dyn. Earthq. Eng. 2017, 103, 55–63. [Google Scholar] [CrossRef] [Scilit]
- Xue, Y.; Tao, Y.; Qiu, D.; Su, M.; Li, Z.; Zhang, X. Analysis of an Underground Water-Sealed Oil Storage Cavern: A Method of Surrounding Rock Classification Considering Hydrological Conditions. Pol. J. Environ. Stud. 2021, 30, 2369–2379. [Google Scholar] [CrossRef] [Scilit]
- Zuo, J.; Song, H.; Jiang, Y.; Zhao, S.; Yu, M.; Li, L. Preliminary Discussion on Comprehensive Research Method for Rock Burst in Coal Mine Based on Newton’s Second Law. Shock. Vib. 2020, 2020, 8861306. [Google Scholar] [CrossRef] [Scilit]
- Dai, F.; Li, B.; Xu, N.; Meng, G.; Wu, J.; Fan, Y. Microseismic Monitoring of the Left Bank Slope at the Baihetan Hydropower Station, China. Rock. Mech. Rock. Eng. 2017, 50, 225–232. [Google Scholar] [CrossRef] [Scilit]
- Huang, Q.; Zhao, K.; Yan, Y.; Wu, J.; Nie, Q.; Chen, J.; Xiao, W.; Wang, H. Failure Study of Weathered Granite Based on Critical Slowing down Theory and Acoustic Emission B-Value. Archiv. Civ. Mech. Eng. 2023, 23, 196. [Google Scholar] [CrossRef] [Scilit]
- Lu, C.-P.; Liu, Y.; Liu, G.-J.; Zhao, T.-B. Stress Evolution Caused by Hard Roof Fracturing and Associated Multi-Parameter Precursors. Tunn. Undergr. Space Technol. 2019, 84, 295–305. [Google Scholar] [CrossRef] [Scilit]
- Liang, Z.; Xue, R.; Xu, N.; Li, W. Characterizing Rockbursts and Analysis on Frequency-Spectrum Evolutionary Law of Rockburst Precursor Based on Microseismic Monitoring. Tunn. Undergr. Space Technol. 2020, 105, 103564. [Google Scholar] [CrossRef] [Scilit]
- Xue, R.; Liang, Z.; Xu, N.; Dong, L. Rockburst Prediction and Stability Analysis of the Access Tunnel in the Main Powerhouse of a Hydropower Station Based on Microseismic Monitoring. Int. J. Rock. Mech. Min. Sci. 2020, 126, 104174. [Google Scholar] [CrossRef] [Scilit]
- Hu, X.; Su, G.; Chen, G.; Mei, S.; Feng, X.; Mei, G.; Huang, X. Experiment on Rockburst Process of Borehole and Its Acoustic Emission Characteristics. Rock. Mech. Rock. Eng. 2019, 52, 783–802. [Google Scholar] [CrossRef] [Scilit]
- Frid, V.; Vozoff, K. Electromagnetic Radiation Induced by Mining Rock Failure. Int. J. Coal Geol. 2005, 64, 57–65. [Google Scholar] [CrossRef] [Scilit]
- Wang, E.; He, X.; Liu, X.; Li, Z.; Wang, C.; Xiao, D. A Non-Contact Mine Pressure Evaluation Method by Electromagnetic Radiation. J. Appl. Geophys. 2011, 75, 338–344. [Google Scholar] [CrossRef] [Scilit]
- Wang, E.; He, X.; Liu, X.; Xu, W. Comprehensive Monitoring Technique Based on Electromagnetic Radiation and Its Applications to Mine Pressure. Saf. Sci. 2012, 50, 885–893. [Google Scholar] [CrossRef] [Scilit]
- He, X.; Nie, B.; Chen, W.; Wang, E.; Dou, L.; Wang, Y.; Liu, M.; Hani, M. Research Progress on Electromagnetic Radiation in Gas-Containing Coal and Rock Fracture and Its Applications. Saf. Sci. 2012, 50, 728–735. [Google Scholar] [CrossRef] [Scilit]
- Cai, W.; Dou, L.; Cao, A.; Gong, S.; Li, Z. Application of Seismic Velocity Tomography in Underground Coal Mines: A Case Study of Yima Mining Area, Henan, China. J. Appl. Geophys. 2014, 109, 140–149. [Google Scholar] [CrossRef] [Scilit]
- Wang, G.; Gong, S.; Li, Z.; Dou, L.; Cai, W.; Mao, Y. Evolution of Stress Concentration and Energy Release Before Rock Bursts: Two Case Studies from Xingan Coal Mine, Hegang, China. Rock. Mech. Rock. Eng. 2016, 49, 3393–3401. [Google Scholar] [CrossRef] [Scilit]
- He, H.; Dou, L.; Gong, S.; He, J.; Zheng, Y.; Zhang, X. Microseismic and Electromagnetic Coupling Method for Coal Bump Risk Assessment Based on Dynamic Static Energy Principles. Saf. Sci. 2019, 114, 30–39. [Google Scholar] [CrossRef] [Scilit]
- Zhang, H.; Miao, X.; Zhang, G.; Wu, Y.; Chen, Y. Non-Destructive Testing and Pre-Warning Analysis on the Quality of Bolt Support in Deep Roadways of Mining Districts. Int. J. Min. Sci. Technol. 2017, 27, 989–998. [Google Scholar] [CrossRef] [Scilit]
- Xu, J.; Wang, E.; Zhou, R. Real-Time Measuring and Warning of Surrounding Rock Dynamic Deformation and Failure in Deep Roadway Based on Machine Vision Method. Measurement 2020, 149, 107028. [Google Scholar] [CrossRef] [Scilit]
- Xu, L.; Zhang, T.; Ren, Q. Intelligent Autofeedback and Safety Early-Warning for Underground Cavern Engineering during Construction Based on BP Neural Network and FEM. Math. Probl. Eng. 2015, 2015, 873823. [Google Scholar] [CrossRef] [Scilit]
- Tian, W.; Meng, J.; Zhong, X.-J.; Tan, X. Intelligent Early Warning System for Construction Safety of Excavations Adjacent to Existing Metro Tunnels. Adv. Civ. Eng. 2021, 2021, 8833473. [Google Scholar] [CrossRef] [Scilit]
- Chen, G.Q.; Li, T.B.; Gao, M.B.; Chen, Z.Q.; Xiang, T.B. Deformation Warning and Dynamic Control of Dangerous Disaster for Large Underground Caverns. Disaster Adv. 2013, 6, 422–430. [Google Scholar]
- Lu, C.-P.; Liu, G.-J.; Liu, Y.; Zhang, H. Mechanisms of Rockburst Triggered by Slip and Fracture of Coal–Parting–Coal Structure Discontinuities. Rock. Mech. Rock. Eng. 2019, 52, 3279–3292. [Google Scholar] [CrossRef] [Scilit]
- Luo, A.-Y.; Zhuo, L.; Liu, H.-Z.; Xie, H.-Q.; Xu, N.-W.; Xiao, M.-L.; Shuai, Y.-J. Complex Function Method Considering Rock Strength for Determining Critical Warning Deformation of Deep-Buried Complex Cavern. Tunn. Undergr. Space Technol. 2024, 152, 105934. [Google Scholar] [CrossRef] [Scilit]
- Snelling, P.E.; Godin, L.; McKinnon, S.D. The Role of Geologic Structure and Stress in Triggering Remote Seismicity in Creighton Mine, Sudbury, Canada. Int. J. Rock. Mech. Min. Sci. 2013, 58, 166–179. [Google Scholar] [CrossRef] [Scilit]
- Wang, J.; Chen, G.; Xiao, Y.; Li, S.; Chen, Y.; Qiao, Z. Effect of Structural Planes on Rockburst Distribution: Case Study of a Deep Tunnel in Southwest China. Eng. Geol. 2021, 292, 106250. [Google Scholar] [CrossRef] [Scilit]
- Liu, F.; Tang, C.; Ma, T.; Tang, L. Characterizing Rockbursts Along a Structural Plane in a Tunnel of the Hanjiang-to-Weihe River Diversion Project by Microseismic Monitoring. Rock. Mech. Rock. Eng. 2019, 52, 1835–1856. [Google Scholar] [CrossRef] [Scilit]
- Xie, S.; Lin, H.; Chen, Y. New Constitutive Model Based on Disturbed State Concept for Shear Deformation of Rock Joints. Archiv. Civ. Mech. Eng. 2022, 23, 26. [Google Scholar] [CrossRef] [Scilit]
- Wang, F.; Zhang, P.; Li, K.; Wang, C.; Cui, P. Mechanical and Fracture Characteristics of Single Tunnel under the Induced Effect of a Key Joint. Archiv. Civ. Mech. Eng. 2023, 23, 206. [Google Scholar] [CrossRef] [Scilit]
- Tang, C.; Wang, J.; Zhang, J. Preliminary Engineering Application of Microseismic Monitoring Technique to Rockburst Prediction in Tunneling of Jinping II Project. J. Rock. Mech. Geotech. Eng. 2010, 2, 193–208. [Google Scholar] [CrossRef] [Scilit]
- Zhou, H.; Meng, F.; Zhang, C.; Hu, D.; Yang, F.; Lu, J. Analysis of Rockburst Mechanisms Induced by Structural Planes in Deep Tunnels. Bull. Eng. Geol. Environ. 2015, 74, 1435–1451. [Google Scholar] [CrossRef] [Scilit]
- Li, Y. Spatial Distribution of Strain Energy Changes Due to Mining-Induced Fault Coseismic Slip: Insights from a Rockburst at the Yuejin Coal Mine, China. Rock. Mech. Rock. Eng. 2025, 58, 1693–1706. [Google Scholar] [CrossRef] [Scilit]
- Zhang, N.; Zhang, Z.-X.; Shan, R.; Qi, Q.; Zhao, S.; Sun, Z.; Guo, Y. An Experimental Study of Fault Slips under Unloading Condition in Coal Mines. Bull. Eng. Geol. Environ. 2023, 82, 126. [Google Scholar] [CrossRef] [Scilit]
- Barton, N.; Shen, B. Risk of Shear Failure and Extensional Failure around Over-Stressed Excavations in Brittle Rock. J. Rock. Mech. Geotech. Eng. 2017, 9, 210–225. [Google Scholar] [CrossRef] [Scilit]
- Tang, C.A.; Yang, W.T.; Fu, Y.F.; Xu, X.H. A New Approach to Numerical Method of Modelling Geological Processes and Rock Engineering Problems—Continuum to Discontinuum and Linearity to Nonlinearity. Eng. Geol. 1998, 49, 207–214. [Google Scholar] [CrossRef] [Scilit]
- Wang, L.; Lu, Z.; Gao, Q. A Numerical Study of Rock Burst Development and Strain Energy Release. Int. J. Min. Sci. Technol. 2012, 22, 675–680. [Google Scholar] [CrossRef] [Scilit]
- Fanjie, Y.; Hui, Z.; Haibin, X.; Azhar, M.U.; Yong, Z.; Fudong, C. Numerical Simulation Method for the Process of Rockburst. Eng. Geol. 2022, 306, 106760. [Google Scholar] [CrossRef] [Scilit]
- Gong, H.; Wang, G.; Luo, Y.; Liu, T.; Li, X.; Liu, X. Shear Failure and Mechanical Behaviors of Granite with Discontinuous Joints under Dynamic Disturbance: Laboratory Tests and Numerical Simulation. Archiv. Civ. Mech. Eng. 2023, 23, 171. [Google Scholar] [CrossRef] [Scilit]
- Bai, Y.; Wang, S.; Chen, Y.; Wang, J.; Wu, Q.; Zhou, J.; Li, C. Numerical Investigation on Failure Characteristics of Concrete Lining in Deep Tunnel Subject to Oblique Incidence of Stress Waves. Arch. Civ. Mech. Eng. 2025, 25, 65. [Google Scholar] [CrossRef] [Scilit]
- Wang, S.; Wang, L.; Tang, F.; Ding, K.; Li, Z.; Ren, B.; Jiang, C.; Guo, J. Experimental Study on the Relationship between the Degree of Surrounding Rock Fragmentation and the Adaptability of Anchor Support. Appl. Sci. 2023, 13, 11328. [Google Scholar] [CrossRef] [Scilit]
- Liang, L.; Li, X.; Liu, Z. Dynamic Responses and Failure Characteristics of Deep Double U-Shaped Caverns under Disturbing Loads. Appl. Sci. 2024, 14, 4543. [Google Scholar] [CrossRef] [Scilit]
- Yang, X.; Qin, Y.; Li, S.; Guo, Y.; Feng, S.; He, Z.; Qin, J.; Xu, N. Study on Surrounding Rock Stability During Solution Mining and Operation of Salt Cavern Gas Storage with Different Height-to-Diameter Ratios and Burial Depths. Appl. Sci. 2025, 15, 10723. [Google Scholar] [CrossRef] [Scilit]
- Li, Z.; Dou, L.; Lu, C.; Mu, Z.; Cao, A. Study on Fault Induced Rock Bursts. J. China Univ. Min. Technol. 2008, 18, 321–326. [Google Scholar] [CrossRef] [Scilit]
- Chen, X.; Li, W.; Yan, X. Analysis on Rock Burst Danger When Fully-Mechanized Caving Coal Face Passed Fault with Deep Mining. Saf. Sci. 2012, 50, 645–648. [Google Scholar] [CrossRef] [Scilit]
- Jiang, L.; Wang, P.; Zhang, P.; Zheng, P.; Xu, B. Numerical Analysis of the Effects Induced by Normal Faults and Dip Angles on Rock Bursts. Comptes Rendus Mécanique 2017, 345, 690–705. [Google Scholar] [CrossRef] [Scilit]
- Zhang, C.; Feng, X.-T.; Zhou, H.; Qiu, S.; Wu, W. Rockmass Damage Development Following Two Extremely Intense Rockbursts in Deep Tunnels at Jinping II Hydropower Station, Southwestern China. Bull. Eng. Geol. Environ. 2013, 72, 237–247. [Google Scholar] [CrossRef] [Scilit]
- Manouchehrian, A.; Cai, M. Numerical Modeling of Rockburst near Fault Zones in Deep Tunnels. Tunn. Undergr. Space Technol. 2018, 80, 164–180. [Google Scholar] [CrossRef] [Scilit]
- Wu, S.; Han, S.; Wang, Y.; Zhu, Z.; Chen, L.; Nian, Y. Assessment and Prediction of Rockburst Risk Zones Under Different Structural Plane Shapes. Geotech. Geol. Eng. 2023, 41, 4395–4414. [Google Scholar] [CrossRef] [Scilit]
- The Ministry of Water Resources of China. Standard for Engineering Classi-Fication of Rock Mass; Ministry of Water Resources of China: Beijing, China, 2014. [Google Scholar]
- Liu, G.; Feng, X.-T.; Jiang, Q.; Yao, Z.; Li, S. In Situ Observation of Spalling Process of Intact Rock Mass at Large Cavern Excavation. Eng. Geol. 2017, 226, 52–69. [Google Scholar] [CrossRef] [Scilit]

Disclaimer/Publisher’s Note: The statements, opinions and data contained in all publications are solely those of the individual author(s) and contributor(s) and not of MDPI and/or the editor(s). MDPI and/or the editor(s) disclaim responsibility for any injury to people or property resulting from any ideas, methods, instructions or products referred to in the content. |
© 2026 by the authors. Licensee MDPI, Basel, Switzerland. This article is an open access article distributed under the terms and conditions of the Creative Commons Attribution (CC BY) license.