Article

Estimating Thermal Comfort and IAQ in Climate Chamber Experiments
by
Giannis Papadopoulos
1,
Dimitrios Kapenis
1,
Loukas Karagiannakis
1,
Nikolaos Taousanidis
1 and
Giorgos Panaras
1,2,*
1
Department of Mechanical Engineering, University of Western Macedonia, 50132 Kozani, Greece
2
School of Mechanical Engineering, Aristotle University of Thessaloniki, 54124 Thessaloniki, Greece
*
Author to whom correspondence should be addressed.
Appl. Sci. 2026, 16(6), 2629; https://doi.org/10.3390/app16062629
Submission received: 30 January 2026 / Revised: 19 February 2026 / Accepted: 23 February 2026 / Published: 10 March 2026

Abstract

Climate chambers enable repeatable indoor boundary conditions and are increasingly used to study multi-domain IEQ. However, thermal comfort and IAQ are still often evaluated separately, limiting evidence on their coupled behavior and potential trade-offs under different ventilation and air-cleaning strategies. The present study was carried out in the climate chamber located in the laboratory facilities of the University of Western Macedonia to quantify thermal comfort and IAQ simultaneously across different experimental scenarios that vary ventilation mode, heating operation, and occupancy. The results show a correlation between subjective and objective measurements, with the comfort temperature varying around 22.2 °C, as estimated by the Griffiths model, while ventilation mainly affects the stability of the thermal environment. CO2 levels scaled with occupancy and ventilation rate, while PM removal was strongly strategy-dependent: after a controlled smoke event, mechanical ventilation plus air purification achieved the fastest decay and recovery toward near-background concentrations. Overall, this work represents a first step toward coupled IEQ research by jointly quantifying thermal comfort and IAQ in a climate chamber, enabling systematic comparison of ventilation strategies in terms of both perceived comfort and pollutant exposure.

1. Introduction

Controlled-environment or climate chambers (often referred to as “test rooms”) have long played an important role in investigating indoor environmental quality (IEQ), with most studies focusing on thermal comfort, indoor air quality (IAQ), and ventilation [1]. A comprehensive review by Pisello et al. (2021) [2] defines a test room as an enclosed space that is environmentally controlled and properly instrumented for human-centric comfort studies, and catalogs 187 facilities worldwide across 396 peer-reviewed papers, highlighting a growing interest in non-thermal domains (including IAQ) and multi-domain IEQ research. In practice, these chambers are typically equipped with HVAC-based conditioning to control and monitor key boundary conditions—most commonly air temperature, relative humidity, and ventilation/air change rate (often via humidification/dehumidification and filtration)—with commonly reported controllable ranges of ~15–30 °C, 30–70% RH, and ~0–36 ACH [3]. By enabling the creation and maintenance of repeatable indoor conditions, such chambers allow a more accurate assessment of occupants’ comfort while supporting controlled exposure experiments and more precise evaluation of the governing parameters [4].
Researchers use climate chambers to systematically examine how indoor environmental parameters shape occupants’ thermal comfort under controlled conditions [5]. Beyond environmental drivers, a substantial body of work highlights the role of human-related factors, including gender-related differences in comfort perception [6,7,8], and the influence of age [8,9,10], body weight [8,10], health status, and long-term climatic background on perceived comfort [6,9,11]. Metabolic activity is particularly central, as it links individual characteristics and the performed task; accordingly, studies estimate metabolic rate using activity type, participant characteristics [8], prevailing indoor conditions [5], air velocity [12,13], and clothing [14]. Further evidence suggests systematic differences in metabolic responses across populations and conditions [15], and comparisons with standards indicate that for sedentary work, standard metabolic rates tend to exceed experimentally derived values, whereas the opposite may apply for higher-intensity activities [13,16,17].
Beyond the above, chambers have also been used to develop new models and evaluate existing thermal comfort models—such as Fanger’s model [18] or the adaptive model [19]—primarily through questionnaires completed by participants during chamber experiments [20]. Also, chambers can be used to test the effectiveness of various devices, such as cooling systems and fans [9], or different ventilation strategies. This includes examining how personalized ventilation may affect employee productivity [21]. They can also be used to simulate extreme environmental conditions that are not typically observed in buildings [22].
Most IAQ studies conducted in climate chambers are typically performed without occupants and in small-scale test facilities. At the same time, a growing body of research—particularly following the COVID-19 pandemic—has investigated how portable air cleaners and other air-cleaning technologies affect indoor environmental quality under controlled conditions [23], including the removal of particles [24], volatile organic compounds (VOCs) [25], and bioaerosols [26]. Chamber-based experiments have also been used to evaluate novel air purifiers [27], emerging air-cleaning approaches such as plants [28], different filter technologies [29], and even do-it-yourself air cleaners [30]. As an indicative indoor particulate source, tobacco smoking is widely recognized as a major contributor to indoor pollution and adverse health effects, emitting fine/ultrafine particles and a complex mixture of volatile and semi-volatile compounds that can elevate PM2.5 and degrade perceived IAQ [31]. In addition, indoor materials can sorb smoke constituents, while subsequent reactions (e.g., with ozone) may generate secondary products and prolong IAQ impacts beyond the smoking period [32].
Ventilation improves IAQ by renewing the indoor air, while it also has a direct effect on thermal comfort, particularly when ventilation is provided naturally. The ANSI/ASHRAE Standard 62.2 [33], as well as the European CEN EN 16798-1 [34], are the most common standards that offer guidance on ventilation airflow rates. Regarding the estimation of air change rates (ACHs) in buildings, several methods have been developed, with the most widely used being the blower-door (pressurization/depressurization) method and tracer gas techniques [35]. The ventilation rate of a climate chamber can vary according to its use and the ventilation strategy [23,36].
Climate chamber studies have repeatedly shown that thermal conditions and ventilation-related factors interact in shaping both thermal comfort and IAQ. Recent chamber research has often examined this interaction through locally applied airflow solutions, such as personalized ventilation (PV) [37,38,39,40], reporting concurrent changes in thermal comfort and perceived IAQ [41,42]. Personally controlled air movement has been shown to influence both thermal comfort and perceived air quality under controlled exposures [37,38,39]. In warm and humid conditions, PV has been reported to improve perceived air quality and thermal sensation and reduce the intensity of SBS-related symptoms [37]. Likewise, seat/headrest PV studies combine objective assessments of inhaled-air “clean air” performance with human comfort responses collected via questionnaires [38]. Despite these advances, the coupling of thermal comfort and IAQ in chamber settings is still frequently addressed primarily through subjective perceived air quality [41], whereas comparatively fewer studies provide a whole-room, ventilation-strategy-focused assessment that jointly reports comfort indices and objective pollutant metrics under repeatable boundary conditions [42,43]. As a result, evidence on comfort–IAQ trade-offs across realistic ventilation and air-cleaning modes remains limited.
Taken together, the literature indicates strong links between thermal sensations and perceived air quality; however, much of the chamber evidence operationalizes “air quality” mainly through subjective PAQ or inhaled-air proxies and often focuses on personalized air delivery rather than building-relevant whole-space strategies [37,38,39]. In this context, studies that systematically compare whole-room ventilation modes and air-cleaning configurations, while simultaneously reporting thermal comfort outcomes together with common IAQ indicators such as CO2 and particulate matter, remain scarce.
This article presents a series of controlled measurements conducted in a dedicated climate chamber, focusing on thermal comfort and IAQ as key components of IEQ. The primary aim is to demonstrate the chamber’s experimental capabilities and highlight how such facilities can enable a more detailed and systematic investigation of IEQ parameters under well-defined and repeatable boundary conditions. As indicative case studies, thermal comfort experiments were performed using the Fanger model in combination with subjective questionnaires, while a metabolic measurement device was employed to improve the accuracy of metabolic rate estimation and thereby strengthen the reliability of comfort assessment. In parallel, IAQ was evaluated through continuous monitoring of CO2 and particulate matter (PM) concentrations. Importantly, multiple ventilation scenarios were examined to elucidate how airflow strategies simultaneously affect both IAQ and thermal comfort, underscoring the coupled nature of these domains. While thermal comfort and IAQ are often investigated separately, this research introduces an integrated climatic-chamber protocol that examines both domains simultaneously across ventilation strategies, enabling direct comparison of their coupled impacts and potential trade-offs. Overall, this work provides an integrated chamber-based protocol and baseline dataset for benchmarking comfort–IAQ interactions across ventilation strategies and for guiding future studies with larger cohorts and expanded pollutant/physiological measurements.

2. Materials and Methods

2.1. Experimental Chamber

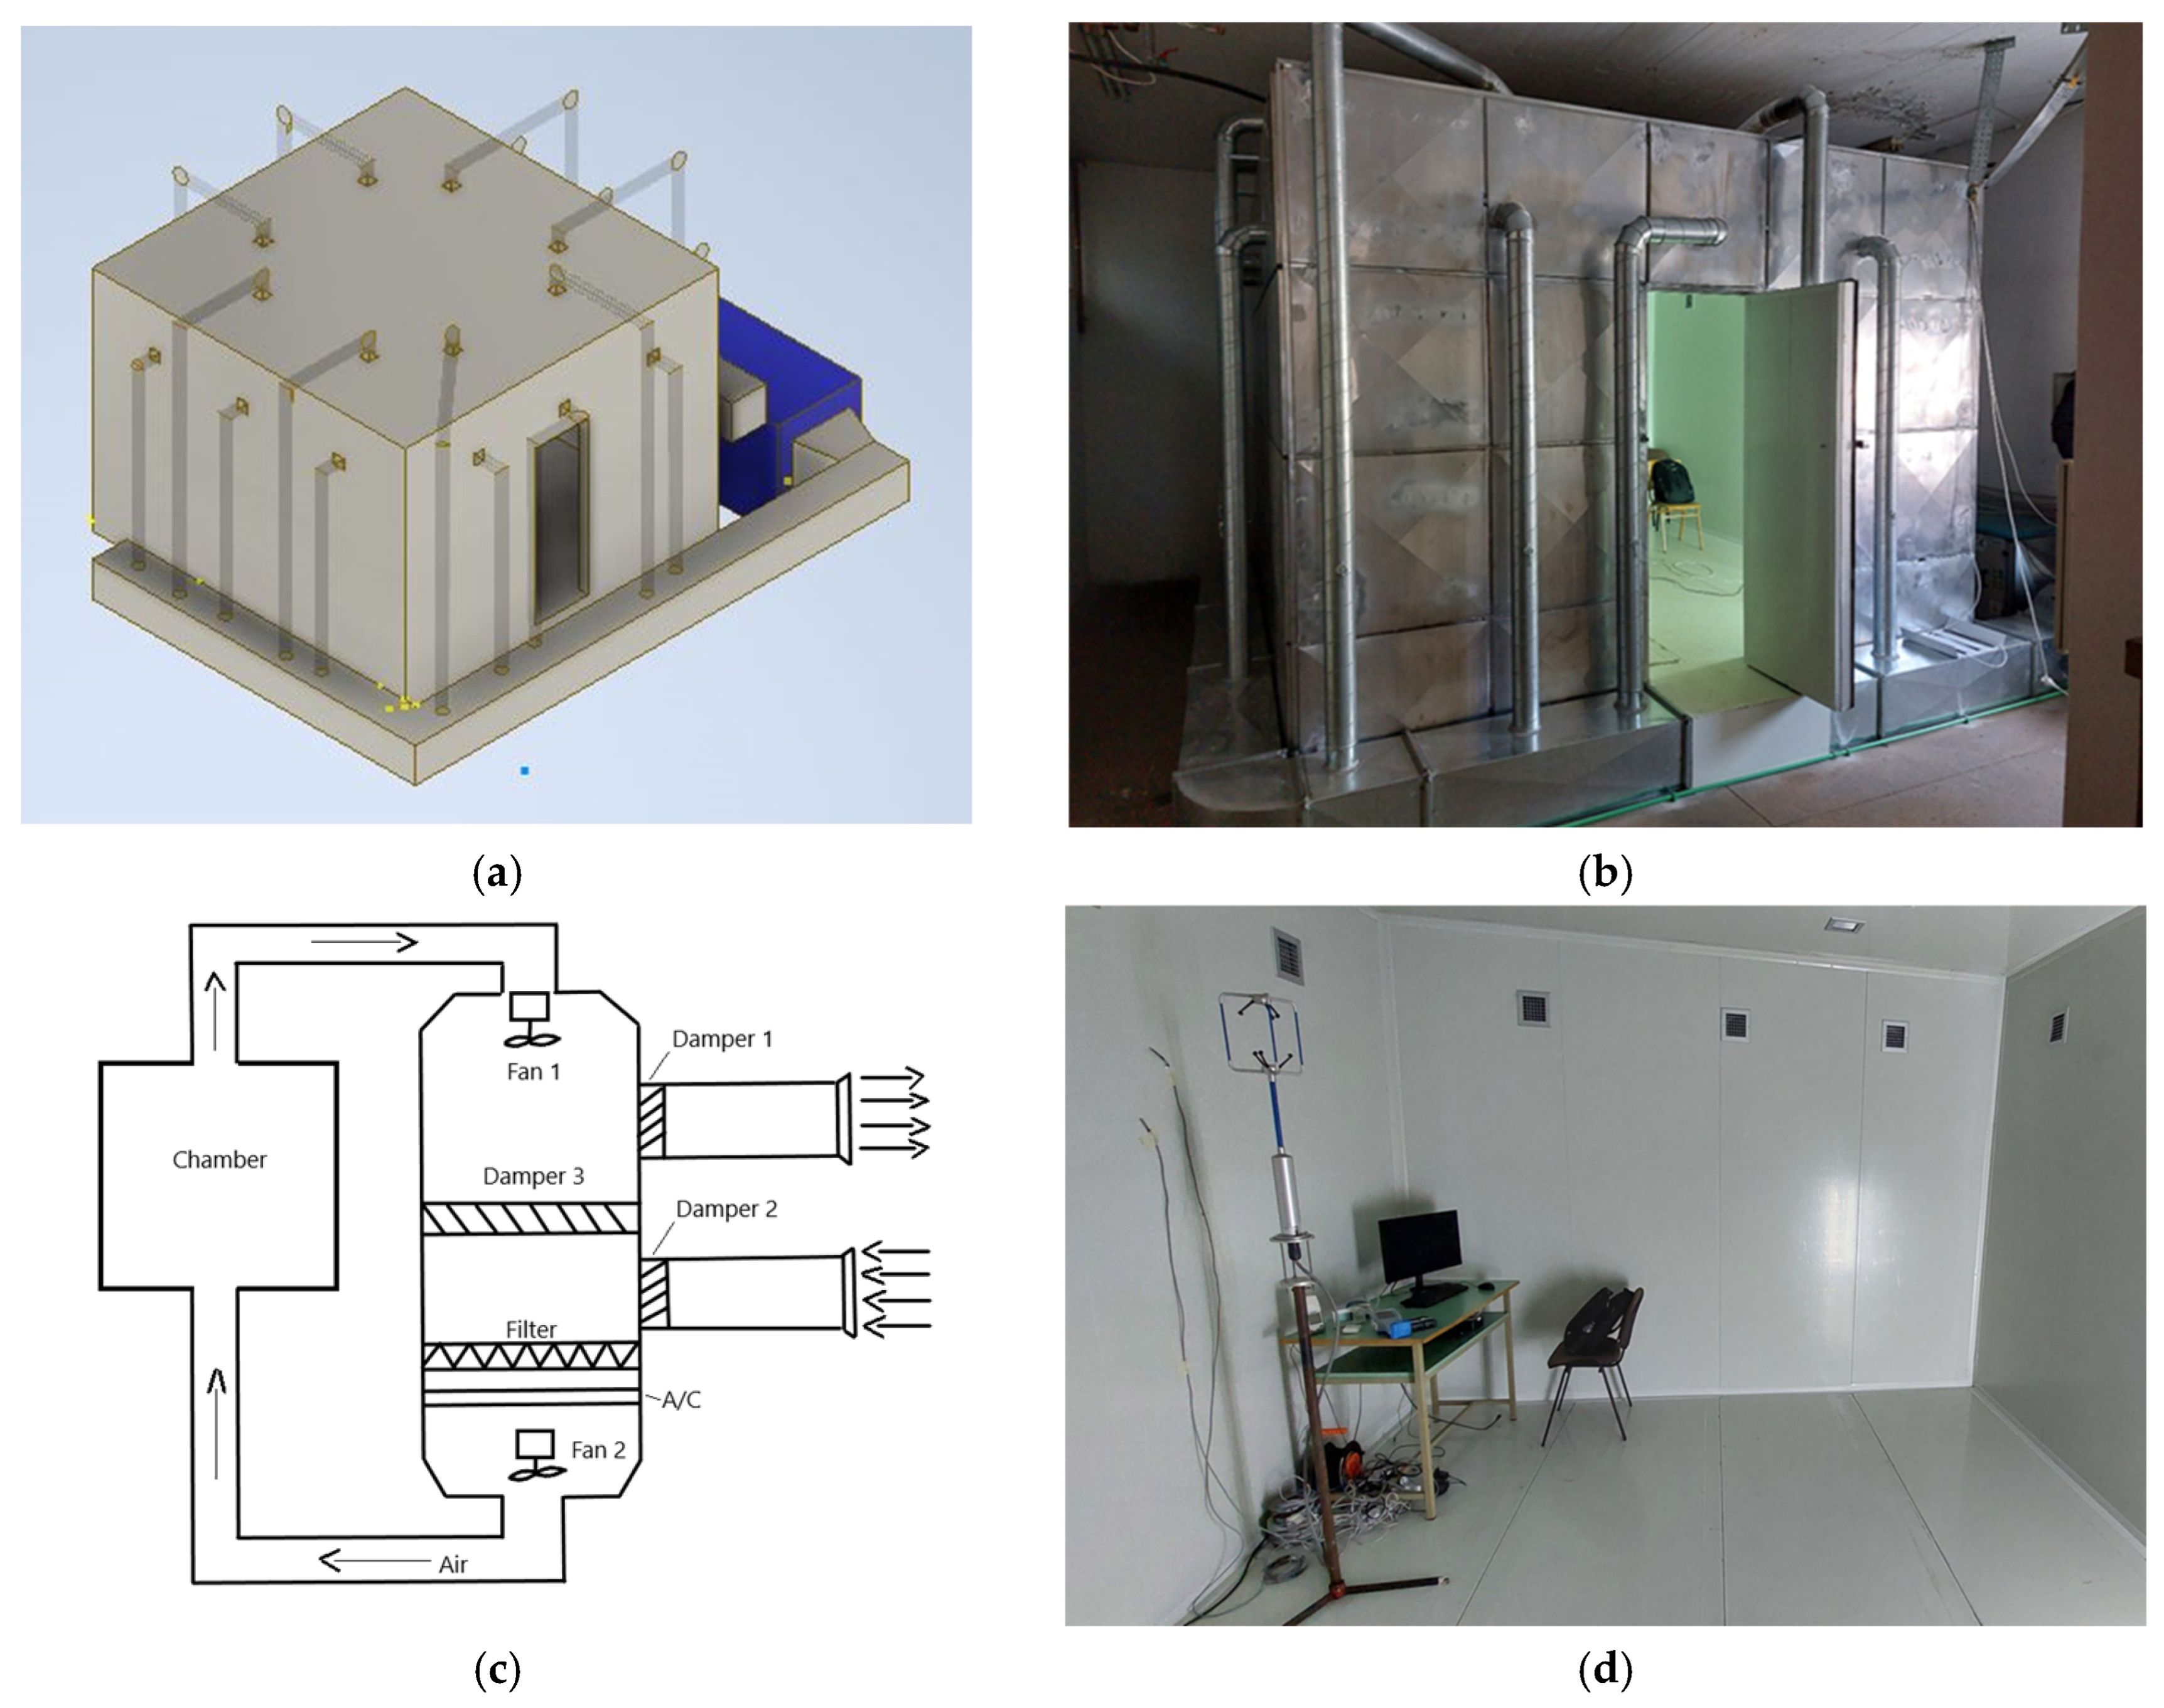
The experimental chamber can be characterized as a box-in-a-box structure and is situated in the facilities of the University of Western Macedonia campus near Koila, Kozani, Greece (Figure 1). This configuration enables precise environmental control within the chamber, while the air conditioners located outside operate with gradual transitions and minimal fluctuations, thereby reducing the impact of outdoor conditions and solar radiation. It has a total floor area of 16 m2 and a volume of approximately 46 m3, and is equipped with an HVAC system. The air handling unit (AHU) is equipped with a water-to-air heat pump with a rated cooling capacity of 8.49 kW and a rated heating capacity of 12.1 kW; it includes an EC plug supply fan delivering 1725 m3/h at a total static pressure of 450 Pa, with an absorbed power of 0.3 kW, 63% efficiency, and an overall in-duct sound power level of 73.3 dB(A). Air filtration is provided by a G4 filter in accordance with ISO 16890 [44]. Ventilation control is achieved by three dampers with dimensions of 210 × 450 mm, which regulate the ventilation mode and the ratio of fresh to recirculated air supplied to the chamber, while air distribution within the chamber is ensured by a total of 20 ventilation grilles, comprising 10 supply air grilles and 10 extract air grilles. All the systems of the chamber are controlled by an appropriate automatic control system equipped with controllers. Further information about this is presented in the work of Zouloumis et al. (2025) [45].
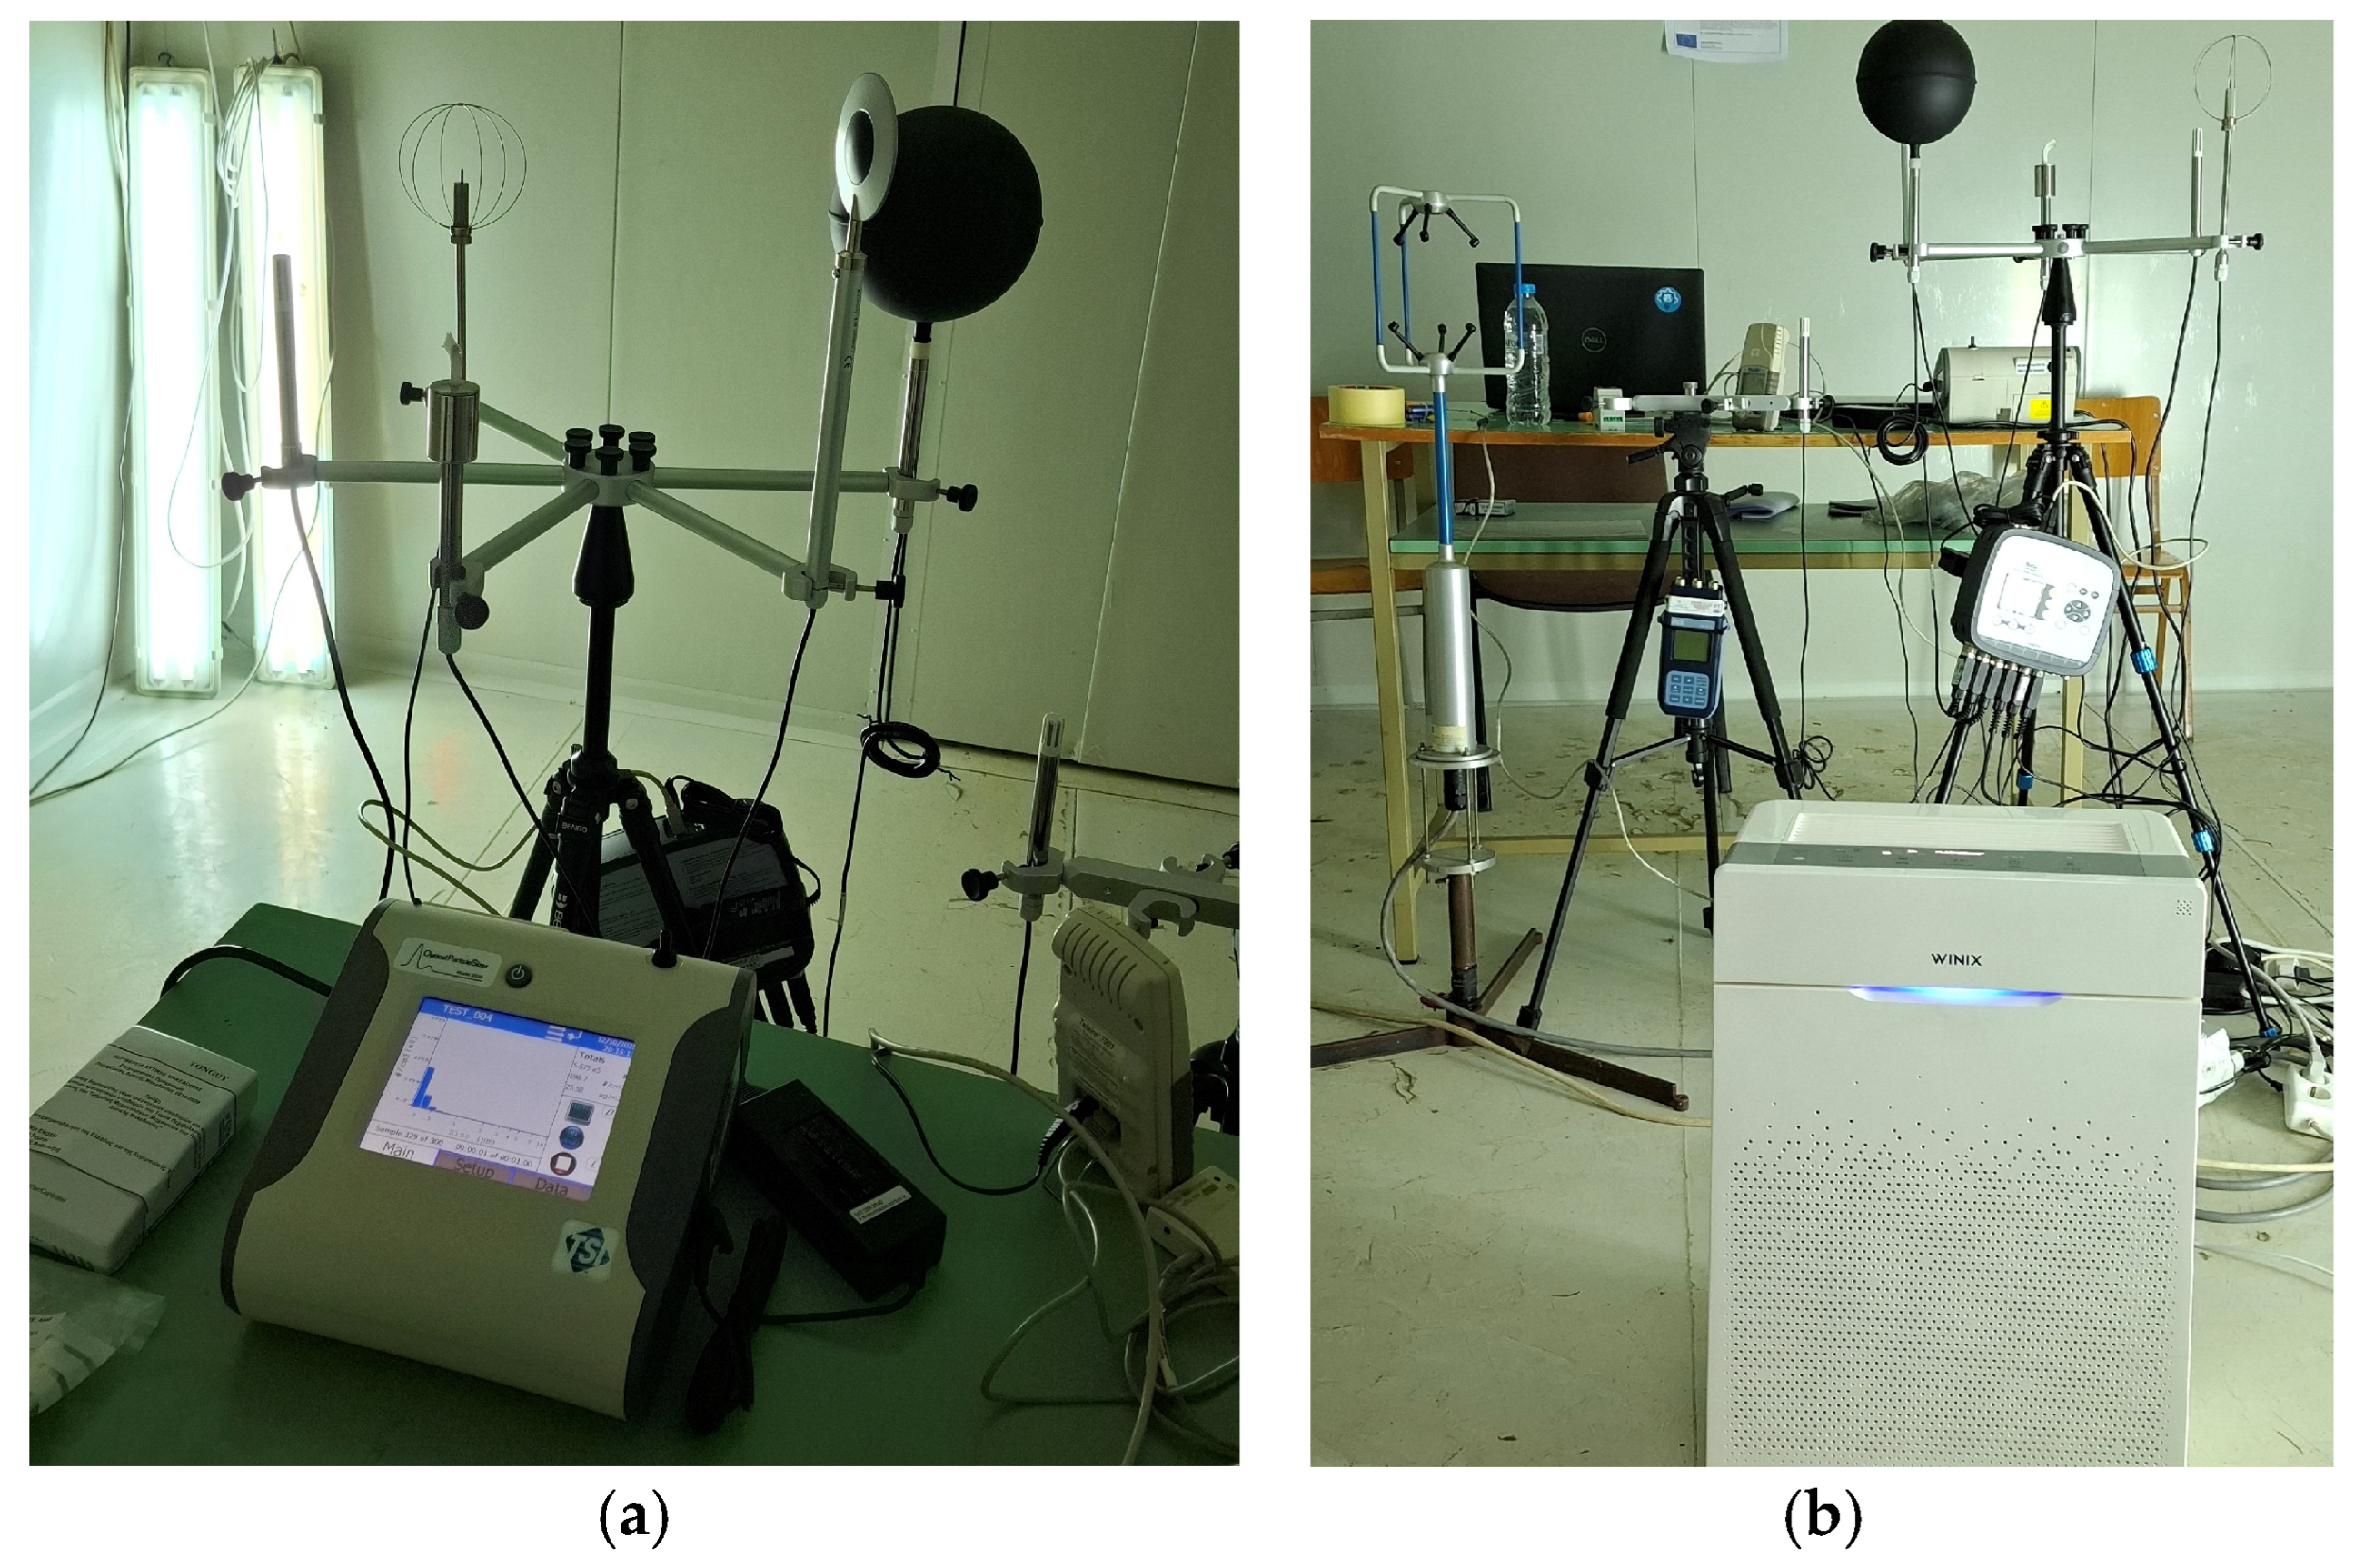
Besides the mechanical ventilation system, an air purifier is also installed in the chamber, providing the opportunity to investigate various ventilation scenarios and the impact that these devices have on the improvement of the IEQ. The present air purifier is the WINIX Zero Pro, which is equipped with a HEPA filter, an active card filter, a pre-filter, and plasma technology (Figure 2b). The Clean Air Delivery Rate (CARD) is about 470 m3/h, and it is suitable for an area of up to 120 m2. This air purifier can be used both manually and automatically. In the auto-mode, the particle and gas sensor can evaluate the IAQ of the room and adjust the fan speed based on this information. The auto-mode of this air purifier helps to maximize the IAQ with minimized energy consumption. Alternatively, the user can manually adjust the fan speed between 4 predefined selections.

2.2. Experimental Setup

This section presents the full set of experimental equipment used to record the parameters related to comfort conditions inside the chamber, as well as the sampling procedure that was followed. Thermal comfort parameters (air temperature, relative humidity, air velocity, and globe temperature) were recorded using the thermal microclimate data logger Senseca HD32.1 coupled with SICRAM probes (Table 1): TP3207, HP3217R, AP3203, TP3275 and TP3207TR. In addition, a 3D ultrasonic anemometer was used to capture three-dimensional air velocity components and better characterize ventilation-induced air movement patterns (Figure 2). The measurement campaign is based on ISO 7726 [46] and ANSI/ASHRAE 55 [16]. Each set of instruments and sensors was calibrated before the experimental measurements and then placed at a height of 1.1 m from floor level at the breath zone of the users of the chamber. The time interval of all the sensors was 1 min.
Metabolic rate is a critical parameter in thermal comfort assessment; however, in the majority of research studies, it is insufficiently evaluated. For this reason, the Breezing Pro device was employed in the present study to obtain direct and individualized measurements of metabolic rate. Direct metabolic rate measurements using the Breezing Pro were therefore conducted on a limited subset of participants to benchmark the default metabolic rate assumptions from EN ISO 7730/ASHRAE 55 and provide measured inputs where available. For the remaining scenarios/participants, metabolic rate was assigned based on standard tabulated values for the prescribed activity level.
As regards IAQ, Optical Particle Sizer (TSI Model 3330) was employed for real-time characterization of airborne particulate matter by measuring particle number concentration and size distribution, supporting detailed evaluation of aerosol behavior and air quality (Figure 2). Also, CO2 concentration was measured as an indicator for ventilation, and IAQ using a Hobo Telaire 7001 was combined with U12-012. Although the Telaire unit can also report temperature, the comfort calculations relied on the higher-accuracy microclimate sensors of the HD32.1 system. Finally, the Tongdy G01-CO2-B10C/30C transmitter was integrated into the chamber HVAC controller and used for operational control only.

2.3. Scenarios

As mentioned above, the aim of this work is to demonstrate the chamber’s experimental capabilities and highlight how such facilities can enable a more detailed and systematic investigation of IEQ. These scenarios were conducted with human participants inside the chamber and focused primarily on thermal comfort and IAQ. The effects of different thermal comfort conditions on chamber occupants were investigated and evaluated both through the participants’ personal thermal feeling using an appropriate questionnaire and through thermal comfort models such as Fanger’s model.
In parallel, the influence of ventilation was examined, including its effects on thermal comfort and IAQ. Regarding thermal comfort, the impact of air drafts occurring during mechanical ventilation was assessed, as air velocity can change the thermal feeling. With respect to IAQ, the effect of ventilation on reducing CO2 generated by occupants, as well as airborne particulate matter, was evaluated.
For particulate matter, indoor smoking experiments were carried out in the chamber as a controlled, repeatable particulate emission event to evaluate the performance of different ventilation and air-cleaning configurations. This setup was not intended to reproduce typical real-life occupancy patterns, but to generate a measurable PM increase under standardized conditions, allowing the comparison of particle removal dynamics across scenarios. These experiments investigated different ventilation scenarios, including mechanical ventilation, the use of an air purifier, and combinations of both, in order to assess the various ventilation configurations and how they affect the chamber’s indoor air quality. Ventilation rates and the chamber airtightness were determined using tracer gas methods, leveraging CO2 concentration measurements.
Table 2 summarizes the experimental scenarios tested, detailing the ventilation strategy and heating operation, the number of occupants present, and which parameters were assessed in each case (thermal comfort, CO2 concentration, and particulate matter, PM). To examine whether changing conditions within the same day affect subjective responses, the lettered scenario sets (e.g., “a–b–c”), which were conducted on the same experimental day, were analyzed.

2.4. Methodology

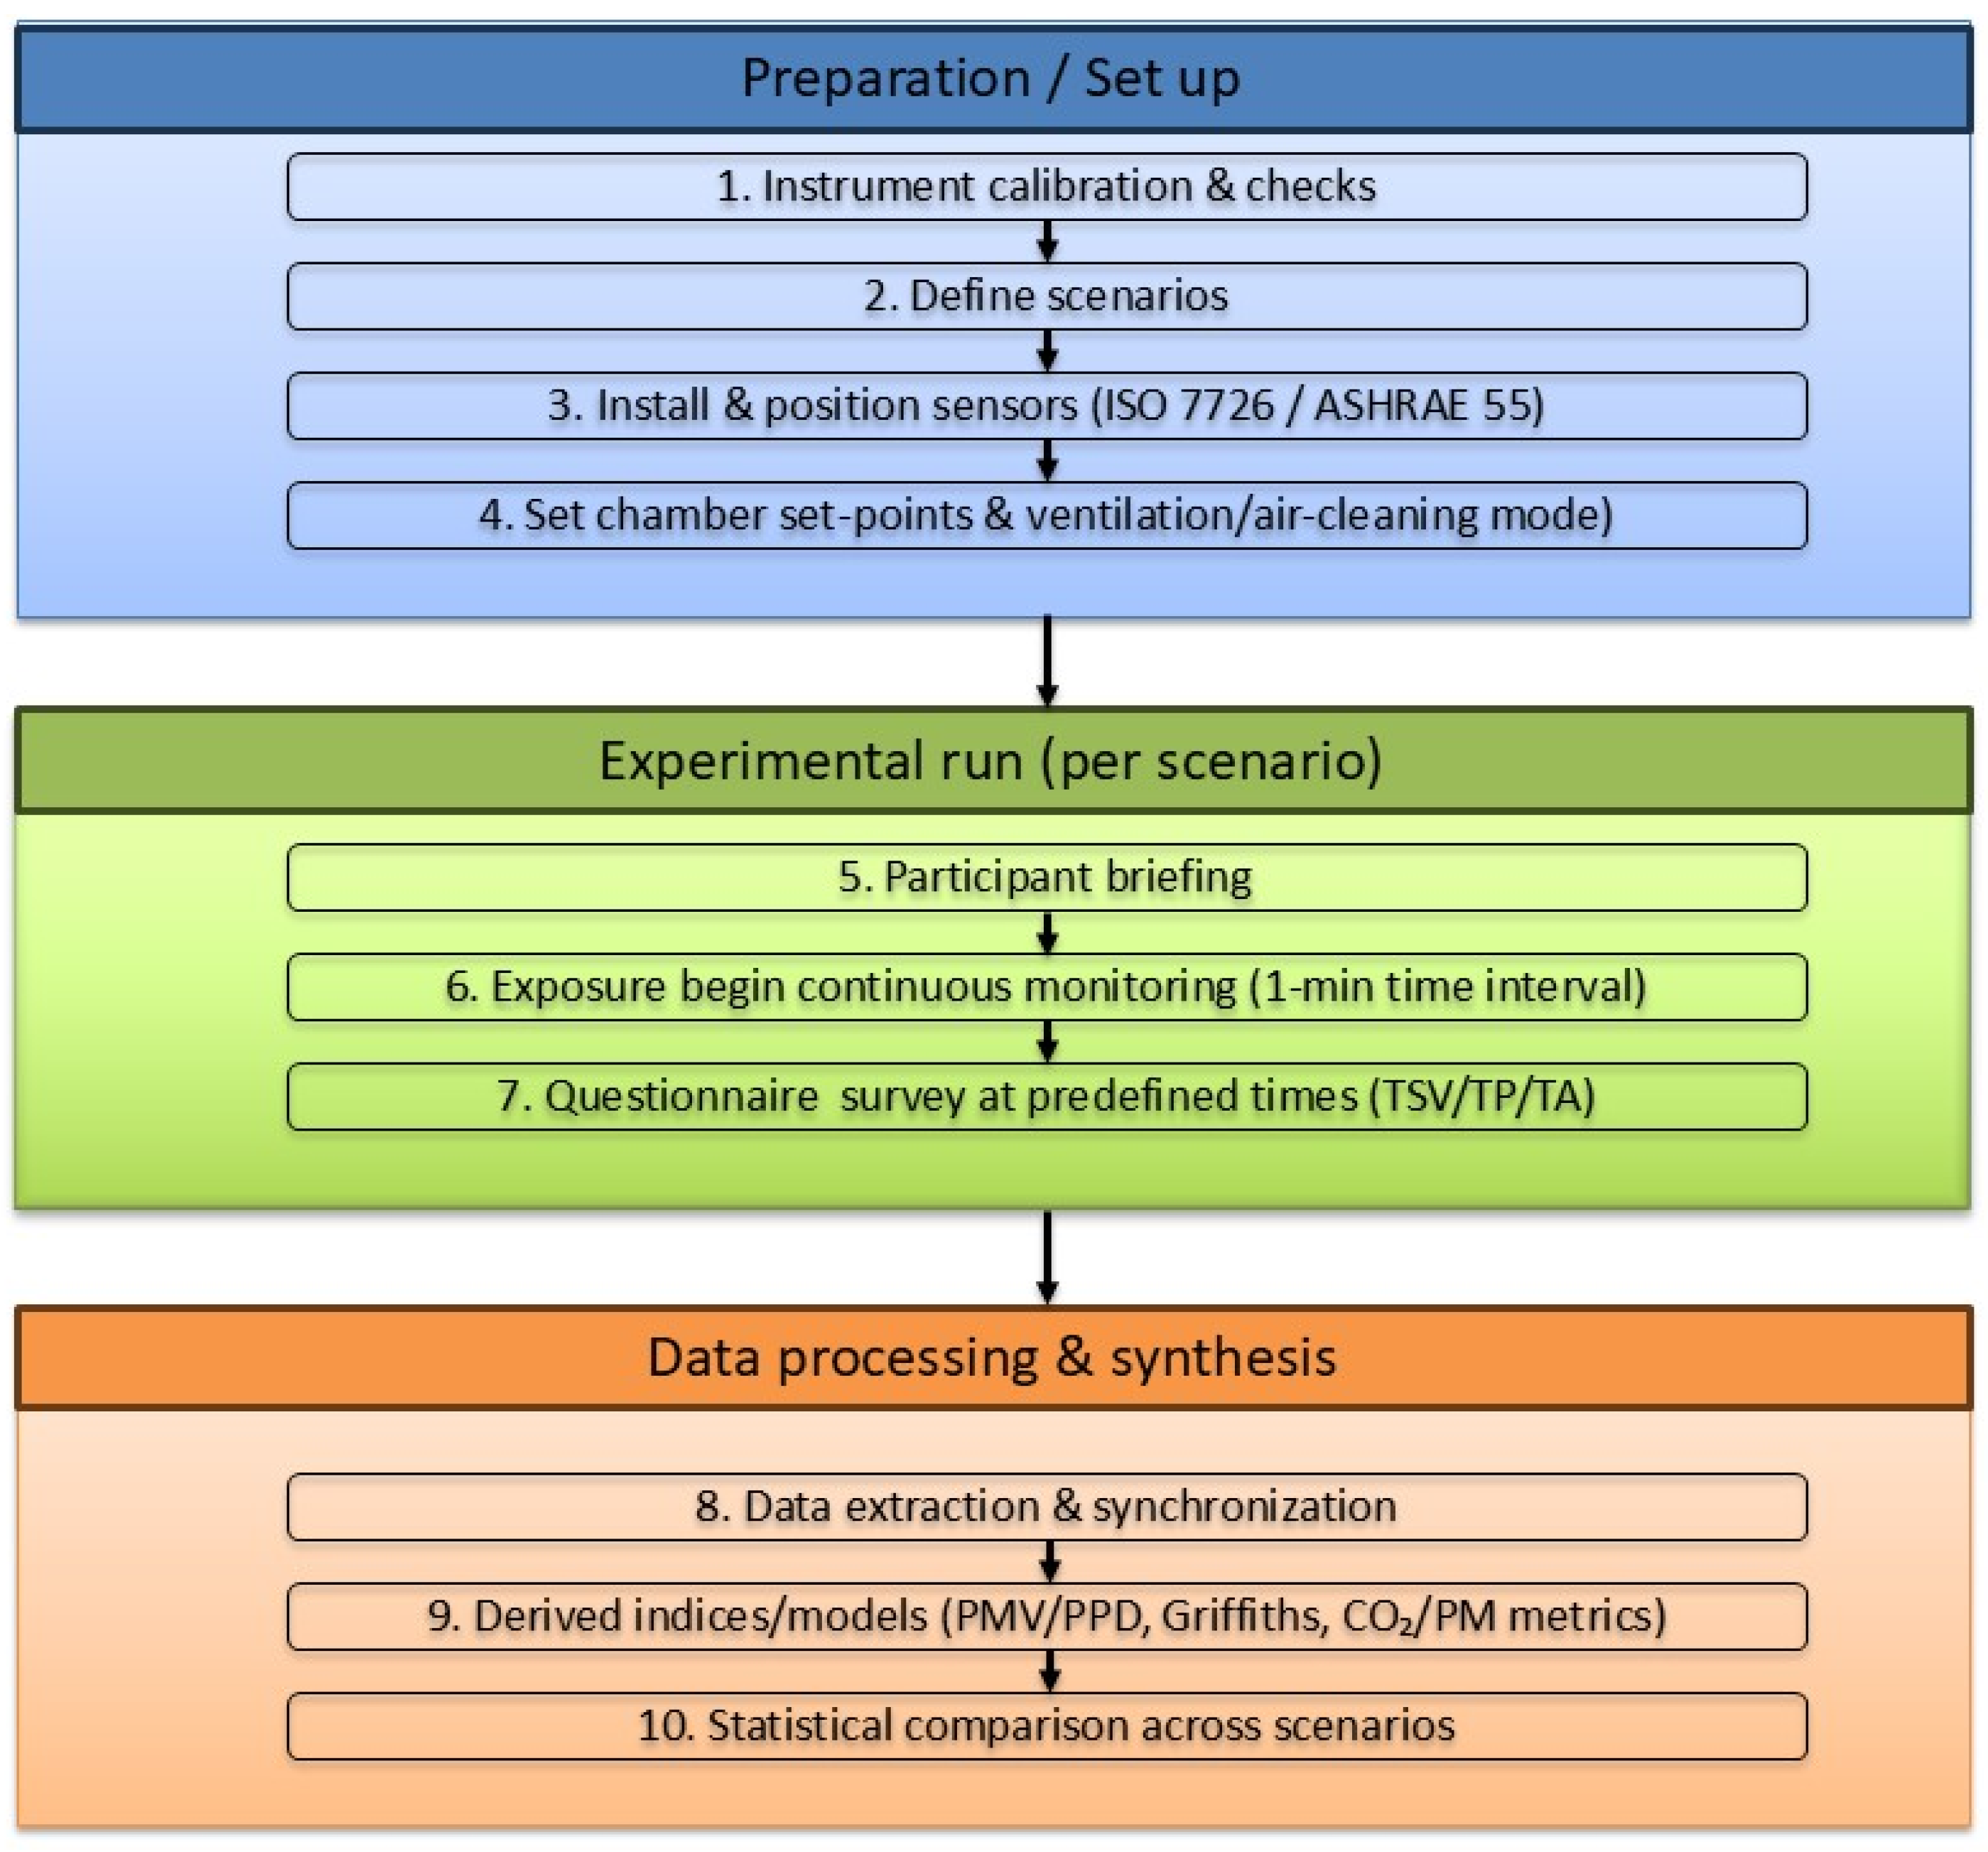
The overall experimental methodology followed in this study is summarized in Figure 3 and consists of three main stages: (i) preparation and setup, (ii) experimental execution per scenario, and (iii) data processing and synthesis.
Prior to each experimental campaign, all measurement instruments were calibrated and checked according to manufacturer specifications to ensure measurement reliability. Subsequently, the experimental scenarios were defined. All sensors were installed and positioned in accordance with international standards, as mentioned above. For each scenario, participants were briefed regarding the experimental procedure and questionnaire survey. The number of participants was limited, and the same volunteers participated across multiple scenarios; therefore, the dataset should be interpreted primarily as a repeated measures comparison across scenarios rather than population-level inference. Exposure commenced under controlled boundary conditions, with continuous monitoring of thermal and IAQ parameters at 1 min time intervals. Following each experimental session, recorded datasets were extracted and synchronized across instruments to ensure temporal alignment. Finally, derived comfort indices and IAQ metrics were calculated.

3. Results

The results of these scenarios, as concern thermal comfort and IAQ, are presented in this chapter. More specifically, thermal comfort will be evaluated using the Fanger model, in combination with occupant questionnaires to capture users’ actual comfort perception. The comfort temperature will be estimated using the Griffiths method, based on the questionnaire-derived thermal sensation responses. Regarding indoor air quality, CO2 concentrations and airborne particulate matter (PM2.5 and PM10) will be reported for each experimental scenario, and the influence of different ventilation strategies will be examined. In addition, dedicated experiments will investigate smoking-related emissions and how alternative ventilation approaches affect the resulting indoor pollutant levels. Finally, the infiltration rate of the chamber will be quantified using a tracer gas approach, exploiting the CO2 measurements.

3.1. Thermal Comfort Results

The Fanger model, which calculates the Predicted Mean Vote (PMV) index and the Predicted Percentage Dissatisfied (PPD) index, was used as the main indicator of thermal comfort. The PMV was estimated from measured thermal comfort parameters (air temperature, radiant temperature, air velocity, and relative humidity) along with the physical parameters of metabolic rate and clothing. As concerns mean radiant temperature (Tmrt), it was calculated using Equation (1), while operative temperature (To) was calculated using Equation (2),
T m r t = T g + 273 4 + 1.1 × 10 8 × V 0.6 ε g × D 0.4 × T g T a 1 / 4
where εg: globe emissivity (assumed to be 0.95) and D: diameter (approximately 150 mm).
T o p = T a + T m r t 2
The estimation of Fanger indexes was calculated according to the relations proposed by EN ISO 7730, Annex D [17], and ASHRAE Standard 55 [16]. Clothing was recorded during the point-in-time survey. Metabolic rate was calculated according to EN ISO 7730, Annex A [17] for sedentary activity, while Breezing Pro was also used. During the experimental period, the Breezing Pro was used to obtain time-resolved gas-exchange outputs, specifically oxygen consumption (VO2) and carbon dioxide production (VCO2). In addition, the Breezing Pro reported ventilatory descriptors, including exhalation rate (ATPS), defined as the volume of exhaled air per unit time (ventilatory flow) expressed under ATPS conditions (Ambient Temperature and Pressure, Saturated), meaning that gas volumes are reported as measured at ambient conditions with full water vapor saturation. The device also provided breath frequency, i.e., the number of breaths per minute (respiratory rate), and tidal volume (ATPS), i.e., the volume of air moved per breath (per respiratory cycle), reported under ATPS conditions. These ventilatory outputs were not direct inputs to the metabolic rate equations but were retained as supporting indicators of respiratory pattern and measurement context during the working protocol.
The measured VO2 and VCO2 were subsequently used to calculate the respiratory quotient (RQ) (Equation (3)). The resulting RQ value was then used to compute the energy equivalent of oxygen (EE) according to the relationship reported in Equation (4). Next, metabolic rate was calculated by combining EE with VO2 and normalizing by body surface area (Equation (5)), where body surface area was estimated from body mass (Wb) and height (Hb) using the DuBois formulation (Equation (6)) [47].
R Q = V C O 2 V O 2
E E = 5.88 × 0.23 R Q + 0.77
M = E E × V O 2 1 A D u
A D u = 0.202 × W b 0.425 × H b 0.725
where:
RQ: Respiratory quotient;
VCO2: Carbon dioxide output (L/h);
VO2: Oxygen consumption (L/h);
EE: Energetic equivalent (W h/L);
M: Metabolic rate (W/m2);
ADu: Body surface area, in square meters (m2), given by the Du Bois formula; Wb is the weight (kg), Hb is the height (m).
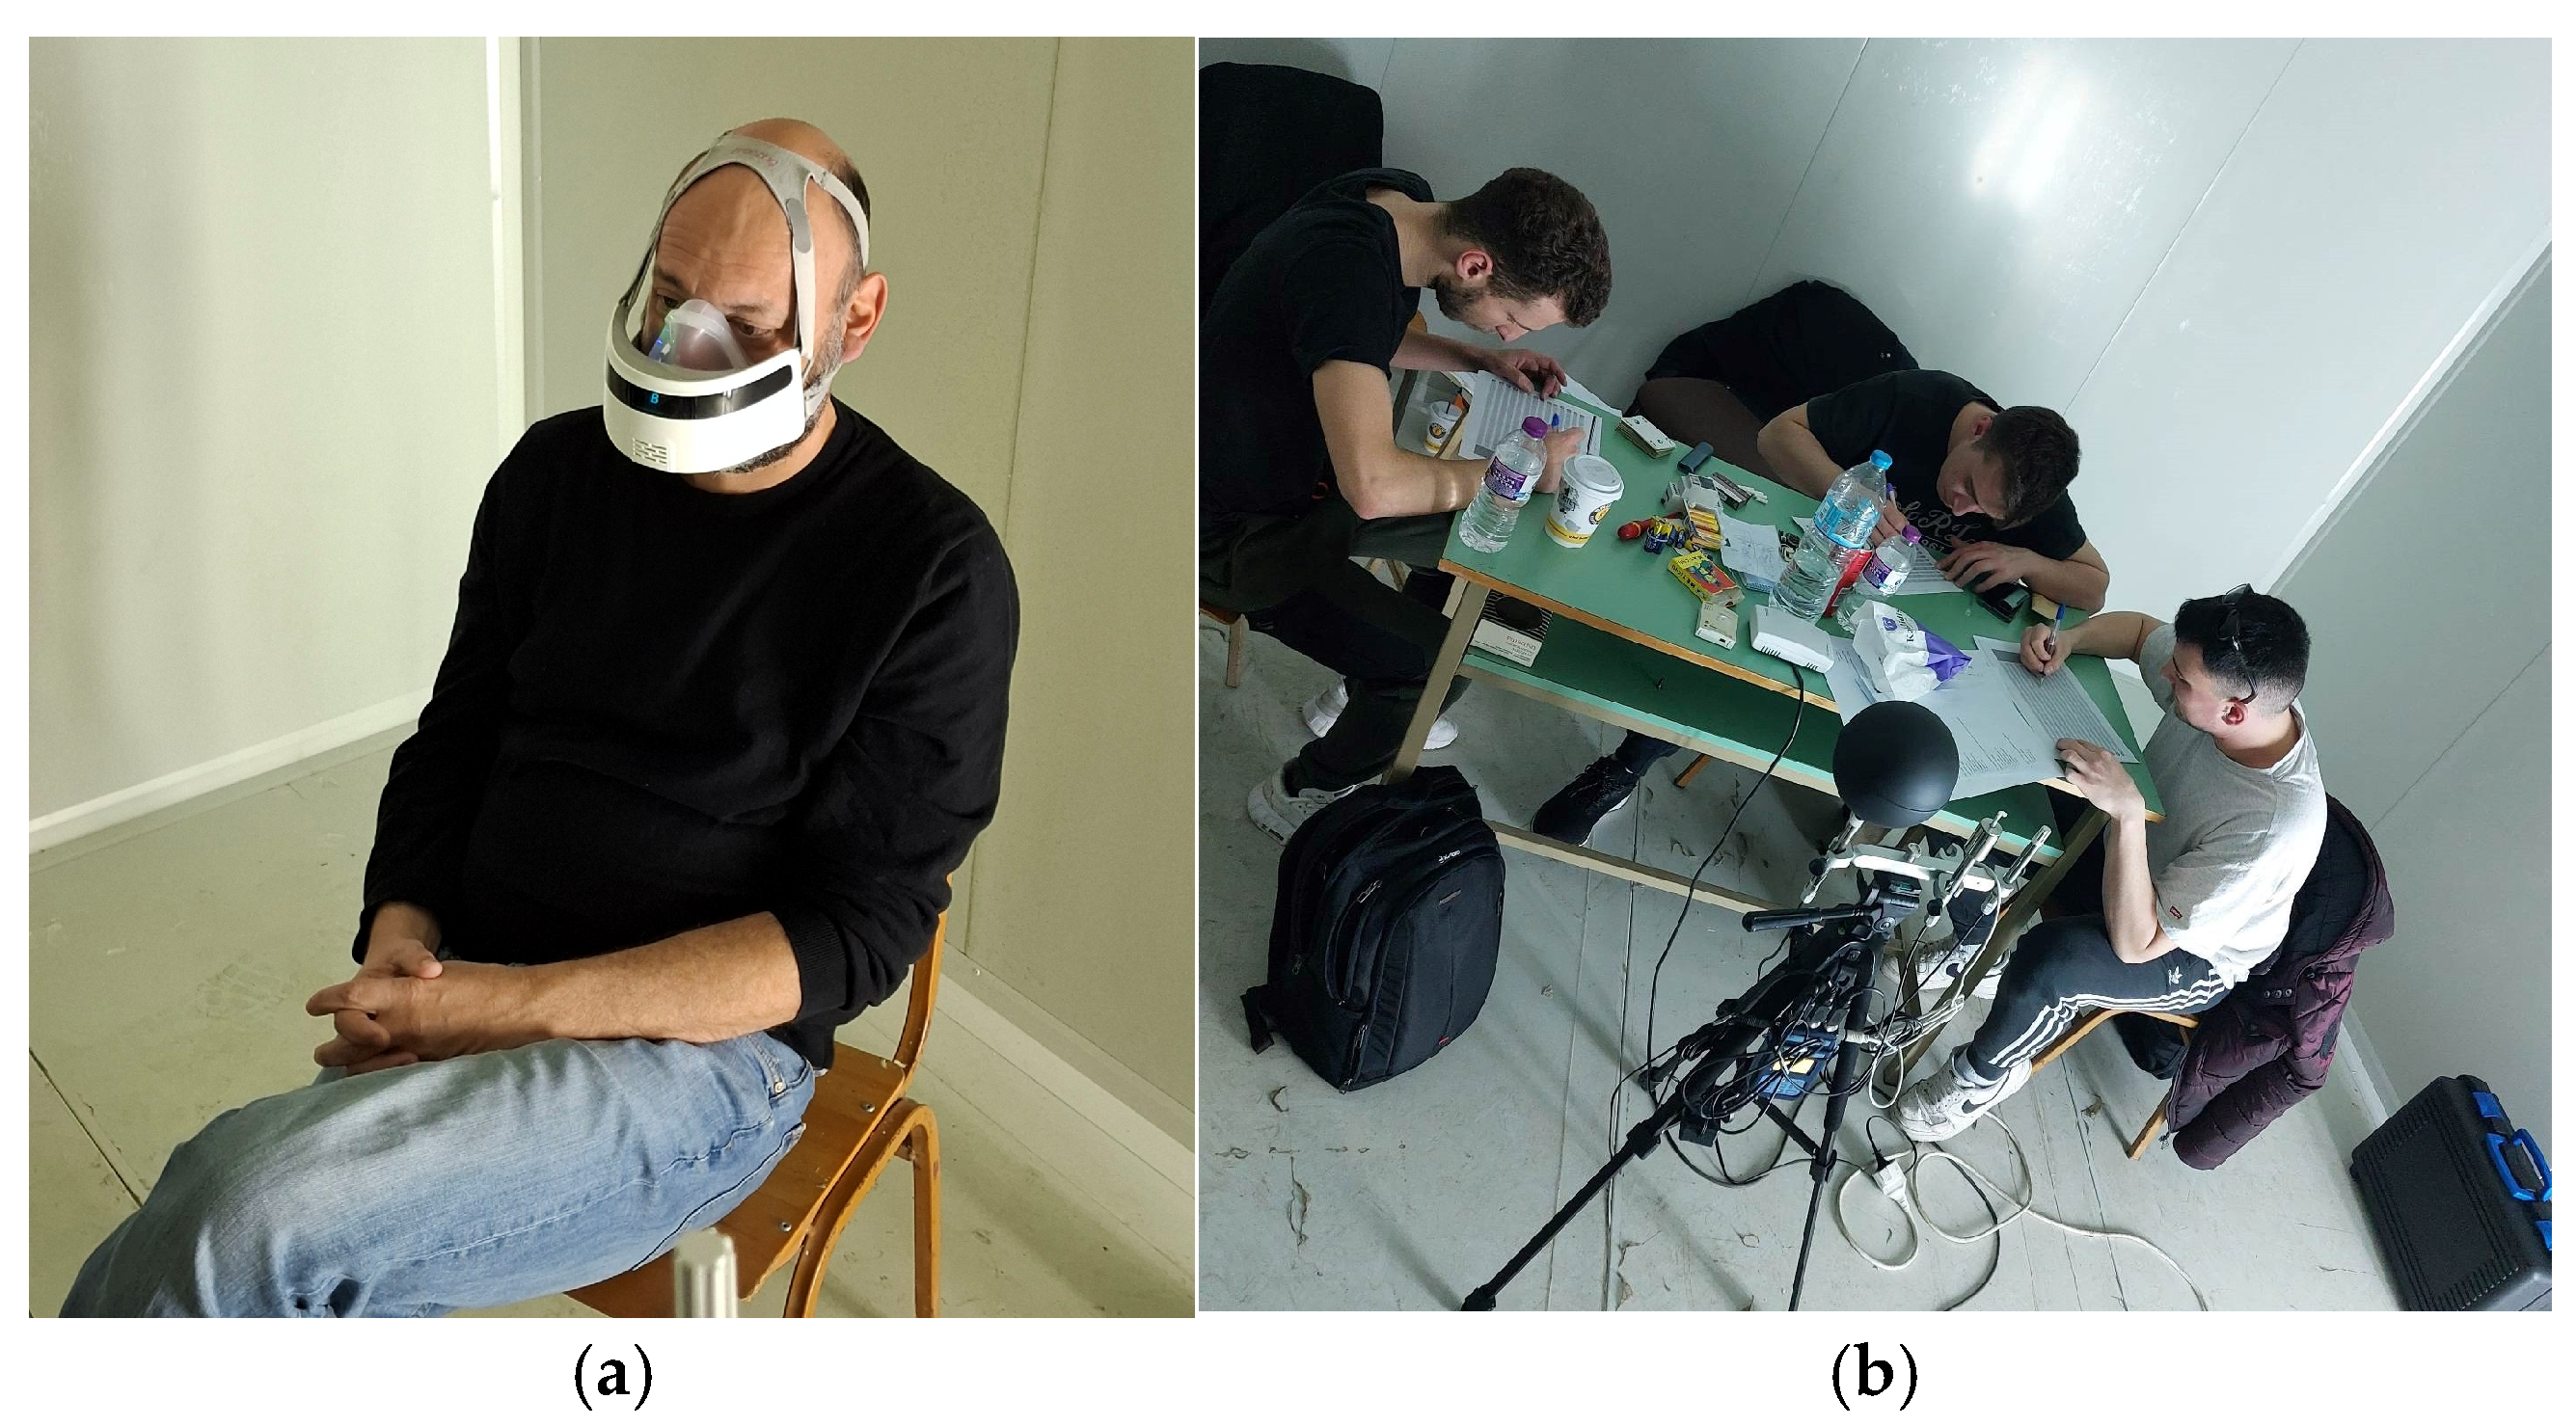
Table 3 summarizes the key parameters used to calculate occupants’ metabolic rate during the measurement campaign. It includes participants’ personal characteristics, as well as the variables provided by the metabolic measurement device that were required for the calculation. Metabolic rate was measured once per participant, assuming it remained constant, as the activity level remained the same throughout the measurements (Figure 4a).
Table 4 summarizes the environmental and personal input parameters used for the calculation of the PMV–PPD indexes across the examined scenarios. Clothing level was recorded for each occupant during the questionnaire survey; metabolic rate was estimated in accordance with the ASHRAE Standard [16] to Scenario 11a and measured thereafter with the Breezing Pro.
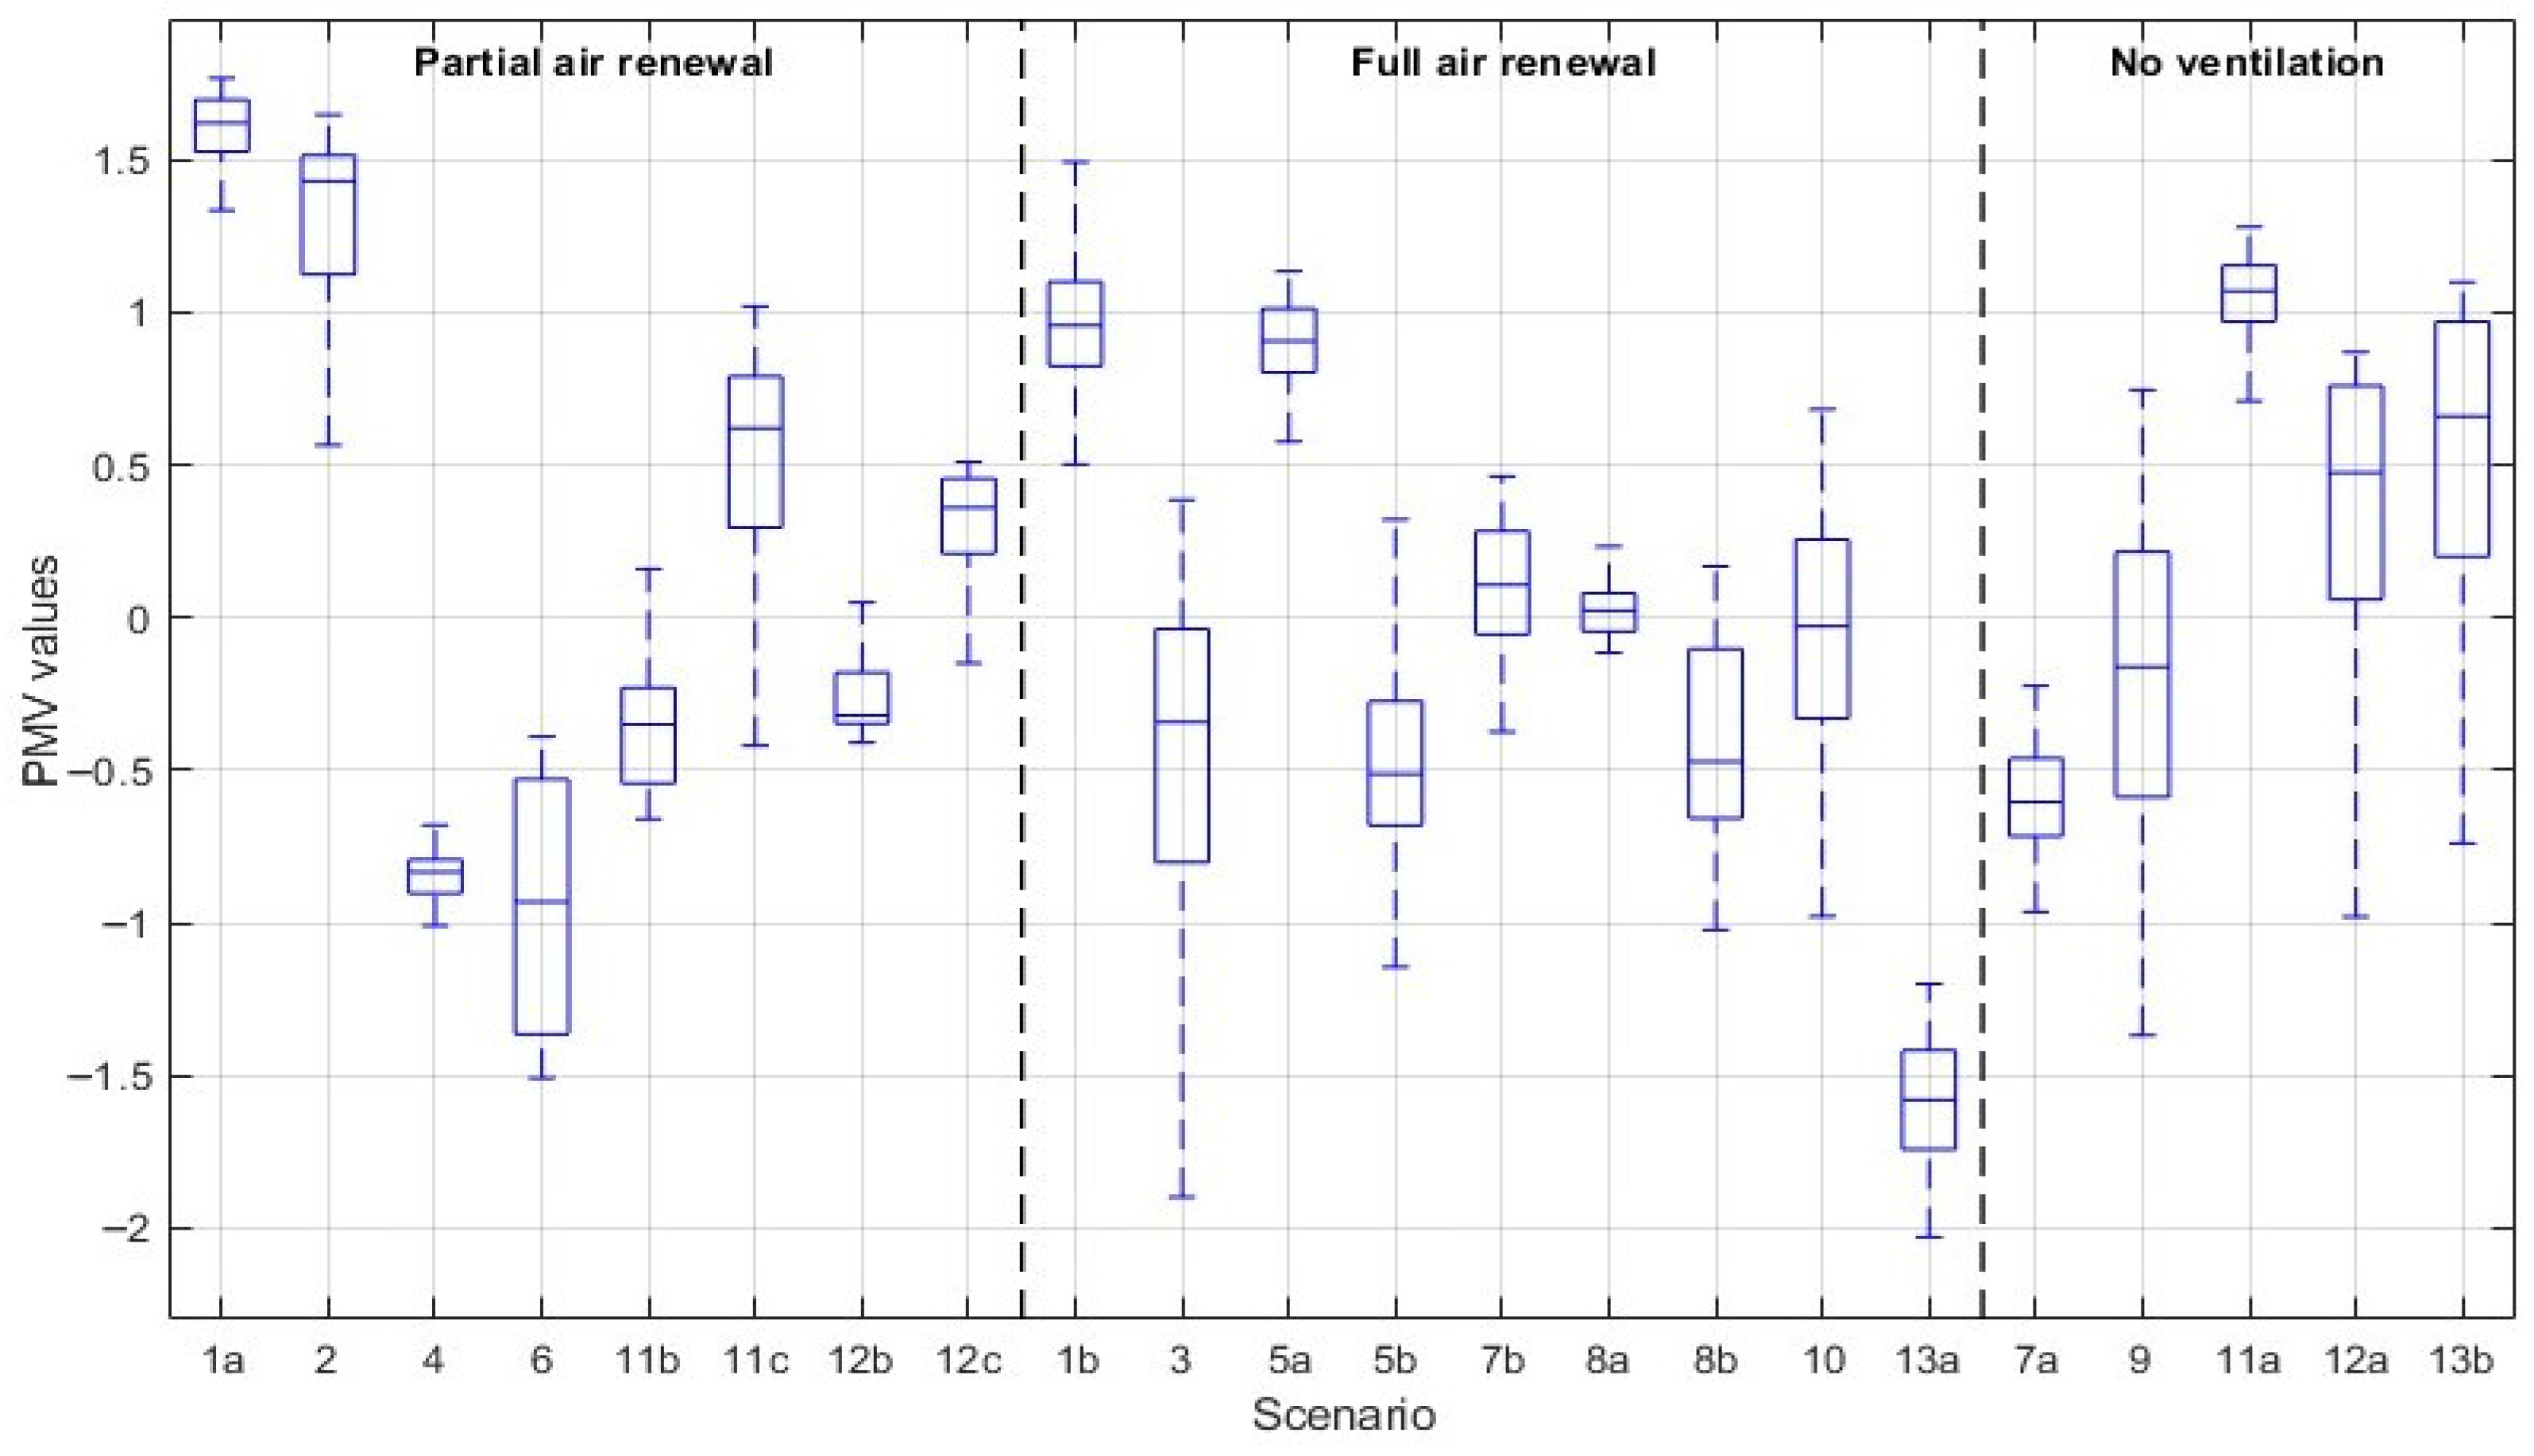
The PMV was calculated for each scenario and summarized as boxplots (see Figure 5) according to different ventilation strategies. Comfort standard interpretation (based on boxplot medians) indicates that ASHRAE Standard 55 [16] with limit −0.5 ≤ PMV ≤ +0.5 is met by Scenarios 3, 5b, 7b, 8a, 8b, 9, 10, 11b, 12b, and 12c. According to EN 16798-1 [34], the most neutral cases fall in Category I (−0.3 to +0.3; e.g., 7b, 8a, 10, and 12b). Scenarios with medians outside +/−0.7 fall in Category IV (1a, 1b, 2, 4, 5a, 6, 11a, 13a, and 13b), while remaining cases fall in Category II or III depending on their median proximity to neutrality. Across all the scenarios, PMV exhibited a clear positive association with air operative temperature, with higher imposed temperatures yielding systematically higher PMV values. When stratified by ventilation regime, the temperature–PMV trend remained consistent, whereas ventilation primarily influenced the dispersion of PMV within each exposure rather than reversing the direction of the thermal response. This indicates that setpoint selection governs the PMV level, while ventilation mainly affects the stability of the thermal environment during each run.
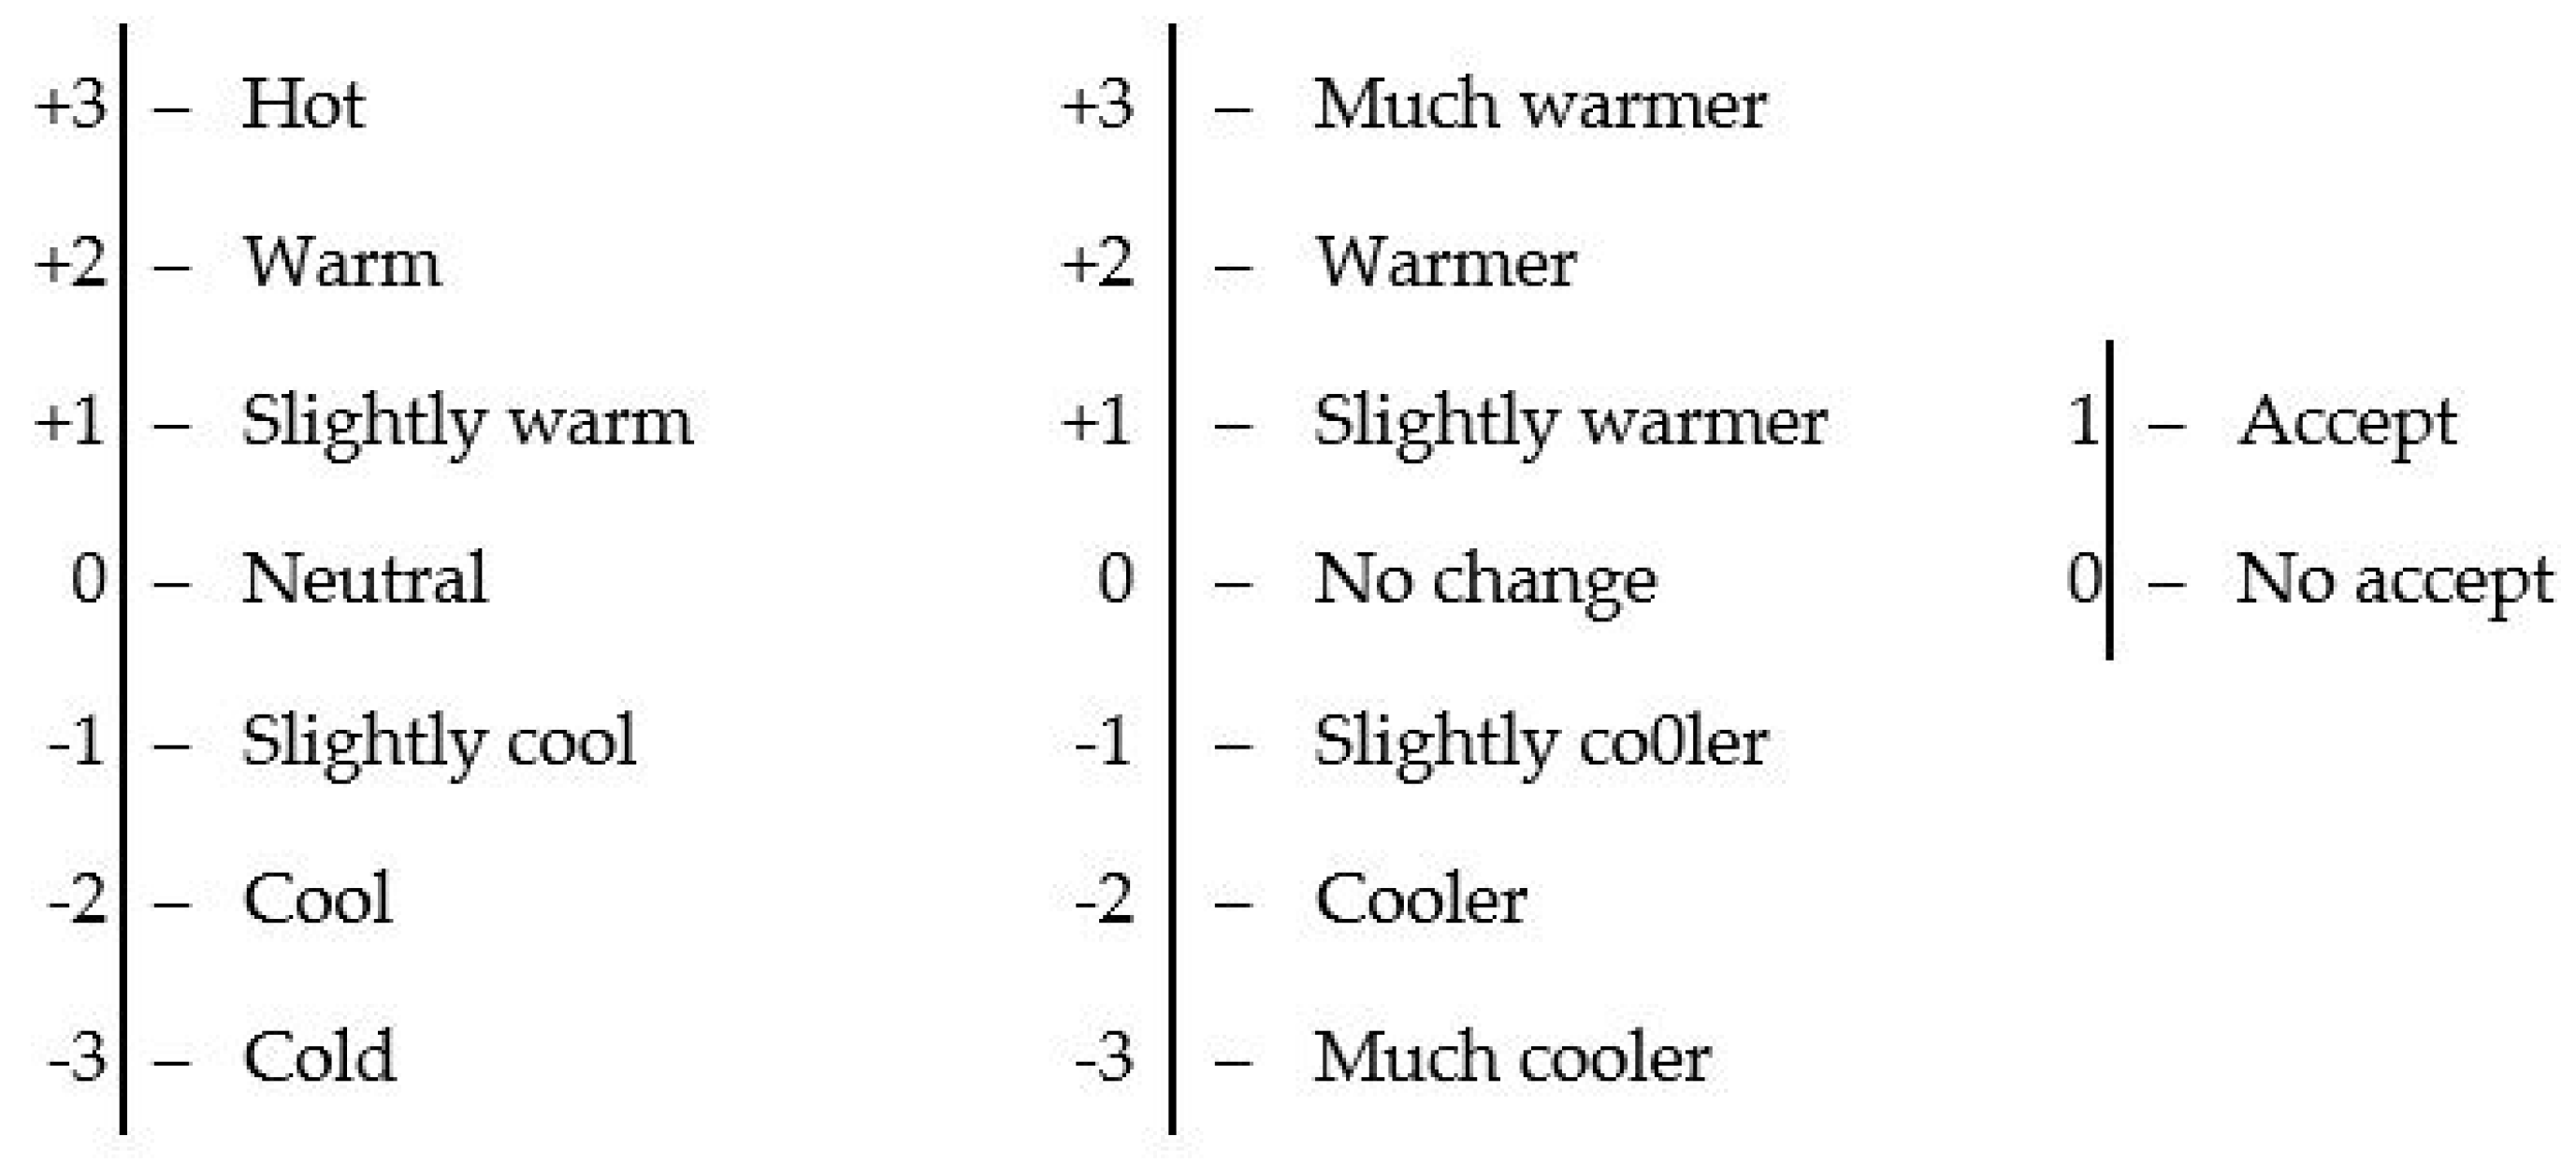
As mentioned above, human thermal comfort is not only objective but also depends on subjective factors [48], so in this work, the experimental measurements are combined with the questionnaire survey (Figure 4b). This point-in-time, or “right-now,” survey, used to evaluate occupants’ thermal sensations at a single moment, included three questions [16]. Thermal sensation vote (TSV) or thermal sensation (TSENS), thermal preference (TP), and thermal acceptability (TA) of the indoor thermal environment were included in the survey. TSV and TP were calculated according to a seven-point scale, while TA was a binary scale (Figure 6). According to the Standard, the satisfaction of occupants occurs when the seven-point scale falls within –1.5 ≤ TSV≤ +1.5 [16].
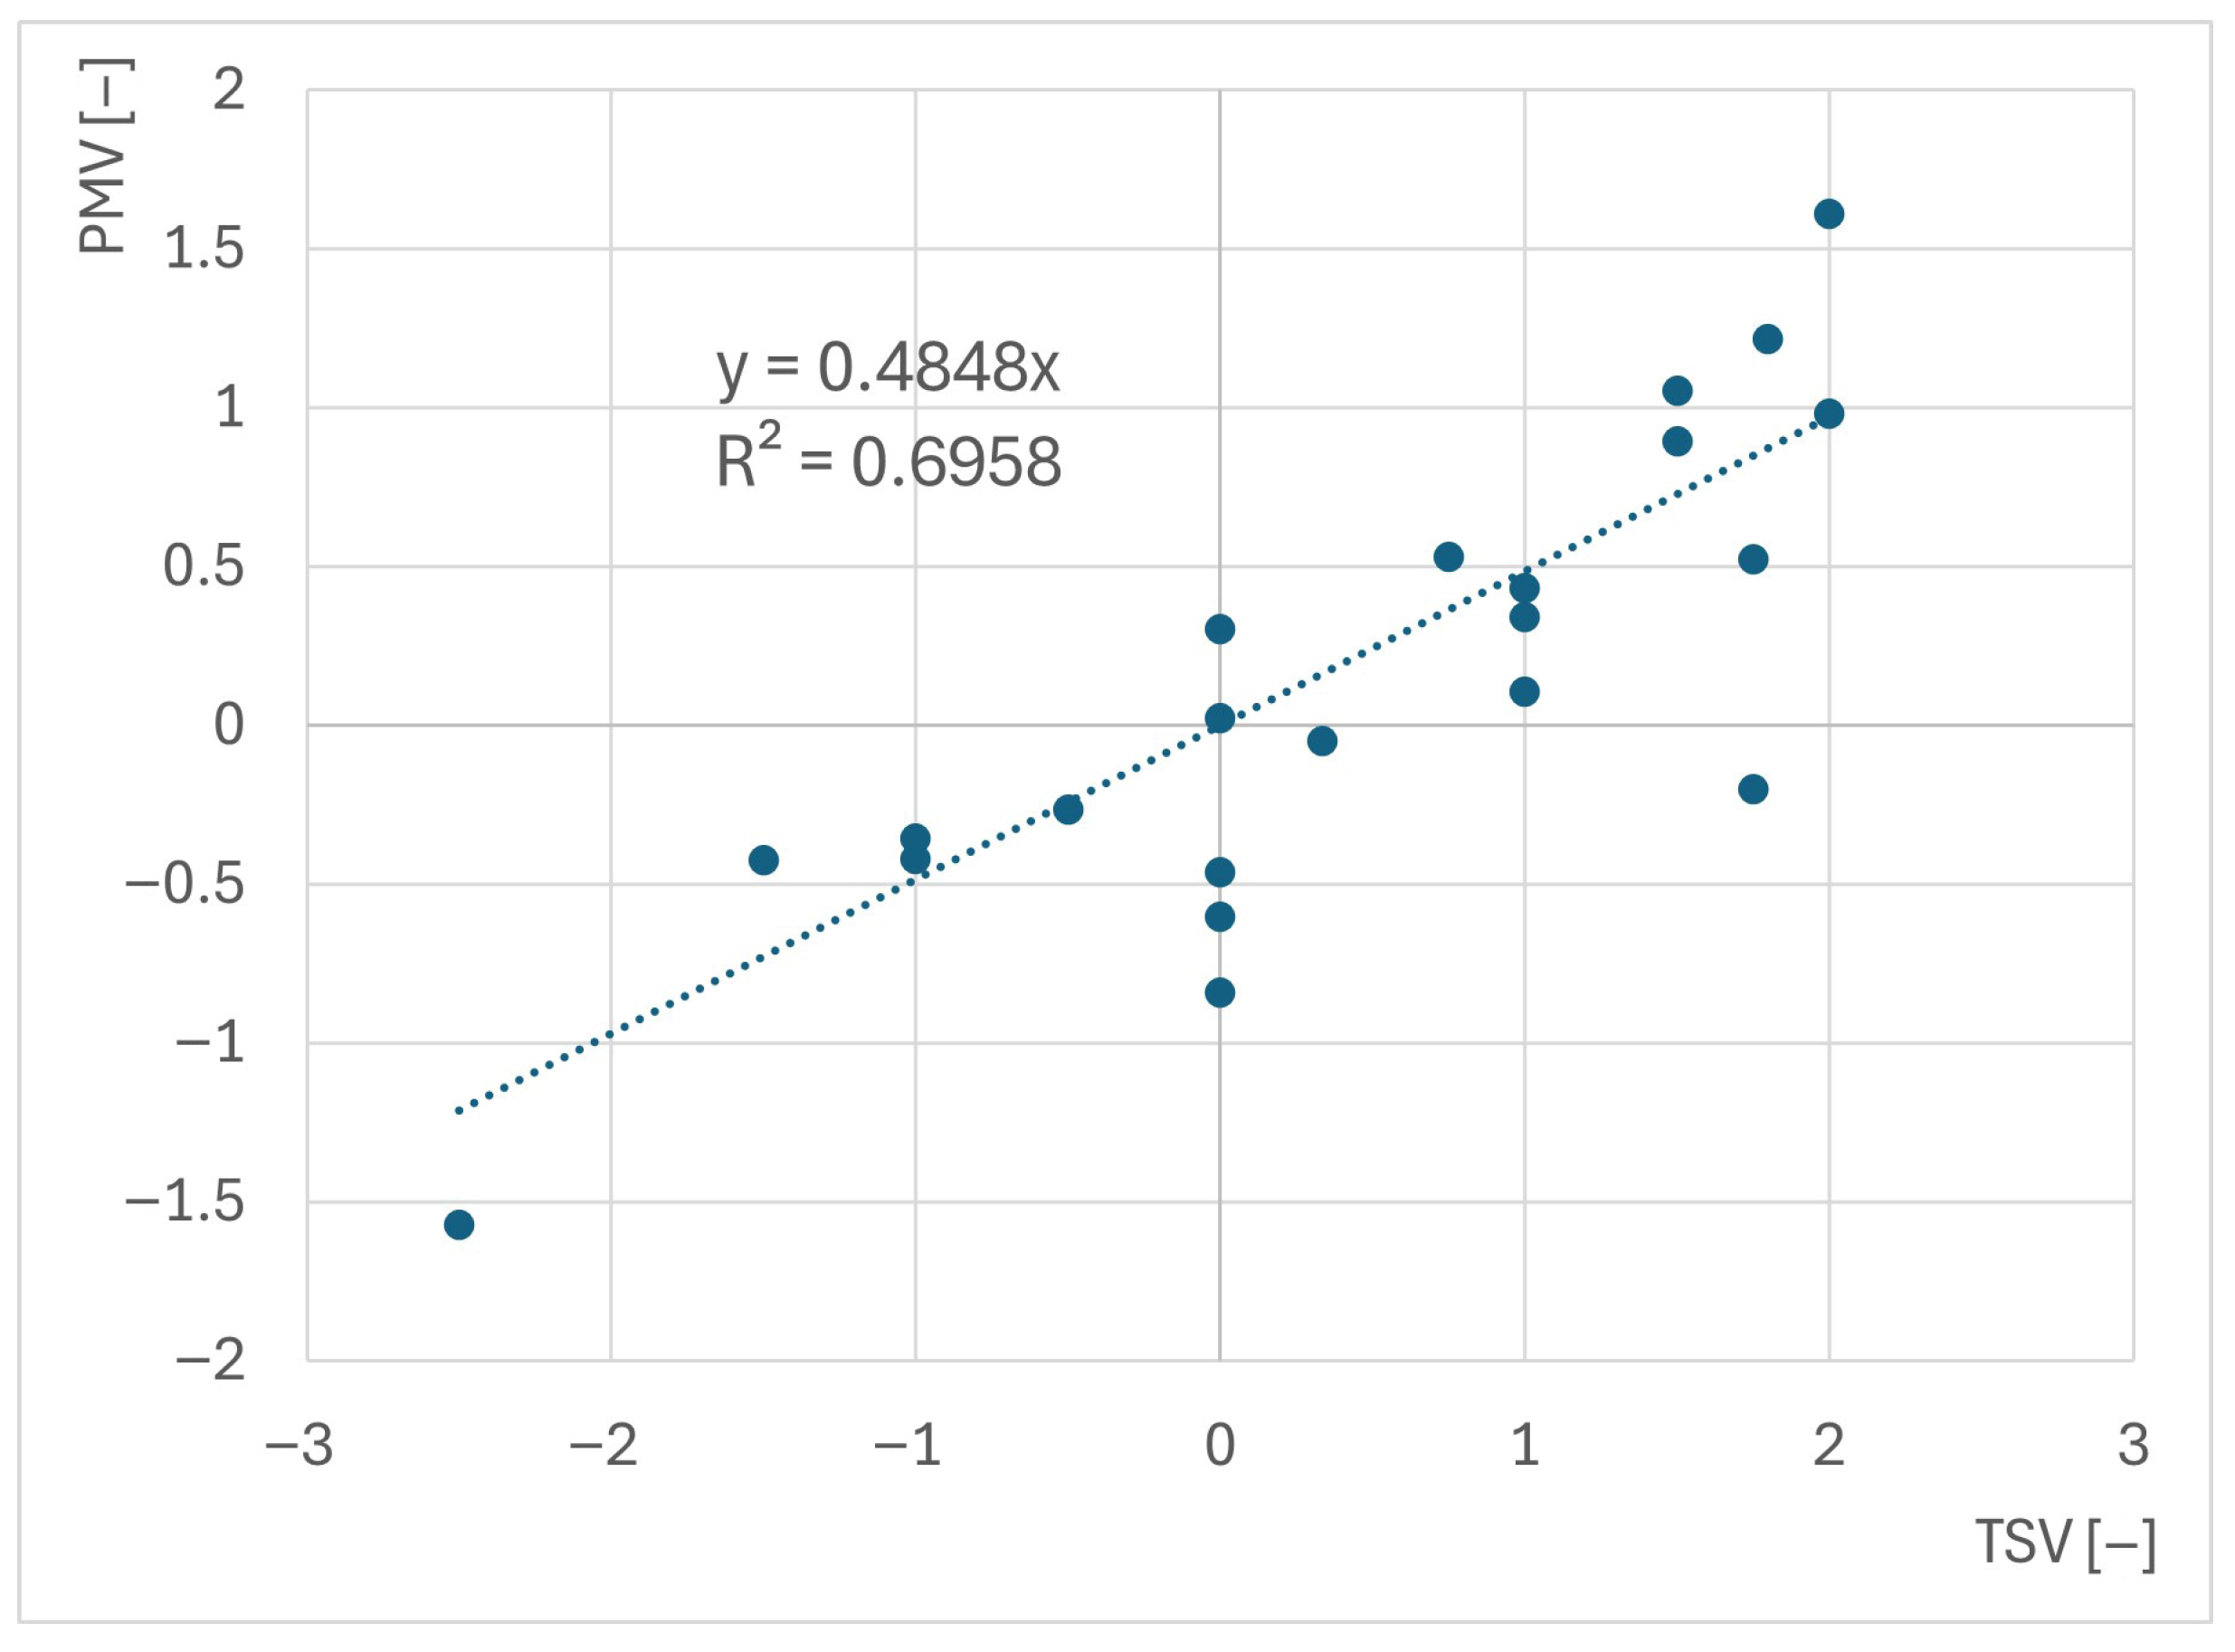
The scenario-averaged PMV and mean TSV values show a clear positive alignment, indicating that warmer subjective votes are generally associated with higher (warmer) PMV. The fitted relationship (Figure 7) is PMV = 0.485·TSV with R2 = 0.696, implying that a 1 unit change in TSV corresponds to an average change of ~0.49 PMV units. When the adopted TSV acceptability band (−1.5 to +1.5) is mapped through the same relationship, it corresponds to PMV ≈ ±0.73, i.e., values that can extend beyond the narrower ASHRAE limits. This interpretation becomes clearer when viewed through EN 16798, where Category III (−0.7 to +0.7) represents progressively wider comfort categories: the ASHRAE band is essentially aligned with EN 16798-1 Category II, whereas the mapped value of ±0.73 lies close to the Category III boundary (±0.7). Accordingly, the combined objective–subjective results appear more consistent with the European categorization, in the sense that conditions deemed acceptable by occupants can correspond to comfort levels near the Category III threshold rather than being fully confined to the stricter Category II/ASHRAE band. Nevertheless, the overall alignment between PMV and TSV indicates that subjective thermal sensation provides a meaningful link to both standards: TSV tracks systematic changes in PMV and can therefore be interpreted against either ASHRAE 55 (more stringent) or EN 16798 (tiered categories) as complementary frameworks for assessing comfort acceptability.
As for the scenarios conducted on the same day, shifts in PMV were consistently accompanied by shifts in mean TSV in the same direction, indicating that participants clearly detected within-day changes in the thermal environment. Overall, the within-day changes appear to induce a stronger response in TSV than would be expected from the corresponding changes in PMV, suggesting that participants perceived the imposed transitions more intensely than indicated by the objective index alone. This effect is particularly evident when conditions shift from the thermal comfort zone into non-acceptable states, where subjective votes change sharply in the direction of the new exposure. Such behavior implies sensitivity to rapid variations and supports the interpretation that short-term transitions across acceptability boundaries can be experienced more strongly than what is captured by PMV under steady-state assumptions.
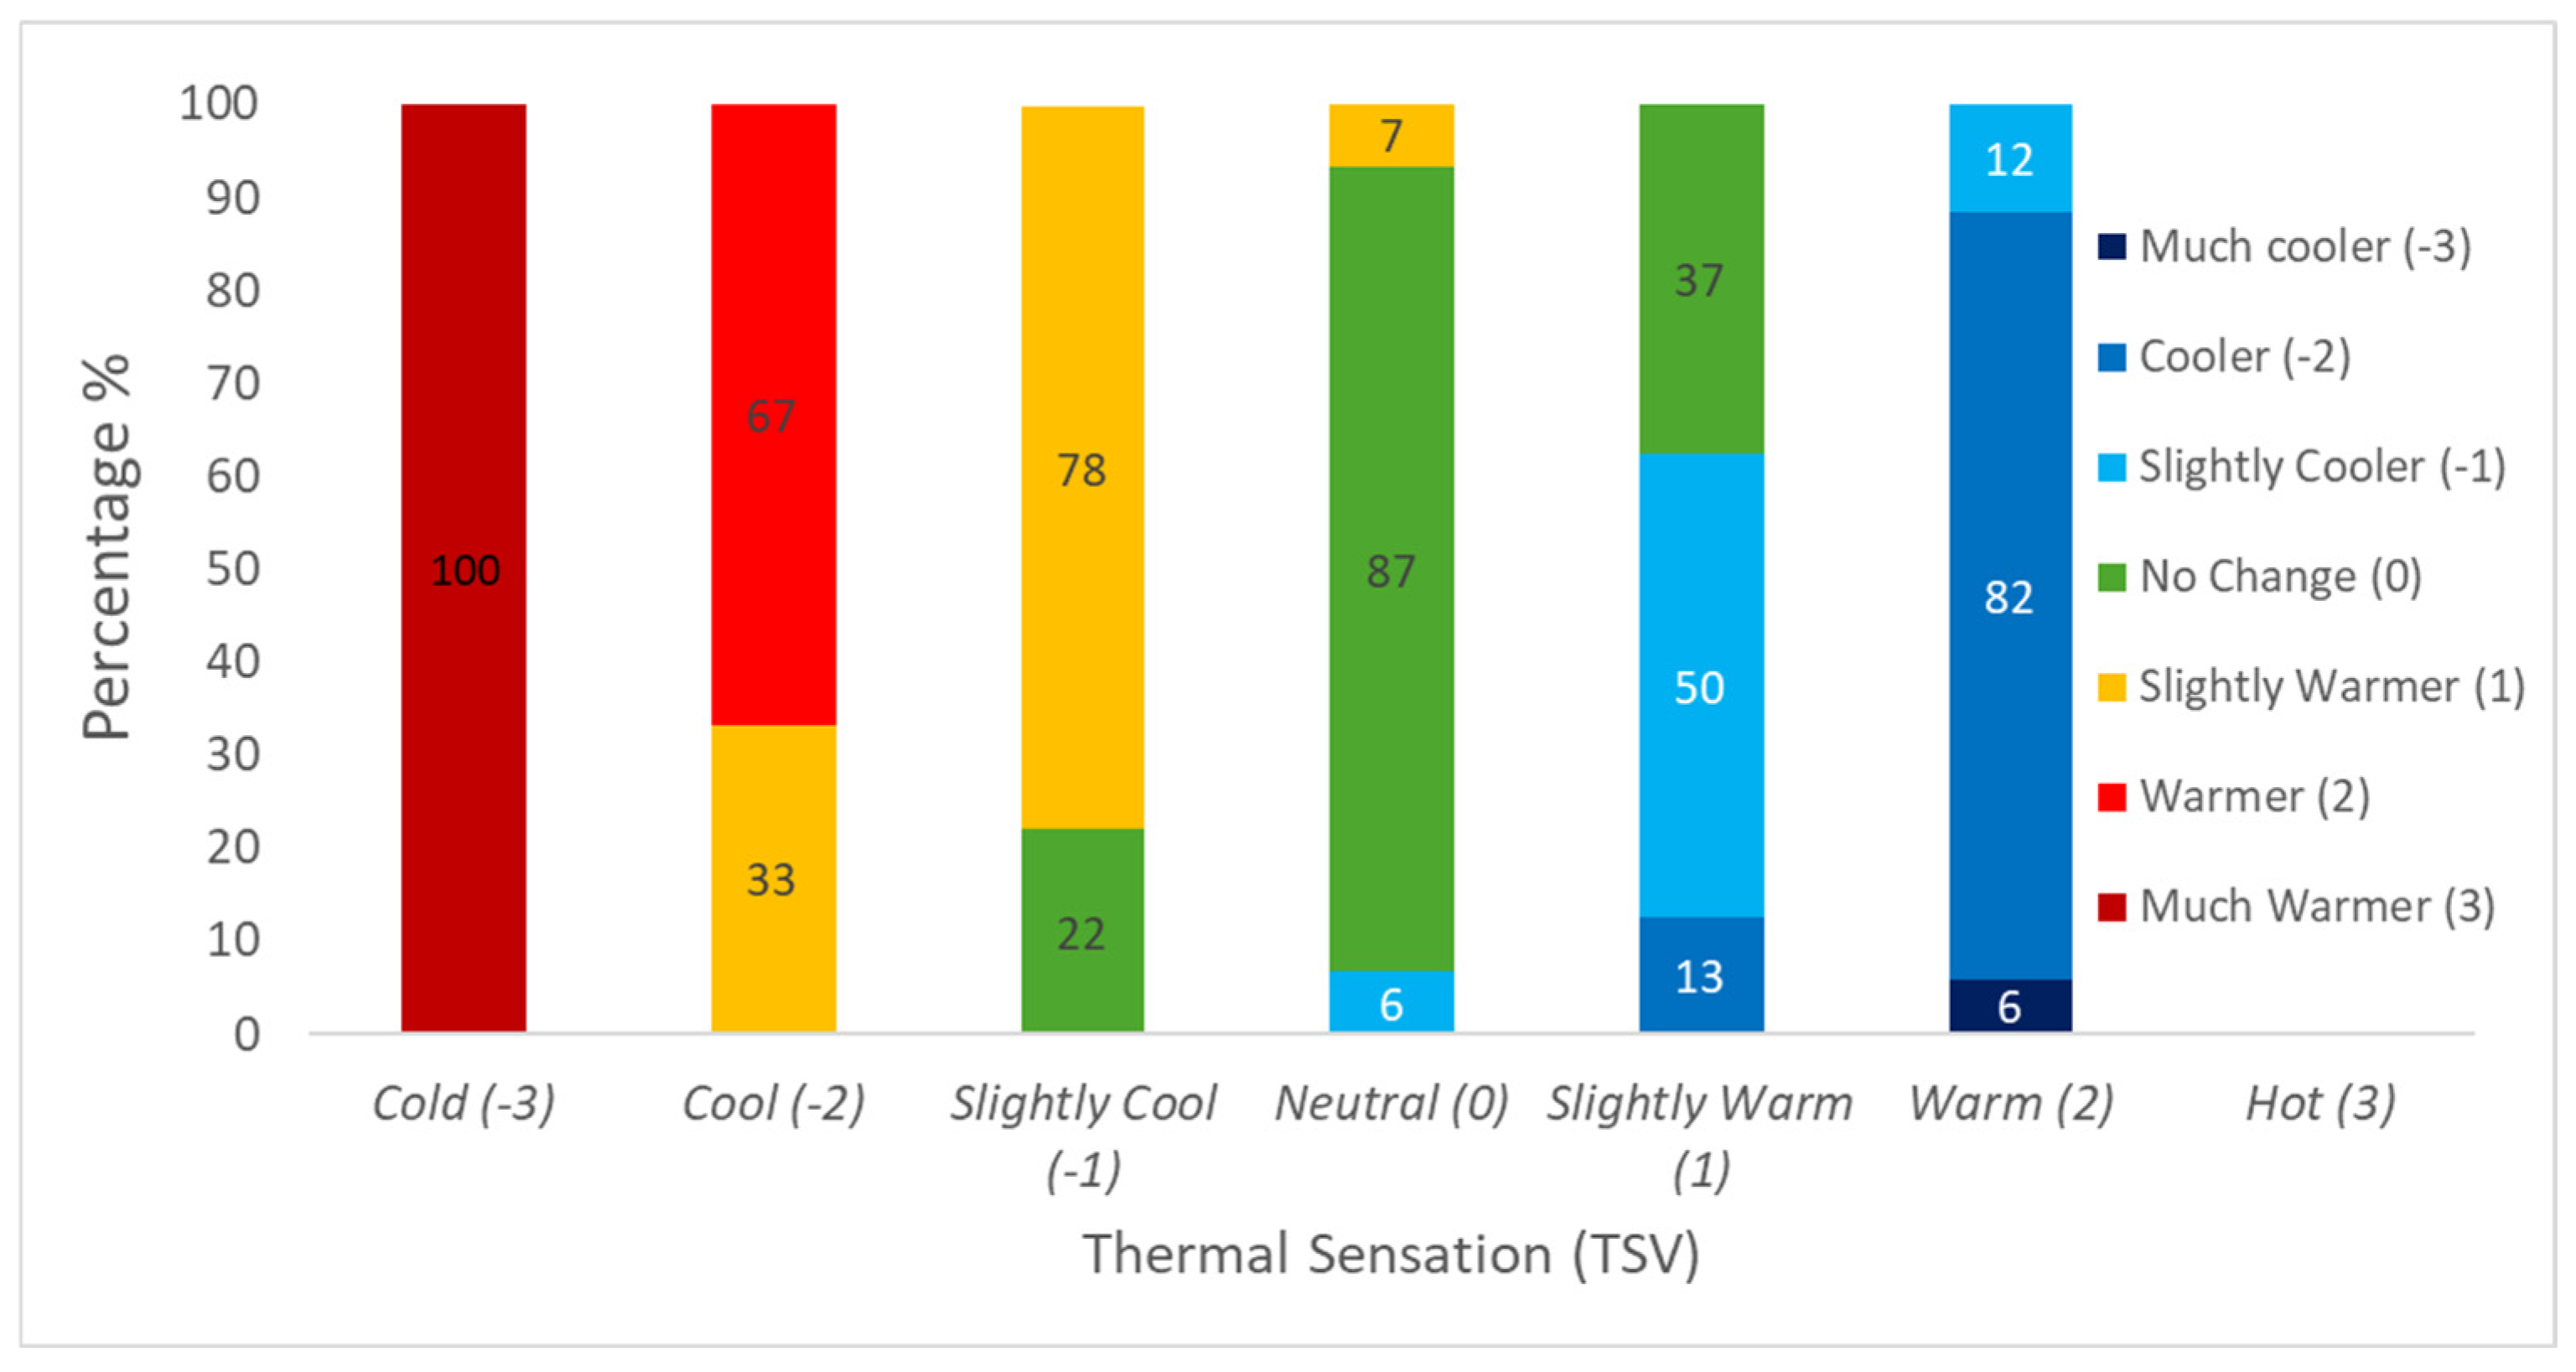
Figure 8 shows the distribution of survey participants’ thermal preference votes in relation to their TSVs. Respondents who felt cold or cool predominantly preferred a warmer environment, whereas those who felt warm overwhelmingly preferred a cooler environment. For slightly cool sensations, preferences were concentrated toward slight warming, although a non-negligible share indicated no change, suggesting that mild cool discomfort was not universally perceived as requiring adjustment. Around neutral TSV, most participants preferred no change, yet a small proportion still requested slight cooling or slight warming, indicating individual variation in preferred setpoints even under nominal neutrality. For slightly warm sensations, preferences shifted primarily toward cooling, while a substantial share still reported no change. Notably, the dominance of “no change” responses in the central TSV classes (−1, 0, +1) is consistent with the adopted acceptability band (−1.5 ≤ TSV ≤ +1.5), within which occupants generally remain satisfied and do not request corrective actions.
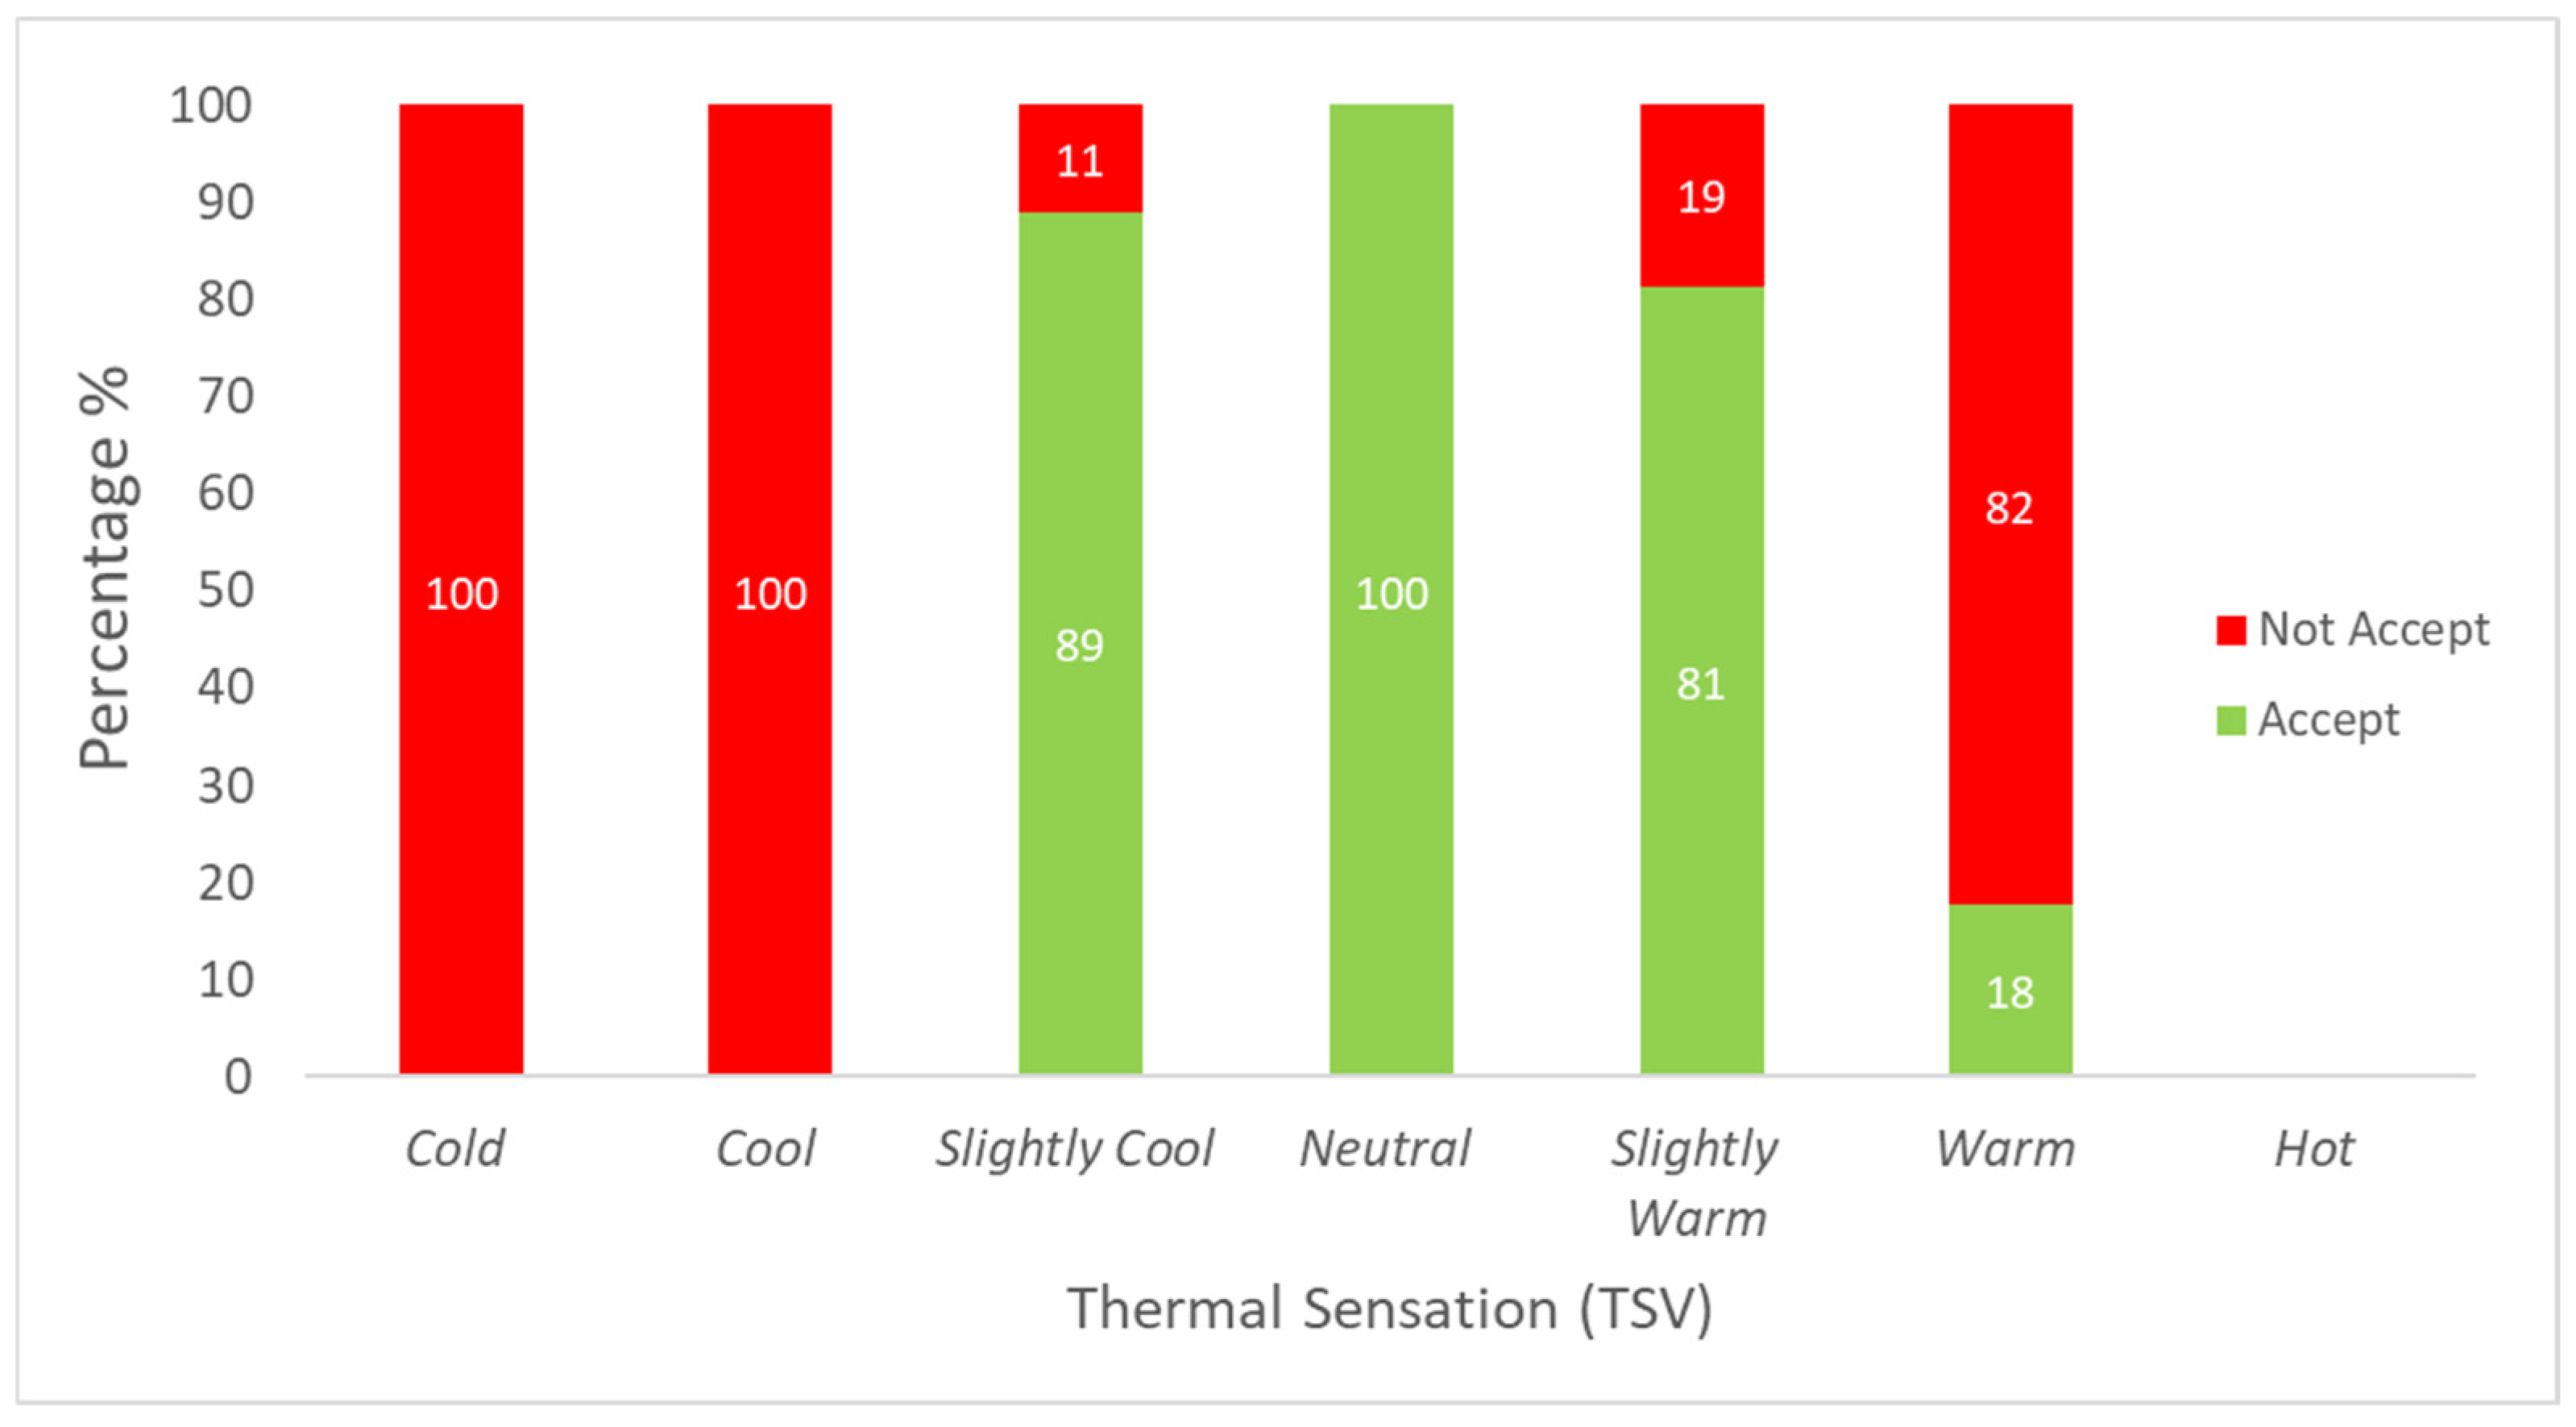
On the other hand, Figure 9 shows the distribution of survey participants’ thermal acceptance votes in relation to their TSVs. A clear pattern is observed whereby acceptability is highest around thermal neutrality and decreases toward the sensation extremes. Specifically, votes in the neutral category are entirely acceptable, while slightly cool and slightly warm sensations remain predominantly acceptable, indicating that mild departures from neutrality are generally tolerated by most occupants. In contrast, acceptability drops markedly for warm sensations and is minimal for the cold and cool categories, suggesting that stronger deviations—particularly toward cool discomfort and pronounced warmth—are more likely to be perceived as unacceptable.
Another very common approach that is used to predict the comfort temperature based on the TSV of the users is the Griffith method. This method is used in order to calculate the comfort temperature (Tc) for each questionnaire observation (TSV recorded at a given operative temperature). Calculation is based on the respondents’ TSV votes and the operative temperature during the questionnaire survey, through the application of the following equation [49] (Griffiths 1990):
T c = T o p + ( 0 + T S V ) a
where Top is the operative temperature (°C), and α is the regression coefficient, which indicates the constant rate of thermal sensation change in relation to the room temperature. In this study, the value α = 0.5 was used [50].
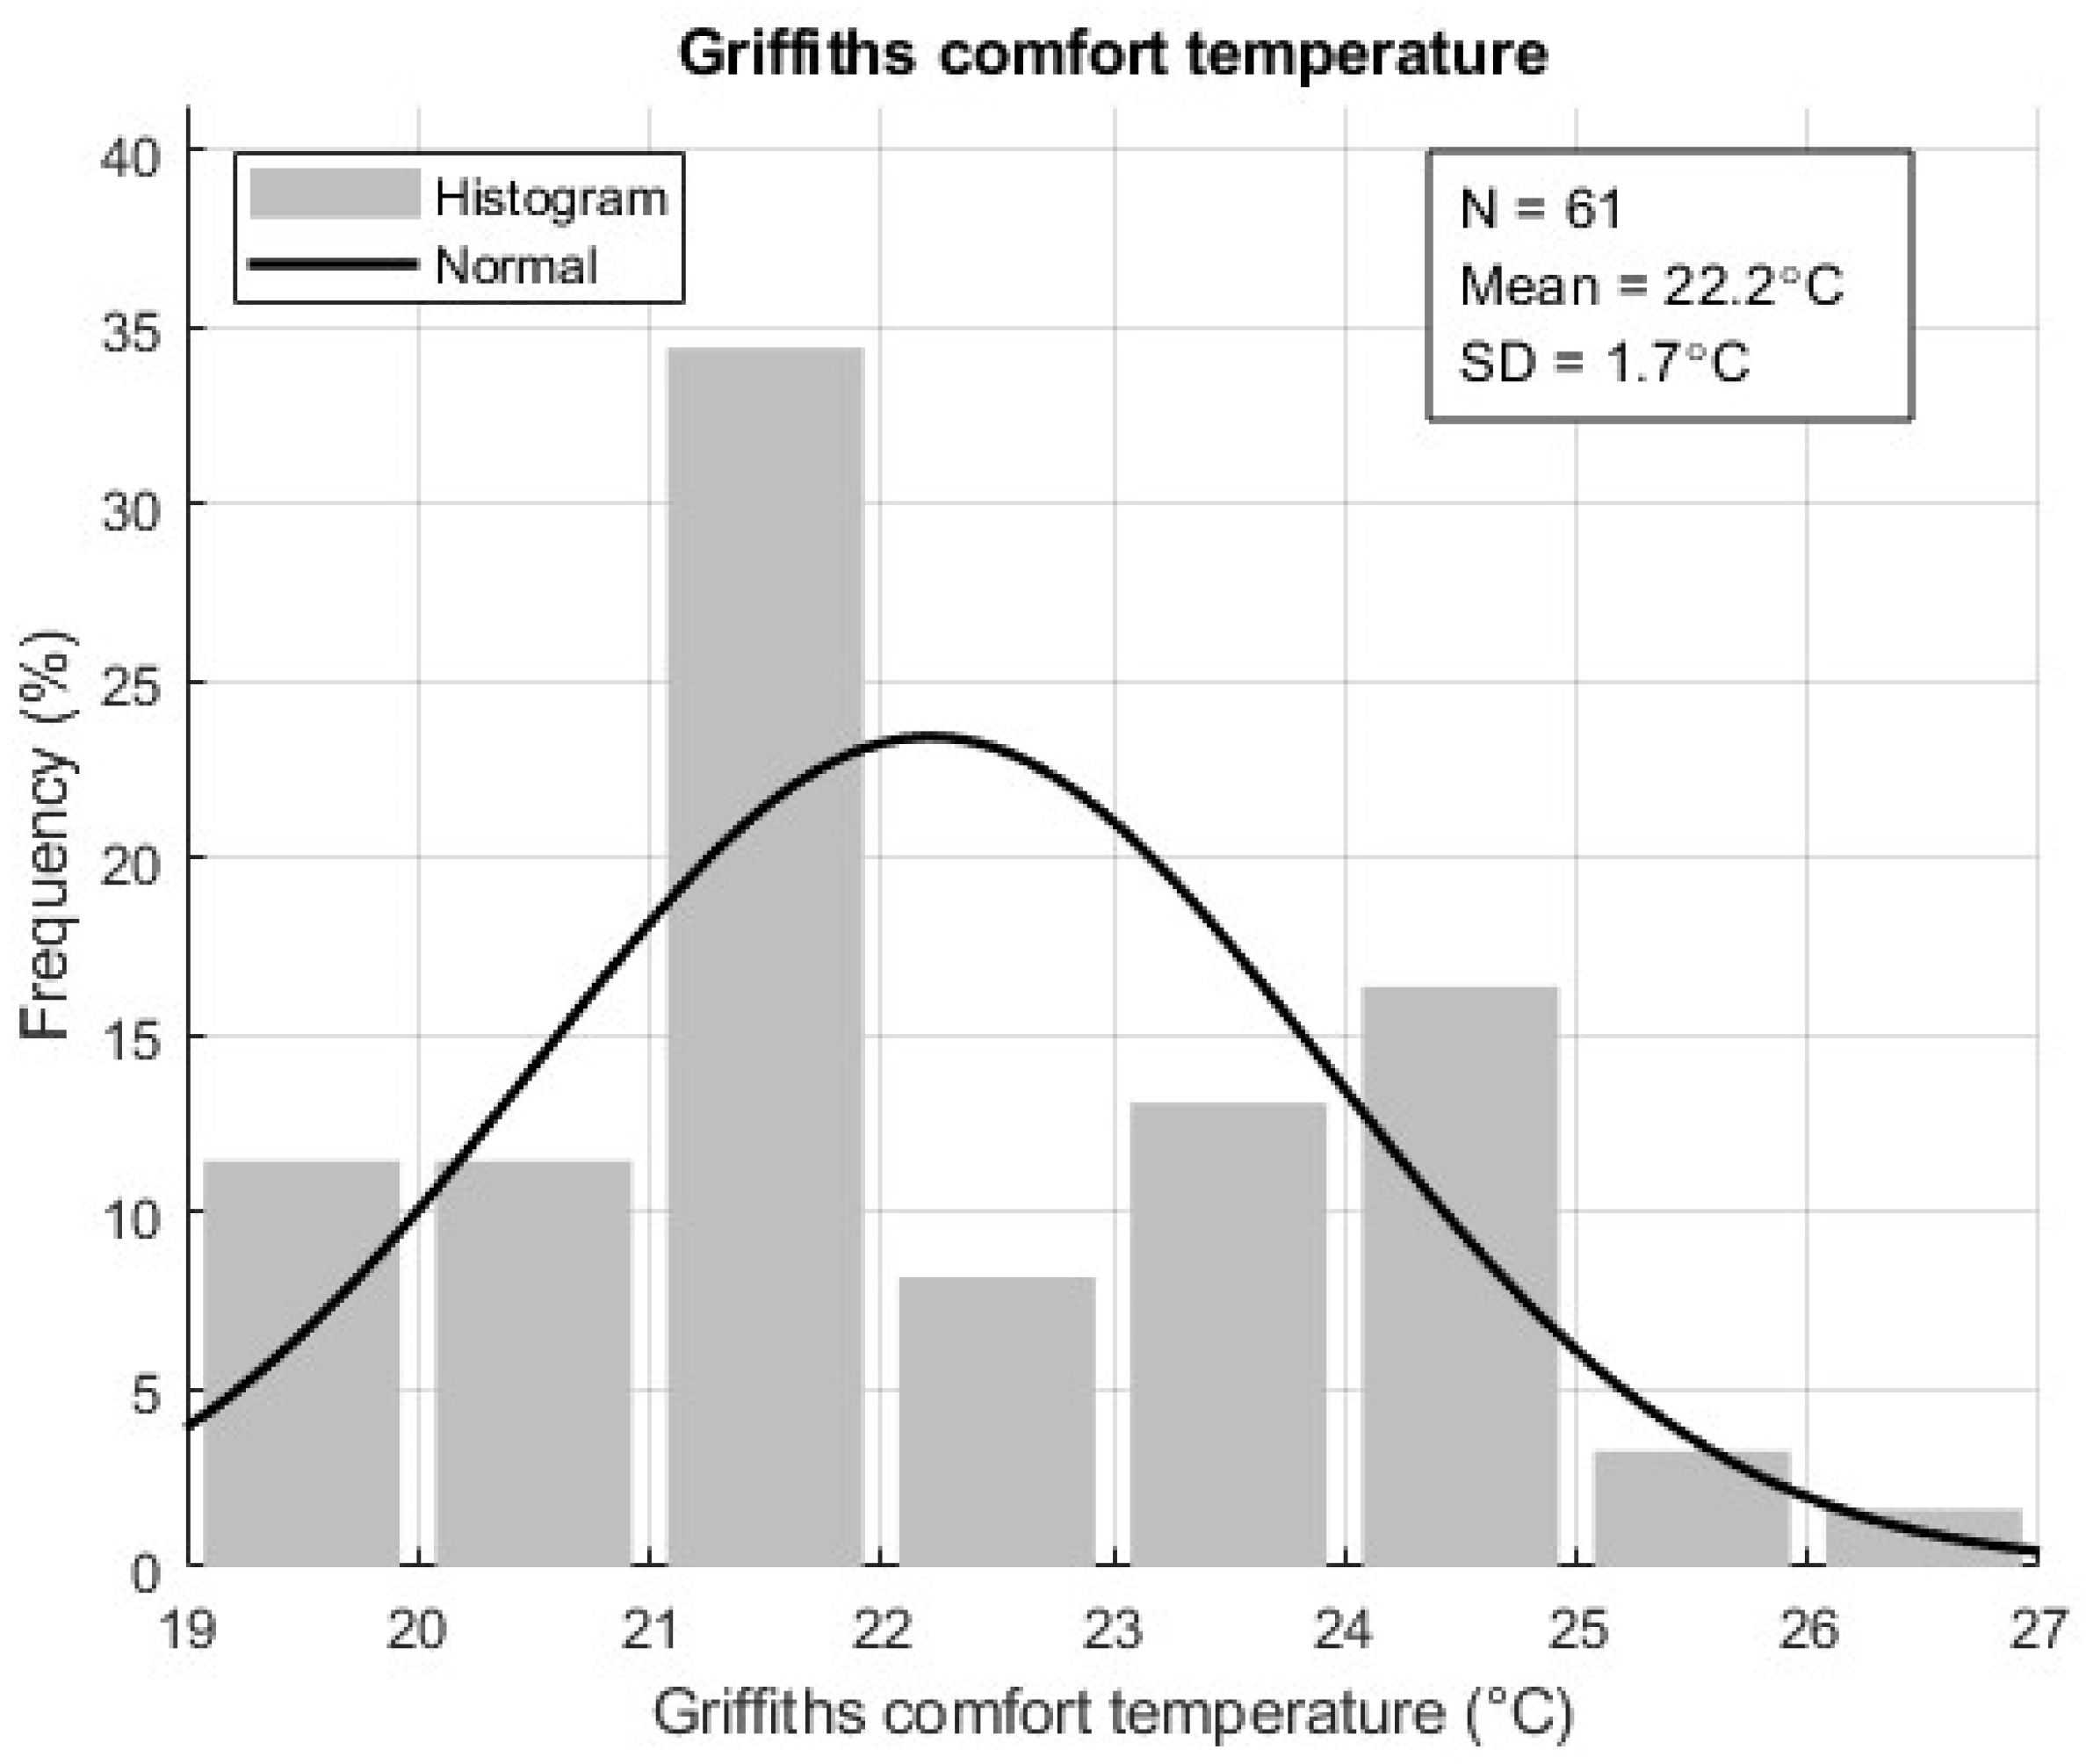
Figure 10 presents the distribution of the Griffiths comfort temperature (Tc) estimated from the survey responses. The histogram is reasonably well described by a normal curve, with a mean Tc = 22.2 °C, and a standard deviation of 1.7 °C. The calculated comfort temperature values fall within the ranges specified by the relevant standards and similar works; this will be further analyzed in Section 4.

3.2. IAQ

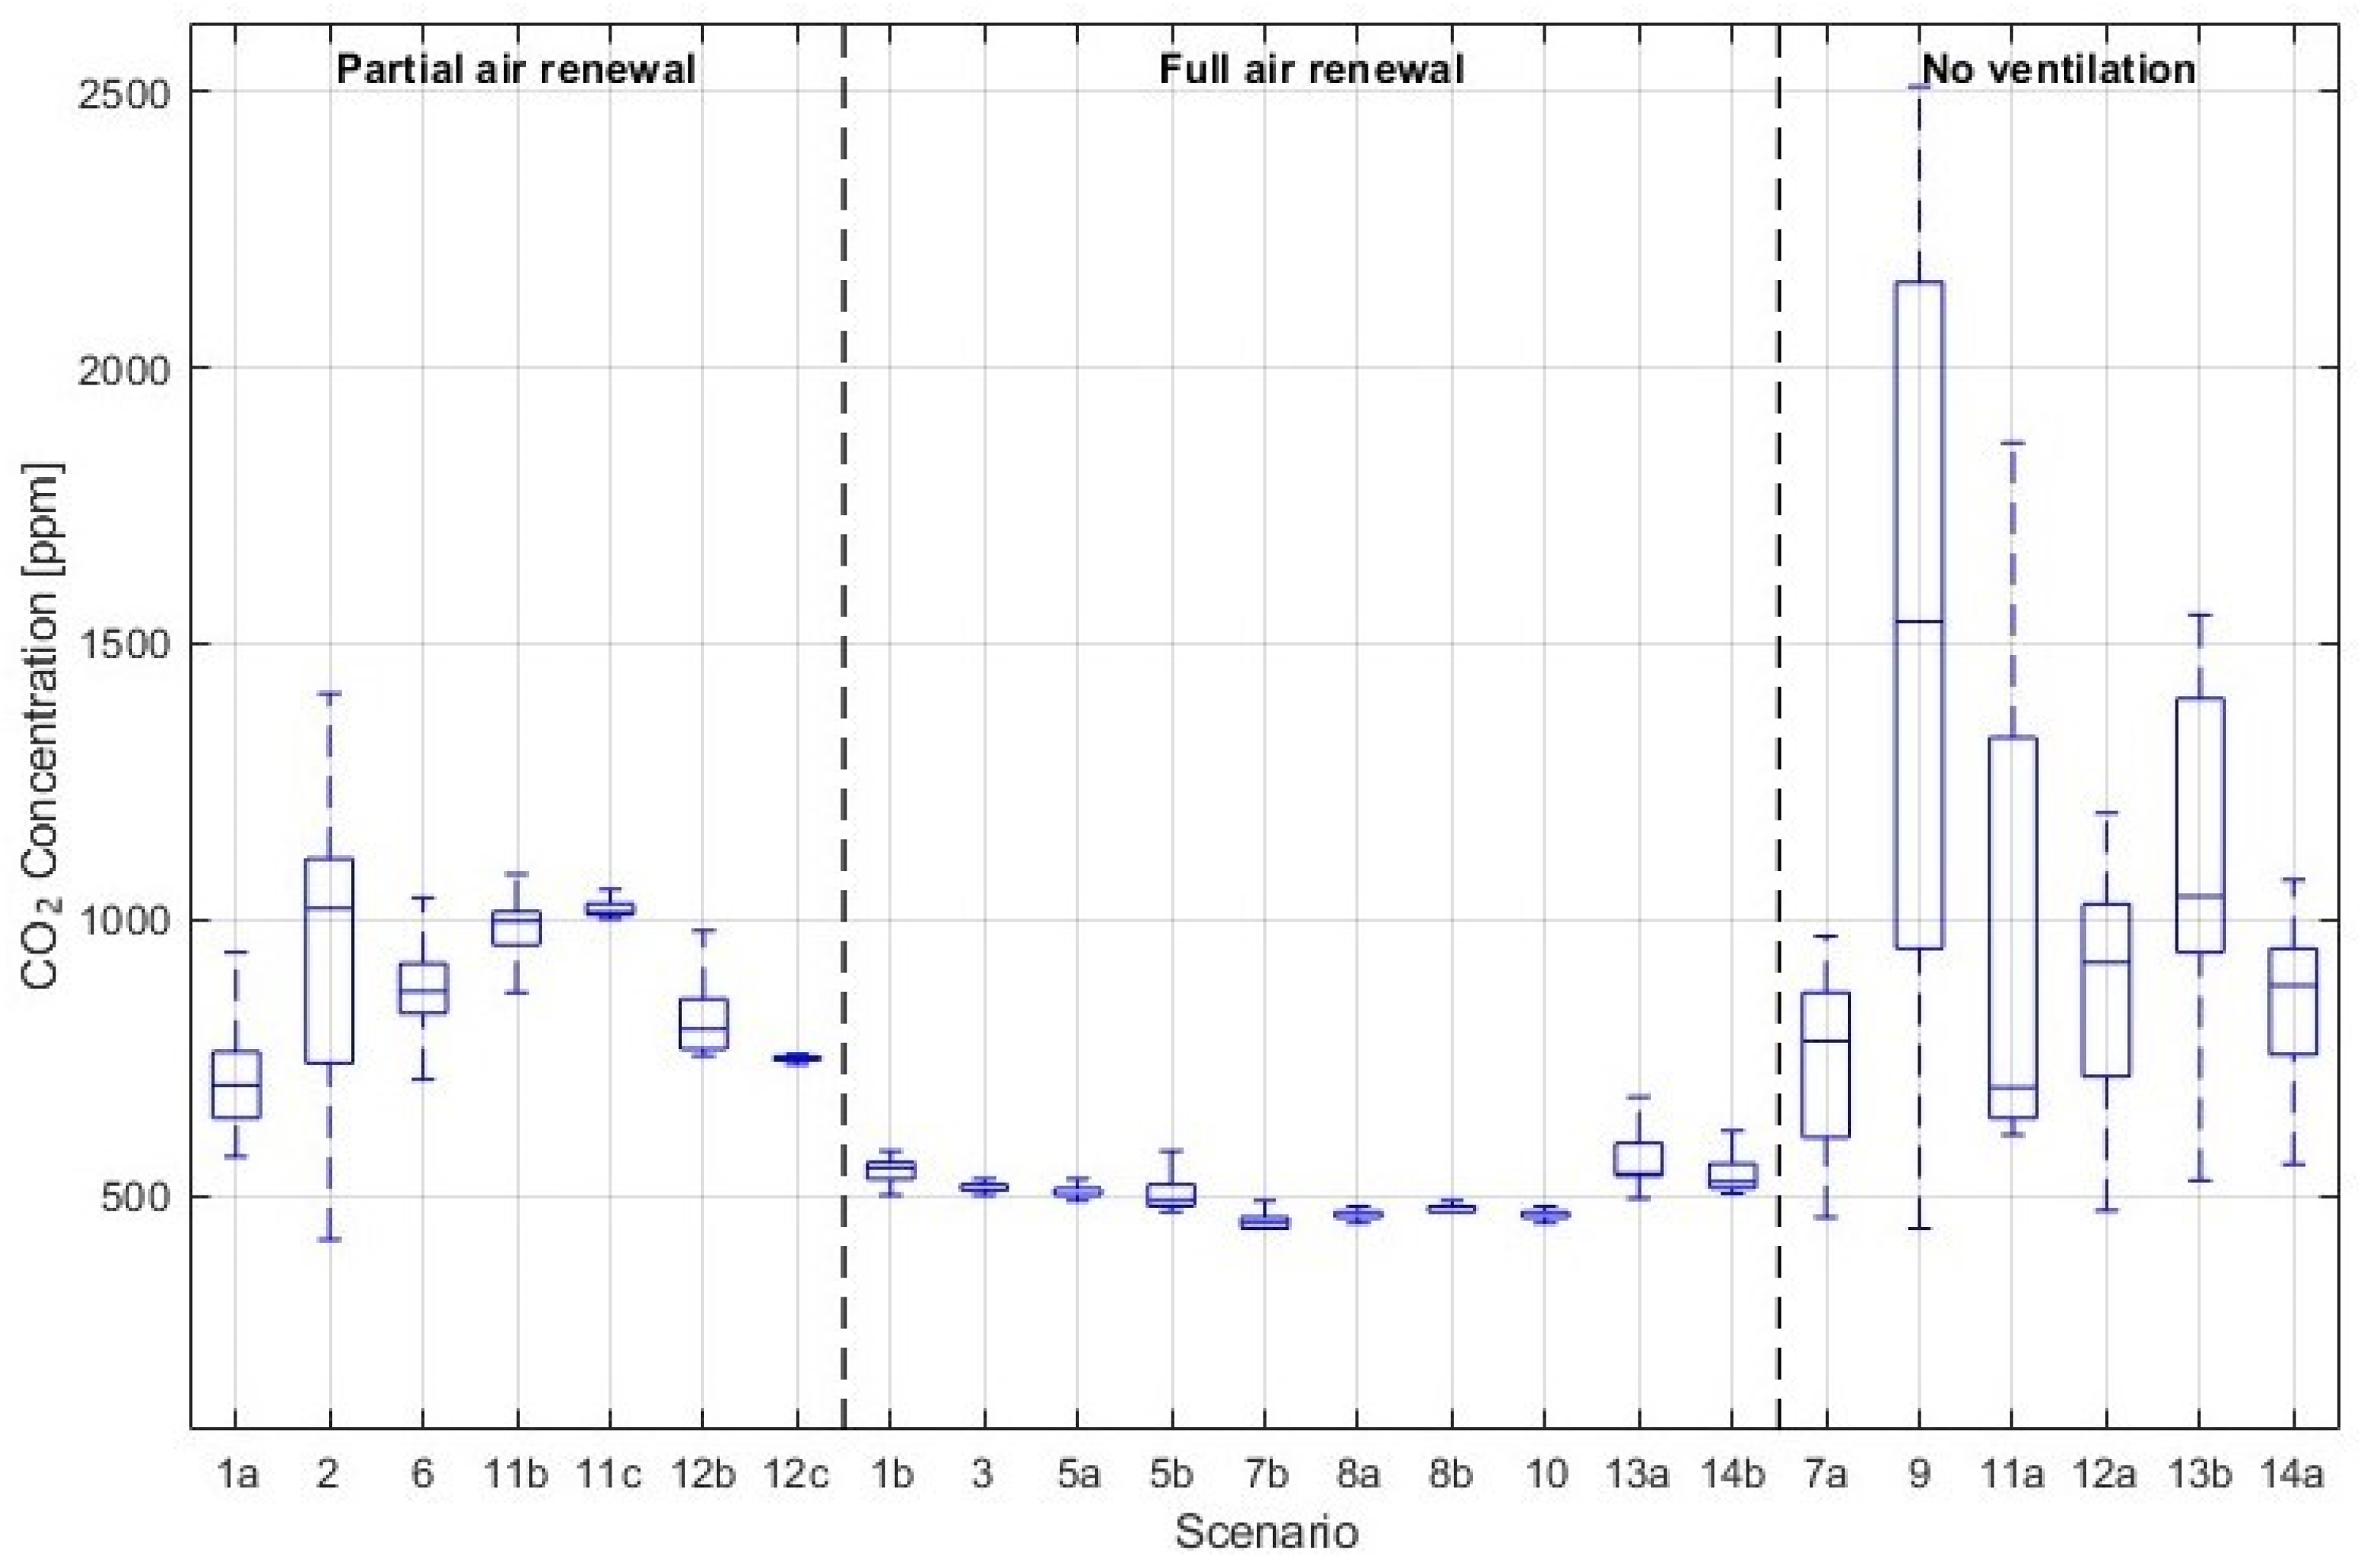
Figure 11 summarizes the distribution of indoor CO2 concentrations measured in the climate chamber across the investigated scenarios (Table 2); the scenarios differed mainly in ventilation mode (recirculation/partial air renewal, 100% air renewal, and no ventilation) and occupancy (1–5 persons). Overall, the results show a clear ventilation-driven trend: scenarios with 100% air renewal maintained CO2 close to background levels, with most medians clustered around ~450–600 ppm and relatively narrow interquartile ranges (e.g., 5a–5b, 8a–8b, 10, 13a, 14b), indicating effective dilution even when occupancy increased up to four persons. In contrast, partial air renewal/recirculation led to systematically higher CO2 and greater variability, with medians typically ranging from ~550 to >1000 ppm, depending on the occupant load and operating conditions. The highest CO2 levels within this group were observed when the chamber hosted more occupants and/or additional heating operation was applied (e.g., Scenario 2 with five occupants, and Scenarios 11b–11c with four occupants). As expected, the no-ventilation scenarios produced the most unfavorable IAQ outcome, with CO2 accumulation reaching the highest medians and the broadest spread; the effect was particularly pronounced for Scenario 9 (four occupants), where CO2 reached peaks near ~2500 ppm. In addition, the duration of each scenario influences the observed concentrations—particularly under no-ventilation conditions—because CO2 accumulates over time, leading to a wider range of values. Overall, these findings confirm that occupancy-related CO2 generation, combined with the effective outdoor air rate, is the primary driver of CO2 levels in the chamber, while recirculation alone is insufficient to maintain low CO2 when the internal load increases.
Regarding airborne particulate matter, and specifically the PM2.5 and PM10 measurements, these were not performed in all scenarios. The experiments can be broadly classified into two main categories: (i) tests with occupant presence but without any intentional indoor particle source and (ii) tests involving smoking as an emission source, combined with the use of a portable air cleaner to evaluate its added effect compared with mechanical ventilation alone, as well as its performance when operated in combination with ventilation.
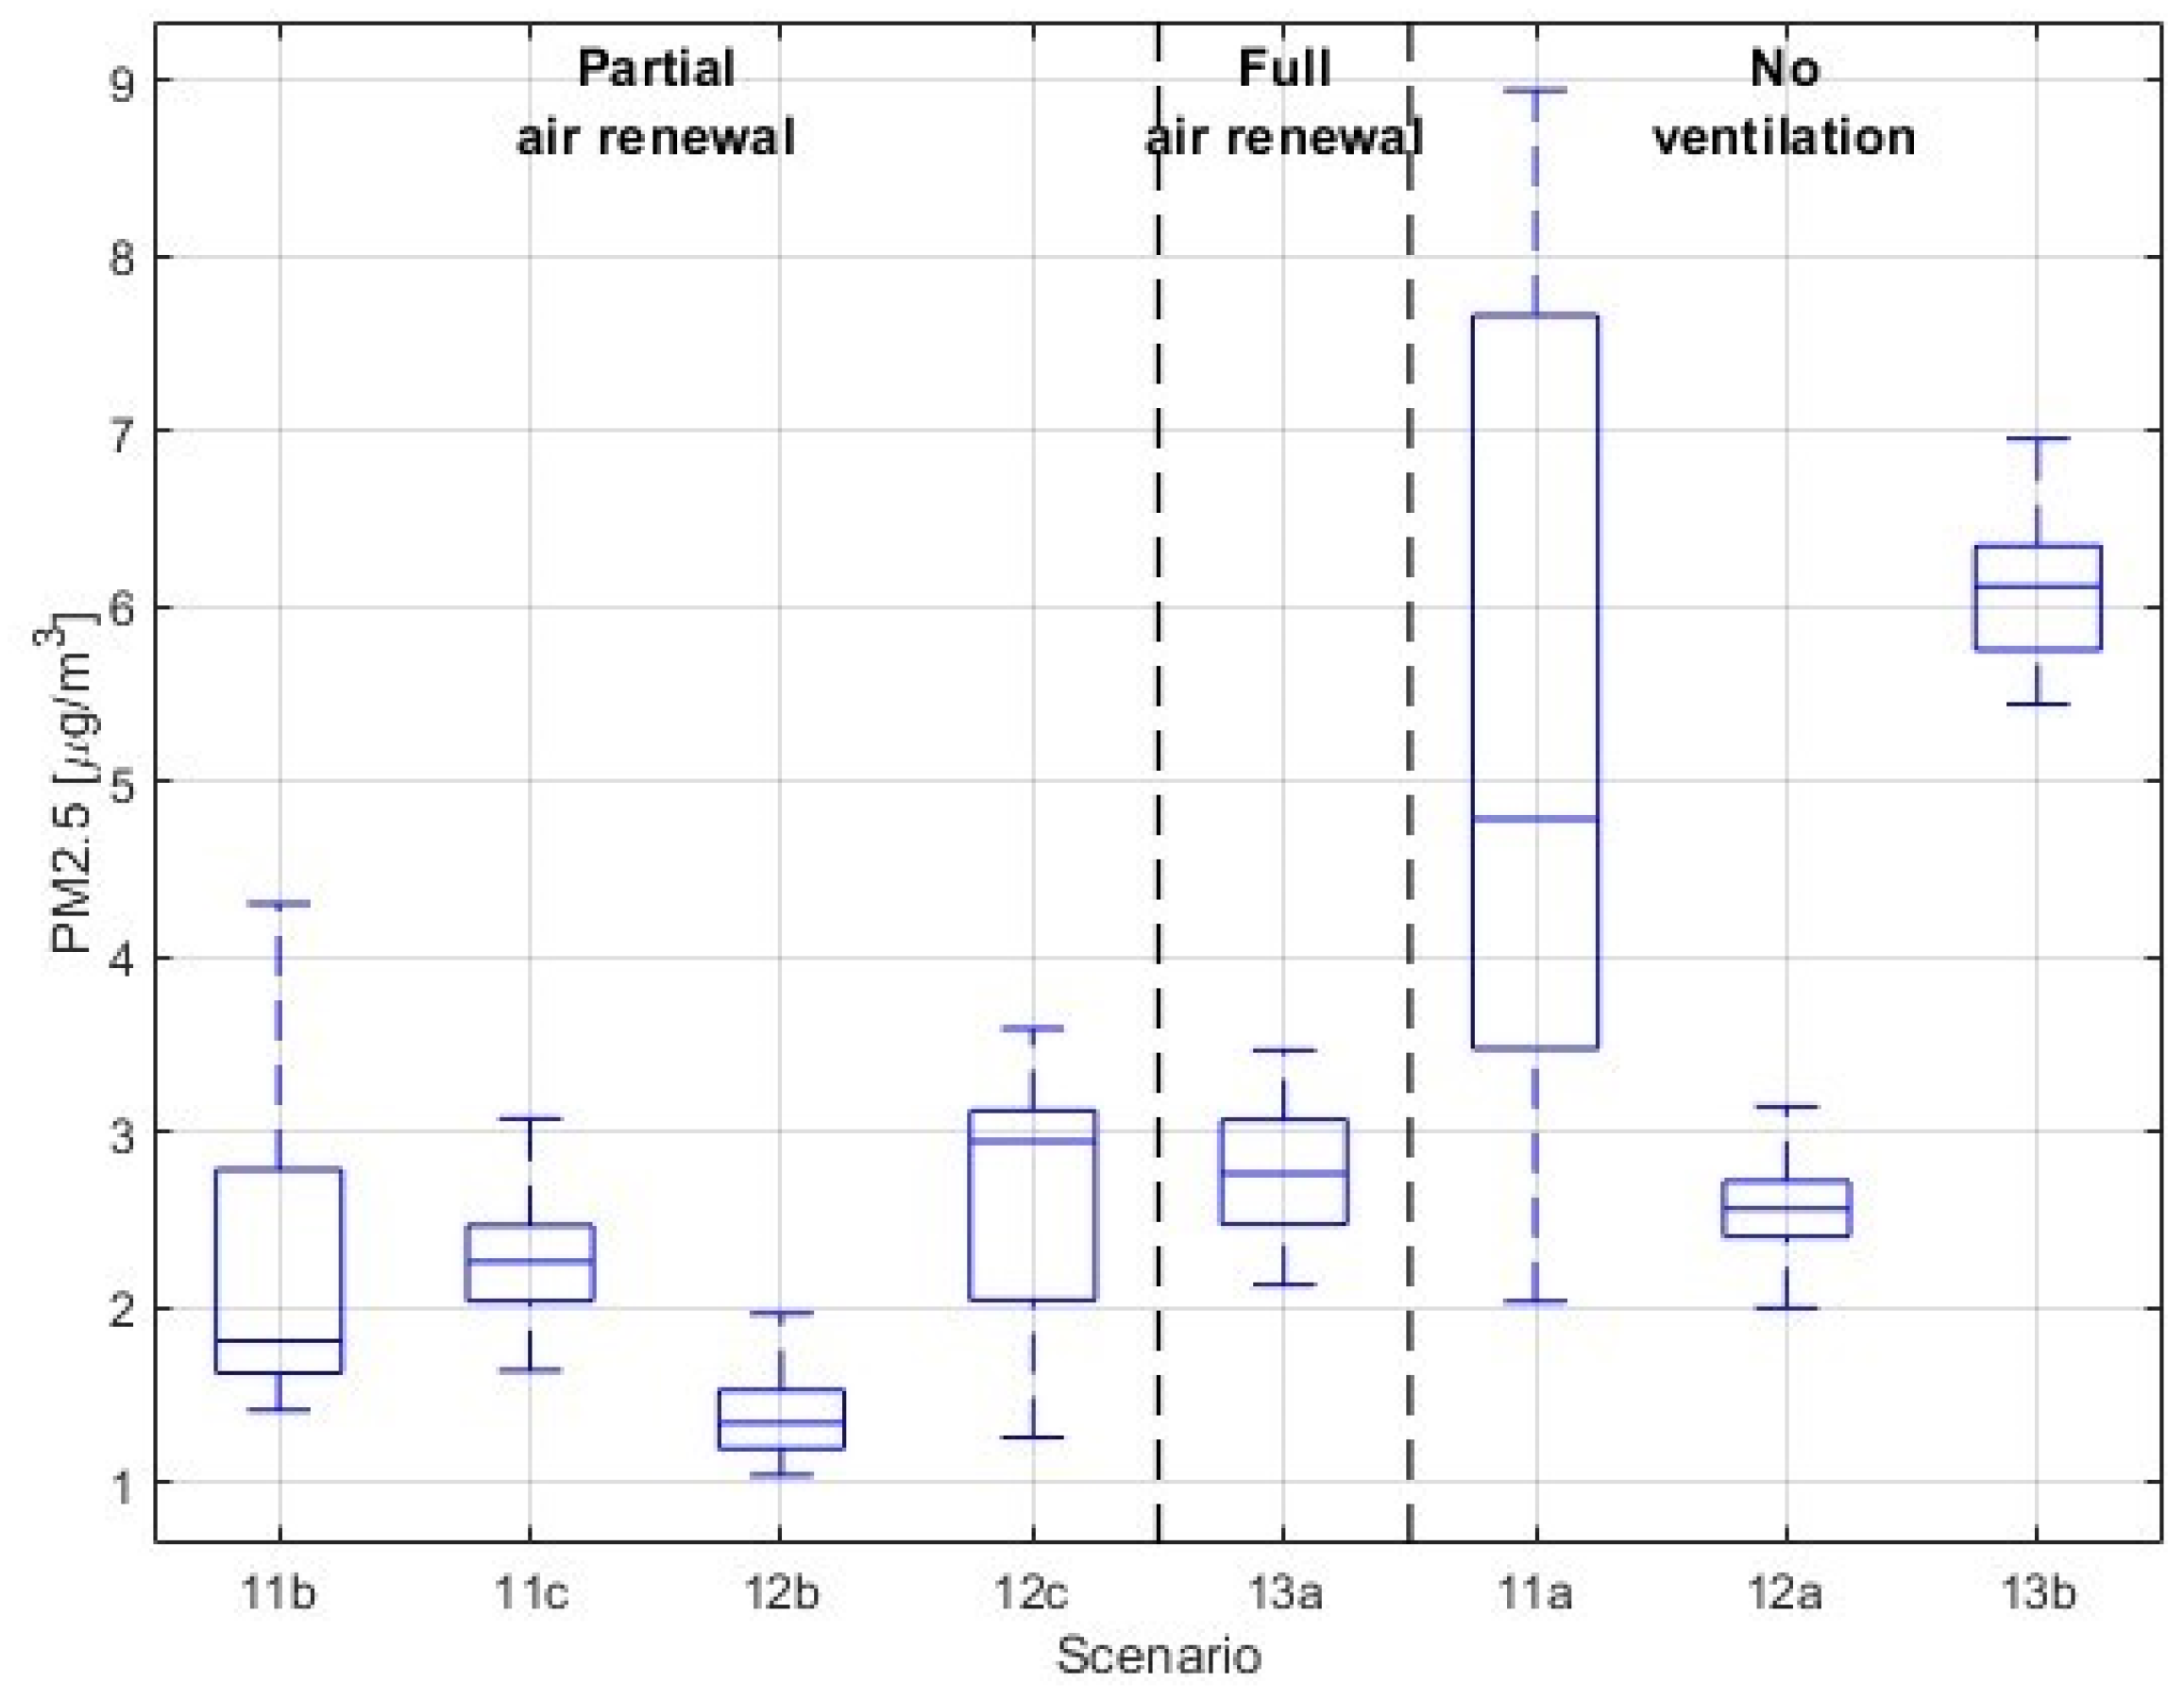
The PM2.5 concentrations remained generally low (1–3 μg/m3) across the occupancy-only scenarios, indicating that, in the absence of a strong indoor emission source, airborne particle levels are mainly governed by background concentrations (Figure 12). Clear differences nevertheless appear between ventilation modes: scenarios classified as partial air renewal show low-to-moderate medians with limited variability, whereas no-ventilation conditions lead to higher median PM2.5 and substantially larger dispersion (notably Scenario 11a), consistent with reduced removal and greater sensitivity to transient events and mixing conditions. Overall, ventilation affects PM2.5 even under background conditions, but the magnitude of change is modest compared with source-driven cases.
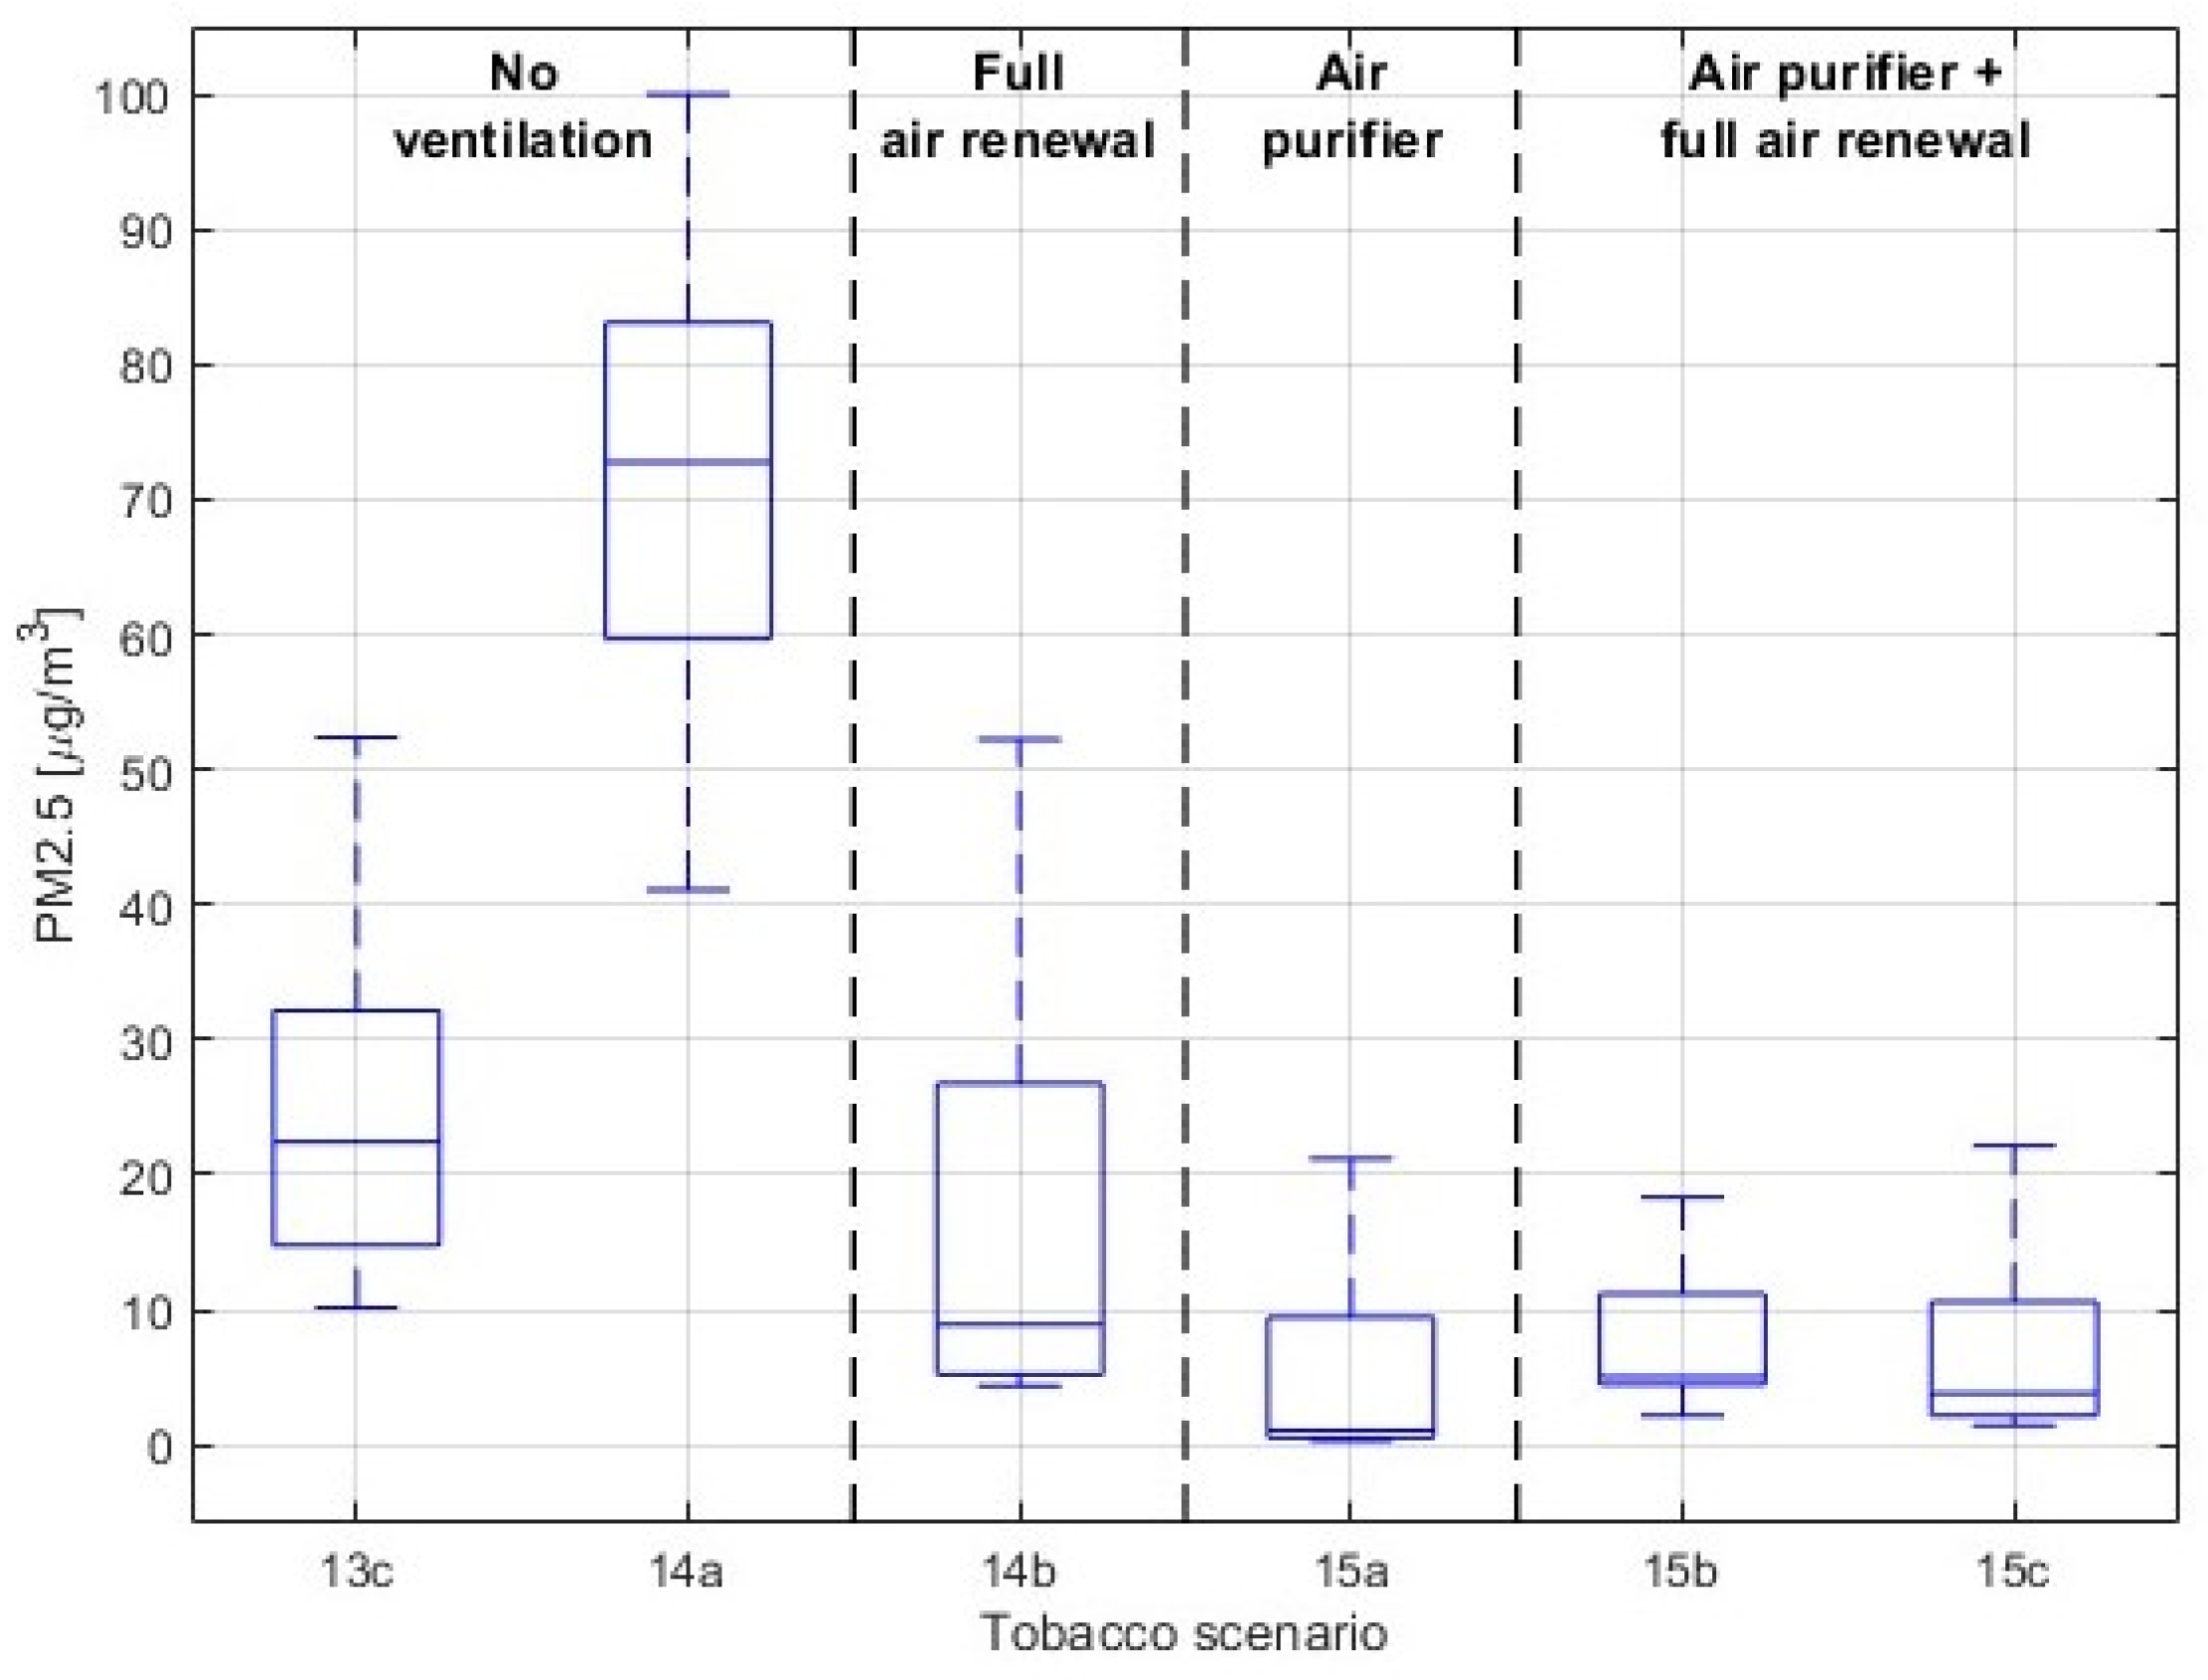
When tobacco smoke is introduced, PM2.5 increases by one to two orders of magnitude, confirming smoking as the dominant driver of indoor particle exposure (Figure 13). Under no-ventilation, the two-cigarette scenario (14a) exhibits the highest PM2.5 levels (median in the 70 μg/m3), while the one-cigarette case (13) shows clearly lower—but still elevated—concentrations. In contrast, full air renewal (14b) substantially suppresses PM2.5 (median around ~10 μg/m3, though with some spread due to the evolving smoking/decay phases). The slightly higher PM2.5 levels observed in 14b compared with the air purifier-only case (15a) likely reflect carryover effects, since 14b was conducted after 14a (no ventilation), meaning that the chamber air and surfaces were initially more particle-laden and the indoor environment was more burdened at the start of the test. Operating a portable air purifier (15a) further reduces PM2.5 toward near-background levels (typically single-digit μg/m3), and the combined strategy (air purifier + full air renewal; 15b–15c) maintains similarly low concentrations, indicating strong source-mitigation capability when active air cleaning is applied (alone or together with ventilation).
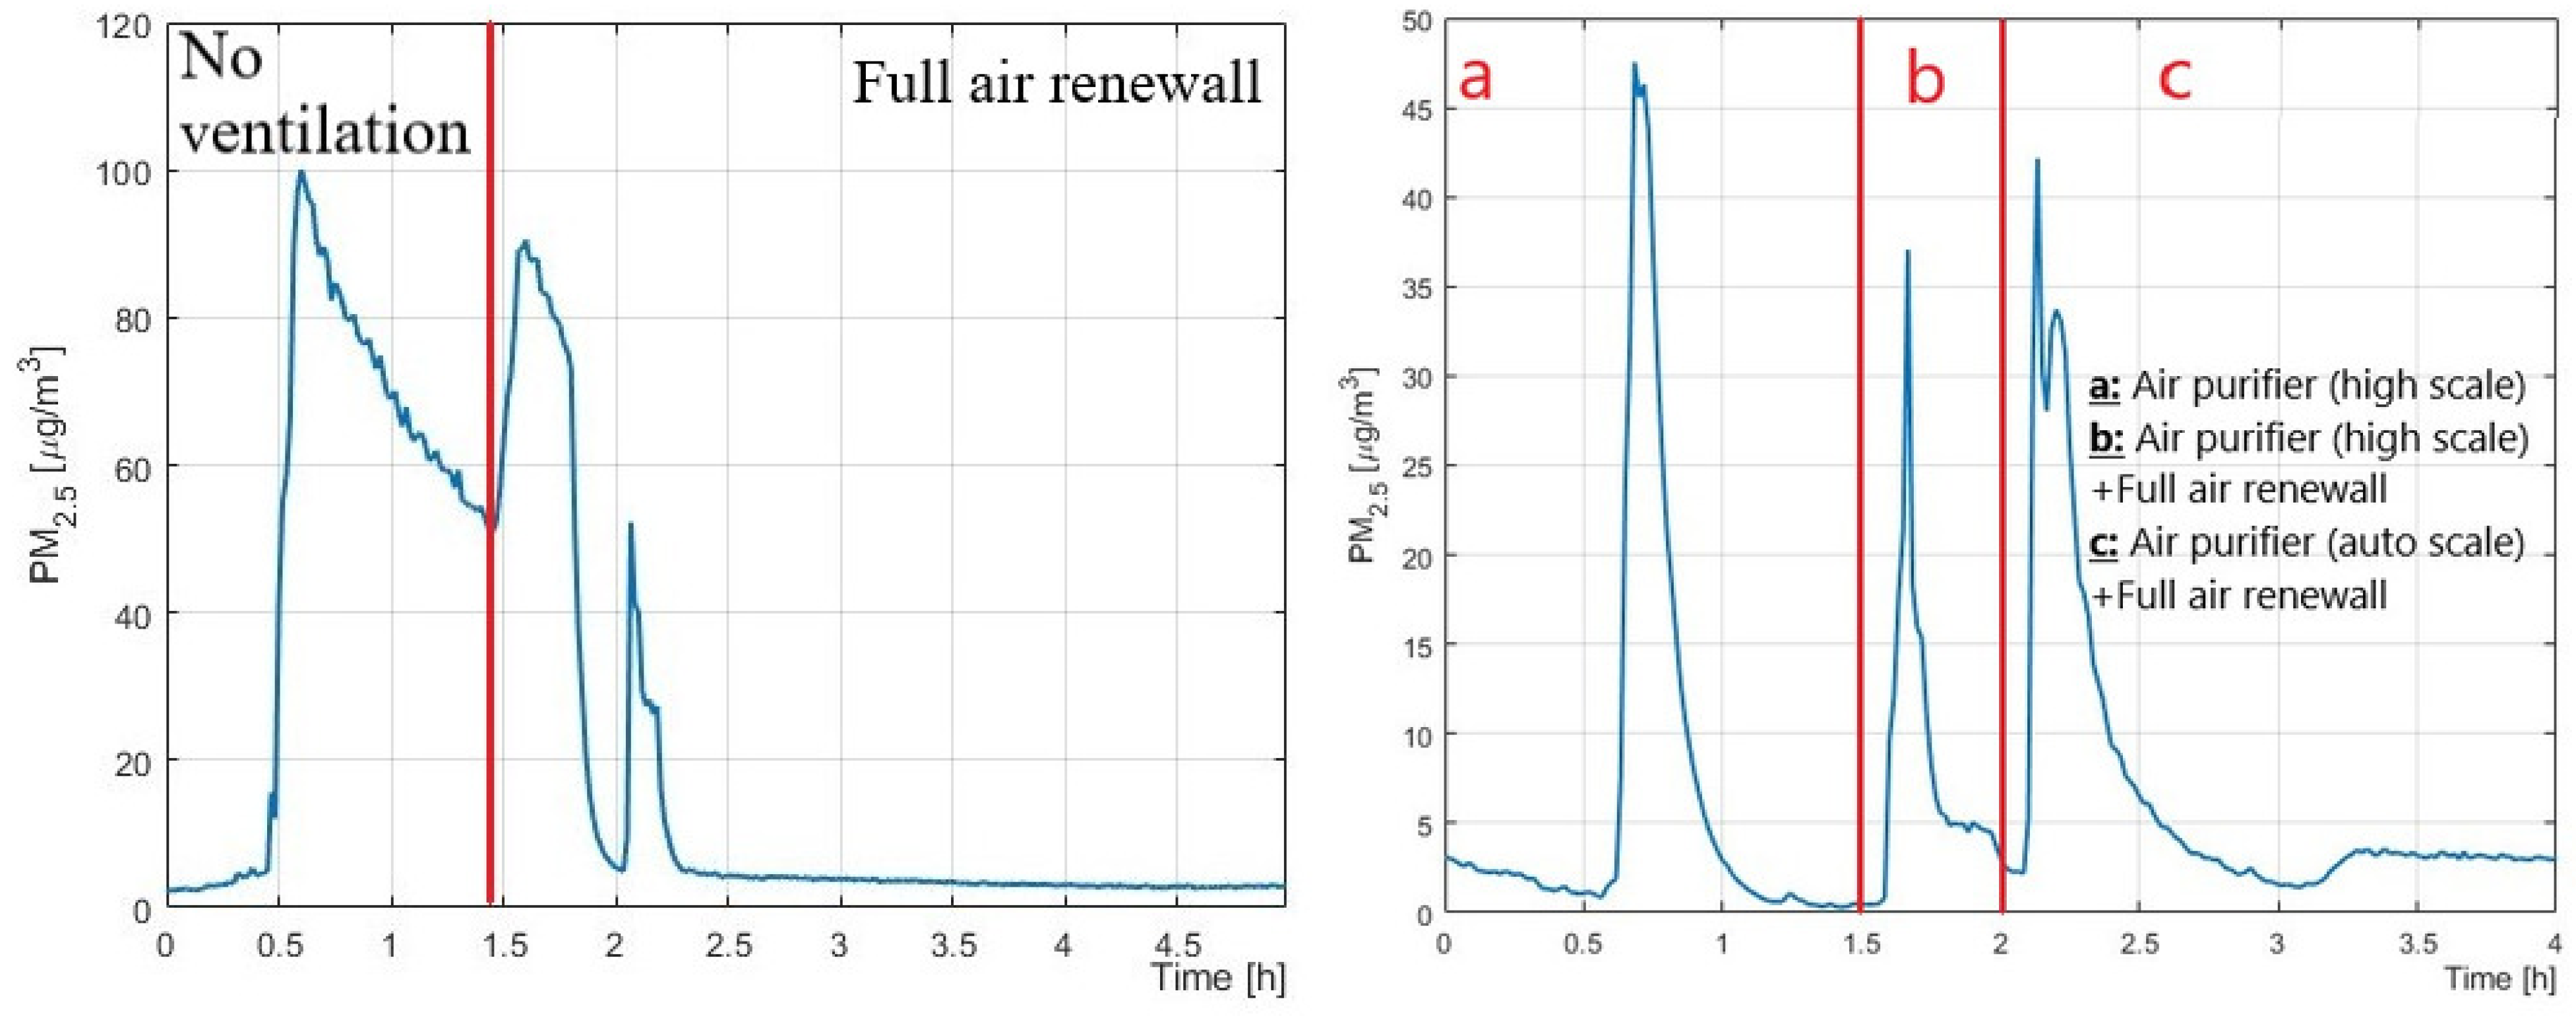
In Figure 14, PM2.5 concentrations are presented as a function of time in order to better illustrate and facilitate the interpretation of the smoking-related scenarios conducted in the climate chamber. The time-resolved PM2.5 traces show the expected pattern of sharp peaks during smoking, followed by decay driven by removal processes. Under no-ventilation conditions, decay is slower, and concentrations remain elevated for longer, whereas switching to full air renewal produces a rapid decrease back toward background levels. A similar rapid post-peak reduction is observed when the air purifier is activated, supporting the boxplot evidence that mechanical ventilation and/or filtration-based air cleaning strongly accelerates PM2.5 removal after emission events.
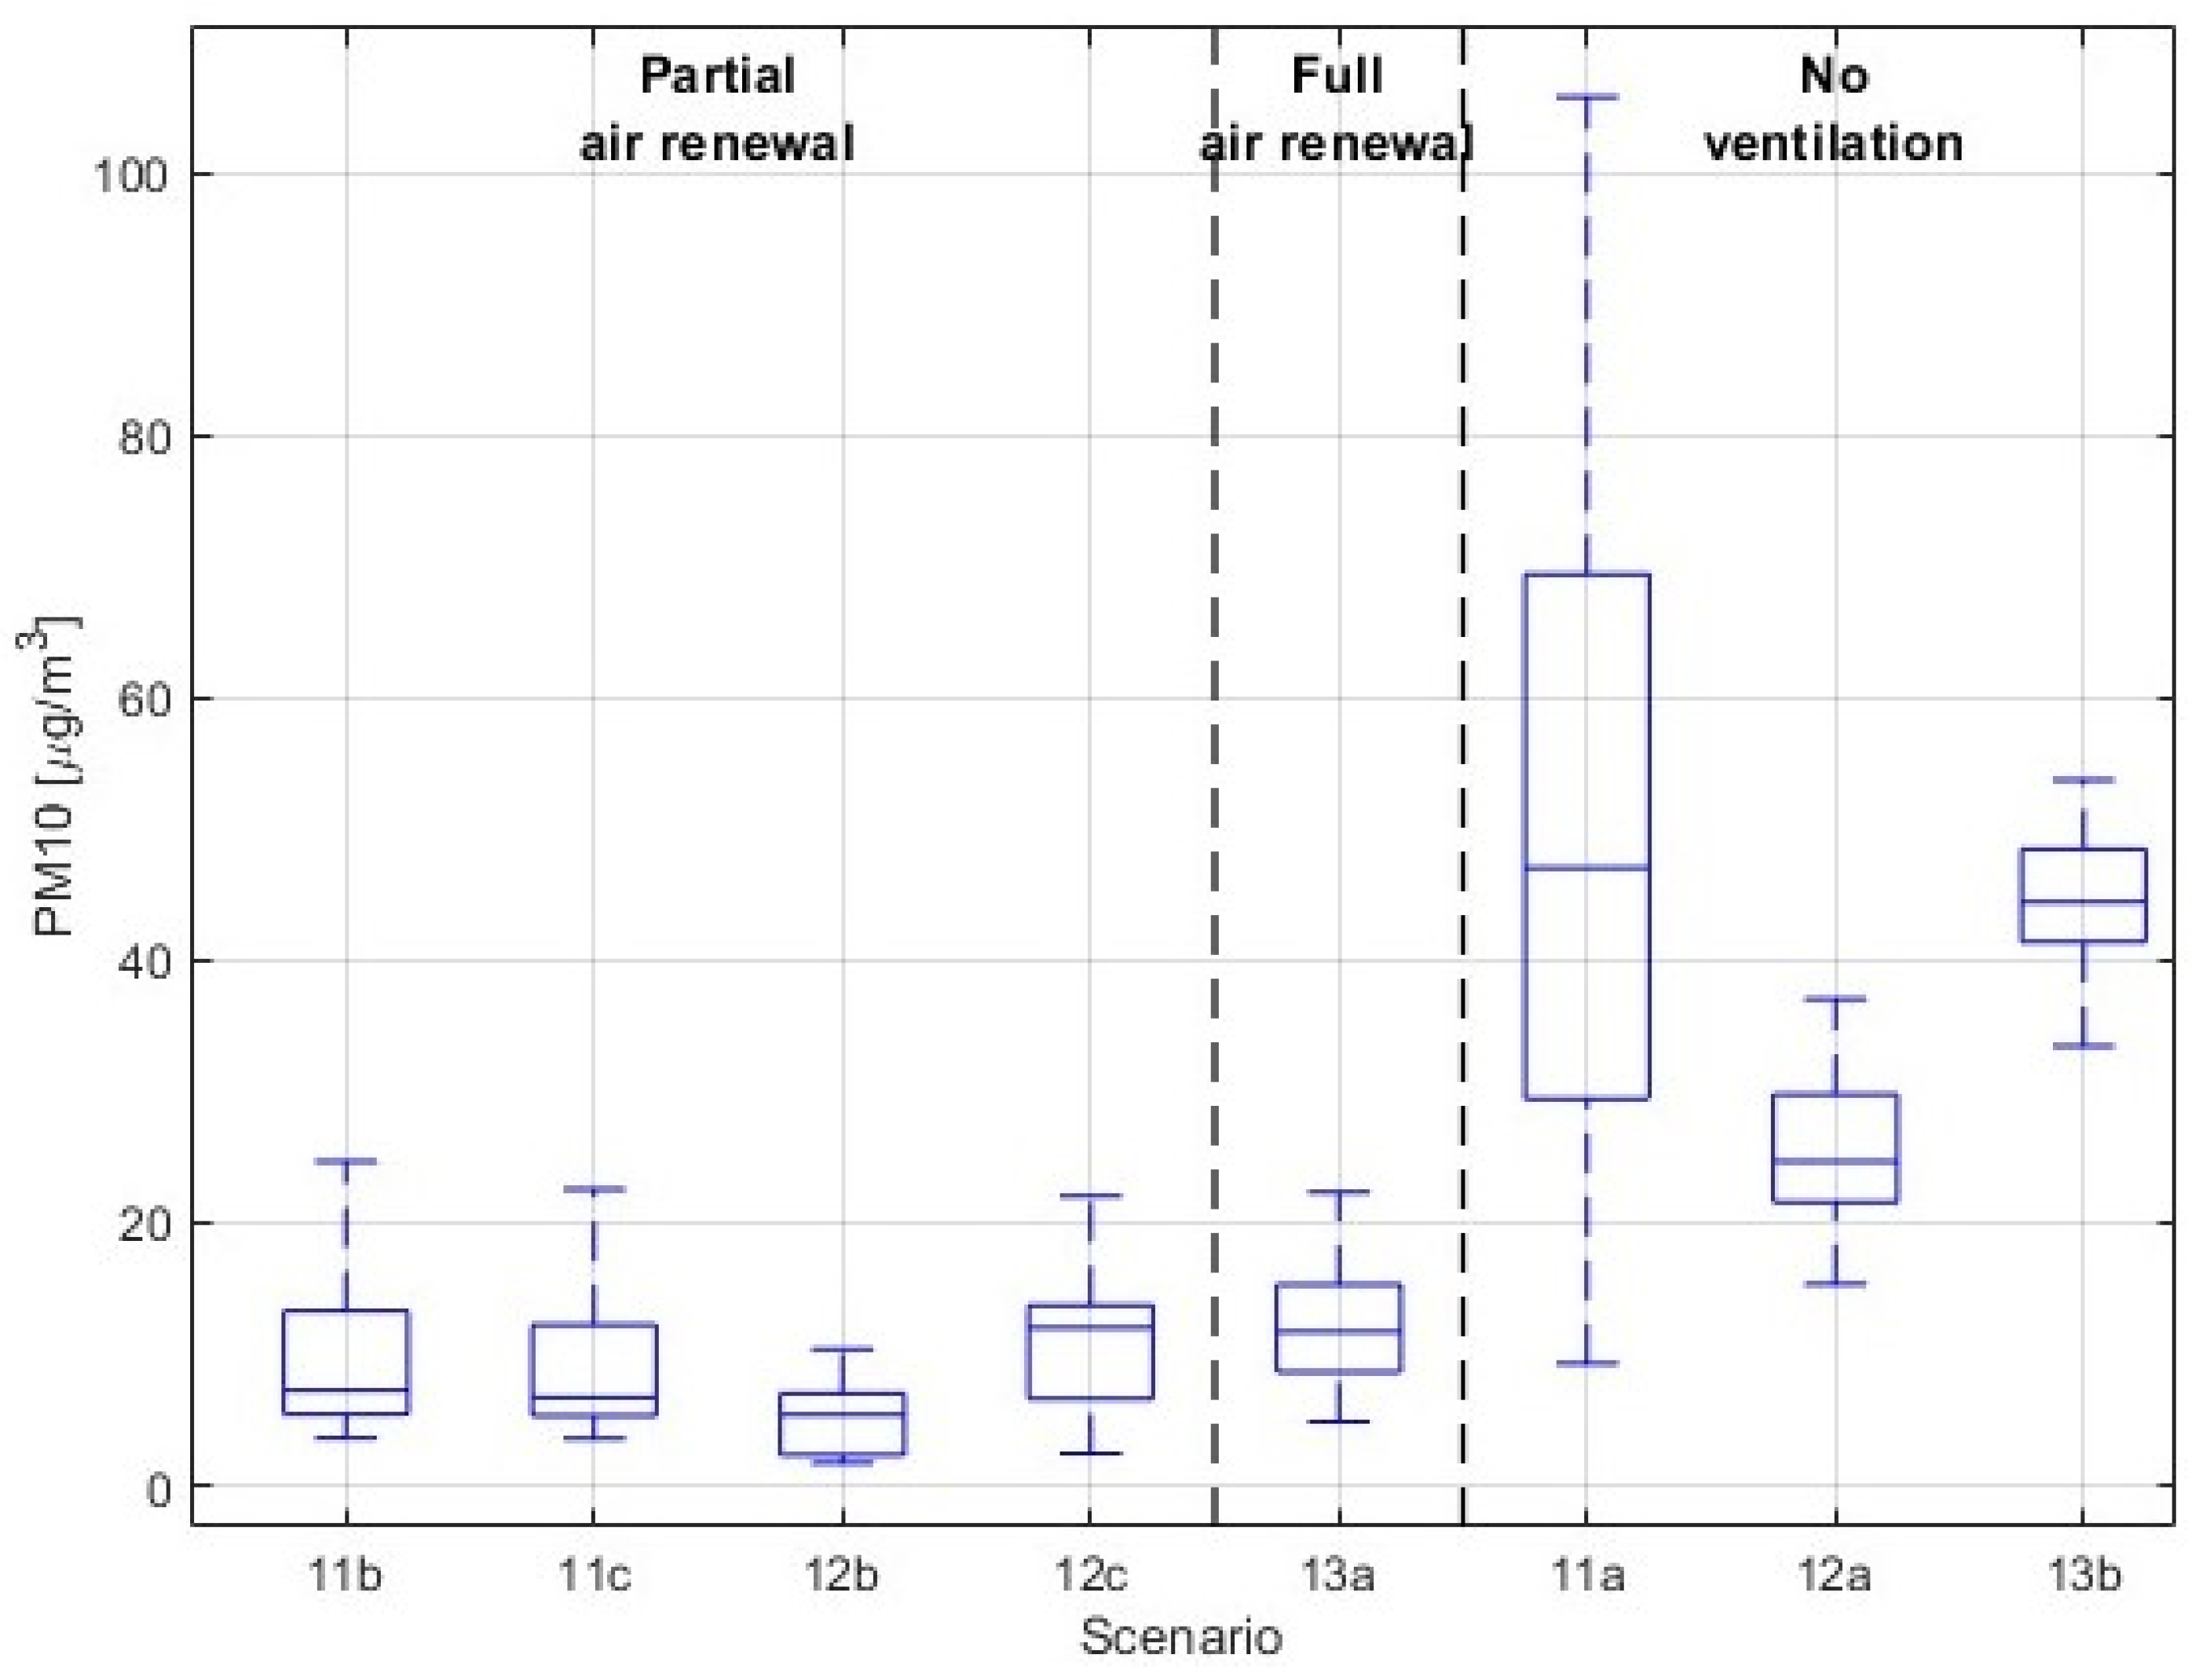
Across the occupancy scenarios presented in Figure 15, PM10 remained relatively low. A ventilation-related pattern is still visible: scenarios under no-ventilation exhibit higher medians and markedly larger variability (especially Scenario 11a), whereas partial and full air renewal cases show lower and more stable distributions. This behavior is consistent with the PM2.5 results, although the ventilation effect appears less pronounced for PM10 than for PM2.5, likely because coarse particles are more strongly influenced by gravitational settling and surface deposition, which can reduce concentrations even in the absence of ventilation. In addition, because coarse particles are often dominated by outdoor sources, variations in PM10 can partly reflect changes in the PM10 content of the supply air during full renewal periods.
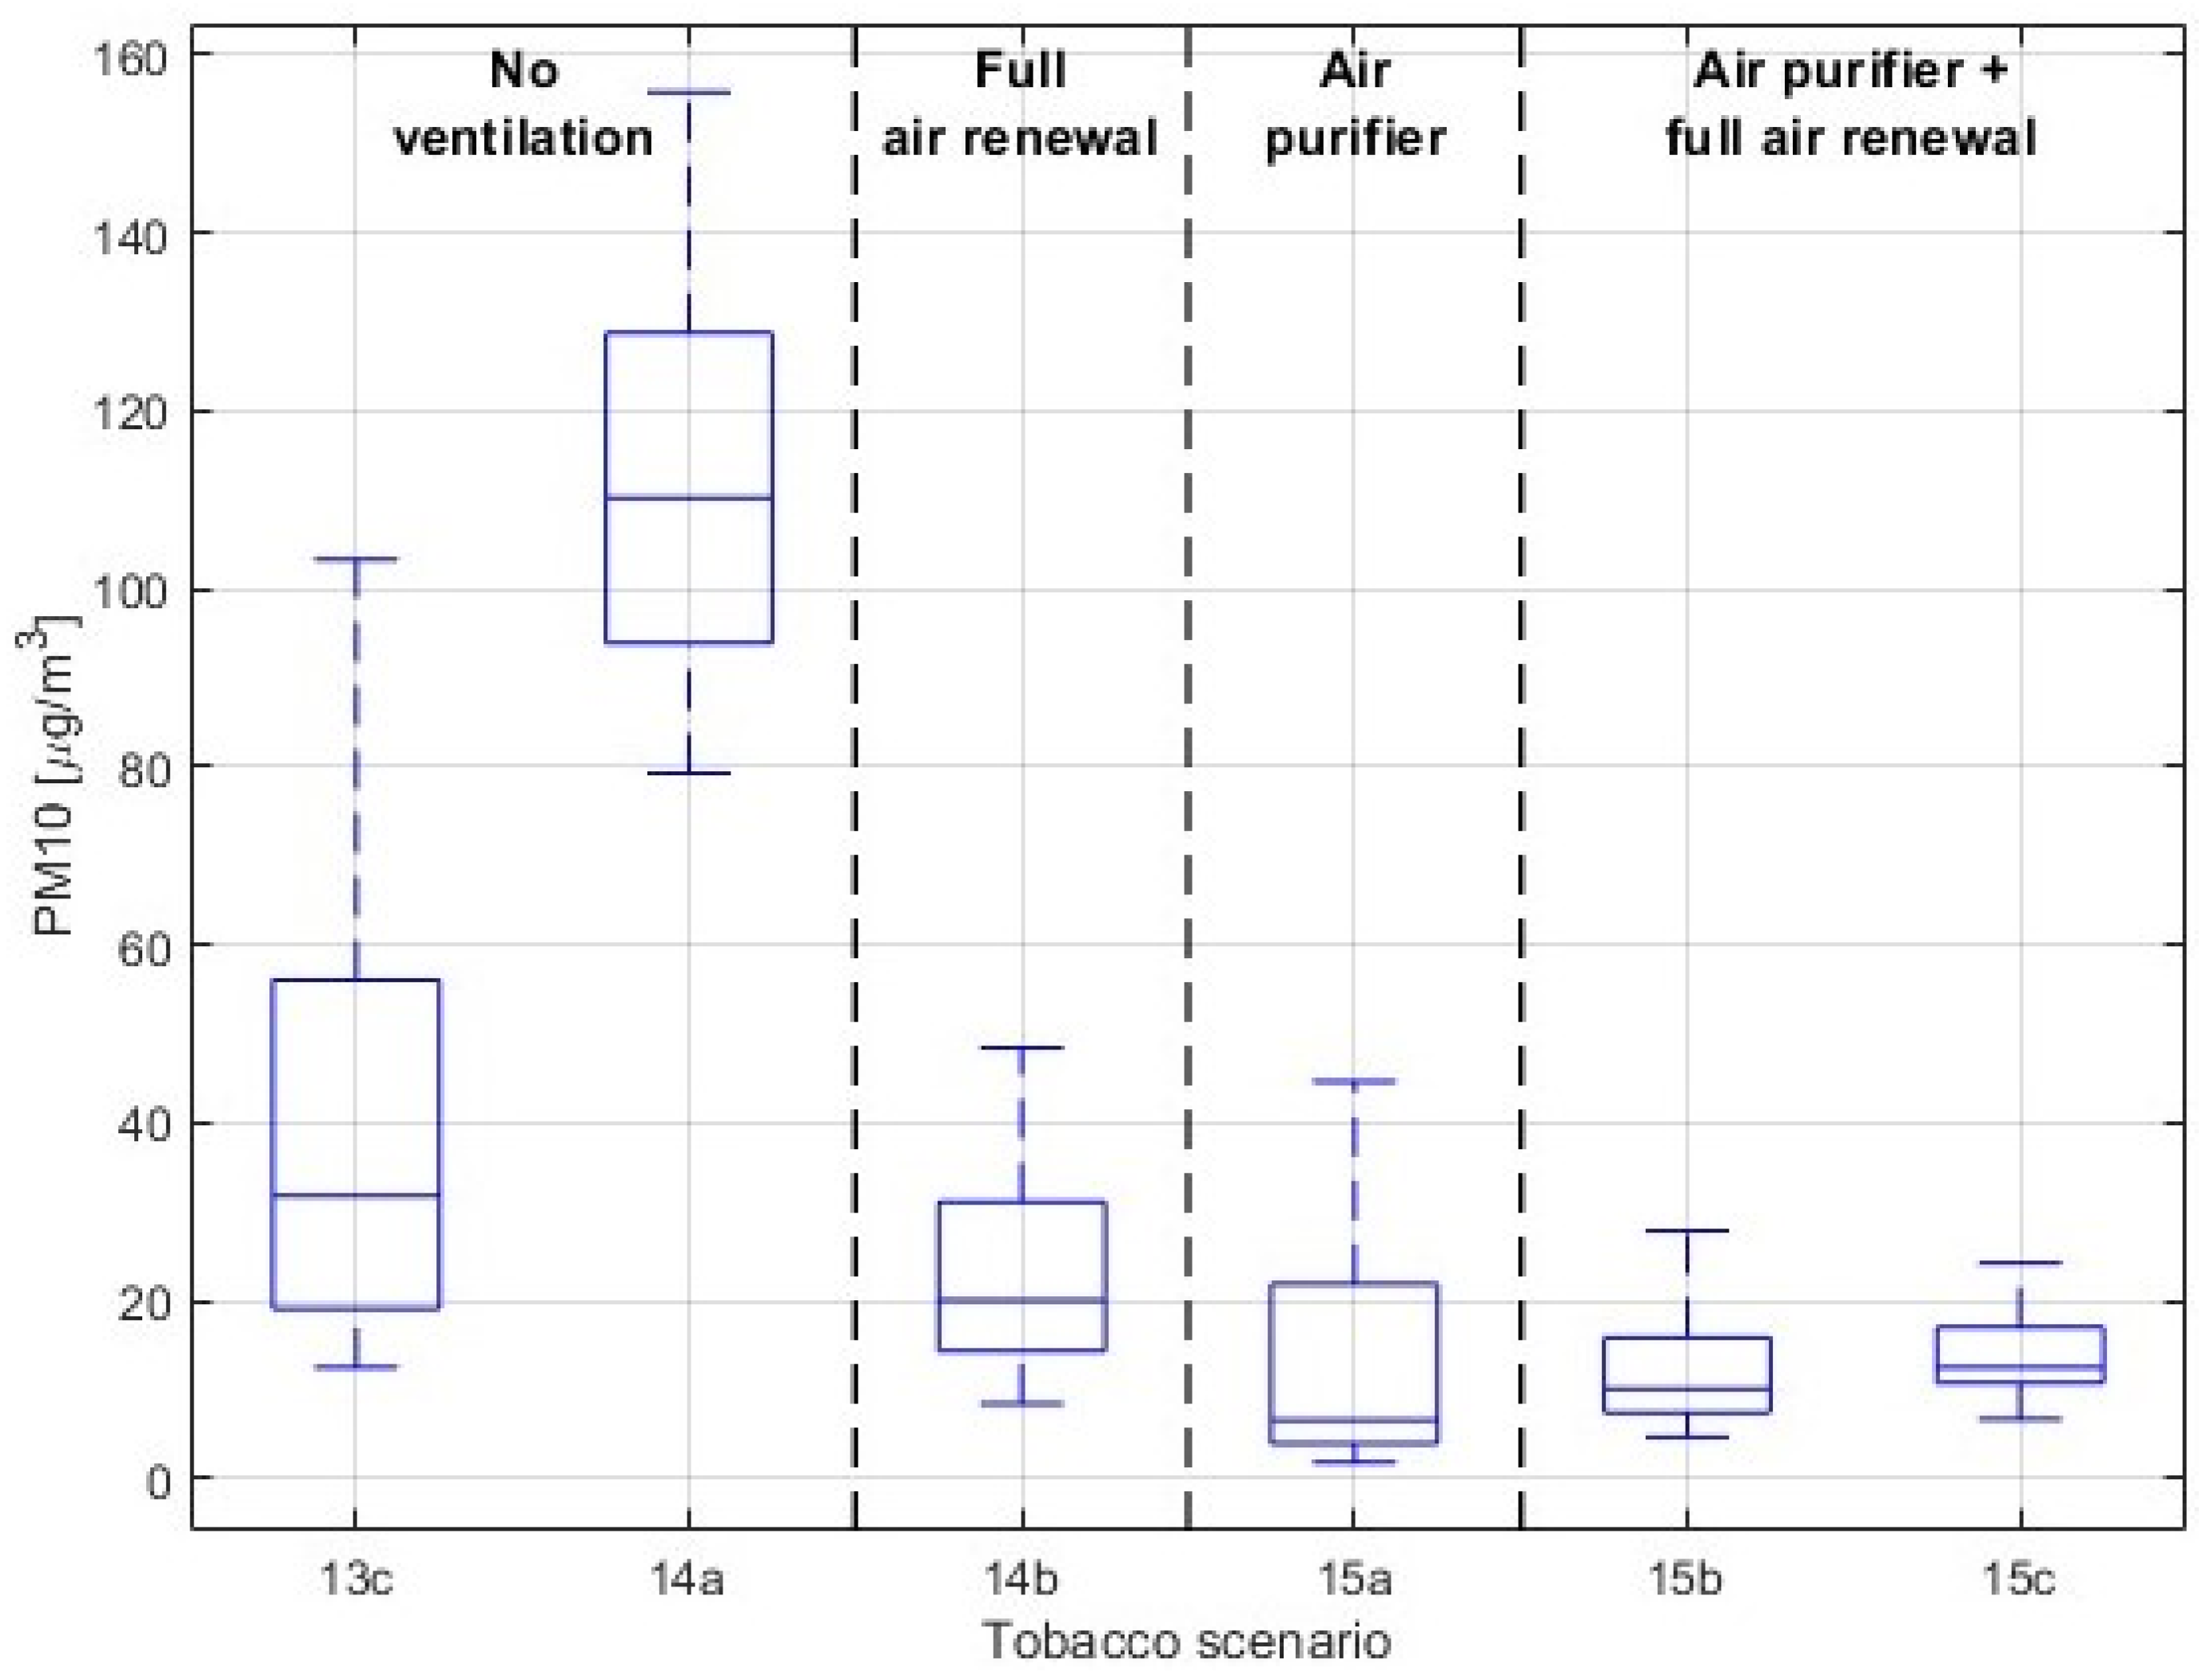
Figure 16 presents the PM10 concentration in tobacco scenarios. The highest concentrations occurred under no-ventilation (two-cigarette Scenario 14a), while the one-cigarette case (Scenario 13c) produced lower—but still elevated—PM10. Switching to full air renewal (14b) strongly reduced PM10, and the air purifier scenarios (15a) and combined air purifier + full air renewal (15b–15c) maintained PM10 at the lowest levels (typically in the low tens μg/m3 or below). Overall, PM10 follows the same qualitative trends as PM2.5—smoking dominates particle exposure, and both ventilation and portable air cleaning reduce concentrations. However, compared with PM2.5, PM10 tends to show smaller relative differences between some ventilation settings, consistent with the stronger role of deposition for the coarse fraction.

3.3. Ventilation Results

For the estimation of the ventilation rate and infiltration rate of the chamber, the tracer gas approach is used [35]. The steady-state or equilibrium method can be used when the concentration of the tracer gas becomes constant during the occupancy period. On the other hand, decay or step-down methods can be used when a space is vacated after occupancy, or if there is a stepwise decrease in occupancy. The estimation of the ventilation rate is made by measuring the rate of reduction in the tracer gas concentration over a certain period. Below are presented the equations of both decay models:
Q = V Δ t ln C 1 C o u t C 0 C o u t
where:
Q: Ventilation rate of the space [L/s],
V: Volume of the space [m3],
C1: Maximum CO2 concentration in decay period Δt [ppm],
C0: Minimum CO2 concentration in decay period Δt [ppm],
Cout: Outdoor CO2 concentration [ppm],
Δt: Time period [hours].
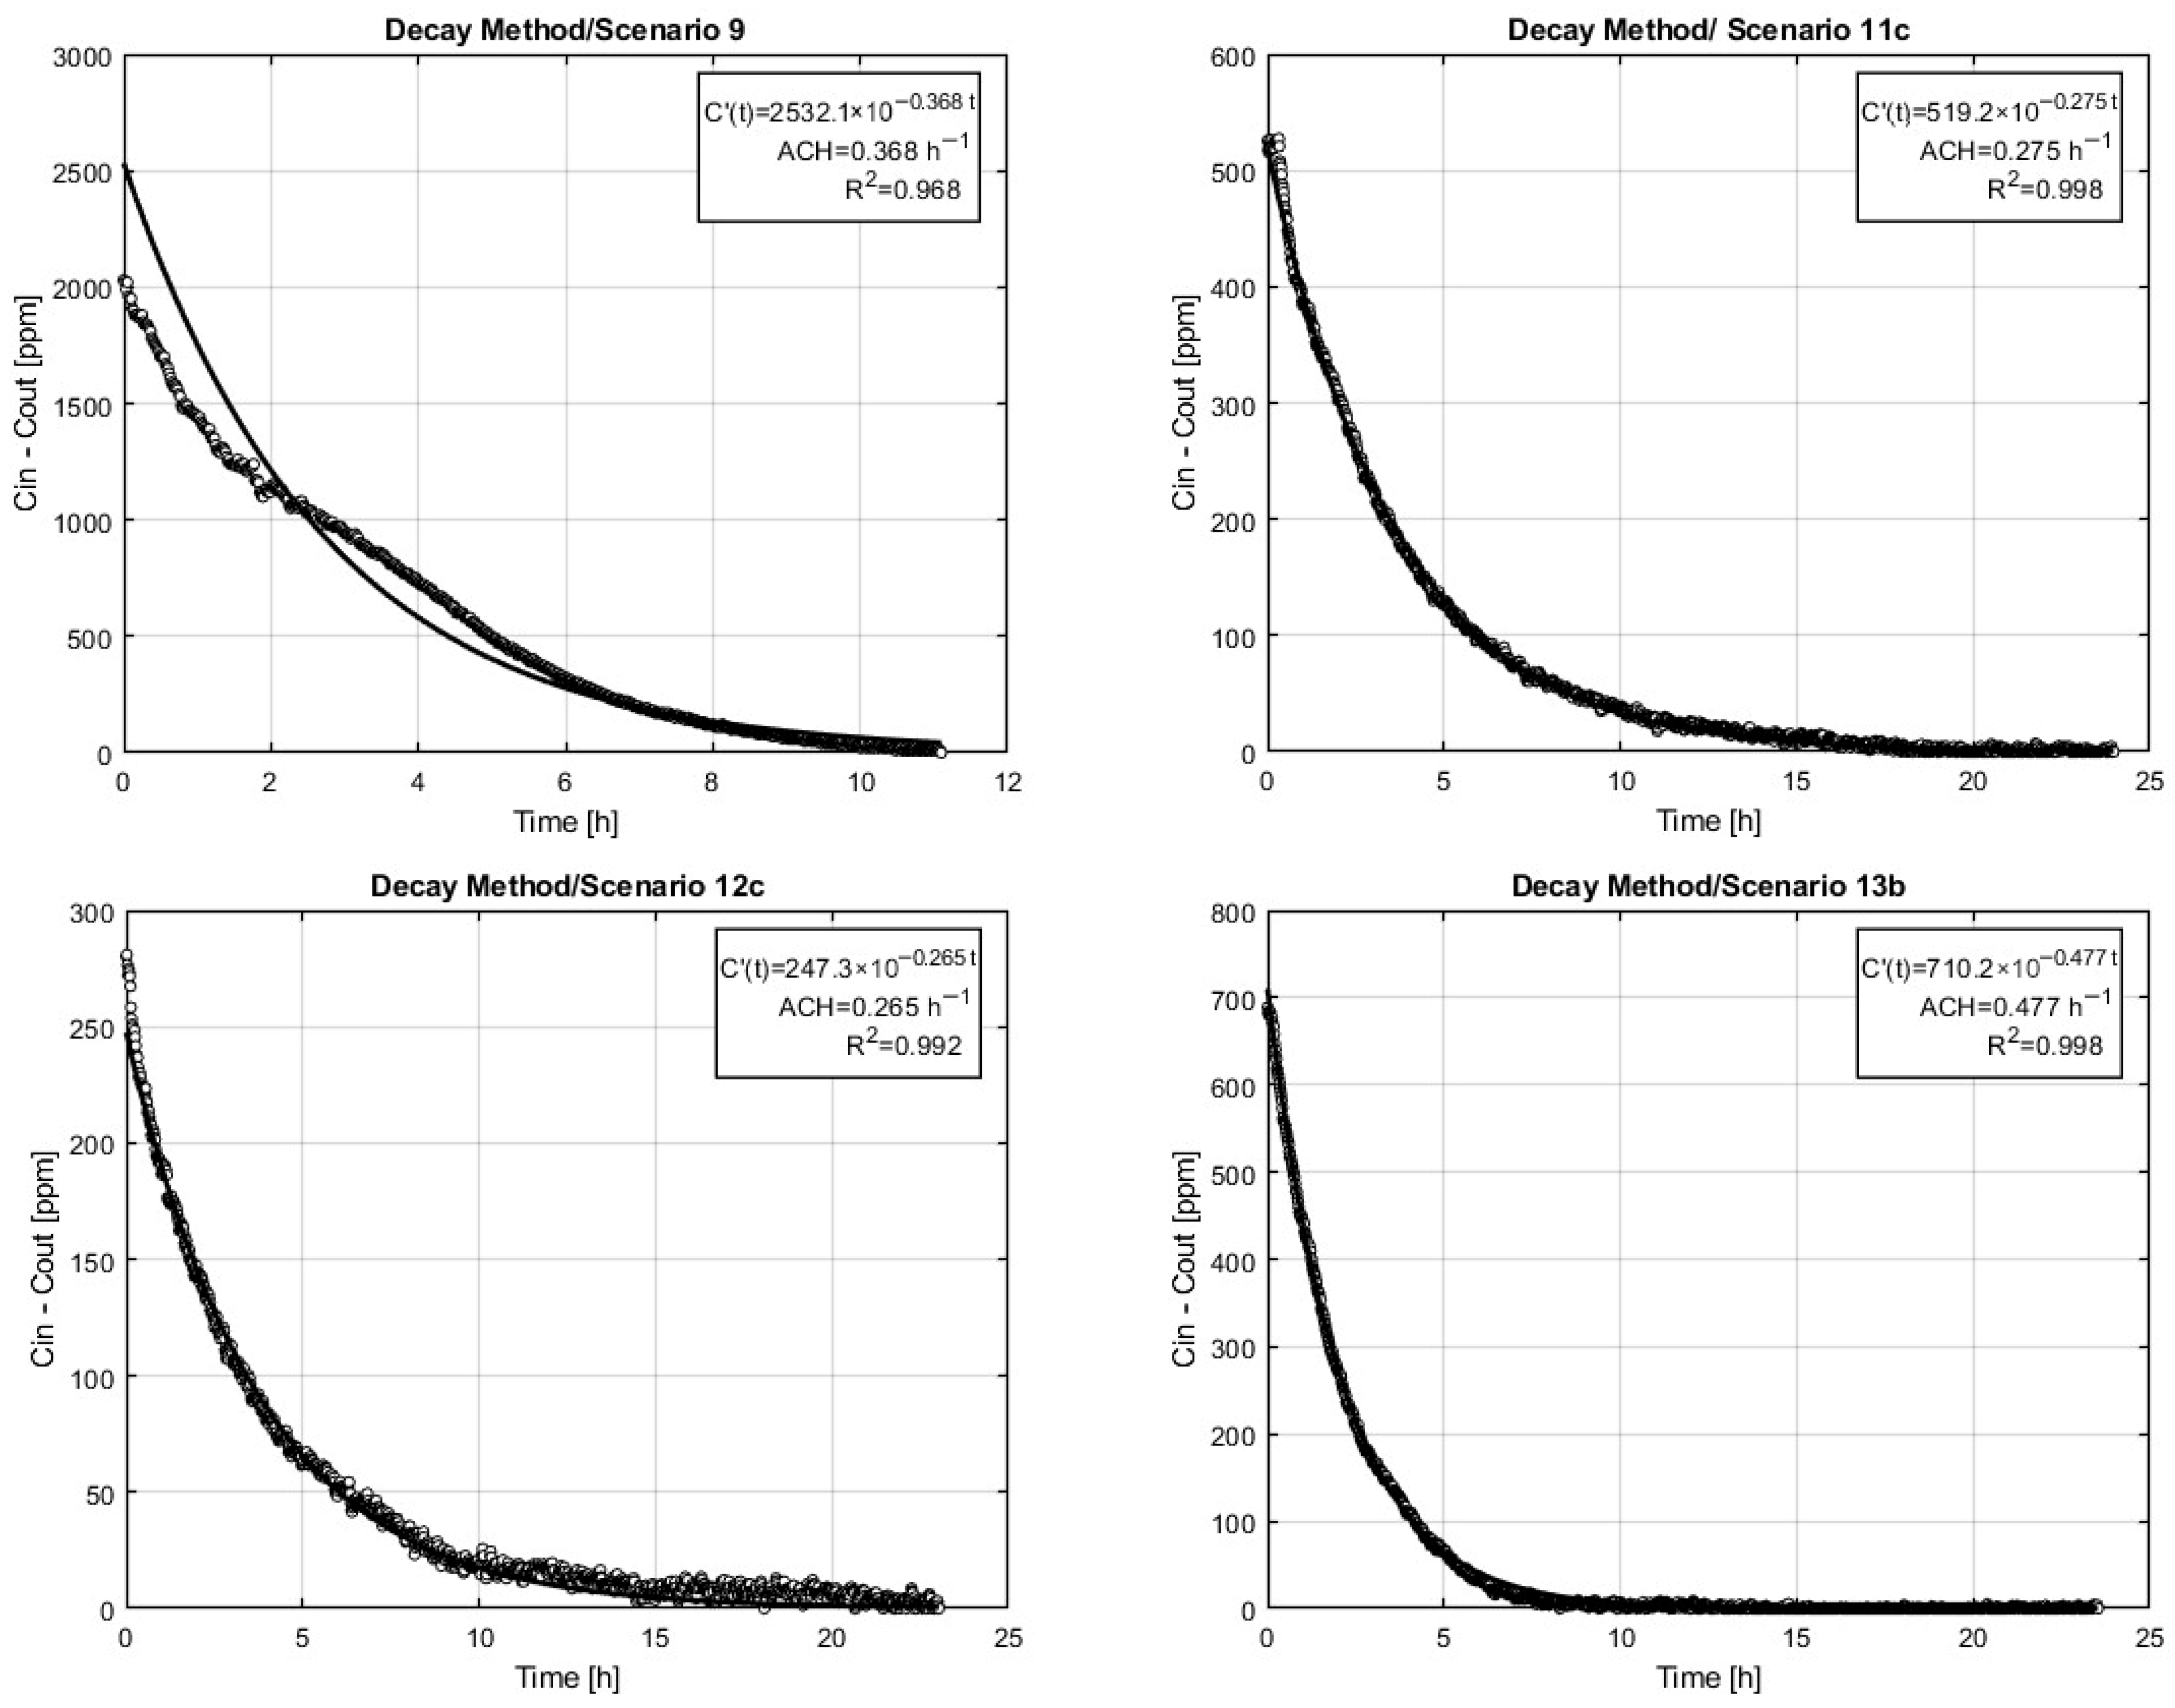
As mentioned, the decay method can be applied after the chamber is vacated while the mechanical ventilation system is switched off. Under these conditions, the method enables estimation of the chamber infiltration rate (i.e., its airtightness) by exploiting the indoor CO2 concentration immediately after the space is emptied. Figure 17 presents four scenarios in which the initial CO2 level was sufficiently elevated to allow application of the above model.
Across scenarios, the infiltration rates lie between 0.265 and 0.477 h−1, with a mean infiltration rate of 0.346 h−1. Scenario 13b exhibits the highest ACH (0.7 h−1) and therefore the fastest decay, while Scenarios 11c and 12c present the lowest ACH values (0.275 and 0.265 h−1). The between-scenario differences suggest that infiltration in the chamber is not strictly constant but varies with the prevailing leakage/driving conditions at the time of measurement. Moreover, the observed differences among scenarios are likely influenced by variability in the CO2 concentration outside the chamber, since the chamber is not located in an outdoor environment. As a result, background CO2 levels within the surrounding building may fluctuate over time and affect the decay calculation. In addition, the initial indoor CO2 concentration at the start of the decay period can also influence the robustness of the fit and the resulting infiltration estimate. Overall, the estimated infiltration rates are broadly consistent across scenarios; the differences are relatively small, and the values remain close to each other.
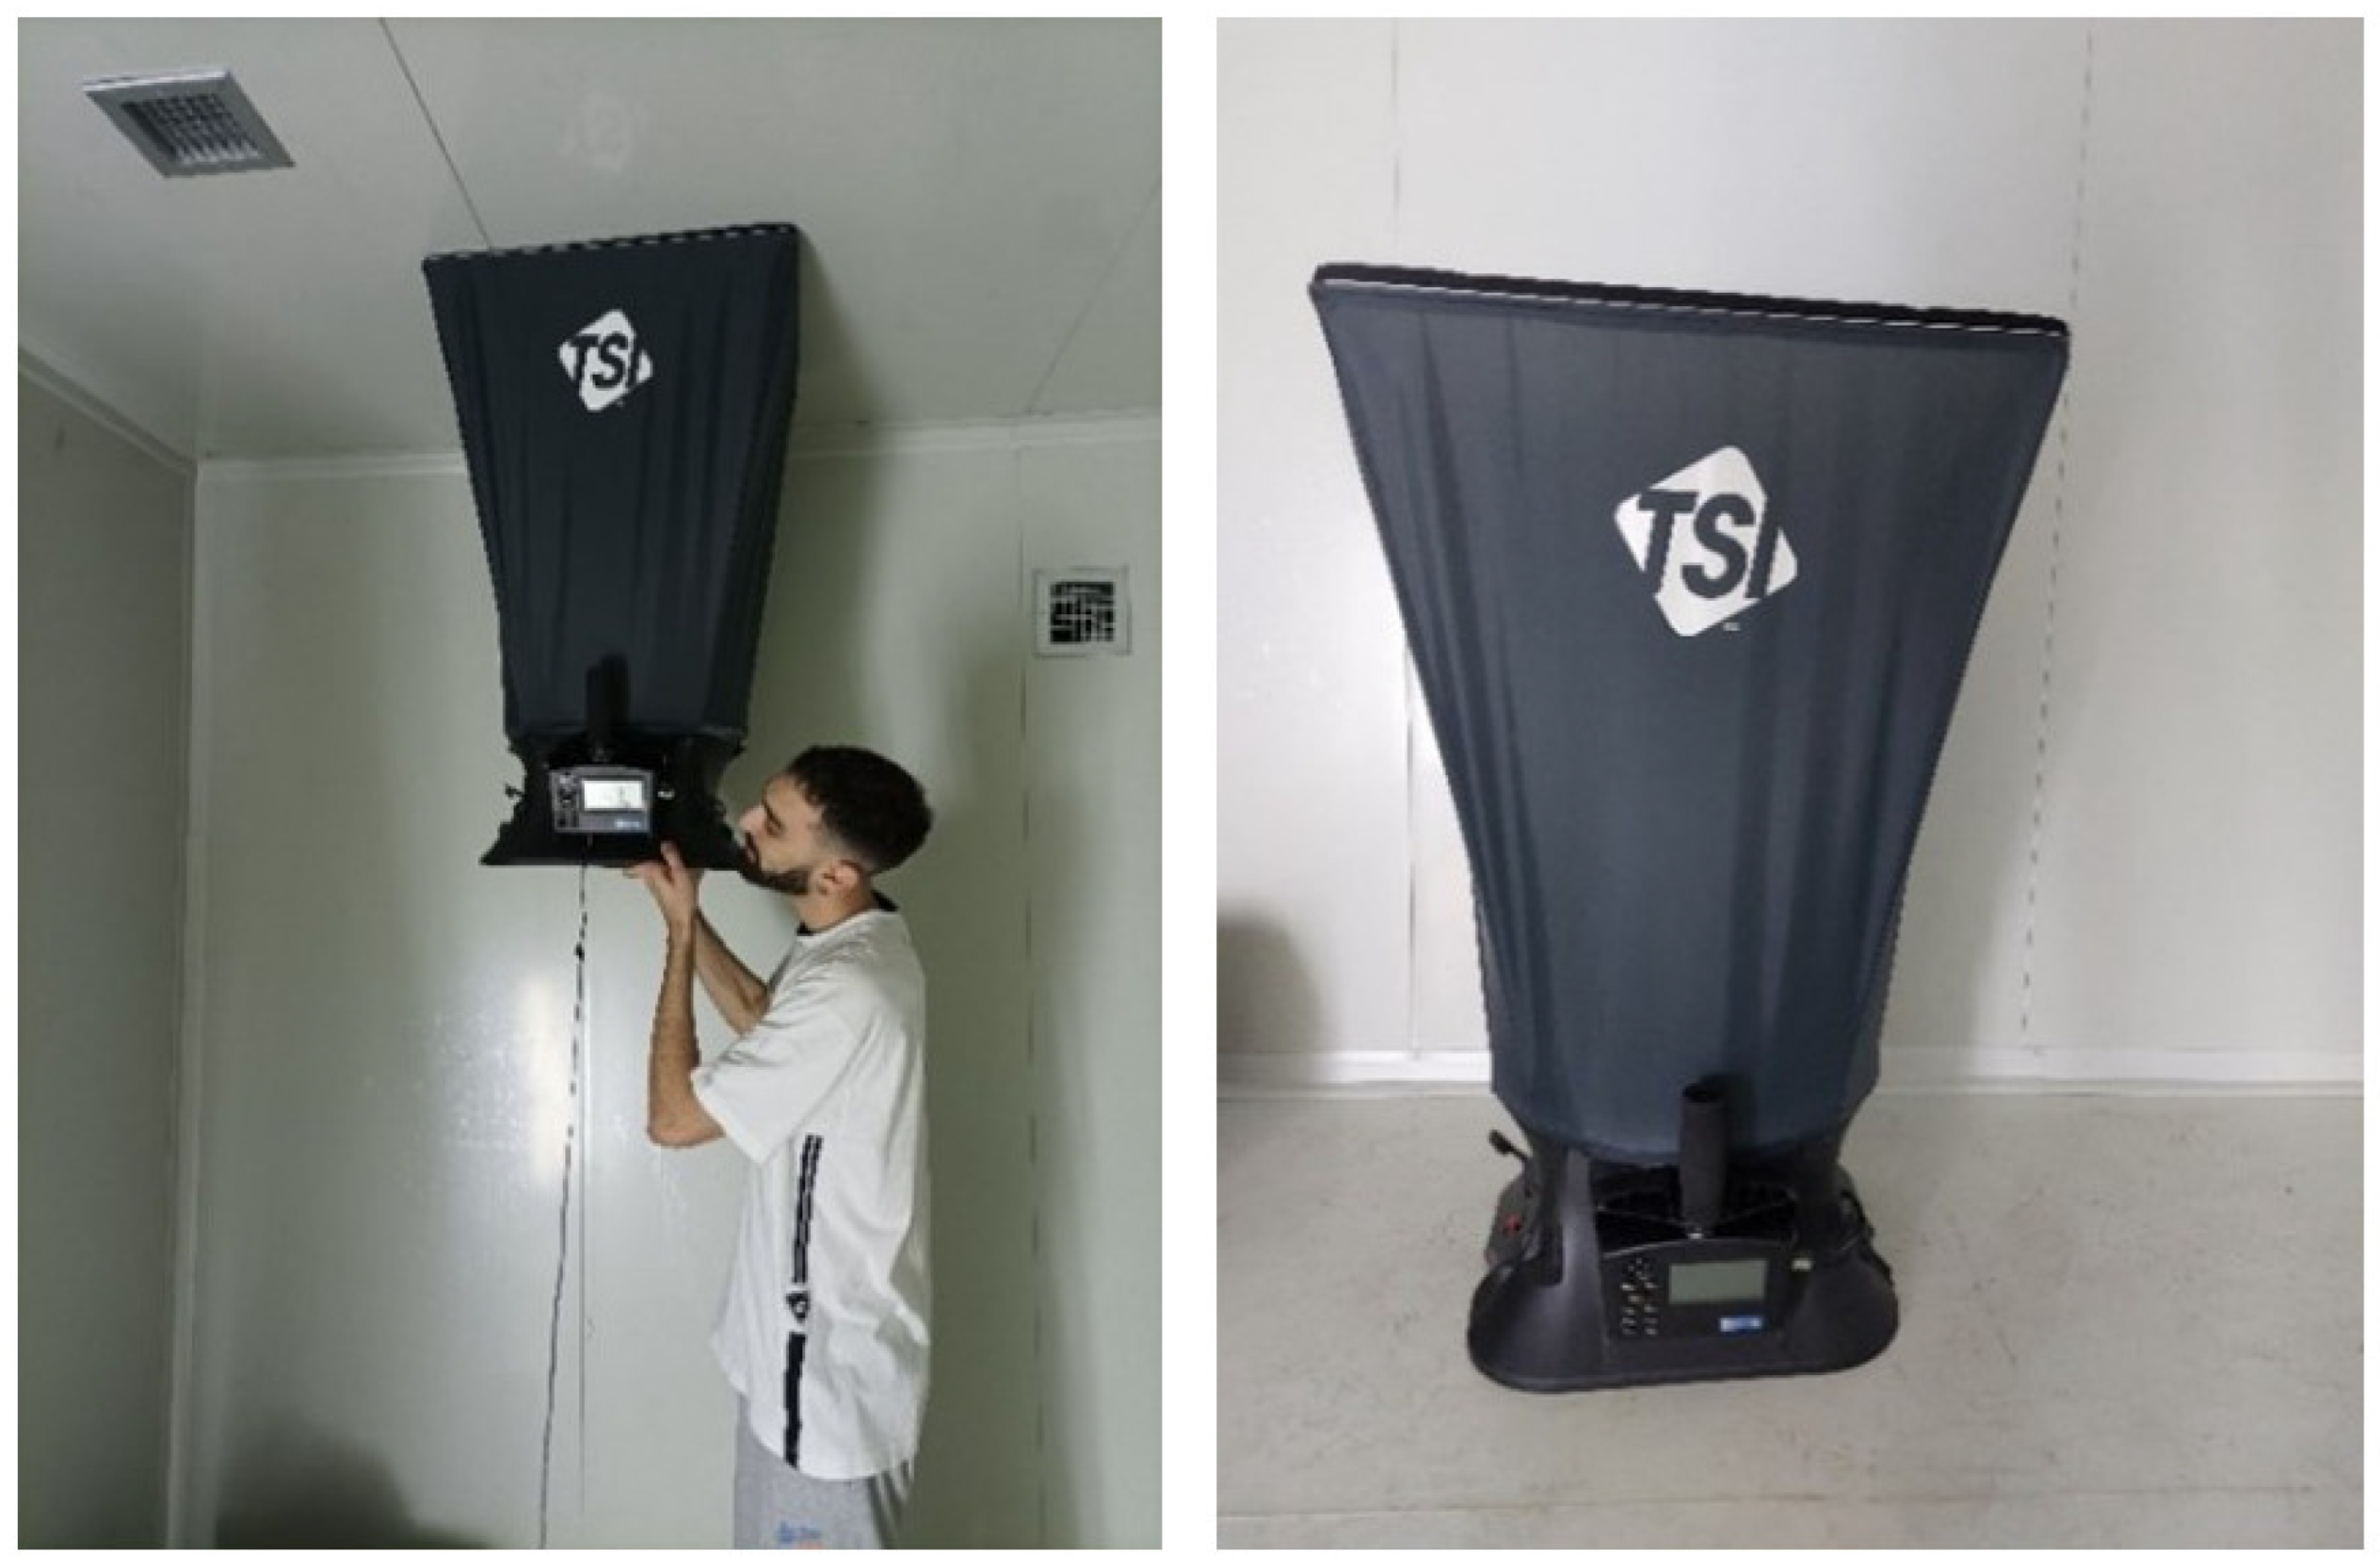
The ventilation rate during periods when the mechanical ventilation system was operating was determined using a balometer (Figure 18). For this purpose, a TSI AccuBalance Model 8375 was used to measure the airflow rate in each supply/exhaust duct serving the chamber. Under the selected fan speed setting, the measured total flow rate was approximately 1500 m3/h, lying close to the maximum flow rate of the fans (1725 m3/h).

4. Discussion

The aim of the present study was to demonstrate selected capabilities of controlled-environment chambers—specifically the chamber located at the facilities of the University of Western Macedonia—with respect to its research potential for investigating topics related to indoor environmental quality. Twenty-eight scenarios under different indoor environmental conditions and ventilation strategies were investigated with regard to their thermal comfort and IAQ parameters. Generally, the climatic conditions of the scenarios were selected to be close to neutral temperatures, combining different numbers of occupants and ventilation methods, while some of them were out of the thermal comfort zone, to invest the thermal adaptation of the users. Parallel same-day scenarios were investigated to assess how variations in the indoor conditions influence the occupants’ perceptions. As concerns the thermal comfort parameters, the air temperature values were similar to the mean radiant temperature due to the absence of outdoor radiant sources. The calculated metabolic rates were lower than the values typically assumed in the ASHRAE and ISO standards, a finding that is also supported by similar studies that directly measured occupants’ metabolic rates [8,10]. These findings suggest that the standards tend to overestimate the metabolic rate for standing activities and significantly underestimate the metabolic rate during walking. Beyond this, important determinants—also reflected in the results of the present study—include individual characteristics (e.g., body mass, height, and age) as well as everyday habits and activity patterns [10,12]. In addition, related studies have reported that ethnicity/background may also influence metabolic rate [8,10]. Clothing insulation levels ranged from 0.5 to 0.95 clo, which is typical for the period during which the experiments were conducted (spring and winter) [16,17]. Finally, air velocity was clearly higher when mechanical ventilation was operating, averaging approximately 0.13 m/s and being similar to other works [51], although air speed remained below the critical value of 0.2 m/s in most scenarios [17].
For the assessment of thermal comfort, the widely used Fanger model was applied alongside questionnaire-based surveys to capture occupants’ actual thermal sensation. The resulting PMV values were consistent with the boundary conditions presented in Table 4 and provided an initial, objective estimate of comfort for each scenario. Subsequently, the inclusion of questionnaire responses enabled a more detailed interpretation of comfort outcomes and occupant perception.
Overall, the findings support that the Fanger/PMV framework performs best in mechanically conditioned (HVAC) environments [52,53], whereas in naturally ventilated buildings, the adaptive approach is often reported to provide a more representative description of comfort, as documented in the literature [54,55,56,57]. This is also reflected in the observed relationship between PMV and TSV, expressed by the fitted PMV–TSV equation (PMV = 0.485·TSV), indicating substantial alignment between the objective index and subjective sensation under the controlled chamber conditions. Although transient effects partly explain deviations between PMV predictions and TSV responses, it is also important to acknowledge the intrinsic assumptions of the Fanger model, including the steady-state heat balance and limited representation of adaptive or behavioral mechanisms [16,17]. Nevertheless, in mechanically conditioned spaces such as the present chamber environment, the strong correlation observed between PMV values and subjective responses suggests that the model remains robust under HVAC-controlled conditions. Any remaining discrepancies were mainly observed in the same-day scenario sets, where participants were exposed to pronounced within-session changes in the indoor environment; these transition cases highlight that rapid alterations can be perceived more intensely than predicted by steady-state assumptions [58,59,60]. The analysis presented in Figure 4 captures this behavior and further underlines the importance of considering transient effects when interpreting objective–subjective agreement.
The questionnaire survey analysis suggests that ventilation-related air movement did not systematically shift the mean comfort level, but in selected mechanically ventilated runs, it may have contributed to slightly less favorable subjective responses. This interpretation is probably supported by the higher air velocities observed during mechanical ventilation (Table 4), although air speed remained below 0.2 m/s in most scenarios. Furthermore, both sensors and participants were positioned away from direct supply diffusers, minimizing localized airflow effects. Under these conditions, ventilation influenced comfort primarily through airflow-related dynamics and thermal stability rather than through direct modification of the temperature-driven PMV response.
The relationship between thermal sensation votes (TSV) and thermal preference (TP) followed the expected pattern reported in previous studies, with preference votes typically acting as a corrective response to sensation (i.e., cooler sensations associated with a preference for warming and vice versa) [61,62]. In addition, the TSV dataset enabled estimation of the comfort temperature using the Griffiths method, providing an occupant-derived neutral temperature that complements the PMV-based evaluation and strengthens the overall interpretation of thermal comfort. The present results yield a comfort temperature of Tc = 22.2 ± 1.7 °C (N = 61), which is consistent with values reported in the literature. Comparable estimates have been obtained from climate chamber experiments (Tc = 22.73 °C) [63] and from university classrooms in Florina, Greece (Tc = 20.5–22.0 °C) [54]. Similar comfort temperatures have also been reported for educational buildings in France and Italy (Tc = 21.3 °C) [64], while studies in primary schools in Chile and the UK report closely matching ranges: Tc = 22.5–23.0 °C and Tc = 20.5–23.0 °C, respectively [65]. In general, comfort temperature varies with outdoor climatic conditions, the ventilation/conditioning mode (naturally ventilated vs. mechanically conditioned), and the building typology [55,62,66,67].
Indoor CO2 concentration depends primarily on the number of occupants in the space and their metabolic activity [68]. In practice, only ventilation with outdoor air renewal can effectively reduce CO2 levels, since air purifiers are mainly designed to remove airborne particles and, depending on the technology, certain volatile organic compounds rather than CO2 [69]. Scenarios with full air renewal keep the CO2 level at low values independently of the number of occupants, while the partial air renewal can keep CO2 at acceptable levels.
As concerns particulate matter, scenarios with and without smoking were investigated. Smoking was selected as the pollution source due to its high emission rates of airborne particles and its well-documented adverse effects on human health [31]. In the investigated scenarios, ignition of two cigarettes produced a peak PM2.5 ≈ 100 µg/m3 under no-ventilation (14a), followed by a relatively slow decay driven mainly by deposition and background leakage. In the broader literature, tobacco-related indoor PM2.5 levels are often higher in real-world settings where smoking is sustained and exposure durations are longer: measurements in public venues permitting smoking commonly fall in the tens to a few hundred µg/m3 range (e.g., 33–299 µg/m3 across bars/restaurants/entertainment venues), with concentrations increasing with smoking density [70]. Moreover, in enclosed room experiments, substantially higher PM2.5 has been reported when ventilation is off; for example, hotel-room measurements indicate cigarette smoking can reach hundreds to >1000 µg/m3 under “ventilation OFF” conditions, while operation of ventilation can reduce levels to around 100 µg/m3 [71]. The comparatively lower peak concentration observed in this work is therefore consistent with the controlled protocol (two cigarettes per event), the modest “smoking density” implied by the chamber volume, and the absence of the prolonged, cumulative smoking typical of hospitality environments. Figure 12, Figure 13, Figure 14, Figure 15 and Figure 16 further demonstrate the role of removal mechanisms: switching from no ventilation to full air renewal caused a rapid drop of PM2.5 towards background, confirming dilution/exhaust as a highly effective pathway for smoke particle removal in the chamber. These results also highlight the practical value of air purifiers, which can be particularly beneficial in spaces with insufficient ventilation, providing removal performance comparable to mechanical ventilation while typically requiring lower energy input [72]. The combined use of mechanical ventilation and air cleaning delivered the most effective reduction, indicating an additive benefit when dilution (ventilation) and filtration (purification) operate simultaneously [73,74,75].
Although the directional influence of ventilation on CO2 and particulate matter concentrations is expected, the experimental campaign enables quantitative comparison of accumulation and decay dynamics under controlled boundary conditions. CO2 concentrations increased systematically with occupancy under reduced ventilation, confirming the sensitivity of indoor concentration to both source strength and air exchange rate. Similarly, while cigarette smoke predictably elevated PM levels, the subsequent reduction patterns differed substantially between mechanical ventilation, air purification, and combined operation. The observed differences in decay rate and recovery time (Figure 14) demonstrate that removal efficiency is strongly configuration-dependent, providing practical insight beyond qualitative expectations.
As noted, the present study aimed to demonstrate the research potential of climate chambers for investigations related to IEQ. Several limitations should be acknowledged. First, identical environmental conditions were not repeated in multiple experimental runs, which would be useful to assess repeatability and quantify the uncertainty of the thermal comfort outcomes. In addition, the participant sample size and the number of occupants simultaneously present in the chamber could be increased, allowing a more robust evaluation of inter-individual variability and of group effects. Future campaigns should also examine the influence of demographic and physiological factors such as gender, age, and background/ethnicity on thermal comfort responses [8,76]. Moreover, transient and extreme changes in indoor conditions were only explored to a limited extent and could be investigated in greater depth, particularly regarding perceptual adaptation and potential hysteresis effects in subjective votes. Concerning IAQ, a larger set of experiments would strengthen the generalizability of the findings and should include monitoring of additional chemical species, such as VOCs. Further work is also needed to evaluate different filtration solutions, including alternative filter grades in the central HVAC system and different air purifier technologies, and to quantify their relative effectiveness under controlled pollutant sources [77,78,79].
Overall, future research should pursue a more comprehensive investigation of the governing parameters for both thermal comfort and IAQ, while also integrating an explicit energy–IEQ perspective [80]. In the thermal domain, extending the scope to psychological and cognitive aspects—such as perceived control, expectation, attention, and the potential influence of comfort on concentration and task performance—would provide a more holistic understanding of occupant response under controlled exposures [81,82]. Future campaigns should expand the number and diversity of participating subjects to better capture inter-individual variability and to strengthen population-level generalizability of the reported comfort–IAQ relationships. Moreover, they could explore more individualized comfort models or AI-models that account for inter-individual differences (e.g., metabolic variability, clothing behavior, acclimatization, and preference), potentially improving predictive accuracy compared with population-average indices and supporting occupant-centric control strategies [83,84,85]. Finally, linking comfort and air quality outcomes to HVAC operational settings and measured energy consumption would enable a more complete assessment of performance trade-offs and the identification of solutions that optimize both occupant well-being and energy efficiency [86].

5. Conclusions

This study presented a structured series of climate chamber experiments designed to evaluate coupled thermal comfort and IAQ responses under controlled and repeatable boundary conditions. The results demonstrated the following:
  • TSV showed good agreement with PMV predictions under HVAC-controlled conditions, supporting the applicability of the Fanger model in this context.
  • The intrinsic assumptions and limitations of PMV (steady-state heat balance and limited representation of adaptive/behavioral mechanisms) should be acknowledged when interpreting PMV–TSV deviations, particularly under transient conditions.
  • The comfort temperature estimated with the Griffiths method was Tc = 22.2 ± 1.7 °C, consistent with ranges reported in international standards and previous literature.
  • Directly measured metabolic rates were lower than standard reference values, consistent with recent literature; although based on a limited participant sample, this supports ongoing discussion on revisiting default metabolic assumptions used in standards.
  • Air velocity associated with mechanical ventilation remained below 0.2 m/s in most scenarios and did not significantly shift the mean PMV response. However, airflow positioning and diffuser proximity may influence localized comfort perception, highlighting the spatial dimension of ventilation effects.
  • Regarding IAQ, CO2 concentration levels scaled predictably with occupancy and ventilation rate, confirming the sensitivity of indoor concentration to air exchange.
  • PM reduction showed configuration-dependent decay behavior. Cigarette smoke was introduced as a controlled emission event to generate repeatable PM peaks, and the subsequent concentration decay rates differed substantially across ventilation modes, demonstrating that pollutant removal efficiency is strongly strategy-dependent.
  • The combined operation of mechanical ventilation and air purification yielded the fastest recovery to near-background levels, demonstrating that pollutant removal efficiency depends not only on airflow presence but on the selected strategy.
Overall, the results indicate that the interaction between thermal comfort and IAQ is primarily mediated by ventilation rate and airflow characteristics. While temperature governs PMV under HVAC conditions, ventilation determines pollutant accumulation and removal dynamics, creating potential comfort–IAQ trade-offs that must be considered in building operation strategies. The present work provides an initial benchmarking of the chamber’s experimental capabilities for coupled comfort–IAQ assessment, establishing a foundation for future campaigns with expanded measurements and deeper analysis of the relevant mechanisms.
Future research should expand the participant sample, incorporate subject-level modeling approaches, and further investigate personalized comfort prediction under dynamic environmental transitions. Integration of energy performance assessment alongside IEQ metrics is also necessary to enable balanced and occupant-centered ventilation strategies.

Author Contributions

Conceptualization, G.P. (Giannis Papadopoulos) and G.P. (Giorgos Panaras); methodology, G.P. (Giannis Papadopoulos) and G.P. (Giorgos Panaras); software, G.P. (Giannis Papadopoulos) and D.K.; validation, G.P. (Giannis Papadopoulos) and D.K.; formal analysis, G.P. (Giannis Papadopoulos); investigation, G.P. (Giannis Papadopoulos), D.K., L.K., N.T. and G.P. (Giorgos Panaras); resources, G.P. (Giannis Papadopoulos) and D.K.; data curation, G.P. (Giannis Papadopoulos) and D.K.; writing—original draft preparation, G.P. (Giannis Papadopoulos); writing—review and editing, G.P. (Giorgos Panaras), L.K. and N.T.; visualization, G.P. (Giannis Papadopoulos); supervision, G.P. (Giorgos Panaras); project administration, G.P. (Giorgos Panaras) and L.K.; funding acquisition, G.P. (Giorgos Panaras) and N.T. All authors have read and agreed to the published version of the manuscript.

Funding

This research received no external funding.

Institutional Review Board Statement

Approval for the study was not required in accordance with local/national legislation (Law 4957/2022, Government Gazette A’ 141/21-7-2022, Hellenic Republic).

Informed Consent Statement

Informed consent was obtained from all subjects involved in the study.

Data Availability Statement

Dataset available on request from the authors.

Conflicts of Interest

The authors declare no conflicts of interest.

Abbreviations

The following abbreviations are used in this manuscript:
ACAir conditioning
ACHAir change rate
ADuBody surface area
AHUAir handling unit
C1Maximum concentration during period of time
C0Minimum concentration during period of time
CinIndoor concentration
CoutOutdoor concentration
CARDClean Air Delivery Rate
DDiameter
EEEnergetic equivalent
HVACHeating, Ventilation and Air Conditioning
IAQIndoor air quality
IEQIndoor environmental quality
MMetabolic rate
PMVPredicted Mean Vote
PMParticular matter
PM2.5Particles with diameters generally 2.5 μm and smaller
PM10particles with diameters generally 10 μm and smaller
PVPersonalized ventilation
PPDPredicted Percentage of Dissatisfied
QsVentilation rate
RQRespiratory quotient
TaAir temperature
TAThermal acceptance
TcComfort temperature
TgGlobe temperature
TmrtMean radiant temperature
TopOperative temperature
TPThermal preference
TSENSThermal sensation
TSVThermal sensation vote
VCO2Carbon dioxide output
VOOxygen consumption
VOCVolatile organic compounds
αRegression coefficient
ΔtTime period
εgGlobe emissivity

References

  1. Fan, X.; Shao, H.; Sakamoto, M.; Kuga, K.; Lan, L.; Wyon, D.P.; Ito, K.; Bivolarova, M.P.; Liao, C.; Wargocki, P. The Effects of Ventilation and Temperature on Sleep Quality and Next-Day Work Performance: Pilot Measurements in a Climate Chamber. Build. Environ. 2022, 209, 108666. [Google Scholar] [CrossRef]
  2. Pisello, A.L.; Pigliautile, I.; Andargie, M.; Berger, C.; Bluyssen, P.M.; Carlucci, S.; Chinazzo, G.; Deme Belafi, Z.; Dong, B.; Favero, M.; et al. Test Rooms to Study Human Comfort in Buildings: A Review of Controlled Experiments and Facilities. Renew. Sustain. Energy Rev. 2021, 149, 111359. [Google Scholar] [CrossRef]
  3. Jiang, J.; Burgholz, T.M.; Rewitz, K.; Streblow, R.; Müller, D. Development of the CoSIE Lab: An Advanced Laboratory for Multi-Domain Indoor Environmental Quality Research. Indoor Environ. 2025, 2, 100120. [Google Scholar] [CrossRef]
  4. Najafi Ziarani, N.; Cook, M.J.; O’Sullivan, P.D. Experimental Evaluation of Airflow Guiding Components for Wind-Driven Single-Sided Natural Ventilation: A Comparative Study in a Test Chamber. Energy Build. 2023, 300, 113627. [Google Scholar] [CrossRef]
  5. Amai, H.; Tanabe, S.; Akimoto, T.; Genma, T. Thermal Sensation and Comfort with Different Task Conditioning Systems. Build. Environ. 2007, 42, 3955–3964. [Google Scholar] [CrossRef]
  6. Chun, C.; Kwok, A.; Mitamura, T.; Miwa, N.; Tamura, A. Thermal Diary: Connecting Temperature History to Indoor Comfort. Build. Environ. 2008, 43, 877–885. [Google Scholar] [CrossRef]
  7. Jin, Q.; Li, X.; Duanmu, L.; Shu, H.; Sun, Y.; Ding, Q. Predictive Model of Local and Overall Thermal Sensations for Non-Uniform Environments. Build. Environ. 2012, 51, 330–344. [Google Scholar] [CrossRef]
  8. Gao, S.; Yang, L.; Li, Y.; Liu, S.; Zhang, H.; Arens, E.; Zhai, Y. Gender and Age Effects on Metabolic Rates of Office Work, Housework, and Different Walking Speeds. Energy Build. 2023, 298, 113551. [Google Scholar] [CrossRef]
  9. Chen, M.; Farahani, A.V.; Kilpeläinen, S.; Kosonen, R.; Younes, J.; Ghaddar, N.; Ghali, K.; Melikov, A.K. Thermal Comfort Chamber Study of Nordic Elderly People with Local Cooling Devices in Warm Conditions. Build. Environ. 2023, 235, 110213. [Google Scholar] [CrossRef]
  10. Anand, V.; Sendhil, D.; Rajasekar, E. Estimating the Metabolic Rate and Associated Physiological Response for Indian Subjects through Climate Chamber Experiments. Build. Environ. 2022, 207, 108466. [Google Scholar] [CrossRef]
  11. Dong, Y.; Shi, Y.; Liu, Y.; Rupp, R.F.; Toftum, J. Perceptive and Physiological Adaptation of Migrants with Different Thermal Experiences: A Long-Term Climate Chamber Experiment. Build. Environ. 2022, 211, 108727. [Google Scholar] [CrossRef]
  12. Jia, X.; Wang, J.; Zhu, Y.; Ji, W.; Cao, B. Climate Chamber Study on Thermal Comfort of Walking Passengers with Elevated Ambient Air Velocity. Build. Environ. 2022, 218, 109100. [Google Scholar] [CrossRef]
  13. Jia, X.; Wang, J.; Zhu, Y.; Ji, W.; Cao, B. Climate Chamber Study on Thermal Comfort of Walking Passengers at Different Moving Speeds. Build. Environ. 2022, 224, 109540. [Google Scholar] [CrossRef]
  14. Liu, X.; Liu, S.; Zhang, H.; Ye, T.; Na, Y.; Zheng, W. An Investigation of College Students on Metabolic Rate Considering Activity Intensity, Ambient Temperature and Clothing Insulation. Build. Environ. 2023, 245, 110865. [Google Scholar] [CrossRef]
  15. Ji, W.; Luo, M.; Cao, B.; Zhu, Y.; Geng, Y.; Lin, B. A New Method to Study Human Metabolic Rate Changes and Thermal Comfort in Physical Exercise by CO2 Measurement in an Airtight Chamber. Energy Build. 2018, 177, 402–412. [Google Scholar] [CrossRef]
  16. ANSI/ASHRAE Standard 55-2023; Thermal Environmental Conditions for Human Occupancy. ANSI/ASHRAE: Atlanta, GA, USA, 2023.
  17. EN ISO 7730; Ergonomics of the Thermal Environment—Analytical Determination and Interpretation of Thermal Comfort Using Calculation of the PMV and PPD Indices and Local Thermal Comfort Criteria. CEN: Brussels, Belgium, 2005.
  18. Yang, Y.; Li, B.; Liu, H.; Tan, M.; Yao, R. A Study of Adaptive Thermal Comfort in a Well-Controlled Climate Chamber. Appl. Therm. Eng. 2015, 76, 283–291. [Google Scholar] [CrossRef]
  19. Zhou, X.; Ouyang, Q.; Zhu, Y.; Feng, C.; Zhang, X. Experimental Study of the Influence of Anticipated Control on Human Thermal Sensation and Thermal Comfort. Indoor Air 2014, 24, 171–177. [Google Scholar] [CrossRef]
  20. Zhou, X.; Guo, D.; Chen, C.; Deng, Y.; Liu, G. Thermal Sensation and Physiological Responses to Intermittent Solar Radiation in a Vehicle-Oriented Climatic Chamber Experiment. Build. Environ. 2026, 290, 114209. [Google Scholar] [CrossRef]
  21. Bogdan, A.; Łuczak, A.; Chludzińska, M.; Zwolińska, M. The Effect of Personalized Ventilation on Work Productivity. Int. J. Vent. 2012, 11, 91–102. [Google Scholar] [CrossRef]
  22. Wang, H.; Hu, S.; Liu, G.; Li, A. Experimental Study of Human Thermal Sensation under Hypobaric Conditions in Winter Clothes. Energy Build. 2010, 42, 2044–2048. [Google Scholar] [CrossRef]
  23. Fan, Y.; Liu, J.; Zhao, L.; Wang, C.; Moon, D.; Song, S. Study on the Test Accuracy of the High-Air-Volume Purifier under Different Test Chamber Volumes. J. Clean. Prod. 2024, 448, 141684. [Google Scholar] [CrossRef]
  24. Zeng, Y.; Heidarinejad, M.; Stephens, B. Evaluation of an In-Duct Bipolar Ionization Device on Particulate Matter and Gas-Phase Constituents in a Large Test Chamber. Build. Environ. 2022, 213, 108858. [Google Scholar] [CrossRef]
  25. Rajapakse, M.Y.; Pistochini, T.E.; Borras, E.; McCartney, M.M.; Davis, C.E. Controlled Air Exchange Rate Method to Evaluate Reduction of Volatile Organic Compounds by Indoor Air Cleaners. Chemosphere 2023, 313, 137528. [Google Scholar] [CrossRef]
  26. Akamatsu, N.; Sugano, S.; Amada, K.; Tomita, N.; Iwaizumi, H.; Takeda, Y.; Wargocki, P.; Olesen, B.W.; Tanabe, S. Effects of a Gas-Phase Air Cleaner in Removing Human Bioeffluents and Improving Perceived Air Quality. Build. Environ. 2024, 257, 111540. [Google Scholar] [CrossRef]
  27. Li, X.; Blatchley, E.R. Validation of In-Room UV-C-Based Air Cleaners. Indoor Air 2023, 2023, 1–14. [Google Scholar] [CrossRef]
  28. Deng, L.; Deng, Q. The Basic Roles of Indoor Plants in Human Health and Comfort. Environ. Sci. Pollut. Res. 2018, 25, 36087–36101. [Google Scholar] [CrossRef]
  29. Law, C.K.; Lai, J.H.K.; Ma, X.D.; Sze-To, G.N. Enhancing Indoor Air Quality: Examination of Formaldehyde Adsorption Efficiency of Portable Air Cleaner Fitted with Chemically-Treated Activated Carbon Filters. Build. Environ. 2024, 263, 111823. [Google Scholar] [CrossRef]
  30. Sankhyan, S.; Clements, N.; Heckman, A.; Hollo, A.K.; Gonzalez-Beltran, D.; Aumann, J.; Morency, C.; Leiden, L.; Miller, S.L. Optimization of a Do-It-Yourself Air Cleaner Design to Reduce Residential Air Pollution Exposure for a Community Experiencing Environmental Injustices. Atmosphere 2023, 14, 1734. [Google Scholar] [CrossRef]
  31. Turner, S.; Cyr, L.; Gross, A.J. The Measurement of Environmental Tobacco Smoke in 585 Office Environments. Environ. Int. 1992, 18, 19–28. [Google Scholar] [CrossRef]
  32. Petrick, L.M.; Sleiman, M.; Dubowski, Y.; Gundel, L.A.; Destaillats, H. Tobacco Smoke Aging in the Presence of Ozone: A Room-Sized Chamber Study. Atmos. Environ. 2011, 45, 4959–4965. [Google Scholar] [CrossRef]
  33. ANSI/ASHRAE Standard 62.1-2022; Ventilation for Acceptable Indoor Air Quality. ANSI/ASHRAE: Atlanta, GA, USA, 2022.
  34. EN 16798-1; Energy Performance of Buildings—Part 1: Indoor Environmental Input Parameters for Design and Assessment of Energy Performance of Buildings Addressing Indoor Air Quality, Thermal Environment, Lighting and Acoustics—Module M1-6. European Standard: Brussels, Belgium, 2018.
  35. ASTM D6245; Standard Guide for Using Indoor Carbon Dioxide Concentrations to Evaluate Indoor Air Quality and Ventilation. ASTM International: West Conshohocken, PA, USA, 2018.
  36. Wang, N.; Müller, T.; Ernle, L.; Bekö, G.; Wargocki, P.; Williams, J. How Does Personal Hygiene Influence Indoor Air Quality? Environ. Sci. Technol. 2024, 58, 9750–9759. [Google Scholar] [CrossRef]
  37. Zhai, Y.; Zhang, H.; Zhang, Y.; Pasut, W.; Arens, E.; Meng, Q. Comfort under Personally Controlled Air Movement in Warm and Humid Environments. Build. Environ. 2013, 65, 109–117. [Google Scholar] [CrossRef]
  38. Melikov, A.; Ivanova, T.; Stefanova, G. Seat Headrest-Incorporated Personalized Ventilation: Thermal Comfort and Inhaled Air Quality. Build. Environ. 2012, 47, 100–108. [Google Scholar] [CrossRef]
  39. Melikov, A.K.; Skwarczynski, M.A.; Kaczmarczyk, J.; Zabecky, J. Use of Personalized Ventilation for Improving Health, Comfort, and Performance at High Room Temperature and Humidity. Indoor Air 2013, 23, 250–263. [Google Scholar] [CrossRef]
  40. Yang, B.; Liu, P.; Liu, Y.; Jin, D.; Wang, F. Assessment of Thermal Comfort and Air Quality of Room Conditions by Impinging Jet Ventilation Integrated with Ductless Personalized Ventilation. Sustainability 2022, 14, 12526. [Google Scholar] [CrossRef]
  41. Kuga, K.; Ito, K.; Wargocki, P. The Effects of Warmth and CO2 Concentration, with and without Bioeffluents, on the Emission of CO2 by Occupants and Physiological Responses. Indoor Air 2021, 31, 2176–2187. [Google Scholar] [CrossRef]
  42. Wu, Z.; Li, N.; Lan, L.; Wargocki, P. The Effect of Inhaled Air Temperature on Thermal Comfort, Perceived Air Quality, Acute Health Symptoms and Physiological Responses at Two Ambient Temperatures. Indoor Air 2022, 32, e13092. [Google Scholar] [CrossRef]
  43. Zhang, H.; Arens, E.; Kim, D.; Buchberger, E.; Bauman, F.; Huizenga, C. Comfort, Perceived Air Quality, and Work Performance in a Low-Power Task–Ambient Conditioning System. Build. Environ. 2010, 45, 29–39. [Google Scholar] [CrossRef]
  44. ISO 16890-1:2016; Part 1: Technical Specifications, Requirements and Classification System Based upon Particulate Matter Efficiency (ePM). International Standardisation Organisation: Brussels, Belgium, 2016.
  45. Zouloumis, L.; Ploskas, N.; Taousanidis, N.; Panaras, G. Smart Thermostat Development and Validation on an Environmental Chamber Using Surrogate Modelling. Energies 2025, 18, 3433. [Google Scholar] [CrossRef]
  46. ISO 7726:2001; Ergonomics of the Thermal Environment—Instruments for Measuring Physical Quantities. International Standardisation Organisation: Brussels, Belgium, 2001.
  47. Du, B. A formula to estimate the approximate surface area if height and weight be known. Arch. Intern. Med. 1916, 17, 863–871. [Google Scholar]
  48. Frontczak, M.; Wargocki, P. Literature Survey on How Different Factors Influence Human Comfort in Indoor Environments. Build. Environ. 2011, 46, 922–937. [Google Scholar] [CrossRef]
  49. Griffiths, I. Thermal Comfort in Buildings with Passive Solar Features, Field Studies; Commission of the European Communities: Brussels, Belgium, 1990. [Google Scholar]
  50. Humphreys, M.A.; Rijal, H.B.; Nicol, J.F. Updating the Adaptive Relation between Climate and Comfort Indoors; New Insights and an Extended Database. Build. Environ. 2013, 63, 40–55. [Google Scholar] [CrossRef]
  51. Wu, Y.; Jiang, A.; Liu, H.; Li, B.; Kosonen, R. Climate Chamber Investigation of the Effect of Indoor Thermal Histories on Thermal Adaptation in Different Seasons. Energy Built Environ. 2024, 5, 455–463. [Google Scholar] [CrossRef]
  52. De Dear, R.J.; Brager, G.S. Thermal Comfort in Naturally Ventilated Buildings: Revisions to ASHRAE Standard 55. Energy Build. 2002, 34, 549–561. [Google Scholar] [CrossRef]
  53. Uddin, M.N.; Lee, M.; Cui, X.; Zhang, X.; Hasan, T.; Koo, C.; Hong, T. Thermal and Visual Comforts of Occupants for a Naturally Ventilated Educational Building in Low-Income Economies: A Machine Learning Approach. J. Build. Eng. 2024, 94, 110015. [Google Scholar] [CrossRef]
  54. Papadopoulos, G.; Tolis, E.I.; Panaras, G. IEQ Assessment in Free-Running University Classrooms. Sci. Technol. Built Environ. 2022, 28, 823–842. [Google Scholar] [CrossRef]
  55. Zaki, S.A.; Damiati, S.A.; Rijal, H.B.; Hagishima, A.; Abd Razak, A. Adaptive Thermal Comfort in University Classrooms in Malaysia and Japan. Build. Environ. 2017, 122, 294–306. [Google Scholar] [CrossRef]
  56. Fang, Z.; Zhang, S.; Cheng, Y.; Fong, A.M.L.; Oladokun, M.O.; Lin, Z.; Wu, H. Field Study on Adaptive Thermal Comfort in Typical Air Conditioned Classrooms. Build. Environ. 2018, 133, 73–82. [Google Scholar] [CrossRef]
  57. Chai, Q.; Wang, H.; Zhai, Y.; Yang, L. Using Machine Learning Algorithms to Predict Occupants’ Thermal Comfort in Naturally Ventilated Residential Buildings. Energy Build. 2020, 217, 109937. [Google Scholar] [CrossRef]
  58. Du, X.; Li, B.; Liu, H.; Yang, D.; Yu, W.; Liao, J.; Huang, Z.; Xia, K. The Response of Human Thermal Sensation and Its Prediction to Temperature Step-Change (Cool-Neutral-Cool). PLoS ONE 2014, 9, e104320. [Google Scholar] [CrossRef]
  59. Jiang, A.; Cheng, Y.; Wu, Y.; Cui, H.; Li, G.; Liu, H.; Li, B. Effect of Temperature Step-Changes and Ramps on Physiological and Psychological Responses of Occupants in Office Buildings in Summer. Build. Environ. 2024, 259, 111631. [Google Scholar] [CrossRef]
  60. Wu, Y.; Zhang, Z.; Liu, H.; Li, B.; Chen, B.; Kosonen, R.; Jokisalo, J. Age Differences in Thermal Comfort and Physiological Responses in Thermal Environments with Temperature Ramp. Build. Environ. 2023, 228, 109887. [Google Scholar] [CrossRef]
  61. Indraganti, M.; Ooka, R.; Rijal, H.B. Field Investigation of Comfort Temperature in Indian Office Buildings: A Case of Chennai and Hyderabad. Build. Environ. 2013, 65, 195–214. [Google Scholar] [CrossRef]
  62. Jindal, A. Investigation and Analysis of Thermal Comfort in Naturally Ventilated Secondary School Classrooms in the Composite Climate of India. Archit. Sci. Rev. 2019, 62, 466–484. [Google Scholar] [CrossRef]
  63. Fang, Z.; Guo, Z.; Chen, W.; Wu, H.; Zheng, Z. Experimental Investigation of Indoor Thermal Comfort under Different Heating Conditions in Winter. Buildings 2022, 12, 2232. [Google Scholar] [CrossRef]
  64. Lamberti, G.; Leccese, F.; Salvadori, G. Analysis of the Interplay between Indoor Air Quality and Thermal Comfort in University Classrooms for Enhanced HVAC Control. Energies 2024, 17, 5053. [Google Scholar] [CrossRef]
  65. Trebilcock, M.; Soto-Muñoz, J.; Yañez, M.; Figueroa-San Martin, R. The Right to Comfort: A Field Study on Adaptive Thermal Comfort in Free-Running Primary Schools in Chile. Build. Environ. 2017, 114, 455–469. [Google Scholar] [CrossRef]
  66. Guo, Y.; Wang, Y. Investigative Study on Adaptive Thermal Comfort in Office Buildings with Evaporative Cooling Systems (ECS) under Dry Hot Climate. Buildings 2022, 12, 1827. [Google Scholar] [CrossRef]
  67. Rijal, H. Investigation of Comfort Temperature and Occupant Behavior in Japanese Houses during the Hot and Humid Season. Buildings 2014, 4, 437–452. [Google Scholar] [CrossRef]
  68. Papadopoulos, G.; Nikolentzos, A.; Tolis, E.I.; Panaras, G. Theoretical and Experimental Investigation of Ventilation Rates and Their Relation with IAQ and Thermal Comfort in University Classrooms during SARS-COV-2 Pandemic. IOP Conf. Ser. Earth Environ. Sci. 2023, 1196, 012094. [Google Scholar] [CrossRef]
  69. Rawat, N.; Kumar, P. Assessing the Impact of Air Purifier and Scheduled Natural Ventilation on Pollution-Ventilation Nexus in a near Highway Infant School. J. Build. Eng. 2024, 86, 108813. [Google Scholar] [CrossRef]
  70. Nandasena, S.; Wickremasinghe, A.R.; Lee, K.; Sathiakumar, N. Indoor Fine Particle (PM2.5) Pollution Exposure Due to Secondhand Smoke in Selected Public Places of Sri Lanka. Am. J. Ind. Med. 2012, 55, 1129–1136. [Google Scholar] [CrossRef] [PubMed]
  71. Chan, W.; Lee, S.-C.; Li, D.; Chen, X.K. Cigarette Induced PM2.5 in Hotel Rooms: An Assessment of the Effectiveness of Management’s Mitigating Measures. Int. J. Hosp. Manag. 2017, 60, 42–47. [Google Scholar] [CrossRef]
  72. Yan, S.; Liu, C.; Hou, L.; Wang, B.; Zhang, Y. A New Filterless Indoor Air Purifier for Particulate Matter and Bioaerosol Based on Heterogeneous Condensation. Environ. Res. 2023, 218, 115034. [Google Scholar] [CrossRef] [PubMed]
  73. Ren, Y.-F.; Huang, Q.; Marzouk, T.; Richard, R.; Pembroke, K.; Martone, P.; Venner, T.; Malmstrom, H.; Eliav, E. Effects of Mechanical Ventilation and Portable Air Cleaner on Aerosol Removal from Dental Treatment Rooms. J. Dent. 2021, 105, 103576. [Google Scholar] [CrossRef]
  74. Jehn, M.L.; Andino, J.M.; Russell, B.; Rana, V.; Akter, S.; Creed, M.A.; Sodhi, H.; Holmes, B.; Palit, T.; Wani, J.; et al. Effectiveness of Do-It-Yourself Air Cleaners in Reducing Exposure to Respiratory Aerosols in US Classrooms: A Longitudinal Study of Public Schools. Build. Environ. 2024, 258, 111603. [Google Scholar] [CrossRef]
  75. Tchounwou, P.B. Environmental Research and Public Health. Int. J. Environ. Res. Public. Health 2004, 1, 1–2. [Google Scholar] [CrossRef]
  76. Schellen, L.; Van Marken Lichtenbelt, W.D.; Loomans, M.G.L.C.; Toftum, J.; De Wit, M.H. Differences between Young Adults and Elderly in Thermal Comfort, Productivity, and Thermal Physiology in Response to a Moderate Temperature Drift and a Steady-State Condition: Differences between Young Adults and Elderly in Thermal Comfort, Productivity, and Thermal Physiology. Indoor Air 2010, 20, 273–283. [Google Scholar] [CrossRef] [PubMed]
  77. Ebrahimifakhar, A.; Poursadegh, M.; Hu, Y.; Yuill, D.P.; Luo, Y. A Systematic Review and Meta-Analysis of Field Studies of Portable Air Cleaners: Performance, User Behavior, and by-Product Emissions. Sci. Total Environ. 2024, 912, 168786. [Google Scholar] [CrossRef]
  78. Lin, Y.; Wang, J.; Yang, W.; Tian, L.; Candido, C. A Systematic Review on COVID-19 Related Research in HVAC System and Indoor Environment. Energy Built Environ. 2024, 5, 970–983. [Google Scholar] [CrossRef]
  79. Lin, Y.; Chen, L.; Jiang, L.; Huang, M. Recent Advances in Filter Materials for Efficient Photodynamic Inactivation of Pathogens in the Air. J. Environ. Chem. Eng. 2024, 12, 114877. [Google Scholar] [CrossRef]
  80. Papadopoulos, G.; Panaras, G. Experimental and Simulation Analysis of IEQ and Energy Demand in an Office Building in Northern Greece. E3S Web Conf. 2025, 669, 01001. [Google Scholar] [CrossRef]
  81. He, J.; Liu, Y.; Wu, H.; Liu, Y. Association of facial infrared thermography with thermal comfort and cognitive performance in summer indoor environments. Energy Built Environ. 2025, in press. [Google Scholar] [CrossRef]
  82. Zhang, W.; Zhang, W.; Xuan, Y. Cognitive Performance under Dynamic Supply Air Modulation: Dual-Objective Balancing of Thermal Comfort and Work Productivity. J. Build. Eng. 2026, 117, 114754. [Google Scholar] [CrossRef]
  83. Alamirah, H.; Tabet Aoul, K.A. Toward Socially-Aware Personal Comfort Models: Integrating Group Dynamics into Building Thermal Management Systems. J. Build. Eng. 2026, 118, 115049. [Google Scholar] [CrossRef]
  84. Chen, H.; Hao, J.-M.; Qin, N.; Cheng, Y.-X.; Cheng, W.-L. Self-Adaptive Wearable Heating with Flexible PTC Material for Personal Thermal Comfort in Cold Stress. Build. Environ. 2026, 289, 114108. [Google Scholar] [CrossRef]
  85. Xu, X.; Ghahramani, A. Real-World Implementation of Personal Thermal Comfort Models in Building Thermal Systems Control: A Systematic Review. Build. Environ. 2026, 290, 114187. [Google Scholar] [CrossRef]
  86. Chatterjee, A.; Khovalyg, D. Dynamic Indoor Thermal Environment Control Using Reinforcement Learning: Balancing Energy Efficiency and Human Well-Being. Eng. Appl. Artif. Intell. 2026, 167, 113846. [Google Scholar] [CrossRef]
Figure 1. Climate chamber: (a) 3D model of the chamber; (b) Chamber façade; (c) Schematic diagram of the controlled climate chamber air handling system (arrows inside the figure indicate the direction of airflow); (d) The interior of the chamber.
Applsci 16 02629 g001
Figure 2. Installed measurement setup: (a) Optical Particle Sizer (TSI Model 3330) and Thermal microclimate sensor (Senseca HD32.1); (b) Air cleaner (WINIX Zero Pro).
Applsci 16 02629 g002
Figure 3. Methodology flow chart of the experimental scenarios.
Applsci 16 02629 g003
Figure 4. Pictures of experimental measurements at the chamber: (a) Metabolic rate measurements by the Breezing Pro device; (b) Participants completing the thermal comfort questionnaires.
Applsci 16 02629 g004
Figure 5. Box-and-whisker plots of PMV values across all experimental scenarios, grouped by ventilation regime.
Applsci 16 02629 g005
Figure 6. Rating scale of point-in-time survey.
Applsci 16 02629 g006
Figure 7. Relationship between PMV and TSV across the examined scenarios.
Applsci 16 02629 g007
Figure 8. Cross-tabulated thermal sensation vote (TSV) and thermal preference (TP) for the chamber.
Applsci 16 02629 g008
Figure 9. Cross-tabulated thermal sensation vote (TSV) and thermal acceptance (TA) for the chamber.
Applsci 16 02629 g009
Figure 10. The frequency distribution of Griffiths’ comfort temperature.
Applsci 16 02629 g010
Figure 11. Box-and-whisker plots of indoor CO2 concentration (ppm) across all experimental scenarios, grouped by ventilation regime.
Applsci 16 02629 g011
Figure 12. PM2.5 concentration (μg/m3) of base scenarios grouped by ventilation regime.
Applsci 16 02629 g012
Figure 13. PM2.5 concentration (μg/m3) of tobacco scenarios grouped by ventilation regime.
Applsci 16 02629 g013
Figure 14. Time series of PM2.5 concentration (μg/m3) during tobacco scenarios (14a, 14b, 15a, 15b, 15c). Red vertical lines indicate transitions between test phases.
Applsci 16 02629 g014
Figure 15. PM10 concentration (μg/m3) of base scenarios grouped by ventilation regime.
Applsci 16 02629 g015
Figure 16. PM10 concentration (μg/m3) of tobacco scenarios grouped by ventilation regime.
Applsci 16 02629 g016
Figure 17. Calculation of infiltration rate using the decay method.
Applsci 16 02629 g017
Figure 18. Calculating the ventilation rate of the climate chamber using balometer equipment.
Applsci 16 02629 g018
Table 1. Specifications of the instruments.
Instrument TypeParameter (s) MeasuredRange/Accuracy
Senseca/Thermal microclimate hd32.1Data logger-
Senseca/TP3207Dry bulb temperature−40 °C…+100 °C/±0.15 °C
Senseca/TP3275Globe thermometer−10 °C…+100 °C/Class 1/3DIN
Senseca/TP3207TRPyranometer0 °C…+600 °C/NTC ± 0.15
Senseca/TP3203Anemometer (hot wire probe)0.1 m/s…5 m/s/±0.2 m/s (0.1…1 m/s) ±0.3 m/s (1…5 m/s)
Senseca/TP3201Wet bulb temperature+4 °C…+80 °C/Class A
Senseca/TP3217RAir temperature, Relative humidity−40 °C…+100 °C, 0…100%RH/Class 1/3DIN, ±2.5%
Onset/Hobo Telaire 7001 with U12-012Air temperature, Relative humidity, CO2−20 °C…+70 °C (T), 5…95% (RH), 0…10,000 ppm (CO2)/±0.5 °C (T), ±5% (RH), ±50 ppm (CO2)
Gill/WindMaster3-Axis Ultrasonic Anemometer0 m/s…50 m/s/±1.5% RMS
TSI/Optical Particle Sizer (OPS) Model 3330Particles0.3…10 μm (particle size range), 0.001…275,000 μg/m3 (Mass concentration range)/5% at 0.5 μm (ISO 21501-1)
Tongdy/G01-CO2-B10C/30CAir temperature, Relative humidity, CO20 °C…+50 °C (T), 5…100% (RH), 0…5000 ppm (CO2)/±0.4 °C (T), ±3% (RH), ±75 ppm (CO2)
Table 2. Experimental scenarios.
ScenarioVentilationHeating OperationPeopleThermal ComfortCO2PM
1aRecirculationOn2-
1b100% air renewalOff2-
2RecirculationOn5-
3100% air renewalOn2-
4RecirculationOn2--
5a100% air renewalOn2-
5b100% air renewalOff2-
6RecirculationOn3-
7aNo ventilationOff2-
7b100% air renewalOn2-
8a100% air renewalOff2-
8b100% air renewalOff2-
9No ventilationOff4-
10100% air renewalOff3-
11aNo ventilationOn4
11bRecirculationOn4
11cRecirculationOn 4
12aNo ventilationOff2
12bRecirculationOn2
12cRecirculationOn2
13a100% air renewalOff4
13bNo ventilationOn4
14aNo ventilationOn 1
14b100% air renewalOn1
14cNo ventilationOff0--
15aAir purifierOn1-
15bAir purifier + 100% air renewalOn1-
15cAir purifier + 100% air renewalOn1-
Table 3. Calculated metabolic rate parameters.
NAgeHeight (m)Weight (kg)VO2 (mL/min)VCO2 (mL/min)Met
1301.90882742280.74
2521.78783302580.75
3301.73682512130.99
4281.70603202401.08
Table 4. Mean measured values of thermal comfort parameters.
ScenarioAir Temperature (°C)Relative Humidity (%)Mean Radiant Temperature (°C)Air Velocity (m/s)Metabolic Rate (W/m2)Clothing (clo)
1a29.0 ± 1.149.4 ± 15.528.8 ± 1.00.13 ± 0.0670 ± 0.00.67 ± 0.10
1b24.6 ± 1.250.9 ± 8.524.1 ± 1.30.13 ± 0.0670 ± 0.00.67 ± 0.10
228.0 ± 0.951.5 ± 6.327.3 ± 1.10.15 ± 0.1170 ± 0.00.55 ± 0.02
321.5 ± 1.345.5 ± 2.121.1 ± 1.40.13 ± 0.0870 ± 0.00.87 ± 0.20
422.5 ± 1.433.2 ± 0.722.5 ± 1.40.13 ± 0.0870 ± 0.00.75 ± 0.03
5a27.3 ± 0.449.5 ± 1.527.3 ± 0.50.13 ± 0.0870 ± 0.00.66 ± 0.09
5b20.8 ± 0.671.3 ± 4.421.3 ± 0.70.13 ± 0.0870 ± 0.00.66 ± 0.09
623.4 ± 1.355.2 ± 6.323.4 ± 1.30.13 ± 0.0570 ± 0.00.84 ± 0.18
7a20.4 ± 0.450.4 ± 0.920.1 ± 0.50.04 ± 0.0170 ± 0.00.77 ± 0.05
7b23.0 ± 0.860.5 ± 11.722.8 ± 0.90.15 ± 0.1170 ± 0.00.77 ± 0.05
8a24.2 ± 0.350.2 ± 0.924.4 ± 0.30.13 ± 0.0870 ± 0.00.58 ± 0.01
8b22.3 ± 1.552.0 ± 5.223.0 ± 1.20.13 ± 0.0870 ± 0.00.58 ± 0.01
923.7 ± 1.458.5 ± 4.623.7 ± 1.40.04 ± 0.0170 ± 0.00.56 ± 0.06
1024.1 ± 0.547.8 ± 1.924.1 ± 0.50.13 ± 0.0870 ± 0.00.49 ± 0.08
11a26.9 ± 0.938.5 ± 1.326.7 ± 0.60.04 ± 0.0451.8 ± 8.90.82 ± 0.08
11b20.7 ± 0.549.5 ± 1.421.2 ± 1.60.15 ± 0.1151.8 ± 8.90.82 ± 0.08
11c25.0 ± 1.538.4 ± 2.724.9 ± 1.70.13 ± 0.0851.8 ± 8.90.82 ± 0.08
12a23.5 ± 2.637.1 ± 3.722.7 ± 3.30.05 ± 0.0260.3 ± 2.50.93 ± 0.03
12b20.5 ± 0.547.4 ± 1.821.2 ± 1.50.13 ± 0.0460.3 ± 2.50.93 ± 0.03
12c23.6 ± 0.838.8 ± 1.423.2 ± 1.20.10 ± 0.0760.3 ± 2.50.93 ± 0.03
13a15.7 ± 0.548.2 ± 1.815.8 ± 0.60.16 ± 0.1051.8 ± 8.90.80 ± 0.06
13b16.3 ± 0.544.1 ± 1.216.3 ± 0.40.04 ± 0.0151.8 ± 8.90.80 ± 0.06
14a23.9 ± 2.833.6 ± 2.123.4 ± 2.90.04 ± 0.0157.8 ± 0.00.95 ± 0.00
14b19.1 ± 1.039.3 ± 0.619.1 ± 1.00.13 ± 0.0657.8 ± 0.00.95 ± 0.00
Disclaimer/Publisher’s Note: The statements, opinions and data contained in all publications are solely those of the individual author(s) and contributor(s) and not of MDPI and/or the editor(s). MDPI and/or the editor(s) disclaim responsibility for any injury to people or property resulting from any ideas, methods, instructions or products referred to in the content.