


Abstract
The catastrophic impact of Hurricane Helene proved that standard FEMA flood maps are often inadequate for assessing risk in complex mountainous terrain. Using Buncombe County, North Carolina, as a case study, this research introduces a replicable framework for siting emergency shelters based on a multi-dimensional Flood Risk Index. By synthesizing HAND-derived inundation data, land-use intensity, and a machine learning-based Socio-Economic Vulnerability Index (SEVI), we mapped the intersection of hazard and vulnerability. Our analysis reveals a significant misalignment—a large portion of the current shelter network sits in high-risk zones, while safer upland corridors in the north and west remain underutilized. This study delivers a data-driven roadmap for disaster preparedness, ensuring that future shelter placement is not only safe from terrain-driven floods but also strategically and equitably located.
1. Introduction
Hurricane Helene produced record-breaking rainfall and extensive inland flooding across Western North Carolina in September 2024. In Buncombe County, modeled inundation exceeded FEMA (Federal Emergency Management Agency) 100-year flood boundaries by more than 20 percent, inundating homes, businesses, and critical facilities such as fire stations and shelters [1,2]. The destruction of critical facilities including fire stations and shelters, combined with the severance of transit routes, left thousands of residents stranded and vulnerable. These systemic failures underscore the critical mandate to treat emergency shelters as vital, “hardened” infrastructure that must be strategically sited outside increasingly unpredictable flood risk zones.
Hurricane Helene, the eighth named storm of the 2024 North Atlantic hurricane season, evolved into a Category 4 superstorm before making landfall on 26 September 2024 along Florida’s Big Bend coast, with sustained winds of 235 kmh and higher gusts over the Gulf waters [1]. The storm’s rapid intensification was fueled by anomalously warm Gulf of Mexico waters, exceeding 30 °C, a condition exacerbated by climate-change-induced sea surface temperature rises (ibid). As Helene advanced northward, its interaction with the Appalachian topography triggered an unprecedented orographic rainfall event across Western North Carolina. Integrated Multi-satellite Retrievals for GPM (IMERG) data corroborate this intensity, recording widespread rainfall totals over 254 mm, with localized maxima surpassing 761 mm in Buncombe County locations such as Busick [2].
The storm’s meteorological structure featured the “deadly triad” of storm surge, high winds, and heavy rain, which transitioned into a complex inland flooding system as it moved over land [1]. This triad was particularly devastating in mountainous regions, where orographic lift amplified precipitation, causing flash floods, river overflows, and over 300 landslides in Buncombe County alone (ibid). Between 24 and 29 September 2024, the storm’s slow progression led to prolonged exposure; rainfall rates peaked at 50–76 mm per hour, overwhelming both natural drainage systems and built infrastructure. Based on Height Above Nearest Drainage (HAND) modeling, the local flooding combined with the region’s steep topography resulted in the inundation of 112.59 km2 within Buncombe County, exceeding FEMA’s 100-year flood boundaries by a factor of 1.22 [2].
Hurricane Helene’s impact extended across socio-economic and environmental spheres, triggered by a “hybrid” transition from a coastal to an inland disaster. Extreme winds decimated mature forests throughout the Southeast, obstructing critical emergency routes and causing 148,902 power outages in Buncombe County by late September [1,2]. Using a real-time Decision Support System (DSS) to integrate these cascading failures, researchers highlighted the storm’s unprecedented reach [2]. Ultimately, the event resulted in 219 fatalities and $79 billion in damages, marking it as one of the most destructive hurricanes in U.S. history since 2005 [1].
In Buncombe County, the flood’s impact on decentralized water infrastructure was particularly acute: 1662 of the county’s 35,287 private wells (serving over 4300 residents) were directly inundated. An additional 8188 wells, providing water to more than 21,000 users, were located within a 100 m high-risk buffer, creating a widespread threat of pathogen and chemical contamination. This public health crisis was mirrored by an economic and operational standstill; local businesses, including critical fueling stations and food services, faced indefinite closures. Simultaneously, the inundation of fire stations, coupled with over 300 landslides and the displacement of key bridges, severely compromised the county’s emergency response capacity at the height of the disaster.
Power outages further exacerbated the crisis, with Duke Energy reporting 148,902 affected customers in Buncombe by 29 September 2024 (Ref. [2]). The IMERG data revealed rainfall totals exceeding 254 mm, with peaks above 762 mm in isolated Buncombe areas like Busick, underscoring the storm’s severity. These conditions strained local health departments (LHDs) and the North Carolina Department of Health and Human Services (DHHS), which relied on the DSS to allocate resources effectively. The decade-long collaboration between academic researchers, LHDs, and the DHHS proved critical in providing real-time geospatial intelligence to mitigate the disaster’s multifaceted impacts.
Effective risk assessment and emergency response are essential for managing the impact of Hurricane Helene in Buncombe County, particularly in identifying suitable locations for flood-resilient emergency shelters. Ref. [3] outline risk assessment as a process involving the identification of potential hazards, evaluation of their likelihood and impact, and the development of strategies across all disaster management (DM) phases: prevention, preparedness, response, and recovery (PPRR).
Managing the impacts of Hurricane Helene necessitated a comprehensive application of empirical knowledge spanning the dimensions of what, how, where, who, when, and why to sustain effective disaster management (DM) efforts. This multi-dimensional framework is essential for the strategic designation of shelters in low-hazard zones, directly fostering systemic resilience. By aligning spatial data with community resources, this approach ensures that critical infrastructure can not only withstand extreme events but also adapt and recover rapidly in the face of evolving environmental pressures [3].
Risk assessment was applied through landslide prediction validation post Helene, using machine learning models like Random Forest and logistic regression to map susceptibility based on rainfall, soil type, and distance to faults, identifying 1792 landslides [4]. This highlights the need to integrate multi-hazard data, flooding, landslides, and bridge scouring and shelter placement decisions, ensuring sites avoid high-risk areas. Ref. [5] documented 79 bridge failures in Buncombe, with damage concentrated at abutments due to scour and sediment deposition, emphasizing the importance of assessing assumed flooding potential (AFP) to select elevated, stable locations with accessible evacuation routes. Improved bridge designs to withstand overtopping and debris flows are also recommended (ibid).
Emergency response strategies post Helene relied on real-time coordination, with the DSS by [2] mapping flooded areas and operational shelters to guide displaced populations. However, challenges in stakeholder consensus, as noted by [3], were evident in the uneven shelter distribution, with high-risk areas like Swannanoa Valley over 20 km from the nearest facility. Ref. [6] propose the Disaster Resilience Index (DRI), assessing resilience based on population size, income, and Social Vulnerability Index (SVI), advocating targeted planning in low-income, high-vulnerability zones. This aligns with the project’s goal of designating accessible, resilient shelters, suggesting preemptive site selection in low-risk areas.
The integration of risk assessment with emergency response forms a foundation for future preparedness in Buncombe County. Ref. [3] advocate for proactive resilience-building strategies, while [5] stress post-event structural assessments to inform infrastructure improvements. These insights collectively support the project’s objectives of analyzing flood impacts, designating strategic shelter locations, and developing a blueprint for emergency responders to address both immediate and long-term needs exposed by Hurricane Helene.
In the aftermath of Hurricane Helene, 54 shelters were activated to assist displaced residents; notably, only one facility in Buncombe County was state-operated [7]. This distribution underscores a critical gap in emergency planning: site selection must account for location-specific environmental hazards. Shelters managed by charities or non-governmental organizations (NGOs) often prioritize immediate property availability and proximity to affected populations, occasionally at the expense of comprehensive risk assessment [8].
To address these vulnerabilities, the American Red Cross, in collaboration with FEMA, the US Army Corps of Engineers, and the EPA, published guidelines in 2018 for establishing temporary emergency shelters [9]. These standards explicitly advise against sites susceptible to hurricane-related risks, including storm surge inundation, heavy-rainfall flooding, high winds, and proximity to hazardous materials.
Beyond the US, international strategies offer additional insights into resilient shelter design. Given that the Philippines experiences approximately twenty cyclones annually, the Philippine government (2020) published specialized construction techniques for temporary shelters, utilizing elevated piles and phenolic flooring to mitigate flood risks [10]. While the longest-operating temporary shelter during the Helene response remained active for only 44 days, its brief lifecycle does not diminish its status as critical infrastructure, particularly as such facilities may eventually transition into permanent housing for financially disadvantaged families [11].
Moving beyond the high-level, generalized guidelines provided by the American Red Cross, this study investigates the application of spatial flooding risk modeling and quantitative tools to optimize temporary shelter siting in the aftermath of Hurricane Helene. Most literature on hurricane flood risk analysis is for effects on coastal regions [12,13] except for a recent study by [14].
This study focuses on Buncombe County in Western North Carolina, a region critically impacted by Hurricane Helene on 27 September 2024. The county was among the initial 25 areas designated under the FEMA-4827-DR disaster declaration, as detailed in Governor Roy Cooper’s Revised Damage and Needs Assessment released on 13 December 2024 [15]. Additionally, the study area encompasses the Eastern Band of Cherokee Indians (EBCI) tribal lands, reflecting their geographic proximity and integrated emergency response efforts with local health departments (LHDs).
Centered on the city of Asheville, Buncombe County spans 1087 km2 and supports a population of 469,025 (2020 U.S. Census). The region is characterized by the rugged terrain of the Blue Ridge Mountains, with elevations ranging from 609 m to over 1829 m. This extreme topographic variance significantly amplifies the risk of flash flooding and landslides, presenting unique challenges for emergency shelter siting.
This study employs geospatial analysis to evaluate the spatial relationship between flood hazard zones and emergency shelters, assessing their direct exposure to risk. By integrating hazard data, physical exposure, and socio-economic vulnerability, the research generates a composite Flood Risk Index at the census block group level. This index serves as a benchmark to audit existing shelter locations and identify optimal sites that are elevated, accessible, and equitably distributed. Specifically, the study asks: To what degree are shelters in Buncombe County, North Carolina, situated in high-risk zones, and where should future resilient shelters be located?
The central hypothesis posits that a significant proportion of existing shelters are situated in moderate- to high-risk areas, a consequence of prioritizing proximity to population centers and transit corridors over environmental safety. Conversely, this study anticipates that the most viable sites for relocation are low-hazard zones strategically adjacent to high-vulnerability clusters. Ultimately, this research offers a replicable, evidence-based framework for shelter siting designed to enhance equitable disaster preparedness across Western North Carolina.
2. Materials and Methods
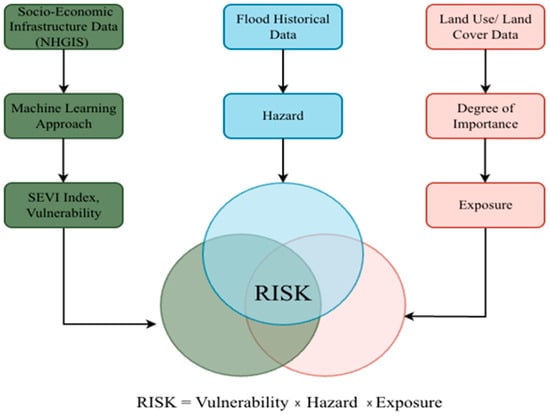
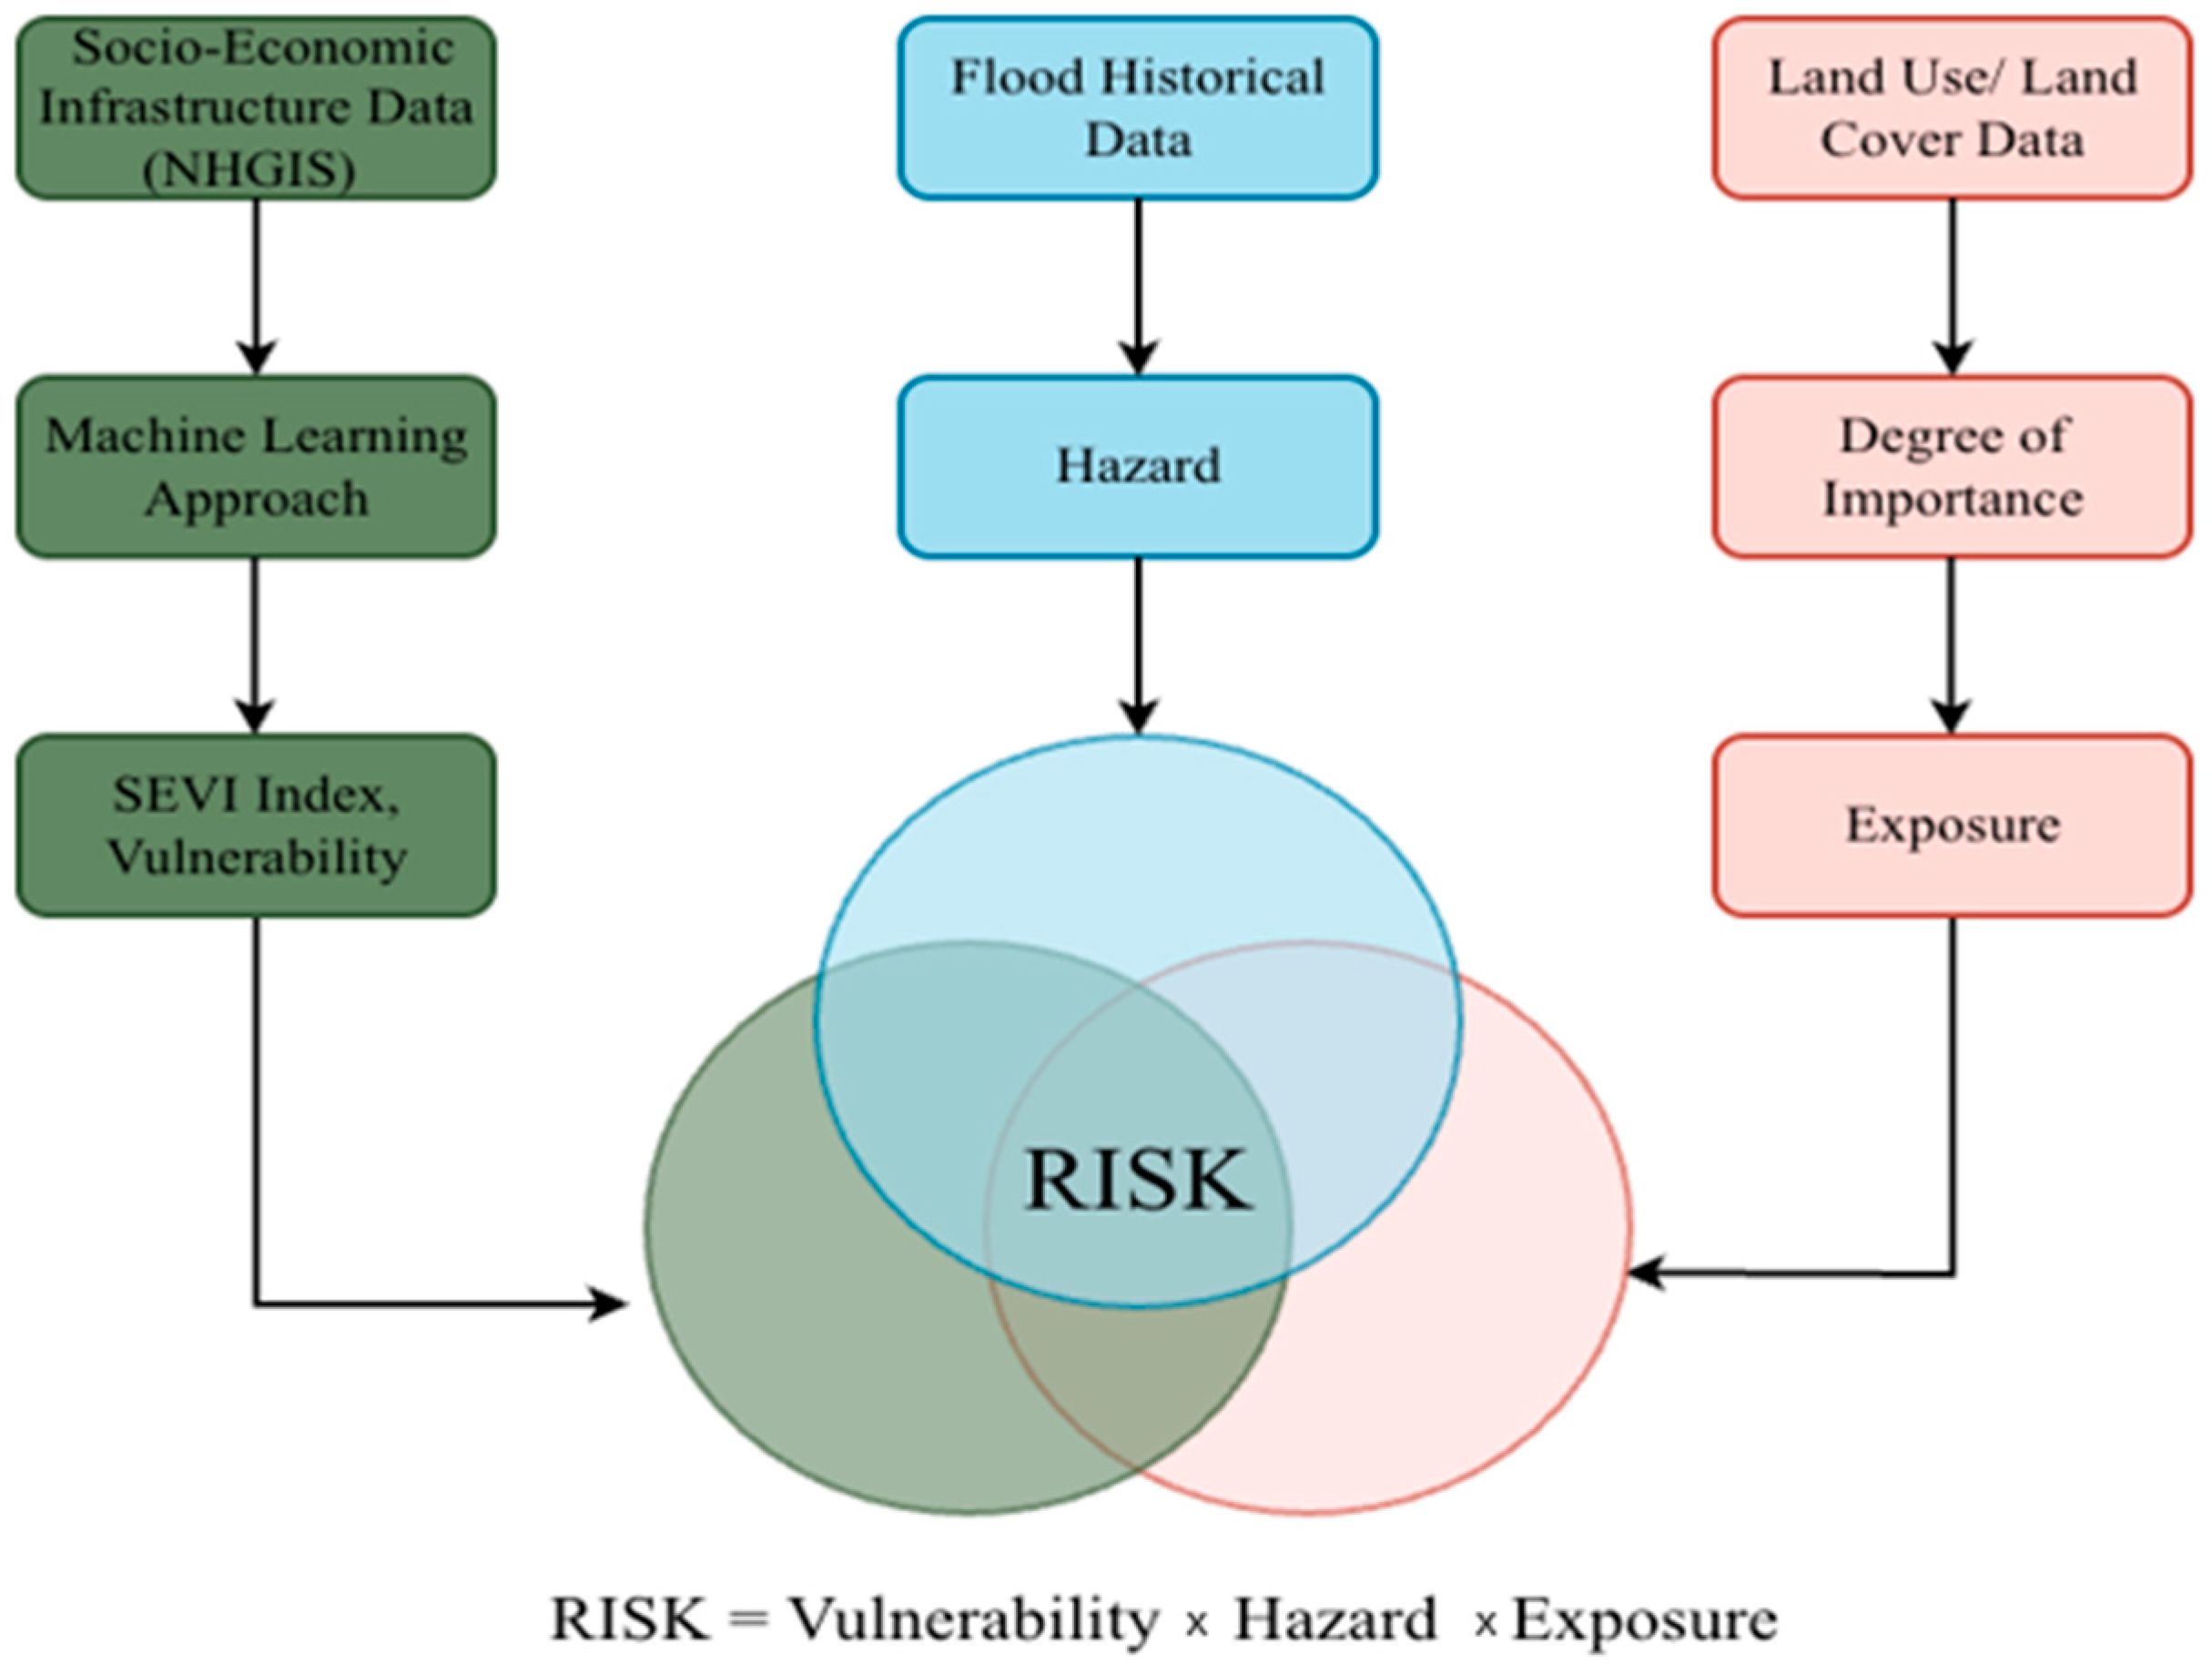
Figure 1 conceptualizes disaster risk as the overlap of hazard, exposure, and vulnerability, emphasizing that risk arises only where all three components coincide. Our methodology is based on the components illustrated in Figure 1 and includes three calculations outlined in the following subsections. This study builds upon and adapts the block-level flood risk assessment methodology proposed by [15], integrating hazard, exposure, and vulnerability into a categorical risk framework. The multiplicative model for risk integration is used as it is the standard framework adopted by major disaster agencies.
Figure 1.
Integrated methodological framework for block-level flood risk assessment. This flowchart illustrates the convergence of three primary components: hazard (derived from historical flood data), vulnerability (represented by the SEVI calculated via a machine learning approach using NHGIS data), and exposure (derived from data on land use and cover). Each color represents the various components of the risk equation: green is for SEVI, Blue if for hazard, and orange is for exposure.
Also shown in Figure 1 is the methodology of how risk is derived by integrating machine learning-based vulnerability (from socio-economic data), hazard information (from historical flood records), and exposure (from land-use importance), following the relationship Risk = Hazard × Vulnerability × Exposure (ibid). Each component in this framework is constructed independently and subsequently standardized to ensure comparability prior to integration. Hazard represents the relative likelihood of flooding based on historical flood occurrence, vulnerability captures socio-economic and infrastructure susceptibility derived using a machine learning-based index, and exposure reflects the spatial distribution and relative importance of land-use and land-cover classes. Through the combination of these components multiplicatively, the framework emphasizes locations where high hazard coincides with both elevated vulnerability and exposure, thereby distinguishing areas of compounded flood risk. This formulation is consistent with established disaster risk definitions and enables spatially explicit identification of high-risk zones suitable for targeted mitigation and shelter-planning analyses.
2.1. Hazard Calculation
To quantify flood hazard exposure from Hurricane Helene at the census block group level in Buncombe County, a spatial analysis workflow was developed in ArcGIS Pro version 3.4 using the HAND-derived flood extent generated by [2]. Their study, “Responding after Hurricane Helene: Rapidly Estimating Impacts to Environmental Health Services in North Carolina,” provided a high-resolution inundation layer calibrated for Western North Carolina using the National Water Model’s maximum one-hour discharge data and the Height Above Nearest Drainage (HAND) approach. The HAND method was optimized for near-real-time flood mapping across mountainous terrain, producing event-specific boundaries that aligned closely with FEMA’s 100-year flood hazard areas (median HAND/FEMA ratio = 1.05) while capturing finer local variations in flood severity.
Building on this dataset, we performed a two-stage workflow consisting of (1) spatial data preparation and (2) a polygon-based overlay analysis to generate normalized hazard scores for each census block group. All spatial datasets were standardized to ensure consistency in coordinate systems and units of measurement. The HAND-derived inundation extent from [2] and the census block group boundaries from TIGER/ACS data were imported and projected to NAD 1983/North Carolina (EPSG: 32119) to support accurate area calculations. The inundation polygons were then dissolved into a single multipart feature representing the full flood extent. Geoprocessing environments were configured so that all subsequent analyses used the same coordinate system and the block group boundary defined the processing extent.
Following preparation, the analysis relied on vector-based overlay operations to quantify the proportion of each block group affected by flooding. The total area of each block group was calculated in square meters using the Calculate Geometry function. The block group layer was intersected with the dissolved flood polygon, producing new features representing only inundated portions. Inundated areas were then aggregated by block group identifiers to obtain the total flooded area within each unit. To compare flood severity across block groups of different sizes, two normalized indicators were derived. First, the percentage of each block group’s land area that was inundated (%Wet) was calculated as follows:
where ΣWet_Area denotes all inundated areas and BlockGroupArea is the study area. The numbers are normalized through division by the total block group area, which is a standard approach in flood hazard studies because it removes scale effects associated with varying polygon sizes and enables direct comparison across administrative units [16,17]. Similar normalization procedures are used in HAND-based flood mapping and impact estimation to quantify the proportion of land subject to inundation [2,18].
Second, a standardized hazard score was generated by rescaling the %Wet values to a 0–5 range using a linear transformation:
This method preserves the proportionality of the original data while converting the continuous %Wet values into a bounded scale standard for GIS-based multi-criteria risk assessments [17]. A 0–5 scale was selected to align with the five-class classification schemes (e.g., Very Low, Low, Moderate, High, Very High) frequently employed in hazard and vulnerability mapping. This categorization enhances interpretability for emergency management stakeholders, allowing for more intuitive decision-making during disaster response planning [16].
Block groups with no overlap with the inundation extent were assigned a hazard score of 0. Resulting values ranged from 0 to 5, where higher scores indicate a greater proportion of land inundated (and therefore higher localized flood hazard) relative to the total area of the block group. This scaling approach creates consistency with spatial risk-mapping frameworks that combine multiple normalized indicators into composite indices [16,17]. Finally, hazard scores were visualized using a five-class graduated color ramp labeled Very Low (0–1) to Very High (4–5).
2.2. Vulnerability Calculation
The degree of susceptibility to being affected by any natural disaster is termed as vulnerability [19]. According to Method 2 explained in [20], they developed a comprehensive block-level flood risk assessment framework that integrates geomorphological, socio-economic, and infrastructure indicators to quantify risk at fine spatial scales. All variables are normalized using min–max scaling and then incorporated into a supervised machine learning model (specifically, a Random Forest classifier) to objectively determine the contribution of each indicator and to classify census blocks into five risk categories ranging from Very Low to Very High. We used the National Historical Geographic Information System (NHGIS), which is based on American Community Survey (ACS) block-group-level data, as the basis for our vulnerability analysis. Each record represents a specific census block group that contains or corresponds to one or more emergency shelters. The dataset includes a broad range of variables covering demographic, socio-economic, infrastructure, and health access characteristics [18]. Key variables include total population, elderly population percentage, disability rate, poverty rate, unemployment, housing tenure (owner vs. renter), vehicle availability, education level, and median income. Environmental and infrastructural layers, such as proximity to hospitals, road density, and flood exposure, are merged with the NHGIS data to create a comprehensive vulnerability profile [18]. Table 1 shows the necessary explanations for why each indicator is important for calculating the Shelter Vulnerability Index (SEVI).
Table 1.
Variables used in Shelter Vulnerability Index (SEVI) calculation; sources of sub-components under each category.
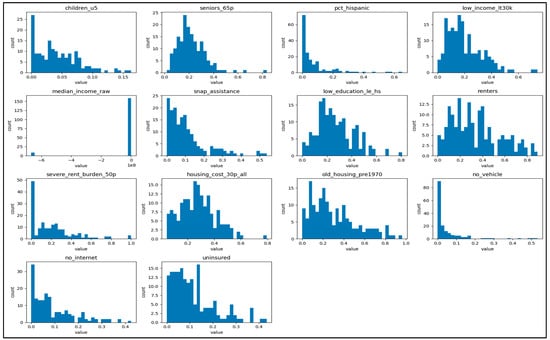
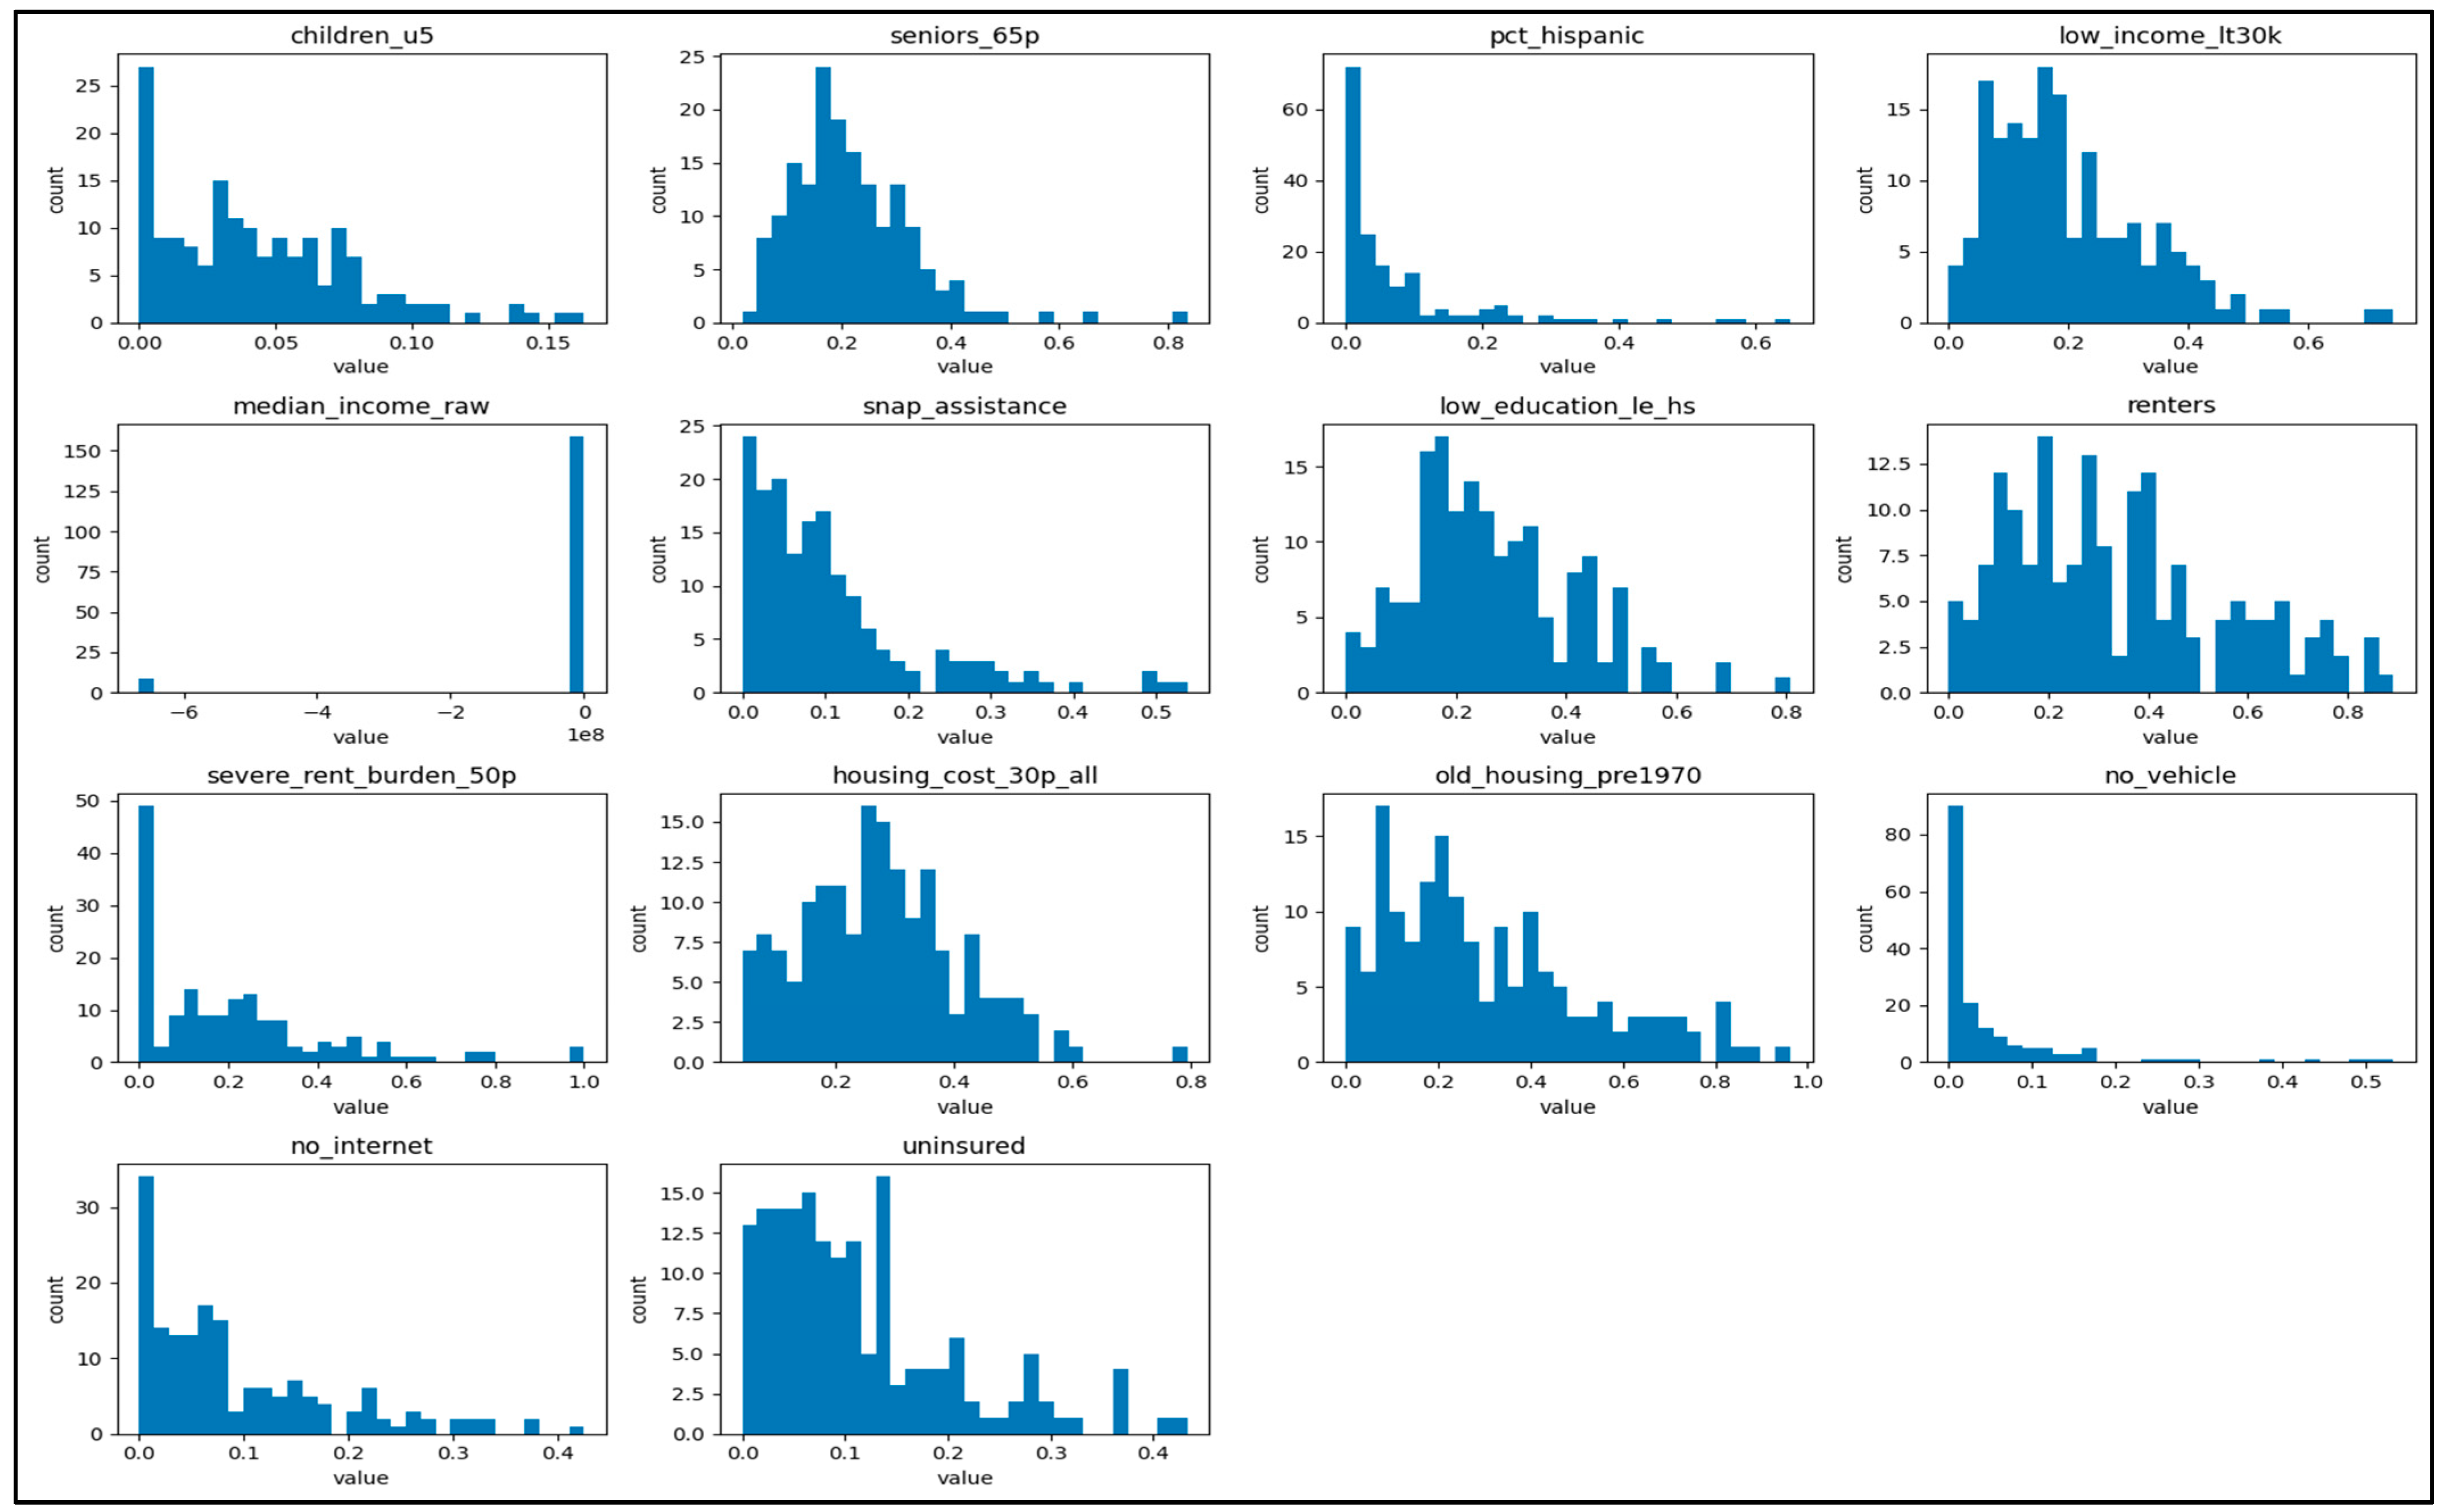
Figure 2 presents a series of histograms illustrating the distribution of key social, economic, and infrastructural variables derived from NHGIS ACS block group data. Each subplot represents one indicator used in computing the Shelter Vulnerability Index (SEVI). The x-axis in each plot shows the normalized value (ranging between 0 and 1 for percentage variables), while the y-axis shows the count of block groups or shelter areas that fall within each range. Together, these histograms provide an overview of the variability and skewness of different vulnerability dimensions within the study region.
Figure 2.
Histogram matrix of the 14 vulnerability indicators included in the study; note that medium household income is the only inverted factor.
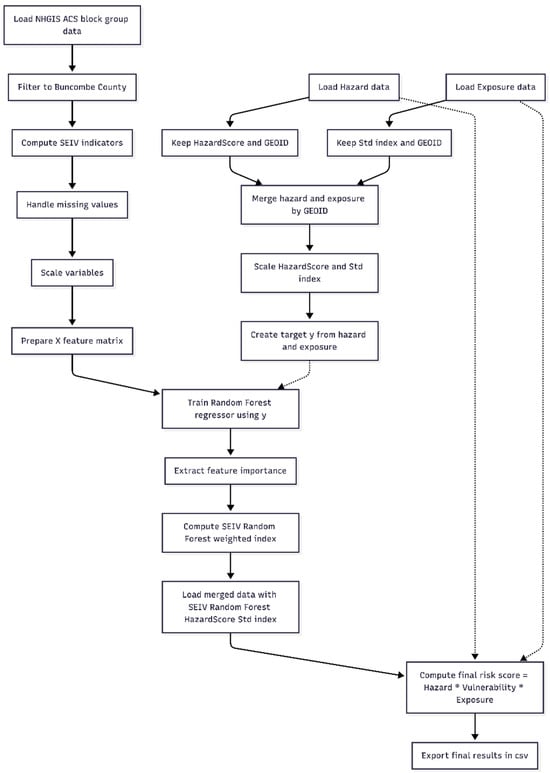
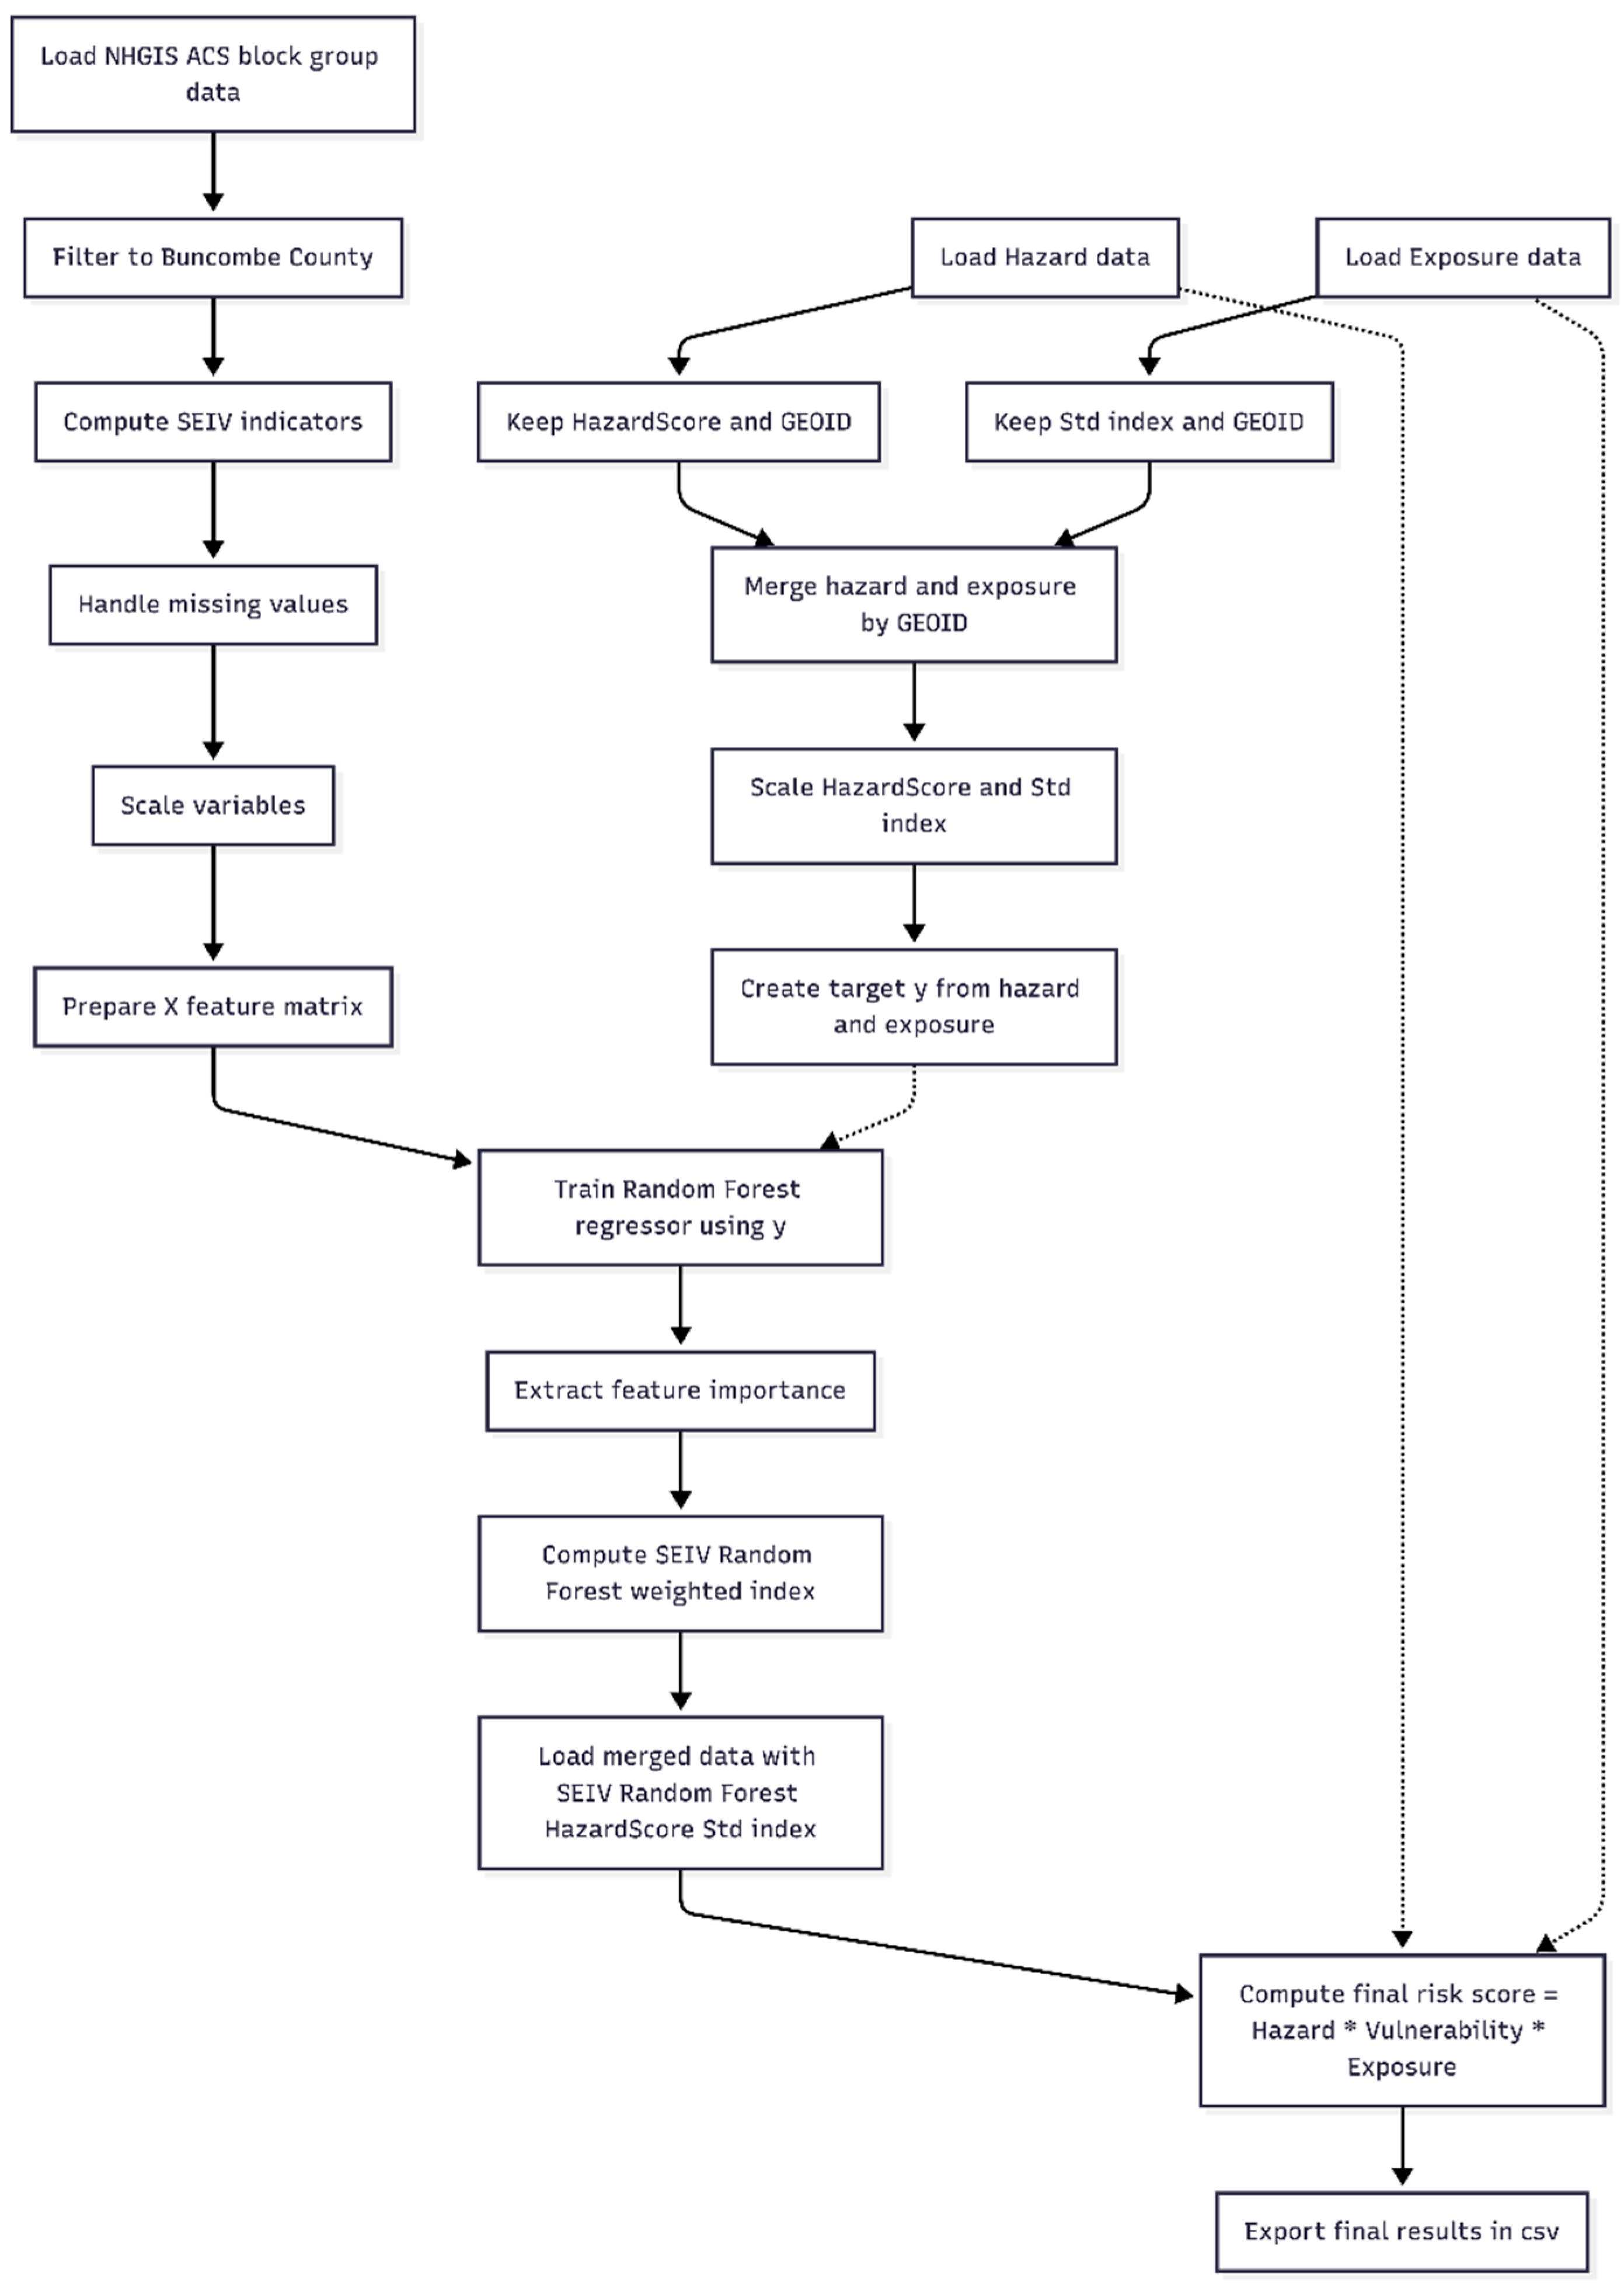
The coding of the Random Forest classifier was performed in Python version 3.12.12 and Scikit-Learn library functions were incorporated. Figure 3 shows the scientific workflow in the Random Forest modeling.
Figure 3.
The schematic of the calculation workflow for the risk score modeling merging the hazard, vulnerability and exposure models. (Solid arrows in figure represent machine learning processes and dashed arrows represent data flow for final score calculation).
It is critical to acknowledge that several variables in the dataset exhibit significant skewness and contain extreme outliers. These statistical irregularities can significantly impact the reliability of the analytical results. For example, median income raw has a massive outlier at −6 × 10⁸ and pc this panic, no vehicle and no internet, are heavily right-skewed. Only seniors_65p, housing_cost_30p_all and centers show more Gaussian (near-normal) distributions. A detailed transformation and sensitivity analysis may be able to identify biased variables. However, such analysis is time-consuming and is not likely to be performed prior to the disaster; hence, it is not reasonable to use for the temporary shelter modeling.
The Shelter Vulnerability Index (SEVI) is calculated using Random Forest, an ensemble machine learning model that operates by aggregating the outputs of multiple decision trees to reach a consensus prediction [18]. There are many other AI and Generative Artificial Intelligence (GenAI) algorithms that are rapidly transforming novel solutions in areas such as medical imaging, drug discovery, and synthetic data and infrastructure generation [21]. The Shelter Vulnerability Index (SEVI) captures complex, non-linear relationships among social, economic, housing, and health variables derived from NHGIS ACS block group data. Using Random Forest modeling, the model operates through an ensemble process that includes the following steps: (1) subsampling, where each tree in the forest is trained on different subsets of data and variables such as income, age, rent burden, and insurance coverage; (2) every individual tree predicts a vulnerability score, and these predictions are then averaged to generate the final SEVI value; and (3) the ensemble approach then reduces variance and prevents overfitting, ensuring the model generalizes well to unseen data while identifying the most influential predictors of vulnerability [1,2]. The resulting SEVI scores are normalized on a scale from 0 to 1, where (1) low scores (→0) indicate lower relative vulnerability and (2) high scores (→1) signal greater social and infrastructural vulnerability within shelter areas.
2.3. Exposure Calculation
In climate risk assessment, exposure refers to the presence of people, infrastructure, and other assets in locations that may be adversely affected by a hazard. In this study, exposure is represented using land-use/land-cover (LULC) characteristics at the census block group level, following the block-level framework developed by [19]. For each block group, the proportion of area occupied by different LULC classes is combined with class-specific Degree of Importance (DI) values that reflect the relative potential for flood-related damage and loss.
We obtained LULC data from North Carolina’s statewide GIS land-cover dataset and clipped to Buncombe County. The dataset, derived from the National Land Cover Database (NLCD), includes classes representing open water; developed/open space; developed low-, medium-, and high-intensity areas; barren land (rock/sand/clay); deciduous, evergreen, and mixed forest; dwarf scrub; grassland/herbaceous; pasture/hay; cultivated crops; woody wetlands; and emergent herbaceous wetlands (Table 2). These classes capture both highly built environments, such as residential, commercial, and transportation corridors, and less developed landscapes, such as forest and agricultural lands, which generally host fewer structures and people at risk.
Table 2.
Land-cover description as defined in the NLCD.
Base DI values were adopted from the land-cover-based exposure scheme used by [19], which in turn builds on earlier applications by [22,23] to assign relative flood exposure weights to different LULC types. Higher DI values were assigned to LULC classes that typically contain dense built assets or critical infrastructure (medium- and high-intensity development), indicating a greater concentration of people and property potentially affected by flooding. Lower DI values were assigned to classes such as open water and forest, which generally contain few exposed structures. Intermediate DI values were used for agricultural and wetland classes, which may include valuable assets but usually have lower structural density than urban cores.
To tailor this scheme to Buncombe County and the North Carolina LULC classification, the published DI values were mapped to the local classes and normalized to a 0-1 scale, where 0 denotes negligible exposure importance and 1 denotes very high exposure importance. For LULC types that did not have a one-to-one counterpart in the original DI tables, DI values were interpolated based on the functional similarity of land-cover classes in terms of surface runoff behavior, structural density, and economic activity. For example, dwarf scrub was treated analogously to shrub/scrub, while pasture/hay and cultivated crops were assigned DI values between those of natural vegetation and developed land.
Using this DI-weighted LULC scheme, an exposure index was calculated for each census block group “i” as follows:
where is exposure of block group “i”, is the DI value for LULC type “k”, is the area occupied by LULC type “k” in block “i”, and is the area of block “i”. This formulation is equivalent to a weighted average of DI values within each block group, such that units dominated by high-DI land covers (e.g., dense development) attain higher exposure scores than those dominated by low-DI covers (e.g., forest or open water), consistent with the approach of [19].
The resulting exposure values were standardized to the [0, 1] range using min–max normalization to ensure comparability across block groups and to align with the normalized hazard and SEVI layers used in the composite Flood Risk Index (Section 2.4). The final exposure surface was then visualized at the block group scale to highlight clusters of highly exposed development and to support subsequent comparison with hazard, vulnerability, and emergency shelter locations.
2.4. Integration of Risk Components
To derive a composite Flood Risk Index (RIi) for Buncombe County, three normalized components, hazard (Hi), exposure (Ei), and socio-economic vulnerability (Vi), were integrated using a multiplicative model:
where “i” denotes the specific census block group. This formulation assumes that areas with simultaneously high values across all three dimensions represent zones of compounded risk, consistent with established multi-hazard disaster frameworks [3,6]. Unlike additive models, this multiplicative approach preserves interaction effects; a near-zero score in any single dimension significantly reduces the overall risk index, while the co-occurrence of high values exponentially amplifies it.
To ensure unit comparability, each component raster was rescaled to a standardized range of [0, 1] prior to integration. The layers were processed using the Raster Calculator in ArcGIS Pro, generating a continuous flood risk surface. This surface was subsequently aggregated to the block group level using Zonal Statistics.
To facilitate spatial analysis and shelter planning, the resulting values were classified into five ordinal categories using the Jenks Natural Breaks optimization: Very Low, Low, Moderate, High and Very High. This classification identifies critical block groups where high environmental hazards intersect with vulnerable populations, providing a prioritized map for emergency infrastructure intervention.
3. Results and Discussion
3.1. Hazard Map: Flood Extent and Intensity
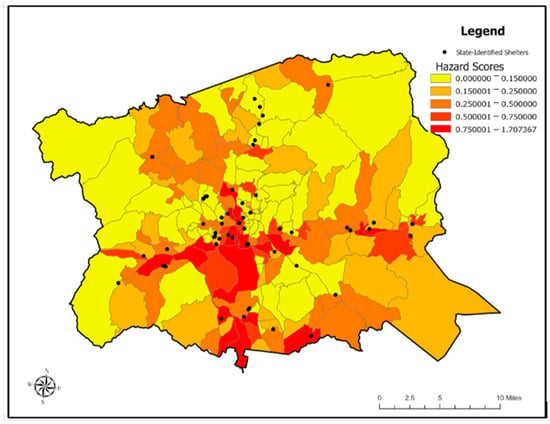
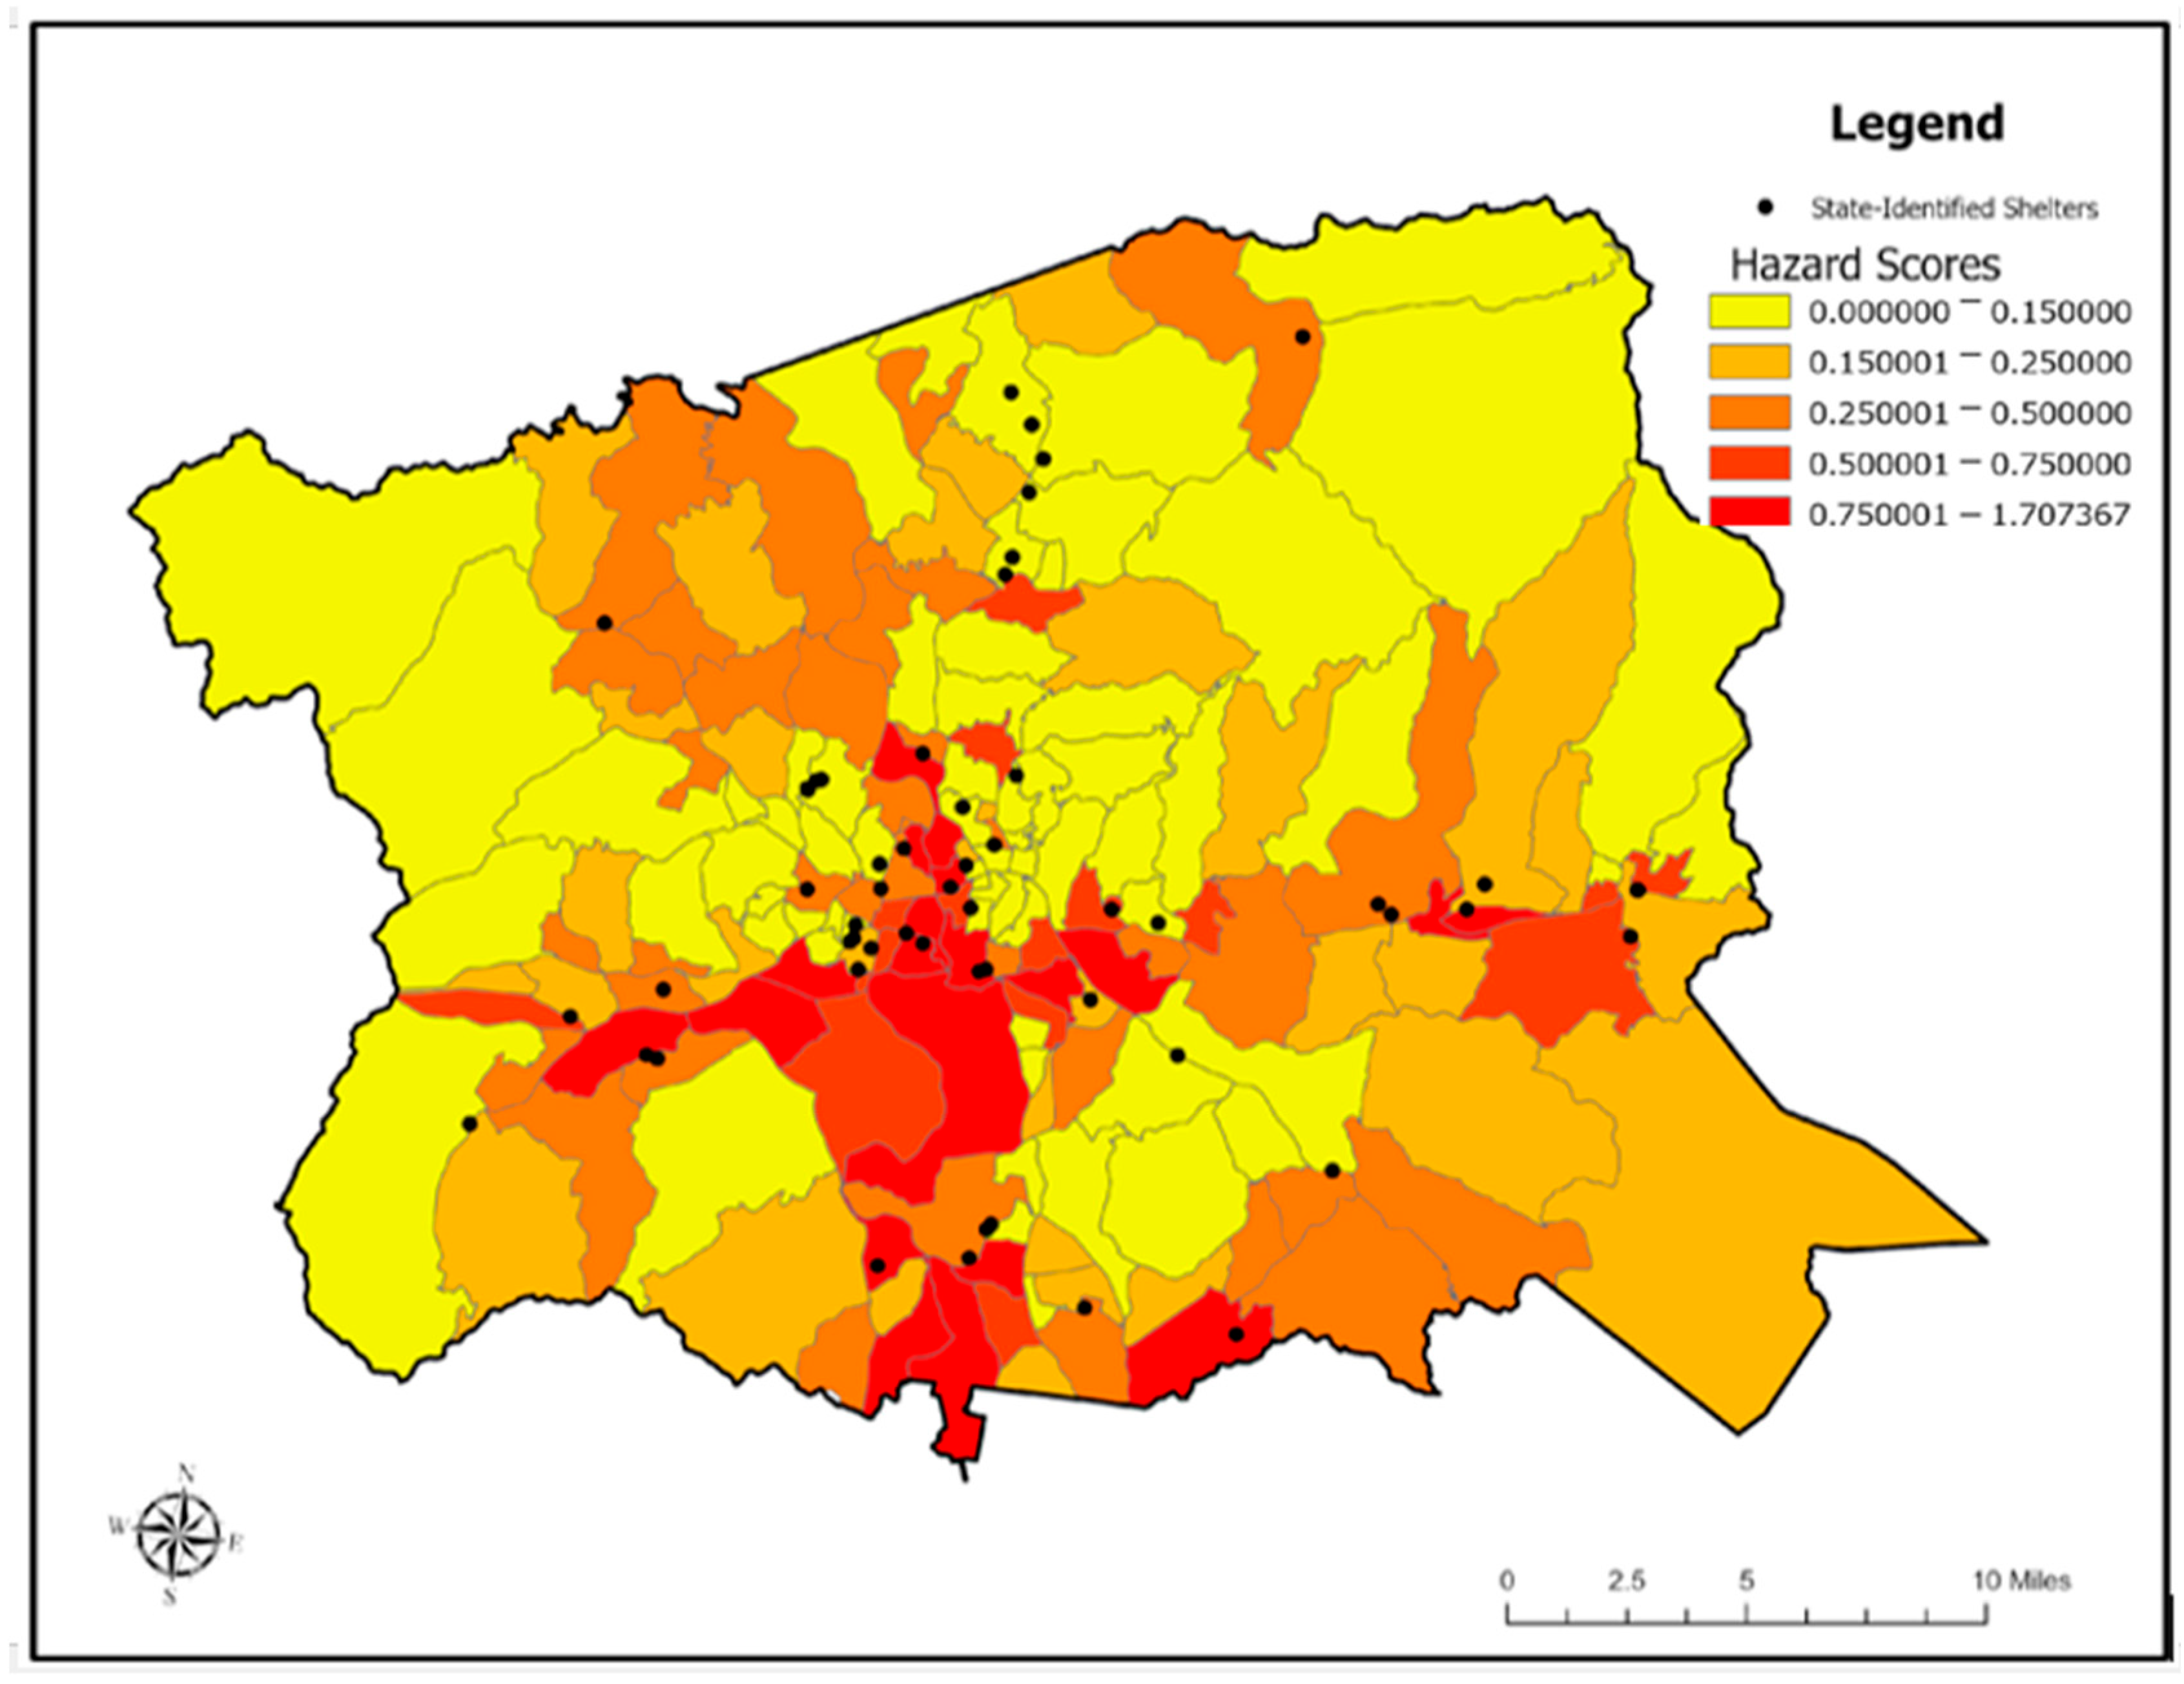
Figure 4 shows the distribution of flood hazard scores derived from the proportion of inundated land within each census block group. The highest hazard values were concentrated along the southern and central floodplain corridors, particularly near the Swannanoa River, Hominy Creek, and the lower French Broad River. These low-elevation valley bottoms are consistent with areas where fluvial flooding is typically amplified due to confined topography and limited overbank storage [24,25]. In these corridors, modeled flood extents exceeded FEMA’s 100-year boundaries by more than 20%, aligning with HAND-based comparisons documented by [2,18], who report that HAND models frequently capture greater floodplain connectivity than static FEMA maps during extreme rainfall events.
Figure 4.
Distribution of flood hazard scores by census block group in Buncombe County. This map illustrates the spatial variation in calculated hazard intensities, with scores ranging from 0.00 (low risk) to over 1.70 (extreme risk). The overlay of state-identified shelters (black points) highlights critical facilities located within high-hazard zones (red), providing a visual baseline for identifying areas where structural mitigation or shelter relocation may be necessary.
Northern and higher-elevation zones exhibited minimal inundation, which is a reflection of the strong control of orographic gradients on flood distribution in mountain watersheds [25]. The southern municipalities, including Arden and Fletcher, displayed contiguous clusters of high hazard values, driven by Helene’s intense rainfall, low-lying geomorphology, and the concentration of developed land uses in valley-floor environments, patterns also observed in other mountainous flood studies [4,26]. These spatial patterns reinforce the tendency for major flood impacts in Western North Carolina to align with river corridors and topographically constrained piedmont–mountain transition zones rather than with overall population density.
3.2. Vulnerability Patterns: Socio-Economic Indicators
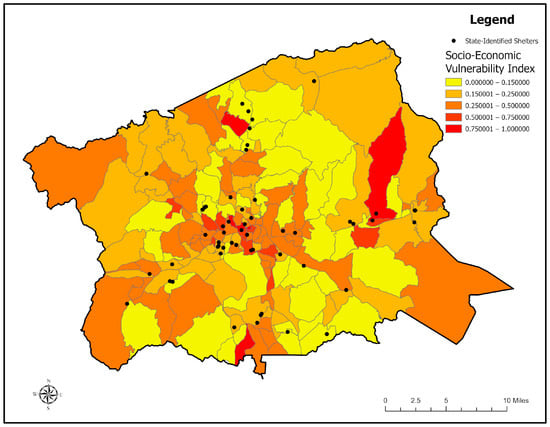
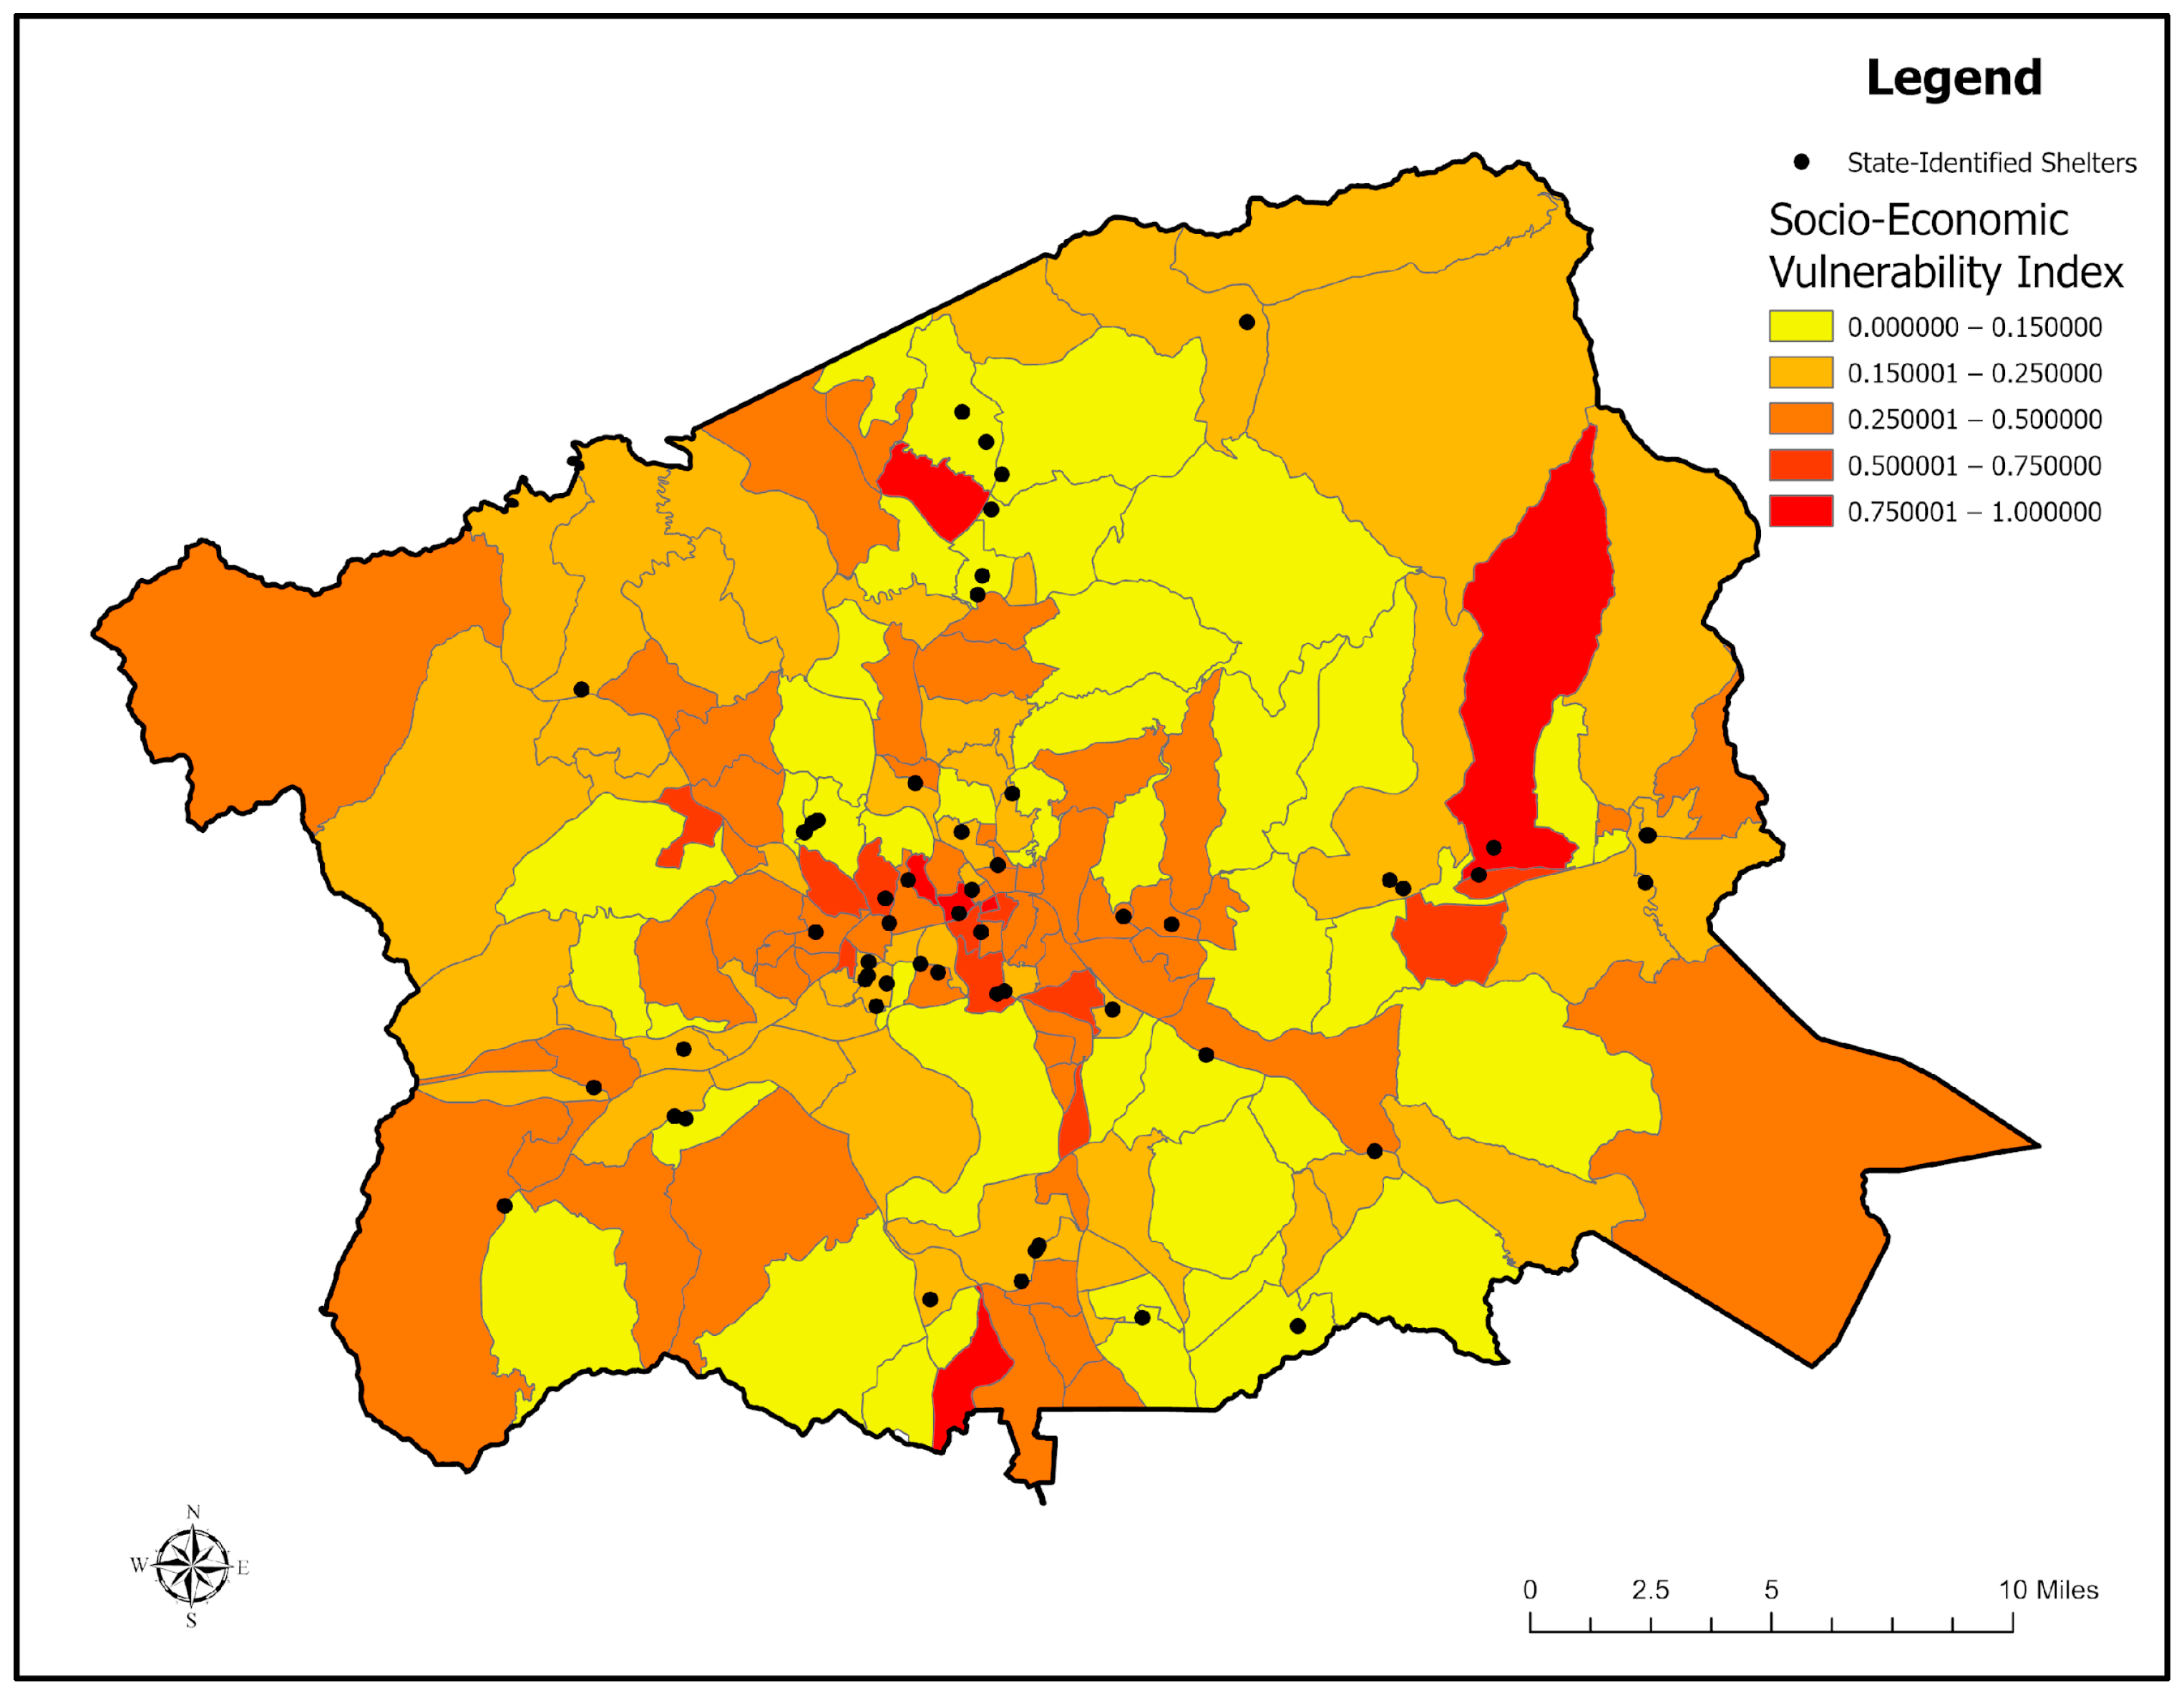
Socio-economic vulnerability, derived from the 14-indicator SEVI listed in Table 1, varied markedly across the county, as shown in Figure 5. The eastern foothill communities and southern Asheville neighborhoods showed the highest vulnerability scores, corresponding with higher proportions of low-income renters, elderly residents, and households lacking private vehicles. In contrast, higher-income and less densely populated western block groups demonstrated greater adaptive capacity, reflected in lower vulnerability values (<0.25). The spatial mismatch between hazard and vulnerability in some tracts suggests that even moderately flood-prone areas can face amplified overall risk when compounded by socio-economic disadvantage. This pattern is consistent with previous resilience studies identifying social fragility as a principal determinant of disaster impact magnitude [3,6].
Figure 5.
Distribution of Socio-Economic Vulnerability Index (SEVI) scores by census block group. This map displays the normalized vulnerability scores—ranging from 0.00 (lowest) to 1.00 (highest) calculated through a Random Forest ensemble model.
3.3. Exposure Patterns: Population and Asset Distribution
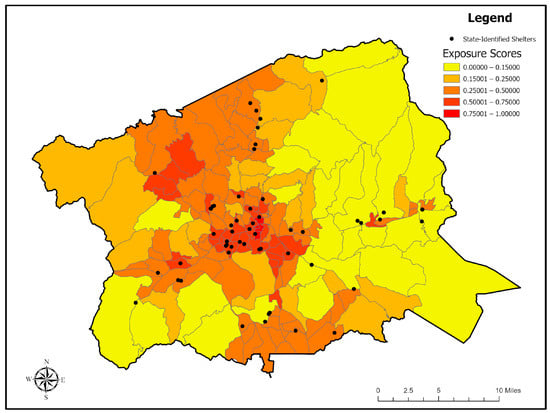
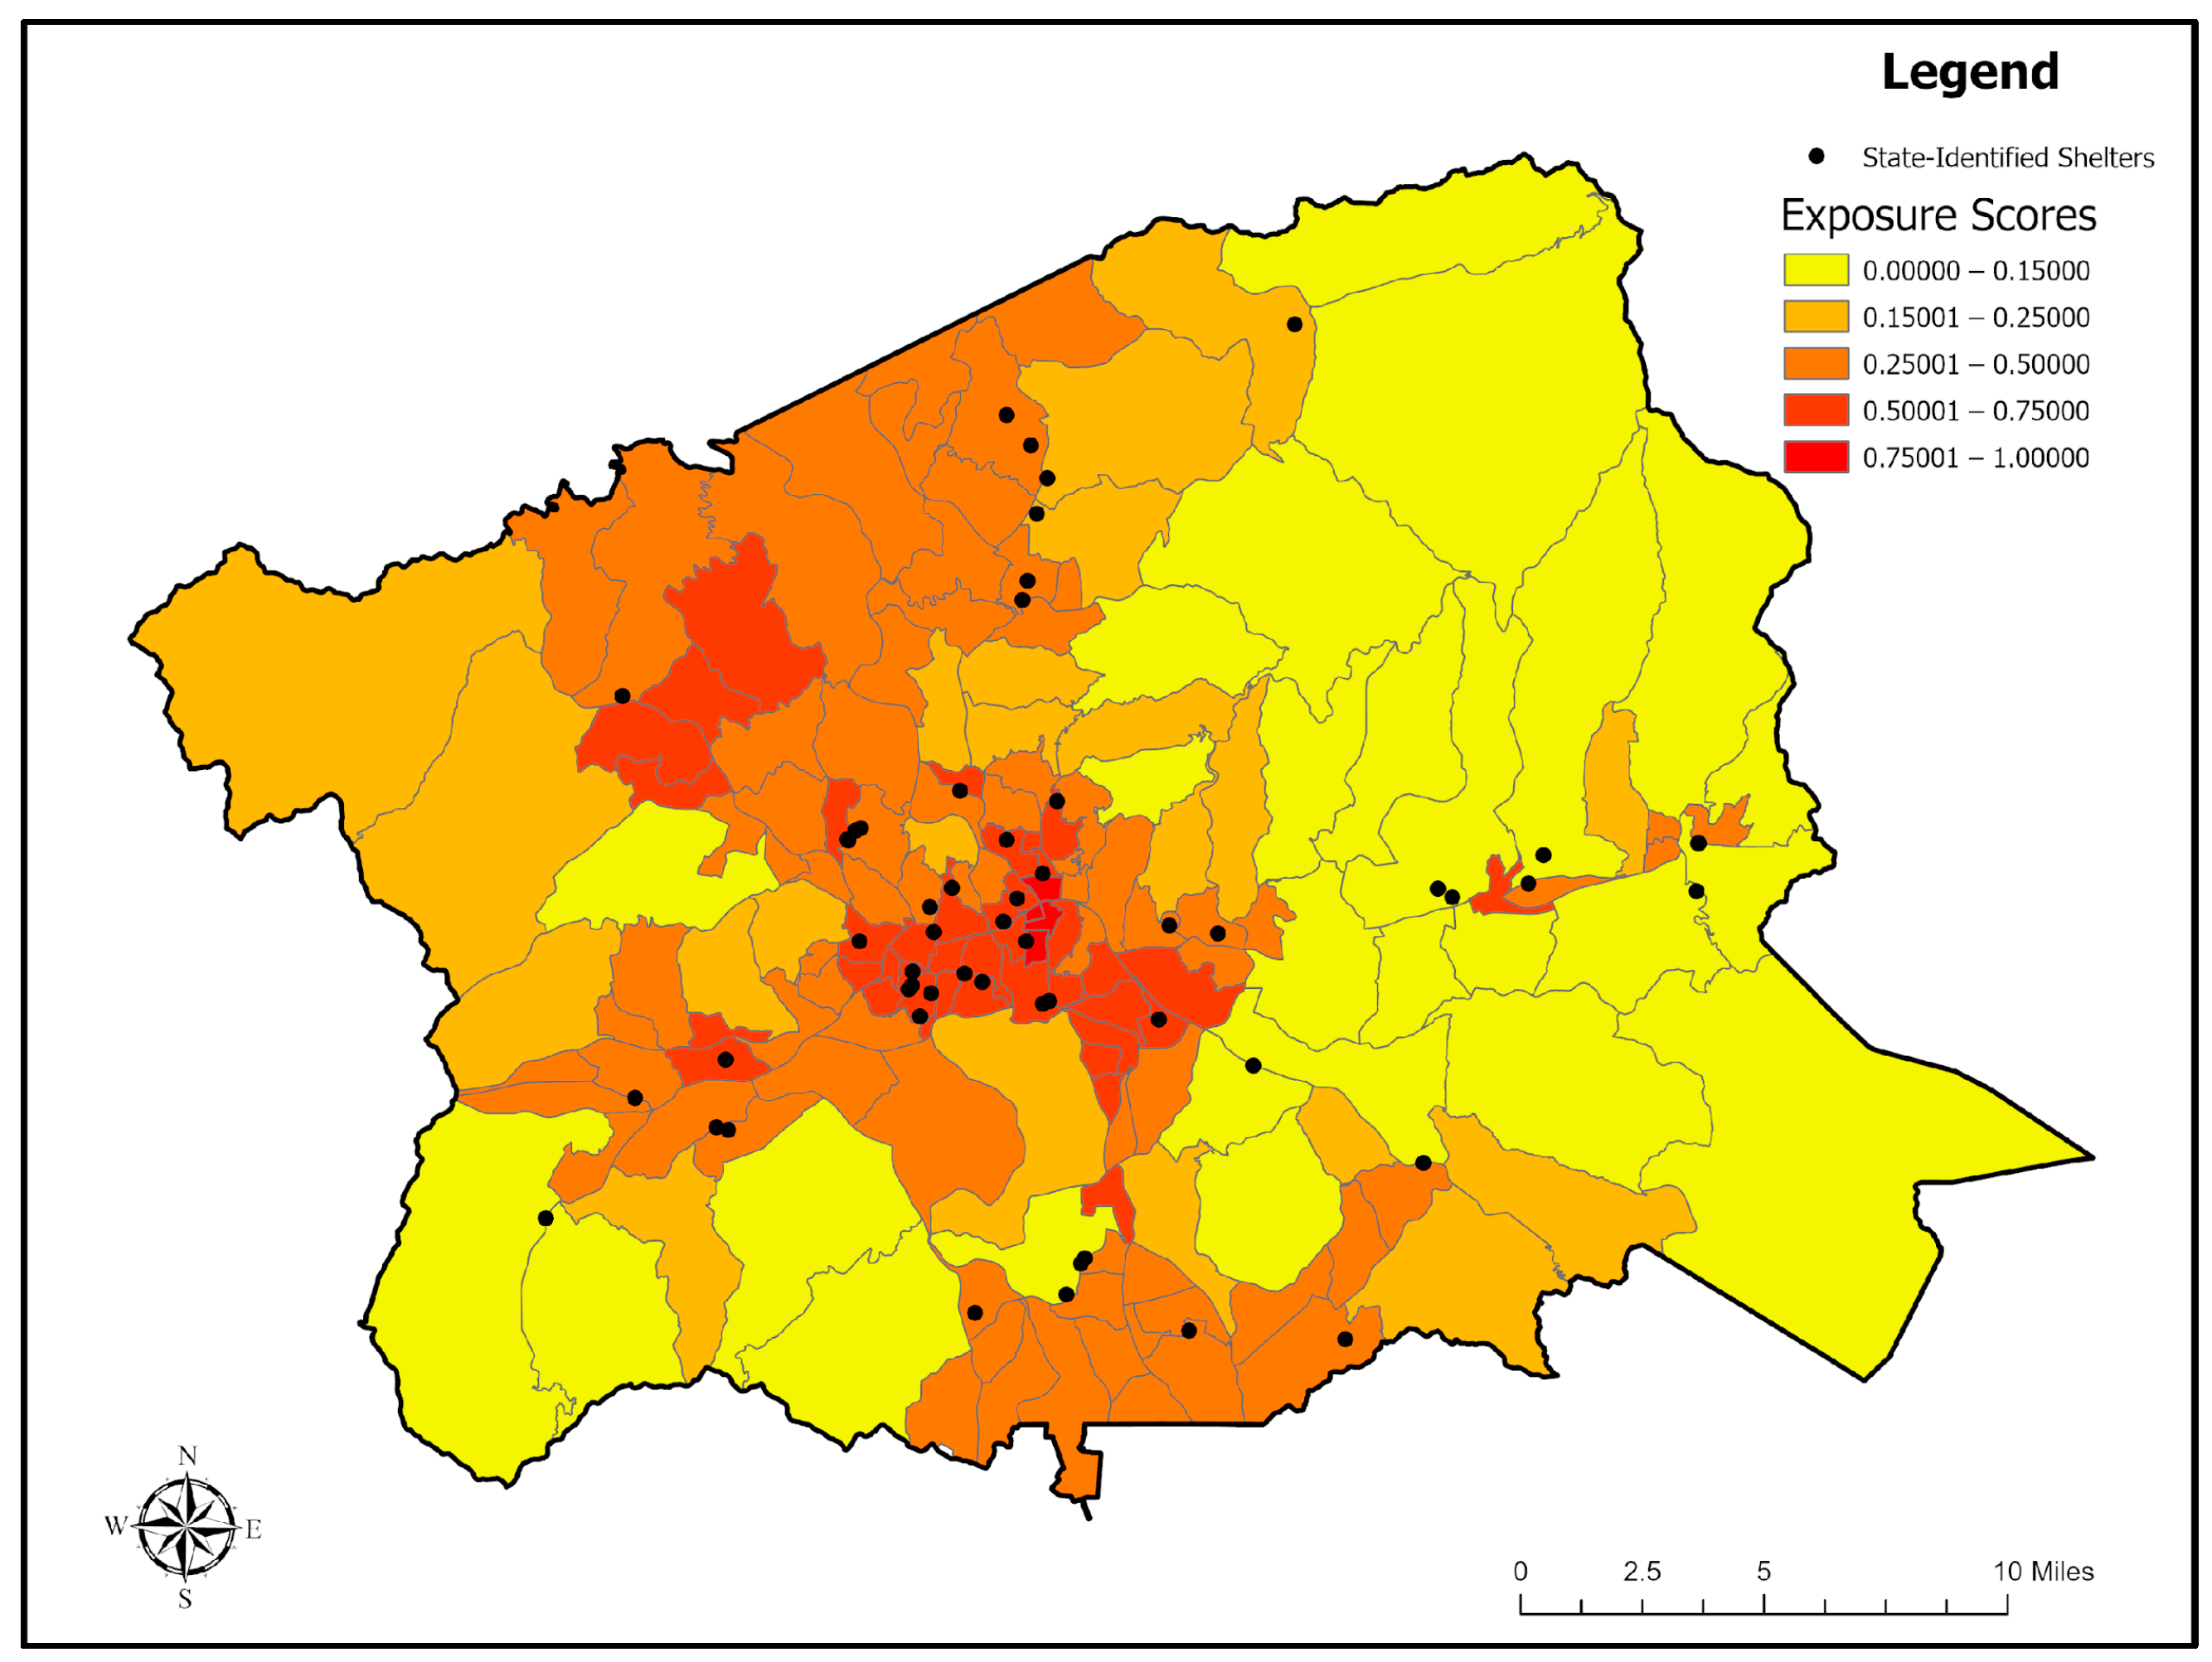
The exposure results, as depicted in Figure 6, demonstrate that developed and densely populated areas faced the greatest concentration of flood-sensitive assets. Block groups with extensive residential, commercial, and transportation infrastructure exhibited exposure scores above 0.5, particularly in the downtown Asheville corridor and intermediate valleys. These regions combine comparatively dense urban land cover with limited elevation relief, magnifying flood exposure. Agricultural and forested zones displayed low exposure values (<0.2) due to sparse infrastructure and lower concentrations of population or built assets.
Figure 6.
Spatial distribution of flood exposure scores by census block group. This map illustrates normalized exposure levels ranging from 0.00 to 1.00 derived from data on land use and land cover to quantify the degree of human and infrastructural assets at risk.
3.4. Risk Index Map: Identification of Highest-Risk Block Groups
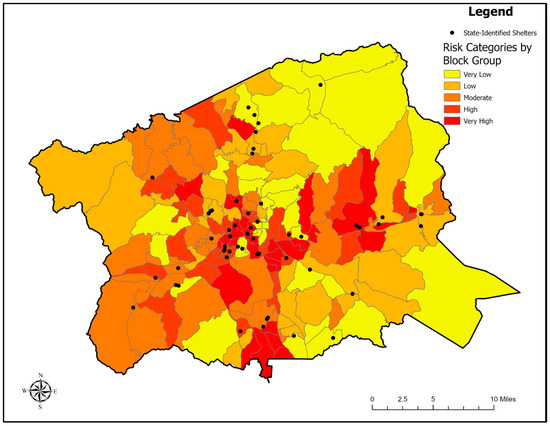
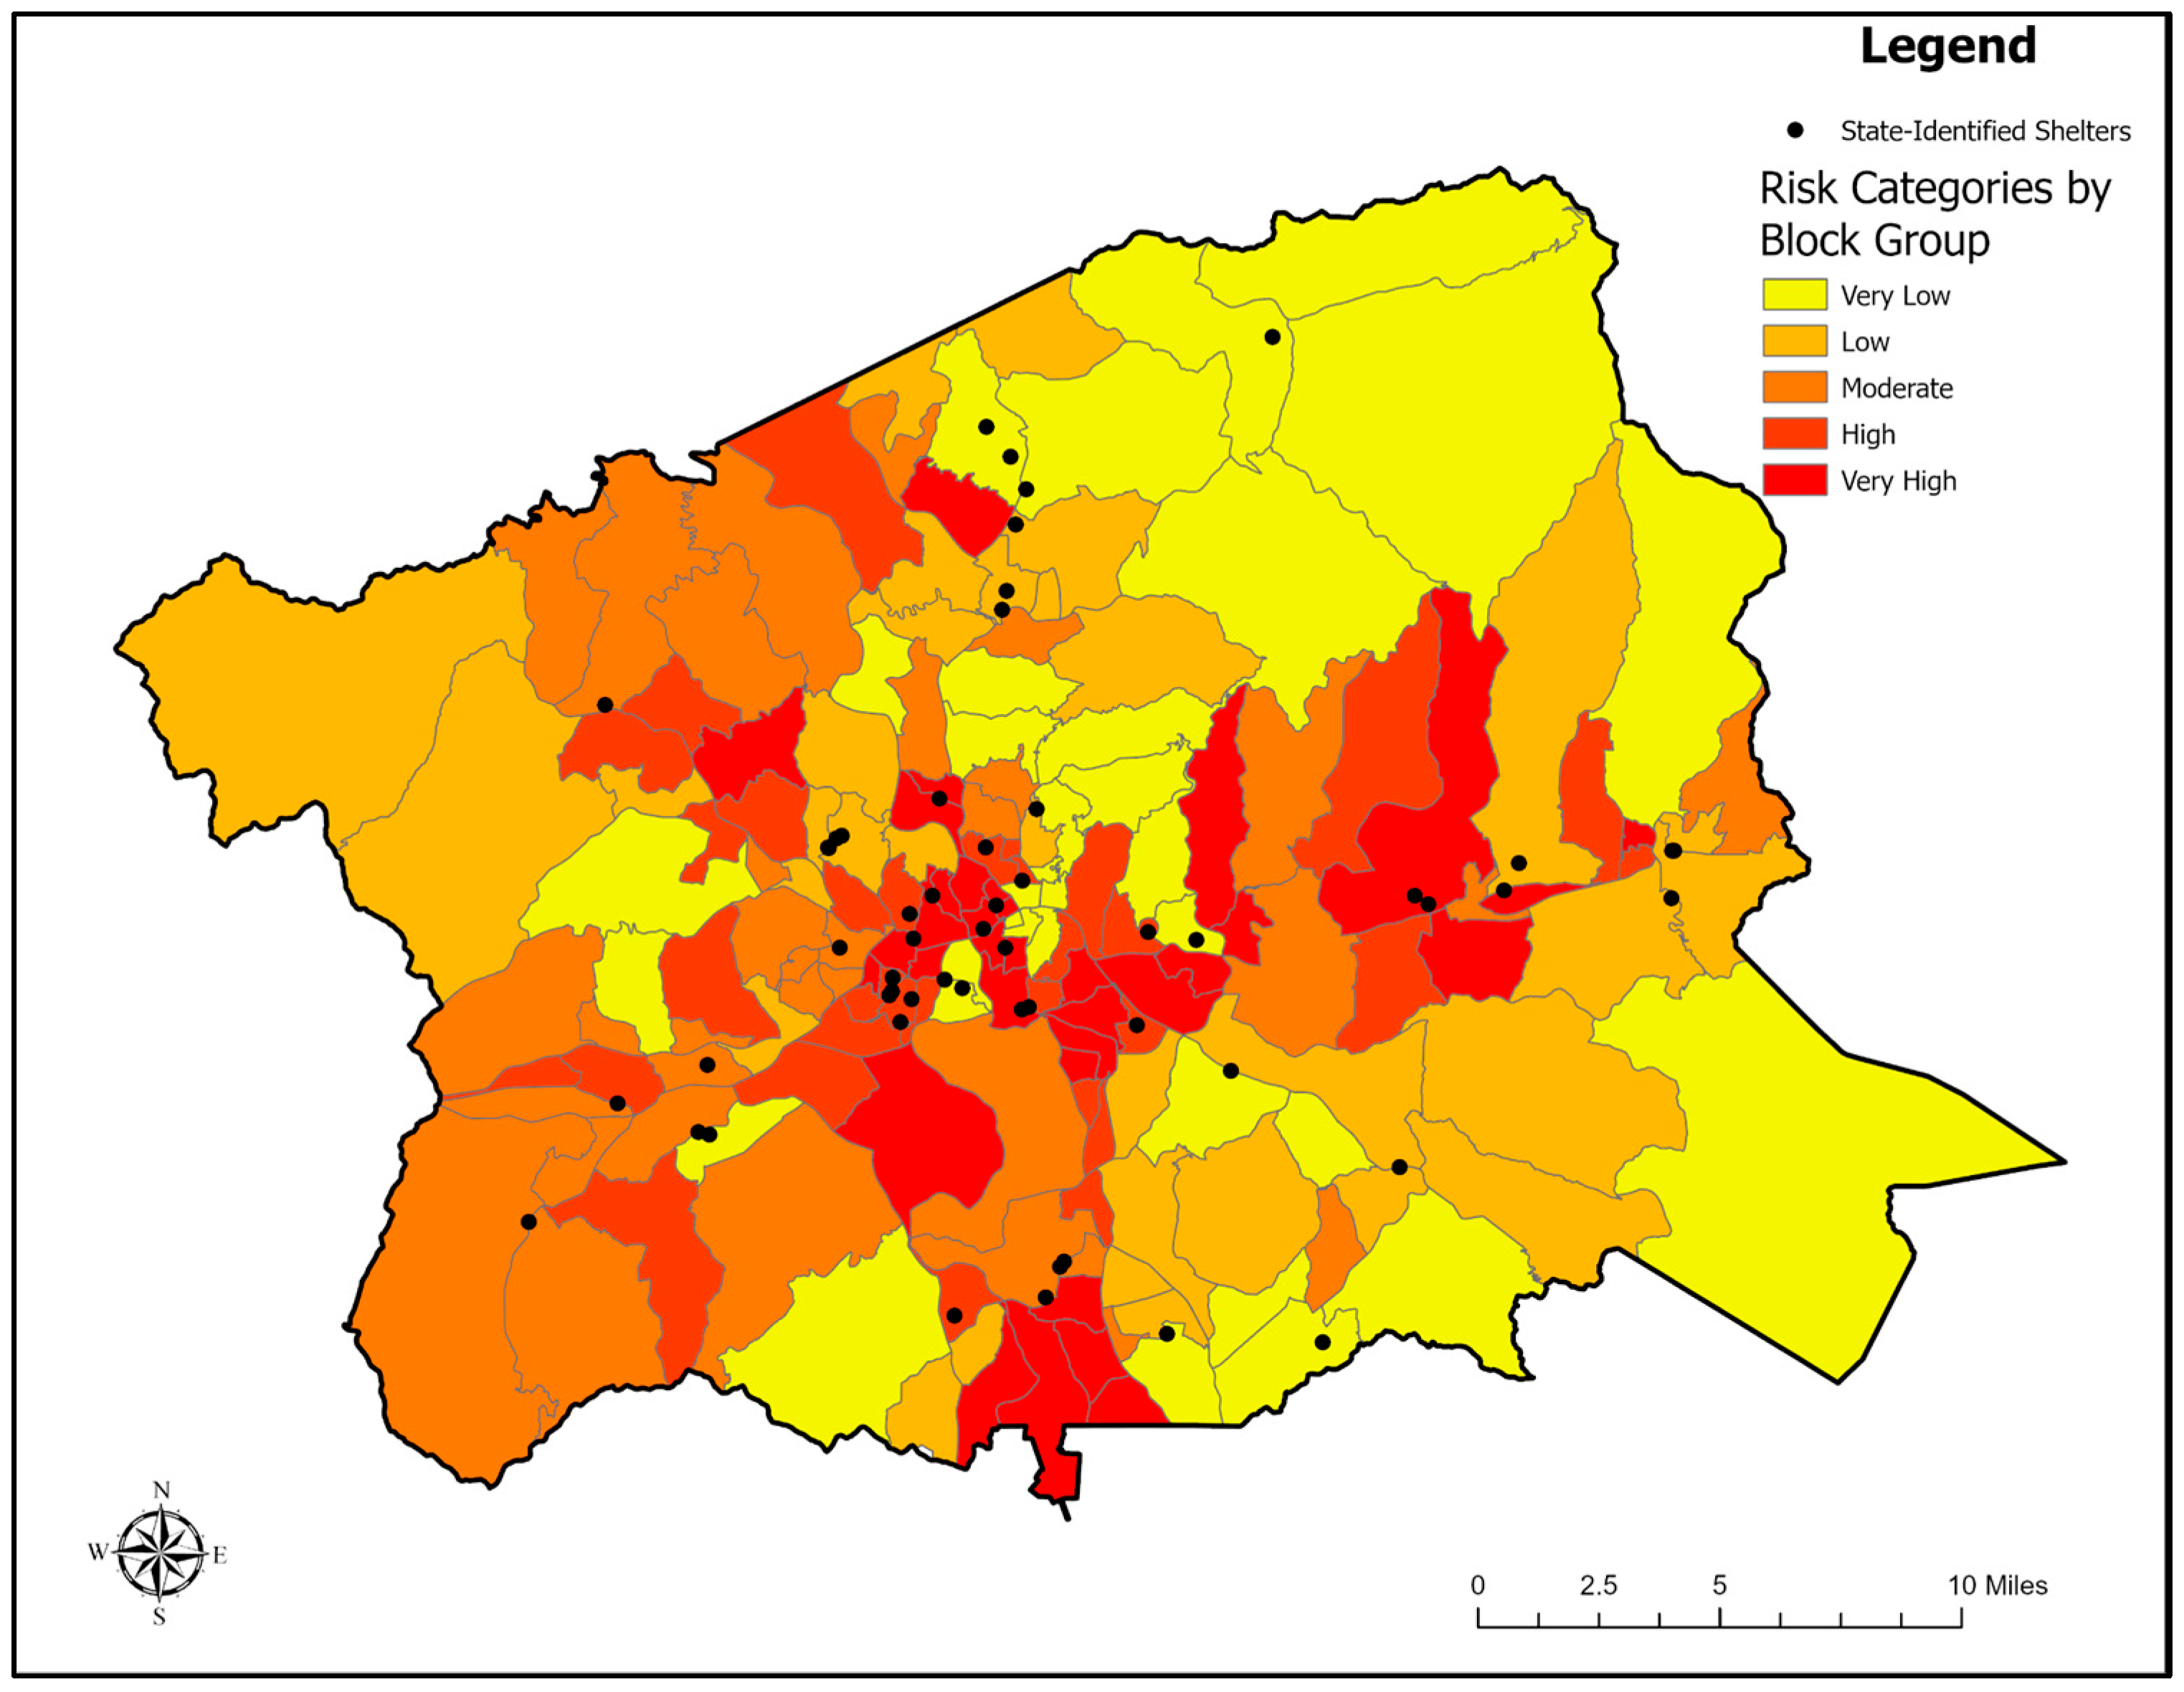
Multiplication of the three dimensions (hazard, SE, and exposure) produced the composite Flood Risk Index (Figure 7). High and Very High-risk zones formed contiguous clusters through the central valley system of Buncombe County. These areas combine large, inundated areas, dense development, and elevated social vulnerability. Block groups categorized as Very High risk represent priority zones for disaster mitigation, given the compounded effects of physical hazard, exposure, and limited community resilience. Conversely, Low- and Very Low-risk areas correspond to forested uplands and sparsely populated rural terrain. The spatial clustering of High-risk areas supports the model’s ability to capture cumulative flood-related pressures relevant to emergency management.
Figure 7.
Composite flood risk assessment by census block group in Buncombe County. This map synthesizes three primary indices—hazard, exposure, and vulnerability—to categorize overall risk into five tiers ranging from Very Low (yellow) to Very High (dark red). The spatial distribution reveals high-risk clusters in the urban core and along vulnerable river corridors where high social vulnerability and significant physical exposure intersect.
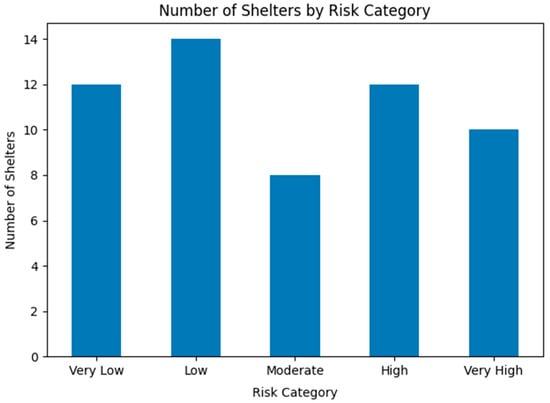
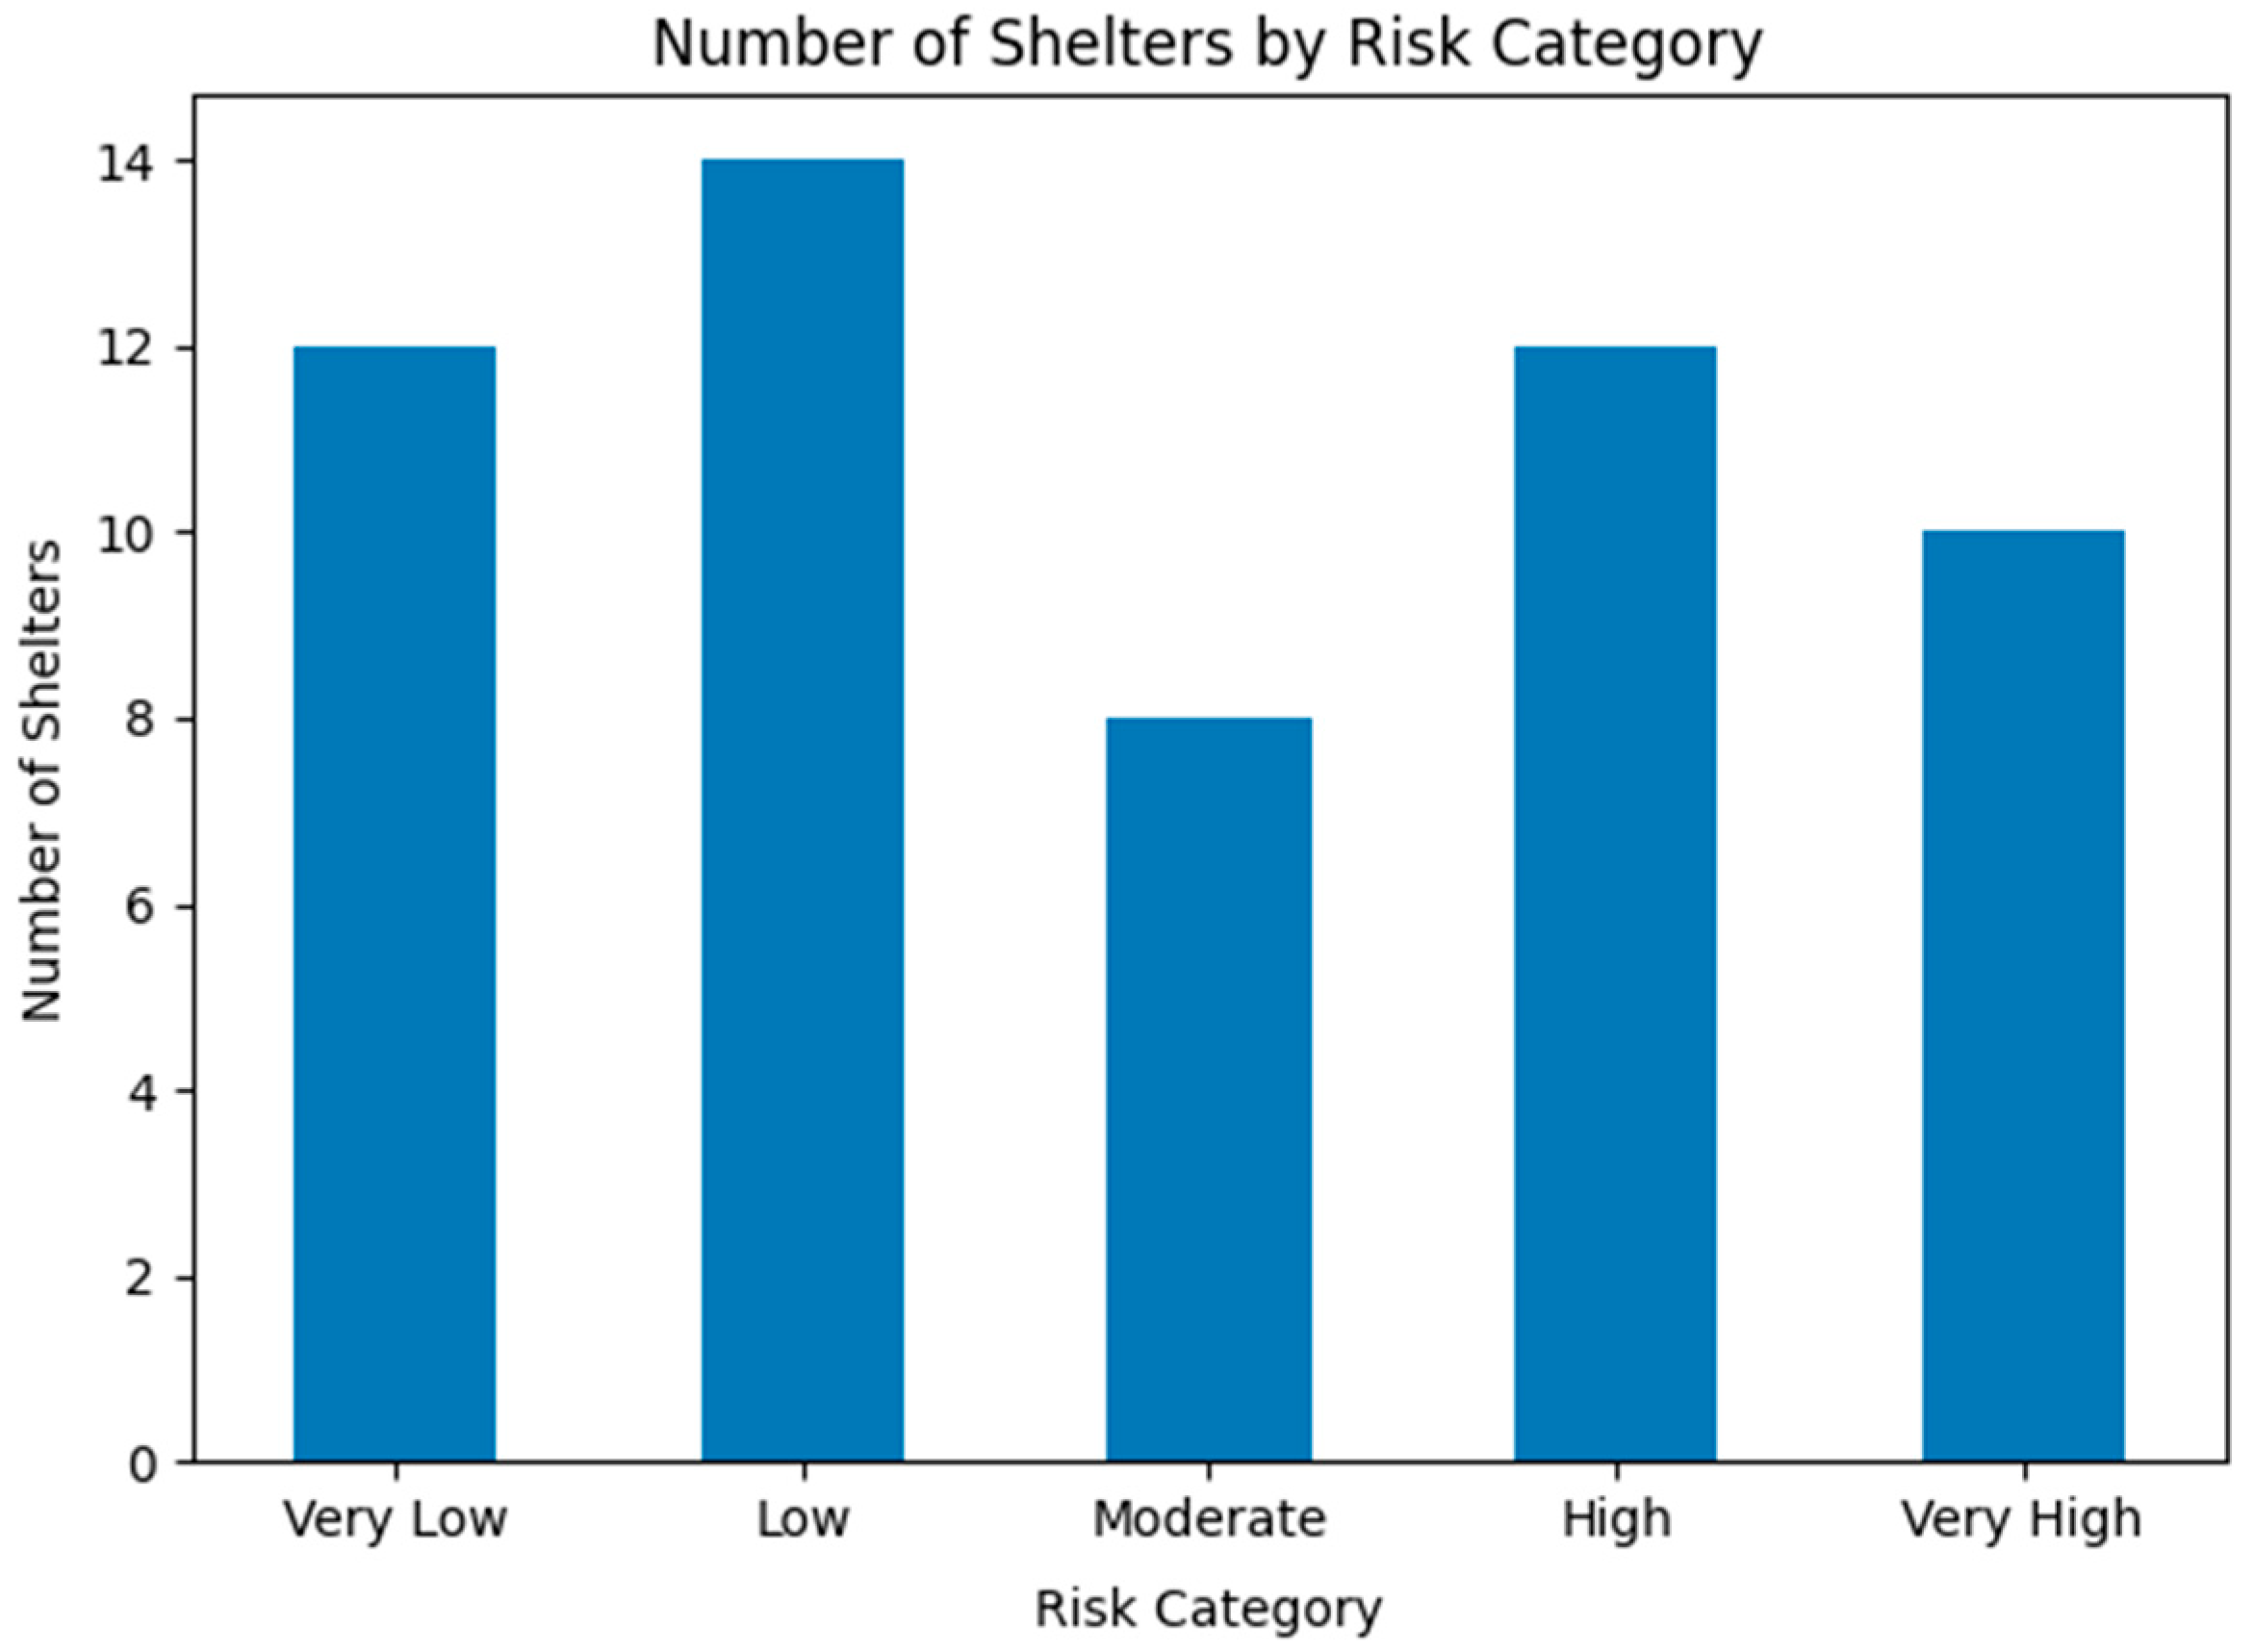
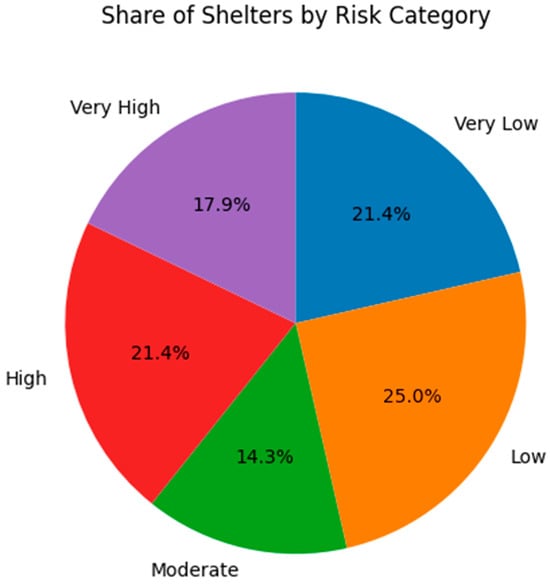
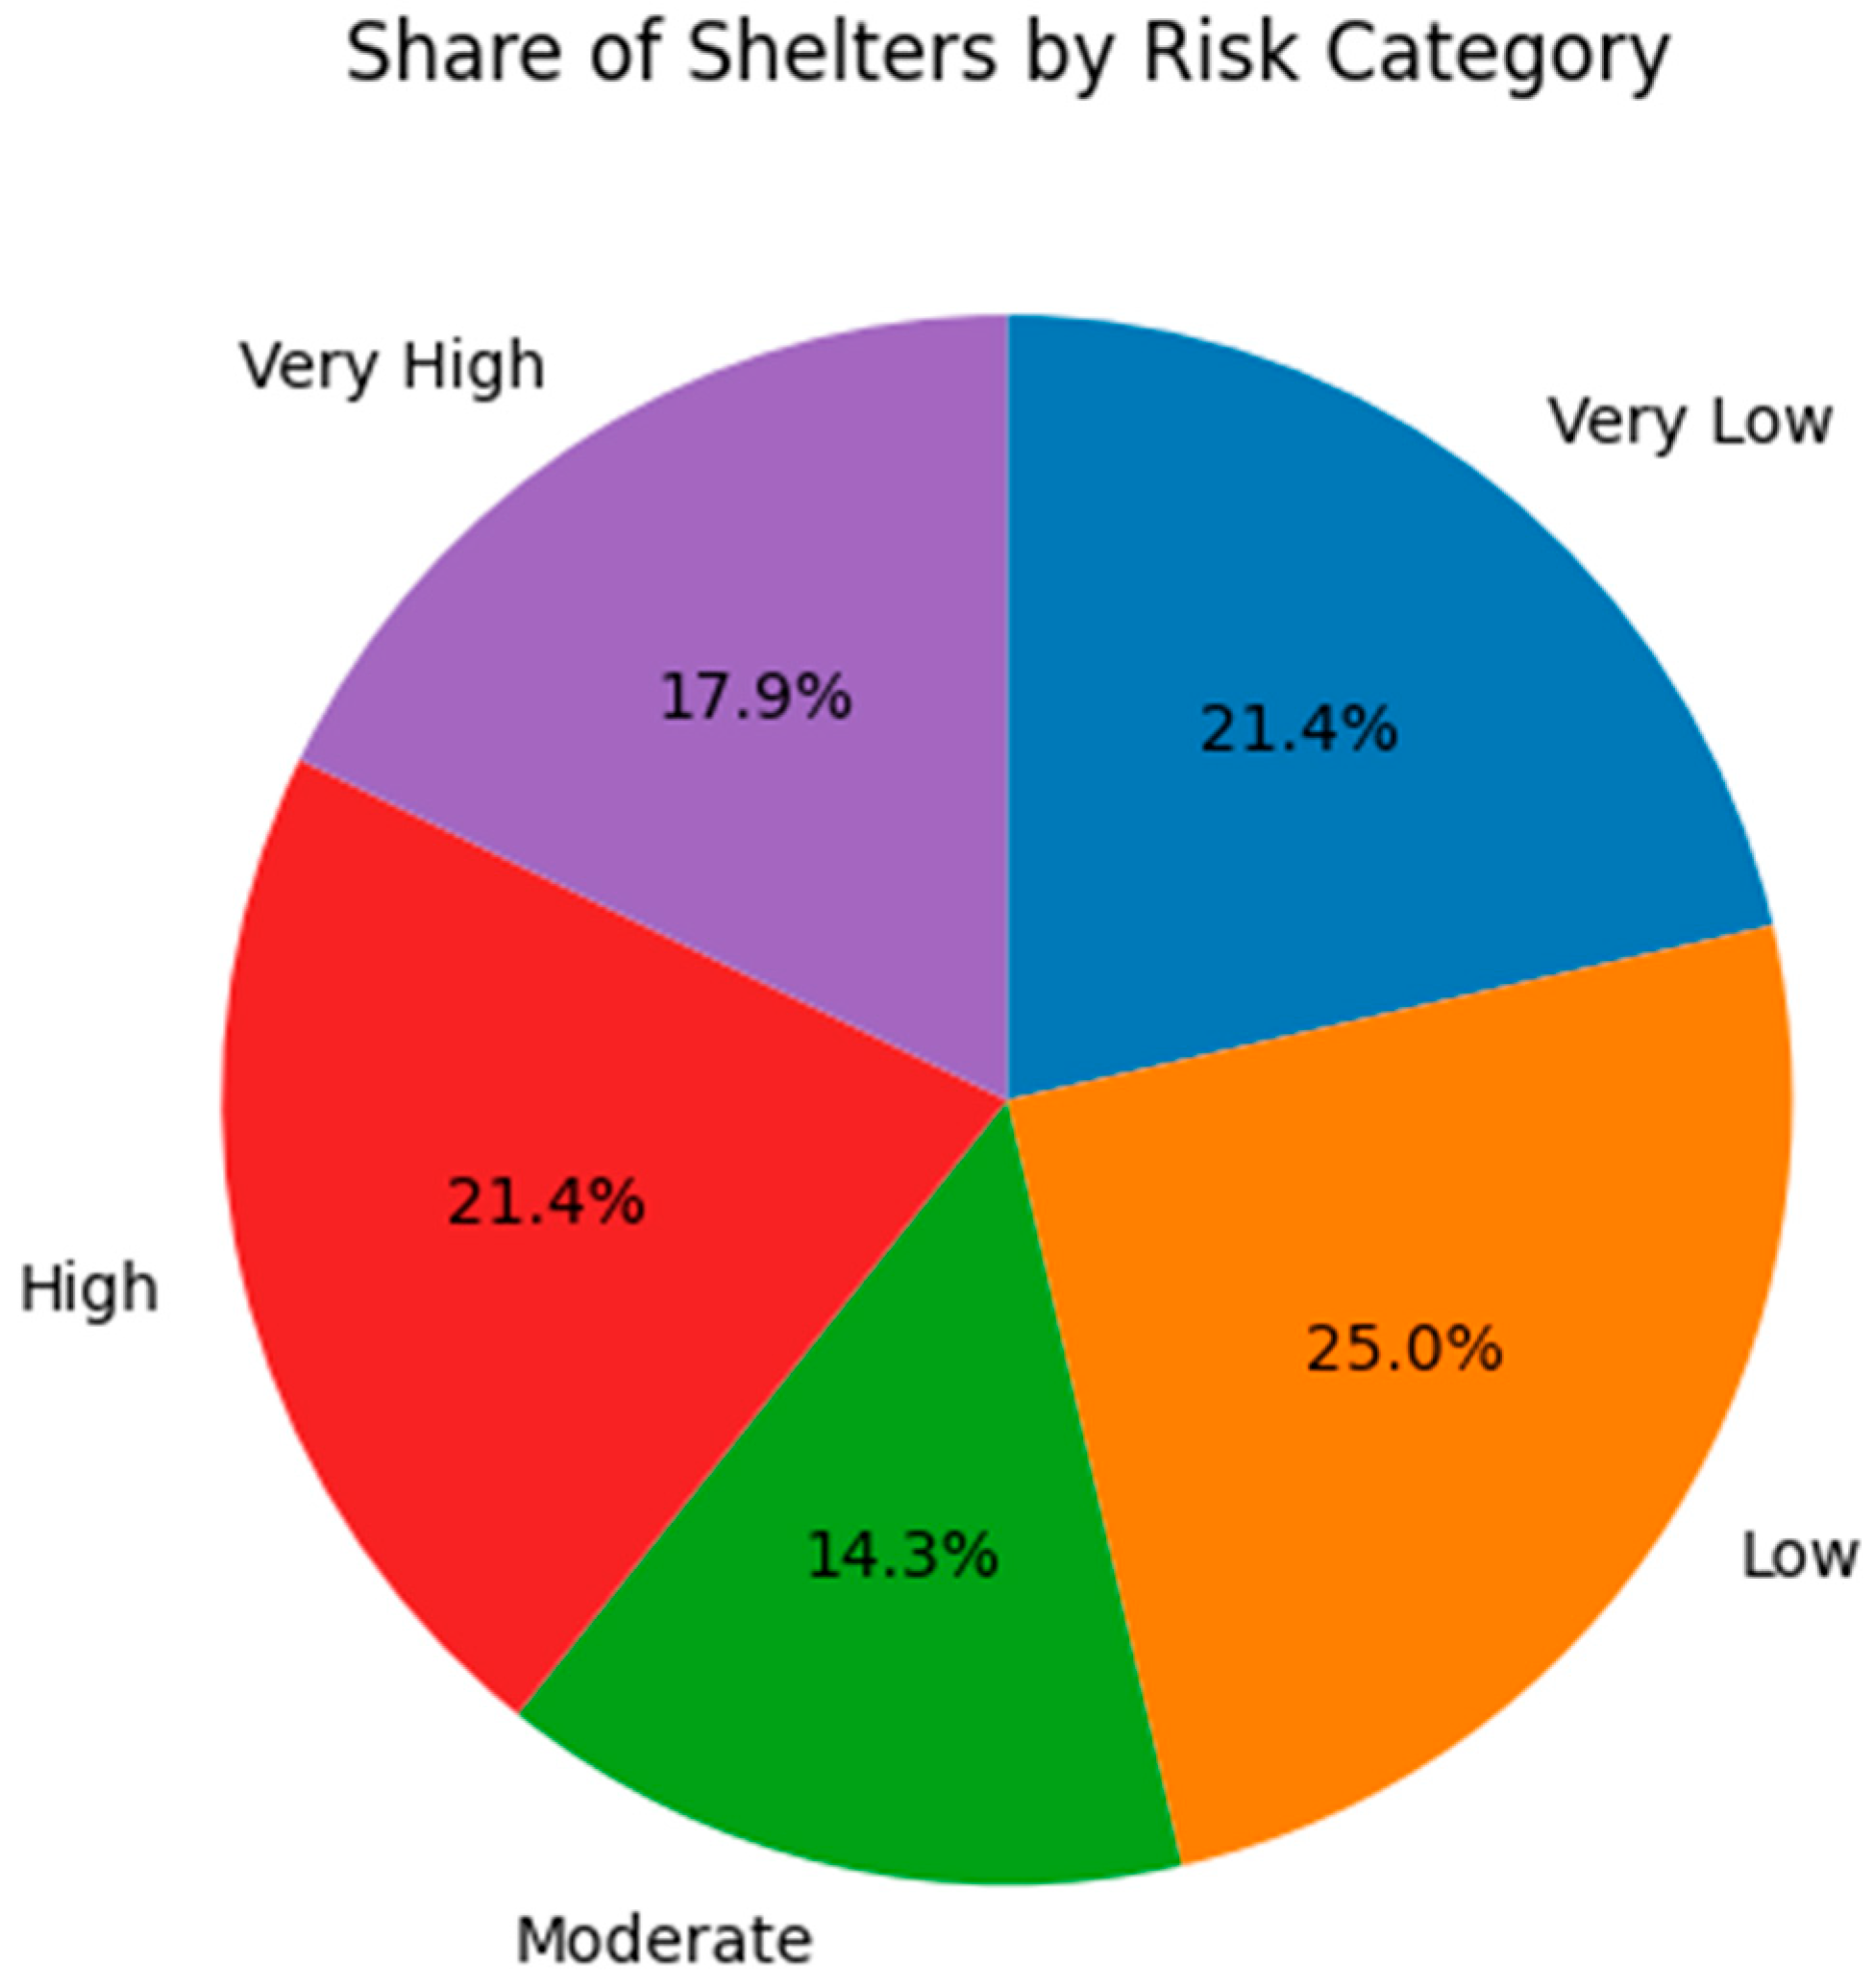
The current shelter network in Buncombe County consists of 56 facilities, the majority of which are public schools, supplemented by a smaller number of higher-education campuses, civic buildings, and National Guard armories. The bar chart in Figure 8 illustrates the distribution of shelters across five different risk categories as Very Low, Low, Moderate, High, and Very High. Over half (53.6%) of the existing shelters fall within the Moderate- to Very High-risk ranges, indicating significant exposure to combined social and environmental factors. This is further represented in Figure 9 in a pie chart in numerical and color-coded form. Only a small proportion of shelters are categorized as Very Low risk, which indicates that many facilities remain exposed to flood-related hazards.
Figure 8.
Quantitative distribution of state-identified shelters by flood risk: This bar chart enumerates existing emergency facilities within each calculated risk tier, revealing that 22 shelters are currently situated in High- or Very High-risk zones. When contrasted with the 12 shelters in Very Low-risk areas, this distribution underscores a significant spatial mismatch between current infrastructure and environmental safety.
Figure 9.
Quantitative and proportional distribution of state-identified shelters by flood risk category: This pie chart reveals that 39.3% of the total shelter network is located in High- or Very High-risk zones.
3.5. Emergency Shelter Suitability Analysis
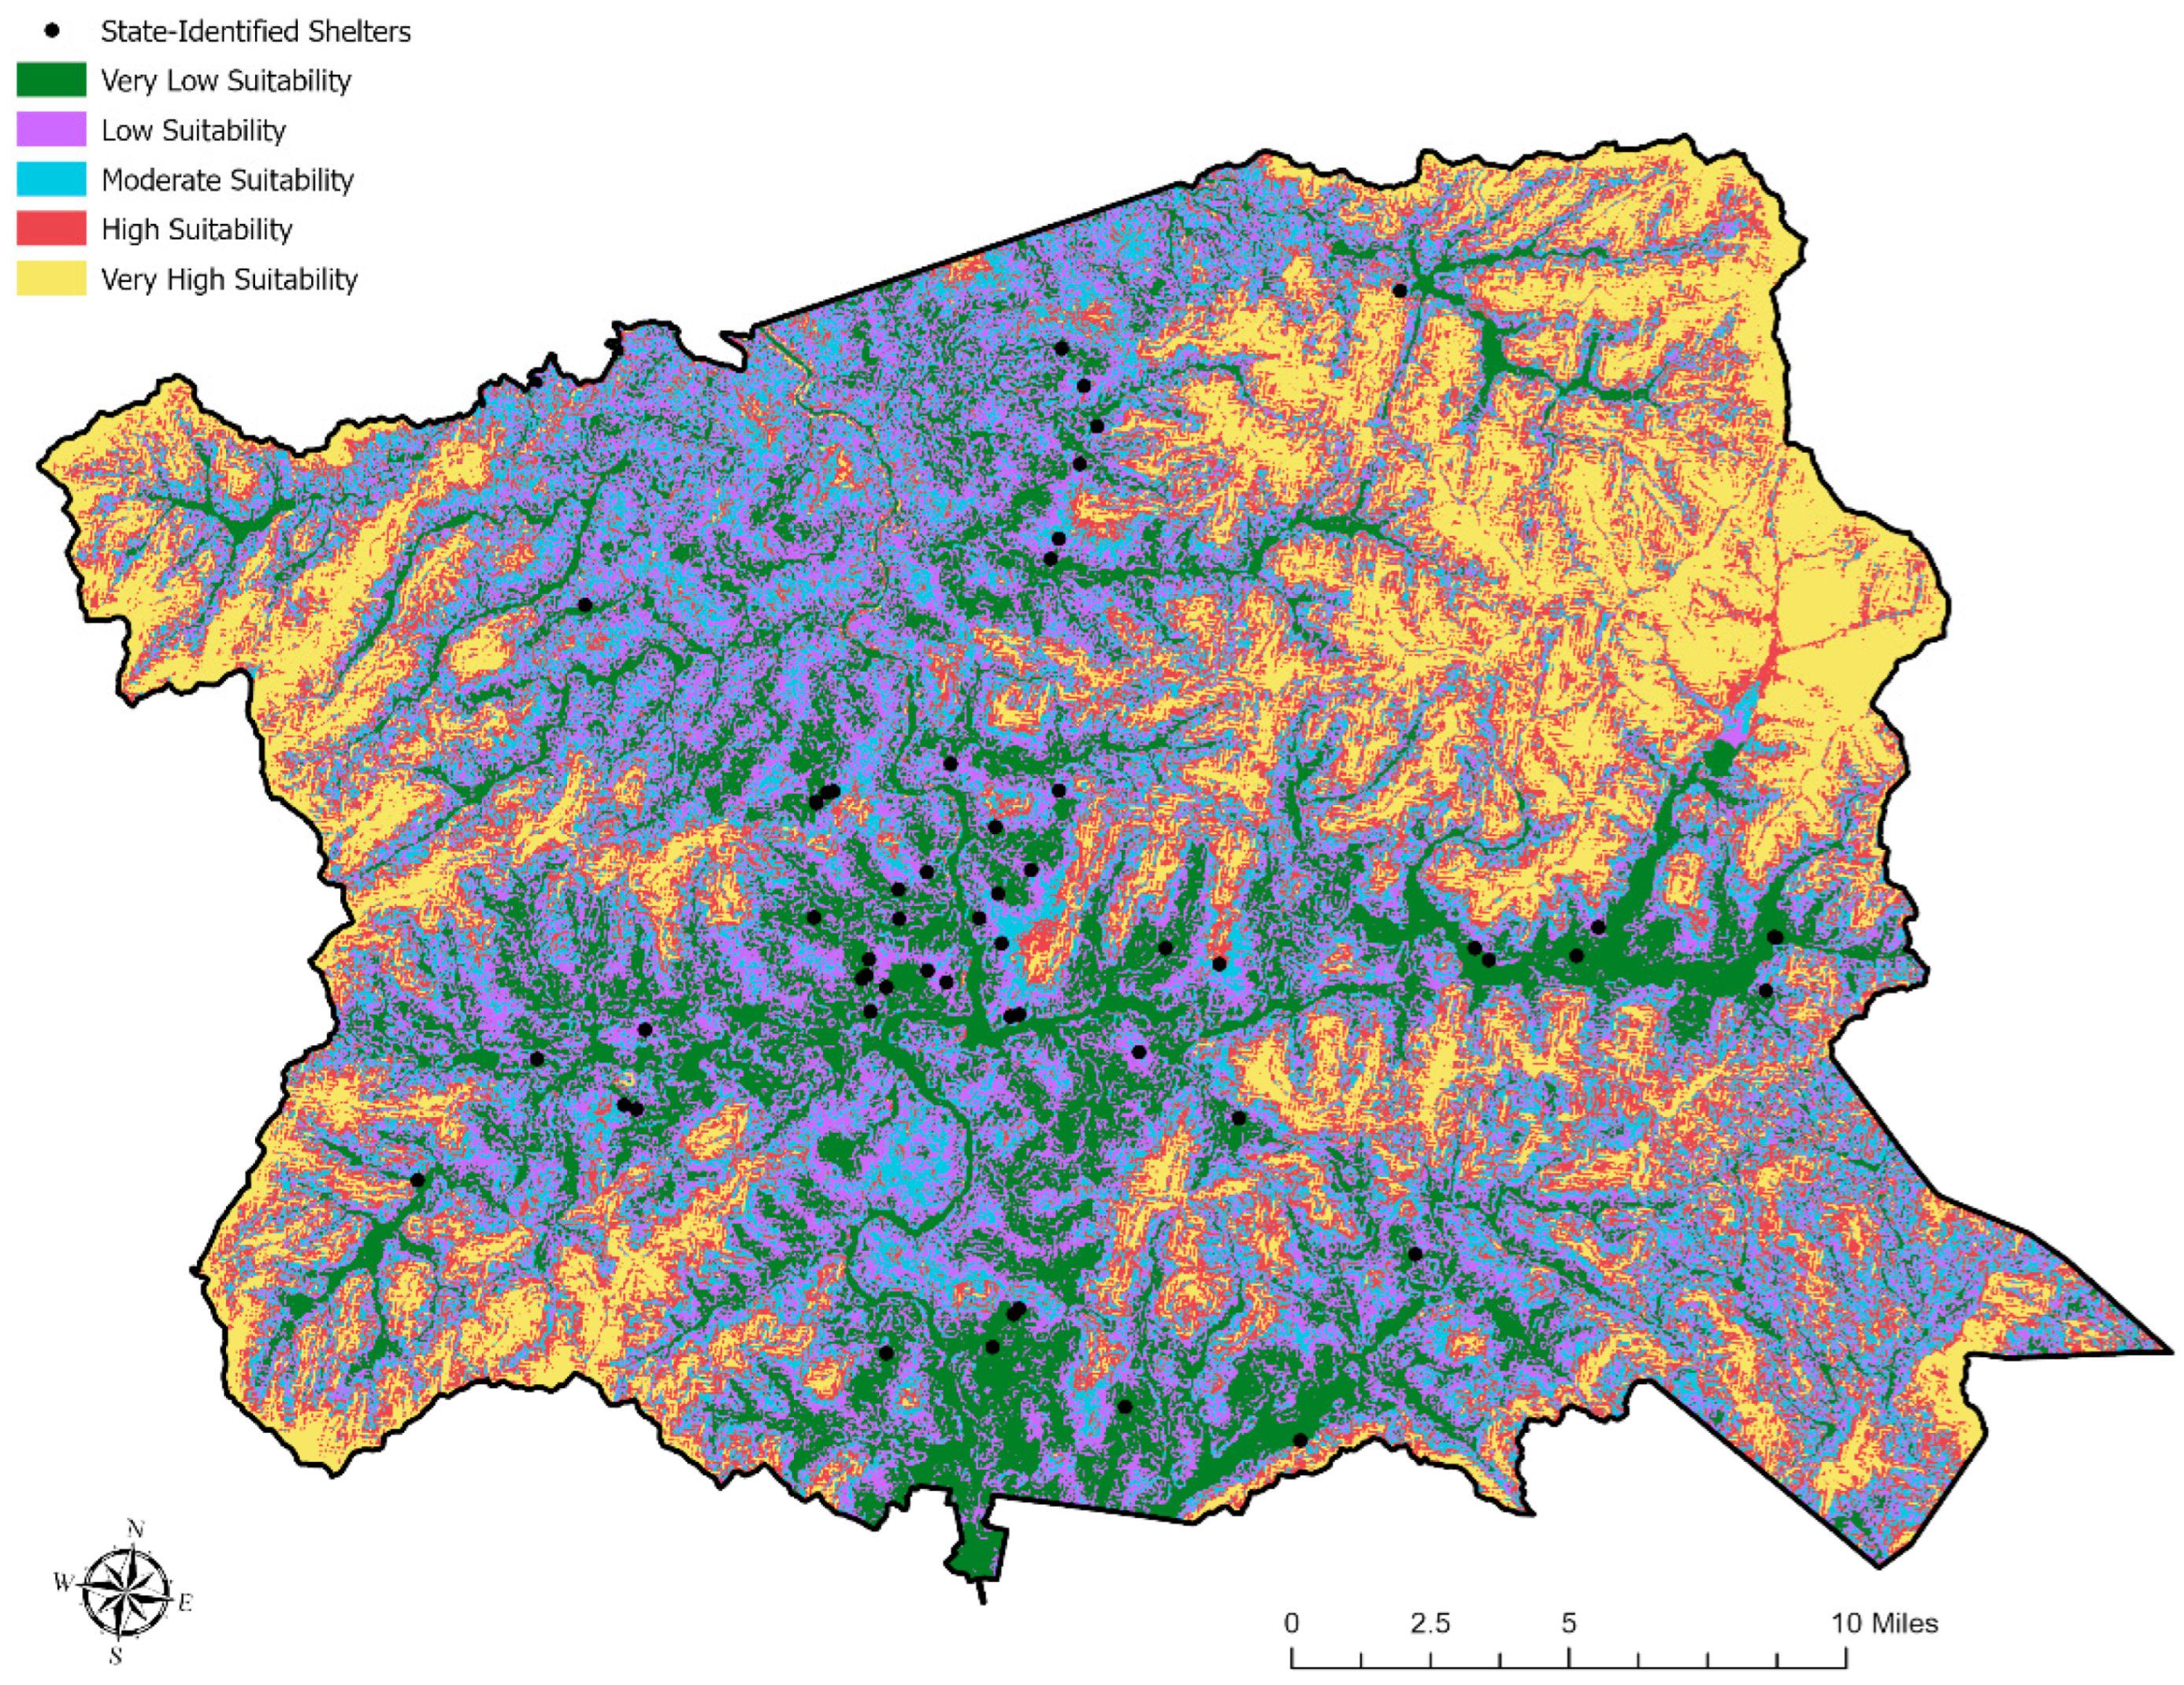
Following the spatial assessment of flood hazard and shelter exposure, a Multi-Criteria Evaluation (MCE) was conducted to identify optimal locations for safer, more resilient emergency shelter placement. This analysis shifts the focus from passive risk characterization to proactive siting, integrating physical constraints, accessibility, and population needs into a decision support framework. Factors included topographic elevation (DEM), proximity to major roads, distance from inundation zones, and accessibility to population centers. These factors utilized several spatial factors representing topographic safety, flood mitigation, connectivity and service capacity.
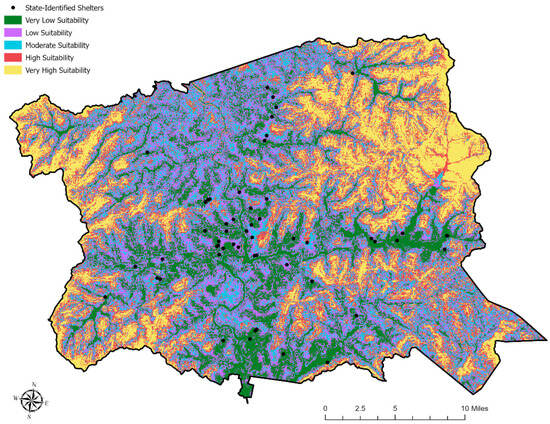
The analysis identifies High- and Very High-suitability zones predominantly on elevated terrain surrounding Asheville’s urban core and along the mid-elevation ridges in western and northern Buncombe County. As shown in Figure 10, a comparison between these optimal zones and existing state-identified shelters (black dots) reveal critical vulnerabilities: (1) Risk Proximity: Several current shelters are situated within or adjacent to Moderate- or High-risk zones; (2) Priority Areas: Facilities in southern Asheville and the Swannanoa Valley are particularly highlighted as candidates for relocation or structural reinforcement; and (3) Strategic Investment: The identified “Very High-suitability” zones offer a data-driven foundation for prioritizing future shelter investments, ensuring locations are both low-hazard and within reasonable travel times for at-risk populations.
Figure 10.
Multi-criteria suitability analysis for emergency shelter placement in Buncombe County. This map illustrates optimal zones for flood-resilient shelter siting based on topographic elevation, accessibility, and proximity to hazard zones. Very High-suitability areas (yellow) are concentrated along elevated ridges and the urban periphery, while existing state-identified shelters (black points) are evaluated to identify facilities requiring potential relocation or reinforcement, particularly in high-risk valley corridors.
3.6. Interpretation of Spatial Patterns (Clusters of High Hazard or High Vulnerability)
The geospatial analysis conducted in this study offers important insights into the flood risk exposure of emergency shelters in Buncombe County, North Carolina, especially in the aftermath of Hurricane Helene (September 2024). The integration of hazard (e.g., HAND-modeled inundation from [2]), exposure (e.g., infrastructure and land use), and socio-economic vulnerability (e.g., Social Vulnerability Index [22]) into a composite Flood Risk Index showed that approximately half of existing shelters are located in moderate- to high-risk flood zones.
Flood hazard scores were highest along the Swannanoa River, Hominy Creek, and lower French Broad River, regions shaped by valley-bottom floodplain morphology and orographic precipitation typical of mountain basins [23,24]. This morphology enhances flood severity, a dynamic corroborated by [25]. The spatial overlay identified eastern Asheville and Swannanoa Valley as experiencing compounded risks—high physical exposure coupled with elevated social vulnerability—mirroring national patterns found by [20,27,28,29,30], who emphasized that such disparities are best revealed at sub-county resolutions.
Furthermore, around 60% of highly vulnerable block groups lacked nearby low-risk shelters, intensifying socio-spatial inequities [31,32]. Proposed new sites, elevated ridges away from major rivers with slopes <15 degrees, would reduce average evacuation distances by 25%, increase equity, and avoid wildfire-prone soils and fault zones [4].
3.7. Implications for Emergency Shelter Siting and Resource Allocation
The majority of existing shelters in Buncombe County are located in high-risk flood zones. These placements reflect historic biases toward proximity to population centers, despite risks from river valleys and infrastructure corridors [33]. At the time of siting, mountainous terrain was widely assumed to provide inherent protection from flooding, leading to shelter placement decisions that prioritized accessibility over flood exposure. The findings demonstrate the need for relocation guided by multi-criteria frameworks [5,34], incorporating terrain, access, and land use, as promoted in [35].
The proposed relocation strategy aligns with resilience frameworks, such as the Disaster Resilience Index (DRI) by [6], which integrates vulnerability, population density, and adaptive capacity. This supports risk-informed policy updates to FEMA criteria and state-level recovery efforts [15]. The findings also echo calls for integrating Decision Support Systems (DSSs), like those used by [2], into dynamic emergency planning.
4. Discussion
4.1. Comparison with Other Risk Assessment Studies
By leveraging high-resolution geospatial tools and multi-source data, this study provides a replicable, transparent framework for vulnerability assessment [17,36]. Utilizing census-block-level analysis allows for more granular mapping compared to regional studies, which is critical for the tactical requirements of local emergency response teams.
Key differentiators in this study included an enhanced inundation modeling; when compared to traditional FEMA flood maps, the Height Above Nearest Drainage (HAND) modeling used here provides more terrain-sensitive inundation estimates. The estimates were validated by post-Helene observational data [2,18], supporting earlier critiques that standard FEMA zones often underestimate actual flood extents in complex topography [37,38]. Finally, by aligning with methodologies from this study, it was possible to unify hazard, exposure, and social data into a singular index.
Studies by [19,39] reinforce the utility of integrating hazard, exposure, and social data into unified indices. Additionally, incorporating climate projection [40] and wildfire proxies [24] enriches the risk profile, addressing compound hazard scenarios.
4.2. Limitations and Future Directions
While the current framework offers significant advancements, several technical and data-driven limitations remain, with key constraints associated with the hydrological modeling—HAND modeling, while effective for terrain-based flooding, does not fully capture backwater effects or complex urban stormwater dynamics. Furthermore, the slope and aspect data derived from DEMs have the risk of overlooking micro-topography that influences localized runoffs. Finally, the current study used vulnerability data derived from ACS sources that may underrepresent transient or undocumented populations, potentially creating “blind spots” in social equity mapping.
Future research should consider better model integration such as integrate real-time soil moisture sensors and field validation into the Random Forest modeling to improve predictive accuracy. Future studies should implement longitudinal performance tracking of shelters during active disasters to refine the suitability criteria.
It is possible to expand this framework to other Appalachian counties, and integrating AI-driven resilience tools along with community-based feedback in future siting decisions [6,17] would provide broader policy impacts for the region.
5. Conclusions
The unprecedented flooding triggered by Hurricane Helene caused profound socio-economic disruption and strained emergency response frameworks throughout North Carolina. While numerous temporary shelters were established to accommodate displaced populations, the strategic siting of these facilities remains a critical, yet under-researched, challenge. Despite existing Red Cross and FEMA guidelines, there is a notable scarcity of peer-reviewed literature detailing empirical methods for optimal shelter location.
To address this gap, this study presented an integrated flood risk analysis incorporating hazard intensity, land-use exposure, and socio-economic vulnerability. The multiplicative analysis reveals that the highest flood risk scores are concentrated within census block groups situated along Buncombe County’s principal river corridors: portions of the Swannanoa River basin, the lower French Broad River and the Hominy Creek valley all experienced extreme inundation and high structural damage. The elevated risk levels in these areas reflect a compounded influence of extensive flood exposure, high building density, and significant socio-economic vulnerability. These findings underscore the necessity of moving beyond “immediate availability” in shelter selection toward a model that prioritizes long-term environmental resilience.
Several block groups in southern Asheville, as well as in and around Arden and Fletcher, form a continuous band of elevated risk. These locations are characterized by low-lying terrain and sustained development patterns that have placed large numbers of residents, facilities, and transportation routes within areas prone to flooding. In contrast, block groups located in the northern and upland portions of the county exhibit the lowest risk values, owing to limited inundation, lower structural concentration, and stronger socio-economic indicators.
A comparison of existing emergency shelter locations with the Flood Risk Index showed that several facilities are positioned within, or immediately adjacent to, moderate- and high-risk block groups. This finding demonstrates that a portion of the current shelter network is not resilient and remains susceptible to flood disruption during events comparable to Helene. The results also identify a set of block groups in the western and northern mid-elevation corridors that offer more stable conditions for shelter placement, with consistently low hazard scores and reasonable access to nearby populations.
Future research should expand upon this analysis by incorporating additional environmental and infrastructural variables to further refine the identification of safe, accessible, and equitable shelter locations. While this study demonstrates the utility of integrating hazard, exposure, and vulnerability indicators, subsequent work should transition toward dynamic, scenario-based modeling. Such models should account for projected land-use changes, population growth, and shifting flood frequencies under varying climate conditions.
To enhance functional suitability, future frameworks must integrate:
- Travel-Time Analysis: Determining the realistic reach of shelters under emergency conditions.
- Evacuation Routing: Mapping optimal paths that avoid high-hazard corridors.
- Accessibility Metrics: Prioritizing the needs of populations with mobility limitations or those lacking private vehicular transport.
A critical next step involves the formal integration of community engagement into the shelter-siting process. Local governments can translate the outputs of risk modeling into static shelter-siting maps to serve as baseline planning tools. However, technical modeling must be complemented by collaboration with residents, grassroots organizations, and emergency management officials to identify sites that are not only safe but also trusted and culturally relevant.
Community participation does more than refine site accuracy; it fosters public confidence, heightens situational awareness, and builds a sense of local ownership in disaster preparedness.
Finally, the methodology presented here is designed for regional scalability. Applying this framework to other North Carolina counties or the broader Appalachian region would provide a standardized approach for emergency management agencies. This would support the strategic development of multi-purpose facilities designed to serve immediate disaster response needs while advancing long-term community resilience objectives.
Author Contributions
Conceptualization, S.-E.C., J.W., K.H.E., T.L., S.R. and S.M.B.; methodology, K.H.E., T.L., S.R. and S.M.B.; validation, K.H.E., T.L., S.R. and S.M.B.; formal analysis, K.H.E., T.L., S.R. and S.M.B.; investigation, K.H.E., T.L., S.R. and S.M.B.; resources, J.W.; data curation, K.H.E., T.L., S.R. and S.M.B.; writing—original draft preparation, K.H.E., T.L., S.R. and S.M.B.; visualization, K.H.E., T.L., S.R., S.M.B. and S.-E.C.; supervision, J.W.; project administration, S.-E.C. All authors have read and agreed to the published version of the manuscript.
Funding
This research received no external funding.
Institutional Review Board Statement
Not applicable for studies not involving humans or animals.
Informed Consent Statement
Not applicable.
Data Availability Statement
The original contributions presented in this study are included in the article. Further inquiries can be directed to the corresponding author.
Acknowledgments
The authors would like to acknowledge Kelsey Pieper for sharing her experiences with the aftermath of Hurricane Helene.
Conflicts of Interest
The authors declare no conflicts of interest.
Abbreviations
| FEMA | Federal Emergency Management Agency |
| IMERG | Integrated Multi-satellite Retrievals for GPM |
| GPM | Global Precipitation Measurement |
| LHD | Local Health Departments |
| DHHS | Department of Health and Human Services |
| DSS | Decision Support System |
| HAND | Height Above Nearest Drainage |
| DM | Disaster Management |
| PPRR | Prevention, Preparedness, Response, and Recovery |
| AFP | Assumed Flooding Potential |
| DRI | Disaster Resilience Index |
| NGO | Non-government Organization |
| EPA | Environmental Protection Agency |
| EBCI | Eastern Band of Cherokee Indians |
| TIGER | Topological Integrated Geographic Encoding and Referencing |
| ACS | American Community Survey |
| NAD | North American Datum |
| EPSG | European Petroleum Survey Group |
| %Wet | Percentage of Inundated Area in Block Group |
| Wet_Area | Total Inundated Area in Block Group |
| BlockGroupArea | Area Within a Block Group |
| HazardScore | Hazard Score in the Range of 0 to 5 |
| GIS | Geographical Information System |
| NHGIS | National Historical Geographical Information System |
| SEVI | Shelter Vulnerability Index |
| AI | Artificial Intelligence |
| LULC | Land-use/land-cover |
| DI | Degree of Importance |
| NLCD | National Land Cover Database |
| Exposurei | Exposure Index |
| Area Occupied by LULC | |
| FRI | Flood Risk Index |
| DEM | Digital Elevation Model |
| MCE | Multi-Criteria Evaluation |
References
- Halverson, J.; Livingston, I. Hurricane Helene: Science and impacts of a superstorm. Weatherwise 2025, 78, 16–25. [Google Scholar] [CrossRef] [Scilit]
- Pieper, K.J.; Beighley, E.; Jones, C.N.; Drewry, K.; Jamshidi, R.; Li, Y.; Michael, L.; Mize, W.; Fowlkes, J.; Blethen, A.; et al. Responding after Hurricane Helene: Rapidly Estimating Impacts to Environmental Health Services in North Carolina. Environ. Sci. Technol. Lett. 2025, 12, 820–826. [Google Scholar] [CrossRef] [Scilit]
- Inan, D.I.; Beydoun, G.; Othman, S.H. Risk assessment and sustainable disaster management. Sustainability 2023, 15, 5254. [Google Scholar] [CrossRef] [Scilit]
- Lin, S.; Chen, S.-E.; Rasanen, R.A.; Zhao, Q.; Chavan, V.; Tang, W.; Shanmugam, N.; Allan, C.; Braxtan, N.; Diemer, J. Landslide prediction validation in western North Carolina after Hurricane Helene. Geotechnics 2024, 4, 1259–1281. [Google Scholar] [CrossRef] [Scilit]
- Chen, S.-E.; Lin, S.; Rasanen, R.A.; Braxtan, N.; Allan, C.; Tang, W. Landslides and bridge damages in western North Carolina after Hurricane Helene. J. Perform. Constr. Facil. 2025, 39, 04025060. [Google Scholar] [CrossRef] [Scilit]
- Basu, R.; Chaudhary, S.; Deval, C.; Sayeed, A.; Herndon, K.; Griffin, R. Estimating disaster resilience of Hurricane Helene on Florida counties. arXiv 2024. [Google Scholar] [CrossRef] [Scilit]
- Hemphill, K. Helene Response—Sheltering and Business Recovery Operations; North Carolina Department of Public Safety: Raleigh, NC, USA, 2024.
- Stephenson, V.; Finlayson, A.; Morel, L.M. Risk-based approach to shelter resilience in rural Philippines. Geosciences 2018, 8, 76. [Google Scholar] [CrossRef] [Scilit]
- Disaster Cycle Services. RES Hurricane Evacuation Shelter Selection Standards; American Red Cross: Washington, DC, USA, 2018. [Google Scholar]
- United Architects of the Philippines-Emergency Architects (UAP-EA). Manuel on Alternative Temporary Shelters; MOVEUP: Manila, Philippines, 2020. [Google Scholar]
- Roxas, C.L.C.; Cruz, R.L.C.D.; De Pedro, J.P.Q.; Tamani, B.M.; Dungca, J.R.; Lejano, B.A.; Ongpeng, J.M.C. Development of Socially Sustainable Transitional Shelter Design in the Philippines. Int. J. Disaster Risk Reduct. 2024, 115, 105026. [Google Scholar] [CrossRef] [Scilit]
- Chilton, W.P.; Weiss, R.; Irish, J.L. Historical analysis of tropical and non-tropical induced flooding within the James River Basin, Virginia. J. Flood Risk Manag. 2024, 17, e12998. [Google Scholar] [CrossRef] [Scilit]
- Canale, C.; Barbaro, G.; Petrucci, O.; Minniti, F.; Foti, G. Compound river floods and sea storms: Forcings and Impacts. Water 2025, 18, 14. [Google Scholar] [CrossRef] [Scilit]
- Donado, Y.A.J.; Restrepo, C.; Cánovas, J.A.B.; Manchado, A.M.T.; Mora, M.A.Á.; Armas, M.C.; Stoffel, M. Hurricane-triggered cascading hazards: Geomorphic responses and flood hazard dynamics in a tropical mountain region. Geoophology 2026, 494, 110090. [Google Scholar] [CrossRef] [Scilit]
- Office of State Budget and Management (OSBM). Hurricane Helene Recovery Revised Damage and Needs Assessment; North Carolina Governor’s Office: Raleigh, NC, USA, 2024.
- Cutter, S.L.; Boruff, B.J.; Shirley, W.L. Social vulnerability to environmental hazards. Soc. Sci. Q. 2003, 84, 242–261. [Google Scholar] [CrossRef] [Scilit]
- De Brito, M.M.; Evers, M. Multi-criteria decision-making for flood risk management: A survey of the current state of the art. Nat. Hazards Earth Syst. Sci. 2016, 16, 1019–1033. [Google Scholar] [CrossRef] [Scilit]
- Richardson, C.A.; Beighley, R.E. Optimizing HAND parameters for rapid flood mapping. Front. Water 2024, 5, 1296434. [Google Scholar] [CrossRef] [Scilit]
- Tripathy, S.S.; Hamid, F.; Rostamkhani, H. A block-level categorical flood risk mapping to aid shelter location. J. Flood Risk Manag. 2025, 18, e70119. [Google Scholar] [CrossRef] [Scilit]
- Yarveysi, F.; Alipour, A.; Moftakhari, H.; Jafarzadegan, K.; Moradkhani, H. Block-level vulnerability assessment across the U.S. Nat. Commun. 2023, 14, 4222. [Google Scholar] [CrossRef] [Scilit] [PubMed]
- Chataut, S.; Bhatta, S.; Dahal, B.; Ojha, G.; Srijana, R.; Bigyan, S.; Bijay, B. Generative artificial intelligence in healthcare: A systematic review of GANs, diffusion models, large language models and variational autoencoders for medical applications. Eur. J. Appl. Sci. Eng. Technol. 2025, 3, 182–203. [Google Scholar] [CrossRef] [Scilit]
- Tripathy, S.S.; Vittal, H.; Karmakar, S.; Ghosh, S. Flood risk forecasting incorporating weather, topography, and land use. Adv. Water Resour. 2020, 146, 103785. [Google Scholar] [CrossRef] [Scilit]
- Karmakar, S.; Simonovic, S.; Peck, A.; Black, J. Information system for flood risk-vulnerability assessment. J. Geogr. Inf. Syst. 2010, 2, 129–146. [Google Scholar] [CrossRef]
- Montgomery, D.R.; Buffington, J.M. Channel-reach morphology in mountain drainage basins. Geol. Soc. Am. Bull. 1997, 109, 596–611. [Google Scholar] [CrossRef] [Scilit]
- Roe, G.H.; Montgomery, D.R.; Hallet, B. Orographic precipitation and mountain relief. J. Geophys. Res. 2003, 108, 2315. [Google Scholar] [CrossRef] [Scilit]
- Tarolli, P. High-resolution topography for understanding Earth surface processes: Opportunities and challenges. Geomorphology 2014, 216, 295–312. [Google Scholar] [CrossRef] [Scilit]
- Zhang, W.; Villarini, G.; Vecchi, G.A.; Smith, J.A. Urbanization exacerbated flooding during Hurricane Harvey. Nature 2018, 563, 384–388. [Google Scholar] [CrossRef] [Scilit]
- Wing, O.E.J.; Pinter, N.; Bates, P.D.; Kousky, C. New insights into U.S. flood vulnerability. Nat. Commun. 2020, 11, 1446. [Google Scholar] [CrossRef] [Scilit] [PubMed]
- McDermott, T.K.J. Global exposure to flood risk and poverty. Nat. Commun. 2022, 13, 6–8. [Google Scholar] [CrossRef] [Scilit]
- Khajehei, S.; Ahmadalipour, A.; Shao, W. A Place-based Assessment of Flash Flood Hazard and Vulnerability in the Contiguous United States. Sci. Rep. 2020, 10, 57349. [Google Scholar] [CrossRef] [Scilit] [PubMed]
- Ermagun, A.; Smith, V.; Janatabadi, F. High urban flood risk and no shelter access disproportionally impacts vulnerable communities in the USA. Commun. Earth Environ. 2024, 5, 2. [Google Scholar] [CrossRef] [Scilit]
- Sanders, B.F.; Schubert, J.E.; Kahl, D.T.; Mach, K.J.; Brady, D.; AghaKouchak, A.; Forman, F.; Matthew, R.A.; Ulibarri, N.; Davis, S.J. Large and inequitable flood risks in Los Angeles, California. Nat. Sustain. 2023, 6, 47–57. [Google Scholar] [CrossRef] [Scilit]
- Tyler, J.; Sadiq, A.A.; Noonan, D.S.; Entress, R.M. Decision making for managing community flood risks. Int. J. Disaster Risk Sci. 2021, 12, 649–660. [Google Scholar] [CrossRef] [Scilit]
- Kongsomsaksakul, S.; Yang, C.; Chen, A. Shelter location-allocation model for flood evacuation planning. J. East. Asia Soc. Transp. Stud. 2014, 6, 4237–4252. [Google Scholar]
- Alaeddine, H.; Serrhini, K.; Maizia, M.; Néron, E. Spatiotemporal optimization model for flood evacuation. Nat. Hazards Earth Syst. Sci. 2015, 15, 687–701. [Google Scholar] [CrossRef] [Scilit]
- Ahmadalipour, A.; Moradkhani, H. A data-driven analysis of flash flood hazard, fatalities, and damages over the CONUS. J. Hydrol. 2019, 578, 124106. [Google Scholar] [CrossRef] [Scilit]
- Bodoque, J.M.; Aroca-Jiménez, E.; Eguibar, M.Á.; García, J.A. Urban flood hazard mapping from LiDAR data. J. Hydrol. 2023, 617, 128975. [Google Scholar] [CrossRef] [Scilit]
- Jafarzadegan, K.; Moradkhani, H.; Pappenberger, F.; Moftakhari, H.; Bates, P.; Abbaszadeh, P.; Marsooli, R.; Ferreira, C.; Cloke, H.L.; Ogden, F.; et al. Recent advances in riverine and coastal flood modeling. Rev. Geophys. 2023, 61, e2022RG000788. [Google Scholar] [CrossRef] [Scilit]
- Alipour, A.; Shafei, B.; Smadi, O.; Zhang, N.; Lichty, B. Assessing and Enhancing Transportation Resilience for the State of Iowa; Final Report; InTrans Project 17-602; Iowa Department of Transportation: Ames, IA, USA, 2020.
- Chen, J.; Sayama, T.; Yamada, M.; Sugawara, Y. Regional event-based flood quantile estimation method for large climate projection ensembles. Prog. Earth Planet. Sci. 2024, 11, 16. [Google Scholar] [CrossRef] [Scilit]

Disclaimer/Publisher’s Note: The statements, opinions and data contained in all publications are solely those of the individual author(s) and contributor(s) and not of MDPI and/or the editor(s). MDPI and/or the editor(s) disclaim responsibility for any injury to people or property resulting from any ideas, methods, instructions or products referred to in the content. |
© 2026 by the authors. Licensee MDPI, Basel, Switzerland. This article is an open access article distributed under the terms and conditions of the Creative Commons Attribution (CC BY) license.