


Featured Application
The adaptation of cities to climate change is critical for ensuring public safety and well-being. Consequently, sustainable rainwater management and land-use planning that promote greener urban environments are indispensable.
Abstract
Climate change adaptation has become a central policy priority, requiring coordinated and systematic action. Cities, as areas highly exposed to climate-related risks, increasingly assume responsibility for implementing effective adaptation measures. In this context, municipalities are required to incorporate Urban Greening and Rainwater Management Concepts into their Climate Adaptation Plans. This paper presents a structured methodology for developing these strategic concepts as components of a City Adaptation Plan, in accordance with recent legislative mandates in Poland. Through case studies conducted in two Polish cities, we demonstrate an integrated approach that combines geospatial analysis, climate projections, planning document review, and participatory stakeholder workshops to produce comprehensive Greening and Rainwater Management Concepts. The methodology enables the identification of vulnerable areas and priority interventions for climate adaptation, strengthens the integration of nature-based solutions into urban planning, and reframes rainwater as a resource within urban systems. The resulting documents provide municipal authorities with an evidence-based framework for resilience planning, supporting funding applications and guiding future green infrastructure and drainage investments. The approach contributes to enhanced urban ecosystem services, improved flood mitigation and thermal regulation, participatory planning processes, and a stronger foundation for long-term urban resilience.
1. Introduction
The global population is projected to continue increasing over the next 50 to 60 years, reaching a peak of approximately 10.3 billion in the mid-2080s, compared with an estimated 8.2 billion in 2024 [1]. In contrast, according to the most recent population projections published by Eurostat, the population of the European Union is expected to decline by approximately 6% between 1 January 2022 and 1 January 2100, corresponding to a reduction of around 27.3 million people [2].
Nevertheless, irrespective of the projected demographic decline in Europe, global urbanisation trends continue to intensify. By 2025, approximately half of the world’s population is expected to reside in urban areas, and by 2050 nearly two-thirds of global population growth is projected to occur in cities, with the remainder taking place in towns [3]. Urban areas attract population inflows due to opportunities across multiple dimensions of development, including business, education, recreation, culture, innovation, creativity, and economic advancement [4,5]. The United Nations Development Programme notes that, although only about half of the global population currently lives in cities, urban areas generate more than 80% of global gross domestic product and are characterised by relatively young, working-age populations [6].
Urban development also generates significant environmental and social challenges. It is estimated that nearly 40% of global urban expansion may occur in informal settlements [6]. Urbanisation is closely associated with a range of environmental pressures, including air pollution [7,8]. For example, in 2022, 96% of the urban population in the European Union was exposed to concentrations of fine particulate matter (PM2.5) exceeding the guideline values established by the World Health Organization [9]. In addition, material-related greenhouse gas emissions from residential and commercial buildings were estimated at approximately 750 Mt CO2 equivalent in 2020, representing around 22% of global building material emissions. Under a middle-of-the-road baseline scenario, these emissions are projected to increase to approximately 2.4 Gt CO2 equivalent by 2060, corresponding to about 51% of total building material emissions [10]. These trends indicate a substantial and continuing increase in the sector’s emissions burden.
Cities are particularly exposed to natural hazards, as many are located along coastlines, within river valleys, or on hillsides [11,12,13,14,15]. In addition, numerous urban areas face challenges associated with ageing infrastructure and resource constraints, including the vulnerability of critical technical systems [16,17,18]. As densely populated environments with highly concentrated assets and infrastructure, cities are especially susceptible to the impacts of climate change and related environmental phenomena, such as heatwaves, flash floods, and biodiversity loss [19,20,21].
Climate change significantly influences the urban hydrological cycle [22], altering precipitation regimes [23,24], surface runoff dynamics, and groundwater recharge processes [25,26,27], thereby posing increasing challenges to the resilience of both human systems and urban infrastructure [28]. These effects are further amplified by urban land-use characteristics, particularly the high proportion of impervious surfaces, which increase runoff generation, reduce infiltration capacity, and shorten hydrological response times [29,30]. In addition, the magnitude and frequency of extreme rainfall events have increased in recent decades across various regions [31]. This intensification of heavy precipitation constitutes a major driver of flash flooding in urban environments.
These phenomena pose persistent challenges across Europe, particularly in mountainous and upland regions where exposure and vulnerability are often elevated. For example, research by Kundzewicz et al. [32] indicates an upward trend in the frequency of major floods, accompanied by substantial interannual and decadal variability. The European Academies Science Advisory Council (EASAC) likewise identified global trends in natural disasters between 1980 and 2016 using data from Munich Re NatCatSERVICE, one of the world’s largest catastrophe databases, comprising more than 40,000 recorded events [33]. Their analysis demonstrates a pronounced increase in hydrological events, including floods and mass movements, relative to geophysical, meteorological, and climatological hazards.
Similarly, an assessment based on the EM-DAT database shows that during the period from 2001 to 2020, Europe experienced 999 recorded natural disaster events, of which 951 were weather-related [34]. Collectively, these events resulted in more than 150,000 fatalities, affected over 11 million people, and caused economic losses exceeding USD 217 billion. Floods were the most frequent hazard type, accounting for approximately 41% of all recorded events.
Another major climate-related hazard associated with ongoing warming is heatwaves (HWs), which are among the most destructive and lethal climate extremes projected to affect human societies in the coming decades [35]. Climate model projections indicate that heatwaves are expected to increase in both frequency and intensity under continued global warming. These extreme temperature events also exacerbate the Urban Heat Island (UHI) effect by enhancing nocturnal heat retention and limiting opportunities for thermal relief. For urban areas, it is therefore essential to assess the magnitude and spatial variability of the UHI, as well as the combined and interacting effects of UHI and heatwaves. Understanding the dynamics and feedback mechanisms between these phenomena is critical for effective urban climate adaptation, the protection of public health, and the planning of resilient infrastructure [36,37].
Recognising these challenges, many countries are seeking to strengthen resilience and enhance climate change adaptation efforts [38], with one key approach being the adoption of new legislation and policy frameworks specifically addressing adaptation [39,40]. Cities play a central role in this process, as they possess institutional, administrative, and regulatory autonomy that enables them to function as primary governance units, often responding more rapidly than national governments. Municipal and metropolitan authorities are therefore well positioned to design, tailor, and implement policies that address both global climate pressures and local environmental conditions.
In Poland, numerous climate adaptation initiatives have been undertaken across scientific, social, and legislative domains. Among the most significant are those related to the development of City Adaptation Plans. The foundations of this process were established through the first national manual for the preparation of City Adaptation Plans [41], followed by the implementation of the MPA44 project [42]. At present, national legislation requires the preparation of a City Adaptation Plan for every city with a population exceeding 20,000 inhabitants [43]. This obligation was introduced by the Act of 27 November 2024 amending the Environmental Protection Law and certain other acts, which entered into force on 11 January 2025.
In parallel, the regulation mandates the preparation of two additional strategic documents to accompany the City Adaptation Plan: a Greening Concept and a Rainwater and Snowmelt Water Management Concept. This requirement reinforces the systematic integration of nature-based solutions (NBS) within local climate adaptation governance and embeds urban water management within a broader resilience framework. Both documents promote a transition from conventional grey infrastructure approaches toward multifunctional green and blue infrastructure systems by providing municipal authorities with concrete examples of such measures.
In particular, they support the reconceptualisation of surface runoff not solely as wastewater requiring rapid drainage, but as a strategic urban resource that can be retained, infiltrated, reused for non-potable purposes, or gradually released to mitigate peak flows. Surface runoff is increasingly recognised as a valuable water resource that can contribute to groundwater recharge, landscape irrigation, and urban ecosystem restoration [44,45,46,47]. Evidence from pilot projects demonstrates that relatively simple treatment techniques can improve runoff water quality to meet standards suitable for certain domestic and agricultural applications, particularly in water-scarce rural contexts [48]. Reviews and case studies further highlight NBS as cost-effective, long-term solutions that trap pollutants, enhance infiltration, support groundwater recharge, and strengthen water security under drought and climate stress [49,50,51].
By emphasising nature-based solutions, the concepts prioritise interventions such as urban tree planting, permeable surfaces, retention basins, rain gardens, restored watercourses, and green roofs. These measures contribute simultaneously to hydrological regulation, urban heat mitigation, groundwater recharge, biodiversity enhancement, and improvements in public space quality. In this sense, green and blue infrastructure is framed not as an aesthetic add-on, but as a multifunctional system delivering measurable ecosystem services, including rainwater retention, peak flow reduction, microclimatic cooling, habitat creation, and improvements in human well-being.
Greening is now widely framed as a core climate adaptation solution; however, its integration into urban planning through formal legal frameworks remains partial and uneven across countries. Notable examples can be found in Scandinavia, where Sweden, Norway, and Denmark have embedded urban greening and green infrastructure within their spatial planning systems at both national and local levels [52]. In Denmark, a key instrument is the Green Map of Denmark (Grønt Danmarkskort) [53], a nationwide ecological network initiative under which, since 2017, every municipal plan is required to designate existing and potential green areas and ecological corridors in accordance with national criteria and guidance. In Norway, the Planning and Building Act (2008) explicitly integrates urban greening by defining “green structure” as a distinct land-use category encompassing parks, natural areas, green corridors, and recreational spaces, supported by several guidelines that assist in the effective design and management of urban greenery [54]. Sweden’s Planning and Building Act (PBA) similarly incorporates urban greening through municipal planning mandates, while national environmental policies further reinforce this approach. In particular, Sweden’s Environmental Quality Objectives (Miljömål) include explicit targets related to sustainable cities and biodiversity conservation, underscoring the role of urban green spaces as providers of ecosystem services and climate resilience [54,55].
In Poland, although a legal obligation exists, there is still no officially standardised framework for the preparation of a Greening Concept, which makes the establishment of good practice examples and practical guidelines particularly important. Research by Baravikova (2020) [56] demonstrates that the uptake of contemporary greening approaches, such as Nature-Based Solutions (NbS), Blue-Green Infrastructure (BGI), and Ecosystem-Based Adaptation (EbA), remains uneven and conceptually ambiguous across Polish cities. Additionally, this uptake remains uneven at the global scale, with developing countries often lagging behind [57]. Barriers to wider adoption include, among others, fragmented methodologies, limited evidence regarding effectiveness, governance constraints, financial limitations, and insufficient stakeholder engagement [58,59].
These barriers also arise from uncertainty concerning the definition and scope of greening approaches, as well as from difficulties in translating international concepts into local planning practice. As a consequence, many municipal documents focus primarily on conventional measures, such as tree planting or park creation, without systematically accounting for the multiple ecosystem services that can be delivered through more integrated and multifunctional greening interventions. Therefore, methodological clarity and the dissemination of good practice examples are of particular importance.
Studies of climate policies in Polish cities indicate that, although many municipalities have adopted adaptation plans and strategies, the implementation of rainwater management measures remains inconsistent and, in some cases, largely symbolic, effectively rendering these documents a “dead letter” [60]. The Polish case is not unique. Reviews of urban drainage adaptation demonstrate that, although numerous case studies examine specific technical solutions, genuinely integrated, city-scale planning that systematically addresses both climate change and urbanisation remains limited. Furthermore, comprehensive maintenance strategies, as well as flood forecasting and early warning systems, are still underrepresented in both research and practice [61].
The aim of this study is to present an approach for preparing a Greening Concept and a Rainwater Management Concept that is beneficial for cities and can serve as a prerequisite for obtaining financial support for subsequent technical and infrastructural projects. For this reason, it is essential to clearly identify the most vulnerable areas and the most pressing urban challenges. Given that these two strategic documents remain relatively recent and still uncommon in practice, the study also seeks to demonstrate a transparent and transferable methodology that may be applied by a wider audience of practitioners, planners, and policymakers.
As integral components of City Adaptation Plans, these concepts also have a significant social dimension, as much of the material is developed through stakeholder engagement processes and informed by issues raised directly by local communities. Highlighting good practice examples is therefore particularly important. Although Poland may be considered a pioneer in formally regulating these issues through national legislation, presenting a clear and robust methodology is equally important at the domestic level, as the absence of detailed and standardised implementation guidelines may result in variable and, at times, disputable document quality. This risk is further amplified by the fact that the preparation of City Adaptation Plans is subject to open-market procurement procedures, where cost considerations may prevail over substantive quality.
2. Materials and Methods
This study is based on two study cases in Polish cities, Sosnowiec and Czechowice-dziedzice, for which City Adaptation Plans were prepared by team of Institute for Ecology of Industrial Areas. Both cities are located in southern Poland in the Silesian Voivodeship (Figure 1).
Figure 1.
Location of both cities, i.e., Czechowice-Dziedzice and Sosnowiec, within the Silesian Voivodeship and Poland.
Czechowice-Dziedzice is a town located in the southern part of the Silesian Voivodeship, in the northern part of Bielsko County. The area of the town covers 32.9 km2, while the total area of the municipality is 33.1 km2. In this study, both areas were analysed, as many issues—particularly those related to climate adaptation and water management—extend beyond the administrative boundaries of the town and require a municipality-wide perspective. Czechowice-Dziedzice is situated approximately 50 km from Katowice. According to data from Statistics Poland (GUS), the population of the city of Czechowice-Dziedzice in 2024 was 34,564.
The area of Czechowice-Dziedzice is situated within the right-bank catchment of the Vistula River [62,63]. The Biała River forms the eastern boundary of the municipality, whereas the Vistula flows through its northern part and, together with the Goczałkowice Reservoir, constitutes the northern boundary. Drainage is divided accordingly: approximately 60% of the area is drained by the Iłownica River and its tributaries, the Jasienica and the Wapienica, while the remaining 40% is equally shared between the Biała River and direct discharge into the Vistula River [63,64]. Several smaller rivers and streams flow through the municipal area, including the Młynka, Świerkówka, Borówka, Wałówka, Krzywa, and the Czechowice Stream. Most river channels are currently regulated; however, in certain locations primarily along smaller streams and watercourses, oxbow lakes have developed, hosting rare and valuable plant species.
The city and municipality of Czechowice-Dziedzice are characterised by a high degree of landscape diversity, resulting, among other factors, from substantial variations in relative elevation, a dense river network, numerous fishponds located in river valleys, and rich natural assets. The largest share of the city’s area is occupied by arable land (30% of the area of Czechowice-Dziedzice), followed by grassland vegetation, which covers 15% of the area, while forests and wooded areas account for approximately 16%. The remaining land-use categories represent only a minor proportion of the city’s area (less than 1%). The city of Czechowice-Dziedzice contains a diverse network of green areas, including parks, forests, riparian zones, ecological sites, nature reserves, Natura 2000 protected areas, agricultural land, and sport and recreational complexes [63,64]. Green areas also comprise small urban green spaces, greenery surrounding heritage buildings, residential greenery, cemetery areas, and allotment gardens. In recent years, the municipality has established new urban parks and created the Centre for Ecology and Green Areas [65].
Sosnowiec is a city with county (powiat) rights in southern Poland’s Silesian Voivodeship, covering about 91 km2 and populated by approximately 185 thousand inhabitants as of 2024. Geographically, it lies on the Silesian Upland at the intersection of the Bytom-Katowice Plateau, the Mysłowice Basin, and the Dąbrowa Upland, with elevation ranging from above 300 m in its northern parts down to ~237 m in the south at the confluence of the Czarna Przemsza and Biała Przemsza rivers (a total relief of ~80 m) [66].
The city falls entirely in the Vistula basin: the Czarna Przemsza and Biała Przemsza flow through Sosnowiec and join within its limits to form the Przemsza, with additional tributaries such as the Brynica (with the Rawa) and local streams like the Bobrek and Zagórski Potok draining the urban area [67,68]. Decades of industrialisation have heavily modified the hydrography, the rivers are regulated in concrete channels, and numerous artificial water bodies occupy subsidence depressions and former excavations; about 81 ponds (e.g., the Stawiki, Balaton, Smug, and Leśny reservoirs) now dot the city, many formed by mine subsidence or sand mining and serving recreation or wetland habitat functions.
In terms of land cover, roughly one-fifth of Sosnowiec’s area is agricultural land (~1888 ha or 21%) and a similar share is occupied by forests and woodland (~1842 ha or 20%), with the remaining ~59% consisting of built-up and other urban land (transport corridors, water, wasteland). Urban green spaces are well represented: over 22.5 km2 of the city (nearly one-quarter of its area) is green infrastructure in the form of parks, squares, housing-estate greenery, urban forest and other public green areas [69]. This includes numerous city parks (several of them historic, with five parks protected in the regional heritage register) as well as tree-lined cemeteries and allotment gardens that together constitute an important component of the urban landscape.
The city’s open spaces also encompass ecologically valuable sites: for instance, the Torfowisko Bory peat bog in eastern Sosnowiec (a Natura 2000 habitat area of ~6.7 ha) preserves rare wetland flora, and semi-natural wet meadows along the unchannelled Biała Przemsza in Stare Maczki support protected orchid species and beaver activity in a partially intact riparian ecosystem.
2.1. Methodological Framework for the Greening Concept
The Urban Greening Concept was developed as part of the municipal Climate Change Adaptation Plan using an integrated, GIS-based methodology that combined spatial analysis, remote sensing, planning document review, and stakeholder input [70]. An initial spatial inventory of green and blue-green infrastructure was conducted using national land-use datasets (BDOT10k) to map the structure and extent of green areas, including forests, grasslands, agricultural land, allotment gardens, and urban green spaces. These data were subsequently used to generate maps of green space distribution, biologically active surfaces, and blue-green infrastructure resources.
To assess vegetation condition and surface moisture status, Landsat 8/9 satellite imagery was processed to derive the Normalised Difference Vegetation Index (NDVI) [71] and the Normalised Difference Moisture Index (NDMI) [72]. These indices enabled the identification of areas characterised by dense, healthy vegetation, as well as zones exhibiting vegetation stress.
Tree-related characteristics were analysed through the preparation of tree inventory and tree density maps [73], expressing the number of trees per hectare across the city. Green space indicators were additionally calculated and mapped at the level of individual cadastral units to identify intra-urban disparities in green cover and retention capacity.
To account for spatial planning constraints, green space distribution was overlaid with Local Spatial Development Plans [64,68], resulting in maps illustrating green areas according to planning designation, as well as spatial patterns of land-use change, including gains and losses of green and agricultural land.
In addition, maps of protected areas and ecologically valuable sites were produced to account for existing conservation frameworks. The spatial analyses were synthesised into a green space deficit and priority intervention map. Finally, a conceptual green connectivity map was developed to identify existing and potential ecological corridors linking urban green spaces with surrounding natural areas.
Concurrently, a thorough review of the city’s strategic and planning documents was undertaken to ensure the alignment of the greening concept with existing policies and development plans. Key municipal documents, including the City Development Strategy [74,75], Environmental Protection Programme [63,66], and local Spatial Development Plans [64,68], were analysed for relevant guidelines and targets, as they consistently underscore the need to expand urban green infrastructure to enhance climate resilience.
This document review was coupled with an assessment of current BGI initiatives and land-use regulations; for example, existing local plan designations were overlaid with the green cover map to identify gaps or recent losses in green space (a comparative analysis showed modest declines in total green areas due to new development). Stakeholder participation formed an integral part of the methodology: interdisciplinary workshops were held with city officials, planners, and experts to incorporate local knowledge and priorities. During these sessions, a SWOT analysis of the city’s green infrastructure was conducted collaboratively, evaluating internal strengths and weaknesses (e.g., existing natural assets, maintenance constraints) and external opportunities and threats (e.g., funding prospects, urbanisation pressures). The process also included public consultation steps to gather community feedback on proposed greening measures, ensuring the concept reflected residents’ needs.
This combination of geospatial analysis, policy review, and stakeholder input yielded a comprehensive Urban Greening Concept (Table 1) that integrates scientific assessments with local planning context, providing a robust framework for enhancing green–blue infrastructure and reducing climate vulnerability in cities.
Table 1.
Summary of the methodological framework and main data sources used in the preparation of the Urban Greening Concept.
2.2. Methodological Framework for Rainwater and Snowmelt Water Management
The Concept of Rainwater and Snowmelt Water Management was developed as a strategic, municipality-scale assessment supporting the City Adaptation Plans of cities. The methodology combined spatial analyses, climate projections, infrastructure diagnostics, and stakeholder input to identify priority areas and define adaptation-oriented measures [70] (Table 2).
The climatic component focused on both pluvial (rainfall-related) and nival (snow-related) processes relevant to urban drainage and flood risk. Climate projections were derived from the national Klimada 2.0 project implemented by the Institute of Environmental Protection—National Research Institute (IOŚ-PIB) [76]. The analyses covered two climate scenarios, RCP 4.5 [77] and RCP 8.5 [78], and multiple future time horizons (2021–2030, 2031–2040, 2041–2050, and long-term projections up to 2095).
The following indicators were examined: annual and monthly precipitation totals, number of precipitation days, frequency of heavy rainfall events (≥10 mm and ≥20 mm per day), number of snow-cover days, and average snow-cover thickness. These indicators were used to assess projected changes in rainfall intensity, seasonality, and snowmelt dynamics relevant to urban runoff generation.
Hydrographic conditions were assessed using national spatial datasets, including the ISOK flood hazard maps [79,80] and hydrographic data provided by PGW Wody Polskie. A high-resolution LiDAR-derived Digital Terrain Model (DTM) obtained from the national Geoportal (1 m spatial resolution) was employed within a GIS environment to analyse surface drainage patterns, identify natural flow paths, and delineate endorheic depressions, defined as non-draining basins. The depth and volume of these depressions were calculated to estimate their potential role in water retention and accumulation during extreme rainfall and flood events. Land cover and land sealing were examined using European Environment Agency (EEA) imperviousness datasets [81] and national environmental databases to quantify runoff potential and identify priority areas for retention-oriented interventions.
Flood hazard and exposure were evaluated using a combination of ISOK flood hazard maps (Q1% and Q0.2% scenarios), remote sensing observations, and empirical records of past flood incidents. Satellite-based flood extent mapping derived from ICEYE [82] and Sentinel-1 imagery was used to analyse the spatial extent of recent flood events, including the September 2024 flood, and to compare observed inundation patterns with modelled flood-prone areas.
In addition, locations of flood-related interventions were mapped using operational records provided by the National Fire Service (Państwowa Straż Pożarna) [83]. These data comprise georeferenced reports of emergency responses to flooding, water accumulation, and related incidents, and were used to identify recurrent problem areas not fully captured by standard flood hazard maps. The integration of these intervention records enabled validation of modelled flood risk, improved identification of pluvial flooding hotspots, and prioritisation of intervention zones where repeated emergency responses indicate systemic drainage or retention deficiencies.
Table 2.
Summary of the methodological framework and main data sources used in the preparation of the Rainwater Management Concept.
3. Results
In the following sections, the results obtained for both concepts are presented. The collected materials enable an in-depth diagnosis [84] and the identification of vulnerable areas requiring targeted climate adaptation interventions. The proposed methodology may be applied not only in Polish cities but also in other contexts, including developing countries where adaptation measures are under consideration or in the early stages of implementation.
3.1. Urban Greening Concept
In the initial stage of preparing the Urban Greening Concept, the existing condition of green areas within the city was assessed. This process involved mapping the spatial distribution of green spaces and biologically active surfaces, together with a detailed inventory of green infrastructure based on available strategic and planning documents. Figure 2a,b illustrate the green area resources in the two case study cities, Czechowice-Dziedzice and Sosnowiec.
Figure 2.
Green space resources in the cities (a) Czechowice-Dziedzice; (b) Sosnowiec.
Cities contain a diverse network of green areas, including parks, forests, riparian zones, ecological sites, nature reserves, Natura 2000 protected areas, agricultural land, and sports and recreational complexes. Green infrastructure also encompasses smaller urban green spaces, vegetation surrounding heritage buildings, residential greenery, cemeteries, and allotment gardens. Collectively, these areas provide a wide range of ecological services that support urban ecosystems and enhance the well-being of residents. However, despite this diversity, certain districts remain significantly deprived of greenery, resulting in spatial inequalities in access to ecosystem services.
Local Spatial Development Plans were further analysed to identify areas designated for green or agricultural use (Figure 3). Based on BDOT10k data and land-use classifications specified in these plans, percentage changes in land-use areas were calculated. For example, in Czechowice-Dziedzice, this comparison indicated a decrease in agriculturally used land of approximately 23% and a reduction in green areas of about 2%.
Figure 3.
Land-use designation within areas covered by Local Spatial Development Plans within the city of Czechowice-Dziedzice.
Information on the spatial distribution and height of trees is of particular importance for assessing thermal comfort, human well-being, and urban water-retention capacity. Figure 4 presents a tree cover map for Czechowice-Dziedzice, identifying areas with mature, high-value trees that provide substantial shading through well-developed canopies. These areas are predominantly concentrated in the southern and south-western parts of the city. In contrast, the central part of the city is characterised by a limited presence of trees or by vegetation dominated by small, low-height individuals.
Figure 4.
Map of tree distribution and tree height in Czechowice-Dziedzice.
High-resolution Tree Cover Density (TCD) maps for Czechowice-Dziedzice and Sosnowiec provide a detailed picture of the structure, distribution, and potential ecosystem services of urban vegetation (Figure 5a,b). The spatial pattern of tree cover in Czechowice-Dziedzice reveals a city strongly shaped by its natural landscape. The southern and southwestern areas exhibit the highest canopy densities (75–97%), corresponding to extensive forest complexes, semi-natural habitats, and riparian vegetation. In contrast, the central and northern districts show markedly lower TCD values (42–62%), reflecting compact urban structures, industrial areas, and transportation corridors. Tree cover within the city core is fragmented, although green corridors along rivers and streams remain evident.
Figure 5.
Tree cover densities in 2023 in the cities: (a) Czechowice-Dziedzice; (b) Sosnowiec.
Tree cover in Sosnowiec presents a distinctly different pattern. Although the city’s mean TCD is higher (34.44%), the distribution is highly uneven. Most of the urban surface is characterised by low canopy density (42–62%), corresponding to dense built-up districts, post-industrial areas, and an extensive road network. The comparison of both cities demonstrates that a higher average canopy cover does not necessarily translate into more effective ecological performance. Czechowice-Dziedzice benefits from large, continuous forested areas that enhance cooling and ecological connectivity, despite having a lower mean TCD. Sosnowiec, conversely, exhibits a higher mean TCD but weaker functional greening, as tree cover is concentrated along the urban margins rather than within the densely developed city core.
This spatial pattern highlights a pronounced intra-urban disparity in tree cover, with direct implications for thermal comfort, ecosystem service provision, and climate-adaptation potential. Areas with low tree density should therefore be considered priority zones for targeted greening interventions, particularly in densely built-up districts.
Vegetation and plant moisture indicators derived from Landsat 8 and Landsat 9 satellite imagery are presented in Figure 6a, Figure 6b, Figure 7a and Figure 7b, respectively. The Normalized Difference Vegetation Index (NDVI) is one of the most widely used remote sensing indicators for assessing vegetation condition and health. NDVI values range from −1 to +1, with vegetated areas typically exhibiting positive values between 0.2 and 1 [85,86,87]. High NDVI values, generally above 0.5, indicate dense and healthy vegetation, whereas low or negative values correspond to the absence of vegetation, water bodies, bare rock, or artificial surfaces. NDVI is particularly useful for monitoring seasonal vegetation dynamics, drought conditions, crop productivity, and land-cover changes [87,88,89].
Figure 6.
Map of NDVI index distribution in: (a) Czechowice-Dziedzice; (b) Sosnowiec.
Figure 7.
Map of NDMI distribution in: (a) Czechowice-Dziedzice; (b) Sosnowiec.
The Normalized Difference Moisture Index (NDMI) is a remote sensing indicator used to assess water content in vegetation. It is particularly useful for monitoring plant water stress, crop condition, and forest fire risk [90]. High NDMI values indicate vegetation with a high water content, whereas low values reflect drying or degradation of the vegetation cover. NDMI is commonly used to analyse temporal changes in soil and vegetation moisture and is often applied in combination with other indicators, such as NDVI, in advanced environmental assessments. As in the case of NDVI, green areas with moderate, high, and very high vegetation cover are particularly well distinguished by this index.
3.2. Concept of Rainwater and Snowmelt Water Management
The objective of the Concept of Rainwater and Snowmelt Water Management was to present the hydrological and environmental conditions relevant to urban water management, the drainage methods currently applied, the risks associated with projected climatic and hydrological changes, and recommendations aimed at reducing the risk of local flooding. Selected excerpts from the concepts developed for the two cities are presented below, highlighting the key issues identified for each municipality.
First, the hydrographic conditions were characterised. In the case of Czechowice-Dziedzice, this step was particularly important, as the city is highly prone to flooding due to its geomorphological setting and dense network of rivers and streams. During the preparation of the document, the municipality experienced both fluvial flooding and intense pluvial flooding associated with Storm Boris. Figure 8a,b present the hydrographic conditions of the municipality. Figure 8a illustrates the distribution of rivers, lakes, streams, and canals, while Figure 8b shows the network of drainage (melioration) ditches.
Figure 8.
Hydrographic conditions of the Czechowice-Dziedzice municipality: (a) distribution of rivers, lakes, streams, and canals; (b) distribution of drainage ditches.
A characteristic feature of Czechowice-Dziedzice is the presence of numerous water bodies, which constitute a significant hydrological component of the area. In terms of surface area, standing waters, including reservoirs, artificial fishponds, and small ponds, collectively cover 6.4% of the municipality. Water ditches perform a dual function, contributing both to the drainage of excess water and to water retention during periods of drought. Within the municipality, roadside ditches and drainage (melioration) ditches can be distinguished (Figure 8b):
- Roadside ditches are technical elements of the road infrastructure and form part of the road right-of-way. They convey runoff from road surfaces and protect roads from flooding during periods of intense rainfall and snowmelt;
- Drainage (melioration) ditches are primarily used to drain land; however, in some cases they can also facilitate irrigation during droughts through the use of dedicated weirs and sluices. The depth of these ditches ranges from 0.6 m to 1.5 m, while the width of the ditch bottom depends on the volume of flowing water and varies between 0.5 m and 2.5 m. According to the BDOT10k database, a total of approximately 210 km of water ditches are present within the municipality. The vast majority of these ditches are located in the central and western parts of the municipality and serve to drain areas used primarily for forestry and agricultural purposes.
Figure 9 presents the approximate spatial distribution of areas affected by flooding in September 2024. The map indicates that both the urban core located in the central and right-hand parts of the figure and the wider municipality were impacted by the flood. Extensive inundation occurred in the vicinity of rivers and lakes, while numerous smaller overflow areas were dispersed across the entire municipality of Czechowice-Dziedzice. This spatial pattern suggests the combined influence of fluvial flooding associated with river overbank flow and pluvial flooding driven by intense rainfall overwhelming local drainage systems.
Figure 9.
Approximate map illustrating the extent of flooding on 17 September 2024 based on Sentinel-1 satellite data.
Figure 10a illustrates the spatial extent of flooding on 17 September 2024 in Czechowice-Dziedzice and its impact on the built environment. Based on Sentinel-1 satellite data and BDOT10k building records, floodwaters affected extensive areas along river corridors and low-lying zones, with more than 8000 buildings located within the flood extent, including both residential and non-residential structures. It was identified that river flood waves result from intensified surface runoff. On the Vistula River, at the level of Czechowice-Dziedzice, major flood events are most often caused by widespread rainfall of moderate intensity lasting several days, typically occurring during the June–August period.
Figure 10.
Impact of flooding: (a) Flood extent in the city of Czechowice-Dziedzice on 17 September 2024, illustrating buildings located within inundated areas; in total, more than 8000 buildings were situated within zones affected by floodwaters, based on Sentinel-1 satellite data. (b) Distribution of buildings in the city of Sosnowiec in relation to flood exposure under two probability scenarios.
Within the framework of the Concept of Rainwater and Snowmelt Water Management, probable fluvial flood hazard scenarios were also analysed. Although Sosnowiec has not experienced a major fluvial flood in recent years, these scenarios were examined as precautionary planning tools to assess potential future risk. Figure 10b presents flood hazard and building exposure in the city of Sosnowiec under four hydrological scenarios: embankment failure (Q 1%), dam damage or destruction, and the Q 1% and Q 0.2% flood probability scenarios corresponding to 100-year and 500-year return periods. The map displays administrative boundaries, the river network, and the distribution of residential and non-residential buildings based on BDOT10k data (26,848 buildings as of 31 December 2023). The largest inundation extent is associated with the dam failure scenario, followed by the 500-year and 100-year floodplains. Exposure analysis indicates that 64 buildings would be affected under the embankment failure scenario, 890 under dam failure, 16 within the 100-year floodplain, and 251 within the 500-year floodplain.
In general, within the Concept of Rainwater Management, surface runoff is identified as a key issue, as it significantly increases the risk of river flooding and is also critically important in the context of urban flash flooding resulting from intense rainfall. In the case of urban surface runoff, impervious areas were identified (Figure 11a,b). Both cities, namely Czechowice-Dziedzice and Sosnowiec, are characterised by a substantial extent of impervious surfaces.
Figure 11.
Spatial distribution of impervious surfaces highlighting the extent of sealed areas in (a) Czechowice-Dziedzice and (b) Sosnowiec.
Figure 12a,b identify closed and poorly drained surface depressions that may temporarily accumulate water during intense rainfall events. In Czechowice-Dziedzice City (Figure 12a), depression areas are predominantly concentrated along river valleys and in low-lying urban zones. The majority of identified depressions exhibit shallow water depths, typically below 0.4 m, although locally deeper depressions reaching 0.8–1.5 m are present, especially near regulated watercourses, former floodplain areas, and zones with dense drainage infrastructure.
Figure 12.
Maps of local depression areas within: (a) the Czechowice-Dziedzice municipality; (b) the city of Sosnowiec.
In Sosnowiec (Figure 12b), potential depression areas are more widespread and spatially fragmented, reflecting the highly transformed urban and post-industrial landscape. Pronounced clusters of depressions occur in the southern and central parts of the city, including areas affected by mining subsidence and extensive land sealing. While most depressions are shallow (generally < 0.5 m), several zones exhibit potential water depths exceeding 1.0 m, with isolated depressions reaching depths greater than 30 m, indicating a markedly elevated risk of localised water accumulation during extreme rainfall. Overall, the average depth of the identified depressions is approximately 3 m, and the deepest features are most likely associated with former resource extraction sites and post-industrial excavations.
Overall, the maps demonstrate that both municipalities are characterised by numerous shallow but spatially extensive depressions capable of generating urban flash flooding during intense precipitation. Areas where local depressions overlap with impervious surfaces are particularly vulnerable, and these locations should be prioritised for the planning and implementation of future climate adaptation measures.
Figure 13a,b present the spatial distribution of flood-related intervention sites. By jointly analysing impervious surface coverage, local topographic depressions, flow directions, and recorded emergency interventions, areas of elevated flood risk can be precisely identified. This integrated expert assessment provides a robust evidence base for municipal spatial planning, supporting the prioritisation of adaptation measures within local development plans, investment programmes, and climate adaptation strategies. On this basis, targeted projects and site-specific interventions related to local climate adaptation can be effectively designed, justified, and incorporated into municipal planning processes.
Figure 13.
Maps of Fire Service interventions related to flooding in: (a) the Czechowice-Dziedzice City; (b) the city of Sosnowiec.
Subsequently, flood-prone areas can be compared with the sewer network (Figure 14a,b), as additional information from local water and wastewater utilities is essential for identifying the type of drainage system, whether combined or separated stormwater systems. Information on the age of infrastructure, operational failures, and planned modernisation is also critical for a comprehensive assessment. Coordinated planning between grey infrastructure investments, such as new sewer sections and system upgrades, and complementary, often more cost-effective blue–green infrastructure solutions is essential for the development of cities that are resilient to climate change.
Figure 14.
Maps distribution of sewer network in: (a) the Czechowice-Dziedzice municipality; (b) the city of Sosnowiec.
The Concept of Rainwater and Snowmelt Water Management also includes proposed measures aimed at improving local drainage conditions and addressing excess rainwater. These measures encompass both water retention through blue–green infrastructure installations adapted to the specific characteristics and scale of identified problem areas and, where justified, the implementation of technical solutions such as upgrades to the stormwater drainage and sewer network. All proposed actions were discussed and refined in close cooperation with interdisciplinary teams, including representatives of the municipal administration, local authorities, and experts in water management, environmental protection, crisis management, and municipal water and wastewater utilities. This collaborative process ensured technical feasibility and alignment with local planning frameworks and operational capacities.
4. Discussion
Urban greening and BGI are increasingly framed as core tools for climate adaptation, particularly for managing flood risk, heat, and water scarcity in cities [91,92]. They are promoted in relation to SDG 11 (sustainable cities) and SDG 13 (climate action), the New Urban Agenda, and national climate strategies—especially in Europe, North America, China, and selected Indian cities [57,93,94]—but their uptake and integration into planning remain uneven. Studies emphasise that BGI only functions as climate adaptation when it is embedded in statutory plans, design codes, and funding streams. Notable examples include Lisbon, Copenhagen, New York, Fort Lauderdale, Chennai, Kochi, and Kraków, where BGI is incorporated into master plans, zoning regulations, or designated “Adaptation Action Areas” [94,95]. This is why integrating concepts of urban greening and rainwater management into strategic city documents under clear legal regulations is essential, and why the methodology for preparing such documents is crucial for urban planners.
The barriers to implementing adaptation measures include unclear allocation of roles and responsibilities, fragmented planning, and a lack of secure budgets for operation, maintenance, and monitoring [96,97,98,99]. In the case of the City Adaptation Plan and both concepts, the documents are developed through a sequential and participatory process involving relevant stakeholders, which may facilitate the uptake of proposed adaptation scenarios. Moreover, the City Adaptation Plan and the associated concepts are subject to monitoring, which supports the implementation of the recommended actions.
The assessment of indicators related to urban green areas was conducted using publicly available spatial and statistical data, complemented by satellite imagery. Analysis of BDOT10k data indicates that green spaces account for 53.9% of the total area of the city of Sosnowiec (Figure 2b) and more than 61% of the area of the city of Czechowice-Dziedzice (Figure 2a). In Sosnowiec, the largest green-area classes are grassland vegetation and forests, each covering approximately 1770 ha. Together, these two classes represent 38.8% of the total city area. In Czechowice-Dziedzice, the largest share of the city area is occupied by arable land, accounting for approximately 30% of the total area. Grassland vegetation covers about 15% of the city, while forests and tree-covered areas together represent approximately 16% of the total area.
These findings confirm that the impact of urban expansion and urban sprawl on vegetation varies considerably between cities and depends on stages of urbanisation, historical development trajectories, and prevailing land-use patterns. Although green areas within urban environments, particularly in densely built city centres, may be substantially reduced during certain phases of development, such losses are not necessarily irreversible. Green space can be partially or even significantly restored at later stages through processes of re-greening, urban regeneration, and targeted conservation measures [100].
Across Europe, cities exhibit considerable variability in the proportion of land covered by green areas. On average, approximately 40–50% of urban land in Europe is classified as green space; however, this proportion varies substantially between cities [101]. Many northern and central European capitals display particularly high levels of green cover. For example, Oslo has approximately 72% of its municipal area designated as green space, the highest share among European capitals, while Stockholm and Bern report similarly high values of around 56% and 53%, respectively [102]. By contrast, densely built cities or those located in arid or semi-arid regions tend to have markedly lower levels of green coverage. Paris, for instance, has only about 16–20% of its land area classified as green space, whereas southern European capitals such as Athens and Nicosia report tree cover as low as approximately 10% and 4%, respectively [102].
In several cities, forests and woodlands constitute the largest share of urban green space. The high levels of green coverage observed in Oslo and Stockholm are largely attributable to protected forests and wooded hills located within municipal boundaries [103]. Similarly, Berlin contains extensive forested areas, covering approximately one-fifth of the city, alongside its well-known parks and green corridors [104]. In other European cities, a substantial proportion of green cover derives from agricultural land incorporated within administrative boundaries. Vienna provides a notable example, where vineyards, arable land, meadows, and the Vienna Woods collectively contribute to the city’s high green-space coverage [105,106].
Nevertheless, urbanisation undoubtedly exerts increasing pressure on both rural areas, where landscapes are becoming progressively less green and on central urban districts, which are subject to intensified soil sealing. Consequently, it is crucial for urban planning to continually remind planners and decision-makers that green infrastructure provides a wide range of ecosystem services [107]. These services include the provision of timber [108], carbon sequestration [108,109], flood regulation and protection [110,111], climate mitigation and regulation [112,113], improvements in air quality [114,115], noise reduction [116], food production [117,118], and employment opportunities [119]. In addition, green infrastructure delivers important cultural and social benefits, such as recreational opportunities [120,121], the strengthening of social cohesion [122], the promotion of physical activity [123], and improvements in human health and mental well-being [124,125]. Accordingly, within the framework of the Greening Concept, not only was an inventory of existing green areas conducted, but strategic directions for their future development were also formulated, with particular emphasis on maximising climate adaptation benefits and protecting the most valuable and ecologically significant areas.
In addition to the quantitative assessment of green areas and their spatial distribution within the city, qualitative information concerning the type and condition of urban green spaces was also analysed. Within the framework of the Greening Concept, several key parameters and indicators were evaluated, among which tree abundance and tree height proved to be particularly informative. It is well established that tree height and canopy size are critical determinants of climate-mitigation potential: large, dense crowns maximise cooling through shading and evapotranspiration, thereby reducing the intensity of the urban heat island (UHI) effect [125,126,127], while also enhancing carbon sequestration and storage benefits [128,129,130].
The NDVI and NDMI indices provide valuable information about the state and quality of green areas in urban environments. NDVI ranges from approximately −1 to +1, with higher values indicating denser and more vigorous green vegetation [131,132]. It is closely associated with photosynthetic activity, biomass, leaf area index, chlorophyll content, productivity, and fractional vegetation cover [133,134]. NDMI, on the other hand, incorporates near-infrared (NIR) and short-wave infrared (SWIR) spectral bands to estimate vegetation and soil moisture. Higher NDMI values generally indicate greater water content [135,136]. This index is particularly useful for monitoring plant water stress, drought conditions, canopy moisture, and soil moisture levels [137].
For example, the NDVI comparison between Czechowice-Dziedzice and Sosnowiec reveals clear differences in vegetation health, structure, and spatial distribution, reflecting their contrasting urban forms. Czechowice-Dziedzice, with a median NDVI of 0.566, exhibits more extensive and cohesive vegetation cover, particularly in the southern and western parts of the city. These areas include forests, grasslands, and agricultural land, contributing to consistently high NDVI values (above 0.6) across broad zones.
In contrast, Sosnowiec has a median NDVI of 0.480, indicating a more fragmented and lower-intensity vegetation profile. Vegetation in Sosnowiec is distributed in scattered patches, with higher NDVI values confined mainly to urban parks, river corridors, and forest remnants in the southern and eastern sectors. Much of the central and northern urban area is dominated by lower NDVI classes (0.2–0.4), consistent with dense urban development and limited open green space.
For Czechowice-Dziedzice, NDMI values from 13 satellite scenes averaged 0.251 (median 0.253, SD 0.121), indicating generally favourable moisture and low vegetation water stress. Most of the town falls within 0.20–0.40, reflecting moderate to high canopy cover. Higher NDMI (0.40–0.72) occurs in peripheral forests and semi-natural areas (Dolina Górnej Wisły, Pogórze Śląskie), while lower values (0.00–0.20) are concentrated in central urban zones with sparse vegetation, highlighting areas where green infrastructure could improve soil moisture and reduce stress. The NDMI map for Sosnowiec, derived from 9 satellite scenes, shows an average NDMI of 0.259 (SD 0.122, median 0.271), indicating generally moderate moisture and low vegetation water stress. Higher NDMI values, reflecting dense canopy and low stress, are concentrated in forested and semi-natural areas, while lower values appear in urbanised zones with sparse vegetation, highlighting areas susceptible to reduced soil moisture and potential vegetation stress.
To summarise, the Greening Concept has provided both municipalities with a substantial body of knowledge regarding the distribution, quality, and condition of green areas, as well as the identification of zones requiring intervention. A series of detailed maps and expert-based analyses revealed that, although both cities can generally be characterised as green, there are specific areas where vegetation is sparse, degraded, or under stress. These zones represent priority targets for immediate intervention, supporting residents and local authorities in their efforts toward climate adaptation and improved urban resilience. In addition, the Concept includes a set of proposed actions that can be undertaken by the city, institutions, or other municipalities to improve the current condition of the urban environment.
Flood impacts in European cities have been substantial in absolute terms, often driven by a few extreme events. However, relative losses compared to Gross Domestic Product (GDP) have declined over recent decades due to improved protection and preparedness measures [138,139]. Notably, the July 2021 floods in Western and Central Europe resulted in €32 billion in total damages, ranking among the five costliest European disasters of the past 50 years [140], with severe consequences for towns and small cities. Similarly, the 2009 Central European floods affected multiple regions, including Vienna and Prague, causing €356 million in direct asset losses, with an additional 65% in indirect economic costs [141]. These cases illustrate that European cities and regions already incur flood-related losses of several billion euros annually, and individual events can result in multi-billion-euro damages. Although adaptation efforts have reduced the relative burden, future climate-driven extremes and continued urbanisation are likely to push absolute losses significantly higher, unless substantial further investment is made in comprehensive risk reduction and resilient urban infrastructure.
Investment in adaptation measures should be underpinned by thorough analyses that clearly identify both where to invest and how to invest effectively. In this context, the City Adaptation Plan, together with the Concept of Rainwater and Meltwater Management, constitutes a particularly important and valuable planning framework. These documents comprehensively integrate river-flood risk analyses, the identification of priority intervention areas, and the delineation of zones prone to flooding during extreme rainfall events. In addition, they incorporate historical analyses of recent flood events, as well as detailed assessments of the sewer network and drainage ditches.
Depressions temporarily store ponded water and act as local retention basins when the drainage system is exceeded, thereby delaying and reducing runoff peaks, particularly during moderate storm events [142,143,144]. As such, the use of these natural landforms as sites for nature-based solutions (NBS) is theoretically well justified. Their identification and mapping can offer valuable insights for urban planning and flood mitigation [145,146]. Moreover, in cases where these depressions are large in extent and spatially correlate with multiple planned interventions [147], it may be appropriate to consider more technical solutions, such as integration with the sewer network or the construction of open drainage channels, to maximise their effectiveness within the broader stormwater management system. In this context, the frequency and spatial distribution of firefighter interventions can serve as a proxy indicator of flash flood risk and urban vulnerability, providing practical insights for identifying critical areas requiring enhanced flood resilience measures.
Within the framework of the Concept, a spatial analysis of impervious surfaces is also undertaken. Urban “sealing” through impervious surfaces fundamentally alters the urban water cycle and represents a key driver of flood vulnerability [148,149], an important catalyst of heat stress [150,151], and a major contributor to ecological degradation. Consequently, the Concept can be used to identify priority areas for de-sealing and to define limits on additional surface sealing. Such guidance supports the strategic placement of green and blue infrastructure aimed at restoring infiltration capacity, enhancing stormwater retention, and reducing urban flood risk. In both cities, experts highlighted the problem of extensive surface sealing, particularly in the central urban districts.
Likewise, in the case of both green space planning and rainwater management, vulnerable areas were delineated and potential solutions proposed. These actions were also consulted with a team of experts representing the cities and local institutions. Participatory processes are increasingly becoming a core element of municipal adaptation planning [152,153]. Evaluations of participatory projects in the context of climate adaptation highlight a range of advantages: working with local organisations makes the process more accessible and inclusive [154], links technical issues to residents’ everyday concerns, and employs iterative activities to build capacity [155]. Partnerships with community groups and universities help participants connect scientific knowledge to local priorities, using methods such as focus groups and “safety walks” to identify local risk hotspots [156].
Future research within the preparation of adaptation concepts remains highly practical, as each city faces specific challenges that must be identified individually. For example, recent cases focus on issues such as soil erosion, leaching onto roads, and the shifting of land masses. Mapping surface runoff and tracking its temporal changes are also becoming increasingly important. The addition of such geospatial layers points toward the development of a digital twin—an advanced tool for enhancing urban resilience [157,158,159]. These “environment-aware” digital twins integrate city infrastructure models with real-time weather and climate data, enabling risk-based and climate-informed decision-making under extreme conditions [160].
Transferring good practices and promoting high quality adaptation concepts is important to demonstrate that investing in well prepared and comprehensive strategies, even if initially more costly, can bring long term benefits. Such documents provide a solid foundation for future targeted projects by supporting funding applications, coordinating stakeholders, and guiding effective implementation. Promoting successful examples helps municipalities justify early investments and encourages a broader move toward strategic and evidence-based climate planning.
5. Conclusions
The development of high-quality Greening and Rainwater Management concepts as part of city adaptation plans illustrates the value of a structured, expert-driven, and participatory planning methodology. By systematically combining data-driven spatial analyses with stakeholder knowledge and input, the process ensures that adaptation concepts are both scientifically robust and locally relevant. This groundwork yields comprehensive planning documents that delineate risk-prone areas, align with existing policies, and propose tailored nature-based interventions. Such conceptual plans lay a solid foundation for future targeted projects, helping cities prioritise investments and attract funding for implementation. Equally important, the participatory approach builds community support and cross-sector collaboration, making the adaptation strategy more inclusive and actionable. In sum, investing in well-prepared, comprehensive greening and rainwater management concepts proves invaluable for climate adaptation; these documents coordinate stakeholders, guide effective implementation, and bolster urban resilience planning for the long term.
Author Contributions
Conceptualization, K.S.-G., J.B. and W.J.; methodology, K.S.-G., J.B. and W.J.; software, K.S.-G. and J.B.; validation, K.S.-G.; formal analysis, K.S.-G., J.B. and W.J.; investigation, K.S.-G.; resources, K.S.-G.; data curation, K.S.-G. and J.B.; writing—original draft preparation, K.S.-G.; writing—review and editing, K.S.-G. and J.K.; visualisation, K.S.-G. and J.B.; supervision, K.S.-G.; project administration, K.S.-G.; funding acquisition, K.S.-G. All authors have read and agreed to the published version of the manuscript.
Funding
This research was conducted as part of the City Adaptation Plan for Czechowice-Dziedzice, funded by the Municipality of Czechowice-Dziedzice, with support from the Fundusze Europejskie na Infrastrukturę, Klimat, Środowisko (FEnIKS) programme. Additionally, the portion of the research concerning the City of Sosnowiec was funded by the European Union through the INTERREG Central Europe programme, project number CE0200553.
Institutional Review Board Statement
Not applicable.
Informed Consent Statement
Not applicable.
Data Availability Statement
All data are available from the authors upon reasonable request.
Conflicts of Interest
The authors declare no conflicts of interest.
Abbreviations
The following abbreviations are used in this manuscript:
| NDVI | Normalized Difference Vegetation Index |
| NDMI | Normalized Difference Moisture Index |
| UHI | Urban Heat Island |
| EEA | European Environment Agency |
| ICEYE | ICEYE Satellite Mission (Synthetic-Aperture Radar provider) |
| ISOK | Informatyczny System Osłony Kraju (Polish National Protection Information System) |
| RCP | Representative Concentration Pathway |
| BGI | Blue-Green Infrastructure |
| GDP | Gross Domestic Product |
| GIS | Geographic Information System |
| TCD | Tree Cover Density |
References
- United Nations. World Population Prospects 2024: Summary of Results; UN DESA/POP/2024/TR/NO. 9; United Nations: New York, NY, USA, 2024; Available online: https://population.un.org/wpp/assets/Files/WPP2024_Summary-of-Results.pdf (accessed on 20 December 2025).
- Eurostat. Available online: https://ec.europa.eu/eurostat/web/products-eurostat-news/w/ddn-20230330-1 (accessed on 20 December 2025).
- United Nations. Available online: https://news.un.org/en/story/2025/11/1166395 (accessed on 20 December 2025).
- Cheshmehzangi, A.; Allam, Z.; Siew, G. (Eds.) Diversity in Cities and Addressing Urban Sustainability. In Diversity as Catalyst: Economic Growth and Urban Resilience in Global Cityscapes; Springer Nature: Singapore, 2024; pp. 1–9. [Google Scholar]
- World Bank & Unesco. Available online: https://www.worldbank.org/en/topic/urbandevelopment/publication/cities-culture-creativity (accessed on 20 December 2025).
- UNDP. Human Developments Reports. Available online: https://hdr.undp.org/content/rapid-urbanisation-opportunities-and-challenges-improve-well-being-societies (accessed on 20 December 2025).
- Kaur, R.; Pandey, P. Air pollution, climate change, and human health in Indian cities: A brief review. Front. Sustain. Cities 2021, 3, 705131. [Google Scholar] [CrossRef] [Scilit]
- Shu, Y.; Hu, J.; Zhang, S.; Schöpp, W.; Tang, W.; Du, J.; Liu, Y.; Chen, Y.; Xie, D. Analysis of the air pollution reduction and climate change mitigation effects of the Three-Year Action Plan for Blue Skies on the “2+26” cities in China. J. Environ. Manag. 2022, 317, 115455. [Google Scholar] [CrossRef] [Scilit] [PubMed]
- EEA. Available online: https://www.eea.europa.eu/en/topics/in-depth/urban-sustainability (accessed on 20 December 2025).
- Zhong, X.; Hu, M.; Deetman, S.; Steubing, B.; Lin, H.X.; Hernandez, G.A.; Harpprecht, C.; Zhang, C.; Tukker, A.; Behrens, P. Global greenhouse gas emissions from residential and commercial building materials and mitigation strategies to 2060. Nat. Commun. 2021, 12, 6126. [Google Scholar] [CrossRef] [Scilit] [PubMed]
- Castonguay, S.; Evenden, M. (Eds.) Urban Rivers: Remaking Rivers, Cities, and Space in Europe and North America; University of Pittsburgh Press: Pittsburgh, PA, USA, 2012; Volume 66, 256p. [Google Scholar]
- Dyl, J. Lessons from history: Coastal cities and natural disaster. Manag. Environ. Qual. Int. J. 2009, 20, 460–473. [Google Scholar] [CrossRef] [Scilit]
- Mosley, S. Coastal cities and environmental change. Environ. Hist. 2014, 20, 517–533. [Google Scholar] [CrossRef] [Scilit]
- Meyer, W.B. The poor on the hilltops? The vertical fringe of a late nineteenth-century American city. Ann. Assoc. Am. Geogr. 2005, 95, 773–788. [Google Scholar] [CrossRef] [Scilit]
- Davis, M. Planet of Slums; Verso: London, UK, 2006; 228p. [Google Scholar]
- Vedachalam, S.; Lewenstein, B.V.; DeStefano, K.A.; Polan, S.D.; Riha, S.J. Media discourse on ageing water infrastructure. Urban Water J. 2016, 13, 861–874. [Google Scholar] [CrossRef] [Scilit]
- Kristvik, E.; Muthanna, T.M.; Alfredsen, K. Assessment of future water availability under climate change, considering scenarios for population growth and ageing infrastructure. J. Water Clim. Change 2019, 10, 1–12. [Google Scholar] [CrossRef] [Scilit]
- Van Breugel, K. Societal burden and engineering challenges of ageing infrastructure. Procedia Eng. 2017, 171, 53–63. [Google Scholar] [CrossRef] [Scilit]
- Depietri, Y.; Renaud, F.G.; Kallis, G. Heat waves and floods in urban areas: A policy-oriented review of ecosystem services. Sustain. Sci. 2012, 7, 95–107. [Google Scholar] [CrossRef] [Scilit]
- Brown, S.J. Future changes in heatwave severity, duration and frequency due to climate change for the most populous cities. Weather Clim. Extrem. 2020, 30, 100278. [Google Scholar] [CrossRef] [Scilit]
- Haase, D. Turning the tide–why cities can be both drivers of climate change and biodiversity loss, and leaders in tackling them. Front. Environ. Sci. 2025, 13, 1685668. [Google Scholar] [CrossRef] [Scilit]
- Yang, D.; Yang, Y.; Xia, J. Hydrological cycle and water resources in a changing world: A review. Geogr. Sustain. 2021, 2, 115–122. [Google Scholar] [CrossRef] [Scilit]
- Dore, M.H. Climate change and changes in global precipitation patterns: What do we know? Environ. Int. 2005, 31, 1167–1181. [Google Scholar] [CrossRef] [Scilit] [PubMed]
- Konapala, G.; Mishra, A.K.; Wada, Y.; Mann, M.E. Climate change will affect global water availability through compounding changes in seasonal precipitation and evaporation. Nat. Commun. 2020, 11, 3044. [Google Scholar] [CrossRef] [Scilit] [PubMed]
- Arnone, E.; Pumo, D.; Francipane, A.; La Loggia, G.; Noto, L.V. The role of urban growth, climate change, and their interplay in altering runoff extremes. Hydrol. Process. 2018, 32, 1755–1770. [Google Scholar] [CrossRef] [Scilit]
- Al Atawneh, D.; Cartwright, N.; Bertone, E. Climate change and its impact on the projected values of groundwater recharge: A review. J. Hydrol. 2021, 601, 126602. [Google Scholar] [CrossRef] [Scilit]
- Kuang, X.; Liu, J.; Scanlon, B.R.; Jiao, J.J.; Jasechko, S.; Lancia, M.; Biskaborn, B.K.; Wada, Y.; Li, H.; Zeng, Z.; et al. The changing nature of groundwater in the global water cycle. Science 2024, 383, eadf0630. [Google Scholar] [CrossRef] [Scilit]
- Pallubinsky, H.; Kramer, R.P.; van Marken Lichtenbelt, W.D. Establishing resilience in times of climate change—A perspective on humans and buildings. Clim. Change 2023, 176, 135. [Google Scholar] [CrossRef] [Scilit]
- Gramaglia, C.; Rio, M.; Salles, C.; Tournoud, M.G. Reducing the imperviousness of urban soils to enhance the quality of surface water: Obstacles and levers to implementing ecological runoff management in the south of France. J. Hydrol. 2024, 636, 131168. [Google Scholar] [CrossRef] [Scilit]
- Nguyen, H.H.; Venohr, M.; Gericke, A.; Sundermann, A.; Welti, E.A.; Haase, P. Dynamics in impervious urban and non-urban areas and their effects on run-off, nutrient emissions, and macroinvertebrate communities. Landsc. Urban Plan. 2023, 231, 104639. [Google Scholar] [CrossRef] [Scilit]
- O’Gorman, P.A. Precipitation extremes under climate change. Curr. Clim. Change Rep. 2015, 1, 49–59. [Google Scholar] [CrossRef] [Scilit] [PubMed]
- Kundzewicz, Z.W.; Su, B.; Wang, Y.; Wang, G.; Wang, G.; Huang, J.; Jiang, T. Flood risk in a range of spatial perspectives—From global to local scales. Nat. Hazards Earth Syst. Sci. 2019, 19, 1319–1328. [Google Scholar] [CrossRef] [Scilit]
- Kron, W.; Eichner, J.; Kundzewicz, Z.W. Reduction of flood risk in Europe–Reflections from a reinsurance perspective. J. Hydrol. 2019, 576, 197–209. [Google Scholar] [CrossRef] [Scilit]
- EMDAT. Available online: https://www.cred.be/sites/default/files/CredCrunch64.pdf (accessed on 20 December 2025).
- Mora, C.; Counsell, C.W.; Bielecki, C.R.; Louis, L.V. Twenty-seven ways a heat wave can kill you: Deadly heat in the era of climate change. Circ. Cardiovasc. Qual. Outcomes 2017, 10, e004233. [Google Scholar] [CrossRef] [Scilit] [PubMed]
- Zhao, L.; Oppenheimer, M.; Zhu, Q.; Baldwin, J.W.; Ebi, K.L.; Bou-Zeid, E.; Smith, K.R.; Liu, X. Interactions between urban heat islands and heat waves. Environ. Res. Lett. 2018, 13, 034003. [Google Scholar] [CrossRef] [Scilit]
- Rizvi, S.; Alam, K.; Iqbal, M.J. Spatio-temporal variations in urban heat island and its interaction with heat wave. J. Atmos. Sol.-Terr. Phys. 2019, 185, 50–57. [Google Scholar] [CrossRef] [Scilit]
- Schleussner, C.F.; Pfleiderer, P.; Andrijevic, M.; Vogel, M.M.; Otto, F.E.; Seneviratne, S.I. Pathways of climate resilience over the 21st century. Environ. Res. Lett. 2021, 16, 054058. [Google Scholar] [CrossRef] [Scilit]
- Adger, W.N.; Brown, K.; Nelson, D.R.; Berkes, F.; Eakin, H.; Folke, C.; Galvin, K.; Gunderson, L.; Goulden, M.; O’Brien, K.; et al. Resilience implications of policy responses to climate change. Wiley Interdiscip. Rev. Clim. Change 2011, 2, 757–766. [Google Scholar] [CrossRef] [Scilit]
- Pietrapertosa, F.; Khokhlov, V.; Salvia, M.; Cosmi, C. Climate change adaptation policies and plans: A survey in 11 South East European countries. Renew. Sustain. Energy Rev. 2018, 81, 3041–3050. [Google Scholar] [CrossRef] [Scilit]
- Ministry of Environment. Podręcznik Adaptacji dla Miast: Wytyczne do Przygotowania Miejskiego Planu Adaptacji do Zmian Klimatu [Adaptation Manual for Cities: Guidelines for the Preparation of a Municipal Climate Change Adaptation Plan]; Institute for Ecology of Industrial Areas, Katowice/Ministry of Environment: Warsaw, Poland, 2015.
- Ministry of Environment. Available online: https://www.gov.pl/web/klimat/mpa-44 (accessed on 20 December 2025).
- Kancelaria Prezesa Rady Ministrow. Act of 27 November 2024 amending the Environmental Protection Law and certain other acts (obligation to prepare Municipal Climate Change Adaptation Plans). In Journal of Laws of the Republic of Poland (Dz.U.); Kancelaria Prezesa Rady Ministrow: Warszawa, Poland, 2024; p. 1940. Available online: https://isap.sejm.gov.pl/isap.nsf/download.xsp/WDU20240001940/T/D20241940L.pdf (accessed on 20 December 2025). (In Polish)
- Gebreslassie, H.; Berhane, G.; Gebreyohannes, T.; Hagos, M.; Hussien, A.; Walraevens, K. Water harvesting and groundwater recharge: A comprehensive review and synthesis of current practices. Water 2025, 17, 976. [Google Scholar] [CrossRef] [Scilit]
- Satheeshkumar, S.; Venkateswaran, S.; Kannan, R. Rainfall–runoff estimation using SCS–CN and GIS approach in the Pappiredipatti watershed of the Vaniyar sub basin, South India. Model. Earth Syst. Environ. 2017, 3, 24. [Google Scholar] [CrossRef] [Scilit]
- Singh, R.; Garg, K.K.; Anantha, K.H.; Akuraju, V.; Dev, I.; Dixit, S.; Dhyani, S.K. Building resilient agricultural system through groundwater management interventions in degraded landscapes of Bundelkhand region, Central India. J. Hydrol. Reg. Stud. 2021, 37, 100929. [Google Scholar] [CrossRef] [Scilit]
- González, P.S.; Sáez Lazo, R.; Vallejos Carrera, C.; Fernández Torres, Ó.; Bustos-Espinoza, L.; Ibáñez Córdova, A.; Ingram, B. Rainwater Harvesting for Well Recharge and Agricultural Irrigation: An Adaptation Strategy to Climate Change in Central Chile. Sustainability 2025, 17, 3549. [Google Scholar] [CrossRef] [Scilit]
- Abdullahi, I. Treatment of Surface Water Runoff in Igala-Mela, Kogi State Nigeria Using Local Materials. J. Environ. 2023, 3, 1–21. [Google Scholar] [CrossRef] [Scilit]
- Grinberga, L.; Lauva, D.; Lagzdins, A. Treatment of Storm Water from Agricultural Catchment in Pilot Scale Constructed Wetland. Environ. Clim. Technol. 2021, 25, 640–649. [Google Scholar] [CrossRef] [Scilit]
- Acreman, M.; Smith, A.; Charters, L.; Tickner, D.; Opperman, J.; Acreman, S.; Edwards, F.; Sayers, P.; Chivava, F. Evidence for the effectiveness of nature-based solutions to water issues in Africa. Environ. Res. Lett. 2021, 16, 063007. [Google Scholar] [CrossRef] [Scilit]
- Keesstra, S.; Nunes, J.; Novara, A.; Finger, D.; Avelar, D.; Kalantari, Z.; Cerdà, A. The superior effect of nature based solutions in land management for enhancing ecosystem services. Sci. Total Environ. 2017, 610–611, 997–1009. [Google Scholar] [CrossRef] [Scilit]
- Lidmo, J.; Bogason, Á.; Turunen, E. The Legal Framework and National Policies for Urban Greenery and Green Values in Urban Areas. A Study of Legislation and Policy Documents in the Five Nordic Countries and Two European Outlooks; Nordregio Report; Nordregio: Stockholm, Sweden, 2020; Volume 3, Available online: https://nordregio.org/publications/the-legal-framework-and-national-policies-for-urban-greenery-and-green-values-in-urban-areas/ (accessed on 20 December 2025).
- Biodiversity EU. Available online: https://biodiversity.europa.eu/countries/denmark/green-infrastructure (accessed on 20 December 2025).
- Nordh, H.; Olafsson, A.S. Plans for urban green infrastructure in Scandinavia. J. Environ. Plan. Manag. 2021, 64, 883–904. [Google Scholar] [CrossRef] [Scilit]
- Hanson, H.I.; Olsson, J.A. Uptake and use of biodiversity offsetting in urban planning–The case of Sweden. Urban For. Urban Green. 2023, 80, 127841. [Google Scholar] [CrossRef] [Scilit]
- Baravikova, A. The uptake of new concepts in urban greening: Insights from Poland. Urban For. Urban Green. 2020, 56, 126798. [Google Scholar] [CrossRef] [Scilit]
- Seidu, S.; Chan, D.W.; Edwards, D.J.; Owusu-Manu, D.G. A systematic review of green infrastructure and ecosystem-based technologies for climate resilience: Development trends, research outlook and future projections. Environ. Res. Lett. 2025, 20, 083001. [Google Scholar] [CrossRef] [Scilit]
- Zarei, M.; Shahab, S. Nature-based solutions in urban green infrastructure: A systematic review of success factors and implementation challenges. Land 2025, 14, 818. [Google Scholar] [CrossRef] [Scilit]
- Sarabi, S.; Han, Q.; Romme, A.G.L.; De Vries, B.; Wendling, L. Key enablers of and barriers to the uptake and implementation of nature-based solutions in urban settings: A review. Resources 2019, 8, 121. [Google Scholar] [CrossRef] [Scilit]
- Szpak, A.; Modrzyńska, J.; Piechowiak, J. Resilience of Polish cities and their rainwater management policies. Urban Clim. 2022, 44, 101228. [Google Scholar] [CrossRef] [Scilit]
- Kourtis, I.; Tsihrintzis, V. Adaptation of urban drainage networks to climate change: A review. Sci. Total Environ. 2021, 771, 145431. [Google Scholar] [CrossRef] [Scilit] [PubMed]
- Halama, A. Zrównoważone gospodarowanie terenami zalewowymi na przykładzie miasta Czechowice-Dziedzice. Stud. Miej. 2013, 11, 105–114. (In Polish) [Google Scholar]
- Urząd Miejski w Czechowicach-Dziedzicach. Program Ochrony Środowiska dla Gminy Czechowice-Dziedzice na Lata 2025–2028 (Załącznik do Uchwały Nr VI/67/2024 Rady Miejskiej w Czechowicach-Dziedzicach z Dnia 17 Września 2024 r.). Czechowice-Dziedzice. Available online: https://www.bip.czechowice-dziedzice.pl/res/serwisy/pliki/41354520?version=1.0 (accessed on 10 January 2026).
- Burmistrz Czechowic-Dziedzic. Studium Uwarunkowań i Kierunków Zagospodarowania Przestrzennego Gminy Czechowice-Dziedzice. Tekst Studium. Tom I: Uwarunkowania (Załącznik nr 3 do Uchwały Nr XXXIV/379/2017 Rady Miejskiej w Czechowicach-Dziedzicach z Dnia 30 Maja 2017 r.). Czechowice-Dziedzice. 2017. Available online: https://www.bip.czechowice-dziedzice.pl/res/serwisy/pliki/15564421?version=1.0 (accessed on 10 January 2026).
- Czechowice-Dziedzice Municipality. Available online: https://czechowice-dziedzice.pl/aktualnosci/centrum-ekologii-i-zieleni-nowa-jednostka-dla-lepszej-przyszlosci-miejskiej-zieleni (accessed on 10 January 2026).
- Rada Miejska w Sosnowcu. Program Ochrony Środowiska na Lata 2021–2024 z Perspektywą na Lata 2025–2028 dla Gminy Sosnowiec (Załącznik do Uchwały Rady Miejskiej w Sosnowcu z Dnia 1 Grudnia 2021 r.). Sosnowiec. Available online: https://www.bip.um.sosnowiec.pl/a,546142,program-ochrony-srodowiska-na-lata-2021-2024-z-perspektywa-na-lata-2025-2028-dla-gminy-sosnowiec.html (accessed on 10 January 2026).
- Absalon, D.; Czaja, S.; Jankowski, A.T. Charakterystyka hydrologiczna. Gospodarka wodno-ściekowa na obszarze miasta (Hydrological Description. Water and Sewage Management in the Territory of Sosnowiec). In Sosnowiec. Obraz Miasta i Jego Dzieje. T. 1.; Barciak, A., Jankowski, A.T., Eds.; Muzeum w Sosnowcu: Sosnowiec, Poland, 2016; pp. 86–104. [Google Scholar]
- Studium Uwarunkowań i Kierunków Zagospodarowania Przestrzennego Miasta Sosnowca [Sosnowiec—Master Plan—Study of the Conditions and Directions for Spatial Development]; Municipal Office in Sosnowiec: Sosnowiec, Poland, 2016.
- Krzysztofik, R.; Rahmonov, O.; Kantor-Pietraga, I.; Dragan, W. The perception of urban forests in post-mining areas: A case study of Sosnowiec-Poland. Int. J. Environ. Res. Public Health 2022, 19, 3852. [Google Scholar] [CrossRef] [Scilit] [PubMed]
- Hajto, M.; Bidłasik, M.; Kuśmierz, A.; Marcinkowski, M.; Potapowicz, I.; Rajkowska, B.; Romańczak, A.; Siwiec, E. Podręcznik Adaptacji dla Miast. Wytyczne do Przygotowania Miejskiego Planu Adaptacji do Zmian Klimatu. Aktualizacja 2023; Instytut Ochrony Środowiska—Państwowy Instytut Badawczy (IOŚ-PIB): Warszawa, Poland, 2023. Available online: https://klimada2.ios.gov.pl/wp-content/uploads/2023/09/Podrecznik-adaptacji-dla-miast_aktualizacja-2023_compressed.pdf (accessed on 10 January 2026).
- Goward, S.N.; Markham, B.; Dye, D.G.; Dulaney, W.; Yang, J. Normalized difference vegetation index measurements from the advanced very high resolution radiometer. Remote Sens. Environ. 1991, 35, 257–277. [Google Scholar] [CrossRef] [Scilit]
- Taloor, A.K.; Manhas, D.S.; Kothyari, G.C. Retrieval of land surface temperature, normalized difference moisture index, normalized difference water index of the Ravi basin using Landsat data. Appl. Comput. Geosci. 2021, 9, 100051. [Google Scholar] [CrossRef] [Scilit]
- Humagain, K.; Portillo-Quintero, C.; Cox, R.D.; Cain, J.W., III. Mapping tree density in forests of the southwestern USA using Landsat 8 data. Forests 2017, 8, 287. [Google Scholar] [CrossRef] [Scilit]
- Rada Miejska w Czechowicach-Dziedzicach. Uchwała Nr LVI/661/22 z Dnia 29 Listopada 2022 r. w Sprawie Przyjęcia Strategii Rozwoju Gminy Czechowice-Dziedzice do 2030 Roku (Załącznik: Strategia Rozwoju). Czechowice-Dziedzice. 2022. Available online: https://www.bip.czechowice-dziedzice.pl/res/serwisy/pliki/31124372?version=1.0 (accessed on 10 January 2026).
- Rada Miejska w Sosnowcu. Strategia Rozwoju Miasta Sosnowca do 2020 r. (Załącznik do Uchwały Nr 162/XII/07 Rady Miejskiej w Sosnowcu z Dnia 24 Maja 2007 r.). Sosnowiec. 2007. Available online: https://www.sosnowiec.pl/wp-content/uploads/2022/01/strategia2020.pdf (accessed on 10 January 2026).
- Klimada 2.0. Available online: https://klimada2.ios.gov.pl/ (accessed on 10 January 2026).
- Thomson, A.M.; Calvin, K.V.; Smith, S.J.; Kyle, G.P.; Volke, A.; Patel, P.; Delgado-Arias, S.; Bond-Lamberty, B.; Wise, M.A.; Clarke, L.E.; et al. RCP4. 5: A pathway for stabilization of radiative forcing by 2100. Clim. Change 2011, 109, 77. [Google Scholar] [CrossRef] [Scilit]
- Riahi, K.; Rao, S.; Krey, V.; Cho, C.; Chirkov, V.; Fischer, G.; Kindermann, G.; Nakicenovic, N.; Rafaj, P. RCP 8.5—A scenario of comparatively high greenhouse gas emissions. Clim. Change 2011, 109, 33. [Google Scholar] [CrossRef] [Scilit]
- Goniewicz, K.; Burkle, F.M., Jr. Analysis of the potential of IT system support in early warning systems: Mitigating flood risk in Poland. Prehospital Disaster Med. 2019, 34, 563–565. [Google Scholar] [CrossRef] [Scilit]
- ISOK. Available online: https://isok.gov.pl/index.html (accessed on 10 January 2026).
- EEA. Available online: https://www.eea.europa.eu/en/analysis/maps-and-charts/imperviousness-in-europe (accessed on 10 January 2026).
- ICEYE. Available online: https://www.iceye.com/solutions/storm-boris-september-2024 (accessed on 10 January 2026).
- Wolański, R.M.; Giełżecki, J. Znaczenie jednostek ochrony przeciwpożarowej w ochronie obiektów dziedzictwa kulturowego w zasobach lokalnych społeczności. Ochr. Ludności I Dziedzictwa Kult. 2022, 1, 63–91. [Google Scholar] [CrossRef] [Scilit]
- Samborska-Goik, K.; Pogrzeba, M.; Bronder, J.; Obłój, P.; Głogowska, M. City Diagnosis as a Strategic Component in Preparing Urban Areas for Climate Change: Insights from the ‘City with Climate’ Project. Appl. Sci. 2025, 15, 4092. [Google Scholar] [CrossRef] [Scilit]
- Bhandari, A.K.; Kumar, A.; Singh, G.K. Feature extraction using Normalized Difference Vegetation Index (NDVI): A case study of Jabalpur city. Procedia Technol. 2012, 6, 612–621. [Google Scholar] [CrossRef] [Scilit]
- Gao, B.C. NDWI—A normalized difference water index for remote sensing of vegetation liquid water from space. Remote Sens. Environ. 1996, 58, 257–266. [Google Scholar] [CrossRef] [Scilit]
- Huemmrich, K.F.; Vargas Zesati, S.; Campbell, P.; Tweedie, C. Canopy reflectance models illustrate varying NDVI responses to change in high latitude ecosystems. Ecol. Appl. 2021, 31, e02435. [Google Scholar] [CrossRef] [Scilit] [PubMed]
- Lunetta, R.S.; Knight, J.F.; Ediriwickrema, J.; Lyon, J.G.; Worthy, L.D. Land-cover change detection using multi-temporal MODIS NDVI data. In Geospatial Information Handbook for Water Resources and Watershed Management; CRC Press: Boca Raton, FL, USA, 2022; Volume II, pp. 65–88. [Google Scholar]
- De La Iglesia Martinez, A.; Labib, S.M. Demystifying normalized difference vegetation index (NDVI) for greenness exposure assessments and policy interventions in urban greening. Environ. Res. 2023, 220, 115155. [Google Scholar] [CrossRef] [Scilit] [PubMed]
- Wilson, E.H.; Sader, S.A. Detection of forest harvest type using multiple dates of Landsat TM imagery. Remote Sens. Environ. 2002, 80, 385–396. [Google Scholar] [CrossRef] [Scilit]
- Almaaitah, T.; Appleby, M.; Rosenblat, H.; Drake, J.; Joksimovic, D. The potential of Blue-Green infrastructure as a climate change adaptation strategy: A systematic literature review. Blue-Green Syst. 2021, 3, 223–248. [Google Scholar] [CrossRef] [Scilit]
- Dhyani, S.; Singh, S.; Basu, M.; Dasgupta, R.; Santhanam, H. Blue-green infrastructure for addressing urban resilience and sustainability in the warming world. In Blue-Green Infrastructure Across Asian Countries: Improving Urban Resilience and Sustainability; Springer: Singapore, 2022; pp. 1–22. [Google Scholar]
- Sanchez, F.G.; Govindarajulu, D. Integrating blue-green infrastructure in urban planning for climate adaptation: Lessons from Chennai and Kochi, India. Land Use Policy 2023, 124, 106455. [Google Scholar] [CrossRef] [Scilit]
- Quattrone, G. Green and blue infrastructures and nature-based solutions to reduce pollutant emissions and make transitioning urban ecosystems more climate change-adaptive. Green Build. Constr. Econ. 2023, 4, 80–89. [Google Scholar] [CrossRef] [Scilit]
- Bogacki, M.; Neverova-Dziopak, E.; Yedoyan, T.; Dziopak, J. Evolution of Cities under Climate Change: Greening and Blue-Green Infrastructure. J. Archit. Eng. Res. 2025, 8, 22–33. [Google Scholar] [CrossRef] [Scilit]
- Hohmann, C.; Bieker, S.; Truffer, B. Breaking out of the silo: Collaborative approaches to implementing blue-green infrastructure in urban areas. Blue-Green Syst. 2025, 7, 95–109. [Google Scholar] [CrossRef] [Scilit]
- Bernaciak, A.; Bernaciak, A.; Fortuński, B. Blue-green infrastructure of a regenerative city. Econ. Environ. 2024, 91, 978. [Google Scholar] [CrossRef] [Scilit]
- Kumar, P.; Sahani, J.; Corada Perez, K.; Ahlawat, A.; Andrade, M.D.F.; Athanassiadou, M.; Cao, S.J.; Collins, L.; Dey, S.; Di Sabatino, S.; et al. Urban greening for climate resilient and sustainable cities: Grand challenges and opportunities. Front. Sustain. Cities 2025, 7, 1595280. [Google Scholar] [CrossRef] [Scilit]
- Kronenberg, J.; Andersson, E.; Barton, D.N.; Borgström, S.T.; Langemeyer, J.; Björklund, T.; Haase, D.; Kennedy, C.; Koprowska, K.; Łaszkiewicz, E.; et al. The thorny path toward greening: Unintended consequences, trade-offs, and constraints in green and blue infrastructure planning, implementation, and management. Ecol. Soc. 2021, 26, 36. [Google Scholar] [CrossRef] [Scilit]
- Zhang, Y.; Wang, P.; Wang, T.; Li, J.; Li, Z.; Teng, M.; Gao, Y. Using vegetation indices to characterize vegetation cover change in the urban areas of Southern China. Sustainability 2020, 12, 9403. [Google Scholar] [CrossRef] [Scilit]
- HUGSI. Available online: https://www.husqvarnagroup.com/sites/husqvarna/files/pr/202411115494-2.pdf#:~:text=Among%20the%20344%20cities%20analyzed%2C,space%20is%20increasingly%20recognized%20as (accessed on 16 January 2026).
- WEFORUM. Available online: https://www.weforum.org/stories/2022/08/green-space-cities-climate-change/#:~:text=According%20to%20data%20from%20the,50%20percent (accessed on 16 January 2026).
- Di Marino, M.; Tiitu, M.; Saglie, I.L.; Lapintie, K. Conceptualizing ‘green’ in urban and regional planning–the cases of Oslo and Helsinki. Eur. Plan. Stud. 2024, 32, 1187–1209. [Google Scholar] [CrossRef] [Scilit]
- Larondelle, N.; Haase, D. Back to nature! Or not? Urban dwellers and their forest in Berlin. Urban Ecosyst. 2017, 20, 1069–1079. [Google Scholar] [CrossRef] [Scilit]
- Breiling, M.; Ruland, G. The Vienna green belt: From localised protection to a regional concept. In Urban Green Belts in the Twenty-First Century; Routledge: Oxfordshire, UK, 2016; pp. 167–183. [Google Scholar]
- Rolf, W.; Peters, D.; Lenz, R.; Pauleit, S. Farmland—An Elephant in the Room of Urban Green Infrastructure? Lessons learned from connectivity analysis in three German cities. Ecol. Indic. 2018, 94, 151–163. [Google Scholar] [CrossRef] [Scilit]
- Wende, W.; Walz, U.; Stein, C. Evaluating municipal landscape plans and their influence on selected aspects of landscape development–An empirical study from Germany. Land Use Policy 2020, 99, 104855. [Google Scholar] [CrossRef] [Scilit]
- Schwenk, W.S.; Donovan, T.M.; Keeton, W.S.; Nunery, J.S. Carbon storage, timber production, and biodiversity: Comparing ecosystem services with multi-criteria decision analysis. Ecol. Appl. 2012, 22, 1612–1627. [Google Scholar] [CrossRef] [Scilit]
- Feng, X.; Fu, B.; Lu, N.; Zeng, Y.; Wu, B. How ecological restoration alters ecosystem services: An analysis of carbon sequestration in China’s Loess Plateau. Sci. Rep. 2013, 3, 2846. [Google Scholar] [CrossRef] [Scilit]
- Stürck, J.; Poortinga, A.; Verburg, P.H. Mapping ecosystem services: The supply and demand of flood regulation services in Europe. Ecol. Indic. 2014, 38, 198–211. [Google Scholar] [CrossRef] [Scilit]
- Farrugia, S.; Hudson, M.D.; McCulloch, L. An evaluation of flood control and urban cooling ecosystem services delivered by urban green infrastructure. Int. J. Biodivers. Sci. Ecosyst. Serv. Manag. 2013, 9, 136–145. [Google Scholar] [CrossRef] [Scilit]
- Amini Parsa, V.; Salehi, E.; Yavari, A.R.; van Bodegom, P.M. Evaluating the potential contribution of urban ecosystem service to climate change mitigation. Urban Ecosyst. 2019, 22, 989–1006. [Google Scholar] [CrossRef] [Scilit]
- Rodrigues, B.N.; Favoreti, A.L.F.; Molina Júnior, V.E.; Silva, C.M.; Canteras, F.B. Green infrastructure for urban climate mitigation and adaptation: Methods, strategies, and typology selection based on ecosystem services. Int. J. Environ. Sci. Technol. 2025, 22, 17383–17404. [Google Scholar] [CrossRef] [Scilit]
- Blum, J. Contribution of ecosystem services to air quality and climate change mitigation policies: The case of urban forests in Barcelona, Spain. In Urban Forests; Apple Academic Press: Palm Bay, FL, USA, 2017; pp. 21–54. [Google Scholar]
- Xie, Q.; Yue, Y.; Sun, Q.; Chen, S.; Lee, S.B.; Kim, S.W. Assessment of ecosystem service values of urban parks in improving air quality: A case study of Wuhan, China. Sustainability 2019, 11, 6519. [Google Scholar] [CrossRef] [Scilit]
- Liu, L.; Han, B.; Tan, D.; Wu, D.; Shu, C. The value of ecosystem traffic noise reduction service provided by urban green belts: A case study of Shenzhen. Land 2023, 12, 786. [Google Scholar] [CrossRef] [Scilit]
- Aerts, R.; Dewaelheyns, V.; Achten, W.M. Potential ecosystem services of urban agriculture: A review. PeerJ Prepr. 2016, 4, e2286v1. [Google Scholar]
- Francini, A.; Romano, D.; Toscano, S.; Ferrante, A. The contribution of ornamental plants to urban ecosystem services. Earth 2022, 3, 1258–1274. [Google Scholar] [CrossRef] [Scilit]
- Brancalion, P.H.; de Siqueira, L.P.; Amazonas, N.T.; Rizek, M.B.; Mendes, A.F.; Santiami, E.L.; Rodrigues, R.R.; Calmon, M.; Benini, R.; Tymus, J.R.; et al. Ecosystem restoration job creation potential in Brazil. People Nat. 2022, 4, 1426–1434. [Google Scholar] [CrossRef] [Scilit]
- Vallecillo, S.; La Notte, A.; Zulian, G.; Ferrini, S.; Maes, J. Ecosystem services accounts: Valuing the actual flow of nature-based recreation from ecosystems to people. Ecol. Model. 2019, 392, 196–211. [Google Scholar] [CrossRef] [Scilit] [PubMed]
- Fischer, L.K.; Honold, J.; Botzat, A.; Brinkmeyer, D.; Cvejić, R.; Delshammar, T.; Elands, B.; Haase, D.; Kabisch, N.; Karle, S.J.; et al. Recreational ecosystem services in European cities: Sociocultural and geographical contexts matter for park use. Ecosyst. Serv. 2018, 31, 455–467. [Google Scholar] [CrossRef] [Scilit]
- Davids, R.; Rouget, M.; Burger, M.; Mahood, K.; Ditlhale, N.; Slotow, R. Civic Ecology Uplifts Low-Income Communities, Improves Ecosystem Services and Well-Being, and Strengthens Social Cohesion. Sustainability 2021, 13, 1300. [Google Scholar] [CrossRef] [Scilit] [PubMed]
- Remme, R.P.; Frumkin, H.; Guerry, A.D.; King, A.C.; Mandle, L.; Sarabu, C.; Bratman, G.N.; Giles-Corti, B.; Hamel, P.; Han, B.; et al. An ecosystem service perspective on urban nature, physical activity, and health. Proc. Natl. Acad. Sci. USA 2021, 118, e2018472118. [Google Scholar] [CrossRef] [Scilit] [PubMed]
- Summers, J.K.; Smith, L.M.; Case, J.L.; Linthurst, R.A. A review of the elements of human well-being with an emphasis on the contribution of ecosystem services. Ambio 2012, 41, 327–340. [Google Scholar] [CrossRef] [Scilit] [PubMed]
- Francis, J.; Disney, M.; Law, S. Monitoring canopy quality and improving equitable outcomes of urban tree planting using LiDAR and machine learning. Urban For. Urban Green. 2023, 89, 128115. [Google Scholar] [CrossRef] [Scilit]
- Rahman, M.; Arndt, S.; Bravo, F.; Cheung, P.; Van Doorn, N.; Franceschi, E.; Del Río, M.; Livesley, S.; Moser-Reischl, A.; Pattnaik, N.; et al. More than a canopy cover metric: Influence of canopy quality, water-use strategies and site climate on urban forest cooling potential. Landsc. Urban Plan. 2024, 248, 105089. [Google Scholar] [CrossRef] [Scilit]
- Chen, J.; Jin, S.; Du, P. Roles of horizontal and vertical tree canopy structure in mitigating daytime and nighttime urban heat island effects. Int. J. Appl. Earth Obs. Geoinf. 2020, 89, 102060. [Google Scholar] [CrossRef] [Scilit]
- Sharma, S.; Hussain, S.; Kumar, P.; Singh, A. Urban trees’ potential for regulatory services in the urban environment: An exploration of carbon sequestration. Environ. Monit. Assess. 2024, 196, 504. [Google Scholar] [CrossRef] [Scilit]
- Mazon, J. Integrating Urban Tree Carbon Sequestration into Metropolitan Ecosystem Services for Climate-Neutral Cities: A Citizen Science-Based Methodology. Urban Sci. 2025, 9, 463. [Google Scholar] [CrossRef] [Scilit]
- Pregitzer, C.C.; Hanna, C.; Charlop-Powers, S.; Bradford, M.A. Estimating carbon storage in urban forests of New York City. Urban Ecosyst. 2021, 25, 617–631. [Google Scholar] [CrossRef] [Scilit]
- Huang, S.; Tang, L.; Hupy, J.; Wang, Y.; Shao, G. A commentary review on the use of normalized difference vegetation index (NDVI) in the era of popular remote sensing. J. For. Res. 2020, 32, 1–6. [Google Scholar] [CrossRef] [Scilit]
- Gandhi, G.M.; Parthiban, S.; Thummalu, N.; Christy, A. Ndvi: Vegetation change detection using remote sensing and gis—A case study of Vellore District. Procedia Comput. Sci. 2015, 57, 1199–1210. [Google Scholar] [CrossRef] [Scilit]
- Zhao, Q.; Qu, Y. The Retrieval of Ground NDVI (Normalized Difference Vegetation Index) Data Consistent with Remote-Sensing Observations. Remote Sens. 2024, 16, 1212. [Google Scholar] [CrossRef] [Scilit]
- Camps-Valls, G.; Campos-Taberner, M.; Moreno-Martínez, Á.; Walther, S.; Duveiller, G.; Cescatti, A.; Mahecha, M.D.; Muñoz-Marí, J.; García-Haro, F.J.; Guanter, L.; et al. A unified vegetation index for quantifying the terrestrial biosphere. Sci. Adv. 2021, 7, eabc7447. [Google Scholar] [CrossRef] [Scilit] [PubMed]
- Das, A.C.; Shahriar, S.A.; Chowdhury, M.A.; Hossain, M.L.; Mahmud, S.; Tusar, M.K.; Ahmed, R.; Salam, M.A. Assessment of remote sensing-based indices for drought monitoring in the north-western region of Bangladesh. Heliyon 2023, 9, e13016. [Google Scholar] [CrossRef] [Scilit] [PubMed]
- Monteiro, A.T.; Arenas-Castro, S.; Punalekar, S.M.; Cunha, M.; Mendes, I.; Giamberini, M.; da Costa, E.M.; Fava, F.; Lucas, R. Remote sensing of vegetation and soil moisture content in Atlantic humid mountains with Sentinel-1 and 2 satellite sensor data. Ecol. Indic. 2024, 163, 112123. [Google Scholar] [CrossRef] [Scilit]
- Imtiaz, F.; Farooque, A.A.; Randhawa, G.S.; Wang, X.; Esau, T.J.; Acharya, B.; Garmdareh, S.E.H. An inclusive approach to crop soil moisture estimation: Leveraging satellite thermal infrared bands and vegetation indices on Google Earth engine. Agric. Water Manag. 2024, 306, 109172. [Google Scholar] [CrossRef] [Scilit]
- Paprotny, D.; Sebastian, A.; Morales-Nápoles, O.; Jonkman, S.N. Trends in flood losses in Europe over the past 150 years. Nat. Commun. 2018, 9, 1985. [Google Scholar] [CrossRef] [Scilit] [PubMed]
- Jongman, B. Effective adaptation to rising flood risk. Nat. Commun. 2018, 9, 1986. [Google Scholar] [CrossRef] [Scilit]
- Mohr, S.; Ehret, U.; Kunz, M.; Ludwig, P.; Caldas-Alvarez, A.; Daniell, J.E.; Ehmele, F.; Feldmann, H.; Franca, M.J.; Gattke, C.; et al. A multi-disciplinary analysis of the exceptional flood event of July 2021 in central Europe. Part 1: Event description and analysis. Nat. Hazards Earth Syst. Sci. Discuss. 2022, 23, 525–551. [Google Scholar] [CrossRef] [Scilit]
- Mendoza-Tinoco, D.; Hu, Y.; Zeng, Z.; Chalvatzis, K.J.; Zhang, N.; Steenge, A.E.; Guan, D. Flood footprint assessment: A multiregional case of 2009 central European floods. Risk Anal. 2020, 40, 1612–1631. [Google Scholar] [CrossRef] [Scilit]
- Jiang, A.L.; Hsu, K.; Sanders, B.F.; Sorooshian, S. Topographic hydro-conditioning to resolve surface depression storage and ponding in a fully distributed hydrologic model. Adv. Water Resour. 2023, 176, 104449. [Google Scholar] [CrossRef] [Scilit]
- Rammal, M.; Berthier, E. Runoff losses on urban surfaces during frequent rainfall events: A review of observations and modeling attempts. Water 2020, 12, 2777. [Google Scholar] [CrossRef] [Scilit]
- Wang, N.; Chu, X.; Zhang, X. Functionalities of surface depressions in runoff routing and hydrologic connectivity modeling. J. Hydrol. 2021, 593, 125870. [Google Scholar] [CrossRef] [Scilit]
- Bai, Y.; Zhao, N.; Zhang, R.; Zeng, X. Storm water management of low impact development in urban areas based on SWMM. Water 2018, 11, 33. [Google Scholar] [CrossRef] [Scilit]
- Burszta-Adamiak, E.; Biniak-Pieróg, M.; Dąbek, P.; Sternik, A. Rain garden hydrological performance—Responses to real rainfall events. Sci. Total Environ. 2023, 887, 164153. [Google Scholar] [CrossRef] [Scilit]
- Pińskwar, I.; Choryński, A.; Graczyk, D. Risk of Flash Floods in Urban and Rural Municipalities Triggered by Intense Precipitation in Wielkopolska of Poland. Int. J. Disaster Risk Sci. 2023, 14, 440–457. [Google Scholar] [CrossRef] [Scilit]
- Lepeška, T. The impact of impervious surfaces on ecohydrology and health in urban ecosystems of Banská Bystrica (Slovakia). Soil Water Res. 2016, 11, 29–36. [Google Scholar] [CrossRef] [Scilit]
- Ungaro, F.; Calzolari, C.; Pistocchi, A.; Malucelli, F. Modelling the impact of increasing soil sealing on runoff coefficients at regional scale: A hydropedological approach. J. Hydrol. Hydromech. 2014, 62, 33–42. [Google Scholar] [CrossRef] [Scilit]
- Hua, L.; Zhang, X.; Nie, Q.; Sun, F.; Tang, L. The Impacts of the Expansion of Urban Impervious Surfaces on Urban Heat Islands in a Coastal City in China. Sustainability 2020, 12, 475. [Google Scholar] [CrossRef] [Scilit]
- Ma, X.; Peng, S. Assessing the quantitative relationships between the impervious surface area and surface heat island effect during urban expansion. PeerJ 2021, 9, e11854. [Google Scholar] [CrossRef] [Scilit] [PubMed]
- Uittenbroek, C.; Mees, H.; Hegger, D.; Driessen, P. The design of public participation: Who participates, when and how? Insights in climate adaptation planning from the Netherlands. J. Environ. Plan. Manag. 2019, 62, 2529–2547. [Google Scholar] [CrossRef] [Scilit]
- Samborska-Goik, K.; Starzewska-Sikorska, A.; Obłój, P. Thinking Green: A Place Lab Approach to Citizen Engagement and Indicators for Nature-Based Solutions in a Case Study from Katowice. Sustainability 2025, 17, 6857. [Google Scholar] [CrossRef] [Scilit]
- Chu, E.; Anguelovski, I.; Carmin, J. Inclusive approaches to urban climate adaptation planning and implementation in the Global South. Clim. Policy 2016, 16, 372–392. [Google Scholar] [CrossRef] [Scilit]
- Sarzynski, A. Public participation, civic capacity, and climate change adaptation in cities. Urban Clim. 2015, 14, 52–67. [Google Scholar] [CrossRef] [Scilit]
- Karimi, A.; Brown, G.; Hockings, M. Methods and participatory approaches for identifying social-ecological hotspots. Appl. Geogr. 2015, 63, 9–20. [Google Scholar] [CrossRef] [Scilit]
- Riaz, K.; McAfee, M.; Gharbia, S.S. Management of climate resilience: Exploring the potential of digital twin technology, 3D city modelling, and early warning systems. Sensors 2023, 23, 2659. [Google Scholar] [CrossRef] [Scilit] [PubMed]
- Zhu, M.; Jin, J. Data-driven urban digital twins and critical infrastructure under climate change: A review of frameworks and applications. Urban Plan. 2025, 10, 10109. [Google Scholar] [CrossRef] [Scilit]
- Chen, C.; Han, Y.; Galinski, A.; Calle, C.; Carney, J.; Ye, X.; van Westen, C. Integrating urban digital twin with cloud-based geospatial dashboard for coastal resilience planning: A case study in Florida. J. Plan. Educ. Res. 2025, 45, 743–759. [Google Scholar] [CrossRef] [Scilit]
- Henriksen, H.J.; Schneider, R.; Koch, J.; Ondracek, M.; Troldborg, L.; Seidenfaden, I.K.; Kragh, S.J.; Bøgh, E.; Stisen, S. A new digital twin for climate change adaptation, water management, and disaster risk reduction (HIP digital twin). Water 2022, 15, 25. [Google Scholar] [CrossRef] [Scilit]
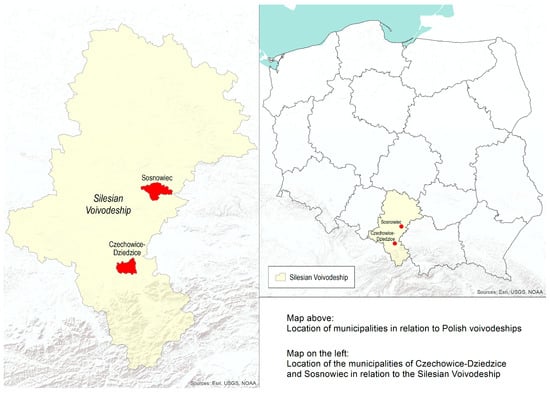
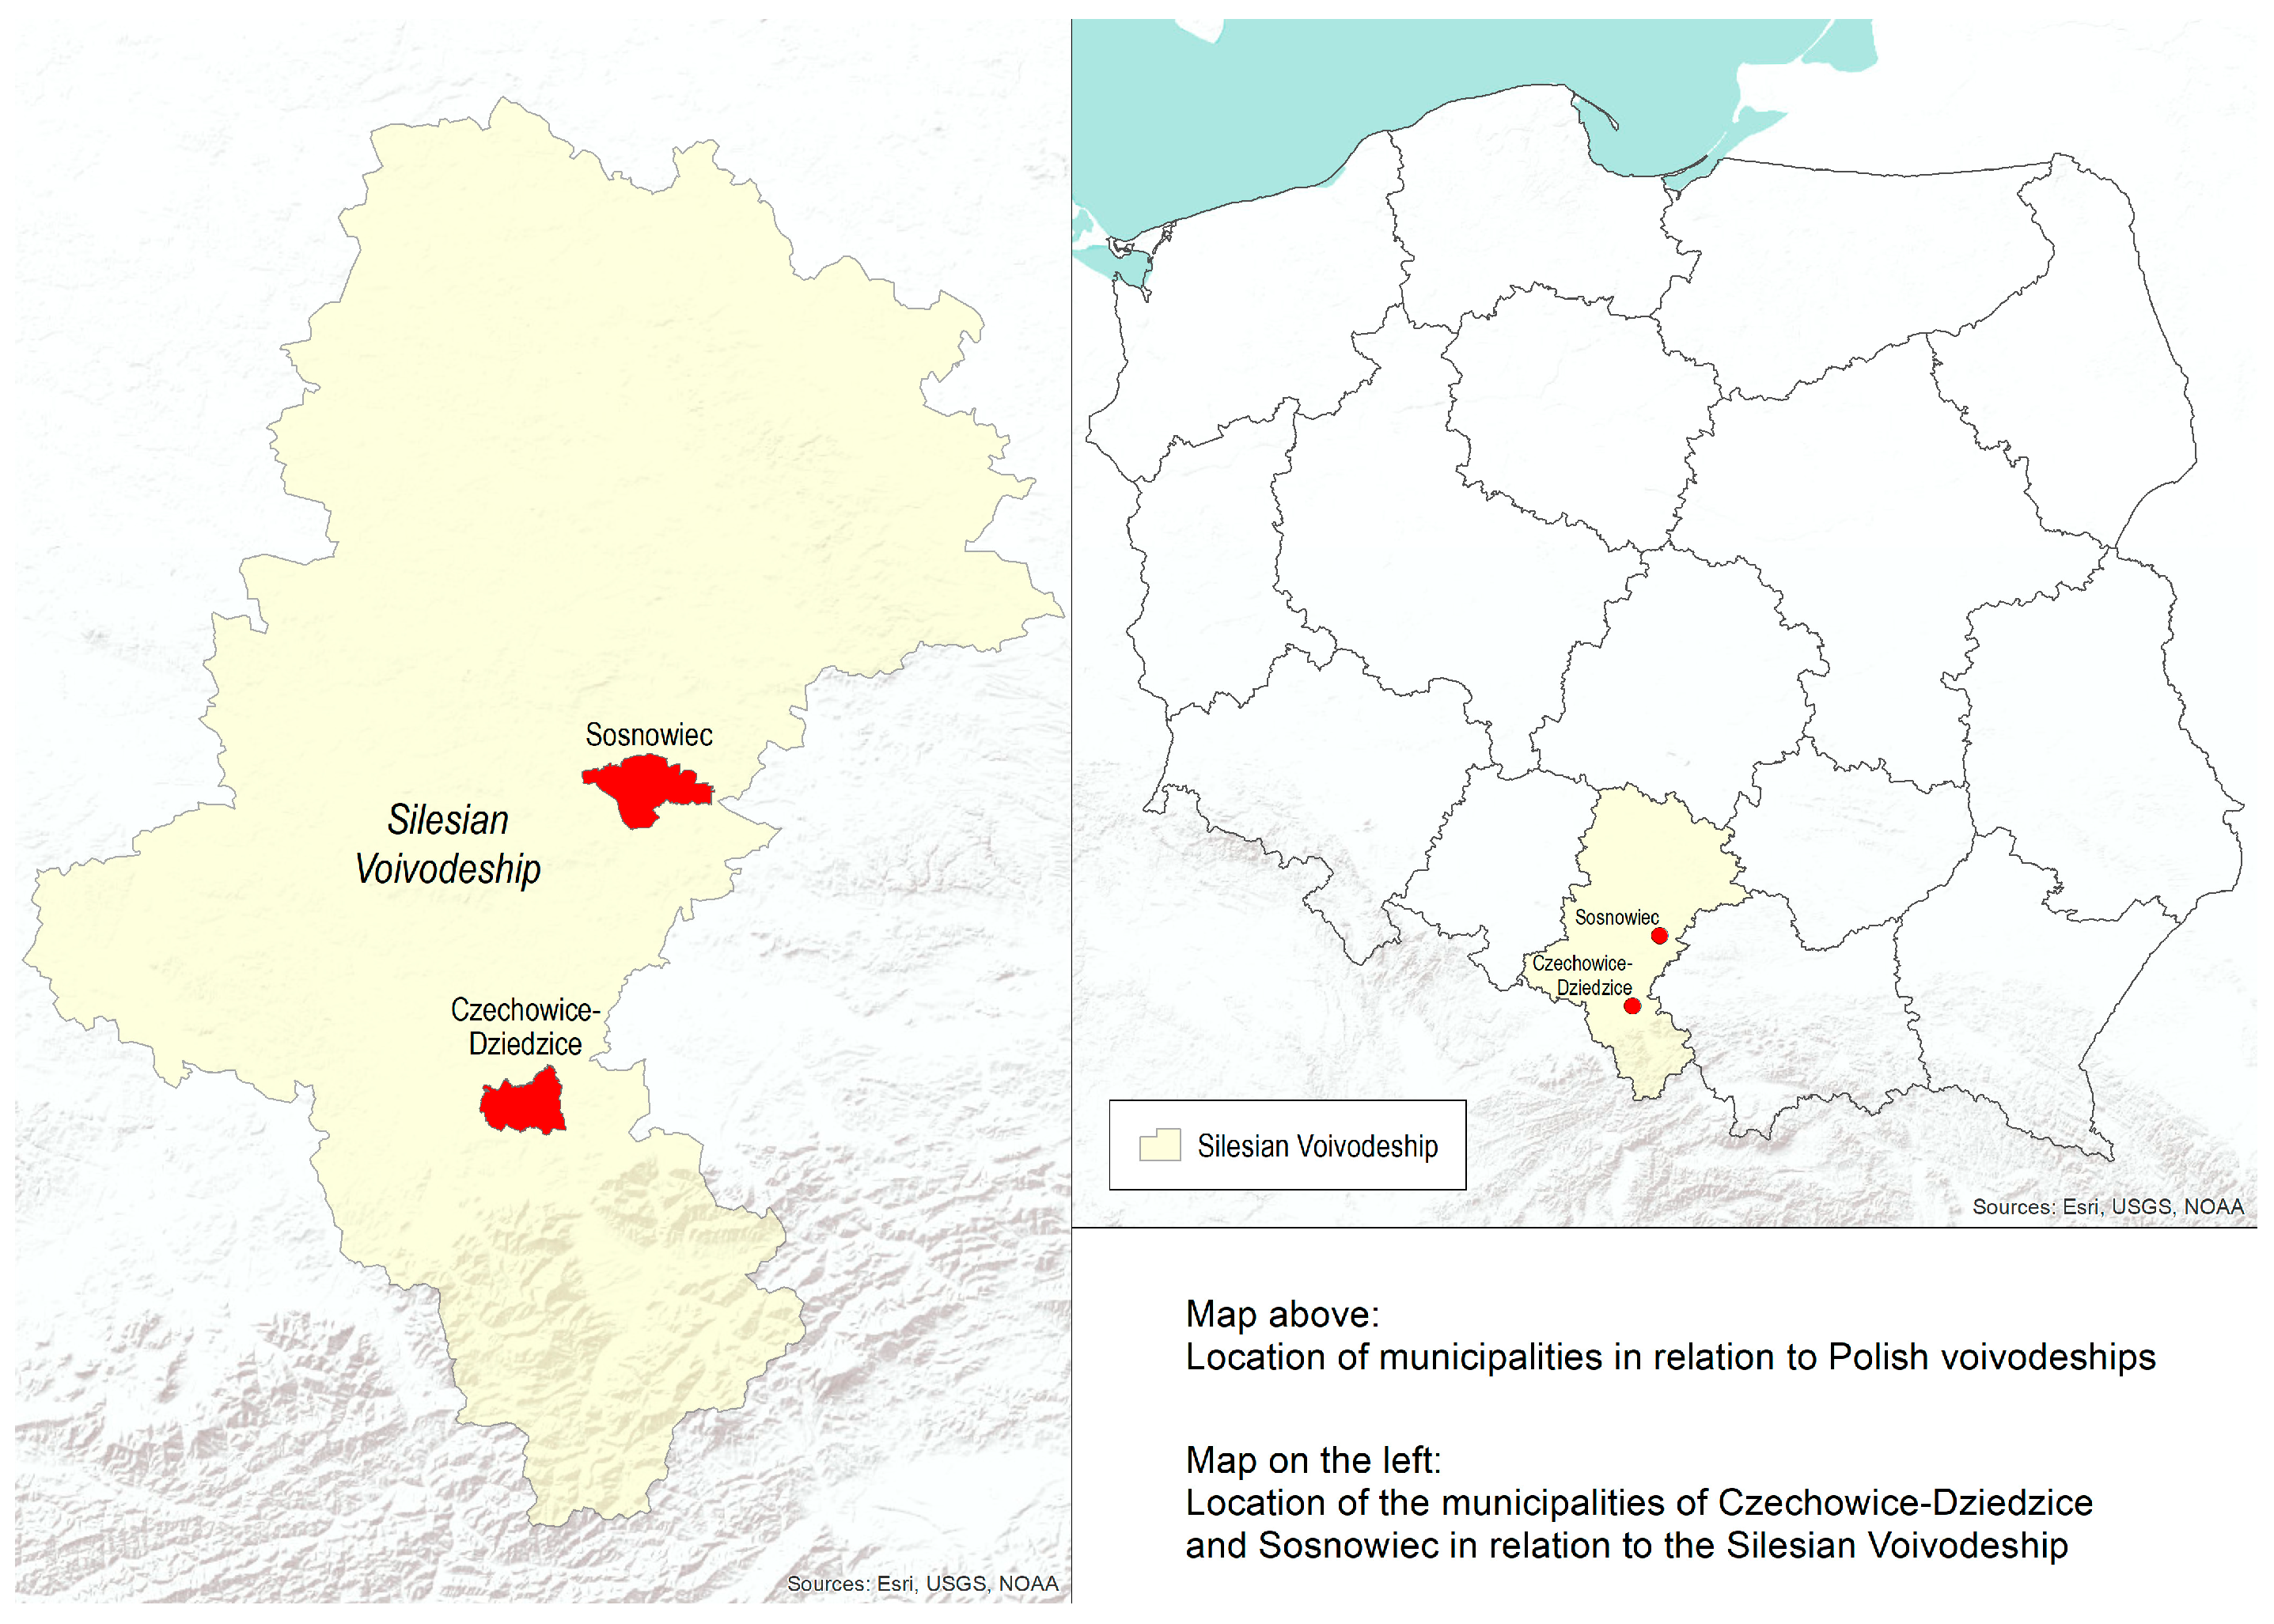
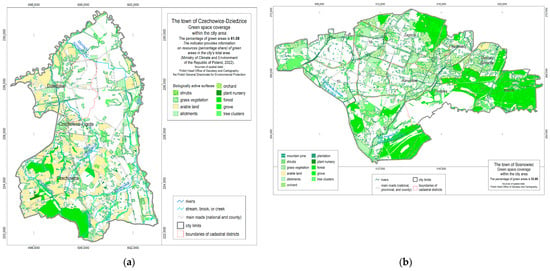
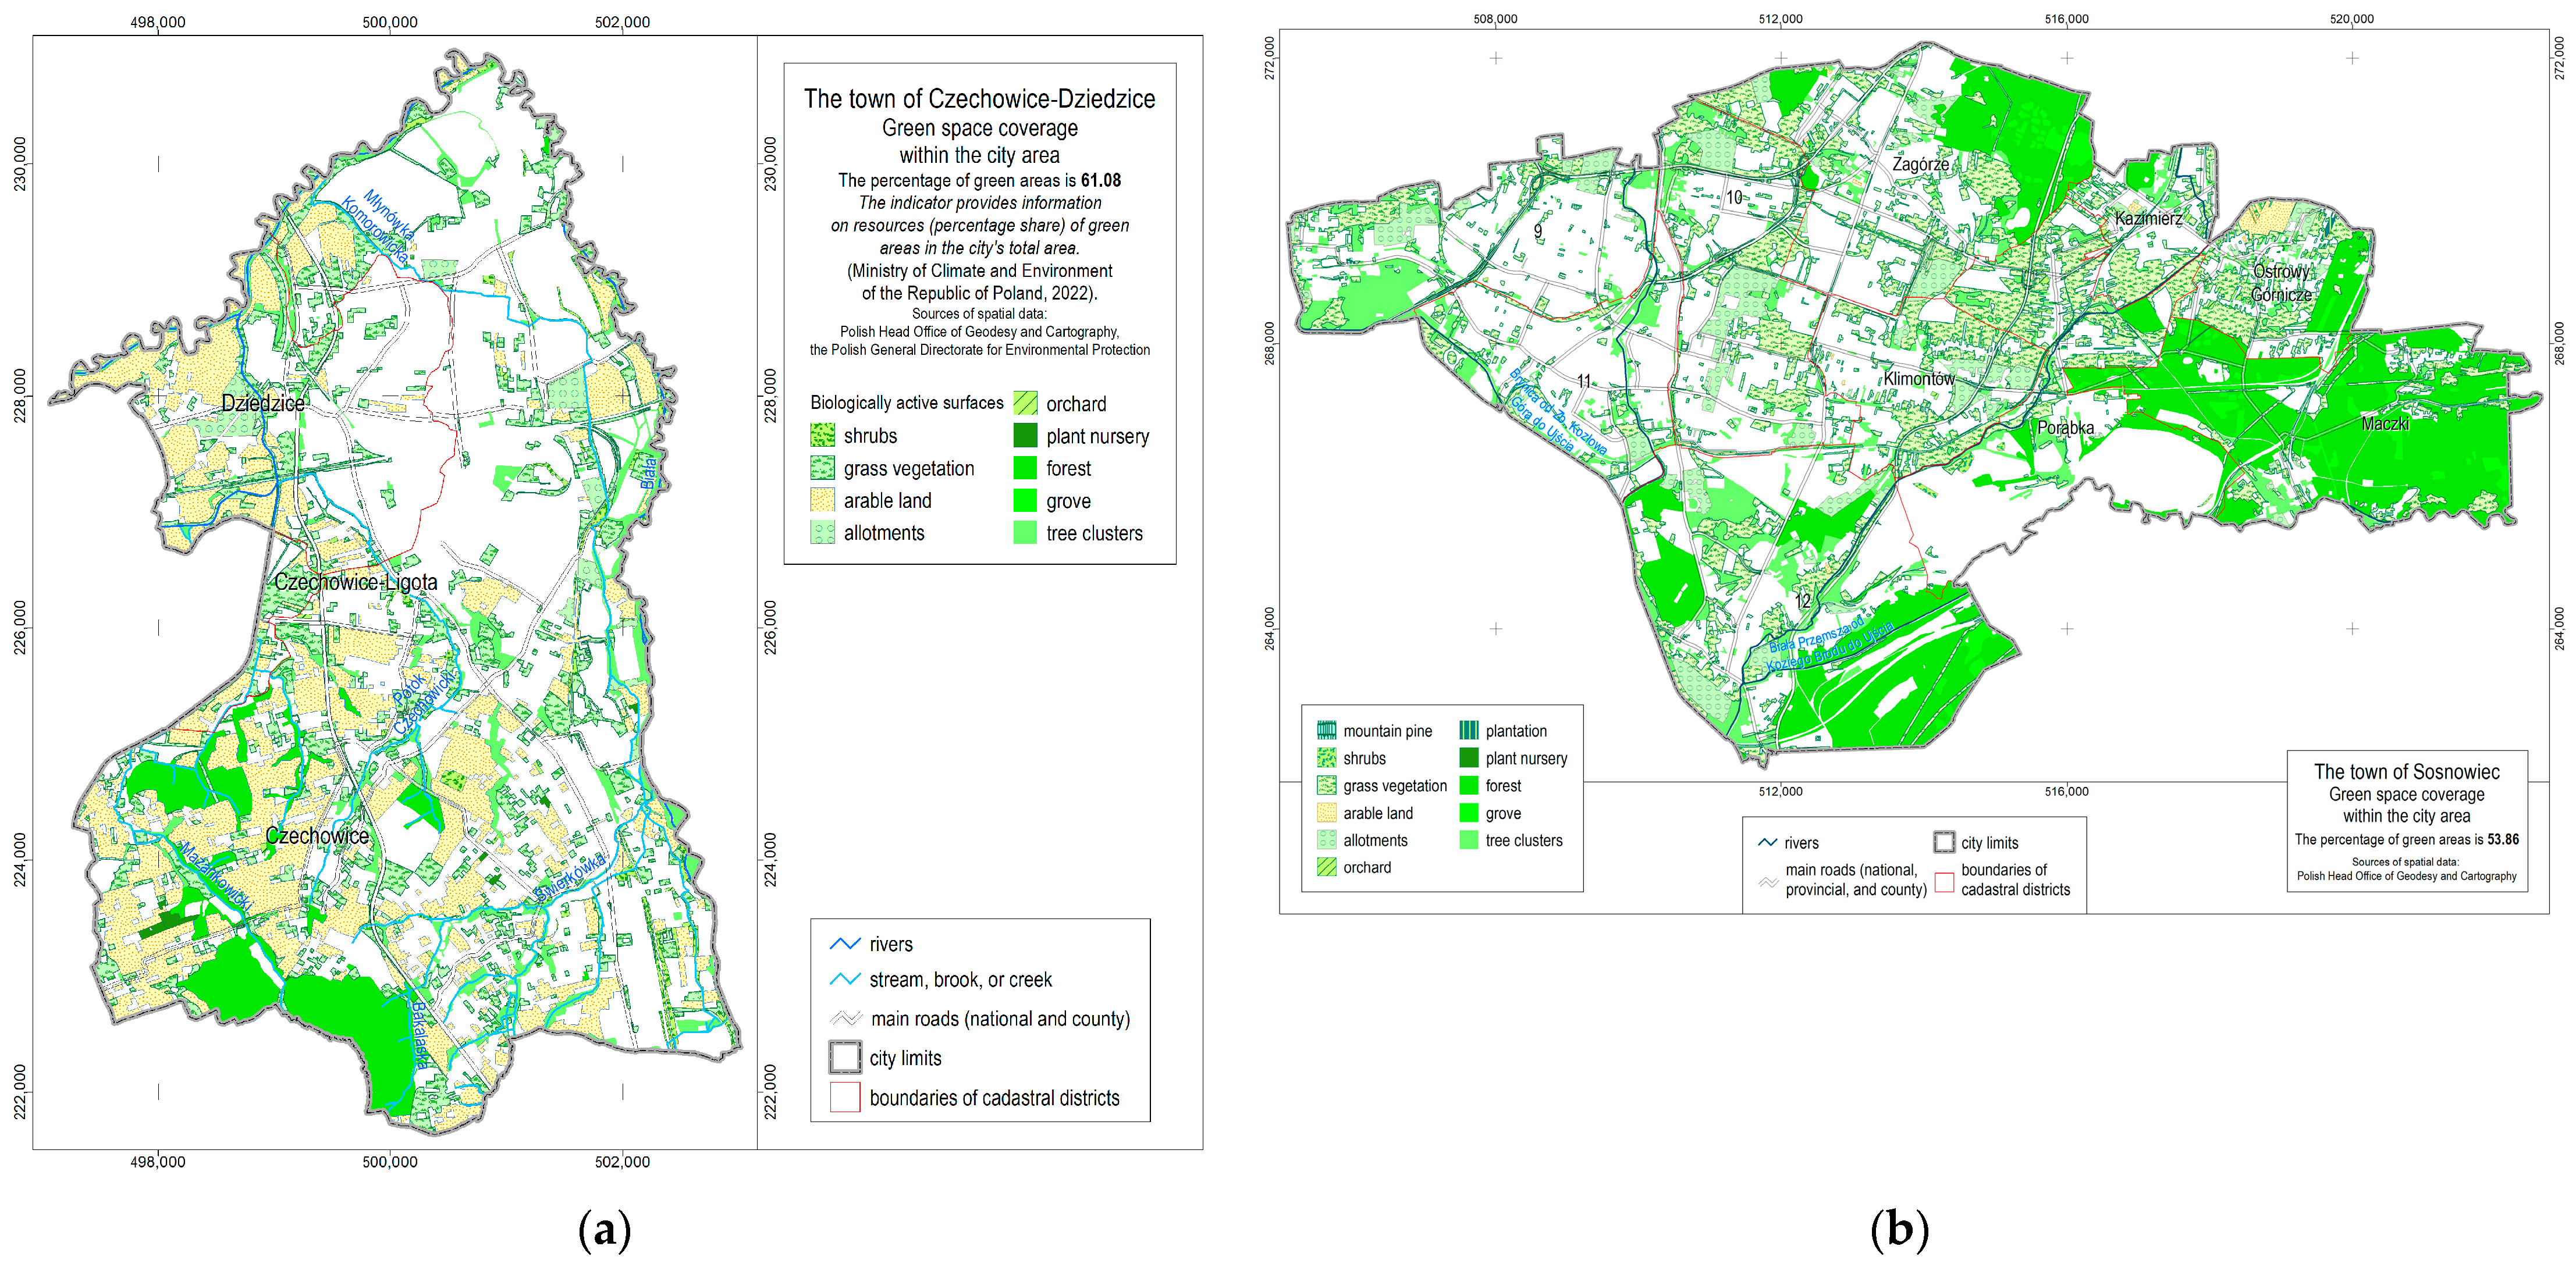
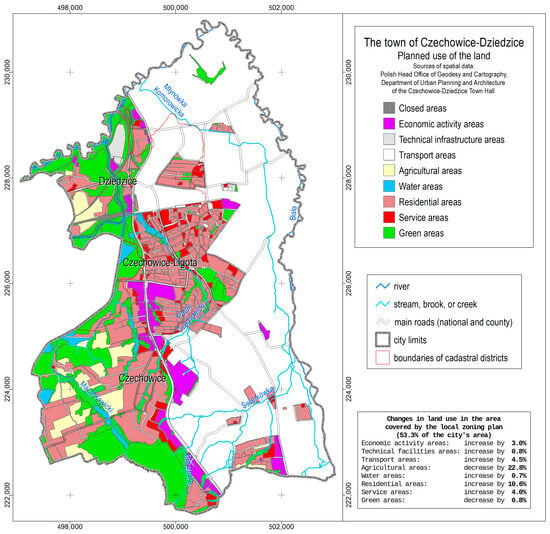
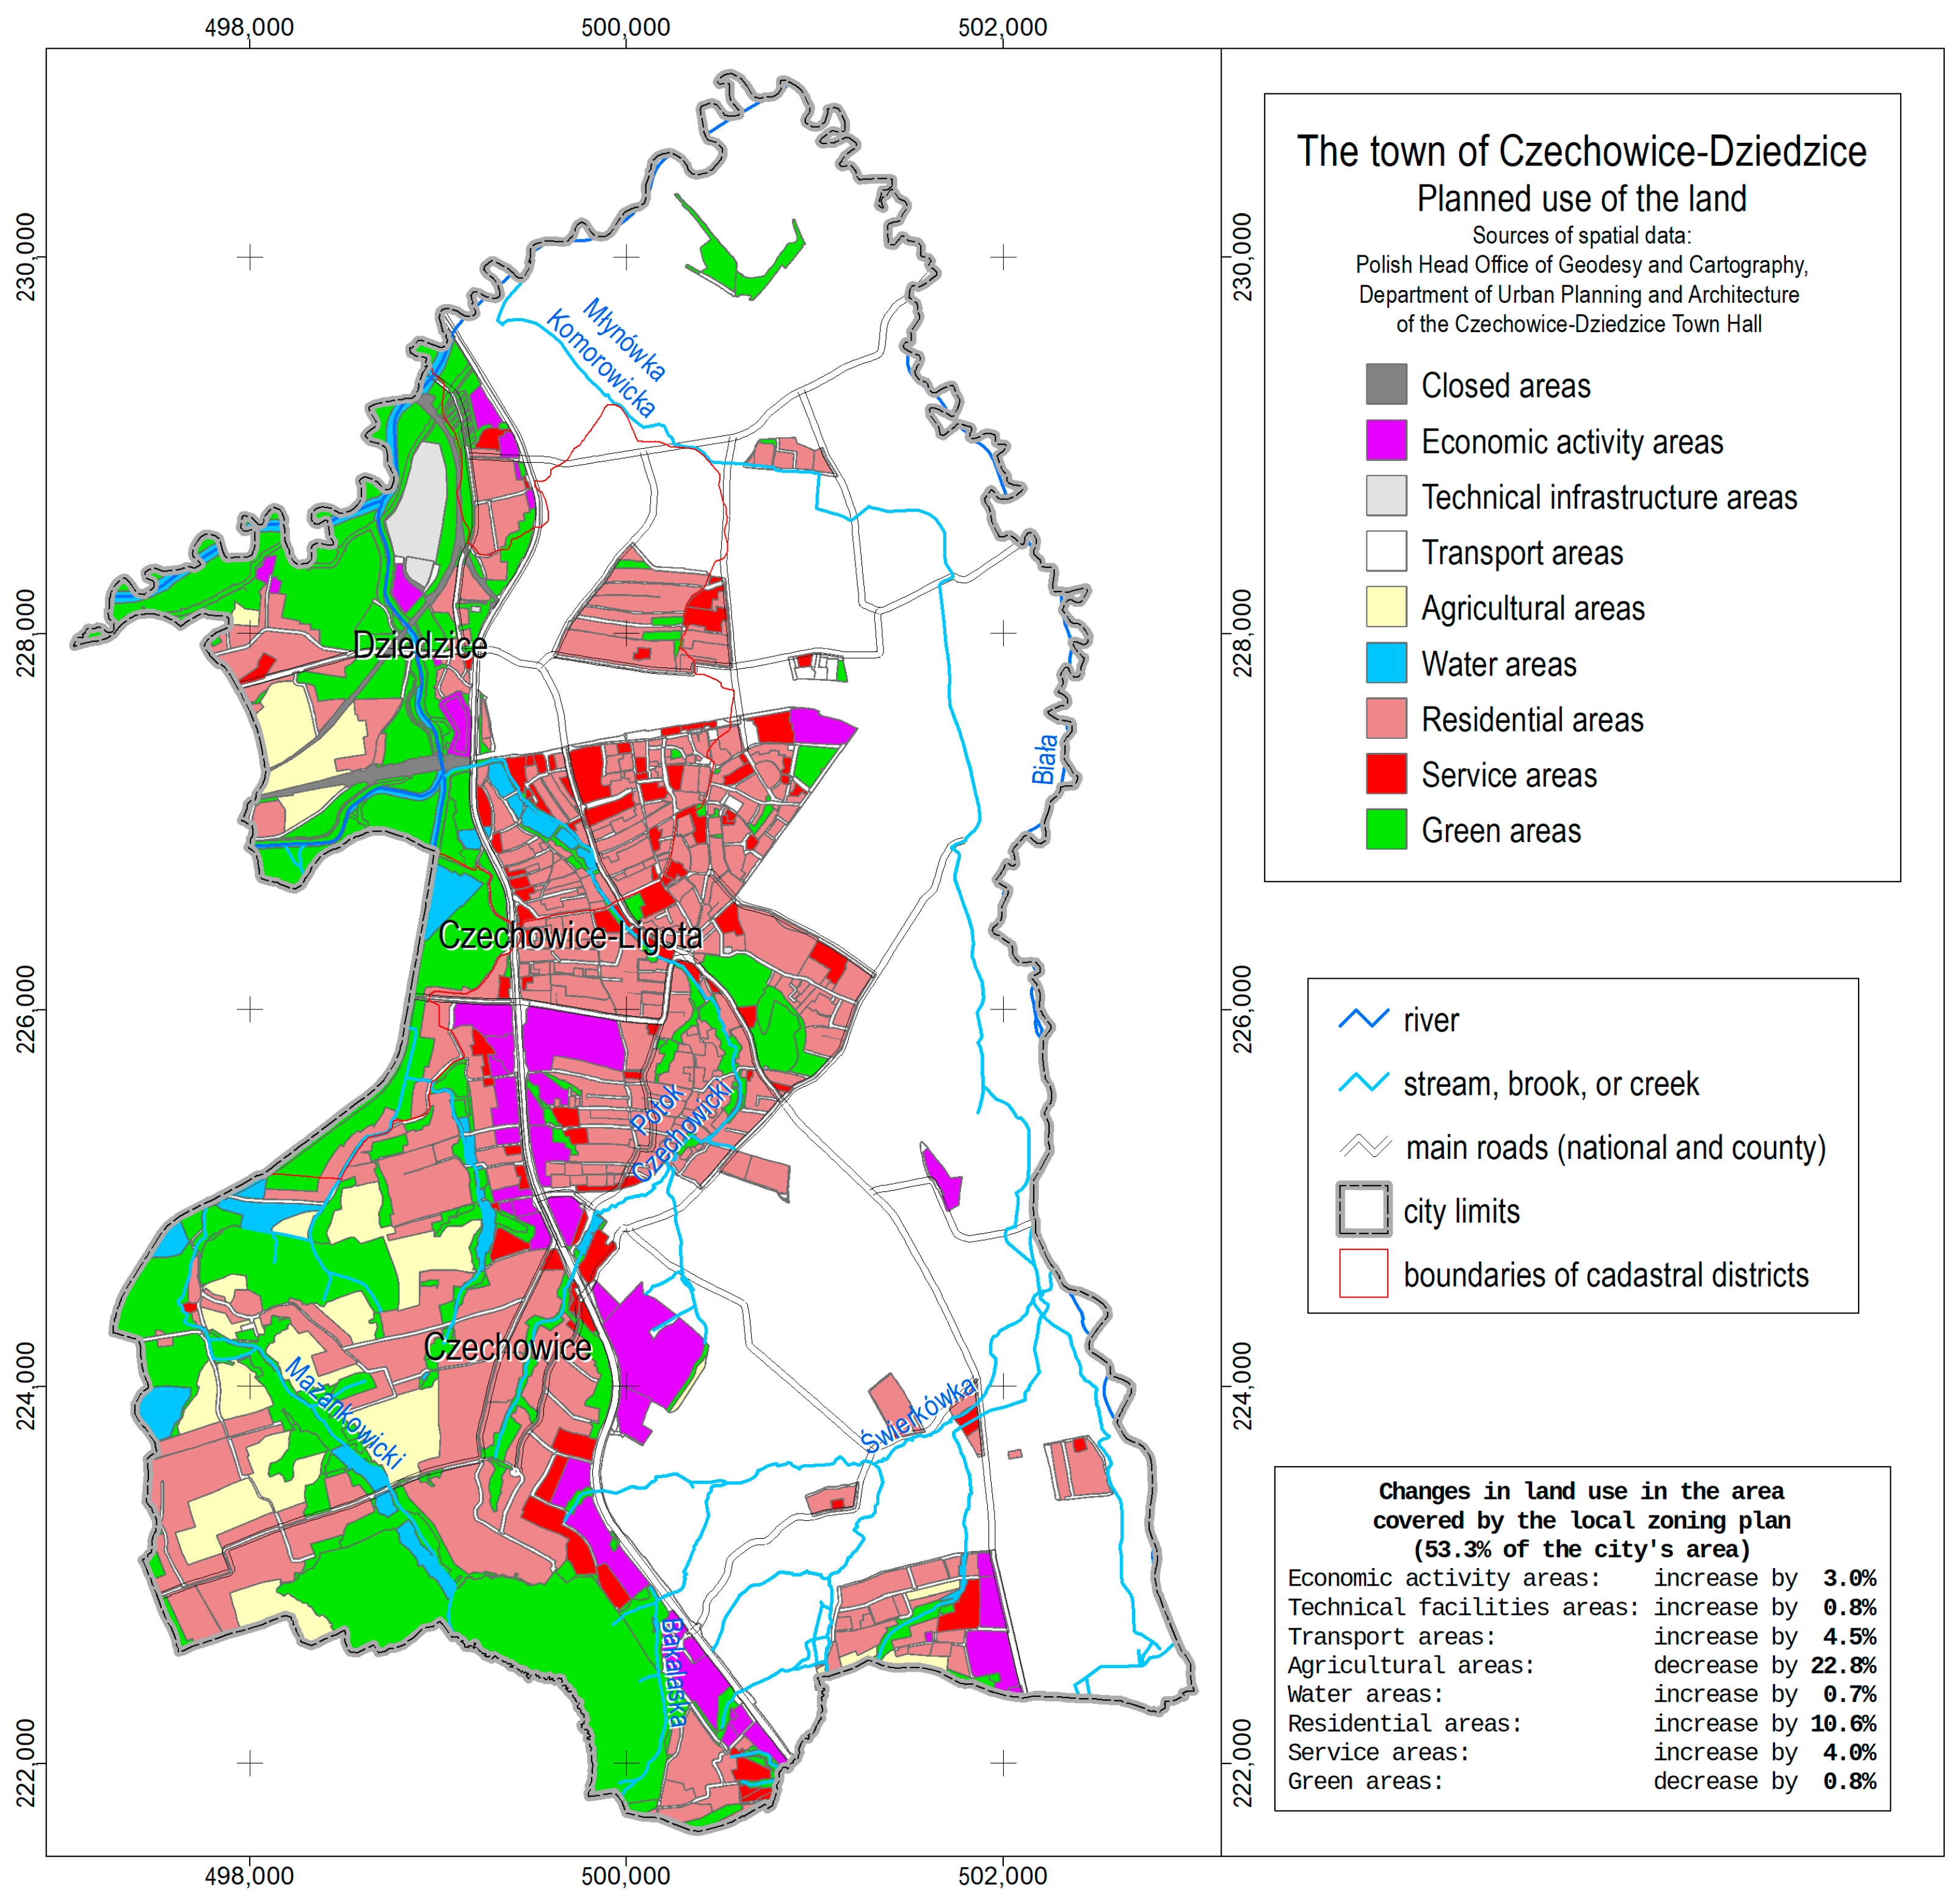
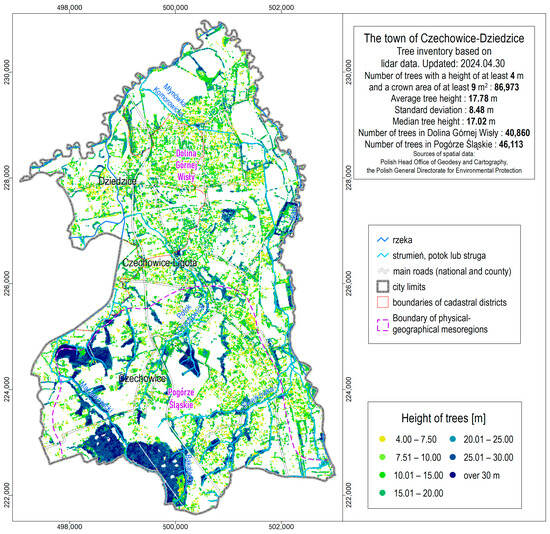
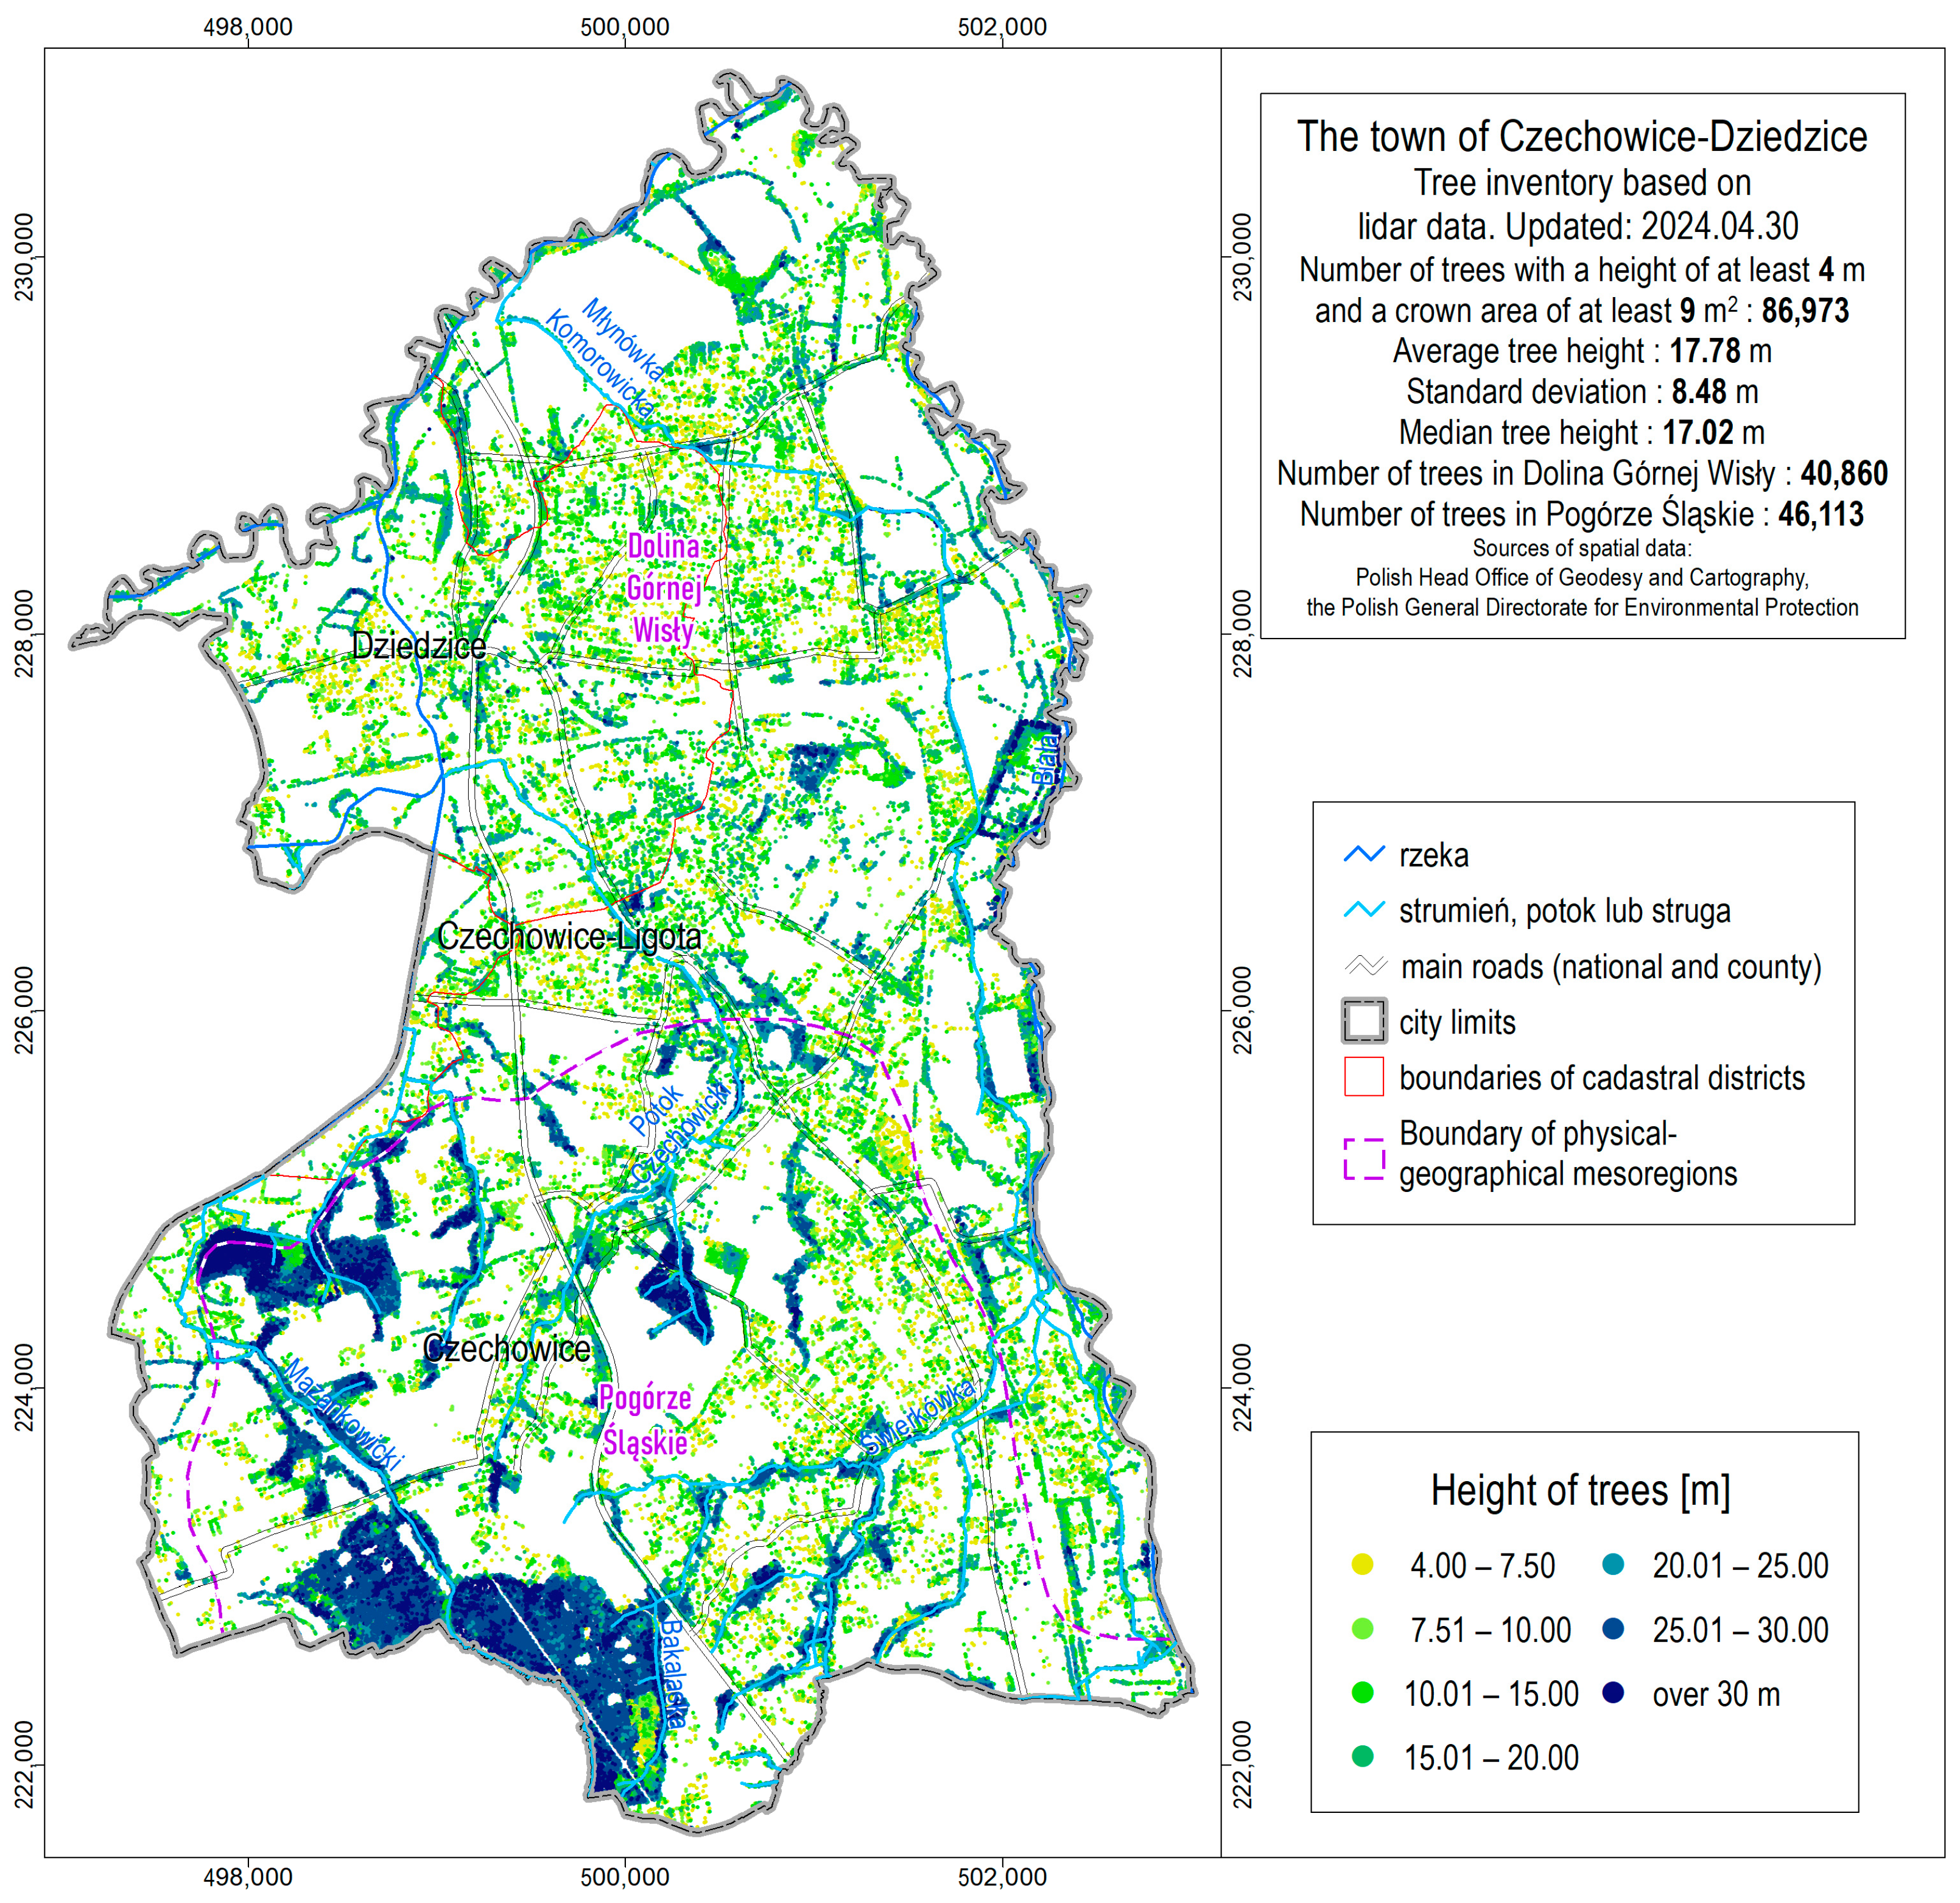
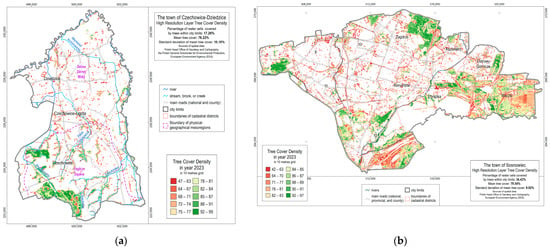
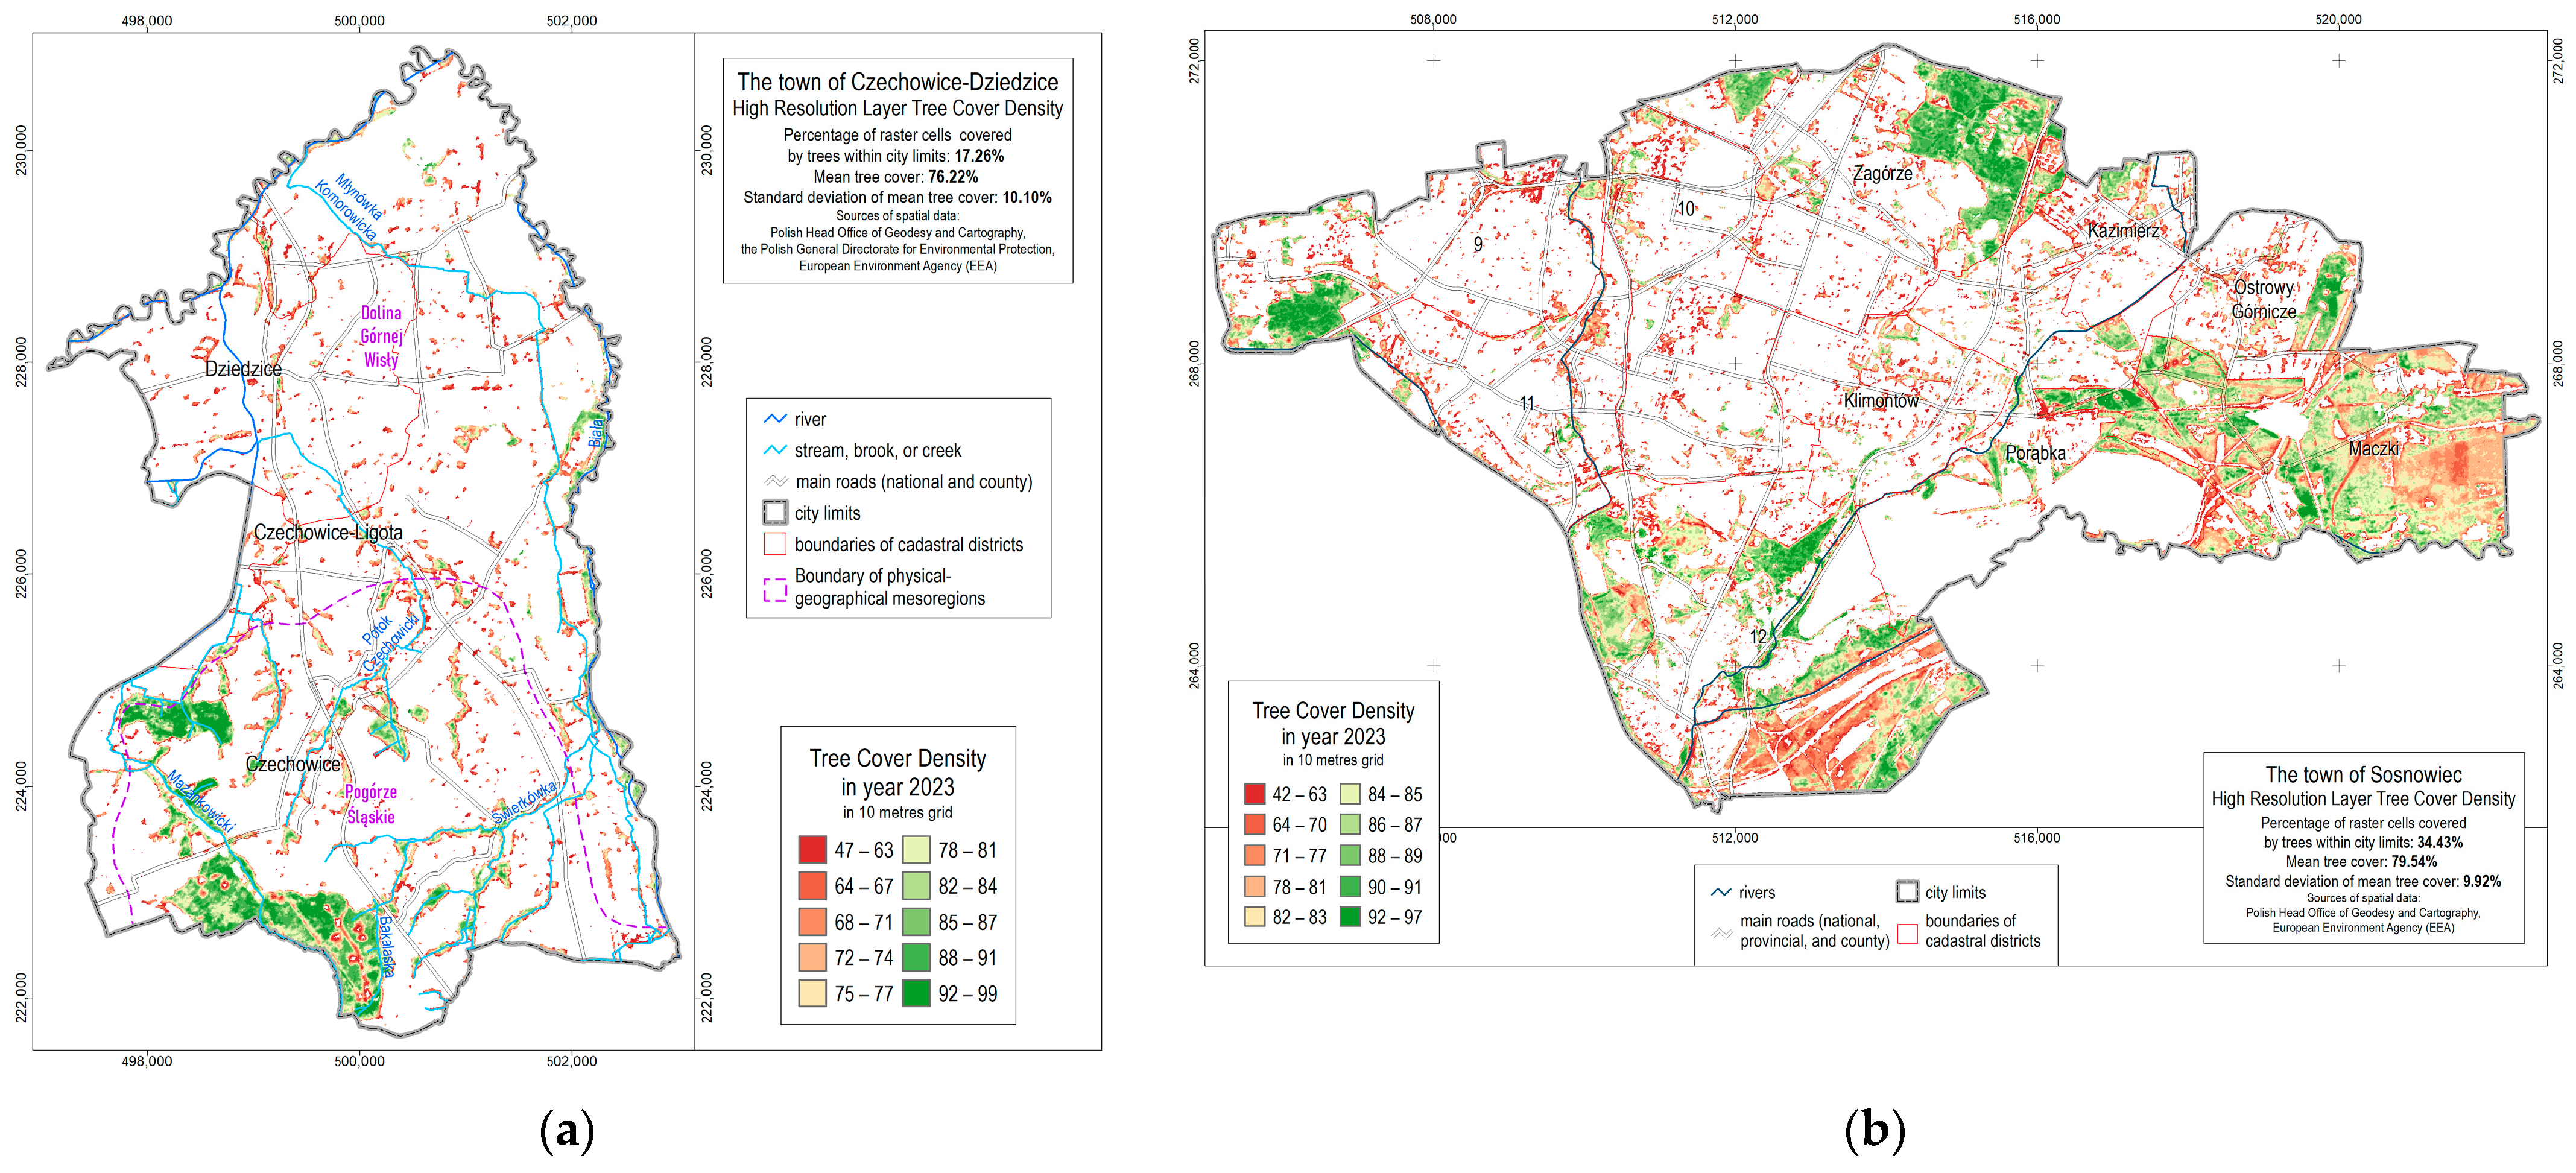
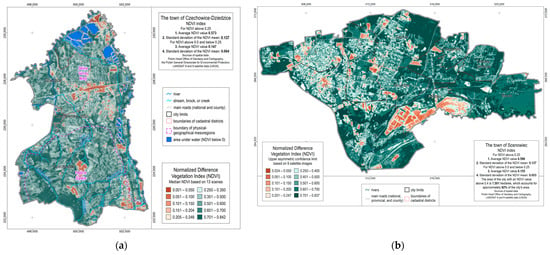
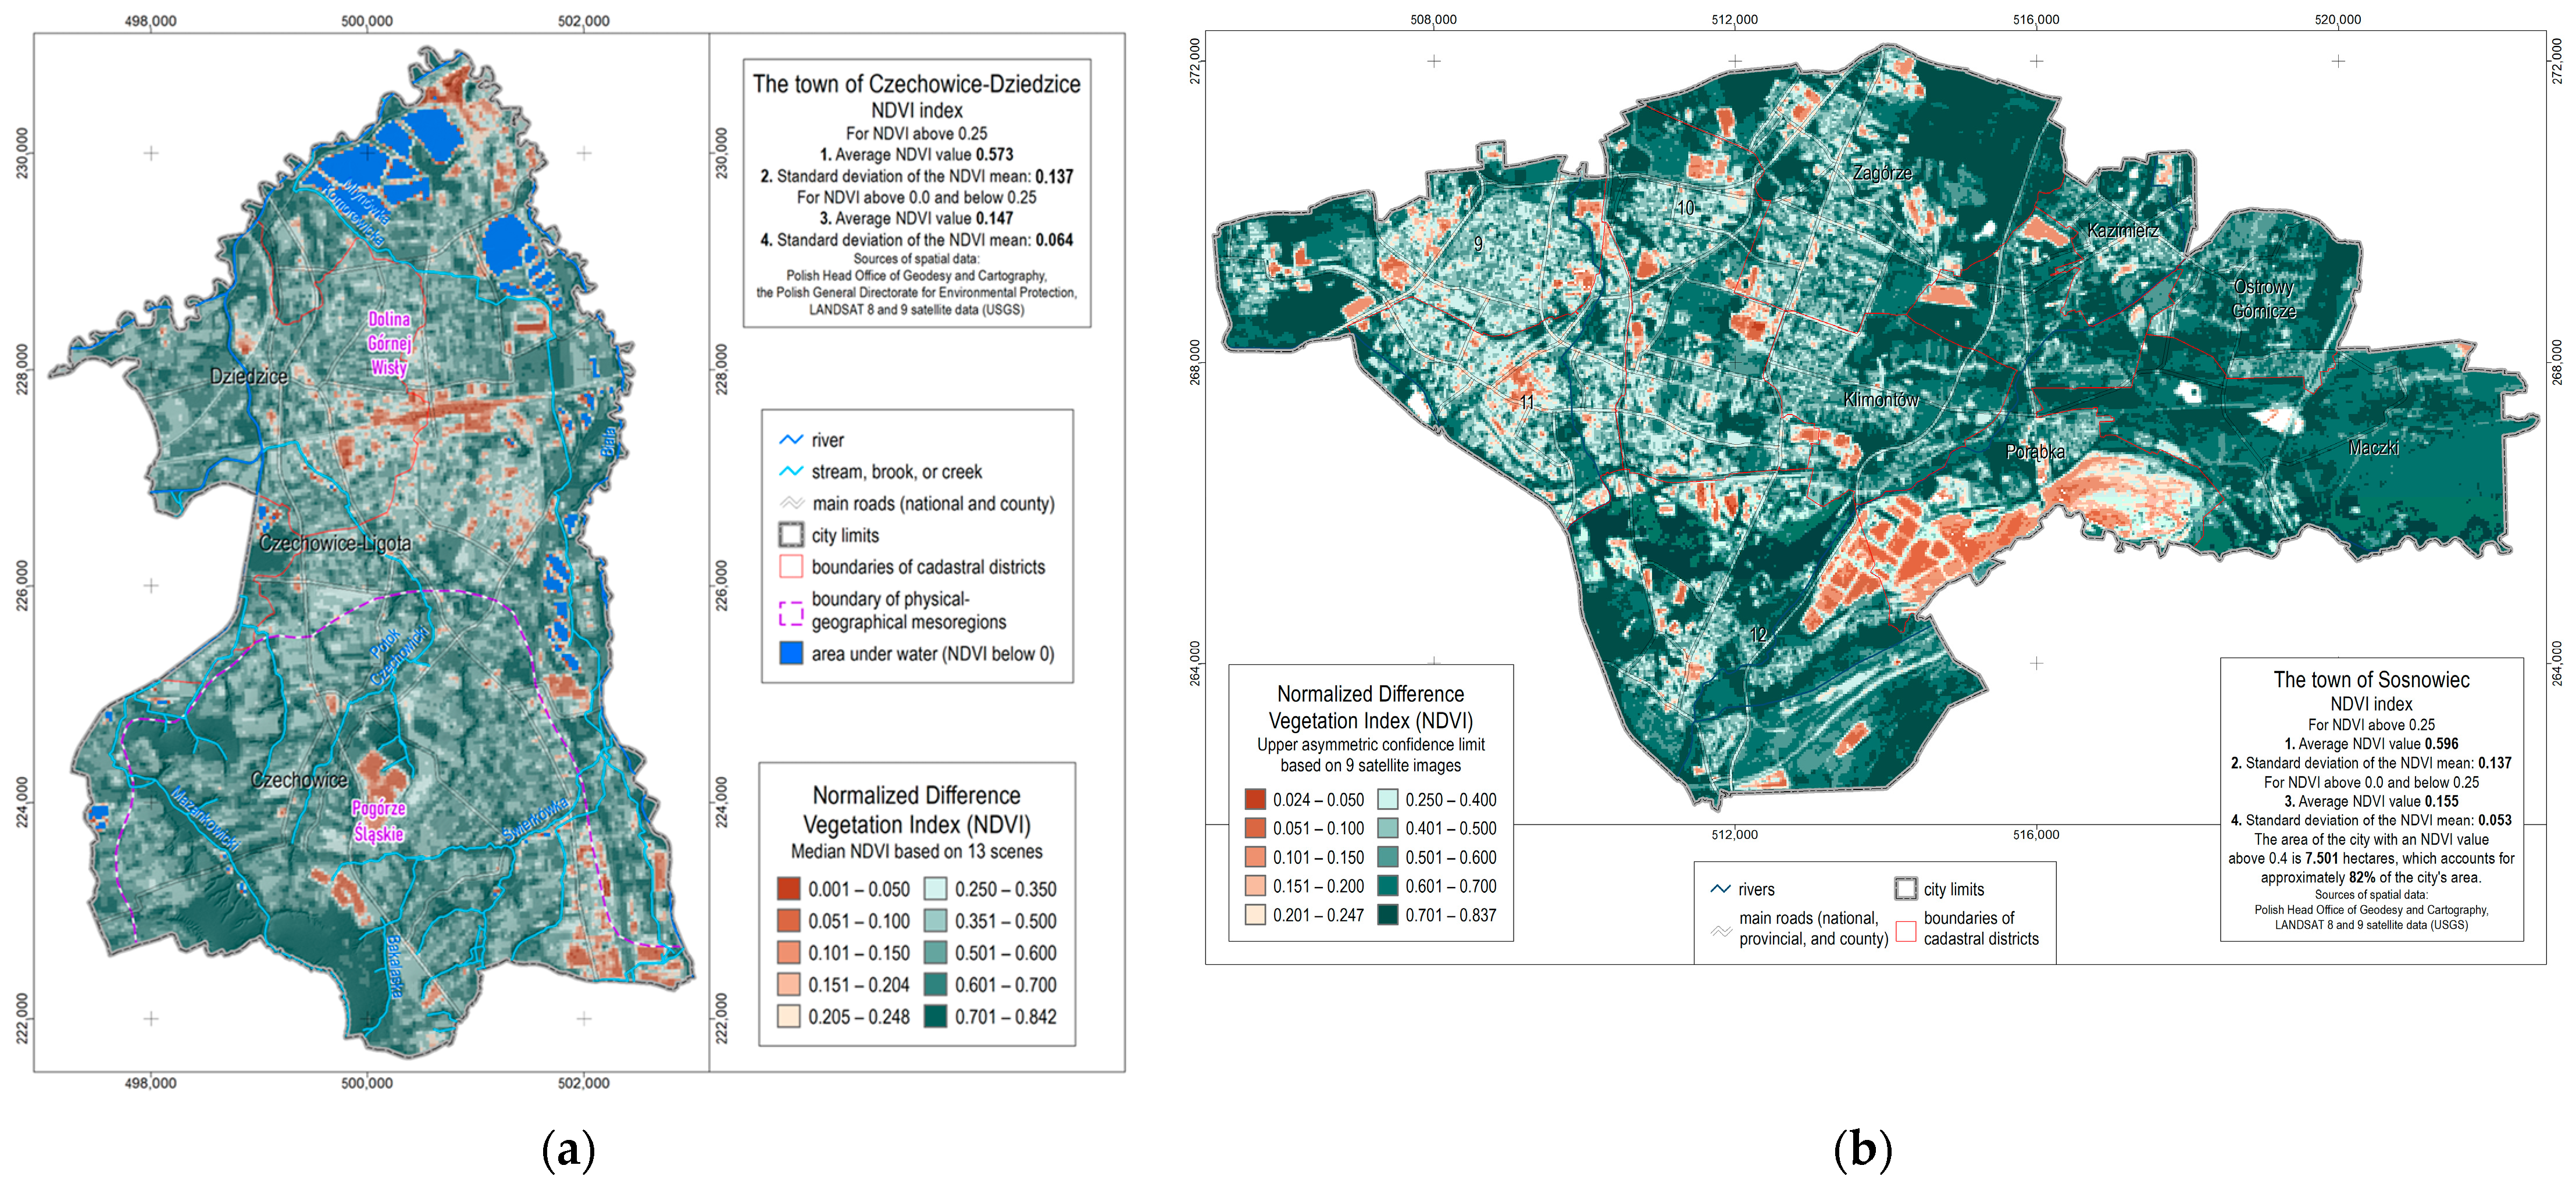
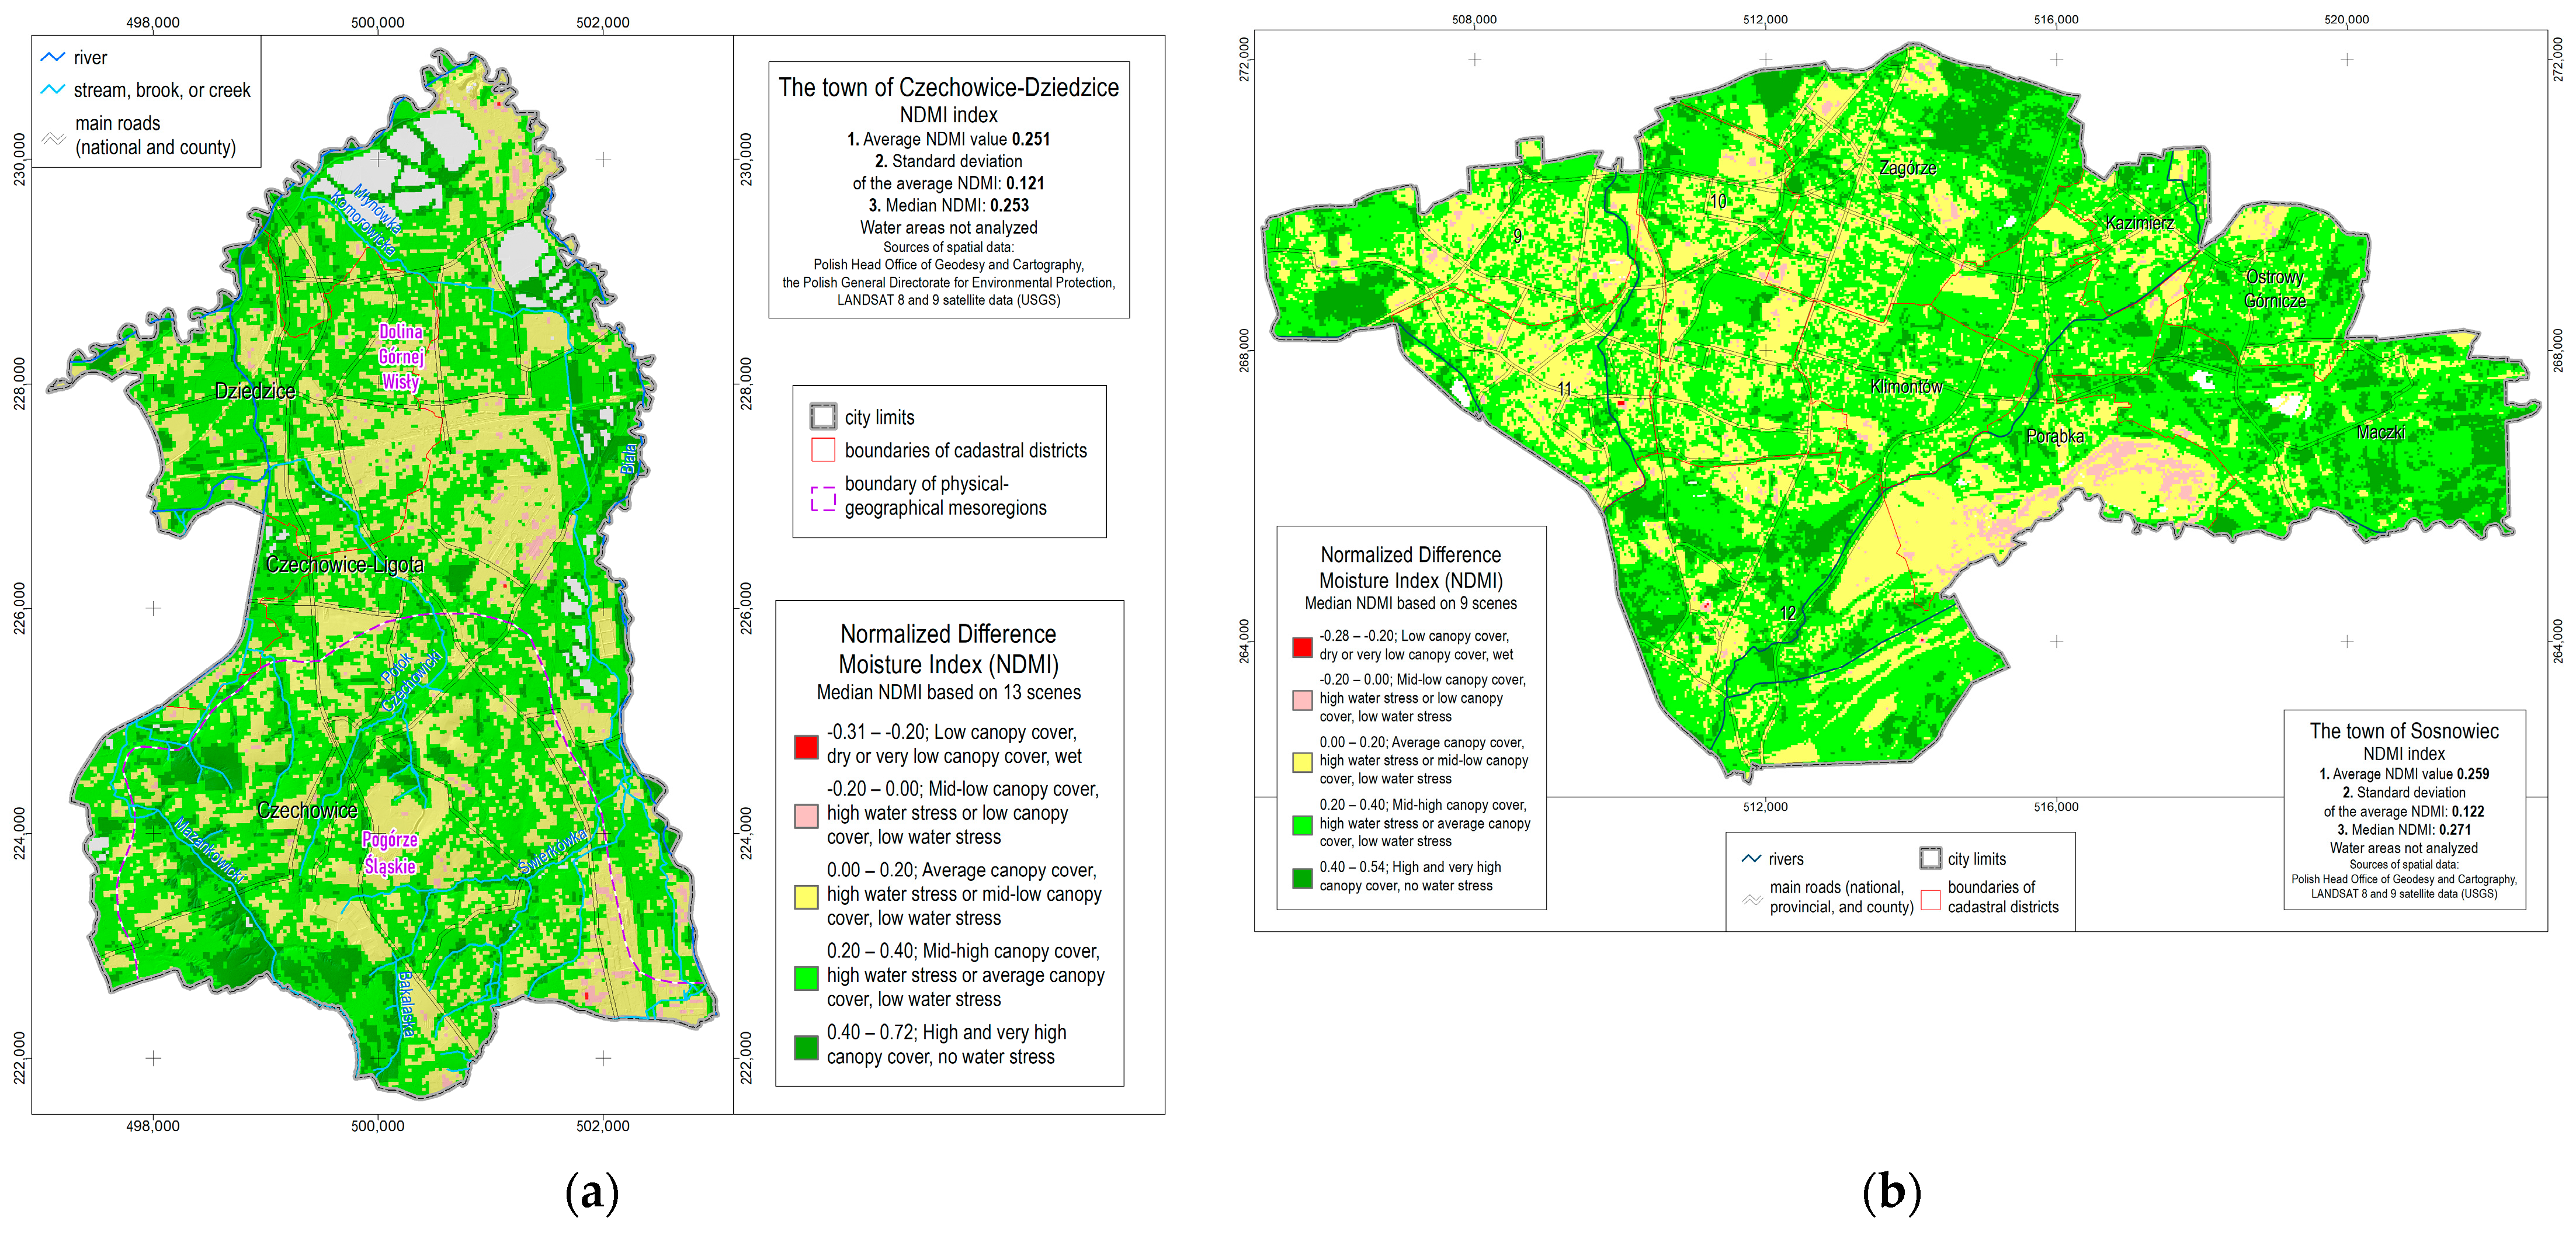
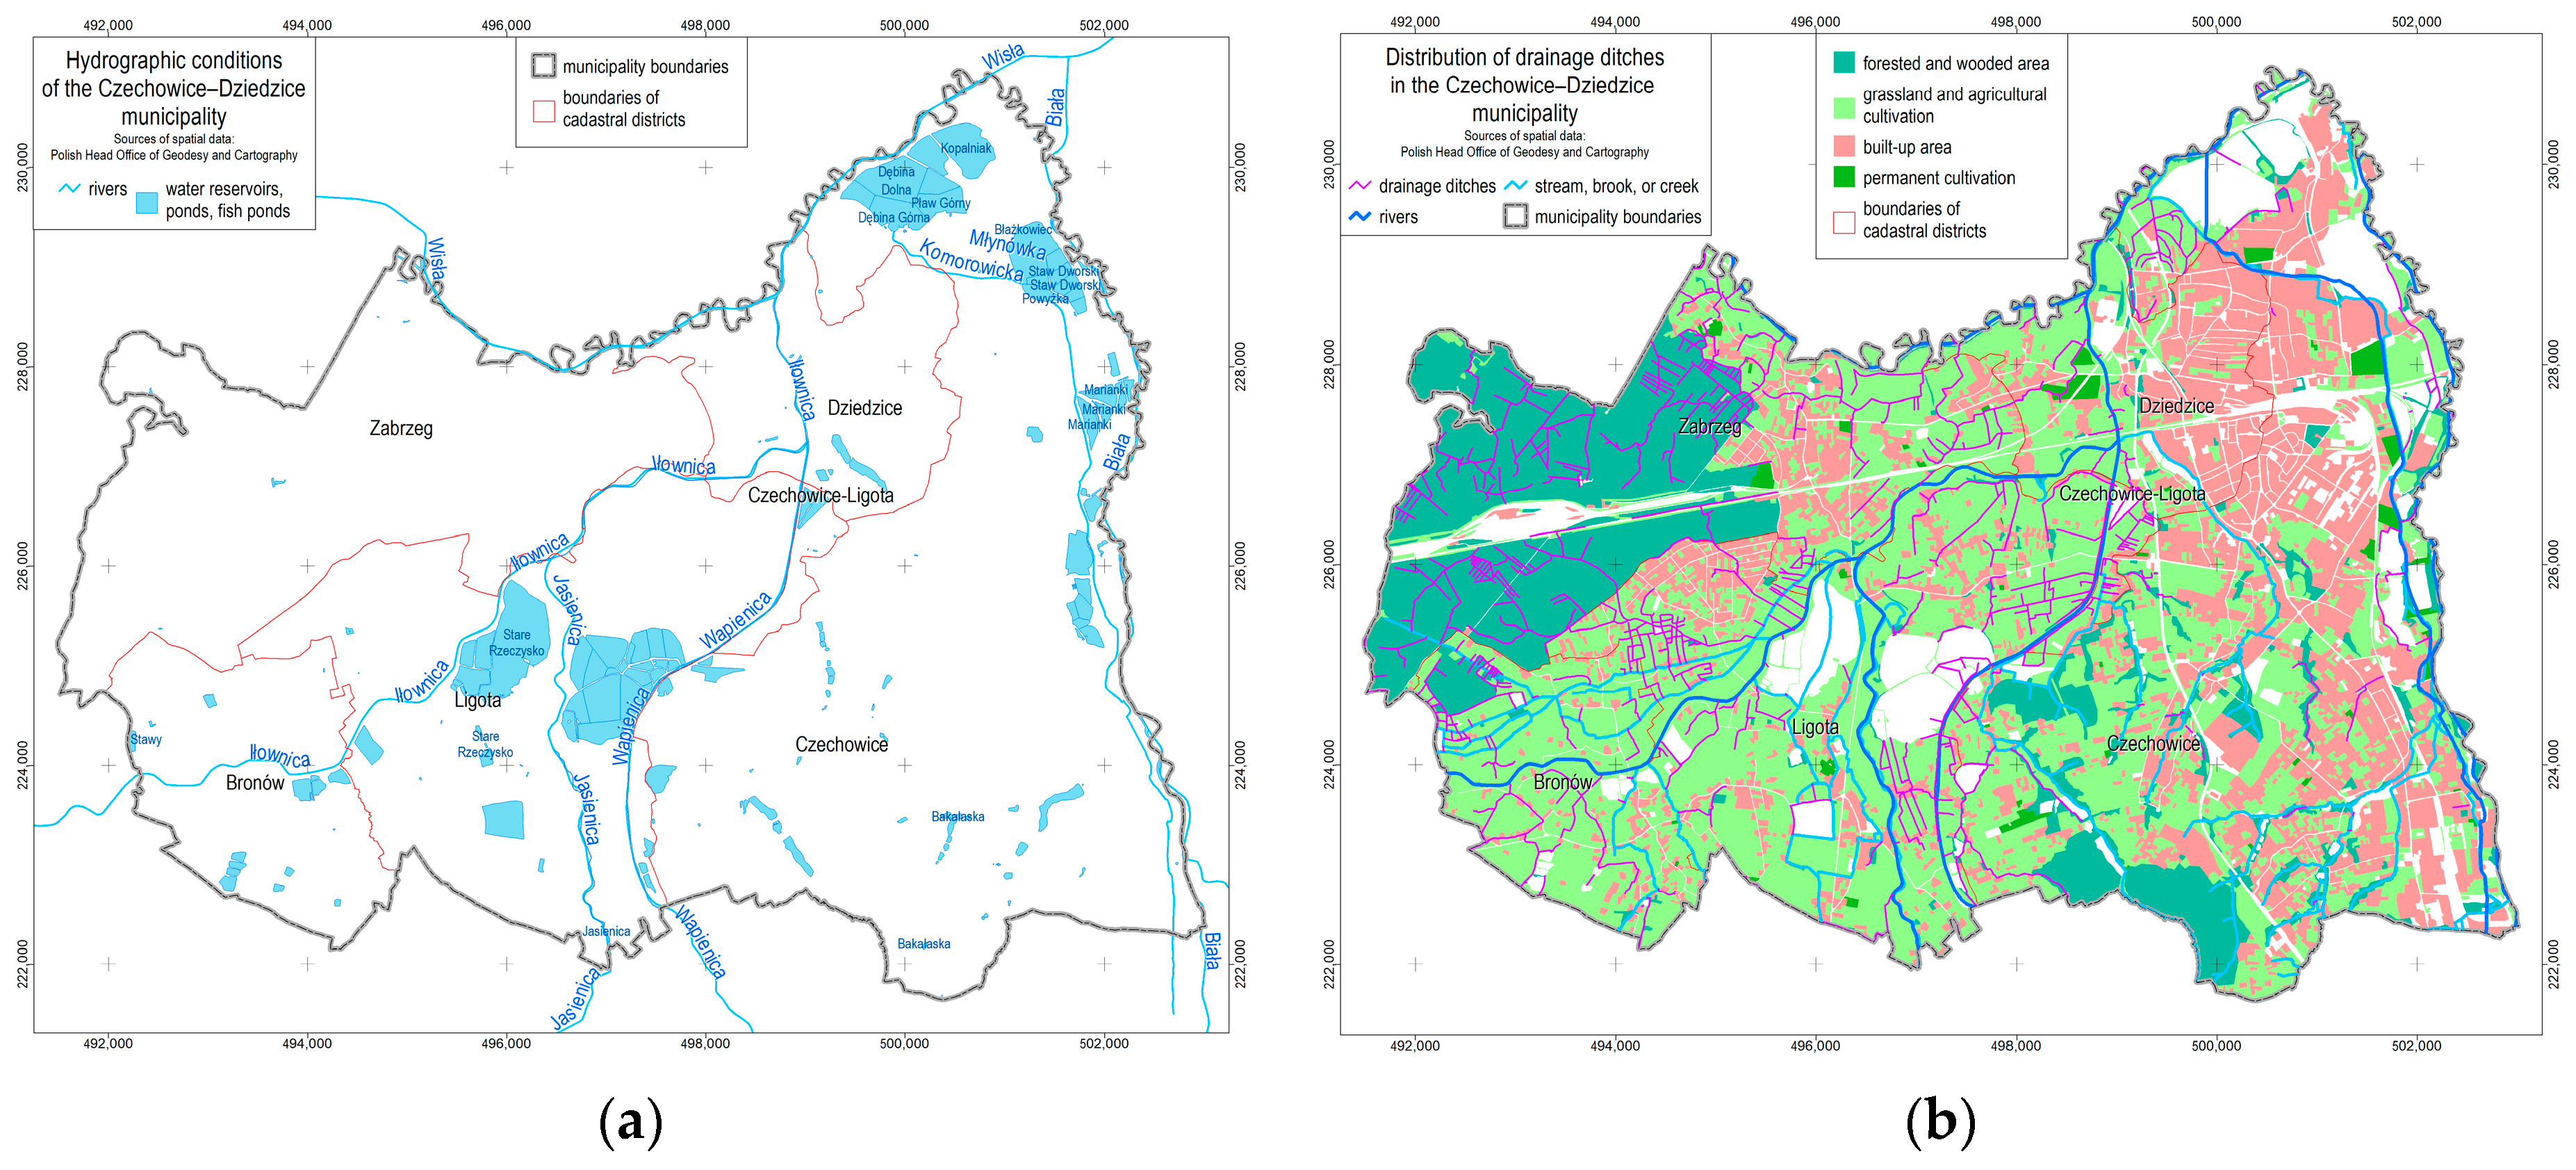
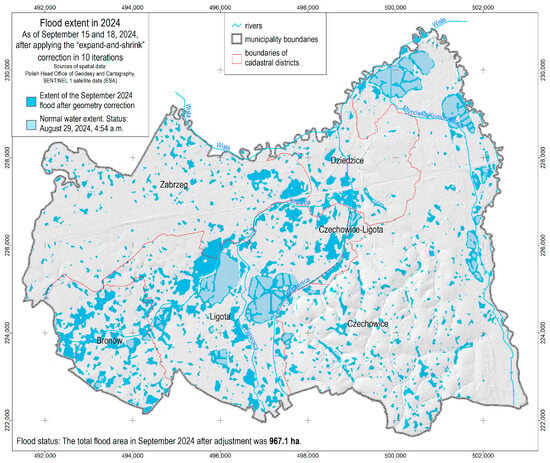
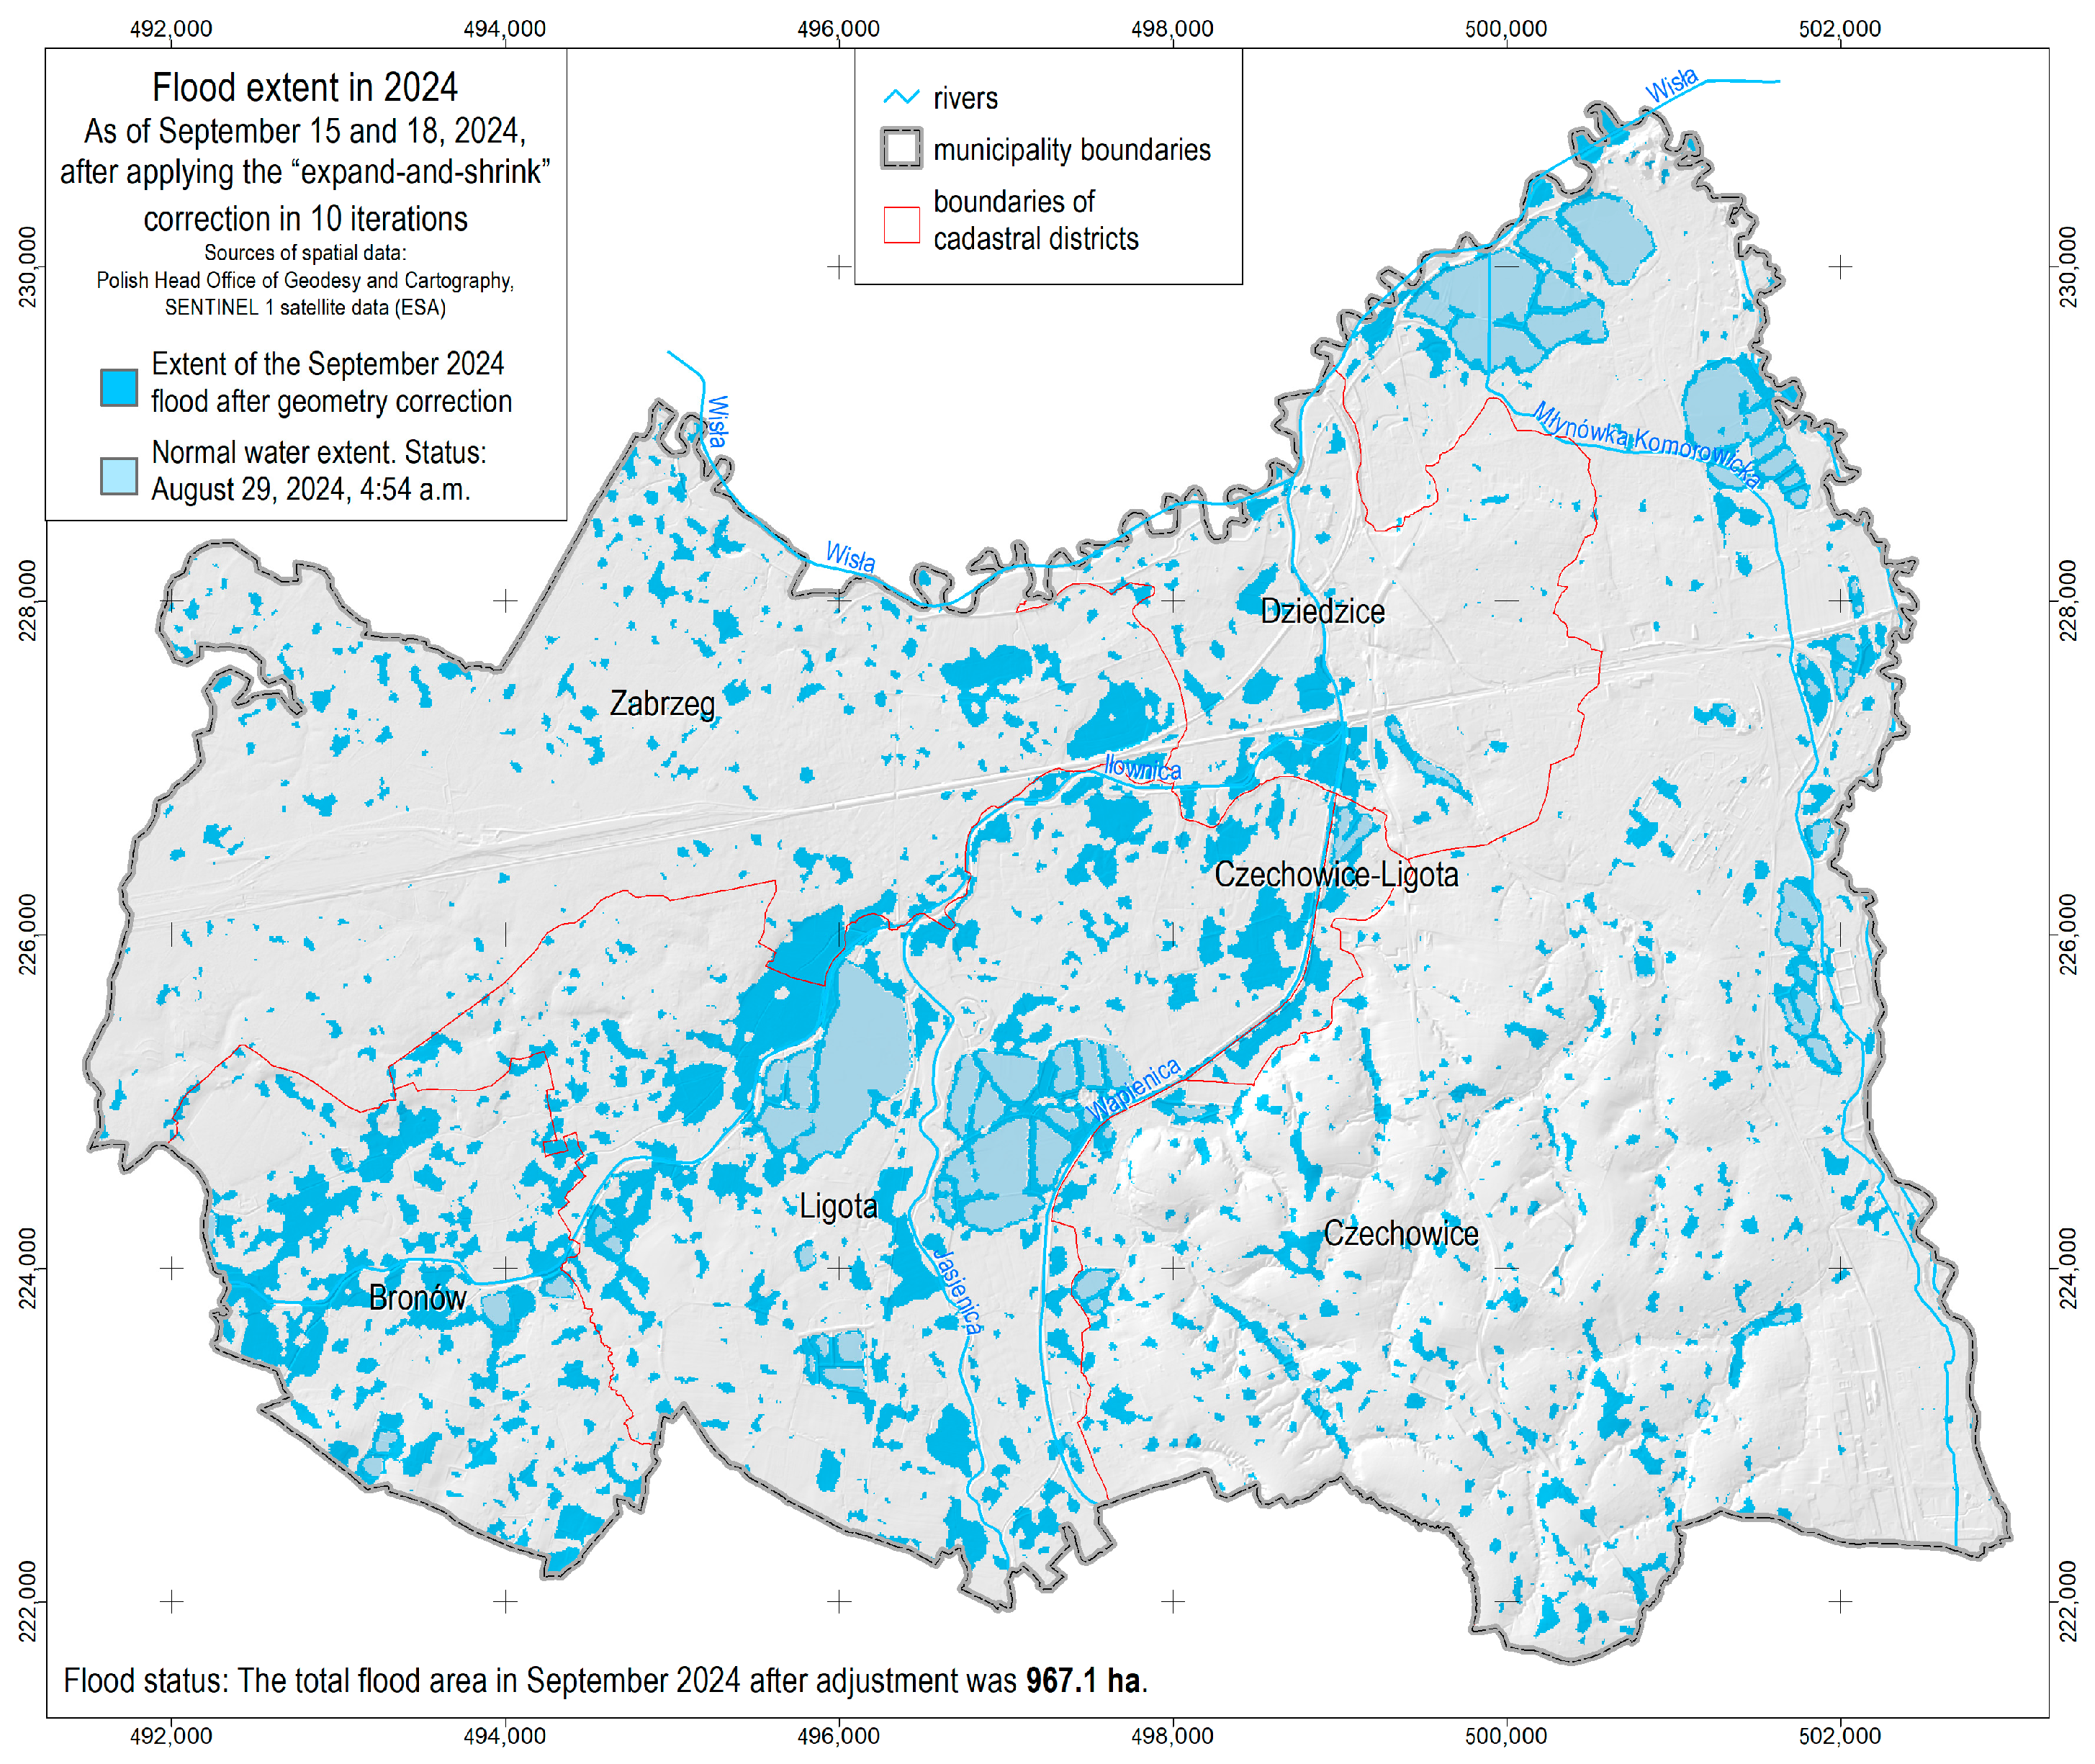
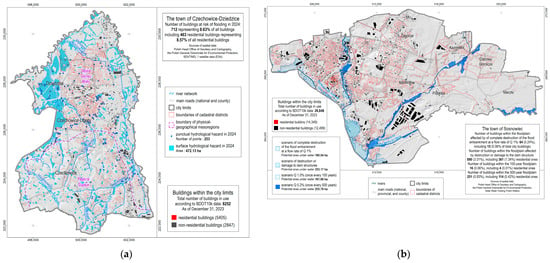
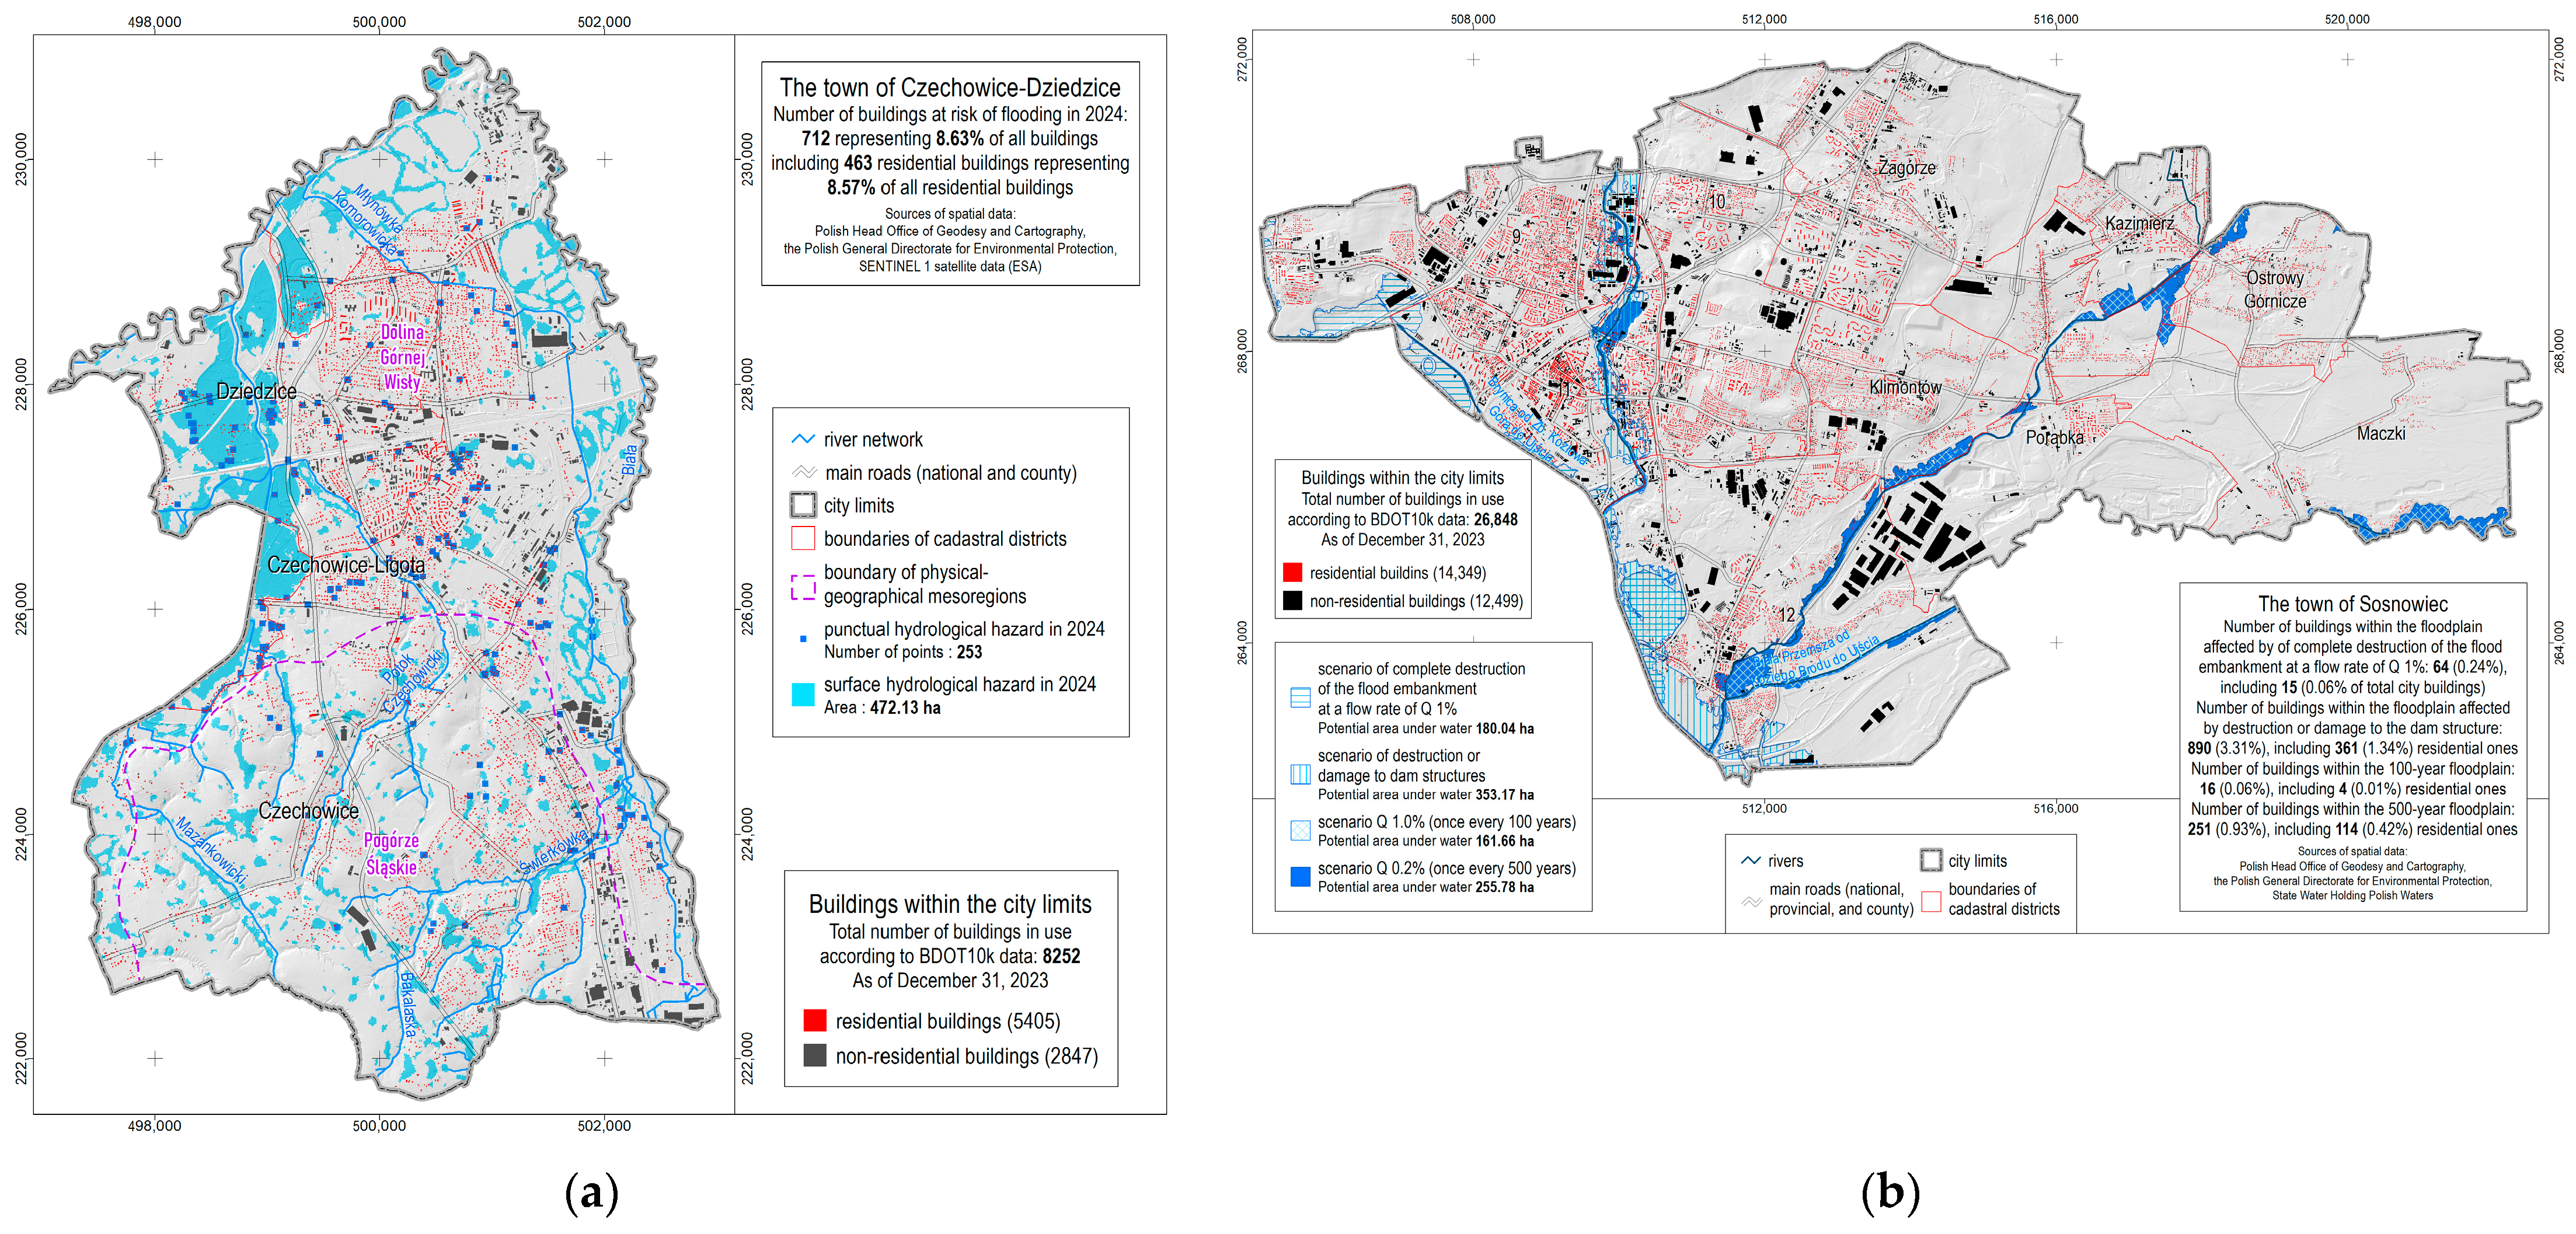
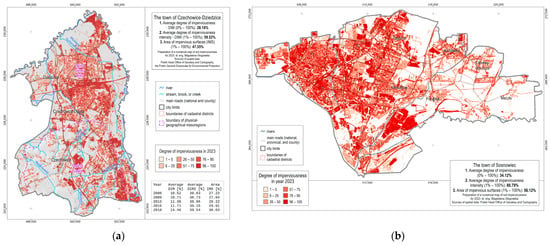
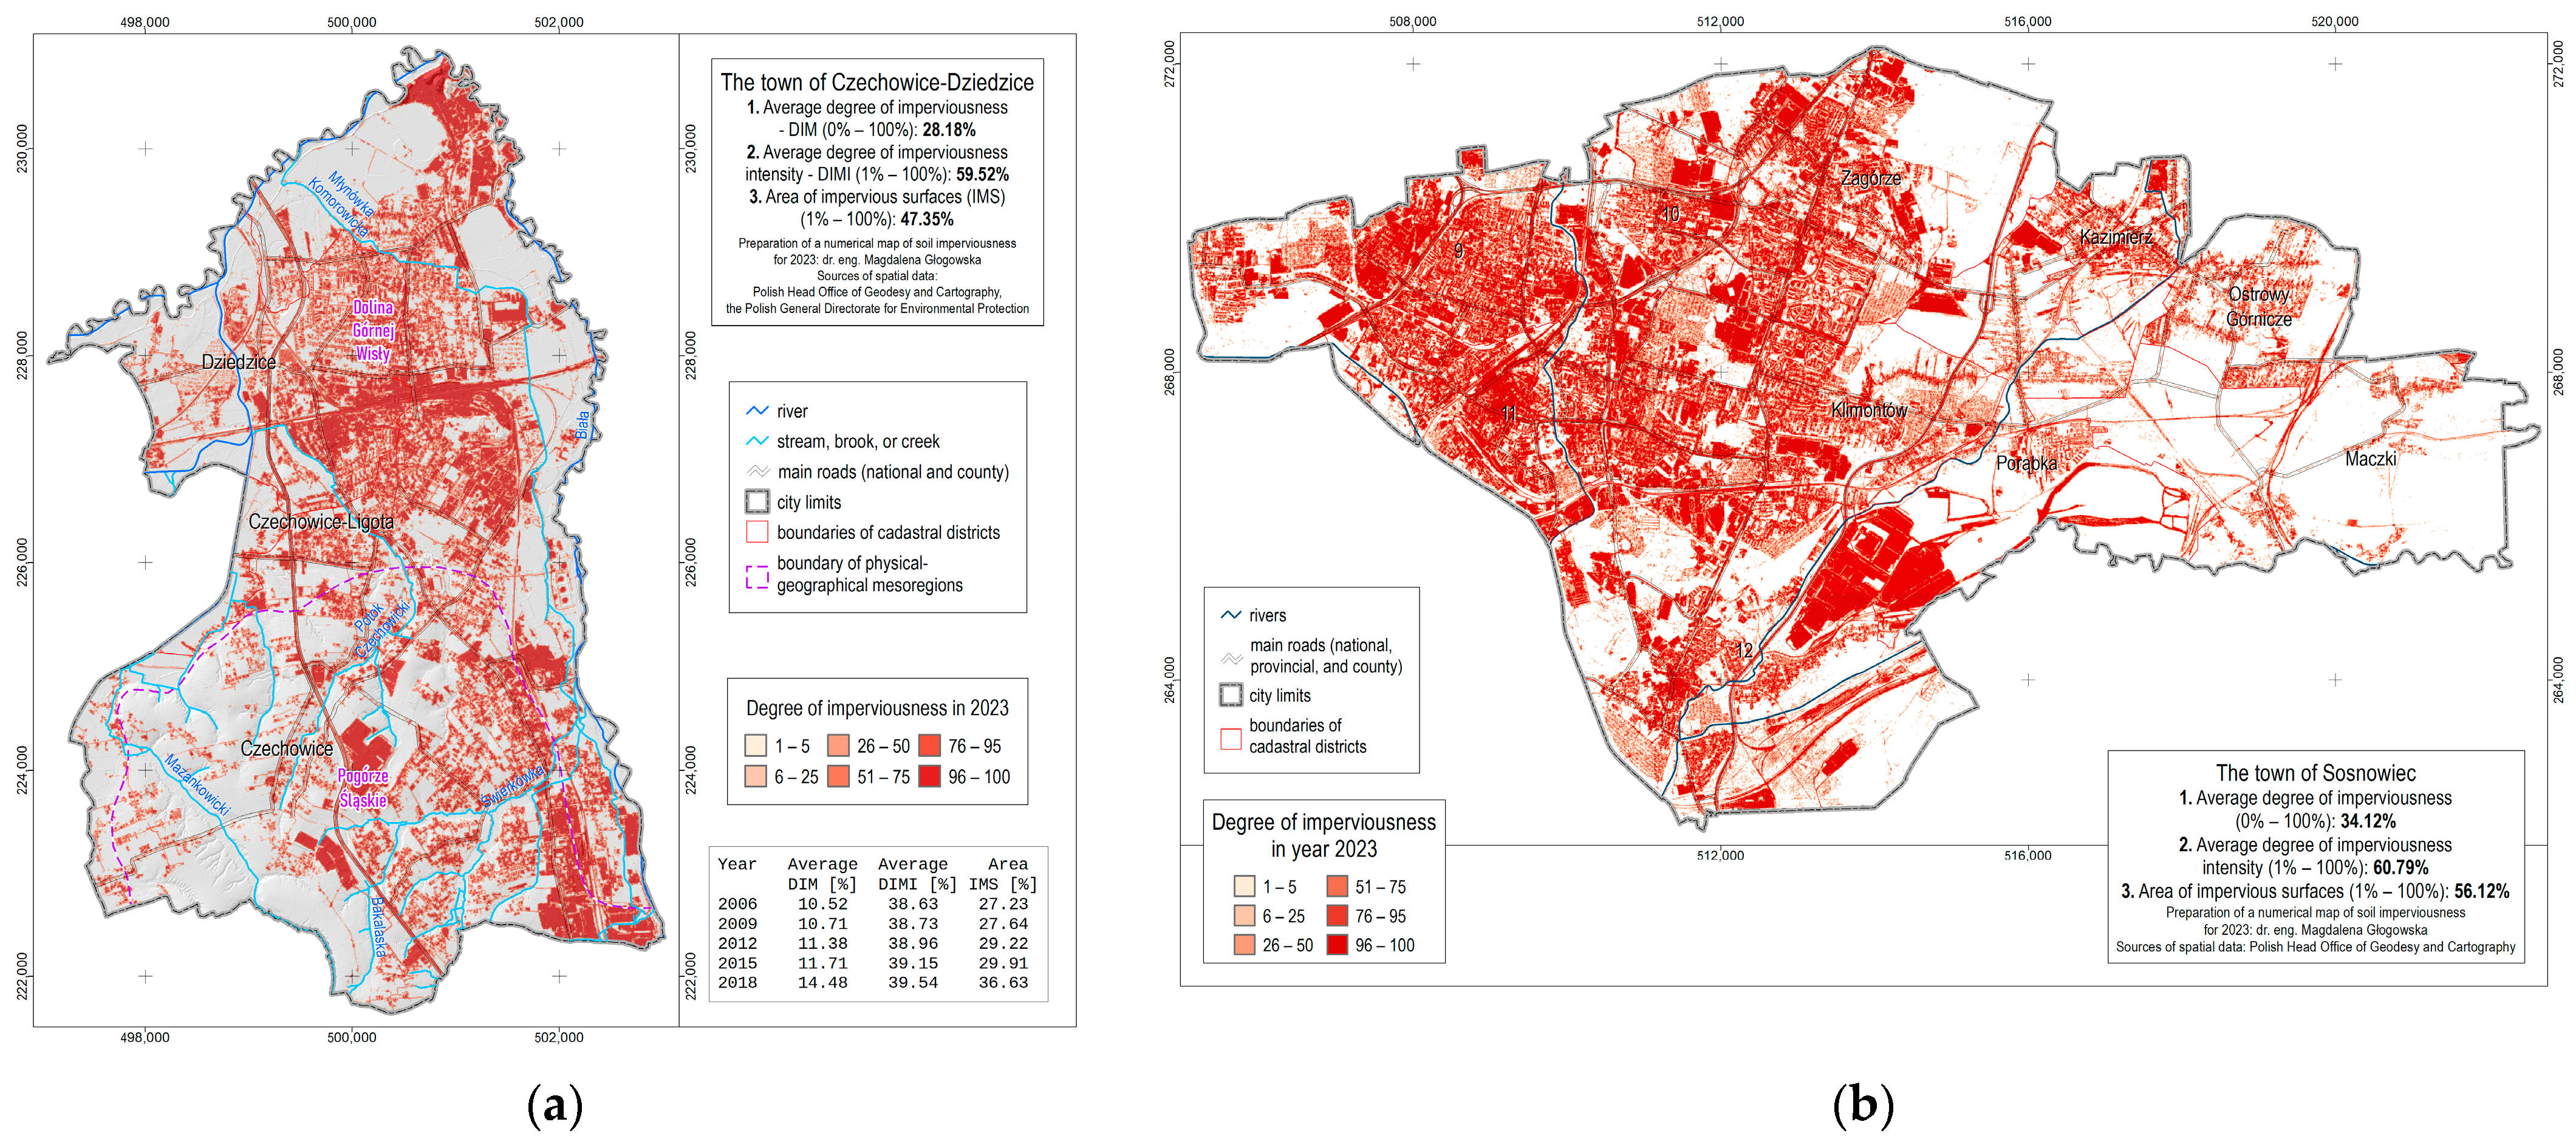
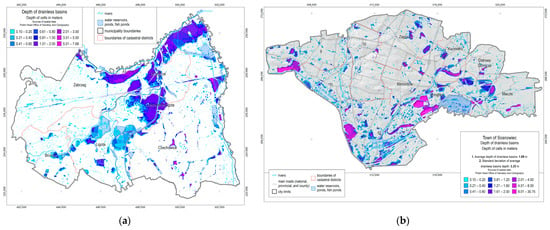
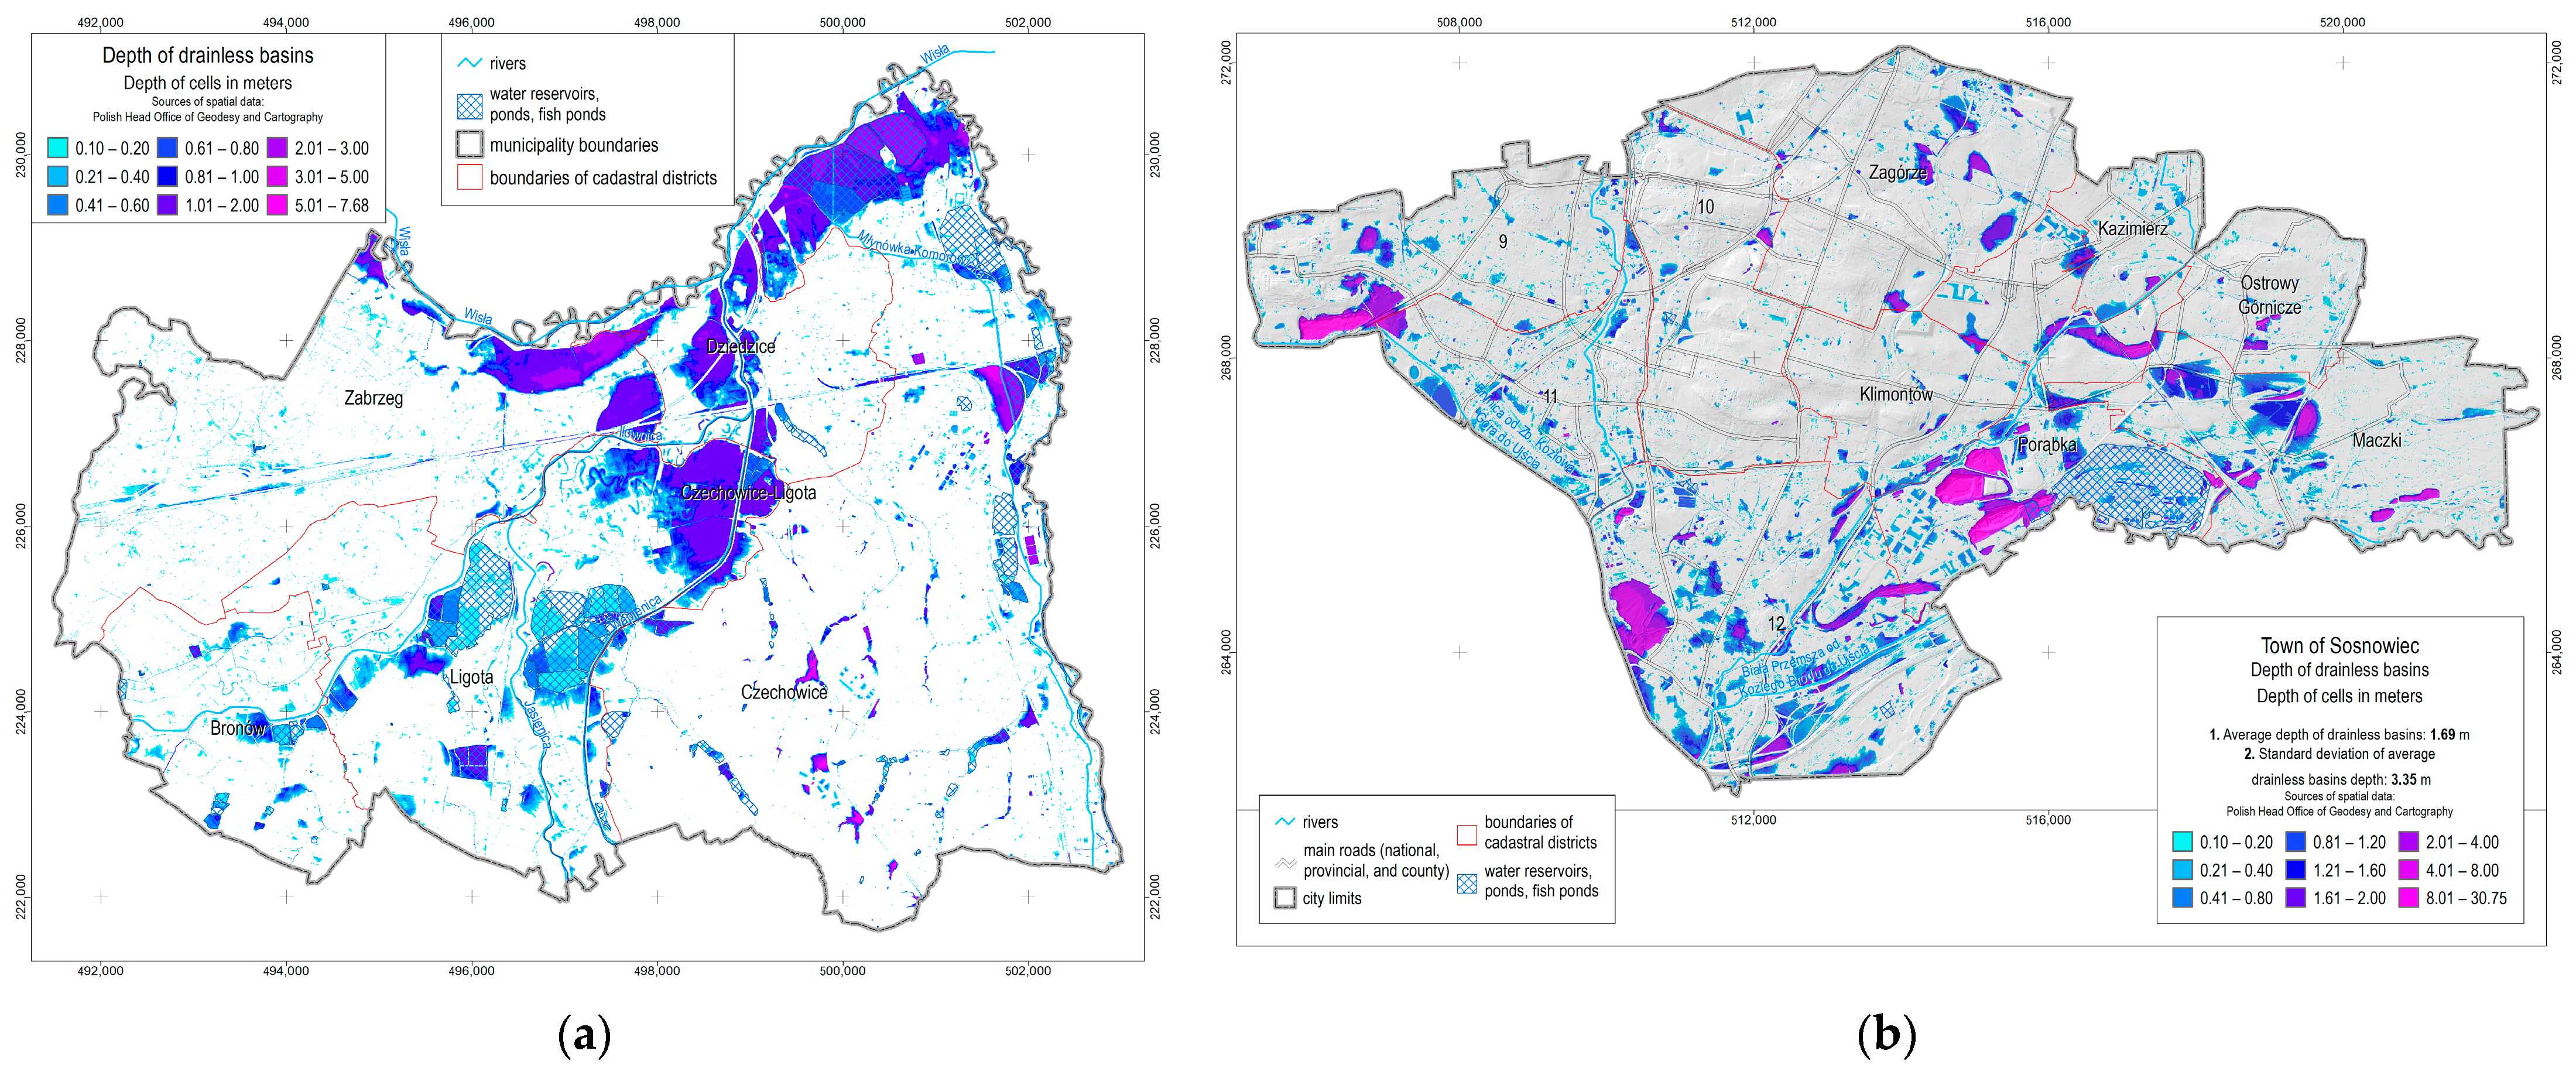
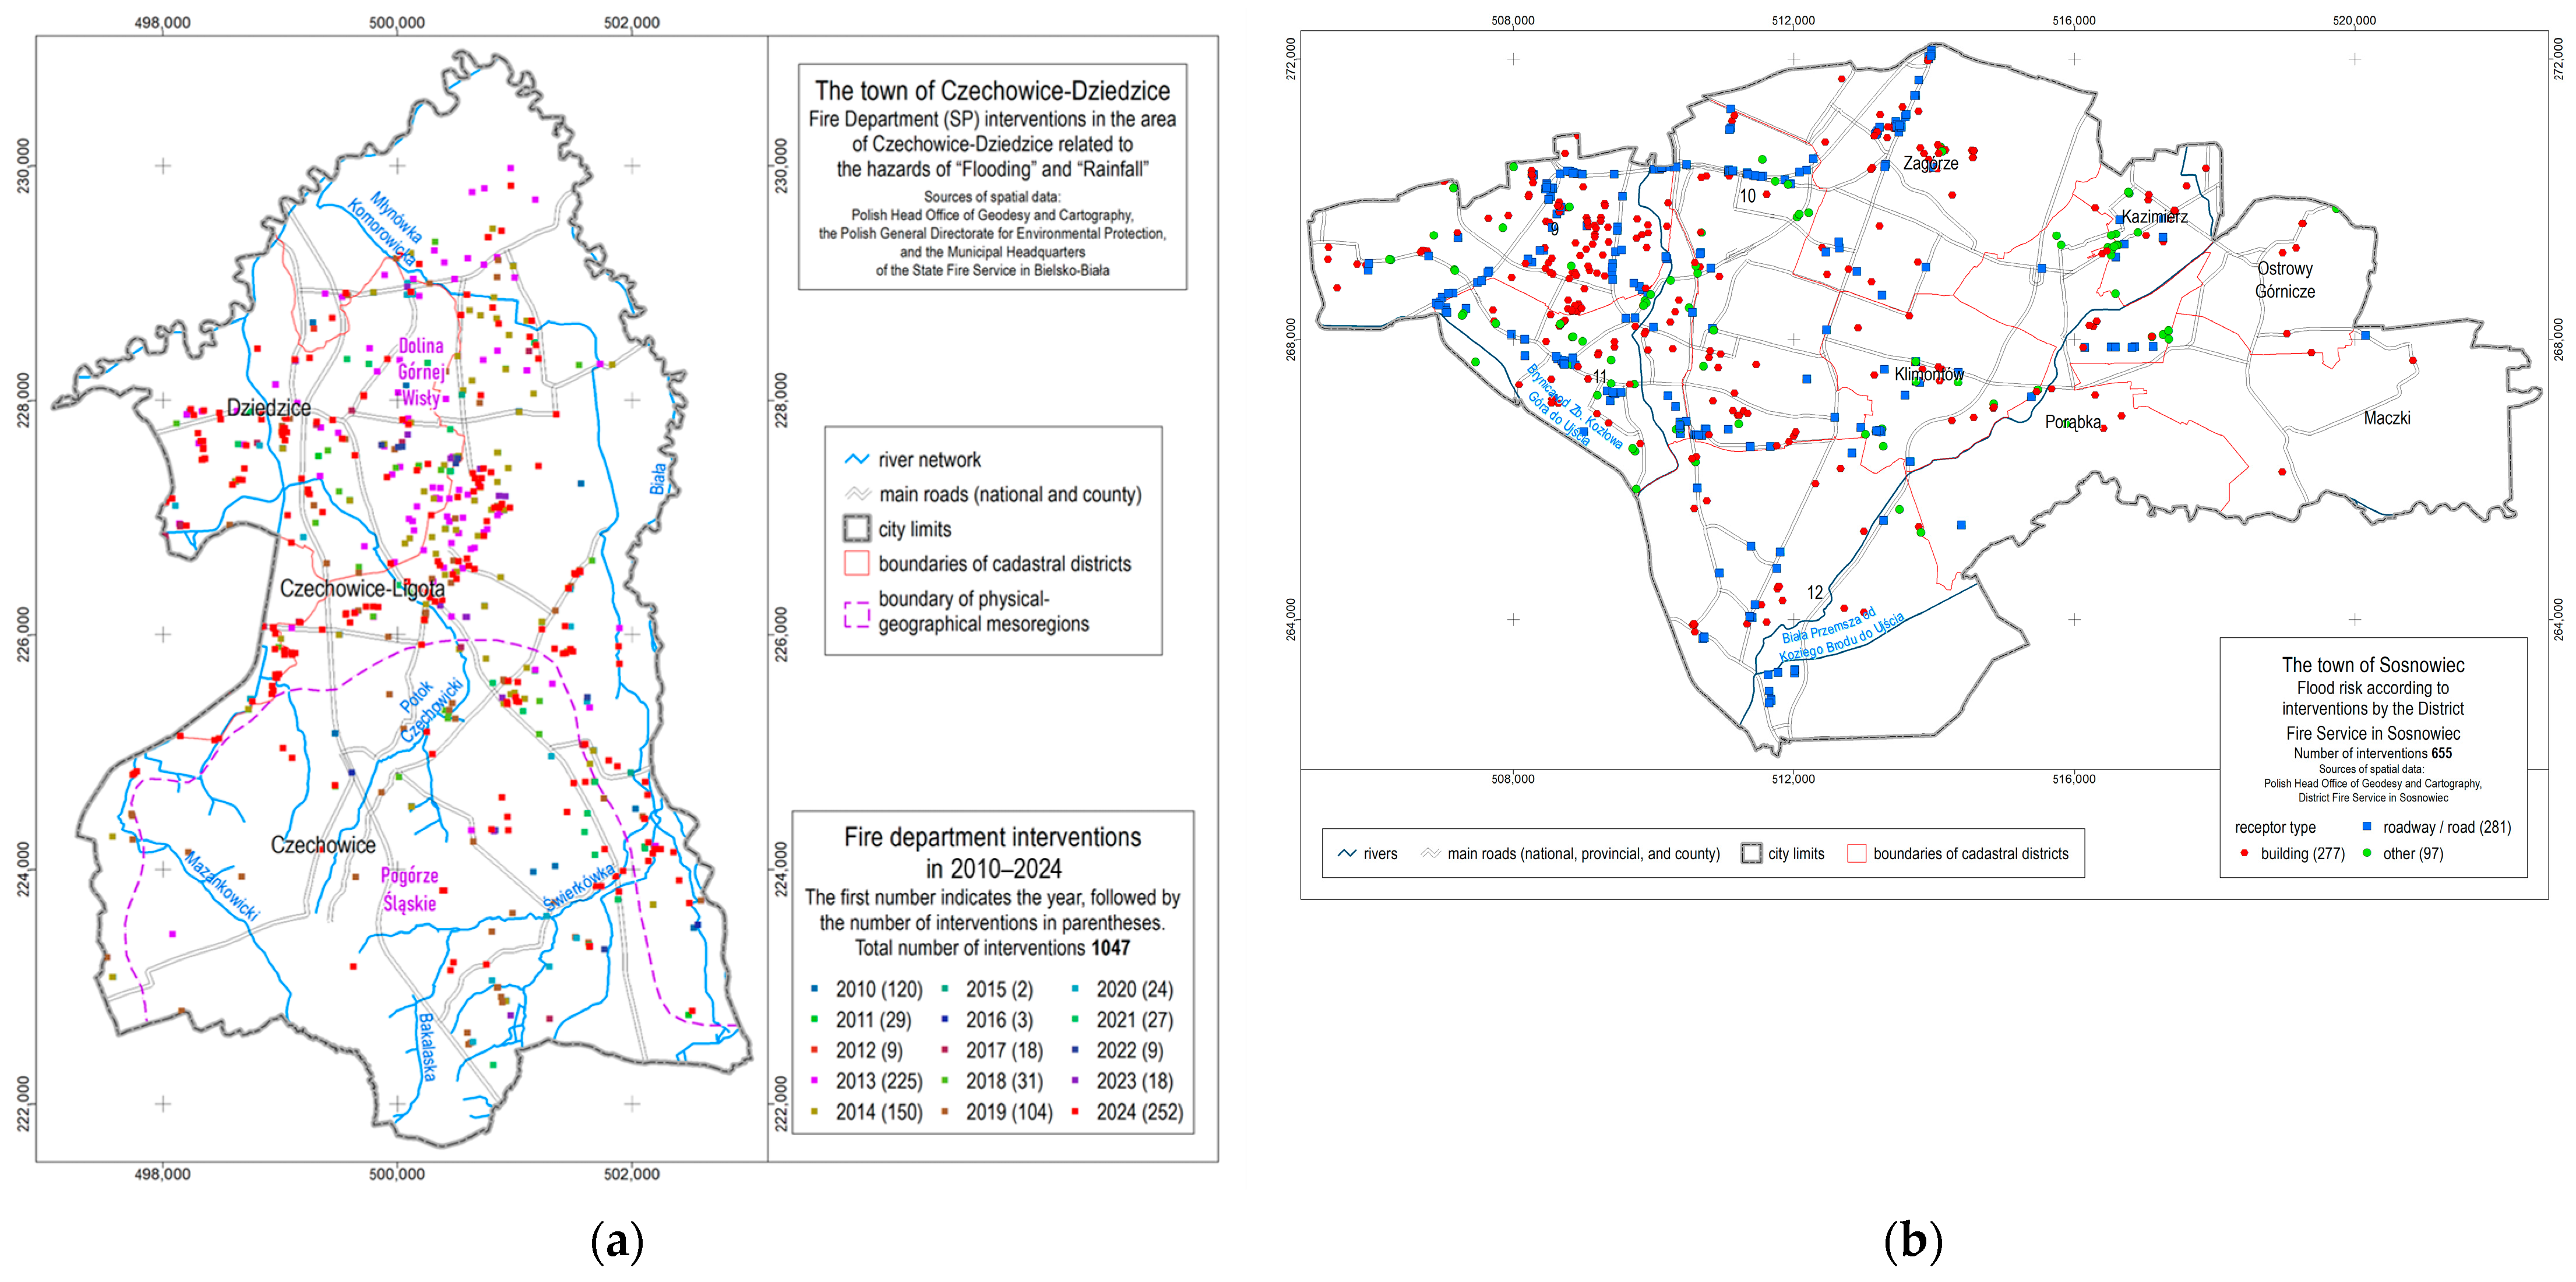
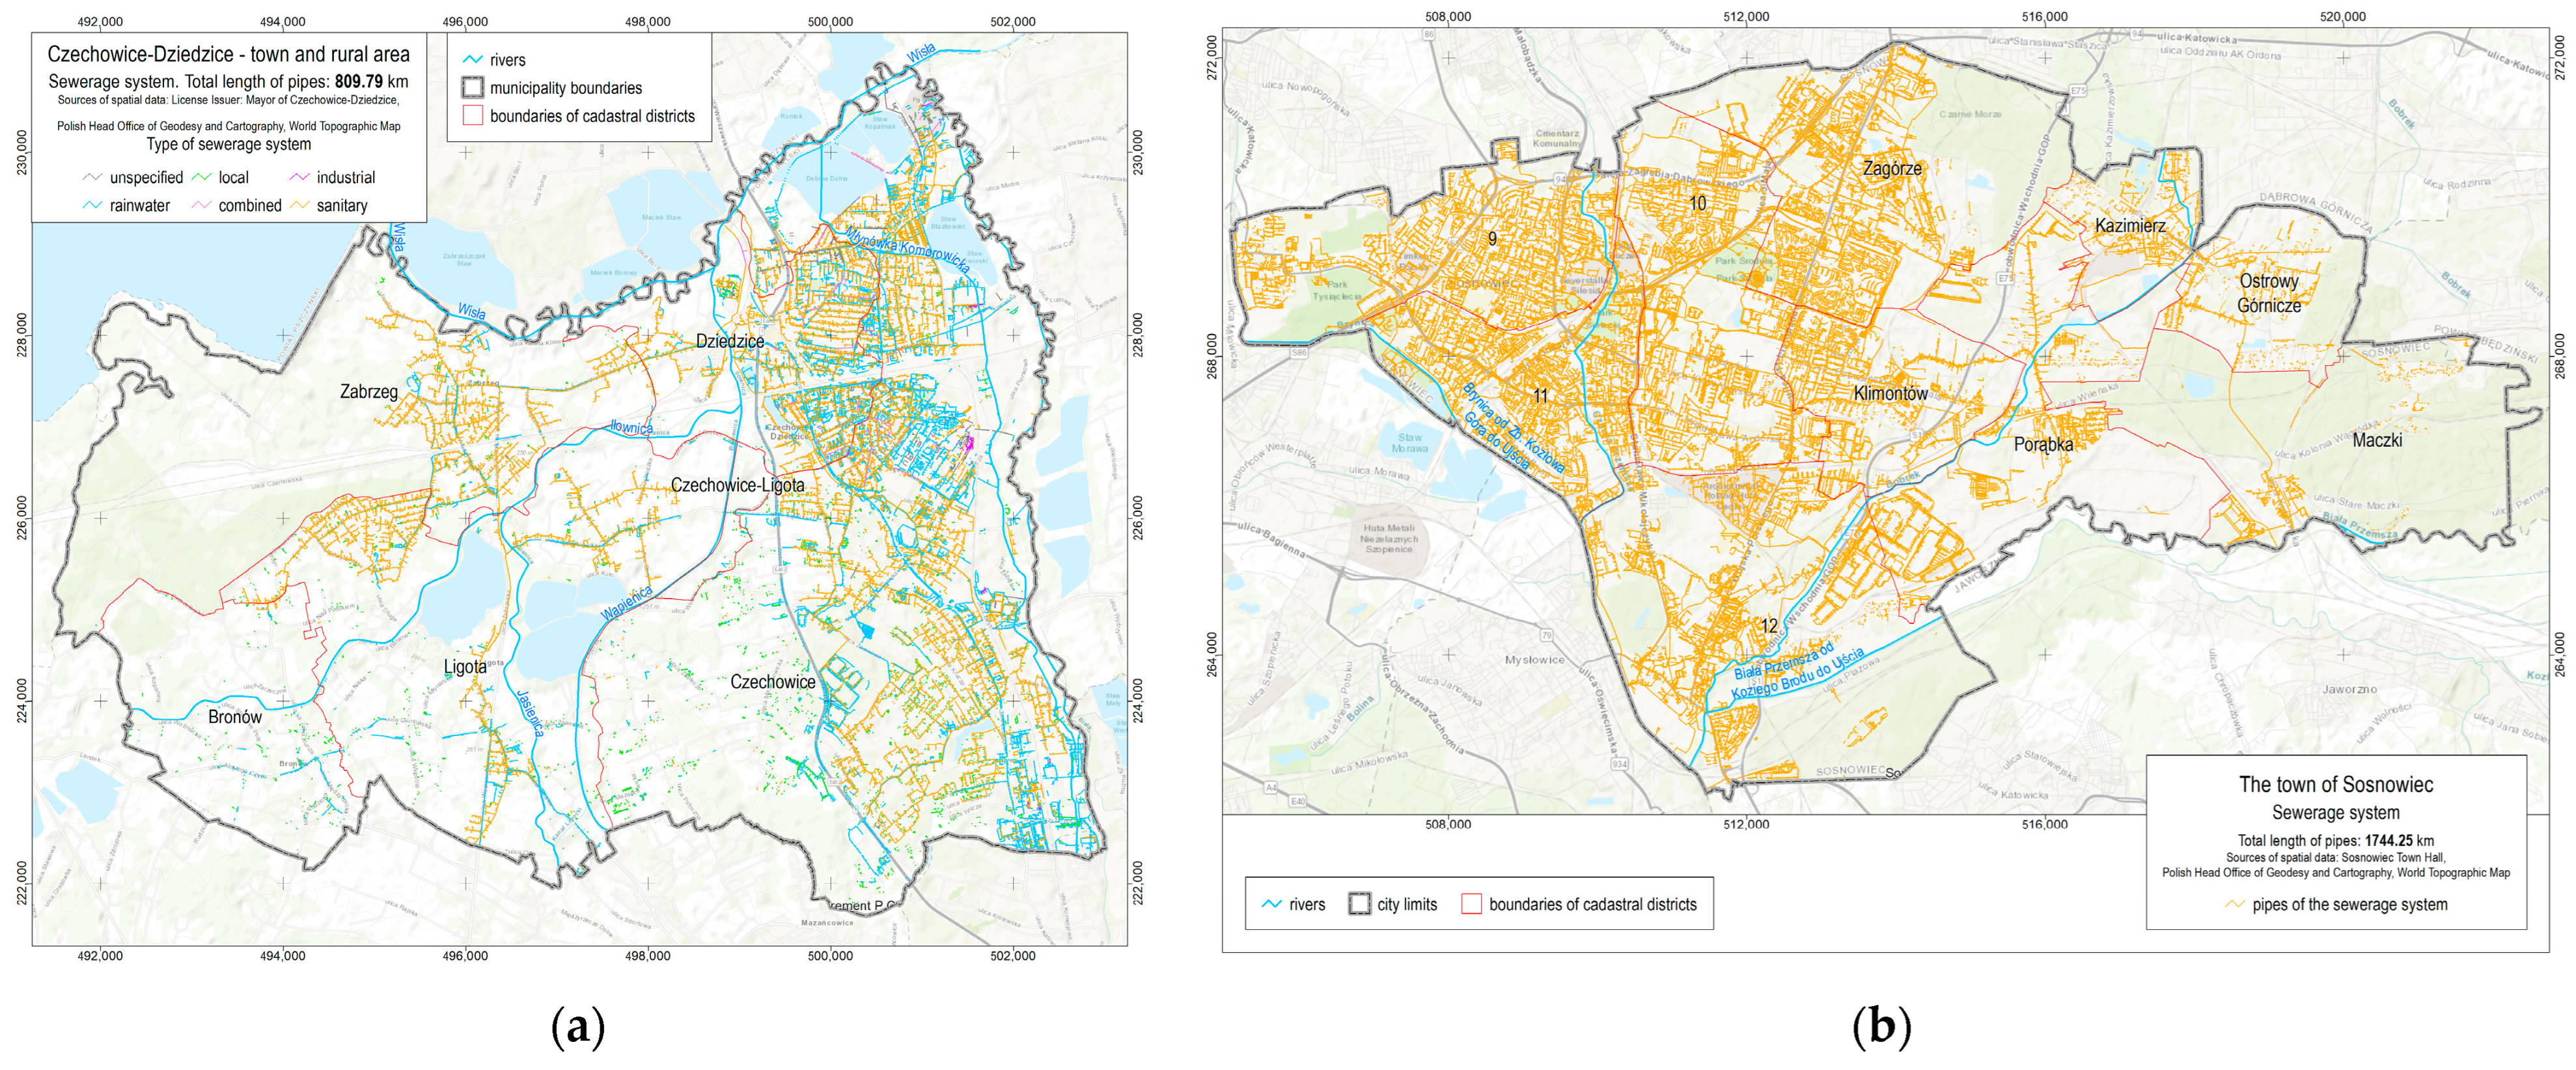

Disclaimer/Publisher’s Note: The statements, opinions and data contained in all publications are solely those of the individual author(s) and contributor(s) and not of MDPI and/or the editor(s). MDPI and/or the editor(s) disclaim responsibility for any injury to people or property resulting from any ideas, methods, instructions or products referred to in the content. |
© 2026 by the authors. Licensee MDPI, Basel, Switzerland. This article is an open access article distributed under the terms and conditions of the Creative Commons Attribution (CC BY) license.