


Abstract
The geoelectrochemical extraction method is effective for locating deep concealed deposits, but research on the particle size distribution of its anomaly-causing substances remains limited. To address this, 20 sampling points were established along the No. 20 exploration profile at the Tongjiangling Copper Deposit in Jiangxi Province. Using consistent technical conditions, geoelectrochemical measurements were compared across filter membranes/papers with pore sizes of 0.22 μm, 0.45 μm, 1 μm, 3 μm, and qualitative medium-speed filter paper (approx. 20–30 μm). The results are as follows: (1) The 20–30 μm filter paper effectively detected anomalies corresponding to both shallow and deep concealed ore bodies, whereas smaller pore sizes only revealed shallow ore bodies. (2) Element content and anomaly contrast were significantly higher with the 20–30 μm filter paper compared to smaller pore sizes. (3) Geoelectrochemical anomalies originate from various surface soil substances, which may exist independently or be adsorbed onto particles of different sizes. The applied electric field mobilizes these charged particles, enabling their adsorption onto the collector and acquisition of deep mineralization anomalies. (4) For similar landscapes and deposit types, using filter paper with a pore size of approximately 20–30 μm is recommended to effectively capture deep ore body anomalies while reducing analytical complexity.
1. Introduction
In the monograph Geoelectrochemical Exploration Methods, Ryss Yu. S. systematically summarized and defined the geoelectrochemical method as a collective term for a series of techniques related to various electrochemical phenomena under an applied electric field, involving ionic migration and distribution, as well as the induced electrochemical characteristics of minerals [1,2]. The underlying theory posited that the applied electric field serves as the driving force for metal ions migrating upward from depth. The electric current directly acts upon the deep ore body, causing electrochemical dissolution. The resulting ions are then transported by the applied field, ultimately allowing for the extraction of anomaly information. To achieve greater detection depths, the corresponding equipment involved a vehicle-mounted high-power supply, coupled with a current modulator, element collectors (liquid or solid), and survey lines [3,4]. After its introduction to China in the late 1970s, extensive research and practical application by numerous scholars led to the proposal of a revised understanding by the end of the 20th century, which differed from the earlier Soviet perspective. Studies indicated that the anomalous substances extracted by this method are not directly derived from the deep ore body as initially proposed by Soviet scholars. Instead, they primarily originate from electro-active mobile forms adsorbed onto particles such as clay and organic matter within the soil [5]. These particles, which carry the anomalous information, are electro-active particulates that were progressively transported from depth to the surface soil layer over geological time through a relay of various geological agents, where they were subsequently deposited and stored [6,7,8,9]. Guided by this shift in theoretical understanding, the corresponding technical equipment has evolved from the old-fashioned, inefficient, and “bulky” systems to the now commonly used “Independent Power Supply Dipole Geoelectrochemical Technology Device [10,11,12].” This modern apparatus is characterized by its compact size, independent single-point power supply (using low-voltage dry batteries), high operability, and improved field efficiency.
With the continuous advancement in geoelectrochemical research and the ongoing improvement of equipment, its application in mineral exploration practice has demonstrated significant effectiveness [13,14,15,16,17]. However, fundamental research remains scarce regarding the types, particle size distribution, and relative contribution to geoelectrochemical anomalies of the electroactive mobile particles in the soil overburden that carry information about deep ore bodies under different landscape settings, ore types, and deposit types. This knowledge gap has, to some extent, hindered the further development of the methodology. To investigate the particle size distribution characteristics of electrochemically mobile materials responsible for geoelectrochemical anomalies, this study was conducted at the Tongjiangling porphyry-skarn copper deposit, located in a region characterized by acidic soil overburden in southern China. Based on standard soil particle size classification, five types of filter membranes/papers were selected for comparative isolation: pore sizes of 0.22 μm and 0.45 μm (corresponding to the clay fraction), 1 μm and 3 μm (corresponding to the silt fraction and the clay–silt transition range), and 20–30 μm (corresponding to the silt fraction). This approach aims to elucidate the influence of different particle size fractions on the manifestation of geoelectrochemical anomalies and to delineate the particle size range of anomalous materials in the soil that can be mobilized by an applied electric field. The findings are intended to provide a theoretical basis for the rational selection of filter membrane pore sizes in geoelectrochemical surveys conducted under similar geological and landscape conditions.
2. Geological Background
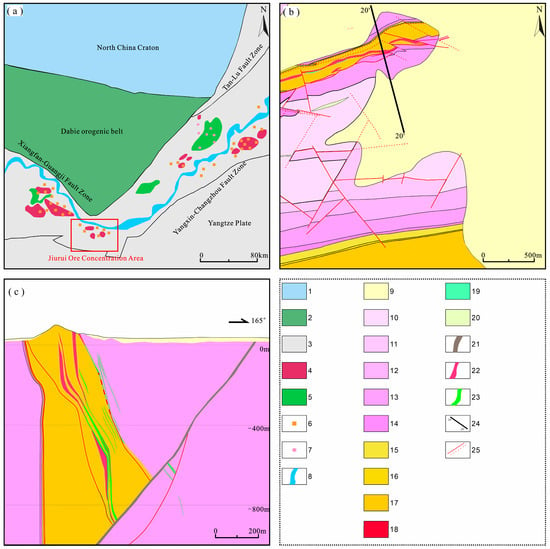
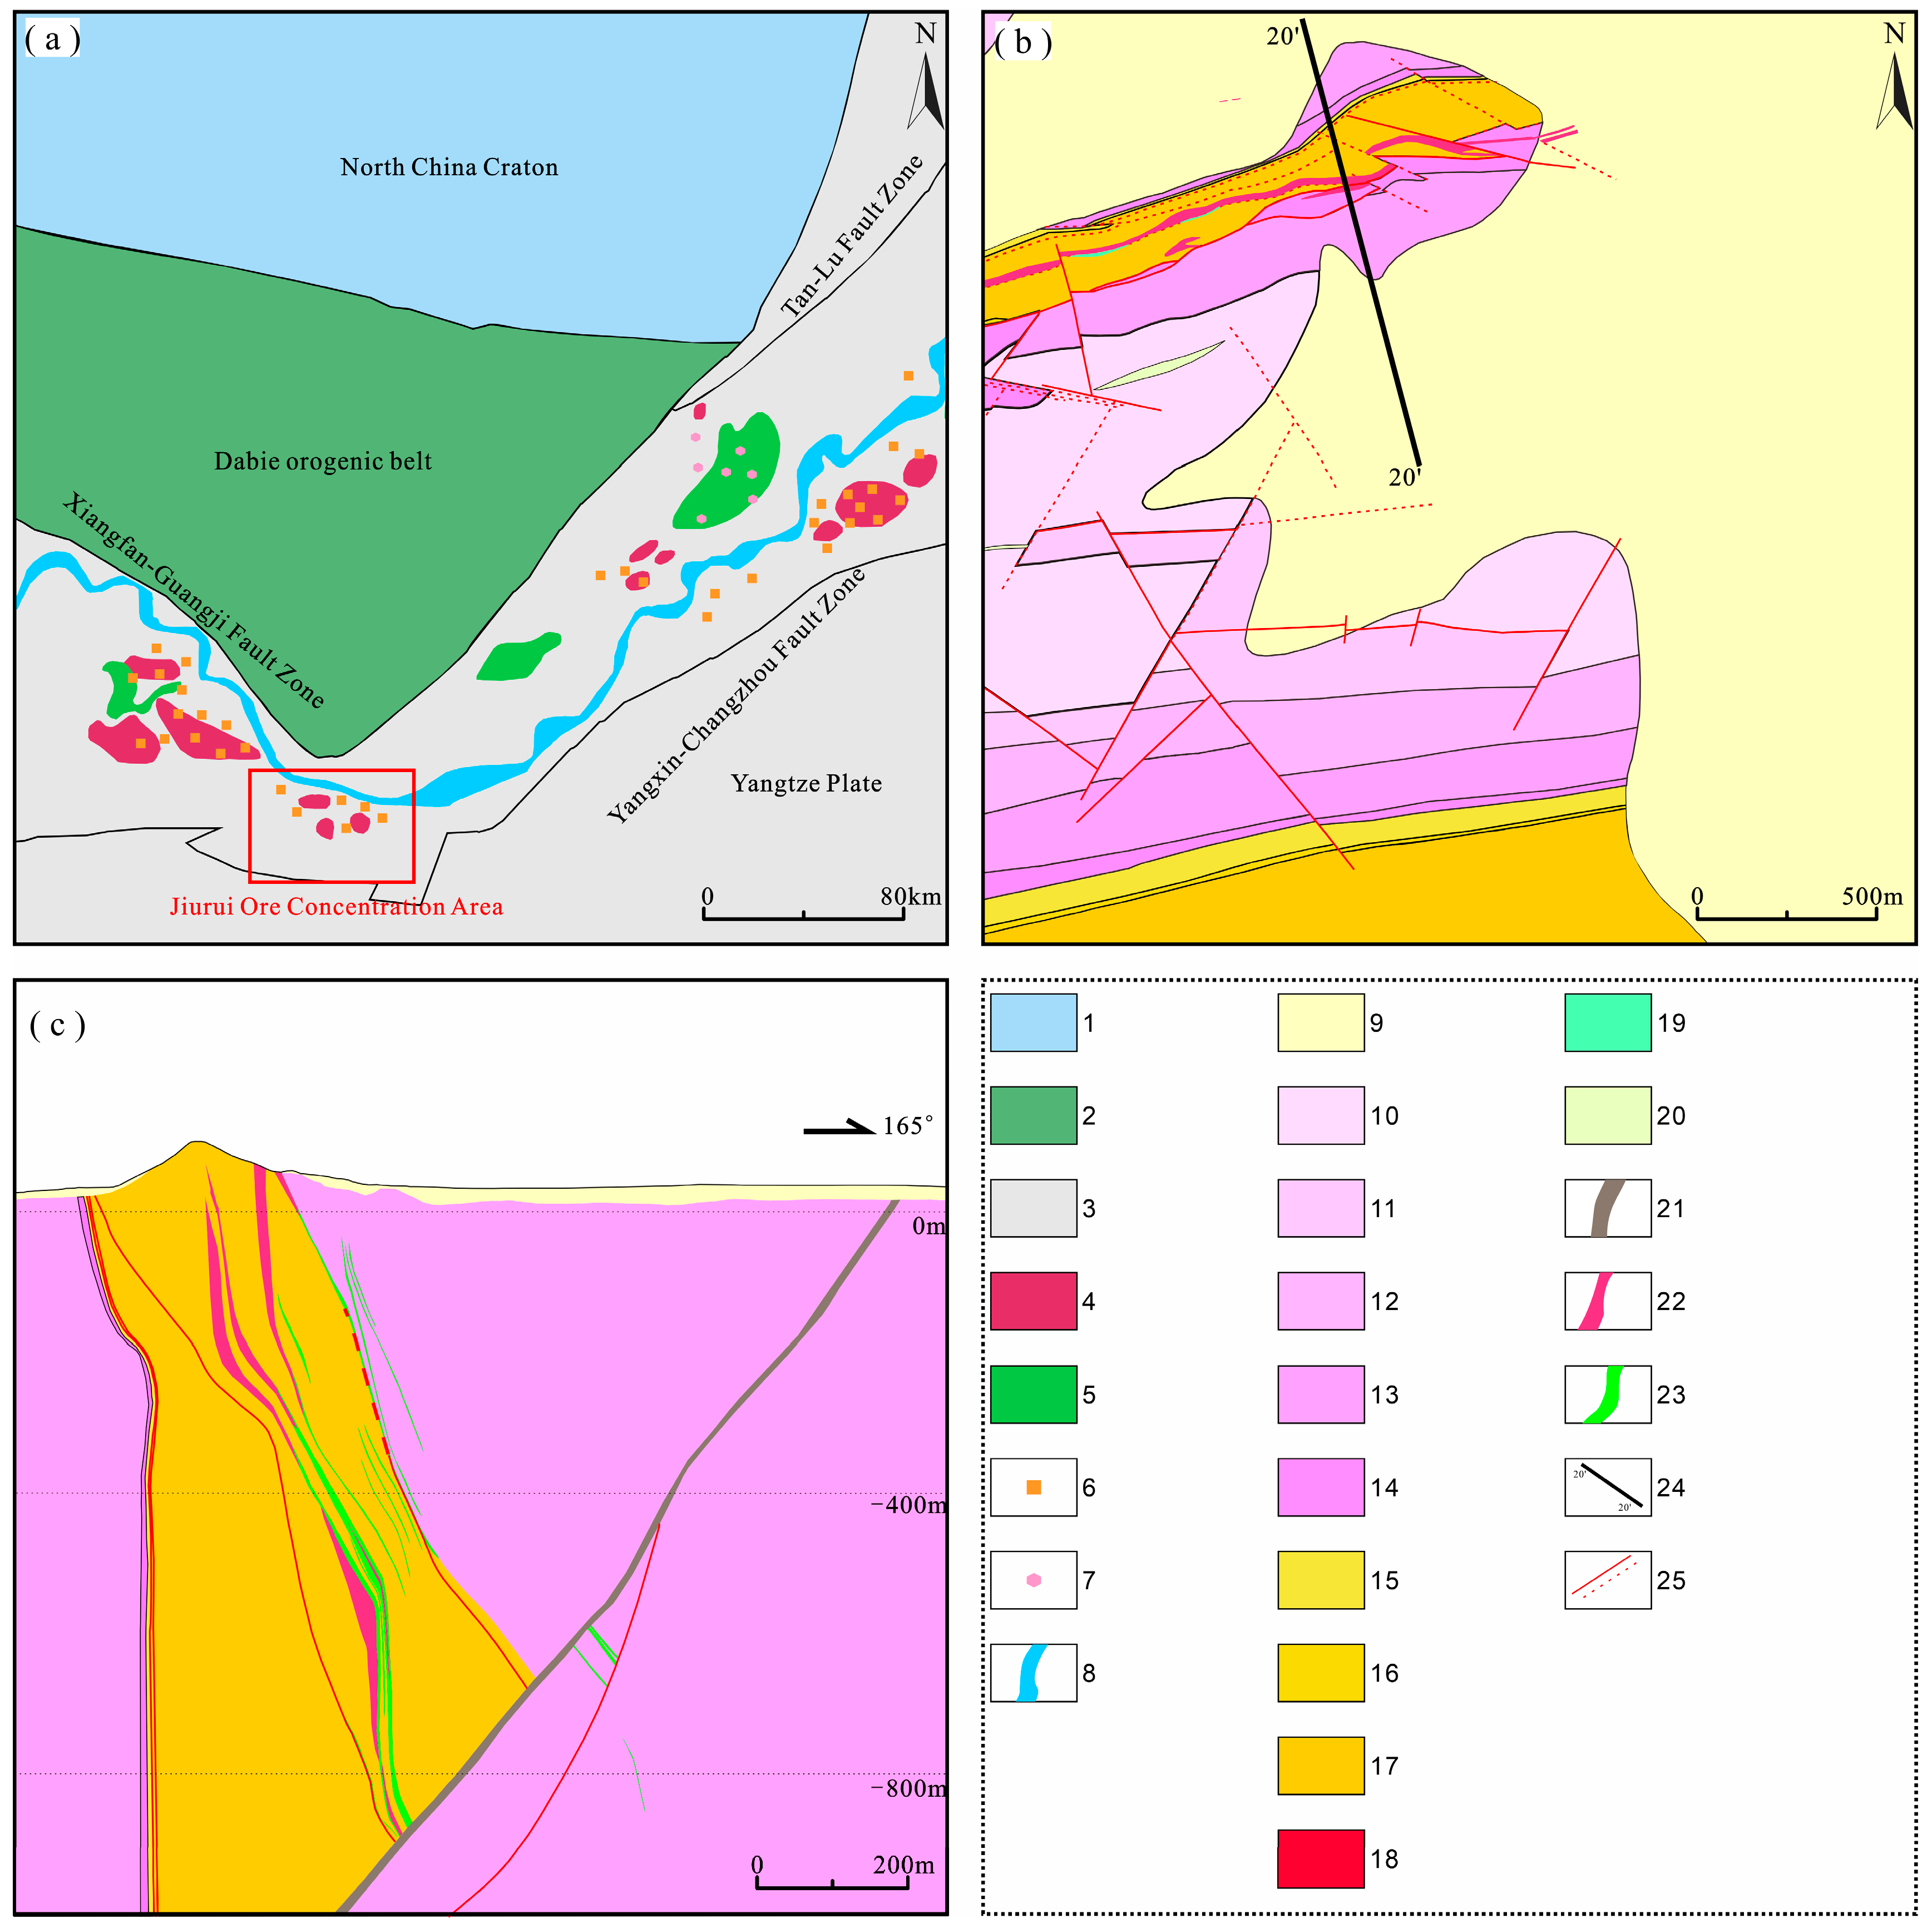
The study area is situated within the Middle-Lower Yangtze River Metallogenic Belt. Tectonically, it lies on the northern margin of the Yangtze Plate, forming a Yanshanian intracontinental fault-depression zone sandwiched between the Dabie Mountain uplift and the Jiangnan orogenic belt. This belt is renowned for its intense Mesozoic tectonic-magmatic activity and abundant copper, gold, and polymetallic mineral resources [18,19] (Figure 1a). The Jiurui ore concentration area, a significant component of this metallogenic belt, is located at the structural transition zone on the western margin of the Lower Yangtze fault-depression belt. Its deep crustal structure exhibits notable layering and block segmentation, accompanied by extensive interlayer sliding and detachment tectonics. These processes have resulted in a complex regional structural framework characterized by north–south zoning and east–west block partitioning. The stratigraphy in this region is well-developed and relatively complete, with exposures ranging from the Ordovician of the Paleozoic to the Triassic of the Mesozoic. The lithology is dominated by marine sedimentary carbonate rocks and clastic rocks. Regional NW-trending basement faults serve as the dominant structures controlling both rock distribution and mineralization. Together with NE- and NEE-trending faults, they constitute a rhombic fault-block system that governs the distribution of shallow intrusive bodies and ore deposits [20,21]. The area experienced intense magmatic activity, yielding a diversity of intrusive rock types, primarily including granodiorite porphyry, quartz diorite porphyrite, and diorite. The formation of porphyry copper-gold deposits is closely associated with the intrusion of granodiorite porphyry bodies.
Figure 1.
(a) Regional geological map; (b) Detailed geological map of the Tongjiangling mining area; (c) Geological cross-section (Profile 20) of the Tongjiangling mining area 1—North China Craton; 2—Dabie Orogenic Belt; 3—Yangtze Plate; 4—magmatic rocks associated with Late Mesozoic Cu-Au-Mo deposits; 5—volcanic and subvolcanic rocks associated with Cretaceous magnetite deposits; 6—porphyry-, skarn-, and massive sulfide-type Cu-Au-Mo(Fe) deposits; 7—magnetite–apatite deposits; 8—Yangtze River; 9—Quaternary System; 10—Upper Member of Triassic Zhouchong Formation: grayi black, medium–thick-bedded limestone with slight dark-red hues, intercalated with thin-bedded limestone; 11—Middle Member of Triassic Zhouchongcun Formation: grayish black to dark red, medium–thick-bedded limestone; 12—Lower Member of Triassic Zhouchongcun Formation: dolomitic limestone; 13—Triassic Qinglong Formation: medium–thin-bedded limestone and thick-bedded limestone; 14—Triassic Yinkeng Formation: yellowish green shale; 15—Permian Changxing Formation: chert-nodule-bearing limestone and siliceous rock; 16—Permian Longtan Formation: variegated shale intercalated with skarn; 17—Middle Permian Maokou Formation: chert-nodule-bearing limestone; 18—granodiorite porphyry; 19—skarn; 20—silicified zone; 21—mylonite zone; 22—granitic zone; 23—copper orebody zone; 24—exploration line; 25—fault: mapped (solid line)/inferred (dashed line).
The Tongjiangling mining area is situated in the northern part of the Jiurui ore concentration area. It is specifically located within the core of the Longquangusi-Niutoushan anticline, a subsidiary anticline of a larger NEE-trending synclinal structure. The exposed strata in the area primarily range from the Permian to the Lower Triassic. From oldest to youngest, they consist of: the Middle Permian Maokou Formation chert-bearing limestone (the main host rock for mineralization); the Upper Permian Longtan Formation variegated shale; the Upper Permian Changxing Formation chert-bearing limestone and siliceous rocks; the Lower Triassic Yinkeng Formation yellowish green shale; the Lower Triassic Qinglong Formation medium-thin to thick-bedded limestone; and the Lower Triassic Zhouchongcun Formation dolomitic limestone to dark-red limestone sequence. The strata generally strike NE (Figure 1b). Fault structures are well developed in the mining area and can be categorized into three sets: NE-trending, NW-trending, and near NS-trending. Among these, the NE-trending faults serve as the principal structures controlling magmatic intrusion and the emplacement of mineralization [22,23]. The parent ore-forming rock, granodiorite porphyry, intruded into the Maokou Formation limestone as dikes along the anticlinal core and the NE-trending fault zones. Skarn was subsequently formed near this contact zone through metasomatic processes. The Tongjiangling deposit is a typical porphyry-skarn composite copper-tungsten deposit. The ore bodies generally exhibit an NEE trend and occur as stratiform-like and lenticular bodies within both the internal and external contact zones between the granodiorite porphyry and the Maokou Formation limestone. The ore mineral assemblage is dominated by chalcopyrite and scheelite. Gangue minerals include typical skarn minerals (such as garnet, diopside, and tremolite) as well as quartz and chlorite. The main deep ore bodies are distributed within the contact zones and interiors of the dikes. They occur at depths exceeding 900 m below the surface, extend over a strike length of more than a thousand meters, and range in thickness from several meters to tens of meters. Mineralization within the dikes is characterized by sparse dissemination, while massive sulfides are developed in the skarn of the contact zones, with notable enrichment particularly in carbonate rock xenoliths [24,25,26] (Figure 1c). Previous studies have preliminarily delineated the geological framework and mineralization zoning characteristics of this deposit.
The study area is located within a typical, highly oxidized landscape in southern China. The surface is primarily covered by residual-slope deposit laterite, which has not been subjected to large-scale anthropogenic disturbance. These environmental conditions are suitable for conducting geoelectrochemical method research. Previous geoelectrochemical prospecting work conducted in this area has yielded favorable results. The obtained geoelectrochemical anomalies show clear correspondence with both shallow and deep concealed ore bodies along the profile, thereby providing a solid foundation for the present study investigating the particle size distribution of geoelectrochemical anomaly materials.
3. Sample Collection and Analytical Methods
3.1. Sample Collection
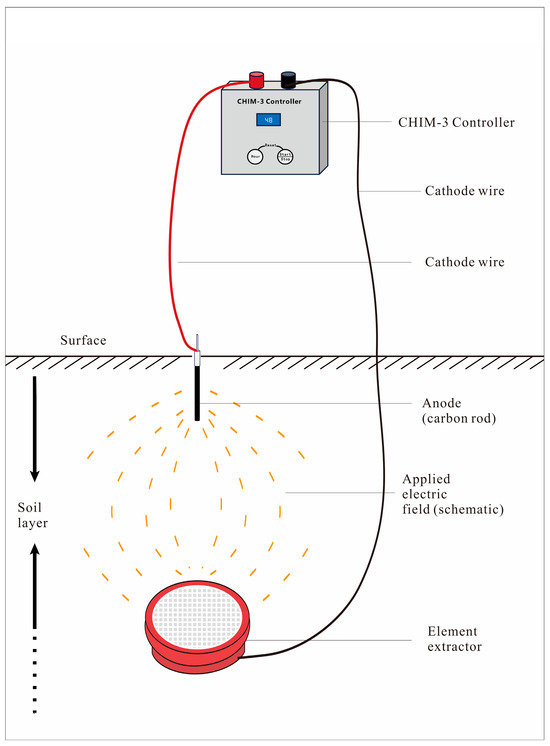
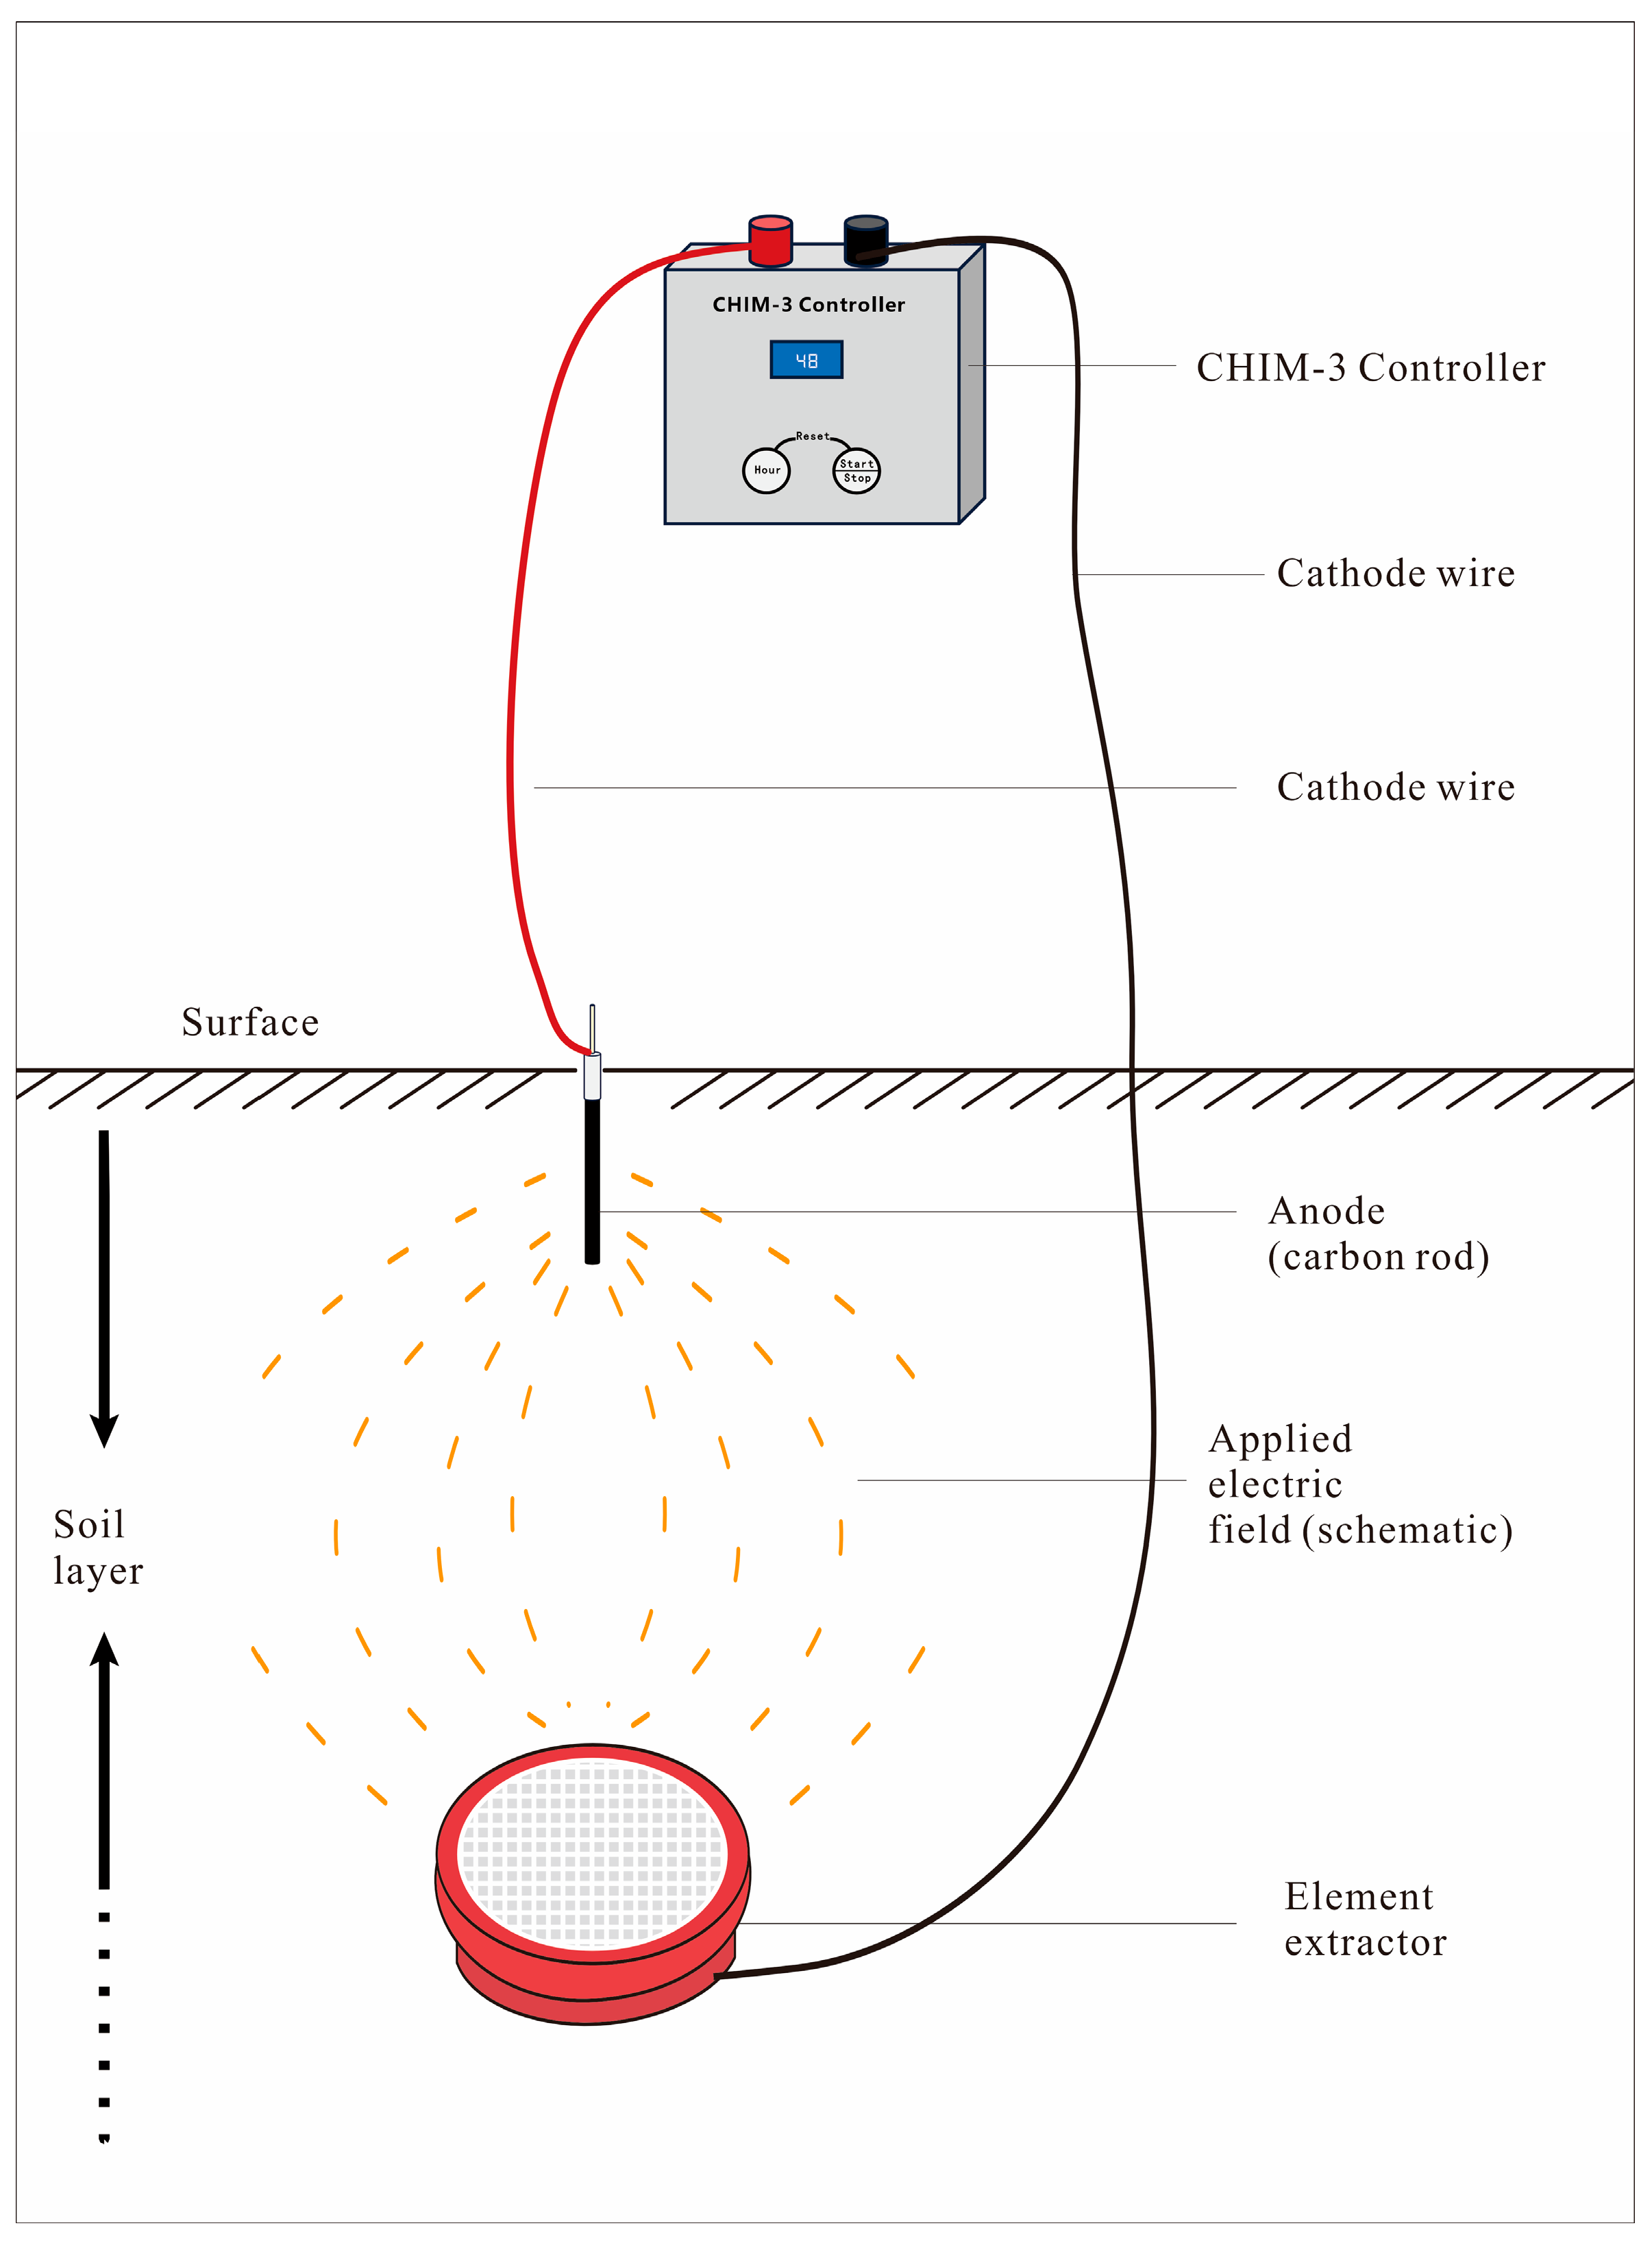
This study employed the “Time-Controlled Solid Carrier Element Extractor” [27,28] (Figure 2) developed by the Institute of Geophysical and Geochemical Exploration, Chinese Academy of Geological Sciences. As the effectiveness of geoelectrochemical tests had been preliminarily validated on this profile, the current experiment was conducted only over the mineralized core segment of Exploration Line 20 in the Tongjiangling mining area. A geoelectrochemical survey profile was established with 20 sampling points at 50 m intervals. At each sampling point, a geoelectrochemical extraction device loaded with five different types of filter membranes was installed. The filter membrane types included four commonly used laboratory microporous membranes (with pore sizes of 0.22 μm, 0.45 μm, 1 μm, and 3 μm) and one type of qualitative medium-speed filter paper with a pore size of 20–50 μm (hereinafter referred to as the filter paper). During the measurement process, the extraction parameters were set as follows: a supply voltage of 9 V applied continuously for 48 h; the extraction solution was local tap water, with a volume of 1 L per point; the adsorption collector was high-density polyurethane foam (density 30 g/dm3), which was pre-treated with 8% aqua regia (HNO3 to HCl volume ratio of 2:1) to reduce blank background levels. This experimental design provided a reliable foundation for investigating the particle size distribution of geoelectrochemical anomalous materials.
Figure 2.
Schematic diagram of the time-controlled solid carrier element extractor.
The sample collection procedure was as follows: ① Select an area showing no obvious signs of anthropogenic disturbance (e.g., foreign deposits). After removing the humus layer, excavate a burial pit to a depth of 30 cm. Place the extractor at the bottom of the pit. Backfill the soil in stages while simultaneously adding the extraction solution to ensure uniform moisture distribution within the pit. ② Connect the geoelectrochemical extraction device, set the extraction duration to 48 h, then check and record the electrical connectivity. ③ The five geoelectrochemical extractors with different filter membranes at the same sampling point were buried with a spacing of 0.5 m between them. ④ Upon completion of the power application, remove the adsorption collector from each extractor. Place it into a contamination-proof paper sample bag. All samples from the same batch were then sent to the laboratory for analysis.
Regarding the use of tap water as the extraction solution, it is important to clarify that all batches included blank samples processed under identical conditions. Based on empirical data from multiple field campaigns, the background noise levels from these blanks are consistently low and stable, while the anomaly signals related to target elements are significantly higher and clearly distinguishable. This contrast has been repeatedly validated, confirming that the extraction method, despite using non-standard fluid, yields reliable and interpretable data.
3.2. Analytical Procedures
All samples were sent for analysis to the “Key Laboratory of Geochemical Exploration, Ministry of Natural Resources”, which is affiliated with the Institute of Geophysical and Geochemical Exploration, Ministry of Natural Resources. The analytical suite covered 22 elements, including Ag, Al, As, Au, B, Bi, Br, Cd, Co, Cu, Fe, K, Mn, Mo, Ni, Pb, S, Sb, Sn, Ti, W, and Zn.
The foam plastic samples were analyzed using Inductively Coupled Plasma Mass Spectrometry (ICP-MS). The specific procedures are as follows: Approximately 0.5000 g of the sample was weighed and placed into a 50 mL conical flask. Then, 18 mL of nitric acid and 2 mL of perchloric acid were added, and the flask was left on a hotplate overnight. Subsequently, the temperature of the hotplate was gradually increased to 220 °C, and heating continued until the solution was nearly dry. If the sample was not completely decomposed during digestion, additional nitric and perchloric acids could be added as needed until no black particles remained. The conical flask was removed and allowed to cool slightly. Then, 10 mL of aqua regia (1:1) was added, and the flask was heated on the hotplate for an additional 5–10 min. After cooling, the entire solution was transferred to a 20 mL colorimetric tube. It was brought to volume with deionized water, shaken well, and allowed to settle and clarify. The elemental content of the sample was then determined using the ICP-MS instrument. Quality control during analysis was performed using the standard addition method [29,30]. The spike recovery rates were predominantly within the range of 95% to 105%, which meets the requirements of this study.
3.3. Data Analysis and Mapping
Following the laboratory analysis of the collected geoelectrochemical foam plastic samples, the acquired data were processed and visualized using a variety of statistical and graphical software tools. First, SPSS 26 software was employed to perform descriptive statistical analysis, Pearson correlation analysis, and factor analysis on the data. Prior to factor analysis, the Kaiser–Meyer–Olkin (KMO) test and Bartlett’s test of sphericity were conducted to assess the suitability of the data. A KMO value greater than 0.5 and a p-value less than 0.05 for Bartlett’s test indicated that the data were appropriate for factor extraction. The principal component method was used for factor extraction, retaining factors with eigenvalues greater than 1. Varimax rotation was applied to simplify the factor loading structure, facilitating the identification of elemental assemblages and their potential geochemical significance. Pearson correlation analysis was utilized to quantify the linear correlations between elements. A correlation coefficient matrix was calculated, and two-tailed significance tests (with significance levels set at 0.05 and 0.01) were performed to corroborate the findings of the factor analysis.
Subsequently, Origin 25 software was used to generate radar charts and correlation heatmaps. The radar charts visually depict the distribution of anomaly intensities for each element across the different filter membranes. The correlation heatmaps, employing a color gradient to represent the strength of correlation coefficients between elements, aided in interpreting elemental paragenetic associations. Grapher 22 software was employed to create line charts of elemental anomalies for the five filter membrane types (qualitative medium-speed filter paper and microporous membranes with various pore sizes). This allowed for a comparison of the capture efficiency of different membranes for ore-forming and associated elements, highlighting the influence of membrane pore size on the extraction of anomalous information. Finally, CorelDRAW 2024 software was utilized to compile the geological map of the study area, incorporating information on stratigraphy, lithology, and structure. This map provides the necessary geological context for interpreting the spatial distribution characteristics of the anomalies. All statistical parameters and plotting settings were standardized to ensure the reliability and comparability of the analytical results.
4. Results and Discussion
4.1. Statistical Characteristics of Parameters
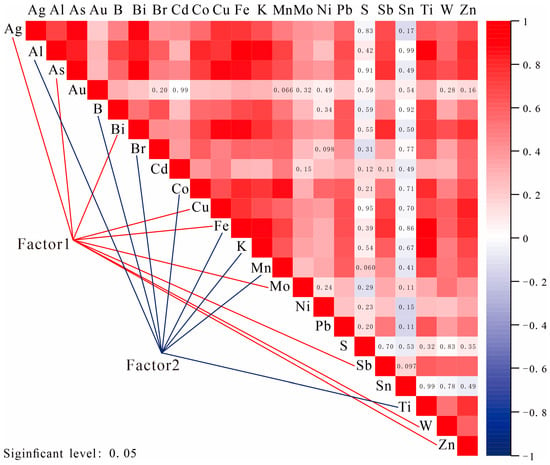
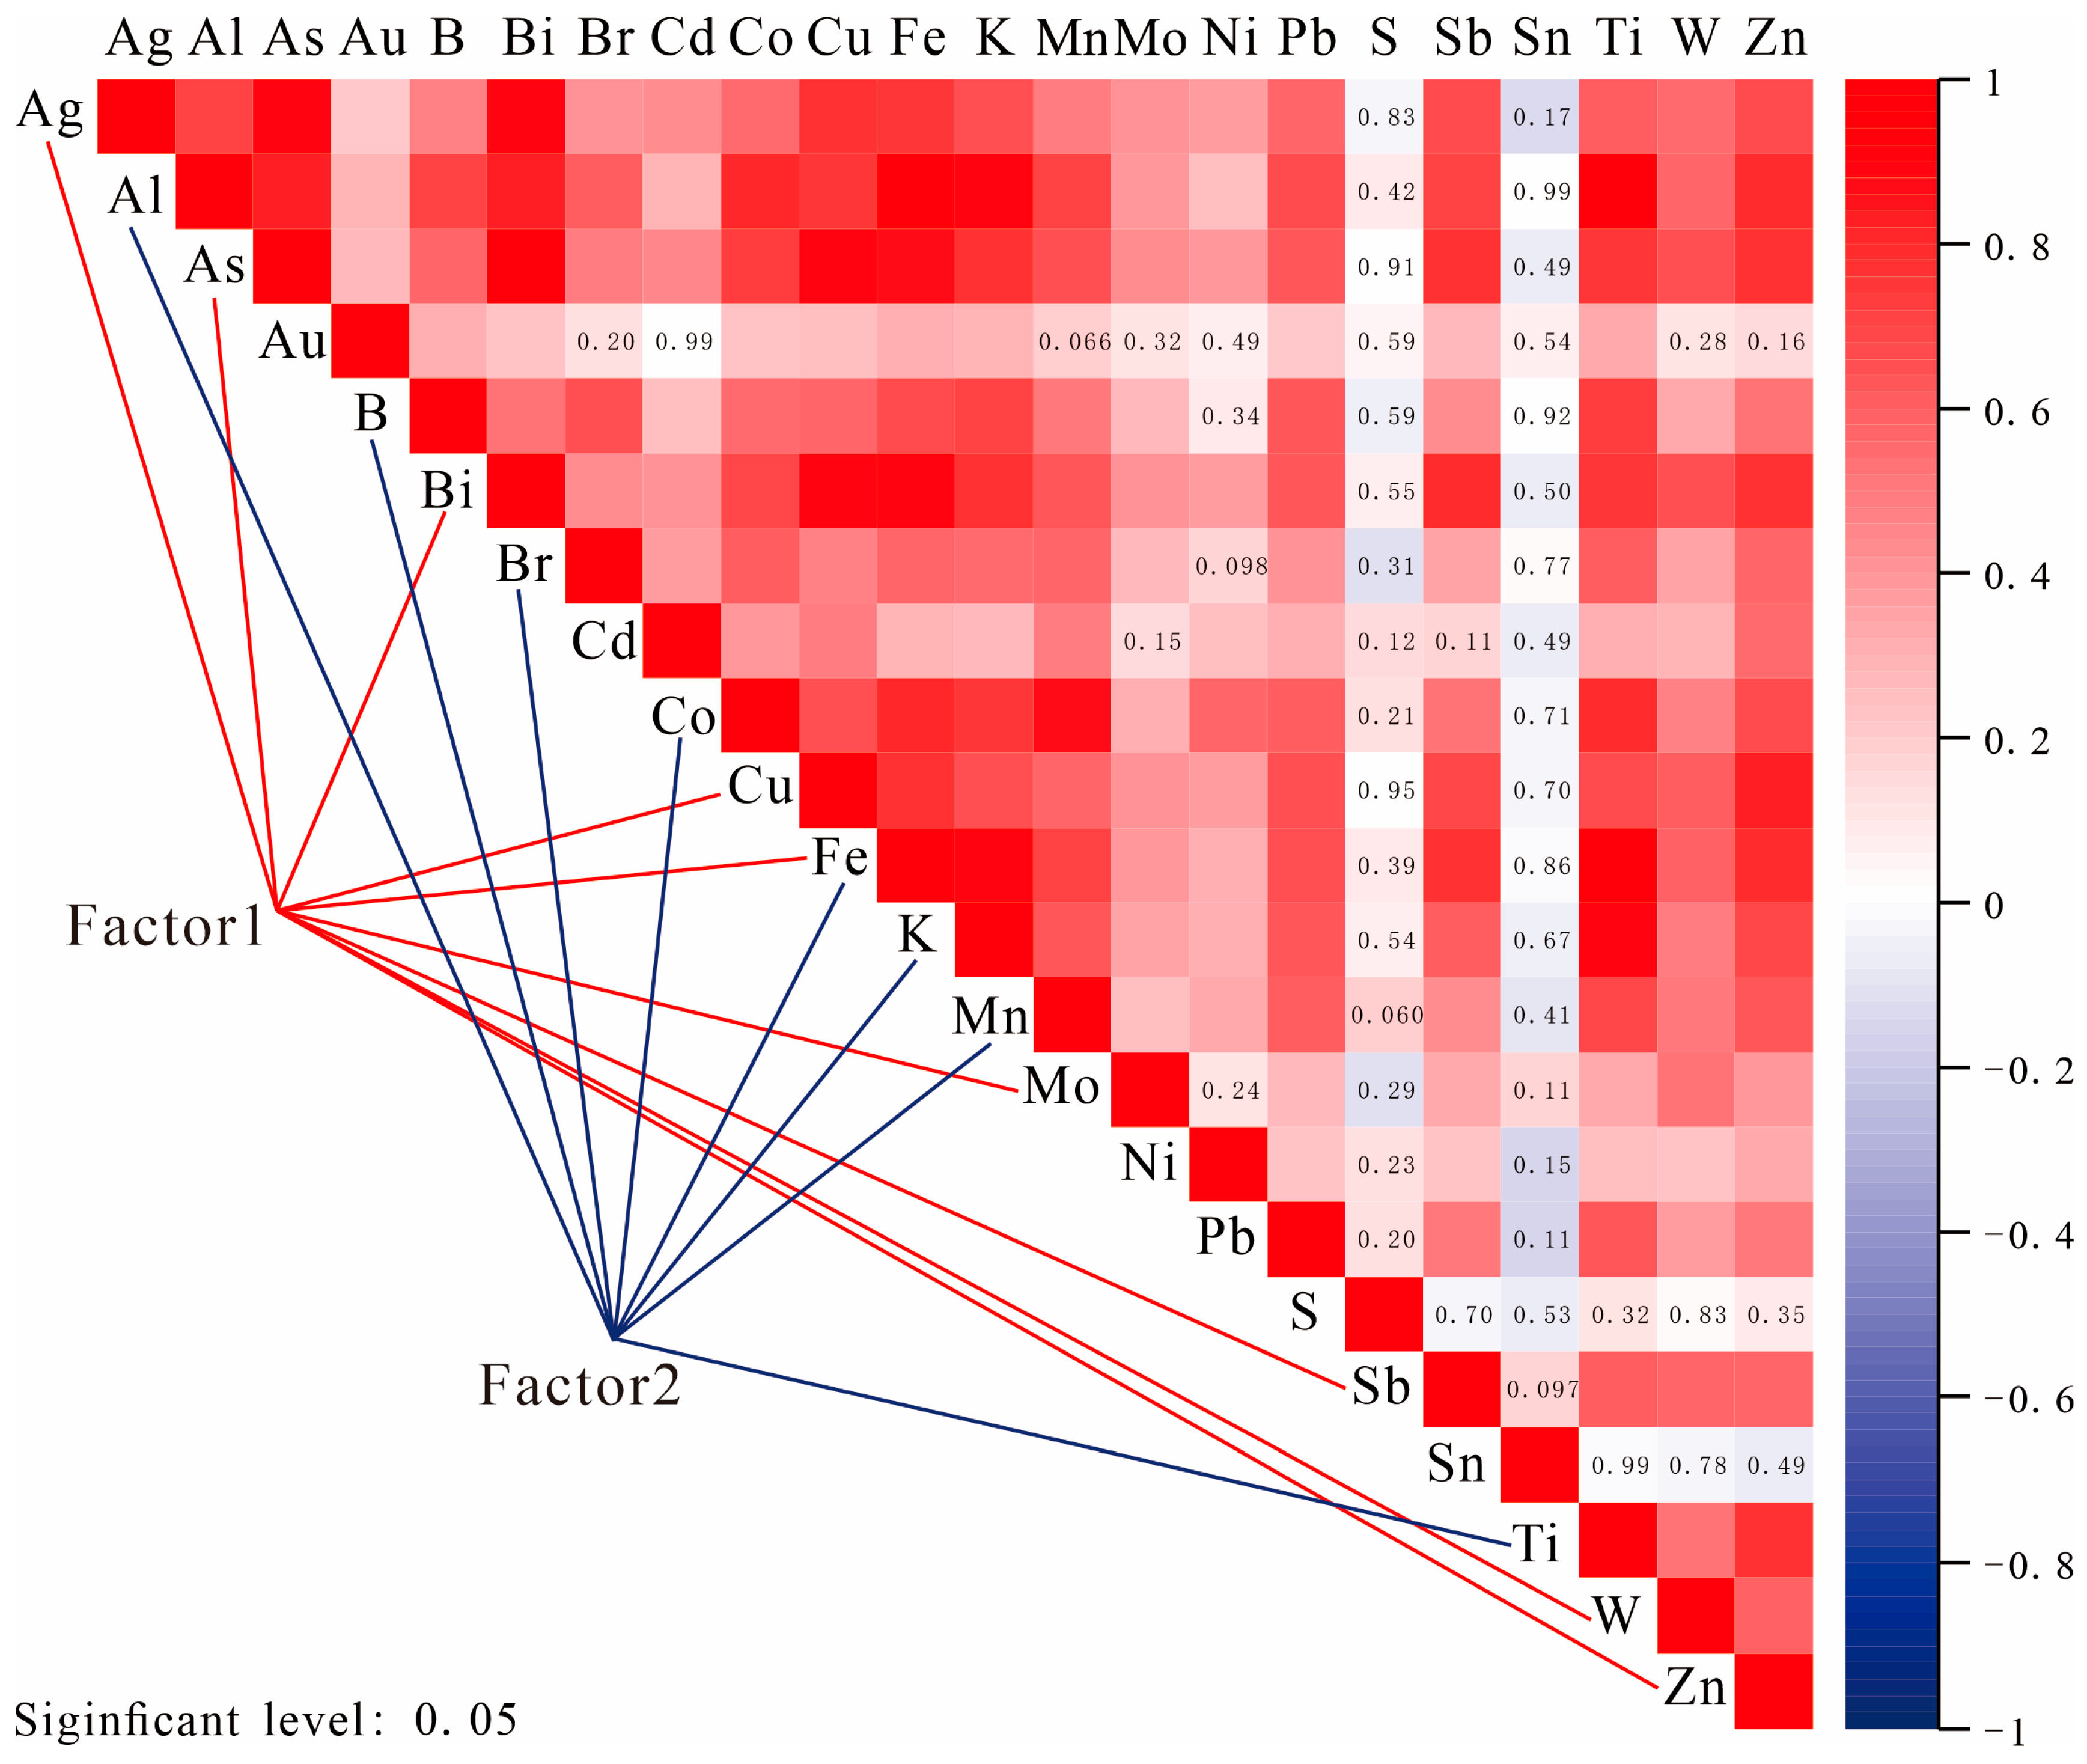
SPSS software was employed to analyze the correlation of the raw geoelectrochemical sample data. Pearson correlation analysis of the data obtained from the five filter membranes yielded a Kaiser–Meyer–Olkin (KMO) measure of sampling adequacy value of 0.846 (close to 1), indicating that the data were highly suitable for factor analysis. By selecting a component group with rotated component coefficients greater than 0.6, a factor F1 closely associated with the ore-forming element copper was successfully extracted (Figure 3). Factor F1 primarily includes Cu, W, Ag, As, Bi, Sb, Zn, and Fe, with a cumulative variance contribution rate of 53.07%. Furthermore, considering Au is an important associated element in porphyry-skarn copper deposits, it was also included as an indicator element. Consequently, the effective indicator element suite for this mining area is Cu, W, Ag, As, Bi, Sb, Zn, Fe, and Au. This suite is largely consistent with the primary and associated elements characteristic of porphyry-skarn copper deposits [31].
Figure 3.
Visualization of factor analysis and correlation matrix.
To address the reviewer’s concern regarding the statistical validation of performance differences between filter types, non-parametric tests were employed to compare element concentrations across groups. For pairwise comparisons between the qualitative medium-speed filter paper and the 3 µm membrane, a Mann–Whitney U test was conducted. For overall comparisons across all five filter types, a Kruskal–Wallis H test was performed. All statistical analyses were conducted in SPSS 26, and a significance level of p < 0.05 was adopted (Table 1 and Table 2).
Table 1.
Nonparametric Comparison of Element Concentrations Recovered by Qualitative Medium-Speed Filter Paper and 3 µm Membrane.
Table 2.
Nonparametric Analysis of Element Concentrations Using Kruskal–Wallis Test by Experimental Group.
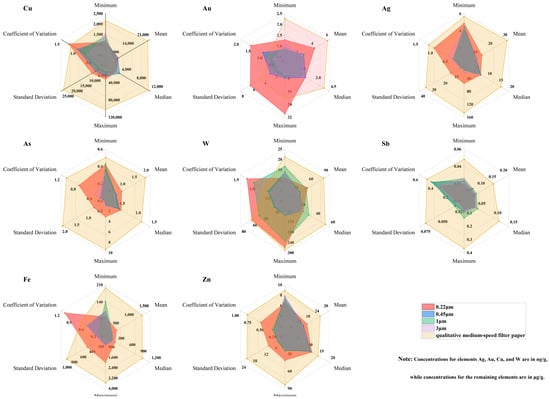
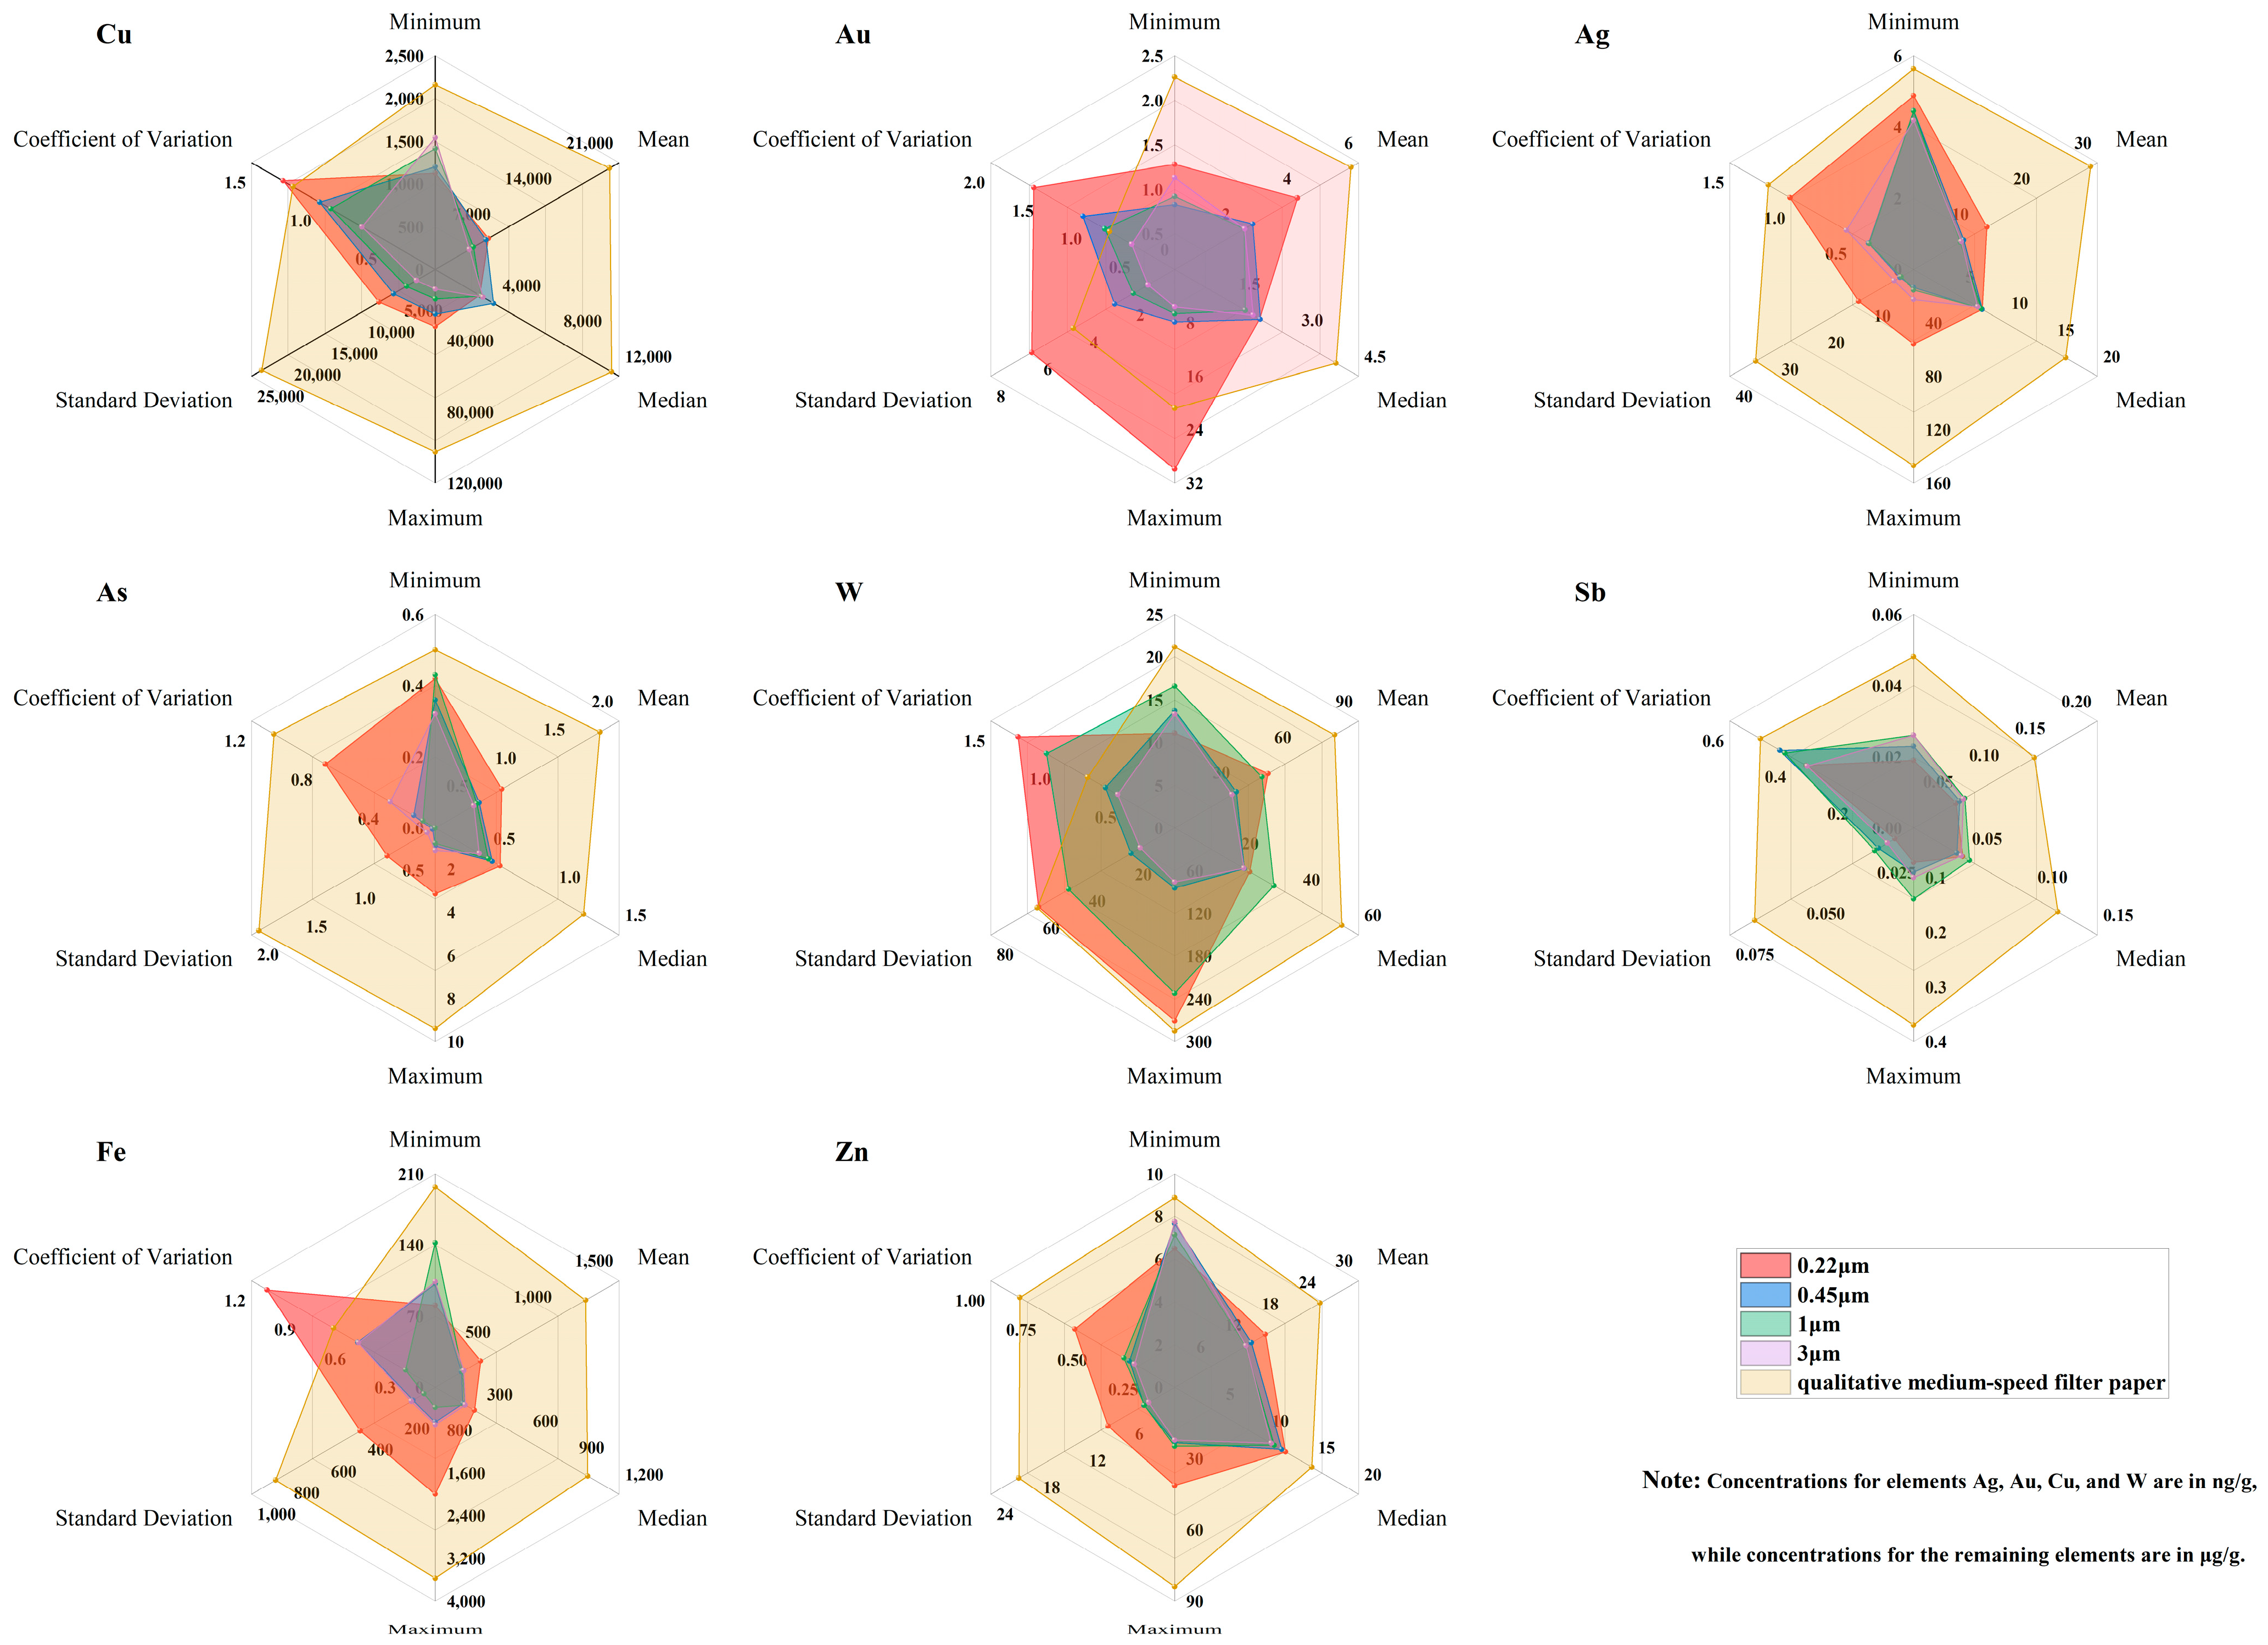
Statistical measures such as extreme values, arithmetic mean, and coefficient of variation are important indicators reflecting the concentration levels of elements within a dataset. A comparison of the descriptive statistical indicators for the indicator elements obtained using the five filter membranes is shown in Figure 4. The mean values of geoelectrochemical element data obtained using the filter paper are generally several times higher than those from other membranes. The maximum values are also significantly greater, particularly for Ag, where the extreme value from the filter paper can be an order of magnitude (ten times) higher than those from other membranes. According to the common classification standard for the coefficient of variation (CV) in geochemistry, a CV below 0.5 indicates a relatively uniform spatial distribution of an element. A CV between 0.5 and 1 suggests localized enrichment or depletion, marking the onset of heterogeneous distribution and the potential presence of anomalies. A CV exceeding 1 signifies a highly heterogeneous distribution, often indicative of strong localized enrichment (e.g., mineralization) and serves as a marker for significant anomalies. The results show that for the selected indicator elements, the concentrations measured using the extraction device with filter paper are relatively high compared to those from the other four membranes, and their coefficients of variation are generally larger. This may suggest that the filter paper possesses distinct advantages in membrane selection. It is noteworthy that the coefficients of variation for elements such as Ag, Cu, W, and Au, measured using the 0.22 μm pore-size membrane, are all greater than 1. This suggests that, under these experimental conditions, the anomalies of these elements in the soil are likely caused by particulate matter with a grain size smaller than 0.22 μm.
Figure 4.
Radar chart of element indicators for different filter membranes.
4.2. Anomaly Manifestation
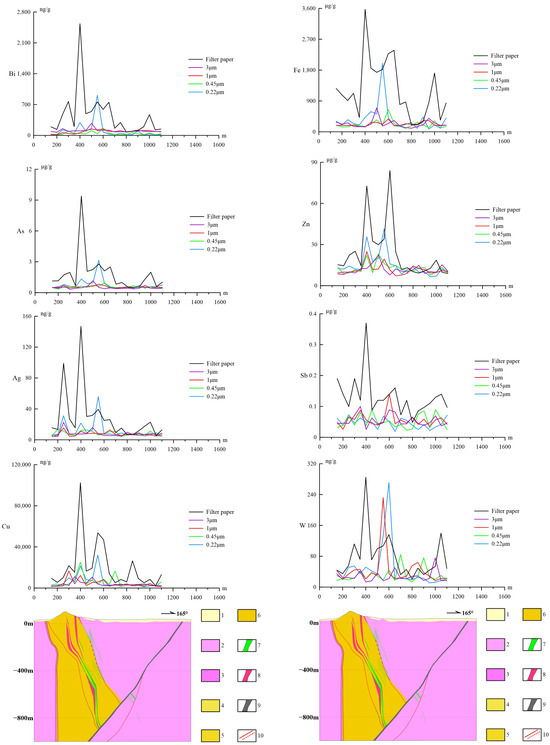
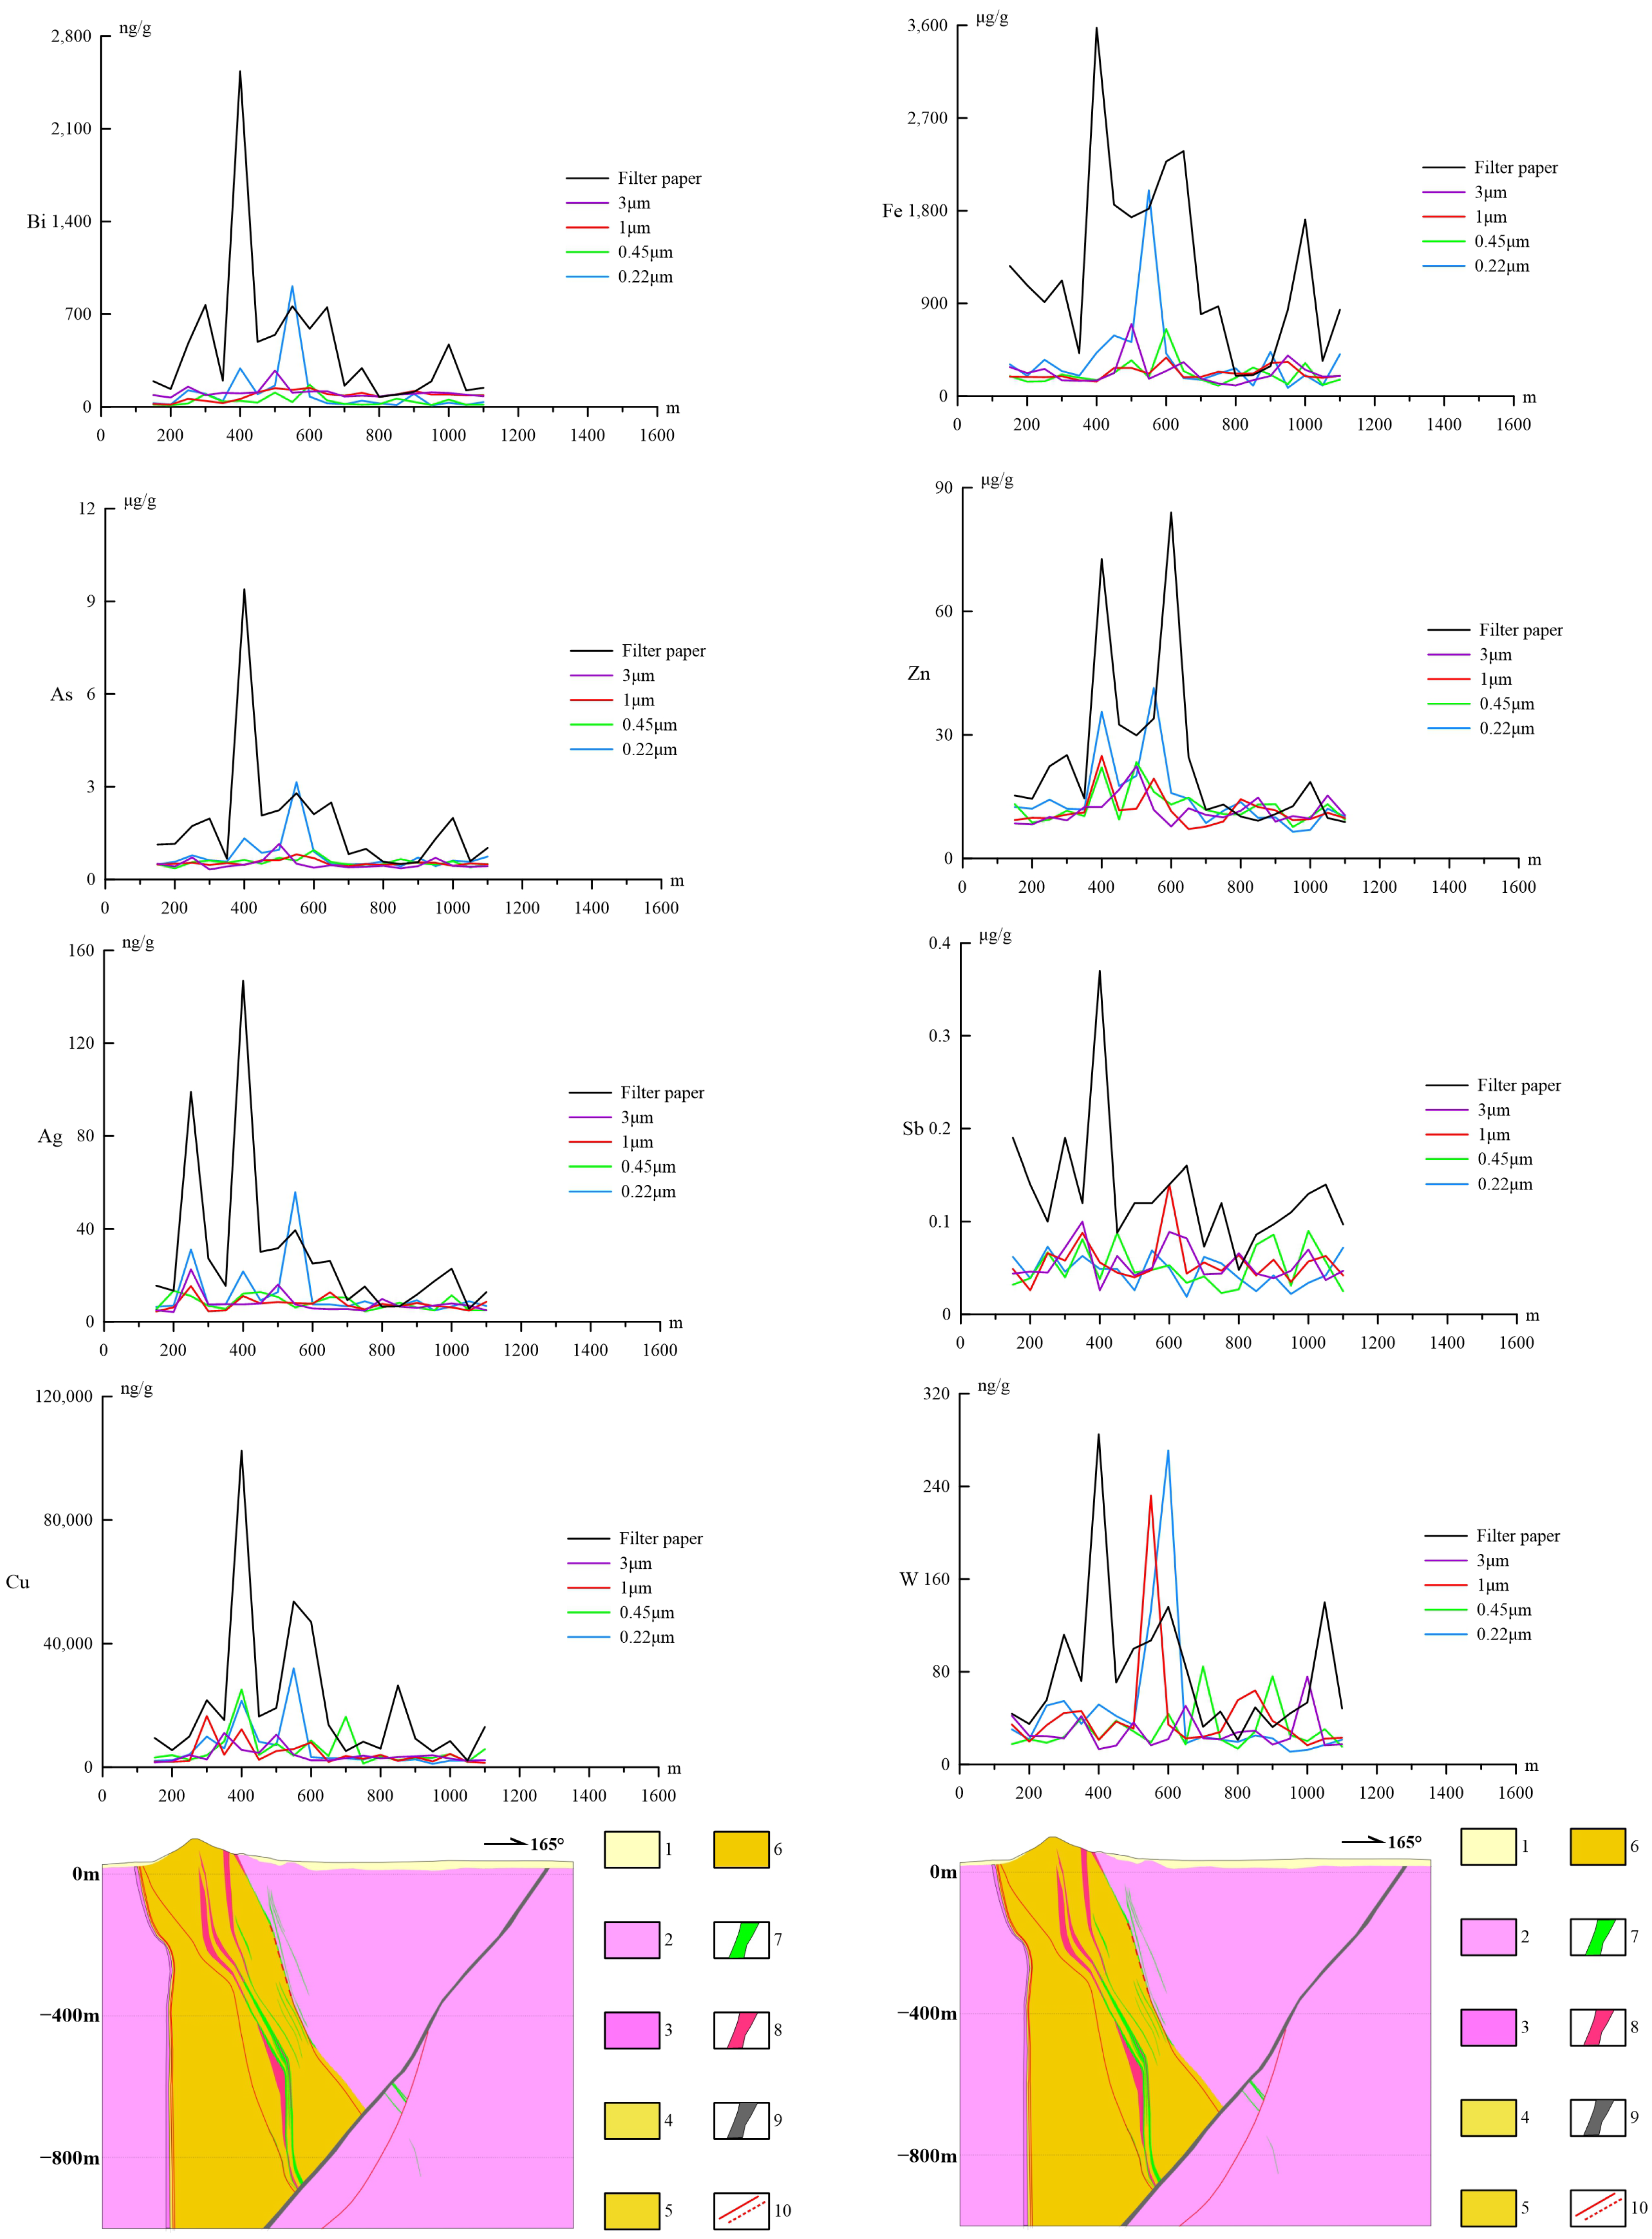
The proven ore bodies along Profile No. 20 of the Tongjiangling Copper Deposit exhibit a vein-like occurrence, with burial depths ranging from 50 to 900 m, and can be categorized into shallow and deep segments. The shallow ore body is located approximately 400 m along the profile at a vertical depth of about 50 m, primarily hosted within the contact zone between granodiorite and carbonate rocks. The geoelectrochemical adsorption measurement results indicate that all five different types of filter membranes revealed relatively distinct geochemical anomalies associated with this body. Representative primary ore-forming and associated elements, including Cu, W, Ag, As, Bi, Sb, Zn, Fe, and Au, show peaks in geoelectrochemical adsorption content within the 400–500 m interval of the profile. As can be seen in conjunction with Figure 3, the filter paper membrane demonstrates particularly outstanding performance in identifying the shallow ore body. The peak adsorption element content for this membrane is significantly higher than that for the other four membranes, reflecting greater detection sensitivity. Furthermore, within the segment corresponding to the shallow ore body, although the other four membranes also display some anomalies, their anomaly curves are generally gentler overall, providing relatively ambiguous indications of the ore body’s spatial location compared to the filter paper membrane.
The deep ore body is located approximately 1100 m along the profile at a vertical depth of about 600 m, hosted within a stratum bounded by a fault zone and a mylonite zone. Among the five filter membranes, only the filter paper membrane exhibited a clear anomalous response to the ore-forming and associated elements related to the deep ore body, demonstrating a relatively good capability for deep detection. The other four membranes showed weaker identification of the relevant elements, with indistinct anomalies (Figure 5). It is noteworthy that the anomaly curve for the W (tungsten) element appears relatively convoluted, indicating its high sensitivity in this geoelectrochemical adsorption measurement. This may suggest the presence of tungsten mineralization at depth [32,33]. The anomalous characteristics of the Au element are generally similar across all five filter membranes, suggesting the anomaly source likely consists of similar material. The anomaly is slightly more pronounced for the filter paper membrane, likely due to its larger pore size, allowing more material to pass through. Only the 0.22 μm membrane exhibited an anomalously high Au anomaly, with an intensity several tens of times greater than that of the other membranes. Considering the anomalies of other elements identified by the 0.22 μm membrane for the shallow ore body, it is inferred that this exceptionally high Au anomaly is likely caused by extremely fine particulates of native gold.
Figure 5.
Line chart of ore-forming element concentrations 1—Quaternary system; 2—Triassic Qinglong Formation: medium–thin-bedded limestone and thick-bedded limestone; 3—Triassic Yinkeng Formation: yellowish green shale; 4—Permian Changxing Formation: chert-nodule-bearing limestone and siliceous rock; 5—Permian Longtan Formation: variegated shale intercalated with skarn; 6—Middle Permian Maokou Formation: chert-nodule-bearing limestone; 7—copper ore body; 8—granodiorite porphyry; 9—mylonite zone; 10—fault: mapped (solid line)/inferred (dashed line).
The different filter membranes exhibit markedly different capabilities in identifying shallow and deep ore bodies. Among them, the filter paper demonstrates superior performance in detecting both. Combining these findings with prior comparative results from indoor and field tests in this area, the anomalies show good correspondence with both shallow and deep mineralization [34]. This not only further confirms the existence of both shallow and deep ore bodies within this profile but also highlights the stable reproducibility of the geoelectrochemical measurement technique in locating concealed ore bodies.
4.3. Anomaly Discrepancies and Mechanisms
4.3.1. Causes of Variation in Anomaly Effectiveness
Soil is a highly complex system composed of solid, liquid, and gaseous phases, along with various organisms. According to the principles of geoelectrochemical extraction, the process primarily targets and captures charged substances [35]. In soil, the capture primarily targets the solid phase, which itself consists of individual soil particles of varying sizes. Based on effective diameter, soil particles are classified into gravel, sand, silt, and clay particles. Furthermore, within each size fraction, particles can be categorized by composition into three types: mineral particles, organic particles, and organo-mineral composite particles [36,37,38]. Therefore, the material extracted via geoelectrochemical methods can consist of particles of different sizes and compositions, or even composite particles combining different sizes and components. The data indicate that (Table 3), due to its favorable pore size distribution, the filter paper allows for the effective passage of all the aforementioned types of charged substances. In contrast, the other four filter membranes are limited by their smaller pore sizes, showing significant constraints in allowing the passage of larger particles such as sand and silt. This results in a notable restriction in both the compositional range and the total quantity of material they capture. This difference directly impacts the information-gathering capability and effectiveness of the different filter membranes in geoelectrochemical surveys.
Table 3.
Soil Particle Classification and Filter Membrane Permeability.
Theoretically, a filter membrane with a larger pore size permits a greater variety of materials to pass through, which should result in more pronounced data signals. In practice, under an applied electric field, the extracted material is a composite of various charged and uncharged particles, rather than a single substance. Data for the major ore-forming and associated elements show that only the filter paper membrane can effectively identify anomalies caused by both shallow and deep ore bodies. In contrast, the small-pore membranes primarily reflect anomalies from shallow ore bodies but exhibit a poor capacity for indicating deep-seated mineralization.
This discrepancy primarily stems from the migration characteristics of deep geochemical signals. The anomalous signals generated by deep ore bodies undergo significant attenuation during their upward migration to the surface (primarily via mechanisms such as groundwater circulation, ionic diffusion, and geogas transport). By the time they reach the surface, these signals are exceedingly weak. Small-pore membranes can only retain materials within a specific size range (e.g., clay particles smaller than 0.22 μm). In contrast, the filter paper, with its larger pore size, allows the passage of materials of various sizes, including some sand, silt, and clay particles. This enables it to capture a more comprehensive spectrum of these weak deep mineralization signals, thereby achieving effective detection of deep ore bodies. It is particularly noteworthy that the 0.22 μm pore-size membrane demonstrates superior effectiveness in identifying deep Au anomalies. This is closely related to the specific occurrence forms of Au in soil and the operational mechanism of the geoelectrochemical measurement technique. This technique utilizes “electrochemical adsorption” to selectively attract charged substances. Gold in soil often exists in fine, active forms such as colloid-adsorbed species and soluble complexes. Under the influence of the applied electric field, these charged entities can migrate via “electrochemical transport” and accumulate near the extraction device. The small-pore (0.22 μm) filter paper effectively intercepts larger particles, permitting only active components smaller than this size—such as nano-scale gold particles and ionic complexes—to pass through. These are subsequently saturated, adsorbed, and collected by the following foam plastic collector. This process enhances the effective extraction of information related to deep ore bodies, consequently yielding superior detection performance. Ultimately, it is the complexity of the actually adsorbed material and the selectivity of the filter membrane pore sizes that lead to the differences in the statistical characteristics of the obtained geoelectrochemical data and the varying capabilities of different membranes in identifying ore bodies.
4.3.2. Anomaly Formation Mechanism
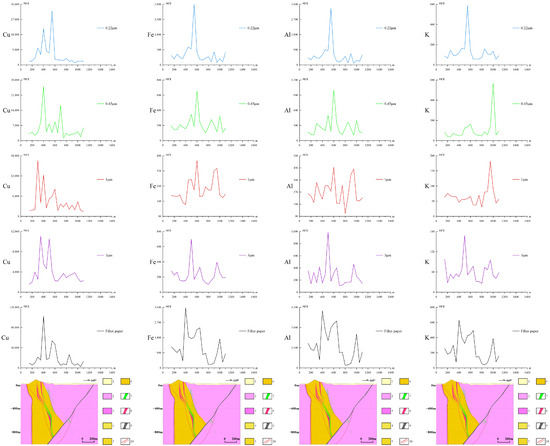
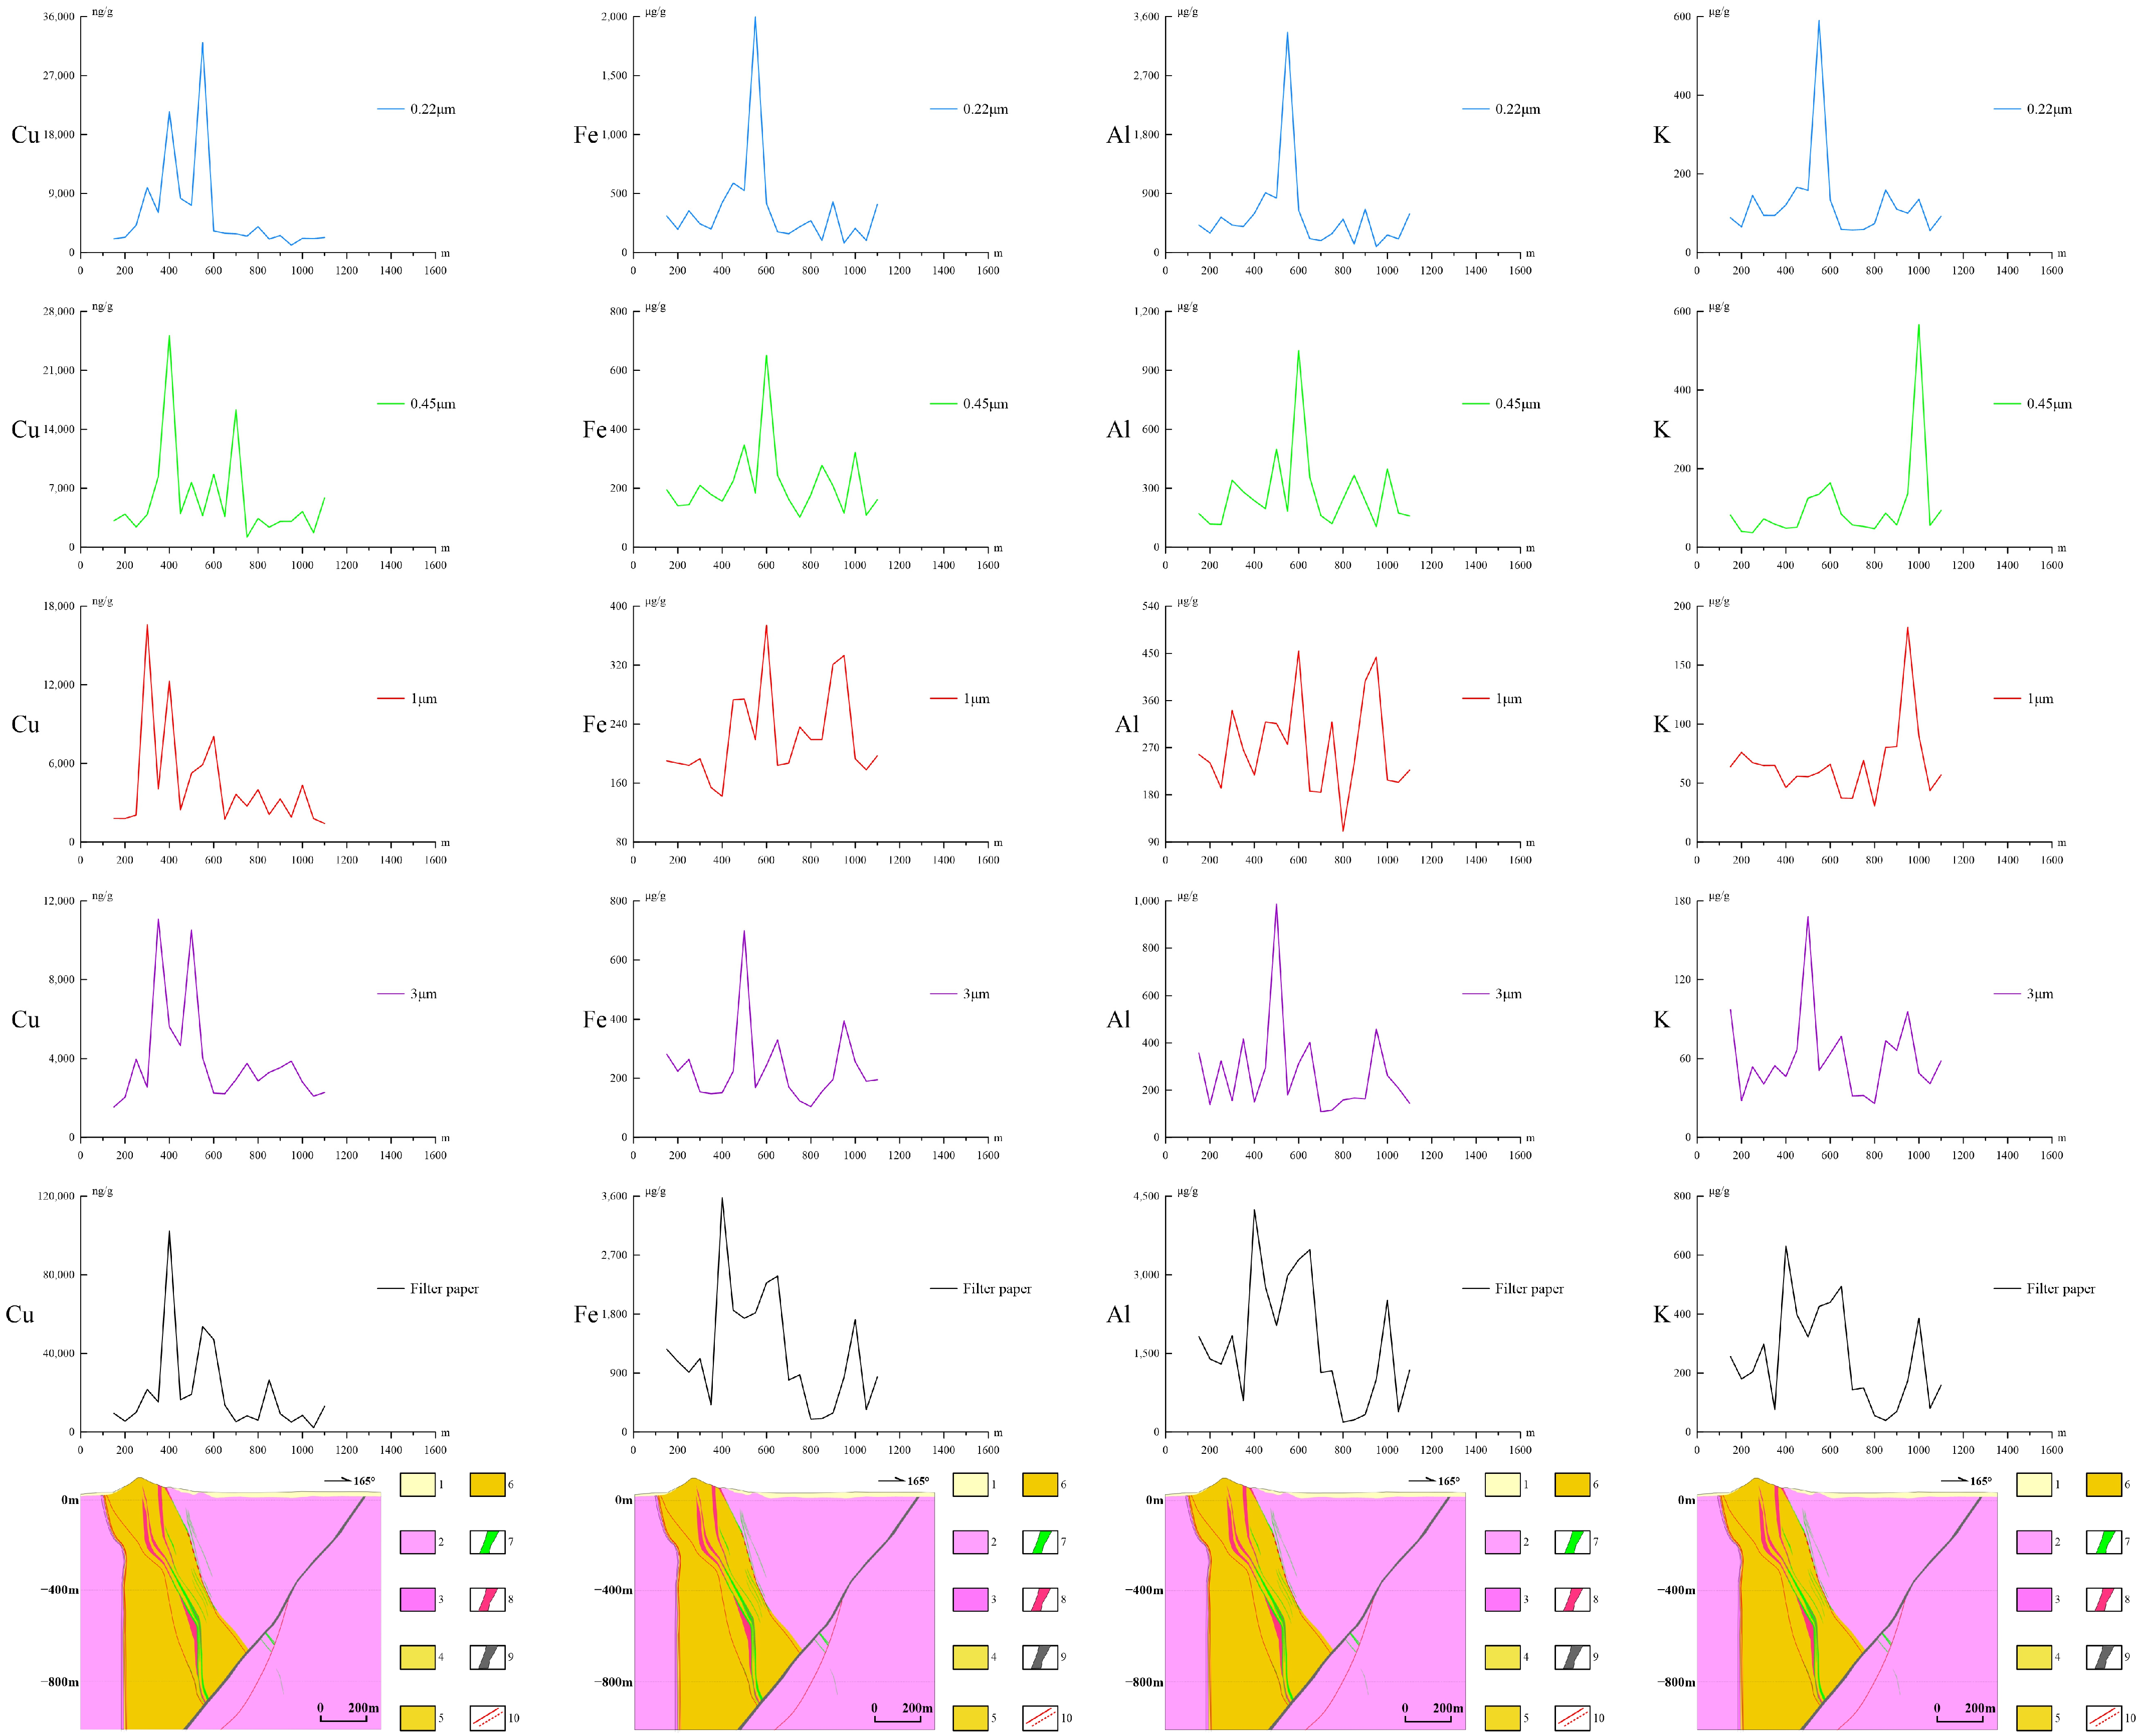
Building upon the previous discussion, the target substances in geoelectrochemical extraction are not particles of a single diameter. Instead, they are “composites” formed by combining particles of three different sizes (sand, silt, and clay) with three different compositional types (mineral particles, organic particles, and organo-mineral composite particles). The smallest particle-size fraction in soil is clay, which generally consists of aluminosilicate minerals. These minerals are formed during soil development through the weathering of primary minerals present in the parent rock. In some instances, clay contains a significant quantity of fine particles that are not aluminosilicate clay minerals, such as iron oxides and calcium carbonate. Therefore, taking elements like Fe, Al, and K from these fine particles within the clay fraction as examples, a comparison of the total extraction amounts by filter membranes with different pore sizes shows that, in general, larger pore sizes yield higher total extraction amounts (Figure 6). This confirms that the pore size directly governs the passage capability for larger particles, and materials of this type can only pass effectively through the filter paper.
Figure 6.
Line chart of element concentrations versus filter membrane pore size 1—Quaternary system; 2—Triassic Qinglong Formation: medium–thin-bedded limestone and thick-bedded limestone; 3—Triassic Yinkeng Formation: yellowish green shale; 4—Permian Changxing Formation: chert-nodule-bearing limestone and siliceous rock; 5—Permian Longtan Formation: variegated shale intercalated with skarn; 6—Middle Permian Maokou Formation: chert-nodule-bearing limestone; 7—copper ore body; 8—granodiorite porphyry; 9—mylonite zone; 10—Fault: mapped (solid line)/inferred (dashed line).
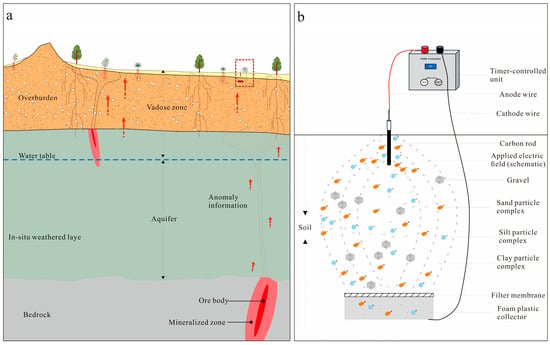
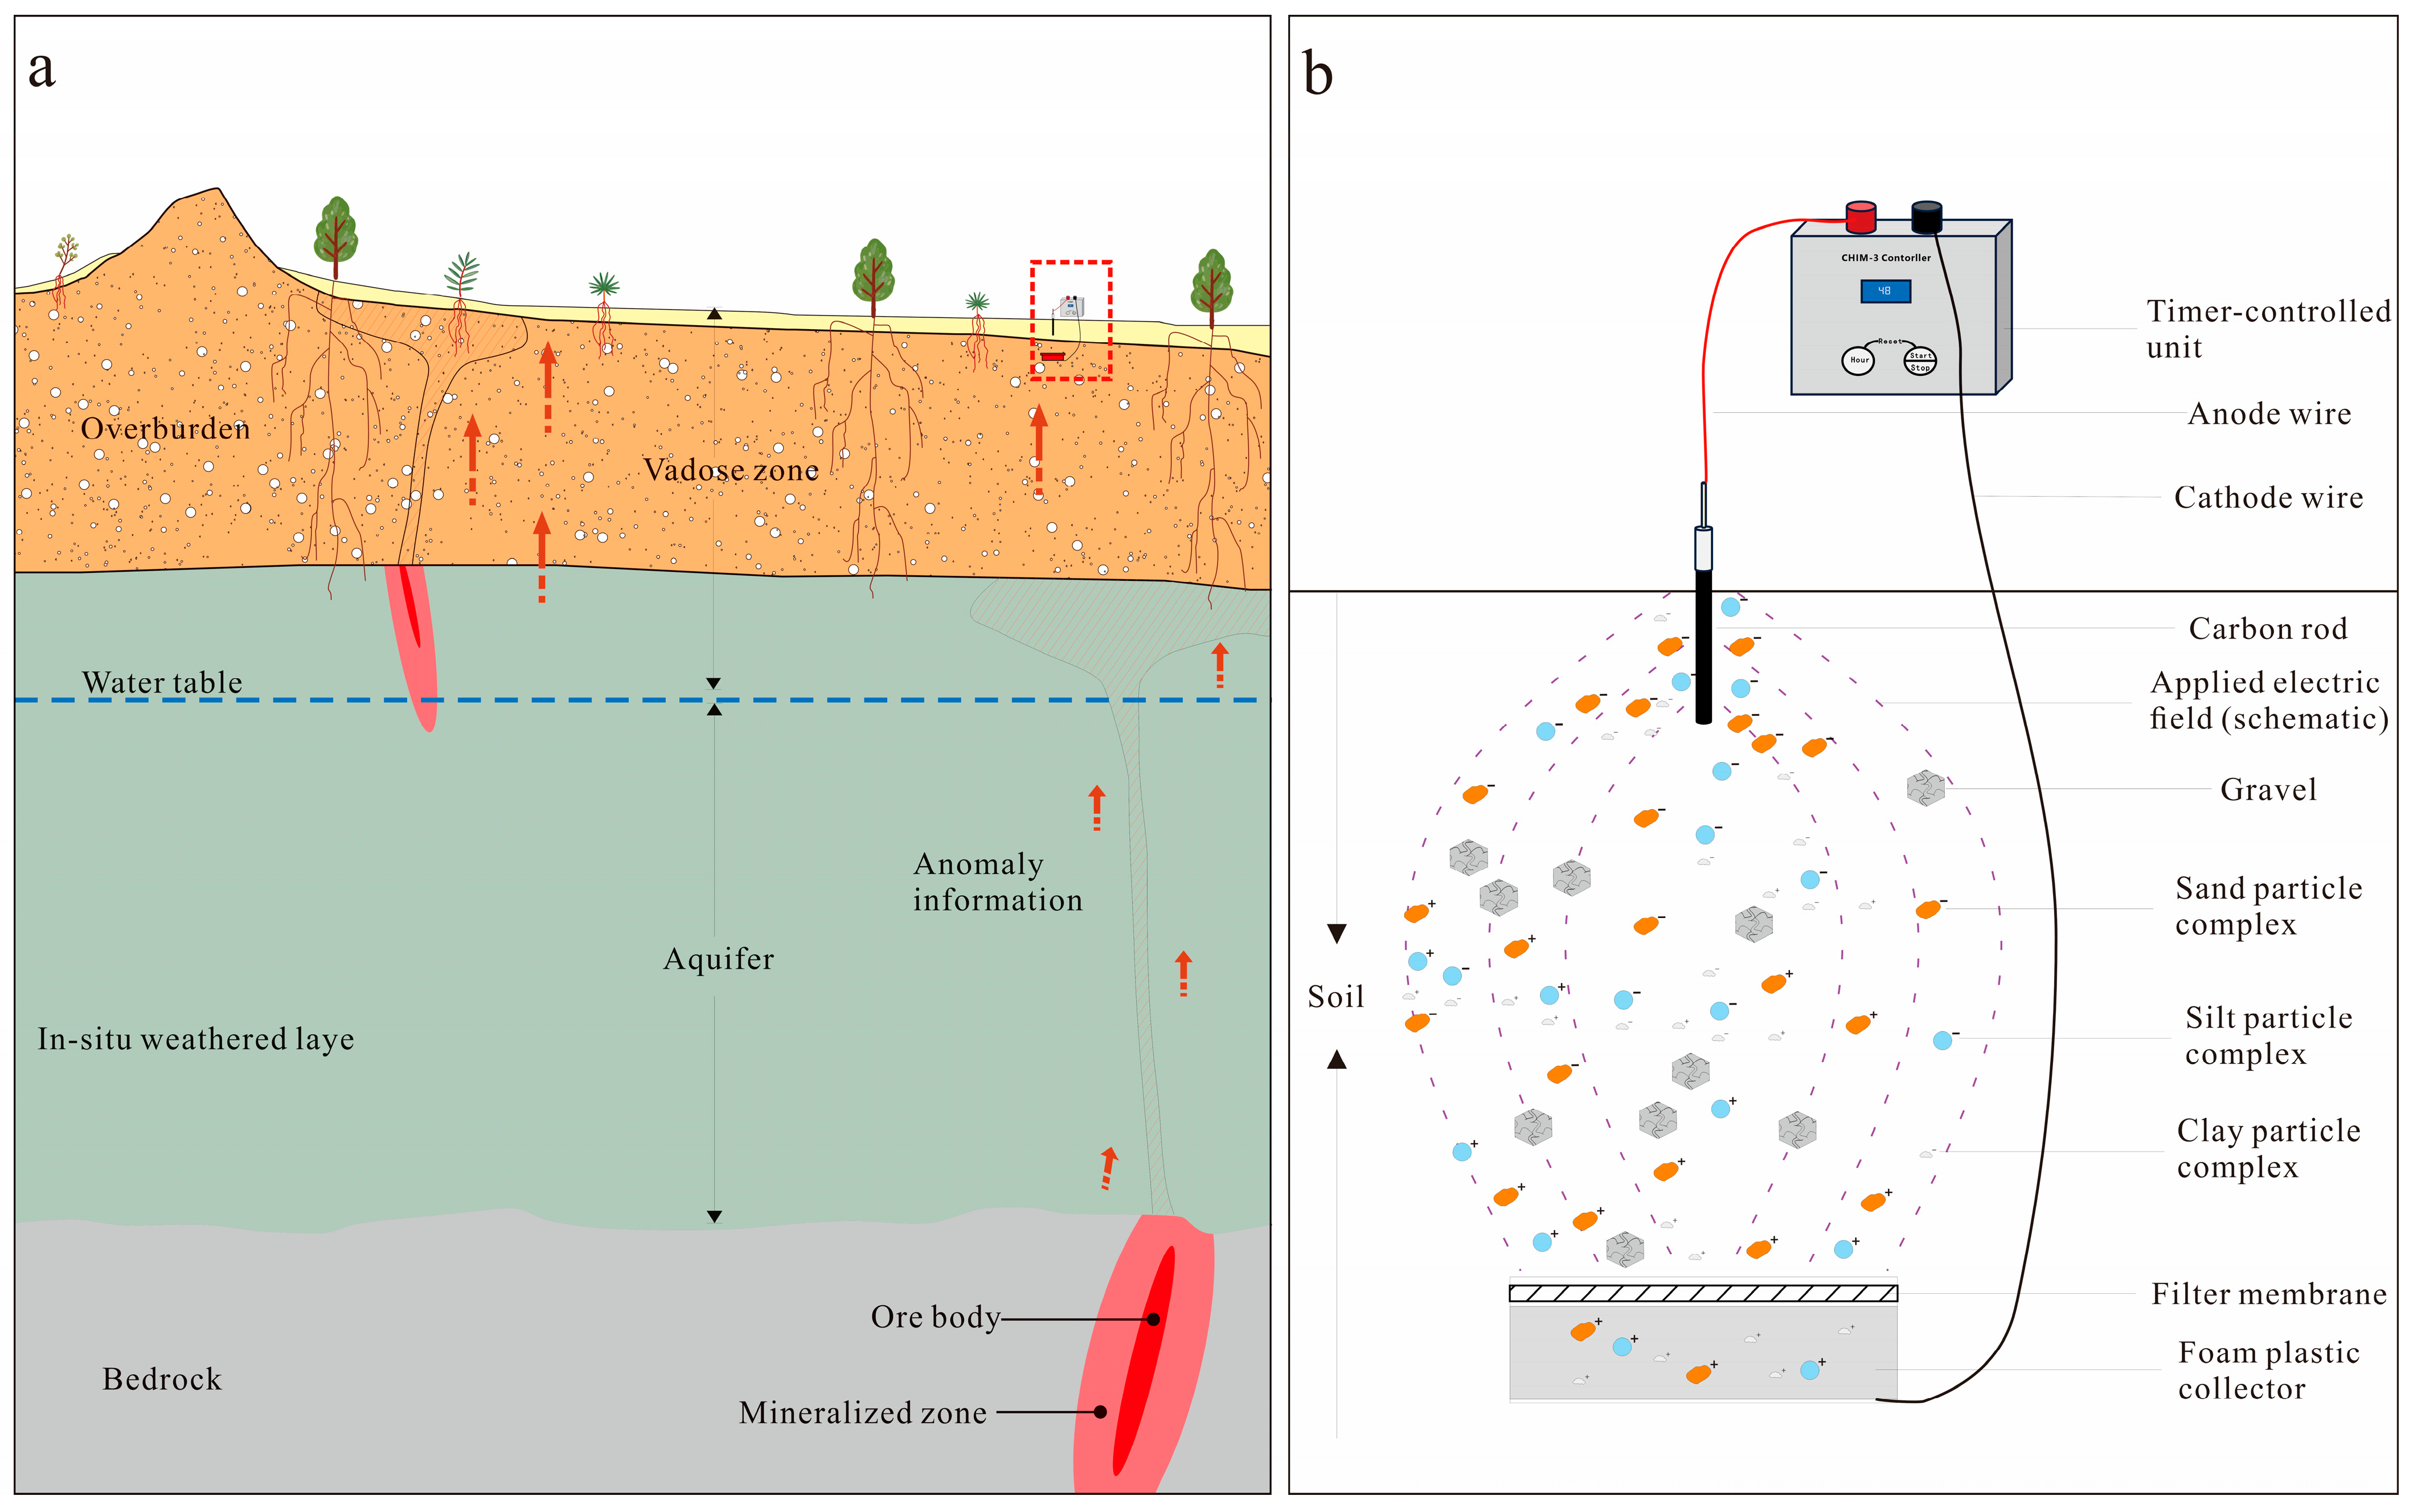
The formation of anomalous signals results from the migration of elemental information from depth to the surface, driven by various natural forces and facilitated by different transport media. The core of this process lies in “gradient-driven transport”: systems inherently tend toward equilibrium, and any disparity in “potential” generates a driving force. Specifically for element migration, the presence of a deep ore body establishes various gradient fields in its surrounding environment, such as chemical potential, hydraulic, and pressure gradients (Figure 7a). Element carriers in different states—ions, nanoparticles, colloids, and mineral particles—respond to different dominant gradients due to their distinct physicochemical properties. For instance, ion migration is predominantly governed by chemical potential gradients, occurring via diffusion and advection within groundwater. Nanoparticles and colloids are more influenced by hydraulic gradients, leading to rapid transport with water flow. The displacement of mineral particles, however, often relies on pressure gradients generated by hydrodynamic forces or ascending gases. These media do not move in isolation within the multiphase (solid–liquid–gas) environment. Instead, they form a complex, relayed, or parallel transport network through the synergy and competition of multiple gradient fields. Ultimately, the elemental information carried by specific media and propelled to the surface by specific driving forces converges into the crucial geochemical anomaly signals that indicate the presence of deep mineralization [8,9,39,40].
Figure 7.
(a) Schematic diagram of anomaly migration; (b) Schematic diagram of the adsorption process of the geoelectrochemical device.
The geoelectrochemical measurement technique achieves selective enrichment by leveraging the inherent electrical properties of the target media. Media carriers in soil—such as gravel, sand, silt, and clay particles that carry weak geochemical information—often form charged fine-scale complexes like colloids, coordination compounds, and oxides through adsorption processes. By applying an artificial electric field, these charged substances are directionally driven toward the extraction device and screened by a filter membrane. The filter membrane plays a crucial role in this filtration—membranes with different pore sizes enable varying degrees of screening, thereby controlling the particle size of the material that proceeds to the next stage, where it is eventually captured and concentrated by a specially designed foam plastic adsorption collector (Figure 7b). This process concentrates and transforms originally weak and dispersed signals into identifiable geochemical anomalies of varying intensities.
5. Conclusions
(1) In identifying both shallow and deep ore bodies, the qualitative medium-speed filter paper (20–30 μm) demonstrated superior overall performance compared to the other filter membranes. It exhibited significantly stronger adsorption capacity for ore-forming and associated elements such as Cu, W, Ag, As, Bi, Sb, Zn, Fe, and Au. The statistical data obtained were information-rich, enabling a more comprehensive capture of geochemical information transported by various media carriers, including clay, silt, and sand particles. In contrast, while the small-pore membranes showed good spatial correspondence with shallow ore bodies, their ability to reflect anomalous information became significantly limited as the burial depth of the ore bodies increased, resulting in a marked decline in overall detection capability.
(2) Geoelectrochemical anomaly information resides within soil particles, hosted in particles ranging from clay to sand. The selection of different particle sizes directly influences the faithful representation of the anomaly. Generally, direct extraction of silt-sized particles from the soil is sufficient for identifying anomalies of common elements. However, for Au, which often exists in forms such as a residual state (as nano-gold) and a complex-bound state, the elemental information for Au tends to be hosted in fine-grained clay particles.
(3) The anomalous information obtained through geoelectrochemical measurement constitutes a multi-source composite information system in an “electrically active mobile state”. Its signal originates from deep ore bodies and is transported to the surface soil via a series of geological agents, where it is subsequently deposited. Information from ore-forming elements is hosted within clay, silt, and sand particles in the soil in various forms, including ions, colloids, nanoparticles, oxide coatings, and mineral fragments.
In this experimental study, the filter membrane pore size was a key parameter. Conventional microporous membranes (e.g., 1 μm) block particle information larger than their pore size, thereby weakening the extraction of anomalous signals. In contrast, the qualitative medium-speed filter paper is compatible with a wider range of carriers, from ions to sand particles, allowing for a more complete capture of the composite anomalous information migrated from depth. Therefore, for similar acidic soil-covered landscapes, it is recommended to use qualitative medium-speed filter paper (20–30 μm) in geoelectrochemical extractors. This approach not only enables a more comprehensive capture of weak anomalies from deep ore bodies, enhancing the effectiveness of concealed ore body identification, but also balances practical field feasibility and cost advantages while ensuring effective element adsorption. It should be noted that the experimental design of this study inevitably involved interference from multiple variables. These include, for example, differences in the intrinsic properties of the various filter membrane materials, as well as minor heterogeneities in the soil micro-environment during the field installation of the five sets of geoelectrochemical devices. Therefore, the conclusions drawn in this paper are reasonable inferences based on the available data. They are intended to provide a methodological reference and empirical support for the application of the geoelectrochemical measurement technique under various landscape conditions, ore types, and deposit categories.
Author Contributions
Writing—Original Draft Preparation, W.Y.; Writing—Review and Editing, B.S., Y.X. and P.L.; Sample Collection, C.C., X.Y., C.W., R.C. and X.Z.; Software and Data Processing, W.Y. and H.W.; Funding Acquisition, B.S. All authors have read and agreed to the published version of the manuscript.
Funding
This research was funded by the Chinese Academy of Geological Sciences (Grant No. JKYZD202326) and the China Geological Survey (Grant No. DD20242846).
Institutional Review Board Statement
Not applicable.
Informed Consent Statement
Not applicable.
Data Availability Statement
The raw data supporting the conclusions of this article will be made available by the authors on request.
Conflicts of Interest
The authors declare no conflicts of interest.
References
- Khayretdinov, I.A. Novovvedeniya v: Vvedenie v Elektrogeokhimiya; Nauka: Moskva, Russia, 1980. [Google Scholar]
- Ryss, Y.S. Geoelektrokhimicheskie Metody Razvedki; Zhang, Z.Y.; Cui, L.P., Translators; Geological Publishing House: Beijing, China, 1986. [Google Scholar]
- Alekseev, S.G.; Dukhanin, A.S.; Veshev, S.A.; Voroshilov, N.A. Some Aspects of Practical Use of Geoelectrochemical Methods of Exploration for Deep-Seated Mineralization. J. Geochem. Explor. 1996, 56, 79–86. [Google Scholar] [CrossRef] [Scilit]
- Fei, X.Q. Discussion on Several Issues of the “Electro-Extraction Ion Method”. Geol. Explor. 1985, 479, 58–60. [Google Scholar]
- Smith, D.B.; Hoover, D.B.; Sanzolone, R.F. Preliminary Studies of the CHIM Electrogeochemical Method at the Kokomo Mine, Russell Gulch, Colorado. J. Geochem. Explor. 1993, 46, 257–278. [Google Scholar] [CrossRef] [Scilit]
- Wang, X.Q. A Geochemical Patterns and Their Geneses. Miner. Depos. 2001, 90, 216–222. [Google Scholar]
- Wang, X.Q. Conceptual model of deep-penetrating geochemical migration. Geol. Bull. China 2005, 24, 892–896. [Google Scholar]
- Wang, X.Q.; Ye, R. Findings of Nanoscale Metal Particles: Evidence for Deep-penetrating Geochemistry. Acta Geosci. Sin. 2011, 32, 7–12. [Google Scholar]
- Wang, X.Q.; Zhang, B.M.; Yao, W.S.; Liu, X.M. Geochemical exploration: From nanoscale to global-scale patterns. Earth Sci. Front. 2014, 21, 65–74. [Google Scholar]
- Okada, K. A Historical Overview of the Past Three Decades of Mineral Exploration Technology. Nat. Resour. Res. 2021, 30, 2839–2860. [Google Scholar] [CrossRef] [Scilit]
- Luo, X.R.; Ouyang, F.; Hu, Y.H.; Wen, M.L.; Wang, B.H. Low-Voltage Dipole Geo-Electrochemical Extraction Device. CN201096644Y, 6 August 2008. [Google Scholar]
- Kang, M. Experiment and application of improved CHIM in mineral exploration. Geol. Bull. China 2009, 28, 250–256. [Google Scholar]
- Tang, R.; Sun, L.; Ouyang, F.; Xiao, K.; Li, C.; Kong, Y.; Xie, M.; Wu, Y.; Gao, Y. CoDA-Based Geo-Electrochemical Prospecting Prediction of Uranium Orebodies in Changjiang Area, Guangdong Province, China. Minerals 2024, 14, 15. [Google Scholar] [CrossRef] [Scilit]
- Guo, H. Study on the prospecting effectivess and halo formation mechanism of CHIM methon in the Wutai Gold Deposit in Shanxi Province. Master’s Thesis, Chang’an University, Xi’an, China, May 2024. [Google Scholar]
- Hu, Y.H.; Xu, X.; Zhang, Q.W.; Ma, H.Y. Test result of low voltage dipole geoelectrochemical extraction device in Gupao gold mining area of Zhaoping in Guangxi. Miner. Resour. Geol. 2016, 30, 669–673. [Google Scholar]
- Kang, H. Application study of deep-penetrating geochemical exploration for concealed sandstone-type uranium deposit. Ph.D. Thesis, China University of Geosciences (Bejing), Beijing, China, April 2021. [Google Scholar]
- Ke, D.; Liu, H.J.; Hou, H.Q.; Wu, G.D.; Hao, W.L.; Yi, C. Formation Mechanism of Electro-geochemical Anomalies in Interlayered Oxidation Type Sandstone-hosted Uranium Deposit and Its Prospecting Significance. Acta Geol. Sin. 2016, 90, 3545–3553. [Google Scholar]
- Kong, F.B. Deep copper polymetallic metallogenic regularities and prospecting studies of favorable locations in Jiurui region of Jiangxi Province. Master’s Thesis, Nanjing University, Nanjing, China, May 2016. [Google Scholar]
- Mao, J.W.; Shao, Y.J.; Xie, G.Q.; Zhang, J.D.; Chen, Y.C. Mineral deposit model for porphyry-skarn polymetallic copper deposits in Tongling ore dense district of Middle-Lower Yangtze Valley metallogenic belt. Mineral Deposits. 2009, 02, 109–119. [Google Scholar] [CrossRef]
- Zhai, Y.S. Remote Sensing Geology and Metallogenic Law in Echeng-Tongling Region of the Middle and Lower Vallery of the Yangtze River; China University of Geosciences Press: Wuhan, China, 1992; ISBN 978-7-5625-0699-7. [Google Scholar]
- Zhai, Y.S. Iron-Copper (Gold) Metallogenic Regularity in the Middle-Lower Yangtze River Region; Geological Publishing House: Beijing, China, 1992; ISBN 978-7-116-00974-5. [Google Scholar]
- Chen, X.Q.; Zhou, T.F.; Wang, B.; Liu, X.; Peng, K. Distribution, occurrence and enrichment mechanism of key metals of selenium, tellurium and cobalt in Wushan copper deposit, Jiurui ore concentration area, Jiangxi Province. Acta Petrol. Sin. 2023, 39, 3121–3138. [Google Scholar] [CrossRef] [Scilit]
- Xiong, Y.; Zhou, T.; Zhu, Z.; Fan, Y.; Li, Z.; Wang, B.; He, B.; Wang, M. Occurrence States and Distribution Patterns of Critical Metals in Skarn Zn Polymetallic Deposits: A Case Study on the Yaojialing Deposit in the Middle-Lower Yangtze River Metallogenic Belt. Acta Petrol. Sin. 2025, 41, 2553–2570. [Google Scholar] [CrossRef] [Scilit]
- Hu, Z.H.; Wang, X.G.; Chen, Y.C.; Zhou, W.; Wang, Y.Y.; Gong, L.X.; Yang, S.J. Metallogenic Regularity in Jiangnan Metallogenic of Tungsten Belt (Jiangxi Section). China Tungsten Ind. 2020, 35, 10–19. [Google Scholar]
- Hu, Z.H.; Wang, X.G.; Chen, G.H.; Hu, L.M.; Huang, Q.Y. Characteristics of Tongjiangling Copper-Tungsten Deposit in Jiangxi and Its Prospecting Significance. China Tungsten Ind. 2018, 33, 15–20. [Google Scholar]
- Mao, J.W.; Wu, S.H.; Song, S.W.; Dai, P.; Xie, G.Q.; Su, Q.W.; Liu, P.; Wang, X.G.; Yu, Z.Z.; Chen, X.Y.; et al. The world-class Jiangnan tungsten belt: Geological characteristics, metallogeny, and ore deposit model. Sci. Bull. 2020, 65, 3746–3762. [Google Scholar]
- Sun, B.B.; Liu, Z.Y. A Solid-State Sorbent-Based Element Extractor with Time-Control Function. CN201535827U, 28 July 2010. [Google Scholar]
- Sun, B.B.; Liu, Z.Y.; Zhou, G.H. The development of the solid carrier elements extractor. Geophys. Geochem. Explor. 2011, 35, 375–378. [Google Scholar]
- Yan, H.Z.; Sun, B.B.; Xu, J.L.; Zhou, G.H.; He, L.; Liu, Y.F.; Wang, T.Y. Comparison of Ashing and Microwave Digestion in Analyzing Geoelectrochemical Polyurethane Foam Samples. Rock Miner. Anal. 2016, 35, 276–283. [Google Scholar]
- Yan, H.Z.; Chen, H.J.; Sun, B.B.; Zhou, G.H.; He, L.; Liu, Y.F.; Wang, T.Y. Study on the Availability of Wet Chemical Digestion of Geo-electrochemical Polyurethane Foam Samples. Rock Miner. Anal. 2017, 36, 510–518. [Google Scholar]
- Huang, C.K. Copper Deposits of China; Geological Publishing House: Beijing, China, 2001; ISBN 978-7-116-02869-2. [Google Scholar]
- Peng, B.; Wang, X.G.; Hu, Z.H.; Dai, J.J.; Wan, X.; Zhang, P.C.; Gu, F.H.; Chen, H.J.; Fu, M.H. The genetic relationship of greisen-vein-type tungsten orebody and skarn-type tungsten-copper orebody of the Zhuxi deposit, northeastern Jiangxi Province: Constraints from in-situ U-Pb geochronology and trace element analysis for the sheelite and garnet. Acta Geol. Sin. 2023, 97, 1508–1525. [Google Scholar]
- Wang, X.G.; Hu, Z.H.; Huang, Q.Y.; Yi, W.; Chen, G.H.; Hu, L.M.; You, W. Zircon U-Pb age of ore-forming magmatic rocks in the Tongjiangling copper-tungsten deposit in the Jiurui ore concentration area and its significance. Geol. China 2019, 46, 832–840. [Google Scholar]
- Han, Z.X.; Zhang, B.M.; Qiao, Y.; Liu, Q.Q.; Hu, L.M.; Guo, X.Y.; Wang, Y.K.; Fu, H.P. Validity Experiments of Fine-grained Soil Geochemical Survey for Exploring Concealed Copper Deposits: A Case Study in the Tongjiangling Copper Deposit, Jiangxi Province. Acta Geosci. Sin. 2020, 41, 977–986. [Google Scholar]
- Luo, X.R. The Mechanism of Electro-Geochemical Halo-Formation and the Application of Electrochemical Method to Exploration of Metallic Ore Deposits. Ph.D. Thesis, Hefei University of Technology, Hefei, China, May 2005. [Google Scholar]
- Michéli, E.; Láng, V.; Owens, P.R.; McBratney, A.; Hempel, J. Testing the Pedometric Evaluation of Taxonomic Units on Soil Taxonomy—A Step in Advancing towards a Universal Soil Classification System. Geoderma 2016, 264, 340–349. [Google Scholar] [CrossRef] [Scilit]
- Yaalon, D.H. Soil Classification. Nature 1996, 380, 31–32. [Google Scholar] [CrossRef] [Scilit]
- Shein, E.V. The Particle-Size Distribution in Soils: Problems of the Methods of Study, Interpretation of the Results, and Classification. Eurasian Soil Sci. 2009, 42, 284–291. [Google Scholar] [CrossRef] [Scilit]
- Kang, M.; Ma, M.H. The role of the artificial electric field in the formation of geoelectrochemical ionic halos. Geophys. Geochem. Explor. 2008, 534–536, 548. [Google Scholar]
- Kang, M.; Guo, L. The Formation of Halos Chim. Bull. Mineral. Petrol. Geochem. 2008, 2, 195–199. [Google Scholar]

Disclaimer/Publisher’s Note: The statements, opinions and data contained in all publications are solely those of the individual author(s) and contributor(s) and not of MDPI and/or the editor(s). MDPI and/or the editor(s) disclaim responsibility for any injury to people or property resulting from any ideas, methods, instructions or products referred to in the content. |
© 2026 by the authors. Licensee MDPI, Basel, Switzerland. This article is an open access article distributed under the terms and conditions of the Creative Commons Attribution (CC BY) license.