


Featured Application
The novel method presented here is a valuable tool that can inform institutions and potential owners/investors about the cost competitiveness of self-consumption PV systems. Its application will enable an assessment of how government policies, support mechanisms, technological advancements, and the economic landscape of a country can impact the cost competitiveness of self-consumption PV systems.
Abstract
Most existing studies on the cost competitiveness of self-consumption PV systems fail to jointly consider key technical, economic, and user-specific factors—such as the share of PV electricity self-consumed, energy exported or imported from the grid, and time-of-use electricity pricing—all of which significantly influence investment viability. To address these gaps, this study introduces a novel method based on a new model to calculate the unit cost of electricity consumption from the user’s perspective (CEC, in €·kWh−1). The array DC power rating is then optimally sized—assuming ideal orientation and tilt—to minimize CEC. A self-consumption PV system is considered cost-competitive when the annualized minimized CEC is lower than the applicable regulated electricity tariff. Colombia is selected as a case study to demonstrate the novel method due to the limited deployment and analysis of self-consumption PV systems in the country. The method is applied across residential, commercial, and industrial sectors in various locations. The resulting annualized minimized CEC values (0.35–8.85 c€/kWh) are consistently below the corresponding regulated tariffs, demonstrating the economic viability of properly sized PV systems. The method’s adaptability to international tariff frameworks makes it a valuable tool for global application and a useful resource for policymakers and stakeholders.
1. Introduction
Photovoltaic (PV) solar energy has emerged as a highly cost-effective electricity source, with significant expansion potential through distributed generation (DG). In this context, self-consumption PV systems allow electricity to be used directly in homes or businesses, reducing reliance on the conventional grid and increasing energy autonomy, while actively contributing to climate change mitigation.
Self-consumption PV systems are increasingly shaping the Latin American electricity mix, with countries like Brazil, Chile, and Mexico demonstrating significant progress and regional leadership [1,2,3,4]. Globally, this expansion is driven by renewable energy policies, including tax incentives, installation subsidies, and compensation schemes for surplus energy fed into the power grid. However, the cost competitiveness of these systems also depends on factors such as the availability of solar resources, installation and maintenance costs, as well as the regulatory framework and local electricity tariffs. There is abundant literature on the competitiveness of self-consumption PV systems in various countries, primarily focused on the Levelized Cost of Electricity (LCOE, in €·kWh−1) as the key criterion. This method estimates the break-even price a project needs to get paid per kWh generated in order to recoup its financing for a fixed rate of return [5]. In their work, Talavera et al. [6] proposed a pre-design decision tool for PV self-consumption systems that evaluates economic feasibility using standard financial metrics—Net Present Value (NPV, in €) and Internal Rate of Return (IRR, in %), among others—alongside cost competitiveness based on the LCOE. In their work, Liu et al. [7] conducted a techno-economic analysis of a PV system for a high-rise building in Hong Kong. Their analysis considered a comprehensive method for the calculation of LCOE, which comprises investment cost, maintenance cost, residual cost, transmission loss saving, network expansion saving and carbon reduction. In ref. [8], a techno-economic analysis was conducted to assess the feasibility of residential PV self-consumption in Peru. The analysis considered three key criteria: NPV, IRR and LCOE. This enabled an assessment of the cost competitiveness of the PV system in comparison to electricity tariffs. Wang et al. [9] presented a LCOE evaluation model of PV power generation—incorporating the impact of tradable green certificates (TGCs) on the economic viability of PV projects—in China applied to analyze the economic performance of PV power generation in various provinces of this country. The findings indicate that upon incorporating TGC schemes, the average LCOE of PV power generation decreases by 5.19%. Other studies rely on commercial simulation software to evaluate the LCOE of PV systems; for instance, Said et al. [10] utilized the Solar Advisor Model (SAM) to develop an improved financial framework, providing detailed LCOE modeling and analysis for PV power plants. Hirvonen et al. [11] analyzed self-consumption PV systems in single-family homes in Finland, also focusing on LCOE. Different heating technologies are compared, and thermal storage is considered as a strategy to improve self-consumption. The analysis shows that, with incentives and economies of scale, LCOE can compete with grid prices—especially in communities and in systems using electric heating. The profitability of PV systems for residential homes in Italy was evaluated in [12] by means of two indicators: NPV and LCOE, among others, which are applied to several studies that depend on three critical variables: plant size, solar irradiation levels and share of self-consumption. Several studies available in the literature [13,14] assess the competitiveness of systems with specific values of photovoltaic array DC power rating, yet they lack a clear rationale or established criteria for how those values were determined.
Accordingly, a growing body of literature examines the cost competitiveness of self-consumption PV systems. While LCOE remains a key parameter for evaluating utility-scale PV, it is widely acknowledged that LCOE alone is insufficient for assessing self-consumption competitiveness. Although some works, such as [15,16,17,18,19,20,21], include additional indicators such as NPV or IRR, these parameters are focused on evaluating the financial profitability of the investment and do not directly reflect cost competitiveness, which is the focus of this study. LCOE is a valuable tool for comparing the cost of generating electricity from PV with that of other technologies (wind, gas, coal, nuclear, etc.). At a first approximation, it suffices to evaluate PV cost competitiveness at the grid level by comparing the wholesale electricity price with the LCOE of PV. In contrast, self-consumption PV lacks such a parameter, as its competitiveness depends on user-specific conditions such as the share of PV electricity self-consumed, the portion exported to the grid, the amount imported from the grid, and time-of-use (TOU) pricing. In other words, unlike utility-scale PV, self-consumption PV lacks a metric that can be directly compared with the retail electricity price to determine its competitiveness from the user’s perspective. Therefore, this metric should express the cost per kWh of electricity consumed by the user over the system’s lifetime. Moreover, it should be expressed in a manner that allows for a proper comparison with retail electricity prices throughout the system life cycle.
In view of the above shortcomings exhibited by previous approaches, a novel method has been developed to assess the competitiveness of self-consumption PV systems. This method is based on a new model to calculate the unit cost of electricity consumed in a building equipped with a self-consumption PV system without storage, from the user’s point of view, by considering both technical parameters (e.g., load profile, array DC power rating, PV energy production, self-consumed and exported energy, energy drawn from the grid, PV system costs) and economic parameters (e.g., inflation, taxes, depreciation, electricity prices, cost of capital, and financing type). Next, the optimal array DC power rating of the system—assuming the orientation and tilt that maximize annual energy yield—is determined as the value of such array DC power rating that minimizes the aforementioned unit cost of electricity consumed in a building equipped with a PV self-consumption system without storage, from the user’s perspective. Then, this minimized unit cost is annualized by means of the capital recovery factor. Finally, the comparison of this annualized minimized unit cost of electricity from the user’s viewpoint with the final unit cost of electricity according to the regulated user determines the competitiveness of self-consumption PV systems. In such systems, the annualized minimized unit cost of electricity from the user’s perspective can be compared with the retail electricity price in each year of the system’s lifetime, since the former results from annualizing the minimized unit cost of electricity from the user’s standpoint.
To gain a better understanding of the implementation of the method, Colombia has been selected as a case study to illustrate how the proposed approach is applied. Additionally, self-consumption PV systems have not yet been widely deployed in this country; therefore, the comprehensive analyses of their competitiveness remain scarce and should be welcomed. The proposed method will be applied under various scenarios, specifically in the residential, commercial, and industrial segments, and across different locations in Colombia. In this work, the method demonstration focuses on cases with a flat tariff, given the lack of smart metering in the aforementioned sectors in Colombia. However, under TOU (time-of-use) rate schemes, the average unit cost of electricity drawn from the grid over the PV system useful life should be calculated and compared with the annualized minimized unit cost of electricity discussed above.
This document is structured as follows. Following the literature review of the criteria used to assess the cost competitiveness of self-consumption PV systems, presented in the current section, Section 2 outlines the novel methodology developed for this purpose. To demonstrate its implementation, Section 2 presents the data employed, including a review of the regulatory framework for PV energy production in Colombia. In addition, the characterization of electricity consumption profiles for the residential, commercial, and industrial segments are examined in this study, as well as the definition of reference cases along with their technical and economic parameters. Section 3 presents and discusses the results obtained. Finally, Section 4 presents the conclusions of the study and the policy implications derived from this work.
2. Materials and Methods
2.1. Introduction to a Novel Method for Assessing the Cost Competitiveness of Self-Consumption PV Systems
Before introducing the novel method for analyzing the cost competitiveness of self-consumption PV systems proposed in this work, two of the most widely used indices for evaluating the match between PV production and load consumption are reviewed. Specifically, these are the self-consumption and self-sufficiency indices (SCI and SSI, respectively), which may be written as shown in Equations (1) and (2):
where P(t) is the output power (AC) of the PV system (kW) and L(t) the load power consumption (kW). M(t) represents the instantaneous overlapping between P(t) and L(t), τ is the reporting period (s, h or y) [22,23]. EPVcon,τ is the self-consumed AC energy generated by a PV system—in which losses of power electronics have been taken into account—over τ (kWh); EPVgen,τ is the AC energy generated by a PV system over τ (kWh) and EL,τ corresponds to the load energy consumption over τ (kWh). Unless otherwise stated, SCI and SSI in the following discussion refer to the values of these parameters calculated over the full useful life of the PV system. The procedure to obtain the curves representing the SCI and SSI indices over the useful life of the PV system for PV self-consumption systems within a given range of array DC power rating values is shown in Figure 1. These curves can be used to assist in the optimal power sizing of PV self-consumption systems under certain premises of self-consumed energy and self-sufficiency, as shown hereafter. The calculation of the parameters EL, EPVcon and EPVgen is carried out at hourly resolution—although other time intervals may be used, of course—which allows for a detailed and accurate analysis of the system behavior. P0,ini and P0,fini are the lower and upper bounds, respectively, of the array DC power rating range within which its optimal value is determined (kWp). EPVcon,h, EPVgen,h and EL,h are the PV energy self-consumed (kWh), the AC energy generated by a PV system (kWh) and the load energy consumption (kWh), respectively, all estimated at 1-h intervals.
Figure 1.
Flowchart of the procedure used to estimate SSI and SCI for PV self-consumption systems for a given array DC power range.
The novel method proposed to assess the cost competitiveness of self-consumption PV systems is structured in three steps:
- Calculating the unit cost of electricity consumed in a building equipped with a PV self-consumption system, from the user’s point of view by means of a new model.
This innovative model takes into to account both technical (load profile, PV energy production, energy self-consumption and fed to the grid, energy from grid, costs of the PV system, etc.) and economic parameters (inflation, tax, depreciation, electricity price, cost of capital, funding sources, etc.) to obtain the unit cost of electricity consumed in a building equipped with a PV self-consumption system, from the user’s point (CEC, in €·kWh−1). The calculation of this parameter is given by Equation (3):
where PVC represents the PV system cost (€), N is the life cycle of the system (y), is the present worth of operation and maintenance cost over the system life cycle (€), represents the present worth of the cost of the energy consumption from the grid over the system life cycle (€), is the present worth of the revenues obtained from the PV energy fed into the grid over the system life cycle (€), is the present worth of money savings due to PV energy self-consumed over the system life cycle (€), represents the present worth of tax depreciation (€), is the depreciation period and is the load energy consumption of the building over the life cycle of the PV system (kWh).
The term PW[PVOM(N)] of Equation (3) can be written as Equation (4) [24,25]:
where PVAOM stands for the annual operation and maintenance expenditure (€) which is assumed to be constant over the life cycle of the system, this being yearly increased by the annual escalation rate of the operation and maintenance cost (rOM), T is the income tax rate and d is the nominal discount rate.
may be written as Equation (5) [26,27,28]:
where is the unit electricity price from the grid in the i-th hour (€·kWh−1); is the energy consumption from the grid in the i-th hour (kWh); is the number of hours in one year and rpfromgrid stands for the annual escalation rate of the electricity price from the grid.
The term of Equation (5) is given by Equation (6) [26,27,28]:
where represents the price of the PV electricity fed into the grid (€·kWh−1); is the PV energy generated that is fed to the grid in the i-th hour (kWh); rpPVtogrid stands for the annual escalation rate of the PV electricity price that is fed to the grid and is the performance loss rate of the PV system.
may be expressed as Equation (7) [26,27,28]:
where is the PV electricity price self-consumption in the i-th hour and represents the PV-generated energy that is used for self-consumption in the i-th hour (kWh).
The present worth of tax depreciation has been calculated using Equation (8) [24,25]:
where Dn is the annual depreciation for tax purposes (€), assumed linear and constant over the depreciation period (Nd). A maximum linear coefficient of 33.33% with = 3 years [29,30] was assumed for the commercial and industrial sector. This means that the annual tax depreciation for the PV system (Dn) has been calculated as .
Finally, the photovoltaic system cost is usually financed by means of debt or equity capital. In the case where the system cost PVC is financed through a loan (PVl)—debt—and the remainder by means of the issue of stocks (PVs)—equity capital—then PVC = PVl + PVs. According to the previous financing scheme, the photovoltaic system cost may be expressed as follows [22]:
The first term in square brackets of Equation (9) is related to the loan (PVl), i.e., the amount of the system cost that is borrowed at an annual interest (il) to be repaid in Nl years. A possible tax rate (T) influence is also included and q is equal to 1/(1 + d).
The last term in square brackets in Equation (9) represents the equity share (PVs), with an annual return in the form of dividends (ds) as compensation for the invested equity. This amount must be paid in full at the end of the system life cycle (N years).
The right-hand side of Equation (9) only equals its right-left side if the selected value of d is equal to the weight average cost of capital (WACC) of the investment, that is, the cost of the chosen financing.
In this study, the value of the nominal discount rate is assumed to be equal to the weighted average cost of capital (WACC), a widespread practice [22,31,32].
Once CEC has been defined mathematically, its difference from LCOE is clearer. LCOE is often sufficient for utility-level comparisons. In that setting, PV cost competitiveness can be assessed by comparing LCOE with the wholesale electricity price. However, CEC addresses a different question. It is tailored to the end user. Its calculation accounts for the share of PV electricity that is self-consumed, the portion exported to the grid, and the electricity imported from the grid. It also incorporates time-of-use (TOU) pricing and other user-specific consumption features over the PV system lifetime. This framework enables an annualized CEC value (defined below). That value represents, in nominal monetary units, the cost per kWh of electricity actually consumed by the user. It can then be compared with the retail electricity price to assess PV self-consumption systems’ competitiveness from the user’s perspective, since both are expressed in nominal terms. Ultimately, this is what matters to the user.
- 2.
- Optimizing the array DC power rating sizing of the PV self-consumption system.
When sizing self-consumption PV systems, one of the most relevant decisions is to correctly attribute the optimal array DC power rating in view of the demand profile considered. In this work, the power will be based on the previously developed model for the calculation of the unit cost of electricity consumed of a PV self-consumption system from the user’s perspective. Indeed, the array DC power rating sizing optimization criterion will be based on minimizing the unit cost of electricity consumed in a building equipped with a PV self-consumption system—assuming the orientation and tilt that maximize annual energy yield—from the user’s point of view. To this end, the following parameters will be computed for a given array DC power rating range: (a) the value of CEC across the specified array DC power rating range, (b) the optimal array DC power rating (P0,opt, in kW), which corresponds to the maximum power at standard test conditions (STC) of the PV generator that minimizes CEC (CEC,min, in €·kWh−1). This procedure is illustrated in Figure 2. In this regard, the annualized value of CEC,min (CEC,min,annualized, in €·kWh−1) will, for convenience, be referred to as the ‘user-minimized annualized unit cost of electricity’ from this point forward, and is expressed by Equation (10) [31]:
where EL,annual is the annual load energy consumption of the building over the life cycle of the PV system (kWh) and is obtained by means of EL,annual = EL/N. To annualize a value, it must be multiplied by the capital recovery factor (CRF). The CRF is defined as follows:
Figure 2.
Flowchart of the procedure used to estimate CEC,min and P0,opt for buildings equipped with a PV self-consumption system for a given array DC power rating range. The symbol “*” denotes the optimal DC power rating, corresponding to the minimum value of CEC.
Equation (10), the value to be annualized is and the result is then divided by to obtain , in €·kWh−1.
- 3.
- Comparing the user-minimized annualized unit cost of electricity with the unit cost of the electricity tariff.
At this point, the only remaining step is to compare the user-minimized annualized unit cost of electricity obtained in Step 2 with the final unit cost of the electricity tariff according to the regulated user (CunitFinal, in €·kWh−1). In this regard, if CEC,min,annualized < CunitFinal the self-consumption PV system is considered cost-competitive. Conversely, if CEC,min,annualized > CunitFinal it is not.
The calculation of most technical parameters shown in Figure 2 can be carried out using simulation tools such as SAM, PVsyst, or, more simply, PVGIS combined with a spreadsheet—the latter being the option selected by the authors, as described in detail in the specific case study presented in Section 2.2. Regarding the system’s life cycle, a duration of 25 or 30 years may be assumed. The performance loss rate of the system primarily depends on the PV technology used; however, a typical value of 0.5%·y−1 can be considered for state-of-the-art crystalline silicon PV systems. In the study by Louwen et al. [33], the initial and final array DC power ratings, in turn, depend on the specific self-consumption PV segment under investigation. The economic parameters presented in Figure 2 depend on the economic scenario in which the calculations are carried out.
The proposed method is readily applicable across countries due to the modular nature of the new model described above for calculating CEC and its ability to accommodate a broad range of technical and economic conditions. In particular, Equation (3) accounts for energy-, system-, and taxation-related costs, while the use of hourly input data (e.g., PV generation, consumption profiles, and electricity prices) allows the framework to reflect diverse tariff designs and regulatory settings. Therefore, although the case study presented hereafter—by way of example of how to apply this method—considers a single country with flat tariffs and no storage, the method can be directly extended to other contexts by substituting the corresponding inputs, such as time-of-use or dynamic tariffs, different surplus export remuneration schemes (net billing, net metering, or other compensation mechanisms). Of course, battery operation strategies and their associated costs may be considered, in a way that in all cases, cross-country differences are captured through the input values and scenario definitions rather than changes to the new model structure, enabling consistent assessments of self-consumption PV cost competitiveness under varied economic and regulatory conditions.
It is worth noting that, although the SCI and SSI are not direct inputs in the calculation of either CEC or CEC,min, both constitute key output metrics that characterize the performance of the optimal configuration. In this economic analysis, both indices act as diagnostic and visualization tools, enabling users, policymakers, and other stakeholders to assess the influence the array DC power rating exerts on the system behavior. For instance, oversizing the array DC power rating may increase SSI (i.e., higher self-sufficiency) but simultaneously decrease SCI. This would lead to greater energy export to the grid and, consequently, a higher CEC. The relationship between these parameters is illustrated in Section 3.
2.2. Demonstration of the Novel Method for Evaluating the Cost Competitiveness of Self-Consumption PV Systems: Case Study of Colombia
After presenting the novel approach to cost competitiveness of self-consumption PV systems in the previous section, Colombia is selected as a case study in which to apply it and demonstrate its practical implementation.
2.2.1. A Brief Overview of PV Self-Consumption in Colombia
Electricity demand has increased significantly in recent years in Colombia [34]. Laws 1715 of 2014 and 2099 of 2021 [29,35] regulate the integration of non-conventional renewable energy sources (RESs) into the National Interconnected System (NIS), including photovoltaic self-consumption, which operates under a net metering scheme defined in Law 1715. This scheme involves compensation offered by the grid operator to the owner of a self-consumption PV installation for injecting surplus energy into the grid. In this way, the user who engages in self-generation transforms from a consumer into a prosumer: an entity that actively participates in both the production and consumption of electricity [36,37,38,39].
In recent years, the Colombian electricity sector has been affected by a gradual increase in demand and a supply gap caused by extreme climatic events, such as the El Niño phenomenon. These conditions have had significant detrimental effects, particularly on hydropower, and are challenging the capacity of energy infrastructures to ensure a continuous supply. In response, the Colombian government implemented Resolution 174 of 2021 [40], which integrates distributed generation (DG) into the National Interconnected System (NIS). Under this framework, 1 MW represents the maximum photovoltaic capacity permitted within the DG regime. This limit is further reduced for small-scale PV systems, also classified under the DG regime, which are defined as systems with a PV capacity of less than 0.1 MW.
To conduct the present study, different segments such as residential, commercial, and industrial were selected for analysis. Several scenarios for each segment were evaluated in different locations across Colombia. Subsequently, a description of the type of prosumer is provided, characterizing their consumption, the hourly price of energy purchased from the grid, and the surplus energy fed to the grid. The purchase and sale prices of electricity were obtained from various power grid operators. The remaining technical and economic parameters involved in the new model for obtaining the unit cost of electricity consumed in a building equipped with a PV self-consumption system from the user’s perspective—as introduced in Section 2.1—are described below and estimated for the different scenarios considered in each sector under study.
2.2.2. PV Energy Production Estimation
The solar production profiles have been built with the PVGIS tool [41]. The PV energy production data used in this work consists of a value for every hour over a 1-year period. PV energy output is calculated from two sources, on the one hand, of the PV energy production data for each hour over a multi-year period, on the other hand, data from the typical meteorological year (TMY). All this data comes from the PVGIS tool, and the database used is shown in Table 1. The PVGIS-NSRDB dataset is provided by the National Renewable Energy Laboratory (NREL) and is part of the National Solar Radiation Database. For each specific month selected by PVGIS from the 2005–2015 period to generate the Typical Meteorological Year (TMY) for the site where the PV system will be installed, the corresponding month from the same period is utilized to determine the hourly AC output power values. These values are also derived using PVGIS, under the assumption that the output power remains constant throughout each hour. The calculations are based on a PV system with an array DC power rating of 1 kWp, resulting in 8760 hourly AC output power values. These values collectively represent a “typical yield year” (TYY0), corresponding to year 0. In doing so, a 1-year dataset of values of hourly values of final system yield representative of every site is built.
Table 1.
Solar radiation database used by the PVGIS tool for sites in Colombia.
The tilt and orientation of simulated self-consumption PV systems is optimized, and monofacial crystalline silicon (c-Si) PV modules are used. The estimated system losses cause the power actually delivered to the electricity grid to be lower than the power produced by the PV modules. There are several causes for this fact, such as ohmic losses in cables, inverter efficiency, soiling on the modules, etc. A default value of 14% for the overall losses was set in the analysis—excluded those losses caused by the angle of incidence (AOI), spectral effects, temperature and low irradiance. Additionally, information about the local horizon to estimate the effects of shadows from nearby hills or mountains is used in the calculation of PV systems output in PVGIS. Performance ratio typically ranges from 0.70 to 0.80 for conventional PV systems in warm climates [41].
The PVGIS-NSRDB dataset, provided by the National Renewable Energy Laboratory (NREL), is part of the National Solar Radiation Database (NSRDB) [42], which provides meteorological data corresponding to sites with values of latitude and longitude within which Colombia is located. This database provides detailed information on solar radiation, mainly used for research and development of photovoltaic systems. A comparison with other climate databases, such as Meteonorm and the meteorological database of NASA—known as the NASA POWER (Prediction of Worldwide Energy Resources)—was performed and it was found that PVGIS and Meteonorm showed a smaller difference in year-to-year variability, averaging 4.16% for the locations to be studied in what follows. Finally, it was decided not to use Meteonorm and NASA POWER due to their lower accuracy, especially in mountainous areas such as Colombia, since these databases provide synthetic data, as opposed to high-resolution temporal and spatial data publicly available through PVGIS.
2.2.3. Demand Profiles
To define representative demand profiles, three categories have been created corresponding to the residential, commercial and industry segments. The residential segment was divided into six types of profiles according to socio-economic criteria (stratum 1, stratum 2, stratum 3, stratum 4, stratum 5 and stratum 6), the commercial segment encompasses different retail profiles (commercial 1 and commercial 2); finally, the industry segment is characterized by means of two different profiles (Industry 1, Industry 2). All the demand profiles considered were accessed from real data provided by [34,43,44,45,46,47].
Residential Segment
The technique employed to derive a representative residential consumption profile for each of the six socio-economic strata involved the use of characteristic algorithms, such as Multidimensional Scaling (MDS) analysis [48]. This statistical method enables the graphical representation of data similarities, facilitating the visualization of relationships within the dataset. The procedure was carried out through the following steps. It begins with the extraction of average electrical energy consumption from large datasets, where the most characteristic consumption patterns are identified. This is performed for a sample of users belonging to the same socio-economic stratum across the different localities analyzed. Additionally, the influence of geographical factors, such as the temperature of the localities and the users’ activity calendar, has been examined. On the demographic side, the number of users comprising a family unit is also considered, with an average of 2.9 people per household, representing the typical size of a Colombian family [49].
As previously mentioned, six representative profiles were considered for the residential segment, categorized according to socioeconomic strata. The data were obtained from various sources [34,45,50,51,52]. Additionally, the allowance average hourly consumption profiles for a typical day for each stratum were provided by the Unified Information System of Public Utility Services of Colombia [53].
Due to the limited implementation of smart metering systems and advanced metering infrastructure (AMI) [54] among Colombian users, particularly in the residential segment, it is not possible to obtain hourly digitalized records of daily electricity consumption in kWh. Instead, only monthly consumption data collected through traditional meters—either electromechanical or electronic—are available. These monthly consumption records were randomly collected in groups of 30 users per socioeconomic stratum in each locality.
Using the MDS statistical method, the distribution that best reflected the behavior of 80% of the data was identified, allowing the necessary parameters to be obtained to construct a daily consumption curve. True, constructing hourly consumption profiles from monthly data, using MDS and representative patterns, entails inherent limitations. This approach tends to smooth short-term fluctuations and underestimate potential peak demand events, which may introduce bias in estimating SCI, SSI, and in optimizing the array DC power rating. A sensitivity analysis using alternative profiles with higher peak-hour concentration would likely show that, although absolute indicator values may vary, the overall trends and key conclusions remain consistent, though this issue warrants further investigation. Access to higher time-resolution data, such as that provided by smart meters, would help mitigate these limitations and represents an important direction for future research.
The generated daily consumption curves were compared with consumption profiles from various electricity companies, validating that the data accurately capture the real consumption behavior for each socioeconomic stratum. Once the consumption profile was verified, the average monthly electricity consumption for each month was determined. Subsequently, the average of these monthly values over the course of a year was calculated to obtain a single value representing the annual average global consumption for this segment.
The (a) and (b) panels of Figure 3 illustrate the annual average hourly electricity consumption profiles in the residential segment for a typical working day and a holiday, respectively, derived from the monthly average electricity consumption values presented in Table 2. In its calculation, the variability in the length of the months has been considered, including those of 28, 30 and 31 days, in order to ensure an accurate representation of consumption behavior throughout the year. Stratum 1 represents the consumption profile of a working couple who are only at home during nighttime, with an average annual demand of 1177 kWh/year. Stratum 2 depicts the consumption profile of a working couple with three children, who are present at home in the late afternoon and evening, with an average annual demand of 1427 kWh/year. Stratum 3 represents the profile of a working couple with two children, who have greater home presence during nighttime, with an average annual demand of 1625 kWh/year. Stratum 4 corresponds to the profile of a retired couple who are at home all day and only leave for brief, specific activities, with an average annual demand of 1909 kWh/year. Stratum 5 depicts the profile of a working couple with three children, where activities are split with half-day work at home, having an average annual demand of 2254 kWh/year. Finally, Stratum 6 represents a working couple with two children who have greater home presence during nighttime, with daytime presence of service personnel, and an average annual demand of 3211 kWh/year.
Figure 3.
Annual average hourly consumption profiles of a typical working day in the Colombian residential segment (a). Annual average hourly consumption profiles of a typical holiday in the Colombian residential segment (b).
Table 2.
Annual average monthly electricity consumption according to stratum for the residential segment in Colombia (data sourced from grid operators XM and DANE).
Although some aspects have been detailed earlier—implicitly in certain cases—it is worth summarizing that residential load profiles were constructed considering three key factors: household activity patterns, local temperature, and the number of residents. Typical daily schedules of Colombian households were derived from national time-use studies, capturing morning and evening consumption peaks associated with work, school, and meal times. Since residential heating demand is negligible in Colombia, temperature effects were mainly linked to the use of fans and air conditioners in warm regions and water heaters in colder areas, with profiles adjusted accordingly. The number of residents per household, obtained from DANE data, was incorporated as a scaling factor that proportionally increases demand and modifies the curve shape, as larger households tend to exhibit more extended appliance use. Together, these factors determined the shape and magnitude of the hourly load curves, ensuring that the resulting profiles accurately represent the diversity of residential conditions across Colombia.
Commercial and Industrial Segment
In the commercial segment, various groupings are considered. Average monthly consumption records are obtained from databases or provided by either users or electricity distribution companies. As in the residential segment, the average monthly consumption was calculated by dividing representative samples of average annual consumption by 12. Subsequently, the annual average daily consumption values were determined, considering the variability in the length of months, including those of 28, 30 and 31 days. This approach ensures an accurate and detailed representation of consumption behavior throughout the year. This annual average daily consumption was then distributed across the hours of the day following an average hourly pattern, designed according to the specific characteristics of commercial and industrial activities in the country. Such hourly patterns are provided by electricity retail companies.
Commercial Profile 1 encompasses retail businesses, where electricity consumption is primarily concentrated during daytime working hours, while remaining at baseline levels during nights and weekends. In contrast, Commercial Profile 2 corresponds to the services sector, which exhibits a similar consumption pattern on weekdays but tends to register higher levels during weekends and holidays.
Figure 4a illustrates a typical weekday and holiday for Commercial Profile 1, which corresponds to retail businesses operating a 9-h daytime shift plus 4 additional overtime hours, with an annual electricity demand below 2160 kWh/year. Commercial Profile 2—Figure 4b—represents restaurant chains located in shopping malls, operating for a 9-h daytime shift plus an additional 3 overtime hours, with an average annual demand of 8640 kWh/year.
Figure 4.
Annual average hourly consumption profiles of a typical business day and a typical holiday in the Colombian segment commercial (a) and industrial (b).
In the industrial sector, generating annual average hourly consumption profiles from annual monthly average consumption data is a more complex process due to the diversity inherent in this sector. Each industry exhibits unique characteristics in its production processes, operating schedules, and specific energy demands, which complicates the development of a standardized consumption profile. In this regard, for the classification of industries, various operational characteristics were considered. Regarding their size, two categories were assumed: small industries, with an assigned electrical capacity of 150 kVA in their transformation center, and medium-sized industries, with a capacity of 300 kVA. Concerning operating schedules, a distinction was made between those with a single work shift and those with rotating shifts, where productivity exhibits peak consumption during active hours and low or negligible levels outside this period. For this analysis, consumption profiles were divided into two categories: hourly profiles representing annual averages for weekdays and hourly profiles for annual averages on weekends and holidays, the latter reflecting lower electricity demand. These categories are represented by Industrial Profile 1 and Industrial Profile 2 showcasing variations in energy consumption according to economic activity.
Figure 4b, depicts the annual average hourly consumption profiles on working days and holidays within the industrial sector. The characterization of consumption in this sector is more complex due to the diversity of activities and operational patterns. In general terms, industry maintains a stable consumption profile during working days, with regular usage, while during public holidays it tends to be slightly lower. These profiles result from a clustering process based on 30 consumption patterns provided by users engaged in different economic activities. The clustering was carried out in two stages. First, analysis of demand and consumption patterns, where profiles were classified according to maximum hourly demand (kWh) and similarities in daily patterns obtained from annual data. In the second stage, segmentation by industry size where small- and medium-sized industries were differentiated to establish a representative consumption profile. To obtain the annual average hourly consumption for a typical working day and public holiday, the monthly average consumption was first calculated by dividing the annual average consumption by 12. Subsequently, the annual average daily consumption values were determined, taking into account the variability in the length of the months (28, 30 and 31 days). Finally, the annual average daily consumption was distributed among the hours of the day following an average hourly pattern, designed according to the specific characteristics of the industrial sector. Within this classification, two groups were identified, Industry 1 and Industry 2, with an average annual demand of 43,560 kWh/year and 210,000 kWh/year, respectively.
The use of aggregated monthly data and average hourly profiles for the commercial and industrial sectors entails certain limitations, as these do not capture facility-specific variability or demand peaks. In Colombia, access to detailed hourly data at the establishment level is limited due to the scarcity of disaggregated measurements. Nevertheless, this approach enables the characterization of general consumption patterns and the development of representative segment profiles, suitable for energy planning and aggregated scenario modeling. The results are not intended to replace site-specific analyses, which require direct measurements to reflect operational variability and peak demand behavior. The obtained profiles describe the average performance of these segments in Colombia, providing valuable insight for macro-level demand analysis, while future work should aim to expand the database with higher-resolution data to improve accuracy in specific industrial and commercial contexts.
In summary, the residential, commercial, and industrial load profiles developed in this Section capture the representative consumption behavior of each sector in Colombia, integrating both behavioral and climatic factors. Although based on aggregated and averaged data, the adopted approach provides a consistent framework for cross-sectoral comparison and for assessing PV self-consumption performance and economic feasibility. These profiles therefore serve as the analytical foundation for this Section, which presents the main results and discusses how sectoral consumption patterns influence the results obtained.
2.2.4. Cost Model Parameters
This study considers self-consumption PV systems, in which their surplus electricity generated is fed into the grid (EPVtogrid) and the owner of the PV system receives compensation from the grid operator based on regulated prices (pPVtogrid). The self-consumed electricity (EPVcon) is remunerated (saved) based on retail market prices pPVcon.
Currently, the cost of PV systems per kWp continues to decrease due to economies of scale and the learning curve of the main components in PV systems [55,56]. In the case of Colombia in 2022, the average cost of a PV system is shown in Table 3 [57,58,59]. In this study, the conversion rates of Colombian pesos and US dollars to euros are as follows: 1 EUR = 4471.68 COP, and 1 EUR = 1.0530 USD (annual average for 2022) [60,61].
Table 3.
Average cost of a self-consumption PV system in Colombia as a function of its array DC power rating.
Electricity prices pPVtogrid, pfromgrid and pPVcon depend on government regulations for self-consumption and the electricity market of each country. In Colombia, the electricity tariff composition is determined through a process regulated by the Energy and Gas Regulatory Commission (CREG, that stands for Comisión de Regulación de Energía y Gas, in Spanish), which involves six independent components: generation cost (CGen, in €·kWh−1), transmission cost (CTra, in €·kWh−1), distribution cost (CDis, in €·kWh−1), commercialization cost (CCom, in €·kWh−1), losses cost (CLoss, in €·kWh−1) and restrictions cost (CRes, in €·kWh−1). The CREG conducts periodic analyses to establish electricity tariffs by combining these six elements with other factors present in the national economy, such as Colombian market inflation, the source of electricity generation, or uncertainty due to environmental phenomena.
As shown hereafter, Cunit is involved in the calculation of the price charged for each unit of electricity consumed. The composition of the unit cost of the electricity tariff (Cunit, in €·kWh−1) is derived from the weighted average of the six components mentioned above, and is given by Equation (12).
The Cunit is updated dynamically according to supply and demand, based on economic price indices and regulations. The Consumer Price Index (CPI) or other region-specific indices track variations in the prices of goods and services. These indices allow for periodic cost adjustments to reflect general economic changes [62].
In Colombia, the cost of the electricity bill includes subsidies and contributions that regulated users either receive or contribute, based on their final unit cost of the electricity tariff according to the regulated user (CunitFinal, in €·kWh−1). This parameter is essential for calculating the total amount to be paid on an electricity bill, by multiplying the total consumption by CunitFinal [63]. The values of CunitFinal are determined in a stratified manner based on Cunit, as shown in Table 4 [64,65].
Table 4.
Final unit cost of the electricity tariff according to the regulated user (CunitFinal, in €·kWh−1).
To estimate the electricity prices involved in this study, data from the main grid operators—representing 61.7% of users connected to the National Interconnected System (NIS)—were used. Parameter CunitFinal in Colombia can vary according to different contracting models, specifically depending on who owns the physical assets (transformer, connection and meter). When the physical assets are owned by the grid operator, costs may be transferred to users in the form of a higher value of CunitFinal. For this study, the least favorable scenario for CunitFinal (physical assets owned by the grid operator) was chosen. The electricity prices of pfromgrid and pPVcon for the different segments under study were based on the value established by the grid operator in CunitFinal, as decreed by CREG Resolution 119 of 2007. The price for pPVtogrid was determined based on market prices [66,67,68,69,70].
In the different segments PV electricity surpluses fed to the grid may be paid according to the concept called hourly spot price of the electricity (PBol, in €·kWh−1), which refers to the price at which energy is traded; the PBol considers a balance point between the supply and demand of energy for each hour of the day. The price can vary significantly depending on factors such as the availability of energy resources and associated demand. The value of PBol, is set through a daily auction process known as the wholesale energy market (MEM, as the initials of Mercado de Energía Mayorista in Spanish) [71]. The average value for PBol during the period 2017–2022 was equivalent to 33.59% of Cunit [72]. Table 5 represents the process for the cases with and without energy surplus according to the array DC power rating, in order to establish the price of remuneration or payment for electricity, whether for self-consumption, surpluses or energy demand.
Table 5.
Unit remuneration and payment of electricity for PV self-consumption systems in Colombia (Resolution 174 of 2021, CREG). N.B: are the monthly PV-generated electricity fed into the grid and the monthly electricity taken from the grid, respectively (kWh).
The percentage PBol [72] exhibits variations from year to year according to extreme meteorological phenomena such as the “La Niña” or “El Niño” phenomena, mainly due to Colombia’s energy matrix which is mostly based on hydroelectricity. The annual escalation rate of the electricity price from the grid (rpfromgrid) is linked to the evolution of the electricity markets and it is difficult to predict its value. Based on the evolution of electricity prices in Colombia’s regulated market, data from nine annual periods (2015–2023) were analyzed [73,74]. Considering these data series, an average year-on-year variation of 1.31% has been assumed for Cunit in all subsequent calculations.
In general, the cost of the PV system can present mixed financing, as outlined in the United Nations report [75]. This financing primarily consists of debt and equity capital. For the entire residential sector, the financing will be 100% of the investment cost (PVC) with own resources. In commercial sectors and industrial sectors, long-term debt financing is referenced, composed of a loan (PVl, in €) with an average amount of 42.5% of the investment cost (PVC) [76] for the period 2008–2023. The remaining 57.5% of the investment cost is financed through equity capital (PVs, in €). In less stable economies like Colombia, banks tend to accept lower leverage, making property rights a crucial resource when granting loans—particularly in the commercial and industrial sectors. The guarantee of property rights serves as a key factor in ensuring protection and minimizing the risk of loss for the banking sector [77,78]. The loan interest rate (il) is set at 9.11% [79] with an amortization period (Nl, in years) of 10 years [80,81]. Regarding equity capital, the annual dividend of the equity capital (ds) is set equal to 15.16% [82,83], which is the average value during the period 2000–2021 in the commercial and industrial sectors. For the residential sector, over the period 2017–2021, an average value of 4.81% is considered for ds. This value is determined based on three key parameters, indicating the correlation or significant statistical measure between different economic indicators, such as the consumer price index (CPI), the deposit facility rate (DFT) and the time deposit certificates (TDCs) [84,85,86,87].
As previously discussed in this study, the nominal discount rate is assumed to be equivalent to the weighted average cost of capital (WACC) for calculating the cost of electricity consumed from the perspective of the user, generated in a building equipped with a PV self-consumption system.
This capital cost will vary depending on how the capital resources are chosen to finance the PV system cost. The income tax rate (T) for the organization or taxpayer varies depending on each country’s regulations. Specifically, in Colombia, this tax showed an average value of 35.29% for the period 2003–2023 [88]. Typically, an annual performance loss rate of 0.5%·y−1 is assumed during the PV system useful life [89,90,91]. Indeed, this rate of performance decline is considered representative of crystalline-silicon-based PV systems, the technology that dominates the market—98% in 2024 [92]. However, if other PV materials were considered in the analysis presented in this work, the assumed PLR value should be adjusted accordingly. In this context, and by way of example, it is worth noting a recent and valuable study by Wu et al. [93] on commercializing perovskite solar cells as a promising and emerging PV technology. Nevertheless, further research is needed to estimate reliable PLR values for this PV material [93]. Regarding the annual inflation rate (g, in %), an average value of g = 4.3% has been considered for Colombia, based on data from the period 2008–2022 [94,95].
The annual operation and maintenance costs (PVAOM) should be considered as the percentage of PVC spent on operation and maintenance tasks on an annual basis. In this case, it has been considered 1.5% of PVC [6]. Additionally, these costs will also be increased year-on-year by an annual escalation rate (rOM). This latter parameter is set equal to the value of the inflation rate, so that rOM = 4.3%.
In this sense, the values assumed for every parameter that defines the proposed study cases (five Colombian cities) are gathered in Table 6. Parameters and are equal to CunitFinal and parameter is set equal to and .
Table 6.
Assumed values of technical and economic parameters for the proposed cases of study.
In Colombia, the residential and commercial segments do not operate under peak and off-peak hours but rather under a fixed electricity rate, as shown in Table 6. As discussed earlier, this is due to the absence of smart metering systems. TOU metering is applied only in the industrial segment, specifically for facilities with high energy demand and power ratings exceeding 55 kW, which are connected to the grid at medium voltage greater than 1 kV. The present study, however, focuses exclusively on companies operating at voltages up to 1 kV.
3. Results and Discussion
In this section, the novel method described in Section 2.1 is used to determine the optimal array DC power rating, by minimizing the unit cost of electricity consumed from the user’s point of view (CEC,min); then annualized, for each case of study in the residential, commercial, and industrial segments. Additionally, SCI and SSI are calculated according to Equations (1) and (2).
This investigation will be conducted in five locations in Colombia: Medellín, Bogotá, Cúcuta, Barranquilla, and Cali. For each location, 10 cases will be analyzed: 6 in the residential segment, 2 in the commercial segment, and 2 in the industrial segment. The values of the parameters involved in each case study of the mentioned segments are shown in Table 6, with the demand profiles described in Sections Residential Segment and Commercial and Industrial Segment.
Figure 5a graphically illustrates the procedure for the calculation of the optimal array DC power rating for self-consumption PV systems corresponding to the location of Medellín, in northwest Colombia, and the residential segment, stratum 3. This example serves to illustrate the procedure applied to all case studies across the five cities under investigation. In this specific case of study, the optimal array DC power rating was found to be equal to 1.9 kWp, which corresponds to the minimum CEC value (CEC,min) of 3.81 c€·kWh−1, which in turn corresponds to a value of CEC,min,anuualized of 6.65 c€·kWh−1, according to Equation (9). Its SCI and SSI indices equal 24% and 41%, respectively. In this case, CEC,min,anuualized is far lower than pfromgrid (CunitFinal), which equals 11.73 c€·kWh−1. This makes the unit cost of electricity from the the user’s point of view utilizing a self-consumption PV system competitive in comparison to grid electricity prices.
Figure 5.
Values of SCI, SSI and CEC,min as a function of the DC array power rating for Medellín (northwest Colombia) in stratum 3 (residential segment). The red symbol “*” indicates the values of SCI, SSI and CEC corresponding to the optimal array DC power rating (a). Values of optimal array DC power rating calculated for self-consumption PV systems across the groupings inside the segments studied for the five locations investigated (b).
The results presented in Figure 5b indicate that, for the six strata analyzed in the residential segment, the optimal array DC power rating values across the different locations, ranked from highest to lowest, correspond to Barranquilla, Cali, Medellín, Cúcuta, and Bogotá. This can be attributed primarily to the values of annual average horizontal irradiation (Ha (0), in kWh·m−2), combined with the absence of a cap on the amount of remunerated electricity fed into the grid. Such values of Ha (0) are 2024 kWh·m−2 in Barranquilla, 1936 kWh·m−2 in Cali, 1863 kWh·m−2 in Medellín, 1802 kWh·m−2 in Cúcuta, and 1655 kWh·m−2 in Bogotá. Within the residential segment, a comparison across strata shows that the range of variation in the optimal array DC power rating is 0.9, 1.1, and 1.7 kWp for strata 1, 2, and 3, respectively, while in stratum 4, it increases to 2.0 kWp. In the upper strata 5 and 6, the optimal array DC power rating varies by 2.4 and 3.9 kWp, respectively. These differences are attributed to the underlying consumption profiles, with stratum 6 exhibiting the highest consumption and stratum 1 the lowest. Regarding the commercial segment, the consumption profiles peak coincides significantly with the higher electricity generation hours of the PV system. For commercial case 1, the values of P0,opt closely match for all the locations studied, varying by a maximum of 0.1 kWp between them. For commercial case 2, which presents a higher consumption profile, the differences in P0,opt do not exceed 0.5 kWp between the locations under scrutiny with the lowest and highest values of this parameter corresponding to Barranquilla and Bogotá, respectively, which also represent the locations with the highest and lowest solar resource, respectively.
In the industrial segment, for case Industry 1, representing an industry with a single daytime shift, values found for P0,opt lie within 33 and 37 kWp for the locations studied. For industry case 2, which represents an industry with a workday distributed over two shifts, the matching between generation and consumption is less favorable compared to Industry Case 1. In this scenario, the largest difference in P0,opt values is observed between Barranquilla and Bogotá, amounting to 8 kWp. As observed in the industrial segment, the lowest and highest values of this parameter correspond to Barranquilla and Bogotá, respectively. This is again consistent with their solar resource levels—Barranquilla having the highest and Bogotá the lowest—and the absence of a cap on remunerated electricity fed into the grid in Colombia.
Figure 6 illustrates the SCI and SSI values obtained in this study for a building equipped with a self-consumption PV system—sized according to the optimal DC power rating shown in Figure 5b—within each grouping across the different segments. In Figure 6a strata 1 and 2 groupings in the residential sector display the highest values of SCI, whereas these strata exhibit low values of SSI, as shown in Figure 6b. This is due to their relatively low optimal array DC power rating, which ranges from 0.5 to 1.9 kWp. Strata 5 and 6 in the residential sector exhibit the lowest SCI values, while simultaneously showing the highest SSI percentages. This is primarily due to their higher optimal array DC power ratings, which range from 2.2 to 7.2 kWp—values that help offset their higher energy consumption profiles compared to those of the lower strata. In the commercial segment, commercial groupings 1 and 2 exhibit similar and higher SCI (54–56%) and SSI values (57–65%). This is due to the fact that a large part of their consumption is diurnal, coinciding with photovoltaic generation, and their P0,opt values do not vary by more than 0.5 kWp for each grouping. In the industrial segment, Industry 1 grouping exhibits higher SSI values compared to those of Industry 2. This discrepancy is largely attributed to the extended working hours in Industry 2, leading to a more pronounced mismatch between PV energy generation and the consumption profile.
Figure 6.
Values of SCI (a) and values of SSI (b), calculated for self-consumption PV systems—sized according to the optimal array DC power rating shown in Figure 5b—across the groupings inside the segments studied for the five locations investigated.
Overall, the location of Bogotá shows the highest SCI values, while Barranquilla presents the lowest SCI values in almost all study cases. Regarding SSI, Barranquilla and Cali exhibit the highest values across all segments, ranging from 42% to 72%, with Cúcuta and Medellín positioned as the third location with the highest SSI values within the residential segment. Interestingly, Bogotá exhibits the lowest values of SSI across all segments.
Figure 7a shows the results obtained for the user-minimized annualized unit cost of electricity (CEC,min,annualized) obtained by the method presented in this work. As discussed before, this parameter represents a constant value of CEC,min over the PV system’s useful life. In the residential segment, across most socioeconomic strata, Bogotá shows the highest values of the former parameter, while Barranquilla presents the lowest, ranging from 3.66 to 8.28 c€·kWh−1 across the six strata investigated. Additionally, values of CEC,min,annualized are lower than those of the final unit cost of the electricity tariff according to the regulated user (CunitFinal) across all strata, thus making self-consumption PV systems—sized with P0,opt—cost-competitive in the residential segment.
Figure 7.
Values of CEC,min,annualized (a) and values of LCOE (b), calculated for buildings equipped with self-consumption PV systems—sized according to the optimal array DC power rating shown in Figure 5b—across the groupings inside the segments studied for the five locations investigated.
In the commercial 1 grouping, the following rank emerges when ordering the locations from highest to lowest values of CEC,min,annualized: Bogotá, Medellín, Cúcuta, Barranquilla, and Cali, this parameter ranging from 4.49 to 8.85 c€·kWh−1. In the commercial 2 grouping, the following rank emerges when ordering the locations from highest to lowest values of CEC,min,annualized: Bogotá, Cúcuta, Medellín, Barranquilla, and Cali, this parameter ranging from 3.22 to 7.48 c€·kWh−1. In the industrial segment, ordering the locations from highest to lowest CEC,min,annualized value, the following rank becomes apparent: Bogotá, Medellín, representing the highest values, while Cali in Industry 1 and Barranquilla in Industry 2 groupings exhibit the lowest values of 0.35 and 6.11 c€·kWh−1, respectively. The notably low values of CEC,min,annualized for both the commercial and industrial segments are mainly due to the relatively high values of SCI and SSI. This fact makes the present worth of money savings due to PV energy self-consumed (PW[CEPVcon]) significantly contribute to reducing CEC,min. Moreover, the inclusion of taxes (T) means that the value of tax depreciation also contributes to reducing CEC,min. In both commercial and industrial segments, the CEC,min,annualized values are lower than those of final unit cost of the electricity tariff according to the regulated user (CunitFinal) in the five groupings studied inside these segments, thus making self-consumption PV systems cost-competitive.
It should be noted again that the regulatory framework for self-consumption PV systems in Colombia does not limit the surplus energy (EPVtogrid) that can be injected into the grid. Therefore, the term PW[CEPVtogrid (N)] can significantly affect the reduction in CEC. This fact, along with those previously mentioned, contributes to the value of this parameter approaching zero, as observed in the case of Industry 1 in one of the five locations investigated, namely Cali.
Figure 7b, depicts the values of LCOE in the case studies analyzed in this paper, following the methodology of previous works [96]. These values are presented for illustrative purposes only, to demonstrate that, in general, CEC,min,annualized is significantly lower than LCOE for strata 1, 2 and 6 of the residential segment, for Commercial 1 and 2 groupings of the commercial segment, as well as for the Industry 1 grouping of the industrial segment. In fact, it is lower across all groupings in the three aforementioned strata at the five locations under analysis.
It is important to note that the criterion of PV self-consumption competitiveness has been redefined in this study, excluding considerations related to the LCOE. Thus, according to the novel method presented in this work, a self-consumption PV system is considered competitive when the annualized minimized unit cost of electricity from the user’s perspective is lower than the final unit cost according to the regulated user, i.e., CEC,min,annualized < pfromgrid = CunitFinal. In this regard, a comparison between Table 6 and Figure 7a clearly shows that, according to the novel model proposed in this study, PV self-consumption systems are cost-competitive across all strata, as CEC,min,annualized < CunitFinal consistently holds. For the commercial and industrial segments, both CEC,min,annualized—as discussed earlier— and LCOE values also remain below those of CunitFinal. In summary, this study demonstrates that self-consumption PV systems are cost-competitive in all segments analyzed across the five studied locations in Colombia, even in socioeconomic strata 1, 2, and 3, where electricity prices are relatively low.
4. Conclusions
The assessment of the cost competitiveness of self-consumption PV systems is essential to foster the uptake of this decentralized approach to clean electricity generation. However, this assessment is significantly more complex than at the utility scale, where the levelized cost of electricity (LCOE) is widely used to evaluate grid parity and, by extension, competitiveness. In the context of self-consumption, LCOE alone is insufficient to capture the full economic performance of PV systems, as it does not account for user-specific dynamics. This study proposes a novel method to evaluate the cost competitiveness of self-consumption PV systems, addressing the limitations of traditional LCOE metrics. By integrating technical, environmental, and economic parameters, the proposed model identifies the optimal PV array size that minimizes the user-minimized annualized unit cost of electricity, enabling a direct and reliable comparison with regulated retail tariffs. In this regard, the user-minimized annualized unit cost of electricity represents the average cost—in nominal euros per kWh—of the electricity consumed over the system life cycle and can be directly compared with the average retail electricity cost for the same period, as both are expressed in nominal terms.
To demonstrate its applicability, the proposed method was applied to five representative locations in Colombia (Bogotá, Medellín, Cúcuta, Cali, and Barranquilla). The analysis evaluated ten distinct study cases per location, encompassing residential, commercial, and industrial profiles. Each case was individually analyzed based on its specific energy tariffs and consumption patterns, alongside the calculation of self-consumption and self-sufficiency indexes. The results confirm that self-consumption PV systems, when sized according to the proposed method, are cost-competitive across all studied cases, as the user-minimized annualized unit cost of electricity consistently falls below the regulated retail tariff. Furthermore, the commercial and industrial segments exhibit the most favorable economic outcomes, primarily driven by their high self-consumption and self-sufficiency indexes, applicable tax depreciation benefits, and favorable regulations permitting unrestricted surplus energy sales to the grid.
Due to its modular structure, the proposed method is highly transferable across countries, requiring only local input data—such as tariffs and compensation schemes—to adapt to diverse regulatory and economic conditions. This universal applicability provides a robust framework for policymakers, investors, and end users to evaluate how specific support mechanisms, technological advancements, and market landscapes impact the cost competitiveness of self-consumption PV systems, ultimately fostering broader engagement in the clean energy transition.
Future research should expand the proposed model to incorporate economic profitability analyses, including metrics such as Net Present Value (NPV), Internal Rate of Return (IRR), and discounted payback period (DPBT). Providing these highly sought-after financial indicators to potential investors will further accelerate the deployment of self-consumption PV systems, particularly in regions where adoption remains low.
Author Contributions
Methodology, data curation, software, investigation, formal analysis, validation, writing—original draft, F.A.S.-V.; conceptualization, supervision, methodology, data curation, validation, writing—review and editing, D.L.T.; methodology, writing—review and editing, L.M.; conceptualization, supervision, methodology, validation, writing—review and editing, G.N. All authors have read and agreed to the published version of the manuscript.
Funding
This research did not receive any specific grant from funding agencies in the public, commercial, or not-for-profit sectors.
Institutional Review Board Statement
Not applicable.
Informed Consent Statement
Not applicable.
Data Availability Statement
The original data presented in the study are openly available in Input dataset for assessing the cost competitiveness of self-consumption photovoltaic systems at https://doi.org/10.5281/zenodo.18011623.
Acknowledgments
Declaration of Generative AI and AI-Assisted Technologies in the Writing Process: During the preparation of this work the authors used ChatGPT (OpenAI, GPT-5.2, 2026) in the writing process to improve the readability and language of the manuscript. After using this tool/service, the authors reviewed and edited the content as needed and take full responsibility for the content of the published article.
Conflicts of Interest
The authors declare that they have no known competing financial interests or personal relationships that could have appeared to influence the work reported in this paper.
Abbreviations
The following abbreviations are used in this manuscript:
| AMI | Advanced Metering Infrastructure. |
| AOI | Angle of incidence (º). |
| CEC | Unit cost of electricity consumed from the user’s point of view (€·kWh−1). |
| CEC,min | Minimized unit cost of electricity consumed from the user’s point of view (€·kWh−1). |
| CEC,min,annualized | Annualized minimized unit cost of electricity consumed from the user’s viewpoint, termed ‘user- minimized annualized unit cost of electricity’, for convenience (€·kWh−1). |
| CCom | Commercialization cost (€·kWh−1). |
| CDis | Distribution cost (€·kWh−1). |
| CGen | Generation cost (€·kWh−1). |
| CLoss | Losses cost (€·kWh−1). |
| CRes | Restriction’s cost (€·kWh−1). |
| CTra | Transmission cost (€·kWh−1). |
| Cunit | Unit cost of the electricity tariff (€·kWh−1). |
| CunitFinal | Final unit cost of the electricity tariff according to the regulated user (€·kWh−1). |
| CPI | Consumer price index. |
| d | Nominal discount rate (%). |
| DFT | Deposit facility rate. |
| DG | Distributed Generation. |
| Dn | Annual depreciation for tax purposes (€). |
| ds | Annual dividend of the equity capital/return on equity (%). |
| Energy consumption from the grid (kWh). | |
| Monthly photovoltaic electricity taken from the grid (kWh). | |
| EL | Load energy consumption of the building over the life cycle of the PV system (kWh). |
| EL,annual | Annual load energy consumption of the building over the life cycle of the PV system (kWh). |
| EL,τ | Load energy consumption over τ (kWh). |
| EPVcon,τ | Self-consumed AC energy generated by a PV system over τ (kWh.) (kWh). |
| EPVgen,τ | AC energy generated by a PV system over τ (kWh). |
| Photovoltaic electricity fed into the grid (kWh). | |
| Monthly photovoltaic electricity fed into the grid (kWh). | |
| g | Annual inflation rate (%). |
| il | Annual loan interest (%). |
| L(t) | Load power consumption (kW). |
| LCOE | Levelized Cost of Electricity (€·kWh−1). |
| M(t) | Photovoltaic power consumed (kW). |
| NIS | National Interconnected System. |
| N | Life cycle of the PV system (years). |
| Nd | Depreciation period (years). |
| Nl | Amortization of loan (years). |
| NO | Network Operator. |
| P0 | Array DC power rating (kWp). |
| P0, ini | Lower bound of the array DC power rating range within which its optimal value is determined (kWp). |
| P0,fini | Upper bound of the array DC power rating range within which its optimal value is determined (kWp). |
| i-th value of the array DC power rating within the range from P0,ini and P0,fini. | |
| i + 1-th value of the array DC power rating within the range from P0,ini and P0,fini. | |
| P0,opt | Optimal array DC power rating (kWp). |
| Pbol | Hourly spot price of the electricity tariff (€·kWh−1). |
| P(t) | AC output power (kW). |
| Price of electricity from the grid (€·kWh−1). | |
| Price of electricity self-consumed (€·kWh−1). | |
| Price of electricity fed into the grid (€·kWh−1). | |
| PLR | Performance loss rate (%·y−1). |
| PR | Performance ratio (%). |
| PV | Photovoltaic(s). |
| PVAOM | Annual operation and maintenance cost of a PV system (€). |
| PVC | Photovoltaic system cost (€). |
| PVl | Amount equal to the portion of the PV system cost financed with a loan (€). |
| PVs | Amount equal to the portion of the PV system cost financed with equity capital (€). |
| Present worth of the energy cost consumption from the grid (€). | |
| Present worth of the savings due to photovoltaic energy that is self-consumed (€). | |
| Present worth of revenues generated from photovoltaic energy fed into the grid (€). | |
| PW [DEP (Nd)] | Present worth of the tax depreciation (€). |
| PW[PVOM (N)] | Present worth of the PV system operation and maintenance cost (€). |
| Annual escalation rate of the operation and maintenance cost of a PV system (%). | |
| rpfromgrid | Annual escalation rate of the electricity price from the grid (%). |
| rpPVcon | Annual escalation rate of self-consumed electricity price (%). |
| rpPVtogrid | Annual escalation rate of the price of electricity fed into the grid (%). |
| SCI | Self-consumption index (%). |
| SSI | Self-sufficiency index (%). |
| T | Income tax rate (%). |
| TDC | Time deposit certificate. |
| WACC | Weighted average cost of capital (%). |
| ΔP | Array DC power rating increase (kWp). |
| τ | Reporting period (day, month, year). |
References
- Marcuzzo, R.; Silberg, T.R.; Uriona-Maldonado, M. Growth of Residential Solar Energy in Brazil: A System Dynamics Approach. Renew. Sustain. Energy Rev. 2025, 215, 115582. [Google Scholar] [CrossRef] [Scilit]
- Associação Brasileira de Energia Solar Fotovoltaica. Photovoltaic Solar Energy Brazil Infographic ABSOLAR. Available online: https://zenodo.org/records/18741580 (accessed on 7 September 2025).
- International Renewable Energy Agency Renewable. Capacity Statistics 2024. Available online: https://www.irena.org/Publications/2024/Mar/Renewable-capacity-statistics-2024 (accessed on 7 September 2025).
- Barrero, A.F.; Federal Electricity Commission (CFE). Self-Consumption Soars in Mexico. Available online: https://www.energias-renovables.com/autoconsumo/el-autoconsumo-se-dispara-en-mexico-20241225 (accessed on 7 September 2025).
- Darling, S.B.; You, F.; Veselka, T.; Velosa, A. Assumptions and the levelized cost of energy for photovoltaics. Energy Environ. Sci. 2011, 4, 3133–3139. [Google Scholar] [CrossRef] [Scilit]
- Talavera, D.L.; Muñoz-Cerón, E.; de la Casa, J.; Lozano-Arjona, D.; Theristis, M.; Pérez-Higueras, P.J. Complete Procedure for the Economic, Financial and Cost-Competitiveness of Photovoltaic Systems with Self-Consumption. Energies 2019, 12, 345. [Google Scholar] [CrossRef] [Scilit]
- Liu, J.; Wang, M.; Peng, J.; Chen, X.; Cao, S.; Yang, H. Techno-Economic Design Optimization of Hybrid Renewable Energy Applications for High-Rise Residential Buildings. Energy Convers. Manag. 2020, 213, 112868. [Google Scholar] [CrossRef] [Scilit]
- Espinoza, R.; Muñoz-Cerón, E.; Aguilera, J.; de la Casa, J. Feasibility Evaluation of Residential Photovoltaic Self-Consumption Projects in Peru. Renew. Energy 2019, 136, 414–427. [Google Scholar] [CrossRef] [Scilit]
- Wang, C.; Chen, H.; Wang, Z.; Gao, Y.; Zhang, G. Economic Assessment and Grid Parity Analysis of Photovoltaic Power Generation Considering Tradable Green Certificate. Appl. Energy 2025, 382, 125282. [Google Scholar] [CrossRef] [Scilit]
- Said, M.; EL-Shimy, M.; Abdelraheem, M.A. Photovoltaics Energy: Improved Modeling and Analysis of the Levelized Cost of Energy (LCOE) and Grid Parity—Egypt Case Study. Sustain. Energy Technol. Assess. 2015, 9, 37–48. [Google Scholar] [CrossRef] [Scilit]
- Hirvonen, J.; Kayo, G.; Hasan, A.; Sirén, K. Zero Energy Level and Economic Potential of Small-Scale Building-Integrated PV with Different Heating Systems in Nordic Conditions. Appl. Energy 2016, 167, 255–269. [Google Scholar] [CrossRef] [Scilit]
- Cucchiella, F.; D’Adamo, I.; Gastaldi, M. Economic Analysis of a Photovoltaic System: A Resource for Residential Households. Energies 2017, 10, 814. [Google Scholar] [CrossRef] [Scilit]
- Schopfer, S.; Tiefenbeck, V.; Staake, T. Economic Assessment of Photovoltaic Battery Systems Based on Household Load Profiles. Appl. Energy 2018, 223, 229–248. [Google Scholar] [CrossRef] [Scilit]
- Kästel, P.; Gilroy-Scott, B. Economics of Pooling Small Local Electricity Prosumers—LCOE & Self-Consumption. Renew. Sustain. Energy Rev. 2015, 51, 718–729. [Google Scholar] [CrossRef] [Scilit]
- Carvalho, J.P.; Lopes, E.B.; Santos, J.B.; Monteiro, J.; Cabrita, C.; Pacheco, A. Comparative Viability of Photovoltaic Investments Across European Countries Using Payback Periods and the Levelized Cost of Energy. Energies 2025, 18, 4676. [Google Scholar] [CrossRef] [Scilit]
- Shand, J.; Glakpe, E.; Ivey, C. Policy Implications of Implementing Residential PV Solar Energy Systems in Developing Regions. Energy Policy 2025, 196, 114414. [Google Scholar] [CrossRef] [Scilit]
- Vilaça Gomes, P.; Knak Neto, N.; Carvalho, L.; Sumaili, J.; Saraiva, J.T.; Dias, B.H.; Miranda, V.; Souza, S.M. Technical-Economic Analysis for the Integration of PV Systems in Brazil Considering Policy and Regulatory Issues. Energy Policy 2018, 115, 199–206. [Google Scholar] [CrossRef] [Scilit]
- Vargas-Salgado, C.; Aparisi-Cerdá, I.; Alfonso-Solar, D.; Gómez-Navarro, T. Can Photovoltaic Systems Be Profitable in Urban Areas? Analysis of Regulation Scenarios for Four Cases in Valencia City (Spain). Sol. Energy 2022, 233, 461–477. [Google Scholar] [CrossRef] [Scilit]
- Cortés, D.; Albarracín, R.D.; Portnoy, I.; Torregroza-Espinosa, A.C.; Atencio, F. Assessing the Economic Feasibility and Competitiveness Analysis of Photovoltaic Solar Power in the Colombian Caribbean Based on NASA’s Satellite Data. Procedia Comput. Sci. 2024, 251, 789–794. [Google Scholar] [CrossRef] [Scilit]
- Shufian, A.; Fattah, S.A. Integrated Rooftop Solar PV-Based Residential Advanced Energy Management System: An Economic Involvement of Energy Systems for Prosumers. Clean. Energy Syst. 2024, 9, 100150. [Google Scholar] [CrossRef] [Scilit]
- Alıç, O. A Holistic Techno-Economic Feasibility Analysis of Residential Renewable Energy Systems: An Insight into Turkish Case. J. Energy Storage 2024, 94, 112433. [Google Scholar] [CrossRef] [Scilit]
- Jiménez-Castillo, G.; Muñoz-Rodriguez, F.J.; Rus-Casas, C.; Talavera, D.L. A New Approach Based on Economic Profitability to Sizing the Photovoltaic Generator in Self-Consumption Systems without Storage. Renew. Energy 2020, 148, 1017–1033. [Google Scholar] [CrossRef] [Scilit]
- Luthander, R.; Widén, J.; Nilsson, D.; Palm, J. Photovoltaic Self-Consumption in Buildings: A Review. Appl. Energy 2015, 142, 80–94. [Google Scholar] [CrossRef] [Scilit]
- Micheli, L.; Talavera, D.L.; Marco Tina, G.; Almonacid, F.; Fernández, E.F. Techno-Economic Potential and Perspectives of Floating Photovoltaics in Europe. Sol. Energy 2022, 243, 203–214. [Google Scholar] [CrossRef] [Scilit]
- Fernández Solas, Á.; Riedel-Lyngskær, N.; Hanrieder, N.; Norde Santos, F.; Wilbert, S.; Nygard Riise, H.; Polo, J.; Fernández, E.F.; Almonacid, F.; Talavera, D.L.; et al. Photovoltaic Soiling Loss in Europe: Geographical Distribution and Cleaning Recommendations. Renew. Energy 2025, 239, 122086. [Google Scholar] [CrossRef] [Scilit]
- Micheli, L.; Talavera, D.L. Economic Feasibility of Floating Photovoltaic Power Plants: Profitability and Competitiveness. Renew. Energy 2023, 211, 607–616. [Google Scholar] [CrossRef] [Scilit]
- Micheli, L.; Sepúlveda-Vélez, F.A.; Talavera, D.L. Impact of Variable Economic Conditions on the Cost of Energy and the Economic Viability of Floating Photovoltaics. Heliyon 2024, 10, e32354. [Google Scholar] [CrossRef] [Scilit]
- Micheli, L.; Soria-Moya, A.; Talavera, D.L.; Abbasi, B.; Fernández, E.F. Energy and Economic Implications of Photovoltaic Curtailment: Current Status and Future Scenarios. Sustain. Energy Technol. Assess. 2025, 81, 104414. [Google Scholar] [CrossRef] [Scilit]
- Congress of the Republic of Colombia. Law 2099 of 2021. Available online: https://www.funcionpublica.gov.co/eva/gestornormativo/norma.php?i=166326 (accessed on 9 October 2023).
- Ministry of Foreign Affairs Colombia. Amortisation of Investments. Available online: https://www.cancilleria.gov.co/sites/default/files/Normograma/docs/pdf/estatuto_tributario_pr006.pdf (accessed on 16 September 2023).
- Short, W.; Packey, D.J.; Holt, T. A Manual for the Economic Evaluation of Energy Efficiency and Renewable Energy Technologies. Available online: https://docs.nlr.gov/docs/legosti/old/5173.pdf (accessed on 12 August 2023).
- Swift, K.D. A Comparison of the Cost and Financial Returns for Solar Photovoltaic Systems Installed by Businesses in Different Locations across the United States. Renew. Energy 2013, 57, 137–143. [Google Scholar] [CrossRef] [Scilit]
- Louwen, A.; Lindig, S.; Chowdhury, G.; Moser, D. Climate- and Technology-Dependent Performance Loss Rates in a Large Commercial Photovoltaic Monitoring Dataset. Sol. RRL 2024, 8, 2300653. [Google Scholar] [CrossRef] [Scilit]
- Market Experts. E.S.P (XM). Energy Demand by Region. Available online: https://informeanual.xm.com.co/2020/informe/pages/xm/23-demanda-de-energia-por-regiones.html (accessed on 9 August 2023).
- Congress of the Republic of Colombia. Law 1715 of 2014. Available online: http://www.secretariasenado.gov.co/senado/basedoc/ley_1715_2014.html (accessed on 9 October 2023).
- Lang, T.; Ammann, D.; Girod, B. Profitability in Absence of Subsidies: A Techno-Economic Analysis of Rooftop Photovoltaic Self-Consumption in Residential and Commercial Buildings. Renew. Energy 2016, 87, 77–87. [Google Scholar] [CrossRef] [Scilit]
- Masson, G. A Methodology for the Analysis of PV Self-Consumption Policies. Available online: https://iea-pvps.org/key-topics/iea-pvps-a-methodology-for-the-analysis-of-pv-self-consumption-policies-2016/ (accessed on 29 April 2024).
- Yamamoto, Y. Pricing Electricity from Residential Photovoltaic Systems: A Comparison of Feed-in Tariffs, Net Metering, and Net Purchase and Sale. Sol. Energy 2012, 86, 2678–2685. [Google Scholar] [CrossRef] [Scilit]
- Mejdalani, A.; Chueca, J.; López, D. Implementing Net Metering Policies in Latin America and the Caribbean: Design, Incentives and Best Practices. Available online: https://publications.iadb.org/en/implementing-net-metering-policies-latin-america-and-caribbean-design-incentives-and-best-practices (accessed on 29 April 2024).
- Ministry of Mines and Energy, R. of C. Resolution 174 of 2021 CREG. Available online: https://gestornormativo.creg.gov.co/gestor/entorno/docs/resolucion_creg_0174_2021.htm (accessed on 18 July 2023).
- European Union Science Centre. Photovoltaic Geographic Information System and PVGIS Calculation Methods. Available online: https://joint-research-centre.ec.europa.eu/photovoltaic-geographical-information-system-pvgis/getting-started-pvgis/pvgis-data-sources-calculation-methods_en (accessed on 11 August 2023).
- Sengupta, M.; Xie, Y.; Lopez, A.; Habte, A.; Maclaurin, G.; Shelby, J. The National Solar Radiation Data Base (NSRDB). Renew. Sustain. Energy Rev. 2018, 89, 51–60. [Google Scholar] [CrossRef] [Scilit]
- Mining and Energy Planning Unit (UPME). First Useful Energy Balance for Colombia and Quantification of Related Energy Losses and the Energy Efficiency Gap—Executive Summary BEU Residential and Tertiary Sector. Available online: https://www1.upme.gov.co/DemandayEficiencia/Documents/Balance_energia_util/BEU-Residencial.pdf (accessed on 8 August 2023).
- Mining and Energy Planning Unit, Colombia, Ministry of Mines and Energy. National Energy Plan: Context and Strategies, 2006–2025. Available online: https://www1.upme.gov.co/Hemeroteca/Impresos/Plan_energetico_nacional_2006-2025_ESP.pdf (accessed on 8 August 2023).
- Mining and Energy Planning Unit (UPME). Estimation of Subsistence Electricity Consumption. Available online: https://www1.upme.gov.co/DemandayEficiencia/Documents/Informe_proyeccion_demanda_energeticos.pdf (accessed on 9 August 2023).
- EPM. Small-Scale Self-Generator Guidelines. Available online: https://www.epm.com.co/content/dam/epm/institucional/documentos/todos/proyectos-normativos/lineamiento-autogenerador-a-pequena-escala-anexo-cuu.pdf (accessed on 9 August 2023).
- Cardenas, L.; Zapata, M.; Franco, C.J.; Dyner, I. Assessing the Combined Effect of the Diffusion of Solar Rooftop Generation, Energy Conservation and Efficient Appliances in Households. J. Clean. Prod. 2017, 162, 491–503. [Google Scholar] [CrossRef] [Scilit]
- Fleming, W.G. The Logic of Comparative Social Inquiry. By Adam Przeworski and Henry Teune. (New York: John Wiley and Sons, Inc., 1970. Pp. 153. $8.50.). Am. Political Sci. Rev. 1970, 64, 1255–1256. [Google Scholar] [CrossRef] [Scilit]
- National Administrative Department of Statistics. How Do We Live? National Population and Housing Census. Available online: https://www.dane.gov.co/index.php/estadisticas-por-tema/demografia-y-poblacion/censo-nacional-de-poblacion-y-vivenda-2018/como-vivimos (accessed on 5 September 2023).
- Mining and Energy Planning Unit (UPME). Energy Demand Projection. Available online: https://www1.upme.gov.co/DemandayEficiencia/Documents/UPME_Proyeccion_Demanda_Energia_Junio_2021.pdf (accessed on 8 August 2023).
- Mining and Energy Planning Unit (UPME). Projected Electricity Demand and Peak Power, 2023. Available online: https://www1.upme.gov.co/DemandayEficiencia/Documents/UPME_Proyeccion_demanda_2023-2037_VF2.pdf (accessed on 11 August 2023).
- DANE. Demographics and Population. Available online: https://www.dane.gov.co/index.php/estadisticas-por-tema/demografia-y-poblacion (accessed on 9 August 2023).
- SUI. Single Information System for Household Public Services. Available online: https://sui.superservicios.gov.co/Reportes-del-sector/Energia/Reportes-comerciales/Consolidado-energia (accessed on 11 August 2023).
- Guerrero-Prado, J.S.; Alfonso-Morales, W.; Caicedo-Bravo, E.F. A Data Analytics/Big Data Framework for Advanced Metering Infrastructure Data. Sensors 2021, 21, 5650. [Google Scholar] [CrossRef] [Scilit] [PubMed]
- International Bank for Reconstruction and Development. Tracking SDG 7 The Energy Progress Report 2023. Available online: https://trackingsdg7.esmap.org/ (accessed on 29 April 2024).
- International Renewable Energy Agency. World Energy Transitions Outlook 2023 1.5 °C Pathway. Available online: https://www.irena.org/Publications/2023/Jun/World-Energy-Transitions-Outlook-2023 (accessed on 29 April 2024).
- Copérnico. How Much It Costs to Install Solar Energy on a House. Available online: https://www.copernicosas.com/post/cuanto-vale-instalar-energia-solar-en-una-casa#:~:text=Generalmente%20un%20sistema%20aislado%20bien,30%20millones%20de%20pesos%20colombianos. (accessed on 17 August 2023).
- International Renewable Energy Agency (IRENA). Renewable Power Generation Costs in 2022. Available online: https://www.irena.org/Publications/2023/Aug/Renewable-Power-Generation-Costs-in-2022 (accessed on 1 February 2024).
- Masson, G. Trends in PV Applications 2023. Available online: https://iea-pvps.org/trends_reports/trends-2023/ (accessed on 18 February 2024).
- WM; Reuters. FX Benchmarks Coins. Available online: https://www.banrep.gov.co/es/glosario/tasa-cambio-trm (accessed on 19 September 2023).
- European Central Bank (BCE). Available online: https://www.ecb.europa.eu/stats/policy_and_exchange_rates/euro_reference_exchange_rates/html/eurofxref-graph-usd.es.html (accessed on 1 February 2024).
- Ignacio Lozano, H.R. Electricity Tariff Formation and Inflation in Colombia. Available online: https://d1b4gd4m8561gs.cloudfront.net/sites/default/files/publicaciones/pdfs/borra634.pdf (accessed on 23 August 2023).
- Superintendency of Household Public Utilities. Tariff Bulletin. Available online: https://www.superservicios.gov.co/sites/default/files/inline-files/Boletin-tarifario-energia-trimestre-IV-2022.pdf (accessed on 31 August 2023).
- Congress of Colombia. Law 142 of 1994, Art 89–99. 1994. Available online: https://www.bogotajuridica.gov.co/sisjur/normas/Norma1.jsp?i=2752 (accessed on 7 October 2023).
- Ministry of Mines and Energy. Solidarity Fund. Available online: https://www.minenergia.gov.co/es/misional/energia-electrica-2/subsidios/fondo-de-solidaridad-para-subsidios-y-redistribuci%C3%B3n-de-ingresos-fssri/ (accessed on 1 September 2023).
- Public companies of Medellín E.S.P. Tariffs Previous Years 2022. Available online: https://www.epm.com.co/clientesyusuarios/energia/tarifas-energia/tarifas-anos-anteriores-energia/ (accessed on 16 September 2023).
- Enel Colombia S.A. ESP. Energy Tariffs 2022. Available online: https://www.enel.com.co/es/personas/tarifas-energia-enel-distribucion.html (accessed on 16 September 2023).
- EMCALI EICE E.S.P. Regulated Market Rates 2022. Available online: https://www.emcali.com.co/documents/d/energia/historico-tarifas-energia-2022 (accessed on 16 September 2023).
- Superservices Rates. Available online: https://www.superservicios.gov.co/Empresas-vigiladas/Energia-y-gas-combustible/Energia/Tarifas (accessed on 2 April 2024).
- Ministry of Mines and Energy. Superservices. Published Energy Rates. Available online: https://www.datos.gov.co/Minas-y-Energ-a/Superservicios-Tarifas-Publicadas-Energia/4is2-3nif/about_data (accessed on 16 September 2023).
- Congress of Colombia. Laws 142 and 143 of 1994. Available online: https://www.superservicios.gov.co/Empresas-vigiladas/Energ%C3%ADa-y-gas-combustible/Energ%C3%ADa/Unidad-de-Monitoreo-de-Mercados-de-Energ%C3%ADa-y-Gas-Natural/Mercado-de-energ%C3%ADa-mayorista-Informes-hist%C3%B3ricos (accessed on 29 April 2024).
- Ministry of Mines and Energy. Integrate. Available online: https://www.integrame.gov.co/ (accessed on 19 September 2023).
- Iván, Á.; Molina, A. Evolution of Electricity Tariffs to Residential Customers before and after the Electricity Market Reform of 1994. Available online: https://repositorio.unal.edu.co/bitstream/handle/unal/80665/1053823182-2021.pdf?sequence=4&isAllowed=y (accessed on 19 September 2023).
- Caicedo García, É.; Montealegre, M.P.; Pérez, L.Á.F. Electricity Tariffs: Recent Developments and Indexation, 2023. Available online: https://repositorio.banrep.gov.co/bitstream/handle/20.500.12134/10591/informe-politica-monetaria-enero-2023-recuadro1.pdf?sequence=2&isAllowed=y (accessed on 19 September 2023).
- Romero, I.; Borrello, F. The Distributed Solar Generation Business Opportunity in Colombia Financing Mechanisms for Commercial Banks, 2021. Available online: https://sole.accionclimatica-alc.org/wp-content/uploads/2022/11/UNEP-SUMMARY-Financing-oportunities-for-DSG-in-Colombia-Generacion-SOLE.pdf (accessed on 19 September 2022).
- Bank of the Republic of Colombia. Report on the Credit Situation in Colombia. Available online: https://www.banrep.gov.co/en/estabilidad-tema-16 (accessed on 19 December 2023).
- Hamilton, K. Finance Guide for Policy—Makers: Renewable Energy, Green Infrastructure. Available online: https://assets.bbhub.io/professional/sites/24/2016/08/Finance-Guide-for-Policymakers-RE-GreenInfra-August-2016.pdf (accessed on 2 October 2023).
- López, M.A.; Mariño, J.S.; Rodriguez, N.D. Report on the Credit Situation in Colombia. Available online: https://www.banrep.gov.co/es/publicaciones-investigaciones/reporte-situacion-credito-colombia (accessed on 2 October 2023).
- TRADING ECONOMICS. Interest Rate Colombia. Available online: https://tradingeconomics.com/colombia/deposit-interest-rate (accessed on 2 October 2023).
- CDM. Meeting 62 (2011) Annex 5—Guidelines on the Assessment of Investment Analysis. Available online: https://cdm.unfccc.int/EB/archives/meetings_11.html (accessed on 2 October 2023).
- Bank of the Republic of Colombia. Yield on Government Bonds Colombia. Available online: https://www.banrep.gov.co/es/estadisticas/deuda-externa-publica-y-privada-dolares (accessed on 8 April 2023).
- Bankscope. Return on Equity Country Rankings. Available online: https://www.theglobaleconomy.com/rankings/bank_return_equity/South-America/ (accessed on 2 October 2023).
- Cárdenas, J.A. Expected Return on Equity (Ke). Available online: https://investigaciones.corfi.com/finanzas-corporativas/decisiones-de-inversiones-y-rentabilidad/rentabilidad-esperada-del-capital-propio--ke-el-camino-de-colombia-hacia-un-menor-ke/informe_1395020#:~:text=Se%20estima%20que%20el%20punto,%2C1%25%20en%20pesos%20colombianos. (accessed on 4 February 2024).
- National Administrative Department of Statistics (DANE). Consumer Price Index. Available online: https://sitios.dane.gov.co/ipc/visorIPC/#!/ (accessed on 5 February 2024).
- Saavedra, A.T. Money Market Deposit and Operating Interest Rates, 2021. Available online: https://www.banrep.gov.co/sites/default/files/guia-metodologica-tasas-de-captacion.pdf (accessed on 18 February 2024).
- Financial Superintendence of Colombia. Costs of Your Financial Products and Remuneration of Your Money. Available online: https://www.superfinanciera.gov.co/personas/#productos (accessed on 18 February 2024).
- Bank of the Republic of Colombia. Economic Statistics. Available online: https://suameca.banrep.gov.co/estadisticas-economicas/#/informacionSerie/220003/Tasas%20de%20inter%C3%A9s/DTF (accessed on 22 November 2023).
- TRADING ECOCOMICS. Tax Rate. Available online: https://tradingeconomics.com/colombia/corporate-tax-rate (accessed on 16 January 2024).
- Audivet, C.; Romero, E.; García, J.; Fonseca, A.; Pinzón, H.; Bula, A.; Sanjuan, M. Evaluation of Performance and Early Degradation of a 180.8 Kwp Rooftop on a Gridconnected Photovoltaic System in a Colombian Tropical Region Environment. CTyF—Cienc. Tecnol. Futuro 2021, 11, 11–20. [Google Scholar] [CrossRef] [Scilit]
- Trejos Grisales, A.; Osorio Giraldo, A.; Gonzalez Montoya, D.; Durango Florez, M.; Rodriguez Bastidas, J.D. Performance Analysis of Photovoltaic Arrays with Degradation Operating under Partial Shading Conditions. Mag. EIA 2020, 17, 1–10. [Google Scholar] [CrossRef] [Scilit]
- Branker, K.; Pathak, M.J.M.; Pearce, J.M. A Review of Solar Photovoltaic Levelized Cost of Electricity. Renew. Sustain. Energy Rev. 2011, 15, 4470–4482. [Google Scholar] [CrossRef] [Scilit]
- VDMA. International Technology Roadmap for Photovoltaics (ITRPV). Available online: https://www.vdma.eu/en-GB/international-technology-roadmap-photovoltaic (accessed on 23 February 2026).
- Wu, X.; Xiong, G.; Yue, Z.; Chen, R.; Tsang, S.-W.; Cheng, Y. A Perspective on Commercializing Perovskite Solar Cells: Unlocking Opportunities in Niche Applications. Small 2026, 12, e11874. [Google Scholar] [CrossRef] [Scilit]
- Technical Management. Serankua Data Warehouse Total and Target Inflation. Available online: https://suameca.banrep.gov.co/descarga-multiple-de-datos/ (accessed on 21 September 2023).
- Mining and Energy Planning Unit (UPME). Energy Inflation in Colombia. Available online: https://www1.upme.gov.co/DemandayEficiencia/Documents/Inflacion_energia/Informe_Inflacion_Energia_Dic_2022_RRH.pdf (accessed on 21 September 2023).
- Talavera, D.L.; Muñoz-Rodriguez, F.J.; Jimenez-Castillo, G.; Rus-Casas, C. A New Approach to Sizing the Photo-voltaic Generator in Self-Consumption Systems Based on Cost–Competitiveness, Maximizing Direct Self-Consumption. Renew. Energy 2019, 130, 1021–1035. [Google Scholar] [CrossRef] [Scilit]
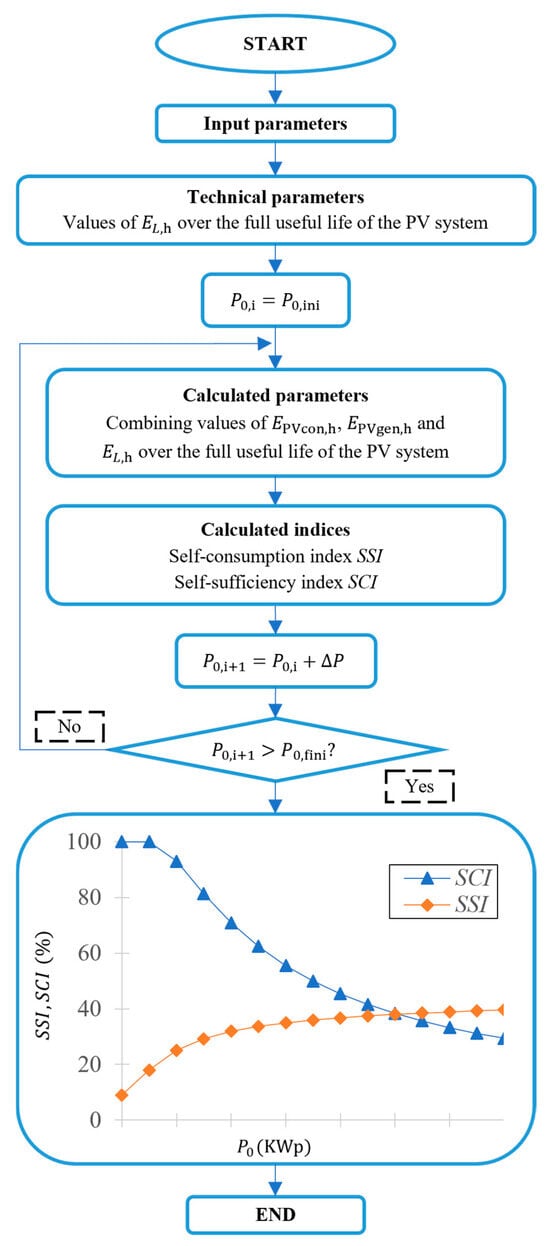
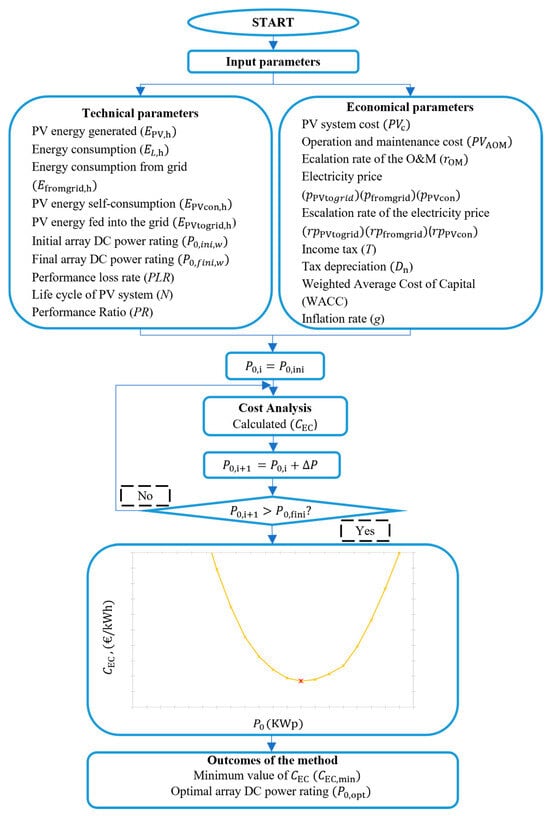
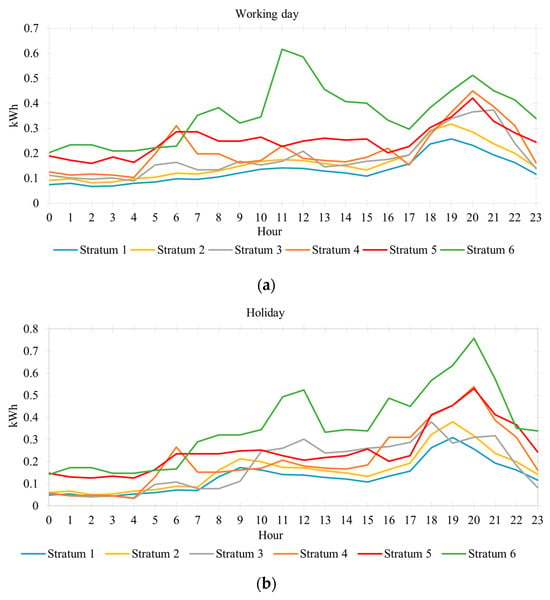
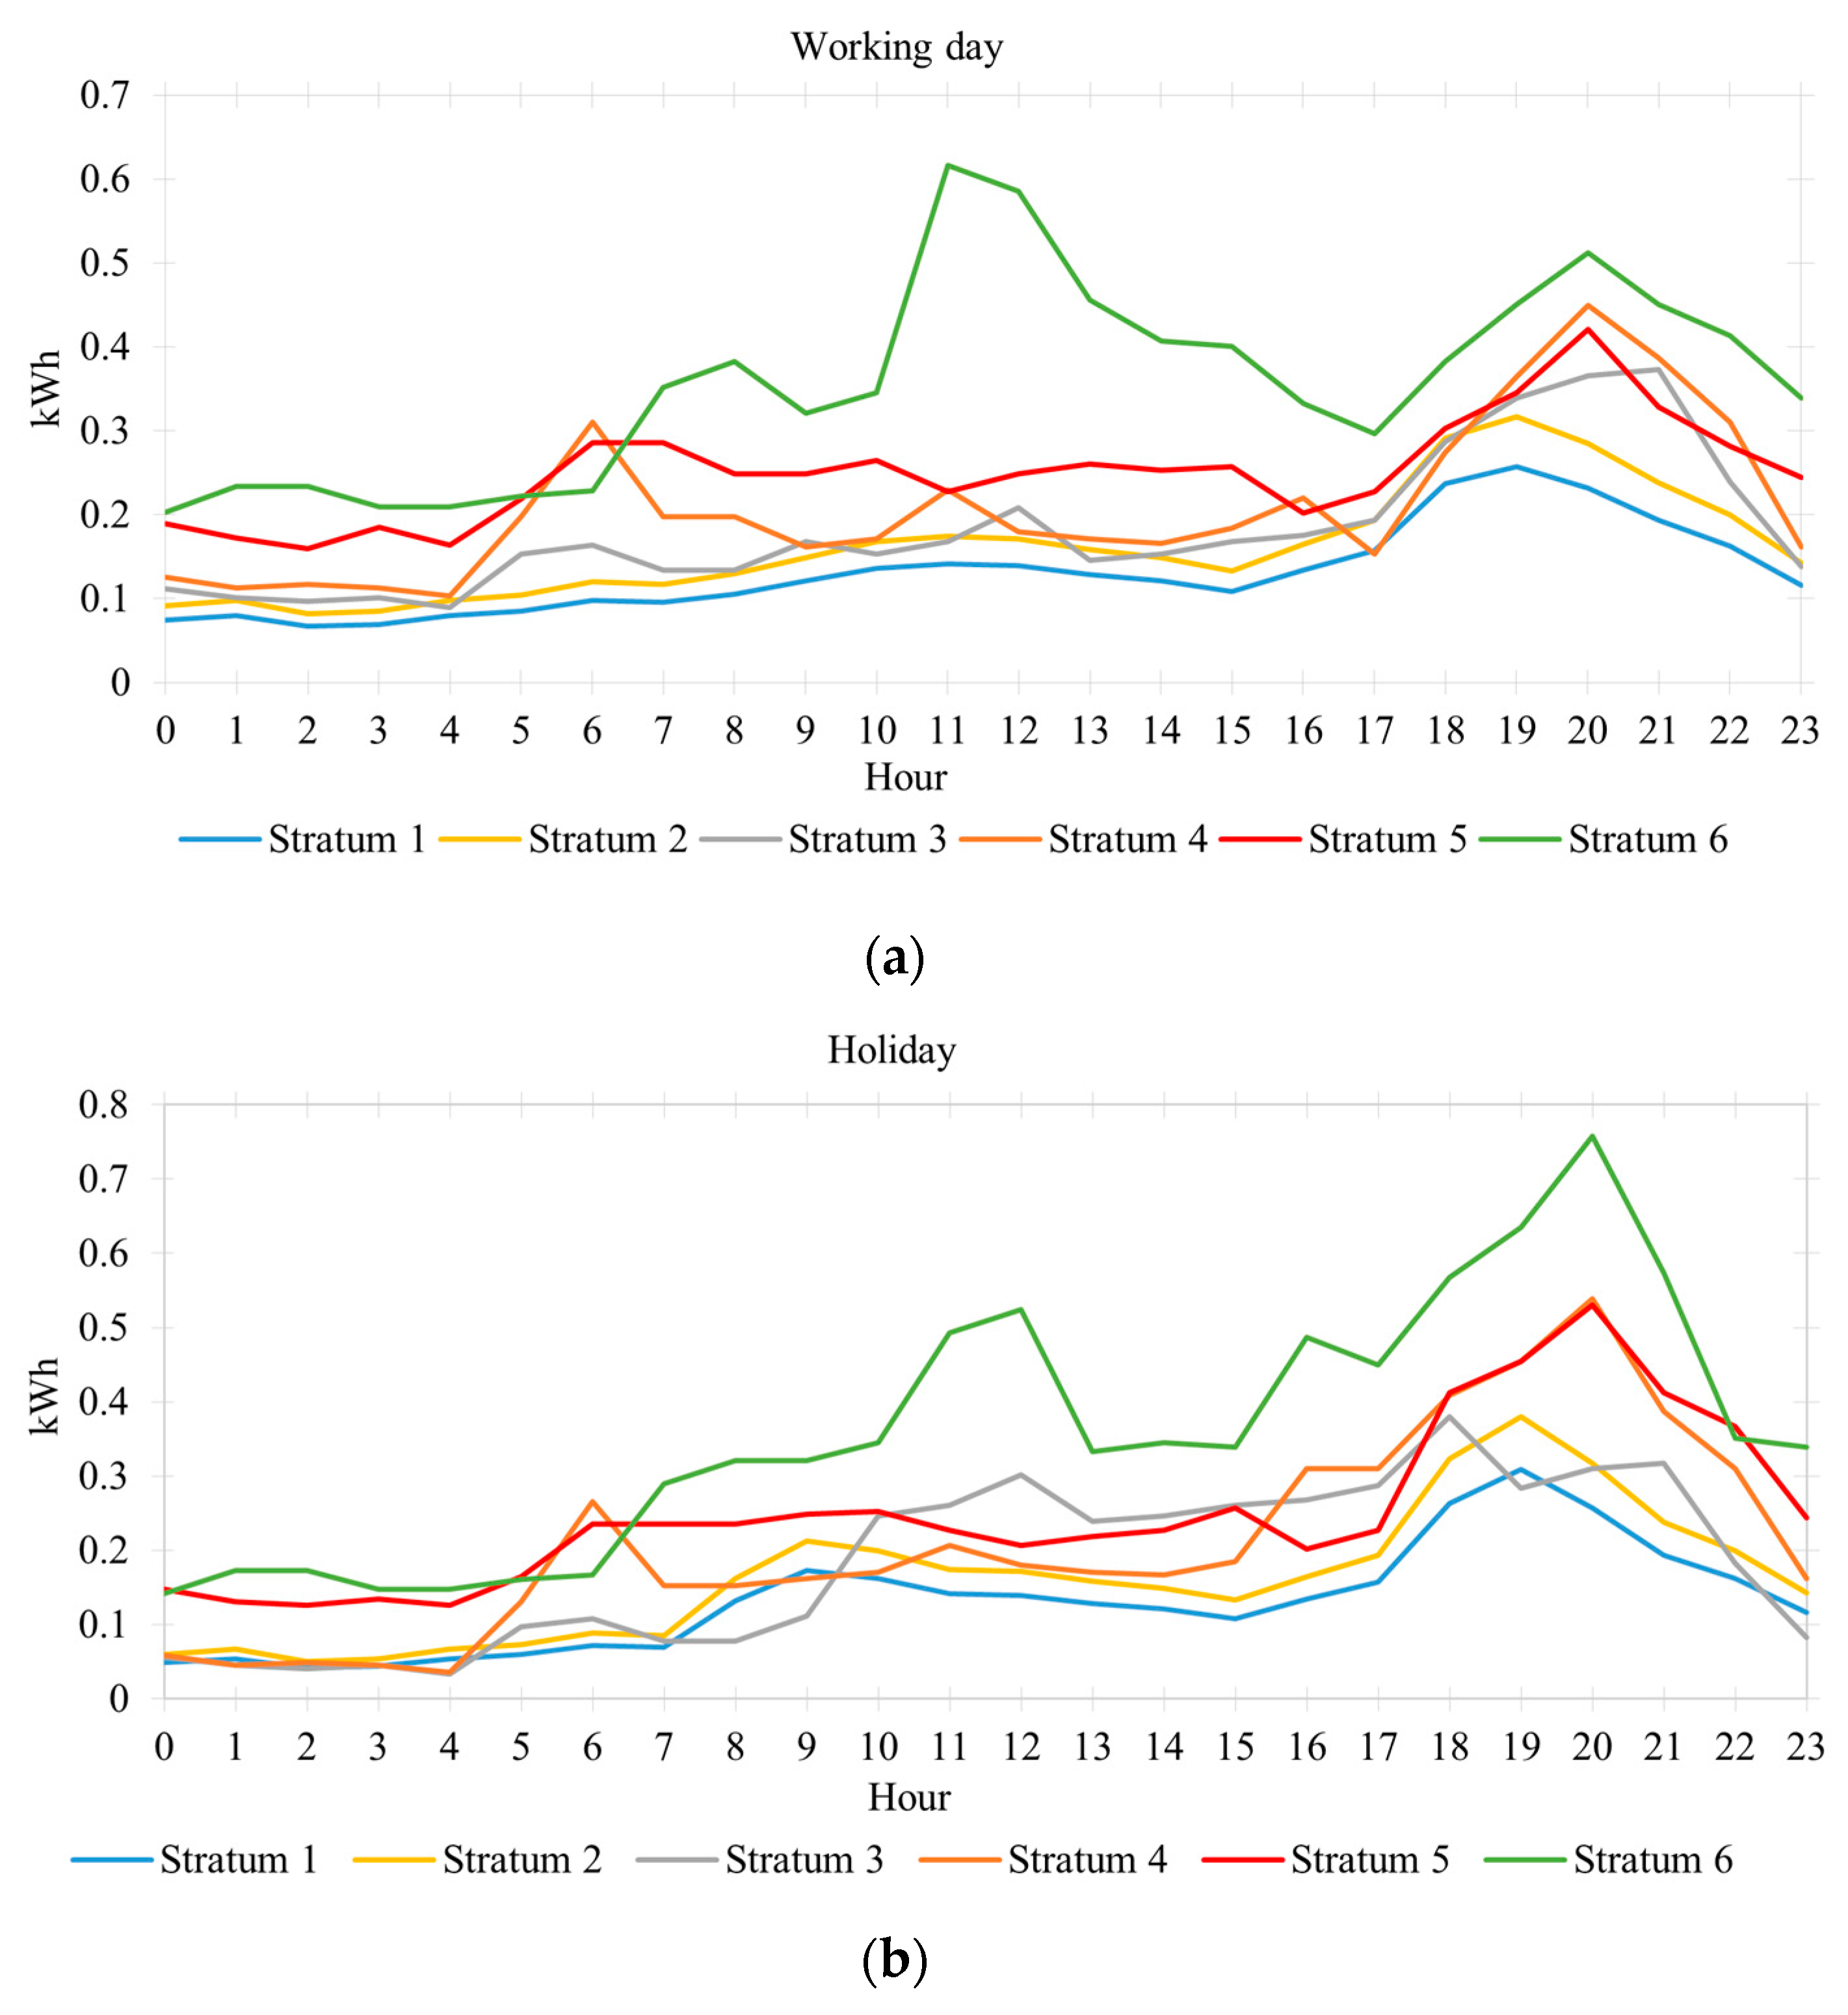
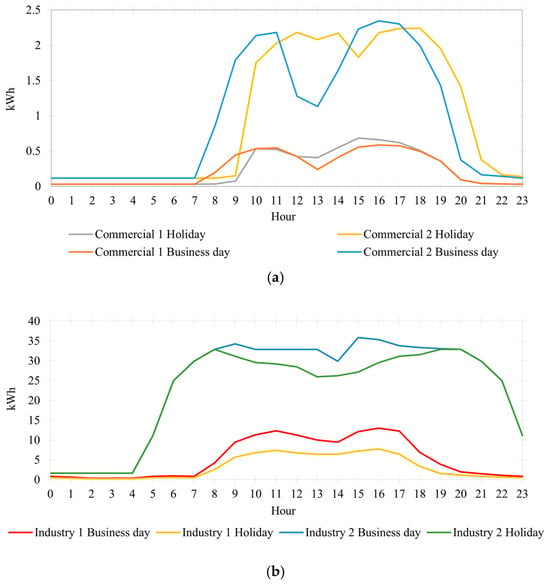
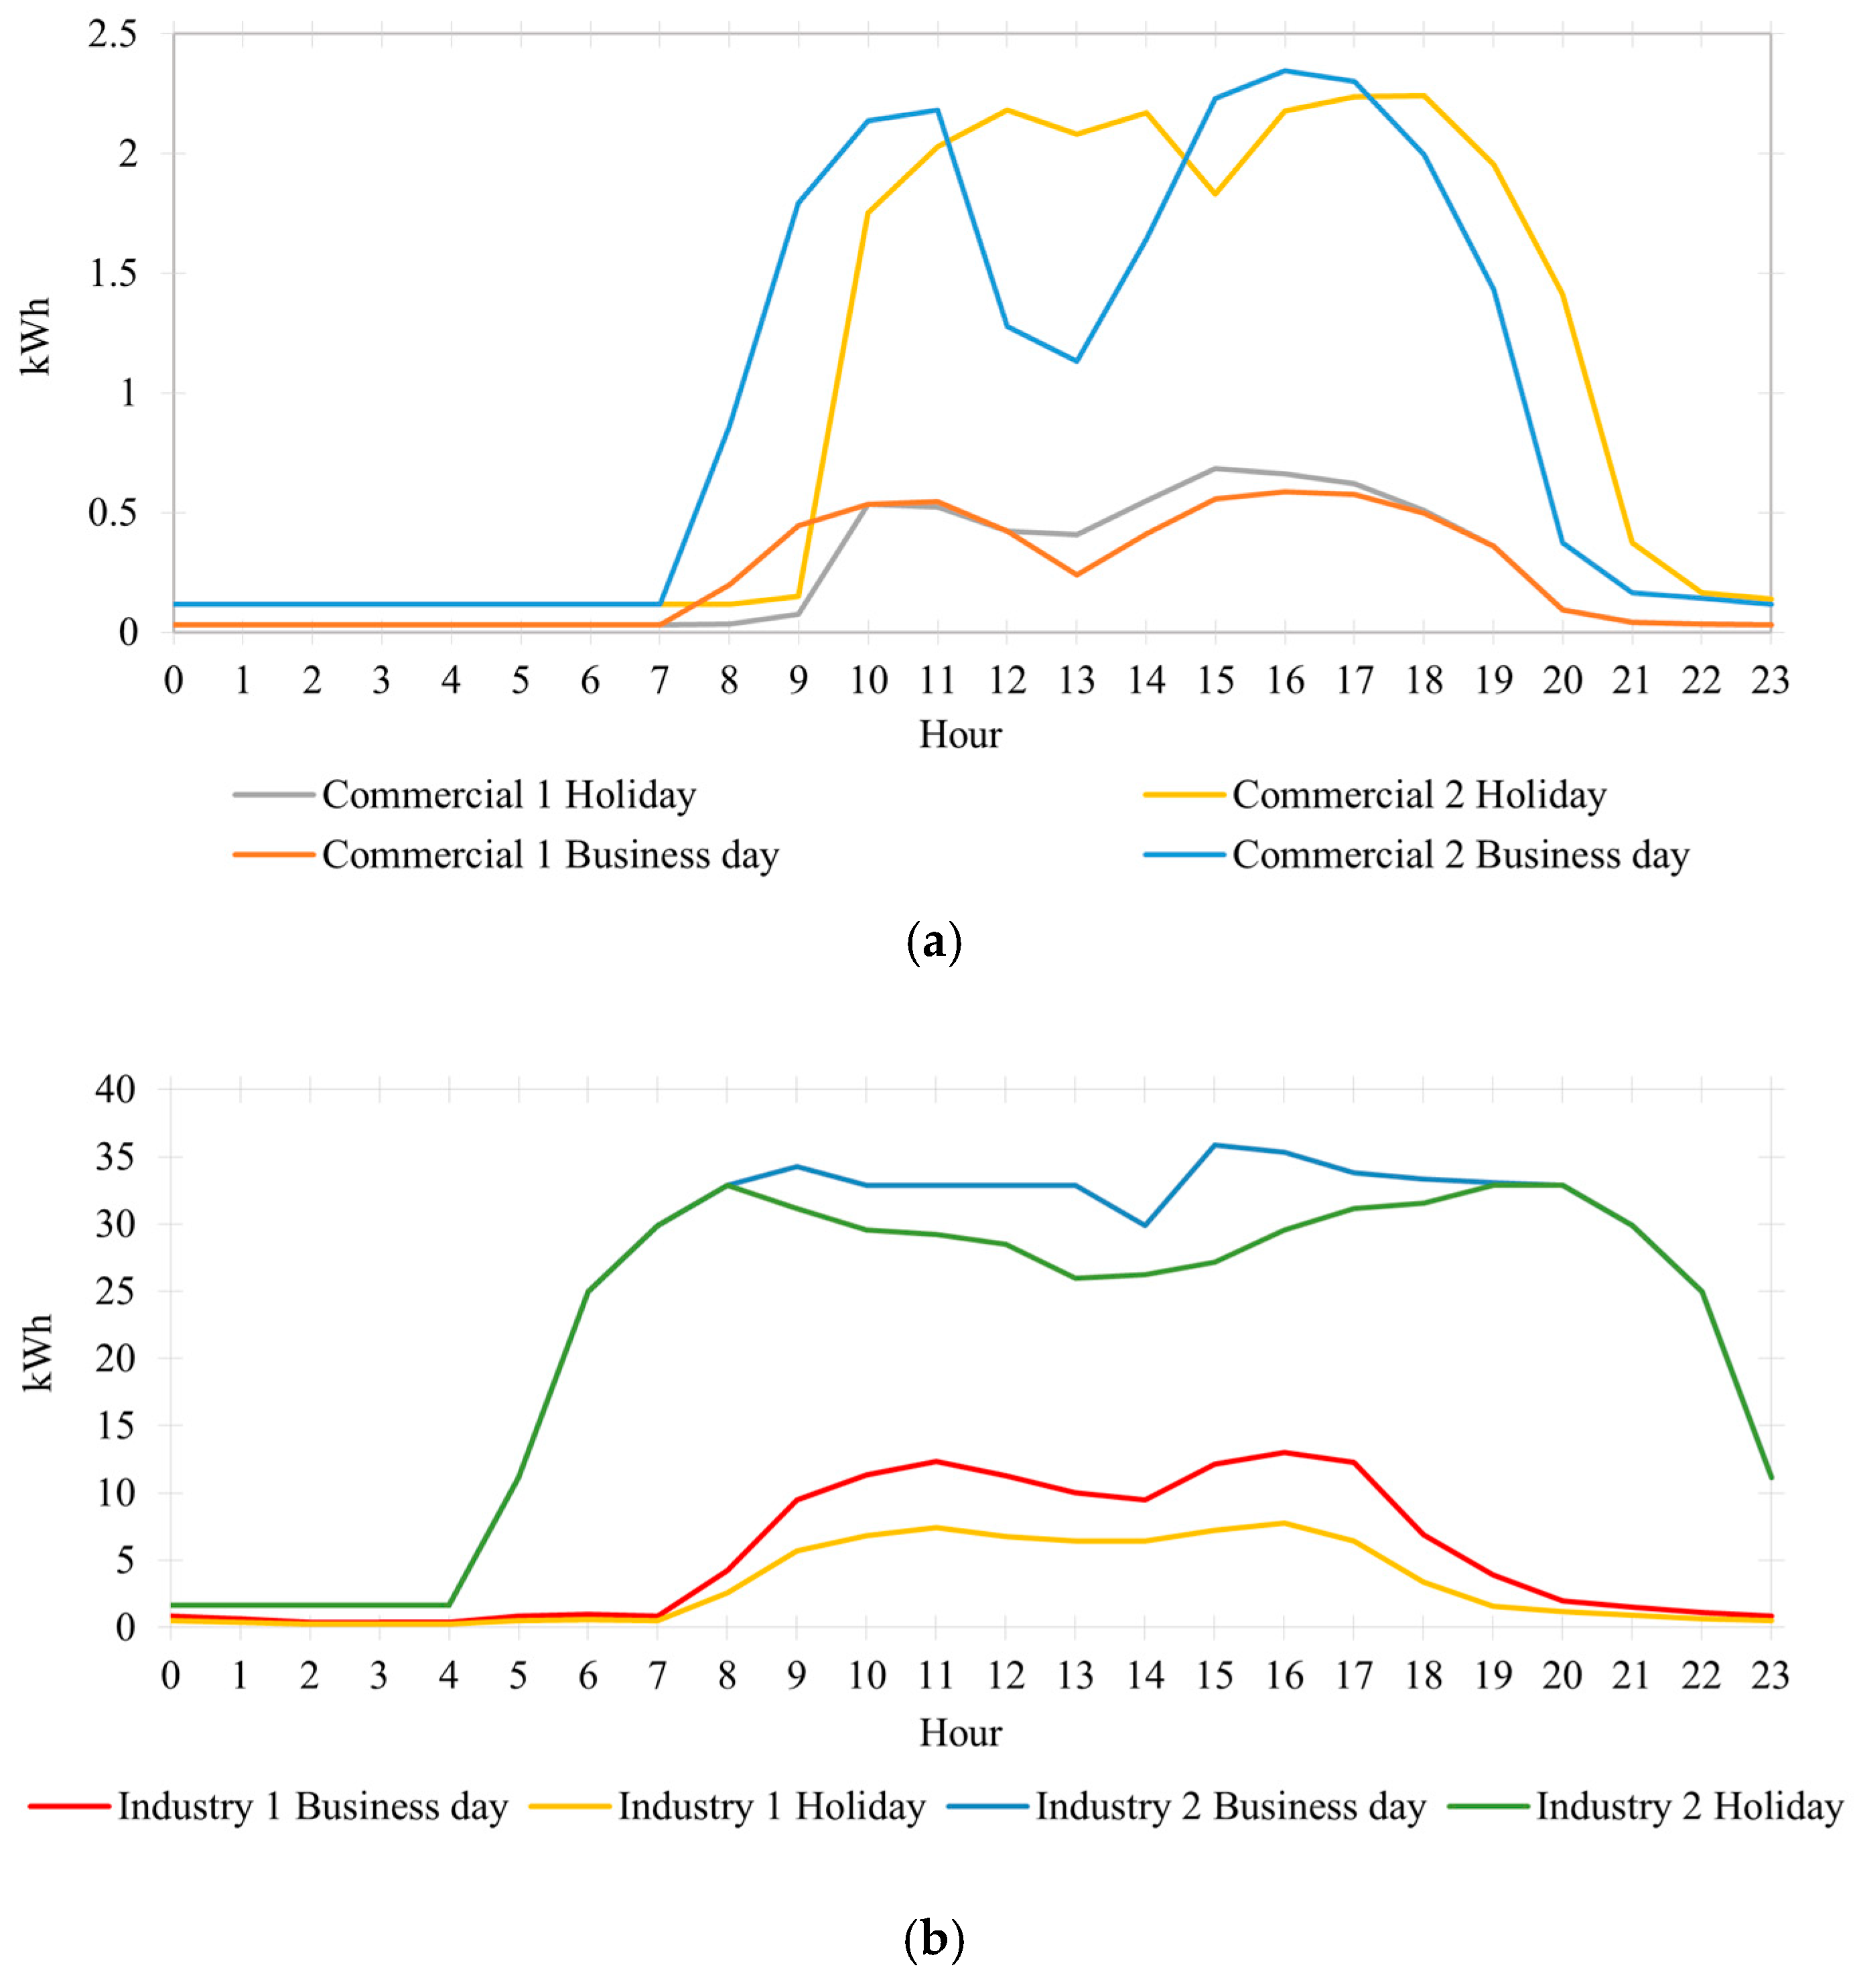
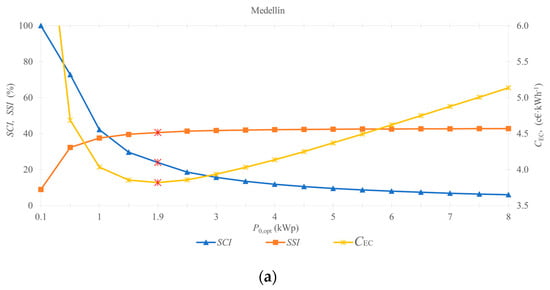
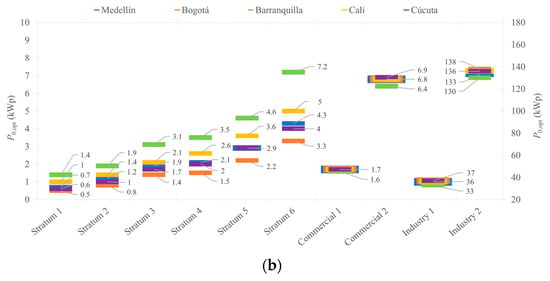
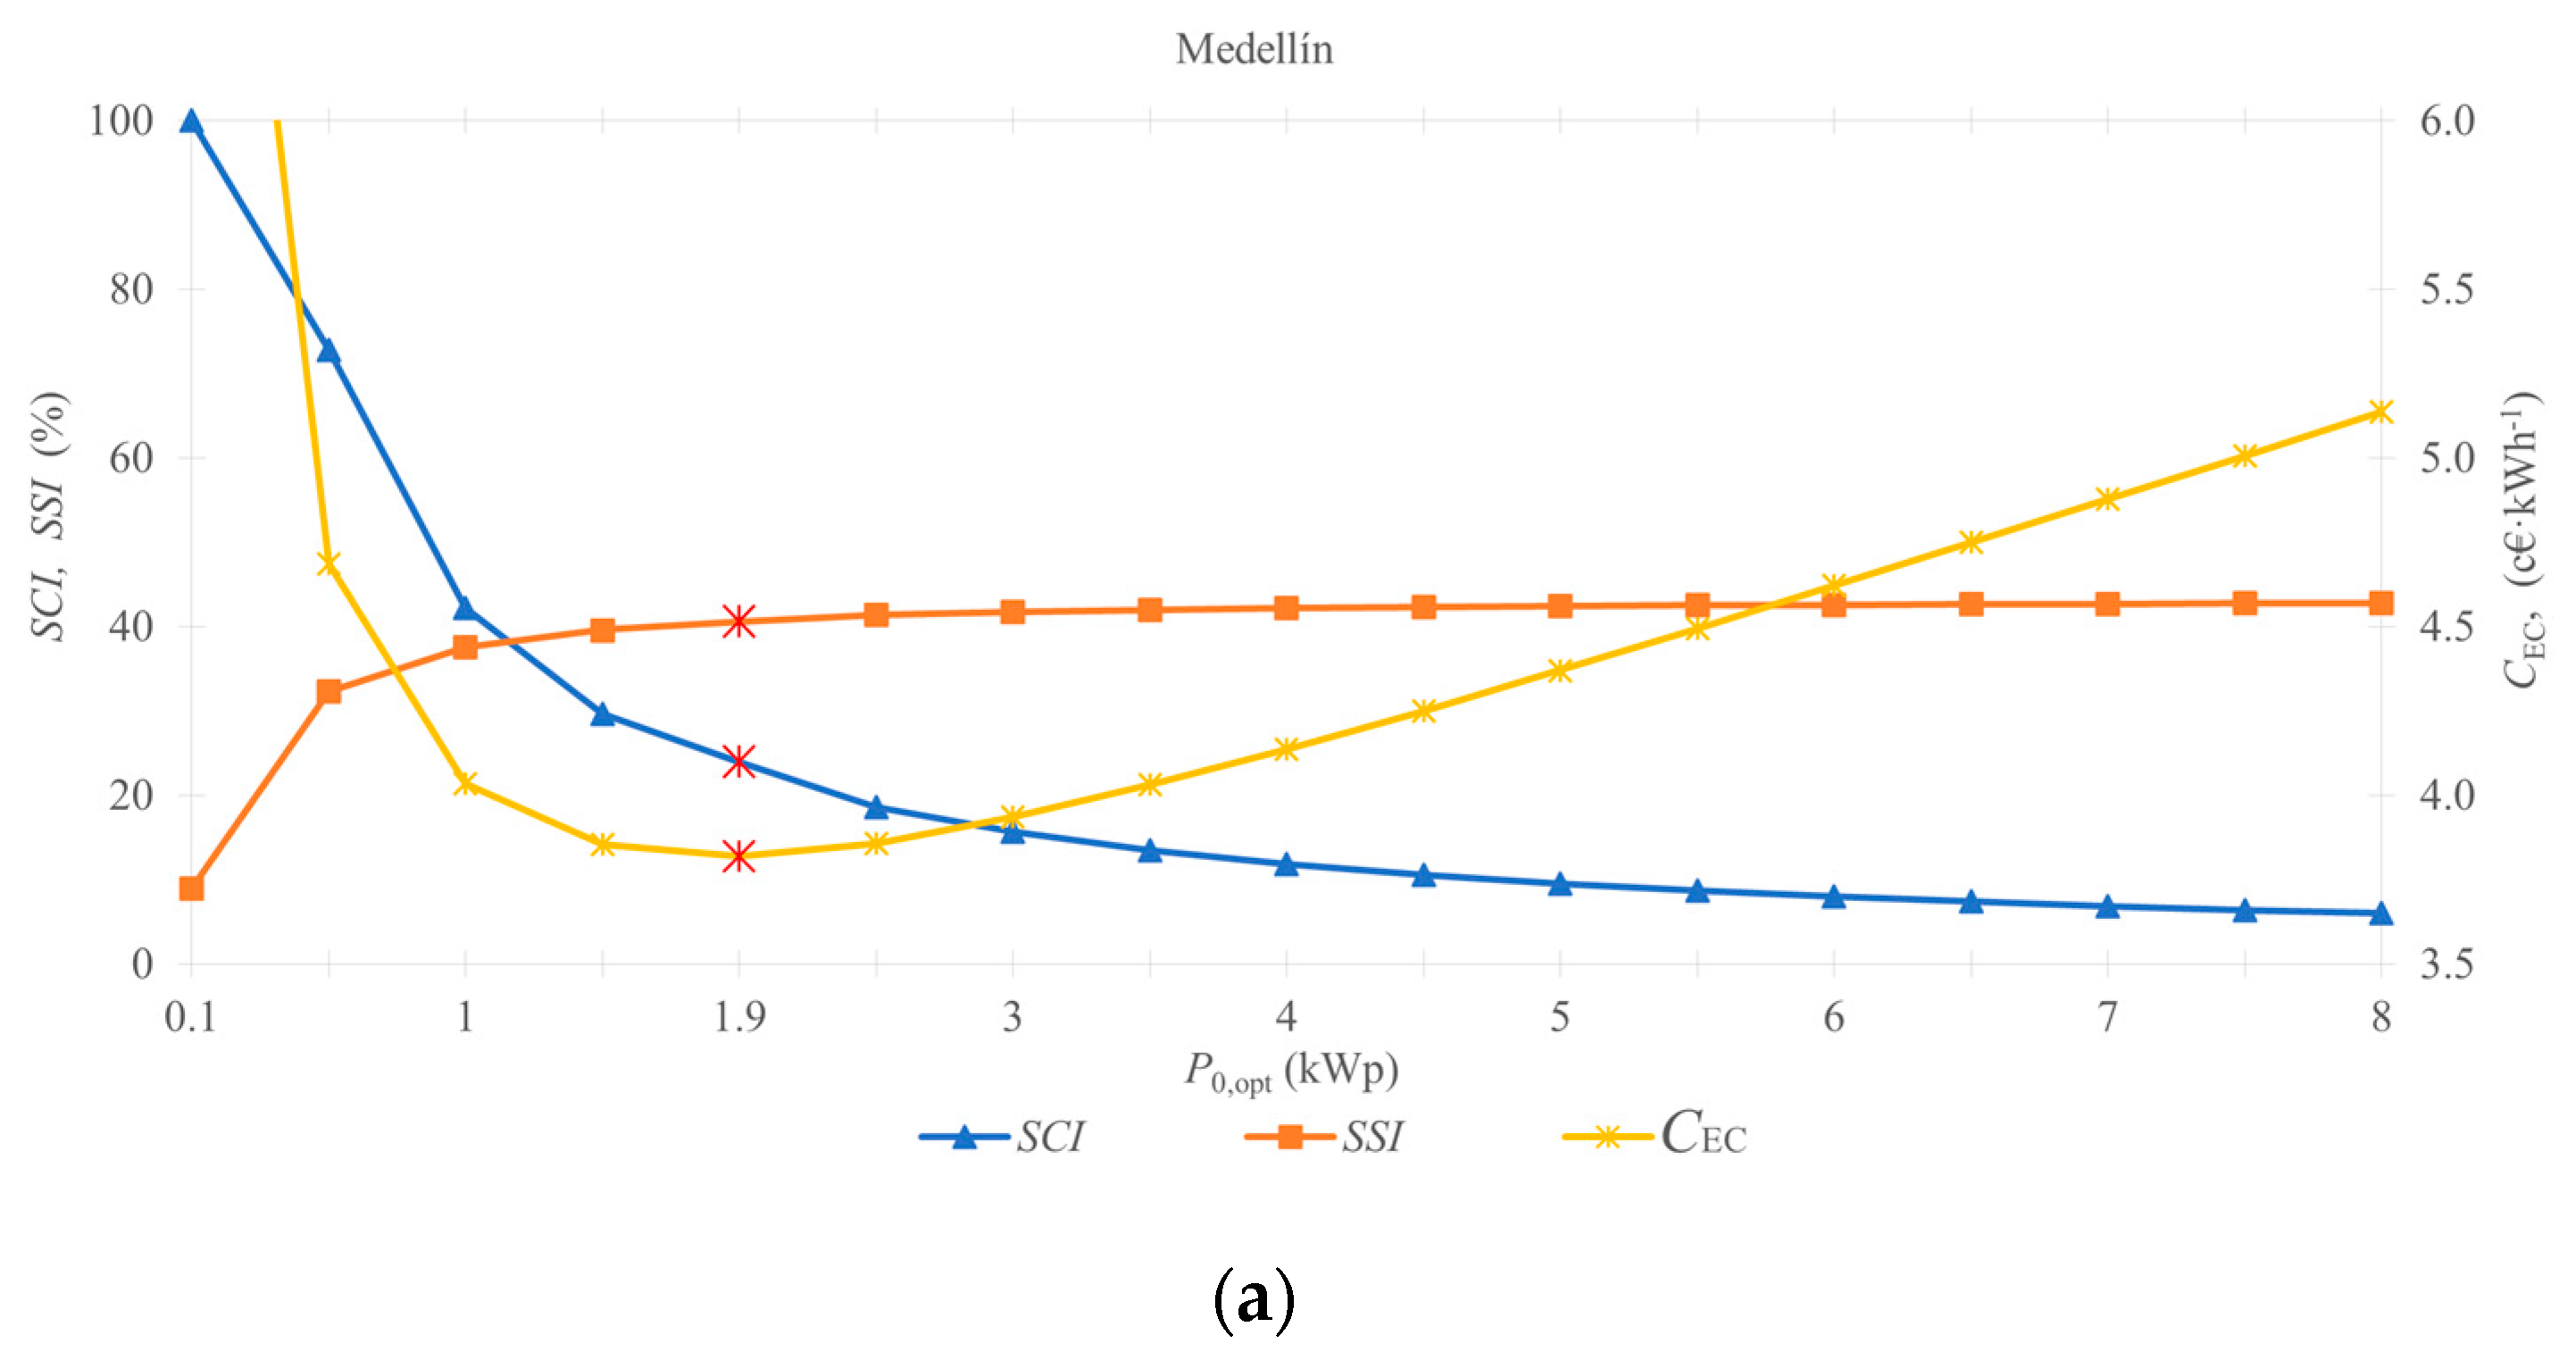
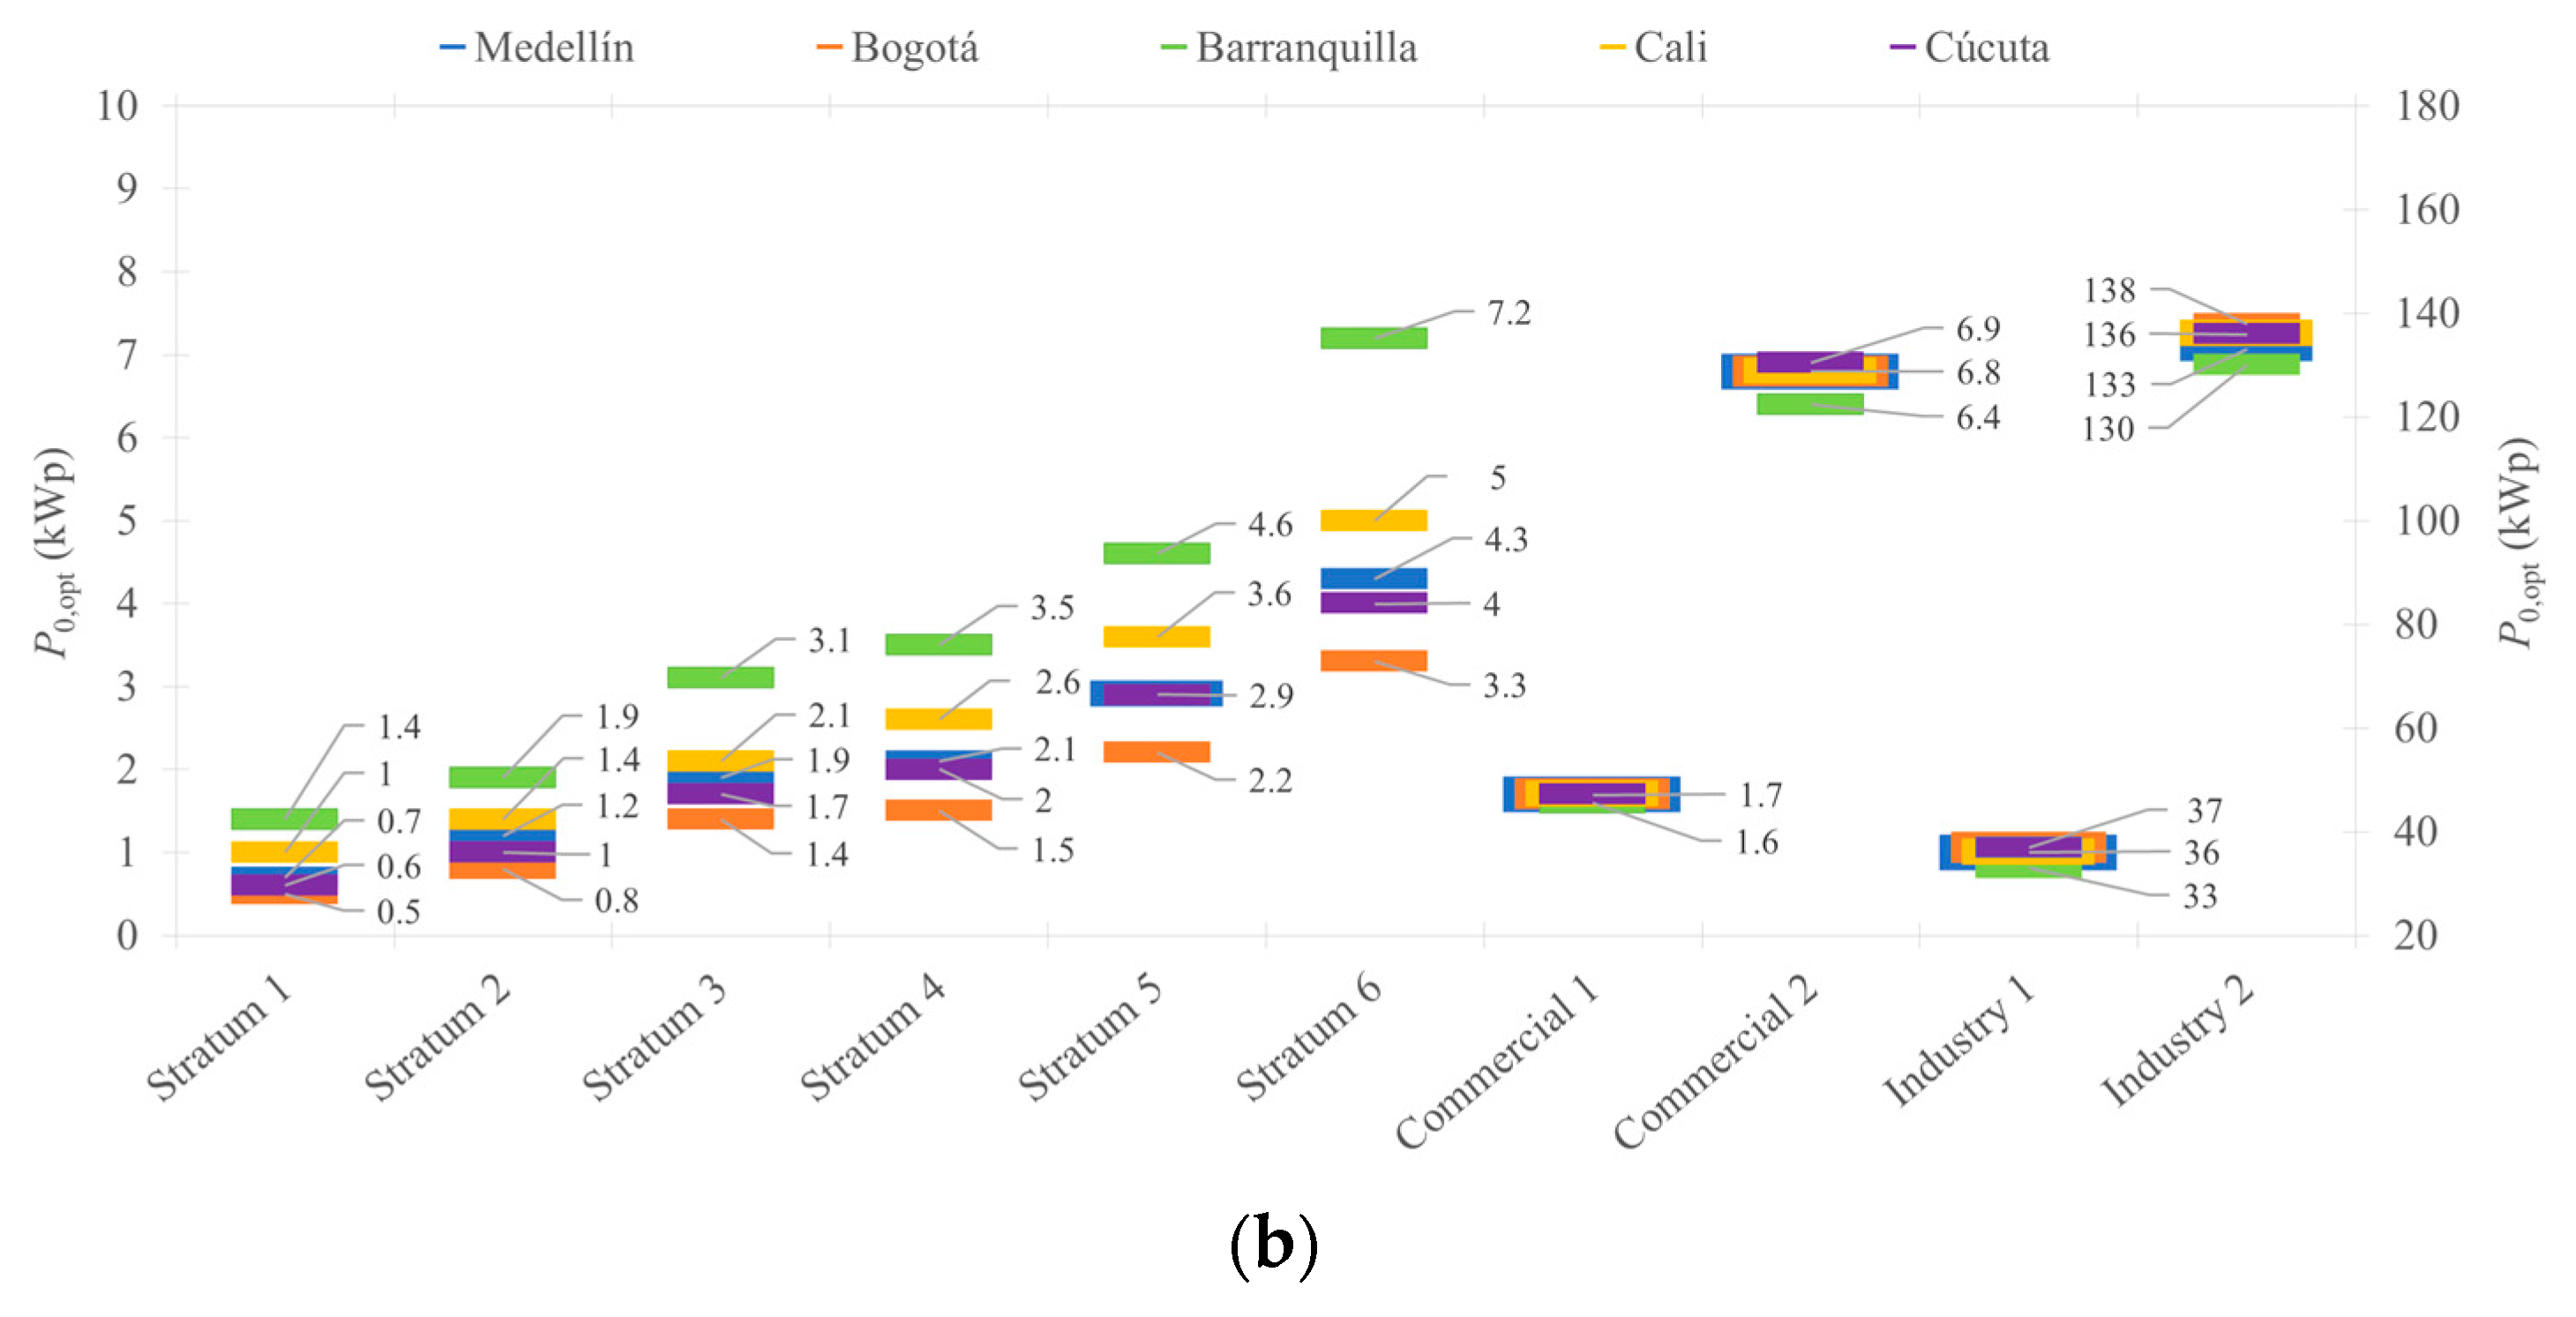
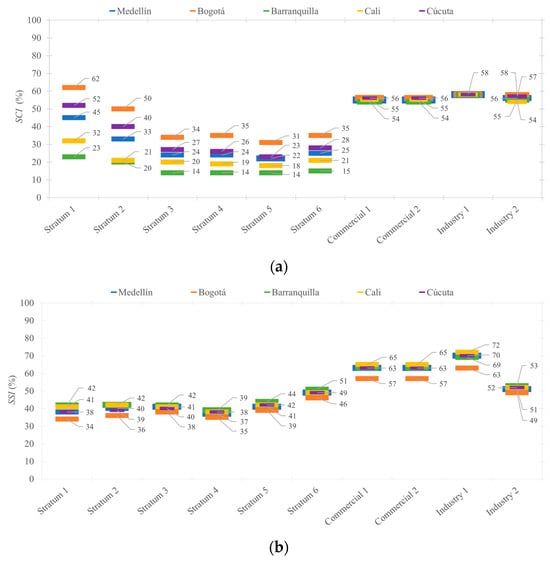
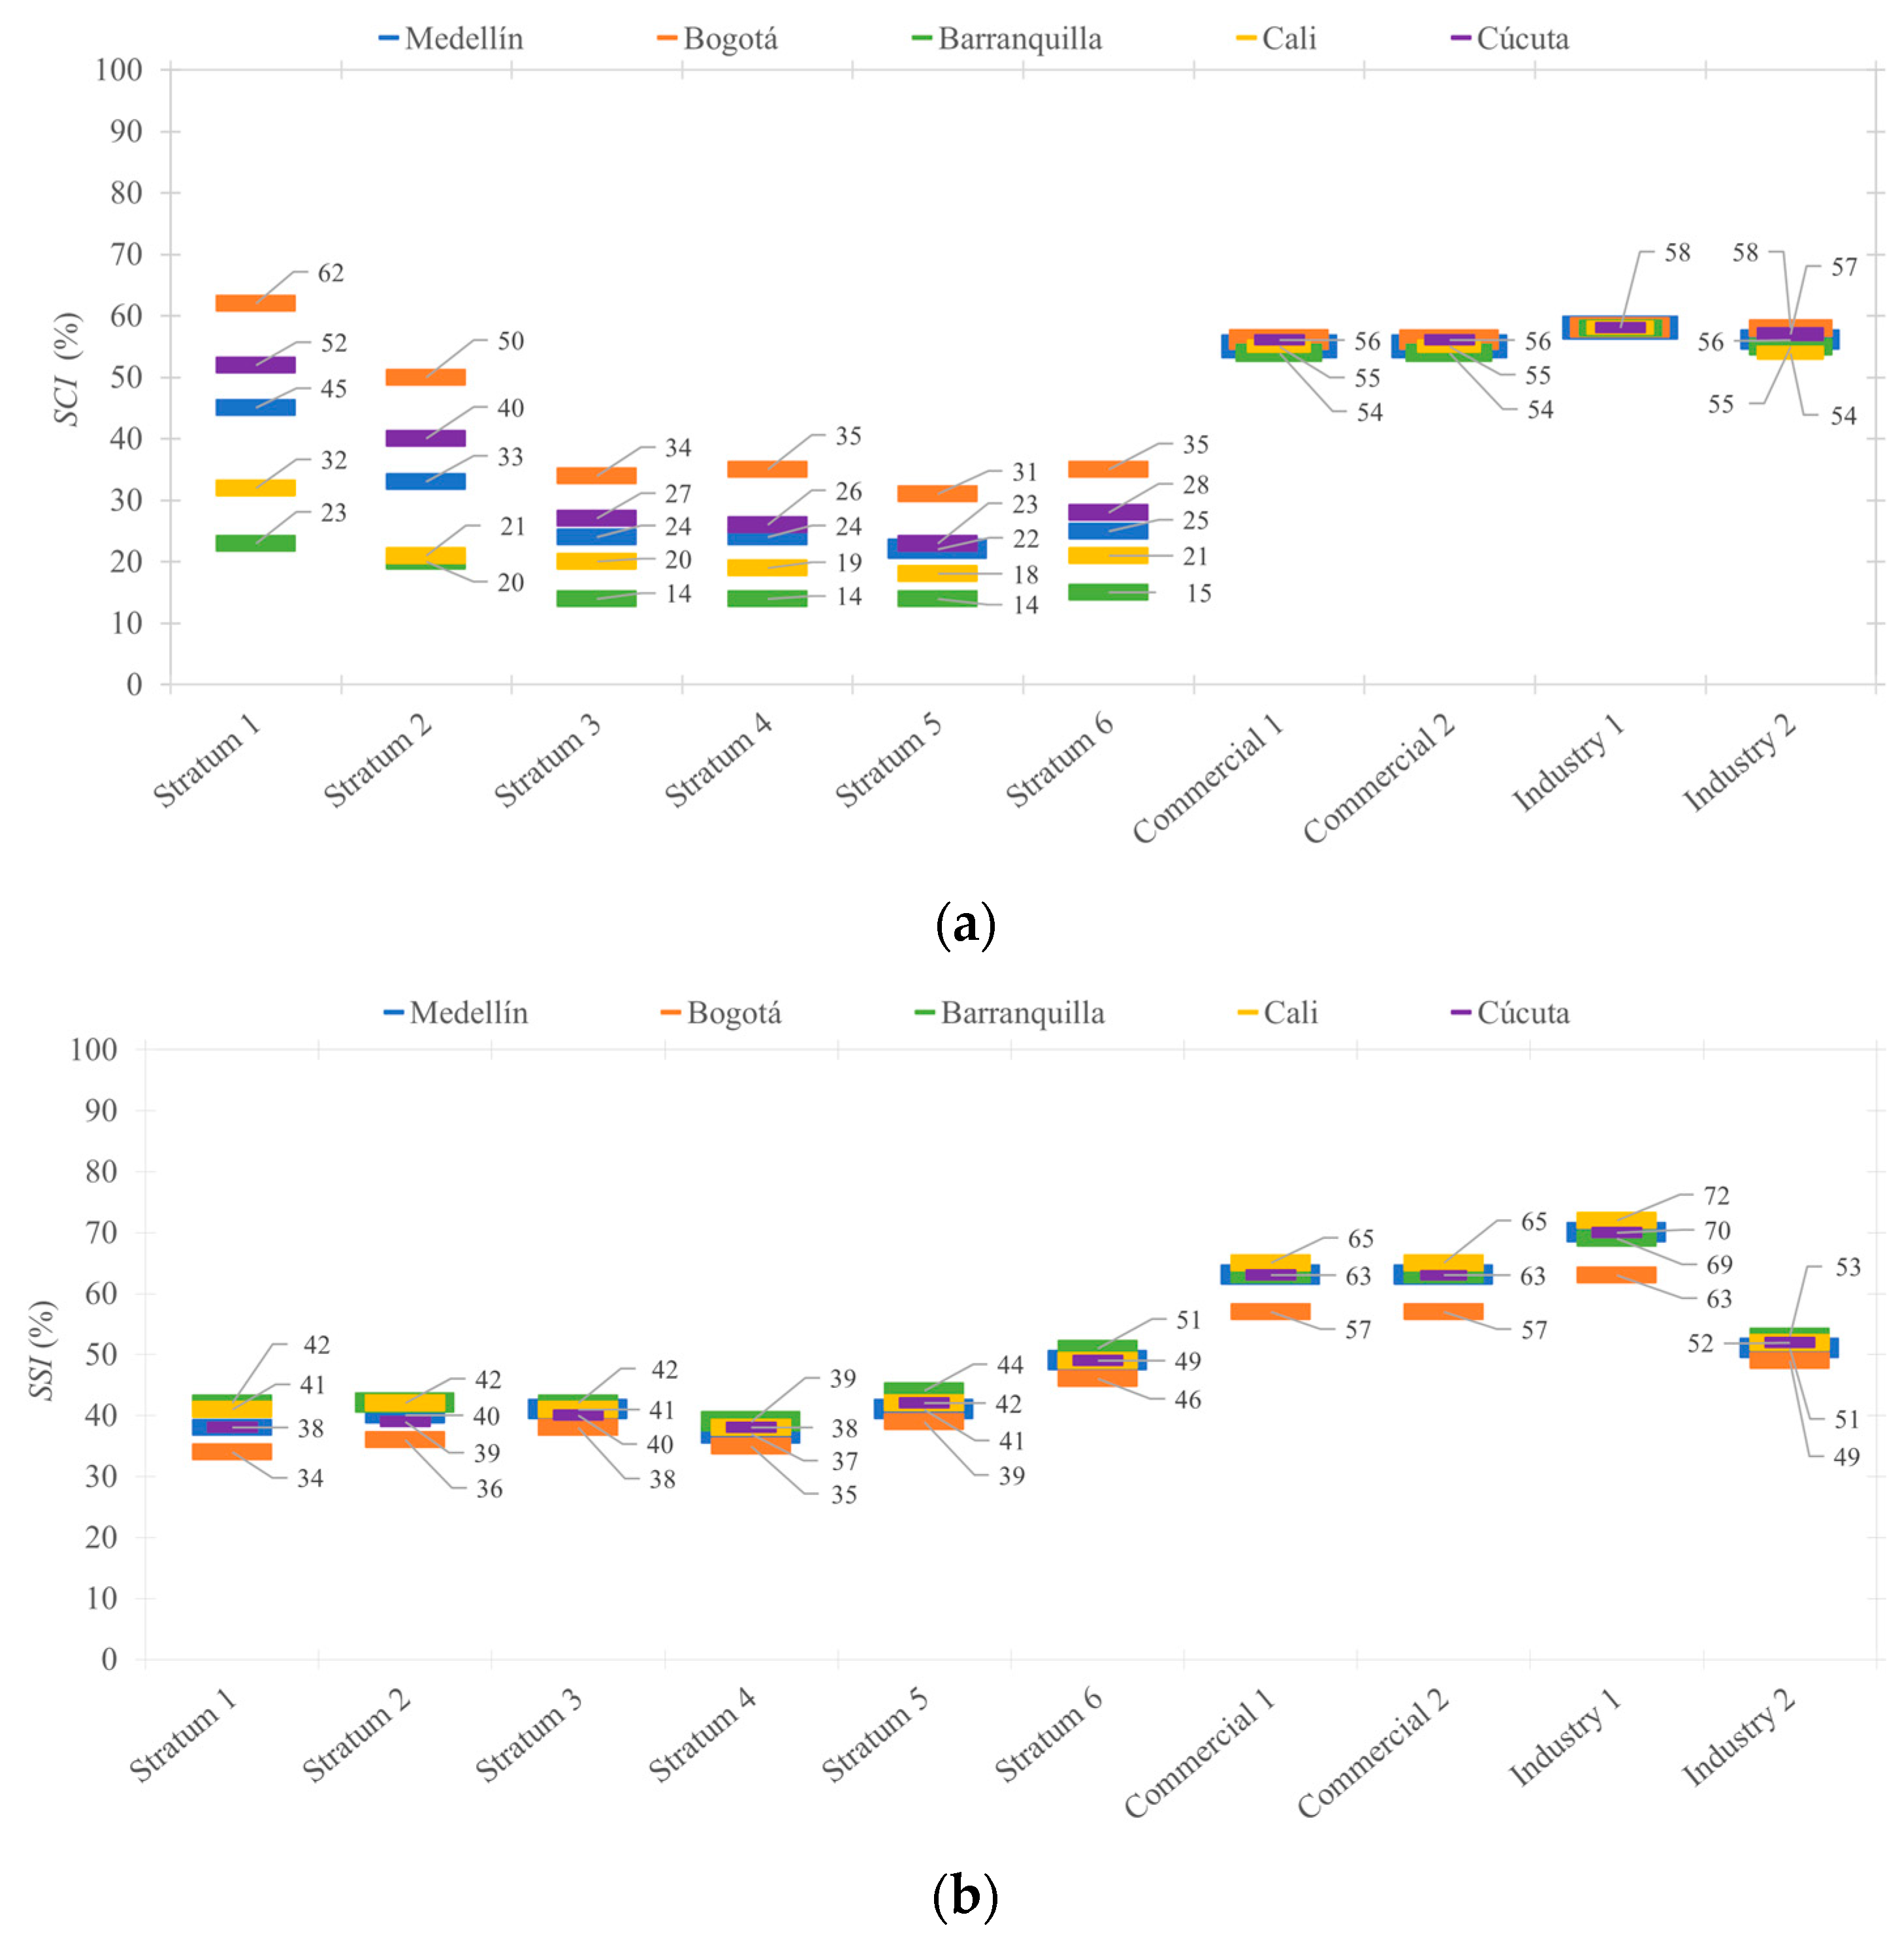
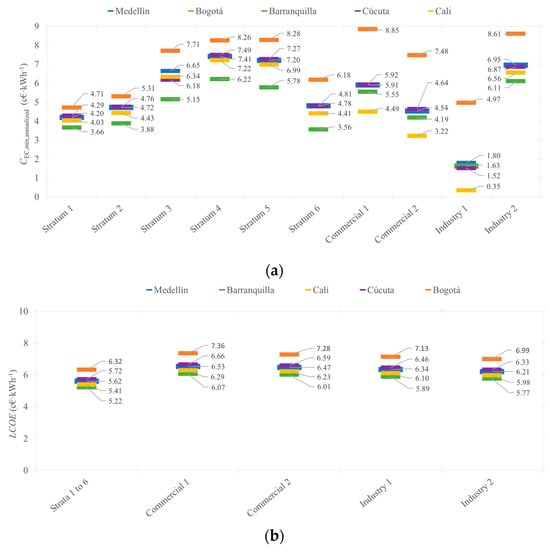
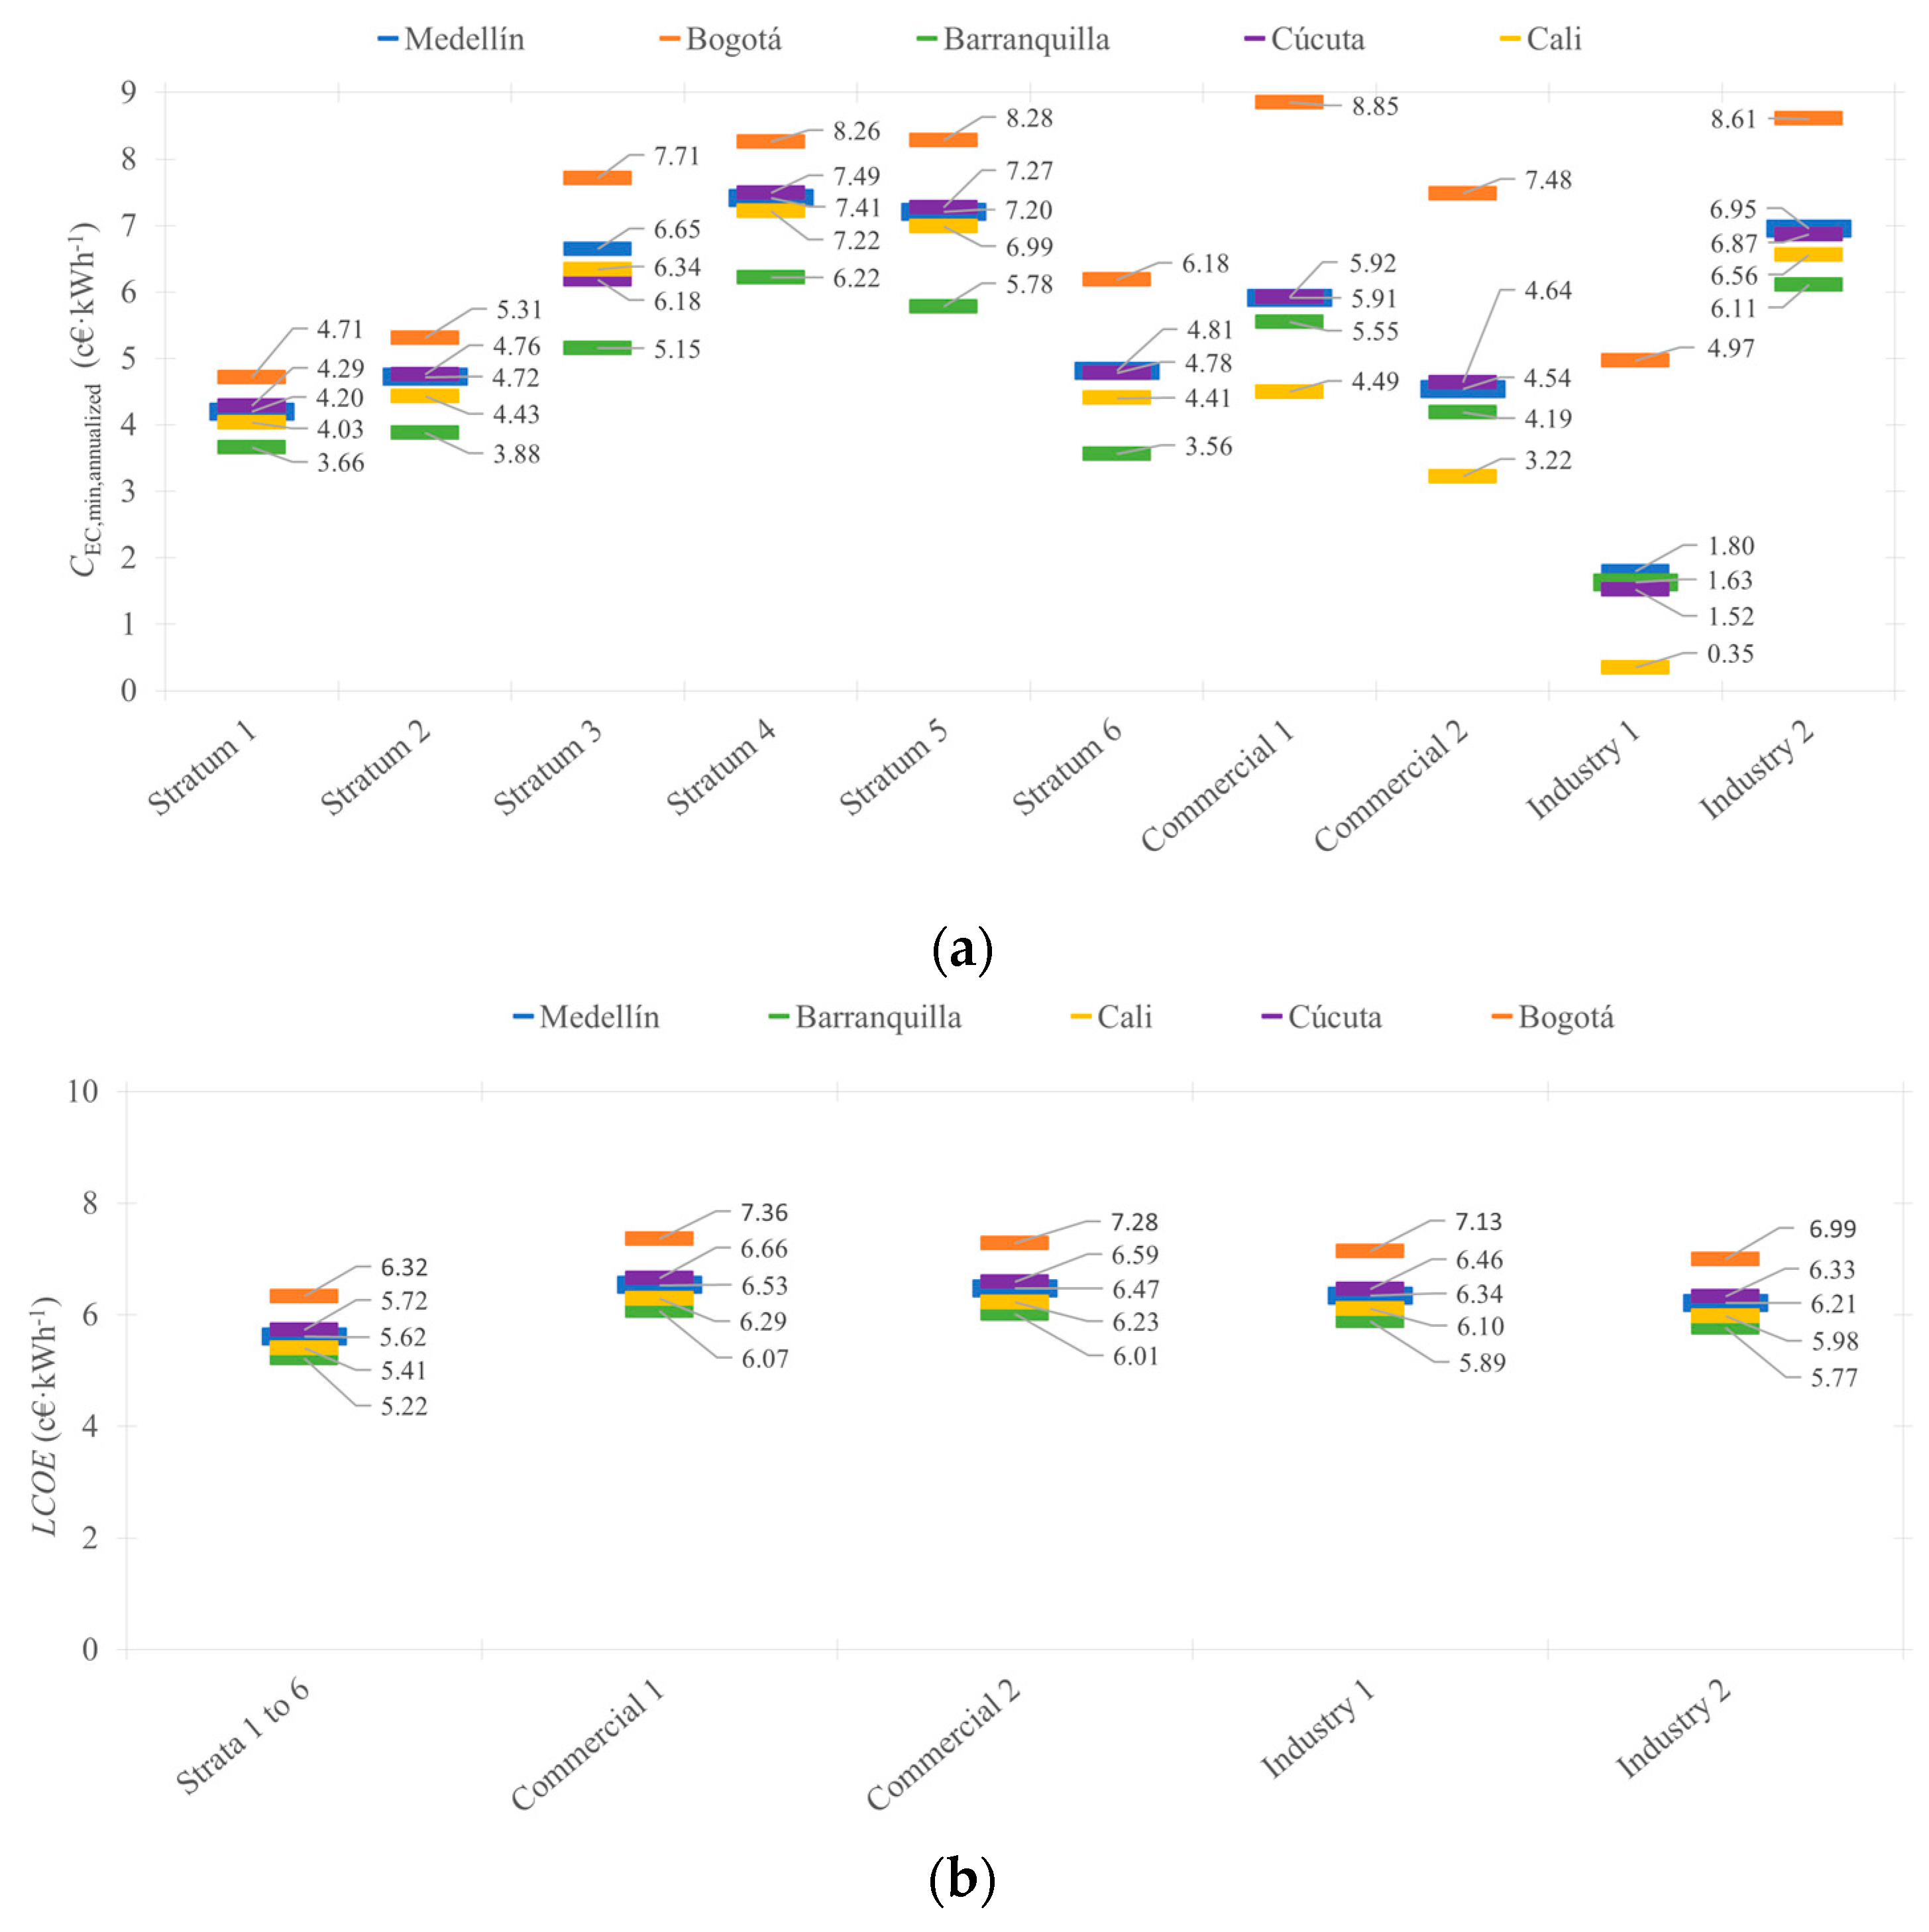

Disclaimer/Publisher’s Note: The statements, opinions and data contained in all publications are solely those of the individual author(s) and contributor(s) and not of MDPI and/or the editor(s). MDPI and/or the editor(s) disclaim responsibility for any injury to people or property resulting from any ideas, methods, instructions or products referred to in the content. |
© 2026 by the authors. Licensee MDPI, Basel, Switzerland. This article is an open access article distributed under the terms and conditions of the Creative Commons Attribution (CC BY) license.