


Abstract
Green towing departure represents a significant approach towards achieving green civil aviation, offering greater efficiency and environmental benefits compared to traditional departure methods. To accurately predict pilots’ visual attention allocation during towing departure and ensure safe operations, this paper proposes a predictive model based on information expectancy and an enhanced information value function. To validate the model, an instrument monitoring experiment was conducted with 14 participants under varying task weights and information presentation formats in a towing-departure context. Gaze-point distribution was recorded as an indicator of attention allocation. Participants monitor target information displayed on a simulated Head-Up Display (HUD) interface and respond to anomalies by pressing designated keys. The experimental results indicate that there is a significant correlation and good agreement between the theoretical values of attention allocation calculated using the proposed model and the actual gaze point distributions observed in the experiment. These findings provide a basis for the design of aircraft cockpit display interfaces.
1. Introduction
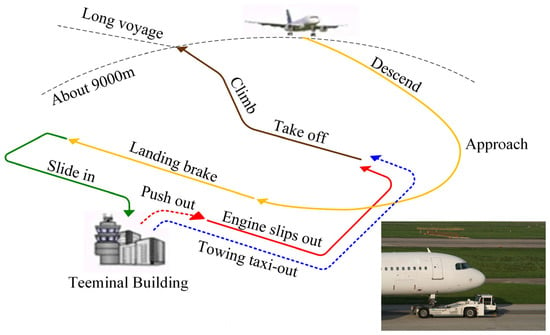
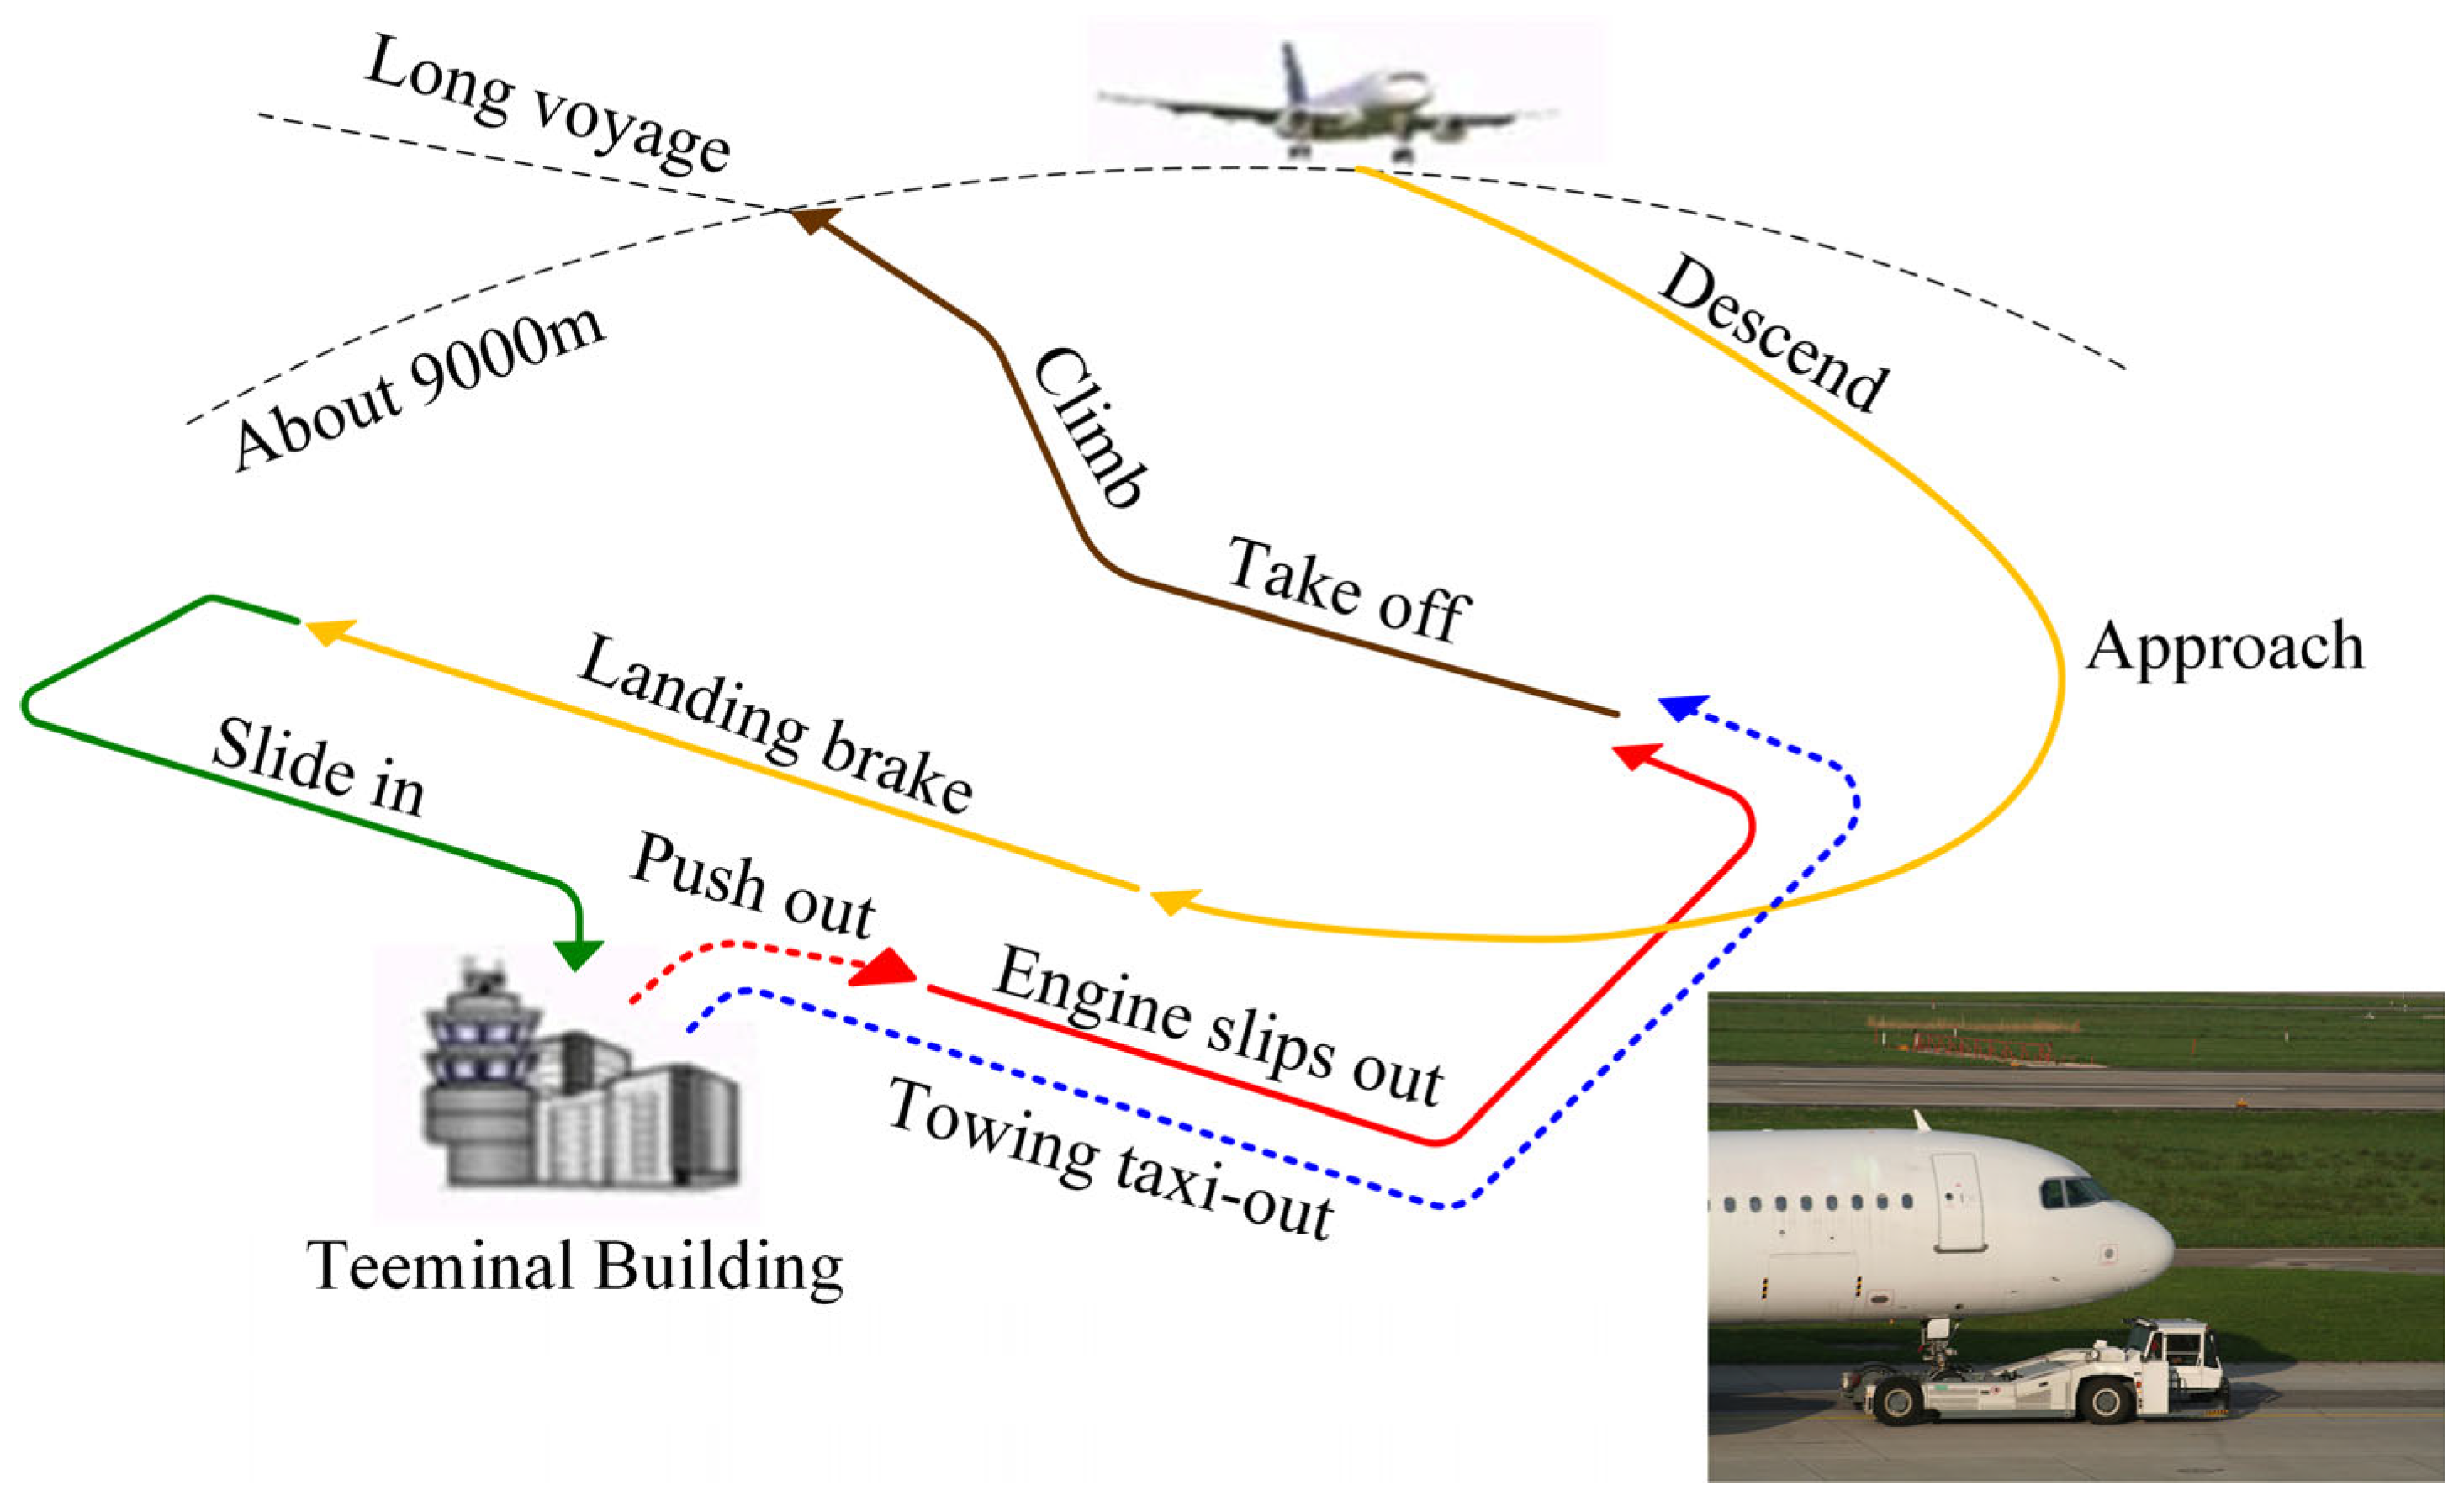
As one of the key economic activities driving societal development, aviation accounted for 2% of global greenhouse gas emissions from all economic sectors prior to the pandemic [1,2]. Based on pre-pandemic projections of aviation traffic growth, it was estimated that this proportion would rise to between 10% and 15% by 2050 [3]. Recent scenario-based assessments and net-zero roadmaps also highlight the urgency of reducing emissions across both airborne and surface phases of flight. The projected growth rate of aviation emissions exceeds that of road, rail, or maritime transport [4]. Aviation emissions encompass two distinct phases: the cruise phase and the ground operations phase [5]. Greenhouse gas emissions generated during the cruise phase contribute to global climate change [6,7]. Greenhouse gas emissions generated during the ground operations phase have a direct impact on the air quality in the vicinity of airports [8,9,10]. Although emissions during the ground operations phase account for only 5% to 10% of the total emissions from aircraft throughout their entire transportation process [11,12], the incomplete combustion of aircraft fuel during this phase results in significant environmental impacts on airports and their surrounding areas [13]. In response to this, multiple research institutions have aimed to reduce greenhouse gas emissions and improve operational efficiency during the ground phase by exploring a novel departure mode known as green towing departure, as illustrated in Figure 1. In this paper, “towing departure” is used as the umbrella term, while “green towing departure” (the blue dashed line in Figure 1) refers to engine-off taxi-out enabled by external towing. This mode involves an integrated aircraft towing system where a tug vehicle is connected to the aircraft’s nose landing gear via a wheel-hugging mechanism, enabling efficient movement within the airport through the power provided by the tug. Depending on the implementation, towing may be performed by a tow tractor/tug and towbar system or by a towbar-less towing vehicle; both are treated as towing-departure enabling technologies in this study. Recent concept-of-operations and safety guidance on sustainable taxi operations highlight multiple solutions (e.g., single-engine taxiing, external towbar-less towing, and hybrid procedures) and underscore the importance of reliable monitoring during towing operations [14,15,16]. Quantitative analyses of alternative taxiing methods, including dispatch towing, have reported measurable reductions in fuel consumption and pollutant emissions during the taxi phase compared with full-engine taxiing [17].
Figure 1.
Schematic diagram of the towing departure process.
Although the new departure mode is more economical, environmentally friendly, and efficient, it also increases the requirement for pilots to acquire information from the towing system. This necessitates a change in the current attention allocation habits of pilots, with an increased need to monitor both internal and external information interfaces within the cockpit. During towing departure, pilots must allocate attention across outside-view guidance, ATC communications, and towing-system status presented on cockpit/Electronic Flight Bag (EFB) interfaces. This shift motivates the need to model and predict pilots’ visual attention allocation under towing-departure monitoring demands, which is essential for safe operations and for designing effective cockpit/EFB displays.
Recent advances in green towing operations and aviation eye-tracking research provide context for this study, but critical gaps remain. In green towing, recent work focuses on technical optimization such as autonomous and electric tug systems developed by ICAO 2025 [18], and dynamic planning frameworks proposed by Van Oosterom and Mitici [19,20]. However, these studies overlook human factors, particularly pilot attention and workload in semi-active towing loops. In aviation safety, eye-tracking has been validated for pilot performance assessment including gaze-based training from RMIT University [21], multimodal monitoring by Wu et al. [22], and workload metrics identified by PubMed Central 2025. Yet existing attention models like the SEEV model [23] are ill-suited for towing’s low-dynamic and high-uncertainty tasks such as intermittent towing-system checks. Notably, several relevant recent studies emphasized in the initial review focus on eye-tracking in airport safety and operations but do not extend to towing-departure scenarios, reinforcing the need for a dedicated model. Table 1 synthesizes key studies to clarify gaps.
Since the 1970s, there has been a growing interest in the impact of attention on transportation safety. Notably, the research by Kahneman, Shinar, and Mihal [24,25,26] has demonstrated a significant correlation between attention and the incidence of road traffic accidents. Additionally, studies have shown that approximately 80% of all acquired information is obtained visually [27]. Failures in attention selection, leading to the omission of critical information, account for 76% of situational awareness errors [28]. More recent human-factors studies in aviation similarly emphasize that monitoring failures and attention misallocation can contribute to safety-relevant events, especially in multi-source information environments. These findings underscore the heightened importance of attention research in the context of aviation and human-factors engineering.
Since the turn of the 21st century, Wickens has conducted simulated flight experiments to compare the acquisition of audio and visual information. The results indicated that visual presentation is less costly compared to auditory presentation. He also developed a multiple resource theory-based attention allocation model, which was validated through visual scanning experiments [29]. Wickens’ SEEV (Situation, Effort, Expectancy, and Value) model has been widely applied in the aviation field and has become the predominant attention allocation model. Many researchers have focused on quantifying and calculating the various factors within the SEEV model [30,31,32]. Wu Xu, drawing from the theory of subjective expected utility and the SEEV model, combined it with the maximum mixed entropy model to construct and validate an attention allocation model under multifactorial conditions [33]. Building on the attention allocation model under multifactorial conditions and the SEEV model, Wu Xu introduced the concepts of resource allocation space, which reflects the attentional resources obtained by regions of interest, and attention control space, which encompasses the factors influencing attention allocation. He then used spatial mapping methods to develop an attention allocation model [34]. Wang Chao employed a dynamic region-of-interest segmentation method combined with Markov chain theory to study the probability and distribution of attention shifts for air traffic controllers during conflict resolution [35]. Wan Yanxiaoru constructed an attention allocation model based on mixed entropy, grounded in cognitive engineering, fuzzy mathematics, and generalized information theory, in order to optimize the SEEV model and strengthen its predictive ability [36,37,38]. However, existing expectancy–value formulations may not fully capture towing-departure monitoring characteristics, where attention can be concentrated on forward/peripheral outside-view regions while safety-critical towing-system indicators may be sampled intermittently under uncertainty. This motivates integrating an enhanced information-value formulation that better reflects priority under subjective uncertainty in towing-departure monitoring. This study proposes a multifactorial attention allocation model based on information importance, occurrence probability, salience, and effort on the basis of the SEEV model and the mixed full-fledged maximization model, and follows the hybrid full-fledged model as mentioned before to integrate the multifactor. Matsui Nobuyuki described attention allocation as the ratio of the sum of the expected values of object information and presented information, providing a clearer theoretical foundation for attention allocation models through the introduction of a cognitive evaluation model [39]. Fang Weining, building upon the work of Wan Yanxiaoru and Matsui Nobuyuki, improved the attention allocation model to address the issue of high information importance but low attention allocation [40]. Building on these efforts, the present study proposes a predictive attention-allocation model for towing departure based on information expectancy and an improved information value function, and validates the model using an instrumented monitoring experiment with eye-tracking data.
Table 1.
Summary of relevant studies and core gaps.
Overall, the existing literature provides limited operationally grounded, towing-specific attention-allocation models that can quantify how information expectancy and information value jointly drive gaze distribution under multi-source monitoring demands. Accordingly, this study develops and validates a towing-departure attention-allocation prediction model grounded in information expectancy and an improved information-value formulation, and evaluates it using eye-tracking data collected in a controlled towing-departure simulation.
The main research questions are as follows: RQ1: How is pilot visual attention distributed across key AOIs during straight taxiing, turning, and obstacle-avoidance towing tasks? RQ2: Can an expectancy–value model with an improved information value function predict observed attention allocation more accurately than a baseline model?
The contributions of this work are: (i) an operational definition and computation of information expectancy and information value for towing-departure monitoring; (ii) an improved information-value function that maps importance membership into a priority scale and incorporates mixed entropy to represent uncertainty; (iii) an eye-tracking experiment in a towing-departure simulation scenario and quantitative validation of model predictions; and (iv) practical design implications for towing-departure cockpit and electronic flight bag interfaces and context-adaptive information prioritization.
2. Model Development and Theoretical Framework
In the context of green towing departure operations, pilots typically need to simultaneously monitor multiple regions of interest (ROIs) or areas of interest (AOIs) to safely complete the departure task. For consistency, this study uses AOI to denote predefined visual regions on the display/outside scene. Let us assume that the attentional resources allocated to these AOIs are denoted as:
Pilots acquire and process information from these AOIs based on the task requirements in a top-down manner. According to the optimal expected-value model (EV model), we introduce the concepts of information expectancy P and information importance V to quantify the attention allocation. The expressions for these are as follows:
In Equation (2), represents the attentional resources allocated to a specific AOI; reflects the information expectancy, which is the probability that the information in a particular AOI will occur. According to information theory, the sampling frequency is positively correlated with the probability of an event. Therefore, the higher the event occurrence level within an AOI, the more frequently the individual will sample information from that AOI. Thus, the information expectancy for the AOI is quantified as follows:
In Equation (3), represents the number of times information needs to be sampled from the AOI. denotes the information value of a specific AOI, which is related to the task requirements. In the multifactorial attention allocation model (Model 1) proposed by Wan Yanxiaoru, the expression for is as follows:
where is the importance membership degree of the information in AOI , and is the probability of the information’s potential cognitive state (i.e., the probability of being cognitively evaluated/processed in AOI ). Fang Weining found that when the attention distribution is too concentrated in a certain area, the multi-factor model will have the problem that the importance of information membership is the highest, but the information value is not the highest. Therefore, to address the mismatch between “high importance membership” and “high predicted information value”, a visual attention distribution model with a higher attention ratio and higher information value is established in this study. Therefore, the importance of membership of the information needs to be improved to determine the priority of the information, which ranges from 0 to positive infinity. Aiming at the similarity of information content and cognitive behavior definition, we propose a priority function to manage the important membership of information. The important membership degree of the improved information , as shown in Equation (5), indicates the tendency of operators to pay more attention to more important information:
According to Equation (5), the improved expression of information value (Model 2) can be obtained as follows:
In Formula (6) is the importance membership degree of information in AOI , and denotes the probability of the information’s potential cognitive state. The probability generated by people’s subjective evaluation of information importance and cognitive state has certain fuzziness and randomness. Two types of fuzziness are irreplaceable with each other yet complementary; thus, the uncertainty jointly caused by fuzziness and randomness can be measured by introducing the concept of mixed entropy in information theory, which is composed of fuzzy entropy and probability entropy [41]. If the sum of the mixing entropy of individual visual information is the total mixing entropy, then the expression is shown as Equation (7):
As a basic function, fuzzy entropy is mainly used to quantify the degree of fuzziness of information. Specifically, the size of fuzzy entropy directly reflects the clarity of an individual’s perception of specific information. When the value of fuzzy entropy is larger, it means that the individual’s perception of the information is more fuzzy and the uncertainty is higher. On the other hand, if the fuzzy entropy is zero, it indicates that the individual’s perception of the information has reached a state of complete clarity, without any ambiguity or uncertainty. In order to determine the degree of source uncertainty, Shannon used the mean value of the information function in the source space for measurement, also known as information entropy or probability entropy, to reflect the probability of information occurrence [42]. If there are pieces of visual information on a certain interface, and the information generation probability of the -th potential cognitive evaluation is , then the fuzzy entropy and probabilistic entropy can be expressed by Equations (8) and (9) respectively.
In Equation (8), denotes binary fuzzy entropy, and the specific expression is shown in Equation (10).
Since operators have great fuzziness in evaluating the important membership degree of tasks in different information areas under different working conditions, and the average amount of information is the scale of fuzziness, with the increase in the average amount of information, psychological activities such as the desire to obtain information and the sense of unease caused by insufficient information will also increase, which will affect the allocation of attention [43]. In other words, when operators pay attention to the displayed information, their psychological entropy will therefore produce a corresponding psychological entropy, which becomes an important driving force to promote their attention. This phenomenon accords with the general cognitive law of human beings. Therefore, we can regard mixed entropy as a concrete manifestation of psychological entropy to reflect the psychological state and cognitive process of pilots in a specific situation.
According to the Shannon additivity principle, the average psychological entropy of a piece of visual information can be expressed as
The maximum entropy principle provides a very effective method to predict the probability distribution of random events. Under certain conditions, when the probability distribution is uniform and not affected by any subjective assumptions or judgments, the system will reach the maximum entropy, and the prediction risk will be minimized. In this case, the problem is actually transformed into an optimization problem under limited conditions. By solving the conditional extremum of the Lagrange function, we can get the probability when the average psychological entropy reaches the maximum.
Taking the partial derivative of L with respect to and setting it to zero yields the optimal probability
By substituting the Formula (15), we can obtain the maximum average psychological entropy when the pilot’s attention level is the highest.
In summary, with reference to Kleinman’s view of attention allocation ratio [44], the proportion of attention resources obtained in the fourth AOI region in the total attention resources is calculated in Equation (16).
3. Materials and Methods
3.1. Experimental Platform and Devices
- (1)
- Towing-Departure Simulation Experiment Platform
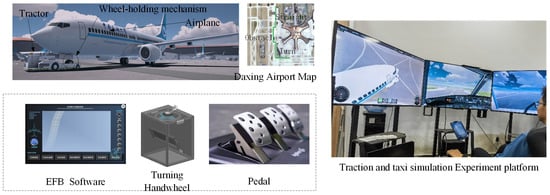
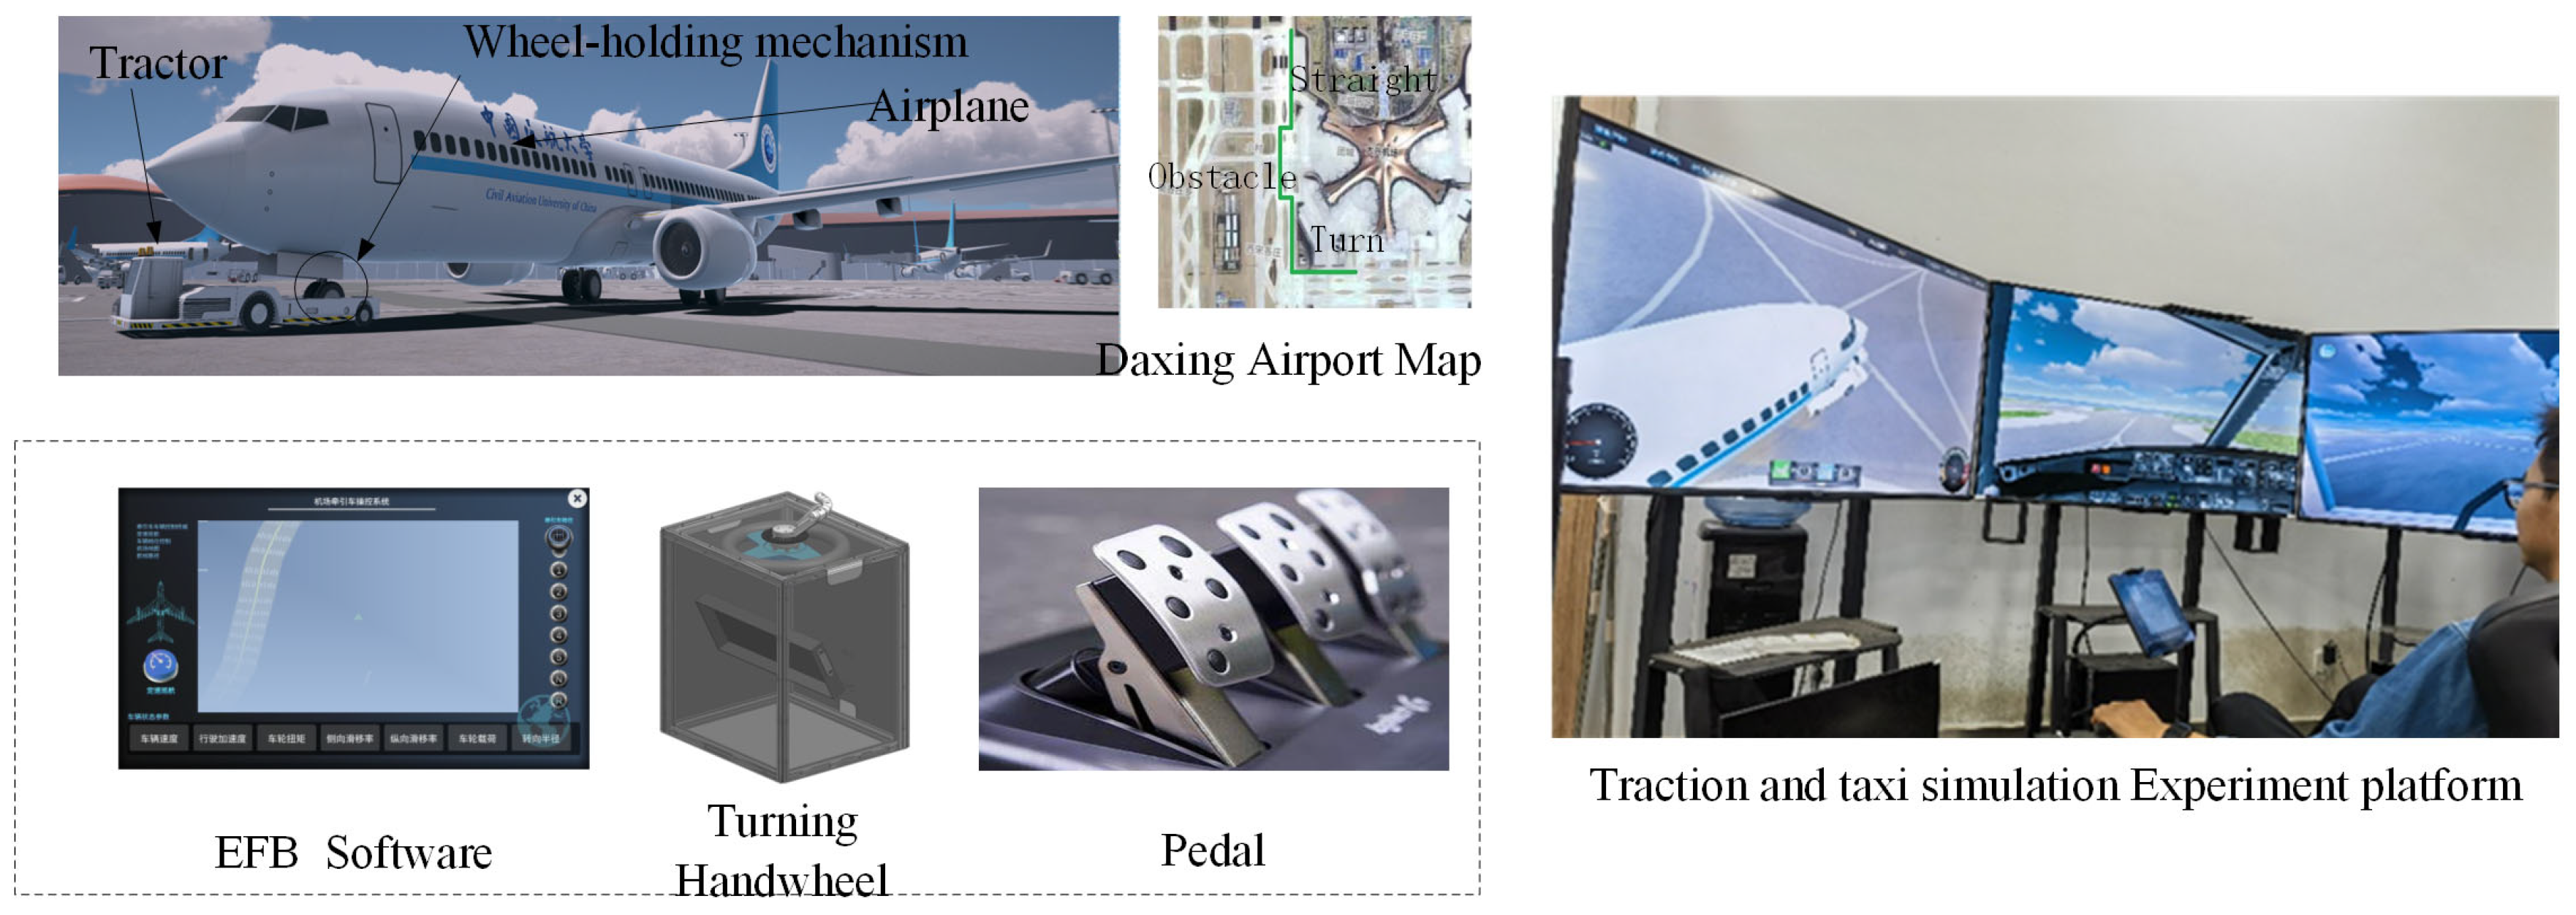
The simulation platform was developed using Unity3D (LTS version, 2022), with Beijing Daxing International Airport serving as the experimental scene. The towing departure control system, developed for an EFB, acted as the primary control object. Hardware modules, including a turning handwheel and pedals, were integrated to construct the complete simulation environment. The platform includes three 4K 55-inch displays that show the pilot’s view from the cockpit, a tractor driver’s view, and an overhead view of the aircraft’s towing system. Also included is a 10.5-inch flat panel with towing departure control software (v1.0.1) developed based on EFB, as well as pedals and homemade turning handles (see Figure 2). The aircraft towing system, which connects the aircraft and the tractor through the wheel holding mechanism, is an important execution unit of the towing departure from the port. In the process of towing out-of-port, it is necessary to prevent the phenomenon of unlocking and folding of the aircraft’s towing system, which means that the nose landing gear is removed from the wheel holding mechanism during operation. The folding phenomenon means that the longitudinal angle between the front of the tractor and the front of the aircraft is greater than 90°. The phenomenon of unlocking and folding is a major hidden danger for the safe operation of towing out-of-port. This is what the subjects need to avoid during the experiment. Unity3D was used for scenario rendering and interaction logic; the Ganzin Caelus analysis software (Ganzin Caelus 2025.10 Release) was used for gaze-data processing and AOI statistics.
Figure 2.
Towing taxi-out simulation experiment platform.
- (2)
- Eye tracking system (Ganzin eye-tracker)
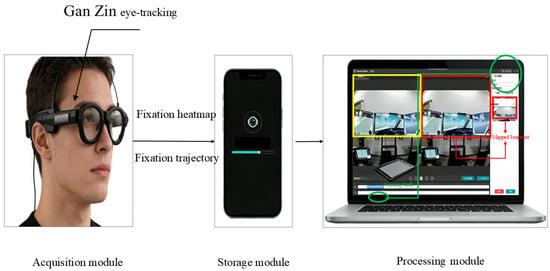
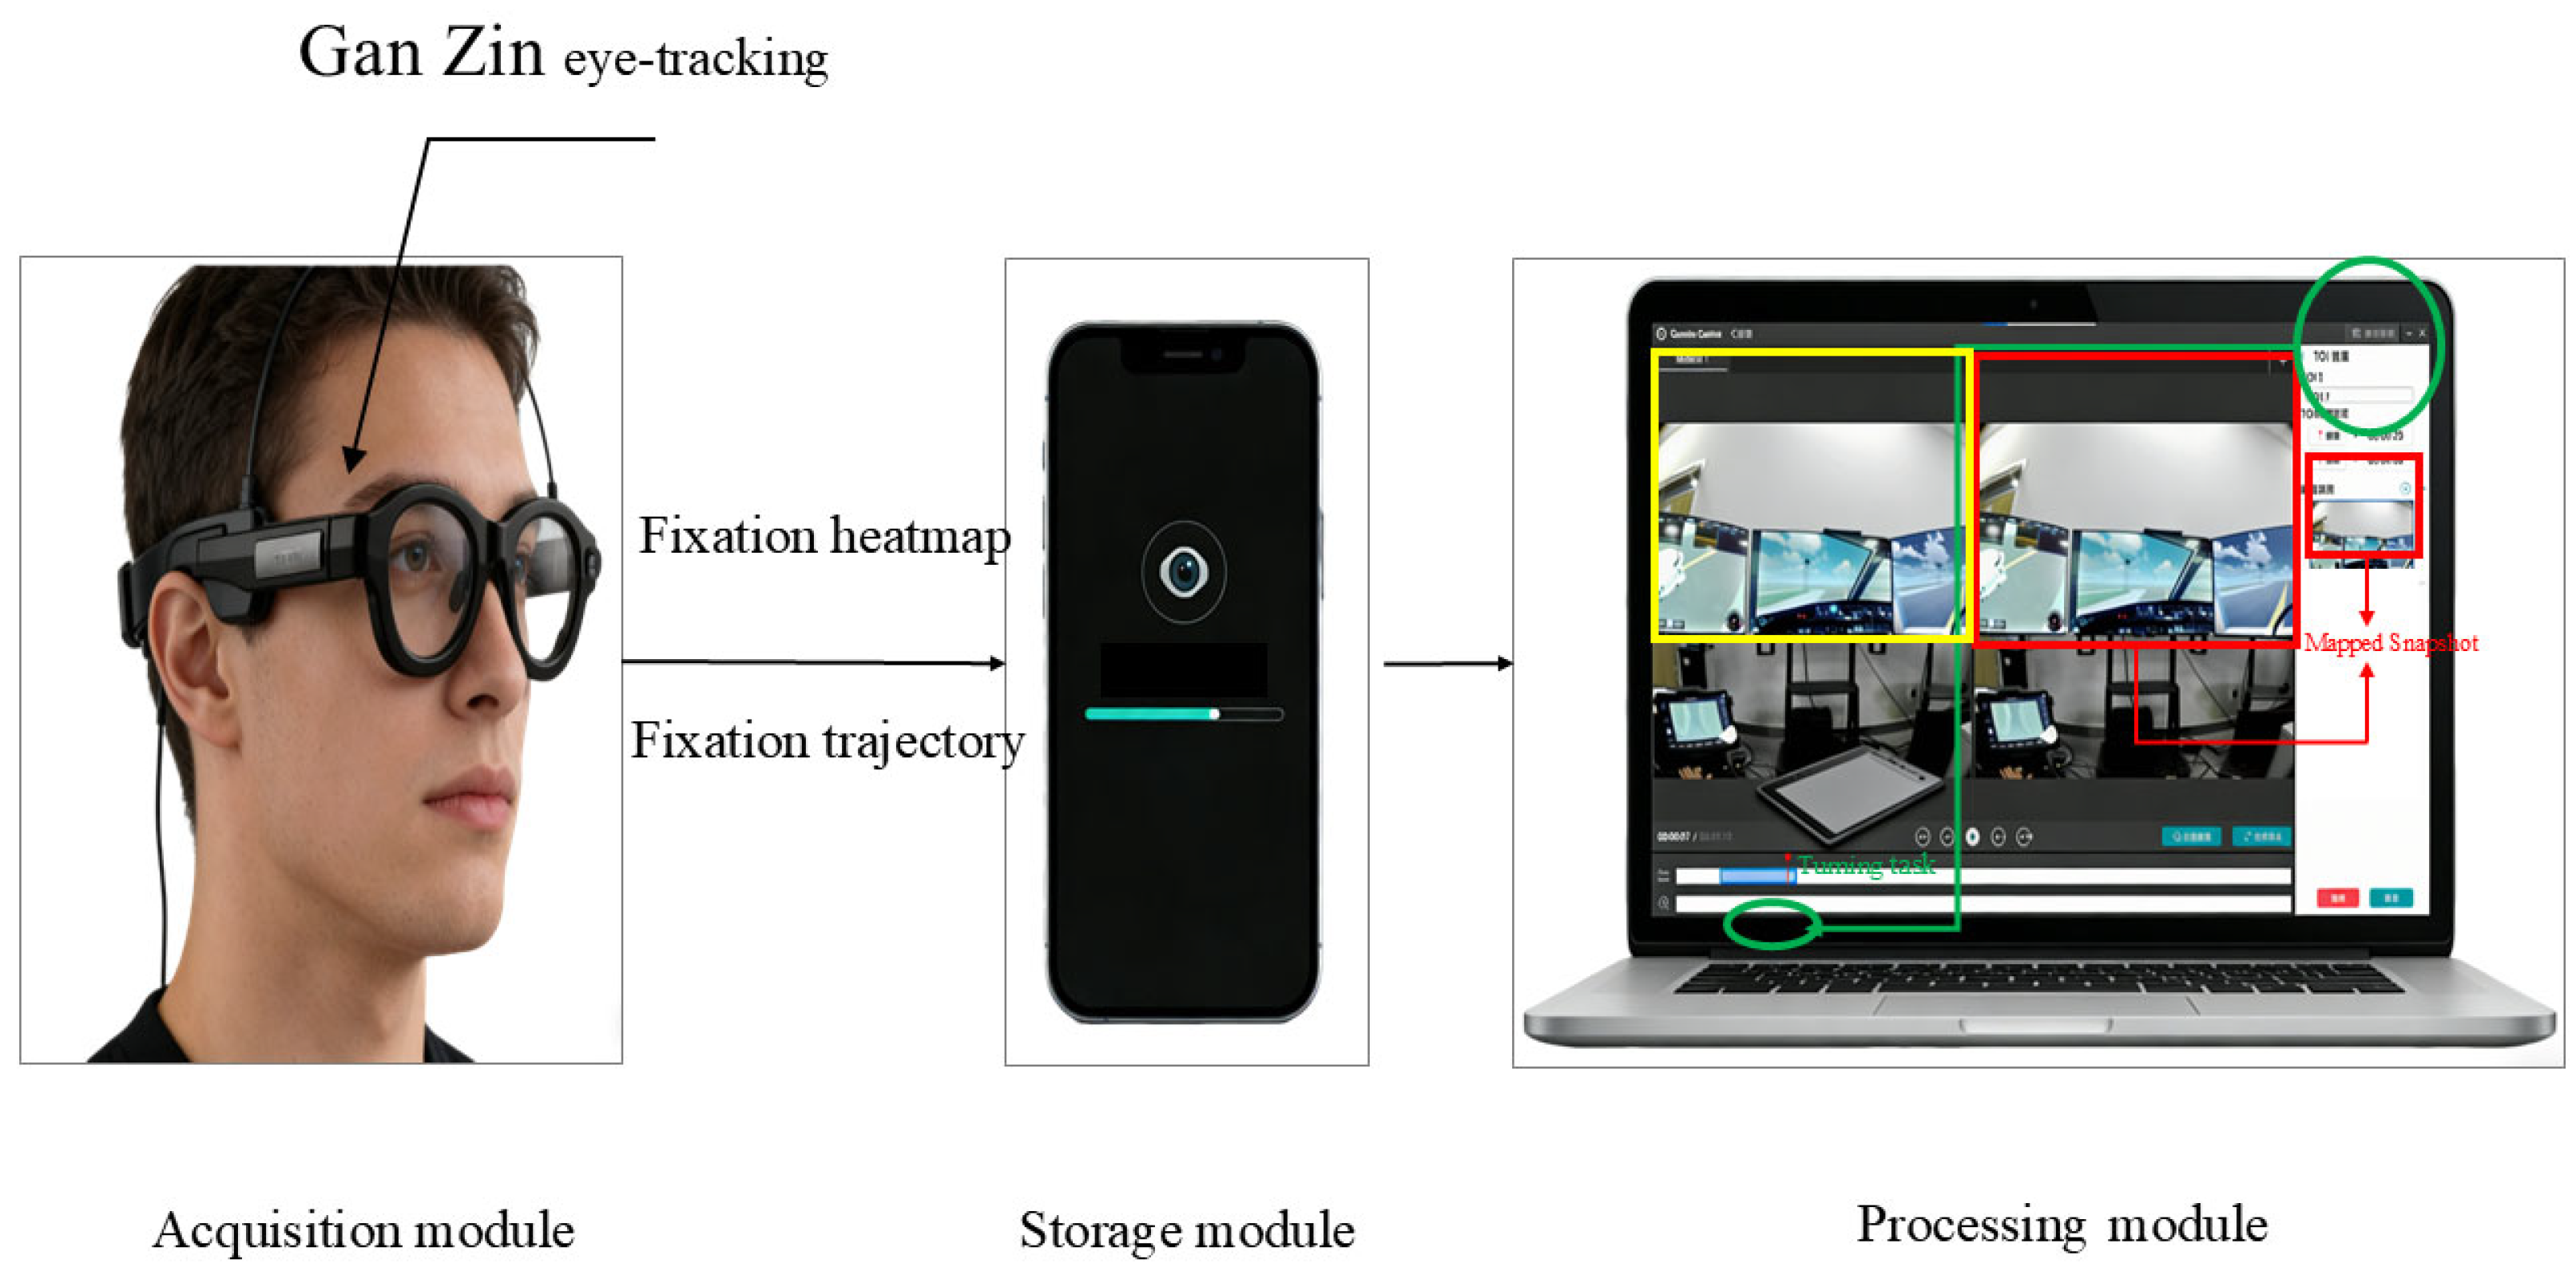
This experiment uses the Ganzin eye-tracking device to record eye movement data from the subjects. Equipped with Ganzin’s artificial intelligence algorithm, this eye-tracking device requires only a few components to obtain accurate and stable eye-movement data. With a sampling rate of up to 120 Hz and a 1080p front camera with an ultra-wide angle (FOV of 140°), the Ganzin eye-tracker consists of an acquisition module, a storage module, and a processing module (see Figure 3). In this experiment, the storage module is a cell phone, and the processing module is a laptop. During the experiment, the head-mounted acquisition module was used to collect the eye movement data of the subjects, and these eye movement data were stored in the storage module in real time. And after the experiment was finished, the eye movement data in the storage module were imported into the processing module to complete the data analysis using Ganzin Caelus software.
Figure 3.
Ganzin eye-tracking device.
3.2. Participants and Ethics
A total of 14 participants from the Civil Aviation University of China and Tianjin Sino-German University of Applied Sciences participated in this experiment, all of whom had a professional background in tractor departure research, and their ages ranged from 22 to 29 years old. The subjects were in good health, had normal vision, were not color blind or weak, and were all right-handed. All participants reported normal or corrected-to-normal vision and no history of ocular disease. This study was conducted in accordance with institutional research-ethics requirements; informed consent was obtained from all participants prior to participation.
Note that the recruited participants served as representative operators for the simulated towing-departure monitoring task in a ground-operation context. They were trained on the interface and procedure prior to the formal trials to ensure familiarity with the task and response method.
3.3. Tasks and Scenarios
Three representative towing taxi-out tasks were designed to simulate typical green towing departure operations: (i) straight taxiing, (ii) turning at an intersection, and (iii) obstacle avoidance. During each task, participants monitored the HUD-like interface and EFB-style towing control panel for towing-system status and environmental cues.
This study proposes a novel operational concept where the pilot retains active command of the towing speed via an EFB interface, rather than being passively towed. This “Pilot-in-the-Loop” design is expected to require higher situational awareness. The control logic is implemented as follows:
Speed Control: The pilot selects target speed gears (Neutral, 15 km/h, 25 km/h, or 35 km/h) on the EFB. The tug then accelerates to the target speed.
Steering: The pilot manages the aircraft’s heading using the cockpit tiller.
Braking: The pilot uses cockpit pedals for deceleration and emergency braking during the towing process.
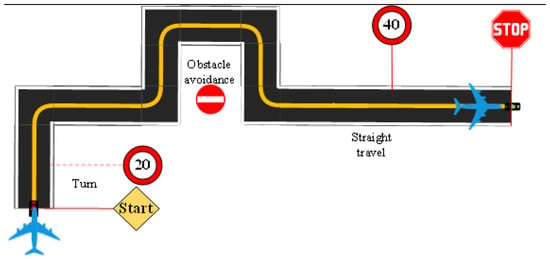
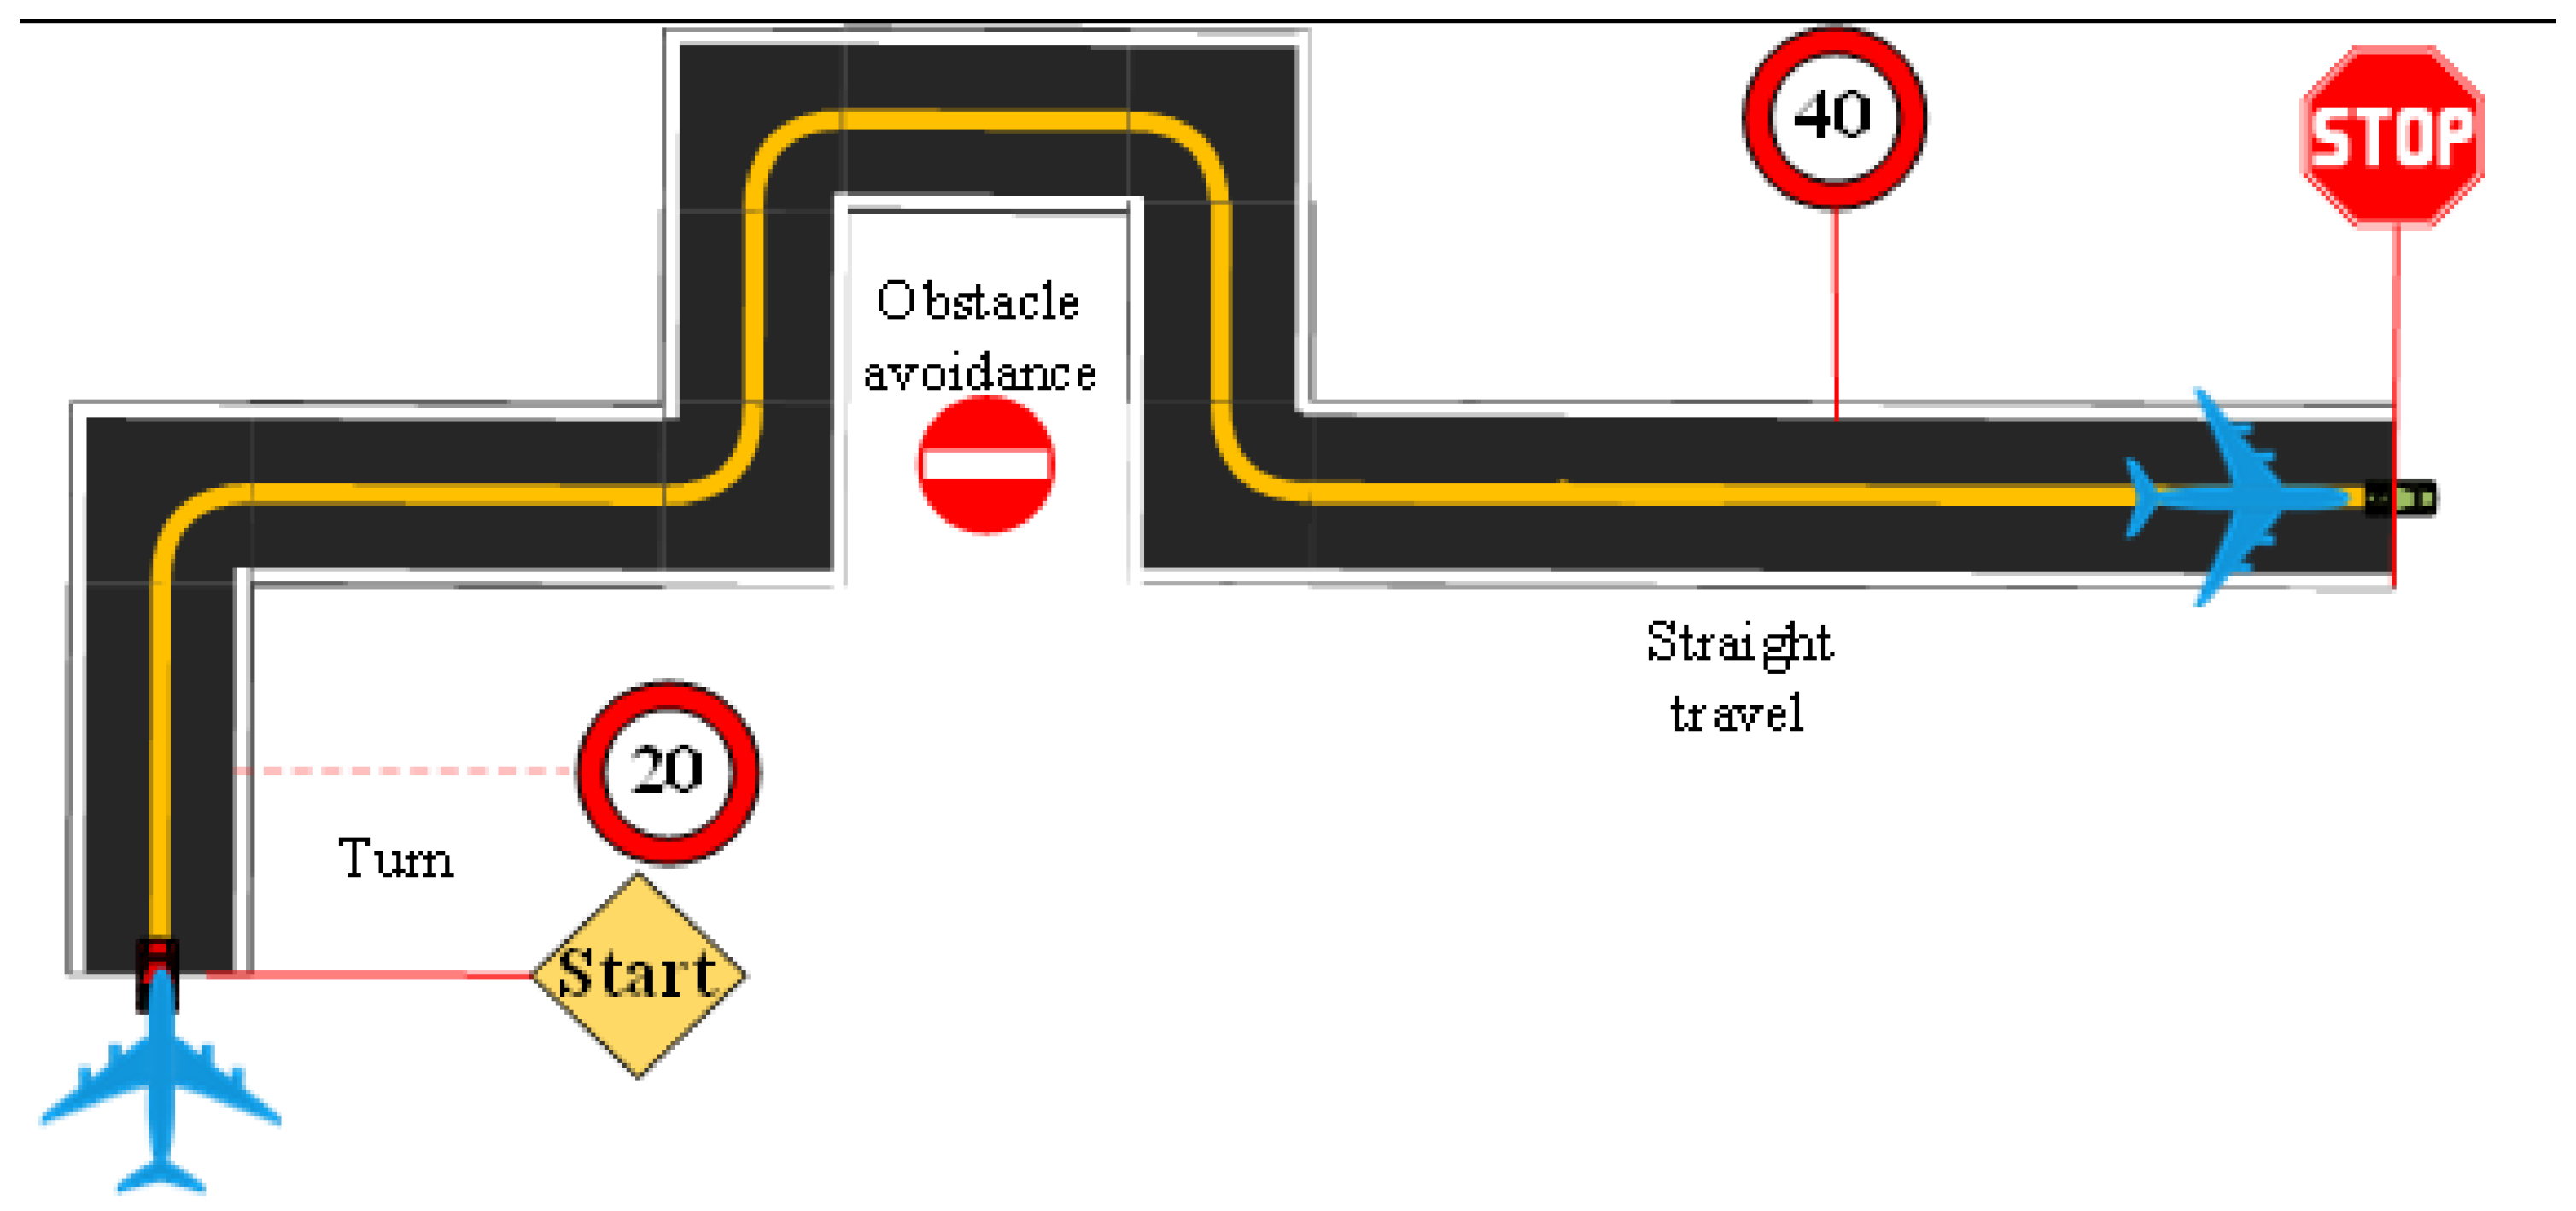
To elicit realistic monitoring demands, specific constraints and abnormal states were embedded in the scenarios. These included speed limits (40 km/h for straight segments; 20 km/h for turns), system warnings, and potential jackknifing tendencies. Each task trial lasted approximately 7 min per speed gear setting. The flight mission is shown in Figure 4.
Figure 4.
Experimental tasks.
3.4. Experimental Procedure
The implementation steps of the experiment can be divided into the preparation stage before the experiment, the testing stage, and data analysis. Before the start of the experiment, it is necessary to explain the experimental process and precautions to the subjects, familiarize them with the experimental scene and driving operation, and perform eye-movement calibration and calibrate the instrument status for the subjects. Participants wore the eye-tracking device throughout the driving task. The experiment was conducted in a quiet, undisturbed space with stable ambient lighting. Subjects controlled the towing system using the EFB gears and a turning handwheel. They were instructed to maintain the designated route and prevent excessive jackknifing angles between the tractor and aircraft. Adherence to speed limits was required: below 40 km/h for straight segments and below 20 km/h during turns. The tractor speed was limited to 40 km/h for straight taxiing and 20 km/h for turning. Participants completed the turning, obstacle avoidance, and straight-line tasks in sequence. Following the trials, information expectancy () and importance membership () were derived from post-trial questionnaires. These values are summarized in the table below. Before formal data collection, participants received standardized instructions and completed practice trials to familiarize themselves with the interfaces, AOIs, and response keys. The order of the three task conditions and in-formation-presentation formats was counterbalanced across participants to reduce order effects. For each trial, participants were instructed to prioritize safe taxi-out monitoring and to press the designated key as soon as an anomaly was detected; response time and correctness were recorded.
3.5. AOI Definition and Eye-Tracking Metrics
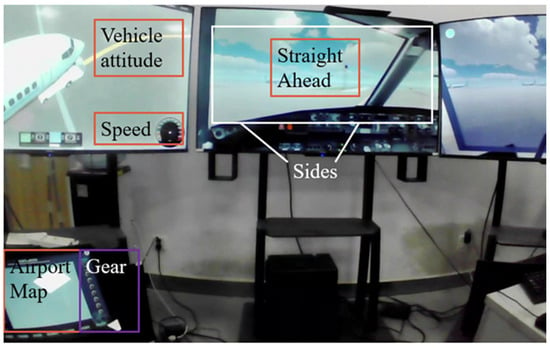
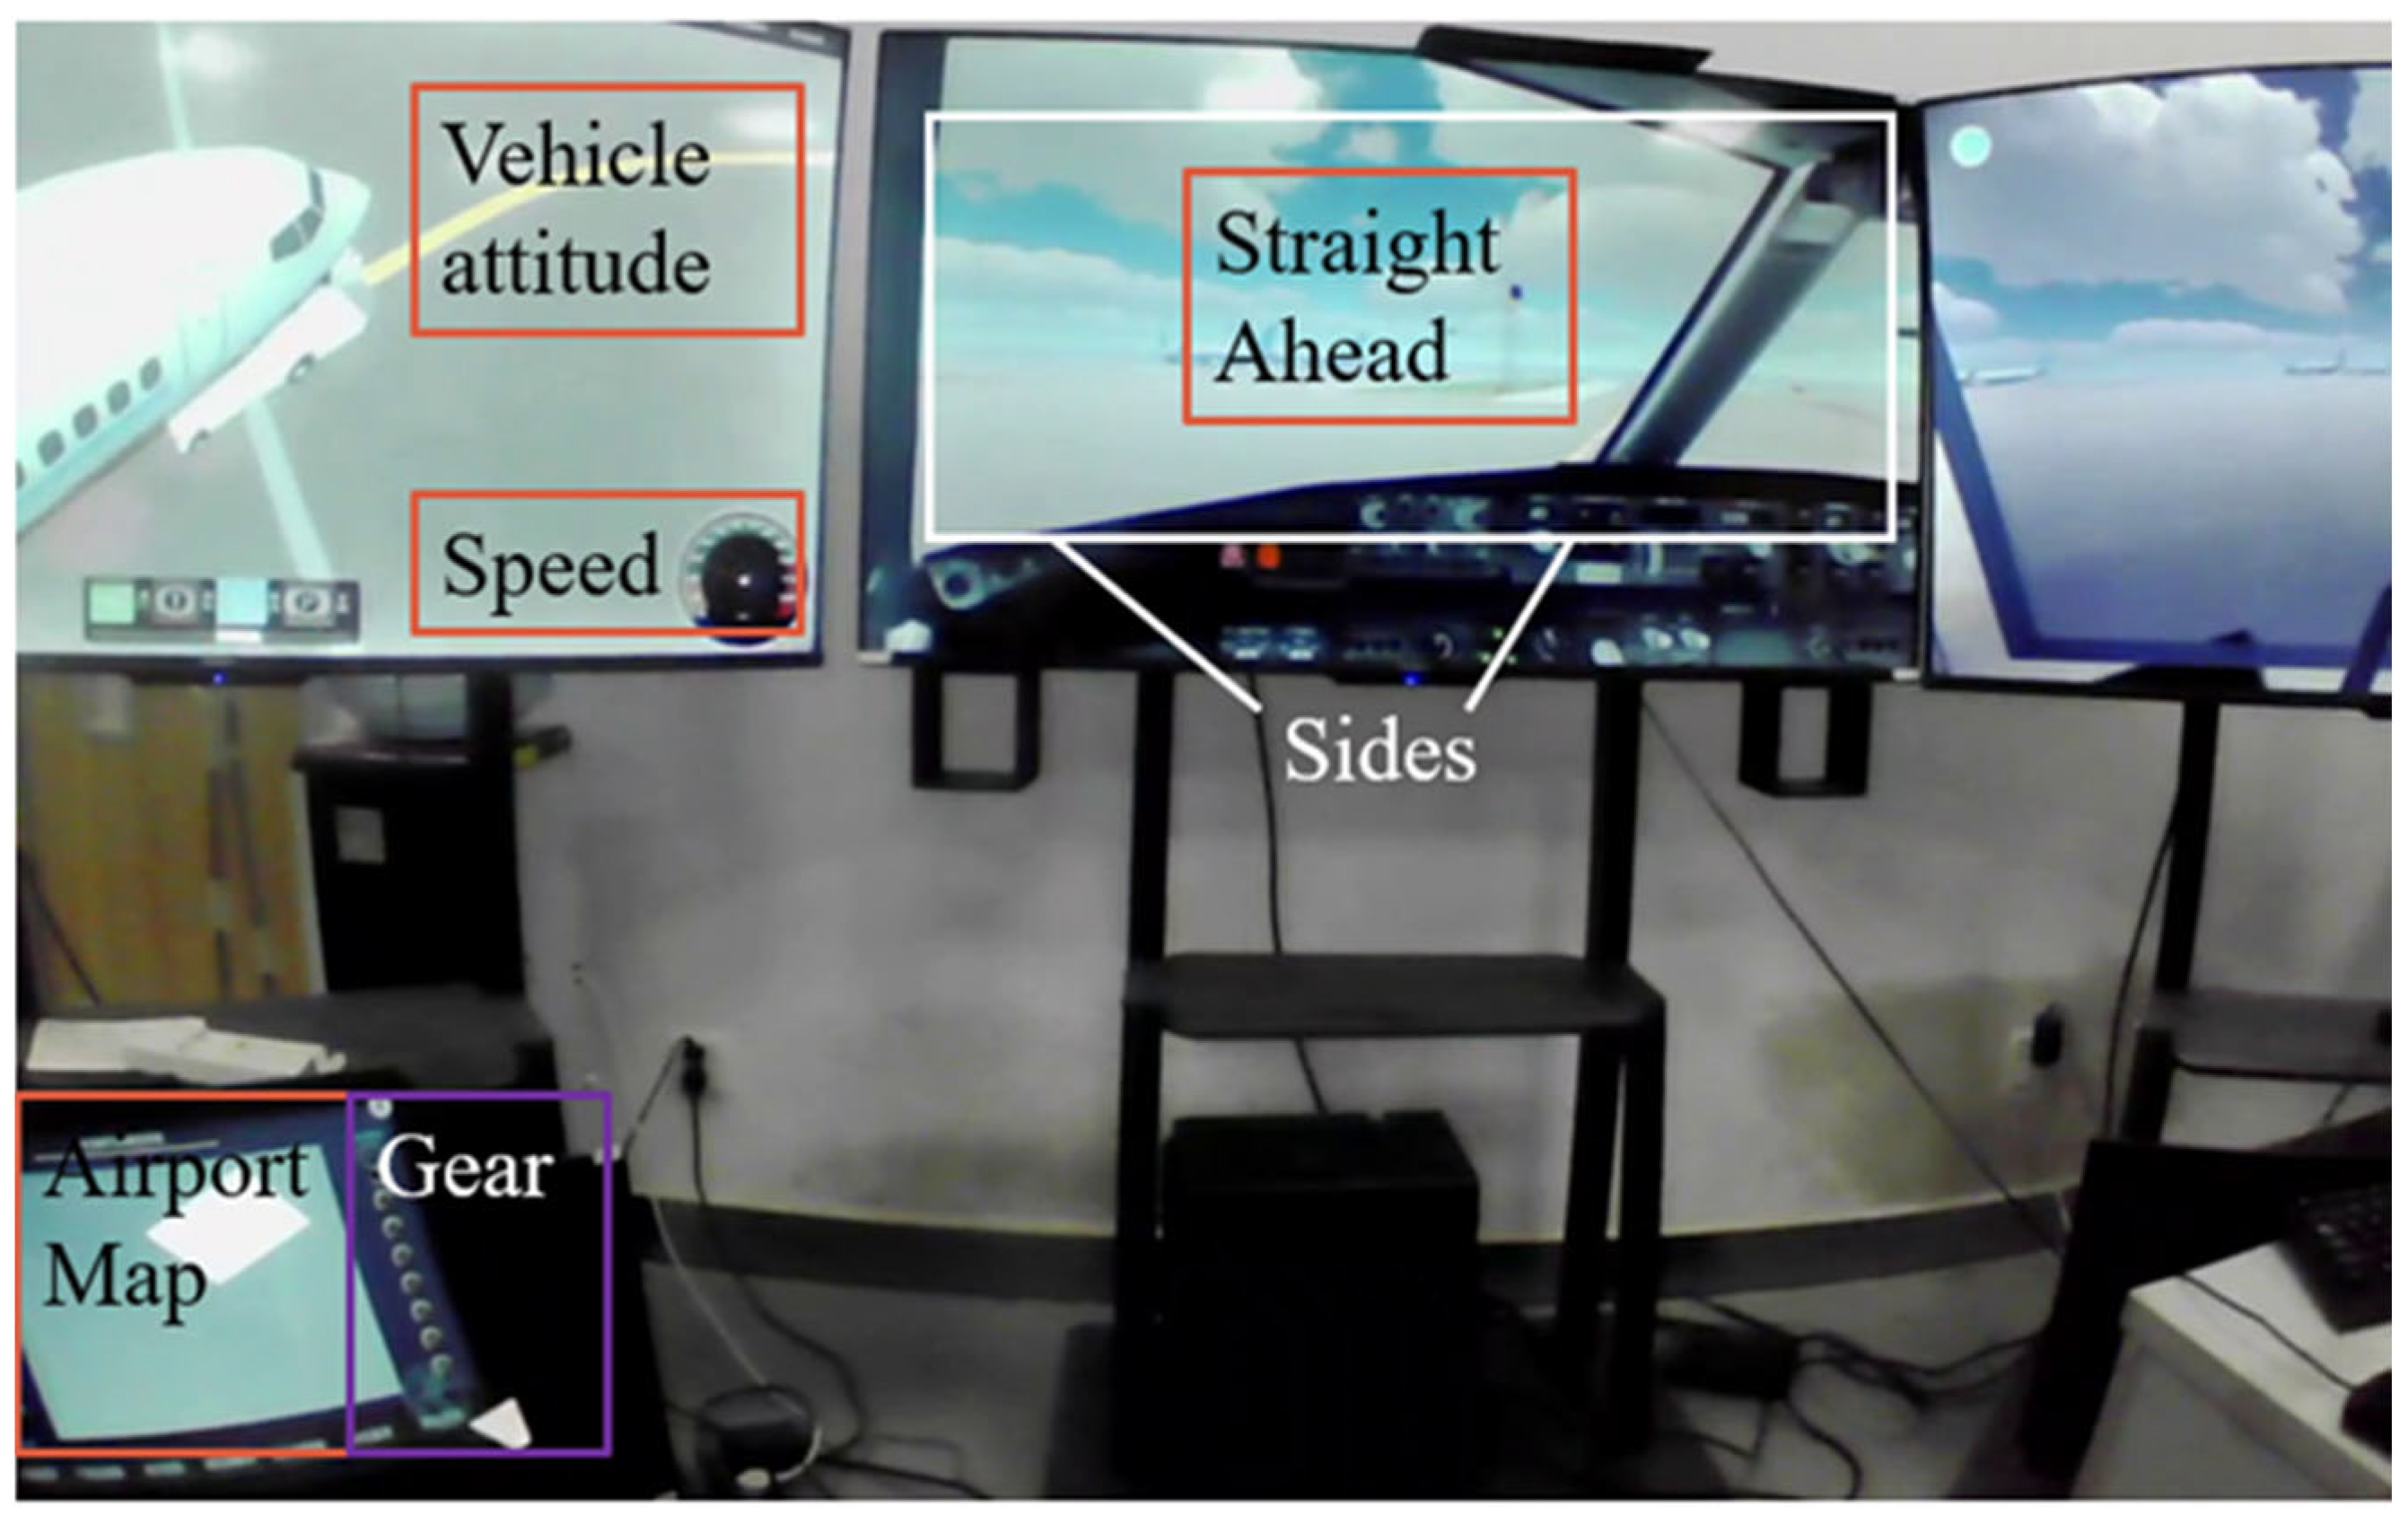
Six areas of interest (AOIs) were defined to cover the primary visual information sources during towing-departure taxi-out: straight ahead, two sides, vehicle attitude, speed, shift, and airport map (see Figure 5). Visual attention allocation to each AOI was quantified as the proportion of gaze samples falling within that AOI over the analysis interval. Visual attention allocation was quantified as the attention allocation ratio—the proportion of gaze samples falling within an AOI. We specifically selected this global distribution metric over micro-metrics such as fixation duration to align with the probabilistic nature of the SEEV model. While fixation duration reflects cognitive processing depth at a specific moment, the allocation ratio captures the macroscopic distribution strategy of the pilot’s attention resource over the entire task duration, which is the primary predictive target of our expectancy-value model.
Figure 5.
AOI region division.
3.6. Questionnaire for Expectancy (P) and Importance Membership (u)
To parameterize model 1, a Subjective Assessment Questionnaire was administered to the participants immediately after the experiment. Due to the novelty of the Green Towing mode, historical data is unavailable; thus, we relied on the “Expert Consultation Method” combined with participant feedback.
3.6.1. Questionnaire Design
A total of 20 valid questionnaires were collected (from the 14 participants and 6 domain experts). The questionnaire evaluated six AOIs under three conditions (Straight, Turning, Obstacle Avoidance) on two dimensions:
Expectancy : Participants rated the frequency of information updates in each AOI. These scores were normalized to obtain the probability of information occurrence , ensuring for each condition.
Importance : Participants rated the importance of each AOI for flight safety using a 5-point Likert scale:
3.6.2. Calculation Using Fuzzy Logic
To transform the subjective qualitative ratings of importance into quantitative membership degrees , we applied Fuzzy Set Theory:
- Evaluation Statistics: We counted the votes for each importance level. For example, in the Straight Taxiing condition for the “Forward View” AOI, the vote distribution was: {0 Not Important, 0 Less Important, 3 Average, 10 Important, 7 Very Important}.
- Fuzzy Matrix Construction: These counts were converted into a fuzzy evaluation matrix (as shown in Table 2). Defuzzification: The final importance membership ($u$) was calculated by weighting these vectors (see Equation (4)).Table 2. Importance membership (u) and quantified information expectancy (P) (normalized values).
The resulting values in Table 2 are dimensionless normalized coefficients ranging from 0 to 1.
4. Results
4.1. Observed Attention Allocation Across Operating Conditions
Before analyzing the gaze distribution, we examined the behavioral metrics (response time and accuracy) to validate the dataset. All 14 participants achieved a 100% task completion rate with correct responses to all embedded signals (mean response time < 1.5 s). This high consistency confirms that the participants were actively engaged and that the collected eye-tracking data reflects valid, attentive monitoring behavior.
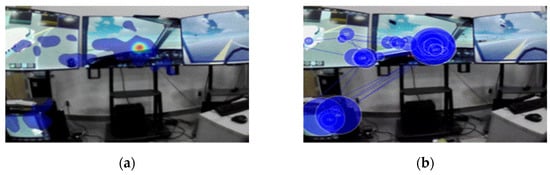
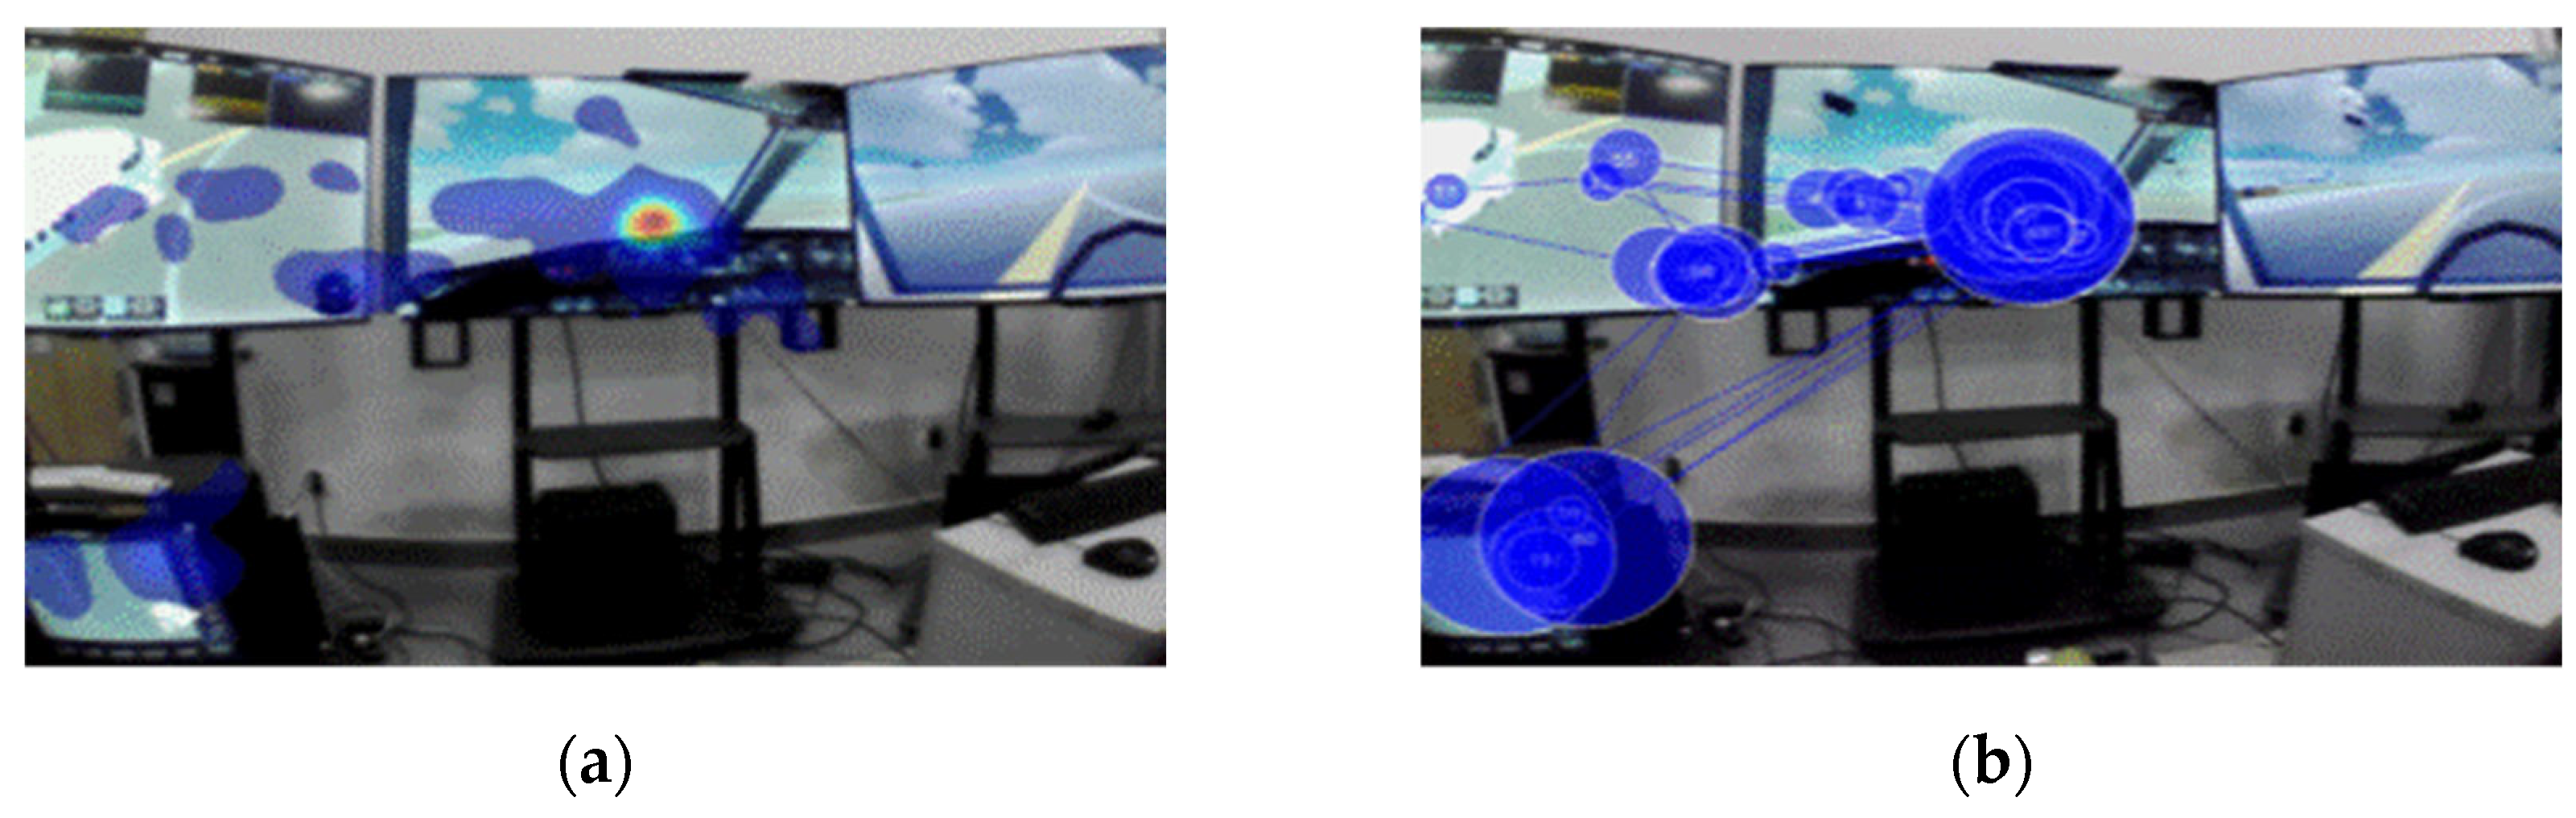
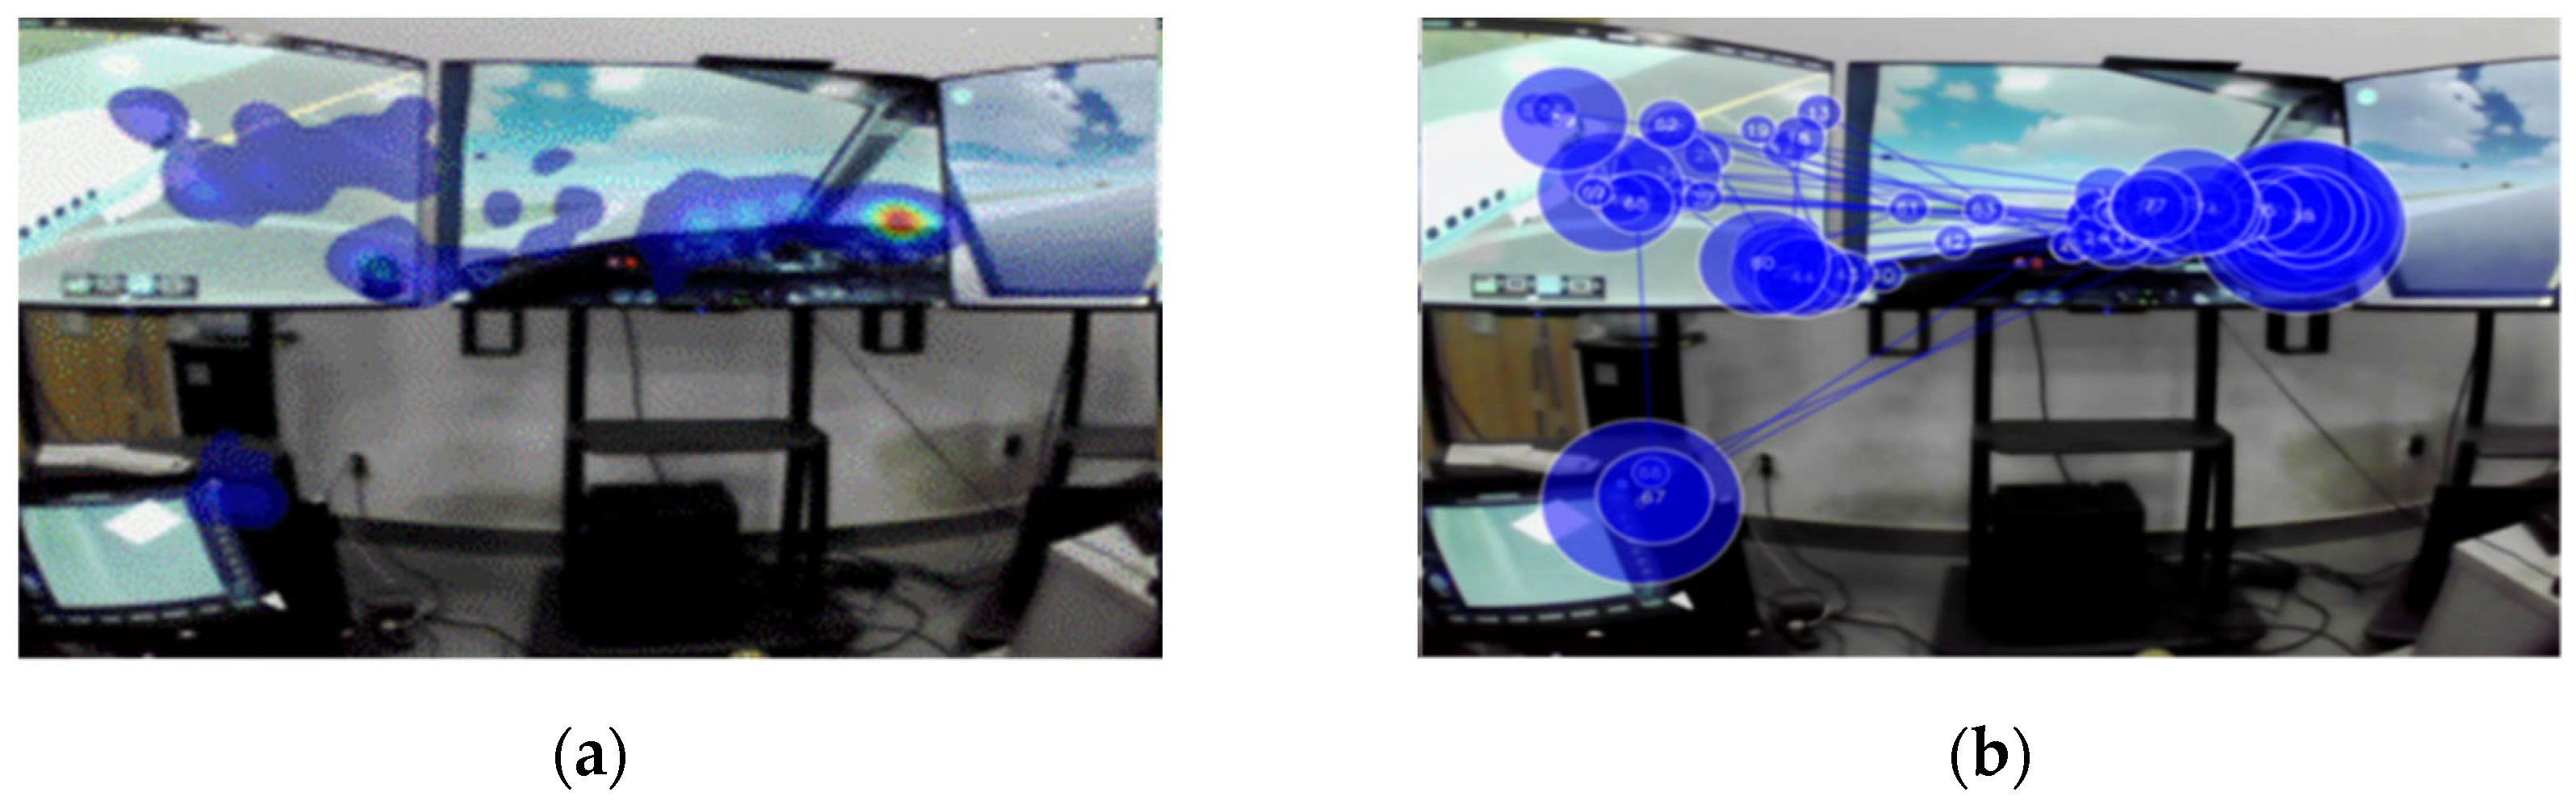
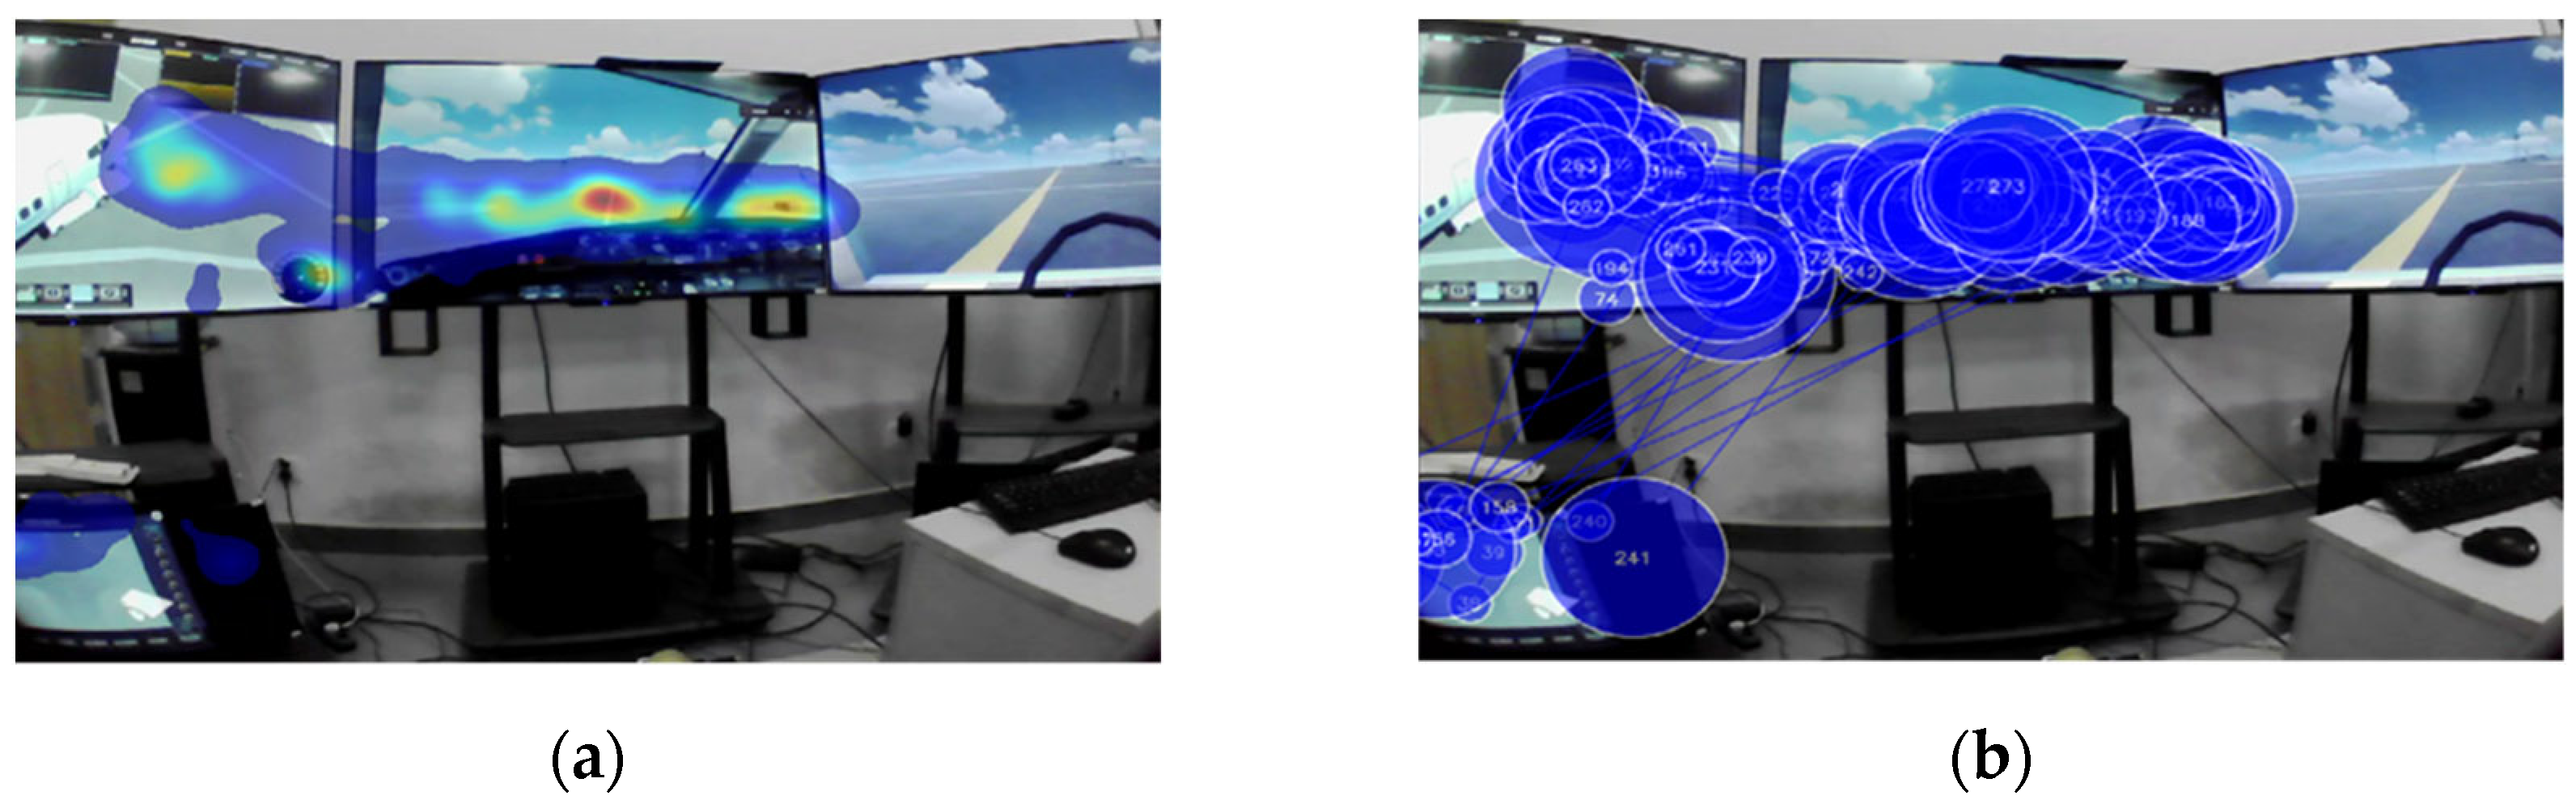
The Ganzin Caelus software allows us to obtain the hot zones of the pilot’s gaze in the different display areas for the three conditions as follows. Figure 6 illustrates the gaze hotspots and scan paths under the straight taxiing condition, with the gaze predominantly focused on the forward view. Figure 7 shows that under the turning condition, the gaze distribution shifts significantly toward the two sides. For the obstacle avoidance condition (Figure 8), the visual scan path becomes more complex, which reflects the increased monitoring demand.
Figure 6.
The gaze of the straight-line condition. (a) Hot zone of fixation under straight driving conditions; (b) eye movement pattern in straight driving conditions.
Figure 7.
The gaze of the turning condition. (a) Hot zone diagram of the turning condition; (b) eye movement chart of the turning condition.
Figure 8.
The gaze of the obstacle avoidance condition. (a) Hot zone of fixation under obstacle avoidance conditions; (b) eye movement pattern of obstacle avoidance conditions.
A total of 14 subjects participated in the experiment, and each set of data was preprocessed. The amount of data under each area of interest was obtained by intercepting the different working conditions in Ganzin Caelus, and finally, the allocation of attention to each area of interest was obtained.
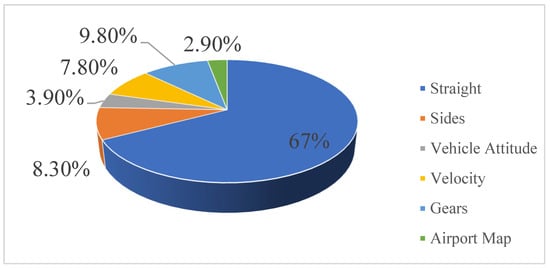
From Figure 9, it can be seen that in the straight ahead condition the highest percentage of attention allocation is (67.28%), the two sides zone (8.29%), the speed zone (7.77%) and the gear zone (9.85%) are in the middle of the allocation, and the vehicle attitude zone (3.90%) and the airport map zone (2.92%) have a smaller percentage of the allocation of attention, because in the straight ahead condition, pilots get more information from the road in front of them, and they need to pay attention to whether there are other airplanes or vehicles on both sides of the road and speed up through the gears when traveling straight to the intersection section, and they also need to pay attention to the speed of driving to avoid the speed exceeding 40 km/h. The attitude of the airplane and the airport map basically do not change in the process of traveling straight, and subjects do not need to pay attention to the area frequently; therefore, the allocation of attention of the front is the highest in the front area. Therefore, the attention allocation in the front area is the highest, the two sides area, speed area, and gear area are average, and the vehicle attitude area and airport map area are the least, which is in line with the actual situation.
Figure 9.
Attention allocation under straight-line conditions.
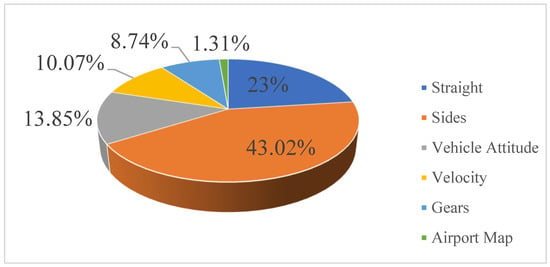
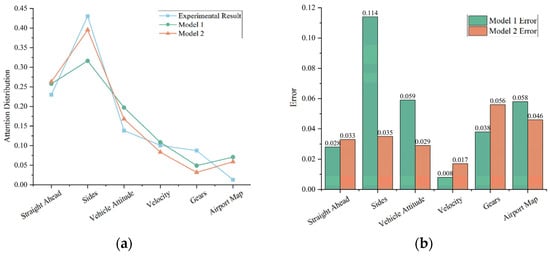
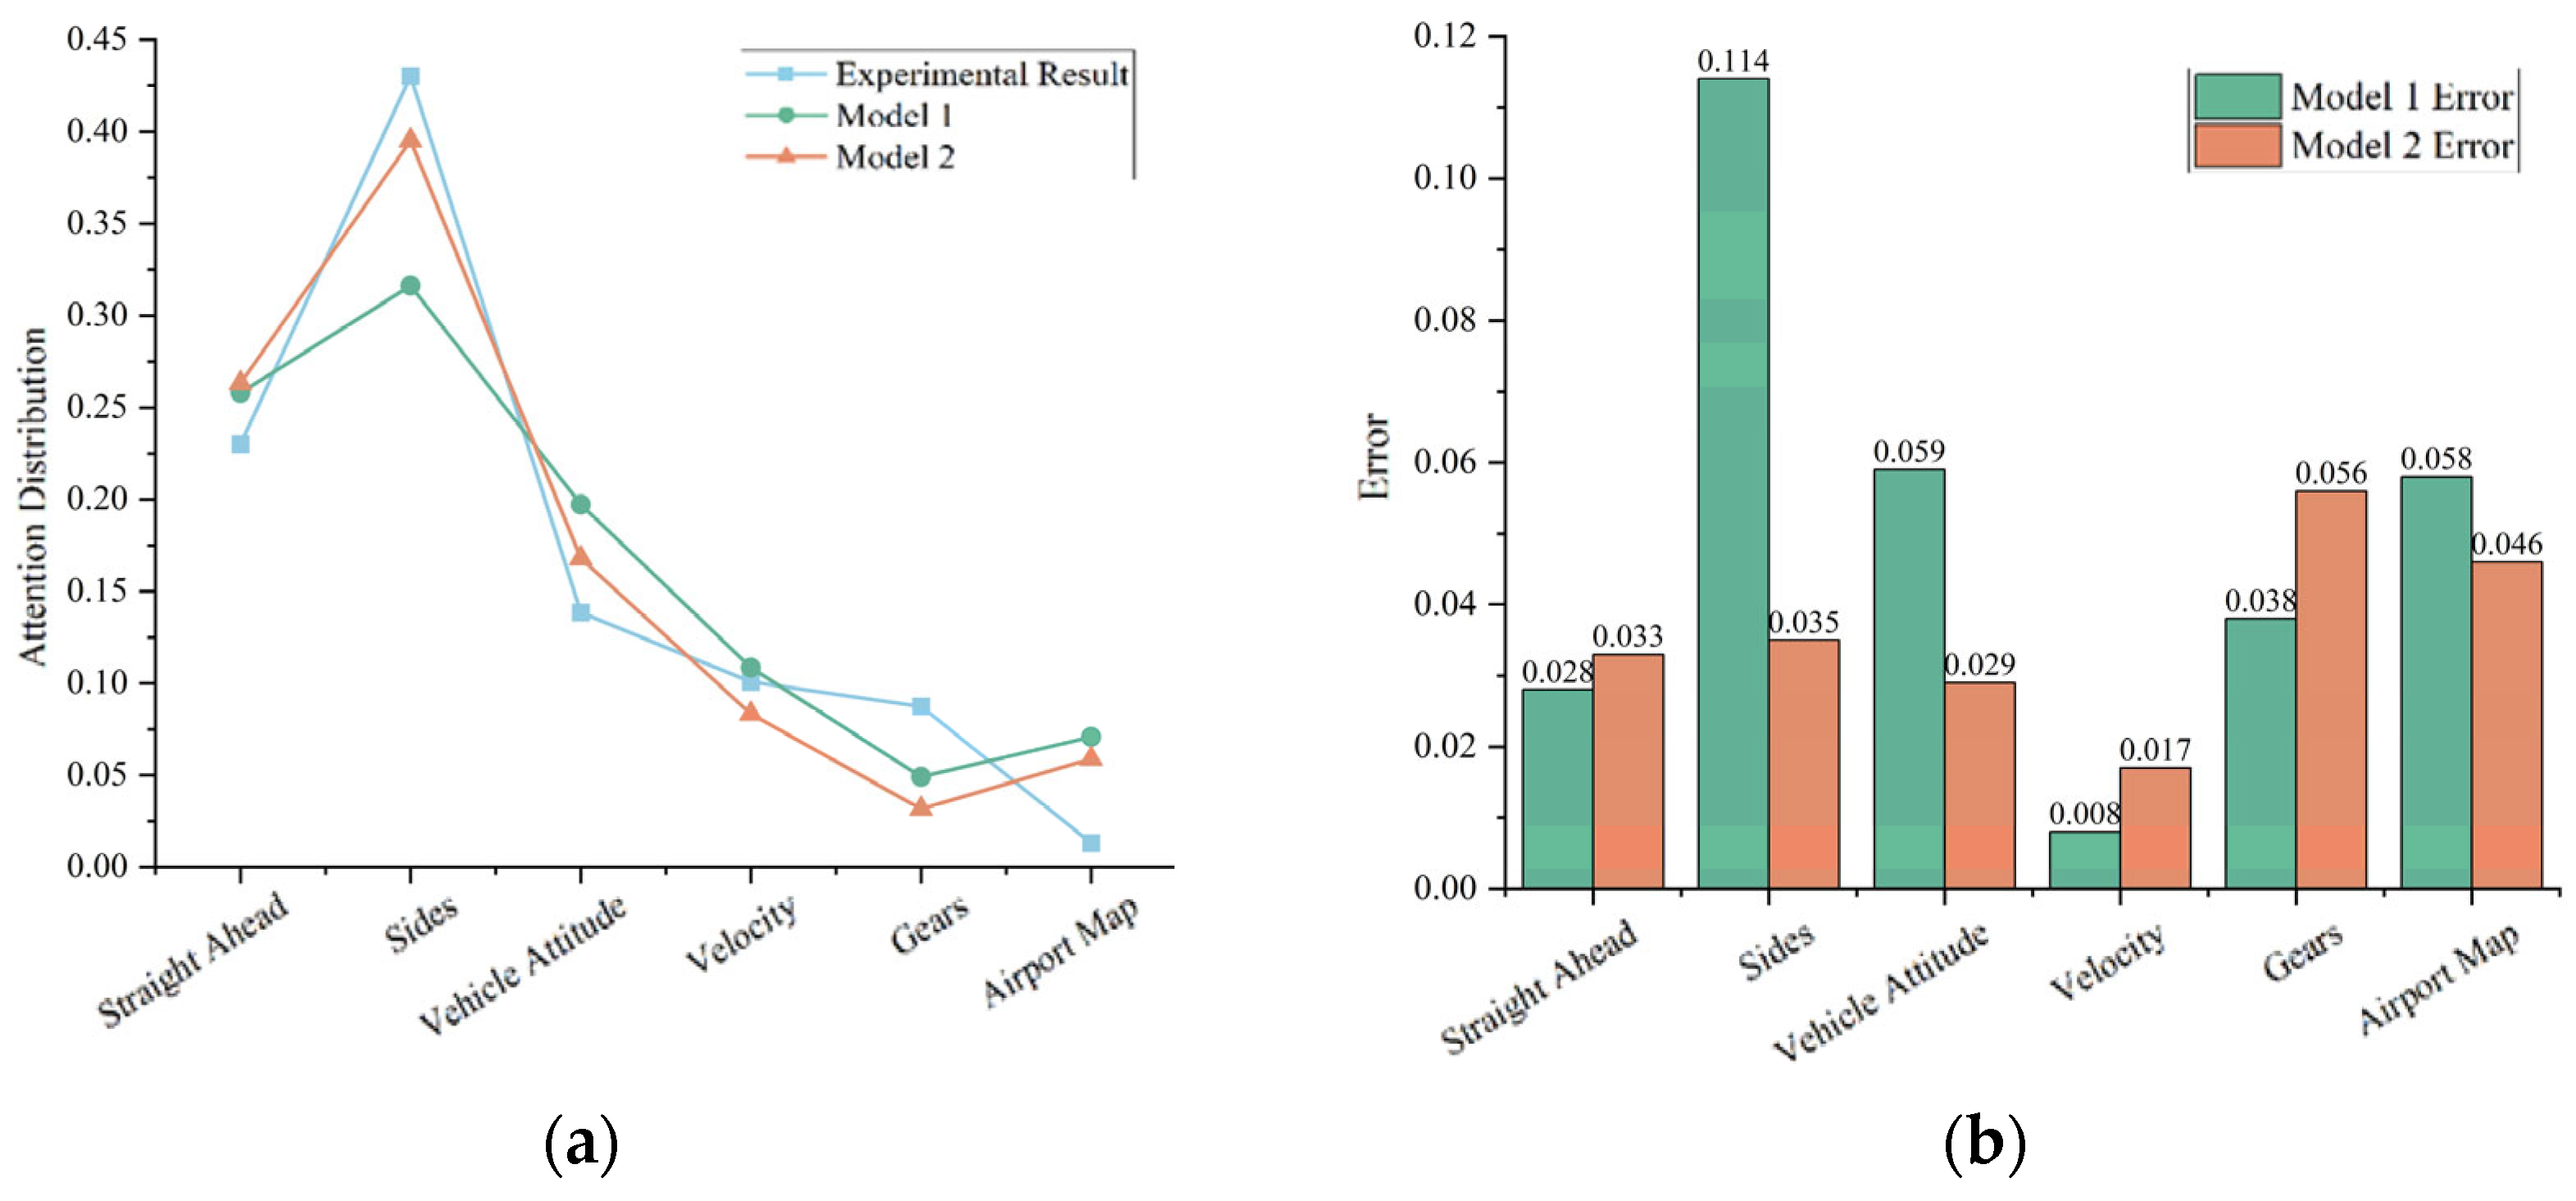
From Figure 10, it can be seen that the higher proportion of attention allocation in the turning condition is in the two-side area (43.02%) and the forward area (23%), followed by the vehicle attitude area (13.85%) and the speed area (10.07%), and lastly, the airport map area (1.31%) and the gear position area (8.74%). This is because, in turning conditions, pilots get more information from the road ahead and from the road they are about to turn into. The subjects need to ensure that the speed is lower than 20 km/h, as well as avoiding too large a tractor–aircraft clamping angle during the turn, in order to avoid the destruction of the towing system by folding. The pilot’s control of the towing system during the turn was mainly in the steering control, with fewer gear operations and no knowledge of the airport map information required. Therefore, the allocation of attention in the forward and side zones is higher in the forward zone, average in the speed zone and vehicle–aircraft attitude zone, and least in the gear and airport map zones, which is in line with the actual situation.
Figure 10.
Attention distribution under turning conditions.
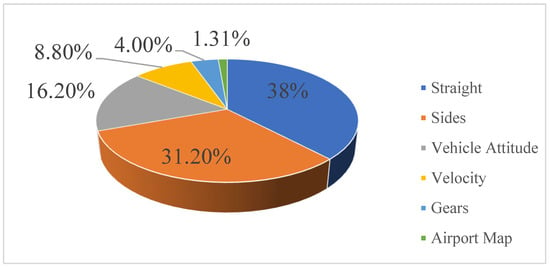
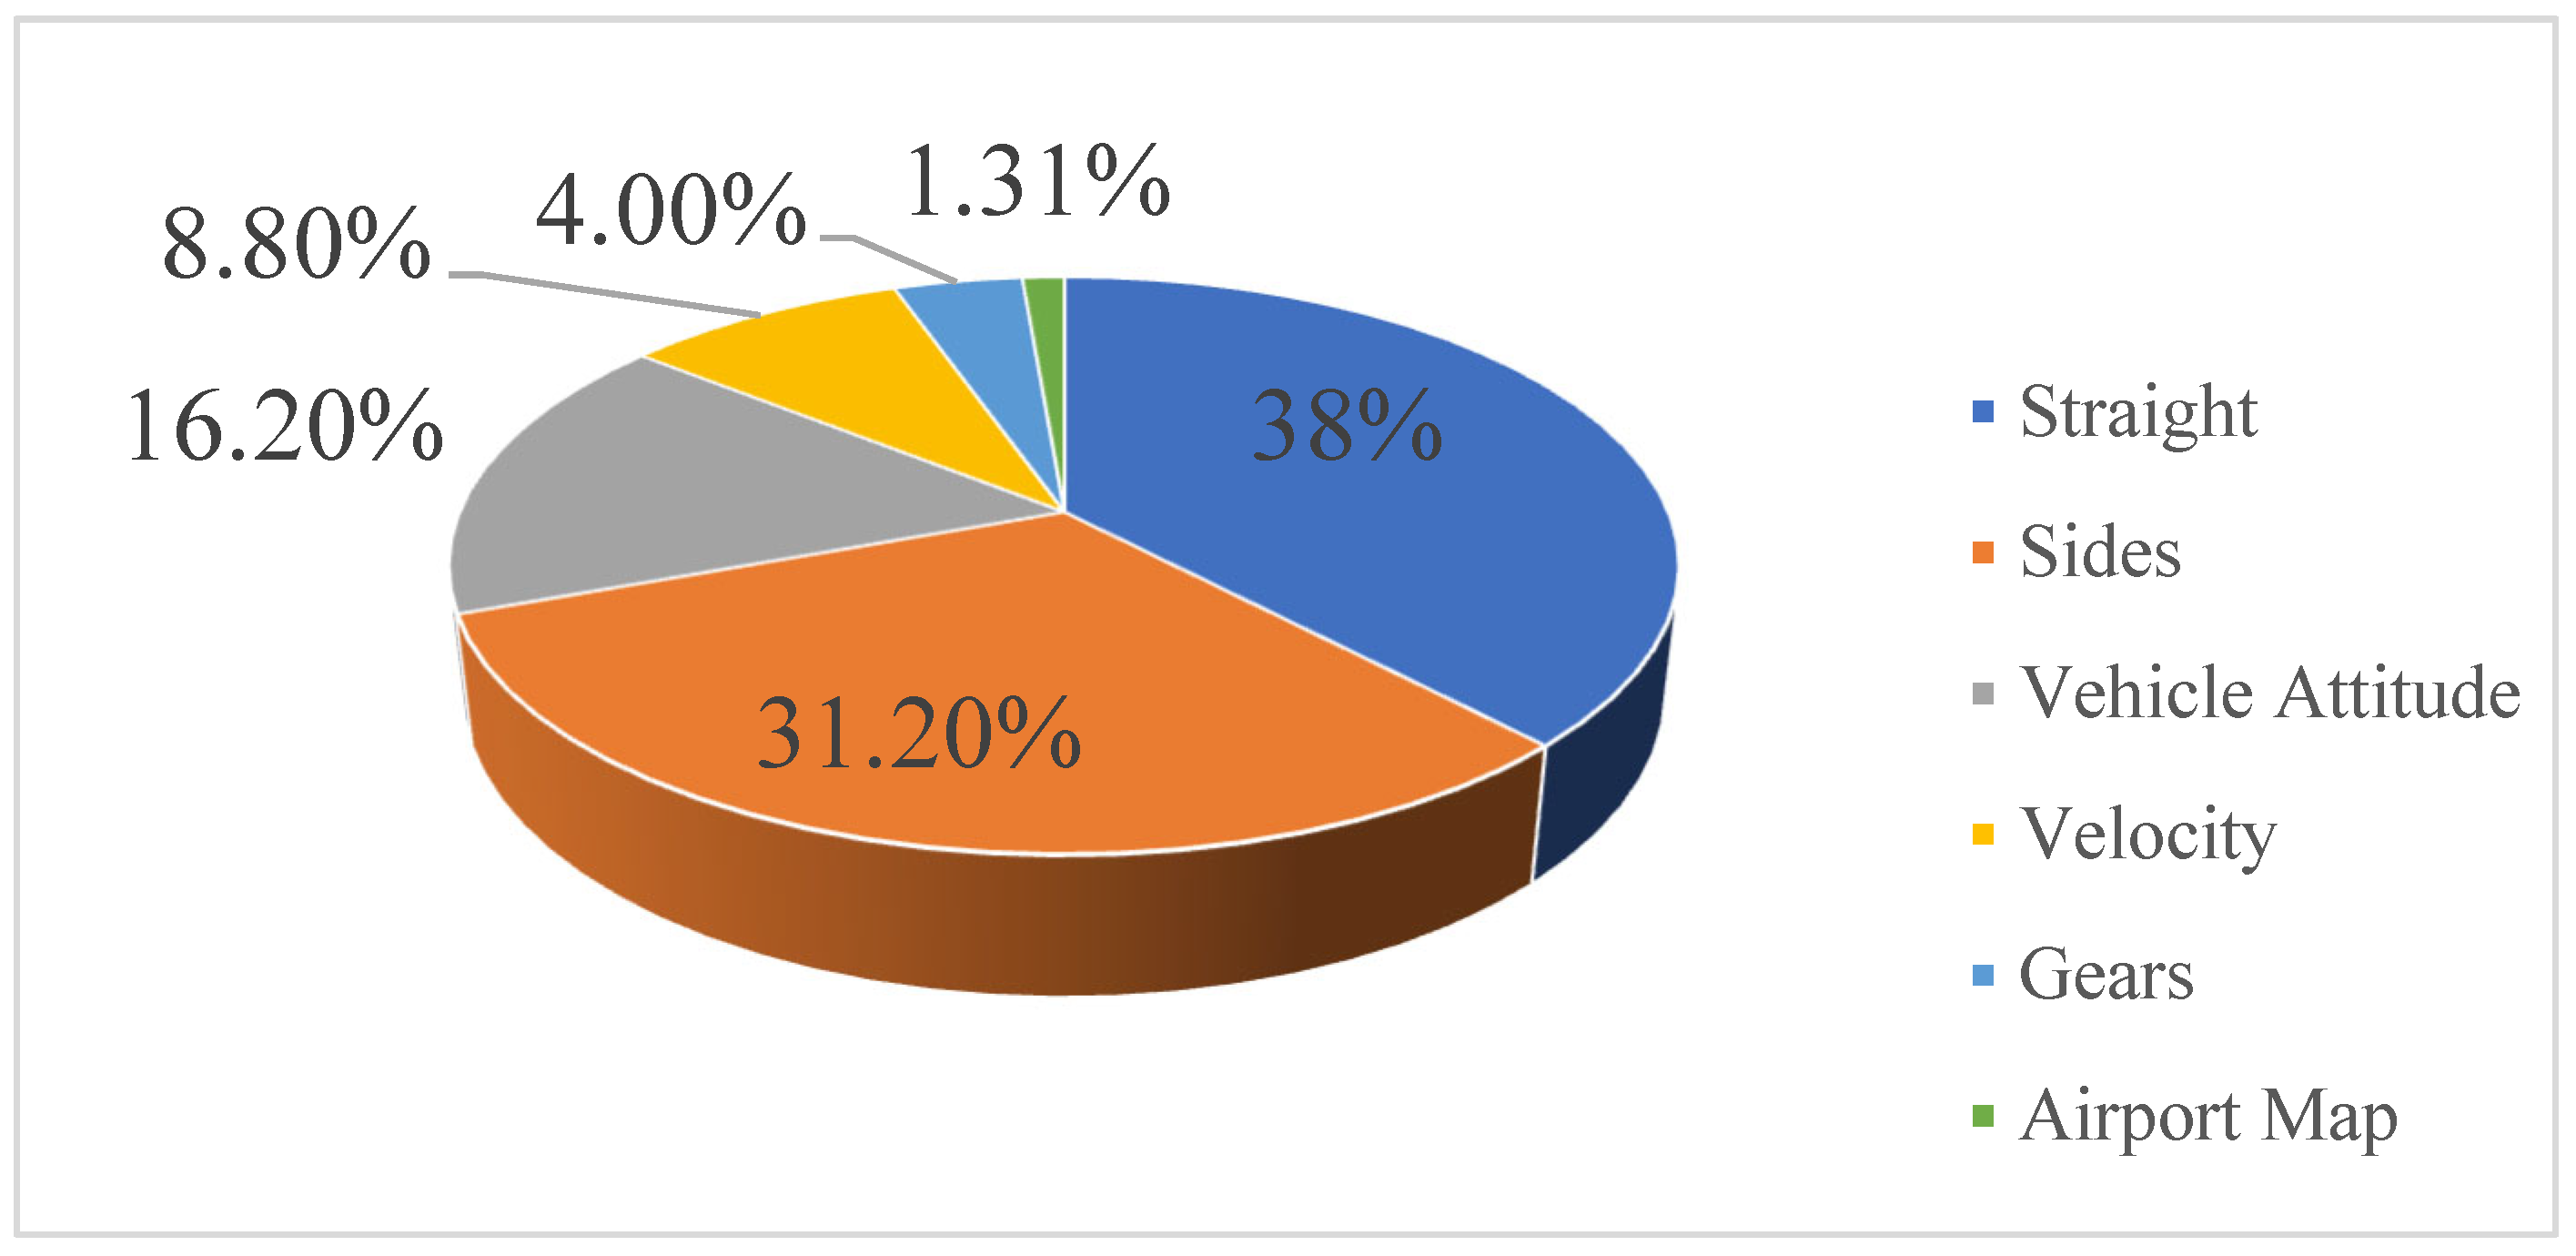
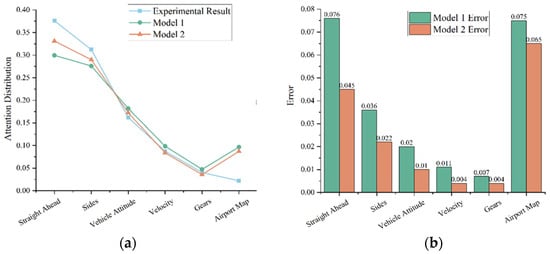
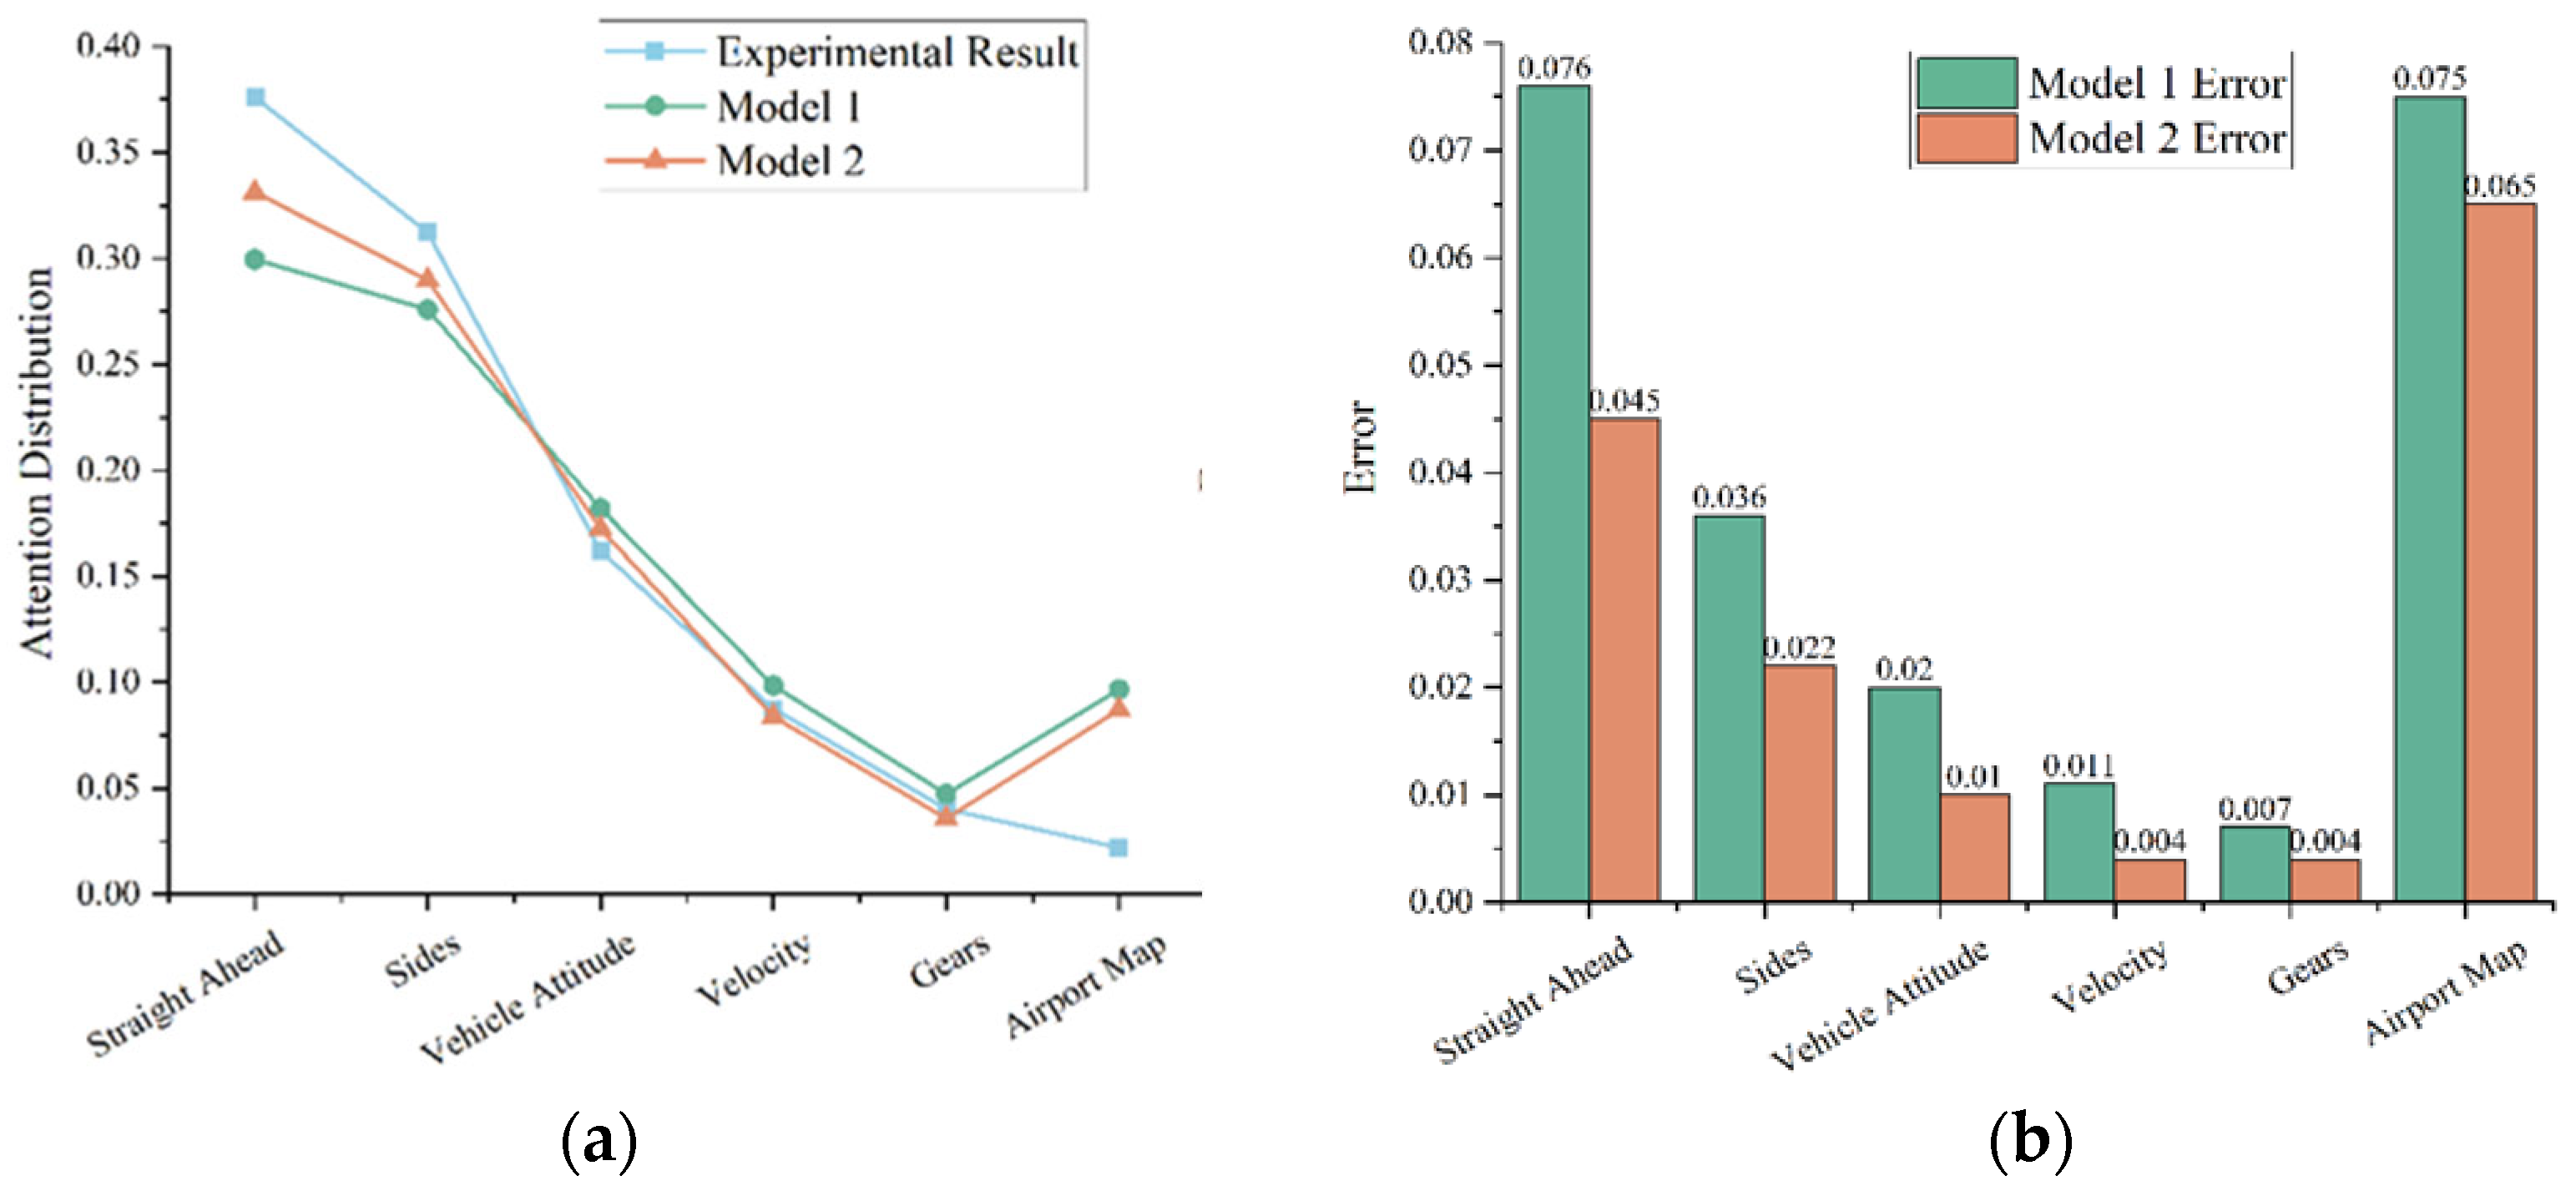
From Figure 11, it can be seen that in the obstacle avoidance condition, the higher proportion of attention allocation is still in the two-side area (31.22%) and the front area (37.6%), followed by the vehicle attitude area (16.2%), and lastly, the speed (8.75%), the airport map area (2.2%), and the gear position area (4.02%). This is because in the obstacle avoidance condition, pilots get more information from the road ahead and the road information on both sides that can be avoided. Unlike turning, the attitude of the aircraft changes frequently during obstacle avoidance, but because of the slower speed, the subjects pay less attention to the speed zone; the lower speed during obstacle avoidance requires the subjects to pay attention to the speed zone only in the turning phase, so the subjects pay less attention to the gear zone because of less acceleration and deceleration; the frequent road changes also cause the subjects to observe the airport map zone more than the turning phase; in some comparisons, the subjects pay more attention to the gear zone than the turning phase, and in other comparisons, the subjects pay more attention to the airport map zone than the turning phase. Pilots have also been observed to pay more attention to the speed zone when making turns, but this is still very low compared to other comparisons. Therefore, the allocation of attention between the front and side zones is higher in the front zone, average in the vehicle attitude zone, and lowest in the speed zone, gear zone, and airport map zone, which is consistent with the actual situation.
Figure 11.
Attention allocation under obstacle avoidance conditions.
4.2. Model Prediction Errors
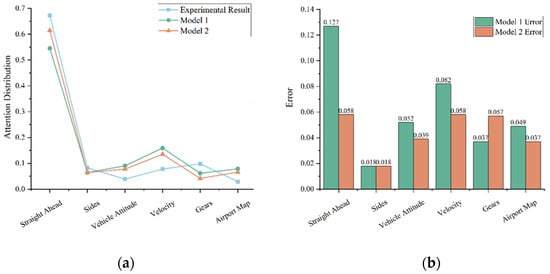
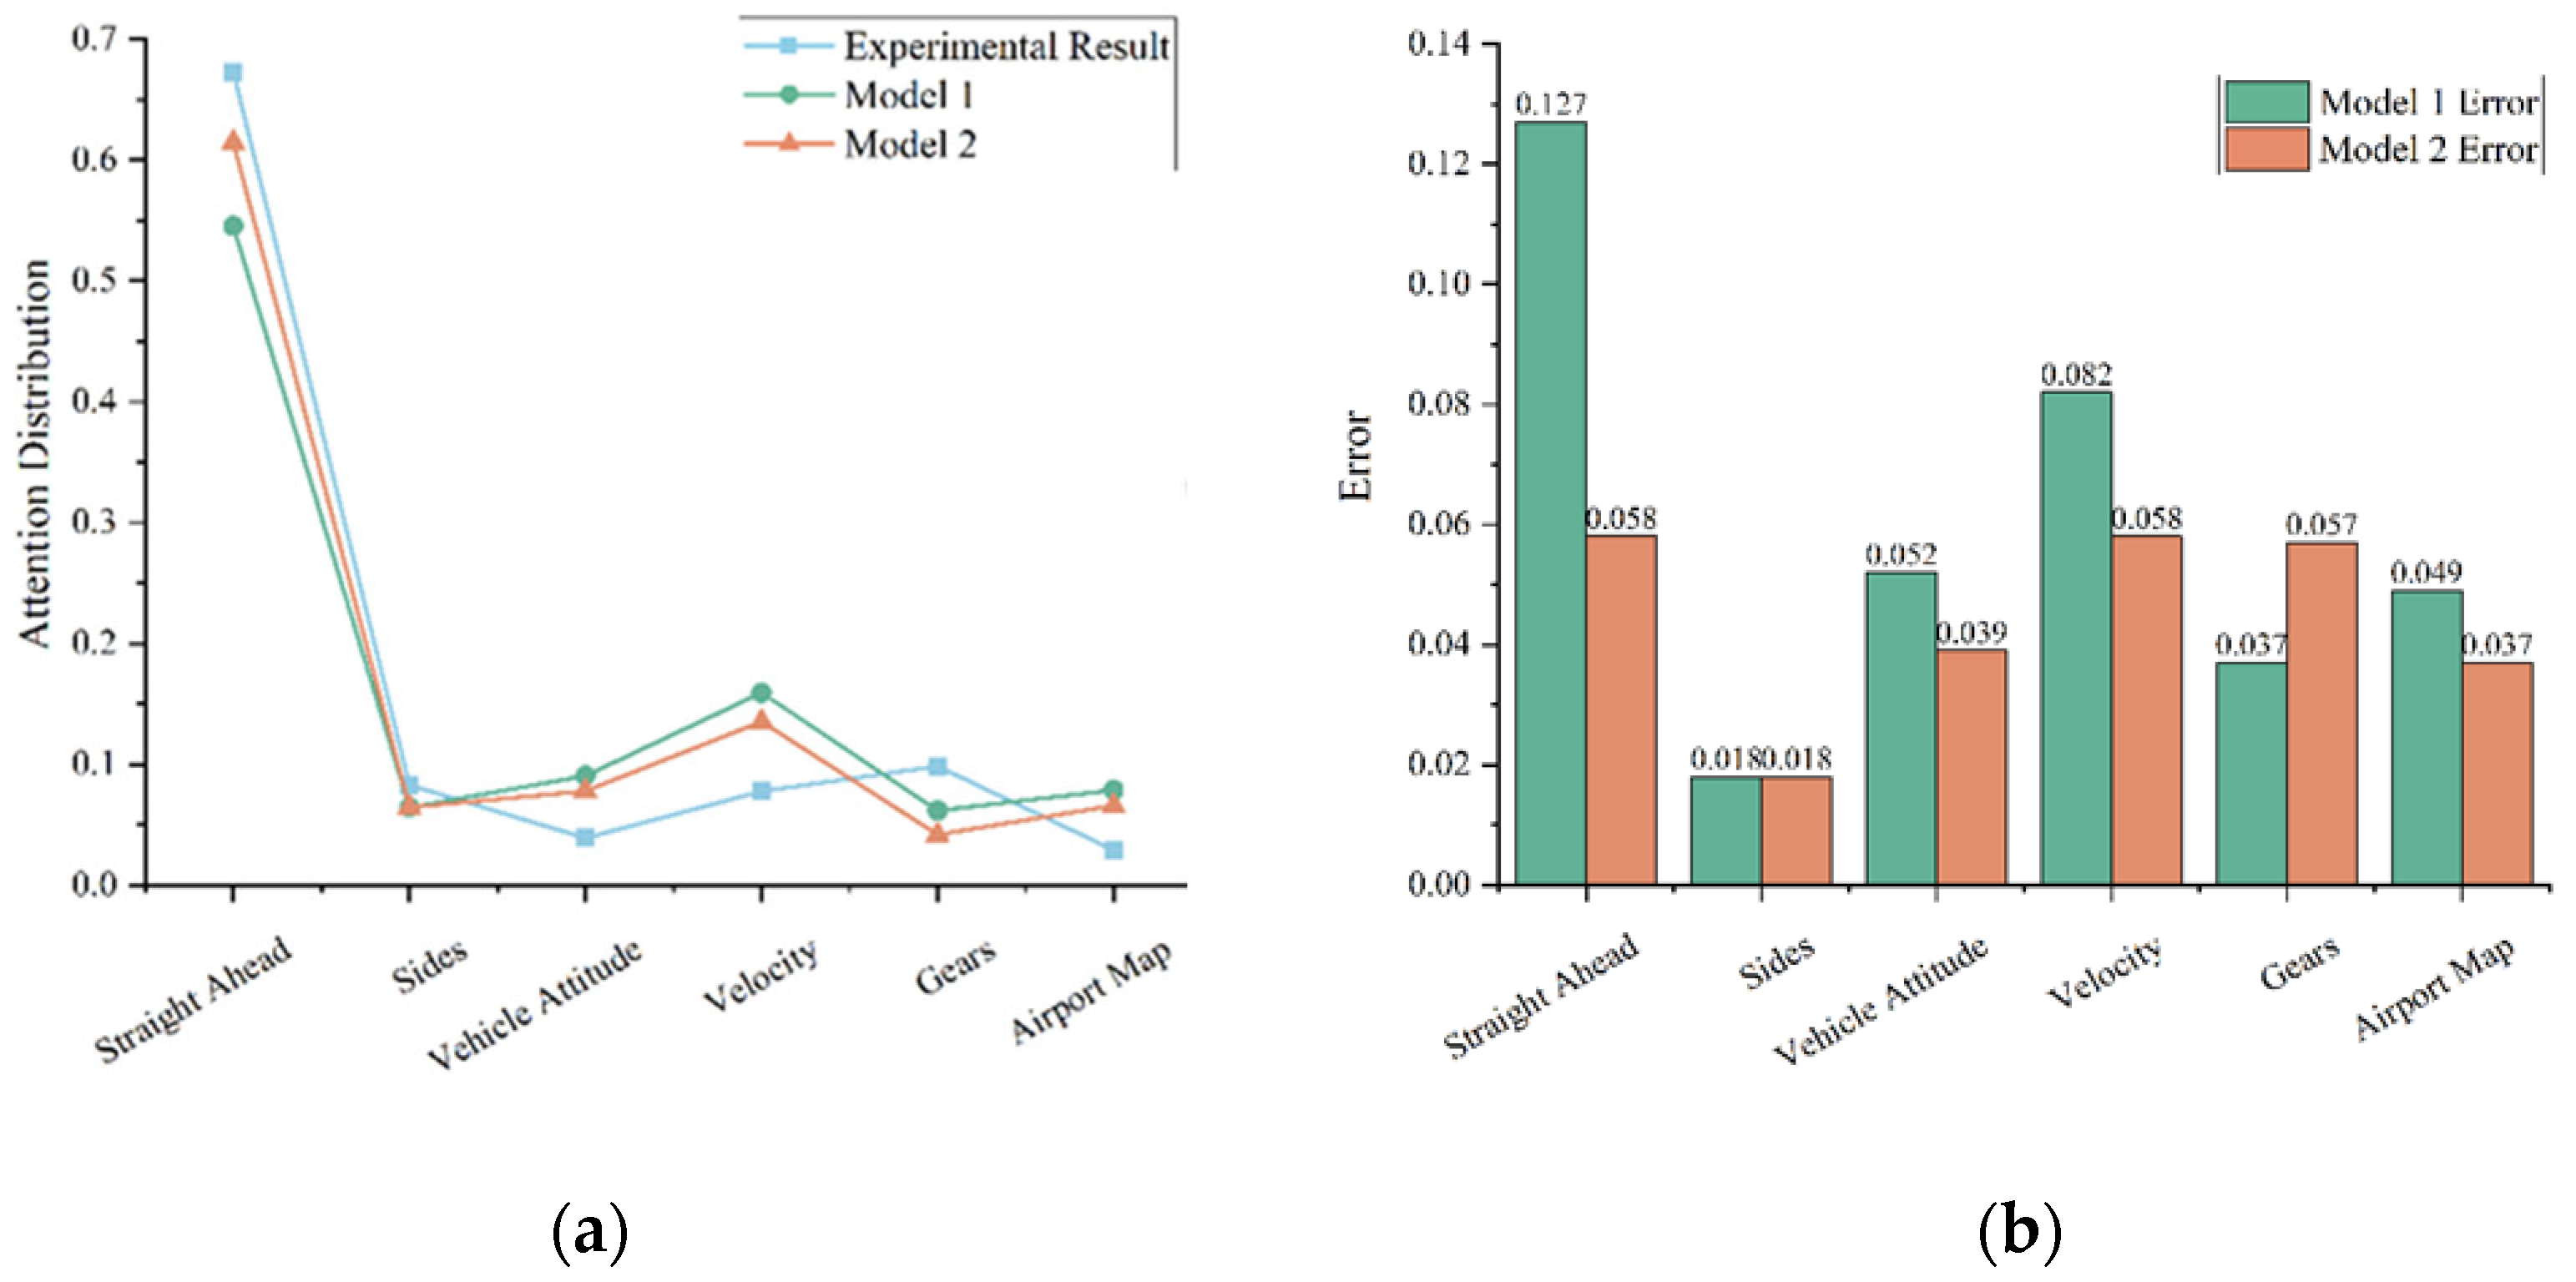
In order to better compare the level of pilot attention allocation prediction of the two attention allocation models in the green towing departure mode, this paper makes an error comparison between the prediction results of attention allocation of the two models in six different AOI regions under different working conditions and the experimental results.
From Figure 12, it can be seen that compared with Model 1, Model 2 has smaller errors in the forward, vehicle attitude, speed, and airport map regions in the straight ahead condition, especially in the forward region, which is consistent with the purpose of model optimization. Therefore, Model 2 is more accurate in predicting the allocation of attention in the straight ahead condition during the towing departure process.
Figure 12.
The error of the theoretical values of different models under the straight driving condition. (a) Distribution of theoretical and experimental values of the model under straight-line operating conditions; (b) difference between theoretical and experimental values of the model under straight-line operating conditions. Note: Values represent the mean attention allocation ratio across all participants.
From Figure 13, it can be seen that compared with Model 1, Model 2 has smaller errors in both sides, vehicle attitude, and airport map areas under turning conditions, especially in the area of both sides, which is consistent with the purpose of model optimization. Therefore, Model 2 can more accurately predict the allocation of attention under turning conditions during towing departure.
Figure 13.
The error of the theoretical values of different models under the turning condition. (a) Distribution of theoretical and experimental model values for cornering conditions; (b) difference between theoretical and experimental model values for cornering conditions.
From Figure 14, it can be seen that compared with Model 1, Model 2 has smaller errors in all regions under obstacle avoidance conditions, especially in the front region, which is consistent with the purpose of model optimization. Therefore, Model 2 can more accurately predict the allocation of attention in the obstacle avoidance condition during the towing departure process.
Figure 14.
The error of the theoretical values of different models under the obstacle-avoidance condition. (a) Distribution of theoretical and experimental model values under obstacle avoidance conditions; (b) difference between theoretical and experimental values of the model under obstacle avoidance conditions.
4.3. Regression Analysis
Using the obtained quantitative values of factors such as information value and information expectation as the theoretical values of the variables, combined with the attention allocation captured in this chapter as the experimental values, the coefficient values of information value and information expectation were solved in different models. In the program editor of MATLAB R2024a (9.15.0), input the independent variables X1 (information expectation) and X2 (information value) and the dependent variable Y (eye movement experimental value), and then solve the different models through the Regress function, which not only outputs the coefficient values of information value and information expectation in the different models, but also includes stats including four statistics used to check the regression model. The final coefficients of variables and test values of Model 1 and Model 2 are shown in Table 3 below:
Table 3.
Variable coefficients and test values of different attention allocation models.
From Table 3, it can be seen that the coefficient of determination R2 = 0.9455 for Model 1 and R2 = 0.9451 for Model 2 are both larger, and the independent and dependent variables are significantly correlated. And the p < 0.05 for both models better indicates that the independent and dependent variables are significantly correlated. Whether the correlation is determined by judging the coefficients or the p-value, the conclusion is the same: both models have significant correlation between the dependent and independent variables, and the significance of Model 2 is more significant than the significance correlation of Model 1. In order to compare whether the independent and dependent variables of these two models are still significantly correlated under the three working conditions, the coefficients of the variables and the test values of the different attention allocation models under the three working conditions are therefore calculated by the same method in the following table, Table 4:
Table 4.
Variable coefficients and test values of different attention allocation models under different working conditions.
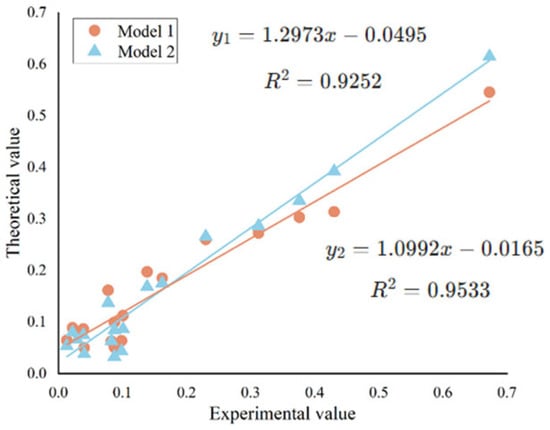
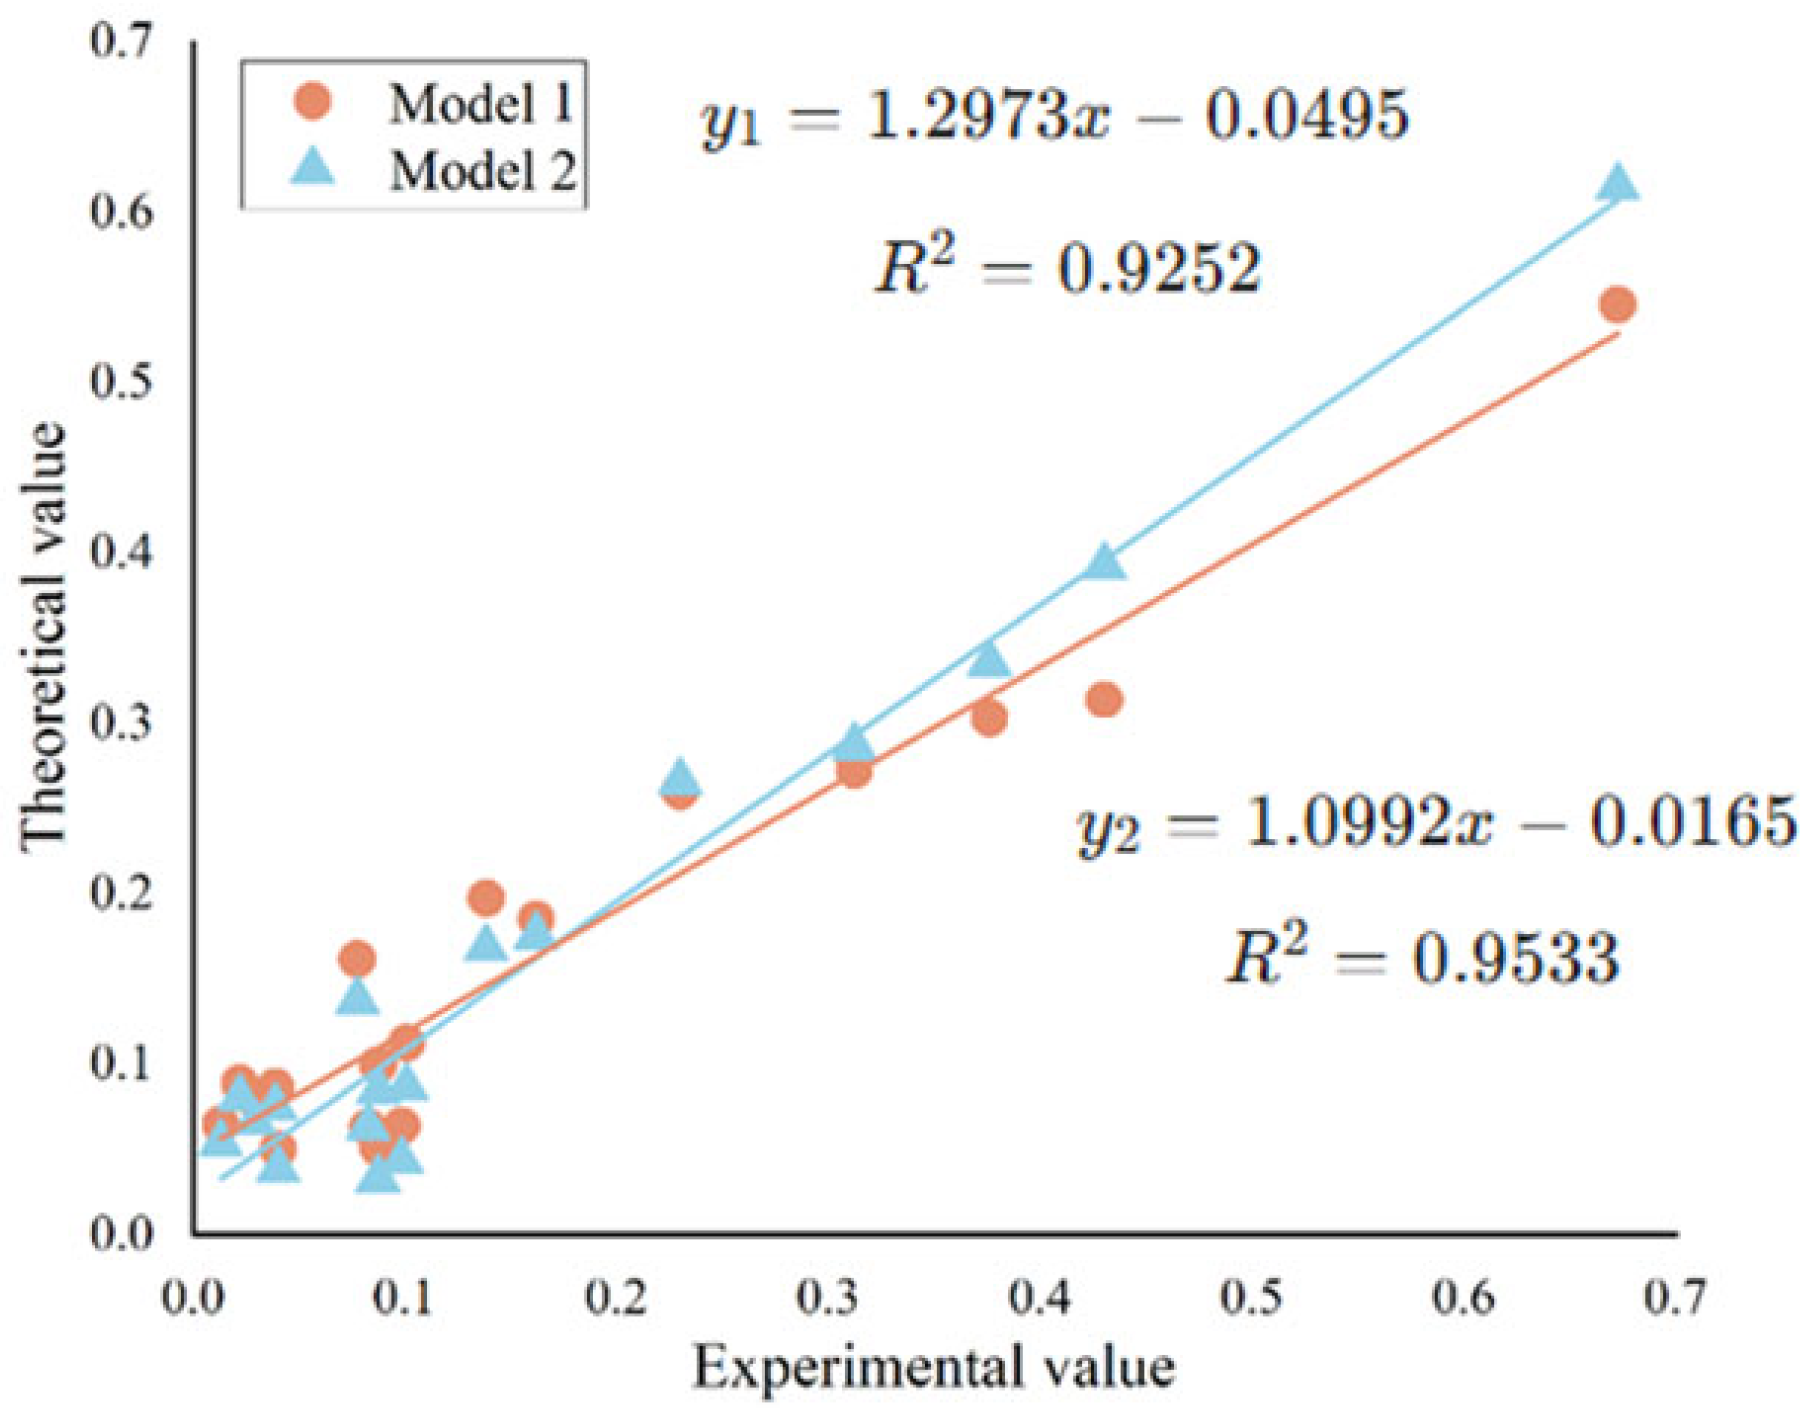
As shown in Table 4, both the baseline model (Model 1) and the improved model (Model 2) yield high overall explanatory power for attention-allocation prediction. Table 4 further reports condition-specific regression coefficients, indicating that Model 2 maintains consistently high R2 across straight taxiing, turning, and obstacle-avoidance conditions while better matching the observed gaze-distribution trends (see Figure 15: R2 = 0.9252 is obviously smaller than the determination coefficient R2 = 0.9533 of Model 2). To compare the models beyond visual inspection, we calculated the AIC. A lower AIC indicates a better model fit. Model 2 showed a lower AIC compared to Model 1, confirming its superiority statistically. The correlation between the theoretical values predicted by the models and the experimental data is plotted in Figure 15.
Figure 15.
Regression analysis of theoretical and experimental values of different models.
5. Discussion
This study begins by introducing the experimental objectives of studying pilots’ attention allocation. Through data processing, it reveals the characteristics of pilots’ attention distribution across six key areas (front view, left/right sides, speed area, gear area, vehicle attitude area, and airport map area) under different operating conditions (straight-line driving, turning, and obstacle avoidance). Specifically, during straight-line driving, pilots’ attention is primarily focused on the front view, followed by the left/right sides, speed area, and gear area, while the vehicle attitude area and airport map area receive the least attention. During turning, the left/right sides and the front view become the main focus of attention, followed by the vehicle attitude area and speed area, while the airport map area and gear area receive relatively less attention. During obstacle avoidance, attention to the left/right sides and the front view remains high, followed by the vehicle attitude area, while the speed area, airport map area, and gear area receive relatively fewer attentional resources. Finally, model regression validation results show a significant correlation between information value, information expectancy, and the experimental values of attention allocation. Furthermore, through model comparison, it is demonstrated that Model 2, constructed in this study, predicts pilots’ attention allocation more accurately under the towing departure mode than Model 1, developed by Wan Yanxiaoru [35,36,37].
5.1. Practical Implications for Interface Design
The observed gaze distributions suggest that towing-departure monitoring involves systematic trade-offs between external cues and internal towing-system parameters. Interface elements that convey safety-critical towing states (e.g., tow angle/vehicle attitude, speed compliance, and shift/status) should be presented with high discriminability and consistent spatial grouping to reduce scanning cost. In addition, the proposed model can support context-adaptive information prioritization: for example, during turning or obstacle-avoidance segments, the interface may temporarily emphasize attitude and clearance-related information while suppressing lower-priority elements to mitigate attentional tunneling.
5.2. Limitations and Future Work
Several limitations should be acknowledged. First, the experiment was conducted in a simulated environment with a limited sample size; future work should validate the model with certified pilots and higher-fidelity surface-operation scenarios. Second, the current AOI set focused on key display regions; incorporating additional external scanning targets and workload measures (e.g., secondary-task performance and physiological indices) may improve ecological validity. Third, the model parameters were obtained from post-trial questionnaires; future studies may explore online estimation of expectancy and value based on operational context and historical data to enable real-time adaptive display strategies.
6. Conclusions
(1) Across the three representative towing taxi-out tasks (straight taxiing, turning, and obstacle avoidance), participants devoted the largest proportion of visual attention to the external-view AOIs (straight ahead and two sides), reflecting the need to continuously monitor path alignment and surrounding traffic/obstacles. Compared with straight taxiing, turning and obstacle avoidance increased attention to towing-system state information (e.g., vehicle attitude and shift/status), consistent with higher control demand and safety risk.
(2) The results of regression analysis showed that both information expectation and information value before and after optimization were significantly correlated with the actual value of attention allocation.
(3) The judgment coefficient between the theoretical value of the model with optimized information value and the actual value of the attention allocation is larger than that between the theoretical value of the model with initial information value and the actual value of the attention allocation, so the model with optimized information value is more able to accurately predict the attention allocation of pilots under the tractor departure mode. Model 1 shows a negative correlation coefficient for information value, suggesting that it fails to capture the positive driver of information priority. In contrast, Model 2 successfully yields a positive coefficient (0.146), aligning better with the theoretical expectation that higher value attracts more attention. It shows that the theoretical model is effective and better reflects the actual situation of attention allocation, which is of some significance for pilots’ attention training, human–machine interface design, and prevention of human error in the tractor departure mode.
Author Contributions
Conceptualization, Z.W. and J.Q.; methodology, Z.W. and X.L.; software, Z.W. and X.L.; validation, X.L., X.W., H.L. and Z.L.; formal analysis, X.L. and Z.W.; investigation, Z.W. and X.L.; resources, J.Q.; data curation, X.L., H.L. and Z.L.; writing—original draft preparation, Z.W.; writing—review and editing, X.L., X.W. and J.Q.; visualization, X.L. and Z.L.; supervision, J.Q.; project administration, J.Q.; funding acquisition, J.Q. All authors have read and agreed to the published version of the manuscript.
Funding
This research was supported by research on the construction of a robot digital twin model and real-time data interaction technology (2021KJ102).
Institutional Review Board Statement
According to the relevant provisions of the “Technology Ethics Review Measures (Trial)”, this study, which involves human participants, adheres to the principles of promoting innovation and preventing risks, respecting life rights, and reasonably con-trolling risks as stipulated in the Measures. The pilot eye-tracking experiment under the green towing departure simulation scenario can be exempted from ethical review for the following reasons: the experimental risk level meets the definition of “minimum risk” in Article 52 (not higher than the risk of daily aviation ground operations); the experimental design does not involve any special ethical risks as stipulated in Article 15, nor is it included in the list of scientific and technological activities that require expert review under Article 25. After evaluation and confirmation by the Science and Technology Ethics Committee of our unit, this study meets the conditions for exemption from simplified procedures under Article 22. According to the ethical review methods for human life science and medical research, this experiment used Ganzin eye tracking devices that have been tested by the government and market departments to collect data. It is not a new product or technology, and scholars with similar research directions are conducting the experiment, so it can be exempted from review. In addition, this study involving human subjects was conducted in accordance with the principles outlined in the Declaration of Helsinki (1975, revised in 2013).
Informed Consent Statement
Informed consent was obtained from all subjects involved in the study.
Data Availability Statement
Data are available from the corresponding author upon reasonable request.
Conflicts of Interest
The authors declare no conflicts of interest.
References
- IATA. Fly Net Zero: Our Commitment to Fly Net Zero by 2050. 2021. Available online: https://www.iata.org/en/programs/sustainability/flynetzero/ (accessed on 17 January 2026).
- European Commission. Reducing Emissions from Aviation. 2017. Available online: https://ec.europa.eu/clima/eu-action/transport-emissions/reducing-emissions-aviation_en (accessed on 15 September 2025).
- International Civil Aviation Organization (ICAO). Trends in Emissions That Affect Climate Change. Available online: https://www.icao.int/environmental-protection/Pages/ClimateChange_Trends.aspx (accessed on 20 August 2025).
- International Energy Agency. Aviation. 2022. Available online: https://www.iea.org/reports/aviation (accessed on 5 October 2025).
- Gao, Y.Q.; Tang, T.Q.; Zhang, J.; You, F. Which aircraft has better fuel efficiency?—A case study in China. Transp. B Transp. Dyn. 2022, 10, 1032–1045. [Google Scholar] [CrossRef] [Scilit]
- Lee, D.S.; Fahey, D.W.; Skowron, A.; Allen, M.R.; Burkhardt, U.; Chen, Q.; Doherty, S.J.; Freeman, S.; Forster, P.M.; Fuglestvedt, J.; et al. The Contribution of Global Aviation to Anthropogenic Climate Forcing for 2000 to 2018. Atmos. Environ. 2021, 244, 117834. [Google Scholar] [CrossRef] [Scilit] [PubMed]
- Vennam, L.P.; Vizuete, W.; Talgo, K.; Omary, M.; Binkowski, F.S.; Xing, J.; Mathur, R.; Arunachalam, S. Modeled Full-Flight Aircraft Emissions Impacts on Air Quality and Their Sensitivity to Grid Resolution. J. Geophys. Res. Atmos. 2017, 122, 13472–13494. [Google Scholar] [CrossRef] [Scilit] [PubMed]
- Riley, K.; Cook, R.; Carr, E.; Manning, B. A systematic review of the impact of commercial aircraft activity on air quality near airports. City Environ. Interact. 2021, 11, 100066. [Google Scholar] [CrossRef] [Scilit] [PubMed]
- Hudda, N.; Durant, L.W.; Fruin, S.A.; Durant, J.L. Impacts of aviation emissions on near-airport residential air quality. Environ. Sci. Technol. 2020, 54, 8580–8588. [Google Scholar] [CrossRef] [Scilit]
- Zaporozhets, O.; Synylo, K. Improvements on aircraft engine emission and emission inventory assessment inside the airport area. Energy 2017, 140, 1350–1357. [Google Scholar] [CrossRef] [Scilit]
- Environmental and Energy Study Institute (EESI). The Growth in Greenhouse Gas Emissions from Commercial Aviation. 2019, Revised 2022. Available online: https://www.eesi.org/files/IssueBrief_Climate_Impacts_Aviation_2019rev2022.pdf (accessed on 25 July 2025).
- Deonandan, I.; Balakrishnan, H. Evaluation of strategies for reducing taxi-out emissions at airports. In Proceedings of the 10th AIAA Aviation Technology, Integration, and Operations (ATIO) Conference, Fort Worth, TX, USA, 13–15 September 2010; p. 9370. [Google Scholar]
- Bendtsen, K.M.; Bengtsen, E.; Saber, A.T.; Vogel, U. A review of health effects associated with exposure to jet engine emissions in and around airports. Environ. Health 2021, 20, 10. [Google Scholar] [CrossRef] [Scilit]
- EUROCONTROL. Sustainable Taxi Operations: Concept of Operations (CONOPS). 2024. Available online: https://www.eurocontrol.int/sites/default/files/2024-07/eurocontrol-sustainable-taxi-operations-conops.pdf (accessed on 17 January 2026).
- Federal Aviation Administration (FAA). Advisory Circular (AC) 00-65A: Towbar and Towbarless Movement of Aircraft. 2023. Available online: https://www.faa.gov/documentLibrary/media/Advisory_Circular/AC_00-65A.pdf (accessed on 17 January 2026).
- International Federation of Air Traffic Controllers’ Associations (IFATCA). Sustainable Ground Movement and Its Operational Impact; WP No. 94. 2025. Available online: https://ifatca.org/wp-content/uploads/WP-2025-94-1.pdf (accessed on 17 January 2026).
- Cao, F.; Tang, T.-Q.; Gao, Y.; You, F.; Zhang, J. Calculation and analysis of new taxiing methods on aircraft fuel consumption and pollutant emissions. Energy 2023, 277, 127618. [Google Scholar] [CrossRef] [Scilit]
- International Civil Aviation Organization (ICAO). Realizing Aviation’s Sustainable Future: Environmental Report 2025; ICAO: Montreal, QC, Canada, 2025; Available online: https://www.icao.int/environmental-protection/ (accessed on 18 September 2025).
- Van Oosterom, S.; Mitici, M. An environmentally-aware dynamic planning of electric vehicles for aircraft towing considering stochastic aircraft arrival and departure times. Transp. Res. Part C Emerg. Technol. 2025, 169, 104857. [Google Scholar] [CrossRef] [Scilit]
- Zaninotto, S.; Gauci, J.; Zammit, B. An autonomous tow truck algorithm for engineless aircraft taxiing. Aerospace 2024, 11, 307. [Google Scholar] [CrossRef] [Scilit]
- Ayiei, A. Improving Visual Attention Patterns Training and Its Integration in the Pilot Monitoring Training Curriculum. Ph.D. Thesis, RMIT University, Melbourne, Australia, 2025. [Google Scholar]
- Zhang, H.; Wang, C.; Wang, P. Research on safe multimodal detection method of pilot visual observation behavior based on cognitive state decoding. Brain Sci. 2024, 9, 103. [Google Scholar] [CrossRef] [Scilit]
- Navia, J.A.; Ibáñez-Gijón, J.; Travieso, D.; Montes, A.; de Frutos, P.L. Eye-tracking metrics for estimating workload and characterizing errors in conflict detection and resolution during simulated en route air-traffic control. Front. Psychol. 2025, 16, 1644721. [Google Scholar] [CrossRef] [Scilit] [PubMed]
- Kahneman, D.; Ben-Ishai, R.; Lotan, M. Relation of a test of attention to road accidents. J. Appl. Psychol. 1973, 58, 113–115. [Google Scholar] [CrossRef] [Scilit]
- Shinar, D. Driver Performance and Individual Differences in Attention and Information Processing: Driver Inattention; The Administration: Washington, DC, USA, 1978.
- Mihal, W.L.; Barrett, G.V. Individual differences in perceptual information processing and their relation to automobile accident involvement. J. Appl. Psychol. 1976, 61, 229. [Google Scholar] [CrossRef] [PubMed]
- Jacobson, N.; Bender, W. Color as a determined communication. IBM Syst. J. 1996, 35, 526–538. [Google Scholar] [CrossRef] [Scilit]
- Jones, D.G.; Endsley, M.R. Sources of situation awareness errors in aviation. Aviat. Space Environ. Med. 1996, 67, 507–512. [Google Scholar]
- Wickens, C.D.; Goh, J.; Helleberg, J.; Horrey, W.J.; Talleur, D.A. Attentional Models of Multitask Pilot Performance Using Advanced Display Technology. Hum. Factors 2003, 45, 360–380. [Google Scholar] [CrossRef] [Scilit]
- Cassavaugh, N.D.; Bos, A.; McDonlad, C.; Gunaratne, P.; Backs, R.W. Assessment of the SEEV model to predict attention allocation at intersections during simulated driving. In Proceedings of the Driving Assessment Conference; University of Iowa: Iowa City, IA, USA, 2013; 7p. [Google Scholar]
- Bos, A.J.; Ruscio, D.; Cassavaugh, N.D.; Lach, J.; Gunaratne, P.; Backs, R.W. Comparison of novice and experienced drivers using the SEEV model to predict attention allocation at intersections during simulated driving. In Proceedings of the Eighth International Driving Symposium on Human Factors in Driver Assessment, Training and Vehicle Design; Public Policy Center, University of Iowa: Iowa City, IA, USA, 2017; pp. 120–126. [Google Scholar]
- Jie, B.; Bing, Y.; Kun, Y. Quantitative research on impact factors of pilot’s attention allocation on HUD. J. Civ. Aviat. Univ. China 2015, 33, 51. [Google Scholar]
- Wu, X.; Wan, Y.; Zhuang, D. Modeling of attention allocation under Multi-factor conditions. J. Beijing Univ. Aeronaut. Astronaut. 2013, 39, 1086–1090. [Google Scholar]
- Wu, X.; Wan, Y.; Zhuang, D. Visual attention distribution prediction model based on spatial mapping. J. Beijing Univ. Aeronaut. Astronaut. 2014, 40, 1713–1718. [Google Scholar]
- Wang, C.; Yu, C.; Wang, M. A study on the cognitive process of controllers’ flight conflict allocation based on attention allocation. J. Saf. Environ. 2016, 16, 205–209. [Google Scholar]
- Wanyan, X.; Zhuang, D.; Wei, H. Pilot Attention Allocation Model In Complicated Human-machine Interface. In Proceedings of the 2009 2nd International Conference on Biomedical Engineering and Informatics; IEEE: New York, NY, USA, 2009; pp. 1–5. [Google Scholar]
- Wanyan, X.; Wei, H.; Zhuang, D. Study on pilot attention allocation model based on fuzzy theory. In Proceedings of the 2010 Sixth International Conference on Natural Computation, Yantai, China, 10–12 August 2010; pp. 2035–2039. [Google Scholar]
- Wanyan, X.; Zhuang, D.; Wei, H.; Song, J. Pilot attention allocation model based on fuzzy theory. Comput. Math. Appl. 2011, 62, 2727–2735. [Google Scholar] [CrossRef] [Scilit]
- Matsui, N.; Bamba, E. Evaluative cognition and attention allocation in human interface. Syst. Comput. Jpn. 1988, 19, 79–86. [Google Scholar] [CrossRef] [Scilit]
- Bao, H.; Fang, W.; Guo, B.; Wang, P. Supervisors’ visual attention allocation modeling using hybrid entropy. Entropy 2019, 21, 393. [Google Scholar] [CrossRef] [Scilit] [PubMed]
- Yao, X.; Yao, X.; Wang, W. Measurement of Uncertain Information in Machining Processes. J. Henan Univ. Sci. Technol. (Nat. Sci. Ed.) 2004, 25, 17–20. [Google Scholar]
- Shannon, C.E. A mathematical theory of communication. Bell Syst. Tech. J. 1948, 27, 379–423. [Google Scholar] [CrossRef] [Scilit]
- Matsui, N.; Bamba, E. Consideration of the Attention Allocation Problem based on Fuzzy Entropy. Trans. Soc. Instrum. Control Eng. 1986, 22, 623–628. [Google Scholar] [CrossRef] [Scilit]
- Kleinman, D.; Baron, S.; Levison, W. A control theoretic approach to manned-vehicle systems analysis. IEEE Trans. Autom. Control 1971, 16, 824–832. [Google Scholar] [CrossRef] [Scilit]

Disclaimer/Publisher’s Note: The statements, opinions and data contained in all publications are solely those of the individual author(s) and contributor(s) and not of MDPI and/or the editor(s). MDPI and/or the editor(s) disclaim responsibility for any injury to people or property resulting from any ideas, methods, instructions or products referred to in the content. |
© 2026 by the authors. Licensee MDPI, Basel, Switzerland. This article is an open access article distributed under the terms and conditions of the Creative Commons Attribution (CC BY) license.