


Abstract
As federated learning scales up in distributed scenarios, training instability and performance degradation caused by data quality issues—such as statistical heterogeneity and noise—have become major bottlenecks for practical deployment. Existing aggregation algorithms have been shown to not adequately account for differences in data importance. This can exacerbate client selection bias and incentive misalignment. As a result, global convergence can slow down and performance can deteriorate. To address this issue, this paper proposes a robust federated learning framework based on data heterogeneity grading and marginal contribution calculation. The objective of this study is to enhance the overall performance of federated learning systems in heterogeneous environments by quantifying data importance. The framework first grades and quantifies the heterogeneity of client data distributions, precisely characterizing data importance while reducing the computational space for Shapley value calculations, effectively lowering its exponential complexity. Subsequently, it integrates client marginal contributions with data distribution heterogeneity to establish a dynamic weighted aggregation mechanism that balances fairness, robustness, and differentiated data quality requirements. Multi-dataset comparative experiments demonstrate that the proposed method achieves consistent gains in model accuracy and convergence under non-IID splits and noisy-label settings.
1. Introduction
Federated learning is a method by which multiple parties can collaboratively build models without sharing raw data. This process involves performing local computations on each client and subsequently aggregating them at the server to generate a global model [1]. This approach has demonstrated a high degree of adaptability to a variety of distributed application scenarios [2,3,4,5,6]. However, in practical applications, deficiencies in data quality are a primary impediment to effective utilization. These deficiencies manifest in the form of pronounced data heterogeneity, which is characterized by significant variations in feature and label distributions across client datasets. Inherent noise and outliers within the data itself contribute to these challenges, and they are further compounded by malicious client behaviors such as data tampering and the injection of malicious parameters [7,8,9,10]. These data quality issues can lead to systematic bias in local models. Under the paradigm of federated learning, the distributed architecture fosters data heterogeneity, noise, and malicious data quality defects, thereby engendering biased local models. Existing aggregation mechanisms are ineffective in counteracting the impact of local biases, which ultimately causes the global model to deviate from the optimal target. This deviation leads to significant declines in convergence efficiency and accuracy. Therefore, the key to surmounting implementation impediments lies in the development of robust aggregation mechanisms that accommodate data heterogeneity and filter out low-quality data. This approach is predicated on a duality of objectives: to optimize both fairness and efficiency, while concomitantly mitigating the deleterious impact of data quality issues on model performance.
Existing aggregation methods often neglect data-quality issues (e.g., heterogeneity, noise, and outliers). These issues further amplify the intrinsic limitations of standard aggregation, causing biased local updates to dominate the global model. The classical FedAvg method [11] employs sample size as the weighting criterion. Although this method is simple and efficient, it fails to reflect variations in data quality. As a result, local biases from low-quality data are allowed to propagate directly to the global level. Subsequent improvements [11,12,13] endeavored to address data and system heterogeneity. However, these improvements neglected to formulate client selection and weight allocation from a data quality perspective. Consequently, the discussion remained constrained by the limitation of discussing aggregation without addressing data quality, leaving the core issue of incentive misalignment fundamentally unresolved. The Shapley value [14], derived from cooperative game theory, enables fair client value assessment based on individual contributions without accessing raw data. Nonetheless, its direct computation is prohibitively costly, necessitating approximate methods [15,16,17] to reduce computational overhead. The unique properties of the Shapley value have led to the proposal of numerous derivative methods that leverage it as an incentive mechanism for rewarding participating users in federated learning. Among these, the S-FedAvg method [18] explores the application of the Shapley value approach to screen clients that positively impact the global learning objective; AFsdSV-class methods [19] approximate Shapley values through temporal accumulation, concurrently constructing aggregation weights and importance sampling probabilities. Recently, the method proposed in [20] integrates the Shapley value, data labels, and sample size information to construct aggregation weights during the aggregation phase. However, the utilization of Shapley value estimates for the evaluation of client contributions during aggregation is subject to inherent limitations. The computational complexity associated with clients is , which is notably high. This makes it difficult to evaluate relative contributions among all clients. Even approximate methods to reduce computational costs struggle to accommodate quality differentiation assessments for large client populations. This approach fails to correct contribution biases arising from data quality while imposing additional computational burdens on servers, compounding the efficiency challenges of aggregation mechanisms with the impacts of data quality.
To this end, this paper proposes a federated learning method based on heterogeneity grading and marginal contribution calculation. The core innovations of the system are manifest in two aspects. Firstly, prior to the initiation of global aggregation, the heterogeneity of client data distribution is quantified through rating and grouping into high, medium, and low tiers. The process of establishing differentiated sampling ratios for each tier is predicated on the principle of decreasing ratios as heterogeneity ratings diminish. In each aggregation round, participating clients are selected from each group at random, according to the preset ratios. This approach has been demonstrated to markedly reduce the computational complexity of Shapley value calculations and to regulate computational overhead, while concurrently safeguarding the participation rights of clients exhibiting varying degrees of heterogeneity. This approach is intended to guarantee the diversity and representativeness of client sources. Secondly, the integration of two core metrics—client marginal contribution and data distribution heterogeneity—establishes a dynamic weight allocation mechanism, thereby enhancing the robustness of global aggregation. This approach effectively balances fairness and efficiency in aggregation, improving algorithmic scalability and enabling adaptation to large-scale federated learning systems encompassing hundreds to thousands of clients.
2. Theoretical Basis and Algorithm Design of the Aggregation Mechanism
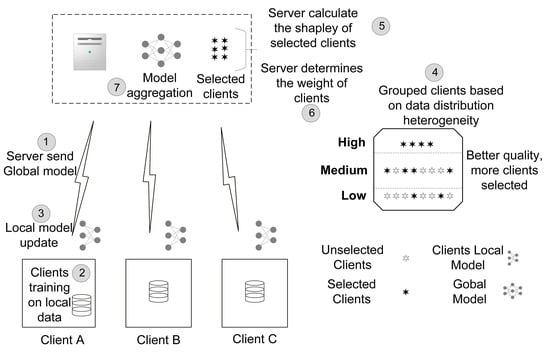
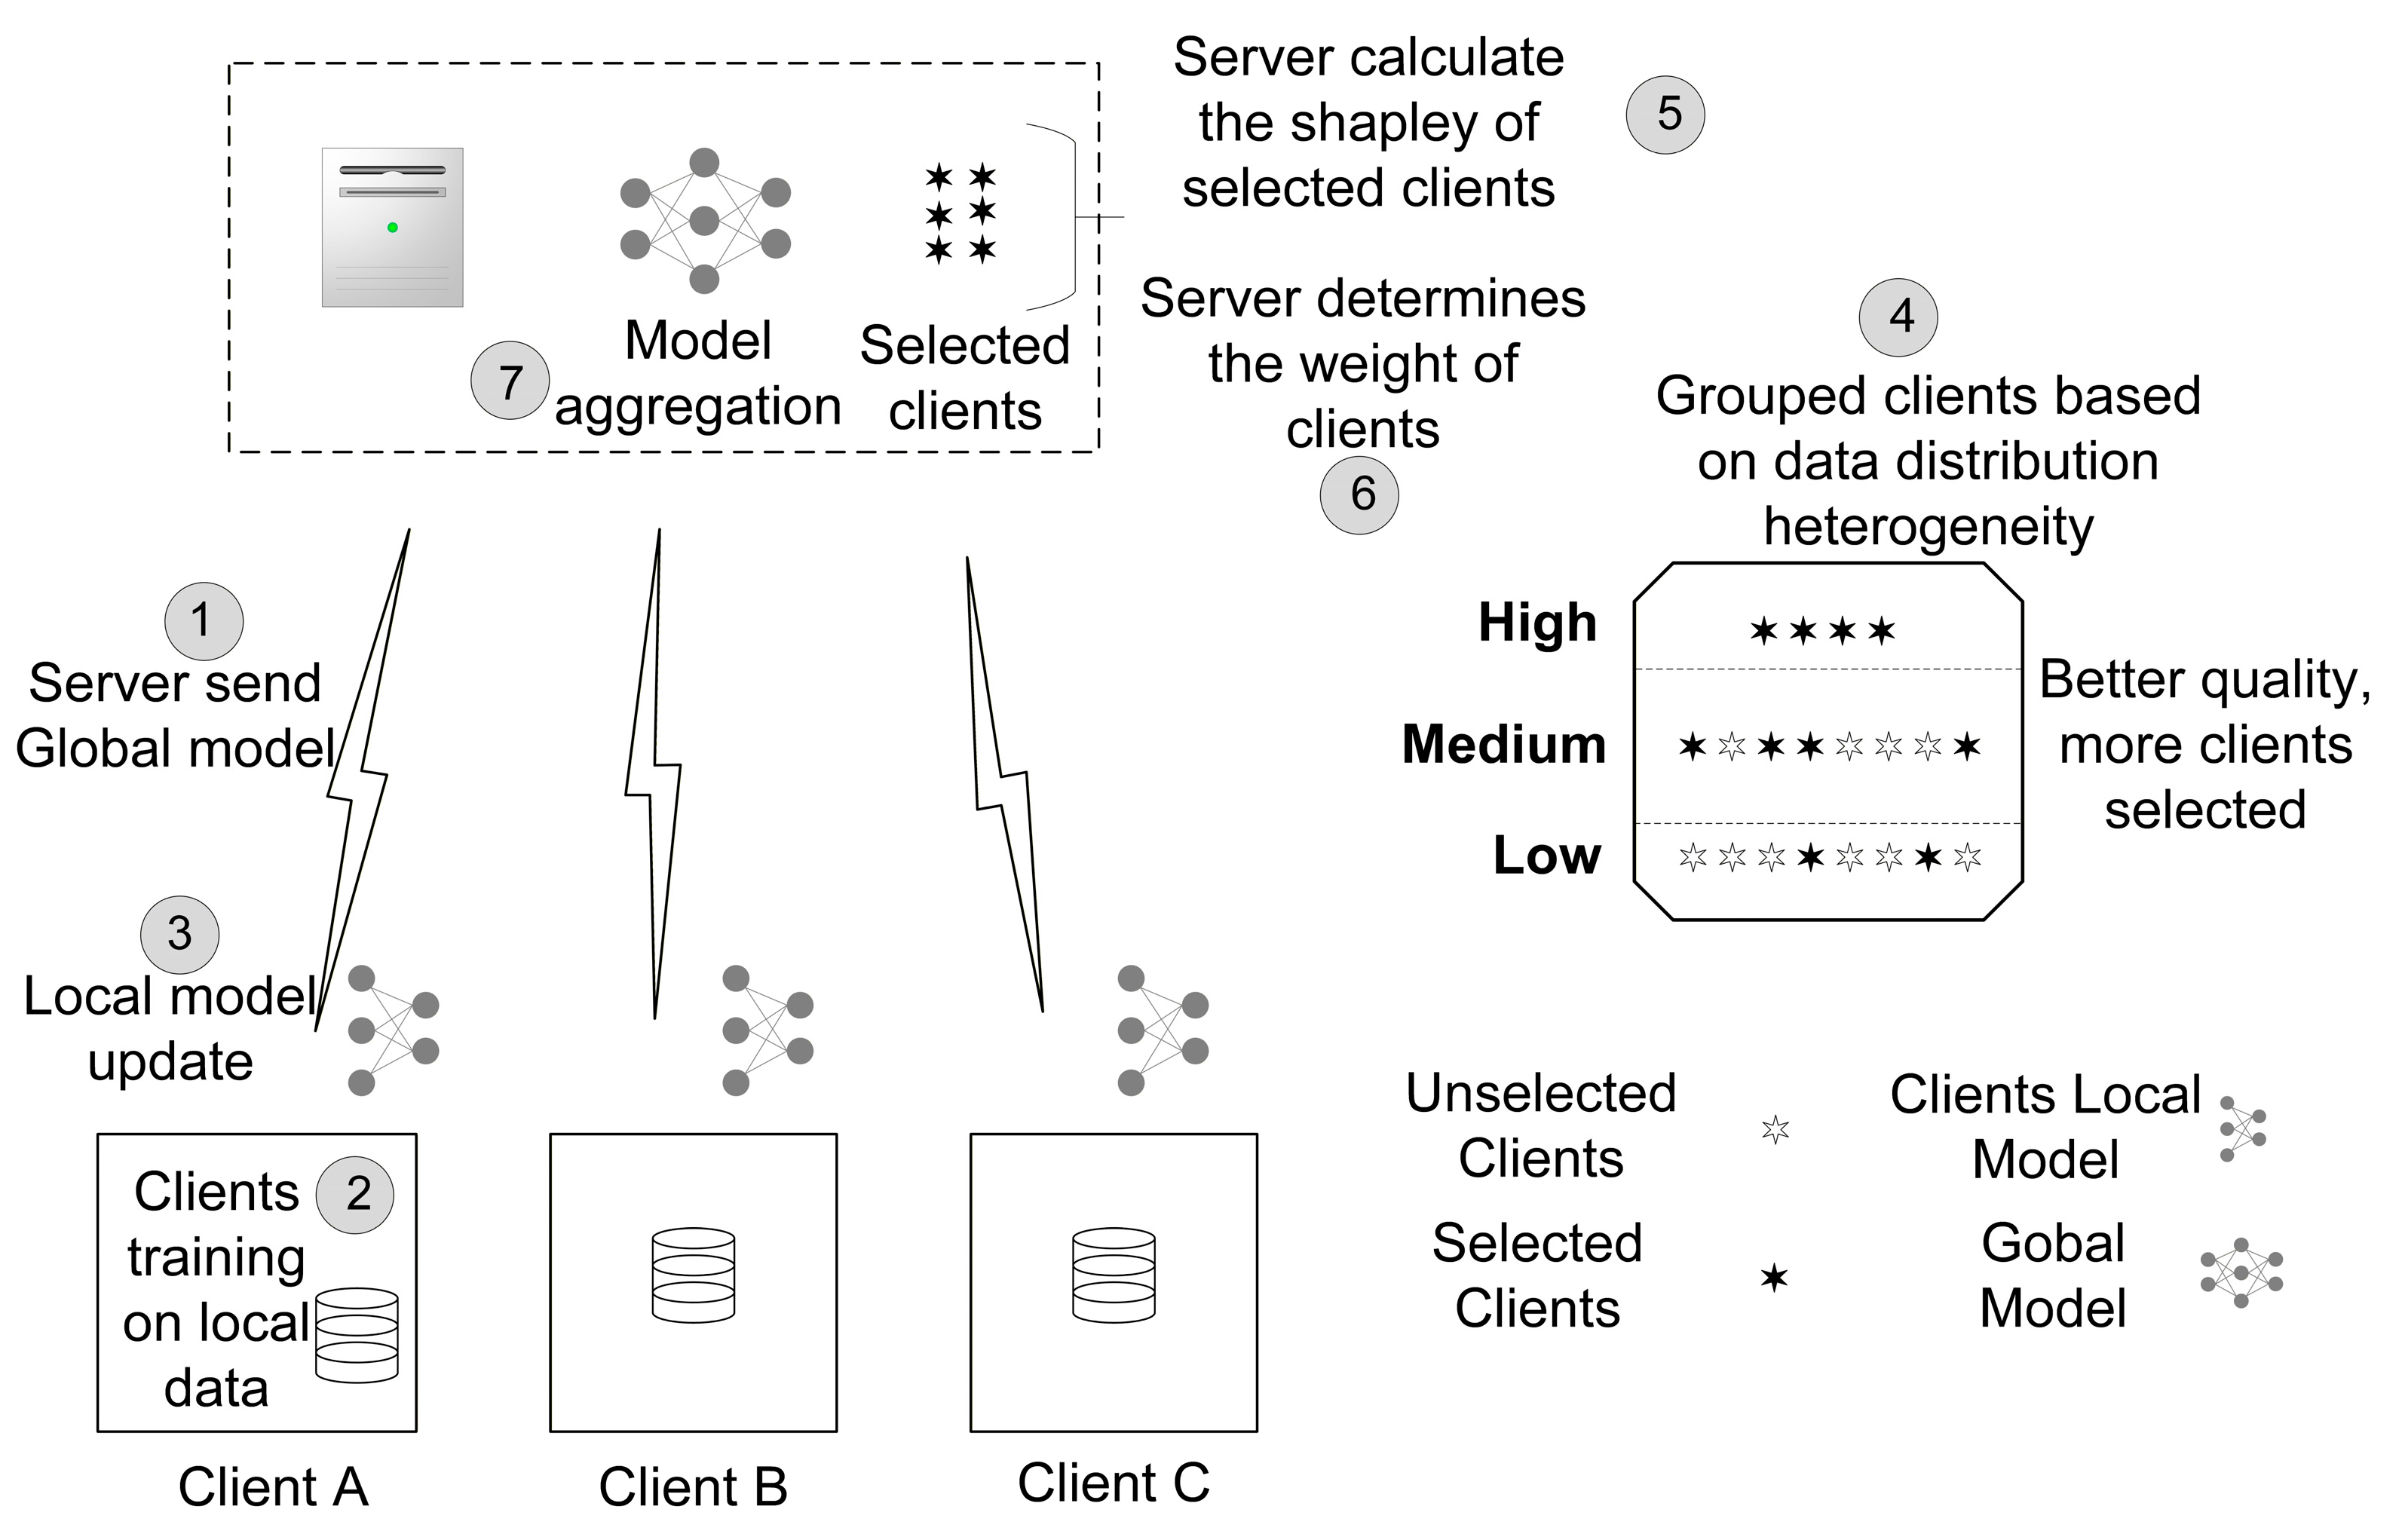
In this paper, we propose an adaptive weighting mechanism based on data heterogeneity classification and marginal contribution, which regards the global model training process as a cooperative game. In order to reduce the computational overhead of Shapley evaluation, the server first groups the clients according to the heterogeneity degree of their local data distribution (step 4), divides them into three levels according to heterogeneity: low/medium/high heterogeneity, and assigns tier-wise participation ratios . By design, higher heterogeneity implies lower data reliability; therefore, the corresponding participation ratio is reduced. The aggregation process of each round corresponds to the steps in the figure: the server shares the global model to the selected clients (step 1); the selected client performs training based on local data (step 2), updates the local model (step 3), and sends the local model back to the server. The Shapley value of the selected client is calculated (step 5), and the aggregation weight of the client is determined by the server combining the Shapley value and the heterogeneity score (step 6); finally, the global model aggregation is completed (step 7). Figure 1 shows the overall framework of the process, and the mechanism and implementation details of the marginal contribution estimation and group sampling strategy in weight construction are further explained in the following.
Figure 1.
Federated learning method based on cooperative game theory to improve efficiency.
2.1. Score Calculation of Heterogeneity Degree of Data Distribution
In this paper, the data distribution heterogeneity score is a quantitative indicator to measure the shift degree and distribution difference of the local data distribution of each client in the feature or label dimension with respect to the reference distribution (such as the global data center of gravity, task target distribution) under the federated learning framework. Wasserstein-distance-based data distribution heterogeneity analysis [21,22,23,24], which relies on the optimal transport theorem [25,26], provides a model-independent and interpretable measurement basis, which is suitable for client classification before starting global model aggregation, and then dividing different heterogeneous subsets. To this end, this paper introduces a method based on optimal transport theory to achieve a quantitative score of client data heterogeneity by calculating the Wasserstein distance between the client data distribution and the global distribution.
In this method, in order to quantify the feature or label dimension, the statistical features calculated on the local dataset feature space of the client in the federated system are denoted as , and different are generally different from each other. The objective reference distribution maintained on the server side is . The Wasserstein distance is used to measure the difference between the data distribution of each client and the reference distribution. However, in federated learning, directly obtaining all on the server side to compute violates privacy constraints. To this end, this paper introduces an interpolation distribution between the client and the server to approximate the solution. We do not transmit any raw samples, labels, or record-level identifiers. The server only receives distribution-level summaries used for heterogeneity grading (e.g., interpolated distribution representations and/or the derived distance scalars), which serve as aggregated surrogates rather than sample-level data. Therefore, the information shared is limited to coarse distributional statistics for grouping and weighting, while the local training data remain entirely on-device.
Specifically, the statistical feature extraction is first done locally on the client: the -th client constructs an empirical distribution on the local dataset and computes the statistical features, denoted as , on which the interpolated distribution is initialized. In the -th iteration, the client combines the current interpolated distribution and the local statistical features to obtain the intermediate distribution of the client’s local statistical feature distribution and the interpolated distribution , which is used to calculate the distance between the local statistical feature and the intermediate interpolation distribution:
The and the are then uploaded to the server. The server collects the interpolated distributions uploaded by all clients , updates the target reference distribution on this basis, constructs the intermediate distribution between the target reference distribution and the interpolated distribution for each client, broadcasts the to the corresponding client, and updates a new round of in the client with or the next round of calculation. At the same time, the distance between the target reference distribution and the intermediate interpolation distribution is calculated in the server.
After several rounds of alternating local and global computations, convergence yields the target reference distribution and the interpolated distribution . The distance between the client data distribution and the reference distribution can be obtained by using Equations (2) and (3) on the server side:
In this equation, and represent the Wasserstein distances from the client data distribution to the interpolation distribution , and from the interpolation distribution to the global distribution , respectively. After calculating for each client, we standardize the results to derive a data heterogeneity score for every client. This conversion is accomplished through the following formula:
Equation (4) indicates that the heterogeneity score of data distribution follows an inverse distance relationship: the closer the feature distribution aligns with the global distribution (i.e., the global centroid or target distribution), the smaller the Wasserstein distance becomes, resulting in a higher score; conversely, greater divergence in feature distribution corresponds to a larger Wasserstein distance and a lower score.
In the global aggregation stage, a differentiated sampling strategy was adopted for different subsets. The group with a local data distribution closer to the reference distribution (that is, the group with lower heterogeneity) was given a higher sampling priority, and the corresponding sampling proportion was higher. Conversely, the higher the heterogeneity of the group, the lower the sampling proportion. By default, the group composition ratio of the low-, medium-, and high-heterogeneity groups after grading was approximately . For per-round participation control, we use tier-wise sampling with participation ratios , typically satisfying . This setting provides a practical trade-off between performance and overhead. Furthermore, the sampling quota can be dynamically adjusted according to the total number of clients and the computing power budget of the server: by controlling the scale of clients participating in each round of aggregation, an adjustable trade-off between computing cost and aggregation performance is achieved.
2.2. Calculation of Marginal Contribution
After the client completes the local model training, it uploads it to the server. In order to improve the global training performance, the Shapley value of each selected client is calculated in the global aggregation stage to quantify its marginal contribution to the global model. The Shapley value of a client is defined as the average marginal contribution of the client on its subset. The contribution evaluation based on the Shapley value can accurately measure the actual effect of the client on the performance improvement of the global model. From a mathematical perspective, the Shapley value of client in round , denoted as , is defined by the following expression.
In the equation, denotes the set of clients participating in aggregation during the -th round ( is obtained through grouped sampling and is smaller than the total number of clients); represents the subset as the set of all participating clients in the -th round that do not include client . denotes the value function of the subset after adding client ; represents the performance gain of the global model following the aggregation of subset .
In the t-th round, let be the global model before aggregation, and be the updated model after aggregation. This paper defines the value function as the increase in accuracy: . Therefore, represents the increase in accuracy of the model obtained after aggregation compared with .
However, even for a subset of selected clients, the cost of directly calculating the Shapley value is still high. Due to the limited computing power of our hardware, in this paper, the Shapley value definition is still used as the core characterization basis for the contribution degree at the theoretical level. In the implementation, GTG-Shapley is adopted as an approximate calculation method for the Shapley value, and precise enumeration is avoided. During the implementation process, we mainly inherited the following two strategies: (i) guiding arrangement/sorting strategy to stabilize the marginal revenue estimation; (ii) truncation in the same round/ different rounds, which significantly reduces the computational load, thereby obtaining client contribution estimation results with an accuracy close to the true Shapley value within an acceptable computational cost range. In the experimental settings of this paper, they are set as follows. Iteration budget: To reduce the computational overhead, we set num_permutations = 500, meaning that the contribution estimation for each client is approximated via 500 permutations. Truncation threshold: To improve computational efficiency and avoid excessive iterations, we set truncation thresholds at the following positions: epsilon_b = 0.001, used for inter-round truncation. When the marginal contribution is below this value, the computation stops; epsilon_f = 0.0005, used for intra-round truncation. When the marginal contribution is below this value, the computation stops. When the calculated marginal benefit is smaller than the preset threshold epsilon_b, the algorithm terminates the Shapley value computation for the current round and skips the corresponding round update. These settings ensure that the Shapley value estimation can be completed within a reasonable time while maintaining satisfactory accuracy.
This result will be used as the input for the marginal contribution part in the method of this paper to further control the cost. These components are only used for contribution estimation. The main contribution of the proposed method still lies in achieving heterogeneous perception and utilization of the estimated contribution signal through stratification, different indicator weighting, and hierarchical sampling.
After calculating the estimated Shapley value of each client, it is normalized to obtain the contribution score :
In the equation, represents the Shapley value of client i; Smin and Smax denote the minimum and maximum Shapley values among all clients, respectively, in order to avoid negative Shapley values and large differences, and, thus, to avoid a negative impact on the final weighting calculation.
2.3. Global Model Training
After receiving the local training model of the client, the server quantified the individual contribution of each client based on the model accuracy, then calculated the marginal contribution of the client based on the individual contribution, used the marginal contribution value as the core basis to configure the aggregation weight for the global model training, and, finally, realized the iterative update of the global model.
In this equation, and denote the marginal contribution score and the data distribution heterogeneity score of the th client, respectively. and . Parameter denotes the weight assigned to the marginal contribution, while parameter represents the weight allocated to the heterogeneity of data distribution. Equation (7) integrates the weighted contributions of two data features, where weight represents the relative importance of marginal contribution and data distribution heterogeneity during the aggregation process. These weights enable us to flexibly adjust the emphasis of different data features in the aggregation process according to the specific requirements or priorities of the learning. Additionally, the formula evaluates the aggregated metrics , which, respectively, represent the marginal contribution and data heterogeneity of the client. Aggregated metrics provide a more comprehensive characterization of the data characteristics across different client groups, thereby offering more complete information for aggregation decisions.
Specifically, parameter represents the weight assigned to each client’s Shapley contribution, enabling the aggregation phase to accurately reflect the client’s true impact on the global model. This weighting mechanism provides a fairer assessment of different clients’ participation value, particularly in scenarios where data contribution cannot be measured solely by sample quantity. Given the critical role of Shapley contributions in determining each client’s current state and relevance to training, parameter is set to emphasize their priority. Relatively, denotes the weight assigned to the distribution heterogeneity of data, used to characterize the deviation between client-side local data and the global target distribution, thereby embodying the core value of data diversity in federated learning. We conducted a sensitivity analysis on the fusion weights, under the setting where and , and a comprehensive comparison was made. It was found that achieved a faster convergence performance while maintaining the final accuracy. Therefore, they were set as the default parameters. The value represents an empirically validated balancing strategy: on one hand, Shapley values dynamically and quantitatively assess the true importance of client inputs, thereby assigning them higher weights; on the other hand, data distribution heterogeneity constrains occasional estimation errors in Shapley values, ensuring fairness in weight allocation. Through this weighted equilibrium, the model aggregation process achieves an optimal trade-off between fairness and overall performance.
Our proposed algorithm is described in Algorithm 1.
The algorithm starts by calculating for each client through several iterations (lines 1–8), which is used to evaluate the heterogeneity degree of data distribution among clients and compute the heterogeneity score . A smaller indicates a higher score. Then clients are divided into different client sets according to their scores (lines 9–10). After that, multiple rounds of training iterations of the algorithm begin, denoted as . Clients are selected to participate in global training according to the settings, and each selected client initializes its local model for training. For each client , the local model parameters are updated by gradient descent. Specifically, denotes the local model parameters of client , is the learning rate of the -th client, and represents the gradient, as described in lines 14–17. According to lines 9–12, the individual contribution value of each client is computed and stored. The detailed process of calculating the Shapley value is shown in line 21, which is normalized to obtain the contribution score . After computing the marginal contributions, as described in line 26, the global model is updated according to the equation proposed in this paper.
| Algorithm 1. Our proposed algorithm for global model training |
| 1 Input: Local data distribution , initialization of and , . 2 For to do 3 Clients compute distance 4 Send and to server 5 Server compute distance 6 Server send to -th client 7 Client update based on and 8 Server compute distance 9 Normalization into heterogeneous scores 10 Grouping clients by score-based 11 End For 12 Output: heterogeneous scores and grouping clients 13 For round do 14 Select aggregation-participating clients based on group 15 Initialization of local training 16 For selected client do 17 18 End for 19 Compute Shapley Value using Selected Clients 20 For each selected client do 21 22 Normalization into the contribution score: 23 24 End for 25 Global Model Training 26 27 End For |
3. Data Simulation Results and Analysis
This chapter systematically validates the proposed mechanism through experimental verification. To demonstrate the effectiveness of the proposed federated learning framework in industrial settings, both the rail defect dataset and the public MNIST dataset were selected for validation analysis.
3.1. Application and Experimental Analysis in Rail Defect Recognition Dataset
3.1.1. Experimental Dataset
The experimental dataset originated from vibration signals collected across different sections of a railway locomotive depot, covering normal conditions and three typical damage types: wave wear, fish scale damage, and spalling. It authentically reflects the real operational conditions of heavy-haul railways. The data was acquired via accelerometers mounted on a rail flaw detection vehicle, accurately capturing the vibration characteristics of rails under actual operational conditions. Given issues such as uneven energy distribution, noise interference, and non-stationarity in the raw vibration data, it underwent a series of preprocessing steps. Specifically, peak normalization was performed for each file, followed by concatenation and standardization. The dataset was split with a fixed 7:3 ratio; for each operating condition, this yielded 420 training samples and 168 test samples, with balanced class proportions across the three categories. The data files include four operating conditions in total. As the sampling frequency is not provided in the data files, the window length is reported in the number of samples (2500 time steps).
For the rail vibration classification task, we used a two-dimensional convolutional neural network (2D CNN). Each sample was reshaped to a 3 × 50 × 50 tensor, and fed into two convolutional blocks followed by a fully connected classifier with three output classes. We trained the model for 50 epochs using Adam with learning rate and a batch size of 48.
3.1.2. Experimental Setup and Performance Evaluation Index
The present study investigates the impact of integrating value indicators on the federated learning process. All methods employed in this study utilize a similar neural network structure, ensuring that the model configuration remains consistent throughout the process to ensure fair performance evaluation. To verify the efficacy of integrating value indicators in enhancing federated learning performance, this study compares the proposed methods with three advanced federated learning methods: S-FedAvg, ShapFederated, and AfedSV, as well as the proposed methods. Notably, ShapFederated employs the conventional Shapley value calculation approach, while S-FedAvg utilizes an enhanced FedAvg method, relying on Shapley value (SV) ratings to select relevant clients for addressing irrelevant data or client issues. AfedSV, on the other hand, is based on Shapley value variation, representing a resilient federated learning algorithm.
Regarding performance evaluation metrics, this paper selects four indicators: final accuracy, convergence iterations, precision, and recall. These metrics comprehensively assess the overall performance of federated learning models across three dimensions: model accuracy, training efficiency, and classification capability. The definitions of each metric are as follows. Final accuracy evaluates the overall classification correctness of the global model on the test set, intuitively reflecting the effectiveness of different methods in enhancing the model’s overall performance. Precision characterizes the reliability of model predictions for target categories, measuring the model’s ability to control false positives. Recall evaluates the model’s coverage in identifying true target samples, effectively detecting its suppression of false negatives. Convergence rounds are defined as the number of communication rounds required for the model to reach a preset stable performance threshold, comprehensively reflecting the convergence speed and optimization robustness of the global model from the perspectives of optimization efficiency and training stability.
In the experiment, to simulate a network environment composed of 10 randomly distributed clients, the dataset was partitioned into multiple non-independent and identically distributed (non-IID) forms. Each client was randomly assigned 10 sub-datasets, with label noise introduced at varying proportions ranging from 0% to 40% to mimic data heterogeneity in real-world scenarios. After grouping clients based on heterogeneity scores, the low-/medium-/high-heterogeneity tiers subsets comprised 2, 4, and 4 clients, respectively. Corresponding extraction ratios were set to 100%, 50%, and 25%, meaning that each round of aggregation selected 2, 2, and 1 clients from each subset. To validate algorithm scalability, the client count was further expanded to 20. Maintaining the same non-IID data distribution strategy and label noise settings, the grouped low-/medium-/high-heterogeneity tiers subsets contained 4, 8, and 8 clients, respectively. The extraction ratios were adjusted to 75%, 37.5%, and 12.5%, corresponding to 3, 3, and 1 clients extracted per round. Experimental results indicate that computational complexity increases incrementally with the number of clients. Our method significantly reduces the number of clients participating in each aggregation round through a rational client selection strategy. The random sampling mechanism ensures high participation of low-heterogeneity-tier clients while maintaining an exploratory proportion for high-heterogeneity clients. Concurrently, the multi-parameter-considered aggregation weight distribution effectively safeguards the stability of model performance.
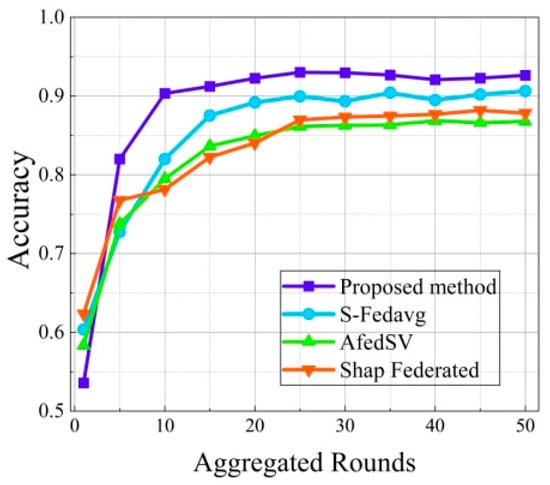
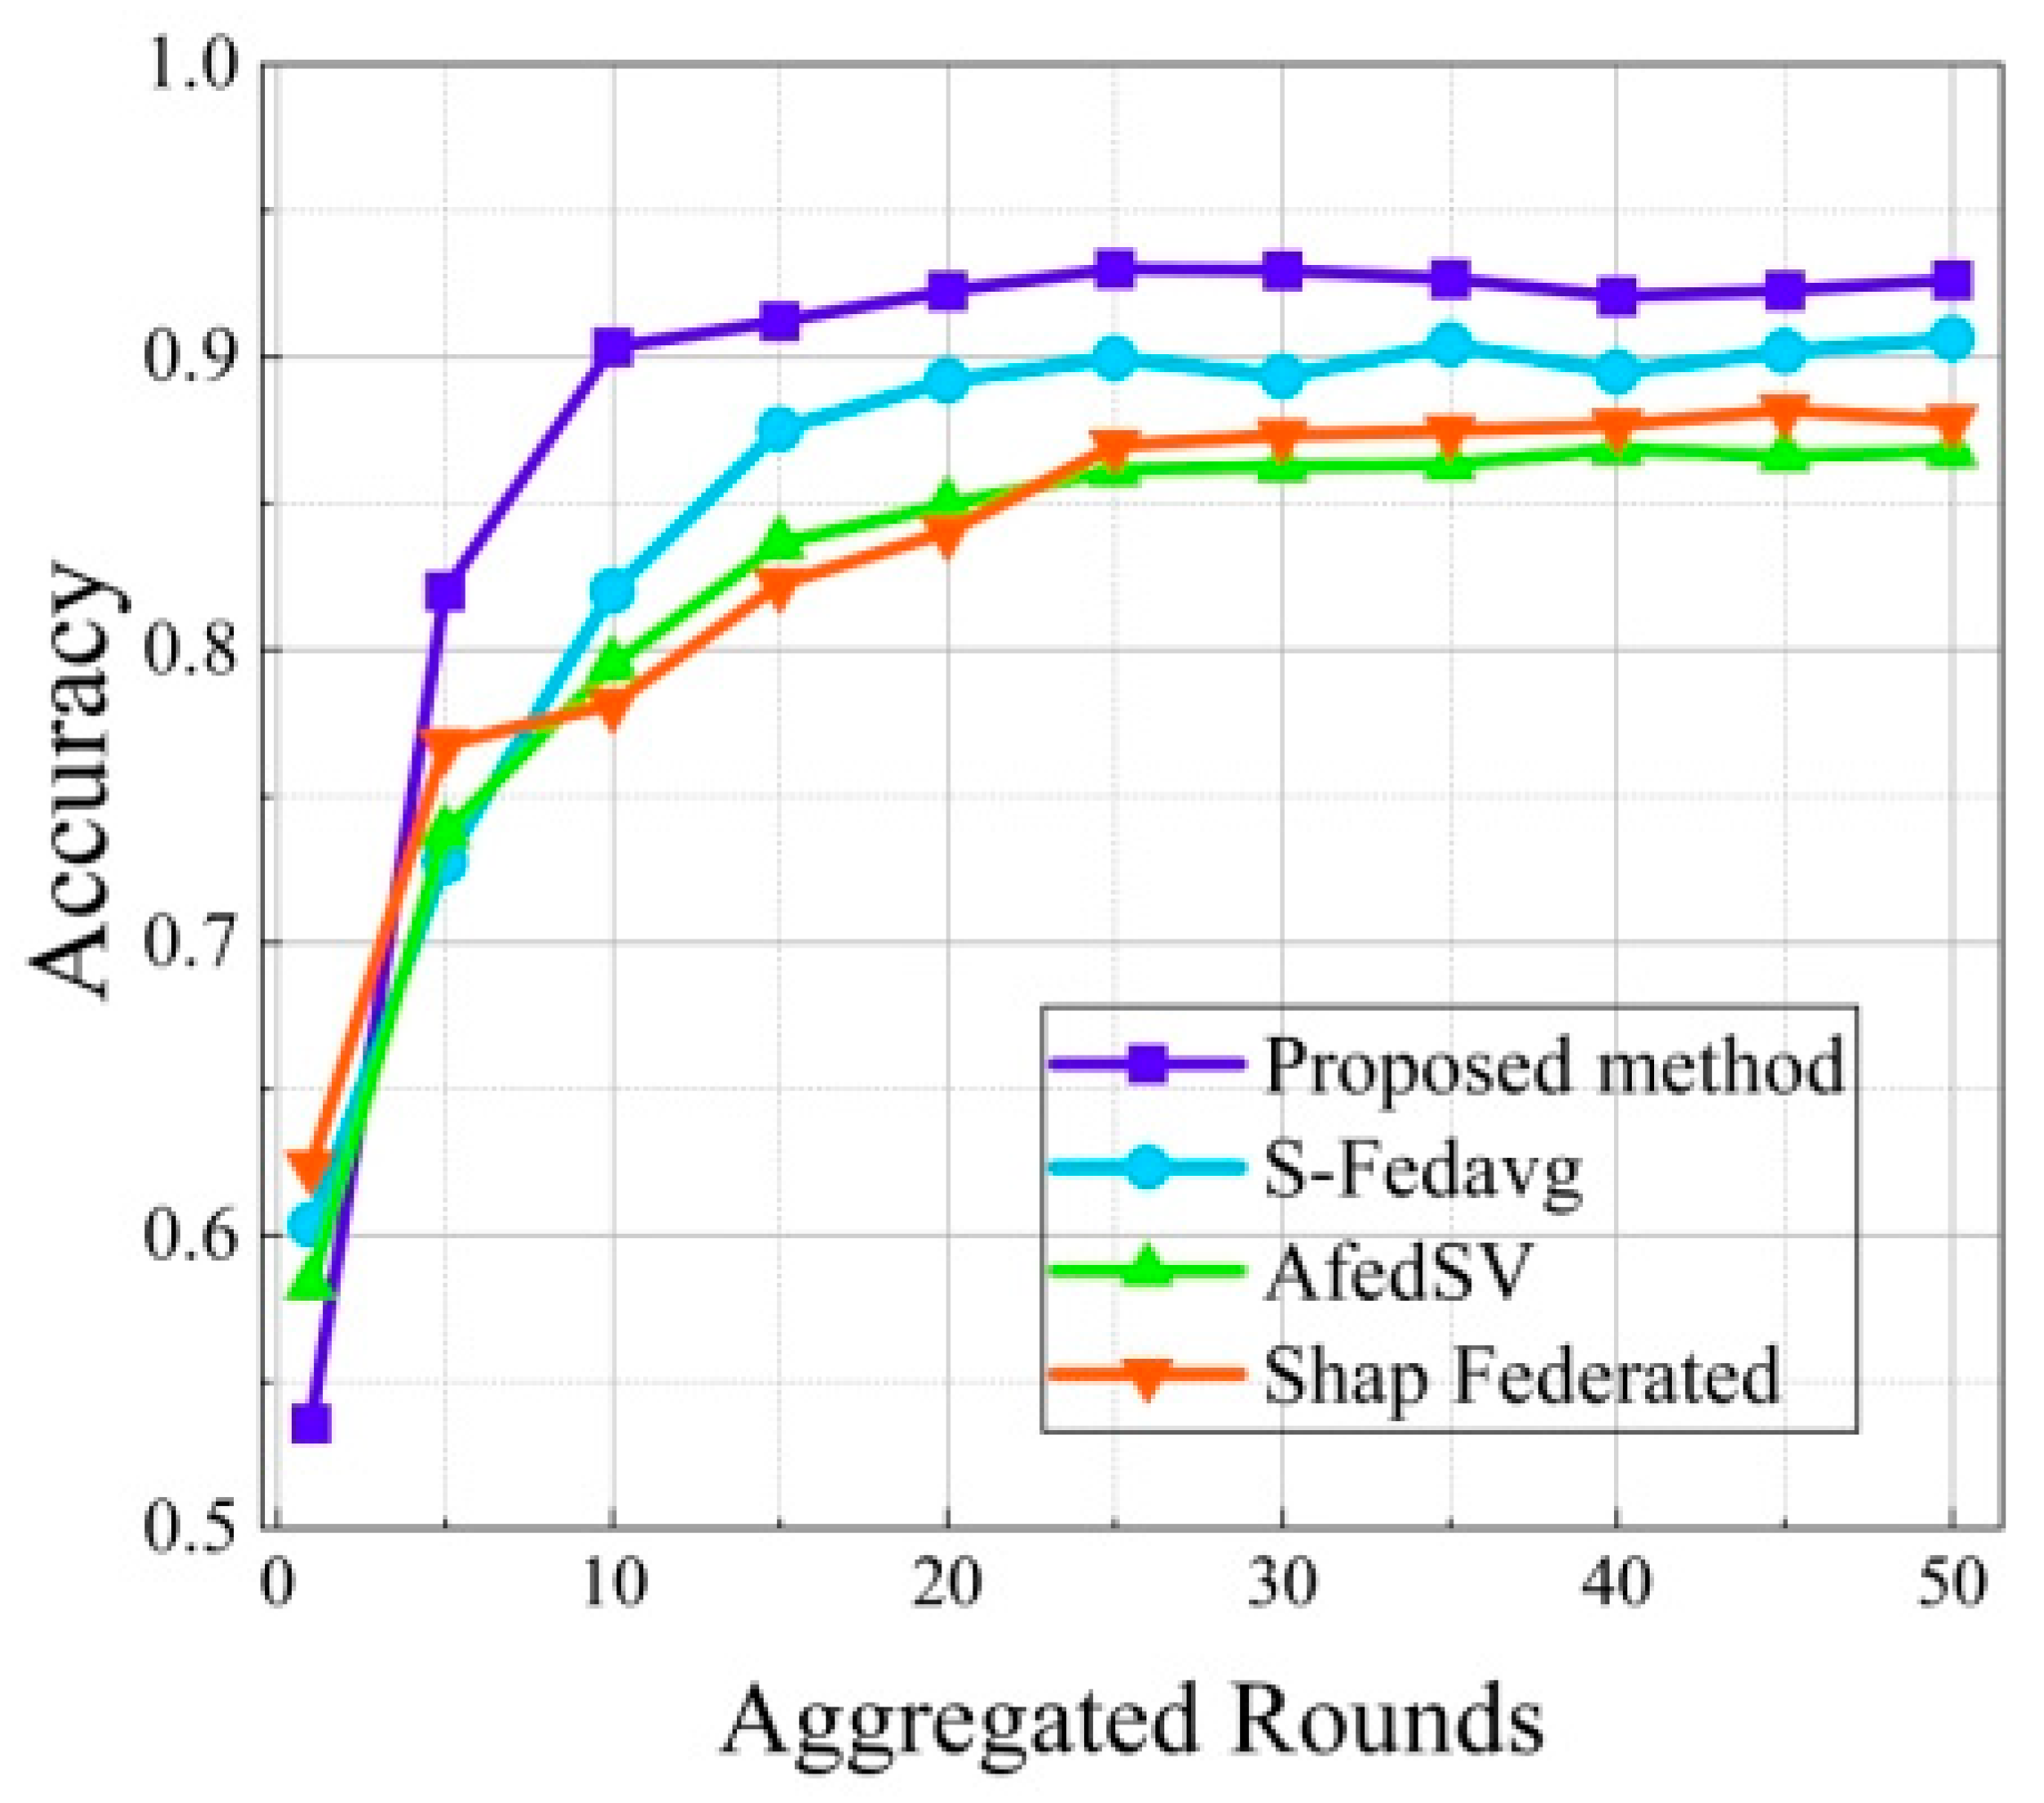
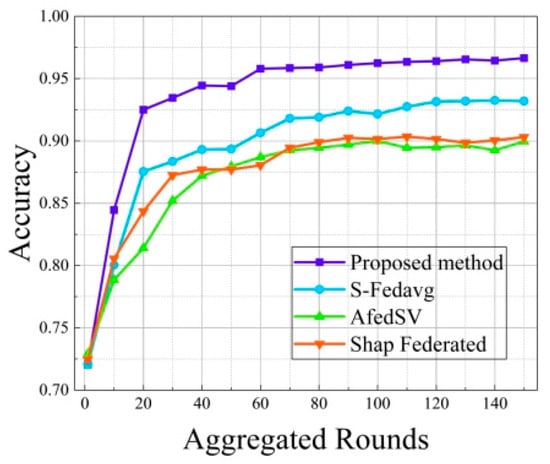
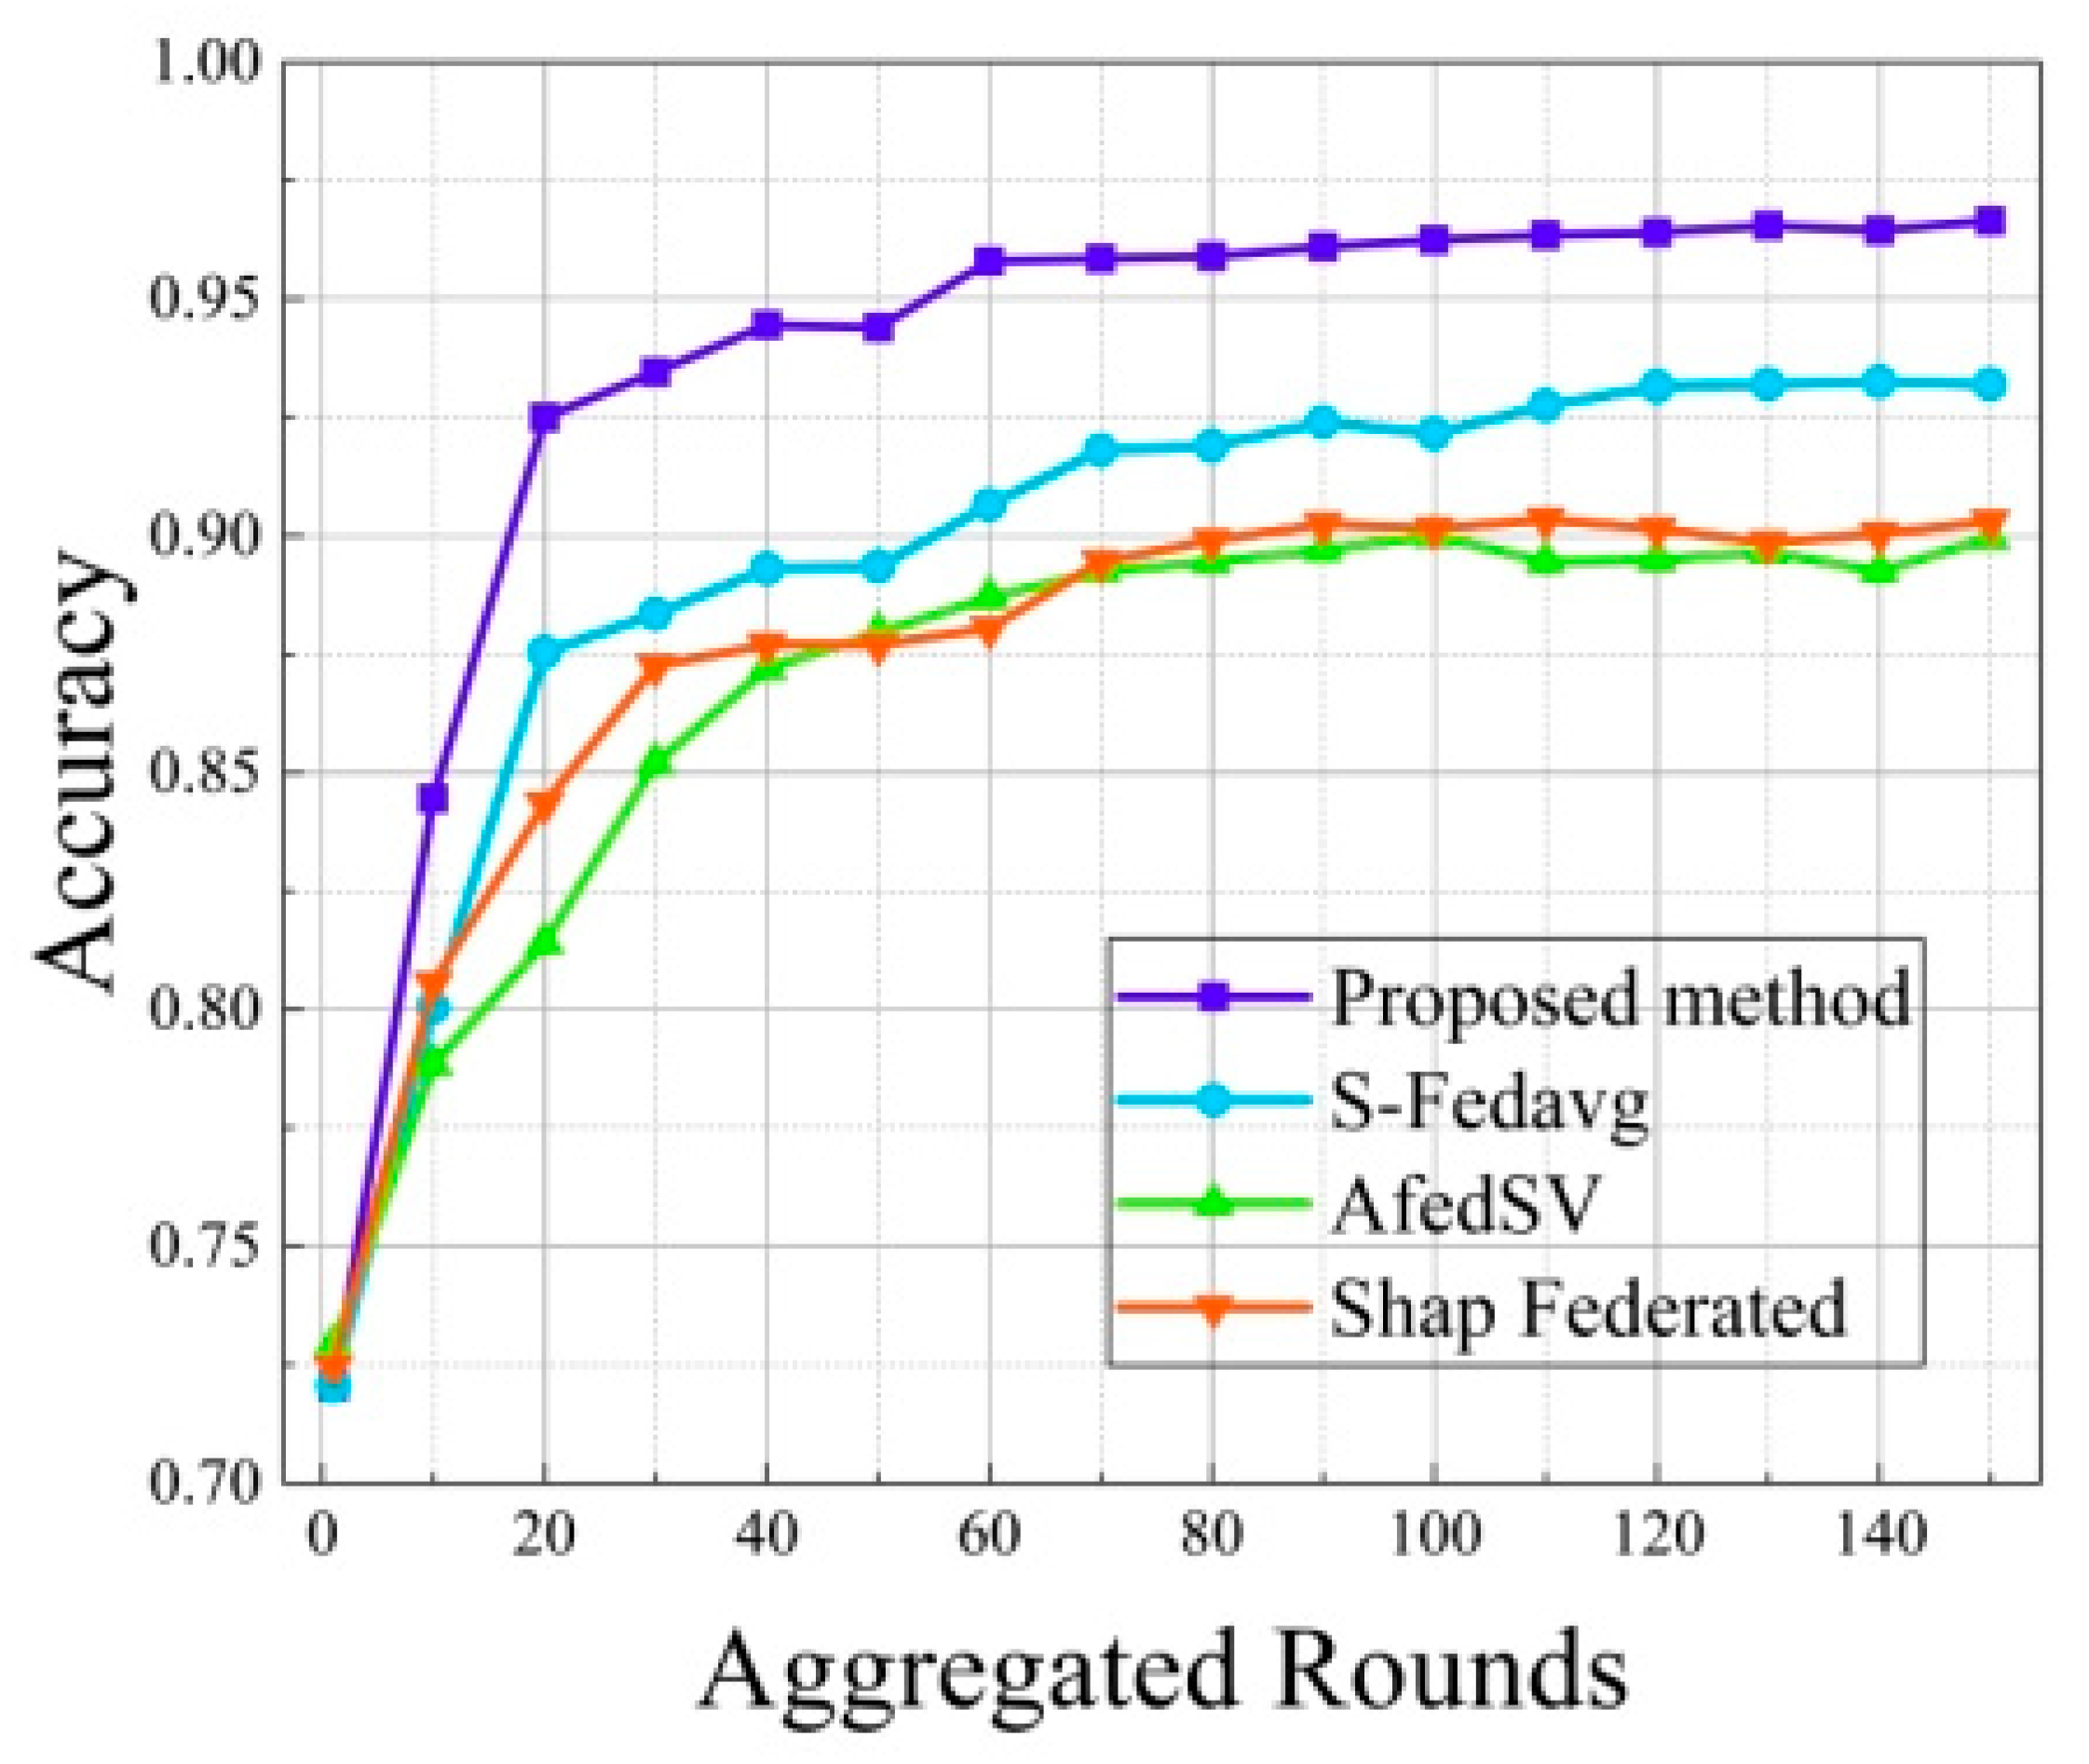
Shown in Figure 2 is the accuracy of the proposed method and other methods on the rail dataset under the experimental settings. In the experimental setup, our method significantly outperforms the baseline. Compared to ShapFederated, AfedSV, and S-FedAvg, our method achieves final accuracy improvements of 5.68%, 6.89%, and 3.13%, respectively. The figure demonstrates that our proposed method achieves excellent accuracy and superior aggregation speed, exhibiting outstanding performance. Our approach converges rapidly in the early stages, approaching 0.9 accuracy within just 10 rounds and ultimately stabilizing above 0.92. The four evaluation metrics—final accuracy, convergence rounds, precision, and recall—are summarized in Table 1.
Figure 2.
Accuracy curves of different learning methods on the rail dataset.
Table 1.
Performance evaluation index of each method on the rail dataset.
The experimental results shown in Table 1 demonstrate the significant advantages of our method over traditional algorithms in terms of accuracy, recall, and other performance metrics. The results conclusively prove that our algorithm outperforms conventional approaches across all evaluation criteria, fully showcasing its exceptional capabilities in handling data heterogeneity and enhancing computational efficiency, thereby validating the robustness and adaptability of our method. Additionally, Table 1 reveals that the proposed method exhibits superior convergence performance compared to the baseline. Specifically, our proposed method achieves the target accuracy 59.1% faster than AFsdSV and 66.7% faster than ShapFederated, while improving convergence by 40% over the S-FedAvg value aggregation method.
The superiority of our proposed method primarily stems from our rational client selection strategy. This approach maintains a higher selection rate for low-heterogeneity-tier clients while preserving necessary exploratory training for high-heterogeneity tiers. This dual approach avoids over-reliance on low-heterogeneity-tier clients and ensures participation opportunities for clients with special data distributions, thereby enhancing the generalization stability of the global model.
3.2. Application and Experimental Analysis on MNIST Dataset
To further validate the adaptability and universality of the proposed method, generalization experiments were conducted on the publicly available image classification dataset MNIST. In the comparative experiments, the baseline methods used in the previous experiments and the proposed method were used. The experimental model employed a standard convolutional neural network (CNN) architecture. For the MNIST task, we used the standard MNIST dataset with ToTensor and normalization (0.1307,0.3081). The classifier is a lightweight MLP (784–128–10) with rectified linear unit(ReLU). We trained clients locally using stochastic gradient descent (SGD) with cross-entropy loss and aggregate updates across rounds. The following hyperparameters were employed. Local epochs: Each client performed 5 rounds of local training. Batch size: The batch size for training was set to 32. Learning rate: The learning rate used in the optimizer was 0.01. These hyperparameters were kept consistent across all experiments, and the relevant configurations were set in accordance with the config files used during training.
The simulation maintained a configuration of 10 clients. The communication rounds were set to 150, with each client’s computational capacity and parameter configuration consistent with the previous experiments to ensure comparability and fairness of results. To further validate scalability, the number of clients was increased to 50 while maintaining the same data distribution strategy but implementing different client extraction strategies. The convergence curves of test accuracy for different federated learning methods on the MNIST dataset are shown in Figure 3.
Figure 3.
Accuracy curves of different methods on MNIST dataset.
As shown in Figure 3, the proposed method also demonstrates faster convergence and higher final accuracy on the MNIST dataset. Experiments demonstrate that the rational selection of clients significantly reduces the number of participating clients per round, substantially lowering computational demands. Simultaneously, the multi-parameter weighted aggregation scheme maintains stable model performance. Under the experimental setup, the proposed method outperformed ShapFederated, AfedSV, and S-FedAvg by 7.07%, 7.61%, and 3.53%, respectively. The proposed method converged rapidly in the early stages, exceeding 0.9 accuracy within 10 rounds and ultimately stabilizing above 0.96. The four evaluation metrics—final accuracy, convergence rounds, precision, and recall—are summarized in Table 2.
Table 2.
Performance evaluation metrics of each method on MNIST dataset.
The experimental results are shown in Table 2, where the proposed method demonstrates superior performance compared to the baseline. Notably, the accuracy improvement rate is significantly faster, achieving the target accuracy within just 9 rounds—markedly quicker than other methods. Furthermore, the final accuracy, precision, and recall metrics all significantly outperform the other three approaches.
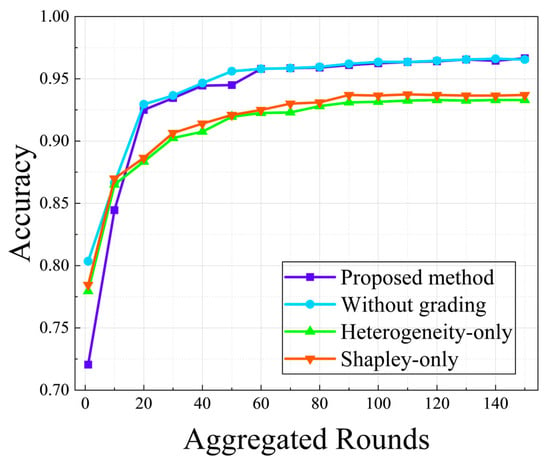
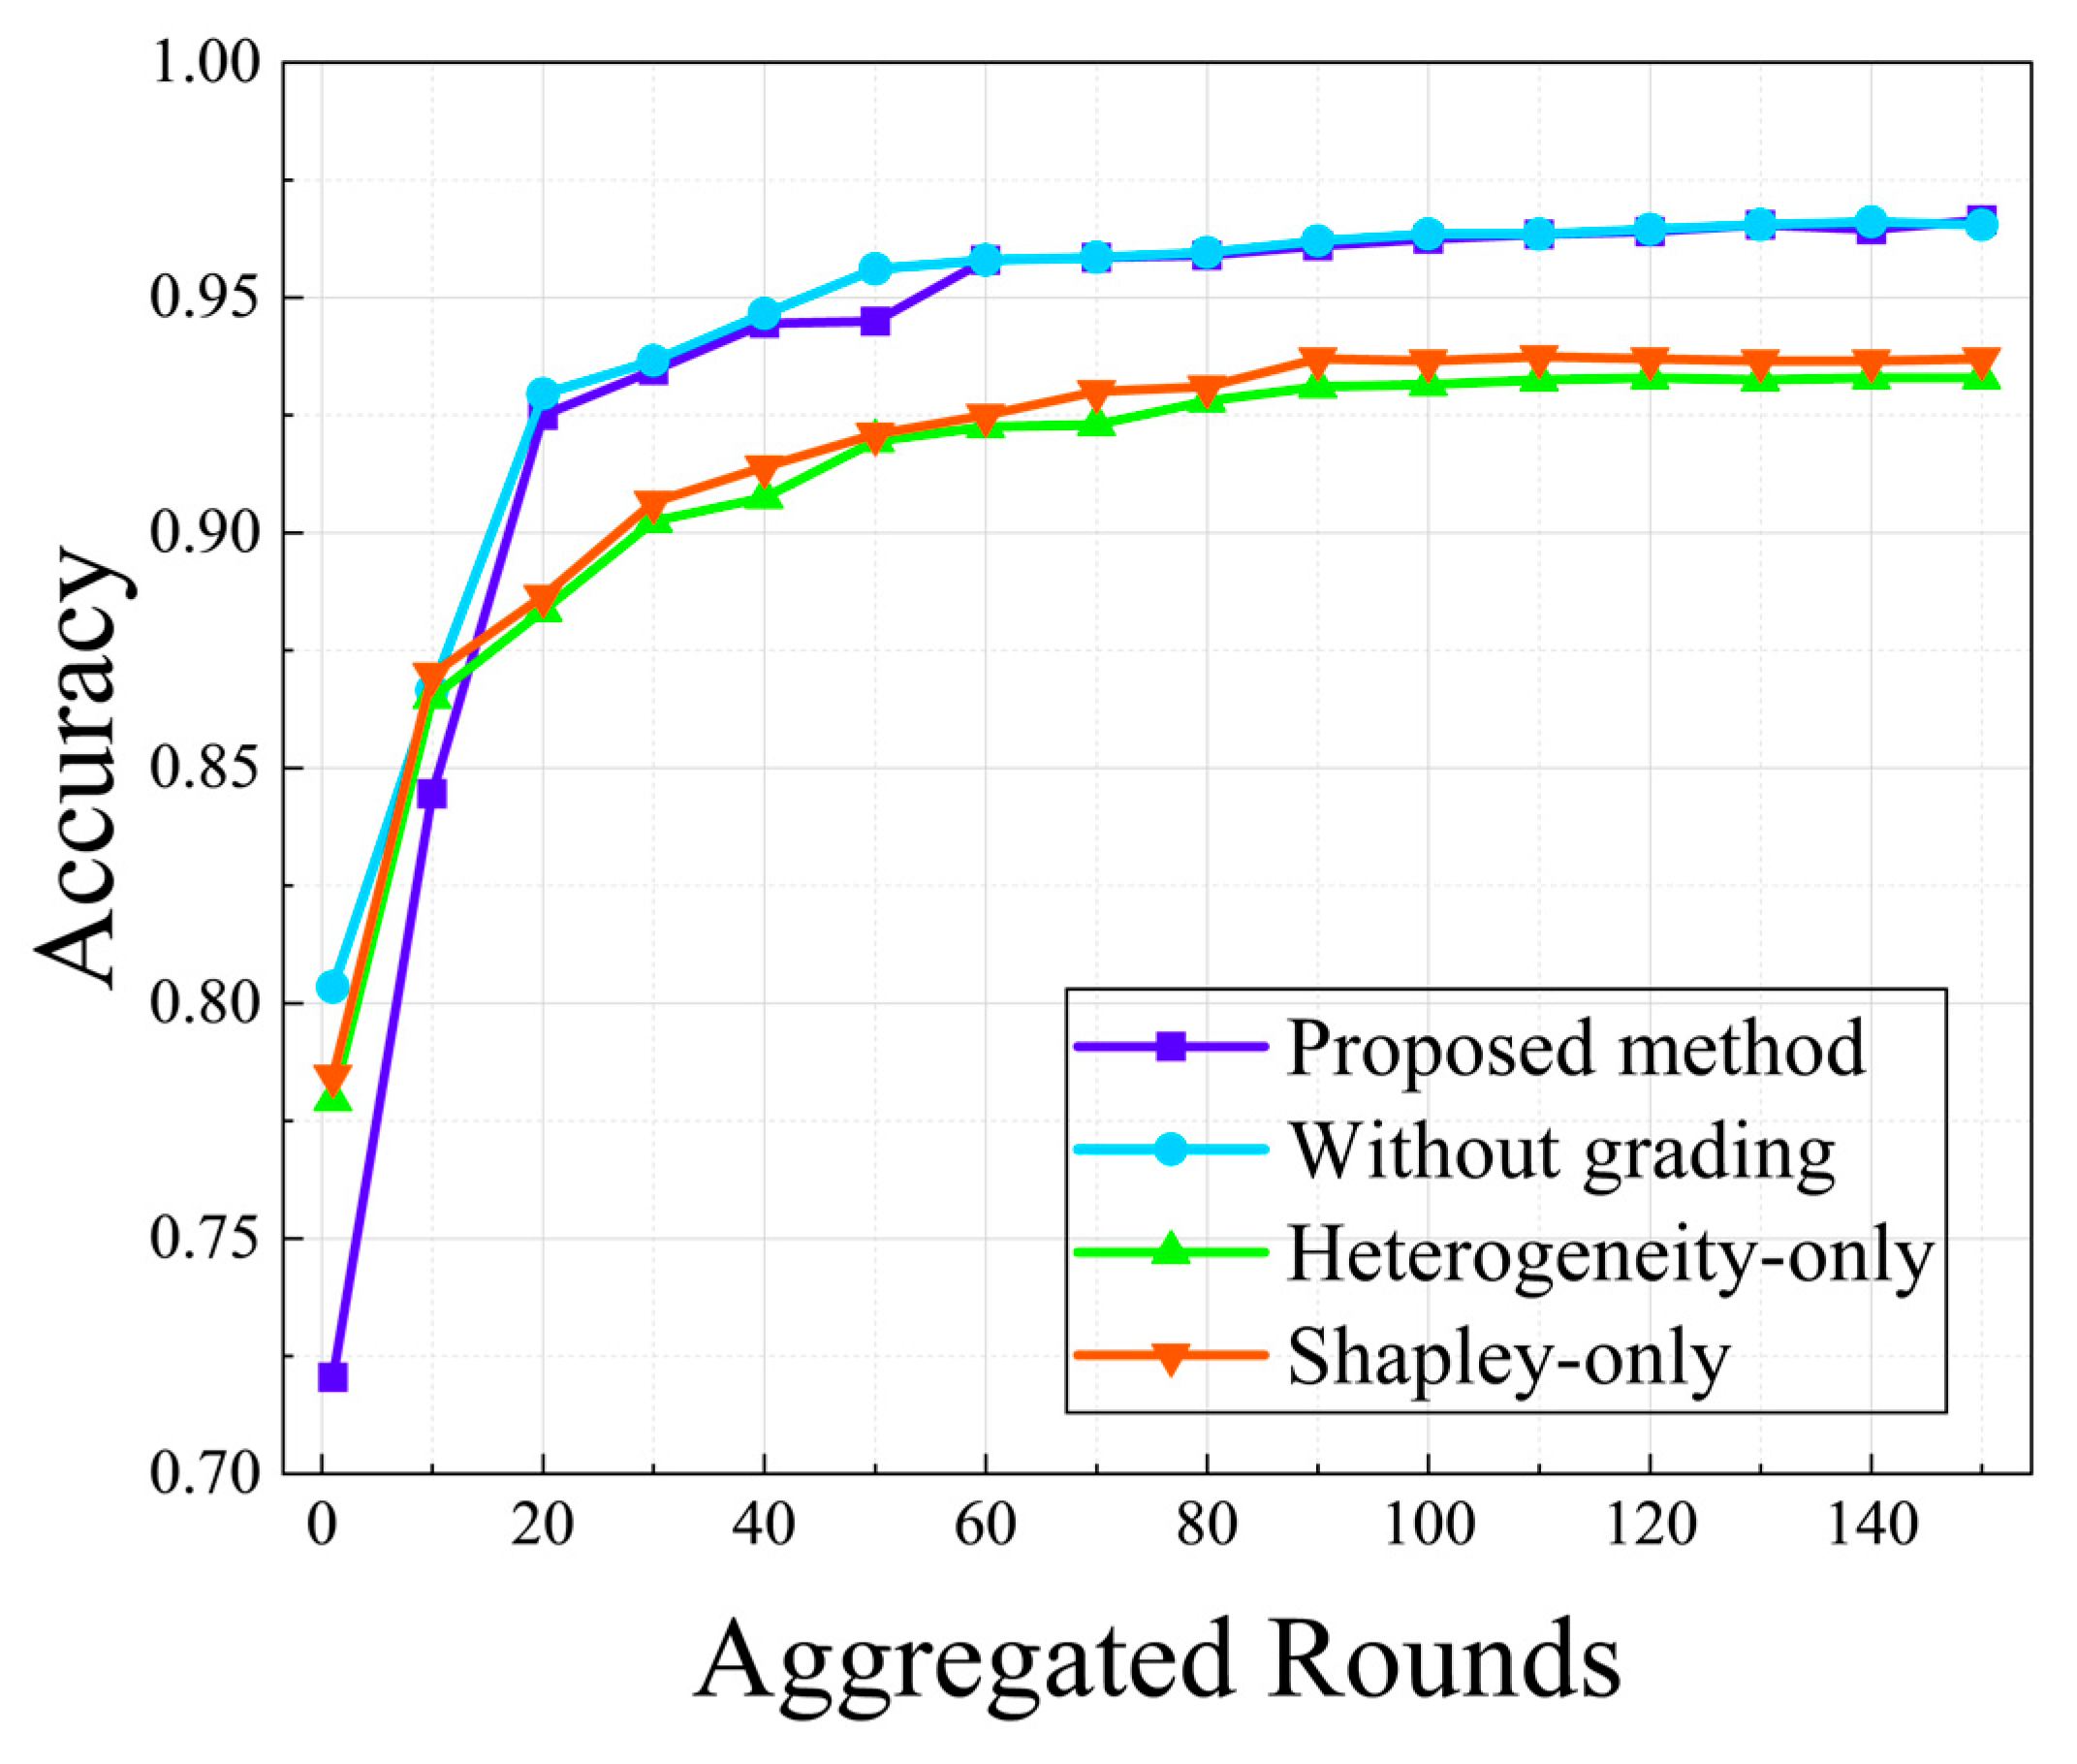
As shown in Figure 4, the experimental results demonstrate that, compared to existing Shapley-value-based methods, the proposed approach achieves a significant improvement in global model training performance while reasonably controlling computational overhead. Furthermore, it converges to a stable state with superior performance in fewer communication rounds.
Figure 4.
Ablation results on MNIST: accuracy versus aggregated rounds.
Ablation experiments were also conducted on the MNIST dataset to verify the independent contributions of each component in this paper. The comparison methods include the following:
- (1)
- Heterogeneity-only: Only the heterogeneity score is used to construct the aggregation weights, that is, the Shapley contribution term is removed (equivalent to only retaining the heterogeneity signal in the weight allocation).
- (2)
- Shapley-only: Only the Shapley contribution is used to construct the aggregation weights, that is, the heterogeneity score term is removed.
- (3)
- Without grading: The heterogeneity grading and stratified sampling mechanism are removed, and a non-graded client sampling strategy is adopted, with the rest of the process remaining the same.
- (4)
- Proposed method: Both heterogeneity grading/stratified sampling and the dual-index fusion weights of “Shapley contribution + heterogeneity score” are enabled simultaneously.
In addition, we also recorded the wall-clock time for each round for different client sizes and the number of selected clients. Compared with the non-grading sampling method, the time was significantly reduced. Table 3 presents the comparison of the single-round execution time of the proposed method and the baseline without heterogeneity grading (without grading) under different settings to illustrate the trend of the method’s overhead and scalability.
Table 3.
Comparison of per-round aggregation time under different client scales and participation settings.
All timing results were measured on a single workstation equipped with an NVIDIA GPU (model: RTX3050), an Intel (model:i7-12700H), and 32 GB RAM, under CUDA 11.8 and PyTorch3.12.
4. Conclusions
This paper proposes a robust federated learning algorithm based on Shapley values. By introducing a data distribution heterogeneity scoring mechanism and a hierarchical client selection strategy, it effectively addresses the computational bottlenecks and incentive imbalances encountered by traditional methods in large-scale client scenarios. By rationally setting client selection ratios and weighted aggregation strategies, this framework not only enhances the convergence efficiency and accuracy of the global model but also scales seamlessly to large-scale client environments, demonstrating its practicality and scalability in industrial settings. Experimental results demonstrate that this method outperforms existing benchmark approaches in both rail defect detection tasks and the MNIST dataset, with particularly notable advantages in accuracy and convergence speed. Its core value lies in enabling fairer and more efficient model training while keeping computational overhead within acceptable limits, making it suitable for various real-world applications characterized by significant data heterogeneity.
Despite the promising performance achieved by our method, there exist several directions worthy of future exploration. While we adopt aggregated statistics rather than raw data, further improvements on privacy preservation can still be made with advanced techniques such as differential privacy. In addition, our current experiments mainly focus on non-IID data and label noise, and the robustness against malicious clients or Byzantine attacks will be thoroughly investigated in our future work.
Author Contributions
Conceptualization, J.L. and W.Z.; methodology, J.L., W.Z., Y.Z., and Y.T.; software, J.L. and W.Z.; validation, J.L. and W.Z.; formal analysis, J.L. and W.Z.; investigation, J.L. and W.Z.; resources, J.L. and W.Z.; data curation, J.L., W.Z., Y.Z., and Y.T.; writing—original draft preparation, W.Z., Y.Z., and Y.T.; writing—review and editing, J.L. and W.Z.; visualization, W.Z., Y.Z., and Y.T.; supervision, J.L.; project administration, J.L.; funding acquisition, J.L. All authors have read and agreed to the published version of the manuscript.
Funding
This research was funded by the National Natural Science Foundation of China (52272347) and the National Science Fund of Hunan (2024JJ7132).
Institutional Review Board Statement
Not applicable.
Informed Consent Statement
Not applicable.
Data Availability Statement
The original contributions presented in this study are included in the article. Further inquiries can be directed to the corresponding author.
Conflicts of Interest
The authors declare no conflicts of interest.
References
- McMahan, B.; Moore, E.; Ramage, D.; Hampson, S.; y Arcas, B.A. Communication-Efficient Learning of Deep Networks from Decentralized Data. In Proceedings of the Artificial Intelligence and Statistics; PMLR; JMLR, Inc.: Norfolk, MA, USA, 2017; pp. 1273–1282. [Google Scholar]
- Zhao, R.; Falvey, J.; Shi, X.; Chinchilli, V.M.; Chen, C. A New Targeted-Federated Learning Framework for Estimating Heterogeneity of Treatment Effects: A Robust Framework with Applications in Aging Cohorts. arXiv 2025, arXiv:2510.19243. [Google Scholar] [CrossRef] [Scilit]
- Harhad, A.; Durand, D.; Drocourt, C.; Utard, G. A Survey of Federated Learning-Based Intrusion Detection Methods in Medical IoT. In Proceedings of the International Conference on Engineering Applications of Neural Networks; Springer: Berlin/Heidelberg, Germany, 2025; pp. 17–30. [Google Scholar]
- Lewis, C.; Varadharajan, V.; Noman, N. Attacks against Federated Learning Defense Systems and Their Mitigation. J. Mach. Learn. Res. 2023, 24, 1–50. [Google Scholar]
- Huang, W.; Ye, M.; Shi, Z.; Wan, G.; Li, H.; Du, B.; Yang, Q. Federated Learning for Generalization, Robustness, Fairness: A Survey and Benchmark. IEEE Trans. Pattern Anal. Mach. Intell. 2024, 46, 9387–9406. [Google Scholar] [CrossRef] [Scilit] [PubMed]
- Li, P.; Zhang, H.; Wu, Y.; Qian, L.; Yu, R.; Niyato, D.; Shen, X. Filling the Missing: Exploring Generative AI for Enhanced Federated Learning over Heterogeneous Mobile Edge Devices. IEEE Trans. Mob. Comput. 2024, 23, 10001–10015. [Google Scholar] [CrossRef] [Scilit]
- Singh, S. Advancing Network Security in 5G: Leveraging the 5G-NIDD Dataset for Intrusion Detection and Mitigation. In Proceedings of the 2025 IEEE 12th International Conference on Cyber Security and Cloud Computing (CSCloud); IEEE: New York, NY, USA, 2025; pp. 1–6. [Google Scholar]
- Makris, I.; Ntampakis, N.; Lagkas, T.; Radoglou-Grammatikis, P.; Goudos, S.K.; Argyriou, V.; Fountoukidis, E.; Skarmeta, A.F.; Saura, P.F.; Sarigianndis, P. Elevating 5G Network Security: A Profound Examination of Federated Learning Aggregation Strategies for Attack Detection. In Proceedings of the 2023 IEEE Future Networks World Forum (FNWF); IEEE: New York, NY, USA, 2023; pp. 1–6. [Google Scholar]
- Li, Q.; Diao, Y.; Chen, Q.; He, B. Federated Learning on Non-Iid Data Silos: An Experimental Study. In Proceedings of the 2022 IEEE 38th International Conference on Data Engineering (ICDE); IEEE: New York, NY, USA, 2022; pp. 965–978. [Google Scholar]
- Pillutla, K.; Kakade, S.M.; Harchaoui, Z. Robust Aggregation for Federated Learning. IEEE Trans. Signal Process. 2022, 70, 1142–1154. [Google Scholar] [CrossRef] [Scilit]
- Li, T.; Sahu, A.K.; Zaheer, M.; Sanjabi, M.; Talwalkar, A.; Smith, V. Federated Optimization in Heterogeneous Networks. Proc. Mach. Learn. Syst. 2020, 2, 429–450. [Google Scholar]
- Wang, J.; Liu, Q.; Liang, H.; Joshi, G.; Poor, H.V. Tackling the Objective Inconsistency Problem in Heterogeneous Federated Optimization. Adv. Neural Inf. Process. Syst. 2020, 33, 7611–7623. [Google Scholar]
- Karimireddy, S.P.; Kale, S.; Mohri, M.; Reddi, S.; Stich, S.; Suresh, A.T. Scaffold: Stochastic Controlled Averaging for Federated Learning. In Proceedings of the 37th International Conference on Machine Learning; PMLR; JMLR, Inc.: Norfolk, MA, USA, 2020; pp. 5132–5143. [Google Scholar]
- Ghorbani, A.; Zou, J. Data Shapley: Equitable Valuation of Data for Machine Learning. In Proceedings of the International Conference on Machine Learning; PMLR; JMLR, Inc.: Norfolk, MA, USA, 2019; pp. 2242–2251. [Google Scholar]
- Wei, S.; Tong, Y.; Zhou, Z.; Song, T. Efficient and Fair Data Valuation for Horizontal Federated Learning. In Federated Learning: Privacy and Incentive; Springer: Berlin/Heidelberg, Germany, 2020; pp. 139–152. [Google Scholar]
- Schoch, S.; Xu, H.; Ji, Y. CS-Shapley: Class-Wise Shapley Values for Data Valuation in Classification. Adv. Neural Inf. Process. Syst. 2022, 35, 34574–34585. [Google Scholar]
- Liu, Z.; Chen, Y.; Yu, H.; Liu, Y.; Cui, L. Gtg-Shapley: Efficient and Accurate Participant Contribution Evaluation in Federated Learning. ACM Trans. Intell. Syst. Technol. 2022, 13, 1–21. [Google Scholar] [CrossRef] [Scilit]
- Nagalapatti, L.; Narayanam, R. Game of Gradients: Mitigating Irrelevant Clients in Federated Learning. In Proceedings of the AAAI Conference on Artificial Intelligence, Online, 18 May 2021; Volume 35, pp. 9046–9054. [Google Scholar]
- Sun, Q.; Li, X.; Zhang, J.; Xiong, L.; Liu, W.; Liu, J.; Qin, Z.; Ren, K. Shapleyfl: Robust Federated Learning Based on Shapley Value. In Proceedings of the ACM SIGKDD Conference on Knowledge Discovery and Data Mining, Long Beach, CA, USA, 6–10 August 2023; pp. 2096–2108. [Google Scholar]
- Bhatti, D.M.S.; Ali, M.; Yoon, J.; Choi, B.J. Efficient Collaborative Learning in the Industrial IoT Using Federated Learning and Adaptive Weighting Based on Shapley Values. Sensors 2025, 25, 969. [Google Scholar] [CrossRef] [Scilit] [PubMed]
- Rieke, N.; Hancox, J.; Li, W.; Milletarì, F.; Roth, H.R.; Albarqouni, S.; Bakas, S.; Galtier, M.N.; Landman, B.A.; Maier-Hein, K. The Future of Digital Health with Federated Learning. npj Digit. Med. 2020, 3, 119. [Google Scholar] [CrossRef] [Scilit] [PubMed]
- Montesuma, E.F.; Mboula, F.M.N. Wasserstein Barycenter for Multi-Source Domain Adaptation. In Proceedings of the IEEE/CVF Conference on Computer Vision and Pattern Recognition; IEEE: Berlin/Heidelberg, Germany, 2021; pp. 16785–16793. [Google Scholar]
- Kang, F.; Just, H.A.; Sahu, A.K.; Jia, R. Performance Scaling via Optimal Transport: Enabling Data Selection from Partially Revealed Sources. Adv. Neural Inf. Process. Syst. 2023, 36, 61341–61363. [Google Scholar]
- Just, H.A.; Kang, F.; Wang, J.T.; Zeng, Y.; Ko, M.; Jin, M.; Jia, R. Lava: Data Valuation without Pre-Specified Learning Algorithms. arXiv 2023, arXiv:2305.00054. [Google Scholar] [CrossRef] [Scilit]
- Redko, I.; Habrard, A.; Sebban, M. Theoretical Analysis of Domain Adaptation with Optimal Transport. In Proceedings of the Joint European Conference on Machine Learning and Knowledge Discovery in Databases; Springer: Berlin/Heidelberg, Germany, 2017; pp. 737–753. [Google Scholar]
- Rakotomamonjy, A.; Flamary, R.; Gasso, G.; Alaya, M.E.; Berar, M.; Courty, N. Optimal Transport for Conditional Domain Matching and Label Shift. Mach. Learn. 2022, 111, 1651–1670. [Google Scholar] [CrossRef] [Scilit]

Disclaimer/Publisher’s Note: The statements, opinions and data contained in all publications are solely those of the individual author(s) and contributor(s) and not of MDPI and/or the editor(s). MDPI and/or the editor(s) disclaim responsibility for any injury to people or property resulting from any ideas, methods, instructions or products referred to in the content. |
© 2026 by the authors. Licensee MDPI, Basel, Switzerland. This article is an open access article distributed under the terms and conditions of the Creative Commons Attribution (CC BY) license.