


Abstract
High-strength concrete (HPC/UHPC) provides a new way to optimize the performance of nuclear power containment, but the mechanism of its application in the bi-directional dense anchorage zone is not clear. In this paper, a three-dimensional nonlinear model was established by ABAQUS to systematically study the effects of concrete strength, cylinder thickness and other parameters on the local pressure-bearing performance of the anchorage zone. The study shows that the use of C80–C120 concrete can thin the thickness of the containment by 30–40% and significantly enhance the pre-compressive stress safety reserve. Comparison of the existing design codes (e.g., Kim’s formula, Highway Bridge Specifications and UHPC-related regulations) reveals that the prediction results have a non-conservative or over-conservative tendency, which restricts the full utilization of the material performance. This study reveals the working mechanism of bi-directional multiple anchorage zones, demonstrates the advantages of high-strength concrete containment in terms of safety and economy, and provides a theoretical basis for the design of advanced nuclear power structures.
1. Introduction
Nuclear energy, characterized by its high energy density and cleanliness, has become an essential element of the global energy transition and plays a critical role in optimizing energy structures. The safety of nuclear power plants, particularly regarding the prevention and control of radioactive leakage, remains a primary concern for the public and a fundamental prerequisite for the industry’s sustainable development. In this context, the reliability of the structural performance of nuclear containment, as the final physical barrier of the nuclear island, directly influences environmental risk levels and the ability to ensure public safety at nuclear power plants. From the early reinforced concrete structures to the contemporary third-generation large-scale pressurized water reactors, such as China’s “Hualong-1”, the U.S. AP1000, and France’s EPR, the predominant use of prestressed concrete containment has consistently served the core safety function of “containment.” This function entails constructing a physical barrier that effectively isolates radioactive materials from the external environment.
Traditional prestressed concrete containment design encounters considerable technical challenges. The prestressing level primarily serves to counterbalance the internal pressure generated by design basis accidents, such as water loss incidents. However, for complex load combinations resulting from strong earthquakes, aircraft impacts, and pipeline ruptures, the localized high stress concentrations and shear effects necessitate reliance on numerous ordinary reinforcement configurations to maintain structural load-carrying capacity and crack control requirements. This design approach not only results in increased containment wall thickness, a complex reinforcement system, and heightened construction difficulty, but it also leads to substantial material consumption and elevated construction costs, thereby limiting the potential for enhancing safety margins. Consequently, the exploration of new materials and structural systems that integrate higher safety with improved economic efficiency has emerged as a critical frontier in the development of next-generation nuclear power plants.
In China, concrete with a strength class equal to or exceeding C50 is commonly designated as high-strength concrete (HPC). Modern HPC integrates exceptional characteristics, including high strength, workability, volumetric stability, impermeability, and notable durability [1]. As large-span, high-rise structures continue to develop rapidly, the demands for concrete strength, construction techniques, and molding processes have intensified. Consequently, various types of high-strength, corrosion-resistant high-performance concrete (HPC) are extensively utilized in these constructions [2,3,4]. The advent of Ultra-High Performance Concrete (UHPC) offers a promising material solution to address the challenges associated with the aforementioned technologies. This concrete is designed based on the theory of closest packing of particles and is typically combined with short-cut steel fibers to create a dense and uniform microstructure, ultimately achieving a synergy of high strength and high toughness along with excellent macroscopic mechanical properties [5,6,7]. The material exhibits significantly higher compressive and tensile strengths compared to conventional concrete, alongside unique tensile strain hardening properties and elevated fracture toughness. Furthermore, its high modulus of elasticity and low creep characteristics enhance its compatibility with prestressed structural systems. Additionally, the extremely low porosity of ultra-high-performance concrete (UHPC) imparts nearly inert physical and chemical stability, resulting in excellent long-term durability and effective resistance to various environmental erosive factors. Currently, UHPC is extensively utilized in bridge engineering, large-span structures, military protection, and other domains with stringent performance requirements, demonstrating favorable whole-life cycle economics.
In the domain of prestressed structures, the localized compressive performance of the anchorage zone is a critical factor influencing the overall safety of the structure. Numerous researchers have conducted extensive studies on the bearing capacity of prestressed anchorage zones in high-strength concrete structures, including high-performance concrete (HPC) and ultra-high-performance concrete (UHPC).
Existing studies on the anchorage zone of high-strength concrete primarily focus on the member level, emphasizing single-plane, single-anchorage, or large-spacing anchorage configurations. For instance, Choi et al. [8] demonstrated through tests on post-tensioned prestressed UHPC beams that UHPC can effectively simplify the reinforcement configuration in the under-anchorage region. Similarly, Yang Jun et al. [9] found through experiments and numerical simulations that UHPC significantly enhances the local compressive load-bearing capacity and crack resistance in the tooth block area. However, these studies do not address the complex working conditions associated with the structural system hierarchy of bi-directional planes and dense multi-anchorage areas that are characteristic of nuclear containment. At the mechanistic level, most existing findings are derived from analyses of damage mechanisms in unidirectional load-bearing scenarios. For example, Cai Shao-Huai [10] and Liu Yong-Yi [11] introduced the “Hoop Theory” and “wedge splitting theory” to elucidate the local pressure damage mechanisms in concrete. Additionally, Haroon et al. [12] confirmed that incorporating steel fibers can significantly enhance the ductility of concrete, thereby potentially reducing the need for indirect reinforcement. However, there remains a lack of investigation into the spatial force-flow synergy in multi-anchorage areas and the superposition of stress effects. Kim [13] conducted a 3D finite element analysis of ultra-high-performance concrete (UHPC) and proposed a corresponding method for calculating bearing capacity. However, his study primarily focused on the performance of individual members and did not assess the enhanced performance of the anchorage zone in relation to the overall structural upgrades of the containment, such as cross-section thinning and pre-stressing optimization. This limitation hindered the quantification of the structural advantages of high-strength concrete. This study addresses these three limitations by developing a systematic analytical framework that spans from material properties to structural performance, thereby bridging the gap in system-level investigations of dense bidirectional anchorage zones.
Wei Wanbing [14] developed a finite element model of a prestressed ultra-high-performance concrete (UHPC) bridge using MIDAS. This model systematically analyzes the local stress distribution characteristics of the anchorage zone by considering prestressing, self-weight, and other loading conditions, thereby providing a numerical foundation for understanding the force mechanism in the UHPC anchorage zone. Jiang Xin et al. [15] demonstrated that the degree of crack development in UHPC specimens was significantly reduced, and the crack width was smaller, indicating excellent crack resistance as evidenced by force transmission performance tests conducted in the anchorage zone. Li Chuanxi et al. [16] performed local compression performance tests on UHPC prisms, revealing that the cracking load of the local compression specimens ranged from approximately 45% to 78% of the ultimate load. Their findings indicated that fiber doping can substantially enhance the local compression load-carrying capacity; however, as the amount of fiber doping increased further, the enhancement efficiency exhibited a declining trend. For prestressed ultra-high-performance concrete (UHPC) girders, Hu Yuqing [17] introduced a calculation method for the local compressive bearing capacity in the anchorage zone, along with a design method for crack-resistant reinforcement in the overall zone. Additionally, he developed a large-diameter pre-tensioned, slow-bonded, post-tensioned hybrid prestressing system, thereby expanding the engineering application of the anchorage system for UHPC girder bridges. Furthermore, Tang Dayang [18] established a three-dimensional finite element model of a box girder and proposed a structural scheme that combines UHPC with ultra-high-strength strands. He also verified the feasibility of simplifying the box girder anchorage area into a rectangular girder for force analysis.
Despite advancements in existing research, two significant limitations hinder the large-scale engineering application of high-strength concrete in critically important structures, such as nuclear power containment. First, much of the current research is concentrated on single-plane, single-anchorage, or large-pitch anchorage issues at the member level. In contrast, the complex spatial force-flow synergistic mechanisms, stress superposition effects, and potential weak areas in actual nuclear containment cylinders—characterized by bidirectional planes and a dense arrangement of multiple anchorages—remain largely unexplored, whether in high-performance concrete (HPC) or ultra-high-performance concrete (UHPC). Second, a substantial portion of existing studies emphasizes performance verification at the component level in isolation, neglecting to integrate the superior performance of HPC and UHPC in the anchorage zone into the analytical framework for upgrading the overall structural system of the containment. Notably, research on the linkage between the prestress levels of the containment has not been conducted. The critical scientific question that remains unresolved pertains to the coupling mechanisms between the overall structural advantages of HPC and UHPC—such as cylinder cross-section reduction, prestressing level enhancement, and stiffness optimization—and the local complex force responses generated in the anchorage zone. The absence of understanding regarding this fundamental correlation mechanism has significantly constrained the precise design and performance boundary definition of high-strength high-performance concrete (HHPC)-based nuclear power containment.
Previous studies have primarily focused on a single scenario at the component level, often utilizing simplified specimens such as prismatic cylinders and tooth blocks. These investigations have concentrated solely on the planar force response of either single anchorage or large spacing double anchorage, failing to accurately represent the real engineering scenario of nuclear containment characterized by a “cylinder structure + bi-directional dense anchorage.” In contrast, the present study constructs a structural system-level three-dimensional model based on an actual nuclear power containment prototype. In contrast to previous studies that often treated anchorage zones in isolation, this work integrates their analysis into the global force system of the containment. By incorporating critical features like bidirectional aperture arrangement, pre-stressing coupling, and shell curvature, our model provides a system-level perspective that better represents reality, as opposed to relying on simplified component-level assumptions.
Essential enhancement of force mechanisms and analytical depth: Previous studies primarily relied on elastic mechanics or simplified plasticity theory, often concentrating on a single damage mode, such as localized compression collapse or unidirectional cleavage. In contrast, this preliminary numerical study explores the distinct mechanism of “superposition of multi-directional stress–evolution of a three-dimensional damage network–coordinated damage of tensile and compressive stresses” within the dense bidirectional anchorage zone. This exploration is achieved through the refinement of the CDP model and the delineation of a three-dimensional mesh. Furthermore, this analysis provides preliminary insights into how the arrangement direction of the borehole and the spacing of the anchorage may influence the regulation of the force flow transfer path, thereby offering a new perspective to address the limitations of previous planar analyses that simplified the three-dimensional stress state. These findings, derived from numerical simulation, constitute a theoretical proposition that requires validation through future experimental work.
Improvement of the analysis system: Previous studies primarily examined the local performance of the anchorage area in isolation, without considering its connection to the overall prestressing design of the containment. This study establishes a linked analysis system that integrates “local anchorage performance, overall prestressing reserve, and structural safety margin.” This system quantifies the impact of enhanced anchorage area performance on the optimization of cylinder cross-section thinning and prestressing levels. Furthermore, it facilitates a closed-loop analytical framework that transitions from “local performance verification” to “overall structural enhancement.”
This study focuses on the containment structure of nuclear power plants, with construction practices closely adhering to the prestressing technology employed at the Qinshan Nuclear Power Plant [19]. The two critical processes of tensile reinforcement and tensioning are essential for the effective implementation of the prestressing system. Threading involves a specialized machine that inserts high-strength steel strands (bundles) into pre-buried pipe holes. The threading direction is dictated by the type of threading employed; for vertical threading, a bottom-up method is utilized to facilitate construction and minimize friction. Dome bundles are threaded from one end to the other to ensure their spatial alignment conforms to design specifications. Tensioning must occur only after the containment concrete attains the strength index specified in the design. This process is executed in stages according to the design sequence to ensure precise application of prestressing.
To systematically address the identified research gaps, this paper utilizes an existing nuclear power plant containment as the research framework and conducts innovative numerical investigations encompassing material property characterization and structural system response. The core components of this study include: 1. Conceptual Design and Parametric Modeling: Drawing on the established design experience of pre-stressed containment in existing nuclear power plants, this paper proposes a novel thin-walled, highly pre-stressed containment cylinder structural scheme utilizing high-strength concrete; 2. Refined Finite Element Modeling: Utilizing ABAQUS 2023 software, a three-dimensional finite element model incorporating two-way anchorage zones is developed. This model aims to analyze in depth the mechanisms of stress superposition in multi-anchorage zones, the evolutionary pathways of localized pressure-bearing failure, and the potential damage modes. Additionally, it seeks to determine safety reserve coefficients by quantitatively comparing pre-stress multiples with normative limits; 3. Comparative verification of theories and specifications: A multi-dimensional comparison of finite element analysis results with established specifications and literature, both domestically and internationally, will quantitatively evaluate the applicability deviation of current analysis methods for multi-anchorage zones of high-strength concrete (HPC/UHPC). This analysis will also assess the degree of conservatism present in design specifications, thereby providing data support for the subsequent revision of specialized design guidelines.
The coupling effects of critical parameters, including concrete strength and cylinder thickness, on the bearing capacity and pre-compression stress reserve in the anchorage zone are quantified. A correlation model linking “material properties, structural parameters, and safety reserve” is established. Furthermore, the applicability of existing specifications and empirical formulas in the dense anchorage zone of high-strength concrete is systematically evaluated. Based on numerical simulations, a direction for precise design improvements is proposed, thereby addressing the limitations inherent in traditional simplified models.
2. Finite Element Model
2.1. Finite Element Modeling of Bi-Directional Prestressed Orifices in the Anchorage Zone of Containment Cylinders
2.1.1. Model Geometric Parameters
To investigate the ultimate bearing capacity of the anchorage zone in a novel high-strength concrete containment, this study utilizes the anchorage zone of an existing pressurized water reactor (PWR) nuclear power plant containment cylinder as an engineering prototype. By integrating the prestressing beam type, anchorage specifications, and other essential design parameters of this unit, a three-dimensional parametric nonlinear finite element model is constructed using ABAQUS 2023 finite element analysis software (see Figure 1 and Figure 2 for model schematic diagrams). This model geometrically represents the typical cross-section of the existing containment cylinder and incorporates bidirectional prestressing apertures, accurately reflecting the aperture arrangement characteristics of the actual structure. The key parameters of the finite element model, such as concrete strength and cylinder thickness, are adjustable, enabling simulations and analyses of the ultimate bearing capacity of the anchorage zone in the new high-strength concrete containment shells under various combinations of design parameters. Additionally, its nonlinear analytical capability allows for a detailed assessment of the ultimate bearing capacity of the two-way anchorage zone, providing a reliable computational basis for subsequent investigations into parameter influence.
Figure 1.
Containment model: (a) Geometric model; (b) Local model of the cylinder; (c) Model size parameters; (d) Actual prestressed steel bundle [20].
Figure 2.
Finite element model: (a) S1 model; (b) S2 model.
To investigate the influence of ultimate bearing capacity in the anchorage zone, this study designs two contrasting specimens based on engineering data from prestressed nuclear containment. Specimen S1 features a 19-hole anchorage, as illustrated in Figure 2a, while specimen S2 incorporates a 37-hole anchorage, as depicted in Figure 2b. The dimensions of the anchor plates and the diameters of the orifices adhere to Chinese codes [21,22,23,24], which mandate that the cross-sectional area of the inner diameter of the pipe must be at least twice the cross-sectional area of the prestressing steel reinforcement. The orifice spacing is determined according to the literature [25], with both specimens designed using the minimum spacing of the orifices as the core design basis. The test program regulates two key variables, concrete strength grade and cylinder thickness, to analyze how different parameter combinations affect the ultimate bearing capacity of the anchorage zone. Detailed design parameters and variable conditions for the two specimens are presented in Table 1 and Table 2, respectively. To ensure the feasibility of the new high-strength concrete nuclear containment, a higher strength strand [26] is employed, as specified in Table 3, with its tensionable control stress set at 0.8 times.
Table 1.
Basic parameters of finite element simulation group.
Table 2.
Finite element simulation group variable parameters.
Table 3.
Basic parameters of steel strands.
2.1.2. S1, S2 Model Material Parameters
In the ABAQUS 2023 numerical simulation conducted in this study, the concrete plastic damage model (CDP model) was selected to accurately capture the nonlinear mechanical response of the concrete in the anchorage area, from the initial force to final failure. This model, grounded in classical elastic-plastic damage theory, emphasizes two primary damage modes of concrete: tensile cracking and compressive crushing. It introduces two essential state parameters—“equivalent plastic tensile strain” and “equivalent plastic compressive strain”—to systematically characterize the dynamic evolution of the yield surface. The model describes the dynamic evolution of the yield surface, the emergence and accumulation of damage, and the accompanying stiffness deterioration as damage progresses. The parameters chosen for the damage plasticity model are based on the set calibrated by Mina Fakeh et al. [27], which was developed through tests and simulations of high-strength concrete systems. In this study, critical parameters, including the expansion angle, were derived from extensive experimental data to accurately represent the mechanical behavior of high-strength concrete. This parameter set has been thoroughly validated in simulations of high-strength concrete and possesses a robust physical and scientific foundation, as presented in Table 4.
Table 4.
Concrete CDP parameters.
The uniaxial stress–strain relationship of the concrete utilized in this model is derived from the FIB specification [28], encompassing strength grades C80 to C120. The corresponding uniaxial compressive stress–strain relationship curve is illustrated in Figure 3. The stress–strain relationships are shown in Equations (1)–(3).
where is the average uniaxial compressive strength of concrete (MPa), derived from the aforementioned test values; is the strain value corresponding to the compressive strength; is the tangent modulus at the origin (MPa); is the modulus of the cut line extending from the origin to the peak point of the compressive stress of the unconfined concrete (MPa); and is the ultimate compressive strain of the concrete.
Figure 3.
Uniaxial compressive stress–strain relationship of concrete.
Concrete damage under tension is a discrete phenomenon. The FIB employs two relational curves to characterize the tensile behavior of concrete, contingent upon the presence of cracks. The stress crack width is determined by the force transfer properties in the anchorage zone, as illustrated in Figure 4. The corresponding bifold expressions are provided in Equations (4)–(8):
Figure 4.
Relationship between uniaxial tensile stress and crack width in concrete.
The concrete fracture energy (N/mm) is numerically equivalent to the area under the stress–crack width relationship curve, bounded by the coordinate axes. The tensile strength of concrete can be expressed in terms of its characteristic compressive strength , as indicated in the following Equations (9)–(11).
For anchor plates and indirect reinforcement, the relevant parameters are shown in Table 5:
Table 5.
Parameters related to anchor plates and indirect steel bars.
The anchor plate and indirect reinforcement are modeled using the bifold elastic-plastic intrinsic model, which is characterized by the stress–strain relationship depicted in Figure 5. The slopes of the bifold lines in the figure are defined by Equations (12) and (13). This bifold model serves as a simplified ideal elastic-plastic representation, effectively simulating the mechanical properties of metallic materials.
Figure 5.
Double line elastoplastic stress–strain relationship.
2.1.3. S1, S2 Model Boundary Condition
To effectively simplify the boundary constraints of the structure, the finite element model of the cylinder in this study integrates St. Venant’s principle while fully addressing the actual engineering requirements in structural design and ensuring the operability of relevant tests.
The local analysis of the massive cylinder structure was conducted based on St. Venant’s principle, with the local model positioned outside the influence zone of the stresses in the anchorage area. According to St. Venant’s principle, loads applied in a localized region of the structure affect the stress field primarily in the immediate vicinity of the application point, while their influence on stress distribution in more distant regions is minimal. Consequently, at the distal end, the translations and rotations of the constrained boundary surfaces are restricted to simulate the rigid support of the distant structure in the sectional direction and to prevent rigid body displacement.
In the vertical direction, two boundary conditions are employed. The first approach applies symmetric boundary condition constraints to the substructure, disregarding the constraints on the corresponding face. The second approach accounts for the effects of vertical prestress on the corresponding face by applying prestress to simulate the actual boundary conditions. The details are illustrated in Figure 6.
Figure 6.
Boundary conditions and loading methods for S1 and S2 models: (a) Taking S1 model loaded with boundary conditions of method one as an example; (b) Taking the S2 model loaded with the boundary conditions of method two as an example.
2.1.4. Loading Conditions and Meshing
Loading conditions: To systematically assess the ultimate load-carrying capacity of the anchorage zone and its nonlinear response history, this analysis employs a displacement-controlled loading mode. The load is applied at a reference point (RP) located at the center of the anchor plate, which is kinematically linked to the loading surface of the anchor plate through coupling constraints. This linkage ensures a uniform load distribution across the surface. The boundary conditions for the reference point constrain all three rotational degrees of freedom while allowing translational movement solely along the vertical axis, thereby aligning with the actual force boundary. Detailed information is provided in Figure 6.
The concrete and anchor plate are modeled using the C3D8R cell (eight-node hexahedral linear reduced integration cell), the concrete grid cell size is 40 mm, while the grid size of the anchor plate is 25 mm. Taking the S1 model as an example, it comprises 15,760 concrete cells and 120 anchor plate cells, resulting in an aspect ratio of 10. Using the S1 model as an example, a finite element model was established for a structure with a concrete grade of C80, a thickness of 0.6 m, and boundary conditions illustrated in Figure 6a. The model employed a 20 mm grid for the concrete and a 12 mm grid for the anchor plate. The total number of concrete elements was 132,128, while the number of anchor plate elements was 384. Comparative analysis revealed that, under the original grid configuration, the ultimate bearing capacity of the model was 2452.01 kN. In contrast, with the current grid setting, the ultimate bearing capacity decreased to 2340.00 kN, resulting in a relative error of approximately 4%. This indicates that, under the specified modeling conditions, the meshing method has minimal impact on the calculation results, demonstrating low grid sensitivity. Consequently, provided that grid sensitivity requirements are met, the original grid configuration can be utilized for subsequent analyses to enhance computational efficiency. Following grid sensitivity and convergence analyses, it was determined that the current grid sizes satisfy the accuracy requirements for finite element simulation. Additionally, this configuration significantly enhances computational efficiency, as illustrated in Figure 7. This cell type effectively mitigates the volume self-locking issue while maintaining the accuracy of the stress solution, making it suitable for finite element analysis in regions with high stress gradients. For the indirect reinforcement, the T3D2 unit (two-node three-dimensional truss unit) is employed for simulation; this unit transmits only axial force and accurately represents the primary mechanical behavior of the reinforcement within the constrained concrete.
Figure 7.
S1, S2 Grid Partitioning: (a) S1 model; (b) S2 model.
The contact definition, the interface between the anchor plate and the concrete adopts “surface-to-surface contact (STS)”, the normal behavior of this contact is defined as “hard contact” to strictly prevent the interface from penetrating each other under pressure; the tangential behavior is described by a “penalty function”, in which the friction coefficient is finally determined to be 0.6 by the systematic parameter sensitivity analysis to fit the actual friction characteristics of the interface. The tangential behavior is described by a “penalty function”, in which the friction coefficient is determined to be 0.6 after a systematic parametric sensitivity analysis to match the actual friction characteristics of the interface. The relevant parameters are shown in Table 6 below:
Table 6.
Finite element related settings.
2.1.5. Destructive Condition
This study systematically conducts a localized bearing capacity analysis of the anchorage zone. To establish a unified quantitative assessment standard, the peak point of the load–displacement curve in the finite element model is defined as the critical state of “cracking failure.” This definition serves as the basis for determining the localized compressive bearing capacity. In the damage evolution law, during the initial loading period, the concrete in the anchorage area remains in an elastic compression state, with the load increasing linearly in relation to displacement. Once the load reaches a critical threshold, the transverse tensile stress surpasses the tensile strength of the concrete, leading to the formation of fine tensile cracks that gradually expand. This progression results in a decline in the concrete’s load-bearing capacity. Upon reaching the peak load, further application of force causes tensile cracks to propagate, accompanied by localized crushing of the concrete. Notably, the peak value is influenced by the earlier expansion of tensile cracks [5].
The anchorage zone is recognized as a stress disturbance zone [29,30]. Analyzing its local effects reveals the distribution of stress concentration but does not allow for the determination of the damage mode within the anchorage zone. Local compression tests conducted on the reserved through-hole of the UHPC block [31] indicate that damage manifests as “cracking first and then breakage.” This phenomenon is specifically illustrated by the split damage observed in the wedges of both the core and peripheral matrix. The nature of this damage is tensile, arising from radial tensile stress induced by concentrated forces at the anchor that exceed the tensile strength of UHPC.
Burdet [32] classified damage in post-tensioned anchorage zones into three categories to establish a theoretical framework for mechanism analysis. The first category is localized compression damage, characterized by localized crushing in the directly compressed region of the anchorage zone, which occurs when the compressive stress surpasses the concrete’s compressive strength. The second category is compression damage, which refers to structural instability induced by the predominant compressive stress throughout the anchorage area. The third category is tensile damage, which arises when the tensile stress, such as circumferential tensile stress, within the overall anchorage area exceeds the material’s tensile strength, leading to splitting or fracture.
Tensile damage represents the primary mode of failure in the anchorage zone of nuclear power containment structures. This localized region must withstand concentrated pressure, while the overall zone is required to endure tensile stress resulting from diffusion stress. The “under-anchor splitting effect” has been identified as the fundamental mechanism responsible for localized pressure-induced collapse damage in the anchorage zone [5]. The evolution of damage can be summarized as follows: during the load increment stage, the concrete in the anchorage area initially enters a strain hardening state, allowing for uniform stress transmission. Upon reaching a critical load value, plastic damage in the anchorage area accumulates rapidly, leading to the swift expansion and penetration of microcracks within the concrete. This process ultimately results in sudden cracking and structural failure, mirroring the phenomenon observed in previous anchorage tests, characterized by “hardening first and then sudden damage.”
In this paper, the peak point of the load–displacement curve is identified as the critical state of ‘cracking failure’ based on two fundamental criteria. First, the experimental validation level is established through the high-strength concrete anchorage zone test, as detailed in the second part of this paper. This test demonstrates that when the load reaches its peak value, a penetrating splitting crack first appears on the surface of the test specimen. This observation indicates that the anchorage zone transitions from the elastic working stage to the failure stage, aligning perfectly with the characteristic of ‘peak load corresponds to damage zone penetration’ observed in numerical simulations. Secondly, regarding the mechanical mechanism, prior to reaching the peak value of the load–displacement curve, the concrete exhibits a strain-hardening behavior characterized by slow damage accumulation and uniform stress transmission. Following the peak value, damage propagates rapidly, leading to the formation of penetrating cracks and a sudden decline in bearing capacity. This behavior reflects the brittle characteristic of “hardening followed by sudden failure,” which aligns with the actual failure mode observed in the anchorage zone of nuclear power plant containment structures. Furthermore, a comparison of the damage maps corresponding to the peak load with the observed crack patterns from tests further confirms that the damage criterion accurately delineates the ultimate bearing state of the anchorage zone.
3. Validation of Finite Element Models
3.1. Test Parameters
This section employs the test results of Tang Minghao et al. [33] concerning specimens with large spacing double anchors and small spacing double anchors in their anchorage zones to validate the proposed finite element model. The overall test setup is illustrated in Figure 8, while the geometric parameters of the two specimens are detailed in Table 7, and the material parameters are provided in Table 8.
Figure 8.
Field trial: (a) Small Pitch Double Anchor Test; (b) Large spacing double anchor test.
Table 7.
Geometric parameters of experimental model.
Table 8.
Material-related parameters.
3.2. Verification Model
Based on the experimental parameters outlined in the preceding section, validation models A and B were developed, with their finite element representations illustrated in Figure 9.
Figure 9.
Finite element model: (a) Modeling of small-spaced double anchor anchorage zones; (b) Modeling of large-spaced double anchor anchorage zones; (c) Model related parameters.
3.3. Material Parameters, Boundary Conditions, Contact Definition, Loading Schemes and Meshing
3.3.1. Material Parameters
For this validation model, in which all material parameters are consistent with the previous model of a two-way prestressed orifice in the anchorage zone.
3.3.2. Definition of Exposure
In simulation groups A and B, the interface between the anchor plate and the concrete is modeled using “surface-to-surface contact (STS).” The normal behavior is defined as “hard contact” to prevent interface penetration, while the tangential behavior employs the “Penalty Function.” A friction coefficient of 0.6 is established through parameter sensitivity analysis to align with the actual friction characteristics of the interface, thereby mitigating the influence of contact slip on the simulation results.
3.3.3. Boundary Condition
Simulation Groups A and B: The model’s base applies fully fixed constraints, aligning with the specimen fixation during testing to maintain equivalent boundary conditions. Figure 10 details the specific boundary conditions for the small-pitch double anchors, which are identical to those of the large-pitch double anchors.
Figure 10.
Structural boundary conditions, loading method.
3.3.4. Loading Scheme and Meshing
Loading scheme: Displacement-controlled loading is employed to determine the ultimate bearing capacity of the anchorage zone. The specific steps are as follows: (1) establish a reference point at the center of the loading plane of the anchor mat; (2) connect the contact surface of the anchor mat to the reference point (RP) using a “coupling constraint” to ensure uniform transmission of the loading force; and (3) restrict the RP’s three rotational degrees of freedom, permitting only vertical translation. The detailed loading procedure is illustrated in Figure 10.
The grid division is illustrated in Figure 11, and the selection of cell types considers both accuracy and efficiency. A reduced integration eight-node linear hexahedral element (C3D8R) is employed for the concrete and anchor plate, effectively mitigating volume locking and ensuring computational accuracy in regions with significant stress gradients. For the indirect reinforcement, a two-node linear three-dimensional truss element (T3D2) is utilized, which accurately transmits axial forces while minimizing the influence of non-axial forces on the results. For simulation group A, the grid cell size for concrete is set at 20 mm, while the grid sizes for the anchor mat and indirect reinforcement are both 25 mm. This configuration results in a total of 20,400 concrete cells, 264 anchor mat cells, and 656 indirect reinforcement cells, yielding an aspect ratio of 10.
Figure 11.
A, B grid division: (a) Model A; (b) Model B.
3.4. Finite Element Model Validation and Mechanism Analysis
3.4.1. Validation of Crack Patterns and Developmental Processes
To assess the validity of the established concrete plastic damage model, the damage maps generated from numerical simulations are compared with the crack patterns observed in experimental tests. The results of this comparison indicate that the model effectively replicates the emergence, evolution, and final damage patterns of various specimen types under loading. The specific comparisons are as follows:
The results of the test and finite element correlation for the double-anchor small spacing specimen are presented in Figure 12. A key observation from the test is the presence of a vertical splitting crack that extends through the full height between the two anchors. The simulation results reveal that the tensile damage maps indicate a rapid connection of the tensile damage zones beneath the two anchors during the loading process. Ultimately, these zones merge into a continuous, severe damage region that spans the entire height of the test specimen, effectively replicating the primary vertical cracks observed in the test. Additionally, the tensile damage on the top surface displays a longitudinal distribution characteristic of the connection between the double anchors. From the perspective of damage mechanics, the simulation results confirm that the stress superposition effect between closely spaced anchors is the fundamental cause of the overall splitting damage in the member.
Figure 12.
Comparison of experimental and simulation of small spacing double anchor anchors anchorage zone: (a) Test results (positive); (b) Test results (back); (c) Test results (Top surface); (d) Concrete tensile cloud diagram; (e) Concrete compression cloud diagram.
The results of the test and finite element analysis for the double-anchor, widely spaced specimen are presented in Figure 13. The specimen exhibited brittle failure during testing, with cracks forming only up to half of its height. The simulation results align closely with these observations; the tensile damage maps indicate that the damage zone originates below the anchorage and does not extend to the opposite anchorage or the bottom of the specimen. The depth of this damage is constrained to approximately half of the specimen’s height and reveals multiple independently developed damage zones, which corresponds with the occurrence of “multiple peeling cracks” observed in the test. Upon reaching the peak load, the compression damage beneath the anchor plate increased significantly, and the cloud diagram illustrated that this region had sustained complete crushing. This finding is consistent with the pronounced cracking sounds noted during the test and the brittle damage process associated with load drop, thereby elucidating the underlying damage mechanism.
Figure 13.
Comparison of experimental and simulation of anchorage zones with large spaced double anchor anchors: (a) Test results (positive); (b) Test results (back); (c) Test results (Top surface); (d) Concrete tensile cloud diagram; (e) Concrete compression cloud diagram.
3.4.2. Comparison of Results for Ultimate Bearing Capacity Under Pressure
The simulation results for the two groups of models and the test data indicate that the relative error in ultimate bearing capacity is maintained within 10%. This aligns with the precision requirements for both engineering and academic research. The specific comparison results are presented in Table 9:
Table 9.
Comparison of ultimate compressive bearing capacity results.
Simulation Group A (double anchors with small spacing) demonstrated a simulated ultimate bearing capacity of 2906.46 kN, while the test value was 2976 kN, resulting in a relative error of 2%. This simulation effectively captured the ductility enhancement characteristics of ultra-high-performance concrete (UHPC) attributed to steel fiber bridging.
Simulation group B, which employed double anchors with substantial spacing, yielded a simulated ultimate bearing capacity of 2362.30 kN. The corresponding test value was 3065 kN, resulting in a relative error of 9%. This outcome reasonably illustrates the weakening effect of increased anchorage spacing on bearing capacity.
3.4.3. Model Reliability Conclusions
In summary, the comparison and validation of the two core levels of “peak load” and “crack pattern” yield the following conclusions: the established three-dimensional finite element model accurately reproduces the test phenomena and mechanical responses of the anchorage zone. The simulation error for the ultimate bearing capacity remains within 10%, and the crack distribution closely aligns with the experimental results. Additionally, the model demonstrates a reasonable sensitivity to key parameters and exhibits superior nonlinear representation and adaptability to complex working conditions compared to existing simplified models. Consequently, this model serves as an effective numerical analysis tool for studying and designing the force performance of the anchorage zone in nuclear power containment while also providing a reliable reference for refined numerical simulations of similar prestressed structures.
4. Analysis of Localized Compressive Bearing Capacity of Anchorage Zone Considering Vertical Prestressing Condition
4.1. Analysis of Anchorage Zone Failure Modes Under Vertical Prestressing Conditions
Considering the vertical prestressing condition, wherein a vertical prestressing force is applied, its magnitude is determined based on the horizontal pre-compressive stress, denoted as Q1, which represents the pre-compressive stress in the horizontal direction. As illustrated in Figure 1, the containment structure comprises a cylindrical cylinder and a hemispherical dome. The structural characteristics indicate that, under a specified internal pressure load, the necessary vertical pre-stress level is half that of the horizontal pre-compressive stress. Therefore, 0.5Q1 is established as the upper limit for vertical prestress. According to Section 2.1.3 and the specifications, the effective prestress is defined as 0.8 times the tension control stress. In the finite element analysis, the calculated prestressing force is represented as a uniform compressive force, which is applied as a static load directly to the cylinder structure in a direction perpendicular to the cross-section, as illustrated in Figure 6b. This approach aims to replicate the actual stress conditions. The core of this method involves incorporating the prestressing effect directly into the overall structure as an initial stress field. This study adopts the perfect bonding assumption, which homogenizes the actual local anchoring mechanical behavior into a continuous interface condition without slip, thereby keeping the strain coordinated at the interface. Figure 14 presents the damage observed in the anchorage zone of the structure without the application of pre-compressive stress levels.
Figure 14.
Cloud diagram of tensile failure of structures under different pre stress conditions: (a) S1 (0Q1); (b) S2 (0Q1); (c) S1 (0.25Q1); (d) S2 (0.25Q1); (e) S1 (0.5Q1); (f) S2 (0.5Q1).
The analysis of the damage mode in the anchorage zone, as previously discussed, reveals that the damage mode of the anchorage zone lacking vertical prestressing is akin to that of the small spacing anchorage zone described in the preceding section. However, the presence of the vertical aperture alters the geometrical characteristics of the aperture, resulting in a modification of the damage mode.
During the initial loading phase, an independent tensile damage zone formed beneath each of the two anchorage devices. As loading increased, these damage zones did not remain isolated; instead, they rapidly interpenetrated under the influence of the tensile stress field, ultimately merging into a continuous severe damage zone that extended throughout the entire height of the specimen. Concurrently, the tensile damage on the top surface of the structure exhibited a distinct longitudinal distribution, linking the twin anchors and delineating a potential damage path determined by the specific geometric configuration.
The application of vertical prestressing effectively mitigated the aforementioned damage mechanism. This prestressing introduced active circumferential restraint within the concrete, enhancing the stress distribution around the hole. At a level of 0.25Q1, while the damage zone beneath the double anchors persisted, its connectivity was inhibited, delaying the formation of a penetrating severe damage zone. When the vertical prestress is increased to 0.5Q1, the restraining effect becomes even more pronounced, significantly curtailing the early expansion and connectivity of the damage zone. This alteration compels the potential damage path to transition from a single, concentrated severe damage zone to multiple dispersed, slowly developing micro-damage zones, thereby enhancing the structural ductility capacity.
4.2. Ultimate Bearing Capacity Analysis of the Anchorage Zone
Considering the vertical prestressing condition, specifically the application of vertical prestressing, its magnitude is determined based on the horizontal pre-compressive stress. Here, Q1 denotes the pre-compressive stress in the horizontal direction. The structural characteristics indicate that the vertical prestressing level can reach a maximum of 0.5 times the horizontal value. Therefore, 0.5Q1 is established as the upper limit and serves as the boundary condition for the barrel structural component. The results pertaining to the load-bearing capacity limit in the anchorage zone are presented in the following Table 10.
Table 10.
Ultimate bearing capacity under different vertical prestressing levels.
This study systematically analyzed the effects of varying levels of vertical prestressing on the ultimate bearing capacity of a cylindrical structure in the horizontal anchorage zone, yielding several data sets with distinct patterns. The results indicate that, across all working conditions, an increase in vertical prestressing correlates with a rise in the ultimate bearing capacity within the horizontal anchorage zone. For instance, in the S2 model, with specific concrete strength and thickness, when the vertical prestressing force reaches 0.5 times the horizontal precompression stress (i.e., 0.5Q1), the ultimate load-carrying capacity attains 6337.46 kN. This represents an approximate 27% increase compared to the capacity of 4590.17 kN observed without vertical prestressing (0Q1), underscoring the significant impact of vertical prestressing on load-carrying capacity enhancement. The above-mentioned improvement in bearing capacity is based on the final state of the fully coordinated work of bidirectional prestress. However, during the construction process, the establishment of vertical prestress may lag behind that of horizontal prestress, resulting in different force-bearing systems.
A further comparison of the two model sets, S1 and S2, indicates a variation in the structural response to vertical prestress based on different construction parameters, such as thickness. For instance, in the S1 model, a thickness of 0.6 m combined with an increase in vertical prestressing from 0 to 0.5Q1 resulted in an ultimate load capacity increase from 2452.01 kN to 3292.34 kN, reflecting an approximate 34% enhancement. In contrast, the increase in the S2 model exhibited a deceleration, despite a higher absolute load capacity. This observation implies that the impact of vertical prestressing on structural performance is contingent upon the interplay of member geometry and material properties, rather than being an isolated factor.
From a mechanical perspective, the implementation of vertical prestressing significantly enhances the stress distribution within the anchorage area of the cylinder. This improvement increases the crack resistance and overall integrity of the concrete when subjected to complex stress paths, thereby delaying the initiation and propagation of damage and enabling the structure to support greater loads in the limit state. Furthermore, the internal self-balancing system established by prestressing optimizes the force transfer path to some extent, mitigating the detrimental effects of localized stress concentrations. However, the impact of vertical prestressing on horizontal load-carrying capacity has not been systematically integrated into current structural design codes and is often overlooked or conservatively simplified in most calculation models.
The results clearly indicate that neglecting this factor will result in an insufficient evaluation of the structure’s actual load-bearing capacity. This oversight may hinder the optimal utilization of material performance and compromise both structural economy and safety reserves. Consequently, it is essential to incorporate the vertical prestressing influence factor in the forthcoming revisions of the relevant codes to more accurately represent the structure’s performance under composite stress conditions.
5. Analysis of Localized Bearing Capacity in Anchorage Zone Without Considering Vertical Prestressing Condition
5.1. Analysis of Damage Patterns in the Anchorage Zone
As discussed in Chapter 3, vertical prestressing positively influences web force performance. However, to establish an analytical benchmark that is broadly applicable and incorporates a safety margin, this study will temporarily exclude the contribution of vertical prestressing from the subsequent analysis of the ultimate bearing capacity of the anchorage zone. This approach is primarily based on two considerations: first, adherence to the principle of conservative design; and second, the possibility that a scenario without vertical prestressing may arise during the prestressing tensioning process of the structure. To ensure the safety of the structure throughout all construction phases, this section adopts a conservative design principle, especially for the verification of construction conditions where the vertical prestress may not have fully taken effect. In this scenario, the favorable contribution of vertical prestress is temporarily not taken into account to verify the safety margin of the structure under the most unfavorable force conditions.
In the DAMAGET cloud diagram, the high damage zone located along the radial connecting line of the anchorage gap corresponds to the process of “splitting crack sprouting and expansion” observed in actual physical damage. Radial tensile stress is induced when the concentrated force beneath the anchors is transmitted through the concrete. When this tensile stress exceeds the tensile strength of the concrete, micro-cracks initiate in the region. As the load increases, the cracks beneath closely spaced anchors connect, forming a penetrating splitting crack, which mirrors the “vertical splitting crack between two anchors” documented in Tang Minghao’s tests. Under two-way orifice conditions, the three-dimensional damage network, characterized by the interweaving of multidirectional tensile damage, corresponds to the composite mode of “multidirectional splitting + localized spalling” evident in the actual damage. This phenomenon is unique and was not observed in the unidirectional orifice test; it arises from the complex tensile stress field generated by the superposition of multidirectional stresses.
In the DAMAGEC cloud diagram, the annular high damage zone located in the core area directly beneath the anchorage illustrates the phenomenon of ‘localized compression collapse’ observed in actual physical damage. The concentrated pressure exerted by the anchor pad plate subjects the concrete in this region to elevated stress levels. Once the pressure exceeds the compressive strength of the concrete, plastic crushing occurs, resulting in localized material densification and a deterioration of stiffness. The gradient of damage diminishes from the core to the periphery, reflecting the diffusion of compressive stress in the radial direction. This observation aligns with the stress diffusion theory of elastic mechanics and confirms the accurate representation of the localized compression physical process within the numerical model.
The concrete compressive damage (DAMAGEC) and tensile damage (DAMAGET) cloud diagrams, illustrated in Figure 15, Figure 16, Figure 17, Figure 18, Figure 19 and Figure 20, depict the concrete damage under conditions of 0.6 m and 0.9 m. The typical damage mode observed in locally pressurized members exhibits characteristics of “tensile-pressure synergistic control composite damage.” In contrast, the damage patterns of localized compression members are characterized by “tensile-pressure cooperative control composite damage.” Regarding the spatial distribution of damage, the tensile damage represented in the DAMAGET cloud map displays a gradient distribution. The radial line region of the anchorage gap experiences a high incidence of tensile damage, where such damage preferentially initiates and propagates. The DAMAGEC cloud map indicates that peak damage is concentrated in the core region directly beneath the anchorage, revealing a ring-shaped distribution characterized by “localized high damage-edge of low damage.” This pattern reflects the local plastic damage resulting from compressive stress concentration.
Figure 15.
S1 model C80 concrete damage cloud map: (a) Cloud image of tensile damage at a thickness of 0.6 m; (b) Cloud image of pressure damage at a thickness of 0.6 m; (c) Cloud image of tensile damage at a thickness of 0.9 m; (d) Cloud image of pressure damage at a thickness of 0.9 m.
Figure 16.
S1 model C100 concrete damage cloud map: (a) Cloud image of tensile damage at a thickness of 0.6 m; (b) Cloud image of pressure damage at a thickness of 0.6 m; (c) Cloud image of tensile damage at a thickness of 0.9 m; (d) Cloud image of pressure damage at a thickness of 0.9 m.
Figure 17.
S1 model C120 concrete damage cloud map: (a) Cloud image of tensile damage at a thickness of 0.6 m; (b) Cloud image of pressure damage at a thickness of 0.6 m; (c) Cloud image of tensile damage at a thickness of 0.9 m; (d) Cloud image of pressure damage at a thickness of 0.9 m.
Figure 18.
S2 model C80 concrete damage cloud map: (a) Cloud image of tensile damage at a thickness of 0.6 m; (b) Cloud image of pressure damage at a thickness of 0.6 m; (c) Cloud image of tensile damage at a thickness of 0.9 m; (d) Cloud image of pressure damage at a thickness of 0.9 m.
Figure 19.
S2 model C100 concrete damage cloud map: (a) Cloud image of tensile damage at a thickness of 0.6 m; (b) Cloud image of pressure damage at a thickness of 0.6 m; (c) Cloud image of tensile damage at a thickness of 0.9 m; (d) Cloud image of pressure damage at a thickness of 0.9 m.
Figure 20.
S2 model C120 concrete damage cloud map: (a) Cloud image of tensile damage at a thickness of 0.6 m; (b) Cloud image of pressure damage at a thickness of 0.6 m; (c) Cloud image of tensile damage at a thickness of 0.9 m; (d) Cloud image of pressure damage at a thickness of 0.9 m.
The results of the small spacing anchorage damage test, coupled with an analysis of the damage cloud, demonstrate a strong correlation with the observed phenomena. The damage cloud indicates that the tensile damage area beneath the closely arranged anchors rapidly connects during the loading process, ultimately merging into a continuous damage zone at a specific height of the specimen. This pattern closely mirrors the formation of vertical cleavage cracks between the two anchors observed in the test. Additionally, the tensile damage on the top surface exhibits a longitudinal distribution that links the two anchors, further confirming the presence of a stress superposition effect between anchors in close proximity. From a damage mechanics perspective, the connectivity and fusion of this tensile damage represent the superposition of the stress fields of the closely spaced anchors. This superposition leads to a significant increase in radial tensile stress between the anchors, surpassing the tensile bearing capacity of the concrete and triggering the propagation of splitting damage.
The alterations in damage maps under varying thickness and concrete strength class conditions are influenced by the stress superposition effect of closely spaced anchors. As thickness increases, the DAMAGET maps indicate a reduction in the penetration of the tensile damage zone, accompanied by a more diffuse damage distribution. This phenomenon occurs because increased thickness enhances the lateral movement resistance of the member, thereby diminishing the tensile stress concentration resulting from the superposition of stresses between the anchors and inhibiting the propagation of cracking damage. Conversely, as the concrete strength grade rises, the threshold of the tensile damage zone in the DAMAGET maps increases, leading to a deceleration in the rate of damage propagation. This effect arises from the superior tensile strength of high-strength concrete, which can withstand greater superimposed tensile stresses, thereby delaying the connectivity and fusion of splitting damage and optimizing the ductility of the damage pattern.
It is particularly important to note that the DAMAGET cloud diagram illustrates how tensile damage in the direction of the new orifice intertwines with the original damage direction, resulting in a multidirectionally connected damage network. In contrast to the unidirectional orifice conditions characterized by a single longitudinal damage zone, the multidirectional orifice facilitates simultaneous tensile damage expansion in both transverse and longitudinal directions, significantly increasing the spatial density of damage units. Furthermore, the DAMAGE maps reveal that the distribution of pressure loss is no longer confined to the ring area directly beneath the anchorage; instead, it forms a continuous pressure loss body in three-dimensional space. Consequently, the peak pressure loss in the core area is further diminished, and the pressure loss gradient becomes more gradual in all directions. The three-dimensional damage characteristics arise from the multi-directional orifice, which facilitates the superposition of anchorage stress fields from various directions. This phenomenon, on one hand, reduces the concentration of tensile stress in any single direction, thereby preventing the rapid propagation of unidirectional cleavage cracks. On the other hand, it allows for the redistribution of compressive stress within three-dimensional space, enhancing the overall uniformity of the applied forces. Ultimately, this results in a shift in the damage mode from unidirectional cleavage to multi-directional synergistic pressure collapse. This transformation further substantiates the pivotal role of the stress superposition effect in the damage evolution of closely spaced anchorages. Not only does the anchorage spacing influence the intensity of stress superposition, but the arrangement of the orifices also alters the spatial configuration of stress superposition, which governs both the distribution of damage and the progression of the damage mode.
5.2. Differences in Existing Localized Pressure Calculation Methods
A comparison of calculation results from various studies and codes (see Table 11 and Table 12) indicates a significant dispersion in the predicted values of localized bearing capacity, with a maximum difference exceeding a factor of one. This variability is primarily attributed to discrepancies in the values of key coefficients within the formulas.
Table 11.
S1 model calculation results and ratios.
Table 12.
S2 model calculation results and ratios.
Existing methods for calculating ultimate bearing capacity include Kim’s formula [13] as presented in Equations (14)–(16), the Technical standards for highway ultra-high performance concrete (UHPC) bridge [34]—hereinafter referred to as the Highway Bridge Specification—outlined in Equations (17)–(20), and the Technical specification for ultra-high performance concrete structures [35]—hereinafter referred to as the UHPC Code—detailed in Equations (21) and (22).
Kim formula:
Technical standards for highway ultra-high performance concrete (UHPC) bridge:
Technical specification for ultra-high performance concrete structures
Current methods for calculating ultimate load-carrying capacity share a common framework, categorizing load capacity into a “concrete contribution term” and a “reinforcement constraint contribution term.” Nonetheless, significant discrepancies exist in the definitions of specific parameters across these methods. Notably, the variation in the concrete contribution coefficient emerges as a critical factor contributing to the divergence in calculation results, with each method exhibiting pronounced differences in the values assigned to this coefficient. In the “Highway Bridge Specification,” the concrete local pressure correction factor varies between 0.5 and 0.6 based on the concrete strength grade. In contrast, the “Ultra-high Performance Concrete Structure Design Technical Regulations” (draft) adopts a fixed value of 0.5 for the concrete local pressure correction factor , which is significantly lower than the correction factor for high-strength concrete. For instance, the “Concrete Structure Design Code” assigns a value of 0.8 for concrete strength grade C80. Notably, Kim’s formula contributes to the establishment of the concrete coefficient, presenting a divergent approach compared to the two standards. This formula does not explicitly define the “local compressive strength correction factor” as an independent parameter; instead, the concrete term can be interpreted as a coefficient that couples with the compressive area ratio. This interpretation suggests that the concrete term serves as a representation of the local compressive strength correction factor, which is considerably smaller for high-strength concrete. The coefficient associated with the concrete term and the compression area ratio indicates that 0.8 can be viewed as an alternative representation of the local compressive strength correction factor, albeit without accounting for the variations across different concrete strength classes. Consequently, the discrepancies in these coefficients can result in deviations exceeding 50% in the bearing capacity calculations for identical structural members.
Conversely, regarding the contribution of reinforcement constraint, the “Technical Specification for Highway Ultra High Performance Concrete (UHPC) Bridges” (Draft for Public Comments) presents an empirical coefficient for calculating this contribution. However, the specification fails to provide a clear range of values. It specifies a value of 1.7 in the relevant “Specifications for design of highway reinforced concrete and prestressed concrete bridges and culverts” specification for C80 concrete. This value, however, is based on test data from ordinary high-strength concrete and does not account for the enhanced bond strength between UHPC and steel reinforcement. This oversight may result in inaccuracies in calculating the restraining contribution of reinforcement in UHPC members. The Technical Specification for the Design of Ultra-High Performance Concrete Structures (Draft for Comment) employs a fixed factor of 2 to calculate the contribution of reinforcement constraints. While this approach simplifies calculations to some extent, it does not align with the characteristics of high-strength concrete. Additionally, Kim’s formula does not present the volume reinforcement ratio multiplied by reinforcement yield strength and core area, as seen in the two specifications. Instead, it integrates these components to reflect the influence of the constraint factor on the concrete material’s strength. Consequently, the range of values for the concrete contribution factor, combined with the inadequate parameter logic of the reinforcement restraint contribution term, results in considerable variability in the predicted values of localized bearing capacity, with discrepancies exceeding a factor of one.
Significant limitations exist in the calculation methods presented in the current literature and codes. Primarily, these limitations stem from the conservative approach to determining the support area. Existing codes typically rely on the “principle of concentric symmetry” to define the support area. This principle, when applied to conditions involving closely spaced multiple anchors, overlooks the overlapping effects of the stress field, which is crucial for accurately assessing local bearing capacity. The disregard for the overlapping effects of the supporting stress field under conditions of closely spaced anchors is a key factor leading to the overestimation of localized pressure bearing capacity calculations. In the densely anchored regions of nuclear power containment structures, anchor spacing often falls below three times the diameter of the anchorage. Under these circumstances, the conical stress diffusion area generated by a single anchor spatially intersects with others, resulting in a three-dimensional superposition of the stress field. This superposition effect is not merely an additive increase in stress values; rather, it complicates the geometric calculations of the “single anchor bearing area superposition.” Due to the overlap of regions that deteriorate the stress state, the effective bearing area cannot be fully realized at the mechanical level, leading to a deficiency in the effective bearing area.
In 1953, Guyon et al. [36] established the elastic solution for tensile stress in the anchorage zone using a Fourier series. They introduced the concepts of “force flow line” and “symmetric prism,” which provided a foundational framework for subsequent research. However, this theory assumes a homogeneous elastic material and does not account for the nonlinear behavior associated with concrete cracking. Additionally, there is a notable absence of systematic experimental and theoretical investigations concerning the unique two-way anchorage zone configuration found in nuclear containment, making the direct application of existing methods challenging.
Analysis of the data reveals that the bearing capacity derived from finite element calculations exceeds the predicted values of the two codes (ratio > 1) for most conditions examined. This trend suggests that the existing design codes are generally conservative within the parameter range addressed in this study. Furthermore, for identical concrete strength and model, the ratio exhibits a clear monotonically increasing pattern as member thickness increases. For instance, the ratio of finite element results to the UHPC specification rises from 1.06 at a thickness of 0.6 to 1.29 at a thickness of 0.9 for the C80 condition of the S1 model. This observation implies that the current specification may not adequately account for the beneficial impact of thickness on load-carrying capacity, indicating that its formulation may be excessively conservative when applied to thicker members.
A comparison of the two models reveals that the ratio values for the S2 model are generally lower than those for the S1 model under identical conditions. Notably, in the C120 case of the S2 model, the ratios of the finite element results to those predicted by Kim are all less than 1. This finding suggests that Kim’s formula yields predicted values that are slightly higher than the finite element results in this specific scenario. This phenomenon underscores the significant impact of the structural form of the members on the accuracy of load capacity predictions.
Among the three design methods, the overall conservatism of the UHPC code calculated values is the most pronounced. This is evidenced by the fact that the ratio of finite element results to the UHPC code calculated values (i.e., Ratio 3) is the highest under most conditions. For instance, in model S1 with C80 concrete and a thickness of 0.9 m, the ratio attains a value of 1.59, which significantly exceeds the ratio derived from Kim’s formula at 1.29 and the ratio from the highway bridge code at 1.32 for the same scenario. This trend is consistently observed across various cases for model S1, suggesting that the UHPC code offers the greatest safety reserve for this type of structure in S1.
The highway bridge code exhibits a level of conservatism that falls between the three ratios. In most instances, the ratio of its calculated values to the finite element results (Ratio 2) is lower than Ratio 3, yet higher or comparable to the ratio derived from Kim’s formula (Ratio 1). For instance, in the case of the S2 model C120 concrete with a thickness of 0.9 m, Ratio 2 is 1.06, whereas Ratio 1 is 0.92 and Ratio 3 is 1.14.
The finite element method relies on three-dimensional stress analysis, accurately representing the multiaxial stress state of concrete subjected to localized pressure. Specifically, lateral confining stresses contribute to an increase in compressive strength. Additionally, empirical strength reductions have not been applied, resulting in generally elevated computed values. In contrast, the conservatism inherent in the formulas and specifications arises from the simplification of multiaxial stresses, which limits the effective utilization of strength.
5.3. Design Basis and Load Combination
The Loss of Coolant Accident (LOCA) is designated as a core Design Basis Accident (DBA) in the design of light water reactor (LWR) nuclear power plants. This incident results in an immediate temperature increase (temperature load ) and a pressure surge (pressure load ) within the containment, which are critical factors in assessing the strength and integrity of the containment structure. Consequently, the design of the containment must be validated by considering the LOCA as the primary scenario, while also incorporating additional extreme loads, such as seismic events, to evaluate the combined effects of these loads.
Load Factor
Using the mainstream prestressed concrete containment of the Chinese under-construction reactor type as a case study, the design must adhere to the Code for the Design of Prestressed Concrete Containment [22] and other relevant specifications. The pre-compressive stress generated by the tensioning of prestressing beams is utilized to counterbalance the pressure resulting from a Loss of Coolant Accident (LOCA). The core load combinations for designing the limiting working conditions are as follows:
Routine accident portfolio:
Seismic-accident combination 1 (operationally safe seismic ):
Earthquake-accident combination 2 (Extreme safety earthquake ):
represents the permanent load, which includes structural self-weight and equipment self-weight. denotes the live load, encompassing maintenance loads. signifies the prestressing load, specifically the tension in the steel bundles. refers to the impact load generated by the activation of the pressure relief valve. indicates the normal operational reaction force of the pipeline, while represents the localized load resulting from pipeline rupture incidents. These combinations account for the extreme working conditions throughout the service life of the containment, thereby ensuring the structural safety under diverse risks.
5.4. Pre-Compression Stress Design Theory
The prestressing design serves as the foundation of prestressed concrete containment. Its primary objective is to induce a pre-compressive stress Q in the concrete shell through the tension F in the steel beams. This approach effectively counteracts the tensile stresses resulting from the LOCA accident pressure Pa, thereby preventing concrete cracking.
According to the theory of shell structure mechanics, the pre-compressive stress Q must be engineered to counterbalance X times the accidental pressure (X-Pa, where X represents the pre-stressing coefficient utilized to maintain a safety margin). The specific calculation formula is categorized as follows based on the structural components:
Horizontal direction of cylindrical cylinder: Horizontal section is required to resist annular tensile force, pre-compressive stress is shown in Equation (26)
where R is the radius of the containment cylinder or dome (m), t is the thickness of the shell (m), and X is the prestressing factor.
Typical design parameters for existing prestressed concrete containment structures in large pressurized water reactors range from X = 1.2 to 1.5, R = 18 to 25 m, and t = 0.9 to 1.4 m. The corresponding pre-compressive stress values of the containment are typically Q1 = 7 to 10 MPa and Q2 = 3.5 to 5 MPa, which effectively counteract the tensile stresses induced by accident pressure.
Meanwhile, the maximum preloading stress must adhere to the allowable stress limits specified in various national standards. The allowable stress limit according to the US standard [37] is presented in Equation (27):
The allowable stress limit of the Chinese standard [16] is shown in Equation (28):
The standard value of the compressive strength of the concrete cylinder is included, as is the standard value of the axial compressive strength of the concrete.
These specified limits ensure that the concrete remains stable during the preloading process, thereby considering both prestress efficiency and structural safety.
Traditional design methods encounter significant challenges in practical engineering applications. First, theoretical calculations derived from rod systems or simplified 2D models often fail to accurately represent the actual distribution of prestress in 3D cylindrical structures, particularly in areas of stress concentration such as openings and anchorage zones. Second, time-varying effects, including concrete shrinkage, creep, and steel bundle relaxation, can substantially influence the long-term effectiveness of prestressing. Furthermore, the combination of high temperature and internal pressure under accident conditions may lead to the degradation of concrete material properties, while traditional linear-elastic analysis methods are inadequate for accurately assessing this nonlinear behavior.
In this study, we conducted systematic finite element simulations to compare the differences among Kim’s empirical formulas, UHPC codes, and bridge codes in predicting the key pre-compressive stress index (Q) of the containment cylinder. We also evaluated the significant impact of high-strength concrete in conjunction with the optimization of structural parameters. Based on the data presented in Table 13 and Table 14, we can draw the following conclusions:
Table 13.
S1 model precompression stress results.
Table 14.
S2 model precompression stress results.
Significant and non-systematic differences exist in the pre-compressive stress values obtained from various calculation methods, with the extent of deviation being highly dependent on the specific model analyzed.
In the S1 model, the pre-compressive stress (Q value) obtained through finite element analysis exceeds the values derived from various analytical methods and specifications under most conditions. For instance, in the case of C80 concrete with a thickness of 0.6 m, the finite element result is 16.35 MPa, whereas the results from Kim’s formula, the highway and bridge code, and the UHPC code are 15.35 MPa, 14.97 MPa, and 12.48 MPa, respectively. The finite element result surpasses Kim’s formula by approximately 6.5% and exceeds the UHPC code by about 31.0%. This indicates that the refined finite element simulation for the S1 model may have identified certain advantageous factors overlooked by the simplified theoretical model.
In the S2 model, the comparative relationships of the pre-compressive stresses exhibit a more intricate nature. At a concrete strength of C80, the finite element results (19.13 MPa to 15.80 MPa) are lower than those predicted by Kim’s formula (21.26 MPa to 14.17 MPa) and the highway bridge code (20.73 MPa to 13.82 MPa) across various thicknesses, yet they surpass the values from the UHPC code (17.27 MPa to 11.52 MPa). When concrete strengths are increased to C100 and C120, the results from Kim’s formula significantly exceed the finite element values under most conditions, particularly for smaller thicknesses. For instance, at C120 with a thickness of 0.6 m, the result from Kim’s formula is 31.89 MPa, whereas the finite element result is 24.28 MPa, indicating that Kim’s formula exceeds the finite element result by approximately 31.4%. This observation implies that Kim’s formula may have overestimated the contribution of high-strength concrete to the enhancement of pre-compressive stress or inadequately accounted for the geometric nonlinear effects specific to the S2 model. In contrast, the calculation results from the highway bridge code and UHPC code were the most conservative across all conditions.
All computational methods consistently indicate that pre-compressive stresses exhibit a monotonically decreasing trend as the thickness of the member increases. This phenomenon arises because an increase in thickness results in a larger cross-sectional area, thereby reducing the average compressive stress within the cross-section for a constant total preload force.
As for the precompression stress multiplier, the following conclusions can be drawn for the analysis of Table 15, Table 16, Table 17 and Table 18:
Table 15.
S1 model pre-compression stress multiplier results (finite element).
Table 16.
S1 model pre-compression should multiplier results (Kim formula, Highway Bridge Specifications, UHPC specification).
Table 17.
S2 model pre-compression stress multiplier results (finite element).
Table 18.
S2 model pre-compression should multiplier results (Kim formula, Highway Bridge Specifications, UHPC specification).
Comparison of the finite element method with theoretical and normative values: The pre-compressive stress multiplier derived from the finite element method does not consistently exceed the values predicted by theoretical formulas and normative standards. The variation in its magnitude is closely associated with the model type, concrete strength, and member thickness. For the S1 model, at a radius of curvature R = 20 m, the finite element results for C120 concrete with thicknesses ranging from 0.6 m to 0.9 m (1.50 to 1.83) are generally lower than Kim’s formula (1.73) and the Highway Bridge Code (1.51), yet higher than the UHPC Code (1.40). At R = 25 m, the finite element results for C120 concrete with thicknesses of 0.6 m to 0.9 m (1.20 to 1.46) are closer to Kim’s formula (1.38) and the Highway Bridge Code (1.21), while still exceeding the UHPC Code (1.12). For the S2 model, at R = 20 m, the finite element results for C120 concrete with thicknesses of 0.6 m to 0.9 m (1.82 to 2.21) surpass Kim’s formula (2.39), the Highway Bridge Code (2.09), and the UHPC Code (1.94) for larger thicknesses but are lower than both Kim’s formula and the Highway Bridge Code for the smaller thickness of 0.6 m. At R = 25 m, the finite element results for C120 concrete with thicknesses of 0.6 m to 0.9 m (1.46 to 1.77) are generally lower than Kim’s formula (1.91) and the Highway Bridge Code (1.67), but are comparable to or exceed the UHPC Code (1.55).
The variations among the various theories and codes reveal that Kim’s formula typically produces the highest results, followed by the highway bridge code, while the UHPC code is the most conservative. This hierarchy distinctly illustrates the differences in safety factors and theoretical assumptions underlying the diverse design methodologies.
Effect of Radius of Curvature: The data analysis clearly indicates that a reduction in the radius of curvature significantly enhances the pre-compressive stress multiplier. In the S1 model, the pre-compressive stress multiplier increases by approximately 25% to 30% when the radius is decreased from 25 m to 20 m. The S2 model exhibits a similar trend, with an increase of about 24% to 28%. These findings confirm that structures with smaller radii necessitate higher pre-compressive stresses to sustain the compressive state of the section, owing to the more pronounced annular tensile stresses.
The finite element analysis results indicate that the pre-compressive stress multiplier exhibits a clear increasing trend as member thickness increases. For instance, in the S1 model under the conditions of R = 20 and C80 concrete, the pre-compressive stress multiplier rises from 1.23 to 1.48 with an increase in thickness from 0.6 m to 0.9 m, representing an approximate increase of 20%. Similarly, with C120 concrete, the multiplier increases from 1.50 to 1.83 as thickness rises from 1.50 m to 1.48 m, reflecting an increase of about 22%. A comparable growth pattern is also observed in the S2 model.
The effect of concrete strength indicates that an increase in concrete strength will correspondingly elevate the pre-compressive stress multiplier. For instance, in the S2 model with R = 20 and a thickness of 0.8 m, when the concrete strength is raised from C80 to C120, the pre-compressive stress multiplier, as calculated by finite element analysis, increases from 1.75 to 2.17, reflecting an approximate increase of 24%. However, the sensitivity of this response differs across various calculation methods and models.
Despite the differences in absolute stress levels between the two models, they exhibit strong agreement in their sensitivity to the influencing parameters. The change in radius impacts both models similarly, and the magnitude of the effect of thickness is also comparable. This consistency suggests that, although the absolute values differ between the models, the underlying mechanical principles remain similar, thereby offering a theoretical foundation for developing a unified design methodology.
According to the well-defined pre-compressive stress multiplier (X = 1.2−1.5) established in nuclear safety standards, the pre-compressive stress performance of the S1 and S2 models has been systematically evaluated. The analysis reveals that, when high-strength concrete is utilized as the primary material for the structure, the pre-compressive stress multipliers for both models meet the mandatory technical requirements of the existing safety shell structures in nuclear power plants. Further examination indicates that, under identical working conditions, the calculation results for the pre-compressive stress multipliers of both models consistently adhere to the limits set by nuclear safety standards, regardless of the mainstream calculation methods or current code provisions employed. Notably, there are no instances of failure to meet any specified indices.
The analysis of the measured and calculated data for the pre-compressive stress multiplier X across various working conditions, as presented in Table 15, Table 16, Table 17 and Table 18, indicates a significant improvement in the X values relative to the lower limit specified by the standards. This enhancement is both statistically and practically significant for engineering applications. The findings of this study demonstrate that the judicious use of high-strength concrete can effectively elevate the pre-compressive stress levels in nuclear containment structures. Consequently, this improvement markedly increases the overall load-bearing capacity and disaster resilience of the structures, thereby enhancing structural safety redundancy. Such characteristics of concrete containment in nuclear power plants can further mitigate the risk of structural failure under extreme conditions, offering more reliable protection for nuclear safety. Additionally, this research provides essential theoretical and experimental support for optimizing the design of concrete structures in nuclear power facilities.
5.5. Improvements in Current Codes and Limitations in Practical Engineering Applications
5.5.1. Improvements to Existing Norms
Based on the findings of this study regarding the applicability of the existing Ultra-High-Performance Concrete (UHPC) code, highway bridge code, and Kim’s formula under conditions of dense anchorage and high-strength concrete, as well as the mechanical characteristics of these two scenarios and the limitations of the current codes, targeted improvements to the design system are proposed. To address the stress distribution characteristics in the dense anchorage area, it is essential to incorporate a correction mechanism for the stress superposition effect. This can be achieved by introducing a suitable correction coefficient to optimize the contribution of concrete in the calculation formula for local compressive bearing capacity. Such an adjustment will compensate for the prediction bias resulting from the oversight of effects outlined in the existing specifications, thereby aligning the calculation results more closely with the actual stress conditions of the project. Simultaneously, it is essential to optimize the correction coefficient for the local compressive strength of high-strength concrete. This requires moving away from the overly conservative fixed values currently specified in design guidelines, which do not adequately consider the mechanical properties of high-strength concrete. By integrating relevant research findings, we can establish a correction coefficient that more accurately correlates with the strength of the concrete, thereby enhancing the precision of the correction.
To enhance the calculation of reinforcement constraint contributions, it is essential to refine the existing specification’s calculation logic. This refinement should clarify the value standards for the relevant experience coefficients, fully account for the synergistic effects of steel fibers and reinforcing steel, and appropriately adjust the contribution term for reinforcing steel under high-strength concrete conditions. Additionally, it is crucial to define the value range for key parameters to improve the accuracy of the calculation results. Furthermore, the current design provisions are predicated on one-way anchorage conditions and lack guidance for two-way intensive anchorage area design. Therefore, new design provisions must be introduced to specify the verification methods for the bearing capacity and safety reserve requirements of two-way aperture arrangements in the anchorage area. This will mitigate the risk of multi-directional stress superposition and ensure that the specifications comprehensively address various anchorage conditions.
5.5.2. Limitations in Practical Engineering Applications
The finite element model developed in this study is grounded in St. Venant’s principle of local intercept processing. However, it does not account for the complexities introduced by structures such as the intersections of nuclear containment domes and cylinders, or pipeline openings. Additionally, the model omits the time-varying effects of concrete shrinkage, creep, and the relaxation of steel bundles. This limitation diverges from the actual project conditions and necessitates correction through the integration of long-term performance data from the test model to better align with engineering design requirements. The parameters of the Concrete Damage Plasticity (CDP) model are established through laboratory tests; however, the mechanical properties of high-grade concrete in real-world applications exhibit variability. Furthermore, parameters associated with steel fibers significantly influence the progression of concrete damage characteristics. The challenges of conducting on-site parameter detection and calibration further constrain the applicability of this method in large-scale projects.
The grid size of the refined three-dimensional finite element model developed in this study is substantial, resulting in extended computation times and elevated computational costs. In analyzing the complete structure of large nuclear power containment, it is essential to enhance computational efficiency by integrating simplified sub-modeling techniques, thereby achieving both analytical accuracy and practical applicability in engineering contexts. Furthermore, the specification improvement proposals presented herein are based solely on numerical simulations and localized test results, lacking validation through full-scale containment prototype tests. Consequently, subsequent full-scale model tests are necessary to further calibrate and refine the relevant correction coefficients and design parameters, ensuring that the proposed specification improvements hold reliable value for engineering applications.
6. Conclusions
Through refined finite element simulations and theoretical analyses, this study conducts an exploratory assessment of a novel high-strength concrete for nuclear power containment, establishing a numerical basis for future essential experimental validation. The principal conclusions are as follows:
- (1)
- The novel containment design utilizing HPC/UHPC materials enables a substantial reduction in cylinder thickness, achieving over 30% less than traditional designs. This optimization maintains a higher safety level while effectively minimizing structural deadweight and seismic impacts.
- (2)
- A three-dimensional system-level finite element model was developed as a preliminary numerical framework to simulate the two-way dense anchorage zone in a nuclear power containment. This exploratory model elucidated the potential transformation mechanism of damage modes—from unidirectional splitting to multidirectional synergistic compression—triggered by the superposition of a multi-directional stress field around the apertures. This advancement provides preliminary insights that could enhance the theoretical framework regarding the mechanical behavior of high-strength concrete in nuclear safety-grade structures, though these numerical findings require future experimental validation. In this preliminary analysis, the nuclear containment anchorage area represents a typical stress disturbance zone, characterized by tensile damage that occurs when radial tensile stress exceeds the tensile strength of concrete due to concentrated forces at the anchor. This tensile damage tends to initiate and propagate along the radial line within the anchorage gap. In cases of closely spaced anchorage, the tensile damage areas rapidly connect, forming a continuous damage zone. Furthermore, a multi-directional orifice arrangement allows for the three-dimensional superposition of the stress field, resulting in a transition from unidirectional splitting to multi-directional synergistic crushing. The mechanisms described herein, derived from numerical simulation, highlight critical phenomena that must be confirmed and quantified through subsequent physical testing.
- (3)
- Refined finite element analysis indicates that existing design codes, such as Kim’s formula and the UHPC code, typically exhibit prediction bias for novel structures. These biases manifest as either overly conservative estimates or insufficient safety for specific working conditions, thereby limiting the optimal performance of high-strength concrete. Notably, Kim’s formula demonstrates a non-conservative prediction tendency under S2 model high-strength concrete conditions (e.g., C120), with a finite element/Kim ratio as low as 0.76. In contrast, the calculations from the two codes reveal excessive conservatism, as evidenced by a finite element/code ratio reaching 1.59 in most conditions. This conservatism hinders the accurate utilization and full potential of high-strength concrete materials. The system elucidates the limitations of current codes (UHPC codes, highway bridge codes) and empirical formulas (Kim’s formula) in the dense anchorage zone of high-strength concrete. It proposes a design amendment that accounts for the stress superposition effect, thereby offering quantitative data to support future revisions of these codes.
- (4)
- The relationships among concrete strength, member thickness, and radius of curvature with respect to pre-compressive stress levels are systematically quantified, establishing a foundation for precise design. The findings indicate that the pre-compressive stress safety reserve (X-value) of the new structural scheme can substantially surpass the minimum threshold set by current standards, thereby offering enhanced safety redundancy. By quantifying the coupling effects of concrete strength, cylinder thickness, curvature, and other parameters on structural performance, this study provides a quantitative basis for optimizing the anchorage zone design. It also addresses the key question of defining the parameter boundaries for high-strength concrete to realize a “thin-walled and high pre-stressing” containment shell.
This study demonstrates the superiority of HPC/UHPC in nuclear containment applications. The proposed structural design scheme offers significant advantages in both safety and cost-effectiveness, providing essential theoretical support and a design foundation for the engineering practices of the next generation of nuclear containment.
Author Contributions
Conceptualization, S.W.; methodology, S.W.; software, J.L.; validation, J.L.; formal analysis, J.L.; data curation, J.L.; writing—original draft preparation, J.L.; writing—review and editing, S.W.; visualization, J.L.; supervision, S.W.; project administration, S.W.; funding acquisition, S.W. All authors have read and agreed to the published version of the manuscript.
Funding
This research was funded by Shanghai Pujiang Talent Program, grant number 21PJ1404300. The research topic is ‘Innovation of Load Combination Design Methods for Concrete Structures of Domestic Nuclear Power Plants Under Nuclear Reactor Accident Conditions’.
Institutional Review Board Statement
Not applicable.
Informed Consent Statement
Not applicable.
Data Availability Statement
The data cannot be shared at this time due to being part of future studies.
Conflicts of Interest
The authors declare no conflicts of interest.
References
- Miranda, E.; Ruiz-García, J. Evaluation of Approximate Methods To Estimate Maximum Inelastic Displacement Demands. Earthq. Eng. Struct. Dyn. 2002, 31, 539–560. [Google Scholar] [CrossRef] [Scilit]
- Shi, C.; Jiao, D.; Zhang, J.; Wang, D.; Zhang, Y.; Farzadnia, N.; Hu, X. Design of High Performance Concrete with Multiple Performance Requirements for #2 Dongting Lake Bridge. Constr. Build. Mater. 2018, 165, 825–832. [Google Scholar] [CrossRef] [Scilit]
- Yang, Y.; Ma, L.; Huang, J.; Gu, C.; Xu, Z.; Liu, J.; Ni, T. Evaluation of the Thermal and Shrinkage Stresses in Restrained High-Performance Concrete. Materials 2019, 12, 3680. [Google Scholar] [CrossRef] [Scilit] [PubMed]
- Bezgin, N.Ö. High Performance Concrete Requirements for Prefabricated High Speed Railway Sleepers. Constr. Build. Mater. 2017, 138, 340–351. [Google Scholar] [CrossRef] [Scilit]
- Feng, Z.; Li, C.X.; Pan, R.S.; Liu, K.Q.; Nie, J. Local Bearing Performance of Anchorage Zone in UHPC Box Girder with Dense Diaphragms. Eng. Mech. 2020, 37, 94–103, 119. [Google Scholar]
- Jiang, X.; Tang, D.Y.; Hu, S.T.; Zhang, Z.Y.; Shi, L. Application of Ultra-High Performance Concrete in Bridge Engineering at Home and Abroad. Railw. Constr. 2021, 61, 1–7. [Google Scholar]
- Shao, X.D.; Fan, W.; Huang, Z.Y. Application of Ultra-High Performance Concrete in Structures. China Civ. Eng. J. 2021, 54, 1–13. [Google Scholar]
- Choi, E.S.; Lee, J.W.; Joh, C.; Kwark, J.W.; Kim, J.S.; Choi, Y.S. A Local Compression Tests of UHPC Anchor Blocks for Post-Tensioning Tendons. Key Eng. Mater. 2013, 525, 561–564. [Google Scholar] [CrossRef] [Scilit]
- Yang, J.; Yang, M.; Zhou, J.T.; Zhang, Z.Y.; Hu, T.X. Bearing Performance and Size Effect of UHPC Prestressed Anchorage Tooth Blocks. J. Railw. Sci. Eng. 2023, 20, 265–277. [Google Scholar]
- Cai, S.H. Local Bearing Strength of Concrete and Reinforced Concrete. China Civ. Eng. J. 1963, 6, 27. [Google Scholar]
- Liu, Y.Y.; Guan, J.G.; Wang, C.Z. Local Bearing Strength and Failure Mechanism of Concrete. China Civ. Eng. J. 1985, 2, 53–65. [Google Scholar]
- Haroon, S.; Yazdani, N.; Tawfiq, K. Posttensioned Anchorage Zone Enhancement with Fiber-Reinforced Concrete. J. Bridge Eng. 2006, 11, 566–572. [Google Scholar] [CrossRef] [Scilit]
- Kim, J.R.; Kwak, H.G.; Kim, B.S.; Kwon, Y.; Bouhjiti, E.M. Finite Element Analyses and Design of Post-Tensioned Anchorage Zone in Ultra-High-Performance Concrete Beams. Adv. Struct. Eng. 2019, 22, 323–336. [Google Scholar] [CrossRef] [Scilit]
- Wei, W.B. Pre-Stressed UHPC Lightweight Anchorage System and Stress Analysis of Anchorage Zone. Master’s Thesis, Lanzhou Jiaotong University, Lanzhou, China, 2024. [Google Scholar]
- Jiang, X.; Guo, J.C.; Sun, B.L.; Zhang, Z.Y.; Shi, L. Experimental study on force transfer performance of UHPC anchorage zones and strut-and-tie model analysis. Railw. Constr. 2023, 63, 49–53. [Google Scholar]
- Li, C.X.; Zhang, Y.; Nie, J.; Pan, R.S.; Liu, K.Q. Experimental study on local compressive behavior of UHPC and bearing capacity calculation method. China Civ. Eng. J. 2022, 55, 36–46, 93. [Google Scholar]
- Hu, Y.Q. Study on Anchorage System and Structural Performance of Pretensioned–Post-Tensioned Unbonded Hybrid PreStressed UHPC Girder Bridges. Doctoral Dissertation, Southeast University, Nanjing, China, 2022. [Google Scholar]
- Tang, D.Y. Finite Element–Based Analysis on Bearing Capacity of a Railway Box Girder. Master’s Thesis, Wuhan Institute of Technology, Wuhan, China, 2023. [Google Scholar]
- Miao, X.Q.; Li, X.F. Prestressed construction technology of containment in the second phase expansion project of Qinshan Nuclear Power Plant. Sci. Technol. Commun. 2010, 9, 97. [Google Scholar]
- Li, J.; Hu, S.G.; Zhu, W.X.; Yang, B.Z. Application of OVM Nuclear Power Anchors in Fangjiashan Nuclear Power Project. In Proceedings of the 16th National Conference on Concrete and Prestressed Concrete & the 12th Prestressed Academic Exchange Conference; Liuzhou OVM Machinery Co., Ltd.: Liuzhou, China; Fangjiashan Project Department of China Nuclear Industry 22nd Construction Co., Ltd.: Jiaxing, China, 2013; pp. 425–431. [Google Scholar]
- JTG 3362-2018; Code for Design of Highway Reinforced Concrete and Prestressed Concrete Bridge and Culvert. China Communications Press Co., Ltd.: Beijing, China, 2018.
- NB/T 20303-2014; Code for Design of Prestressed Concrete Containment. Energy Industry Standard of the People’s Republic of China. China Atomic Energy Press: Beijing, China, 2014.
- GB 50010-2010; Code for Design of Concrete Structures. China Architecture & Building Press: Beijing, China, 2010.
- JGJ 85-2010; Technical Specification for Application of Anchorages, Clamps and Couplers for Prestressing Tendons. China Architecture & Building Press: Beijing, China, 2010.
- Pei, X.; Zeng, L. Size Estimation of Wedge-Type Anchor Plate Series—Part 4 of Safety Discussion on Prestressed Anchorage Zones. In Proceedings of the 17th National Conference on Concrete and Prestressed Concrete & the 13th Prestressed Academic Exchange Conference; China Academy of Building Research: Beijing, China; Hangzhou Zhemao Prestressing Co., Ltd.: Hangzhou, China, 2015; pp. 264–277. [Google Scholar]
- GB/T 5224-2023; Steel Strand for Prestressed Concrete. National Technical Committee on Steel Standardization (SAC/TC 183); China Standard Press: Beijing, China, 2023.
- Fakeh, M.; Jawdhari, A.; Fam, A. Recommended Concrete Damage Plasticity Parameters and Constitutive Models for UHPC in ABAQUS. Eng. Struct. 2025, 333, 120154. [Google Scholar] [CrossRef] [Scilit]
- International Federation for Structural Concrete (fib). fib Model Code for Concrete Structures 2010; FIB: Lausanne, Switzerland, 2013. [Google Scholar]
- Lin, B.; Liu, Z.; Lü, Z.T. Strut-and-Tie Model and Reinforcement Design of Anchorage Zone for External Prestressed Independent Rectangular Tooth Blocks. Eng. Mech. 2011, 28, 59–64. [Google Scholar]
- Lin, B.; Liu, Z. Strut-and-Tie Model and Reinforcement Design of Anchorage Zone for External Prestressed Corner Rectangular Tooth Blocks. Eng. Mech. 2012, 29, 155–160, 167. [Google Scholar]
- Zhou, W.; Hu, H.B. Local Bearing Performance and Bearing Capacity Analysis of Reactive Powder Concrete with Reserved Ducts. Eng. Mech. 2014, 31, 119–128. [Google Scholar]
- Burdet, O.L.; Sanders, D.H.; Roberts, C.L.; Collins, M.P. Models and Tests of Anchorage Zones of Post-Tensioning Tendons. In IABSE Colloquium on Struct. Concrete; International Association for Bridge and Structural Engineering: Zurich, Switzerland, 1991; pp. 545–550. [Google Scholar]
- Tang, M.H. Study on Mechanical Performance and Structural Design of UHPC Anchorage Zones. Doctoral Dissertation, Southeast University, Nanjing, China, 2022. [Google Scholar]
- Technical Specification for Highway Ultra-High Performance Concrete (UHPC) Bridges; Highway Branch of China Association for Engineering Construction Standardization (Draft for Comments); China Communications Press Co., Ltd.: Beijing, China, 2019.
- Technical Specification for Structural Design of Ultra-High Performance Concrete; China Concrete and Cement Products Association (Draft for Comments); China Building Materials Industry Press: Beijing, China, 2020.
- Guyon, Y.F. Prestressed Concrete; Contractor’s Record Ltd.: London, UK, 1953. [Google Scholar]
- ASME BPV Code Section III, Div 2/ACI 359-2021; Code for Concrete Containments. American Society of Mechanical Engineers: New York, NY, USA, 2021.
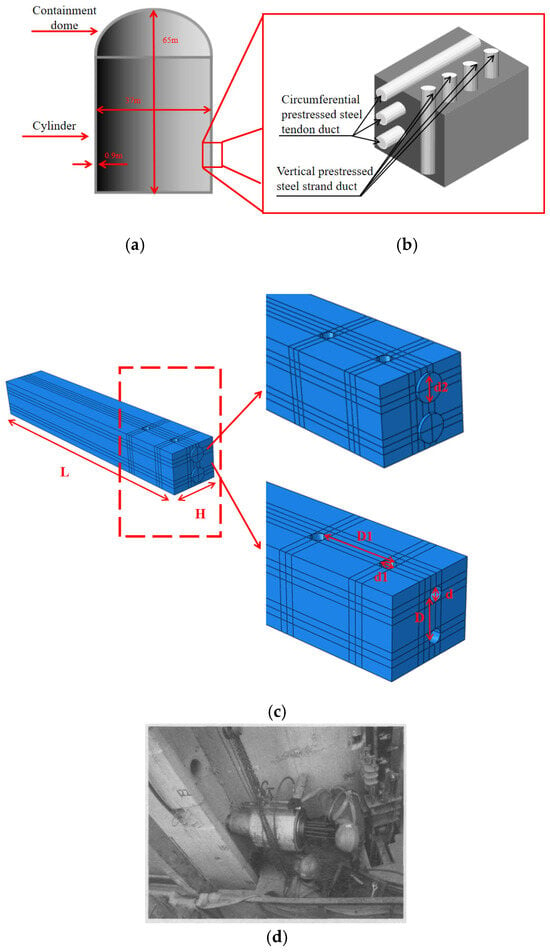
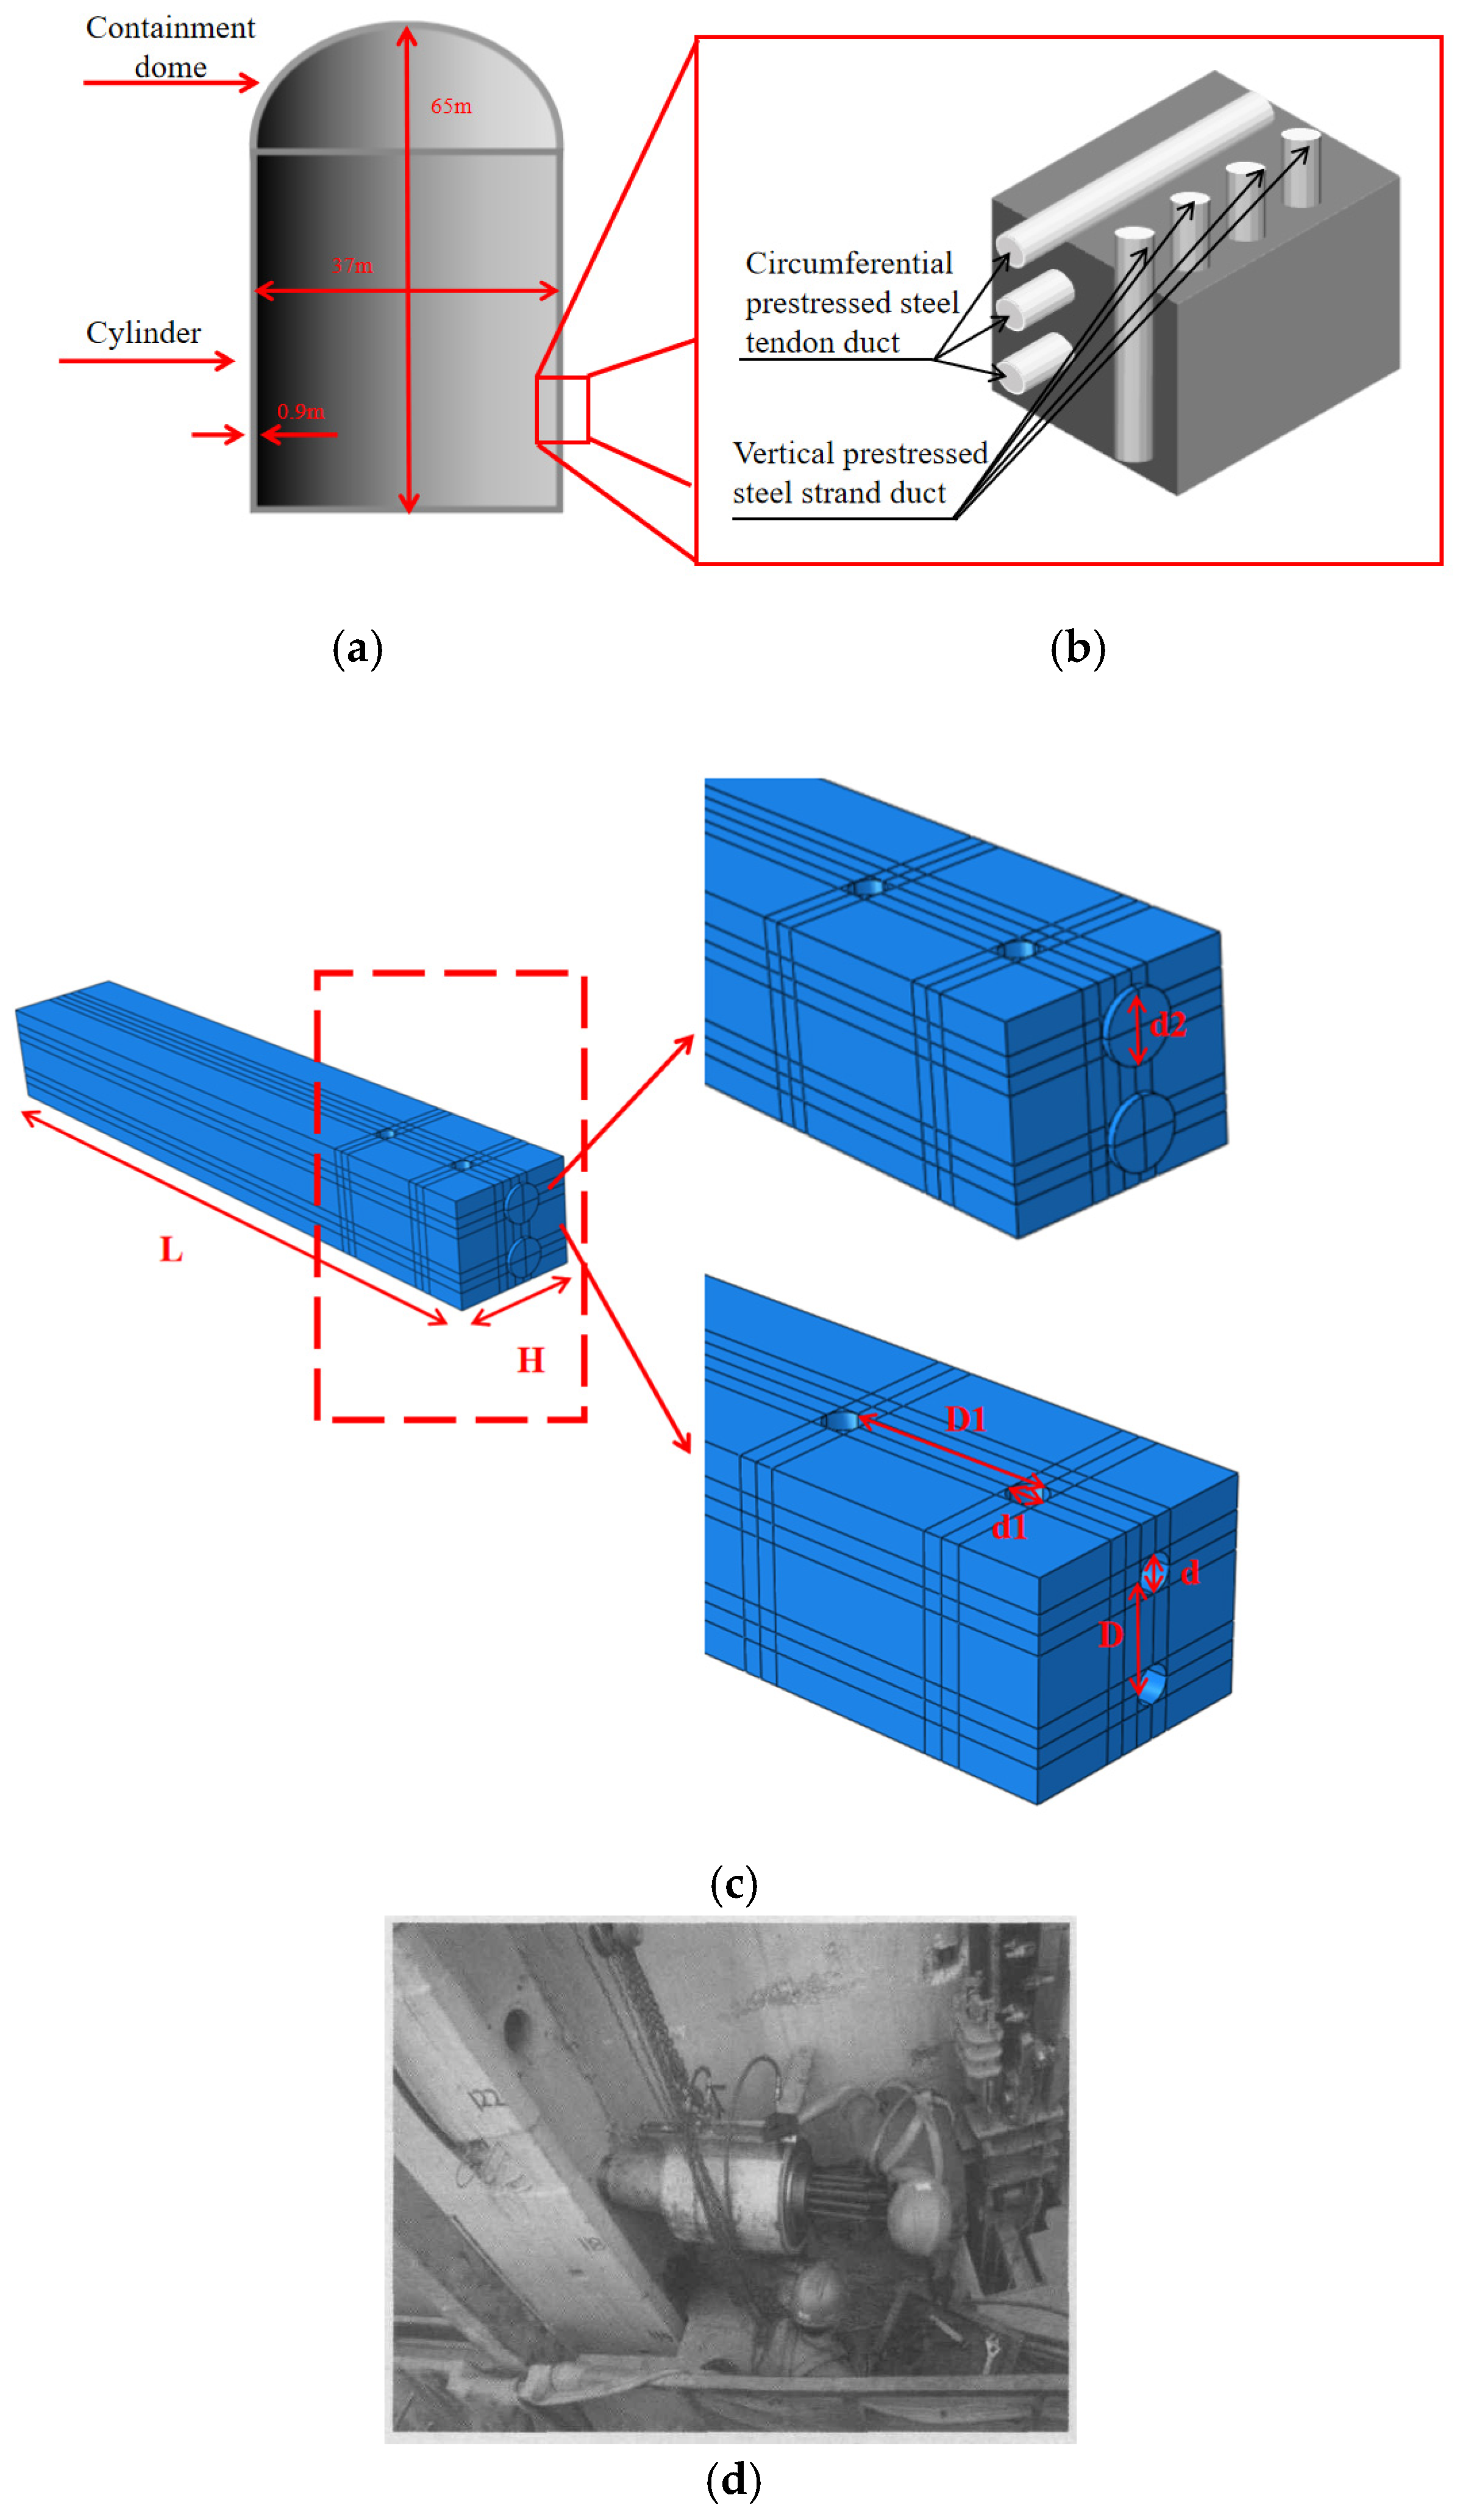
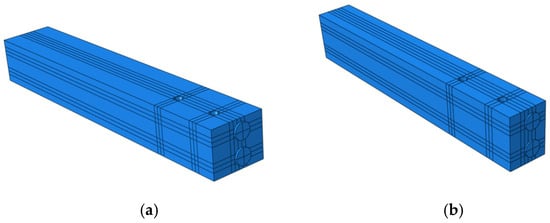
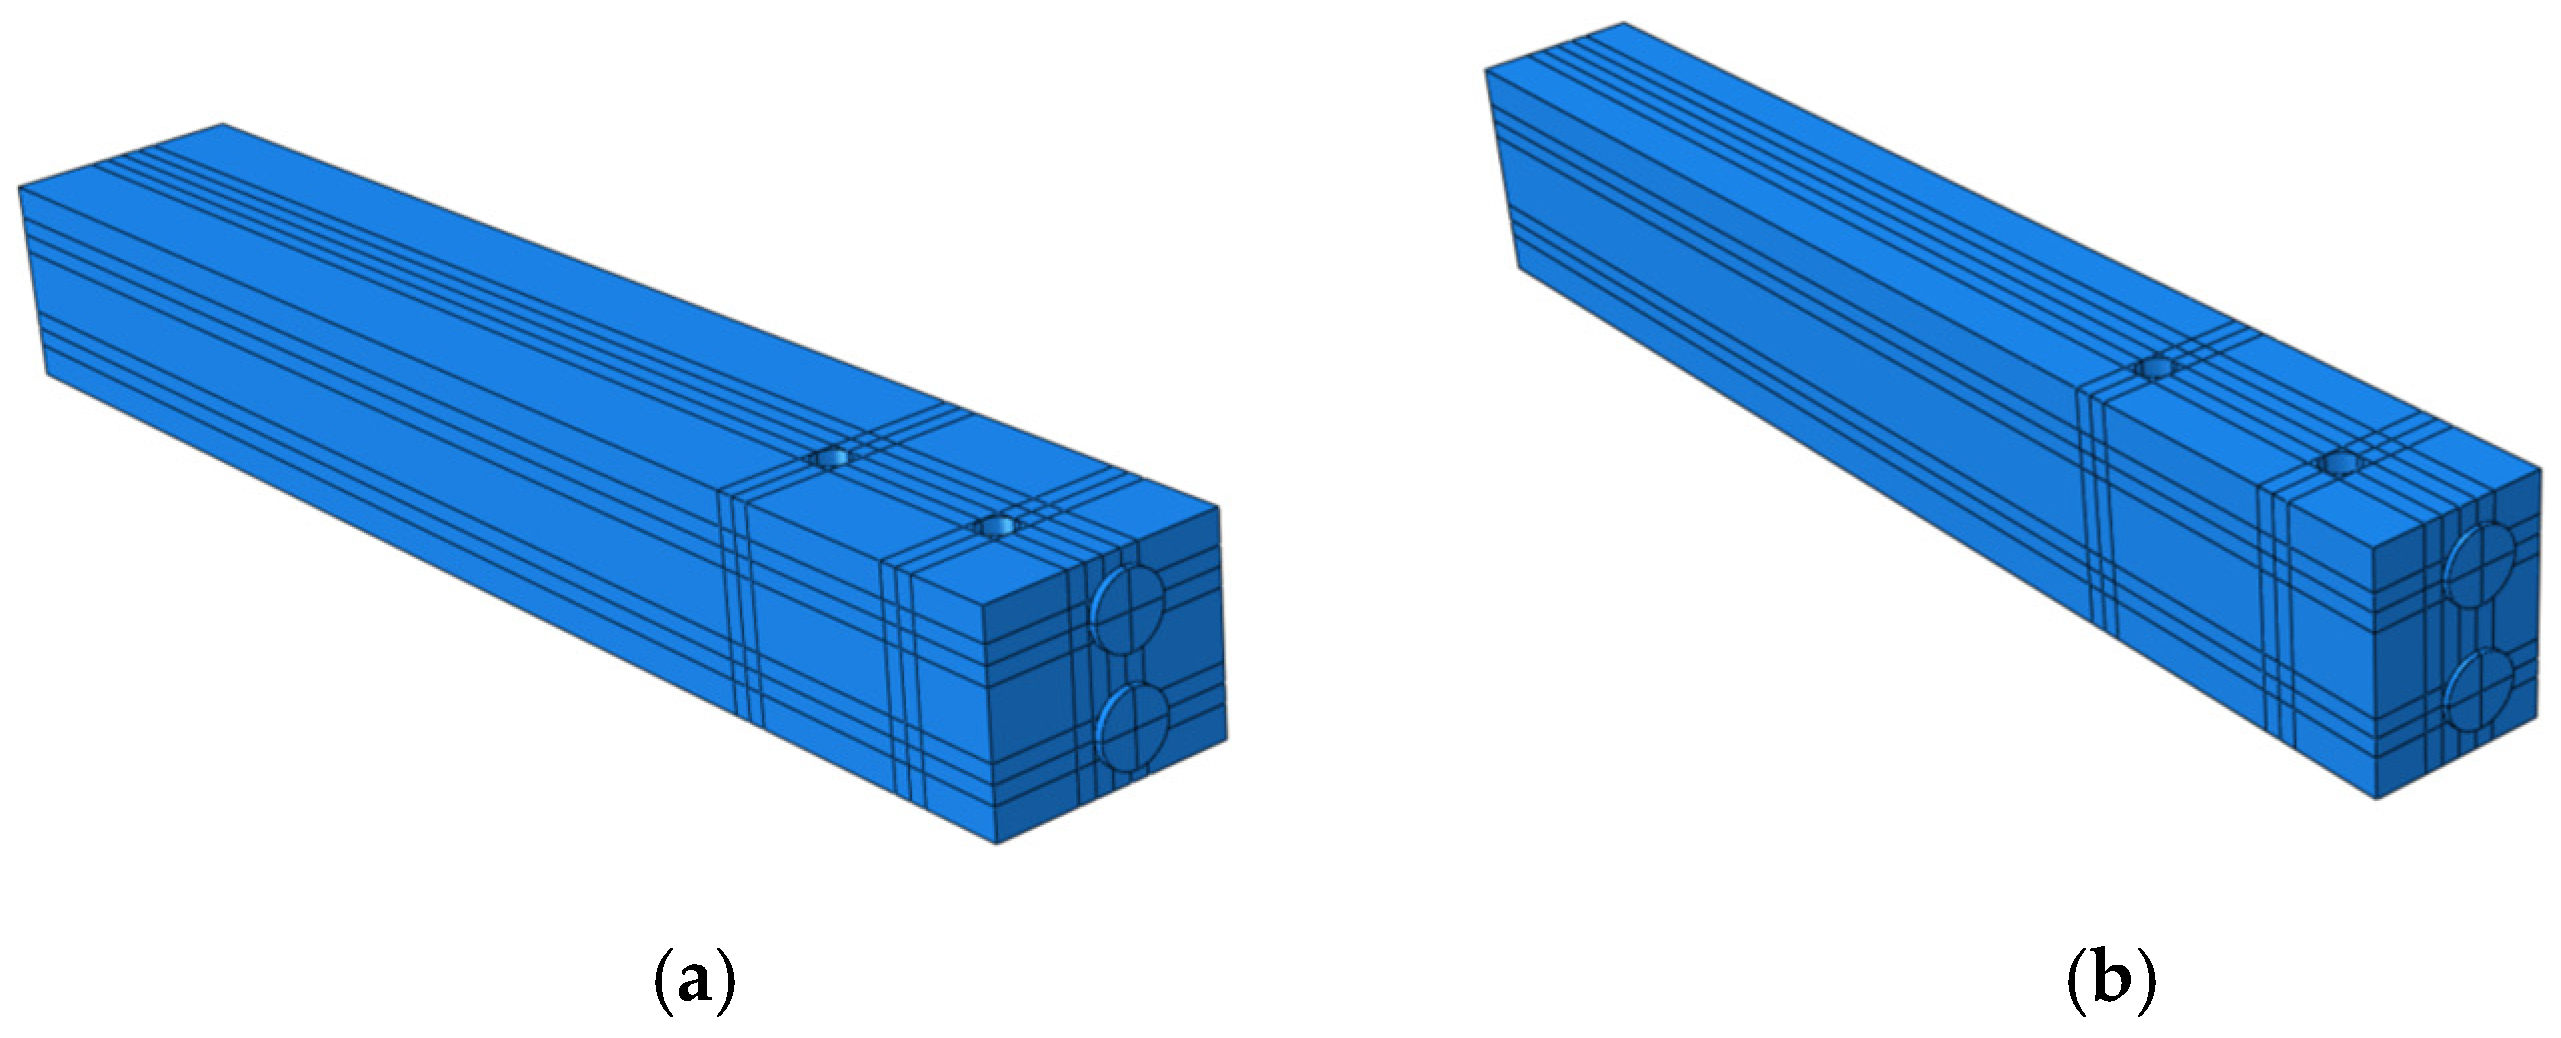
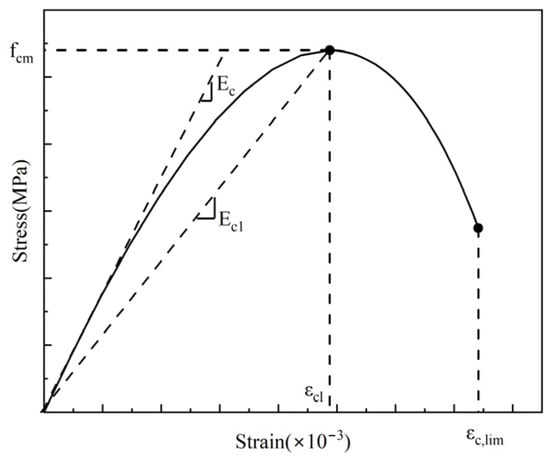
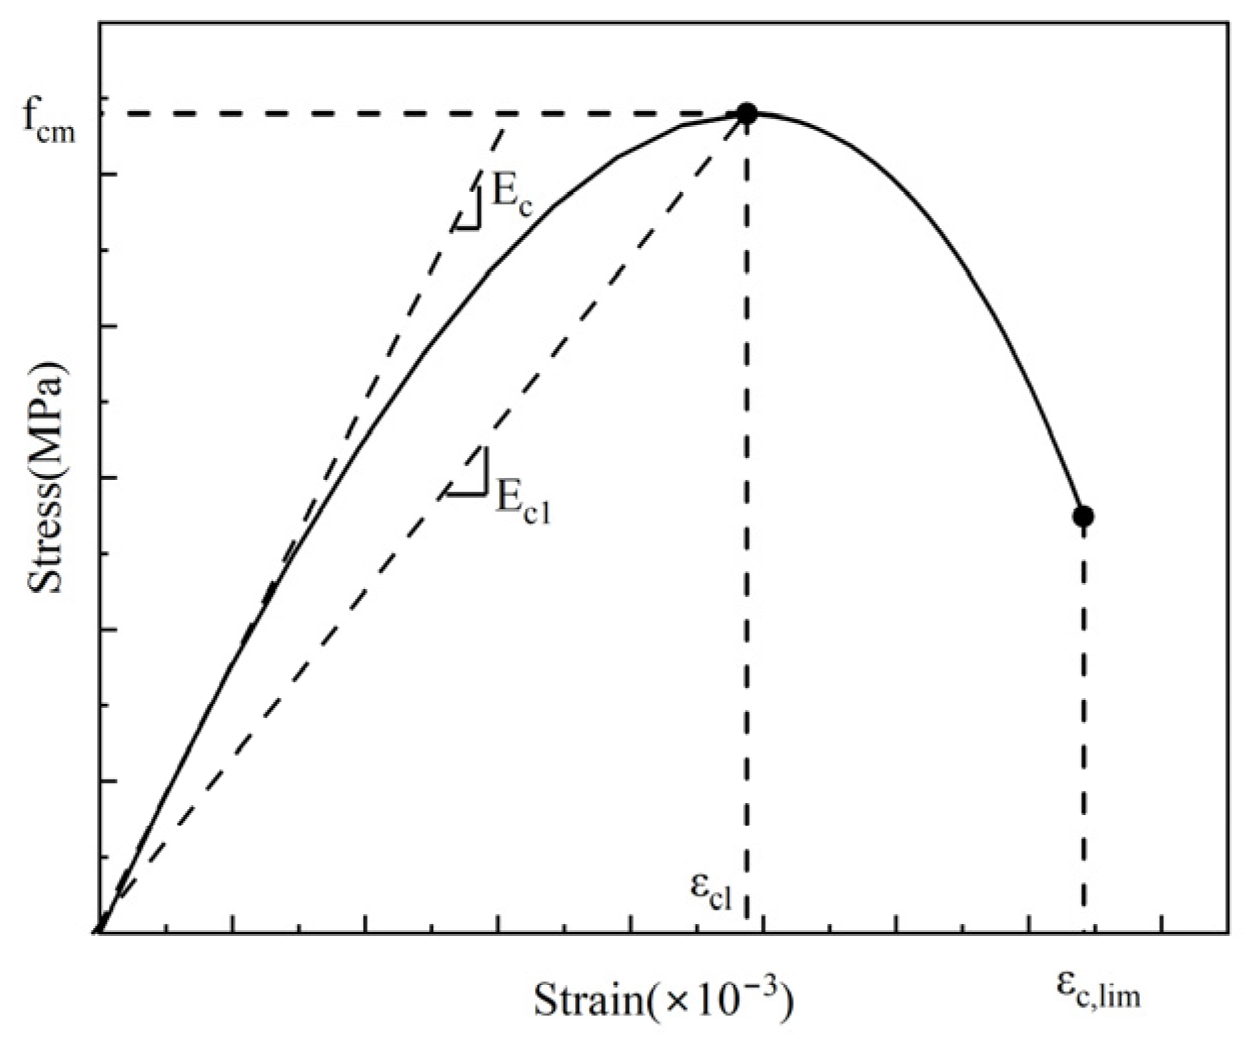
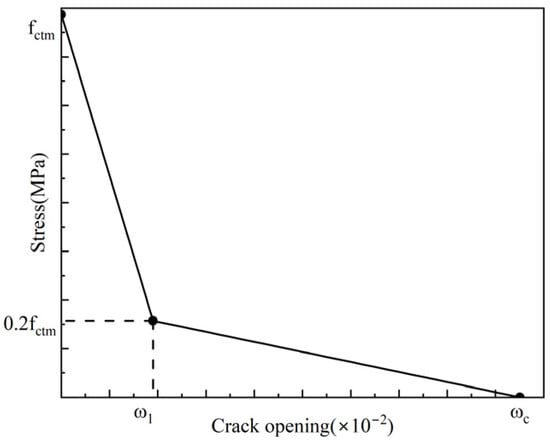
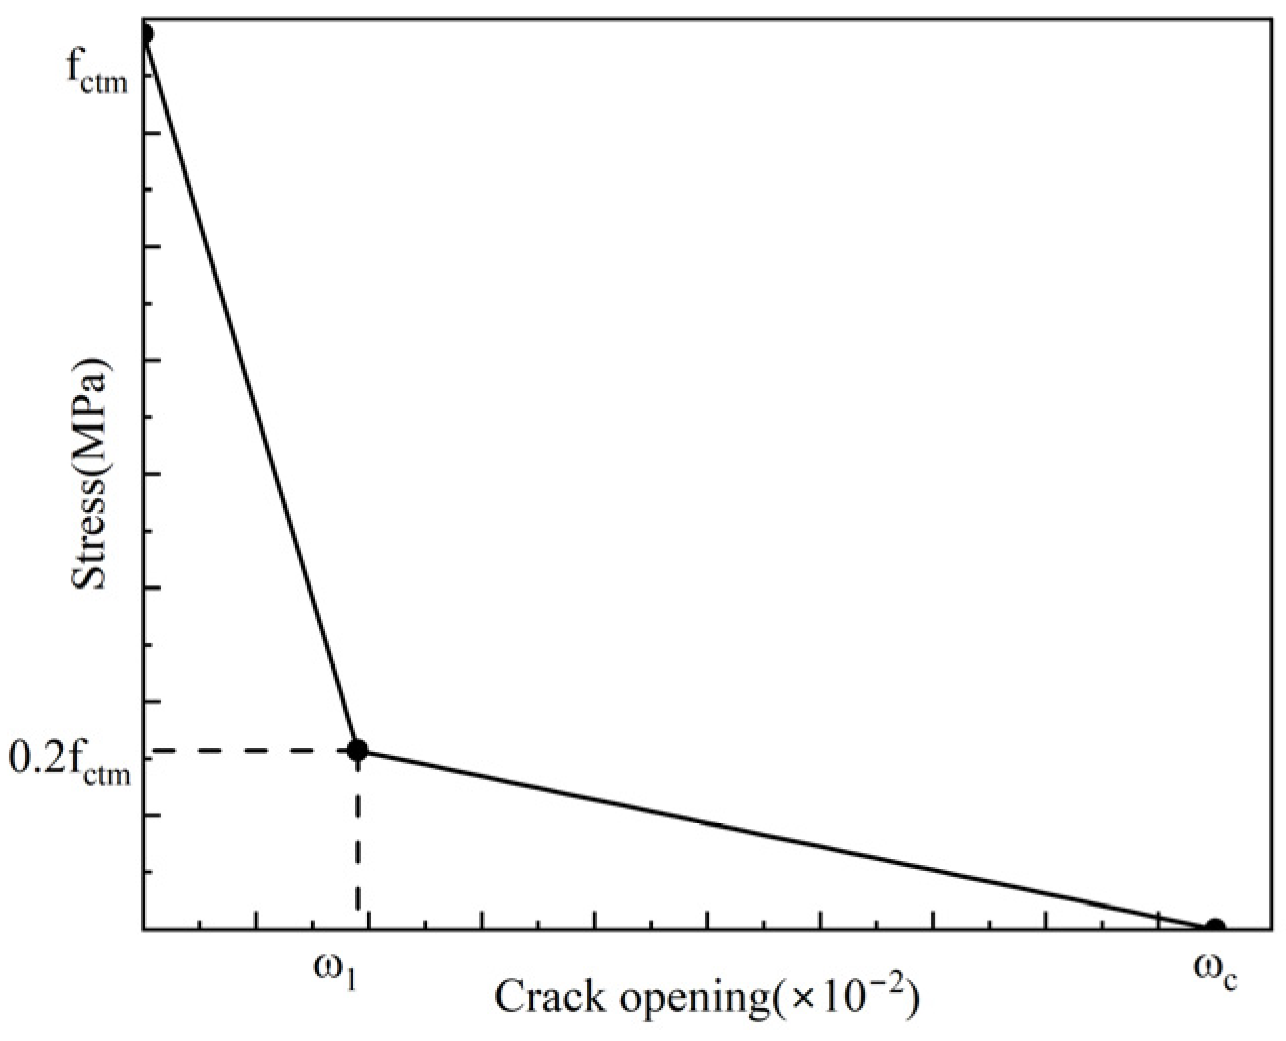
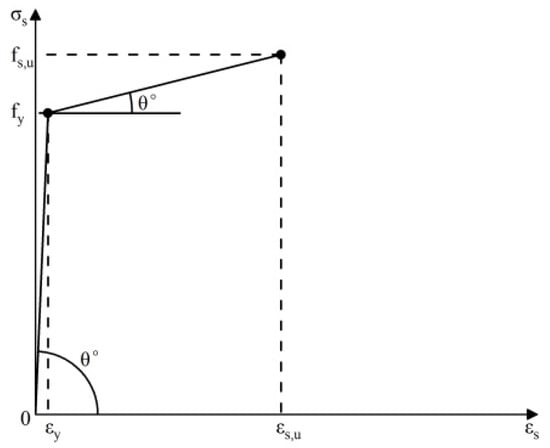
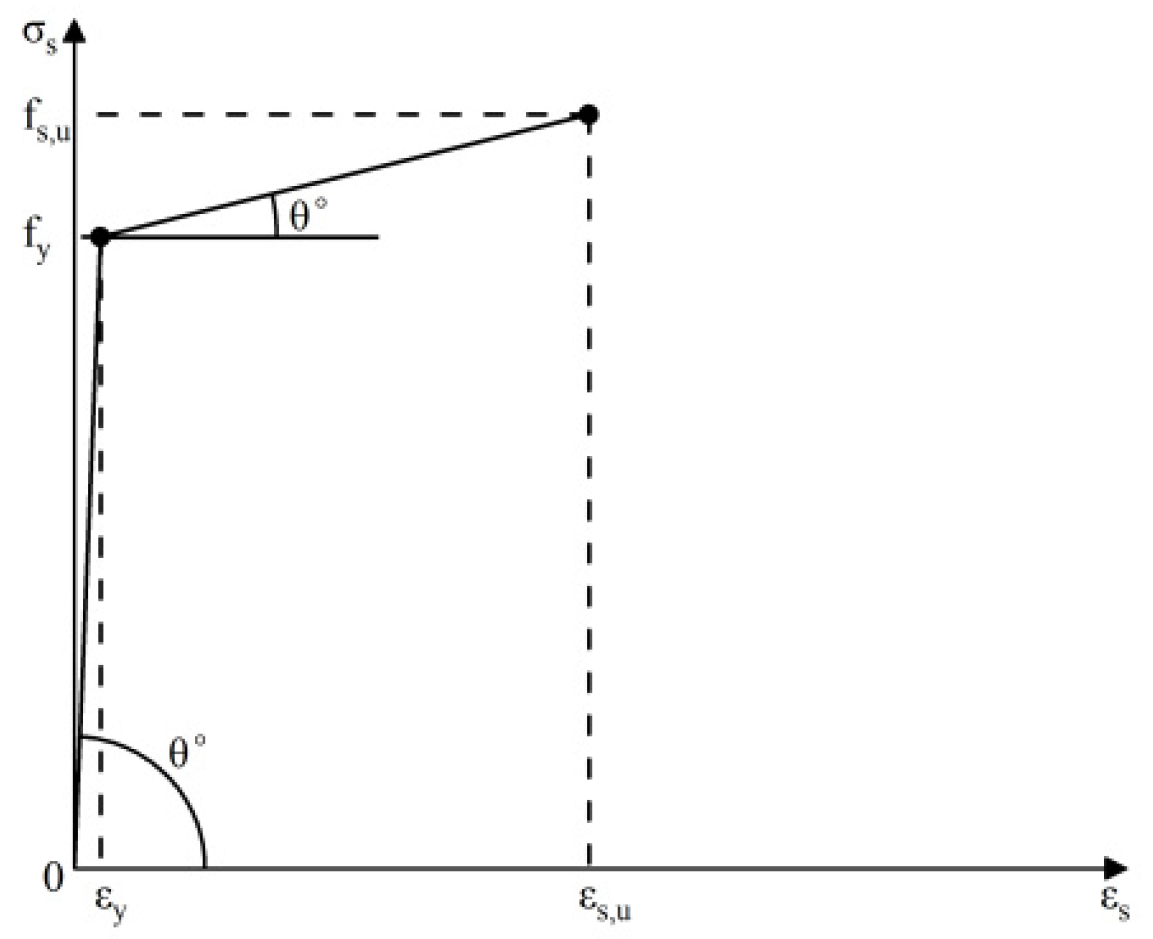
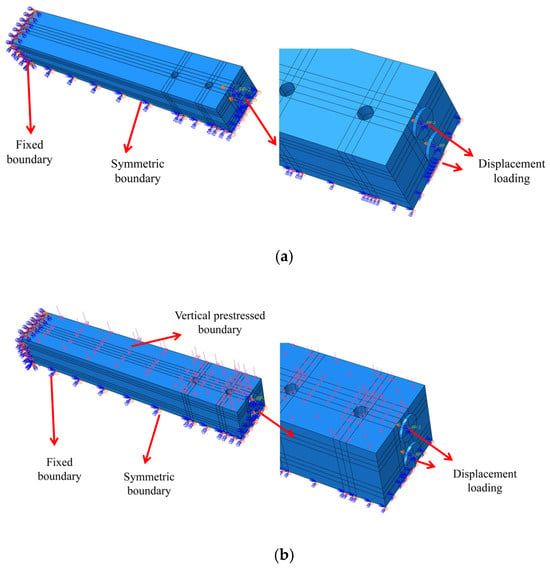
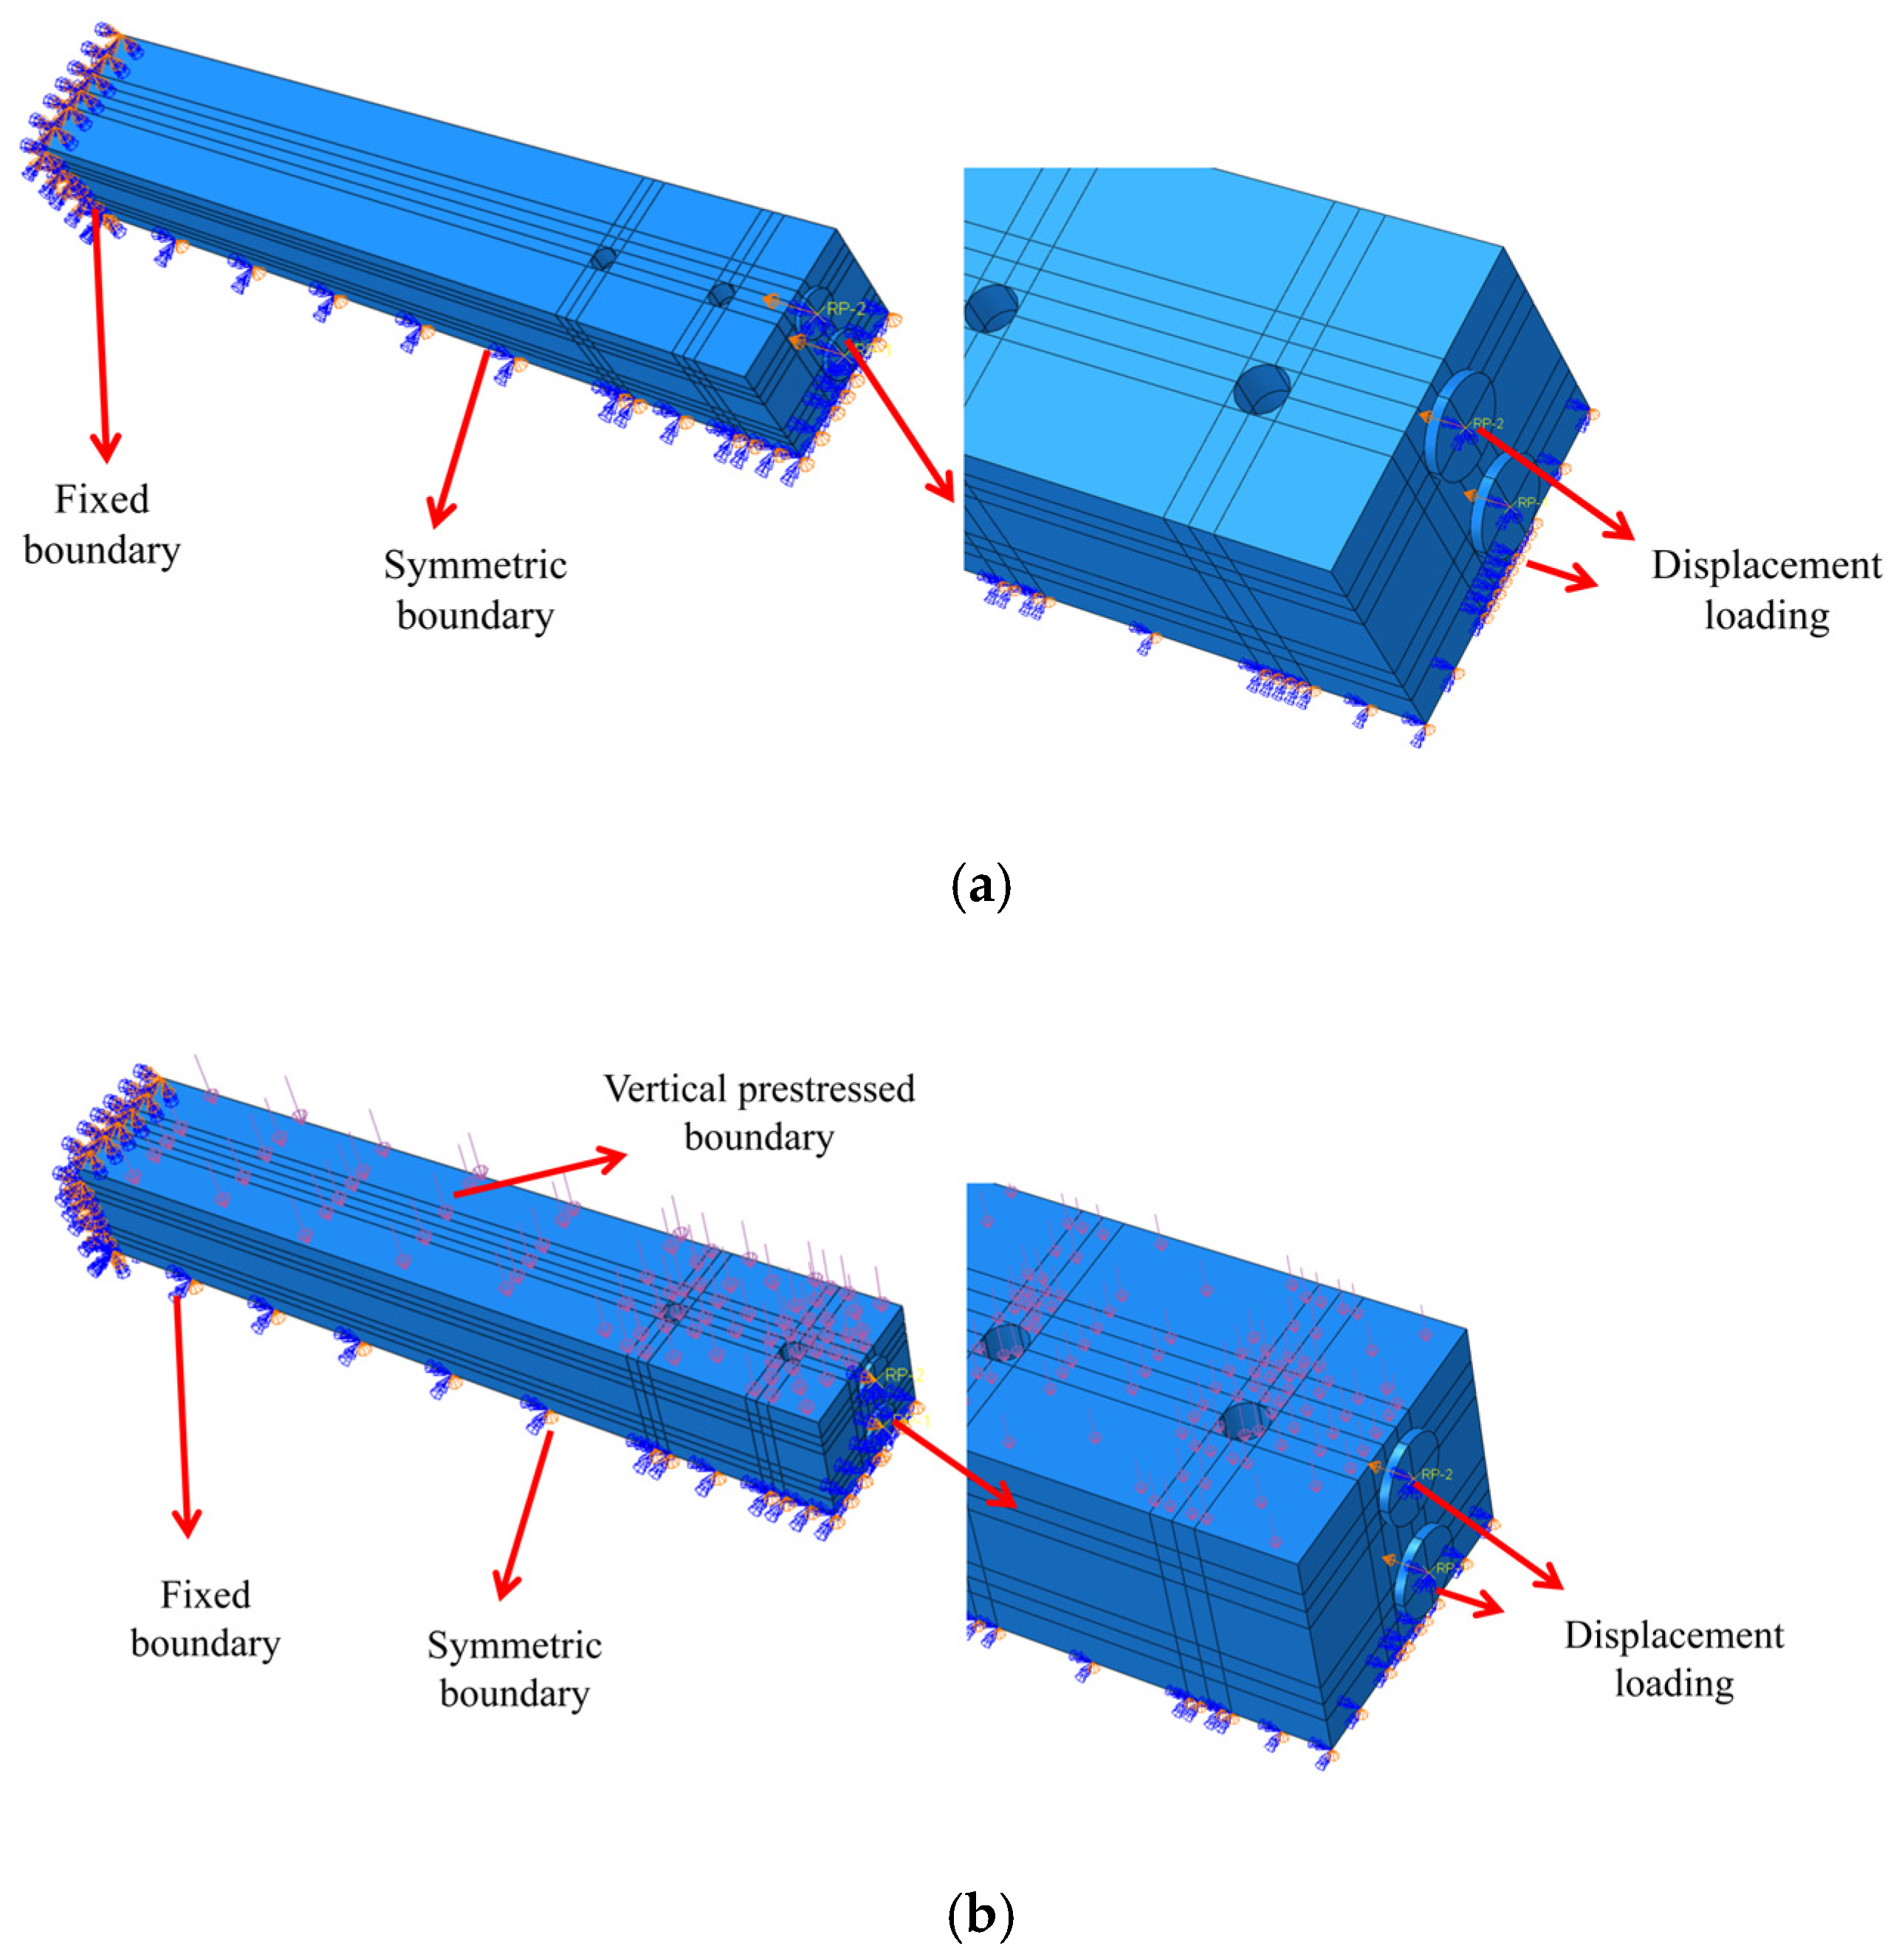
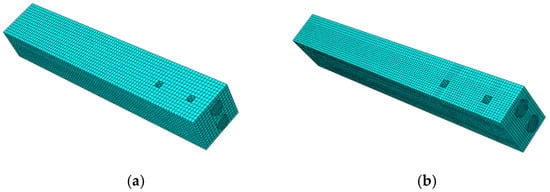
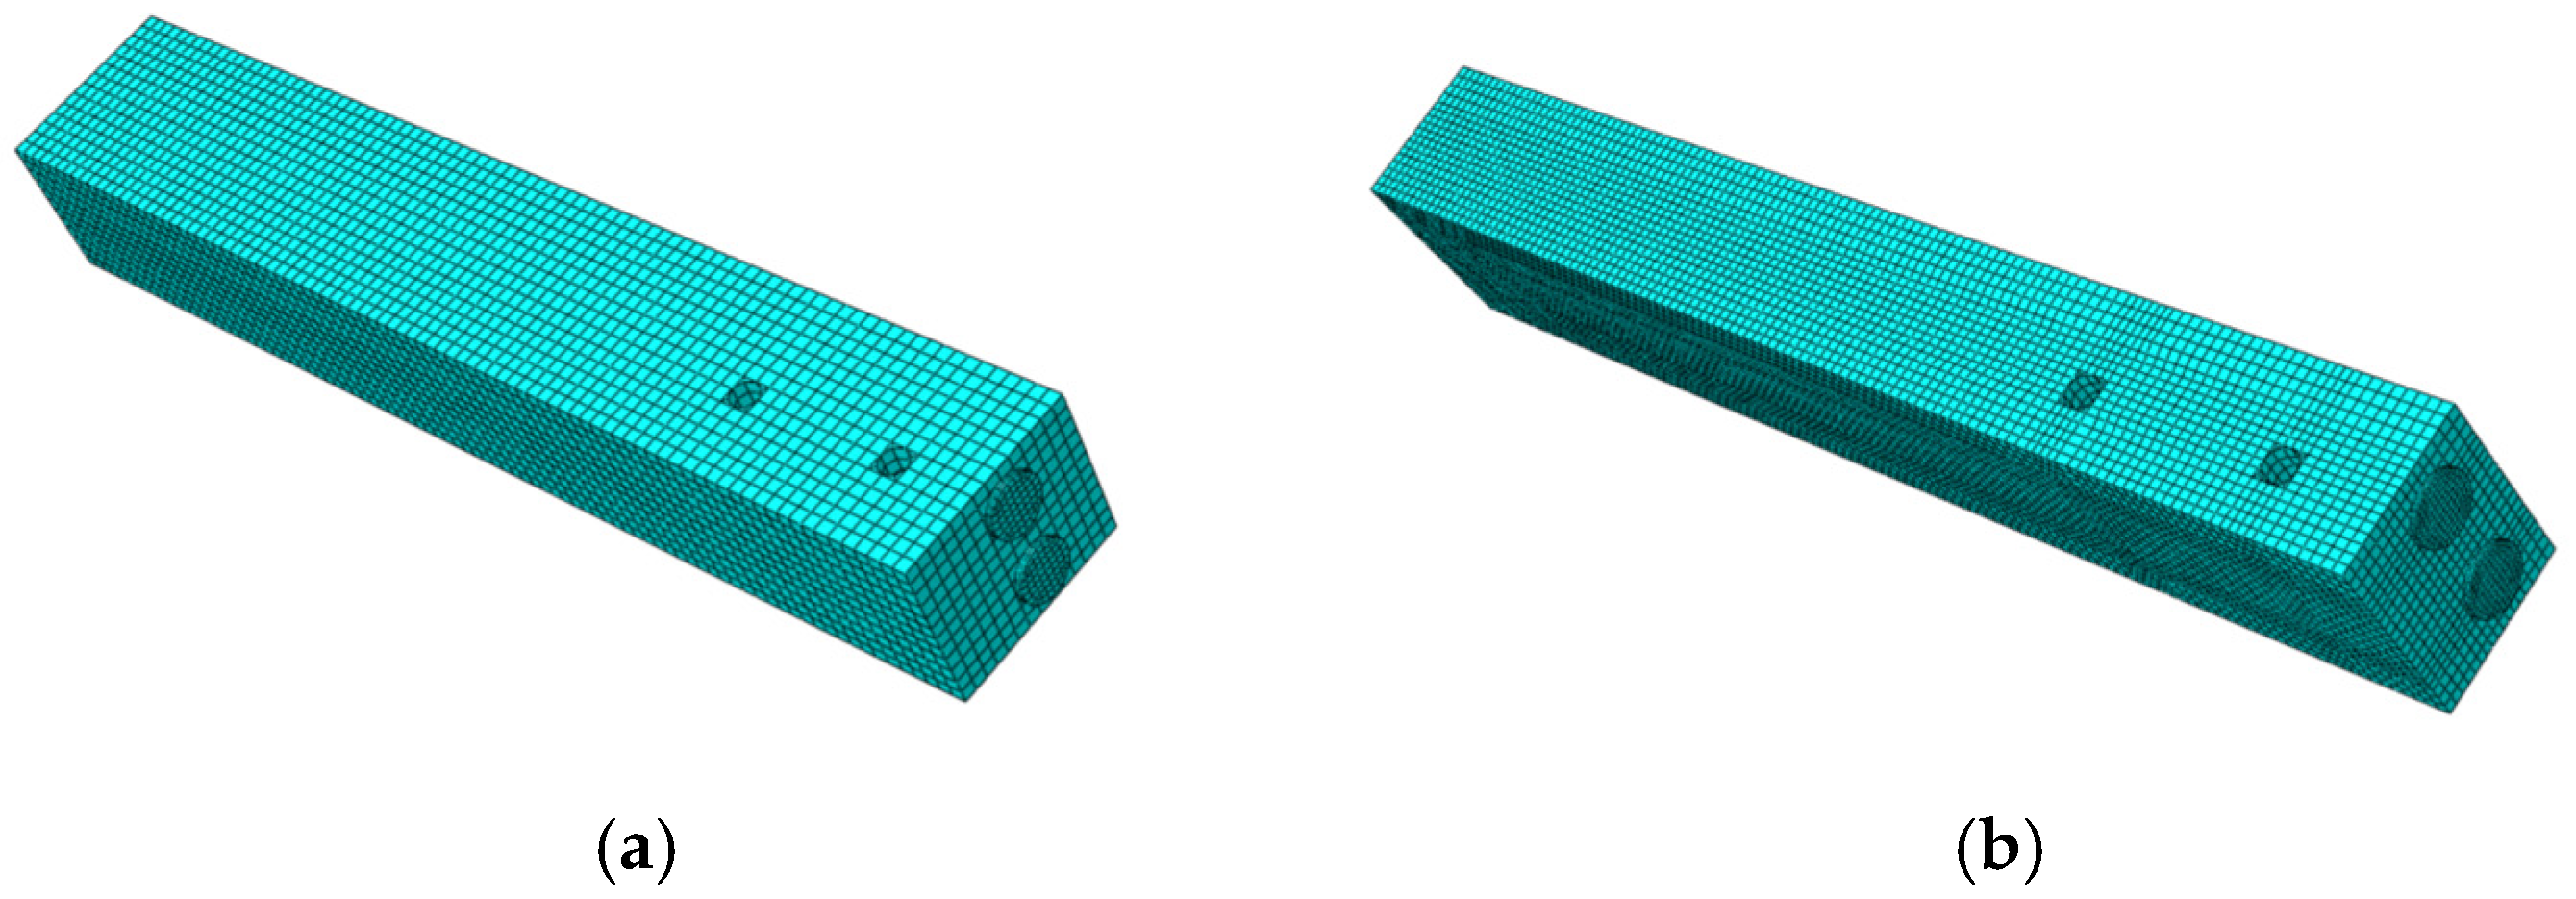
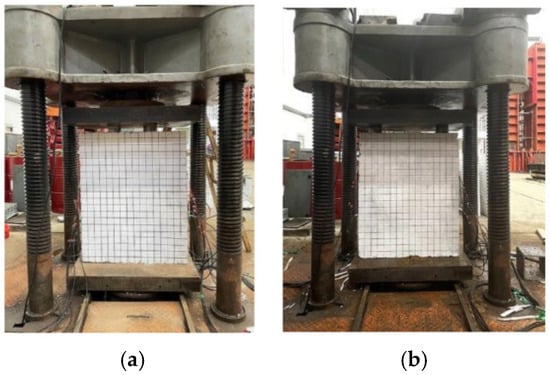
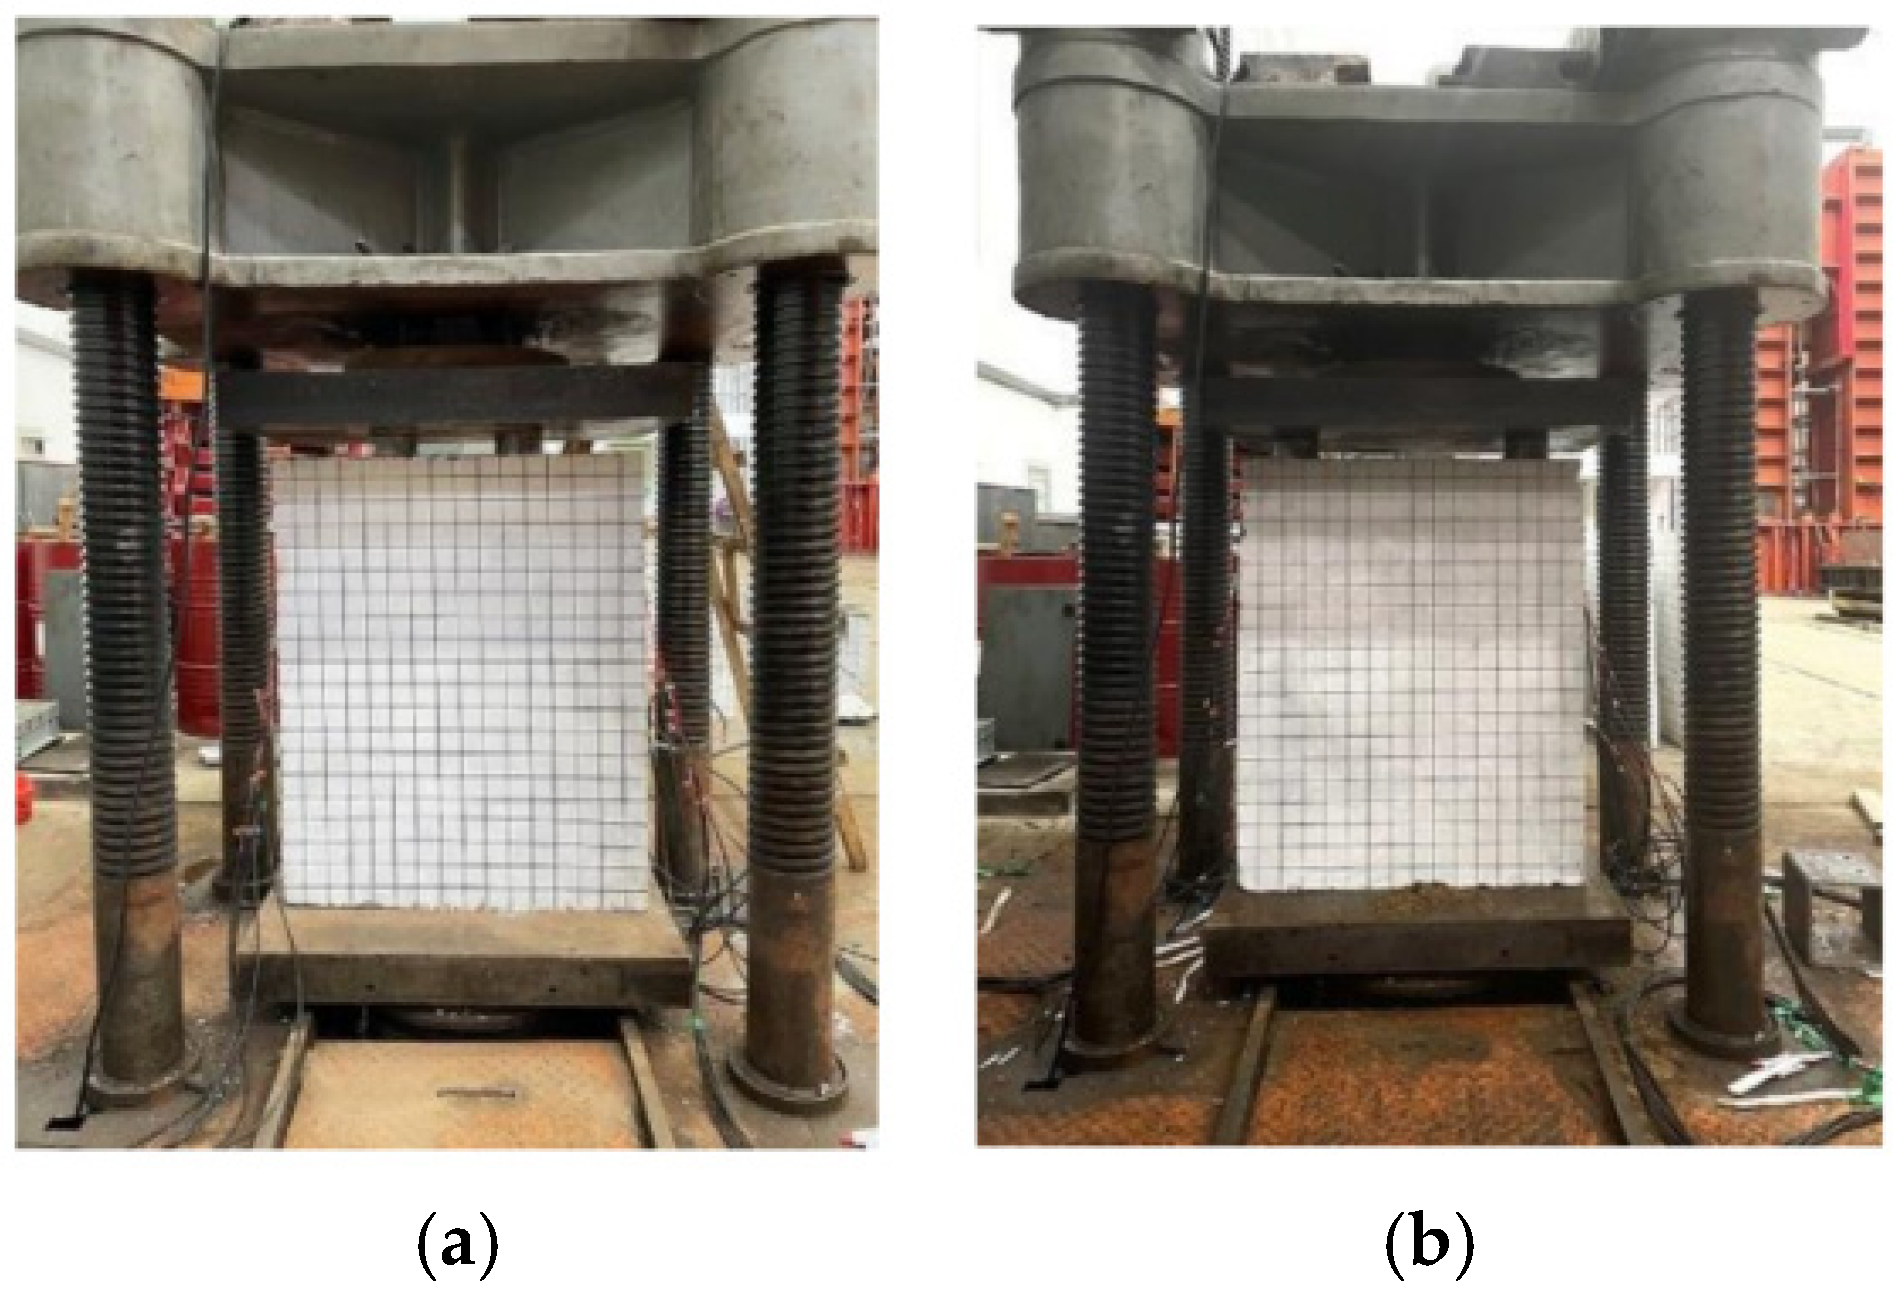
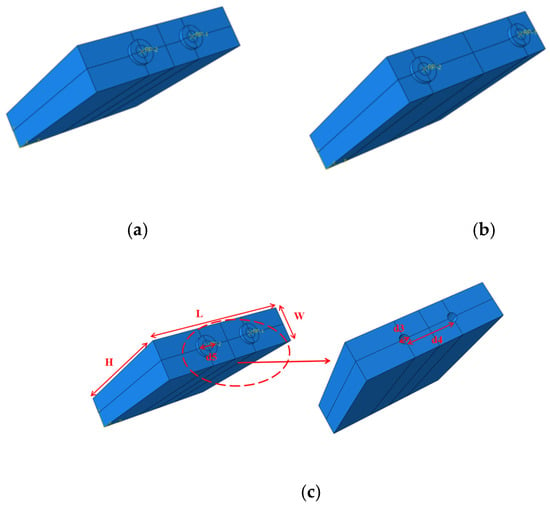
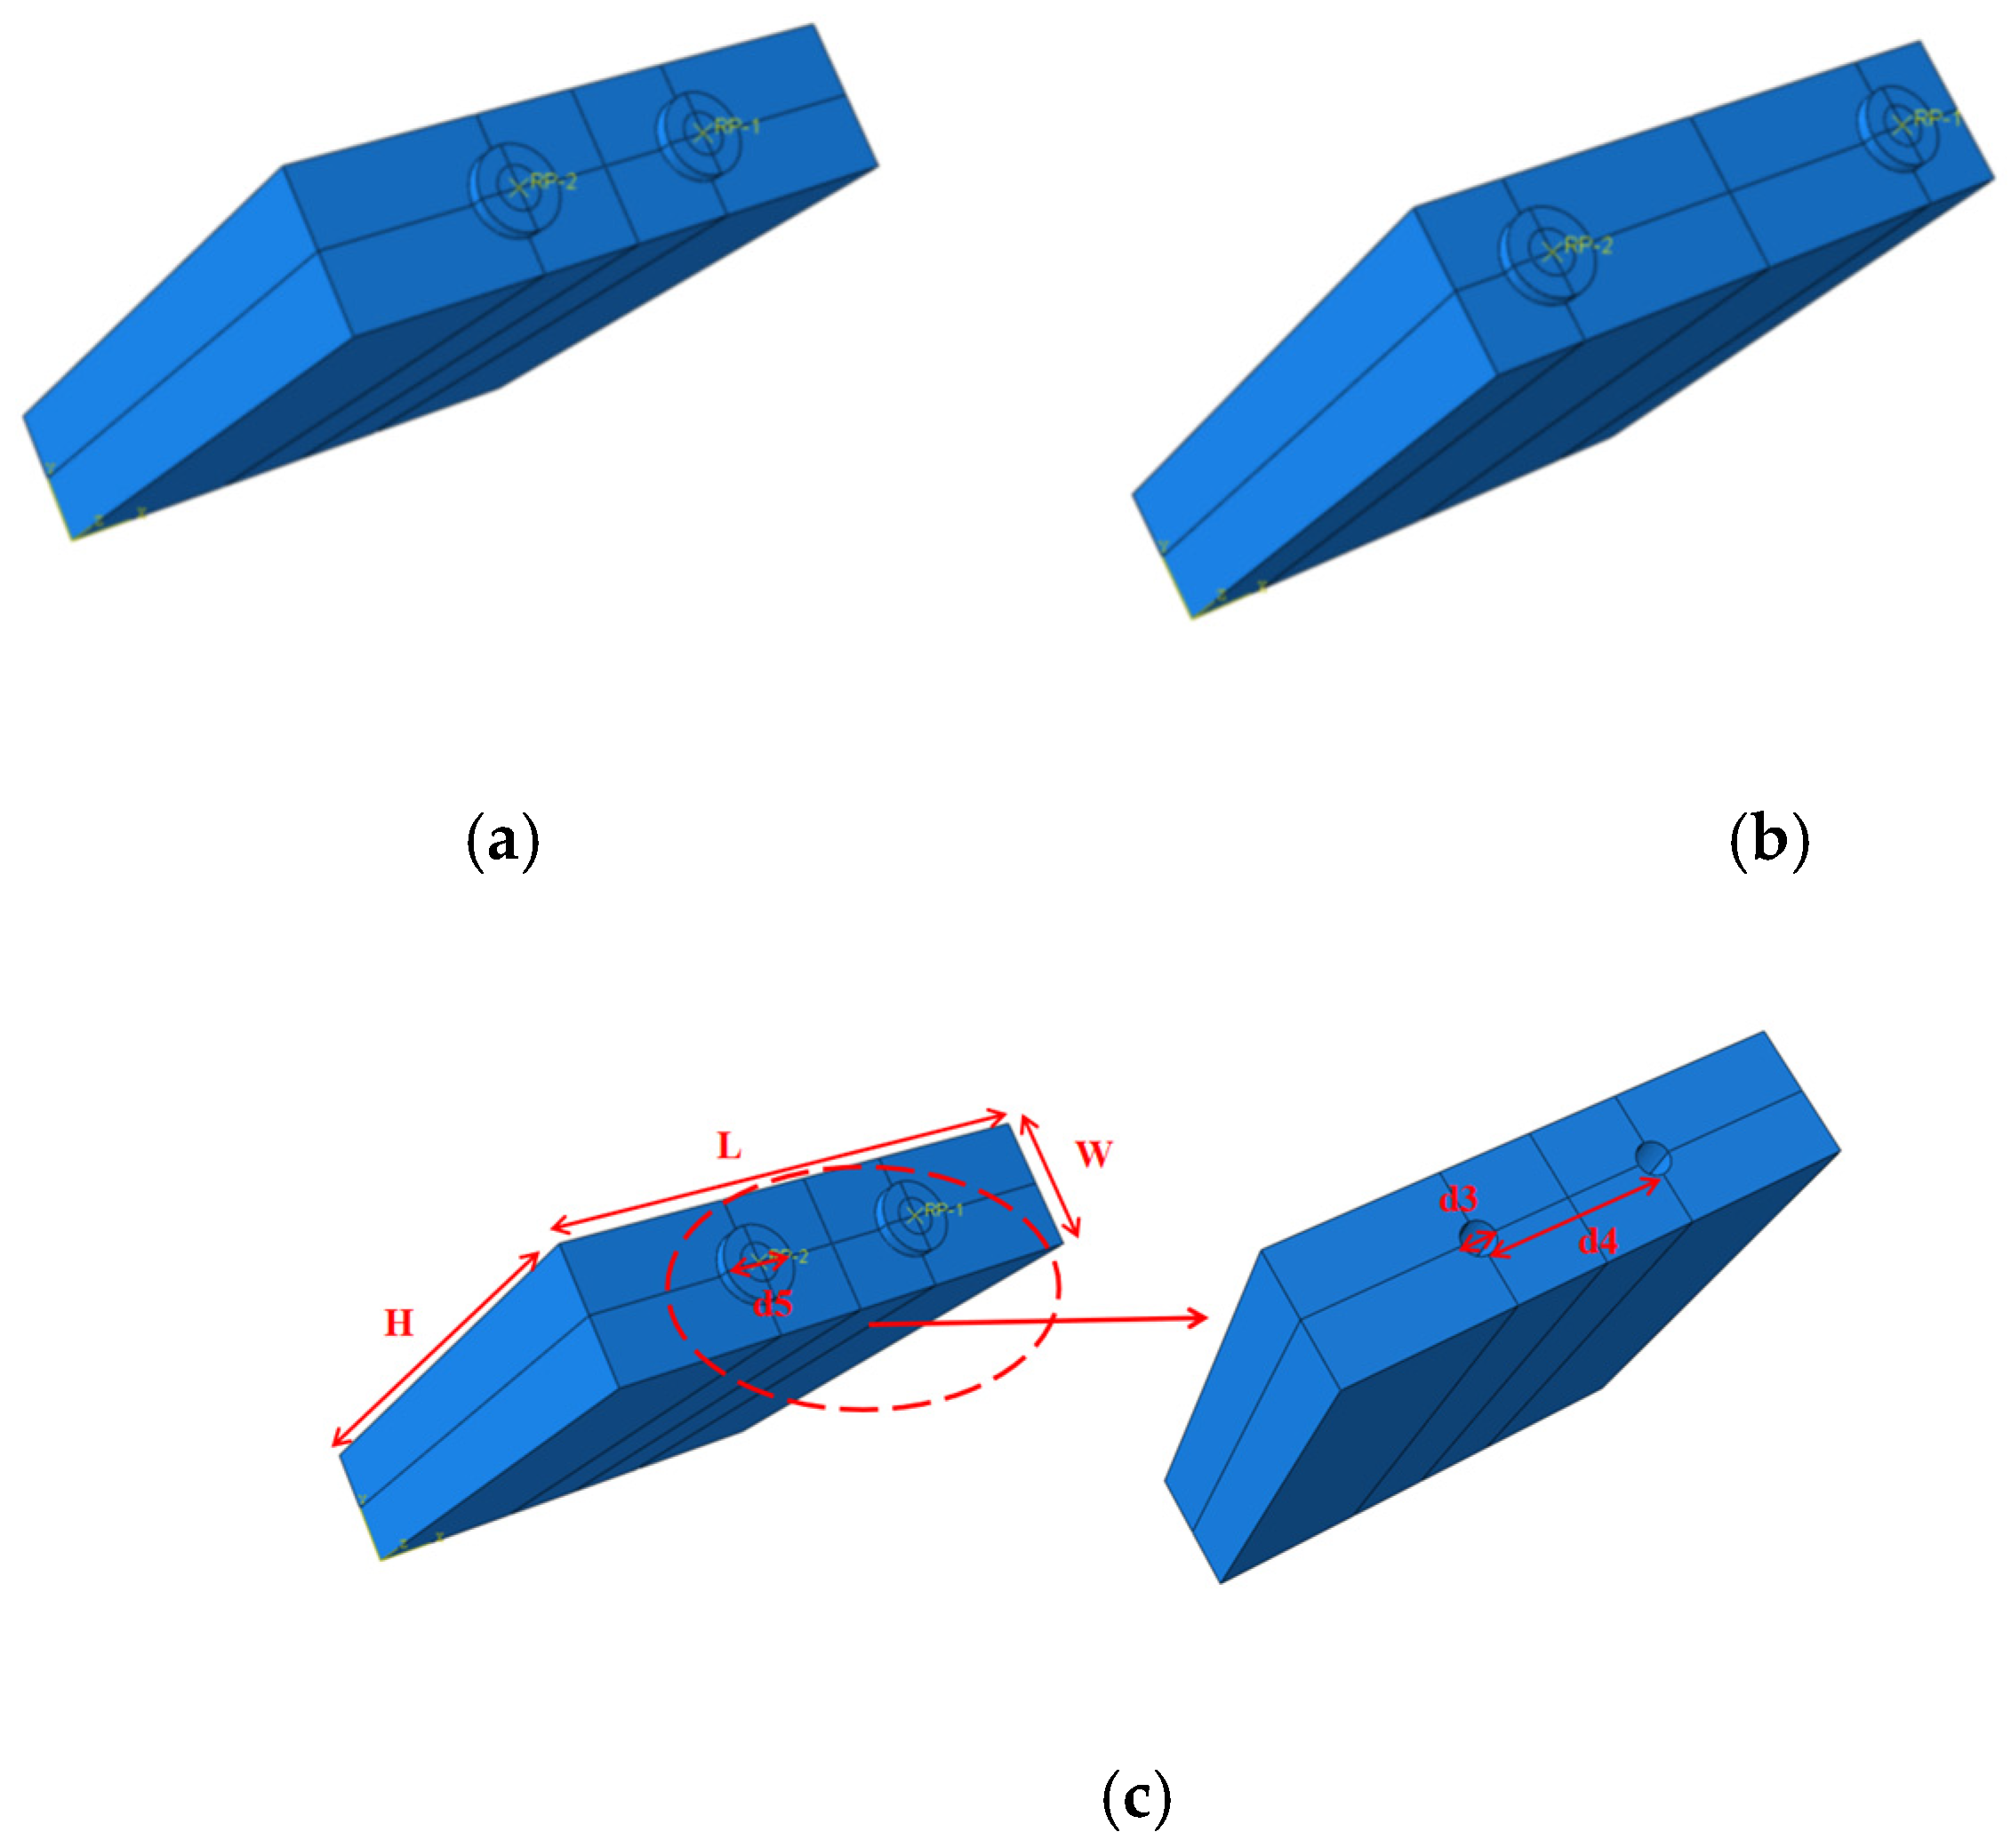
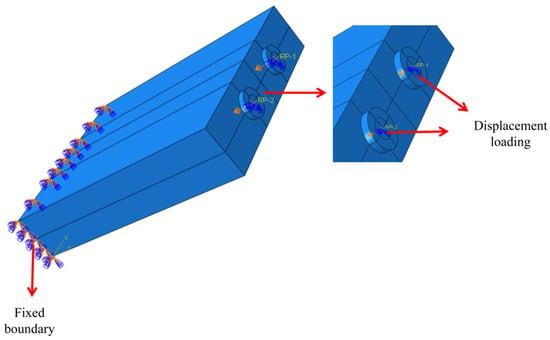
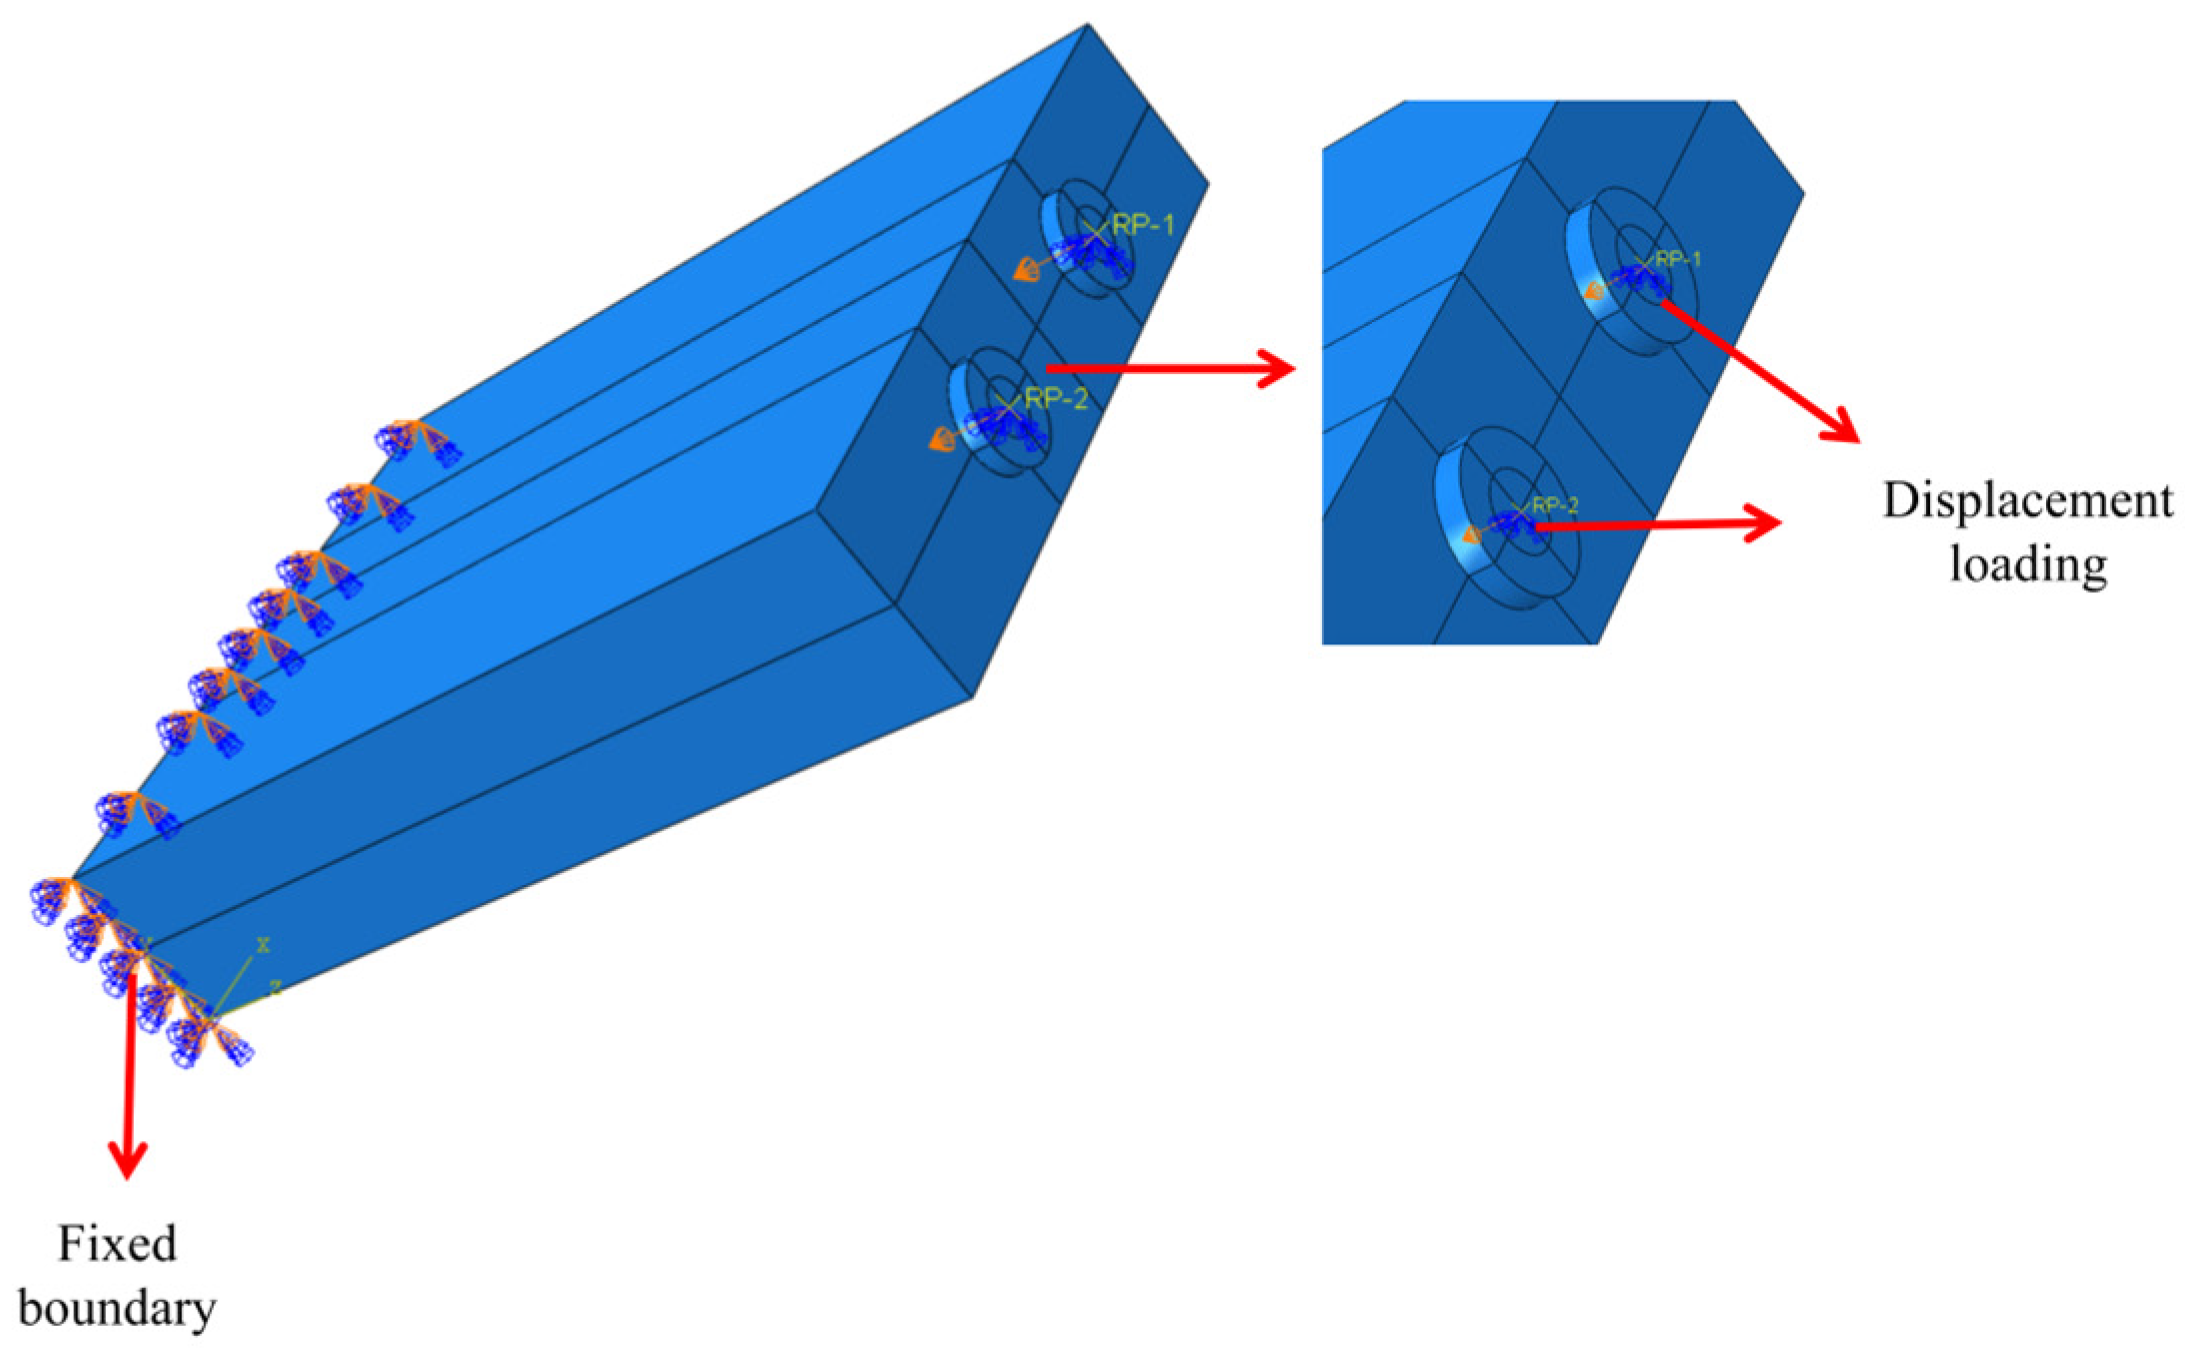
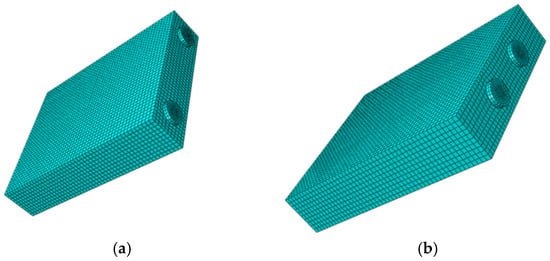
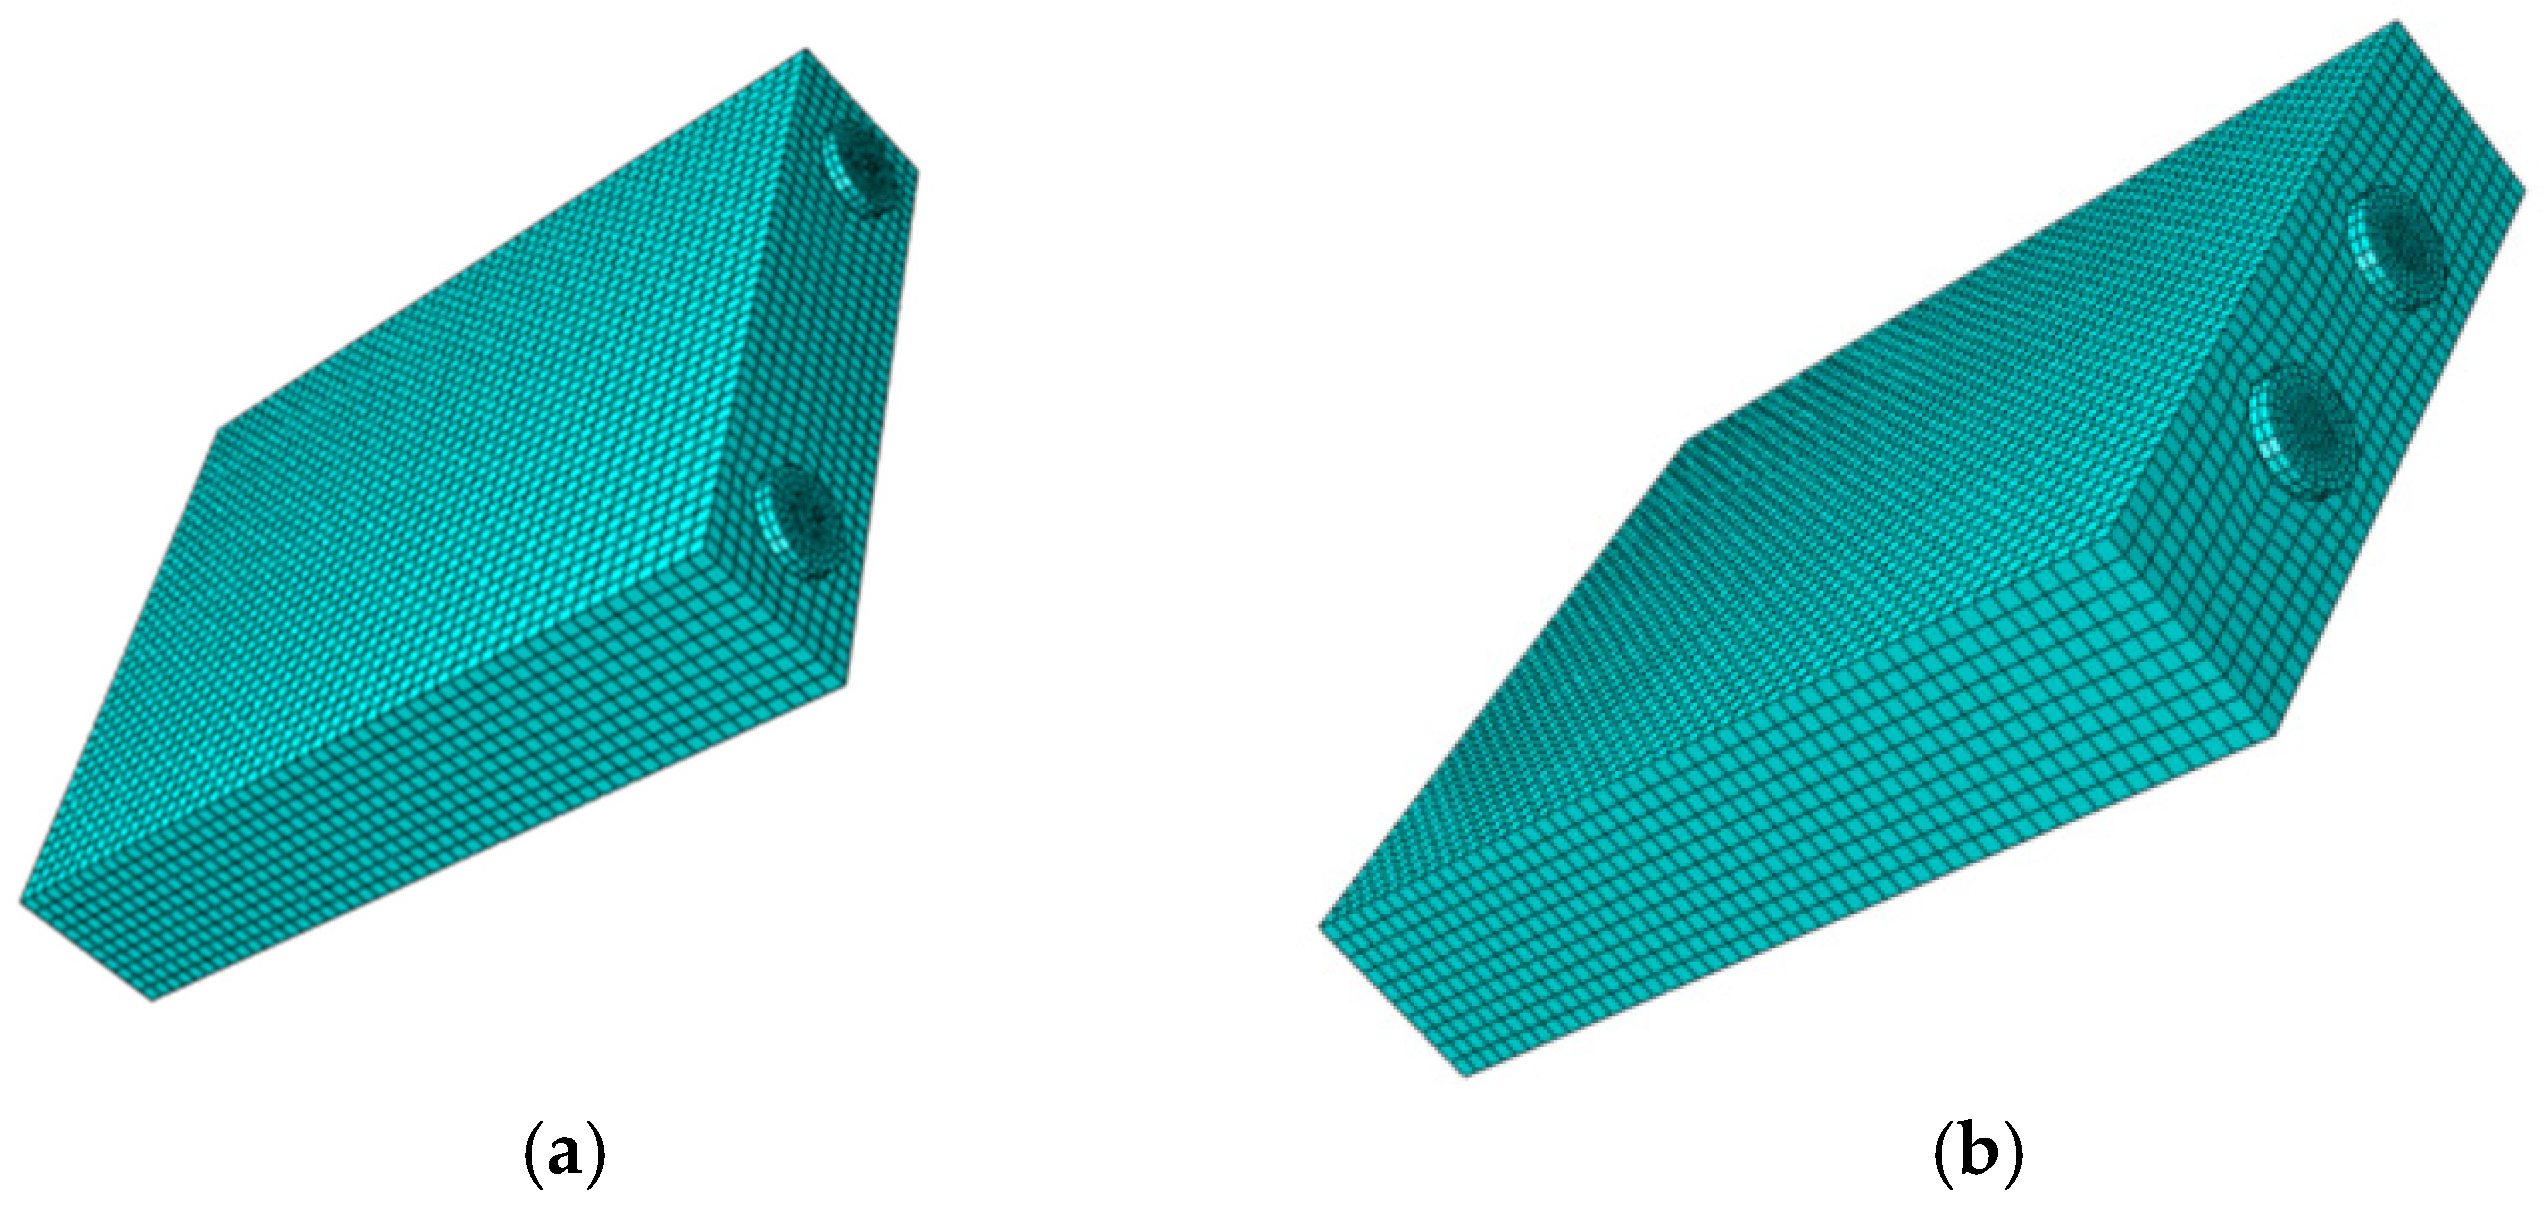
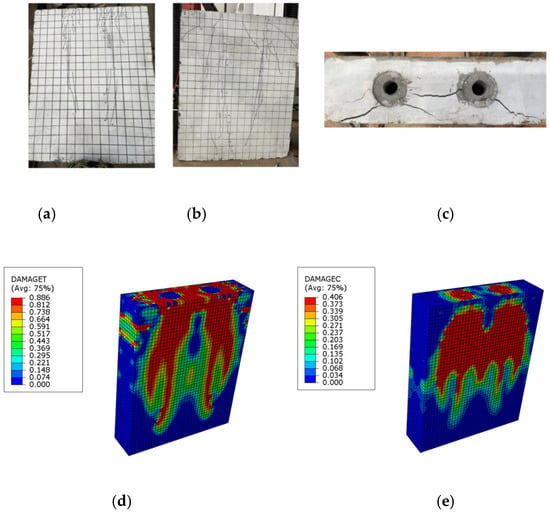
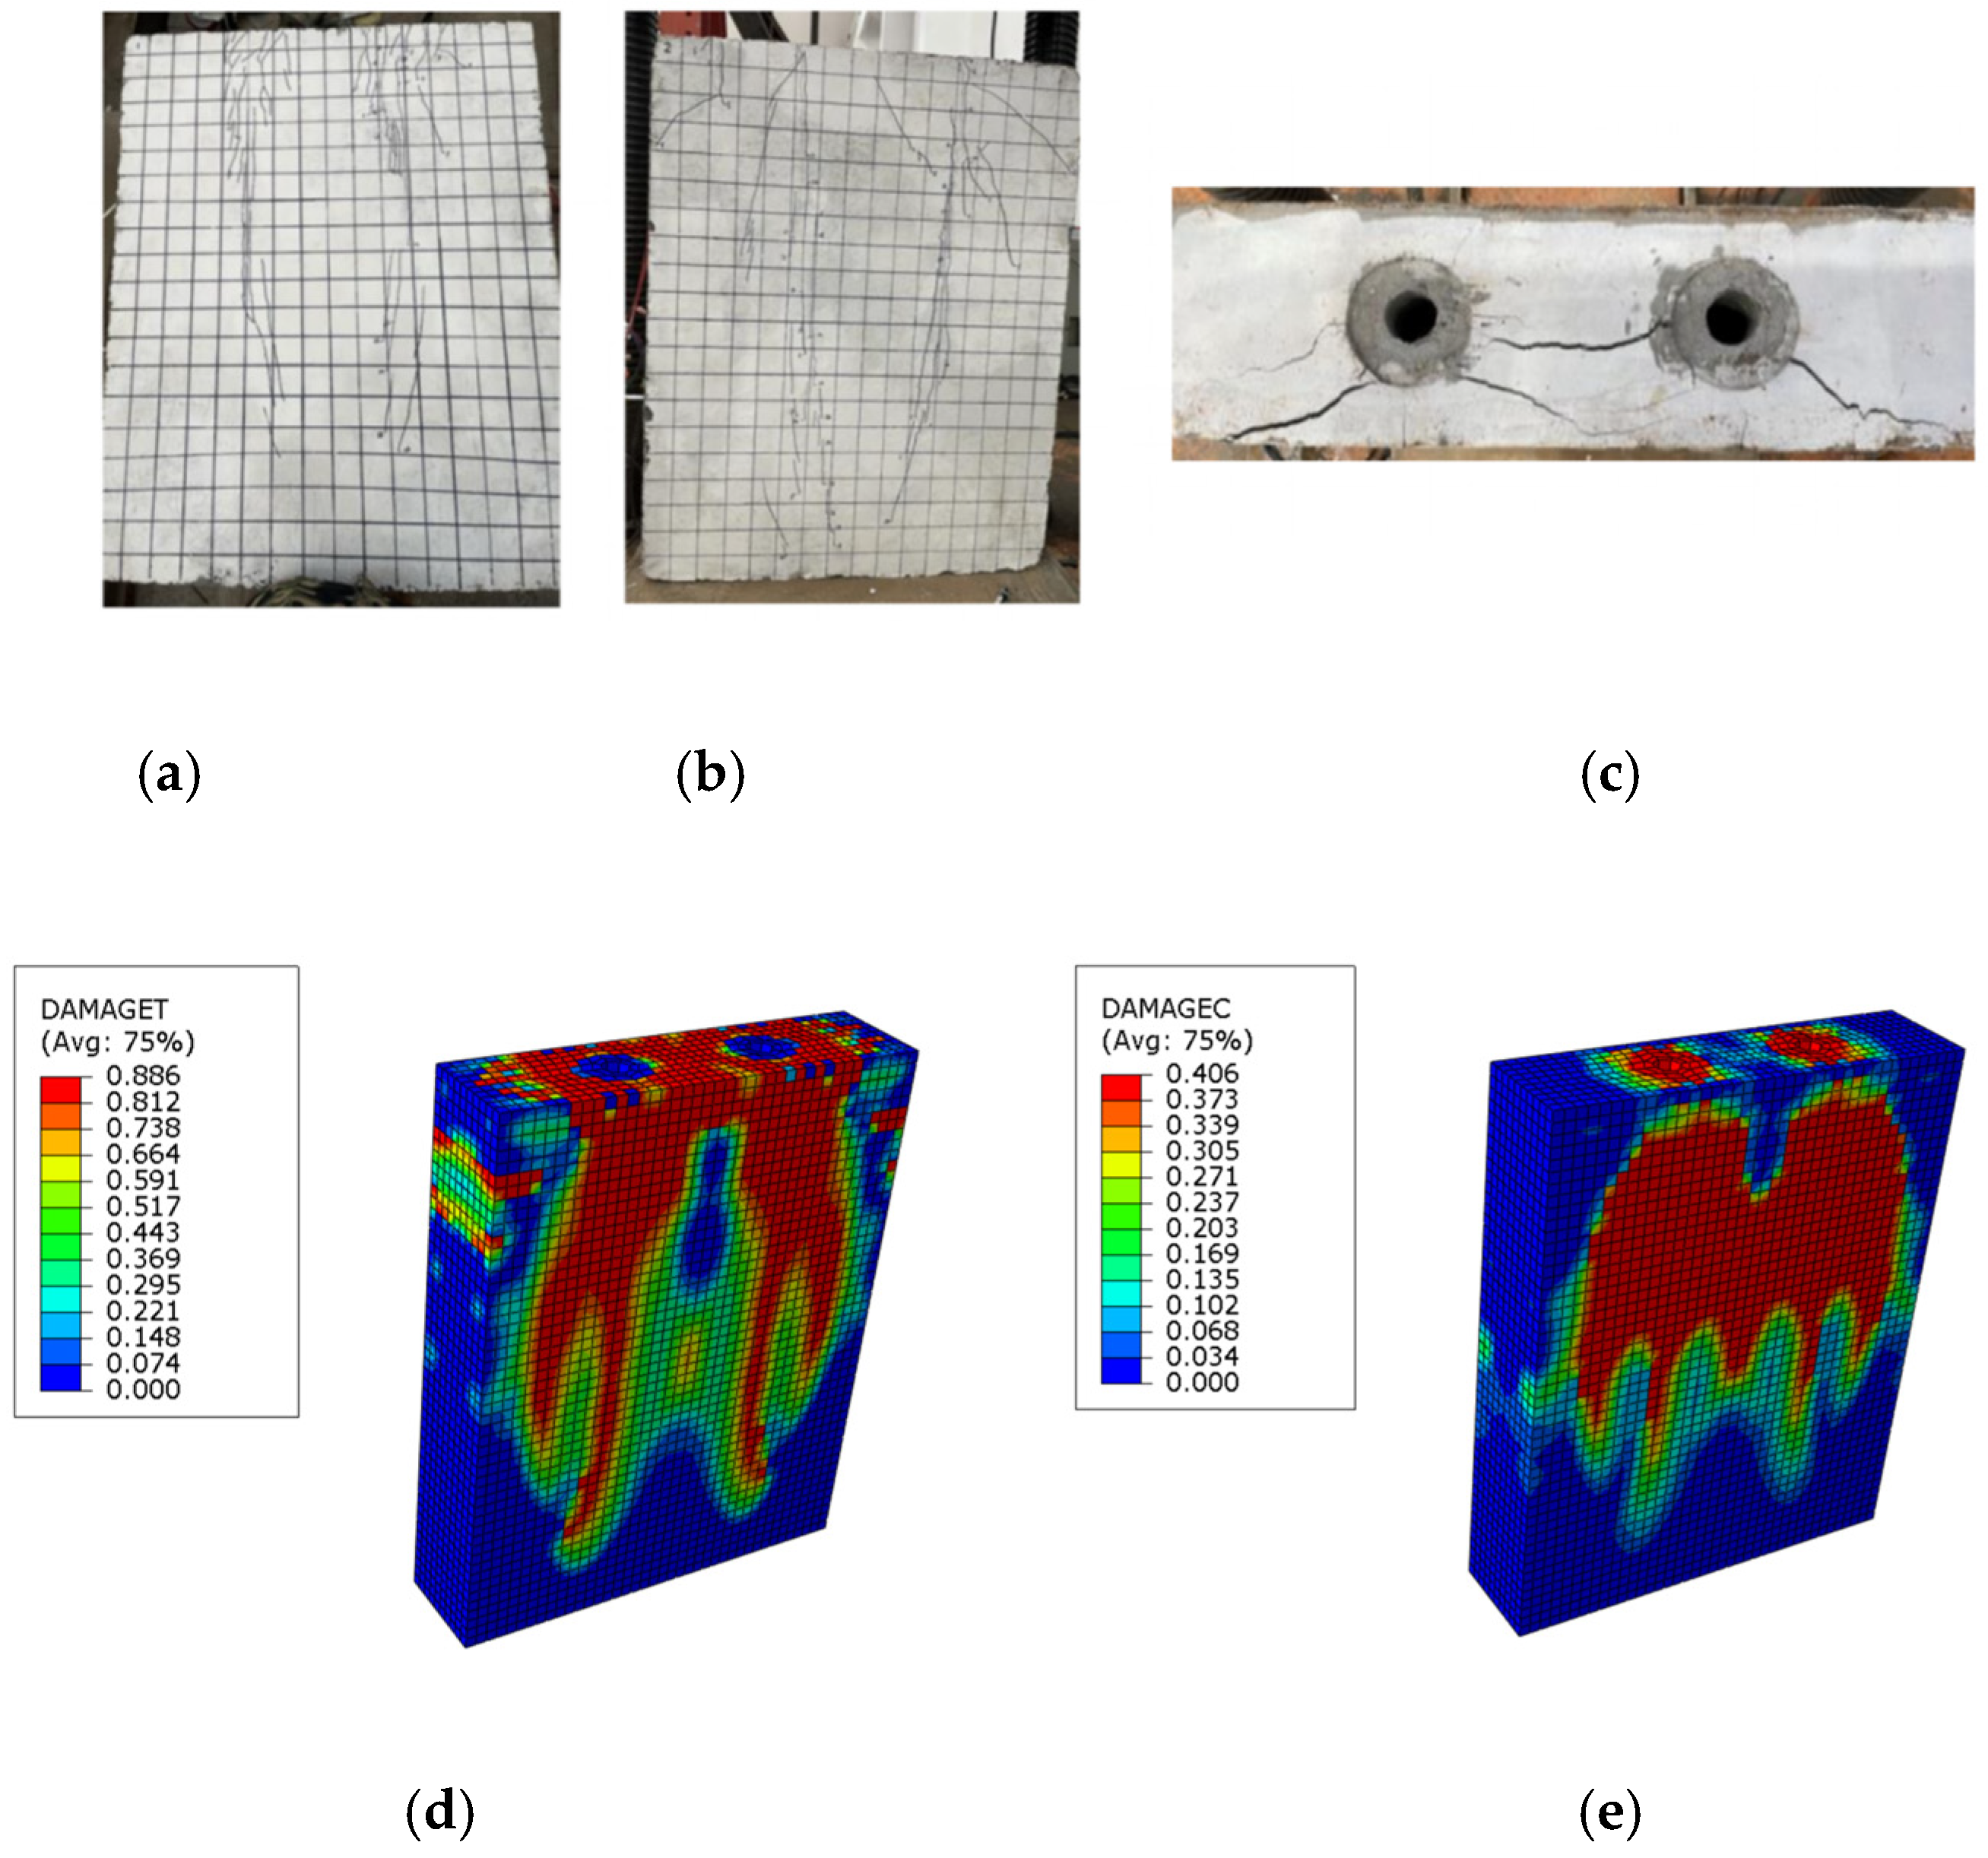
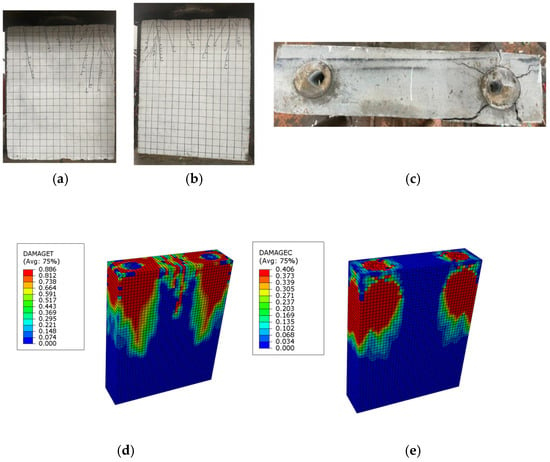
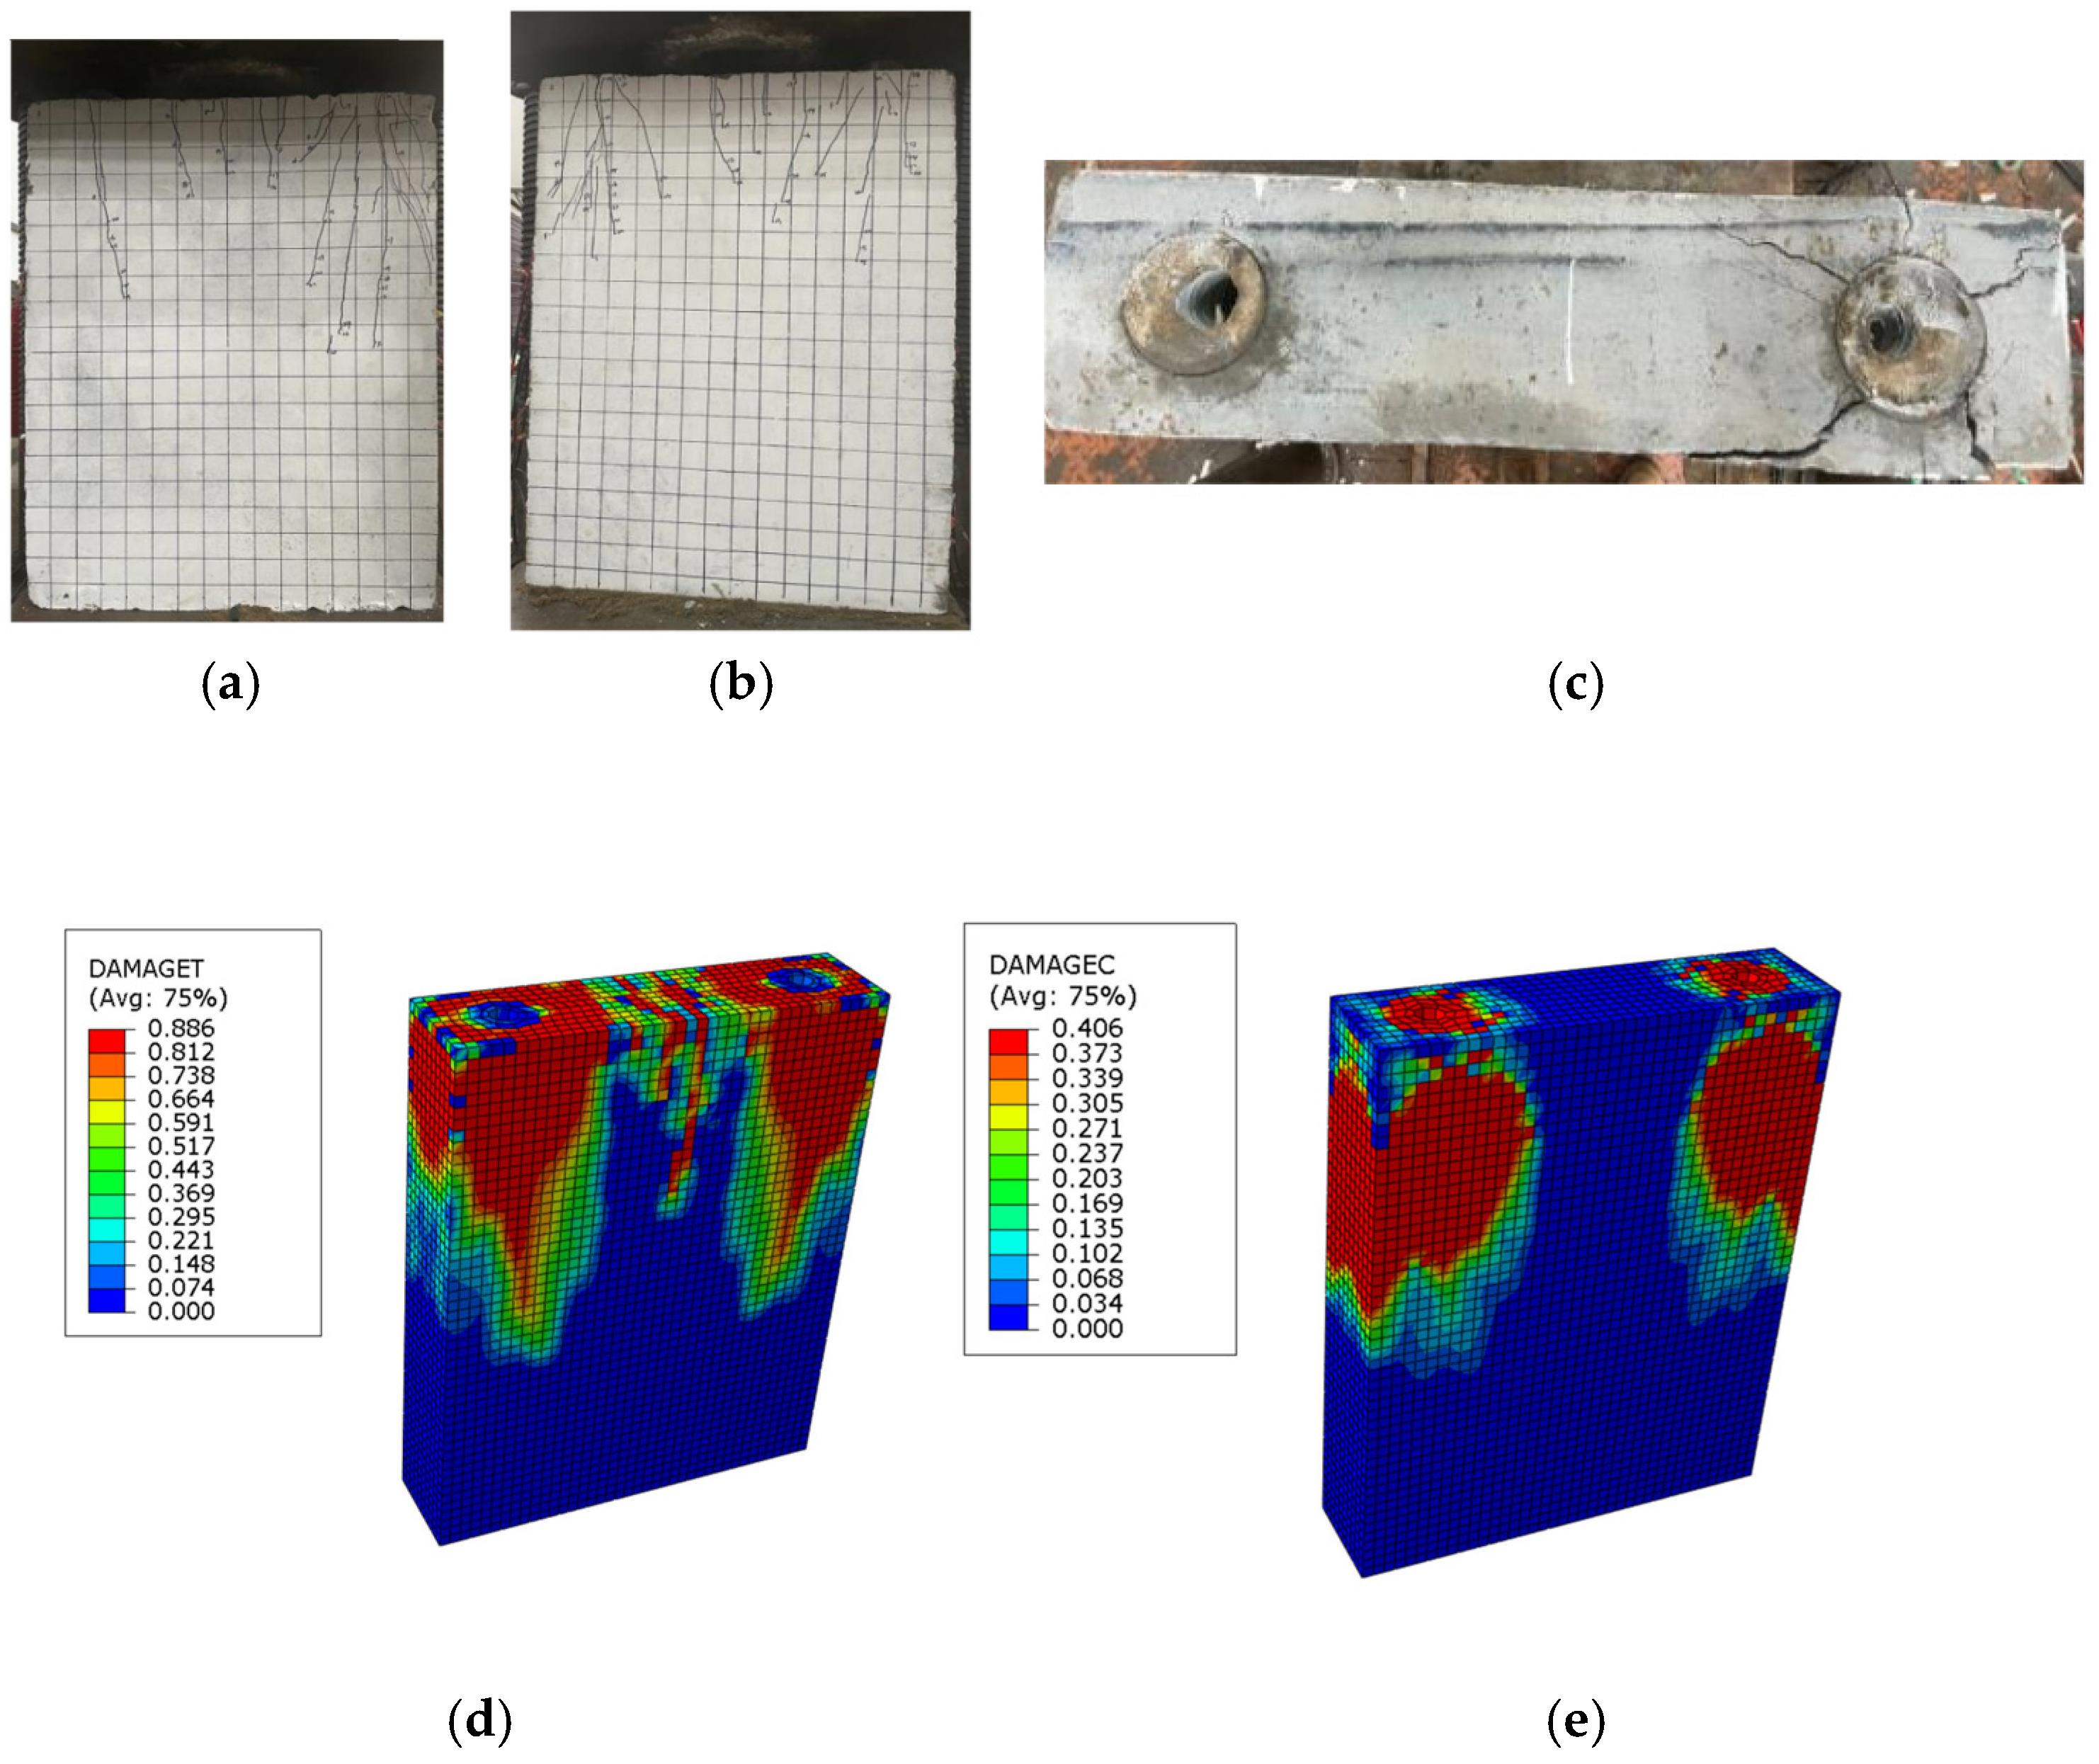
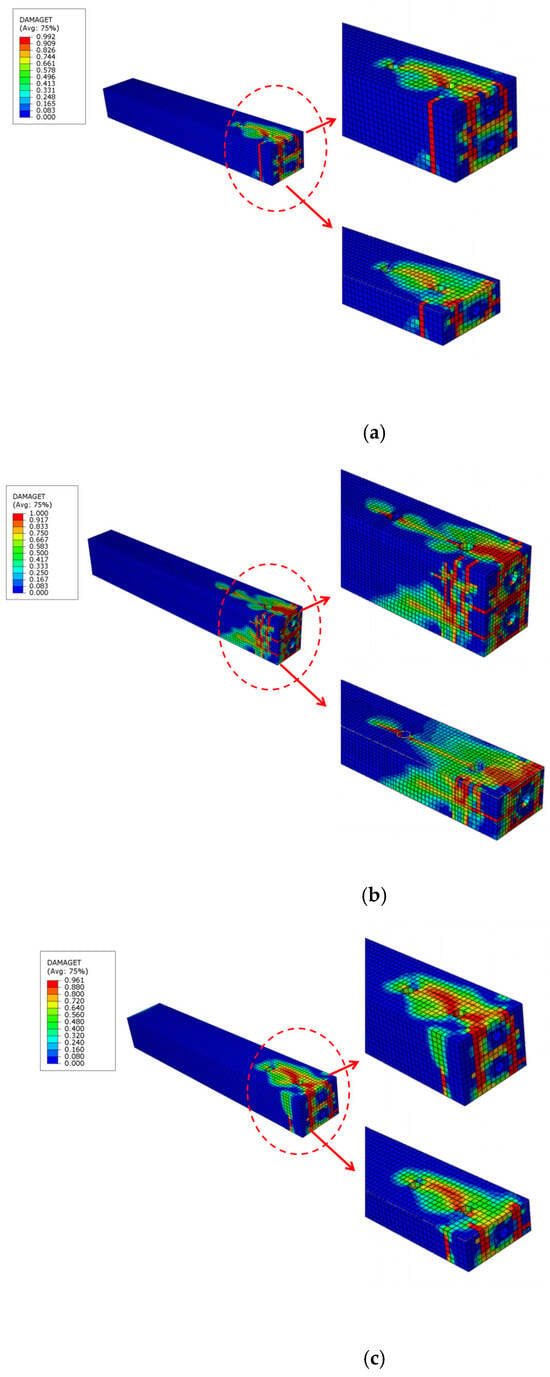
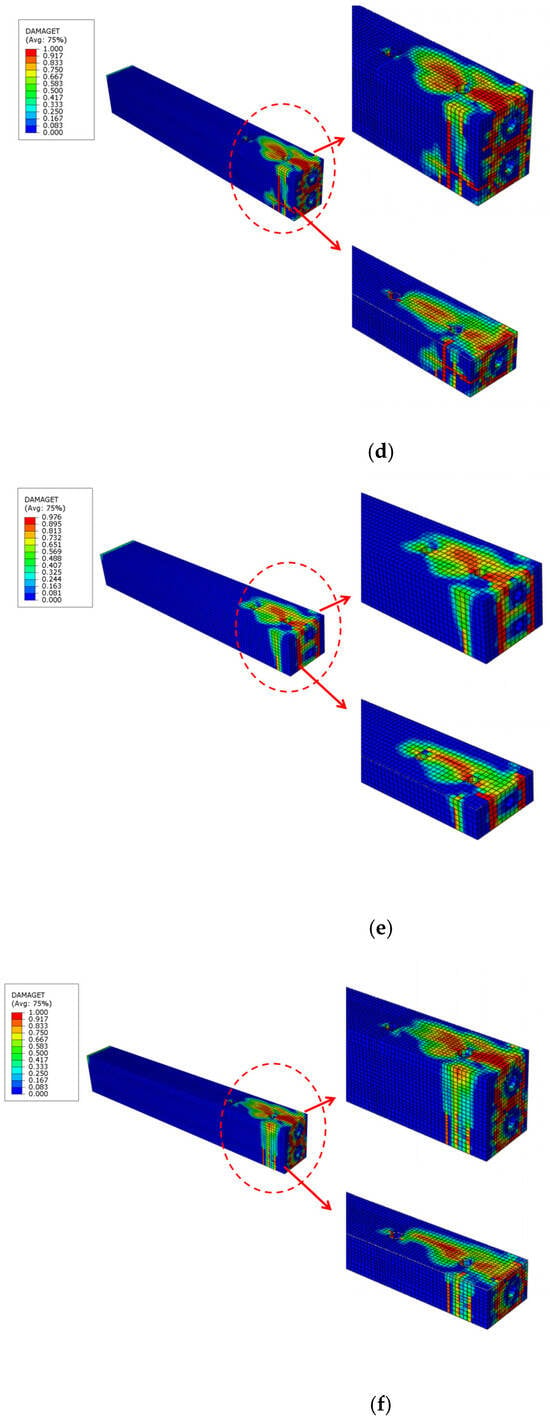
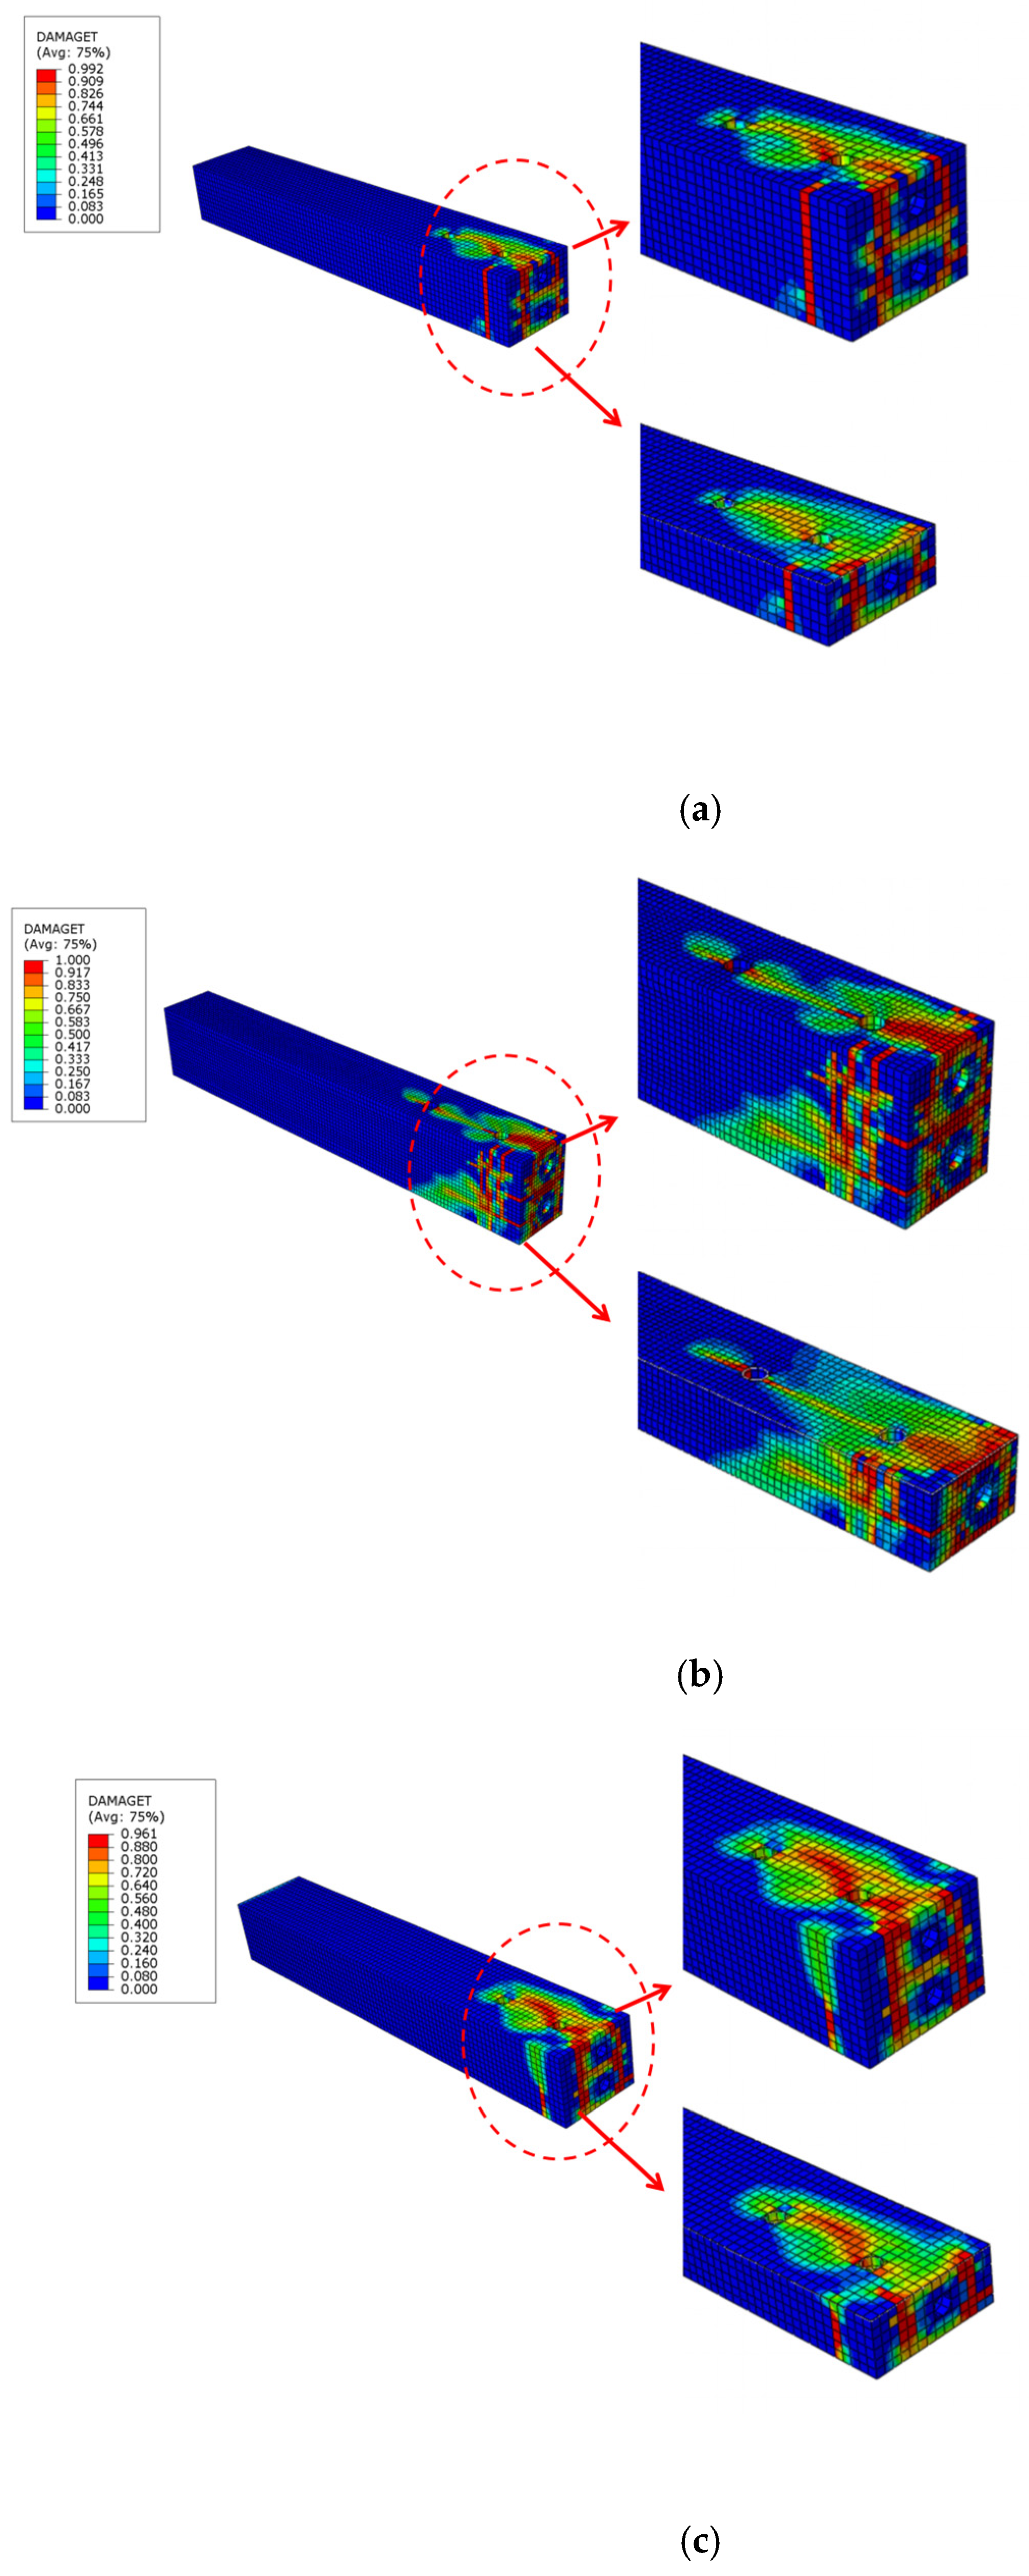
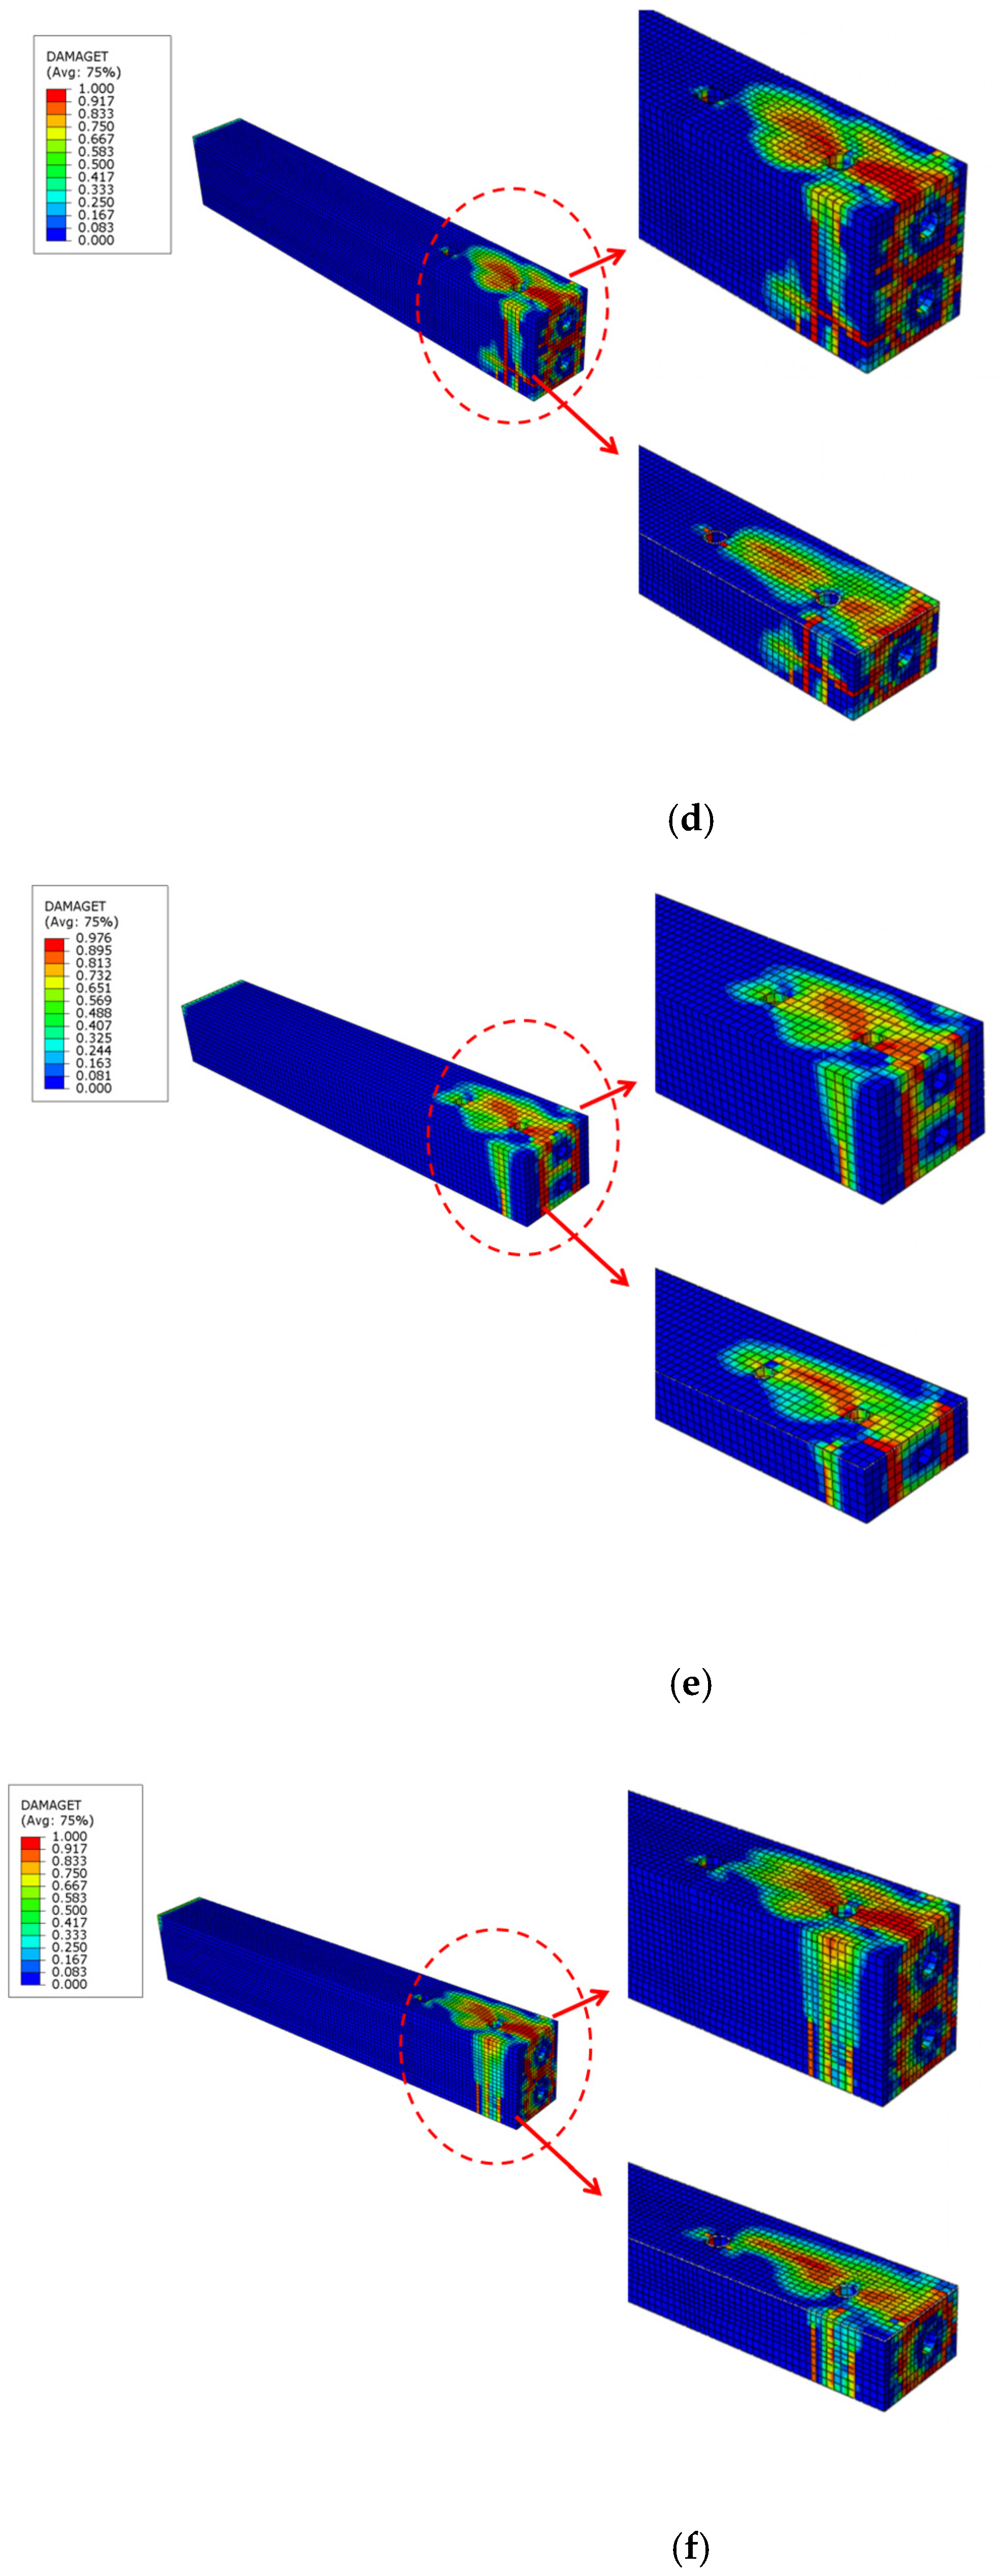
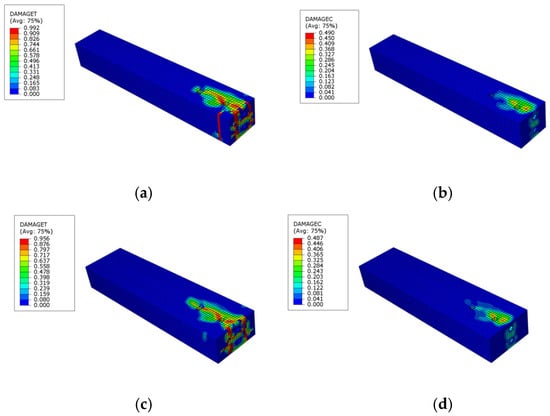
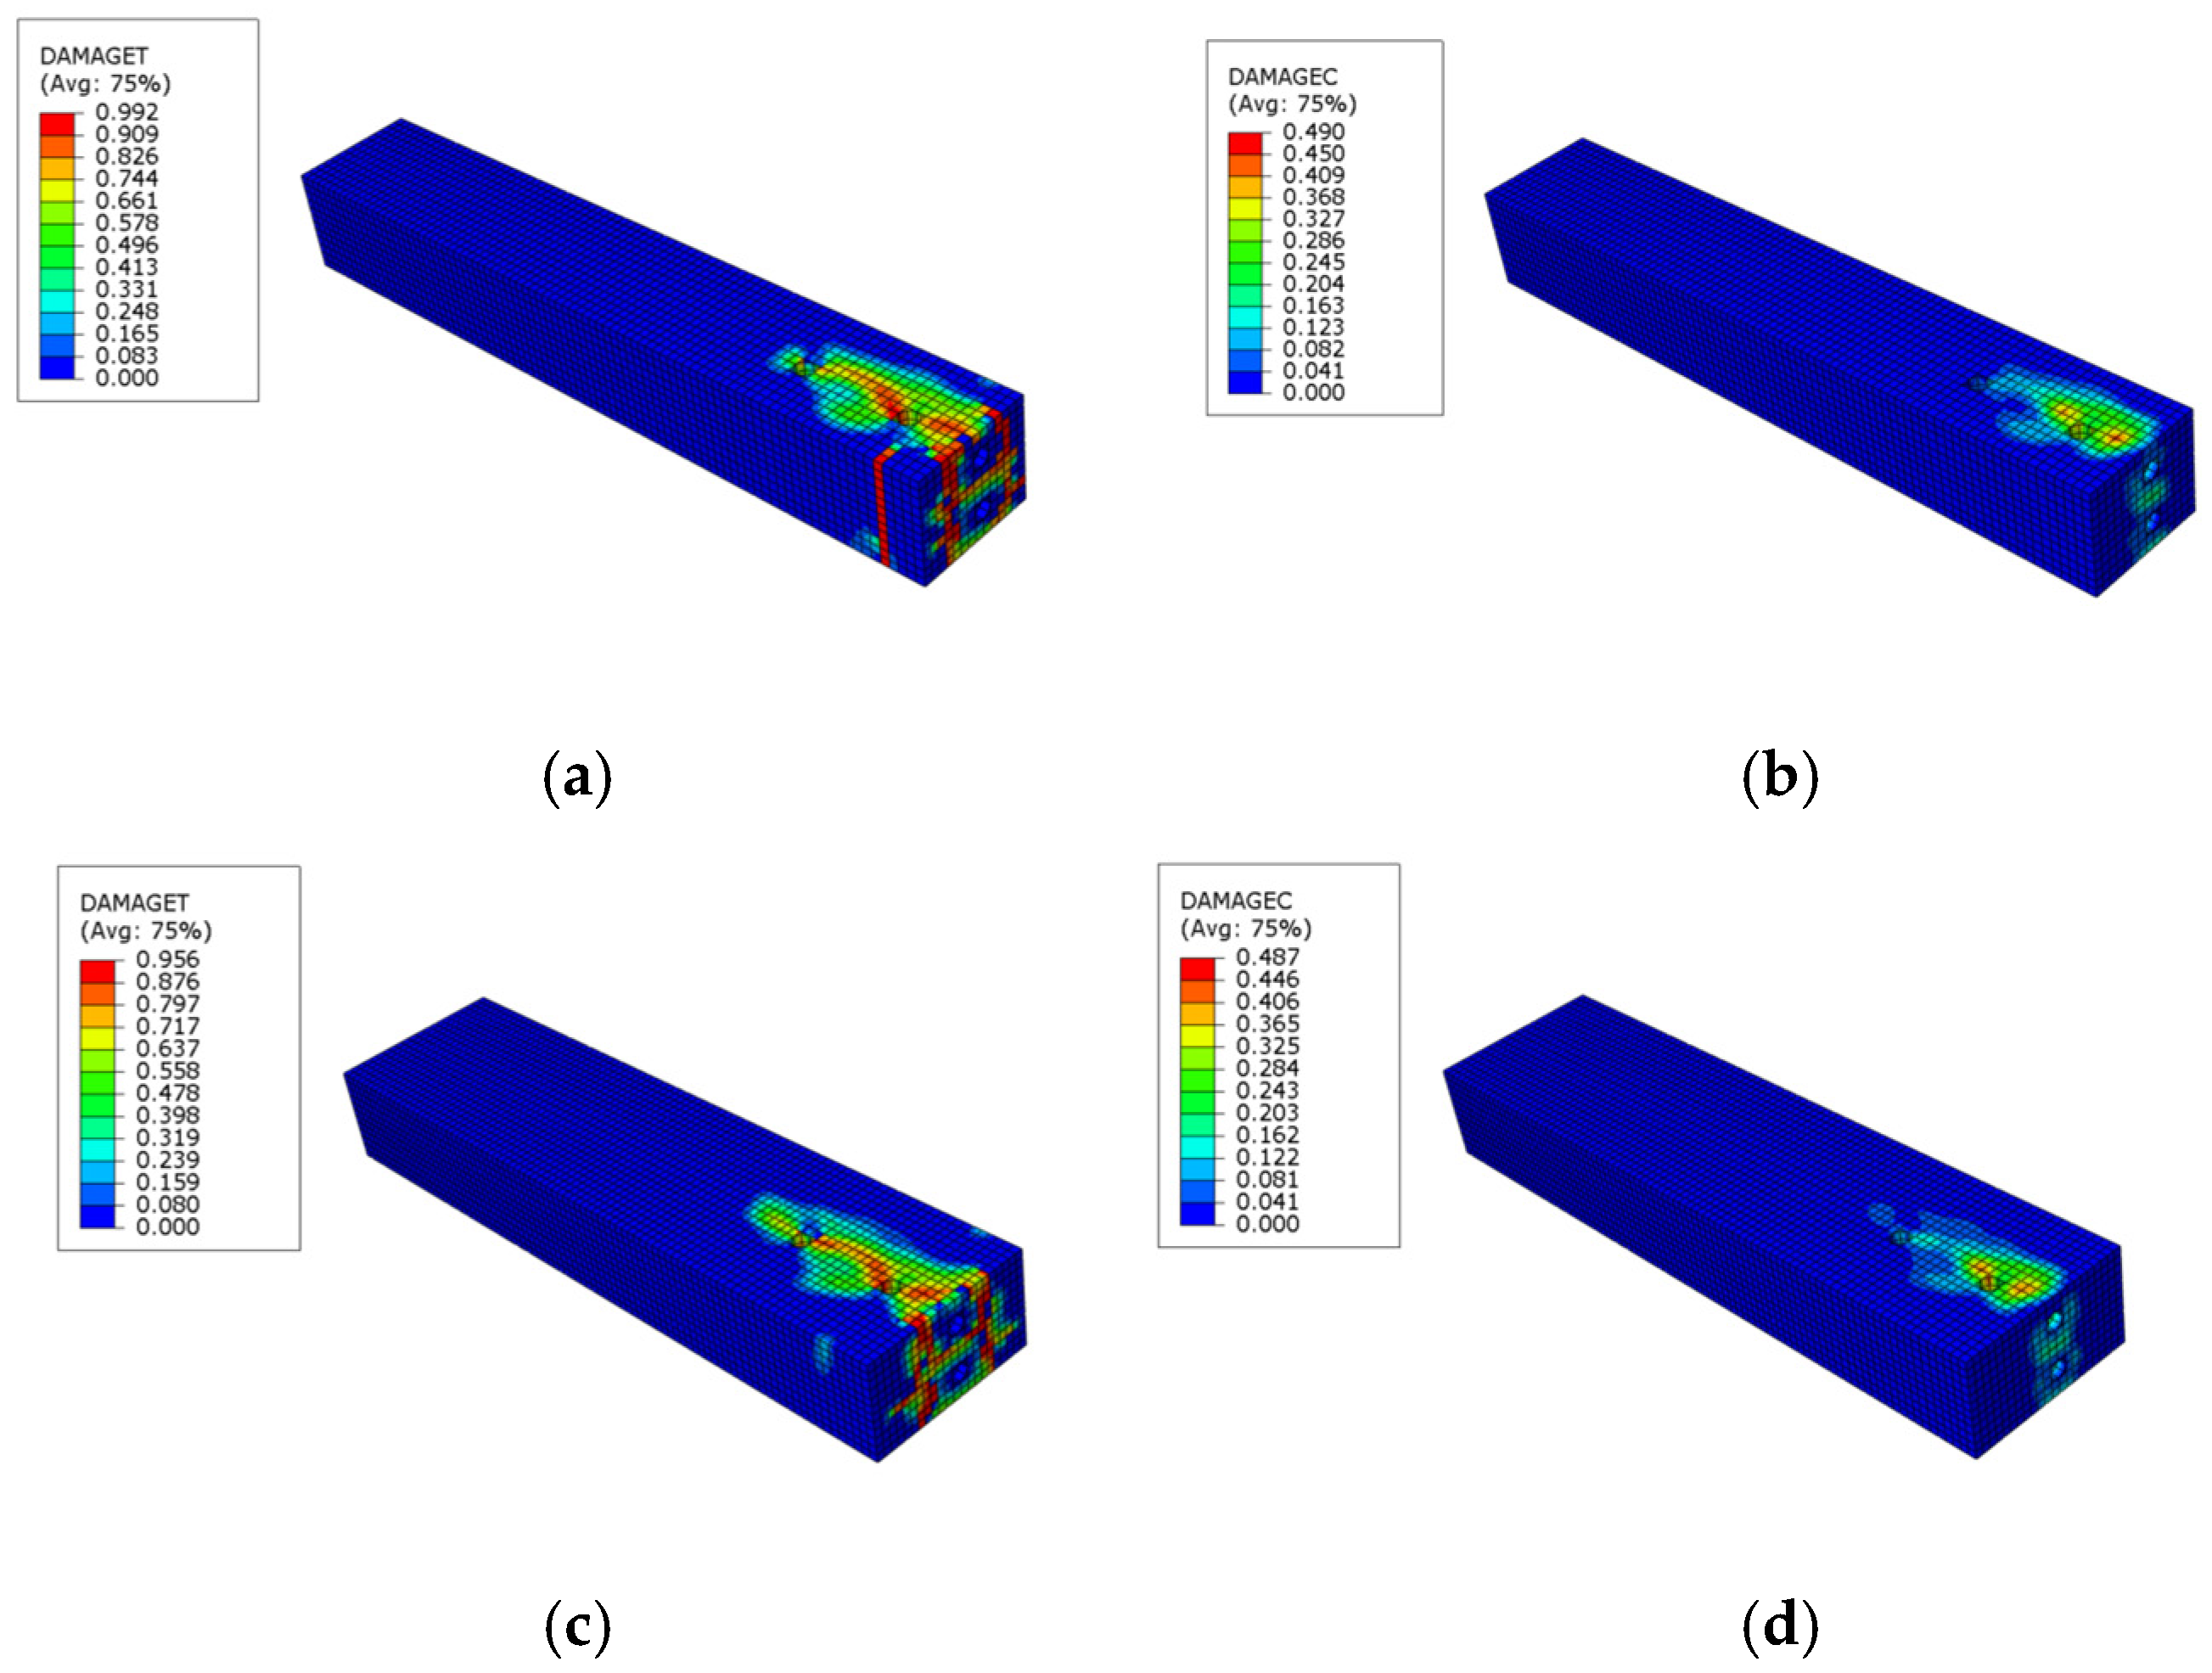
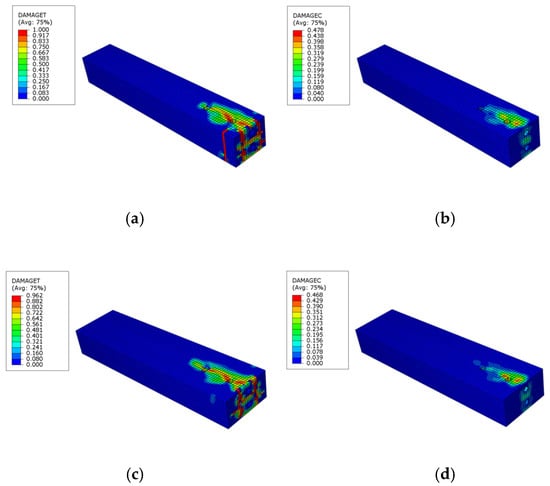
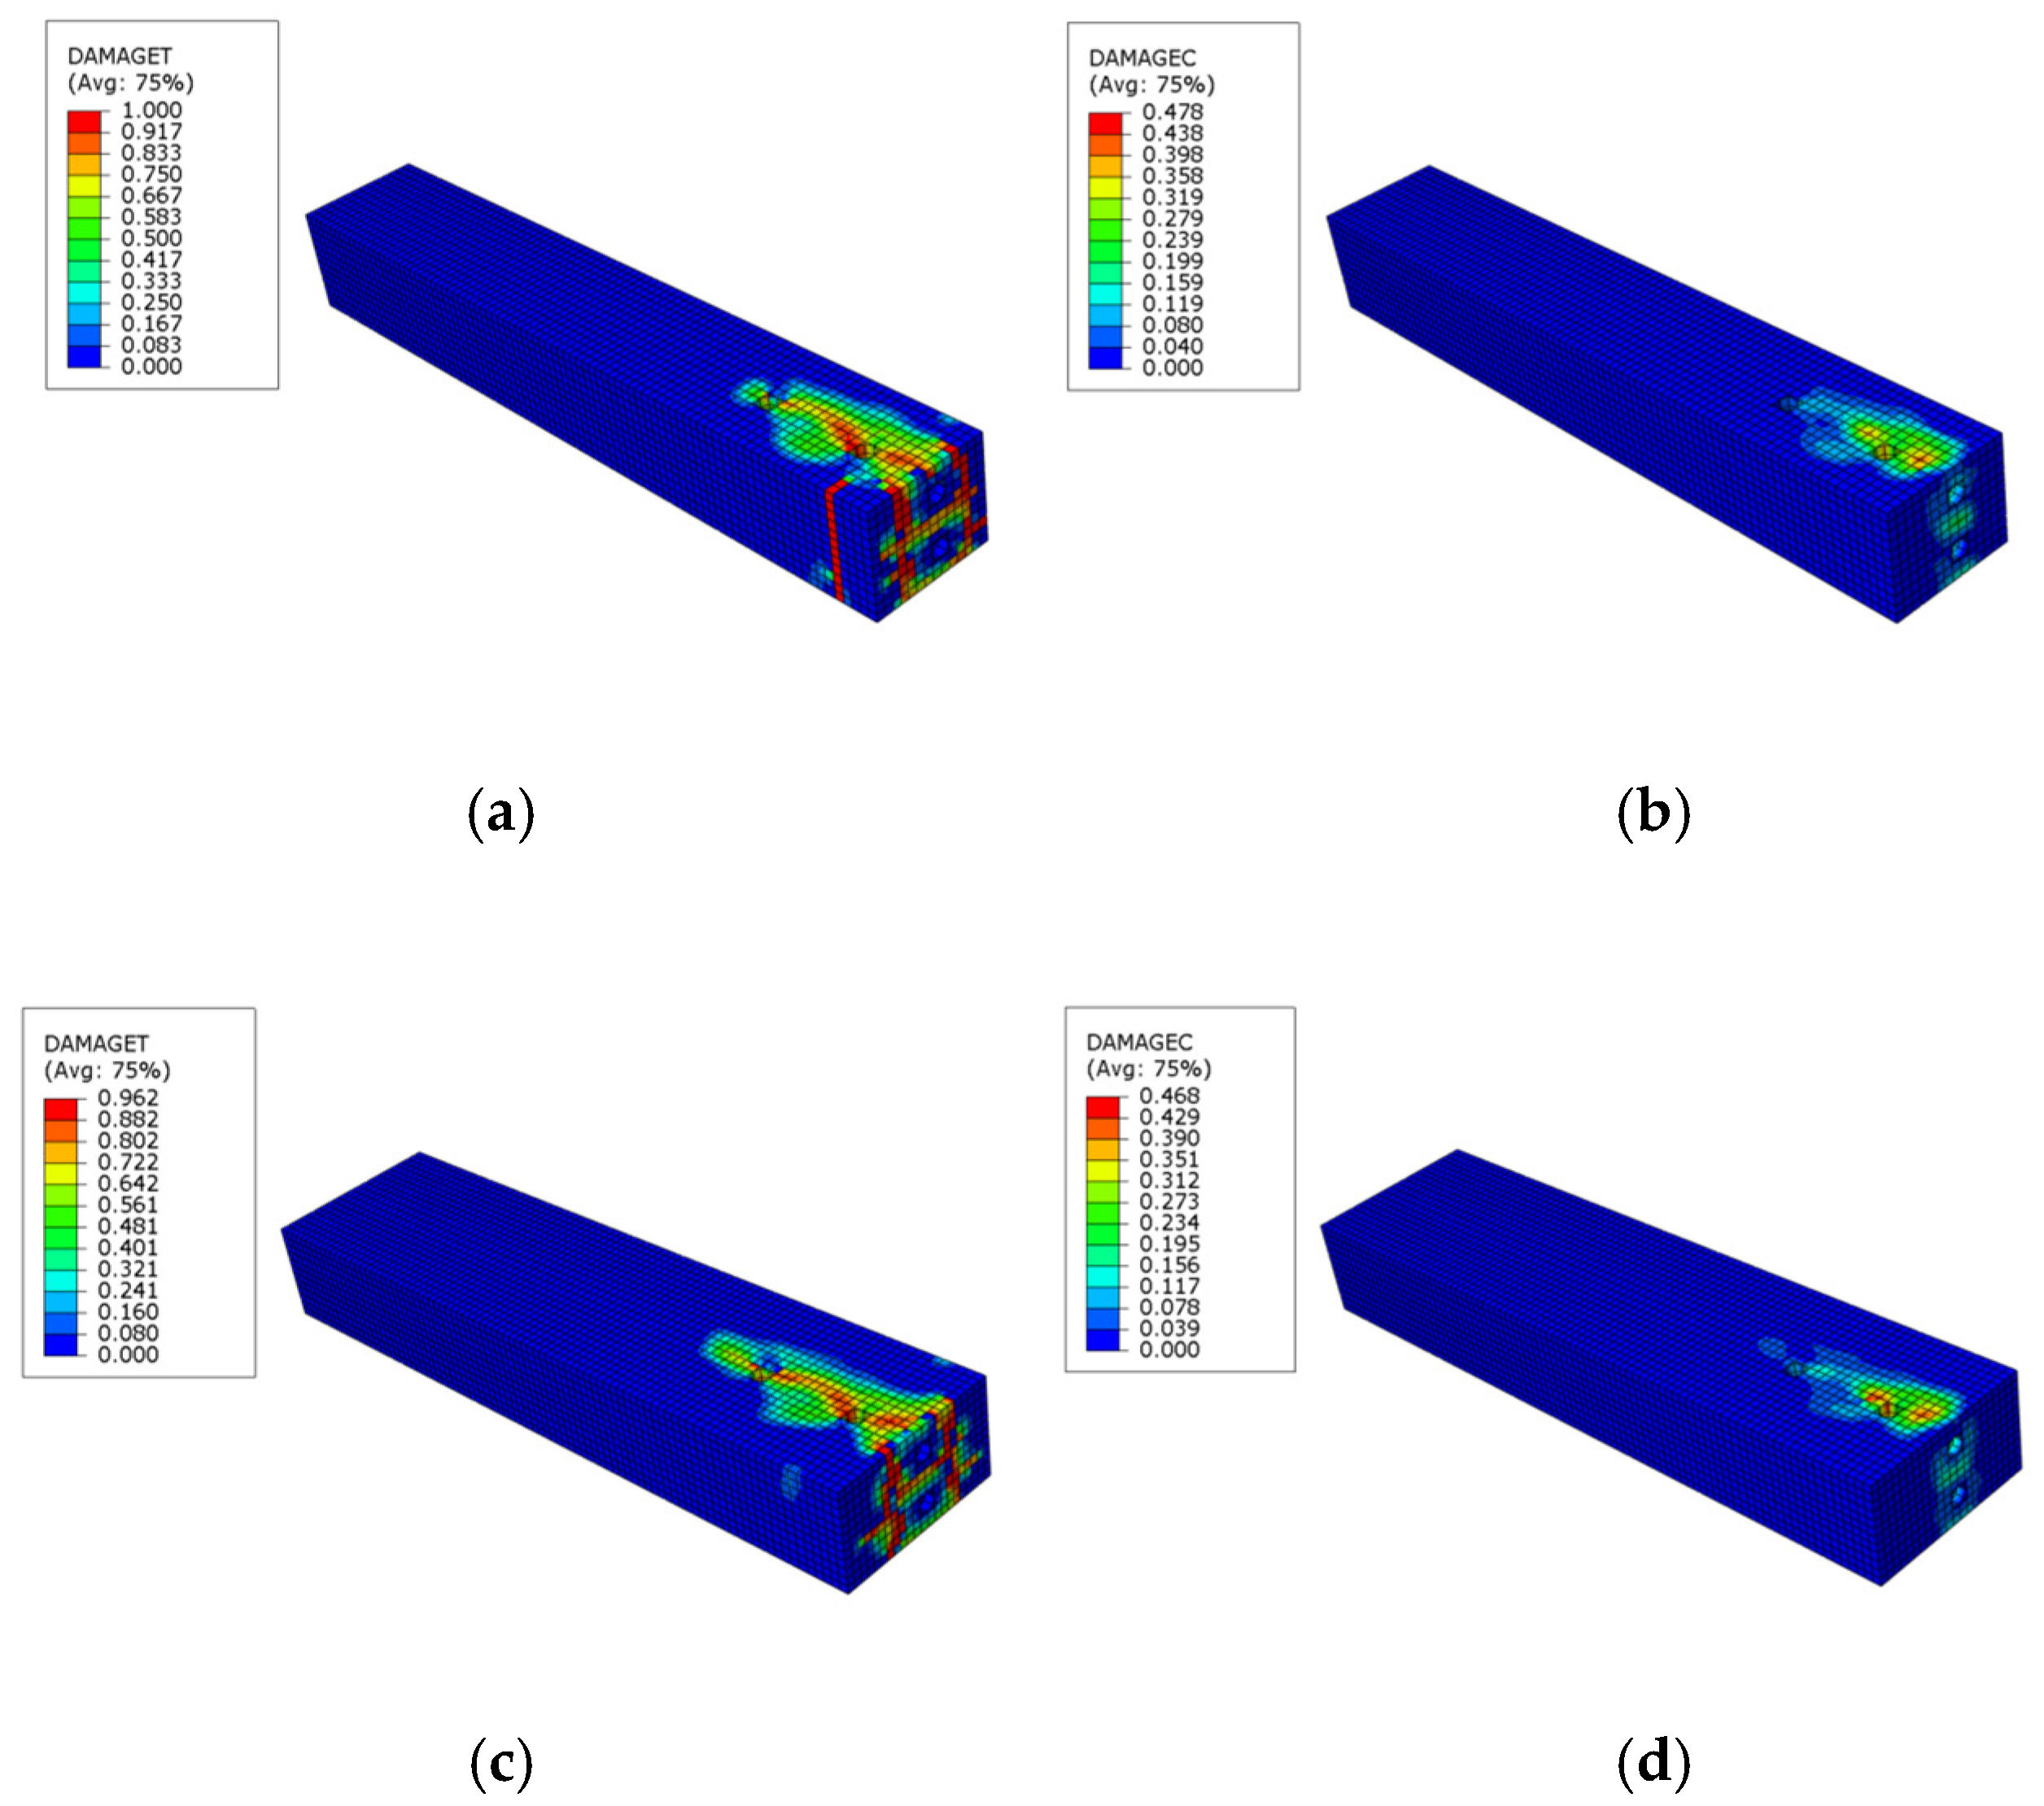
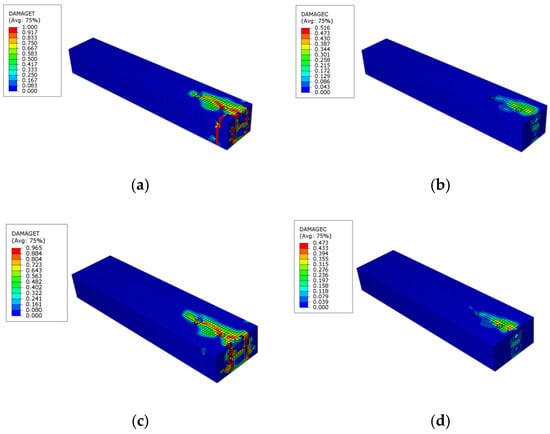
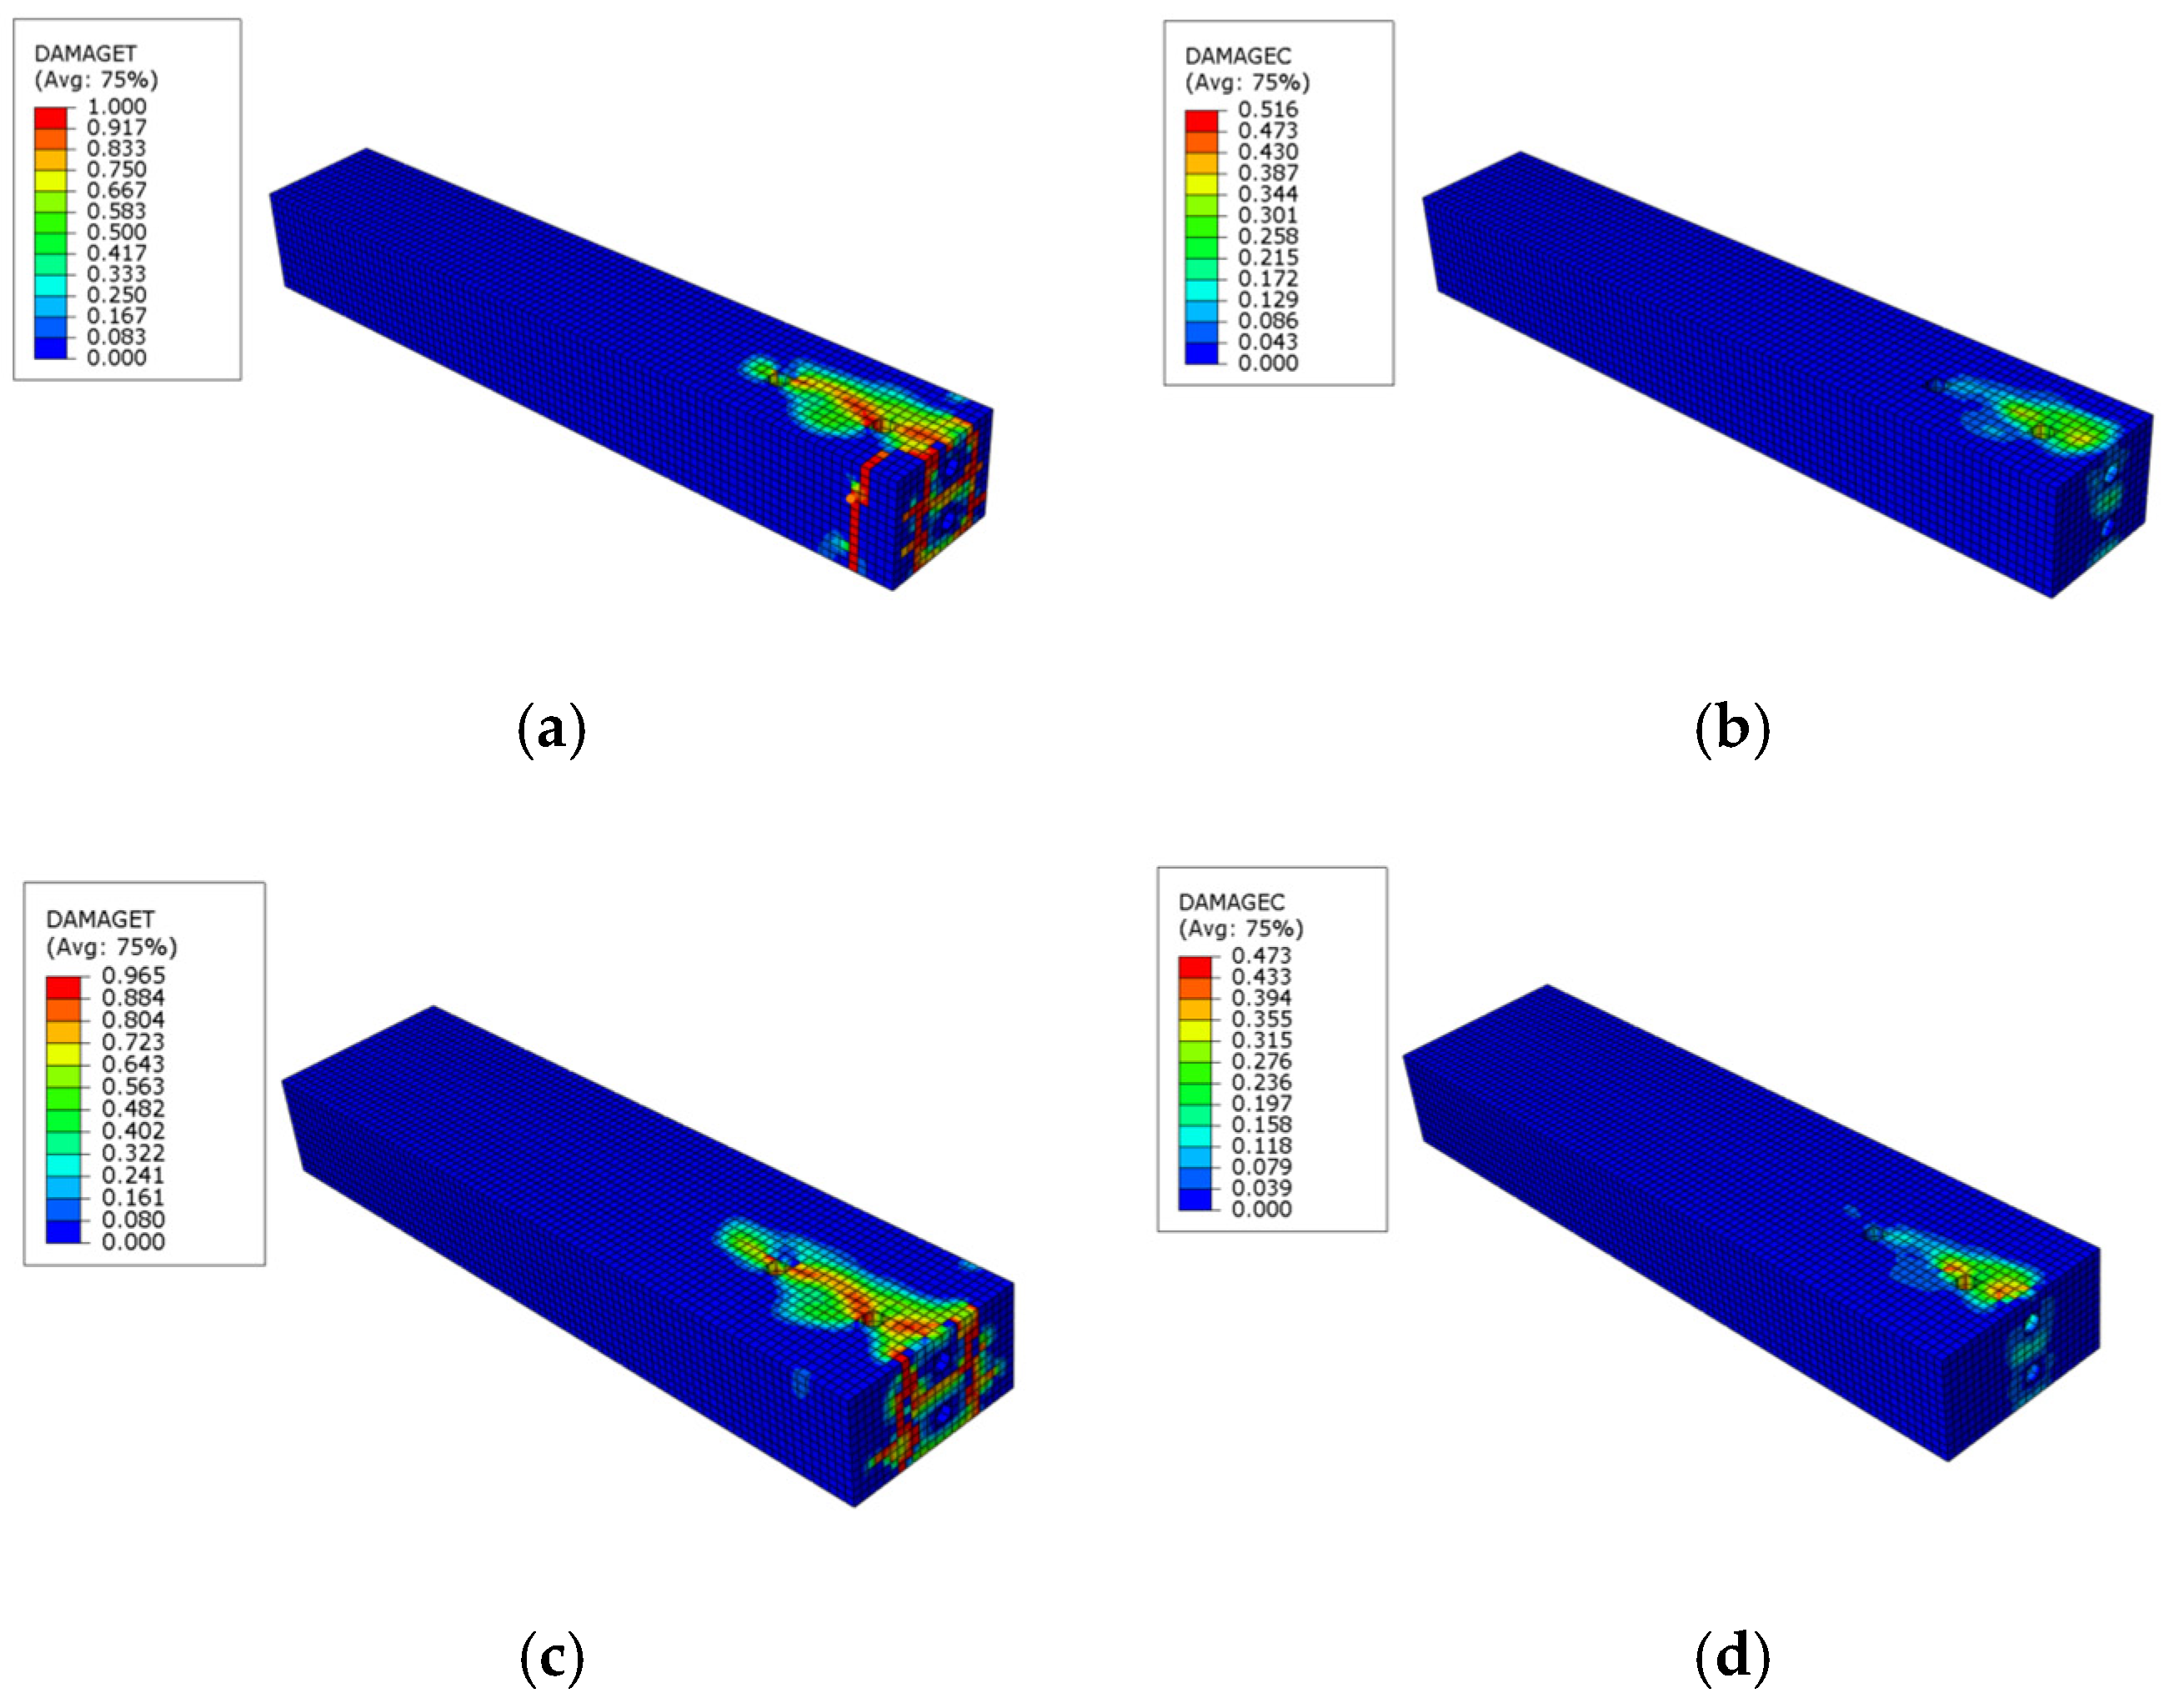
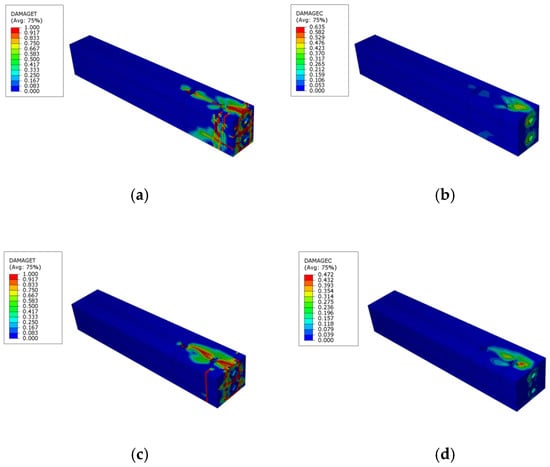
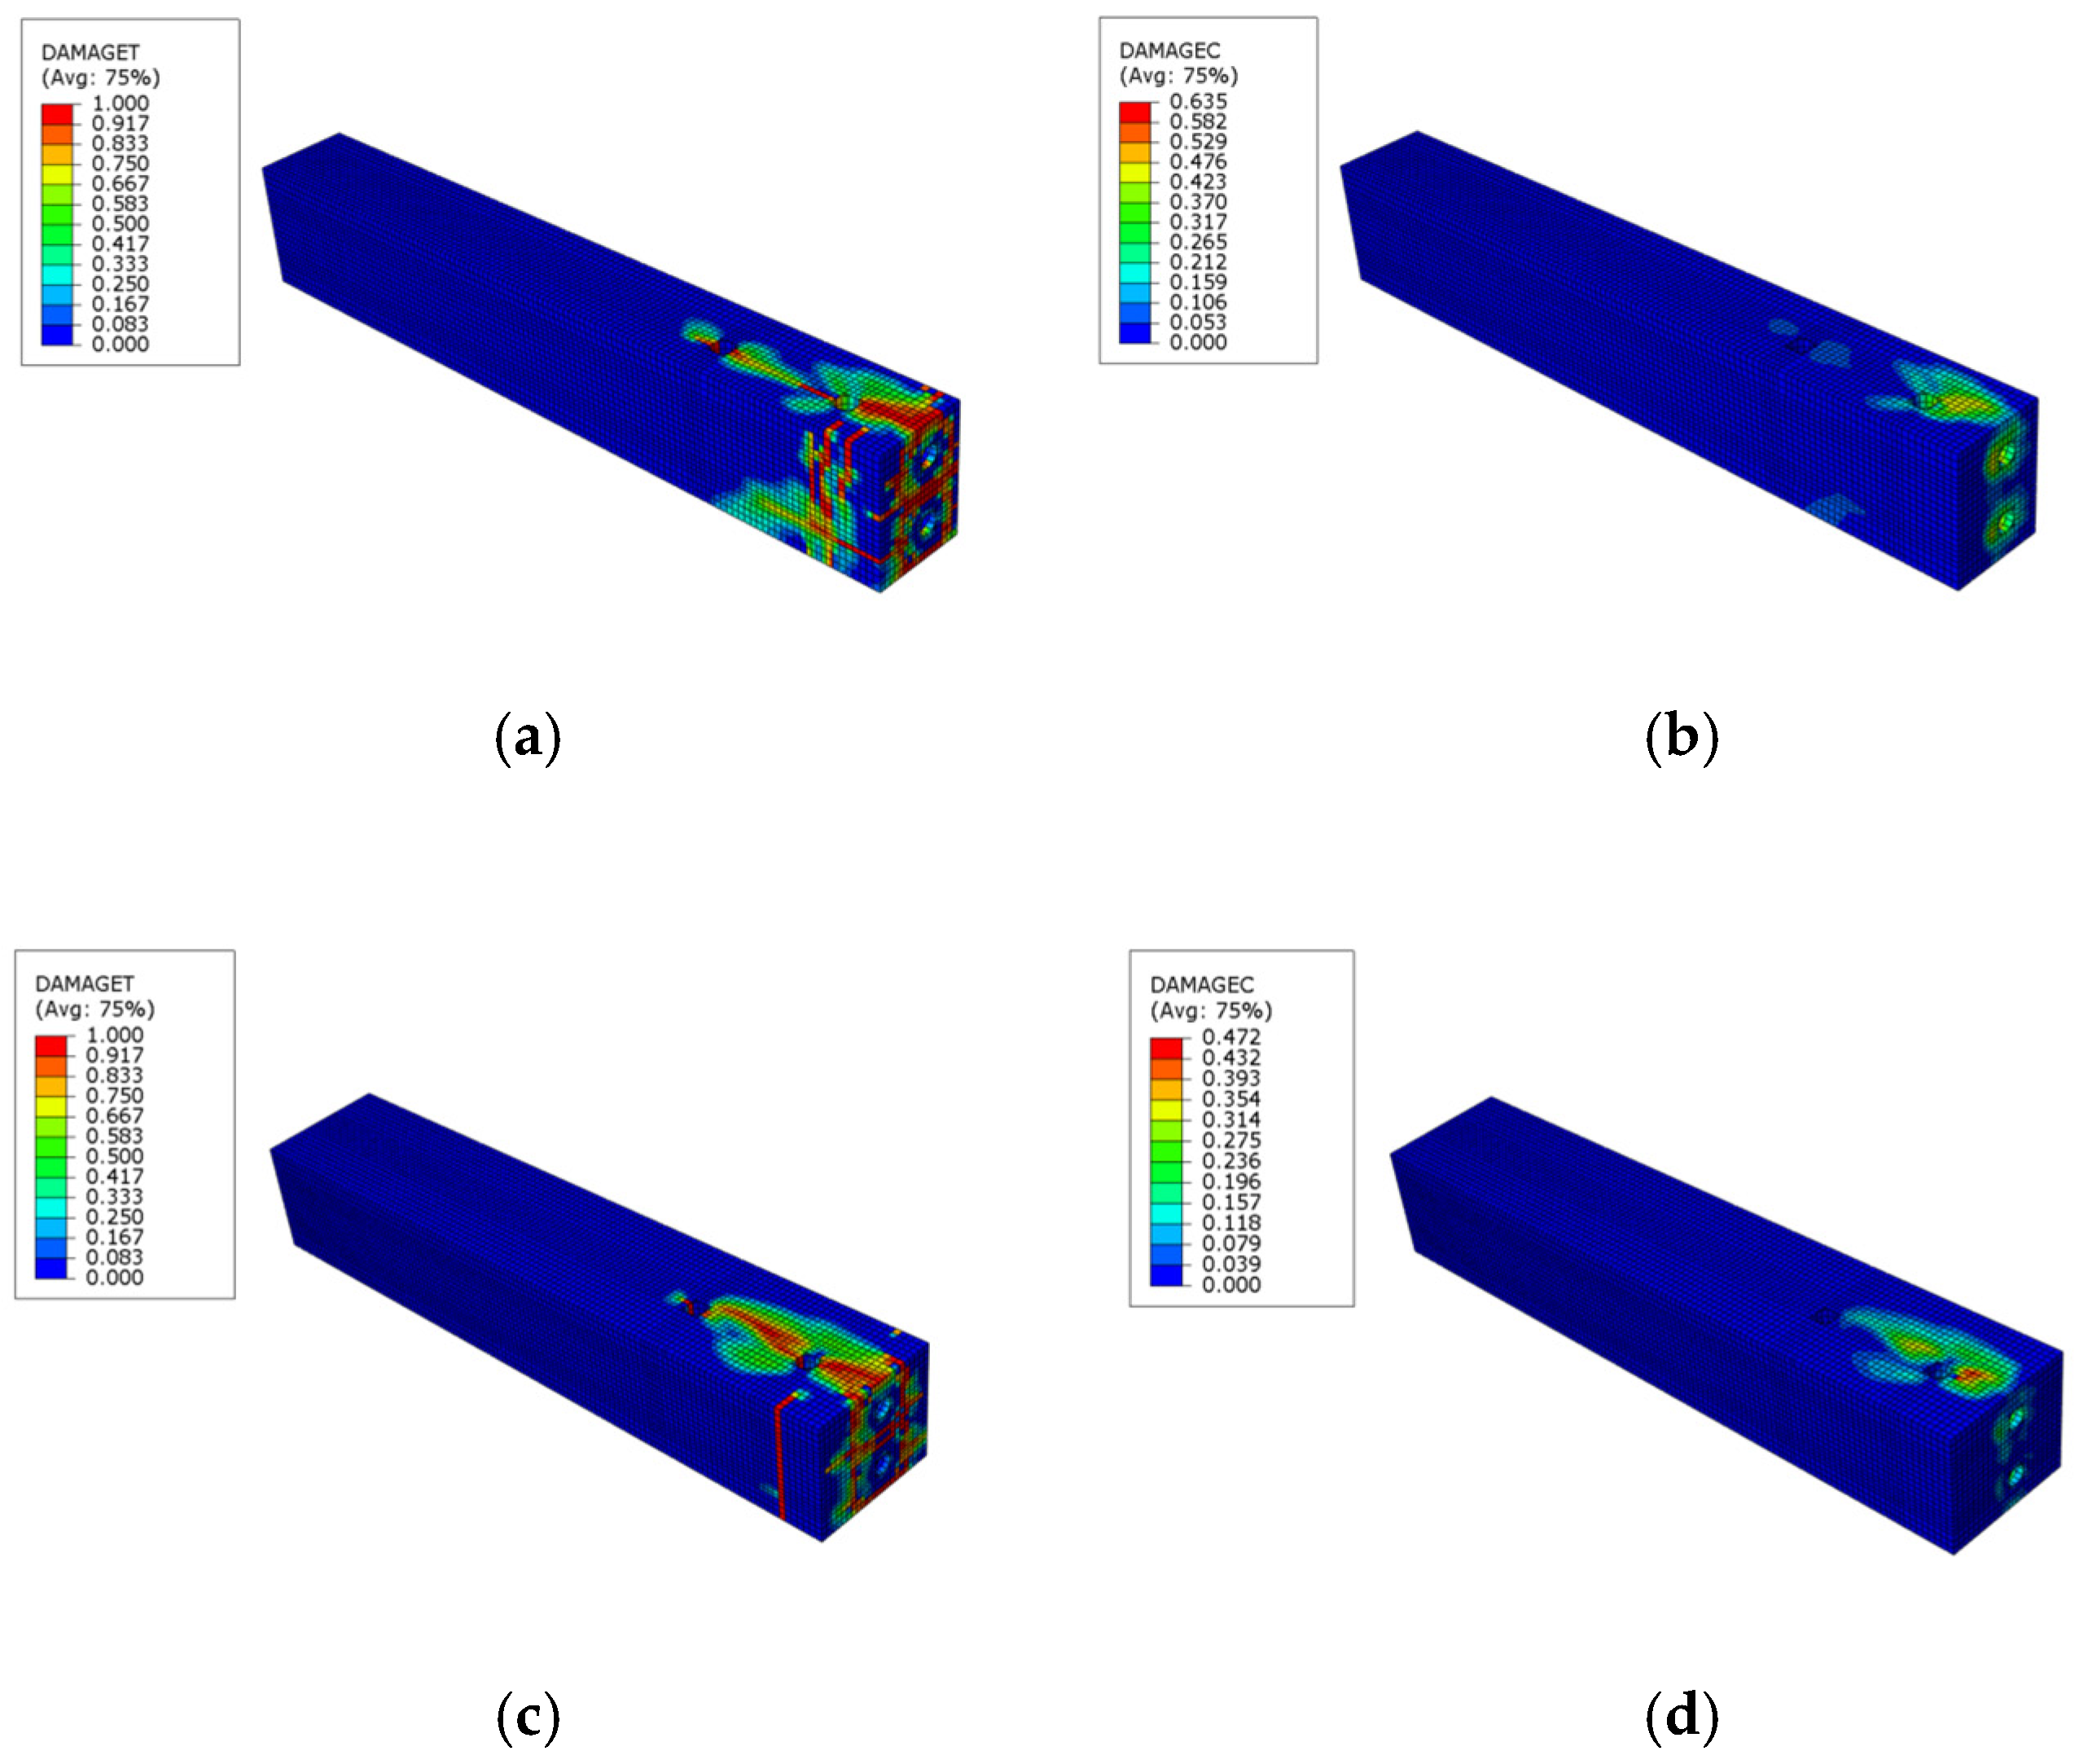
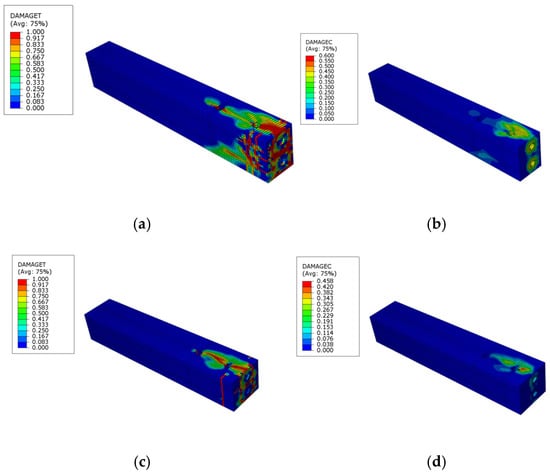
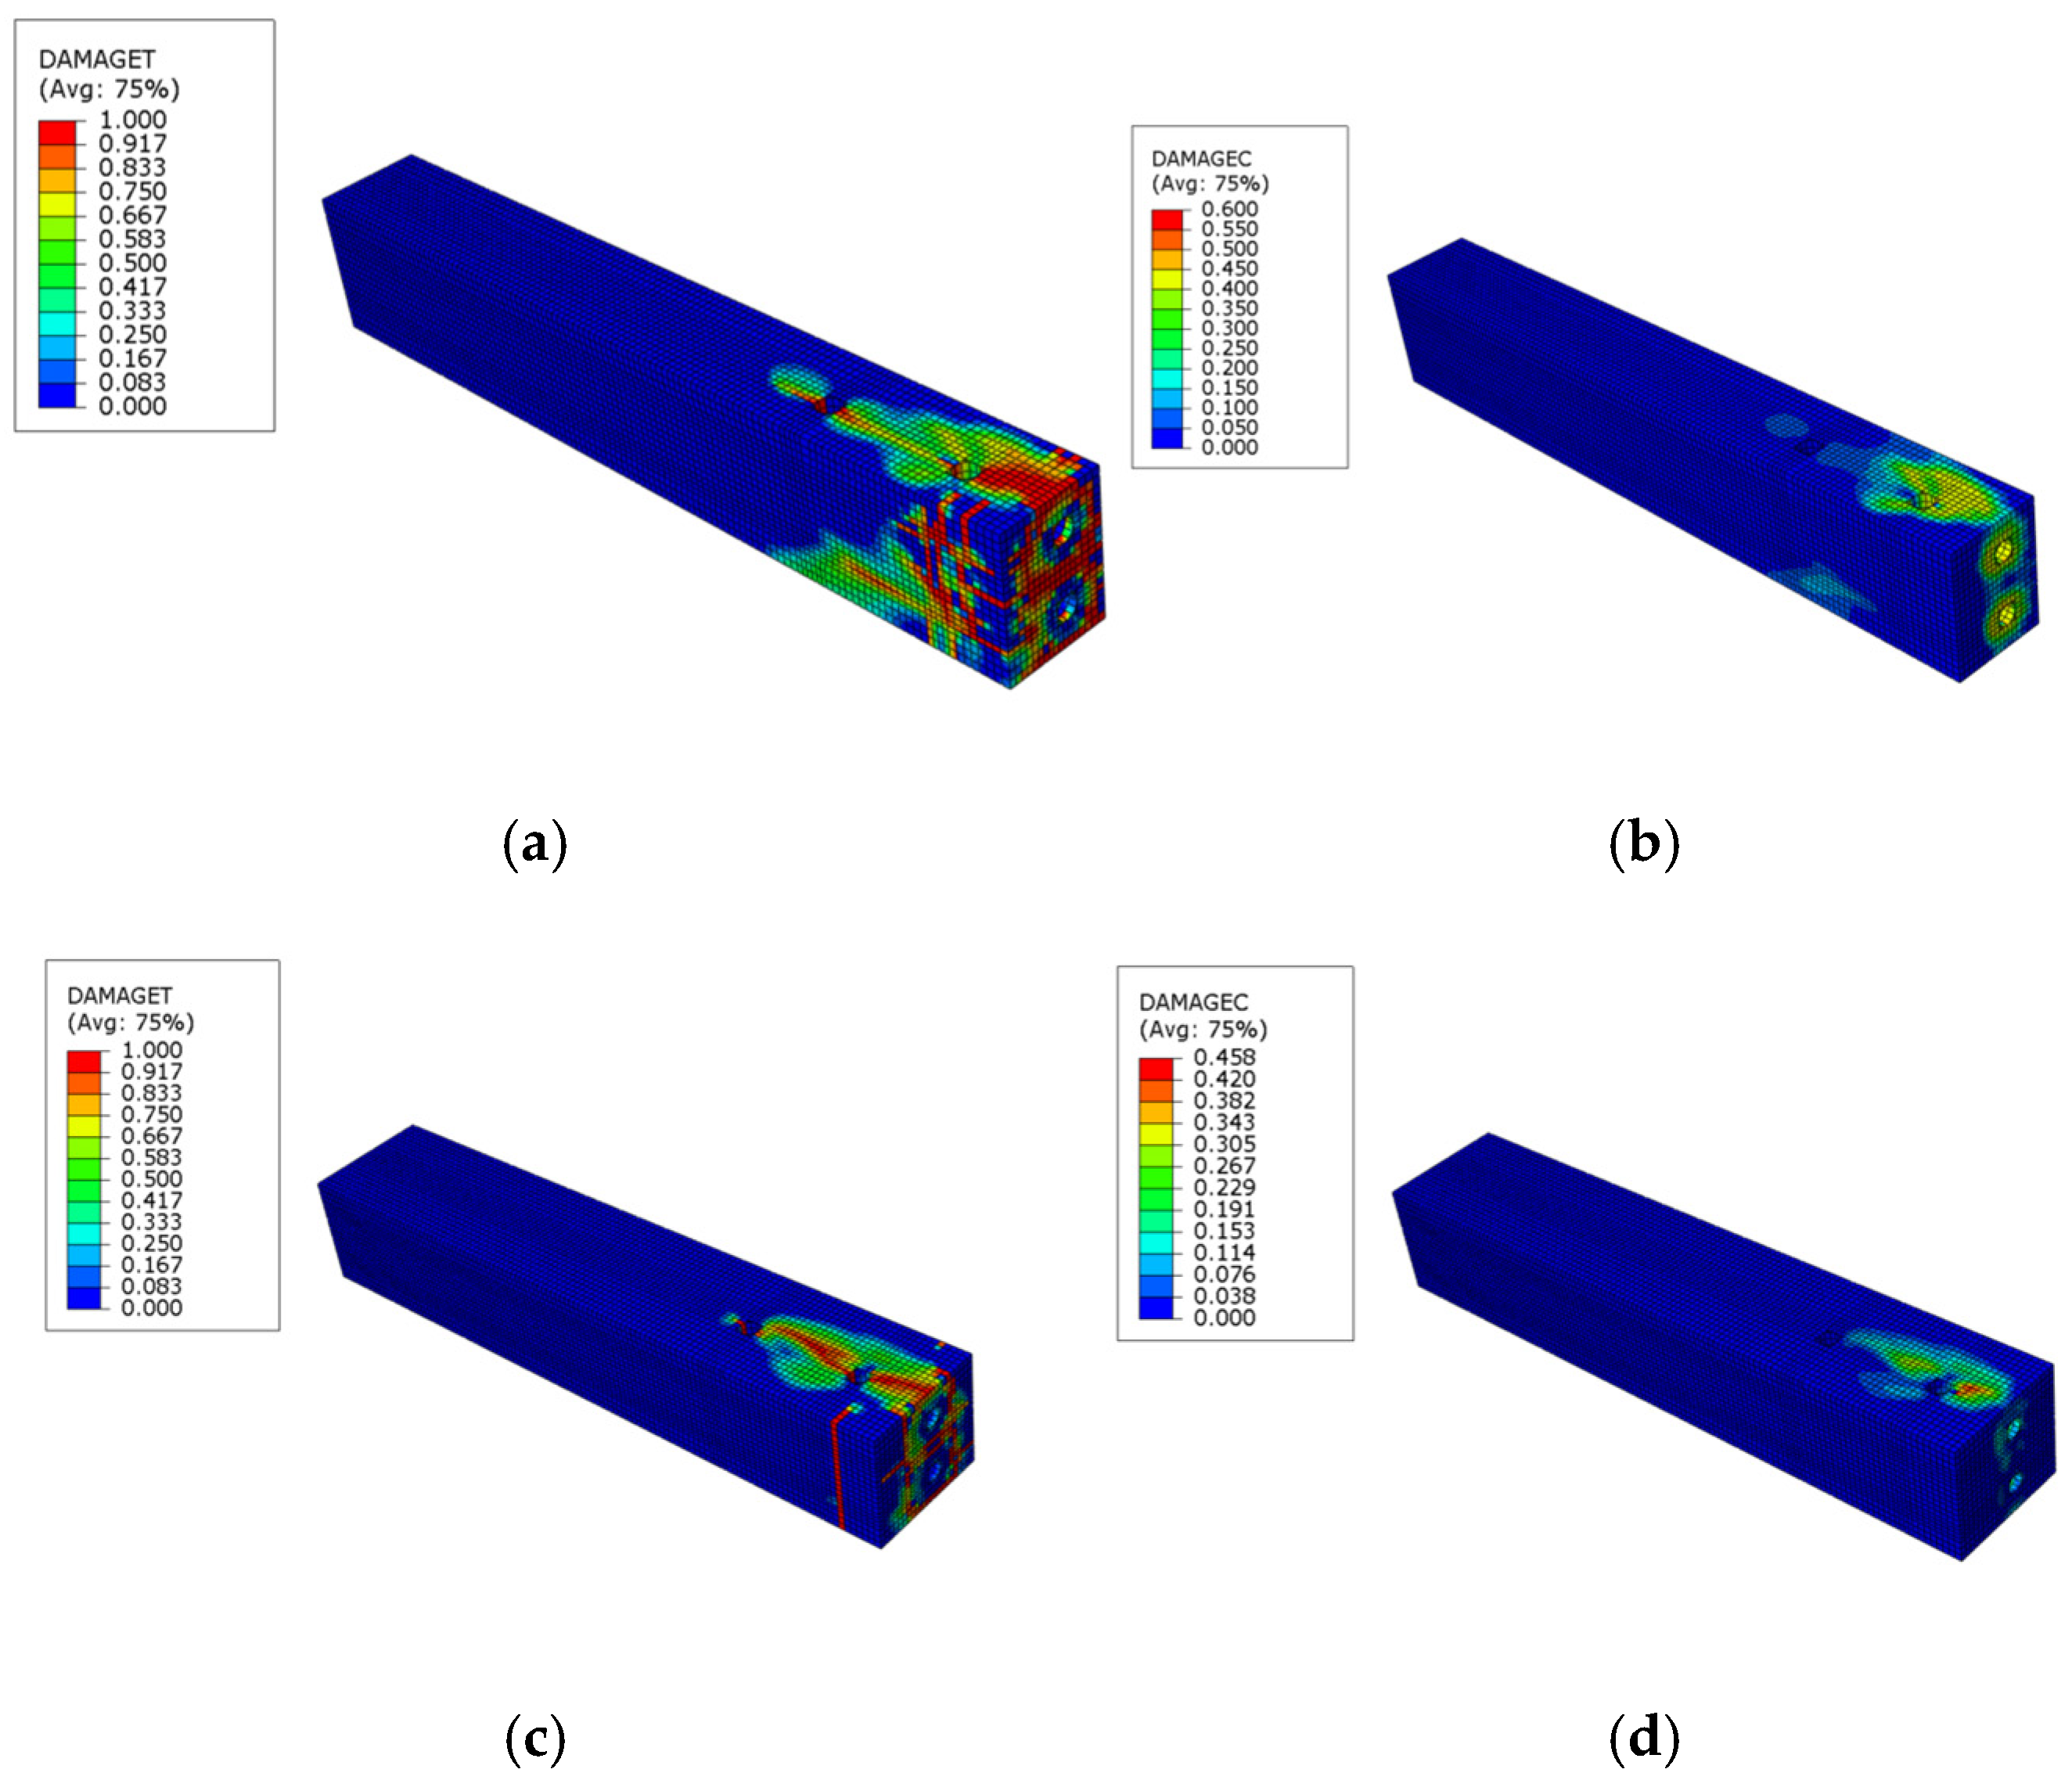
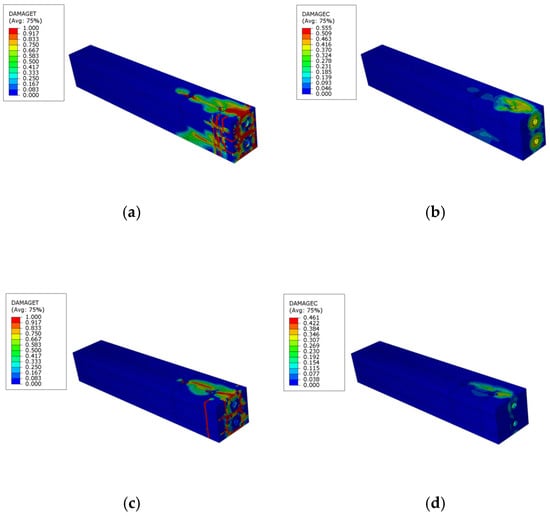

Disclaimer/Publisher’s Note: The statements, opinions and data contained in all publications are solely those of the individual author(s) and contributor(s) and not of MDPI and/or the editor(s). MDPI and/or the editor(s) disclaim responsibility for any injury to people or property resulting from any ideas, methods, instructions or products referred to in the content. |
© 2026 by the authors. Licensee MDPI, Basel, Switzerland. This article is an open access article distributed under the terms and conditions of the Creative Commons Attribution (CC BY) license.