


Abstract
Studying the slumping disintegration, movement speed, impact intensity, accumulation characteristics, and energy conversion laws of tower-column unstable rock masses (TCURM) is crucial for high-altitude rockfall hazard risk evaluation. Existing PFC-based rockfall simulations rarely target the unique “top-hard-bottom-weak” structural characteristics of TCURM and lack in-depth integration of on-site monitoring videos to verify dynamic evolution processes. Taking the large-scale collapse of W12# unstable rock mass at Zengziyan, Jinfo Mountain in Chongqing as an example, a combination method of orthogonal test and PFC3D discrete element simulation is used. Mesoscopic parameters are calibrated via comparison with on-site video and investigation data, accurately reproducing the entire slumping disintegration process and revealing its dynamic characteristics. Results confirm the simulation is basically consistent with field data, verifying the model and parameter rationality. The total duration from instability to stagnation is 121 s (15 s to impact the secondary steep cliff base, 106 s for debris accumulation). Movement speed time-histories of deteriorated and non-deteriorated zones are generally consistent, both exhibiting a “double-peak” feature. Rockfall impact force first increases, stabilizes in the middle, and declines to stability afterward, with a maximum of 2.1 × 10⁹ N. The kinetic energy curve also shows a “double-peak” distribution, closely related to the on-site two-level steep cliff morphology. The findings provide important references for analyzing the dynamic evolution of such rockfalls and designing disaster prevention/mitigation engineering.
1. Introduction
Rock avalanche refers to the process and phenomenon that unstable rock masses of any size are separated from the parent body of the source area and piled up at the foot of the slope by falling, bouncing, rolling, sliding and other movements [1]. High-position and high-energy rock avalanches are characterized by steep terrain conditions, high energy, large scale, strong destructive power, and wide coverage [2]. Their early identification, instability and movement mechanisms, disaster chain effects, as well as technical measures for prevention and control have become frontier and hot topics, as well as major challenges in international earth sciences [3].
As a disaster-causing body, the movement speed, accumulation characteristics, and energy conversion of collapse debris are important indicators of geological hazard risk assessment [4], while the movement distance and sliding velocity directly determine the disaster range. In view of the dynamic evolution characteristics of the collapse process, which is a topic of widespread concern in the academic community, existing studies have developed a variety of technical methods, including empirical models, analytical methods, physical experiments, and numerical simulations [5]. However, significant differences exist among these various methods; empirical models [6,7,8] and analytical methods [9] contain many assumptions and are less versatile. Physical models [10,11] are expensive and time sensitive. The numerical simulation method [12,13] is low-cost and easy to apply, and can simulate various complex boundary conditions and invert the evolution process of geological hazards. Among them, the PFC (Particle Flow Code) method, due to its characteristics of high efficiency and flexibility, has been widely applied in fields such as geological hazard risk assessment [14,15]. For example, Zou used PFC2D to study the high-speed, high-energy, large-scale deformation and accumulation characteristics of rock landslide-debris flow in Jiwei Mountain, Wulong. Gao [16] used PFC3D to establish a particle cluster model to study the variation of rebound coefficient, impact force, and movement velocity of aggregates of different shapes with slope inclination. Scaringi [17] used PFC2D, Mat DEM, MassMov2D, and Mass flow to simulate the motion process and accumulation characteristics of Xinmo landslide, respectively. Weng [18] established PFC two-dimensional and three-dimensional rock landslide models to study the slope displacement characteristics under groundwater corrosion.
Despite the wide application of PFC discrete element numerical simulation in constructing three-dimensional simulated terrain, quantitatively inverting collapse processes, and obtaining dynamic parameters, two critical research gaps remain unresolved. First, the comparative study between actual collapse monitoring videos and numerical simulation results is insufficient. Although video monitoring data is intuitive and realistic, its observation scope is limited, making it difficult to fully display the global process of the instability-migration-accumulation of the unstable rock mass; while PFC discrete element models can well reproduce the global process, the reliability of simulation results lacks sufficient verification through multi-dimensional comparison with on-site dynamic characteristics (e.g., velocity evolution law, impact timing). Second, tower-column unstable rock masses (TCURM), as a special type of unstable rock, has distinct geometric and mechanical characteristics compared to other rockfall types (such as blocky or fragmented rock masses). Their vertical height is much larger than their horizontal dimensions, and they often develop obvious deterioration zones at the bottom, presenting a “top-hard-bottom-weak” structural feature. This unique structure leads to a distinct instability mode (seat collapse-disintegration) and dynamic evolution process that cannot be fully captured by conventional rockfall simulation strategies [19]. However, existing DEM-based landslide/rockfall studies [20,21] mostly focus on general rock mass collapse, lacking targeted modeling methods and in-depth analysis for TCURM.
Taking the large-scale collapse disaster at Zengziyan, Jinfo Mountain in Chongqing as an example, this study reconstructs a virtual three-dimensional terrain using the PFC3D 6.0 discrete element software, based on engineering geological conditions and collapse monitoring video. By repeatedly comparing the output results of the numerical model with video monitoring data, the mesoscopic parameters of the numerical model are iteratively optimized to make the simulation results close to the real situation. This study quantitatively inverts the movement characteristics, impact force, debris accumulation distribution, and energy conversion laws during the collapse evolution of TCURM. By combining the actual collapse-sliding process with numerical simulation inversion, it effectively compensates for the limitations of video monitoring and numerical simulation when applied independently, thereby providing technical support for the instability and collapse of high-level unstable rock masses, as well as risk assessment and prevention.
2. Geological Environment of Zengziyan
Zengziyan, the rock of Jinfoshan in Nanchuan, Chongqing, is composed of two steep cliffs from top to bottom and has the typical dualistic mountain structure characteristics of “steep at the top and gentle at the bottom, hard at the top and soft at the bottom”. The W12# large-scale unstable rock collapse occurred on 12 August 2004, located on a second-class steep cliff, in the shape of a triangular prism, with a height of about 240 m, a width of about 32 m, a length of about 64 m, and a shear elevation of about 1560 m. The stratigraphic lithology is limestone of members 3, 4, and 5 (P1m3+4+5) of the Lower Permian Maokou Formation, and the rock mass develops three groups of structural planes, among which two groups of occurrences are upright orthogonal fractures, which run through from the top to the bottom, extend about 200 m in length, and the fracture width is 3~10 m. The other group is at the near-horizontal level.
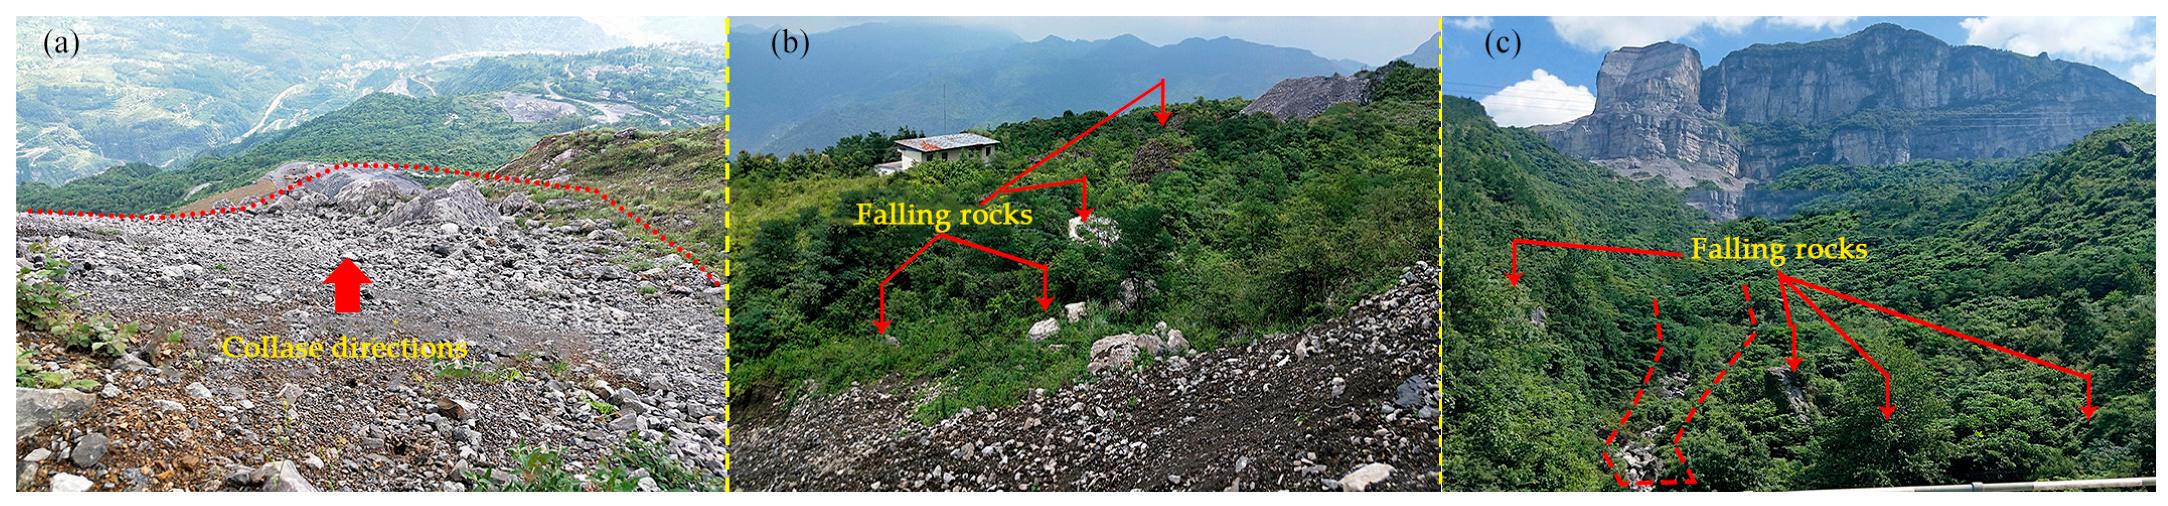
Under the action of karst water, physical and chemical weathering, temperature difference, biological root splitting and other factors, the rock mass properties of the whole TCURM are separated into two parts: that is, the middle and upper non-complete deterioration areas and the bottom deterioration areas. The mechanical mode of the tower-column unstable rock is approximately a large-scale uniaxial compressive stress state [19], and its deterioration zone is the initial part of the fracturing instability. As the bottom deteriorated areas start to destabilize, the rock mass in the upper incomplete deterioration zone continues to sit down, impact the base and disintegrate into various specifications of stone debris, and the whole collapse process presents a seat collapse and instability mode. The farthest horizontal migration distance of the main sediment is about 800 m [20], and the rest of the rocks are scattered in the slope valley area with a range of nearly 2 km2 [21] (Figure 1 shows the remaining rocks in the main gully during the field investigation).
Figure 1.
Colluvial blocks in the main gully: (a) shows colluvial material in collapse source area; (b) illustrates colluvial areas along the motion path; (c) exhibits colluvial areas at the end of the gully. The red arrows indicate falling rocks, and the dotted lines represent collapse directions.
3. Real-Scene Analysis of the Slumping-Disintegrated Collapse at Zengziyan
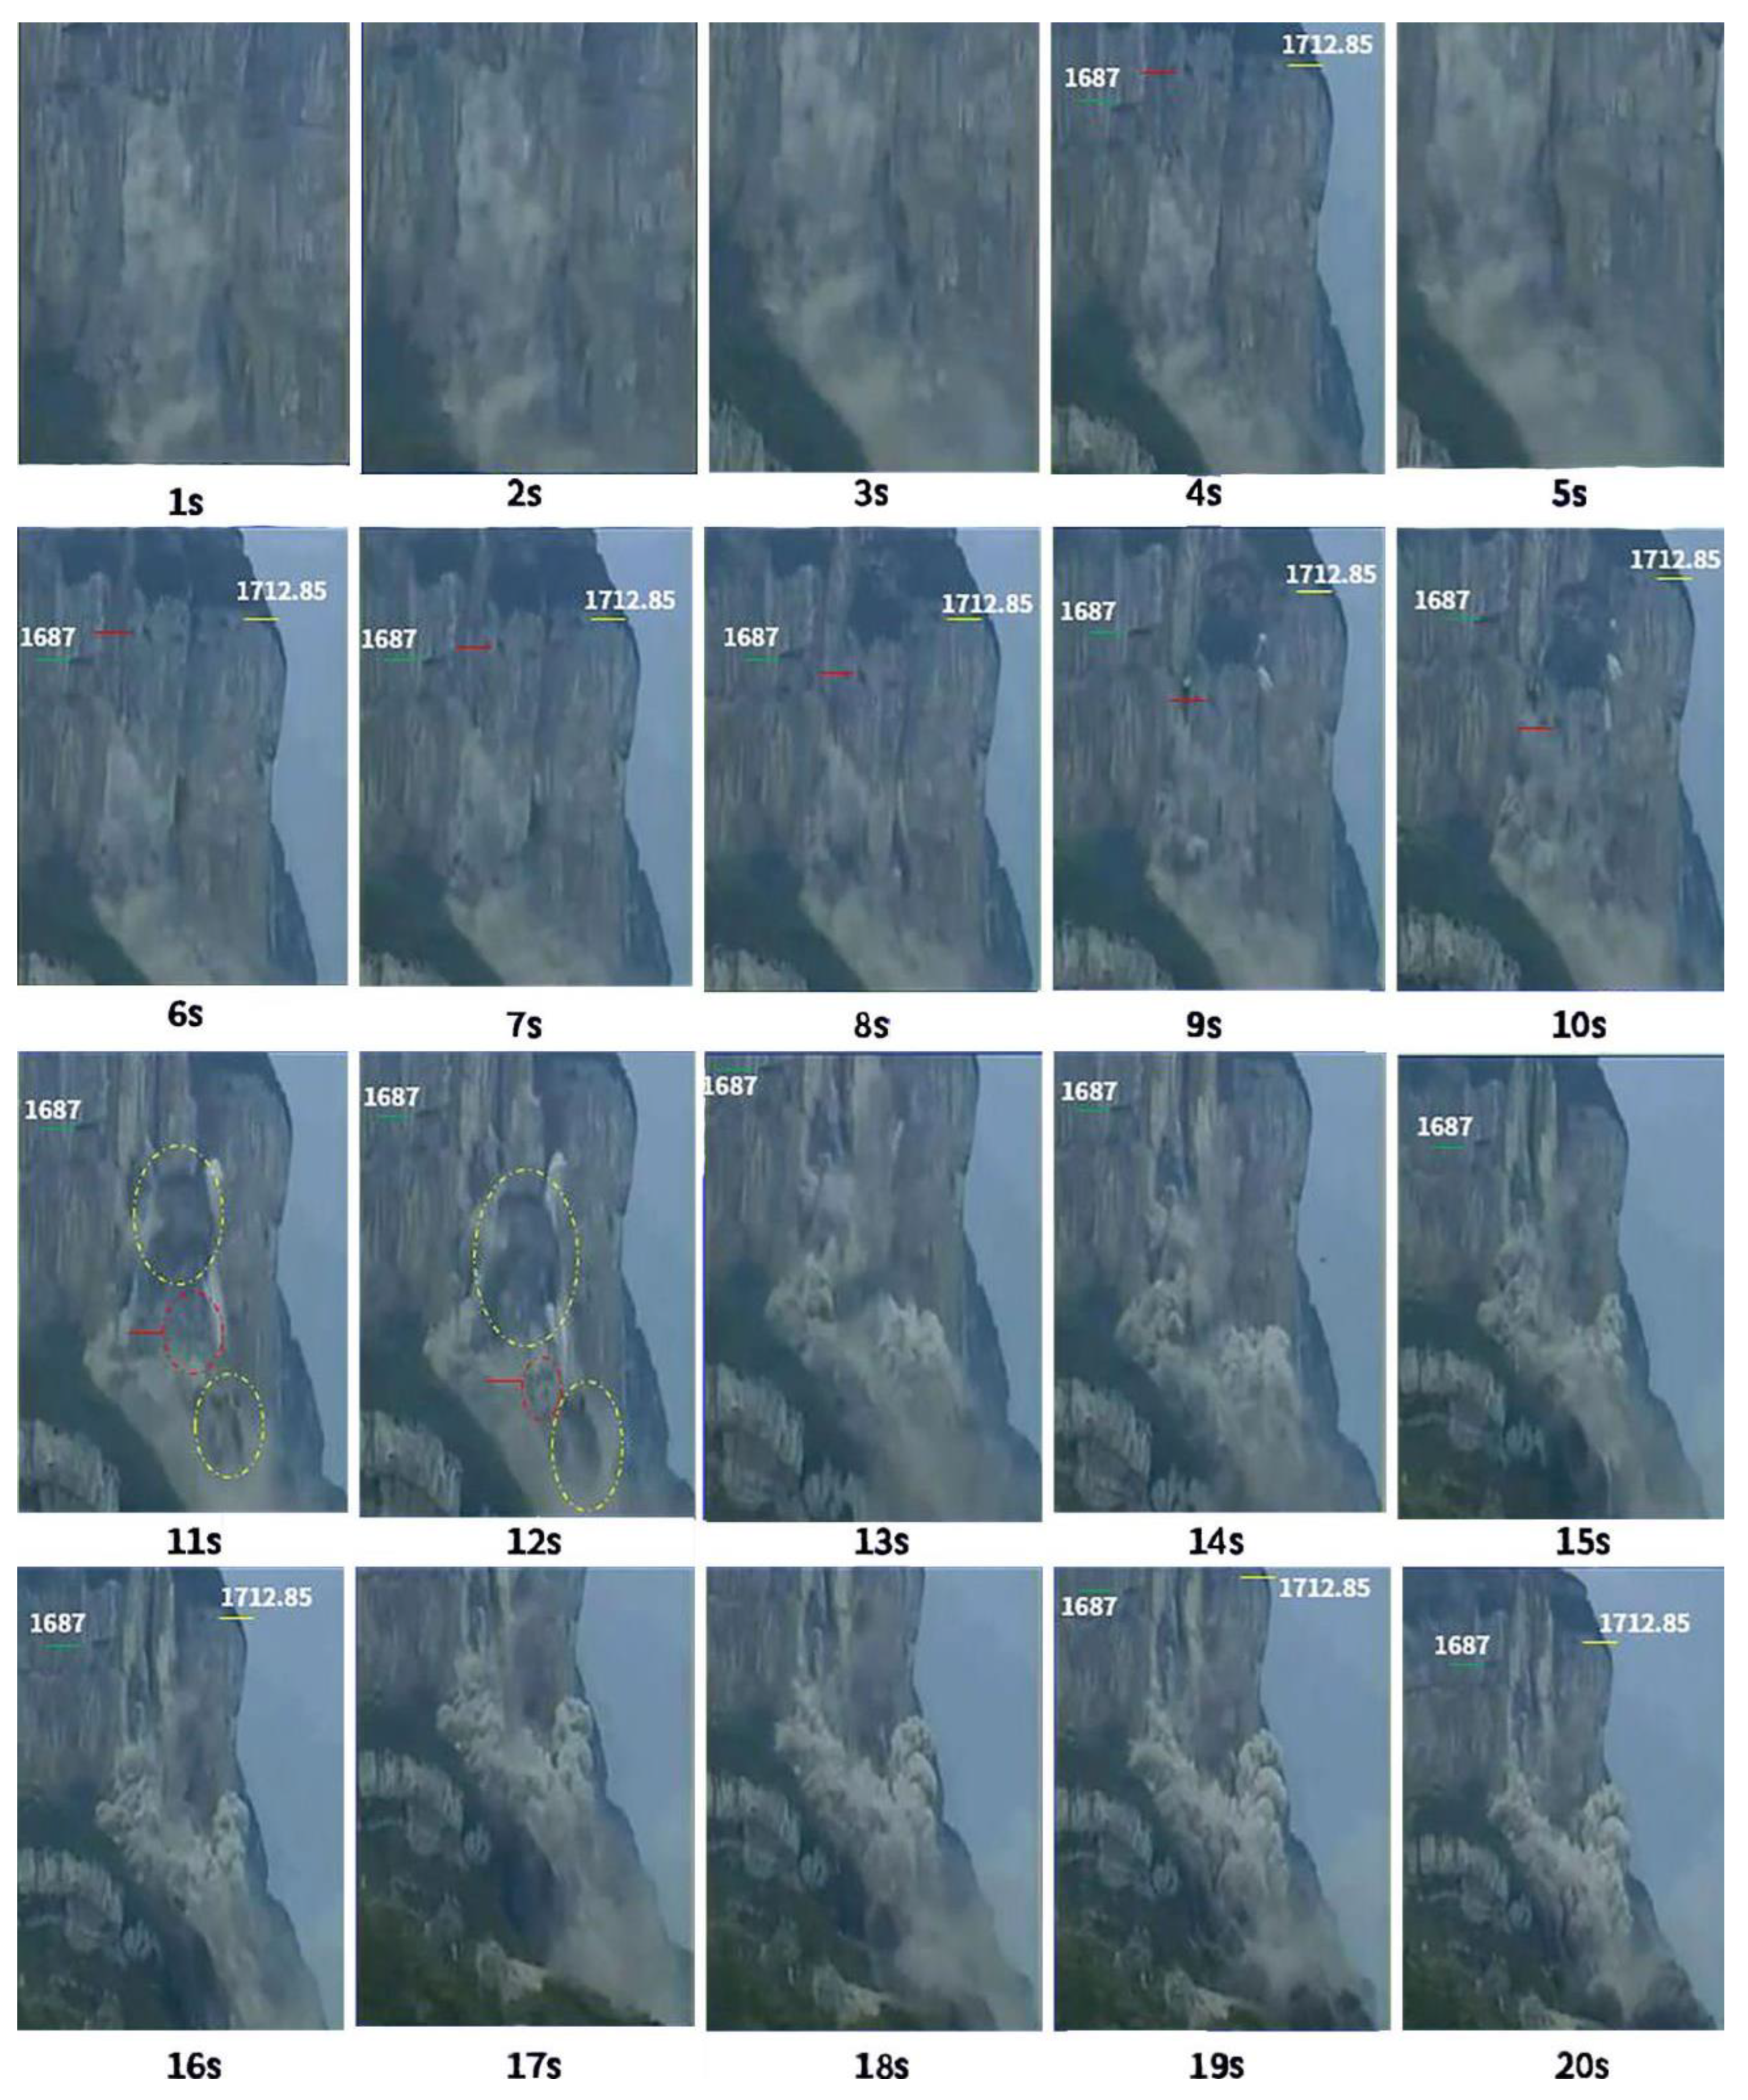
To quantitatively characterize the collapse process of the W12# TCURM, this study utilized high-definition surveillance video with a resolution of 1920 × 1080 pixels and a frame rate of 25 frames per second for observation. The video was preprocessed for image stabilization and contrast enhancement to ensure clear identification of the rock mass boundary and movement features. According to the video data, the entire disintegration process of the subset of the W12# TCURM was obtained, and the duration from the fracturing instability in the deterioration zone to the disintegration of the impact base was about 13 s, during which the disintegrated rock blocks continued to slide along the slope terrain (Figure 2). To quantitatively analyze the movement characteristics of the unstable rock mass, in Figure 2, a fixed point is selected in the middle and upper part of the W12# unstable rock, and the red short line is used as a mark to approximate the subjectional movement process of the TCURM. At the same time, the green line (elevation 1687 m) and yellow line (elevation 1712.85 m) are marked on the adjacent stable cliffs on both sides of the unstable rock as a motion reference system.
Figure 2.
Monitoring image of the slumping-induced disintegration of the unstable rock mass W12# of the Zengziyan.
The 1st to 3rd are the ejection of rock cuttings and smoke during the fracturing instability of the bottom deterioration zone of W12# unstable rock. In the 4 s, the unstable rock began to dip slightly to the right, but the whole movement was downward, and this moment was the initial moment of the downward movement. At 5 s, the number of fractured debris flowing out of the bottom debris significantly increases; from the 6th to the 12th, the red reticle accelerates its sinking; from the 13th to the 20th, the top of the TCURM disintegrated at the impact base, left the secondary base, and collapsed to the first-class cliff.
Ref. [22] analyzed the velocity and acceleration characteristics of the monitoring point near the top of the unstable rock slope from a kinematic point of view and divided them into three stages. The average velocity and maximum instantaneous velocity of each stage are shown in Table 1. It can be seen that the maximum instantaneous velocity is located in the lower part of the unstable rock from the instability of TCURM to the early stage of the lower seat (0~5 s), its value is about 2.02 m/s, the speed at the top of the slope is about 0 m/s, and the average velocity of the whole tower is about 1.3 m/s. In the middle of the TCURM subblock movement (5~11 s), the maximum instantaneous velocity is about 49.42 m/s, and the downward velocity of the tower is about 25.72 m/s. In the late stage of the TCURM subset movement (11–13 s), the maximum instantaneous velocity of the lower part of the unstable rock is about 41.24 m/s, and the average velocity of the lower seat of the tower is about 33 m/s. According to the weight of the proportion of the movement time of each stage, the weighted average velocity of each stage is calculated, and the weighted average velocity of the whole disintegration process of the lower seat is about 18.72 m/s.
Table 1.
Speed characteristics of W12# unstable rock mass on the Zengzi cliff during the collapse process.
It can be seen that the sub-seat process of TCURM has the characteristics of staged movement, and the instantaneous velocity of the lower part of the tower body is relatively fast, while the instantaneous velocity of the upper part is slow, showing the velocity hysteresis of the upper rock mass. This velocity hysteresis phenomenon leads to the formation of a tensile state inside the tower body, which further accelerates the detachment trend of the near-horizontal layer and promotes the disintegration.
4. Three-Dimensional Numerical Model Construction
4.1. Mesoscopic Parameter Acquisition
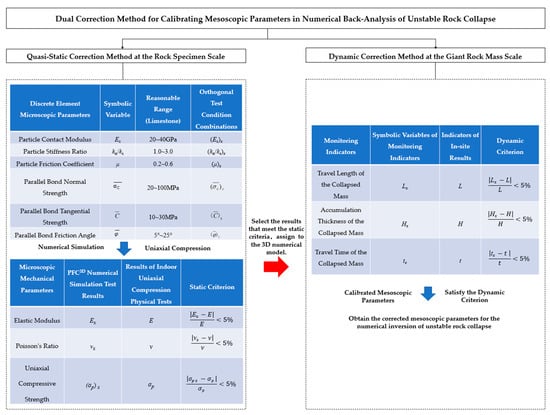
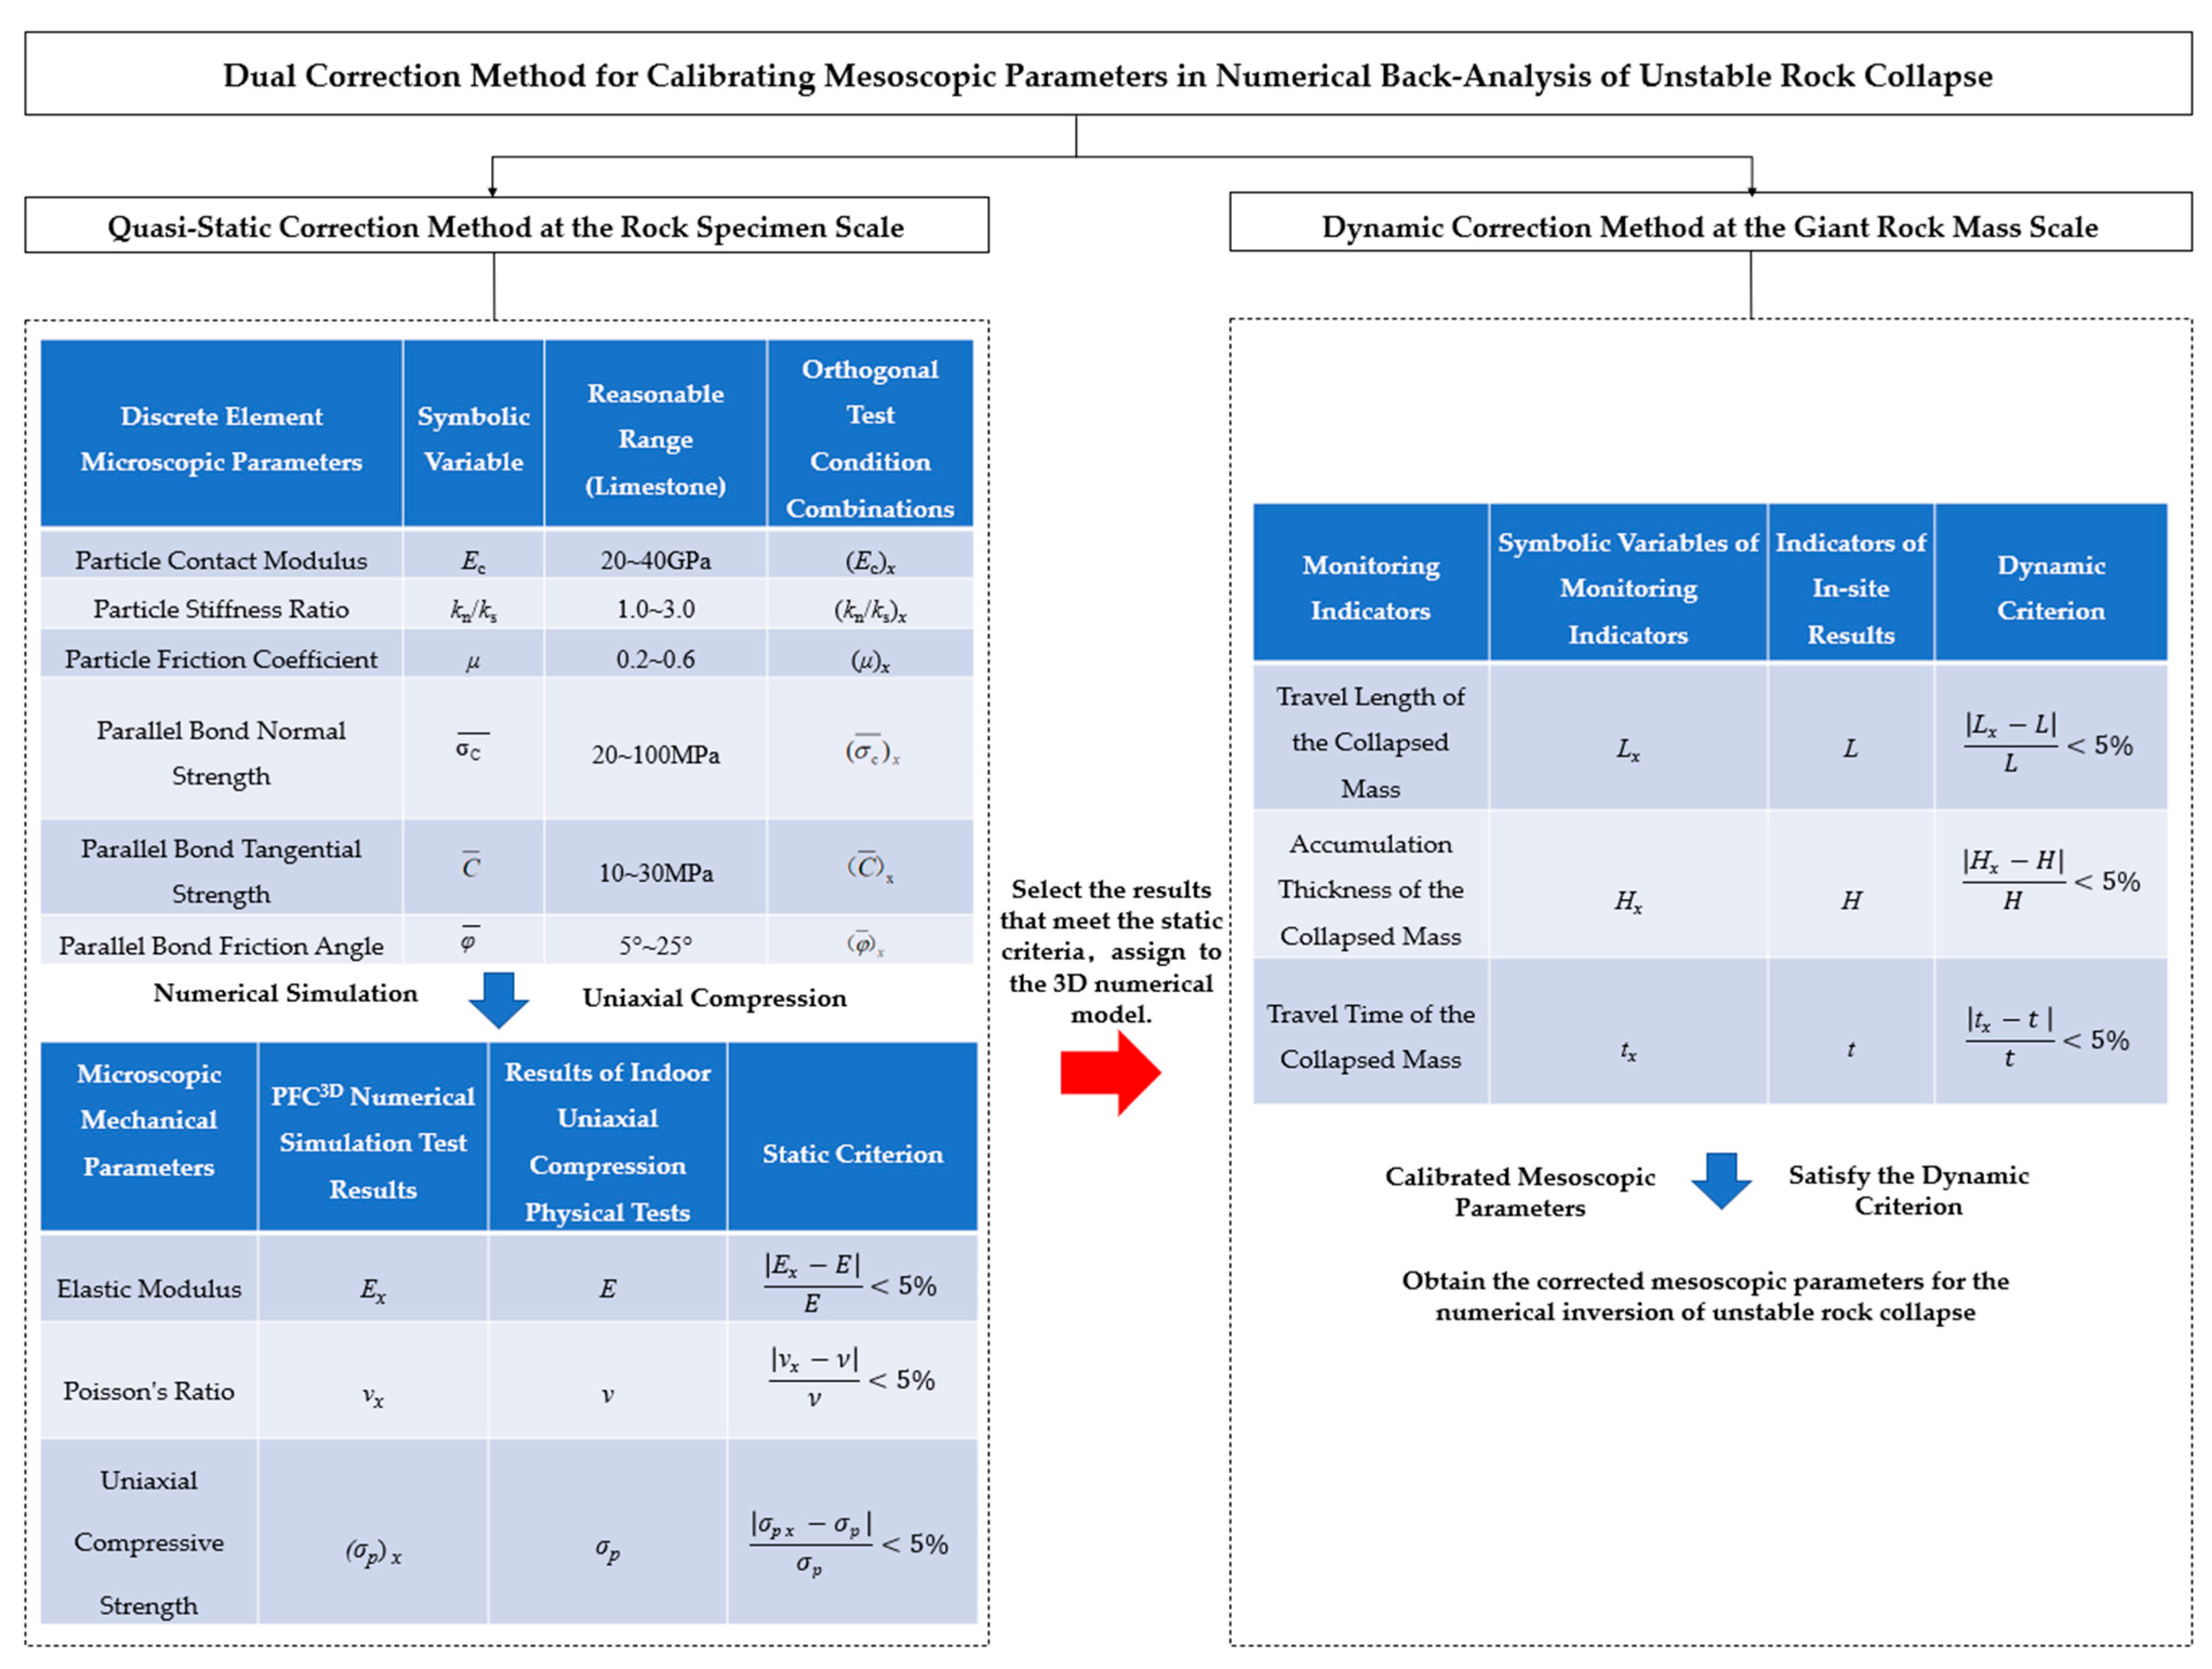
The Dual Correction Method for Calibrating Mesoscopic Parameters in Numerical Back-Analysis of Unstable Rock Collapse aims to calibrate the mesoscopic parameters of the discrete element method (DEM) to recover the macroscopic physical and mechanical properties of unstable rock masses and reproduce the dynamic evolution process of unstable rock collapse. The method consists of two stages: Quasi-Static Correction Method at the Rock Specimen Scale and Dynamic Correction Method at the Giant Rock Mass Scale. The main procedures are illustrated in Figure 3 as follows.
Figure 3.
The Dual Correction Method for Calibrating Mesoscopic Parameters in Numerical Back-Analysis of Unstable Rock Collapse.
First, based on the indoor uniaxial compression test data obtained from on-site sampling of the Zhengzi Rock unstable rock mass in Nanchuan District, Chongqing, the dominant mesoscopic parameters affecting macroscopic mechanical properties were qualitatively identified by combining orthogonal design, grey relational analysis, multi-factor variance analysis, and regression analysis [23]. Subsequently, the initial mesoscopic parameters were derived via the quantitative expressions of macro-meso parameters and an iterative correction method. Then, the initial mesoscopic parameters were assigned to the 3D DEM model of the unstable rock mass. Further calibration of mesoscopic parameters was conducted in accordance with video monitoring data and field survey results, thereby obtaining mesoscopic parameters that simultaneously satisfy the macroscopic mechanical properties at the specimen scale and conform to the dynamic characteristics of giant unstable rock masses.
4.1.1. Quasi-Static Calibration at the Rock Specimen Scale
Selection of Macroscopic and Mesoscopic Parameters
The selection of mesoscopic parameters in the particle flow constitutive model is crucial for numerical simulations conducted via the PFC6.0 software. The limestone material in this study is simulated using the parallel bond (PB) constitutive model to represent the brittle rock characteristics. Some of the mesoscopic parameters, undetermined mesoscopic parameters, and macroscopic parameters are presented in Table 2, based on the references [24,25]. The following assumptions are made in accordance with the literature [26,27]: in numerical simulations, the particle contact modulus (EC) is identical to the parallel bond modulus (), and the particle stiffness ratio (kn/ks) is consistent with the parallel bond stiffness ratio ().
Table 2.
Macro- and mesoscopic parameters selected.
Orthogonal Test Design for Limestone Mesoscopic Parameters
Based on the existing literature regarding the study of macroscopic and mesoscopic parameters [28], six mesoscopic parameters to be calibrated were selected. The value ranges of these parameters, which affect the mechanical properties of the macroscopic model, were initially determined, and an orthogonal test scheme with six mesoscopic parameters and five levels was designed, as presented in Table 3.
Table 3.
Orthogonal experimental design table meso-parameters.
(Ec)x denotes the mesoscopic elastic modulus Ec corresponding to the x-th test group; (kn/ks)x denotes the normal/tangential stiffness ratio kn/ks corresponding to the x-th test group; (μ)x denotes the friction coefficient μ corresponding to the x-th test group; denotes the mesoscopic bonding strength corresponding to the x-th test group; denotes the mesoscopic cohesion corresponding to the x-th test group; denotes the mesoscopic internal friction angle corresponding to the x-th test group (where x is the case number of the orthogonal test).
Numerical Test on Uniaxial Compressive Strength of Rock
Three-dimensional uniaxial compression numerical tests were conducted using the PFC3D program to obtain the macroscopic physical and mechanical parameters Ex, νx, and (σp)x under each numerical test case. The orthogonal table was automatically generated by SPSS 25.0 software. Three-dimensional uniaxial compression numerical tests were performed on the 25 cases listed in the L25(56) orthogonal table, and the corresponding numerical simulation results of macroscopic parameters are presented in Table 4. Specifically, the elastic modulus (E) ranges from 28.1 to 71.9 GPa with an average value of 46.91 GPa; the Poisson’s ratio (ν) ranges from 0.083 to 0.257 with an average value of 0.191 (where the elastic modulus (E) for each case is calculated as the ratio of lateral strain to axial strain at the 50% limit strength point on the stress-strain curve); the uniaxial compressive strength (σp) ranges from 22.57 to 139.77 MPa with an average value of 67.24 MPa.
Table 4.
Orthogonal test conditions and numerical simulation results of macroscopic parameters.
Quasi-Static Criterion Calibration
The macroscopic parameters obtained from numerical tests were compared with those from laboratory uniaxial compression tests to initially select the numerical test cases with high consistency. According to the quasi-static criterion, if the relative error is less than 5%, the macroscopic mechanical characteristics of the rock specimen numerical model constructed by the corresponding mesoscopic parameters under the quasi-static uniaxial compression condition are considered equivalent to those of the actual rock specimen.
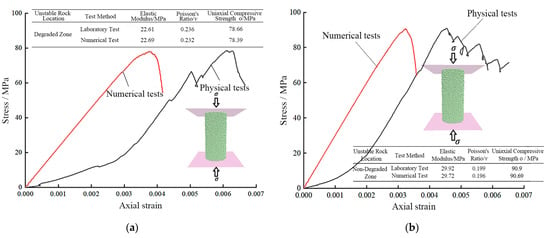
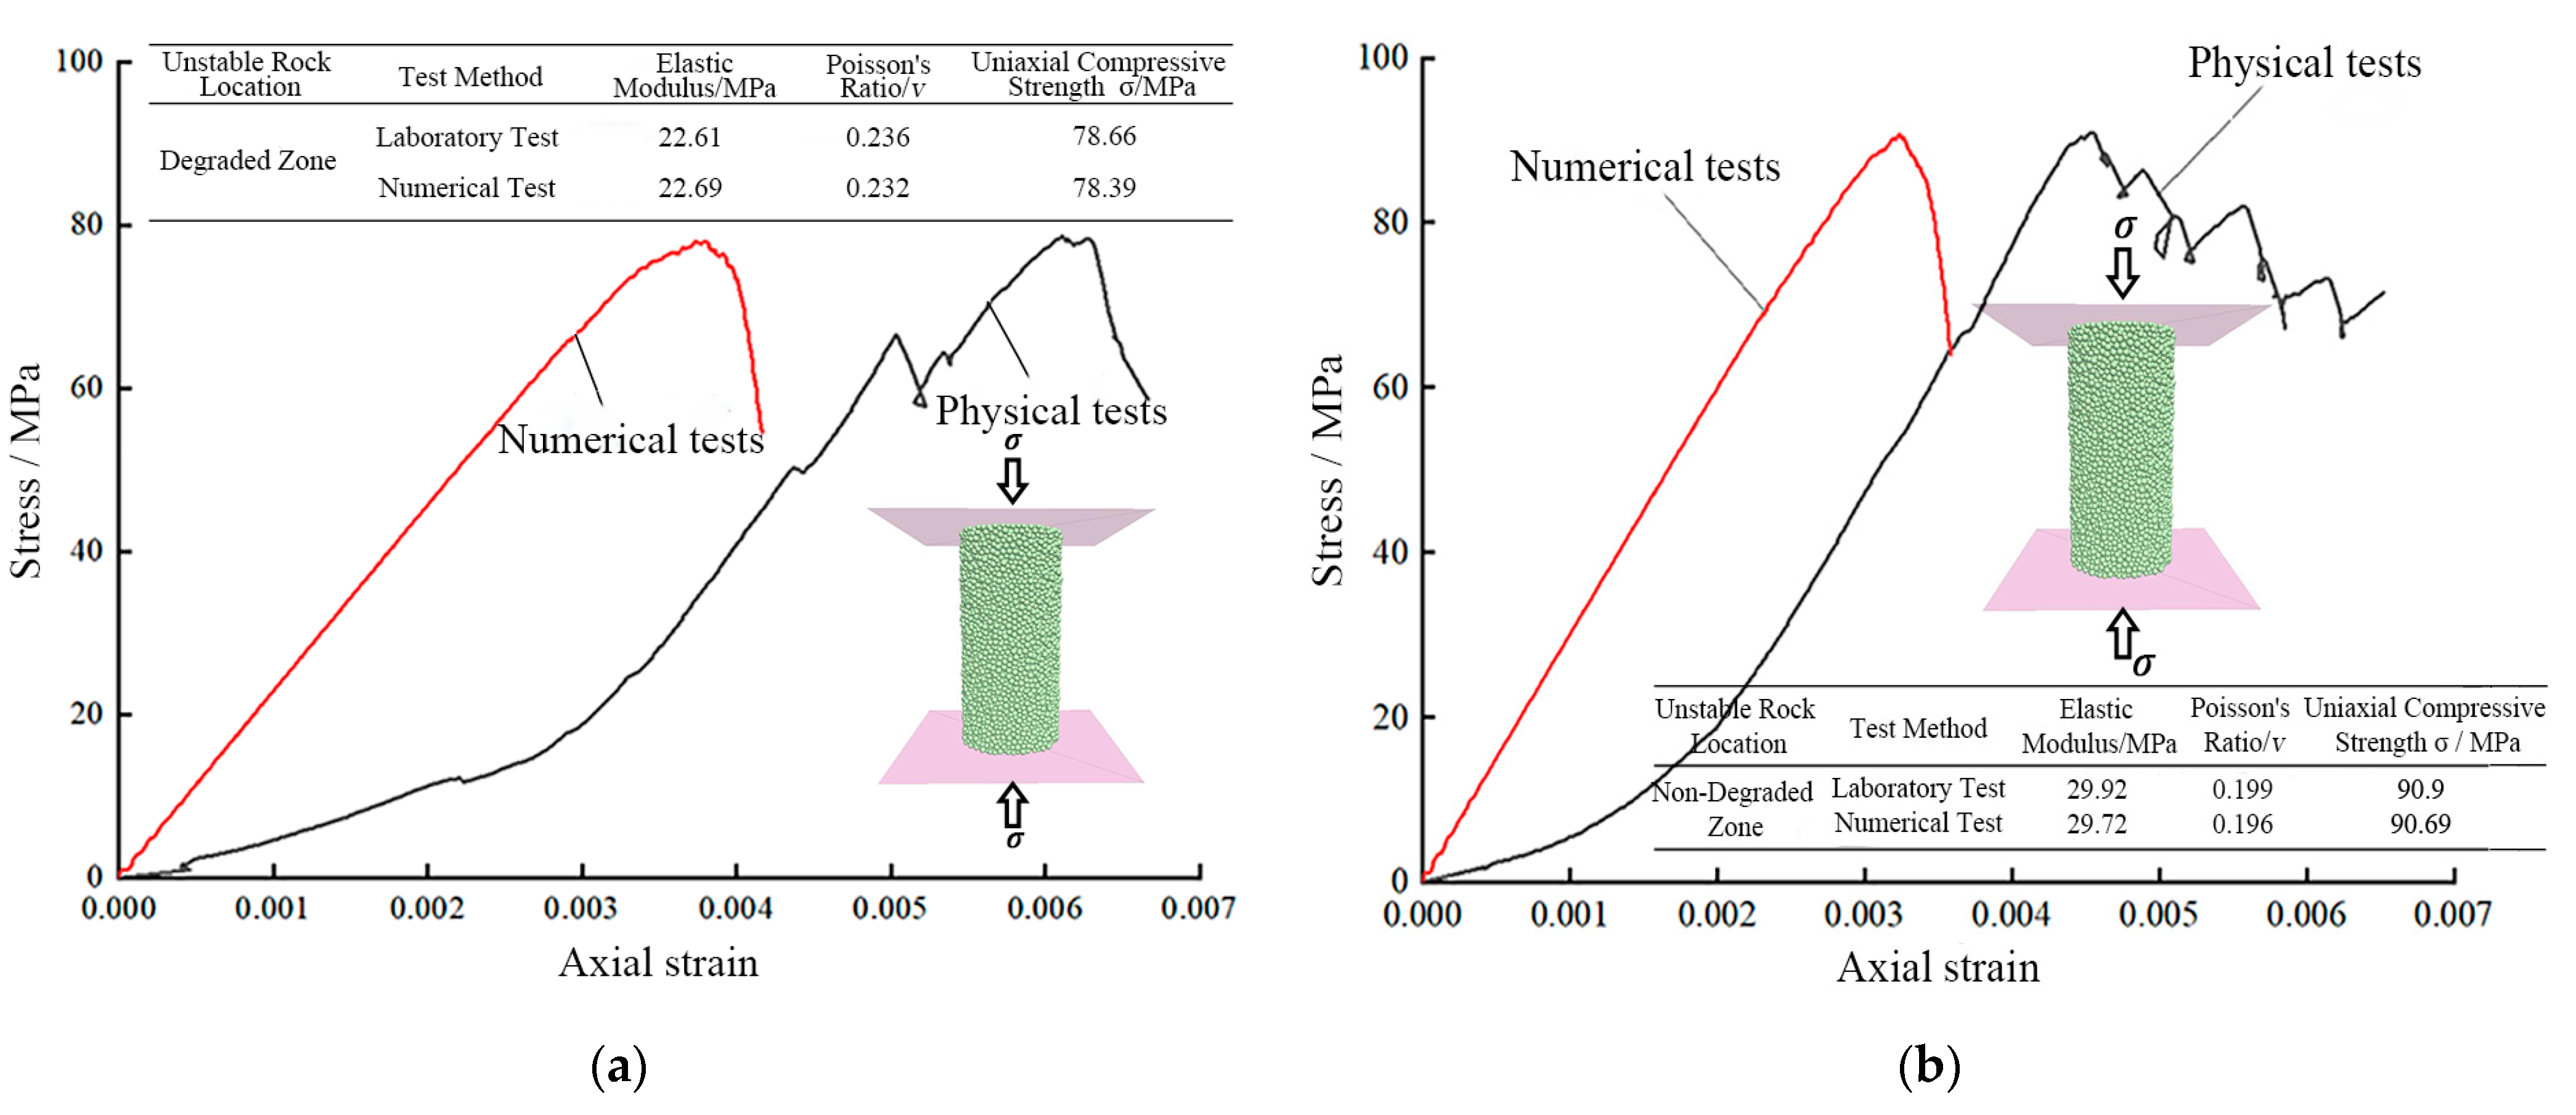
Given that columnar unstable rock masses comprise both deteriorated and non-deteriorated zones, two sets of macroscopic parameters are required for the numerical modeling. Based on the uniaxial compression tests, the macroscopically calibrated parameters for the deteriorated and non-deteriorated zones are in good agreement with the laboratory-measured macroscopic mechanical parameters, as illustrated in Figure 4. The results demonstrate that the calibration of macro-meso parameters via orthogonal tests can effectively reduce the trial-and-error cost associated with parameter tuning, and the initially obtained mesoscopic parameters can adequately reflect the physical and mechanical properties of the rock. In Figure 4a,b, the stress-strain curves obtained from physical tests exhibit a convex-upward segment at the initial stage of compression. This phenomenon is attributed to the gradual compaction of rock particles and the reduction of voids as the load is applied. Upon reaching a certain compression level, the rock enters the elastic deformation stage, where the slope of the curve, peak stress, and strain range are consistent with those of the numerical tests. In contrast, the numerical model undergoes initial stress equilibrium prior to computation, resulting in intimate particle contact and Newtonian equilibrium at the onset. Consequently, the compaction process is absent, and no convex-upward segment appears in the constitutive curve.
Figure 4.
Macro-parameters of the numerical test and the physical test in different parts of the unstable rock mass: (a) macro parameters of deterioration zone; (b) macro parameters of non-deterioration zone.
4.1.2. Dynamic Calibration at the Giant Rock Mass Scale
After the quasi-static calibration at the rock specimen scale, multiple sets of mesoscopic parameters may satisfy the quasi-static criterion. Therefore, the above-mentioned mesoscopic parameters were assigned to the discrete element model of unstable rock collapse at the giant rock mass scale. A comparison was conducted between the monitoring indices of the three-dimensional numerical simulation of the unstable rock collapse migration process (the movement length Lx, accumulation thickness Hx, and movement time tx of the collapse mass) and the actual migration results (L, H, t). If the relative error is less than 5%, the mesoscopic parameters satisfying the quasi-static criterion are also considered to meet the dynamic criterion, and can thus be taken as the final calibrated mesoscopic parameters for the reconstruction of the collapse process.
4.1.3. Determination of Mesoscopic Parameters Based on the Dual-Calibration Method
Following the two main steps, the mesoscopic strength parameters for the deteriorated and non-deteriorated zones of the unstable rock mass were obtained, as presented in Table 5.
Table 5.
Micro-parameters of the unstable rock mass’ particles.
The results satisfying the dynamic criterion will be elaborated in Section 5: Results and Analysis.
4.2. Numerical Model of TCURM at Zengziyan
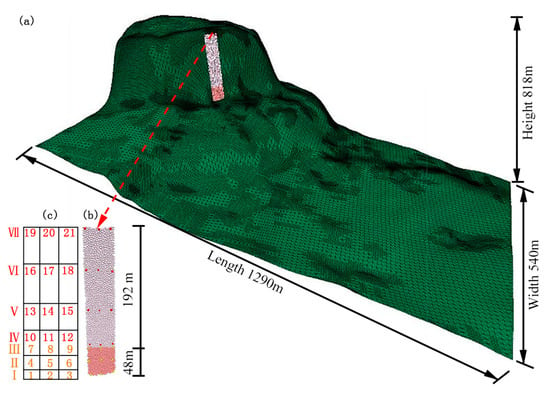
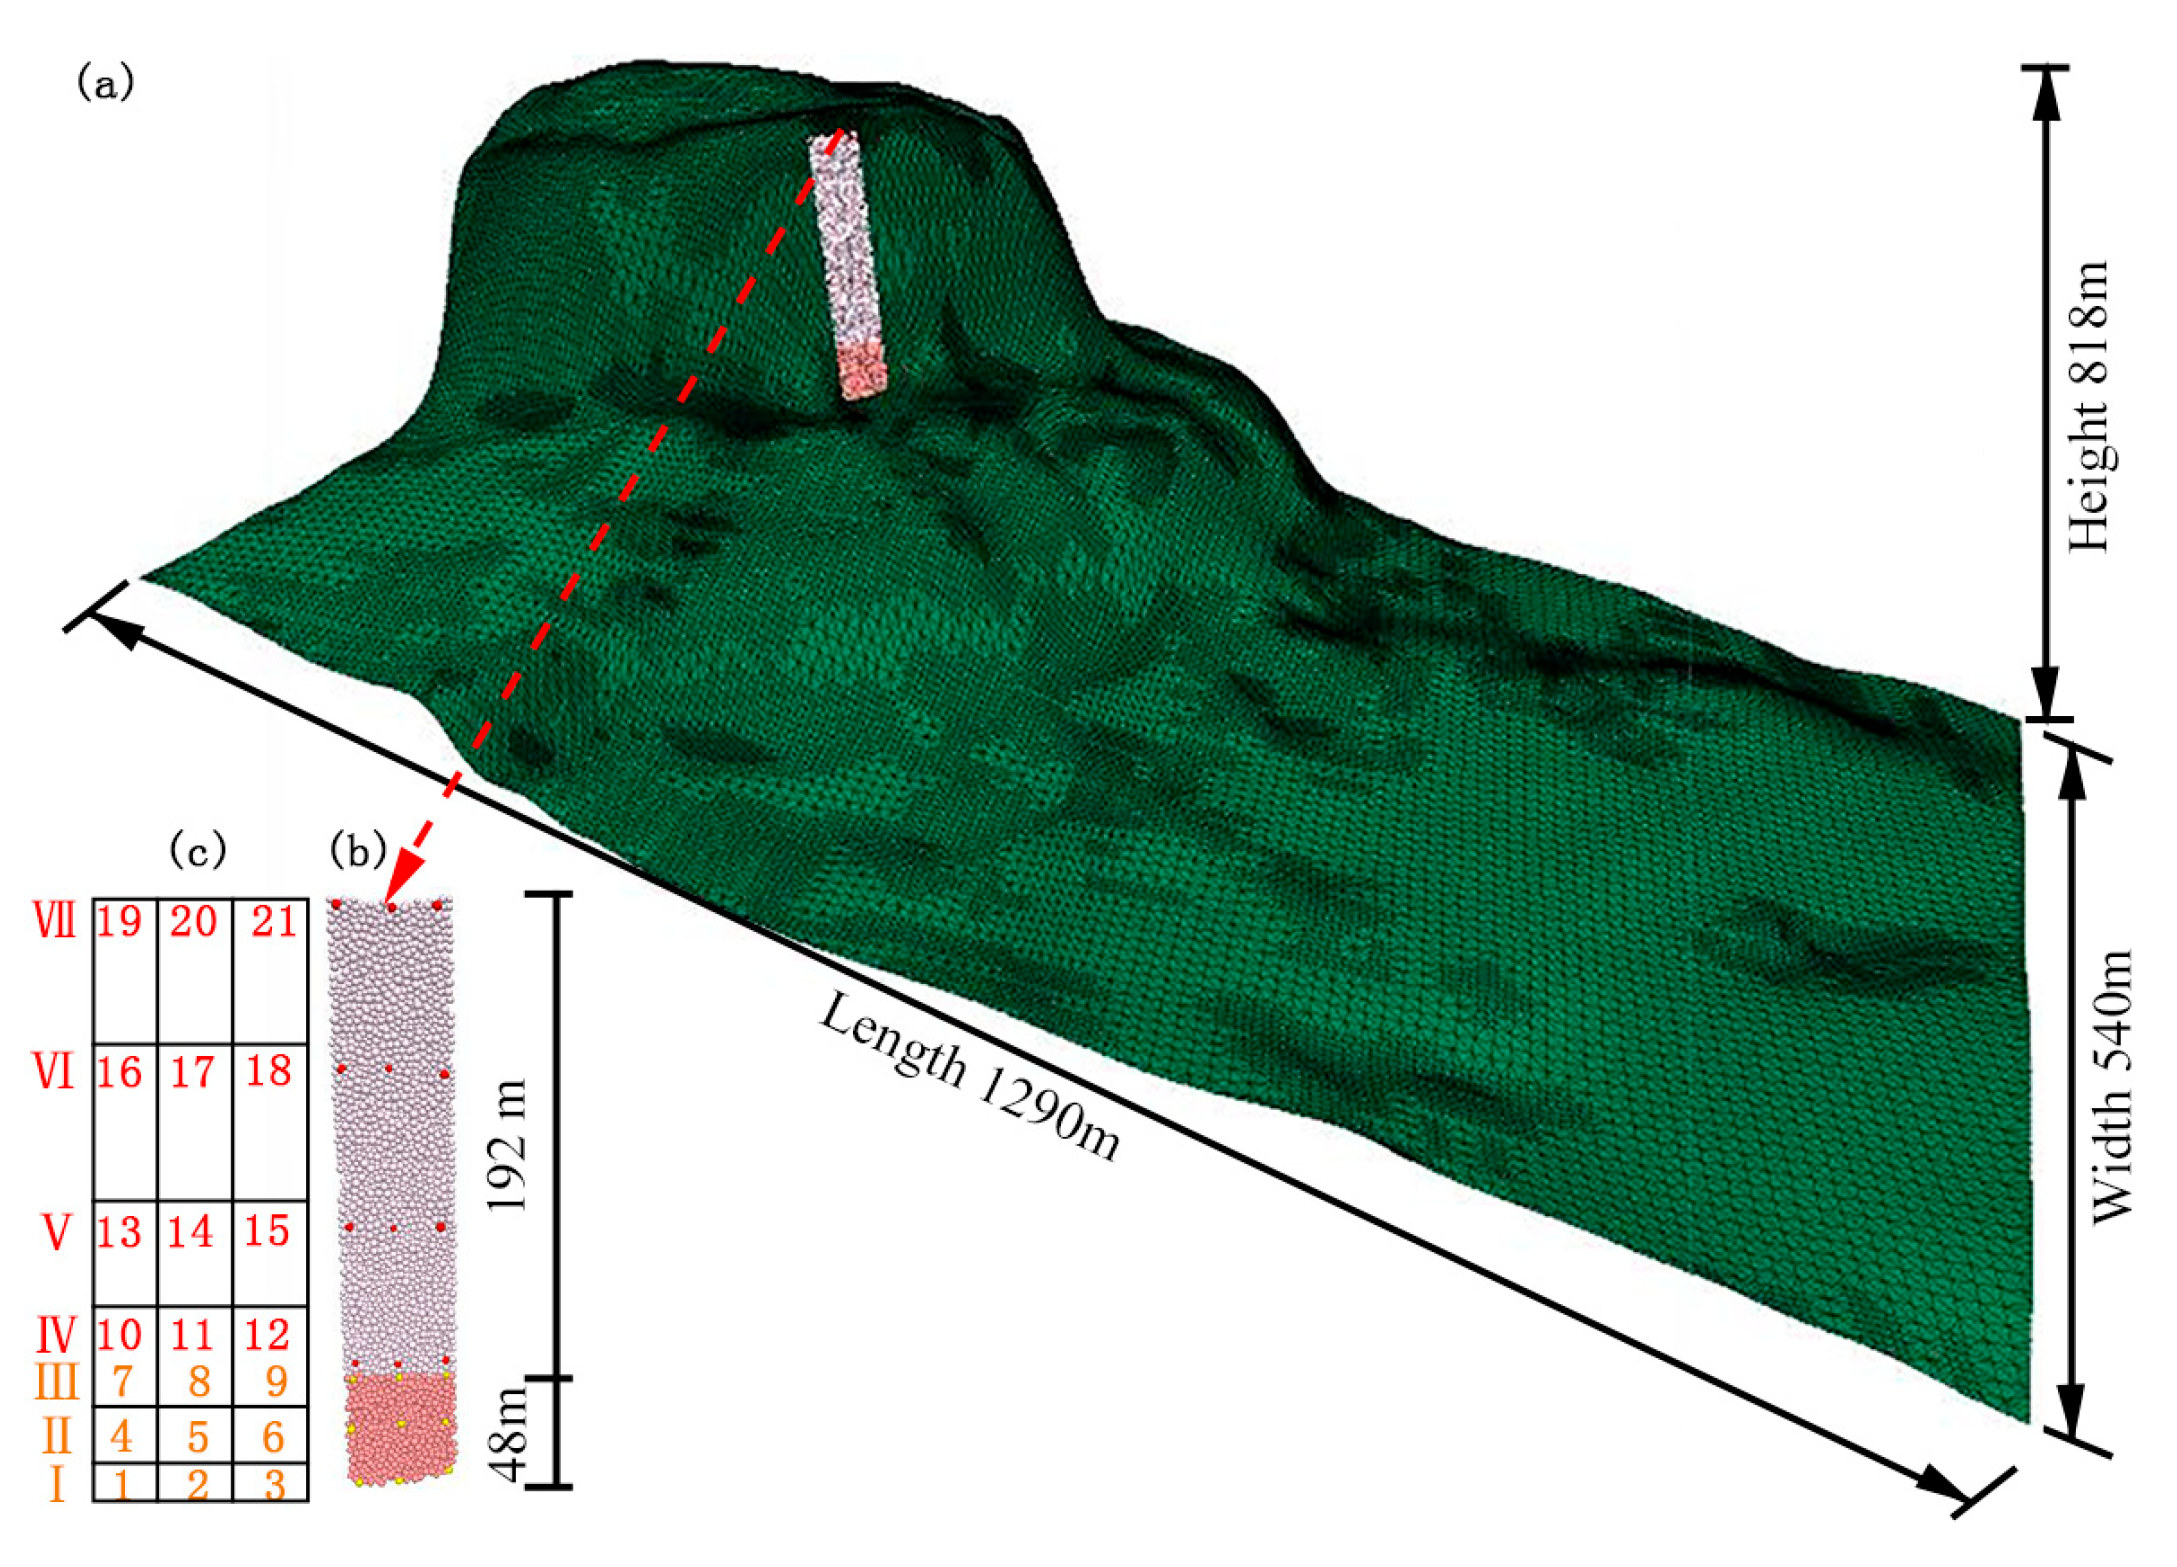
In order to improve computational efficiency, the Ball-Wall method is often used to establish a three-dimensional numerical model when the PFC3D software simulates large-scale unstable rock avalanches [4]. In this study, the wall element was used to simulate the three-dimensional topography of the retort rock, the spherical element was used to simulate the TCURM, and the constitutive model was used to adopt the PB bonding model [18]. The method and process of model construction can be referred to the idea of Ref. [29]. In Figure 5a, the three-dimensional terrain is 540 m in transverse width, 1290 m in longitudinal length, and 818 m in relative elevation, consisting of 65,179 wall elements. In Figure 5b, the unstable rock mass is composed of 7106 spherical particles with a particle size ranging from 0.1 m to 0.17 m. It is divided into two parts: the rock mass in the middle-upper non-deteriorated zone (with a height of 192 m) and the rock mass in the bottom deteriorated zone (with a height of 48 m). To monitor the movement characteristics and dynamic evolution process of different parts of TCURM, nine monitoring points (No. 1~9) in three layers are set at equal intervals in the deterioration area, and 12 monitoring points (No. 10~21) in four layers are set at equal intervals in the non-deterioration area. These points are marked with different colors, and their stratification and numbering distribution are shown in Figure 5c.
Figure 5.
Three-dimensional numerical model of the W12# TCURM in Zengziyan cliff: (a) shows the overall three-dimensional terrain topography; (b) illustrates the unstable rock mass divided into two zones; (c) exhibits the distribution of monitoring points with stratification and numbering.
5. Results and Analysis
The numerical simulation of the unstable rock collapse movement process not only can reproduce its movement path and disaster-causing range, but also obtain key parameters such as velocity, kinetic energy, and impact force—these parameters are core indicators for characterizing the disaster-causing capacity of unstable rock collapse and the intensity of impact-induced hazards [30], which will be specifically analyzed and discussed in the subsequent sections.
5.1. Characteristics of the Lower Seat Impact Movement
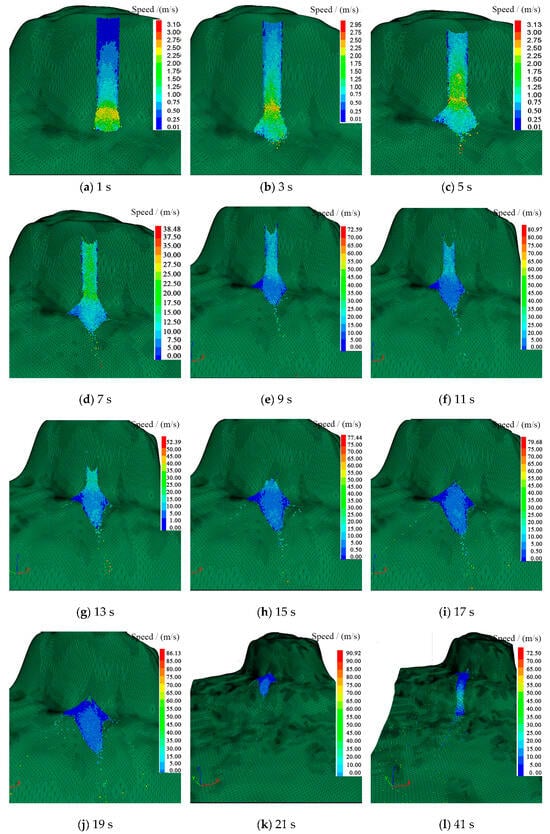
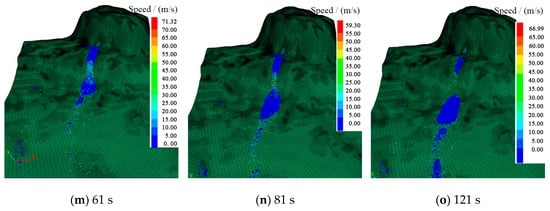
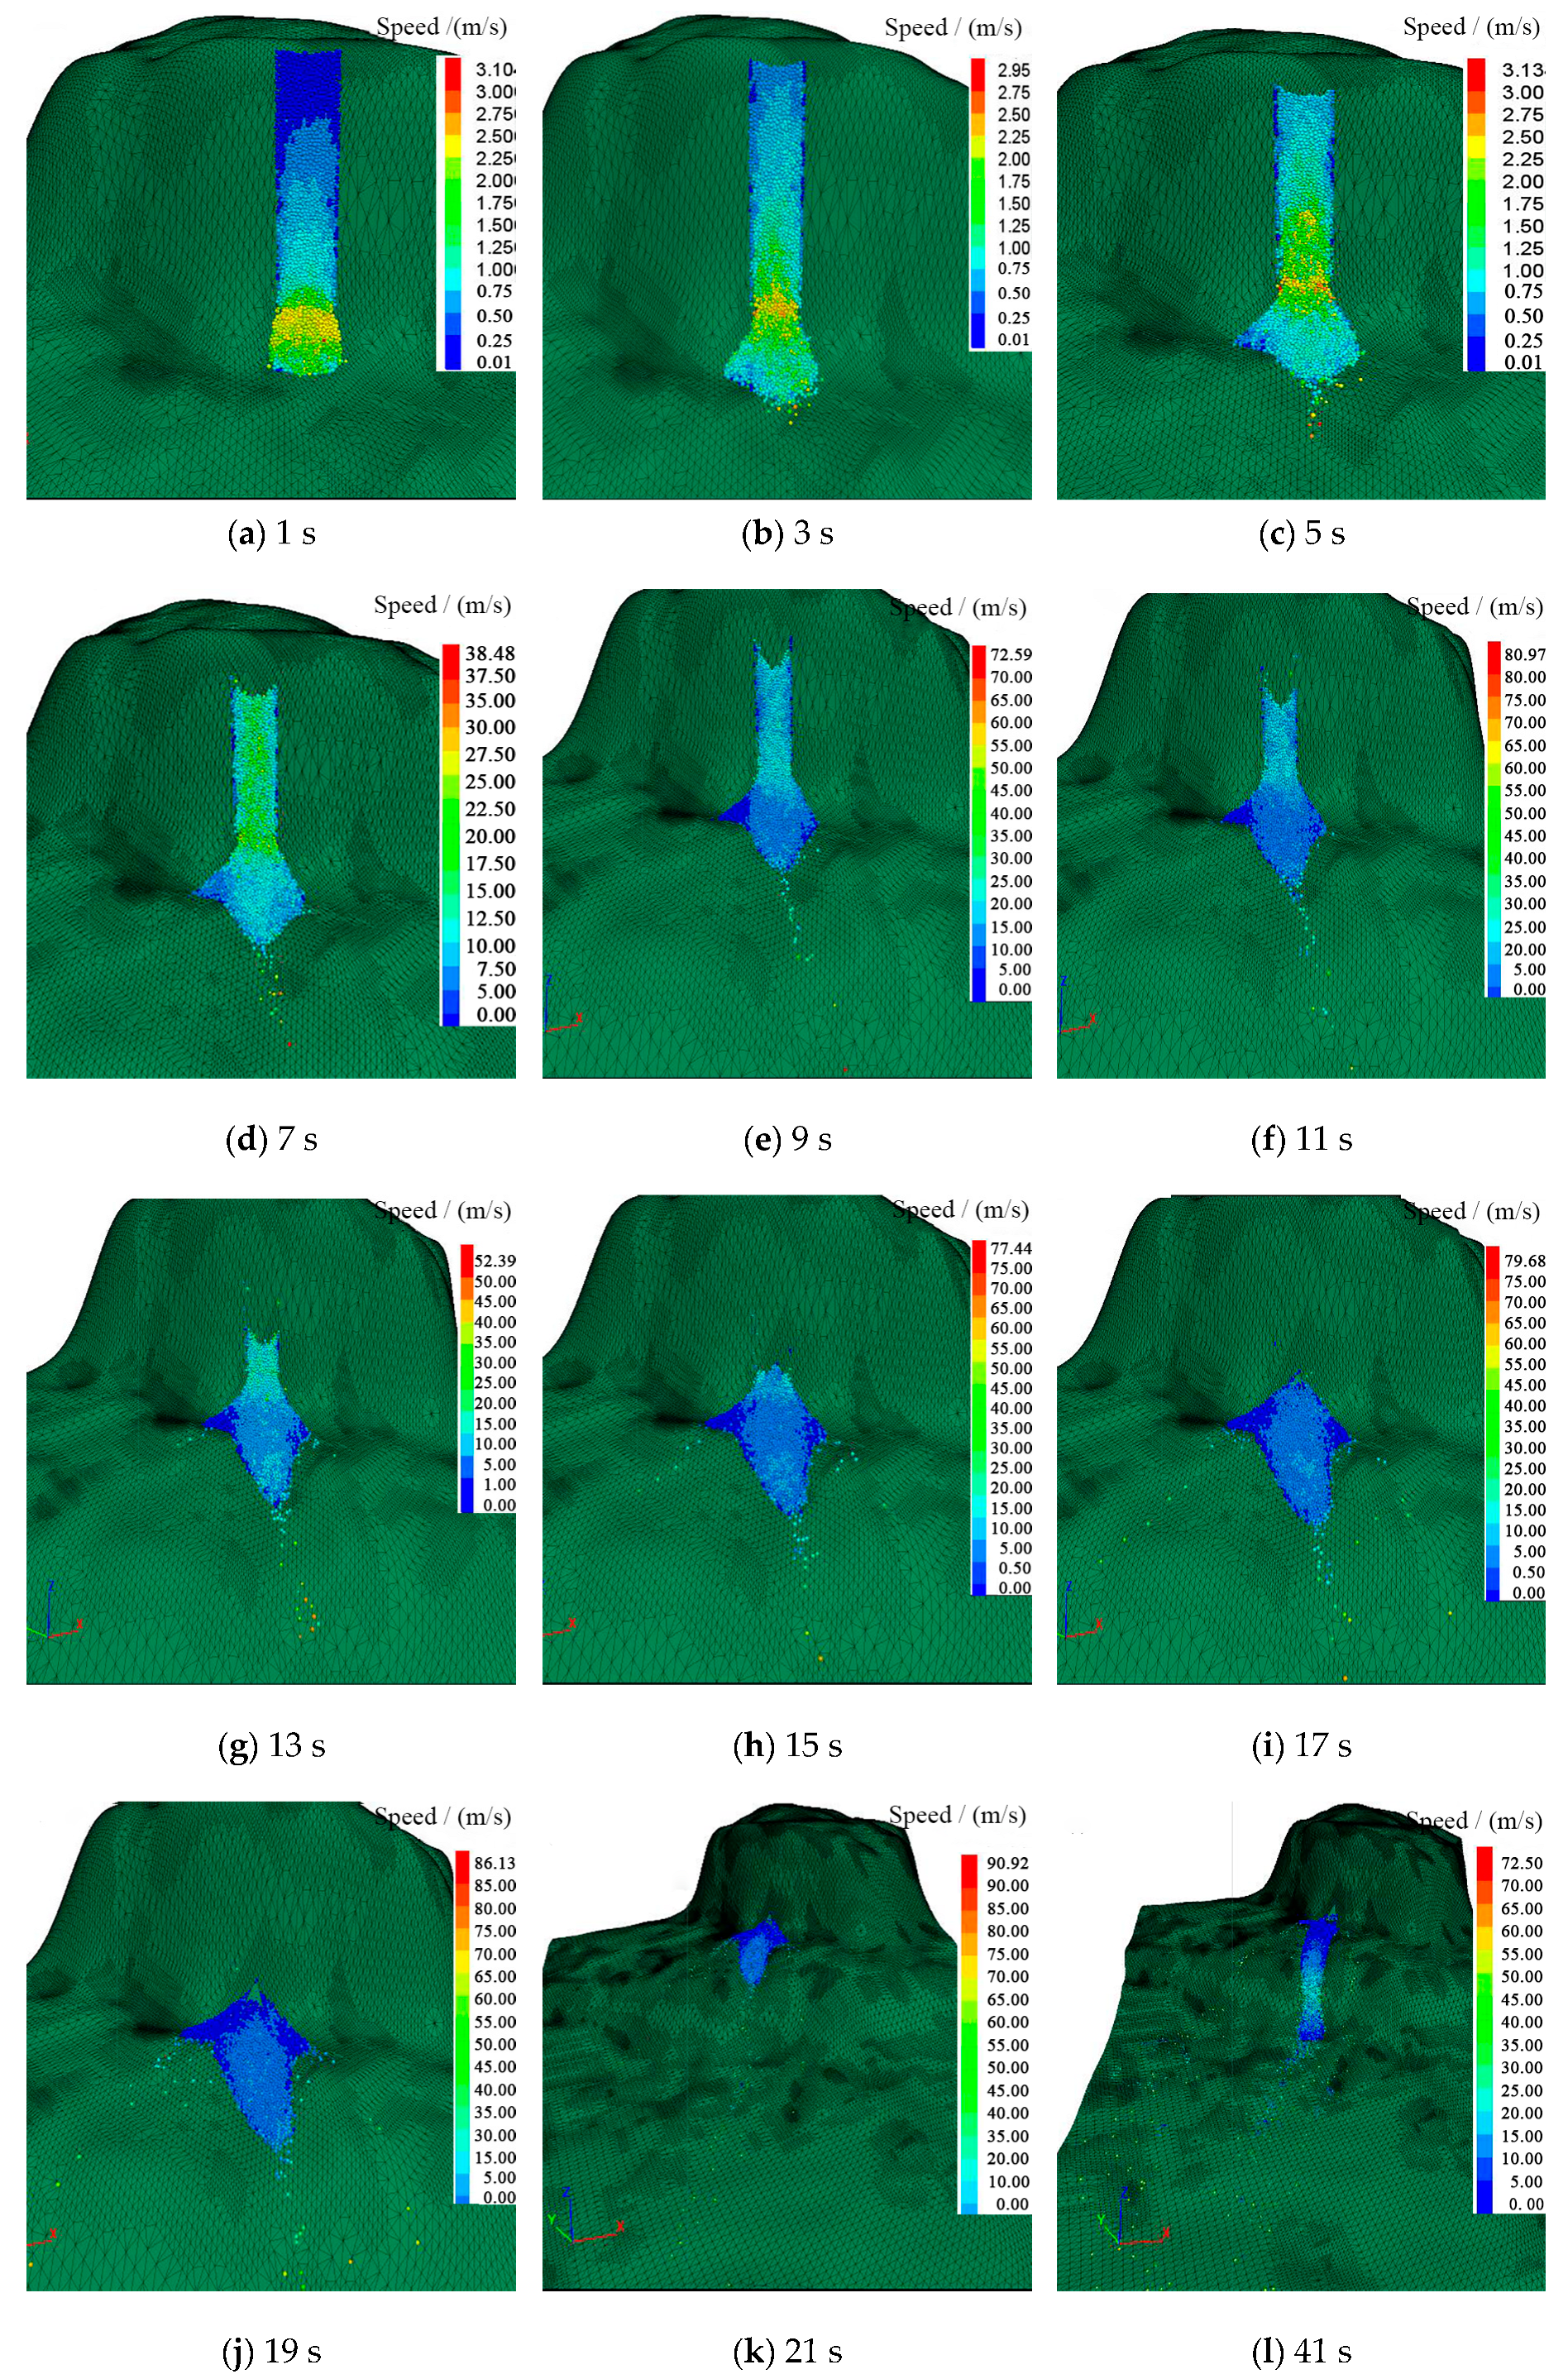
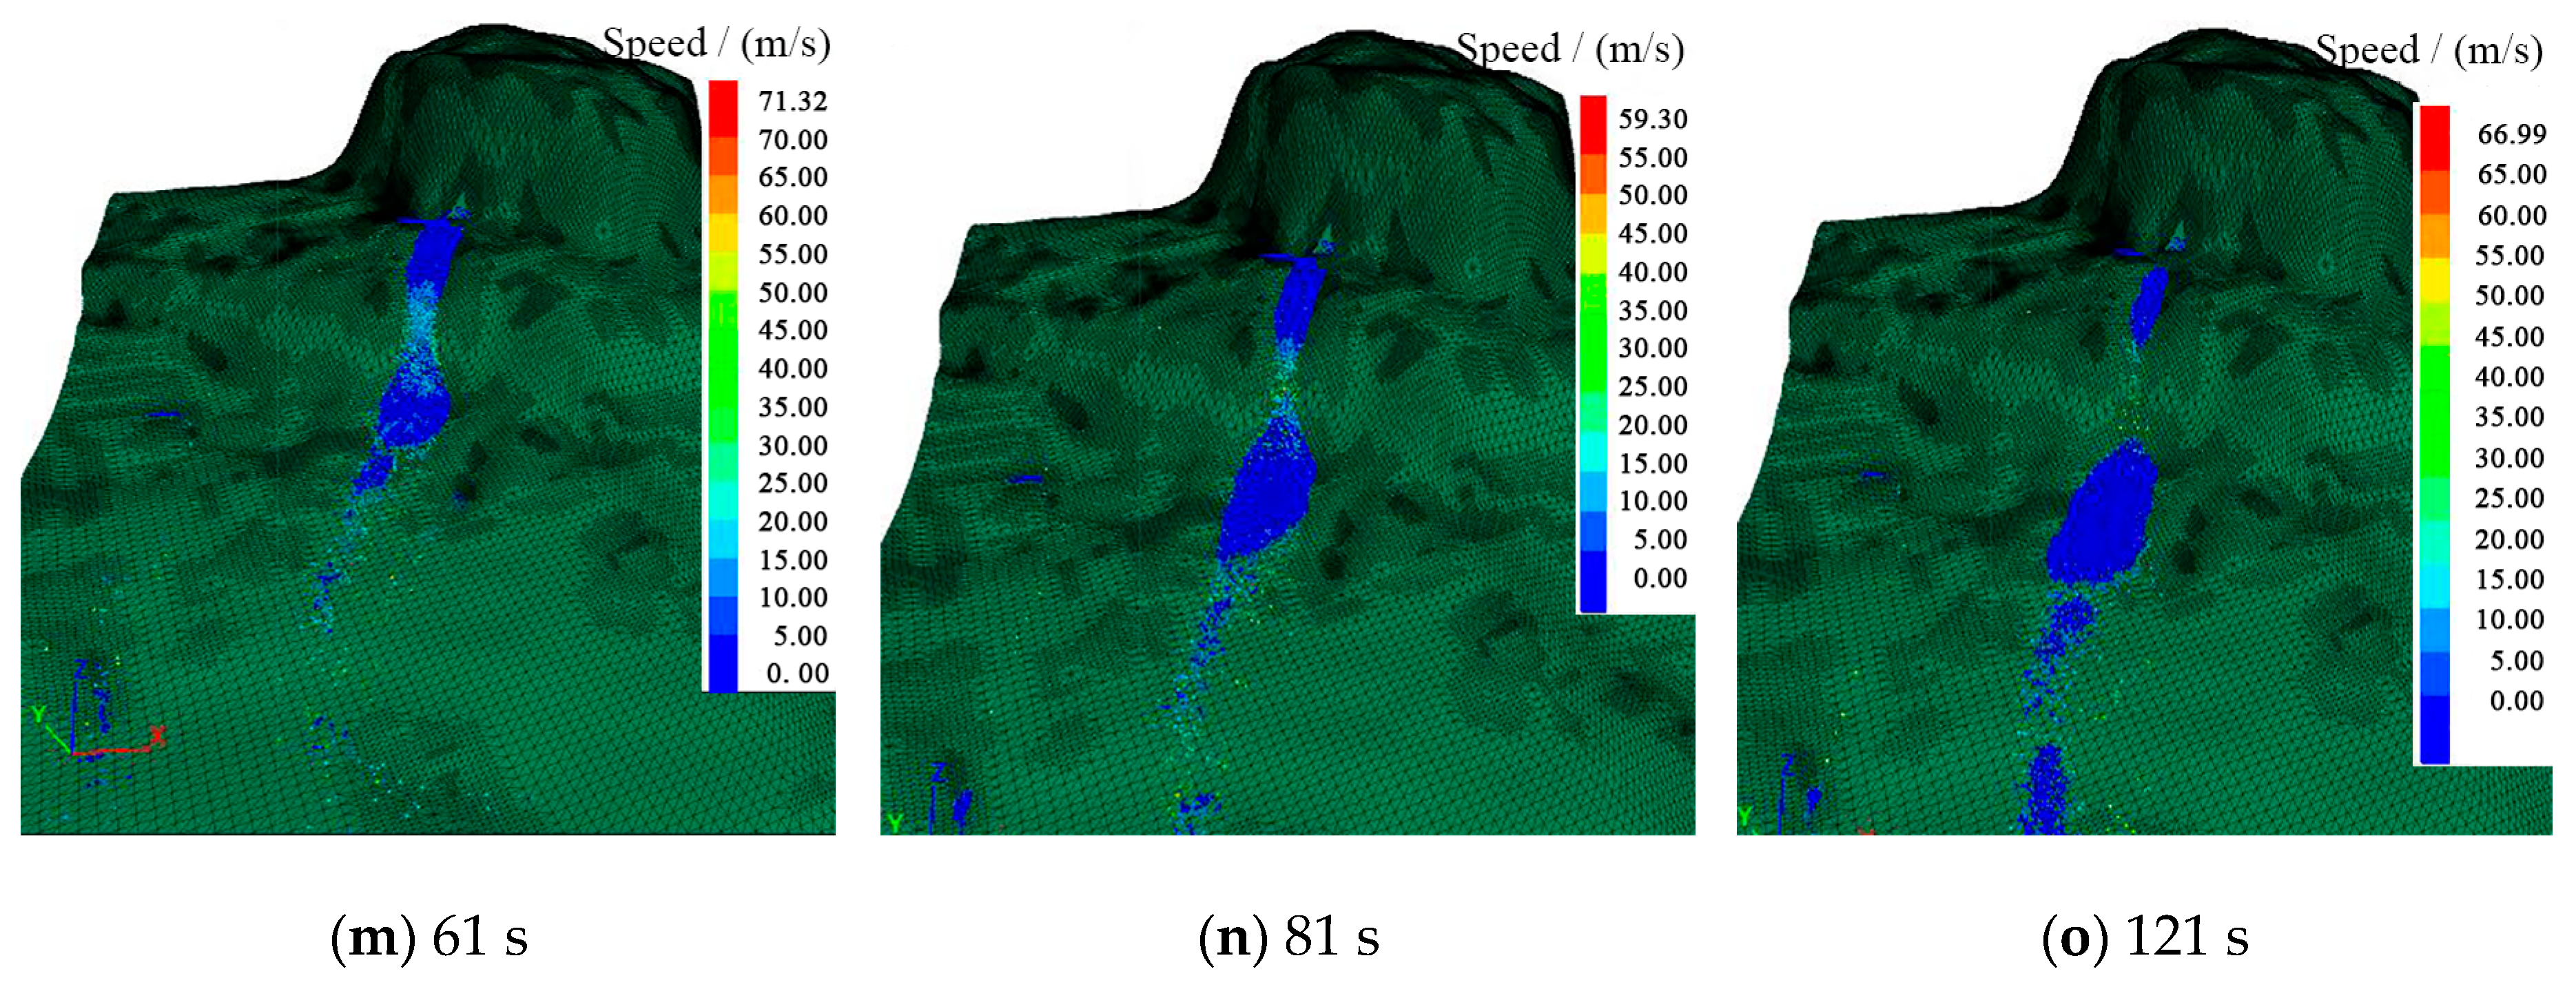
As can be seen from Figure 6, this study inverts the entire process of slumping-disintegrated evolution of the Zengziyan collapse using the established 3D model and the total time from the instability to the cessation of movement of the unstable rock is about 121 s, the time for the lower seat to impact the base of the second-level steep cliff is about 15 s, and the time for the impact disintegration debris to move to the stop is about 106 s. In the early stage of fracturing instability in the unstable rock deterioration area (0~5 s), the bottom rock mass is fractured and extruded at a low speed of 1.25~3.13 m/s, and the top rock mass is lowered at a low speed of 0~0.75 m/s. At the 5th~11th s, the middle and upper rock mass descended at a speed of 15~30 m/s. The rock mass in the bottom deterioration area was completely fractured and disintegrated, and slid along the base of the second-level steep cliff slope at a speed of 7.5~10 m/s, and the partially disintegrated rock blocks rushed out along the first-class cliff trench, with a maximum speed of 38.48 m/s, which was in the acceleration stage of the lower seat. The lower speed of the 11~15 s is slower than the upper speed, and the accumulation of the secondary steep cliff slope is mainly in this stage. At the same time, it has a blocking effect on the disintegration material of the subsequent lower seat, which corresponds to the deceleration stage of the lower seat.
Figure 6.
Velocity field in different spaces during the collapse process of the unstable rock mass named W12# in Zengziyan cliff.
The disintegration process of the lower seat is basically consistent with the video monitoring results, which is consistent with the division stages in Table 1, but the motion velocity obtained by numerical simulation is slightly lower than that obtained by the kinematic method, because based on the theoretical method of kinematic analysis, the friction, collision and impact energy dissipation between substances are not considered, and all the potential energy is converted into kinetic energy, so the velocity obtained by kinematics is high. In addition, the numerical results further confirm that the down-seat velocity distribution of the whole TCURM is non-uniform, and the bottom down-seat velocity is fast at the initial stage, and the down-seat velocity in the middle and upper parts is slow and exhibits hysteresis.
It should be noted that the numerical model established in this study has limitations in the quantitative comparison between simulated velocities and field kinematic velocities, and the relevant comparison is still mainly qualitative. Although the model can well reproduce the overall collapse process of the unstable rock mass, it cannot fully restore the random distribution characteristics of micro-scale joints and fissures in the rock mass due to the inevitable simplification of the complex actual geological conditions. In addition, the model does not consider the dynamic changes of environmental factors such as air resistance and the heterogeneity of surface roughness. These factors result in the inability to achieve in-depth quantitative matching analysis between simulated velocities and field velocities, which is also the key direction for the subsequent optimization and improvement of this model.
5.2. Characteristics of Whole-Domain Migration and Accumulation of Debris
The TCURM of the 15~21 s tower completed the disintegration of the lower seat, and decelerated and slid on the slope of the secondary base, and some of the debris spread to the periphery, and the disaster scope expanded. The sediments in the 21~81 s poured down along the first-class cliff trench, and the migration speed was about 25~50 m/s. The debris is affected by the collision and friction energy dissipation along the way, and the movement speed is reduced, but when it pours from the first-class cliff, the debris in this area still maintains a high movement speed due to the influence of potential energy and rotational energy. By 121 s, three main static accumulation areas were formed, some of which were located on the second-level steep cliff slope, most of them were located at the foot of the first-class steep cliff, and the rest were distributed in the gentle slope area about 800~900 m away from the collapse source area. The distribution range of the sediments is basically consistent with the literature survey data [22].
In this study, a comparative verification was conducted between the numerical simulation results of TCURM collapse and theoretical calculation formulas. The actual vertical drop of the unstable rock mass in the study area is 240 m, the volume of the sliding mass is 5.2 × 10⁵ m3, and the slope angle is approximately 15°. The empirical formula for the travel distance of collapse debris proposed by Xuanmei Fan [31] was adopted:
where L is the theoretical travel distance of debris (m); H is the elevation difference between the front and rear edges of the collapse mass (m); V is the volume of the collapse mass (m3); and β is the slope angle (°).
The theoretical travel distance of debris calculated by the formula is 615.6 m, and the maximum horizontal travel distance obtained from numerical simulation is 600 m [32]. The two values are generally close, indicating good consistency between the theoretical calculation based on potential energy conversion and the numerical simulation results, thereby verifying the reliability of the numerical simulation method and results adopted in this study.
Therefore, from the characteristics of velocity change and debris accumulation stage in the sub sediment impact stage, it can be seen that the established three-dimensional numerical model is reasonable, which can make up for the limitations of the actual monitoring range, and completely reconstruct the initial instability process, movement path, and hazard-affected range of the unstable rock collapse, achieving the dynamic reproduction of the entire collapse process across the whole domain. This thus provides scientific reference for the risk assessment of similar stratigraphic lithology rock collapses in steep cliff landform areas.
5.3. Characteristics of Whole-Domain Velocity Distribution in Different Parts of TCURM
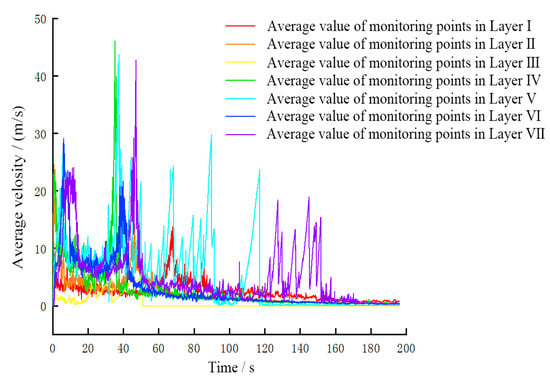
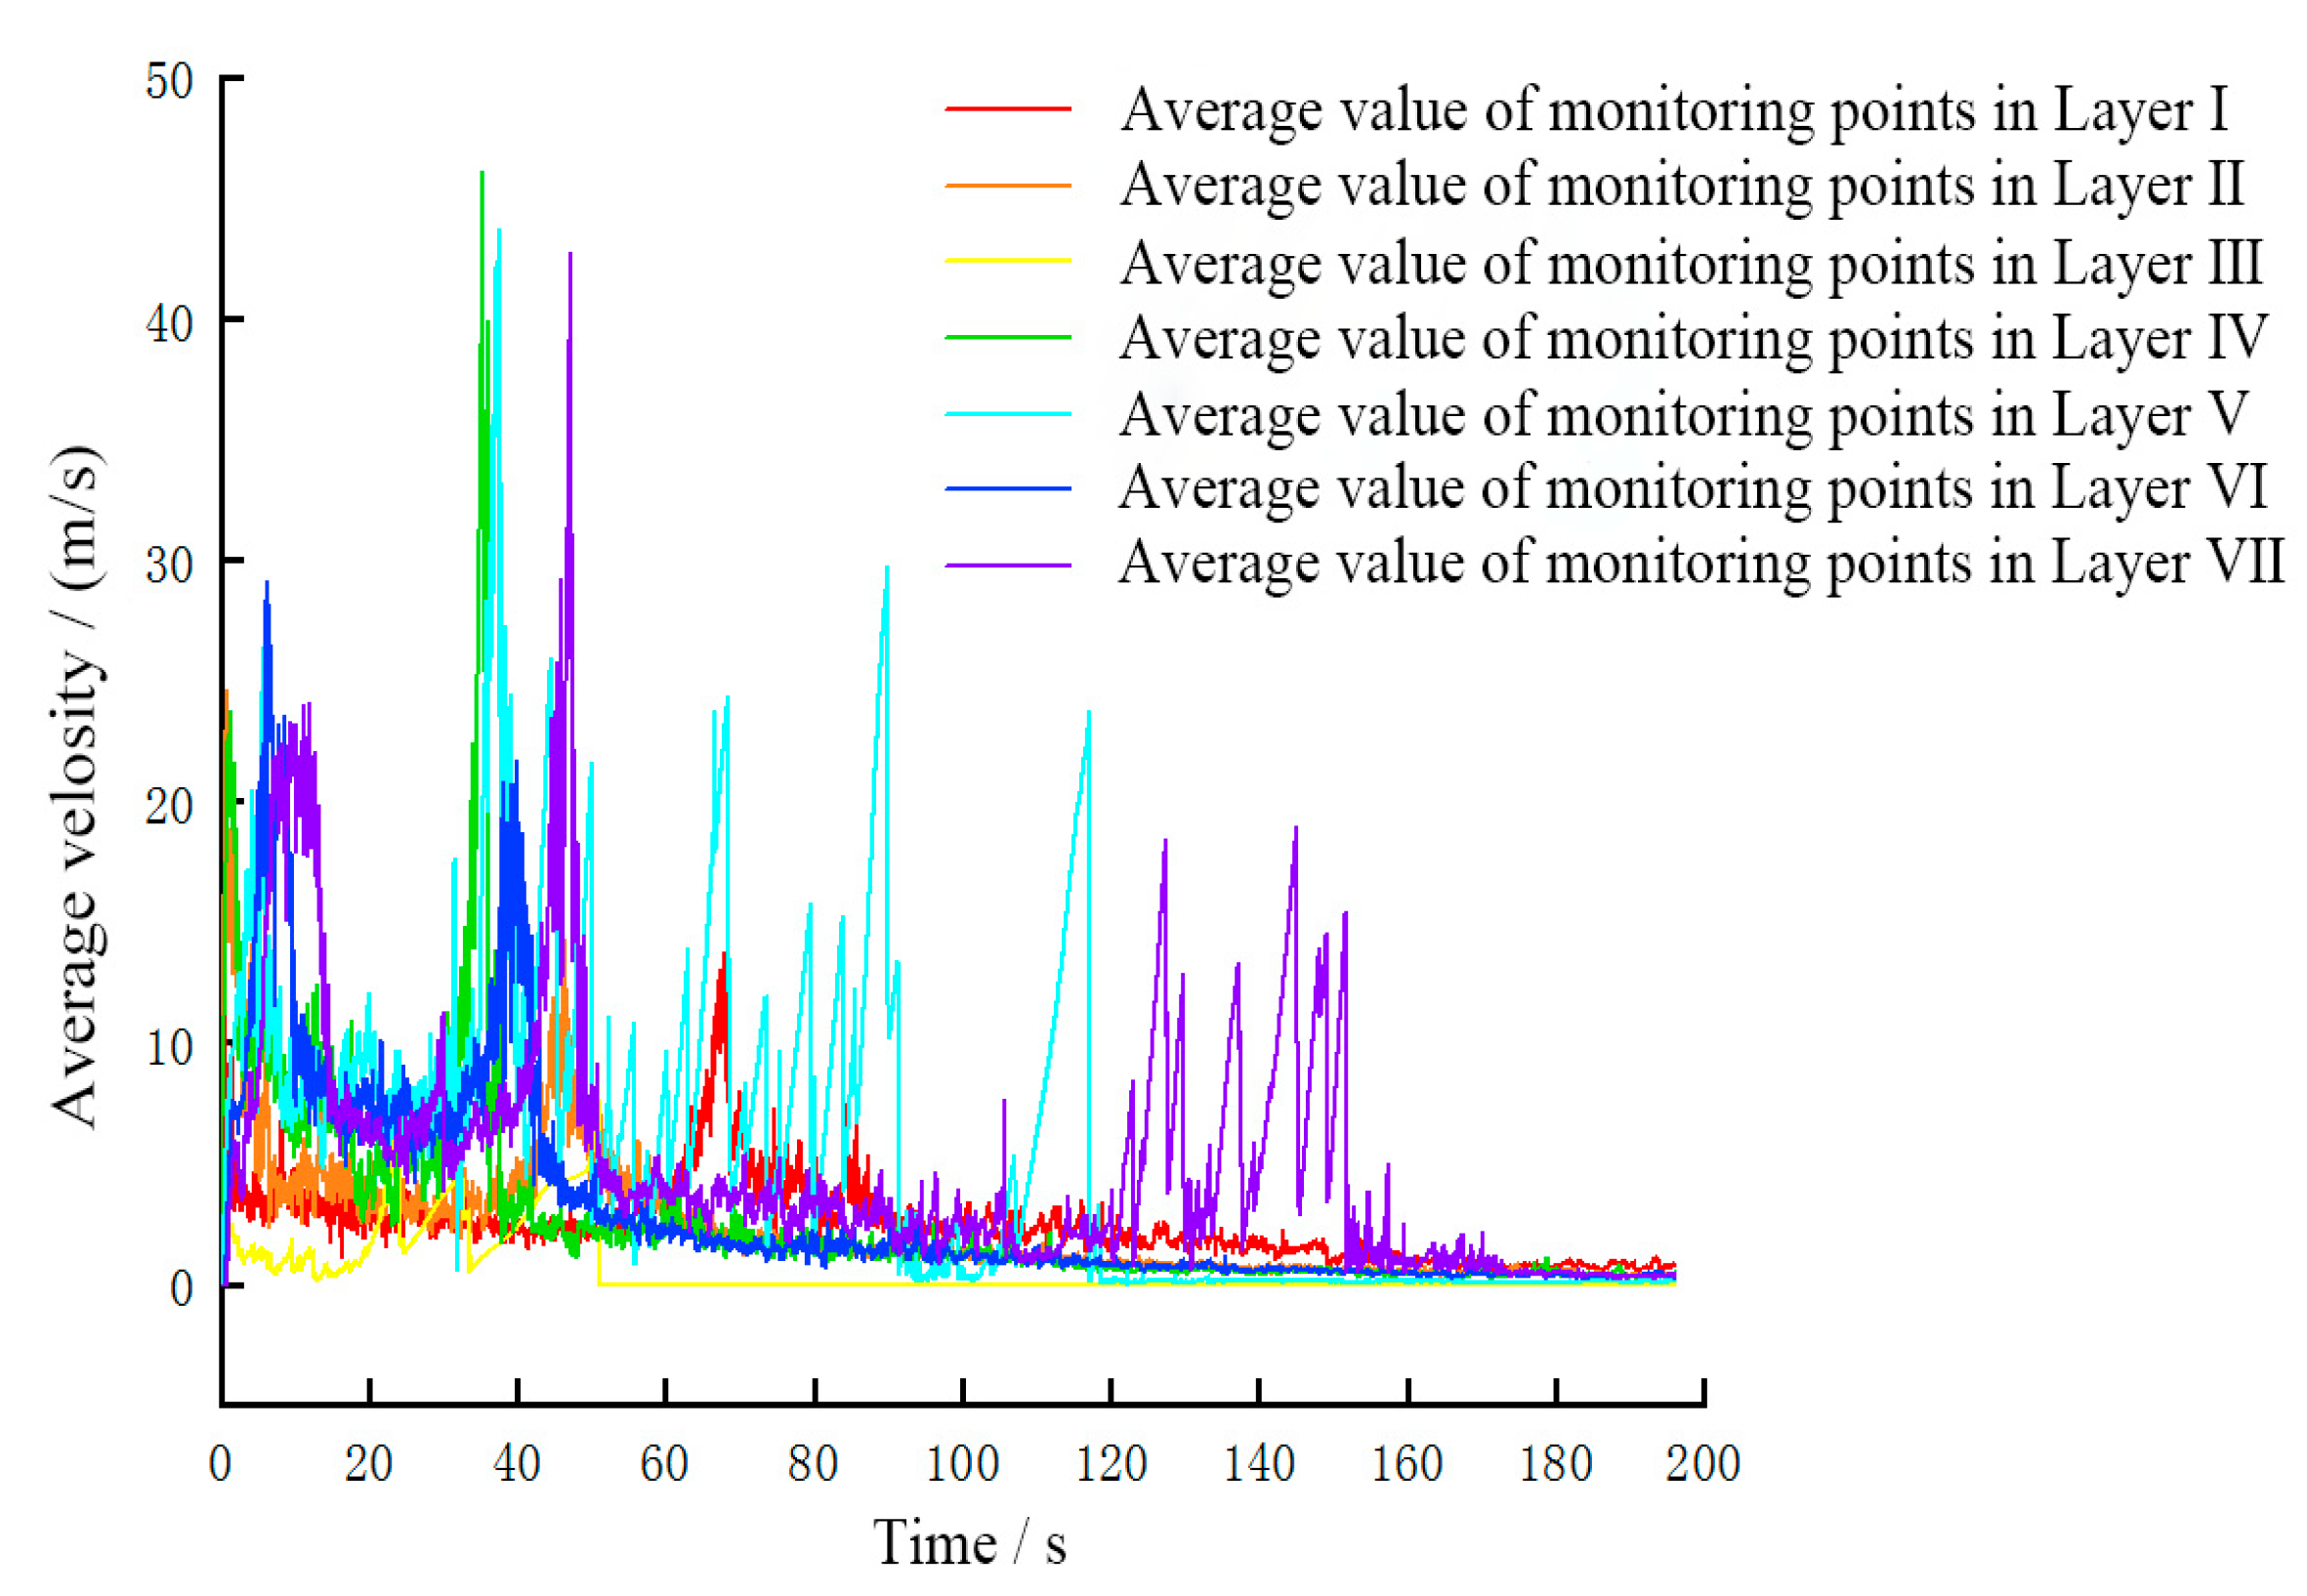
According to the characteristic monitoring points set in Figure 5b, the curves of the movement velocity of each layer in the deterioration zone and non-deterioration zone during the collapse of unstable rock are obtained, as shown in Figure 7. The following can be seen:
Figure 7.
Average velocity in different elevations of the deterioration and deterioration area of the unstable rock mass named W12# in Zengziyan cliff.
- 1.
- The overall trend of the time history curve of the movement velocity of the deterioration zone and the non-deterioration zone is basically the same, and both have the characteristics of “bimodal type”, the first velocity peak of each layer appears within 20 s, and the peak velocity of the deterioration zone is lower than the peak velocity of the non-deterioration zone, and the occurrence time is earlier, because the monitoring points of each layer of the deterioration zone are located at the bottom of the TCURM, and their vertical downward distance and acceleration time are shorter than those in the middle and upper non-deterioration zone, resulting in the bottom deteriorated zone reaching the velocity peak of the first stage first, with a lower peak value. The second velocity crest of each layer is in the range of 30~50 s, and the peak velocity of the deterioration zone is lower than that of the non-deteriorating zone, but the occurrence time of the velocity crest of the deterioration zone lags behind that of the non-deteriorating zone. Observations from the numerical simulation reveal that during the slumping-disintegrated process, some particles in the bottom deteriorated zone are covered by particles in the middle-upper non-deteriorated zone. This results in a time delay in the movement of bottom particles from the base of the secondary steep cliff slope to the primary steep cliff, thus the accelerated falling time of the second velocity wave peak occurs later than that in the middle-upper non-deteriorated zone.
- 2.
- The second velocity crest in the deterioration and non-deterioration region is generally higher than the first velocity peak, because the first velocity crest evolves in the stationary state with the initial velocity of 0, and the second velocity crest is based on a certain initial velocity and further increases.
- 3.
- The second velocity peak of the non-deterioration area is greater than the second velocity peak of the deterioration area, because the height of the deterioration zone is 48 m, and the height of each monitoring layer in the non-deterioration area is 48~192 m, so the non-deterioration zone has a larger acceleration stroke and longer acceleration time, so the second velocity peak of the deterioration zone is lower than the first velocity peak, and the second velocity peak of the non-deterioration zone is higher than the first velocity peak.
- 4.
- After the 60th s, the average velocity of the particles in the V and VII layers of the non-deteriorating zone fluctuated “jagged” and the amplitude was large, which was due to the fact that some particles deviated from the main sliding axis and were affected by the micro-geomorphological undulation characteristics during the movement along other paths, resulting in steep drop and slope slip succession.
5.4. Characteristics of the Collapse Impact
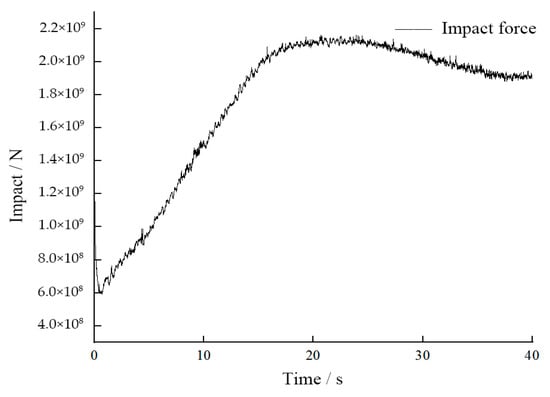
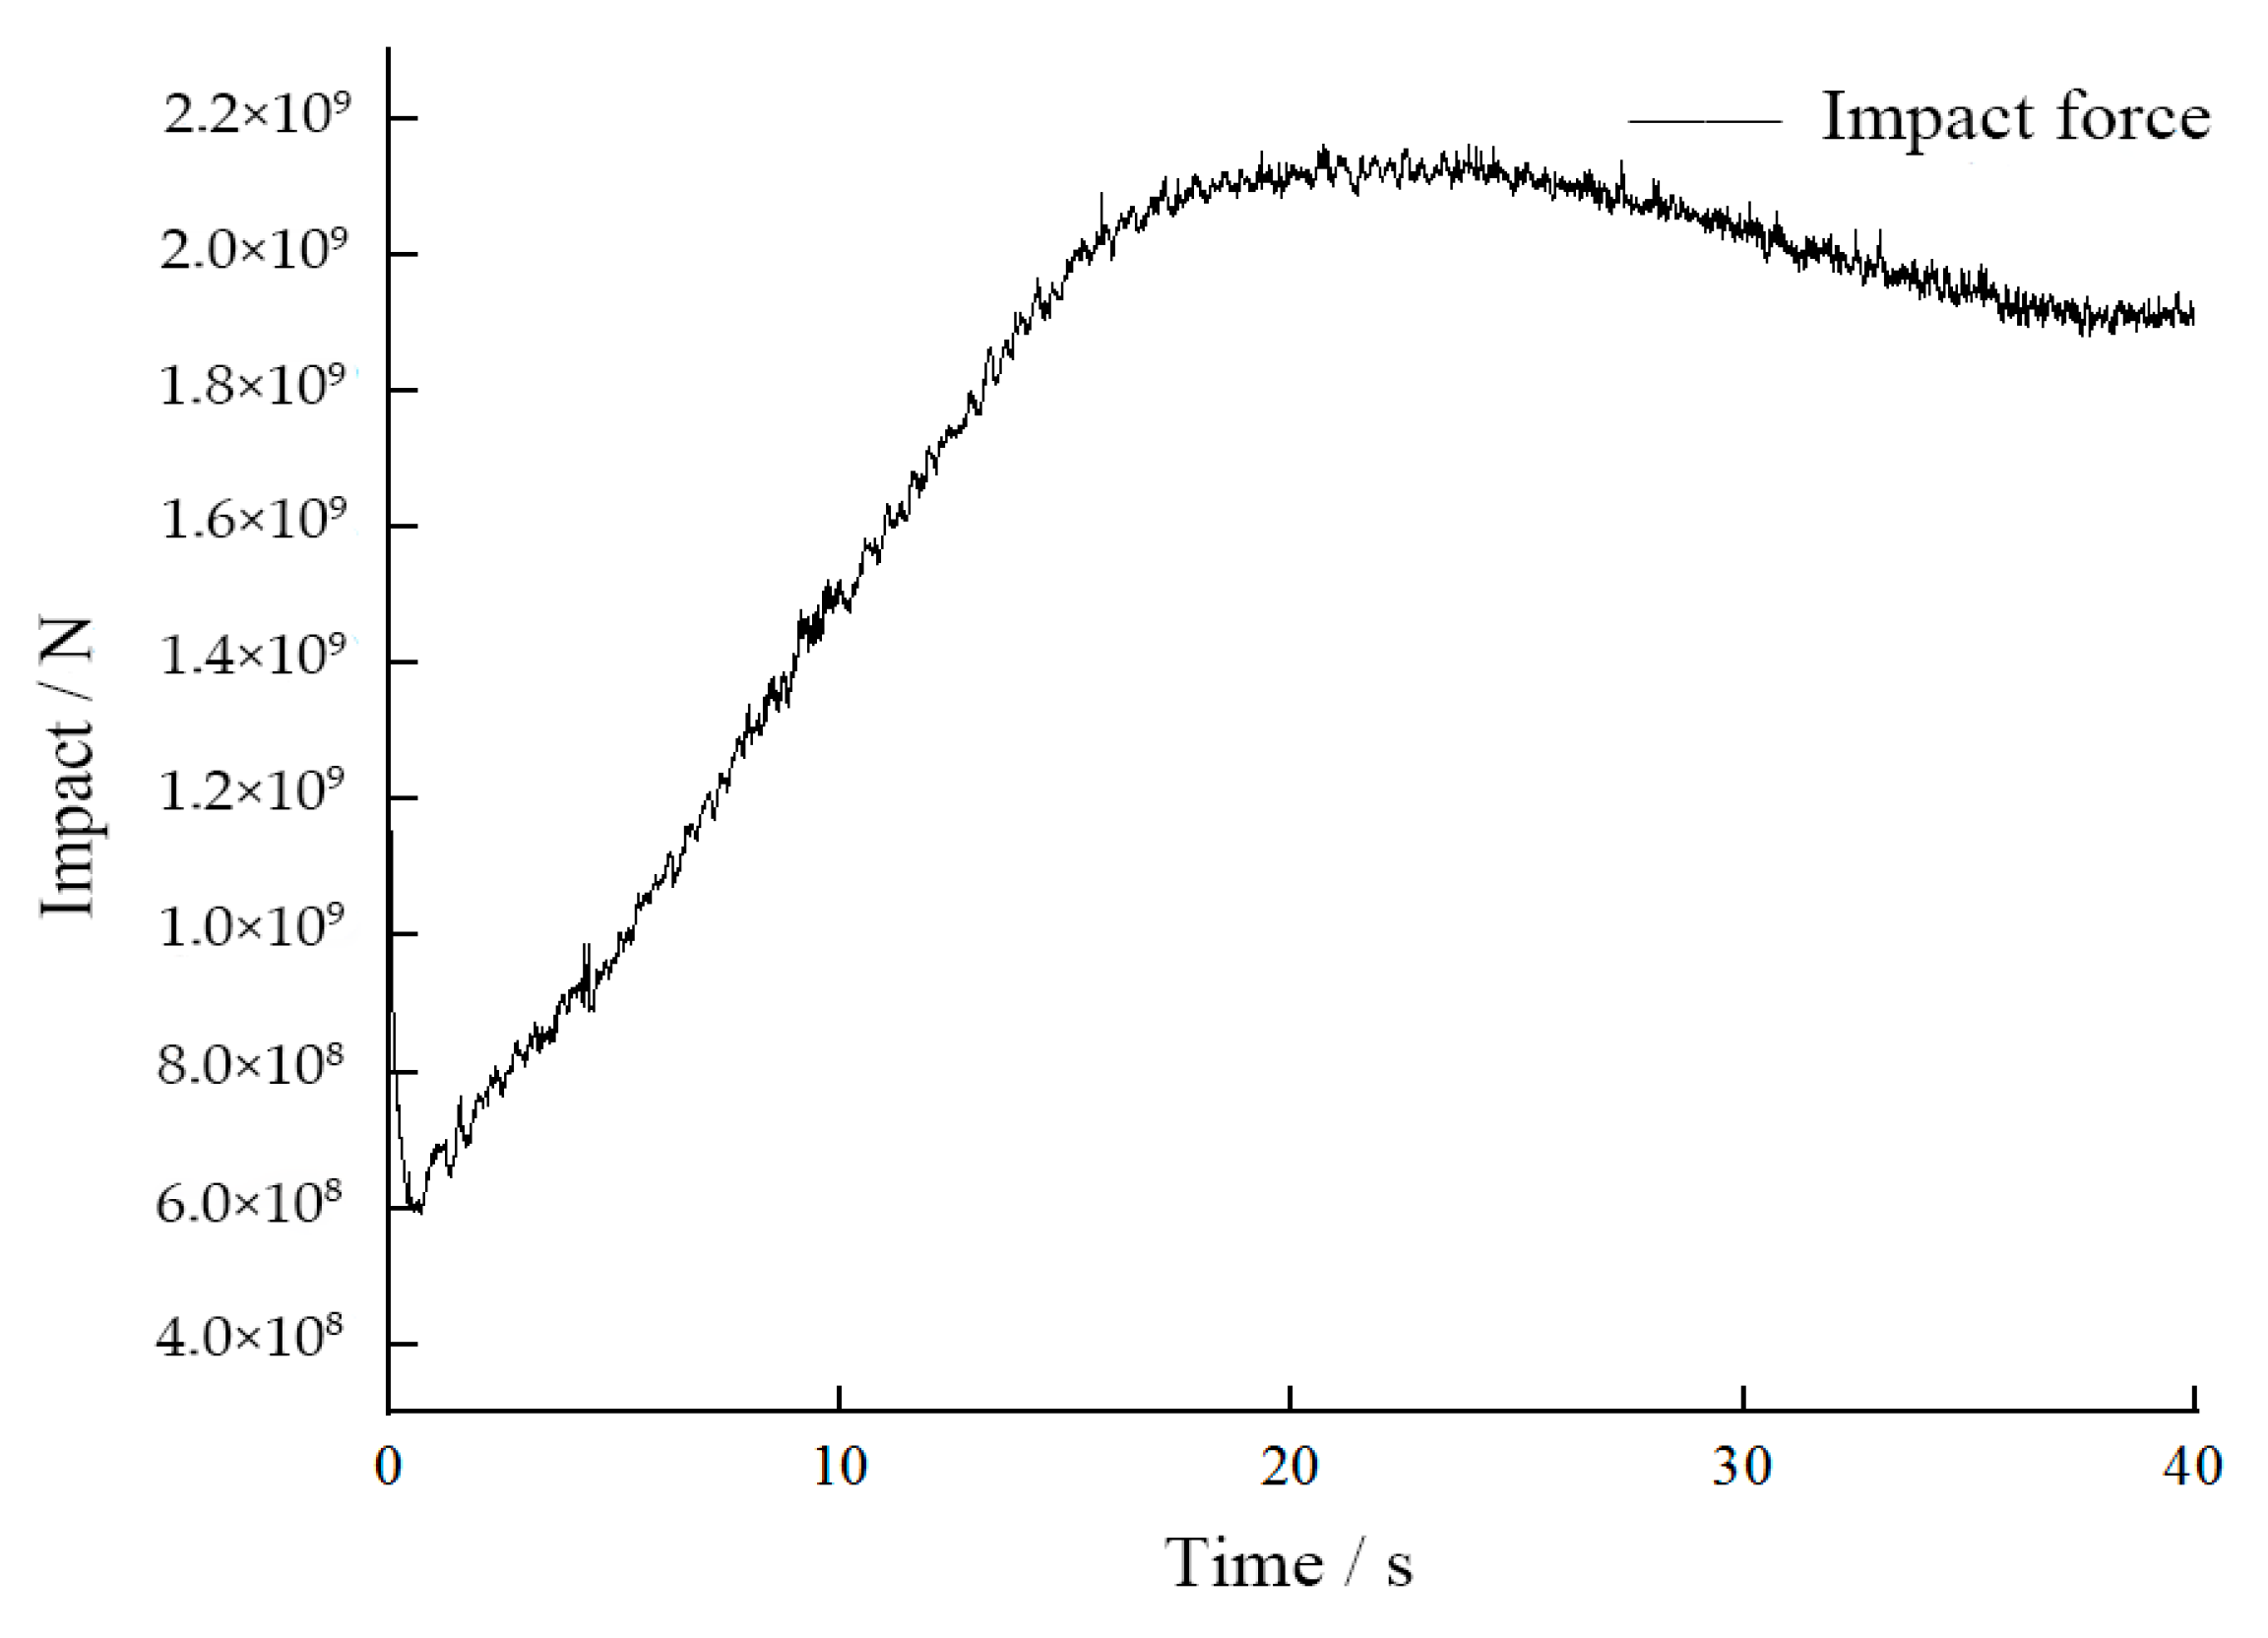
By detecting the value of the impact force of the base wall unit in the process of the TCURM down seat, the impact force time history curve can be obtained, as shown in Figure 8:
Figure 8.
Curve of impact force with time during collapse of the W12# unstable rock mass in Zengziyan cliff.
- 1.
- In the process of impacting the slope base of the 0~20 s unstable rock base, the impact force increases with the increase of time, and the reason for this phenomenon lies in the following aspects: initially, the upper rock mass has a greater vertical distance from the slope base; during the slumping process, the upper rock mass accelerates downward under the action of gravity, and when it slumps to the slope base, its accumulated impact velocity is significantly greater than that of the lower rock mass which first contacts the slope base; according to mechanical principles (impact force is positively correlated with impact velocity), a higher impact velocity corresponds to a greater impact force, thus showing the characteristic that the impact force increases with time.
- 2.
- In the short period of 20~25 s, the impact force fluctuates slightly around the maximum value of 2.1 × 10⁹ N, which is due to the fact that the upper rock mass basically completes the downloading process, but most of the debris is accumulated on the slope, and the impact force at this time is the contact pressure between the debris and the slope.
- 3.
- The peak stress converted according to the peak impact force is about 65.625 MPa, which is greater than the calculation result of 42.33 MPa in Ref. [33], which is due to the numerical model that the particles are continuously lowered to the impact base, and the impact velocity of the particles near the top of the unstable rock is greater, while Ref. [33]. According to Hertz’s theory, the impact velocity is considered the average value, so the impact force obtained in this paper is greater.
- 4.
- After the 25th s, the debris moved to the vicinity of the first-class cliff, and in the process of continuous pouring and falling, the debris accumulated on the slope of the second-class cliff was continuously reduced to a certain accumulation, resulting in a decrease of the contact pressure between the debris and the slope, and finally tended to be stable.
5.5. Characteristics of Collapse Energy of TCURM
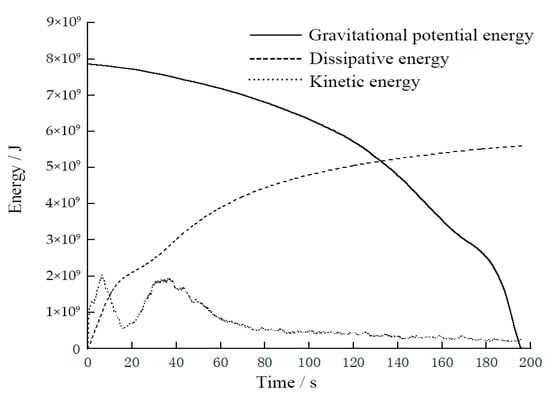
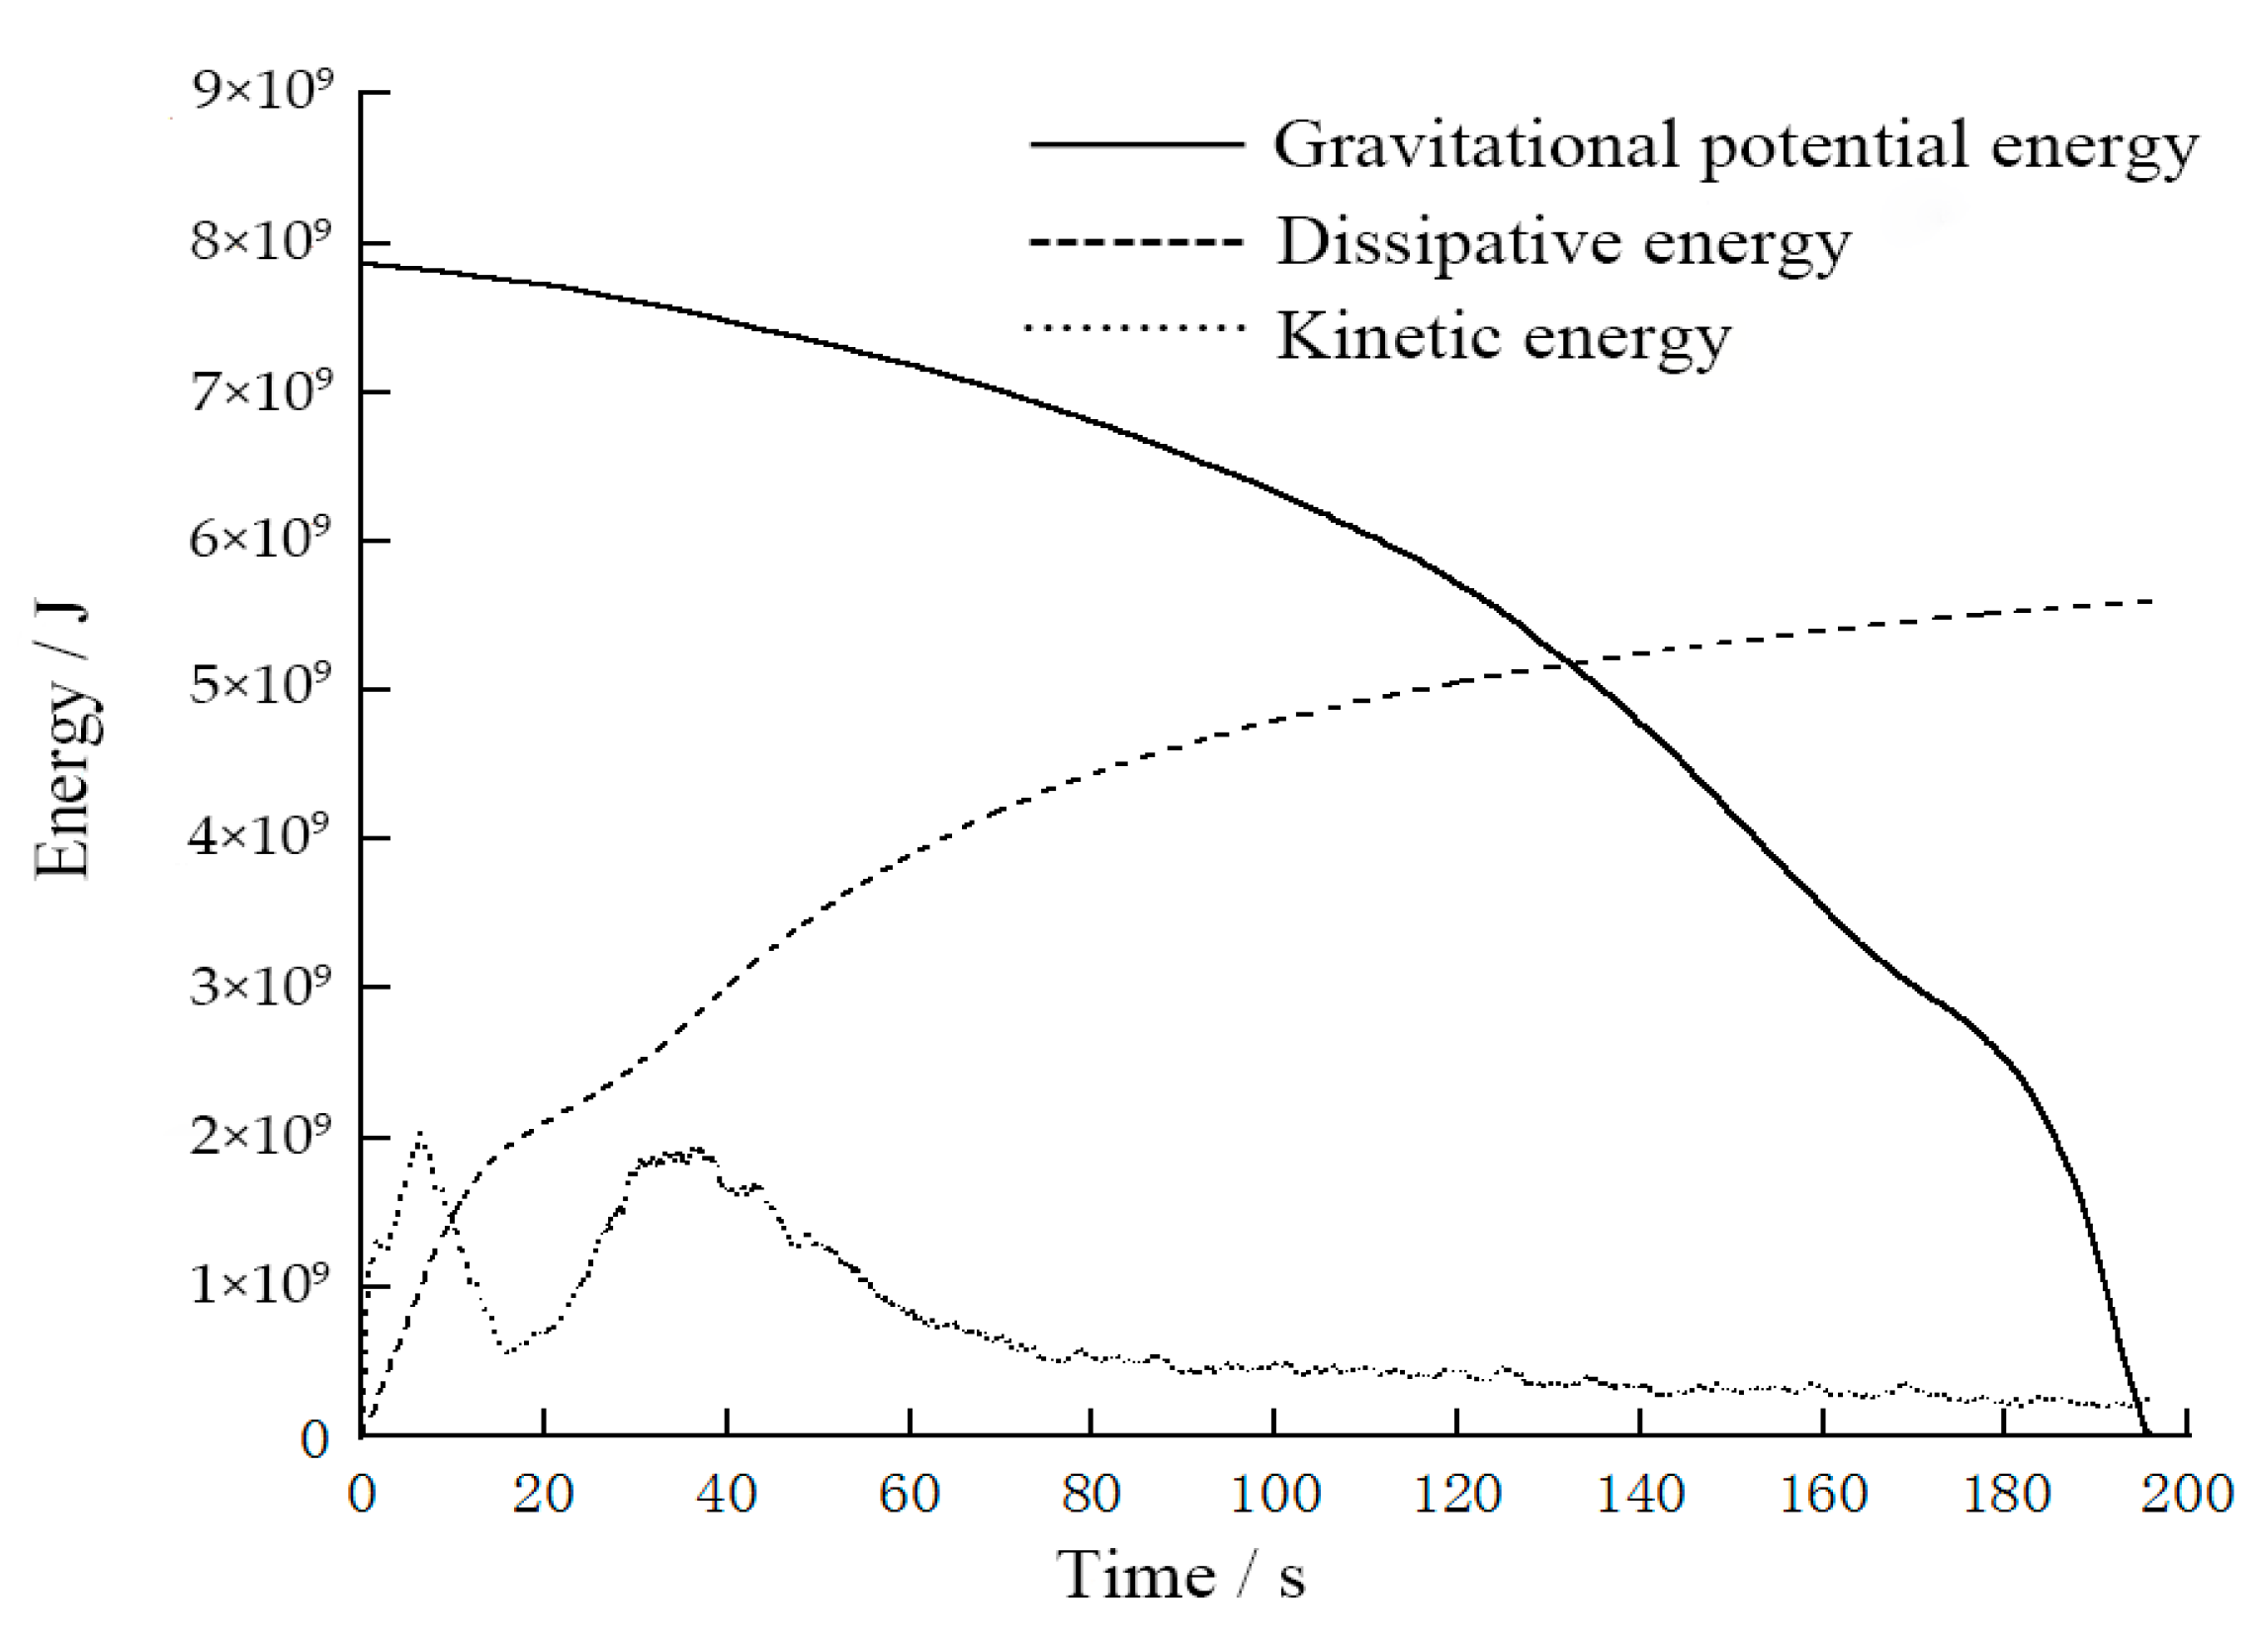
The energy source of the whole process of collapse movement is mainly gravitational potential energy, and there is internal frictional energy loss, heat energy dissipation, particle collision energy dissipation, acoustic emission energy loss, fracture dissipation energy, and kinetic energy in the process of movement, but the gravitational potential energy is finally converted into friction energy, collision energy, and heat energy [4]. Throughout the entire process of unstable rock collapse, gravitational potential energy serves as the core energy source. Various forms of energy conversion and dissipation occur during the collapse movement, specifically including internal friction energy dissipation, thermal energy dissipation, particle collision energy dissipation, acoustic emission energy dissipation, fracture dissipation energy, as well as kinetic energy and gravitational potential energy. Among these, gravitational potential energy is ultimately converted into friction energy, collision energy dissipation, and thermal energy [4]. To quantitatively analyze the characteristics of energy evolution, this study refers to the PFC6.0 help file of the parallel bonding PB model, and programmatically obtains the gravitational potential energy (energy-body), dissipative energy (damping dissipative energy-damp, contact sticky pot dissipative energy-dashpot, contact sliding dissipative energy-slip), and kinetic energy (energy-kinetic) on the entire collapse motion time domain), as shown in Figure 9.
Figure 9.
Curve of energy with time during the whole fracturing-induced slumping and accumulation process of the W12# unstable rock mass in Zengziyan cliff.
The following can be seen from Figure 9:
- 1.
- The gravitational potential energy decreases continuously and the dissipated energy gradually increases during the whole motion process, and theoretically the gravitational potential energy is completely converted into dissipation energy, but the dissipated energy obtained by the PB model only includes the energy dissipation forms such as damping dissipation, contact sticky pot dissipation and contact sliding dissipation, and does not include the dissipation energy forms such as fracture dissipation, acoustic emission and thermal energy, so the final dissipated energy accounts for only 75% of the gravitational potential energy;
- 2.
- In the first 60 s, the kinetic energy showed a “bimodal” distribution, the first energy peak was located at about 6.5 s, and its kinetic energy was about 2.05 × 10¹⁰ J, and the first energy trough was located at 15.9 s, and its kinetic energy was about 5.5 × 10⁹ J, and the time of the first trough corresponded to the beginning time of the detritus caving along the first-class cliff. The second energy peak is located near 37.3 s, and its kinetic energy is about 1.93 × 10¹⁰ J, and at about 120 s, the kinetic energy is about 4.26 × 10⁹ J, and the debris gradually tends to be stationary.
It can be seen that the “bimodal” kinetic energy curve is closely related to the two-level cliff landform morphology in the field, the kinetic energy increase stage corresponds to the detritus accelerated caving process, and the kinetic energy decline stage corresponds to the slope movement process dominated by energy consumption, and the geomorphological morphology of the cliff progression can be reflected according to the number of kinetic energy peaks of the collapsed debris.
6. Discussions
- 1.
- There are two main reasons for the velocity lag of the upper part of the tower during the down seat of the TCURM. One is that the deterioration area of the lower part of the unstable rock is the first to be unstable, and the jet forms a free surface, and the lower part of the tower body first perceives and responds, and quickly forms the initial velocity of the lower seat. However, the down-seat velocity has a time delay phenomenon from the bottom to the top, so the down-seat velocity of the upper rock mass is lower than the velocity of the lower rock mass at each time.
- 2.
- Collapsing-sliding masses have different general characteristics at different stages, and the mesoscopic parameters of their discrete element models are also different. The mesoscopic parameters calibrated according to the discrete element uniaxial compression test can be used in the static to quasi-static stage before fracturing instability, while the mesoscopic parameters of the discrete element model need to be corrected according to the monitoring video and accumulation phenomenon in the stage from seat failure disintegration to sliding migration. The values of mesoscopic parameters usually exhibit significant differences under the two types of conditions. The essence of this phenomenon lies in the inherent differences in the physical and mechanical properties of the same medium under static and dynamic conditions, which fall within the scope of objective laws. For example, the static and dynamic coefficients of friction of the same object are different, and the static and dynamic elastic modulus are also different. Therefore, when establishing a global discrete element numerical model, it is advisable to assign meso-parameters in stages and look for the meso-parameter conversion relationship in the dynamic and static stages.
- 3.
- In the process of collapse along the cliffs at all levels, the kinetic energy is the destructive energy that destroys human facilities and life and property, but the kinetic energy does not decrease with the decrease of the movement elevation of the debris, and is mainly related to the vertical drop of the cliffs at all levels, and the larger the cliff drop, the greater the kinetic energy. Therefore, in the area of frequent human activities, the kinetic energy of detritus can be reduced from two aspects. First, slope cutting measures are adopted in steep cliff areas to reduce the relative height difference of the cliffs, or several intermediate barrier layers are installed, and the other is to increase the slope roughness, dig the groove and divert (micro-geomorphological transformation), and set up the blocking structure. In addition, when it is difficult to reach or the cost is high, the steep change landform unit near the human activity area can be identified first, and the above treatment ideas can be used for comprehensive prevention and control, which can reduce the disaster risk of high-level remote landslide.
7. Conclusions
The dynamic characteristics of collapse and disintegration of TCURM, the movement velocity of debris, the accumulation characteristics and the energy transformation are important research contents of geological disaster risk assessment in mountainous areas. Taking the collapse of large unstable rock in Nanchuan, Chongqing as an example, the PFC3D discrete element method is used to simulate the global process of fracturing instability, impact disintegration and migration and accumulation of unstable rocks, and the velocity change characteristics, impact force characteristics, accumulation process, and energy change law of different stages and parts are revealed, and the following conclusions are drawn:
- 1.
- The numerical model of TCURM takes about 121 s from instability to stoppage, the time for the lower seat to impact the base of the second-level steep cliff is about 15 s, and the time for the impact disintegration debris to move to the stop along the way is about 106 s. The disintegration process of the lower seat is basically consistent with the on-site video monitoring data, and the debris accumulation distribution characteristics in the accumulation stage are basically consistent with the survey data, indicating that the established three-dimensional numerical model and mesoscopic constitutive parameters can better reflect the actual collapse disaster, and can make up for the limitations of the actual monitoring range, and provide a reference for the analysis of similar rock avalanches in the area.
- 2.
- The overall trend of the time history curve of the motion velocity in the deterioration area and the non-deterioration area is basically the same, and both have the characteristics of “bimodal type”. In the process of impacting the slope base of the lower seat of unstable rock, the impact force has the characteristics of first increasing, maintaining steadily, decreasing and tending to be stable in the later stage. The kinetic energy curve presents a “bimodal” distribution characteristic, which is closely related to the two-level cliff landform morphology. The kinetic energy increase stage corresponds to the debris acceleration caving process from the cliff, and the kinetic energy decline stage corresponds to the slope movement process dominated by energy consumption.
- 3.
- The dissipated energy obtained according to the parallel bonding model only includes the energy dissipation forms such as damping dissipation, contact sticking pot dissipation and contact sliding dissipation, but does not include the dissipation energy forms such as fracture dissipation, acoustic emission and thermal energy, resulting in the final dissipation energy accounting for only 75% of the gravitational potential energy. Future research will investigate the applicability and simulation effects of constitutive models with dynamic impact characteristics, such as the Hertz model and the Hysteretic model, during the collapse process of this type of TCURM. At the same time, future research will conduct studies on the adaptability and conversion methods of mesoscopic parameters during different static and dynamic stages, so as to provide a scientific basis for the parameter setting of the whole-domain discrete element numerical model and thereby improve the accuracy and reliability of discrete element numerical simulation results.
Synthesizing the above findings, the collapse of TCURM is dominated by the “slumping-disintegration” mechanism, with the bottom deterioration zone acting as the trigger source, and the dual-level cliff landform amplifying the disaster effect through staged energy accumulation and release. For risk management of existing TCURM, targeted measures can be implemented based on their structural characteristics:
- 1.
- Reinforcement of the bottom deterioration zone (e.g., grouting to improve bond strength) to delay or prevent initial instability;
- 2.
- Reduction of the relative height difference of dual-level cliffs through slope-cutting measures (where geologically feasible) to weaken the “double-peak” kinetic energy effect;
- 3.
- Installation of multi-stage barrier systems along the potential movement path to sequentially dissipate energy, reducing the impact force on downstream infrastructure (e.g., highways, villages, and water conservancy projects).
For long-term risk control, this study’s parameter calibration method (combining orthogonal tests, indoor mechanical tests, and on-site monitoring data) can be standardized to guide the numerical simulation and risk assessment of similar unstable rock masses, improving the scientificity and pertinence of disaster prevention and mitigation engineering.
Author Contributions
Conceptualization, F.Z.; methodology, F.Z.; investigation, H.T. and Y.Z.; data curation, X.G.; writing—original draft preparation, F.Z. and D.Z.; writing—review and editing, Y.Z.; funding acquisition, F.Z. and X.L. All authors have read and agreed to the published version of the manuscript.
Funding
This research was funded by the Chongqing Natural Science Foundation (grant No. CSTB2024N-SCQ-MSX0006), the Project of Science and Technology Research Program of Chongqing Education Commission of China (No. KJQN202403413), and the Chongqing Talents and Outstanding Scientists Project (cstc2024ycjh-bgzxm0032).
Institutional Review Board Statement
Not applicable.
Informed Consent Statement
Not applicable.
Data Availability Statement
All data generated during this study are included in this article.
Acknowledgments
The authors are grateful to the anonymous reviewers and relevant editors for their constructive criticism and suggestions.
Conflicts of Interest
The authors declare no conflicts of interest.
References
- Hungr, O.; Leroueil, S.; Picarelli, L. The Varnes classification of landslide types, an update. Landslides 2014, 11, 167–194. [Google Scholar] [CrossRef] [Scilit]
- Crosta, G.B.; De Blasio, F.V. Fragmentation and boosting of rock falls and rock avalanches. Geophys. Res. Lett. 2016, 42, 8463–8470. [Google Scholar]
- Fang, X.; Scaringi, G.; Korup, O.; West, A.J.; Van Westen, C.J.; Tanyas, H.; Hovius, N.; Hales, T.C.; Jibson, R.W.; Allstadt, K.E.; et al. Earthquake-Induced Chains of Geologic Hazards: Patterns, Mechanisms, and Impacts. Rev. Geophys. 2019, 57, 421–503. [Google Scholar]
- Hu, X.B.; Fan, X.Y.; Tang, J.J. Study on Accumulation Characteristics and Energy Conversion of High-speed Long-distance Landslide Based on Discrete Elements: A Case Study of Sanxi Village Landslide. J. Geomech. 2019, 25, 527–535. [Google Scholar]
- Bi, Y.Z.; He, S.M.; Du, Y.J.; Sun, X.; Li, X. Effects of the configuration of a baffle-avalanche wall system on rock avalanches in Tibet Zhangmu: Discrete element analysis. Bull. Eng. Geol. Environ. 2019, 78, 2267–2282. [Google Scholar] [CrossRef] [Scilit]
- Komac, M. A landslide susceptibility model using the analytical hierarchy process method and multivariate statistics in perialpine Slovenia. Geomorphology 2006, 74, 17–28. [Google Scholar] [CrossRef] [Scilit]
- Roback, K.; Clark, M.K.; West, A.J.; Zekkos, D.; Li, G.; Gallen, S.F.; Chamlagain, D.; Godt, J.W. The size, distribution, and mobility of landslides caused by the 2015 Mw7.8 Gorkha earthquake, Nepal. Geomorphology 2018, 301, 121–138. [Google Scholar] [CrossRef] [Scilit]
- Iverson, R.M.; George, D.L.; Allstadt, K.; Reid, M.E.; Collins, B.D.; Vallance, J.W.; Schilling, S.P.; Godt, J.W.; Cannon, C.M.; Magirl, C.S.; et al. Landslide mobility and hazards: Implications of the 2014 Oso disaster. Earth Planet. Sci. Lett. 2015, 412, 197–208. [Google Scholar] [CrossRef] [Scilit]
- Denlinger, R.P.; Iverson, R.M. Granular avalanches across irregular three-dimensional terrain:1. Theory and computation. J. Geophys. Res. Earth Surf. 2004, 109, 1–14. [Google Scholar] [CrossRef] [Scilit]
- Wu, L.Z.; Zhang, L.M.; Zhou, Y.; Xu, Q.; Yu, B.; Liu, G.G.; Bai, L.Y. Theoretical analysis and model test for rainfall-induced shallow landslides in the red-bed area of Sichuan. Bull. Eng. Geol. Environ. 2018, 77, 1343–1353. [Google Scholar] [CrossRef] [Scilit]
- Xiao, Z.K.; Xu, C.; Li, H.; Huang, S.; Li, B.; He, X.L. Analysis on the Development Status and Trend of Physical Simulation Experiments for Geological Hazards. Bull. Geol. Sci. Technol. 2024, 44, 23–47. [Google Scholar] [CrossRef]
- Conte, E.; Pugliese, L.; Troncone, A. Post-failure stage simulation of a landslide using the material point method. Eng. Geol. 2019, 253, 149–159. [Google Scholar] [CrossRef] [Scilit]
- Wu, H.; Nian, T.K.; Shan, Z.G. Research progress on the formation and evolution mechanism of landslide damming and risk prediction method. Chin. J. Rock Mech. Eng. 2023, 42, 3192–3205. [Google Scholar]
- Zhou, L.; Fan, X.M.; Xu, Q.; Yang, F.; Guo, C. Numerical simulation and risk prediction of the movement process characteristics of Baige landslide in Jinsha River. J. Eng. Geol. 2019, 27, 1395–1404. [Google Scholar]
- Yang, Z.P.; Zhang, Y.M.; Jiang, Y.W.; Li, B.; Cui, F.P. Fracture propagation and deformation and failure law of slope with deep and large karst structure plane under mining. Chin. J. Geotech. Eng. 2022, 44, 1397–1405. [Google Scholar]
- Gao, G.; Meguid, M.A. On the role of sphericity of falling rock clusters-insights from experimental and numerical investigations. Landslides 2018, 15, 219–232. [Google Scholar] [CrossRef] [Scilit]
- Scaringi, G.; Fan, X.M.; Xu, Q.; Liu, C.; Ouyang, C.; Domènech, G.; Yang, F.; Dai, L. Some considerations on the use of numerical methods to simulate past landslides and possible new failures: The case of the recent Xinmo landslide (Sichuan, China). Landslides 2018, 15, 1359–1375. [Google Scholar] [CrossRef] [Scilit]
- Weng, M.C.; Lin, M.L.; Lo, C.M.; Lin, H.H.; Lin, C.H.; Lu, J.H.; Tsai, S.J. Evaluating failure mechanisms of dip slope using a multiscale investigation and discrete element modelling. Eng. Geol. 2019, 263, 105303. [Google Scholar] [CrossRef] [Scilit]
- Feng, Z.; Li, B.; Yin, Y.P.; He, K. Rockslides on limestone cliffs with sub-horizontal bedding in the southwestern calcareous area, China. Nat. Hazards Earth Syst. Sci. 2014, 14, 2627–2635. [Google Scholar] [CrossRef] [Scilit]
- Gao, Y.; Yin, Y.P.; Li, Z.; Li, B.; Wu, W.L.; Zhang, H. Study on dynamic disintegration effect of high-level long-distance rock landslide. Chin. J. Rock Mech. Eng. 2022, 41, 1–13. [Google Scholar]
- Ren, Y.R.; Chen, P.; Zhang, J.; Xie, Q. Early warning analysis of W12# dangerous rock collapse in Yongziyan, Nanchuan City, Chongqing. Chin. J. Geol. Hazard Control 2005, 16, 28–31, 37. [Google Scholar]
- He, K. Study on Collapse Mechanism of Tower Columnar Rock Mass. Master’s Thesis, Chang’an University, Xi’an, China, 2015. [Google Scholar]
- Tang, H.M.; Song, G.; Zhou, F.C.; Yang, J. Numerical Experimental Study on Mesoscopic Parameter Calibration of Limestone: Taking Zengziyan Rock Mass Unstable Rock in Nanchuan District, Chongqing Municipality as an Example. J. Chongqing Norm. Univ. (Nat. Sci.) 2024, 41, 50–60. [Google Scholar]
- Tang, H.M.; Yan, Z.Q.; Chen, H.K. Numerical test of colluvium’s mechanical properties in Three Gorges Reservoir based on discrete element method. J. Chongqing Norm. Univ. (Nat. Sci.) 2016, 33, 42–49. [Google Scholar]
- Xia, M.; Zhao, C.B. Dimensional analysis of effects of microscopic parameters on macroscopic parameters for clump parallel-bond model. Chin. J. Rock Mech. Eng. 2014, 33, 327–338. [Google Scholar]
- Potyondy, D.O.; Cundall, P.A. A bonded-particle model for rock. Int. J. Rock Mech. Min. Sci. 2004, 41, 1329–1364. [Google Scholar] [CrossRef] [Scilit]
- Poulsen, B.A.; Adhikary, D.P. A numerical study of the scale effect in coal strength. Int. J. Rock Mech. Min. Sci. 2013, 63, 62–71. [Google Scholar] [CrossRef] [Scilit]
- Li, B.; Gong, W.P.; Tang, H.M.; Zou, Z.; Bowa, V.M.; Juang, C.H. Probabilistic analysis of a discrete element modelling of the runout behavior of the Jiweishan landslide. Int. J. Numer. Anal. Methods Geomech. 2021, 45, 1120–1138. [Google Scholar] [CrossRef] [Scilit]
- Wei, J.G.; Zhao, Z.; Xu, C.; Wen, Q. Numerical investigation of landslide kinetics for the recent Mabian landslide (Sichuan, China). Landslides 2019, 16, 2287–2298. [Google Scholar] [CrossRef] [Scilit]
- Zhang, Z.D.; Fan, X.Y.; Jiang, Y.J. Effect of Rock and Soil Particle Size on Characteristics of Impact Force Chain of Landslide Debris Flow. J. Mt. Sci. 2020, 38, 402–415. [Google Scholar]
- Zhan, W.W.; Fan, X.M.; Huang, R.Q.; Pei, X.; Xu, Q.; Li, W. Empirical prediction for travel distance of channelized rock avalanches in the Wenchuan earthquake area. Nat. Hazards Earth Syst. Sci. 2016, 17, 833–844. [Google Scholar] [CrossRef] [Scilit]
- Kong, X.Z.; Li, B.; He, K.; Luo, H.; Chang, W.; Xing, A. Dynamic characteristics and fragmentation evolution of columnar rockfall: A case study of the Zengziyan rockfall in Chongqing, China. Chin. J. Geol. Hazard Control 2022, 33, 1–10. [Google Scholar]
- Chen, H.K.; Wang, S.J. Study on the Fracture Evolution Mechanism of Dangerous Rock Sockets on Rock Slope in the Limestone Area of the Three Gorges Reservoir Area: A Case Study of Donnie Yen Rock of Jinfoshan in Chongqing. J. Chongqing Norm. Univ. (Nat. Sci. Ed.) 2017, 34, 38–43. [Google Scholar]

Disclaimer/Publisher’s Note: The statements, opinions and data contained in all publications are solely those of the individual author(s) and contributor(s) and not of MDPI and/or the editor(s). MDPI and/or the editor(s) disclaim responsibility for any injury to people or property resulting from any ideas, methods, instructions or products referred to in the content. |
© 2026 by the authors. Licensee MDPI, Basel, Switzerland. This article is an open access article distributed under the terms and conditions of the Creative Commons Attribution (CC BY) license.