


Abstract
As global warming intensifies, urban heat stress is increasing. Urban blue–green spaces (UBGSs) reduce heat exposure, and refined planning can enhance cooling in space-limited cities. Yet drivers and mechanisms at the urban-agglomeration scale remain unclear. This study quantified the cooling intensity (CI) of 162 UBGS across 27 cities in the Yangtze River Delta using summer 2020 land surface temperature data (June–August). CI is defined as the average temperature difference (ΔLST) between the UBGS and its surrounding buffer. Extreme gradient boosting (XGBoost) and Shapley additive explanations (SHAP) methods were applied to analyze the driving factors. Key findings include (1) the top five factors by SHAP value: Area (0.38), buffer NDBI (0.16), lake/river landscape shape index (0.07), buffer tree height (0.06), and buffer population (0.06). (2) CI rises with Area only up to 50 hm2 and then plateaus at ~6 °C. Buffer NDBI strengthens CI, with faster gains when buffer NDBI < −0.2. Water-shape effects are stepwise, and a lake/river shape index of 5–8 delivers near-optimal cooling. Interactions indicate stronger cooling in large parks with high water coverage and in sites combining complex water edges with dominant grassland patches. These findings support structure-focused UBGS design and targeted mitigation in dense urban areas.
1. Introduction
Under the dual pressures of rapid global urbanization and climate change, the urban heat island (UHI) effect has become a severe challenge faced by cities worldwide [1]. UHI exerts substantial adverse impacts on both natural ecosystems and socioeconomic systems, leading to increased energy consumption, more frequent extreme heat events, deteriorating air quality, and public health crises [2,3,4]. It also elevates health risks for urban residents by increasing morbidity and mortality rates and adversely affecting mental health [5,6]. With rising urban greenhouse gas emissions and the growing frequency of extreme climatic events, there is an urgent need to integrate climate change mitigation and adaptation strategies into urban planning frameworks [7].
Compared with engineering-based approaches to heat mitigation, nature-based solutions (NbS) regulate the urban thermal environment through natural processes such as vegetation evapotranspiration, shading, and water evaporation, and are therefore regarded as more sustainable and long-term cooling strategies. Among various NbS, Urban blue–green spaces (UBGSs) refer to an integrated network of green land and water infrastructure in urbanized areas, including parks, wetlands, rivers, and vegetation. These spaces are key natural assets in urban areas [8,9]. UBGS provide essential ecosystem services such as urban heat mitigation, climate change adaptation, air quality improvement, and recreational areas, and are widely regarded as effective nature-based solutions for adapting to environmental warming and mitigating extreme heat. They balance economic progress with environmental protection [10], playing a critical role in local climate regulation and urban heat environment management [11,12,13]. Urban heat environment refers to the spatial and temporal temperature variations within urban areas, influenced by factors such as land use, building density, and the presence of green spaces, leading to the urban heat island effect (UHI) [14]. Consequently, how to improve the urban thermal environment through refined planning and design of UBGS within limited urban space has become an important research topic in sustainable development and urban governance.
However, the cooling effects of UBGSs are not spatially homogeneous and vary considerably across cities, spatial scales, and landscape configurations. To systematically characterize the capacity of UBGSs to mitigate UHI effects, research has gradually shifted from qualitative descriptions to quantitative assessments, leading to the development of multiple indicators for measuring cooling performance. For example, Guo et al. [15] proposed a set of metrics—including park cooling intensity (PCI, temperature difference between the park and its surroundings), park maximum cooling intensity (PMCI, maximum temperature difference generated by the park), park cooling area (PCA, spatial extent of cooling), park cooling efficiency (PCE, efficiency of cooling relative to area and vegetation), and park cumulative cooling intensity (PCCI, total cooling effect over time)—to investigate the spatial patterns of park cooling effects from multiple perspectives. Among these indicators, cooling intensity (CI) is defined as the difference in LST between the average temperature of the impervious surface within the buffer and the average temperature of UBGSs [16]. It is widely used to assess the cooling effect of urban blue–green spaces and is one of the most frequently utilized indicators to characterize “cooling islands” [17,18,19]. Compared to other indicators, CI accounts for the spatial continuity of the cooling effect and is typically used in large-scale, cross-regional studies [20]. Therefore, identifying and quantifying the key drivers of CI is of great practical significance for optimizing the configuration of UBGS and scientifically mitigating the UHI effect.
The study of UBGS cooling effects and their influencing factors has been extensively conducted. Higher Cooling Intensity (CI) indicates a larger cooling range and stronger cooling effect [21,22,23]. CI is influenced by factors such as the size of UBGS [15], landscape composition [24], shape characteristics [25], climatic conditions, and surrounding environmental factors [26]. Specifically, CI is related to the shape characteristics of UBGS and its internal landscape patterns (such as the percentage of land use and land cover, and spatial configuration of land use/land cover (LULC). CI generally increases logarithmically with the area size [11,23], while the relationship between shape and CI varies across different studies [17,27]. Vegetation and water bodies within UBGS typically enhance CI, while impervious surfaces such as roads and buildings usually reduce it [13,28]. Kong et al. [29] found that as the average forest patch area increases, CI decreases with the density of forest patches in parks. These findings reveal the driving factors behind CI and provide valuable knowledge for better urban planning and management [30,31,32]. However, the conclusions of these studies often differ due to variations in study area, sample selection, and analytical scale, resulting in a lack of consensus regarding the underlying mechanisms of each factor. For instance, some studies indicate that more compact and simplified green spaces show stronger cooling abilities [33,34], while others argue that shape has a negligible effect [35,36].
In addition to the geometric shape and landscape pattern within UBGS, the surrounding 2D/3D built environment, such as building density, height, and sky openness, has been shown to significantly affect CI in UBGS [37,38]. However, external indicators of UBGS do not directly affect CI, but rather indirectly influence it by affecting the temperatures inside and outside UBGS, with internal and external temperatures interacting with each other [39]. High-temperature buffer zones may impose heat stress on park vegetation, thereby reducing its cooling effect [21]. Previous studies have mostly used multiple linear regression methods, with CI as the dependent variable and driving factors as the independent variables [21,40,41,42]. However, single-equation regression, estimated with Ordinary Least Squares (OLS), may ignore potential endogeneity, leading to biased and inconsistent results. For example, Geng et al. [41] reported a positive correlation between CI and the green cover percentage of the buffer zone, while Shah et al. [43] and Qiu and Jia [42] found a negative correlation between CI and buffer greening degree (i.e., normalized difference vegetation index). These conflicting results highlight the importance of using robust statistical methods to obtain reliable results. An increasing number of researchers are now using machine learning models to gain deeper insights into UBGS cooling effects. For instance, Yang et al. used random forests (RF) to investigate the impact of various indicators on UBGS cooling ability [24]. Deng et al. used random forest regression and Shapley Additive Explanations (SHAP) [44] to uncover the driving factors of urban wetland park cooling effects [45]. Luo et al. applied XGBoost [46] and SHAP techniques to explore the spatial effects, relative importance, and interactive impacts of 2D/3D built environments on LST [47].
In recent years, academic attention has increasingly shifted from isolated city-level UHI studies to investigations of regional thermal patterns at the urban agglomeration scale [20,48]. Urban agglomerations are characterized by high spatial connectivity, economic integration, and dense development [49], causing surface UHI effects to transcend individual city boundaries and evolve into regional thermal environmental issues [50,51]. This trend is particularly evident in the Yangtze River Delta (YRD), one of the three major urban agglomerations in the Yangtze River Basin. At the urban agglomeration scale, exploring the internal and external driving factors affecting the cooling intensity of UBGS and systematically quantifying CI and its driving mechanisms is a research topic worthy of further exploration.
This study focuses on the Yangtze River Delta urban agglomeration, using land surface temperature data from June to August 2020. The study employs methods such as extreme gradient boosting (XGBoost) and Shapley additive explanations (SHAP) to quantify the summer cooling intensity of urban blue–green spaces and analyze its main driving factors. A total of 162 urban blue–green spaces across 27 cities in the YRD were compiled for analysis. The specific objectives of this study are to: (1) quantify the summer CI of urban green spaces in the YRD region based on land surface temperature data; (2) identify and analyze the key drivers of CI from 2D landscape characteristics, 3D built-environment features, and socio-economic dimensions; (3) reveal the nonlinear relationships and interactions between influencing factors and CI, as well as among the factors themselves, to explore their synergistic effects.
Given the highly urbanized and heatwave-prone context of the Yangtze River Delta, understanding how UBGSs regulate surface cooling at the urban-agglomeration scale is particularly necessary. Therefore, this study examines the joint effects of multi-dimensional drivers on CI, with an emphasis on their nonlinear relationships and interactions. The results are expected to provide region-specific evidence to support UHI mitigation and UBGS-oriented planning in the YRD and other rapidly urbanizing urban agglomerations.
2. Materials and Methods
2.1. Study Area
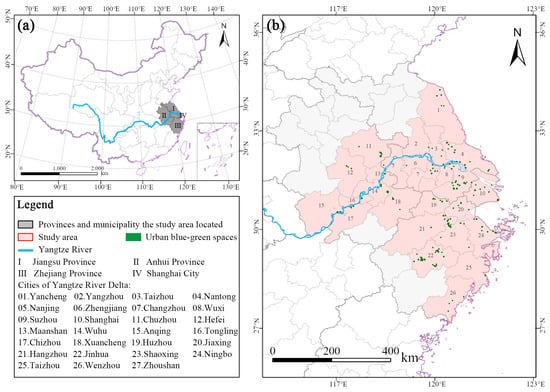
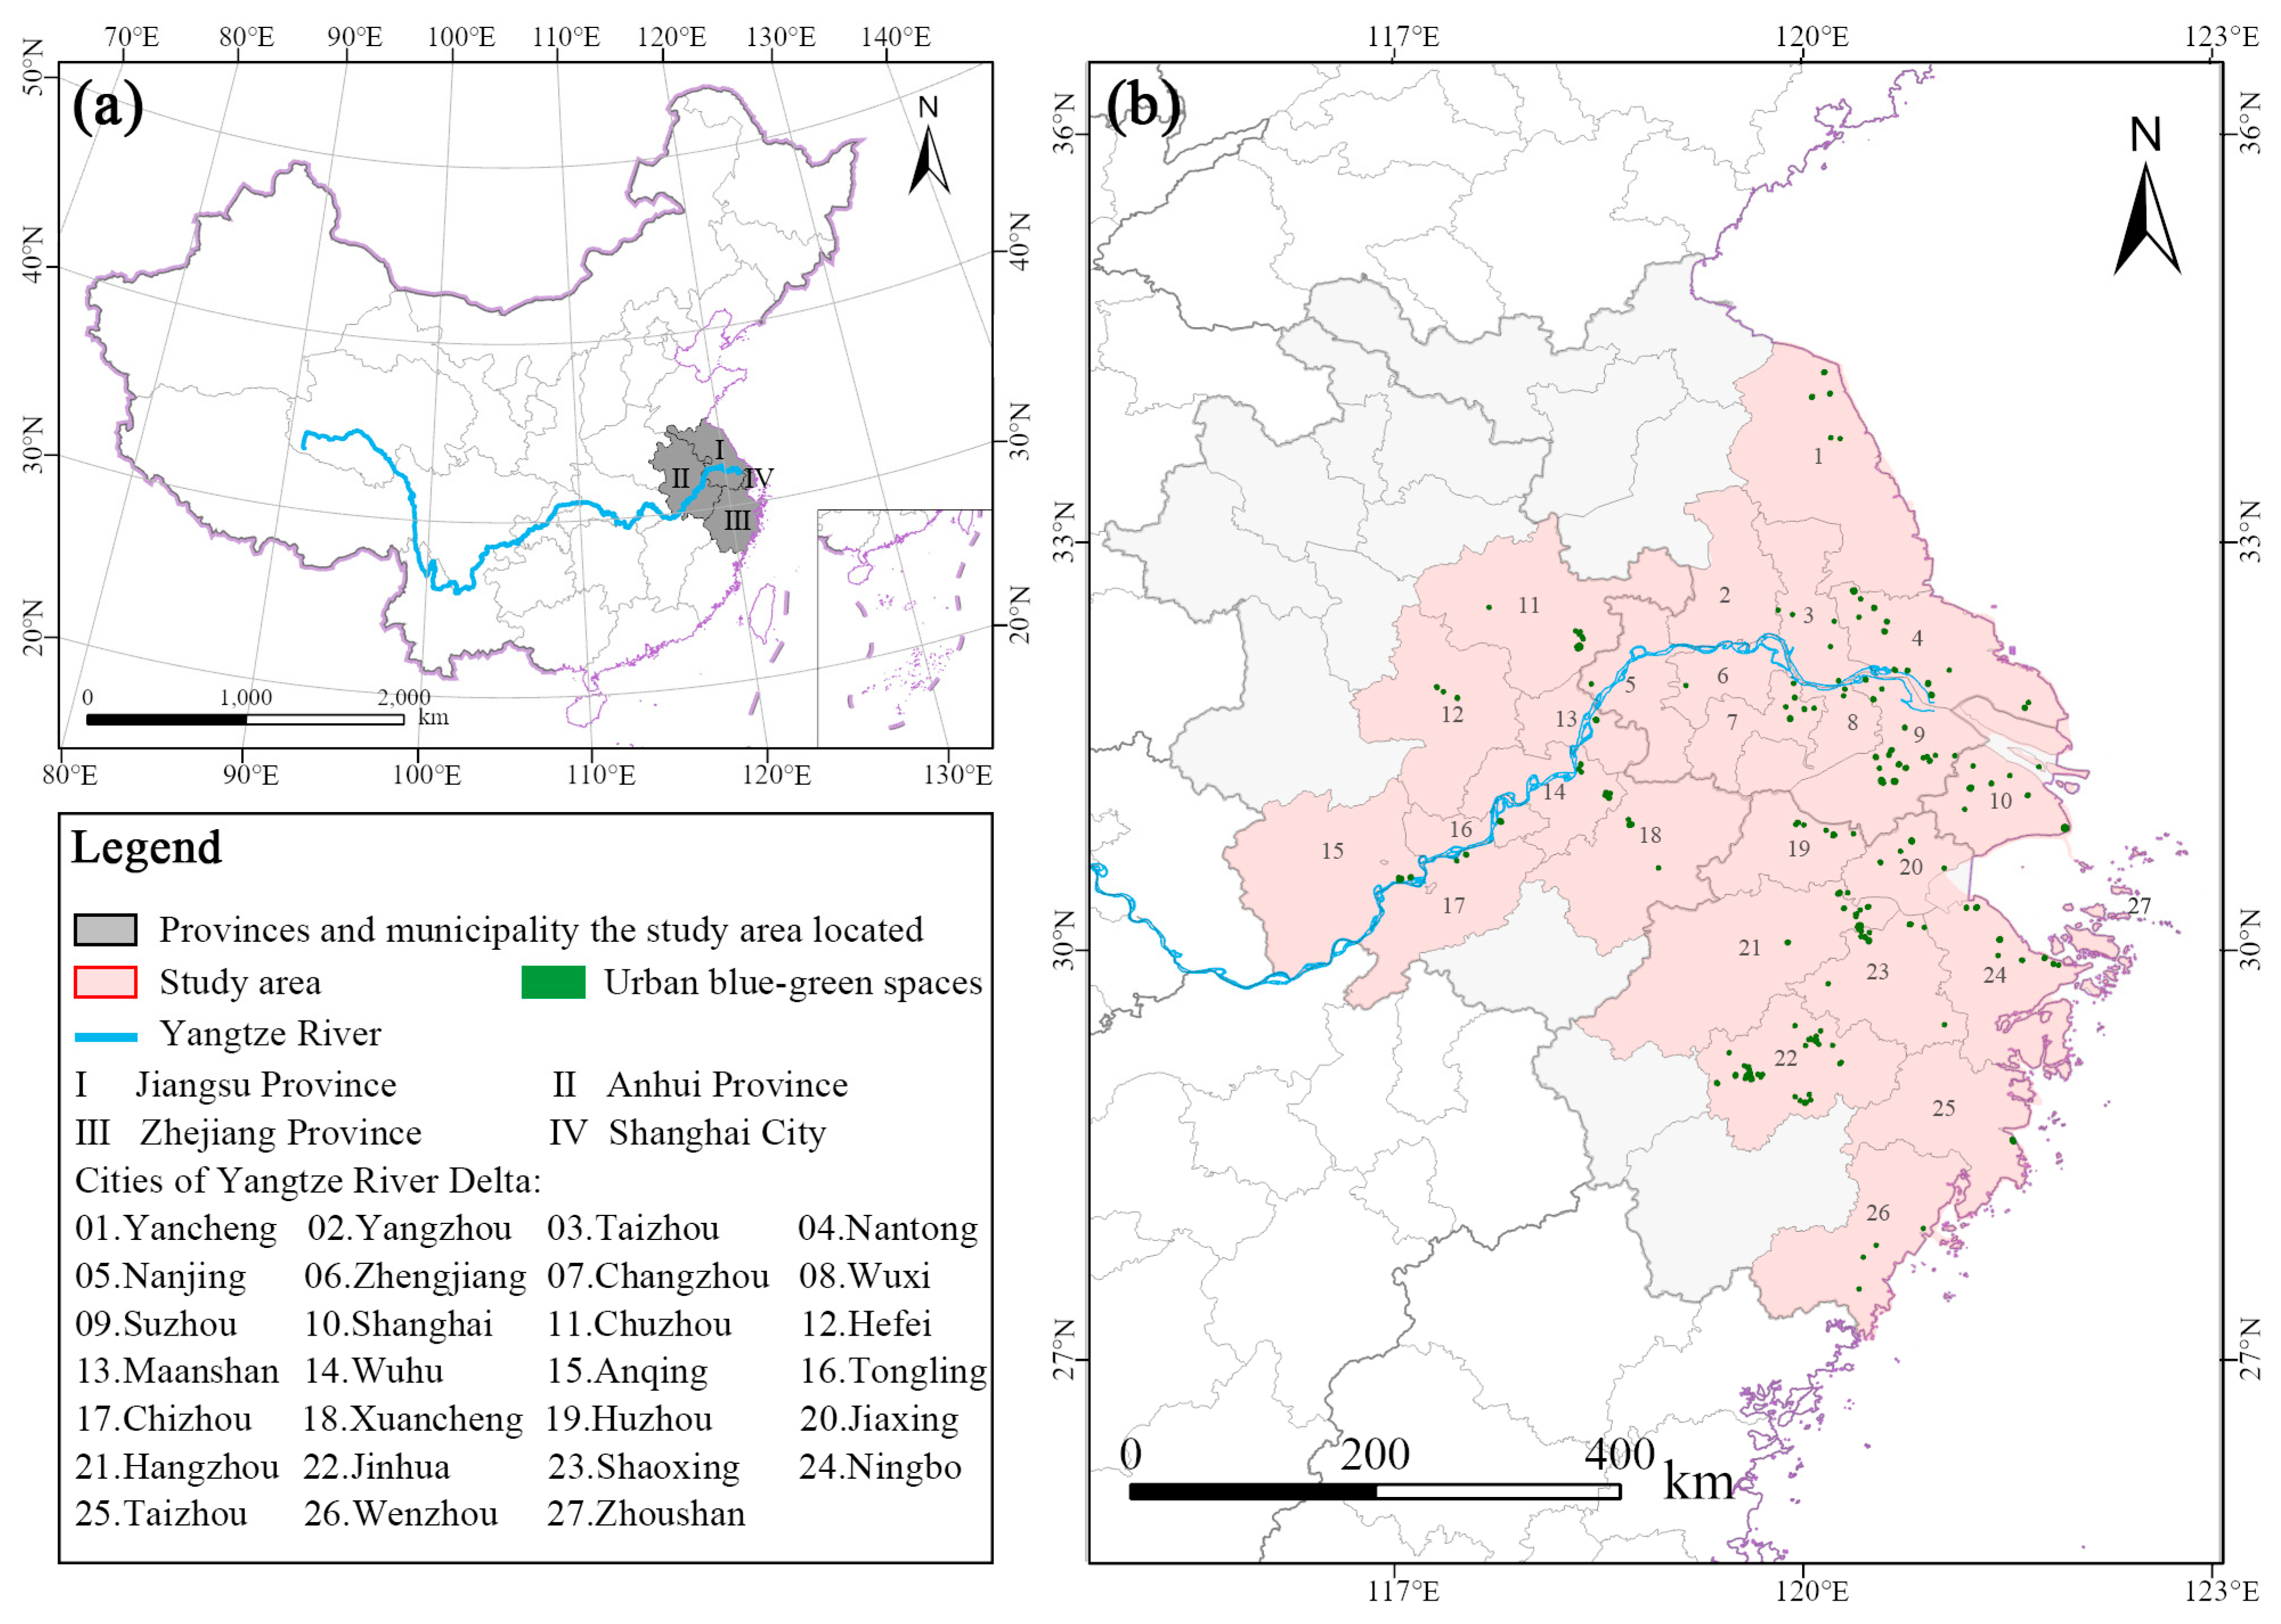
The Yangtze River Delta (YRD) region, located along China’s eastern coastline, is one of the nation’s most economically developed and highly urbanized areas. Geographically, it spans from 115.5° E to 122.5° E longitude and from 27.5° N to 34.5° N latitude. The region encompasses Shanghai, southern Jiangsu, northern Zhejiang, and eastern Anhui, covering a total area of approximately 211,700 km2 (Figure 1). According to the Köppen–Geiger climate classification, the study area falls within the subtropical monsoon climate zone (Cwa) [52]. With an urbanization rate exceeding 70%—substantially higher than the national average—the YRD exhibits distinct developmental characteristics while facing significant environmental challenges, including uneven green-space distribution and insufficient heat island mitigation services.
Figure 1.
(a) Location of provinces and municipalities in the Yangtze River Delta region within China; (b) 27 cities and UBGS within the Yangtze River Delta region.
Major cities within the region, such as Shanghai, Nanjing, and Hangzhou, have undergone rapid urbanization, resulting in extensive expansion of built-up areas and intensifying ecological pressures. Notably, Hangzhou, Nanjing, and Hefei were identified as “Top Ten Furnace Cities” by the National Climate Center of the China Meteorological Administration based on analyses of meteorological records from 1981 to 2010 (https://www.cma.gov.cn/2011xwzx/2011xqxxw/2011xqxyw/202110/t20211029_4039203.html, accessed on 5 October 2025). The YRD frequently experiences prolonged summer heatwaves. For example, during the summer of 2025, Shanghai recorded an exceptionally persistent heatwave, with 24 consecutive high-temperature days—tying the historical record since observations began in 1873 (https://www.thepaper.cn/newsDetail_forward_31470705, accessed on 5 October 2025).
Despite increases in green coverage to over 40% in most urban built-up areas and improvements in the service coverage of parks and green spaces, the region continues to face challenges such as imbalanced green-space allocation and limited cooling-island effectiveness. As urban boundaries increasingly merge and interconnect, the urban heat island (UHI) effect has transitioned from a localized issue within individual cities to a broader regional thermal environmental concern. The National Climate Change Adaptation Strategy 2035 [53] emphasizes enhancing the climate resilience of major urban agglomerations—including the YRD—where effective mitigation of UHI is a critical component of developing climate-adaptive cities.
Given that the Yangtze River Delta (YRD) urban cluster serves as a development model for emerging urban agglomerations across China—such as the Beijing–Tianjin–Hebei region, the Guangdong–Hong Kong–Macao Greater Bay Area, and the Chengdu–Chongqing Economic Circle—the findings of this study are not only of local relevance but also offer valuable insights for other rapidly urbanizing regions.
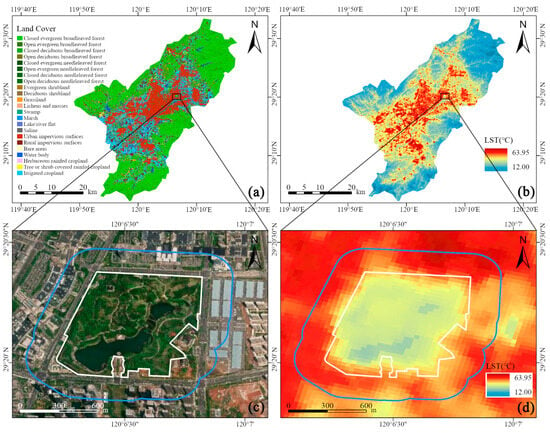
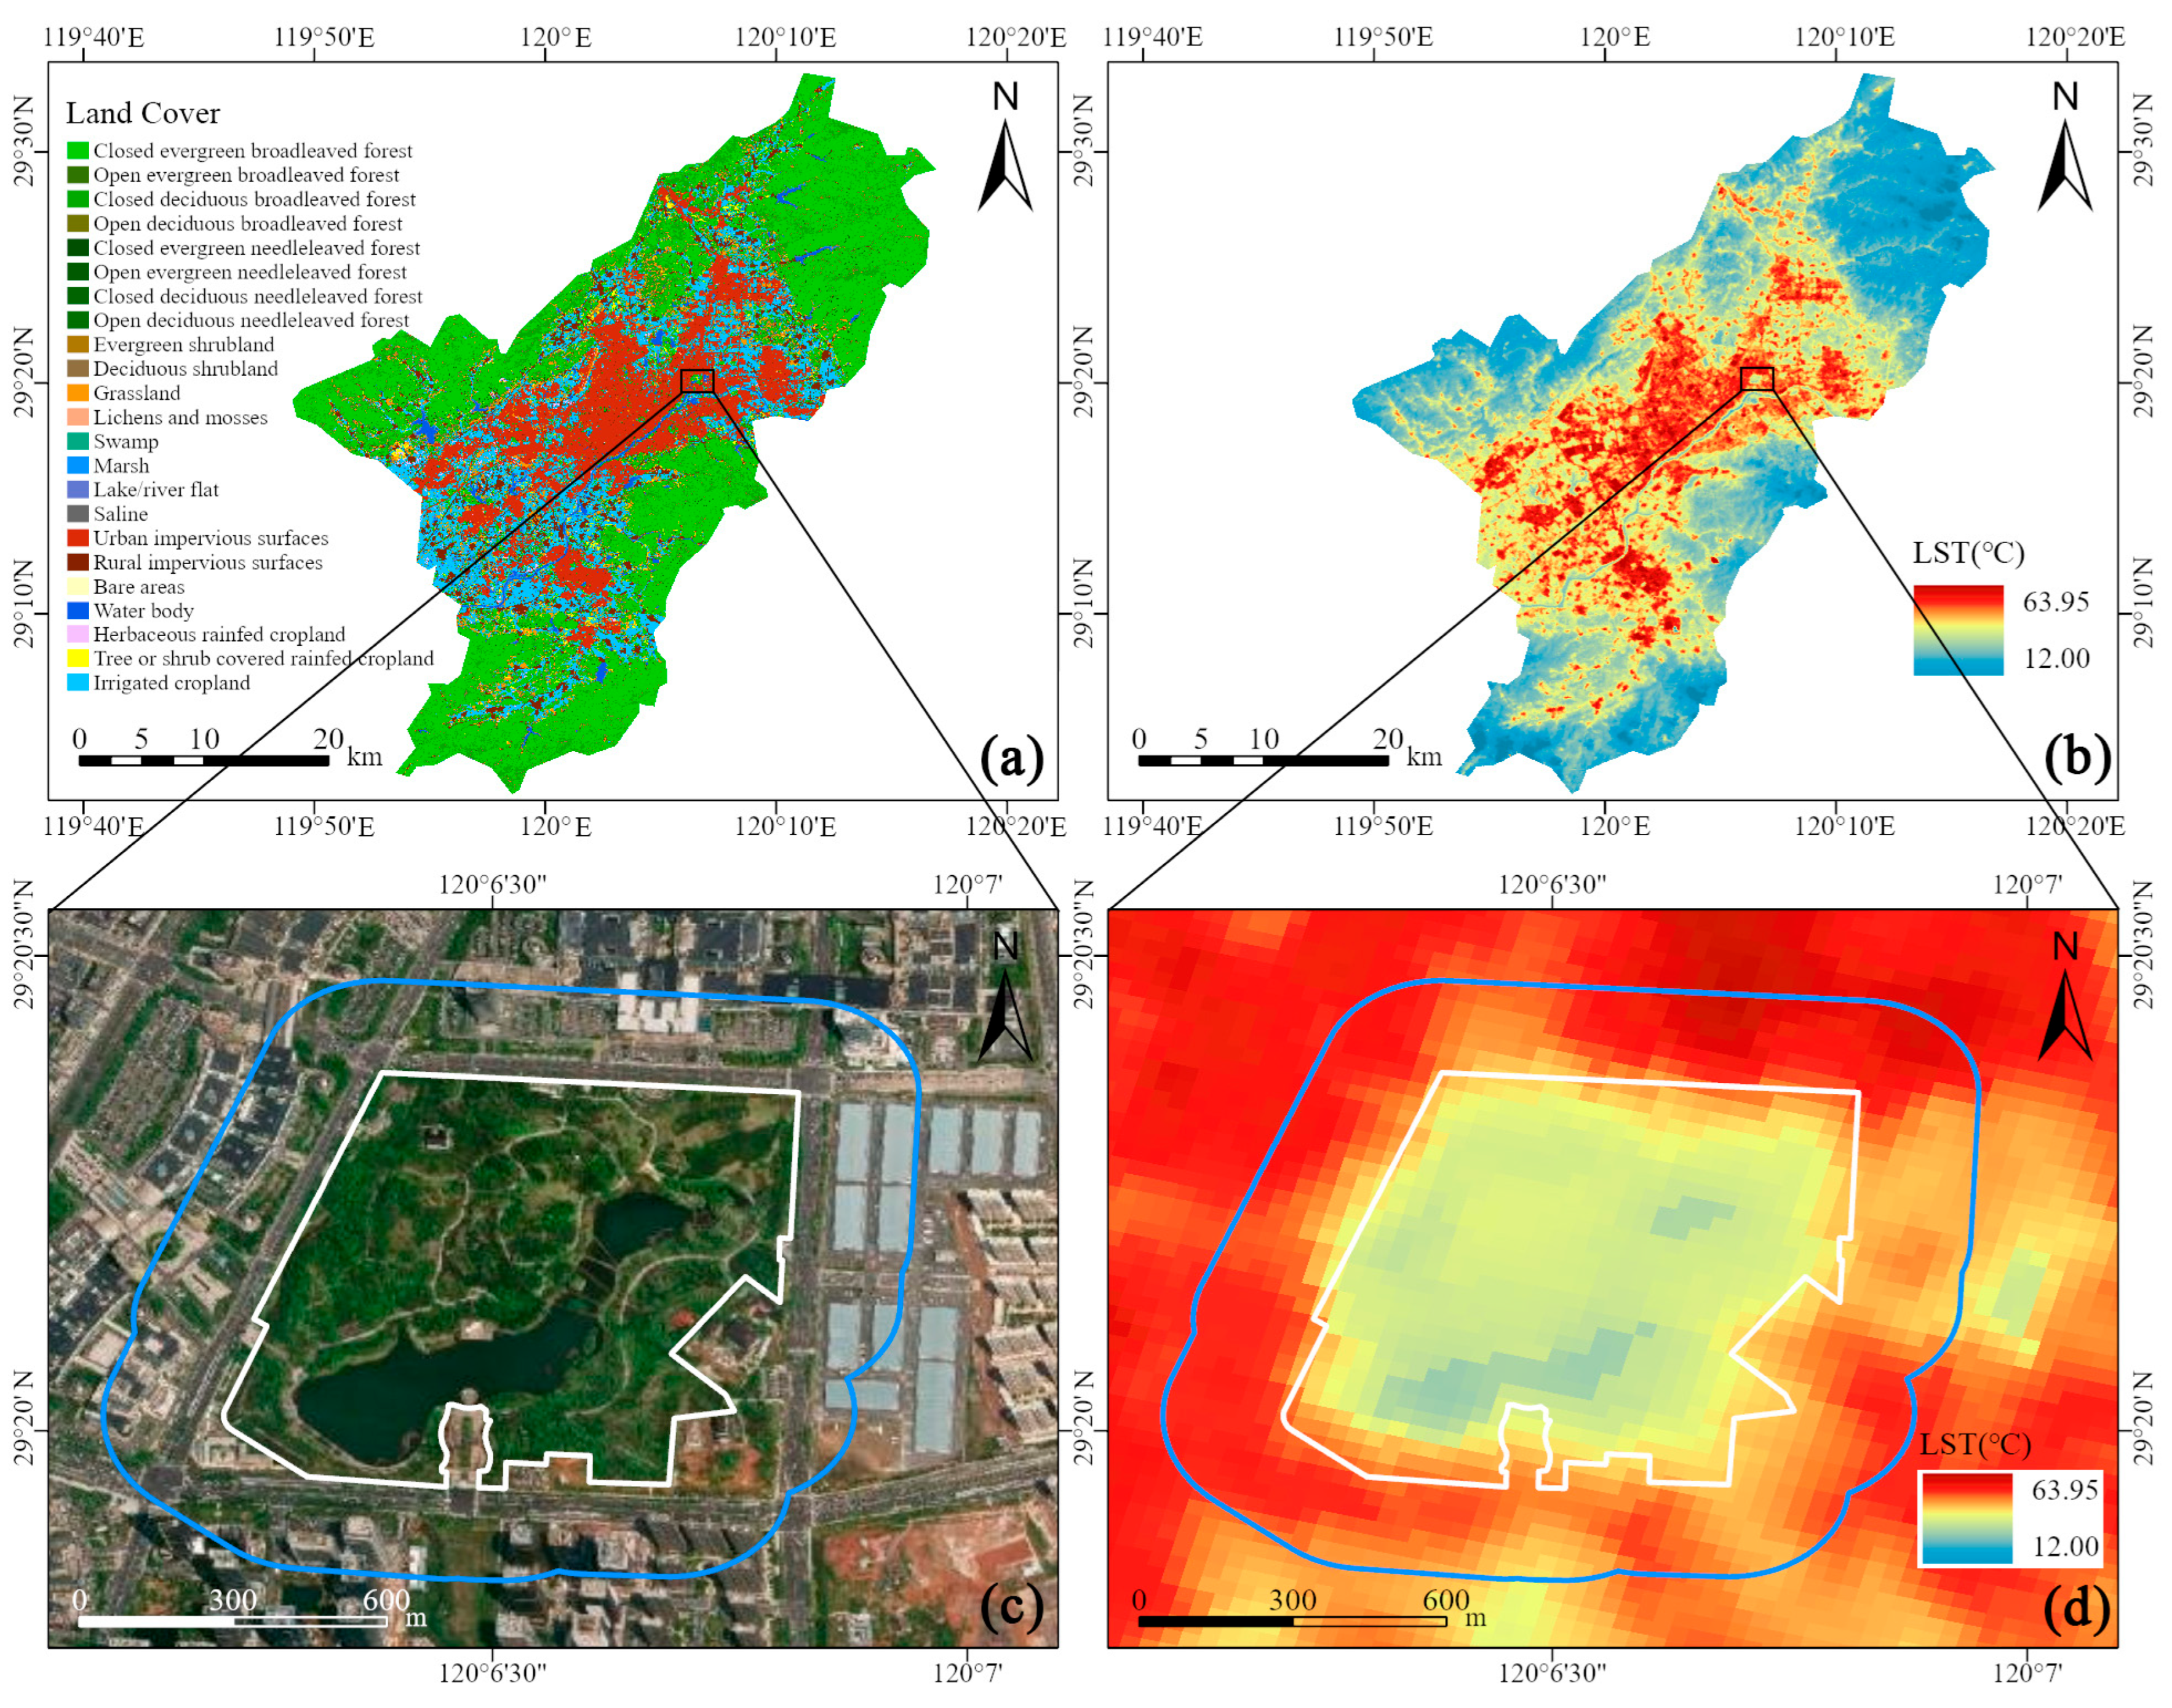
This study considers the influence of large bodies of water, such as the East China Sea and Yellow Sea, as well as mountain ranges, on local microclimates and their effects on the cooling performance of urban blue–green spaces. As a result, the study focused on urban blue–green spaces greater than 1 hectare and located away from coastal areas [54]. A total of 27 cities within the Yangtze River Delta region were included in the analysis. High-resolution Google Earth satellite imagery and LULC data [55] were utilized for visual identification, ensuring that the selected spaces met the criteria for urban blue–green spaces. In total, 162 urban blue–green spaces were selected for analysis. The boundaries of these spaces were delineated using ArcGIS Pro 3.1 [56], as shown in Figure 2c.
Figure 2.
Land cover map of Yiwu City, Zhejiang Province (a), Land surface temperature (b), and cooling effect of green space taking the Futian Wetland Park as an example (c,d). (c) Enlarged green space in Futian Wetland Park, with Google Image as the background; (d) Enlarged cooling effect of green space in Futian Wetland Park, with land surface temperature as the background. The wight line represents the border of the green space, and the blue line represents the cooling distance of the green space.
2.2. Data and Preprocessing
The data used in this study were primarily sourced from and processed using the Google Earth Engine platform. Detailed information on the data sources, descriptions, and preprocessing steps can be found in Table 1. Specifically, Landsat satellite imagery was processed through radiometric calibration, cloud masking, index calculation, and temporal synthesis to generate long-term time series of LST and NDBI. All data underwent standard preprocessing steps, including spatial clipping and resampling. Landscape pattern indices were calculated using tools such as FRAGSTATS [57].
Table 1.
Data collection and preprocessing.
2.3. Quantification of Cooling Intensity
As shown in Figure 2, distinct heat accumulation zones are observed in densely populated commercial districts, residential areas, and large public spaces, based on the land surface temperature spatial pattern. In contrast, cooler areas are associated with ecological infrastructures, such as urban parks, rivers, and lakes. These landscapes exhibit lower surface temperatures, functioning as cooling islands within the urban environment. For example, Futian Wetland Park in Yiwu City, Zhejiang Province, contains a prominent cool island (indicated in blue) that helps mitigate the urban heat island effect. This study employs a novel area-adaptive method to determine buffer zones [16]. Assuming circular green spaces, the cooling distance is defined by adjusting the buffer area to be approximately equivalent to the urban blue–green space area. The area-adaptive method avoids the drawback of using a fixed threshold for different sizes of UBGS [40] and the inability to determine the cooling distance of small UBGS using the turning point method [58], making the calculation more efficient and convenient. The cooling zone defined in this study is illustrated in Figure 2c. Given the urban blue–green space area and buffer distance , the calculation formula is:
This method has been shown to rapidly and effectively quantify CI [16,19]. Subsequently, the CI of urban blue–green spaces is defined as the difference between the LST of these spaces and their surrounding areas [59], where represents the average LST of the buffer zone and denotes the average LST of the urban blue–green space. The formula for calculating CI is:
2.4. Potential Landscape Factors and Description
Numerous factors mitigate the urban heat island effect. Two-dimensional (2D) elements of the urban landscape, such as variations in the size, shape, and clustering of landscape features, influence the thermal environment and energy flux, thereby enhancing spatial heterogeneity [60,61]. Three-dimensional (3D) factors, including building height, volume, and floor area ratio, also play a significant role in shaping the urban climate [61,62]. Population density and nighttime light data, which reflect human activity and socioeconomic conditions, have been shown to correlate with urban thermal environments [12,63].
Building upon these three dimensions, this study incorporates a buffer-to-urban-green-space difference metric to ensure a comprehensive examination of variables. Ultimately, 15 indicators were summarized for both the interior and surrounding buffer zones of urban blue–green spaces (Table 2). Multicollinearity among variables was assessed using variance inflation factors (VIF), with severe multicollinearity typically indicated by VIF values exceeding 10 [64]. The results show no significant multicollinearity among the indices.
Table 2.
Summary of CI potential driving factors.
2.5. Methods
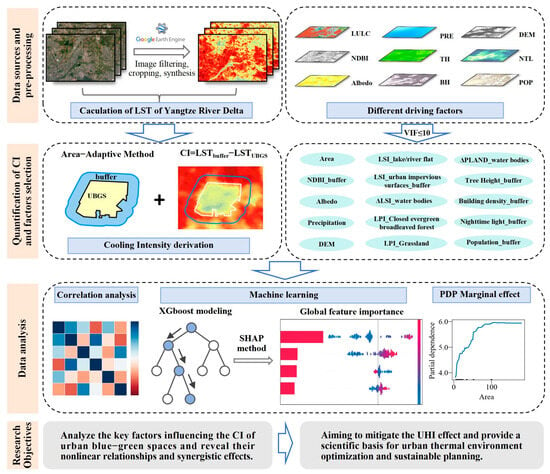
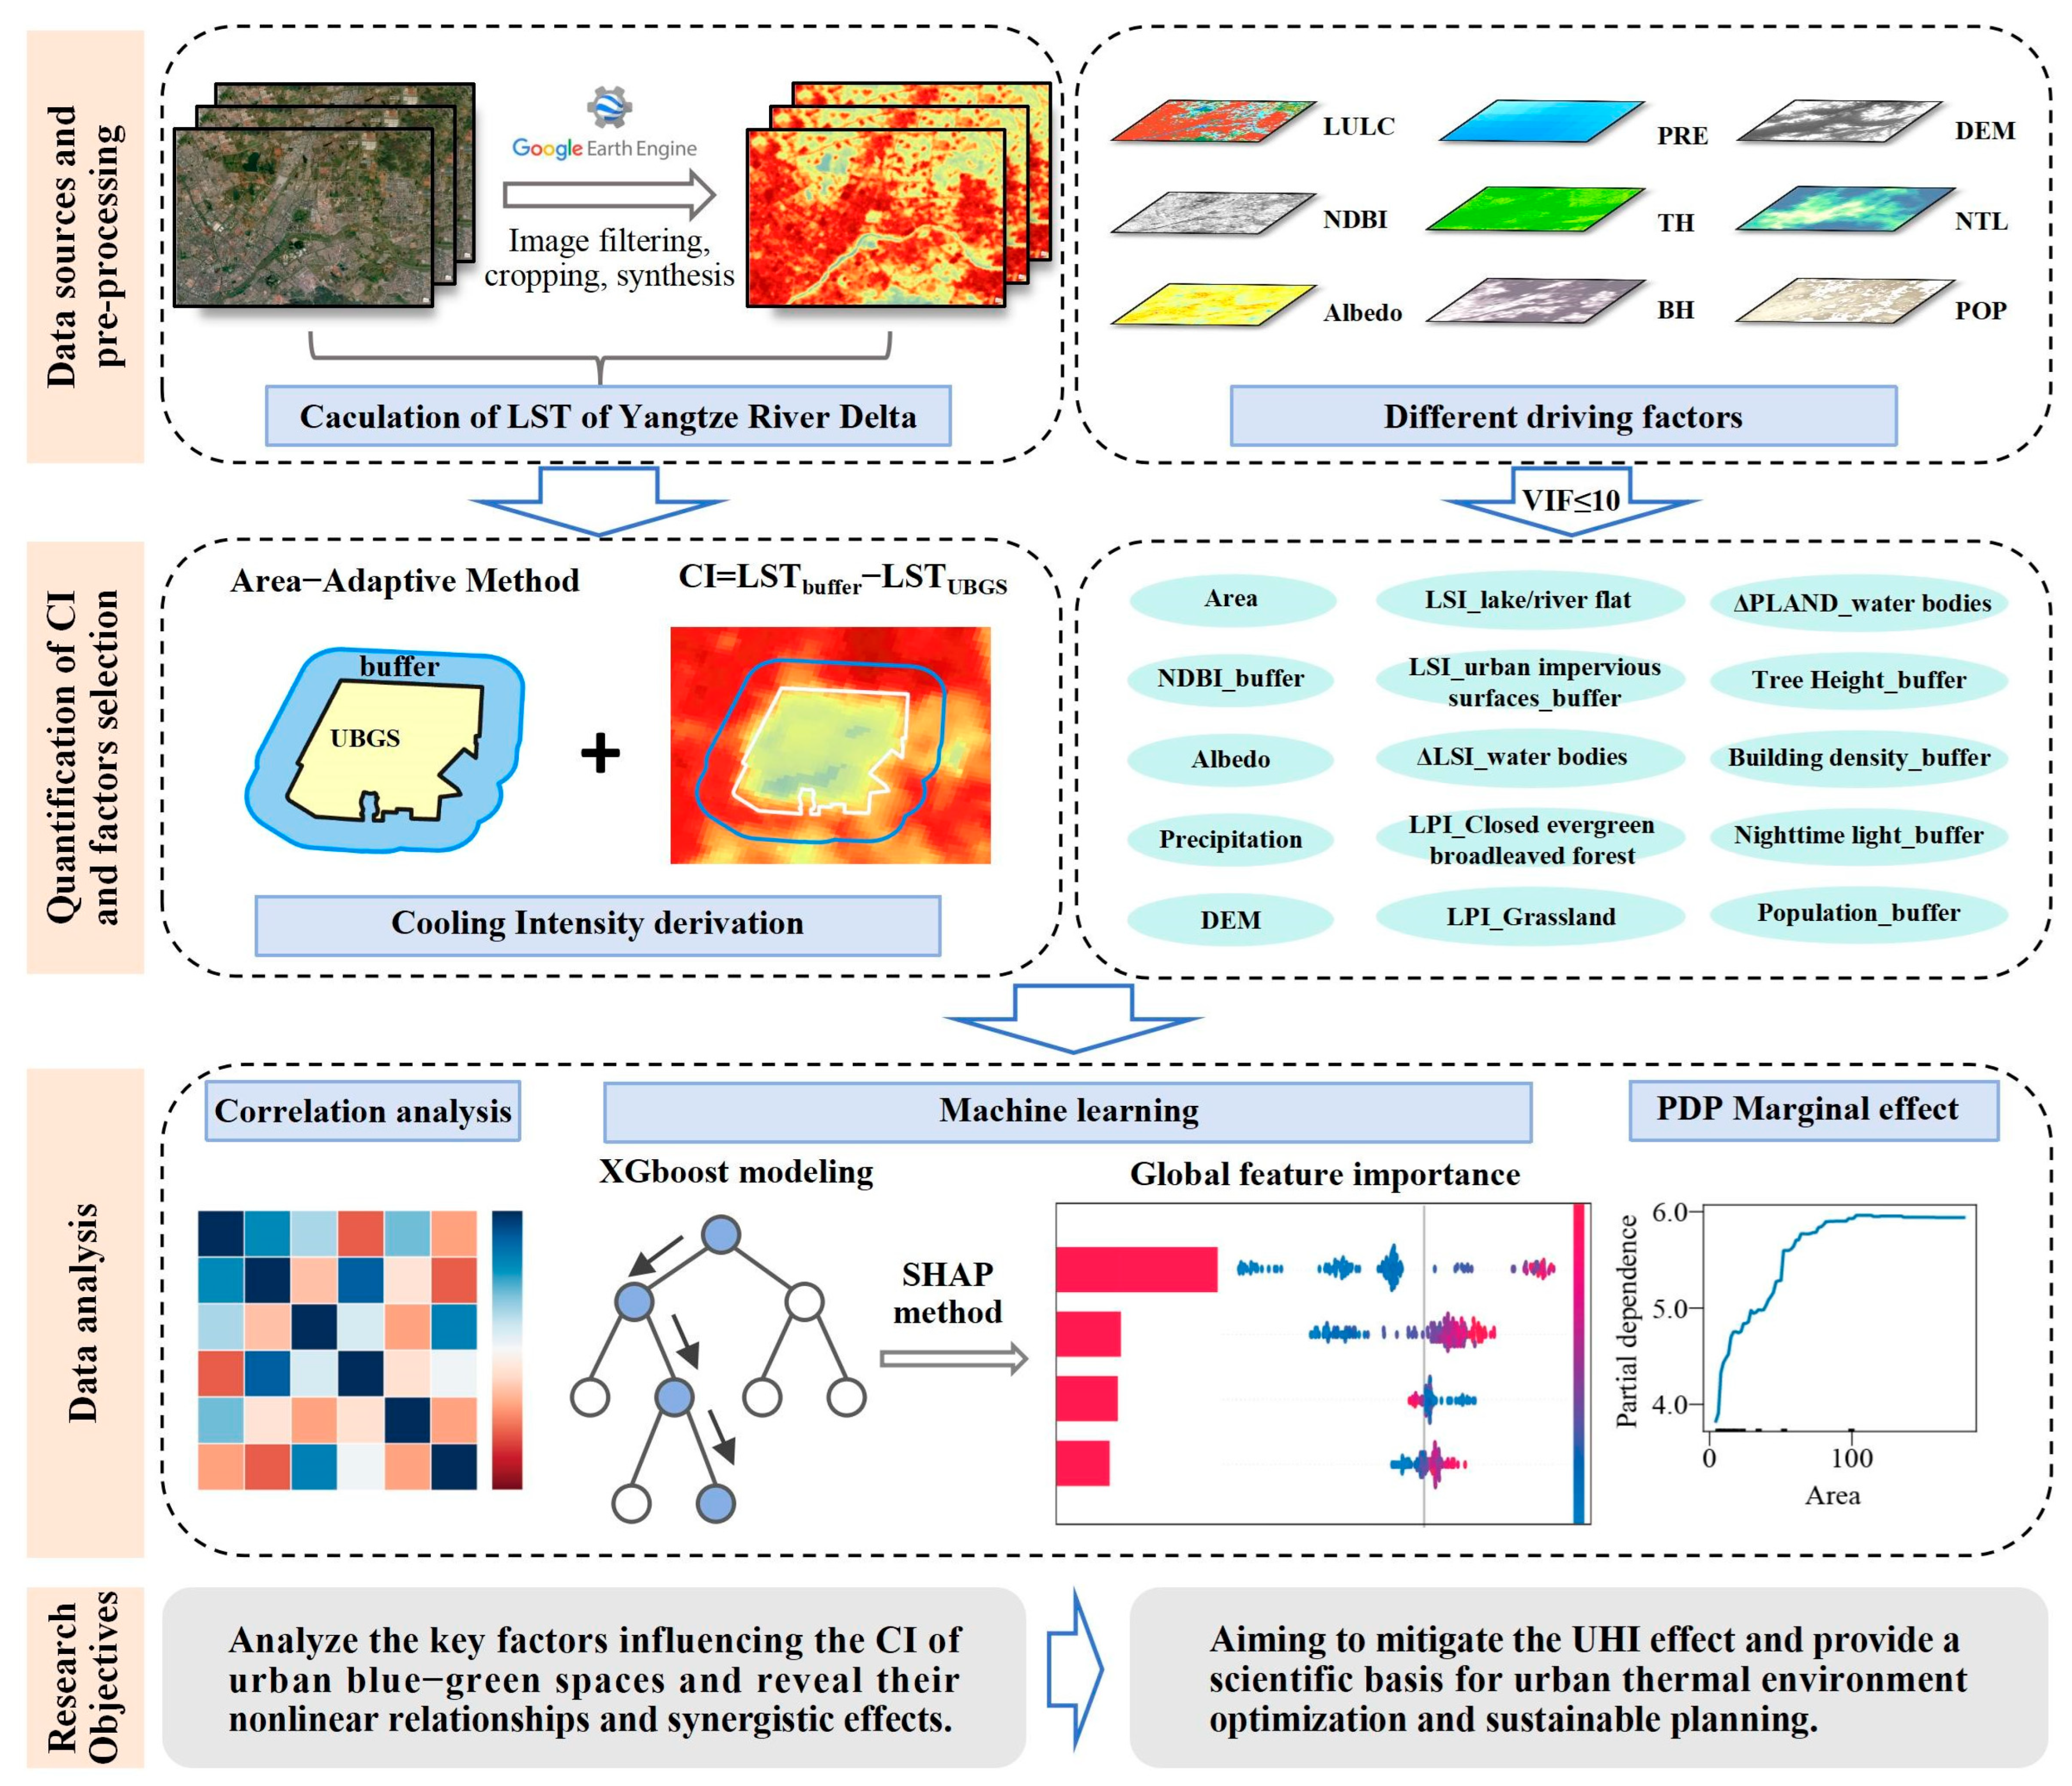
The main workflow of this study is illustrated in Figure 3. Data sources and preprocessing steps have been described earlier. This section primarily focuses on the XGBoost machine learning model and the SHAP explanation method.
Figure 3.
Flowchart of this study.
The Pearson correlation coefficient, a standard method for analyzing correlations, effectively assesses the degree of linear association between two variables. For example, it has been used to reveal correlations between urban green landscape pattern characteristics and UHI or LST [65,66]. In this study, Pearson coefficients between CI and all potential influencing factors listed in Table 1 were sequentially calculated using SPSS 26. More detailed theories and formulas regarding Pearson coefficients can be found in the literature [67].
Given the complexity and nonlinearity of urban thermal processes, machine learning methods were employed to complement traditional correlation analysis. XGBoost is a gradient-boosting-based ensemble learning technique that offers high computational efficiency and predictive accuracy. The algorithm incorporates regularization strategies and an efficient gradient descent optimization mechanism. Specifically, XGBoost applies both L1 (Lasso) and L2 (Ridge) regularization to leaf weights, which penalizes model complexity and mitigates overfitting. This approach not only enhances model precision but also effectively prevents overfitting [46]. It has been widely applied in recent studies to identify key factors influencing thermal intensity [47,68]. The XGBoost regression model [46] was implemented using the Python 3.13 package xgboost, with CI as the dependent variable and potential influencing factors as independent variables. The dataset was randomly divided, with 70% used for model training and 30% for validation, and explained variance was employed to evaluate model performance. During model training, several key hyperparameters were optimized, including the number of trees (n_estimators), maximum tree depth (max_depth), learning rate (learning_rate), subsampling ratio (subsample), feature sampling ratio (colsample_bytree), and the minimum loss reduction required for node splitting (gamma). The optimal hyperparameter configuration was determined using 10-fold cross-validation to enhance model robustness and generalization ability. Subsequently, the SHAP method was applied to interpret the contributions of individual influencing factors to CI. As a local interpretation technique, SHAP computes Shapley values to quantify the relative importance of each explanatory variable, enabling an assessment of both feature importance in model predictions and the contribution of individual samples [44]. PDP is a model-agnostic interpretation method that illustrates the average marginal effect of one or two features on the predicted outcome while averaging out the influence of all other variables [44]. The revised text clarifies that PDP is used to visualize the marginal effect of a feature on the target prediction, which helps assess whether the feature–target relationship appears approximately linear, monotonic, or nonlinear [69].
3. Results
3.1. Descriptive Statistics
Table 3 presents the descriptive statistics for all influencing factors. The average CI value for urban blue–green spaces across 160 cities was 4.85 °C, with a standard deviation of 1.44 and a range from 1.85 °C to 11.11 °C. Significant variations exist in the performance of blue–green spaces across different cities in terms of mitigating local heat island effects. The average area of the urban blue–green spaces selected for this study was 43.65 hectares, with a range from 1.32 to 504.39 hectares. The average NDBI_b (Neutral Dry Bulb Index) of the buffer zone was −0.17, ranging from −0.33 to −0.01, indicating relatively low surface hardening in the buffer zones. The mean albedo value was 0.13. The average precipitation (Pre) value was 29.98 mm, suggesting favorable rainfall conditions that promote vegetation growth and indirectly enhance cooling effects. The mean Digital Elevation Model (DEM) elevation was 27.02 m, ranging from −2.70 to 241.59 m. Regarding landscape morphology, the average landscape shape index for internal lakes and rivers (LSI_LR) was 4.12 (with a standard deviation of 3.14), indicating relatively regular water body shapes. The average urban impervious surface shape index (LSI_UIS_b) in the buffer zone was 5.20, reflecting high complexity and fragmentation in the surrounding built environment, which may negatively impact the cooling performance of green spaces. The difference in landscape shape complexity between internal and external water bodies (ΔLSI_W) reveals heterogeneity in landscape configuration between green spaces and their surroundings, with external water bodies exhibiting greater fragmentation. The average water proportion difference (ΔPLAND_W) was −39.55, indicating a significantly higher proportion of water bodies within urban blue–green spaces compared to external areas. Extensive water bodies play a positive role in regulating local microclimates.
Table 3.
Descriptive statistics of the thermal and explanatory variables.
Among the 3D factors, the mean TH_b value is 0.65 m, with a range from 0 to 5.48 m, indicating generally low values. This suggests sparse external vegetation coverage and limited shading capacity. The mean building density (BD_b) is 86.63, with a maximum value of 1766.83, reflecting relatively high values, with some green spaces surrounded by high-density urban development. High-density and high-rise buildings may obstruct ventilation and increase anthropogenic heat emissions, thereby counteracting the cooling effects of green spaces.
The socioeconomic indicators, Nighttime Light Intensity (NTL_b, standard deviation 14.32) and Population Density (POP_b, standard deviation 20.12), exhibit large standard deviations, indicating significant variations in human activity intensity and socioeconomic development levels surrounding different green spaces. These factors typically show a negative correlation with CI and may amplify the “background pressure” on the cooling functions of green spaces. Specifically, the more intensely developed the surrounding area, the more susceptible the cooling effect of green spaces becomes to suppression by the external thermal environment.
3.2. Correlation and Feature Contribution Analysis
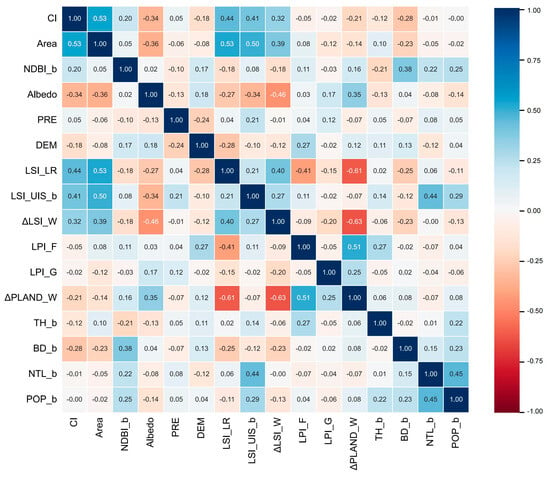
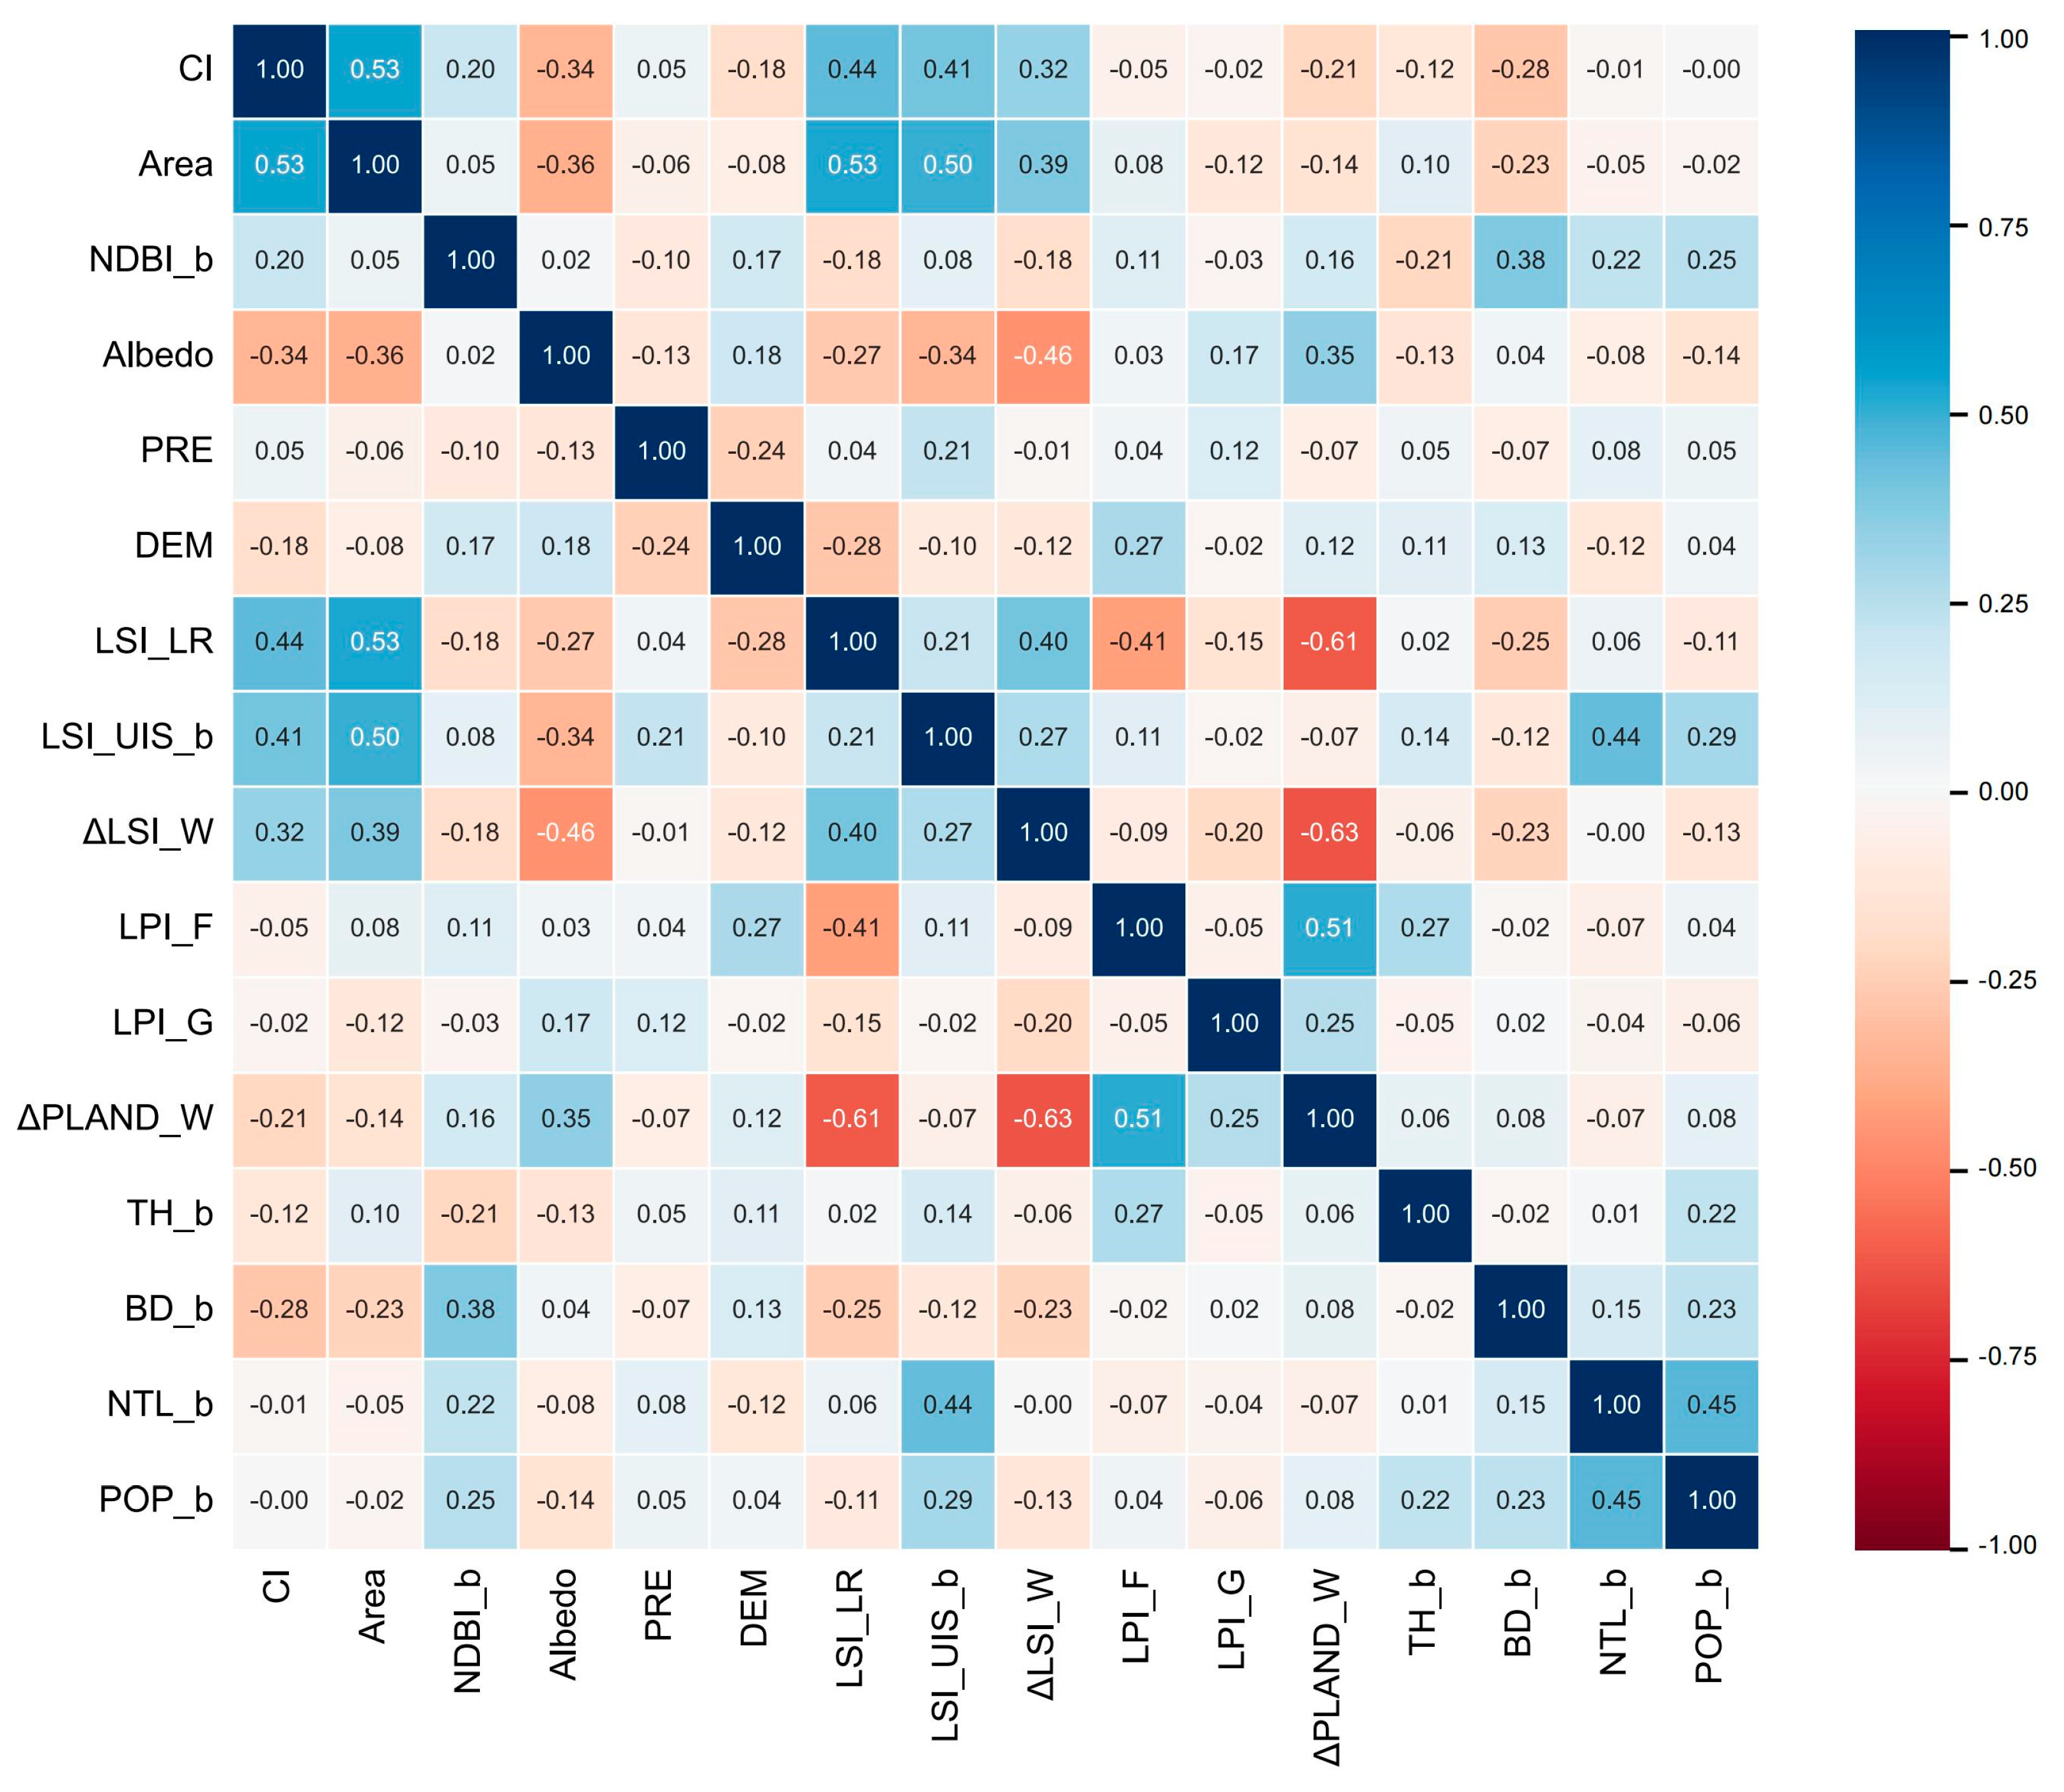
Pearson correlation coefficients were used to analyze the linear relationships between various landscape indices and CI (Figure 4). The cooling effect of urban blue–green spaces is influenced not only by their internal ecological attributes but also by their urban environmental context. The results indicate that Area, NDBI_b, Pre, LSI_UIS_b, ΔLSI_W, and LSI_LR are positively correlated with CI, suggesting that larger green space areas, higher precipitation, greater patch aggregation and connectivity, and lower fragmentation all enhance cooling effects.
Figure 4.
Pearson Correlation Matrix Between Predictors and CI.
It is widely recognized that large-scale green spaces exhibit superior cooling effects due to their larger canopy and leaf areas, which more effectively intercept solar radiation and provide shade. Higher precipitation values help sustain healthy plant growth in green spaces and enhance transpiration cooling efficiency, thereby intensifying cooling effects. The positive correlation between ΔLSI_W and CI reflects the difference in the shape indices of external versus internal water bodies, indicating that more regular internal landscape structures favor the formation of stable cooling zones. When water bodies exhibit highly regular and simple shapes—such as near-circular or square lakes—they better maintain their lower temperatures, creating a stable and potent “cold core.” This pattern reduces thermal radiation dispersion and enhances the localized regulatory capacity of water bodies and vegetation.
The impervious surface index (NDBI_b) and impervious landscape shape index (LSI_UIS_b) of buffer zones show significant positive correlations with CI. This finding suggests that the cooling effect of green spaces depends not only on their internal ecological quality but also on their thermal contrast with the surrounding environment. When buffer zones exhibit higher levels of surface hardening or more complex built-up patterns, their surface temperatures are relatively higher, increasing the temperature difference with the interior of green spaces and thereby enhancing the “cool island” effect.
Albedo, DEM, ΔPLAND_W, BD_b, TH_b, NTL_b, and POP_b were negatively correlated with CI. Due to the large proportion of water bodies within green spaces in the study area, vegetation coverage was relatively low, weakening the positive contribution of Albedo to cooling effects. A smaller difference in the ratio of internal to external water bodies resulted in better cooling performance. External building density (BD_b) negatively correlates with CI, further validating that high-density urban development suppresses green space cooling functions. Dense building clusters not only obstruct ventilation but also increase anthropogenic heat emissions, limiting the effective propagation of green space cooling effects. Both NTL_b and POP_b exhibit negative correlations with CI. High-intensity human activities significantly increase external thermal loads, diminishing the cooling effects of green spaces.
Urban planning must holistically consider both the external ecological quality of blue–green spaces and the urban environment to maximize the cooling benefits of green spaces.
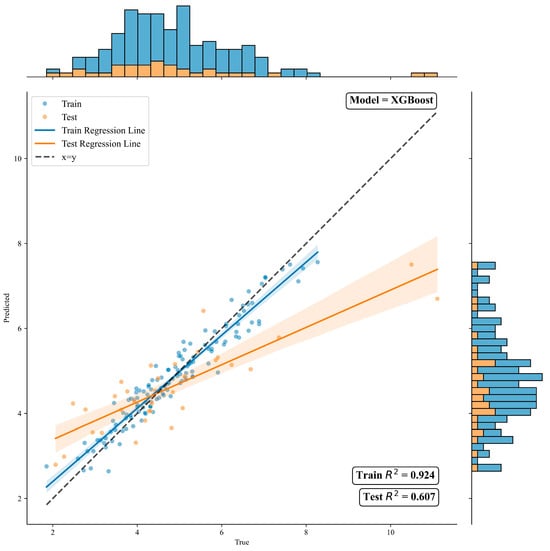
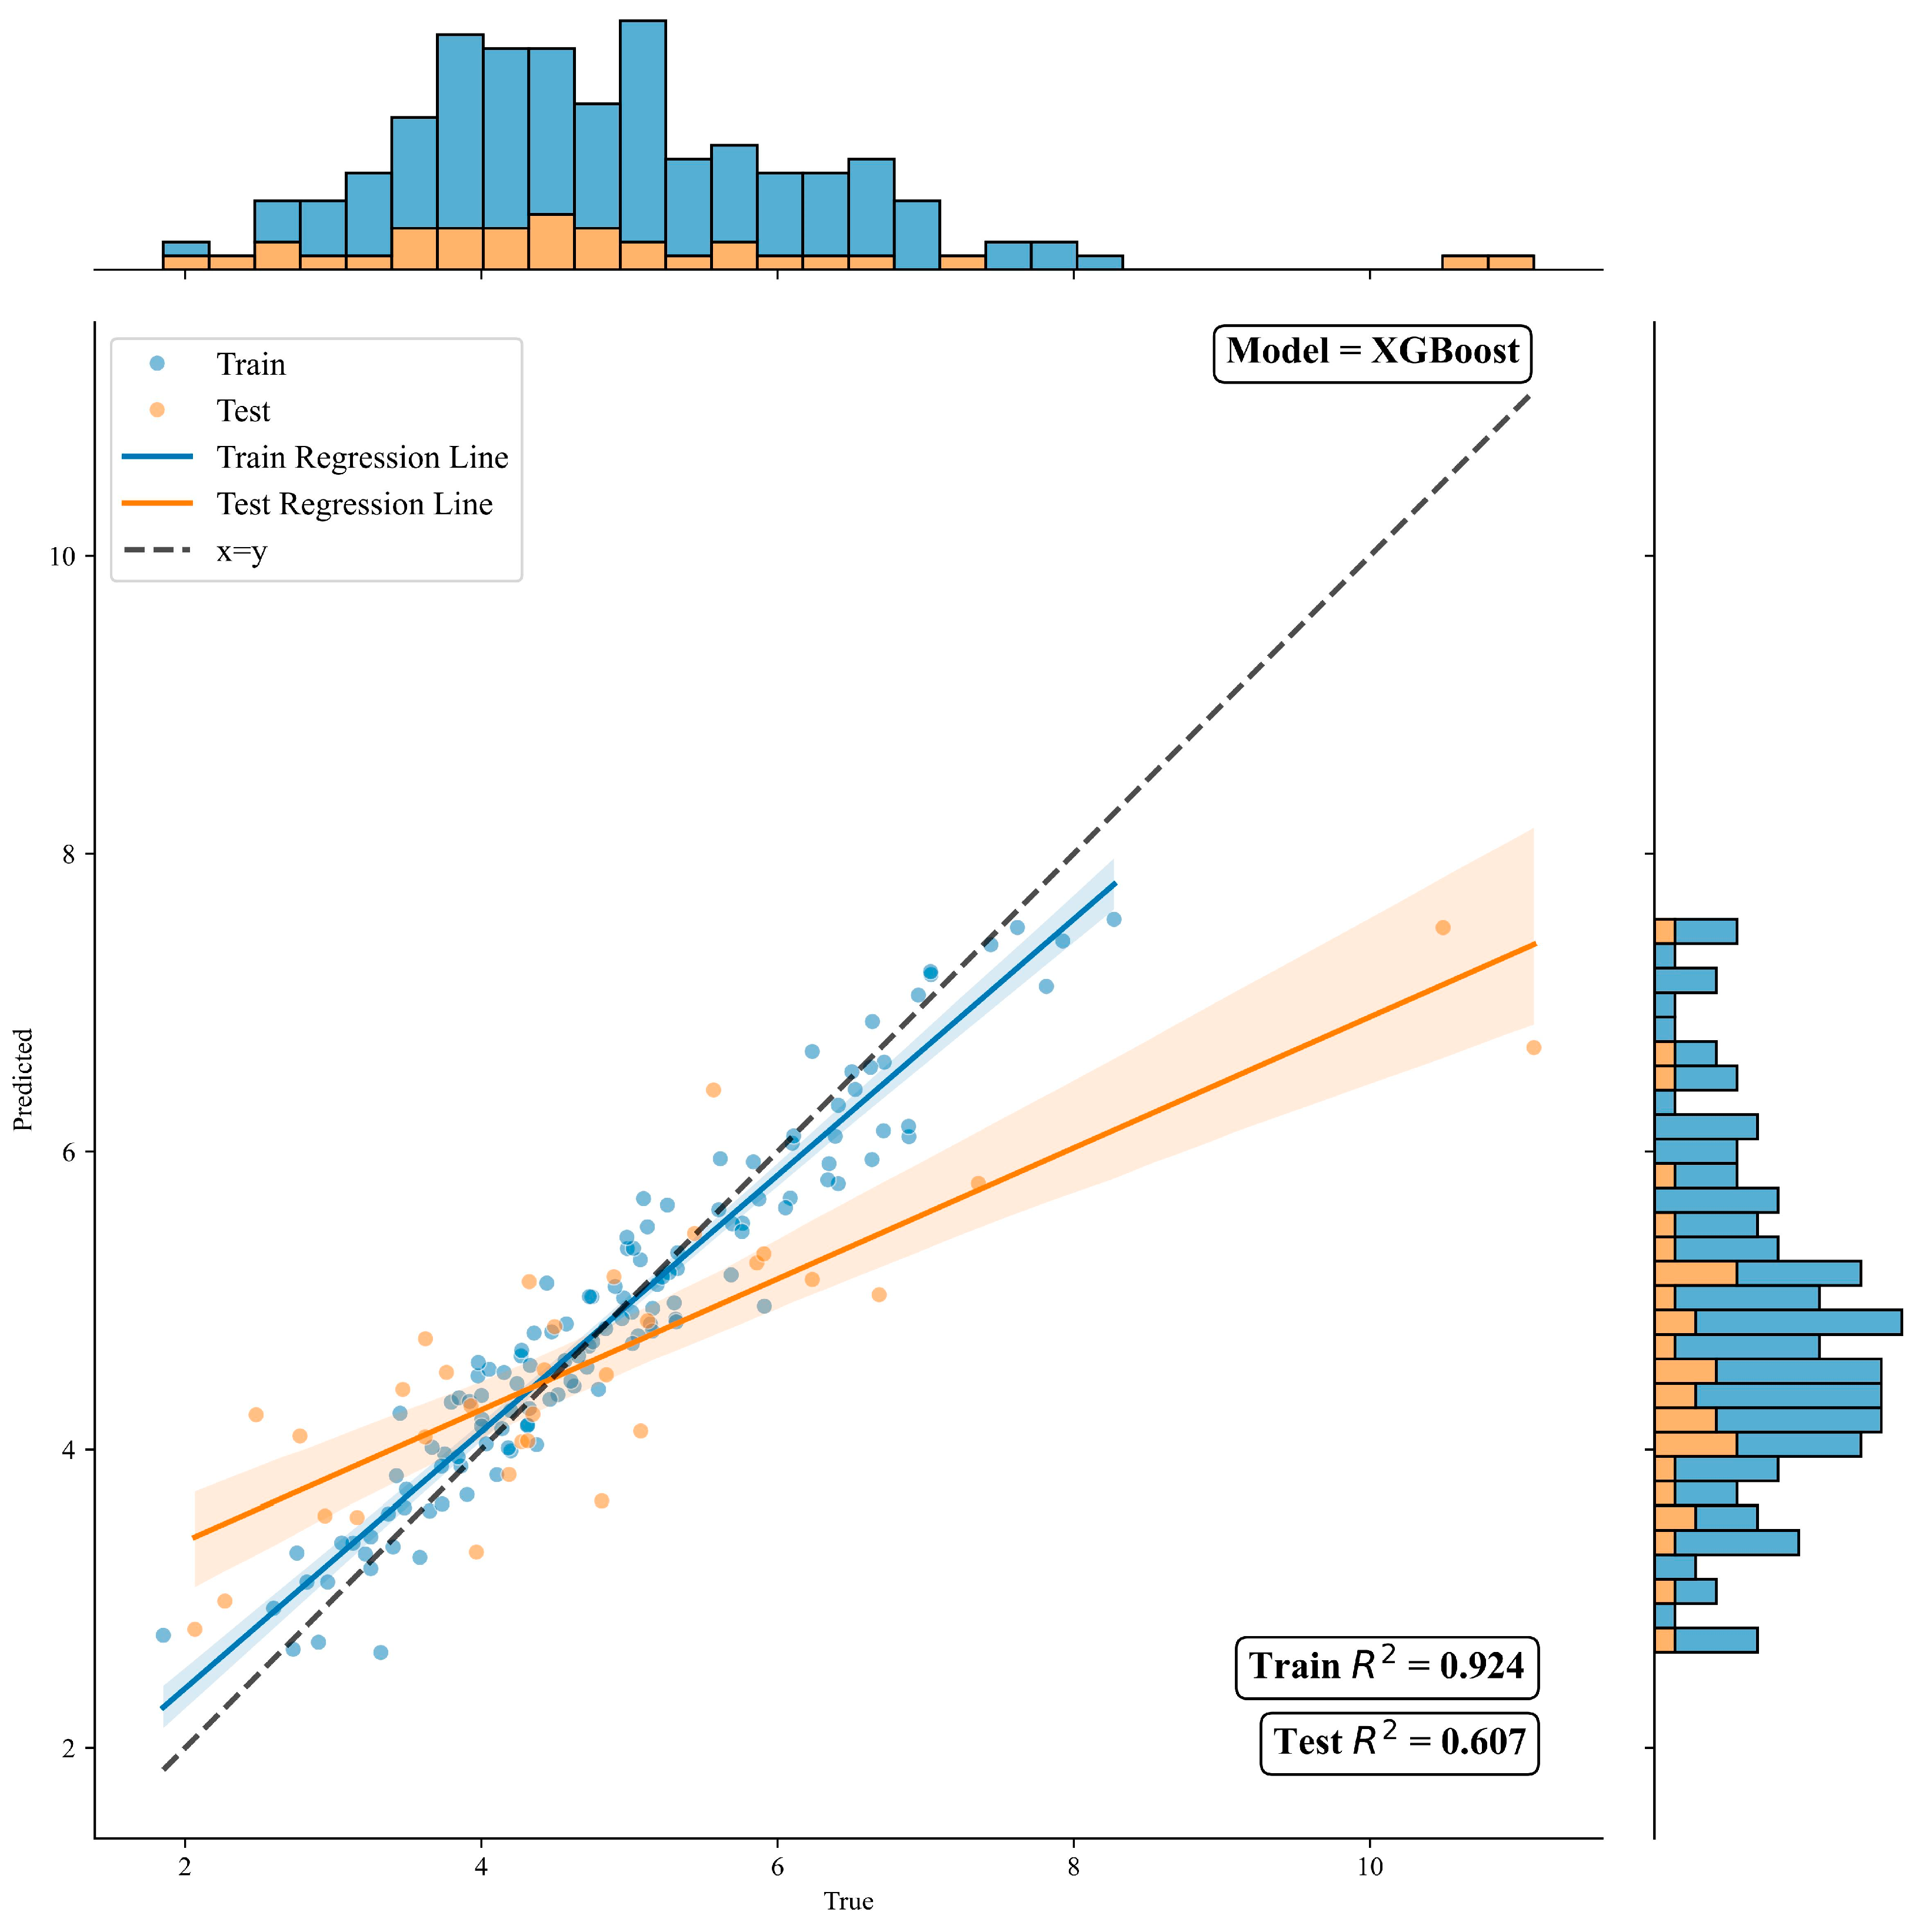
This study employs XGBoost to identify nonlinear relationships between the physical environment within and surrounding urban parks and their cooling intensity. Subsequently, SHAP models are used to interpret the predictions generated by XGBoost. The training and testing sets achieved R2 values of 0.924 and 0.607, respectively (Figure 5). The testing R2 of 0.607 reflects moderate but meaningful predictive power, which is considered acceptable for modeling complex environmental processes influenced by multiple interacting factors.
Figure 5.
Comparison of CI Prediction Results Between XGBoost Training and Test Sets.
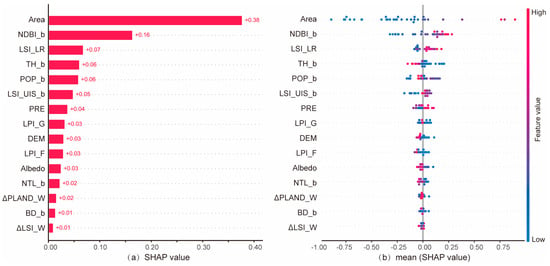
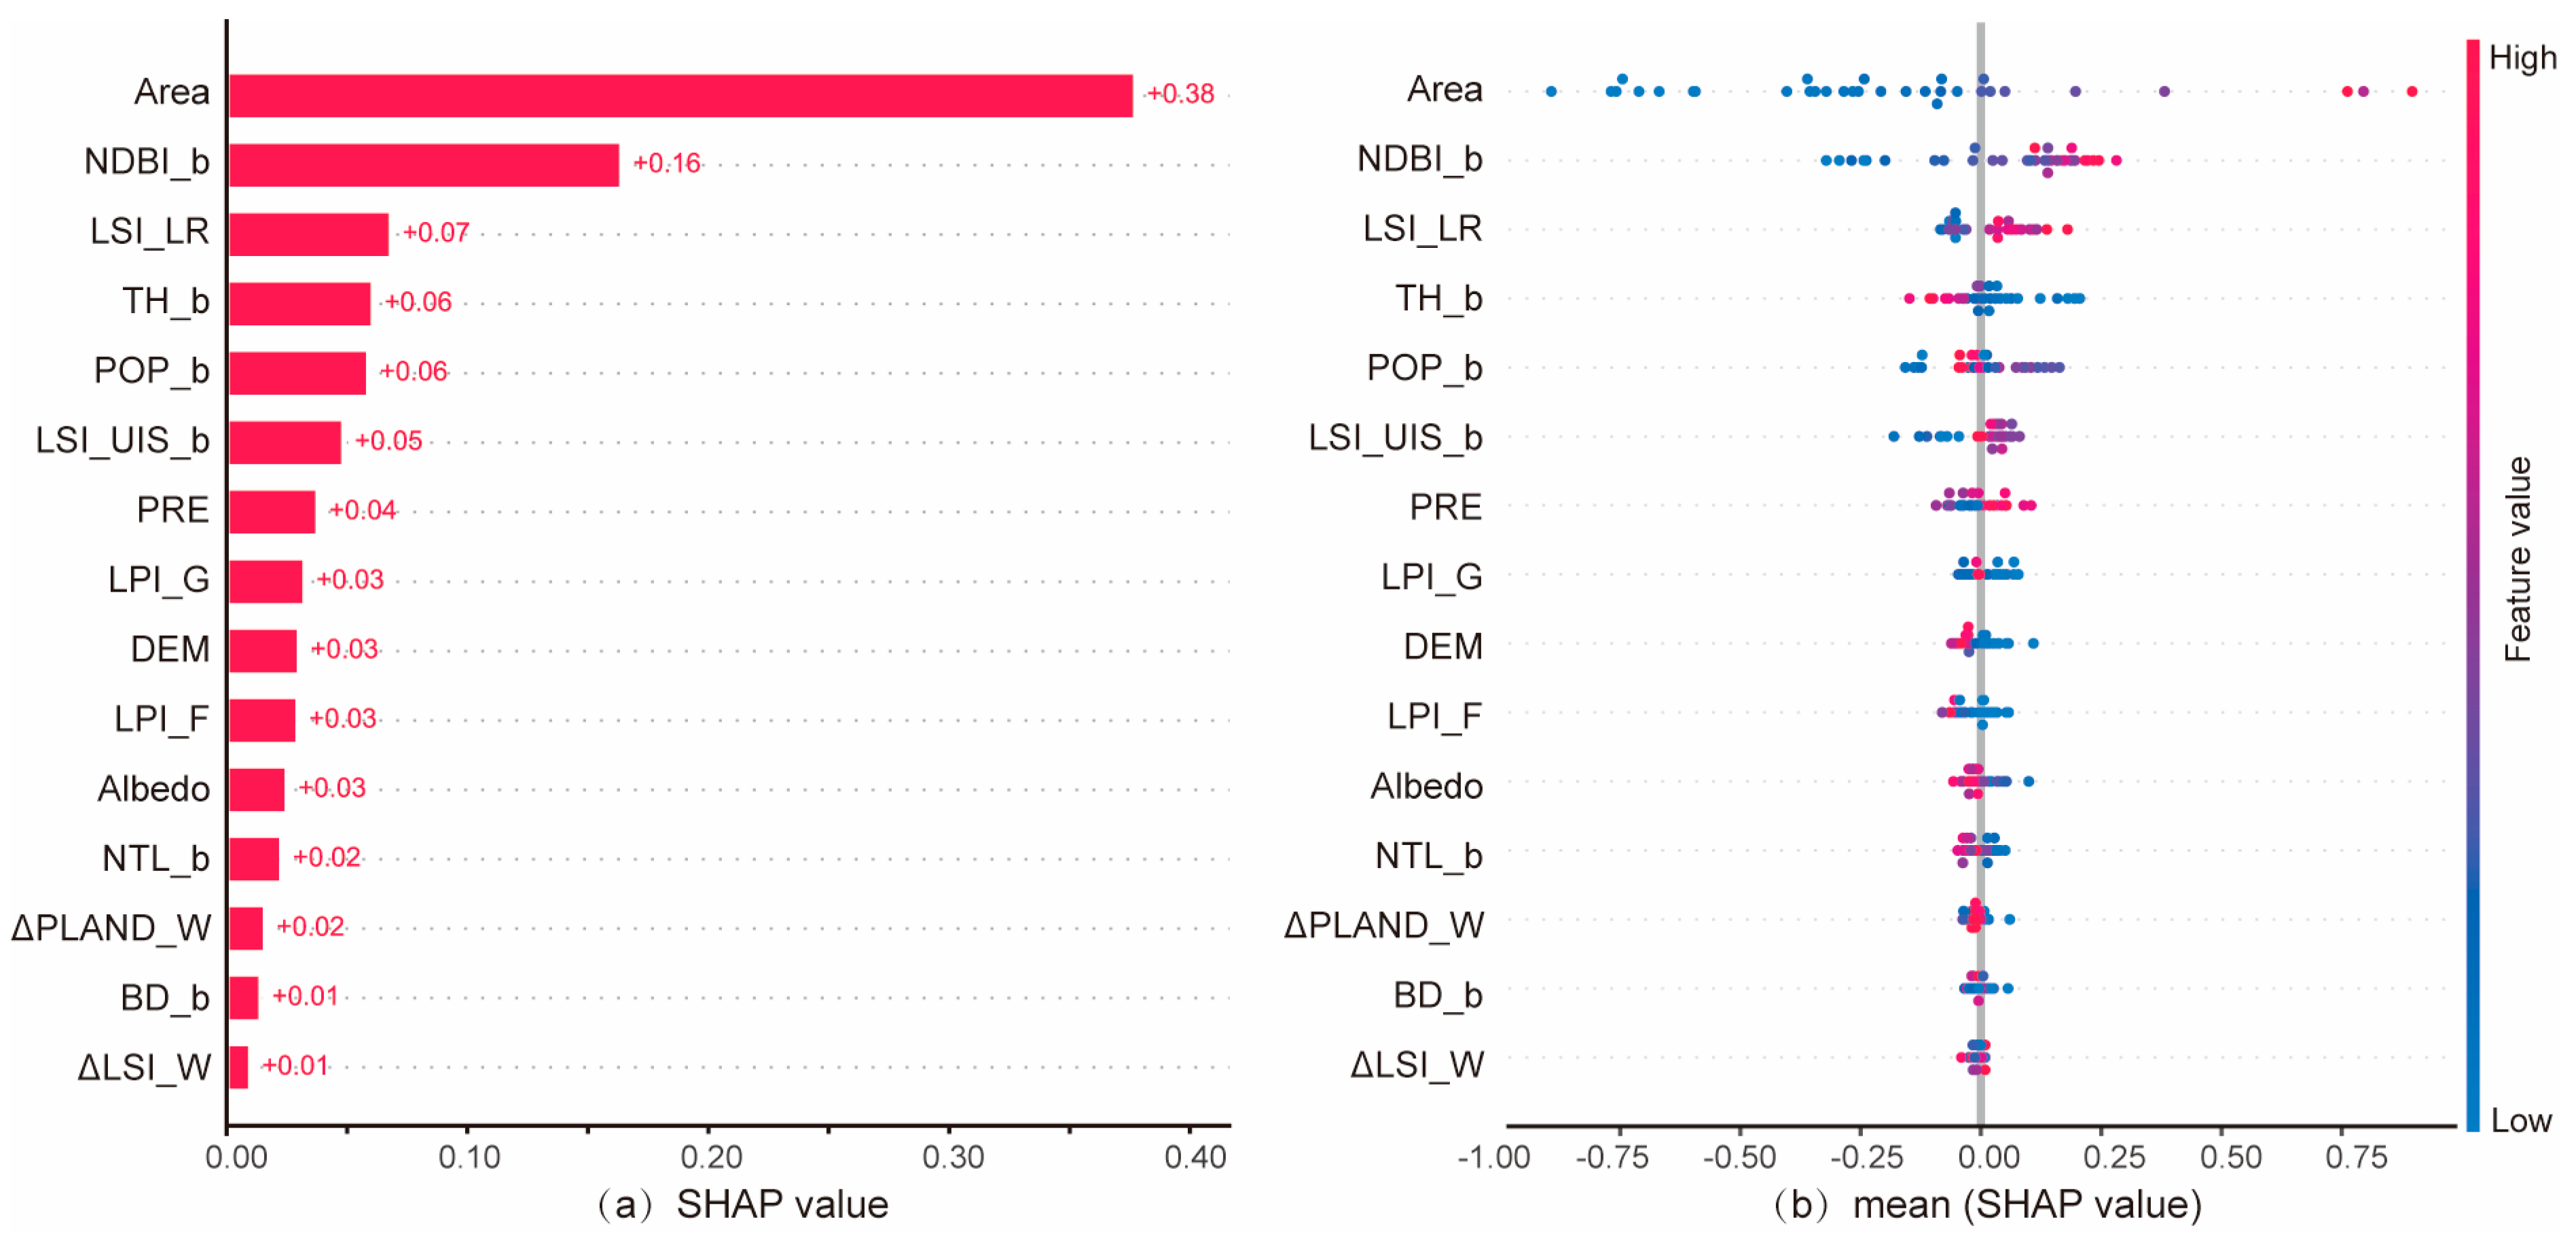
Figure 6a illustrates the relative importance of variables for CI prediction. Based on the average SHAP values across all factors, park area (Area: 0.38) is significantly more important than the other factors. The second most important factor is buffer NDBI (NDBI_b: 0.16), followed by the LSI of internal lakes/rivers (LSI_LR: 0.07), tree height in the buffer (TH_b: 0.06), population in the buffer (POP_b: 0.06), and landscape shape index of urban impervious surfaces in the buffer (LSI_UIS_b: 0.05). In contrast, the importance of factors such as the difference in water body LSI (ΔLSI_W: 0.01), difference in water body area proportion (ΔPLAN_W: 0.02), and surface reflectance (Albedo: 0.03) is relatively low.
Figure 6.
Mean SHAP (a) and SHAP value (b) of influencing factors.
In terms of importance distribution, at the urban agglomeration scale, the size of UBGS is the primary factor in explaining CI variation. Additionally, the intensity of surrounding development constitutes a key external background condition. In contrast, indicators such as ΔLSI_W, Albedo, and ΔPLAN_W rank at the lower end of importance, suggesting that these factors have a diminished average contribution in this study’s sample and scale. Their effects are more likely to be reflected through interactions with other variables, which should be further validated through subsequent PDP analysis.
Figure 6b displays a SHAP summary plot with variables sorted in descending order of relative importance. Each point represents a data sample, with the x-axis position indicating the SHAP value for that point. Points on the right side indicate a positive correlation between the feature and the prediction, while points on the left side indicate a negative correlation. Point color reflects the magnitude of the variable’s feature value: red indicates high values, and blue indicates low values. For example, for LSI_LR, low values (blue) are predominantly distributed on the left, while high values (red) are mainly on the right. Thus, increasing LSI_LR can enhance its CI. LSI_LR exhibits a long “right tail” and a short “left tail,” indicating that higher LSI_LR values have a relatively minor impact on CI, whereas lower LSI_LR values can significantly reduce CI. The Area variable is predominantly blue on the left side and red on the right side, with the largest horizontal span, indicating a positive contribution of increasing area to CI, which is much higher than other variables. Larger areas typically correspond to more pronounced cooling cumulative effects. LSI_LR shows a similar red-blue distribution pattern to the park area, but with a smaller span, suggesting its contribution is less significant compared to area. The red tail on the right side is longer than the blue tail, indicating that when LSI_LR is at higher levels, its positive contribution to CI becomes significantly amplified. For LSI_UIS_b, the red points are clearly clustered on the right, while the blue tail on the left is longer. When LSI_UIS_b is higher, its contribution to CI is more likely to be positive and concentrated.
3.3. Marginal Effects of Predictor Variables
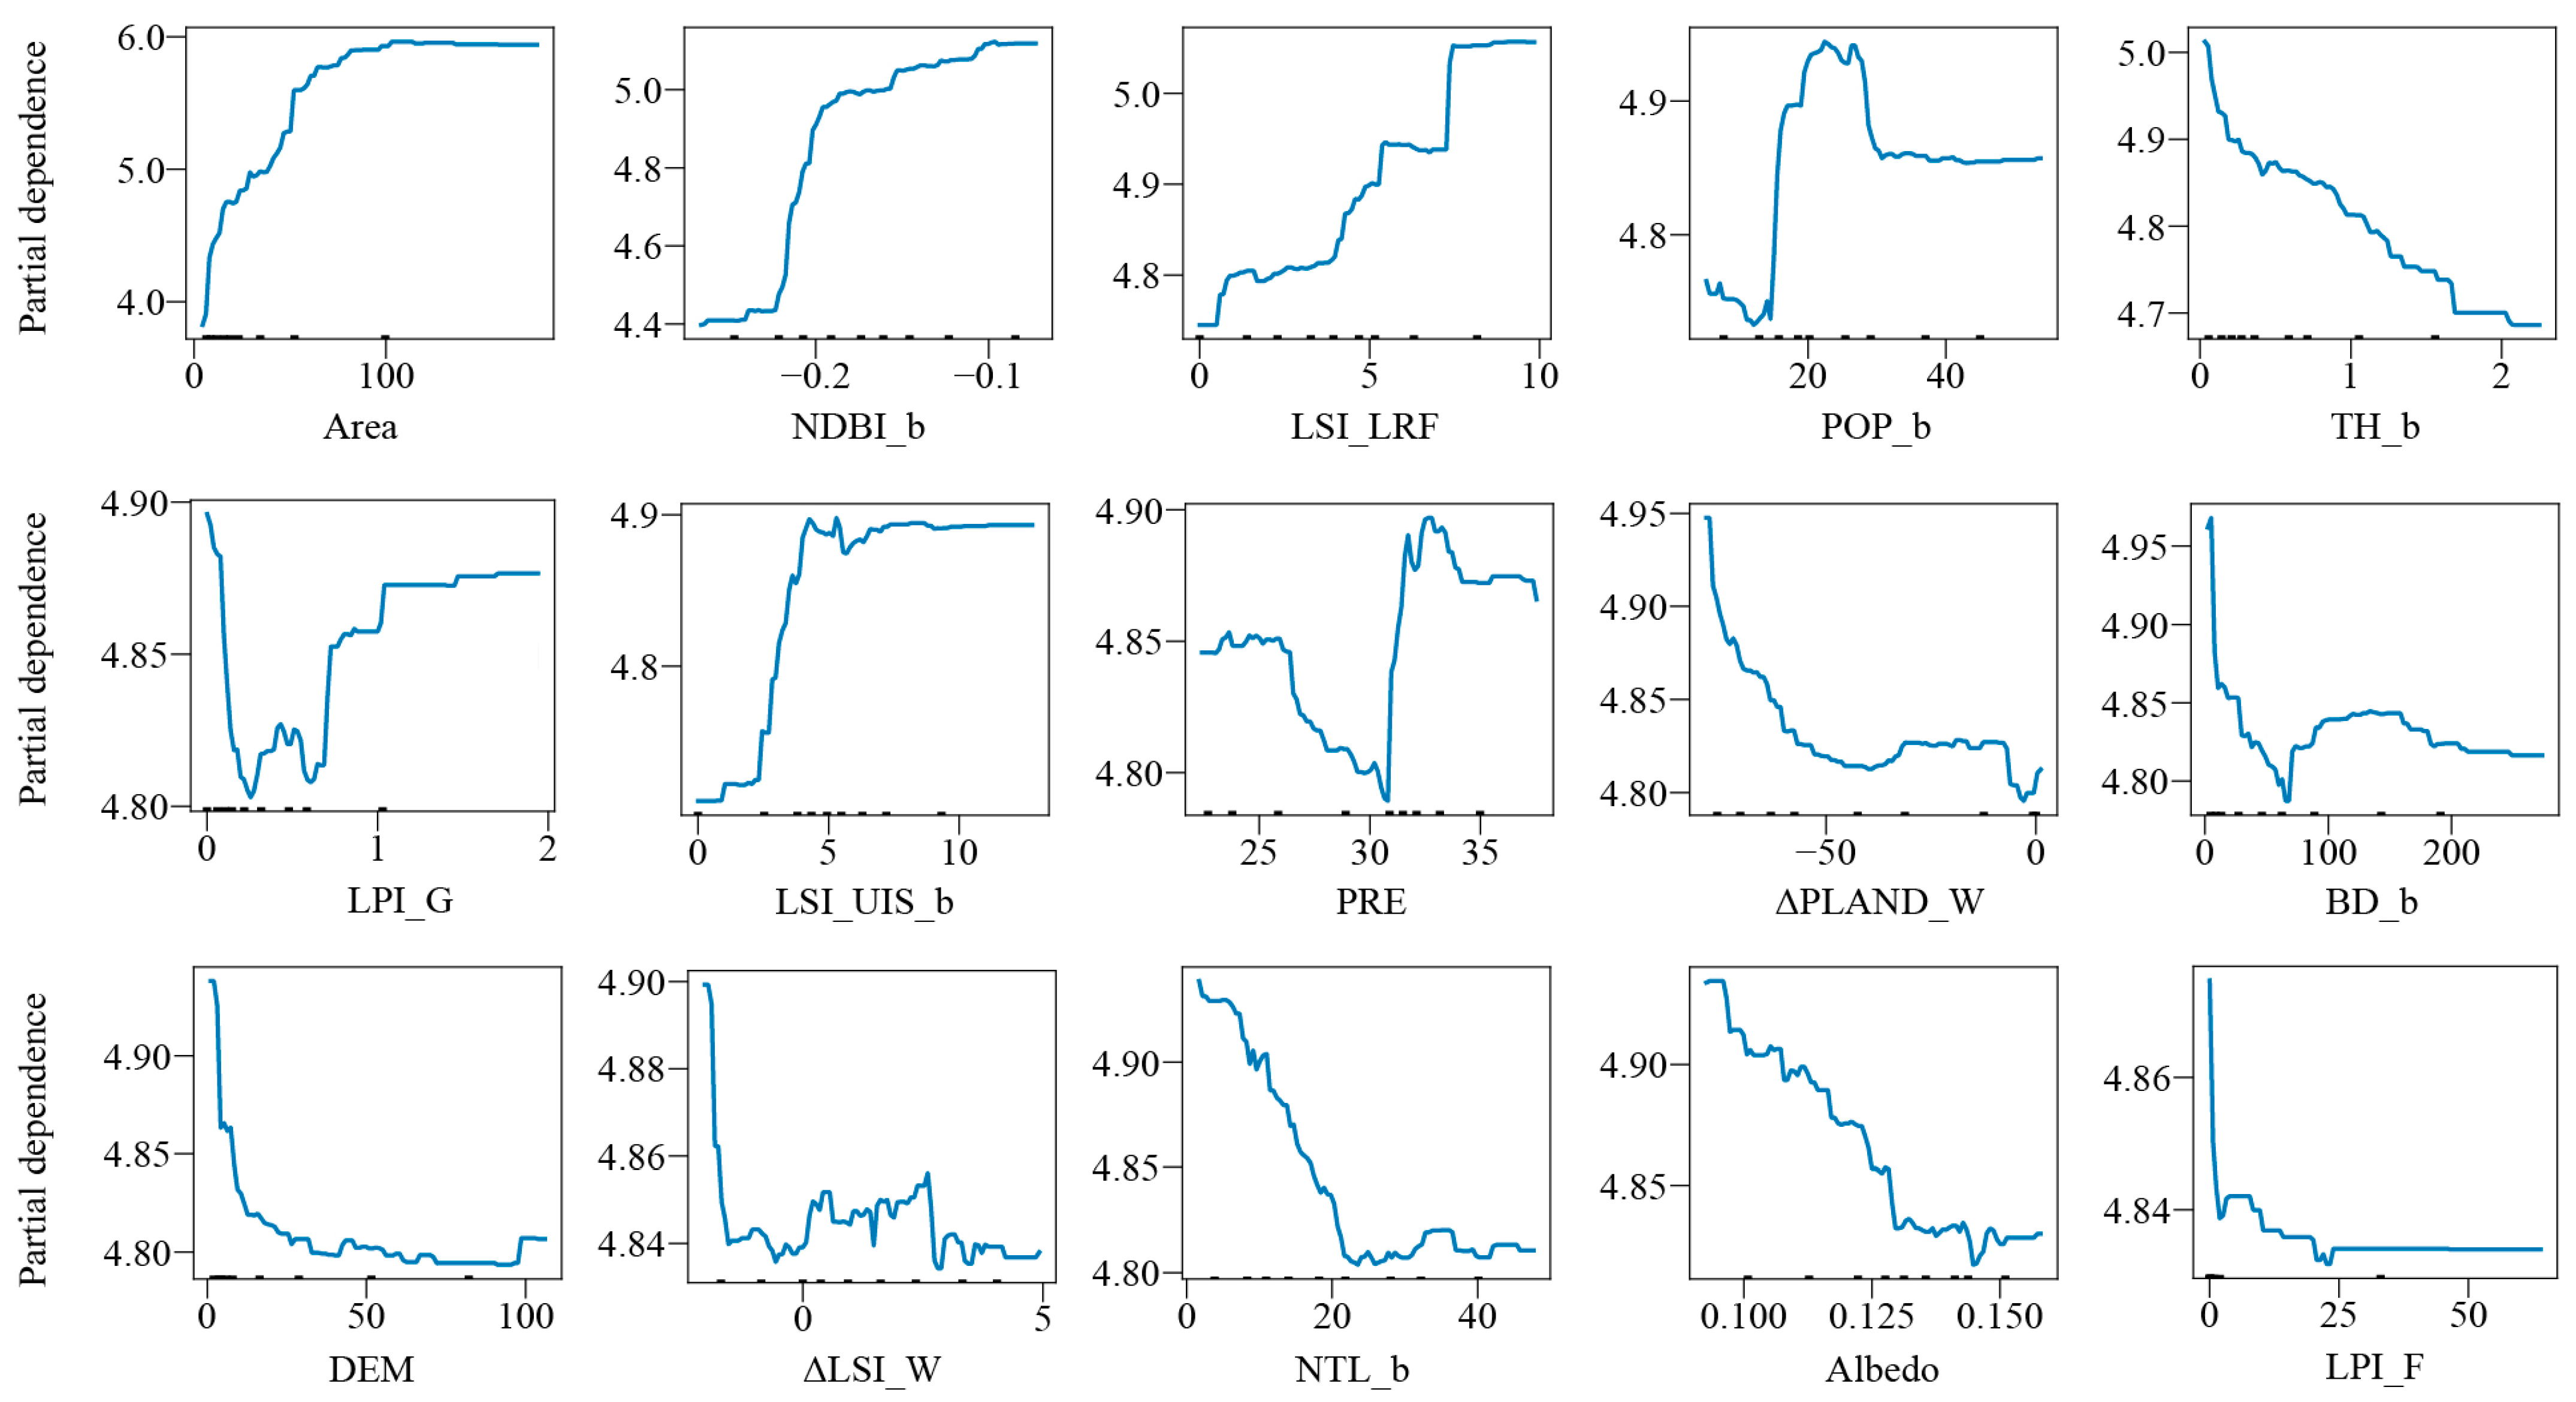
Partial Dependency Plots (PDPs) were used to analyze the marginal effects of each potential factor on CI (Figure 7). While Pearson correlation analysis had already demonstrated correlations between the 15 variables and CI, marginal effect analysis further revealed the nonlinear nature of these relationships. Additionally, the nonlinear response patterns among different indicators exhibited significant differences.
Figure 7.
Nonlinear relationships between influencing factors and CI.
Among the top three ranked variables, area showed a positive correlation with CI when ranging from 0 to 50 hm2. However, when the area exceeded 50 hm2, CI plateaued at its maximum value of 6 °C and ceased to change. Thus, larger park areas do not necessarily result in greater cooling effects. NDBI_b exhibits a positive correlation with CI. When NDBI_b is below −0.2, CI increases significantly faster than when NDBI_b exceeds −0.2. Higher hardscaping levels in buffer zones intensify thermal contrast with internal green spaces, amplifying CI. Green spaces deliver particularly pronounced cooling benefits in low-development-intensity areas. However, in highly urbanized external environments, while cooling effects persist, their growth rate slows. LSI_LR shows a positive correlation with CI, but its influence on CI does not increase continuously; instead, it exhibits stepwise growth. In urban blue–green space design, more complex water body edges are not necessarily better; LSI_LR within the 5–8 range achieves optimal cooling benefits. Beyond a certain edge complexity threshold, its contribution to cooling stabilizes. Among other variables, ΔPLAND_W shows a clear negative correlation with CI: larger water areas within urban blue–green spaces yield greater cooling effects. When Pre falls within the 22–30 mm range, CI exhibits a negative correlation with Pre. This indicates that during periods of low precipitation, vegetation transpiration in green spaces is constrained, and the evaporative cooling effect of water bodies is also insignificant, resulting in an overall weaker cooling capacity. However, when Pre increases to the 30–32 mm range, CI rises rapidly with increasing precipitation and then stabilizes. NTL_b and BD_b show a clear negative correlation with CI, indicating that the urban built environment significantly suppresses the cooling function of green spaces.
3.4. Interaction Effects Between Influencing Factors
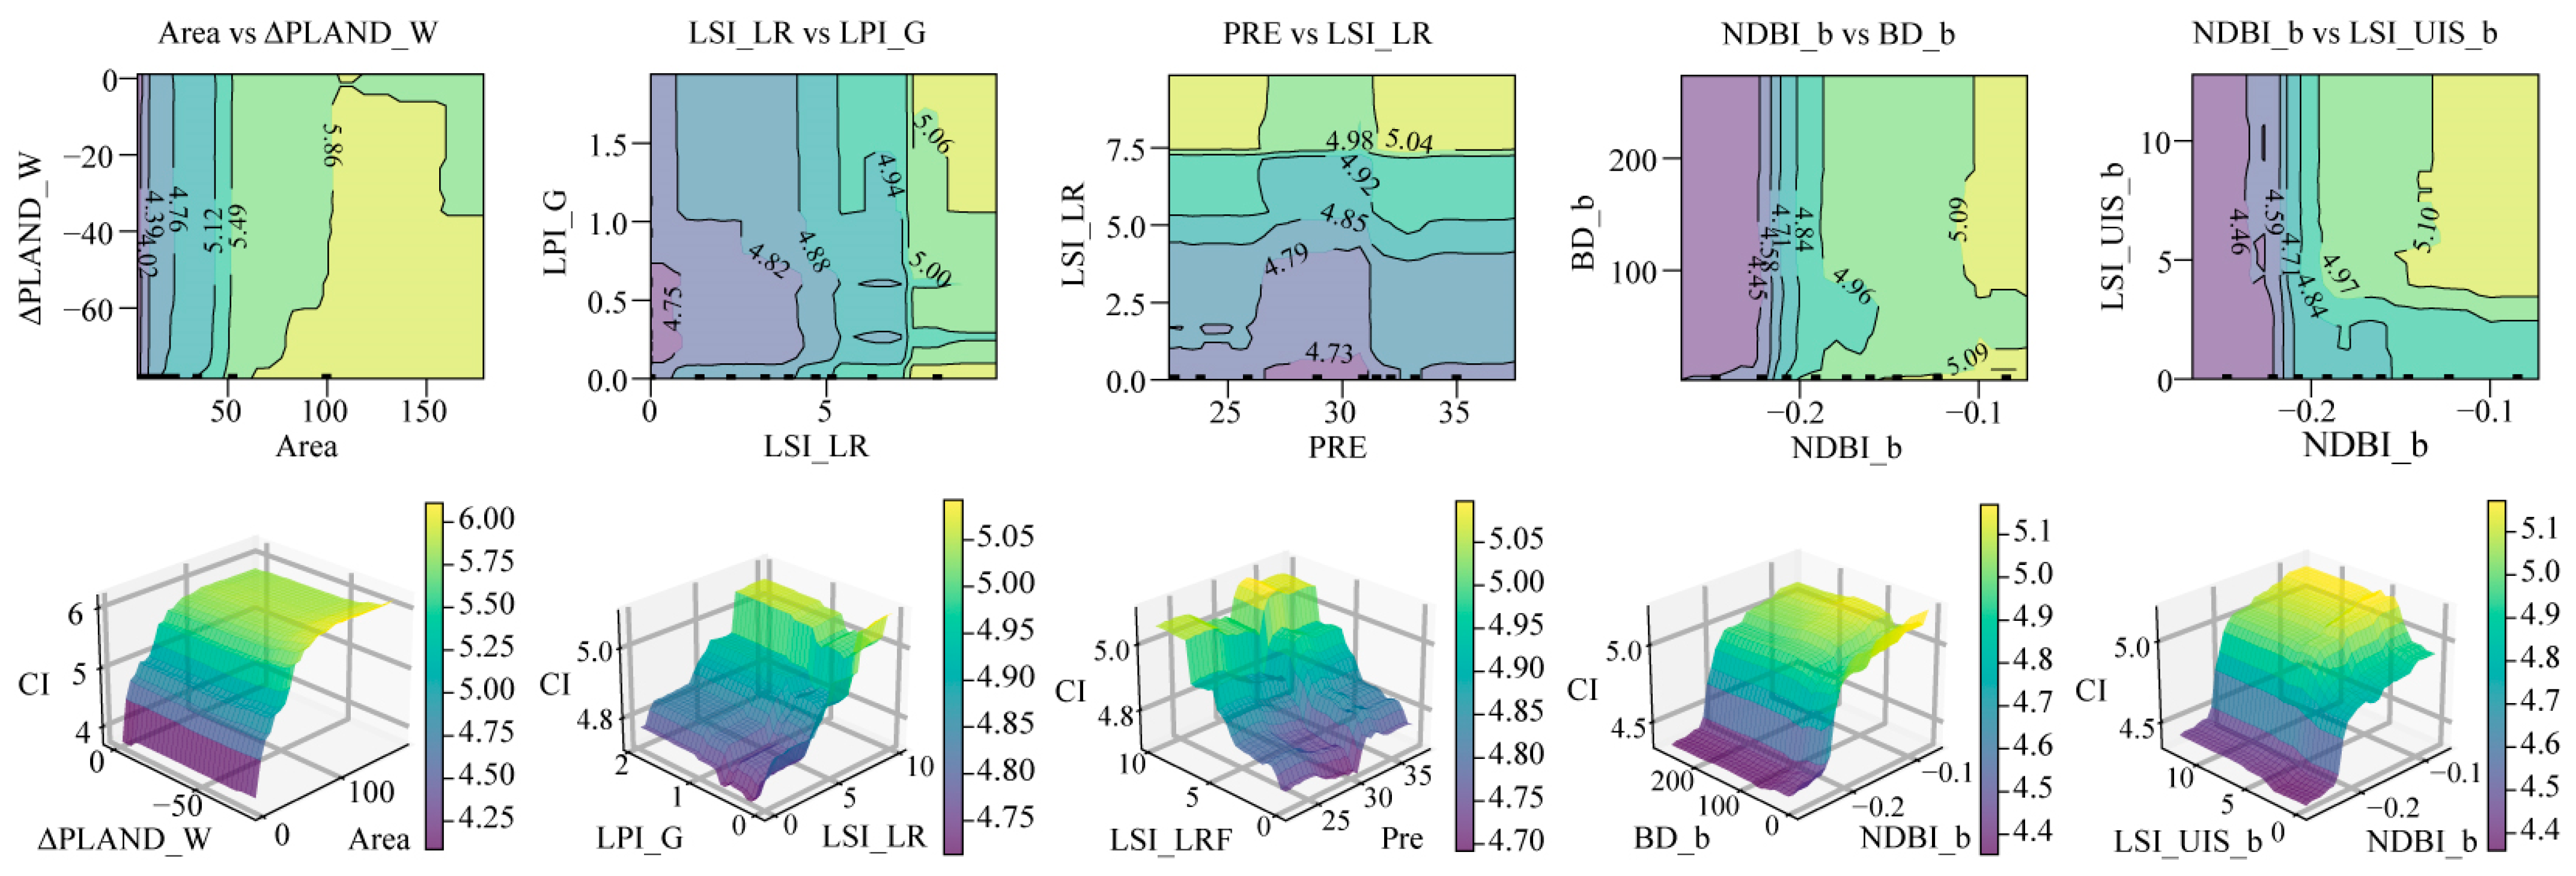
Through 2D and 3D Partial Dependence Plot (PDP) analysis, the synergistic effects of the following factors on CI were examined (Figure 8). When large UBGS (Area > 50 hectares) are combined with high internal water coverage (ΔPLAND_W < −60), the cooling effect of UBGS are significantly enhanced through vegetation transpiration and large-scale water evaporation. When both high river/lake boundary complexity (LSI_LR > 7.5) and high grassland patch dominance (LPI_G > 1) are present within UBGS, CI increases significantly, indicating a clear synergistic effect between these two factors in enhancing cooling. Under low precipitation (Pre) conditions, even with complex water body boundaries, evaporation is limited. However, under high precipitation conditions, complex boundaries can more effectively utilize water for evaporative cooling. As NDBI_b increases, the cooling capacity of the green space is greatly enhanced. High NDBI_b indicates large surface heat capacity, while high LSI_UIS_b signifies disordered building layouts and poor ventilation. When both rise, heat accumulates easily and dissipates poorly through natural convection, leading to sustained local temperature increases. Maximizing the cooling effect of urban blue–green spaces requires an integrated consideration of internal structural optimization and external environmental control.
Figure 8.
Interaction Effects Between influencing factors and CI.
4. Discussion
4.1. Key Factors Influencing the Cooling Effect of Urban Blue–Green Spaces
This study systematically evaluated the summer cooling intensity of 162 UBGS in the Yangtze River Delta region, with an average CI of 4.85 °C. The cooling intensity is the result of multiple contributing factors.
This study confirms a significant positive correlation between urban blue–green space (UBGS) area and CI, with larger areas generating stronger CI—consistent with findings in the existing literature [11,70]. Larger areas typically contain more trees and greater biomass, making them more likely to form cooling islands due to enhanced shading and evapotranspiration effects [21,43]. Furthermore, larger areas exhibit more stable microclimates and greater resilience against adverse thermal stress from surrounding built environments [13]. However, CI does not increase linearly with area but follows a logarithmic pattern. Consequently, cooling effects increase at diminishing rates until spatial scale reaches a threshold. This logarithmic relationship between CI and area has been documented in numerous studies [23,58]. However, different studies have proposed varying area thresholds: for example, some studies indicate that cooling intensity reaches its peak when the area exceeds 10 hectares [23], while others suggest that CI stabilizes after exceeding 20 hectares [71]. In contrast, this study estimates that the threshold for cooling efficiency in the Yangtze River Delta region is approximately 50 hectares. These differences may arise from the interaction of regional climate conditions, vegetation structure, urban morphology, and other factors, as the same threshold may not apply to all urban systems. Future research should further quantify threshold ranges in different regions and, by integrating remote sensing and field observation data, reveal the biophysical mechanisms behind the nonlinear relationship between area and cooling effects, such as the saturation characteristics of evapotranspiration and shading effects [27,72].
Research indicates that the percentage of water coverage within urban blue–green spaces (UBGS) positively correlates with CI, a mechanism attributed to the potent cooling effect provided by water through evapotranspiration, consistent with prior findings [13,73]. Concentrated patches experience less thermal stress from surrounding built environments, maintaining better health and higher evapotranspiration rates. More densely concentrated green spaces typically remain cooler than fragmented green spaces of equivalent total area [74]. However, high relative humidity can also intensify thermal sensation, making the ambient temperature feel higher, often referred to as “mugginess.” Future studies should consider the interactions between cooling intensity, humidity levels, and thermal comfort to provide a more comprehensive understanding of the thermal environment and guide the design of urban blue–green spaces to optimize comfort.
CI is also influenced by the buffer zone environment [75]. Studies reveal a significant negative correlation between building density (BD) and CI, as buildings alter energy balance patterns, directly affecting land surface temperature (LST) [37]. Additionally, surrounding structures impede the diffusion of cool air within parks [76]. Previous research indicates a quadratic polynomial relationship between BD and CI [77]. As BD increases, cooling intensity gradually rises, but decreases when BD exceeds a tipping point. This tipping point is determined by the amount of anthropogenic heat released in the neighborhood and the blocking effect of building form. However, since high-temperature buffer zones may impose heat stress on park vegetation, thereby reducing its cooling effect [21], this study found that the relationship between buffer zone building density (BD_b) and blue–green space CI exhibits a quadratic polynomial (V-shaped curve), which contradicts previous findings. Specifically, as building density increases, CI initially decreases gradually, but after reaching a turning point at approximately 80 (BD_b = 80), CI begins to increase with further increases in building density.
Studies also found that the shape index of impervious surfaces within the buffer significantly influences CI, consistent with previous research [37,42]. The normalized difference built-up index (NDBI) is considered an indispensable factor in China’s urban temperature rise; higher densities of buildings or impervious surfaces capture and store more heat [78]. However, this study found that NDBI’s impact on the Yangtze River Delta region is not particularly significant. This may be attributed to the separation between built-up areas and natural land, resulting in insufficient spatial variation in the built index to significantly influence CI [78]. Similar findings have been reported by previous scholars [79].
Socioeconomic factors are widely recognized as the primary drivers behind urban heat islands [80,81]. Therefore, this study selected multiple socio-related factors, such as population density (POP) and nighttime light intensity (NTL), to analyze the factors influencing CI. The findings reveal that NTL exerts a significant negative effect on CI. This may stem from NTL’s strong correlations with human activity, population density, socioeconomic development, and regional urbanization. Higher NTL levels indicate greater anthropogenic heat emissions, which directly intensify the heat island effect [78]. Furthermore, increased heat storage in buildings and roads during the day leads to greater heat release at night [78,79], further diminishing CI.
4.2. Implications for Sustainable Urban Planning
As China’s economic strategy unfolds, urban clusters continue to expand, accompanied by various environmental challenges and the impacts of climate change [82]. Therefore, exploring heat mitigation strategies at the regional level may yield insights that transcend single-city research [18,41]. It is crucial to strictly protect existing large-scale blue–green spaces, as they serve as irreplaceable regional cooling assets. When designing urban blue–green spaces, priority should be given to concentrated, large-scale water bodies and vegetation patches with relatively regular shapes to maximize evapotranspiration cooling effects. Additionally, efforts should be made to actively increase canopy coverage and water body coverage in both new and existing parks. To mitigate the thermal impact on surrounding environments, impervious surfaces in buffer zones should be reduced, and green infrastructure (e.g., green roofs, street trees) should be integrated into the urban fabric. This approach lowers background land surface temperature (LST) and extends the reach of urban blue–green spaces as cooling islands.
4.3. Limitations and Future Work
In this study, we quantified CI and identified the effects of factors within the urban blue–green space (UBGS) area and its buffer zone. This research has several limitations. First, this study focuses on near-field cooling intensity and does not examine the distance-decay effect beyond the buffer zone or include comparisons with non-UBGS control areas. Extending the analysis to these spatial dimensions represents an important direction for future research. Meteorological conditions such as wind speed, air temperature, and relative humidity are known to influence CI, yet this study did not account for these factors. Future research should incorporate climate variability [75]. Furthermore, to validate the accuracy of our model, future work could involve installing in situ temperature sensors to collect ground-truth data, as demonstrated in Boqué-Ciurana et al. [83], who used such sensors to reschedule human tower exhibitions based on thermal comfort. This approach would provide empirical validation and enhance the robustness of the findings. Since our dataset only covers land surface temperature data under clear-sky conditions from June to August 2020, and does not include data from other seasons, the interpretation of results for other seasons may be limited and should be treated with caution. It is recommended to integrate year-round temperature, weather, and land cover data to generate results for each season, as well as annual averages. Future studies could further expand to multi-year datasets to analyze CI variations across different years, thereby capturing long-term trends and the impact of climate change on the cooling effect of UBGS. Additionally, future research should consider other potential drivers, such as traffic density, industrial activities, and urban design characteristics, to gain a more comprehensive understanding of the formation mechanisms of the urban heat island effect.
5. Conclusions
This study provides a scientific basis for effectively planning urban mitigation of extreme heat effects through a systematic analysis of the cooling intensity and its drivers across 162 urban blue–green spaces in the Yangtze River Delta region. The key findings are as follows.
Using Pearson correlation analysis, the XGBoost machine learning algorithm, and the SHAP explanation method, we identified the complex relationships between 15 potential influencing factors and CI. The top five factors in terms of relative importance are: Area (0.38), NDBI in the buffer (0.16), Landscape shape index of lake/river flat (0.07), Tree height in the buffer (0.06), and Population in the buffer (0.06). Among the 2D landscape factors, Area shows a significant positive effect on CI, followed by NDBI in the buffer and LSI of rivers and lakes within UBGS. Higher water body coverage and a lower water body shape index within UBGS promote the formation of stable cooling zones. Regarding 3D landscape factors, Building density shows a significant negative correlation with CI, as dense building clusters not only obstruct ventilation but also increase anthropogenic heat emissions. Socioeconomic indicators also significantly influence CI, with NTL_b and POP_b showing strong negative correlations. This reflects how urbanization intensity suppresses the cooling effects of blue–green spaces.
Therefore, in practical green space planning and management, prioritizing the scale and internal landscape structure of UBGS is essential. Increasing the edge length and area of water bodies maximizes cooling effects, making core area expansion the most valuable strategy for enhancing cooling performance. Additionally, reducing hard surface ratios, optimizing three-dimensional spatial configurations, and appropriately controlling surrounding building layouts and heights can significantly mitigate the urban heat island effect.
Author Contributions
Conceptualization, L.G. and Z.Y.; methodology, L.G. and Z.Y.; software, L.G.; validation, L.G. and Z.Y.; formal analysis, L.G.; investigation, L.G.; resources, L.G. and Z.Y.; data curation, L.G.; writing—original draft preparation, L.G.; writing—review and editing, Z.Y.; visualization, L.G.; supervision, Z.Y.; project administration, Z.Y.; funding acquisition, Z.Y. All authors have read and agreed to the published version of the manuscript.
Funding
This work was supported by the Youth Fund Program of National Natural Science Foundation of China (NSFC) Program (grant number 51908116), Humanities and Social Science Foundation of the Ministry of Education in China (grant number 23YJAZH059) and Key Laboratory of Urban and Architectural Heritage Conservation, Ministry of Education, Southeast University (grant number KLUAHC2401).
Institutional Review Board Statement
Not applicable.
Informed Consent Statement
Not applicable.
Data Availability Statement
Data are available upon reasonable request to the corresponding author.
Conflicts of Interest
The authors declare no conflicts of interest.
Abbreviations
The following abbreviations are used in this manuscript:
| UBGS | Urban blue–green space |
| UHI | Urban heat island |
| CI | Cooling intensity |
| LST | Land surface temperature |
| YRD | Yangtze river delta |
| LULC | Land use and land cover |
| NDBI | Normalized difference built-up index |
| PRE | Precipitation |
| DEM | Digital elevation model |
| TH | Tree height |
| BH | Building height |
| BD | Building density |
| NTL | Nighttime Light |
| POP | Population |
| 2D | Two-dimensional |
| 3D | Three-dimensional |
| LSI | Landscape shape index |
| LPI | Largest patch index |
| PLAND | Percentage of landscape area |
References
- Mohajerani, A.; Bakaric, J.; Jeffrey-Bailey, T. The Urban Heat Island Effect, Its Causes, and Mitigation, with Reference to the Thermal Properties of Asphalt Concrete. J. Environ. Manag. 2017, 197, 522–538. [Google Scholar] [CrossRef] [Scilit]
- He, B.; Wang, J.; Zhu, J.; Qi, J. Beating the Urban Heat: Situation, Background, Impacts and the Way Forward in China. Renew. Sustain. Energy Rev. 2022, 161, 112350. [Google Scholar] [CrossRef] [Scilit]
- Hu, J.; He, G.; Meng, R.; Gong, W.; Ren, Z.; Shi, H.; Lin, Z.; Liu, T.; Zeng, F.; Yin, P.; et al. Temperature-Related Mortality in China from Specific Injury. Nat. Commun. 2023, 14, 37. [Google Scholar] [CrossRef] [Scilit] [PubMed]
- Peng, J.; Jia, J.; Liu, Y.; Li, H.; Wu, J. Seasonal Contrast of the Dominant Factors for Spatial Distribution of Land Surface Temperature in Urban Areas. Remote Sens. Environ. 2018, 215, 255–267. [Google Scholar] [CrossRef] [Scilit]
- Buchin, O.; Hoelscher, M.-T.; Meier, F.; Nehls, T.; Ziegler, F. Evaluation of the Health-Risk Reduction Potential of Countermeasures to Urban Heat Islands. Energy Build. 2016, 114, 27–37. [Google Scholar] [CrossRef] [Scilit]
- Heaviside, C.; Macintyre, H.; Vardoulakis, S. The Urban Heat Island: Implications for Health in a Changing Environment. Curr. Environ. Health Rep. 2017, 4, 296–305. [Google Scholar] [CrossRef] [Scilit]
- Hurlimann, A.; Moosavi, S.; Browne, G.R. Urban Planning Policy Must Do More to Integrate Climate Change Adaptation and Mitigation Actions. Land Use Policy 2021, 101, 105188. [Google Scholar] [CrossRef] [Scilit]
- Lundy, L.; Wade, R. Integrating Sciences to Sustain Urban Ecosystem Services. Prog. Phys. Geogr. Earth Environ. 2011, 35, 653–669. [Google Scholar] [CrossRef] [Scilit]
- Völker, S.; Kistemann, T. “I’m Always Entirely Happy When I’m Here!” Urban Blue Enhancing Human Health and Well-Being in Cologne and Düsseldorf, Germany. Soc. Sci. Med. 2013, 78, 113–124. [Google Scholar] [CrossRef] [Scilit]
- Wong, N.H.; Tan, C.L.; Kolokotsa, D.D.; Takebayashi, H. Greenery as a Mitigation and Adaptation Strategy to Urban Heat. Nat. Rev. Earth Environ. 2021, 2, 166–181. [Google Scholar] [CrossRef] [Scilit]
- Fan, H.; Yu, Z.; Yang, G.; Liu, T.Y.; Liu, T.Y.; Hung, C.H.; Vejre, H. How to Cool Hot-Humid (Asian) Cities with Urban Trees? An Optimal Landscape Size Perspective. Agric. For. Meteorol. 2019, 265, 338–348. [Google Scholar] [CrossRef] [Scilit]
- Ramírez-Aguilar, E.A.; Lucas Souza, L.C. Urban Form and Population Density: Influences on Urban Heat Island Intensities in Bogotá, Colombia. Urban Clim. 2019, 29, 100497. [Google Scholar] [CrossRef] [Scilit]
- Yang, C.; He, X.; Yu, L.; Yang, J.; Yan, F.; Bu, K.; Chang, L.; Zhang, S. The Cooling Effect of Urban Parks and Its Monthly Variations in a Snow Climate City. Remote Sens. 2017, 9, 1066. [Google Scholar] [CrossRef] [Scilit]
- Li, H.; Wang, G.; Tian, G.; Jombach, S. Mapping and Analyzing the Park Cooling Effect on Urban Heat Island in an Expanding City: A Case Study in Zhengzhou City, China. Land 2020, 9, 57. [Google Scholar] [CrossRef] [Scilit]
- Guo, A.; Yue, W.; Yang, J.; Li, M.; Zhang, Z.; Xie, P.; Zhang, M.; Lu, Y.; He, T. Quantifying the Cooling Effect and Benefits of Urban Parks: A Case Study of Hangzhou, China. Sustain. Cities Soc. 2024, 113, 105706. [Google Scholar] [CrossRef] [Scilit]
- Xu, Z.; Zhao, S. Scale dependence of urban green space cooling efficiency: A case study in Beijing metropolitan area. Sci. Total Environ. 2023, 898, 165563. [Google Scholar] [CrossRef] [Scilit] [PubMed]
- Sun, X.; Tan, X.; Chen, K.; Song, S.; Zhu, X.; Hou, D. Quantifying Landscape-Metrics Impacts on Urban Green-Spaces and Water-Bodies Cooling Effect: The Study of Nanjing, China. Urban For. Urban Green. 2020, 55, 126838. [Google Scholar] [CrossRef] [Scilit]
- Yu, Z.; Yang, G.; Zuo, S.; Jørgensen, G.; Koga, M.; Vejre, H. Critical Review on the Cooling Effect of Urban Blue-Green Space: A Threshold-Size Perspective. Urban For. Urban Green. 2020, 49, 126630. [Google Scholar] [CrossRef] [Scilit]
- Xiao, Y.; Piao, Y.; Pan, C.; Lee, D.; Zhao, B. Using Buffer Analysis to Determine Urban Park Cooling Intensity: Five Estimation Methods for Nanjing, China. Sci. Total Environ. 2023, 868, 161463. [Google Scholar] [CrossRef] [Scilit]
- Shi, M.; Chen, M.; Jia, W.; Du, C.; Wang, Y. Cooling Effect and Cooling Accessibility of Urban Parks during Hot Summers in China’s Largest Sustainability Experiment. Sustain. Cities Soc. 2023, 93, 104519. [Google Scholar] [CrossRef] [Scilit]
- Feyisa, G.L.; Dons, K.; Meilby, H. Efficiency of Parks in Mitigating Urban Heat Island Effect: An Example from Addis Ababa. Landsc. Urban Plan. 2014, 123, 87–95. [Google Scholar] [CrossRef] [Scilit]
- Kong, F.; Yin, H.; James, P.; Hutyra, L.R.; He, H.S. Effects of Spatial Pattern of Greenspace on Urban Cooling in a Large Metropolitan Area of Eastern China. Landsc. Urban Plan. 2014, 128, 35–47. [Google Scholar] [CrossRef] [Scilit]
- Yang, G.; Yu, Z.; Jørgensen, G.; Vejre, H. How Can Urban Blue-Green Space Be Planned for Climate Adaption in High-Latitude Cities? A Seasonal Perspective. Sustain. Cities Soc. 2020, 53, 101932. [Google Scholar] [CrossRef] [Scilit]
- Yang, F.; Yousefpour, R.; Zhang, Y.; Wang, H. The Assessment of Cooling Capacity of Blue-Green Spaces in Rapidly Developing Cities: A Case Study of Tianjin’s Central Urban Area. Sustain. Cities Soc. 2023, 99, 104918. [Google Scholar] [CrossRef] [Scilit]
- Dai, Y.; Zhang, J.; Fu, S.; Chen, W.; Zhang, Y.; Yi, K. Improving Resilience to Extreme Heat Events through Green Space Morphology: A Threshold-Based Perspective. Sustain. Cities Soc. 2025, 123, 106278. [Google Scholar] [CrossRef] [Scilit]
- Lu, Q.; Qi, W.; Yang, D.; Zhang, M. The Influence of Internal Spatial Coupling Characteristics of Blue-Green Space on Cooling Benefit in Metropolitan Areas: Evidence Form Hangzhou, China. Environ. Sustain. Indic. 2025, 25, 100558. [Google Scholar] [CrossRef] [Scilit]
- Xie, Q.; Li, J. Detecting the Cool Island Effect of Urban Parks in Wuhan: A City on Rivers. Int. J. Environ. Res. Public Health 2020, 18, 132. [Google Scholar] [CrossRef] [Scilit]
- Chang, C.-R.; Li, M.-H. Effects of Urban Parks on the Local Urban Thermal Environment. Urban For. Urban Green. 2014, 13, 672–681. [Google Scholar] [CrossRef] [Scilit]
- Kong, F.; Yin, H.; Wang, C.; Cavan, G.; James, P. A Satellite Image-Based Analysis of Factors Contributing to the Green-Space Cool Island Intensity on a City Scale. Urban For. Urban Green. 2014, 13, 846–853. [Google Scholar] [CrossRef] [Scilit]
- Du, H.; Cai, W.; Xu, Y.; Wang, Z.; Wang, Y.; Cai, Y. Quantifying the Cool Island Effects of Urban Green Spaces Using Remote Sensing Data. Urban For. Urban Green. 2017, 27, 24–31. [Google Scholar] [CrossRef] [Scilit]
- Peng, J.; Dan, Y.; Qiao, R.; Liu, Y.; Dong, J.; Wu, J. How to Quantify the Cooling Effect of Urban Parks? Linking Maximum and Accumulation Perspectives. Remote Sens. Environ. 2021, 252, 112135. [Google Scholar] [CrossRef] [Scilit]
- Shih, W. Greenspace Patterns and the Mitigation of Land Surface Temperature in Taipei Metropolis. Habitat Int. 2017, 60, 69–80. [Google Scholar] [CrossRef] [Scilit]
- Cai, X.; Yang, J.; Zhang, Y.; Xiao, X.; Xia, J. Cooling Island Effect in Urban Parks from the Perspective of Internal Park Landscape. Humanit. Soc. Sci. Commun. 2023, 10, 674. [Google Scholar] [CrossRef] [Scilit]
- Zhou, Y.; Zhao, H.; Mao, S.; Zhang, G.; Jin, Y.; Luo, Y.; Huo, W.; Pan, Z.; An, P.; Lun, F. Studies on Urban Park Cooling Effects and Their Driving Factors in China: Considering 276 Cities under Different Climate Zones. Build. Environ. 2022, 222, 109441. [Google Scholar] [CrossRef] [Scilit]
- Vaz Monteiro, M.; Doick, K.J.; Handley, P.; Peace, A. The Impact of Greenspace Size on the Extent of Local Nocturnal Air Temperature Cooling in London. Urban For. Urban Green. 2016, 16, 160–169. [Google Scholar] [CrossRef] [Scilit]
- Xu, X.; Cai, H.; Qiao, Z.; Wang, L.; Jin, C.; Ge, Y.; Wang, L.; Xu, F. Impacts of Park Landscape Structure on Thermal Environment Using QuickBird and Landsat Images. Chin. Geogr. Sci. 2017, 27, 818–826. [Google Scholar] [CrossRef] [Scilit]
- Han, D.; Xu, X.; Qiao, Z.; Wang, F.; Cai, H.; An, H.; Jia, K.; Liu, Y.; Sun, Z.; Wang, S.; et al. The Roles of Surrounding 2D/3D Landscapes in Park Cooling Effect: Analysis from Extreme Hot and Normal Weather Perspectives. Build. Environ. 2023, 231, 110053. [Google Scholar] [CrossRef] [Scilit]
- Meng, Q.; Gao, J.; Zhang, L.; Hu, X.; Qian, J.; Jancsó, T. Coupled Cooling Effects between Urban Parks and Surrounding Building Morphologies Based on the Microclimate Evaluation Framework Integrating Remote Sensing Data. Sustain. Cities Soc. 2024, 102, 105235. [Google Scholar] [CrossRef] [Scilit]
- Liao, W.; Guldmann, J.-M.; Hu, L.; Cao, Q.; Gan, D.; Li, X. Linking Urban Park Cool Island Effects to the Landscape Patterns inside and Outside the Park: A Simultaneous Equation Modeling Approach. Landsc. Urban Plan. 2023, 232, 104681. [Google Scholar] [CrossRef] [Scilit]
- Cao, X.; Onishi, A.; Chen, J.; Imura, H. Quantifying the Cool Island Intensity of Urban Parks Using ASTER and IKONOS Data. Landsc. Urban Plan. 2010, 96, 224–231. [Google Scholar] [CrossRef] [Scilit]
- Geng, X.; Yu, Z.; Zhang, D.; Li, C.; Yuan, Y.; Wang, X. The Influence of Local Background Climate on the Dominant Factors and Threshold-Size of the Cooling Effect of Urban Parks. Sci. Total Environ. 2022, 823, 153806. [Google Scholar] [CrossRef] [Scilit]
- Qiu, K.; Jia, B. The Roles of Landscape Both inside the Park and the Surroundings in Park Cooling Effect. Sustain. Cities Soc. 2020, 52, 101864. [Google Scholar] [CrossRef] [Scilit]
- Shah, A.; Garg, A.; Mishra, V. Quantifying the Local Cooling Effects of Urban Green Spaces: Evidence from Bengaluru, India. Landsc. Urban Plan. 2021, 209, 104043. [Google Scholar] [CrossRef] [Scilit]
- Lundberg, S.M.; Lee, S.-I. A Unified Approach to Interpreting Model Predictions. In Proceedings of the 31st International Conference on Neural Information Processing Systems; Curran Associates Inc.: Red Hook, NY, USA, 2017; pp. 4768–4777. [Google Scholar]
- Deng, Y.; Jiang, W.; Ling, Z.; Liu, L.; Sun, S. Revealing the Driving Factors of Urban Wetland Park Cooling Effects Using Random Forest Regression and SHAP Algorithm. Sustain. Cities Soc. 2025, 120, 106151. [Google Scholar] [CrossRef] [Scilit]
- Chen, T.; Guestrin, C. XGBoost: A Scalable Tree Boosting System. In Proceedings of the 22nd ACM SIGKDD International Conference on Knowledge Discovery and Data Mining; Association for Computing Machinery: New York, NY, USA, 2016; pp. 785–794. [Google Scholar]
- Luo, P.; Yu, B.; Li, P.; Liang, P.; Zhang, Q.; Yang, L. Understanding the Relationship between 2D/3D Variables and Land Surface Temperature in Plain and Mountainous Cities: Relative Importance and Interaction Effects. Build. Environ. 2023, 245, 110959. [Google Scholar] [CrossRef] [Scilit]
- Shi, S.; Ji, S.; Luo, Z. Spatial Heterogeneity, Interaction and Multi-Scale Effects of Driving Factors of Heat Island Intensity in Different Urban Agglomerations. Sustain. Cities Soc. 2025, 126, 106401. [Google Scholar] [CrossRef] [Scilit]
- Fang, C.; Yu, D. Urban Agglomeration: An Evolving Concept of an Emerging Phenomenon. Landsc. Urban Plan. 2017, 162, 126–136. [Google Scholar] [CrossRef] [Scilit]
- Du, H.; Wang, D.; Wang, Y.; Zhao, X.; Qin, F.; Jiang, H.; Cai, Y. Influences of Land Cover Types, Meteorological Conditions, Anthropogenic Heat and Urban Area on Surface Urban Heat Island in the Yangtze River Delta Urban Agglomeration. Sci. Total Environ. 2016, 571, 461–470. [Google Scholar] [CrossRef] [Scilit]
- Feng, R.; Wang, F.; Wang, K.; Wang, H.; Li, L. Urban Ecological Land and Natural-Anthropogenic Environment Interactively Drive Surface Urban Heat Island: An Urban Agglomeration-Level Study in China. Environ. Int. 2021, 157, 106857. [Google Scholar] [CrossRef] [Scilit]
- Peel, M.C.; Finlayson, B.L.; McMahon, T.A. Updated World Map of the Köppen-Geiger Climate Classification. Hydrol. Earth Syst. Sci. 2007, 11, 1633–1644. [Google Scholar] [CrossRef] [Scilit]
- Ministry of Ecology and Environment of the People’s Republic of China. National Climate Change Adaptation Strategy 2035; Ministry of Ecology and Environment of the People’s Republic of China: Beijing, China, 2022.
- Gao, Z.; Zaitchik, B.F.; Hou, Y.; Chen, W. Toward Park Design Optimization to Mitigate the Urban Heat Island: Assessment of the Cooling Effect in Five U.S. Cities. Sustain. Cities Soc. 2022, 81, 103870. [Google Scholar] [CrossRef] [Scilit]
- Zhang, X.; Liu, L.; Zhao, T.; Zhang, W.; Guan, L.; Bai, M.; Chen, X. GLC_FCS10: A Global 10-m Land-Cover Dataset with a Fine Classification System from Sentinel-1 and Sentinel-2 Time-Series Data in Google Earth Engine. Earth Syst. Sci. Data 2025, 17, 4039–4062. [Google Scholar] [CrossRef] [Scilit]
- Esri. ArcGIS Pro, Version 3.1; Environmental Systems Research Institute: Redlands, CA, USA, 2023. [Google Scholar]
- McGarigal, K.S.; Cushman, S.; Neel, M.; Ene, E. FRAGSTATS: Spatial Pattern Analysis Program for Categorical Maps; University of Massachusetts: Amherst, MA, USA, 2002. [Google Scholar]
- Liao, W.; Cai, Z.; Feng, Y.; Gan, D.; Li, X. A Simple and Easy Method to Quantify the Cool Island Intensity of Urban Greenspace. Urban For. Urban Green. 2021, 62, 127173. [Google Scholar] [CrossRef] [Scilit]
- Cheng, X.; Wei, B.; Chen, G.; Li, J.; Song, C. Influence of Park Size and Its Surrounding Urban Landscape Patterns on the Park Cooling Effect. J. Urban Plan. Dev. 2015, 141, A4014002. [Google Scholar] [CrossRef] [Scilit]
- Berger, C.; Rosentreter, J.; Voltersen, M.; Baumgart, C.; Schmullius, C.; Hese, S. Spatio-Temporal Analysis of the Relationship between 2D/3D Urban Site Characteristics and Land Surface Temperature. Remote Sens. Environ. 2017, 193, 225–243. [Google Scholar] [CrossRef] [Scilit]
- Yuan, B.; Zhou, L.; Dang, X.; Sun, D.; Hu, F.; Mu, H. Separate and Combined Effects of 3D Building Features and Urban Green Space on Land Surface Temperature. J. Environ. Manag. 2021, 295, 113116. [Google Scholar] [CrossRef] [Scilit] [PubMed]
- Zeng, P.; Sun, F.; Liu, Y.; Tian, T.; Wu, J.; Dong, Q.; Peng, S.; Che, Y. The Influence of the Landscape Pattern on the Urban Land Surface Temperature Varies with the Ratio of Land Components: Insights from 2D/3D Building/Vegetation Metrics. Sustain. Cities Soc. 2022, 78, 103599. [Google Scholar] [CrossRef] [Scilit]
- He, J.; Shi, Y.; Xu, L.; Lu, Z.; Feng, M.; Tang, J.; Guo, X. Exploring the Scale Effect of Urban Thermal Environment through XGBoost Model. Sustain. Cities Soc. 2024, 114, 105763. [Google Scholar] [CrossRef] [Scilit]
- Menard, S. Applied Logistic Regression Analysis; SAGE Publications, Inc.: Thousand Oaks, CA, USA, 2001; ISBN 1-5443-3258-0. [Google Scholar]
- Xu, C.; Chen, G.; Huang, Q.; Su, M.; Rong, Q.; Yue, W.; Haase, D. Can Improving the Spatial Equity of Urban Green Space Mitigate the Effect of Urban Heat Islands? An Empirical Study. Sci. Total Environ. 2022, 841, 156687. [Google Scholar] [CrossRef] [Scilit]
- Yao, L.; Li, T.; Xu, M.; Xu, Y. How the Landscape Features of Urban Green Space Impact Seasonal Land Surface Temperatures at a City-Block-Scale: An Urban Heat Island Study in Beijing, China. Urban For. Urban Green. 2020, 52, 126704. [Google Scholar] [CrossRef] [Scilit]
- Schober, P.; Boer, C.; Schwarte, L.A. Correlation Coefficients: Appropriate Use and Interpretation. Anesth. Analg. 2018, 126, 1763–1768. [Google Scholar] [CrossRef] [Scilit]
- Wu, H.; Ming, Y.; Liu, Y. Investigating the Influence of Morphologic and Functional Polycentric Structures on Urban Heat Island: A Case of Chongqing, China. Sustain. Cities Soc. 2024, 114, 105790. [Google Scholar] [CrossRef] [Scilit]
- Greenwell, B.M. Pdp: An R Package for Constructing Partial Dependence Plots. R J. 2017, 9, 421. [Google Scholar] [CrossRef] [Scilit]
- Li, Y.; Fan, S.; Li, K.; Zhang, Y.; Kong, L.; Xie, Y.; Dong, L. Large Urban Parks Summertime Cool and Wet Island Intensity and Its Influencing Factors in Beijing, China. Urban For. Urban Green. 2021, 65, 127375. [Google Scholar] [CrossRef] [Scilit]
- Pang, B.; Zhao, J.; Zhang, J.; Yang, L. How to Plan Urban Green Space in Cold Regions of China to Achieve the Best Cooling Efficiency. Urban Ecosyst. 2022, 25, 1181–1198. [Google Scholar] [CrossRef] [Scilit]
- Santamouris, M.; Ban-Weiss, G.; Osmond, P.; Paolini, R.; Synnefa, A.; Cartalis, C.; Muscio, A.; Zinzi, M.; Morakinyo, T.E.; Ng, E.; et al. Progress in Urban Greenery Mitigation Science—Assessment Methodologies Advanced Technologies and Impact on Cities. J. Civ. Eng. Manag. 2018, 24, 638–671. [Google Scholar] [CrossRef] [Scilit]
- Dai, Z.; Guldmann, J.-M.; Hu, Y. Thermal Impacts of Greenery, Water, and Impervious Structures in Beijing’s Olympic Area: A Spatial Regression Approach. Ecol. Indic. 2019, 97, 77–88. [Google Scholar] [CrossRef] [Scilit]
- Masoudi, M.; Tan, P.Y. Multi-Year Comparison of the Effects of Spatial Pattern of Urban Green Spaces on Urban Land Surface Temperature. Landsc. Urban Plan. 2019, 184, 44–58. [Google Scholar] [CrossRef] [Scilit]
- Zeren Cetin, I.; Varol, T.; Ozel, H.B.; Sevik, H. The Effects of Climate on Land Use/Cover: A Case Study in Turkey by Using Remote Sensing Data. Environ. Sci. Pollut. Res. 2023, 30, 5688–5699. [Google Scholar] [CrossRef] [Scilit]
- He, B.-J.; Ding, L.; Prasad, D. Enhancing Urban Ventilation Performance through the Development of Precinct Ventilation Zones: A Case Study Based on the Greater Sydney, Australia. Sustain. Cities Soc. 2019, 47, 101472. [Google Scholar] [CrossRef] [Scilit]
- Zhang, Q.; Zhou, D.; Xu, D.; Rogora, A. Correlation between Cooling Effect of Green Space and Surrounding Urban Spatial Form: Evidence from 36 Urban Green Spaces. Build. Environ. 2022, 222, 109375. [Google Scholar] [CrossRef] [Scilit]
- Geng, S.; Yang, L.; Sun, Z.; Wang, Z.; Qian, J.; Jiang, C.; Wen, M. Spatiotemporal Patterns and Driving Forces of Remotely Sensed Urban Agglomeration Heat Islands in South China. Sci. Total Environ. 2021, 800, 149499. [Google Scholar] [CrossRef] [Scilit] [PubMed]
- Zhou, D.; Bonafoni, S.; Zhang, L.; Wang, R. Remote Sensing of the Urban Heat Island Effect in a Highly Populated Urban Agglomeration Area in East China. Sci. Total Environ. 2018, 628–629, 415–429. [Google Scholar] [CrossRef] [Scilit] [PubMed]
- Deng, X.; Gao, F.; Liao, S.; Liu, Y.; Chen, W. Spatiotemporal Evolution Patterns of Urban Heat Island and Its Relationship with Urbanization in Guangdong-Hong Kong-Macao Greater Bay Area of China from 2000 to 2020. Ecol. Indic. 2023, 146, 109817. [Google Scholar] [CrossRef] [Scilit]
- Wang, Y.; Zhang, W.; Fan, M.; Ge, Q.; Qiao, B.; Zuo, X.; Jiang, B. Regression with Adaptive Lasso and Correlation Based Penalty. Appl. Math. Model. 2022, 105, 179–196. [Google Scholar] [CrossRef] [Scilit]
- Liang, L.; Wang, Z.; Li, J. The Effect of Urbanization on Environmental Pollution in Rapidly Developing Urban Agglomerations. J. Clean. Prod. 2019, 237, 117649. [Google Scholar] [CrossRef] [Scilit]
- Boqué-Ciurana, A.; Pozo, J.X.O.; Sevil, J.; Saladié, Ò. Rescheduling Summer Human Tower Exhibitions? Thermal Comfort Increases in the Evening. Geographies 2025, 5, 50. [Google Scholar] [CrossRef] [Scilit]

Disclaimer/Publisher’s Note: The statements, opinions and data contained in all publications are solely those of the individual author(s) and contributor(s) and not of MDPI and/or the editor(s). MDPI and/or the editor(s) disclaim responsibility for any injury to people or property resulting from any ideas, methods, instructions or products referred to in the content. |
© 2026 by the authors. Licensee MDPI, Basel, Switzerland. This article is an open access article distributed under the terms and conditions of the Creative Commons Attribution (CC BY) license.