


Abstract
Perception-level interference patterns, such as abutting gratings that induce illusory contours and pseudoisochromatic dot camouflage, can trigger failures that are not well captured by conventional corruption benchmarks. We construct an illusion-driven evaluation suite based on MNIST variants, including AG-MNIST and Ishihara-MNIST, under a unified pipeline with fixed train/validation/test splits. Building on a multi-domain empirical risk minimization (ERM) baseline, we present AugMix–DeepAugment Consistency Training (ADCT), a training-time recipe that combines mixed augmentations, DeepAugment-style image distortions, and Jensen–Shannon consistency regularization. Across multiple ImageNet-pretrained backbones and multiple random seeds, ADCT improves robustness on the five-set illusion OOD suite (OOD5) on average while simultaneously improving probabilistic calibration, as measured by ECE together with proper scoring rules (NLL and Brier score). For ResNet-50, ADCT yields a substantial gain on OOD5 relative to the Ishihara-only baseline (S0), increasing accuracy from 29.0% to 59.7% and reducing NLL from 7.44 to 1.11. To assess external validity, we additionally report results on CIFAR-10 and CIFAR-10-C and compare against representative augmentation-based baselines (including PixMix), contextualizing the robustness–calibration trade-off on a widely used natural-image robustness benchmark. These results suggest that consistency-based augmentation recipes can improve both robustness and confidence reliability under structured, illusion-like shifts without changing inference-time architectures.
1. Introduction
Modern computer vision systems increasingly rely on deep neural networks for recognition, inspection, tracking, and decision support. While convolutional neural networks (CNNs) achieve strong accuracy on standard benchmarks, their performance and reliability can degrade sharply under distribution shift—a pervasive issue in real-world deployments where images exhibit variations in illumination, background texture, compression, blur, noise, and acquisition conditions [1,2,3,4,5]. Corruption benchmarks, such as ImageNet-C/P, standardize common perturbations and reveal substantial error increases under such shifts [6]. However, many practical failures in vision pipelines are driven not only by acquisition-style degradations, but also by structured, perception-level interference patterns that reorganize local evidence (e.g., gratings, dot fields, chromatic context) while largely preserving global geometry [7,8].
A critical complication is that accuracy drops under shift often coincide with degraded uncertainty estimation: deep models can be sharply overconfident, producing high-confidence mistakes that are particularly harmful for risk-aware vision applications. Negative log-likelihood (NLL), reliability diagrams, and expected calibration error (ECE) quantify the mismatch between confidence and empirical correctness [1,2,9,10]. Beyond standard vision benchmarks, prior work in risk-sensitive settings has highlighted that improving calibration and avoiding confident wrong predictions is important for trustworthy deployment [11]. These considerations motivate training recipes that improve not only robustness but also the reliability of confidence scores. Among training-time approaches, augmentation-based recipes are attractive because they keep inference unchanged while improving robustness and calibration under distribution shift. AugMix improves robustness and calibration via stochastic mixing and a Jensen–Shannon divergence (JSD) consistency loss [12], while DeepAugment expands the perturbation space using network-based transformations and improves robustness on challenging benchmarks [13,14]. Recent studies also highlight that augmentation choices can influence model transparency and decision rationale, which further affects trust in practical systems [15]. Despite these advances, augmentation-based robustness and calibration have been far less studied under perception-driven distortions that introduce structured interference rather than conventional acquisition noise.
Perceptual illusions provide a controlled tool to probe systematic differences between physical stimuli and subjective percepts, and to compare human and machine vision under structured interference. Classic examples such as Kanizsa shapes show that humans perceive clear contours where no physical edges exist, whereas standard feed-forward CNNs often struggle to represent such illusory boundaries [16,17]. Neurophysiological evidence suggests that illusory contours are represented in the higher visual cortex and can be shaped by top-down feedback and recurrent computations [18,19,20]. More recently, illusions have been embedded into machine-learning benchmarks: Fan and Zeng proposed abutting-grating (AG) distortions that superimpose phase-shifted gratings around object boundaries (AG-MNIST), demonstrating that a wide range of modern deep models suffer severe performance degradation under such illusion-induced perturbations, particularly as grating spacing increases [21]. Henshaw et al. introduced Ishihara-MNIST by embedding digits into pseudoisochromatic dot patterns, revealing large degradations in both performance and calibration [22]. Complementary work on color illusions further shows that CNNs can be systematically misled by chromatic context even in low-level vision tasks [23]. Importantly, analogous structured interference can arise in computer vision practice (e.g., repetitive textures, moiré-like patterns, or pseudoisochromatic camouflage in printed/signage imagery), making illusion-driven shifts relevant for risk-aware perception.
Despite these advances, several questions remain open. Most illusion-based studies emphasize accuracy, while calibration under perception-driven shifts has received less systematic attention [1,2,10]. It is also unclear how effective general-purpose robustness techniques such as AugMix and DeepAugment are in these illusion domains, and whether they can reliably mitigate the degradation observed on AG-MNIST and Ishihara-MNIST [12,13,22]. Beyond training-time robustness, reliability under distribution shift can be pursued via generalized OOD detection or test-time adaptation, but these approaches typically require additional detection modules, target-domain data streams, or online updates at deployment [24,25,26].
In this paper, we address these questions by constructing a family of illusion-based evaluation sets built upon MNIST and its variants, including abutting-grating distortions (AG-MNIST), Ishihara-style color-dot distortions (Ishihara-MNIST), and high-resolution MNIST (high-MNIST) [27,28]. We propose a unified training strategy, AugMix–DeepAugment Consistency Training (ADCT), which jointly trains on Ishihara-MNIST and AG-MNIST style data with an AugMix + DeepAugment + JSD consistency regularization term. All models operate on a unified 224 × 224 × 3 input with ImageNet-style normalization and follow strict train/validation/test splits with per-class caps. Across ImageNet-pretrained backbones, ADCT improves mean accuracy over five illusion-domain OOD test sets (OOD5) and substantially reduces OOD5 NLL and ECE, indicating better-calibrated predictions under illusion-based distribution shifts.
Our main contributions are fourfold. (1) We propose a unified evaluation protocol and data pipeline for illusion-driven distribution shifts, complementing conventional corruption benchmarks that largely overlook illusory contours and pseudoisochromatic camouflage. (2) We study ADCT as a practical training-time recipe (AugMix + DeepAugment + JSD consistency) and show that it improves illusion-domain robustness and calibration on average across five seeds and multiple pretrained backbones. (3) We characterize systematic sensitivity patterns induced by AG gratings (orientation × spacing) and analyze structured confusion behaviors, highlighting that illusion shifts induce class-dependent failure modes rather than purely random noise. (4) We assess external validity by reporting results on CIFAR-10/CIFAR-10-C and contextualizing the robustness–calibration trade-offs relative to representative augmentation-based baselines, which is relevant for selective prediction settings where confidence scores are used for screening or abstention.
2. Background
Robust perception in vision pipelines requires models that maintain both accuracy and reliable confidence under distribution shifts. Existing robustness benchmarks and training recipes have enabled systematic evaluation under acquisition-style corruptions (e.g., blur, noise, compression) [4,5,6]. However, perception-driven distortions that restructure local evidence—such as gratings that induce illusory boundaries or pseudoisochromatic dot fields that camouflage targets—are far less represented in standard benchmark suites, despite their relevance to structured interference patterns that can arise in real imagery (e.g., repetitive textures, moiré-like artifacts, and chromatic clutter) [7,8]. This section reviews augmentation-based robustness training, illusion-based perturbations, and calibration concepts that motivate our unified protocol and ADCT recipe.
2.1. Data Augmentation and Joint Training Strategies
Data augmentation expands the effective training distribution by sampling label-preserving transformations, and has become a primary tool for improving generalization and robustness without changing inference-time architecture [29]. AugMix introduces stochastic multi-operator mixing and couples it with a Jensen–Shannon divergence (JSD) consistency loss, yielding improved robustness to unseen corruptions while simultaneously benefiting NLL and ECE [12]. DeepAugment broadens the perturbation space using network-based transformations, which can complement conventional image operators and improve robustness on challenging benchmarks (e.g., ImageNet-R) [13]. Beyond single-shot augmentation, Rebuffi et al. showed that multi-stage augmentation and combining augmentation with weight averaging can mitigate robust overfitting and improve training stability [14].
Recent research also emphasizes that robustness depends not only on the augmentation family itself, but also on how augmentation interacts with model sensitivities and training dynamics. In our setting, ADCT builds on a multi-domain training baseline (joint training on Ishihara-MNIST and AG-MNIST) and adds an AugMix + DeepAugment + JSD consistency scheme, aiming to improve both robustness and calibration under perception-driven illusion shifts.
2.2. Visual Illusions and Illusory Contours
Illusory contours refer to perceived boundaries in regions where physical edges are absent or occluded. Abutting-grating (AG) patterns are a classic example: two sets of parallel gratings with phase offsets form salient illusory contours at their junctions. Psychophysical and neurophysiological studies show that the perceived strength of AG illusions depends on the number, length, and phase offset of the gratings, is negatively correlated with line spacing, and cannot be fully captured by classical linear receptive field models [7,8]. Neural evidence suggests that illusory contours can be represented similarly to real contours in higher visual areas and are modulated by feedback and recurrent processing [18,19,20]. These findings suggest that AG patterns provide a controlled way to probe contour integration beyond simple gradient-based edge detection. Illusory contour formation can remain robust under crowding and can be modulated by attention, supporting the view that higher-level integration mechanisms contribute to contour completion [30,31].
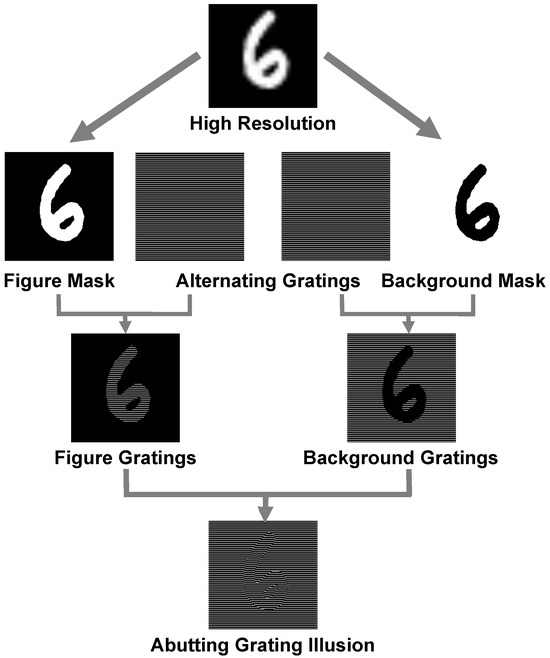
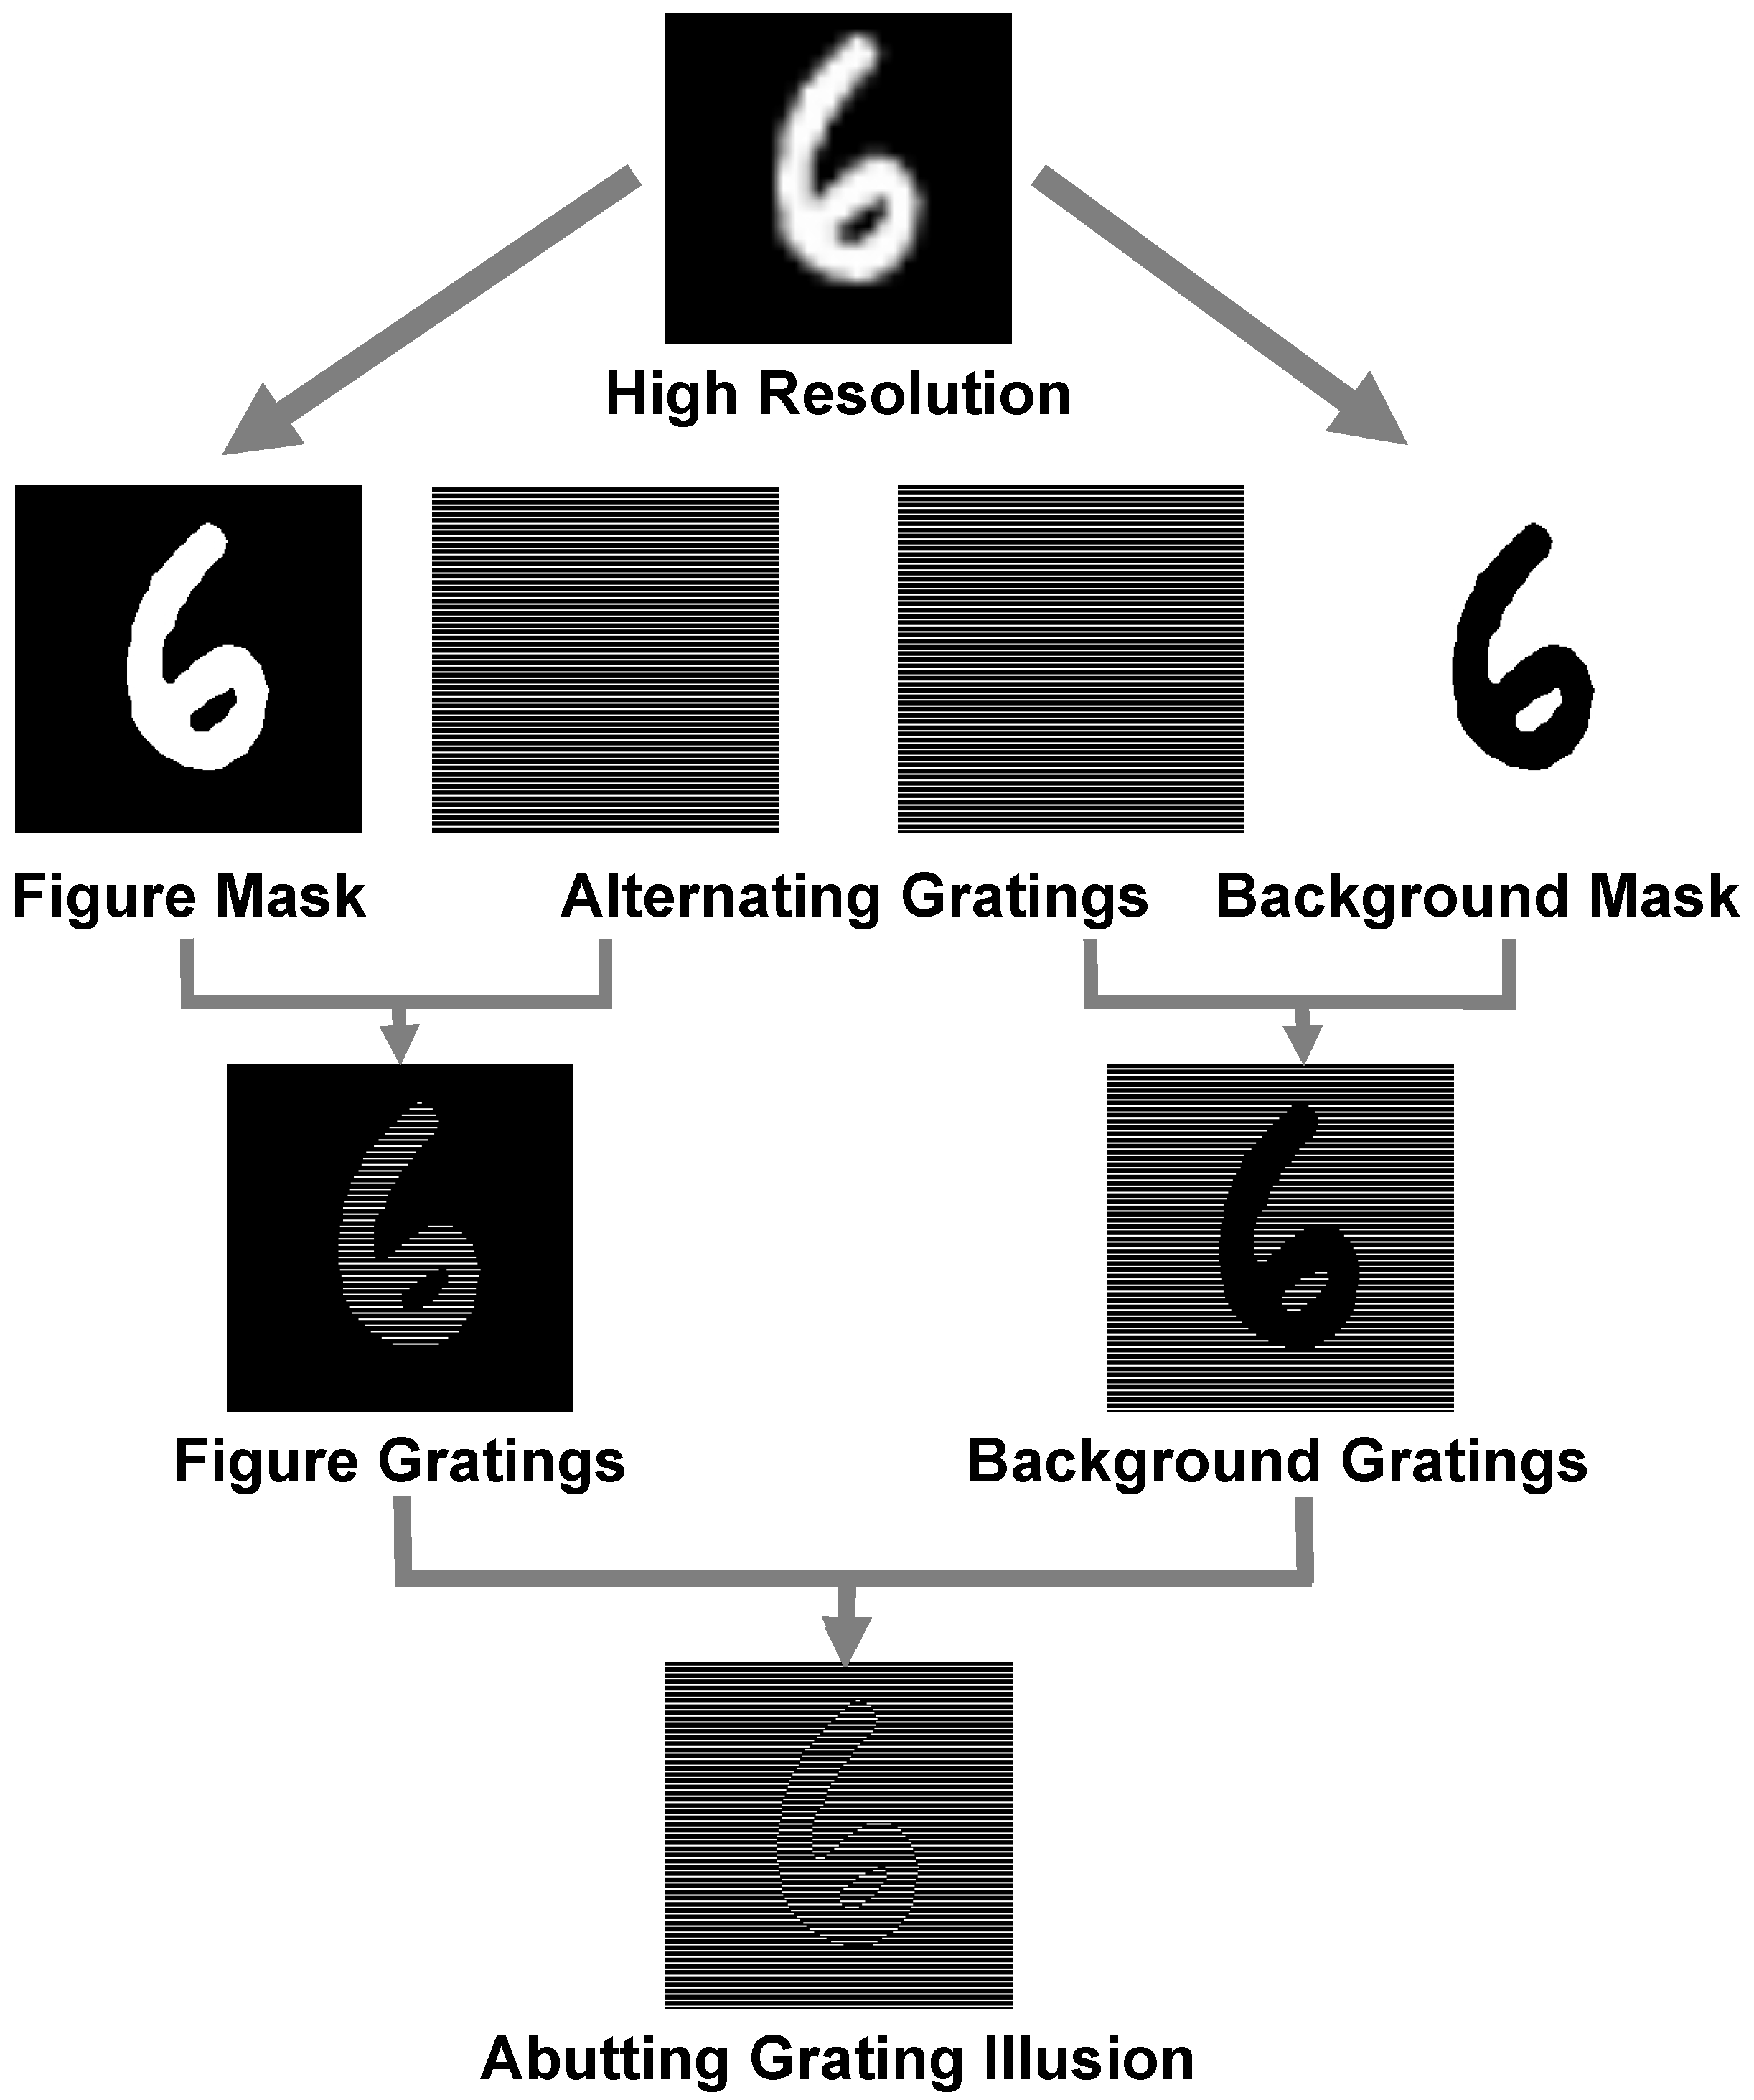
Fan and Zeng proposed an AG-based image distortion method that converts generic datasets into AG-induced contour versions to probe the vulnerability of deep models under “induced boundary” conditions [21]. The key idea is to embed phase-misaligned gratings around object boundaries so that a model’s reliance on physical gradients can be misdirected by illusory boundaries, with controllable parameters such as orientation, line spacing, and phase offset [7,21]. Figure 1 illustrates the AG distortion pipeline used to convert high-MNIST into AG-MNIST.
Figure 1.
The process of converting high-resolution MNIST into AG-MNIST.
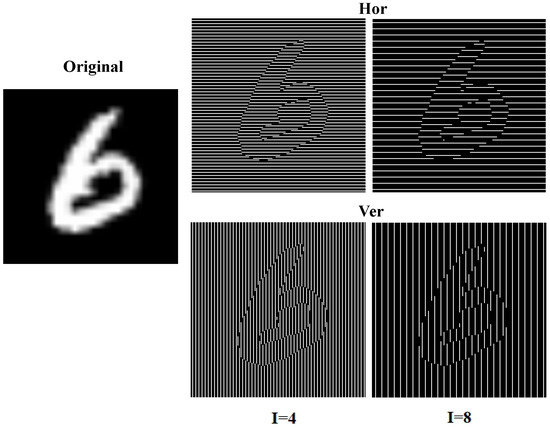
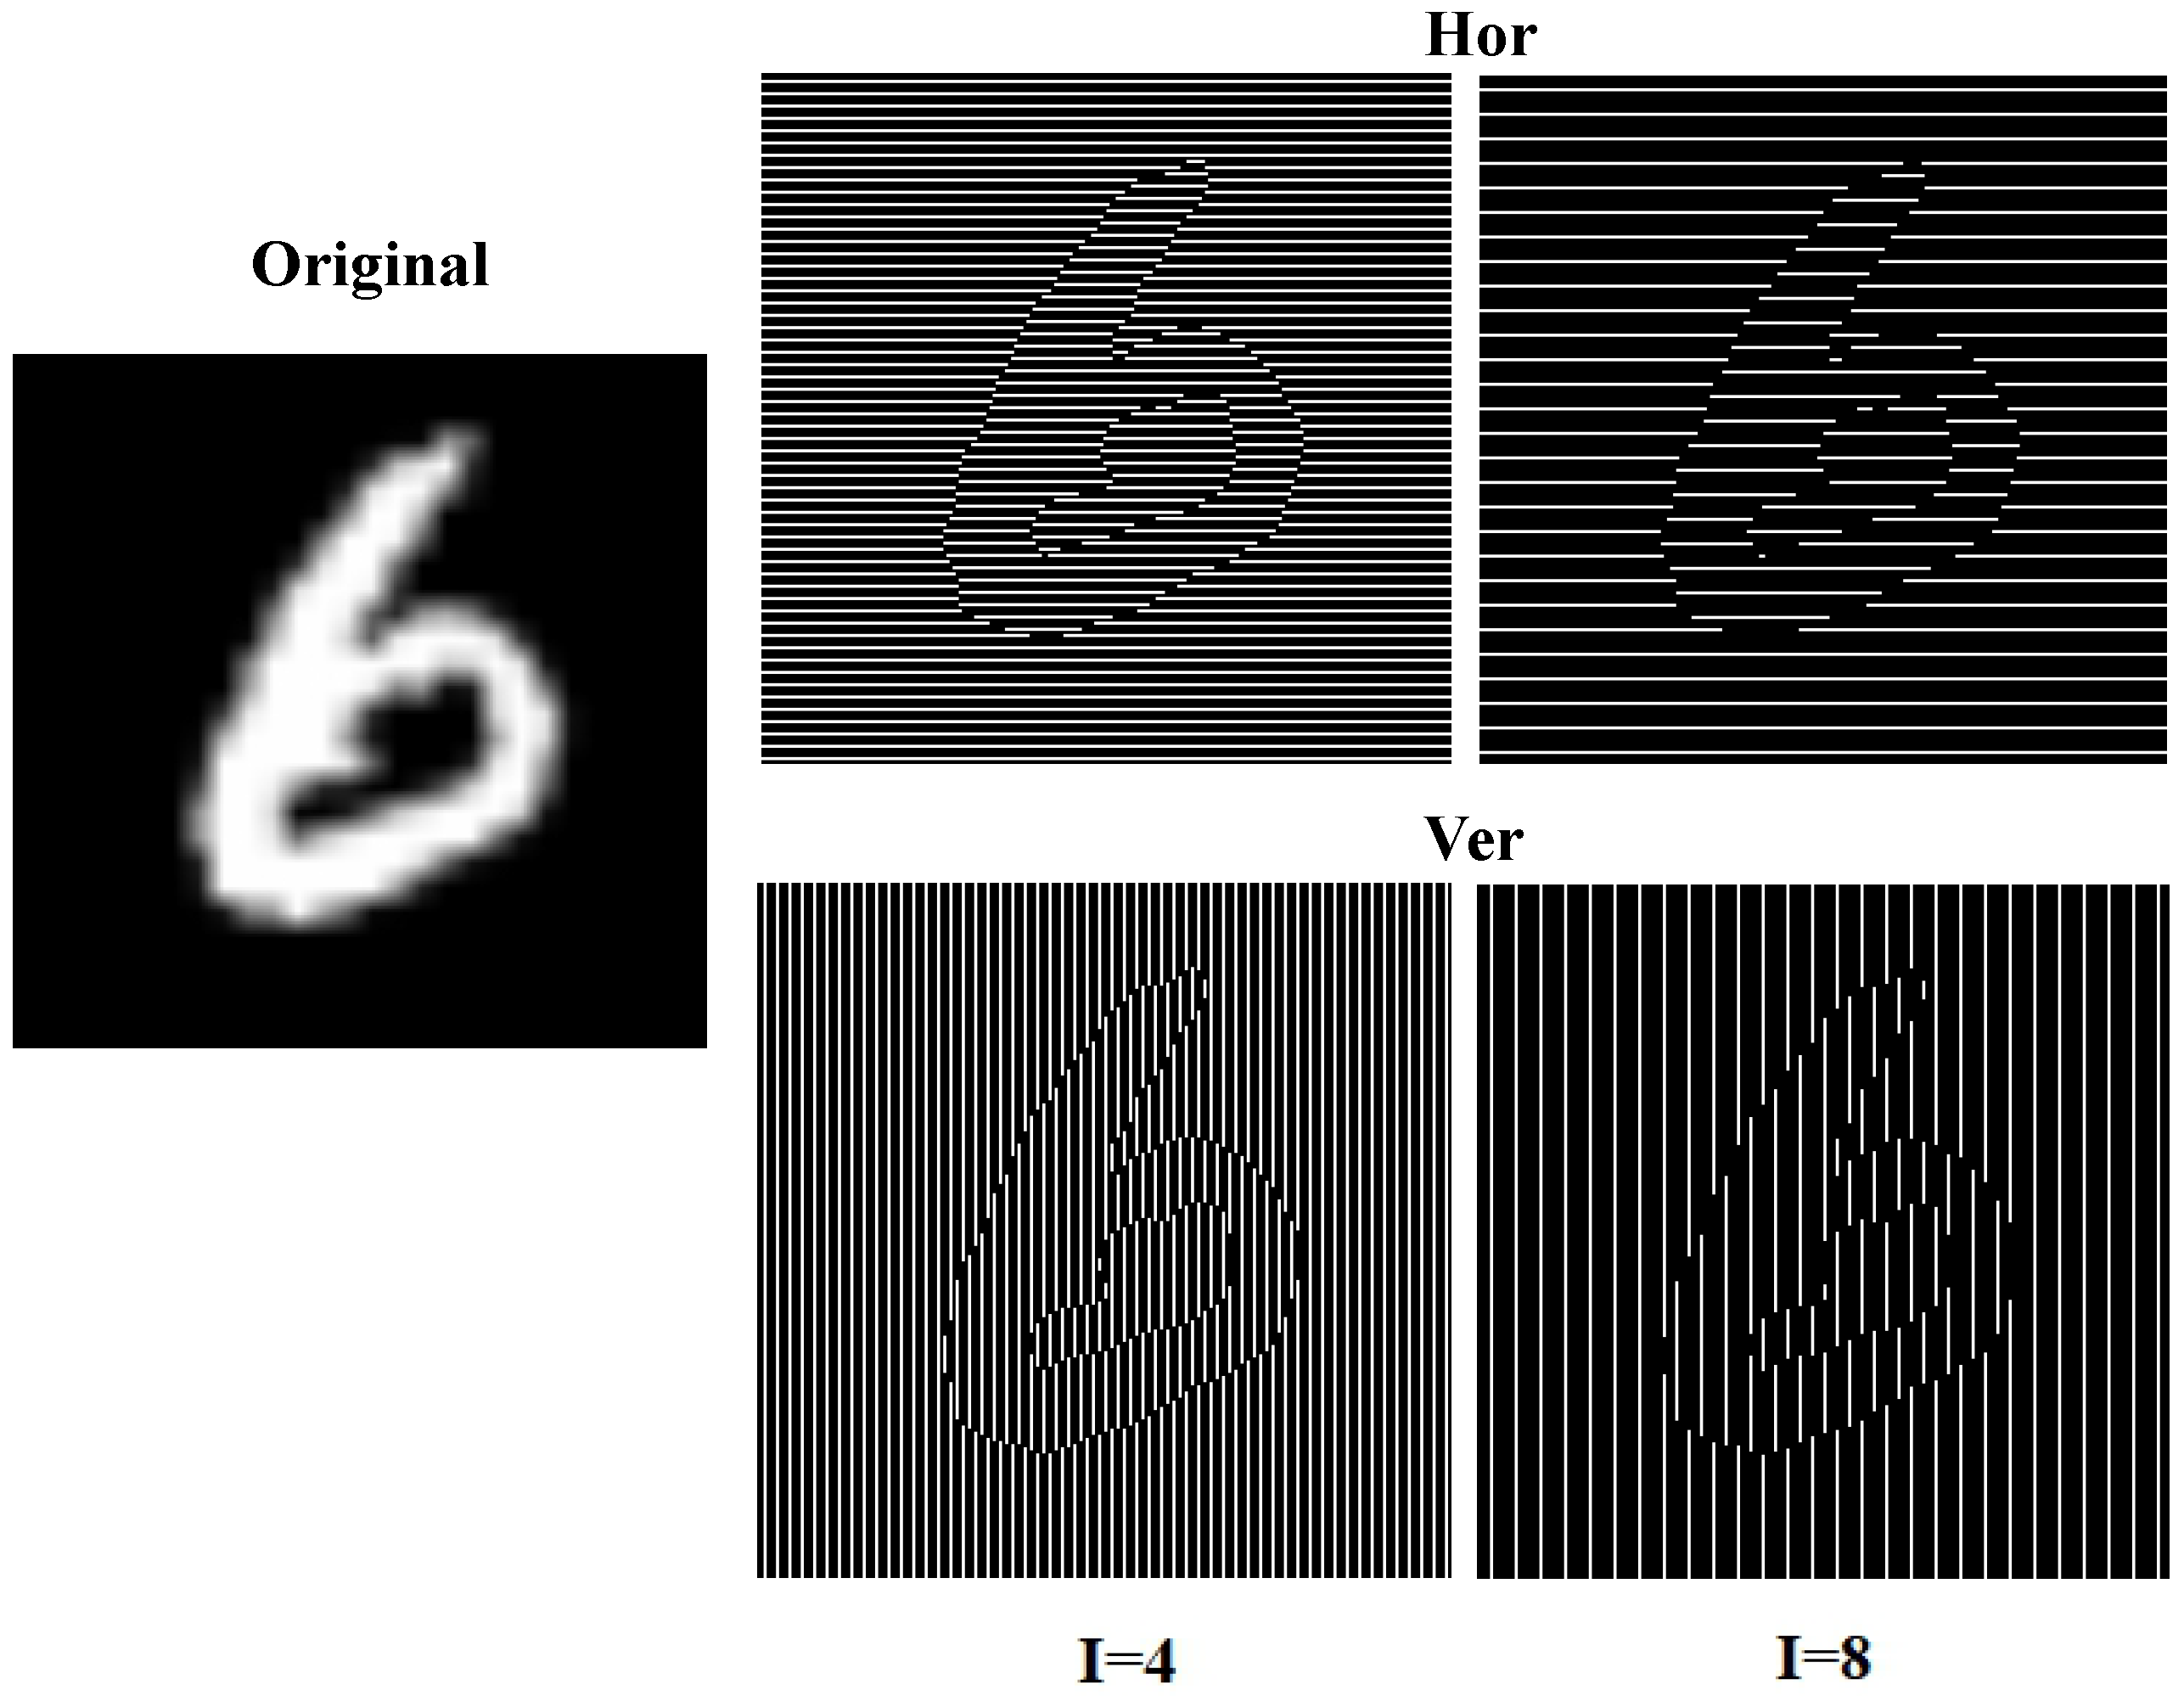
In our experiments, AG-MNIST denotes the test sets obtained by applying AG distortions to high-resolution MNIST. Following Fan and Zeng [21], we upsample MNIST before applying AG distortions, and we consider two orientations (horizontal/vertical) and two line spacings (4/8), yielding four variants: hor4, hor8, ver4, and ver8. These settings jointly cover easier and harder conditions for humans and models and are sufficient in our controlled setup to reveal spacing-dependent robustness effects. We use the grating spacing (4/8) as an inverse proxy for spatial frequency: smaller spacing corresponds to higher spatial frequency. Qualitative examples of the four AG variants are shown in Figure 2.
Figure 2.
AG-MNIST dataset: MNIST upsampled to and its hor4/hor8/ver4/ver8 variants (line spacing = 4/8; orientation = horizontal/vertical). We use spacing (as an inverse proxy for spatial frequency) and orientation as minimal factors to probe sensitivity to grating structure and anisotropy in contour perception and recognition.
Fan and Zeng reported that increasing spacing leads to a substantial performance drop for CNNs, even when they perform well on clean MNIST and other corrupted variants, highlighting AG-MNIST as a targeted benchmark for evaluating contour integration in deep models [21].
2.3. Ishihara-Style Pseudoisochromatic Dot Camouflage
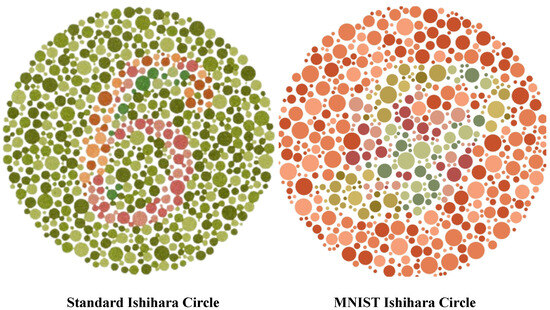
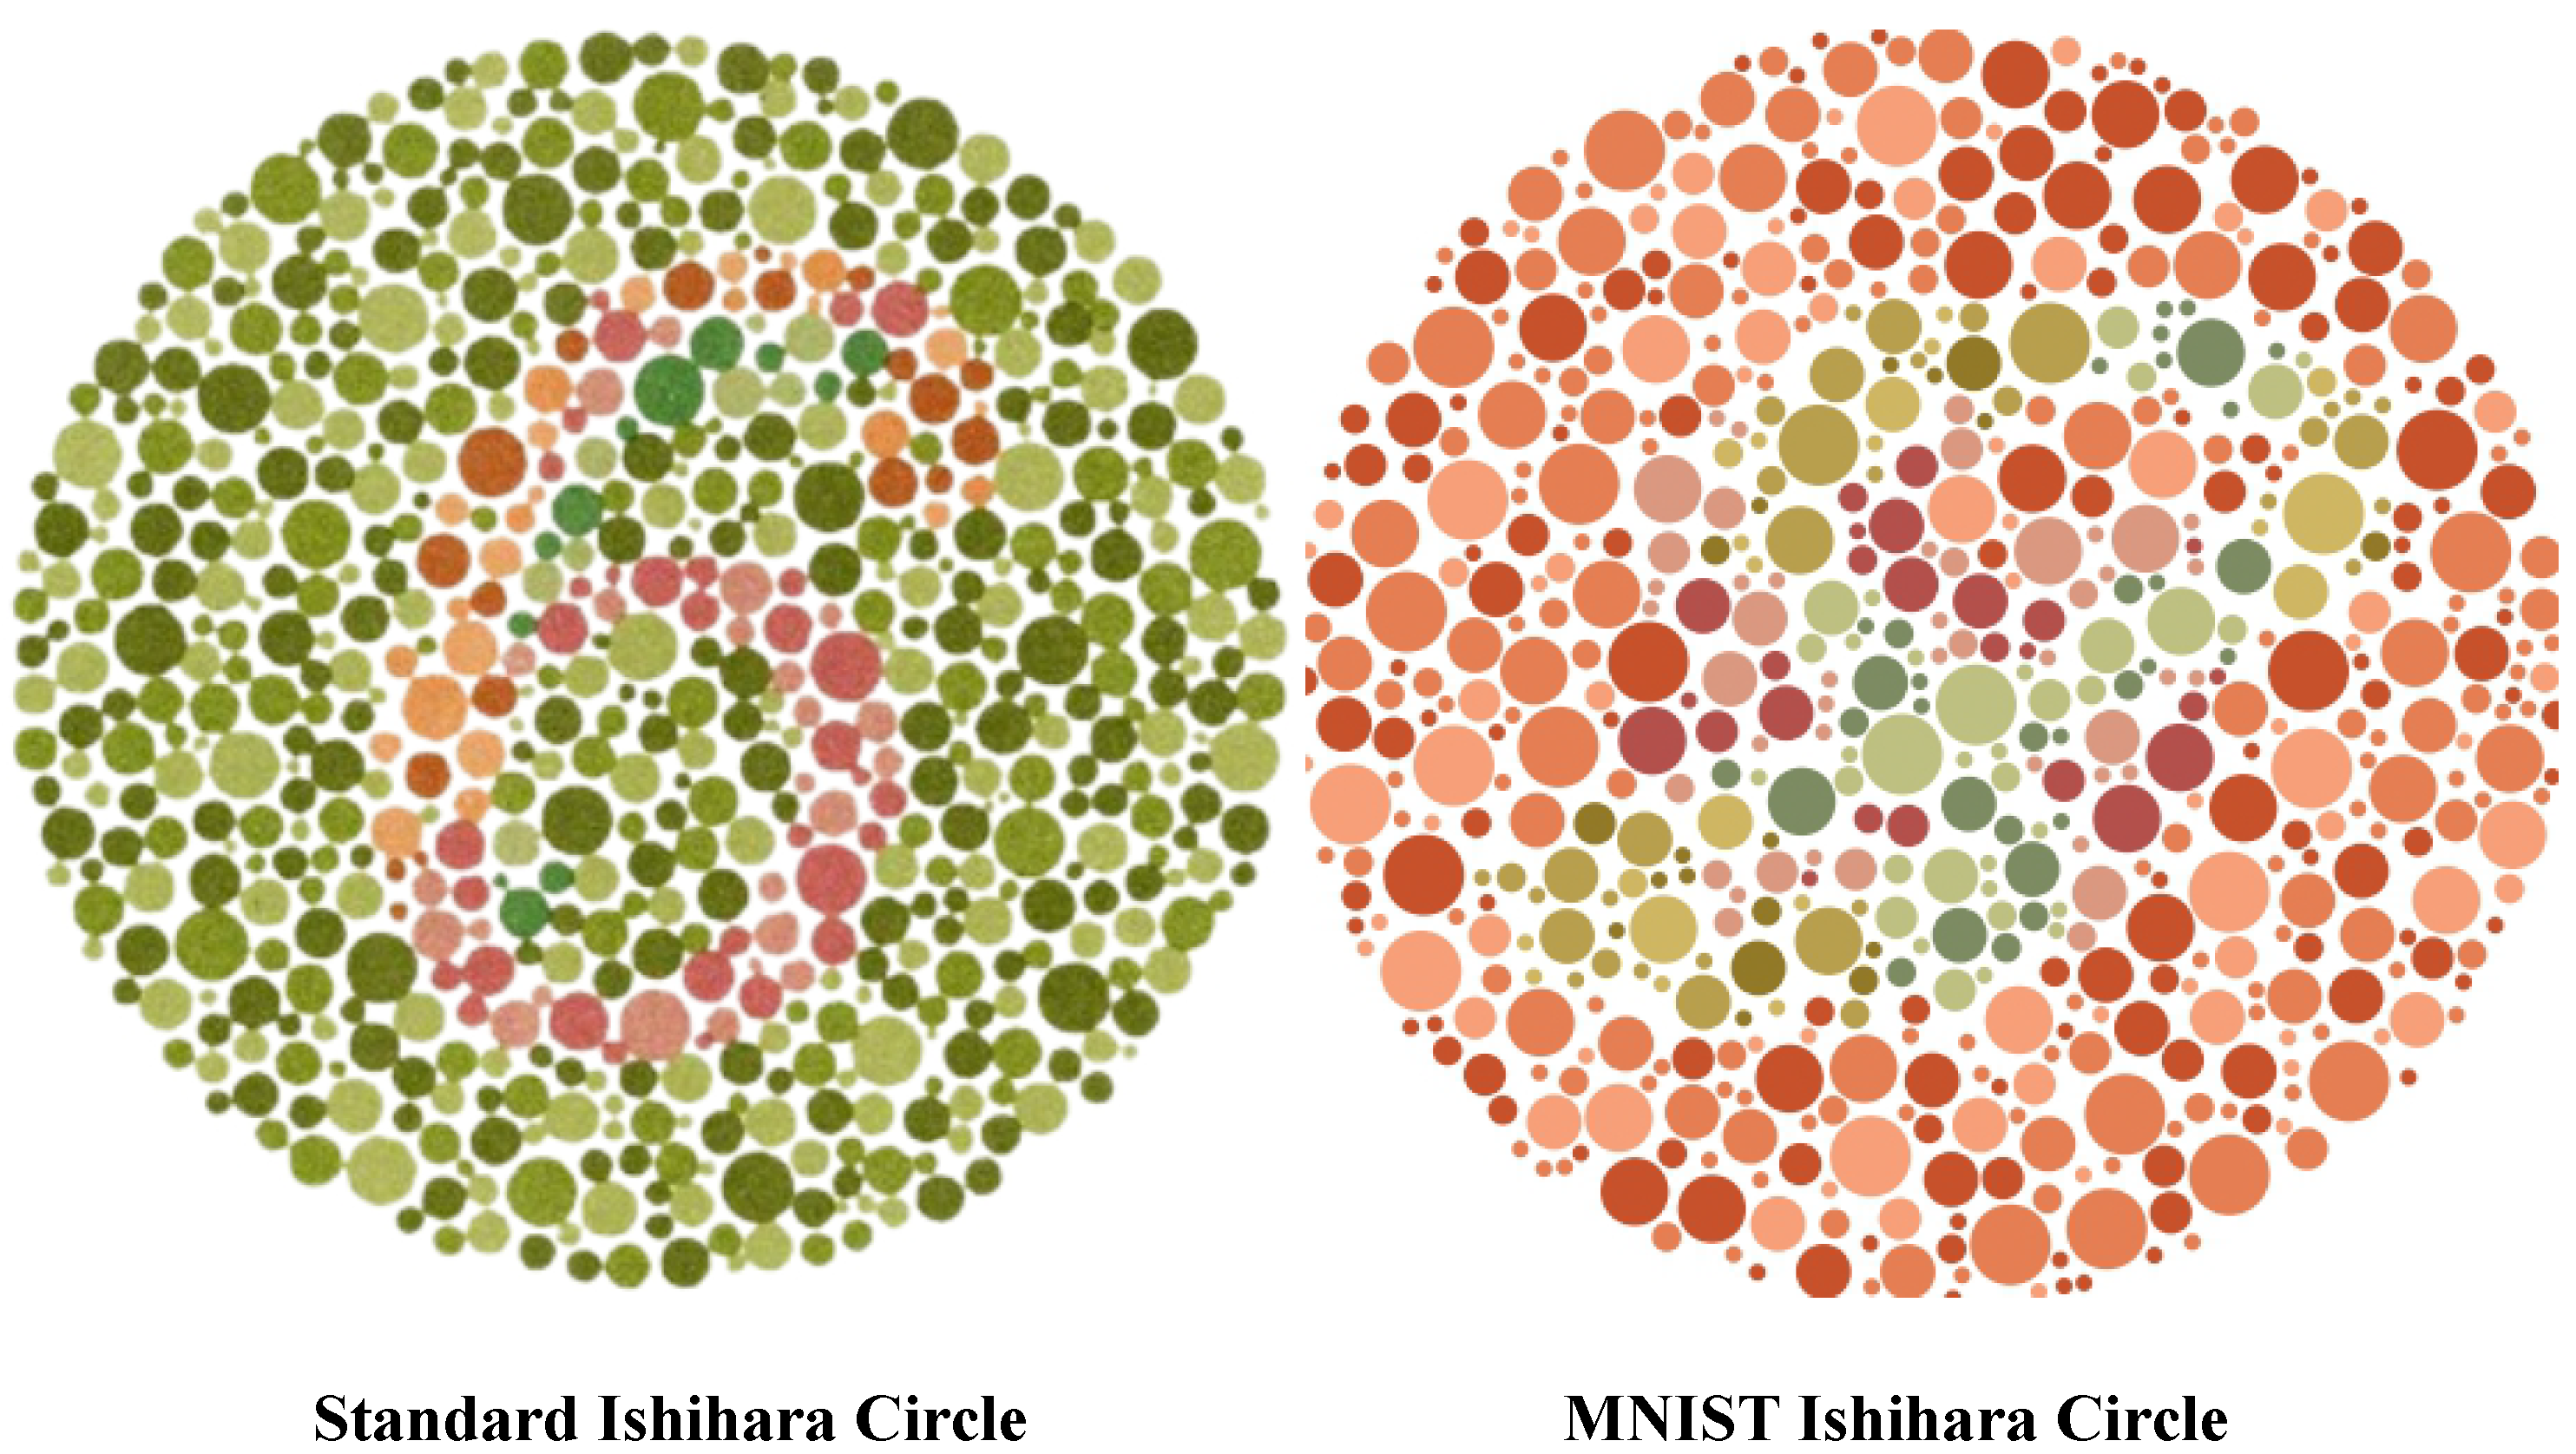
The Ishihara color vision test uses pseudoisochromatic plates that embed digits or paths within an approximately equiluminant background of randomly sized colored dots. By reducing luminance and shape-from-shading cues, these plates emphasize chromatic differences and have been widely adopted for clinical screening [32]. Related psychophysical work measures pseudoisochromatic thresholds under controlled dot noise and luminance conditions, providing quantitative insights into color discrimination limits [33,34,35]. Computerized variants (e.g., Cambridge Colour Test and Mollon–Reffin series) randomize dot patterns and control chromatic difference vectors and noise to estimate discrimination thresholds along red–green and blue–yellow axes [36,37]. These paradigms share a common principle: targets are embedded in dot fields such that chromatic cues become the primary informative signal. Figure 3 provides an example of the pseudoisochromatic dot camouflage used in Ishihara-MNIST.
Figure 3.
Ishihara-MNIST dataset: A standard Ishihara numeral and a synthesized Ishihara-style MNIST digit. The geometric contour is preserved, but local texture and edge continuity are severely disrupted.
Henshaw et al. adapted this paradigm to machine learning by constructing an Ishihara-style MNIST dataset and benchmarking multiple CNN architectures, showing that pseudoisochromatic backgrounds can strongly interfere with edge/texture encoding and induce high-confidence errors together with degraded calibration [22]. This observation aligns with broader evidence that standard CNNs can over-rely on local texture cues rather than global shape [38], and with findings that chromatic context can systematically mislead CNNs in low-level vision tasks [23]. Motivated by this line of work, we adopt an image-based version of Ishihara-MNIST as one of our illusion-based OOD domains. In our implementation, dot backgrounds and foreground digits are strictly separated, and plate-level splits are enforced to avoid train–test leakage.
Taken together, AG-MNIST and Ishihara-MNIST form two human-interpretable, perception-level perturbation families: AG induces illusory contours through structured gratings, while Ishihara embeds targets in pseudoisochromatic camouflage. In Section 4, we quantify their effects using sensitivity plots and confusion matrices, and relate them to the robustness and calibration behavior under different training recipes.
2.4. Uncertainty, Calibration, and Reliability Under Shift
Under distribution shift, modern deep networks often exhibit miscalibrated confidence, which motivates reporting calibration metrics (e.g., reliability diagrams, ECE) together with proper scoring rules such as NLL [1,2]. Recent analyses emphasize that calibration is sensitive to both the shift type and the training recipe, making it important to evaluate multiple complementary metrics rather than accuracy alone [9,10,39]. Beyond standard vision benchmarks, uncertainty-aware training studies in high-stakes settings further illustrate that improving calibration is feasible and practically valuable for risk-sensitive decisions [11].
For training-time robustness, AugMix-style consistency has been shown to improve both corruption robustness and calibration on standard benchmarks [12]. Our experiments extend this perspective to illusion-driven shifts: ADCT reduces overconfidence in high-confidence bins, which is particularly relevant for risk-aware decision rules such as confidence thresholding and selective prediction. For completeness, we note that alternative reliability routes include OOD detection and test-time adaptation; while powerful, they often introduce additional system components or deployment-time requirements [24,25,26,40]. In this work, we focus on a purely training-time recipe that aims to improve robustness and calibration without altering inference-time architecture.
3. Experimental Design
This section describes the task setup, datasets, and splits, training strategies, model selection, and evaluation metrics. Our goal is to assess robustness and confidence calibration under distribution shift, with a focus on illusion-driven perturbations.
3.1. Data Splits and Sampling Protocol
All illusion experiments are based on MNIST [27,28]. We upsample the original images to using bicubic interpolation and replicate the single channel to three channels for ImageNet-style normalization. We refer to this upsampled set as high-resolution MNIST (high-MNIST) and use it as a clean reference for reporting in-domain-like performance; it is not used for training unless stated otherwise.
On top of high-MNIST, we generate abutting-grating (AG) distortions to obtain AG-MNIST. We consider two grating orientations (horizontal/vertical) and two spacing levels (4/8), yielding four test variants: {hor4, hor8, ver4, ver8}. In addition, we construct Ishihara-MNIST by embedding digits into RGB pseudoisochromatic dot fields in the spirit of Ishihara color-vision plates. For Ishihara-MNIST, we enforce strictly non-overlapping plate backgrounds between training/validation and test splits.
For Ishihara-MNIST, we use a per-class capping protocol with disjoint instance-level splits: train = 1000, val = 100, and test = 200 samples per class. Training and validation use plates {3, 5, 6, 7, 9}. The Ishihara test set merges plates {2, 4, 8}, with 2000 images per plate (200 per class), i.e., 6000 images in total. We include plates {2, 4, 8} in testing to cover the major color styles in Ishihara-MNIST while keeping these plates held out from training.
For AG-MNIST, stripe distortions are generated on the fly in the collate step. For evaluation on AG-MNIST (hor4/hor8/ver4/ver8), each distortion is applied to the full MNIST test set (10,000 images). Distorted images are not stored on disk.
Following Fan and Zeng [21], we adopt spacing 4 and 8 as two representative levels (higher vs. lower spatial frequency, respectively) and Hor/Ver as a minimal orientation set to reveal anisotropy in deep models. We further follow the recommendation to upsample MNIST before applying AG distortions to preserve shape details while making grating patterns salient at larger spacing [7,21]. This aligns with our unified input and ImageNet-style normalization.
3.2. Training Strategies and Ablations
We consider three main training strategies:
- S0 (Ishihara-only baseline): Train only on Ishihara-MNIST.
- S1 (multi-domain ERM baseline): Alternate training between Ishihara-MNIST and AG-MNIST (Hor/Ver, spacing 4/8) using standard empirical risk minimization, without AugMix or DeepAugment.
- ADCT (AugMix–DeepAugment Consistency Training): Build on S1 and introduce AugMix, DeepAugment (DA), and a Jensen–Shannon divergence (JSD) consistency term weighted by . Concretely, a clean branch is paired with two stochastically augmented views; DA perturbations are applied within the augmentation pipeline, and a JSD-based consistency loss is enforced between the predictive distributions. Unless stated otherwise, we use (as in AugMix [12]) and sample DA strength uniformly in [0.3, 0.6]. We set da_blocks. All settings start from ImageNet-pretrained weights and perform full-network fine-tuning for the same number of epochs, with automatic mixed precision (AMP) enabled by default.
For transfer to a new setting, we select the DeepAugment strength range and, if necessary, using the same validation criterion as model selection (Equation (1)), which jointly reflects Ishihara-MNIST and the validation-only AG6 suites. In practice, if training becomes unstable on the most challenging AG regimes, we adopt a conservative adjustment: we first narrow the DeepAugment strength range (e.g., by lowering its upper bound), and only then reduce if needed. This validation-driven procedure provides a simple and reproducible guideline for tuning the dominant hyperparameters without exhaustive search.
We also include two ablation variants: AugMix-only (AugMix + JSD only; DA disabled) and DA-only (clean→DA trained with cross-entropy only; without AugMix or JSD), following the joint vs. single-factor evaluation strategy used in prior work [12,13]. Key hyperparameter settings and protocol details are summarized in Appendix A Table A1.
3.3. Validation and Model Selection
Model selection is based on a validation criterion that reflects both the Ishihara domain and a held-out AG spacing. Specifically, we use the Ishihara validation split together with two online AG validation sets generated at a spacing 6 (AG6) for horizontal and vertical orientations. The selection criterion is
Here, denotes the held-out Ishihara validation split from the training plates. and are auxiliary AG validation sets generated online with grating spacing 6 (horizontal/vertical), used only for model selection and early stopping to avoid overfitting to the test spacings (4/8); is not included in the final evaluation.
3.4. Test Protocol and Metrics
Final testing covers five illusion-domain datasets:
Our primary robustness summary metric is the unweighted mean accuracy across these five test suites:
We report accuracy on high-MNIST as a clean reference metric; it is not included in OOD5. Here, is computed on the merged Ishihara test set, while each AG-MNIST test set is obtained by applying the corresponding distortion to the full MNIST test set.
To address sample-size imbalance across suites, we additionally report a sample-size weighted variant
where denotes the number of test images in suite j. Since all four AG suites have 10,000 samples and Ishihara has 6000 samples, mainly re-weights the Ishihara contribution relative to AG suites. We confirm that the main conclusions remain unchanged under this alternative aggregation (Appendix A Table A2).
For calibration and uncertainty, we report negative log-likelihood (NLL), the Brier score, and expected calibration error (ECE). Given predicted probabilities , NLL is
The Brier score is
ECE is computed with M equal-width confidence bins :
where and . Unless stated otherwise, we report ECE with bins and use the same binning for reliability diagrams [2,9]. We additionally compute ECE with to assess sensitivity to binning.
We evaluate multiple ImageNet-pretrained backbones, ref. [41] including ResNet-50, ResNet-101, Inception-V3, and EfficientNet-B4. All models use the unified input size and ImageNet normalization under full-network fine-tuning.
Unless stated otherwise, results are summarized over five random seeds as mean ± standard deviation. For aggregated accuracy metrics, we additionally report 95% confidence intervals using a t-interval (Appendix A Table A3); for accuracy, interval bounds are clipped to [0, 100].
For completeness, ADCT minimizes
where are stochastically augmented views and denotes the Jensen–Shannon divergence between predictive distributions.
4. Results and Analysis
This section presents a unified evaluation of robustness and predictive reliability under illusion-induced distribution shifts. We first report accuracy and calibration across the five OOD suites, and then use sensitivity and error-structure analyses to characterize how grating orientation and spacing shape failure modes. Together, these results aim to clarify when the proposed training recipe is beneficial and where residual brittleness remains.
4.1. Main Results
We begin by clarifying the role of the two reference baselines. S0 is trained on Ishihara-MNIST only, and therefore its behavior on unseen AG distortions—often near chance level (10% for 10 classes)—is an expected failure mode under a strong domain shift rather than a numerical anomaly. Likewise, S1 follows a standard multi-domain ERM protocol alternating between Ishihara-MNIST and AG-MNIST without AugMix/DeepAugment; as a result, its performance can be notably seed-sensitive on the hardest AG configurations. For transparency, all results below are reported over seeds (mean ± std). Main results, ablations, and transferability are summarized in Table 1, Table 2 and Table 3. Calibration metrics are reported in Table 4.
Table 1.
Main results for ResNet-50 (S0/S1/ADCT). Values are reported as mean ± std over seeds, in %. Reference (high-MNIST) reports accuracy on the undistorted high-MNIST reference set, which is not used for training and is not included in OOD5 (Equation (3)). Chance level is 10% (10 classes). S0 is trained on Ishihara-MNIST only; S1 is a standard multi-domain empirical risk minimization (ERM) baseline; ADCT is our training recipe.
Table 2.
Ablation on illusion-based OOD: AugMix-only, DeepAugment-only, and ADCT. Values are mean ± std over seeds.
Table 3.
Transfer across backbones on illusion-based OOD: OOD5 accuracy (mean ± std over seeds).
Table 4.
Calibration metrics on OOD5 for different backbones under S0 and ADCT. OOD5 is computed following Equation (3). Values are mean ± std over five seeds. ECE is computed with M equal-width confidence bins; we report ECE15 and include ECE10 and ECE20 to assess sensitivity to binning. Lower is better for NLL, ECE, and Brier.
Against these references, ADCT improves robustness on average while simultaneously reducing miscalibration (Table 1). For example, on ResNet-50, the aggregated OOD accuracy (OOD5) increases from 29.0 ± 0.1 (S0) and 35.5 ± 17.8 (S1) to 59.7 ± 6.9 (ADCT). These accuracy gains are accompanied by markedly improved calibration, as reflected by lower NLL, ECE, and Brier scores (Table 4), suggesting that improvements are not achieved by inflating predictive confidence.
At the subset level, the spacing-8 AG conditions (hor8 and ver8) are typically the most challenging, with ver8 often yielding the lowest accuracy, whereas hor4 is usually the easiest. For ADCT, Ishihara performance is generally between the hor4 and the spacing-8 AG conditions. This aligns with the empirical finding that increasing grating spacing from four to eight degrades recognition, and that vertical orientation further exacerbates failures under structured interference [21]. Finally, the reference high-MNIST results provide context rather than an optimization target: since high-MNIST is not used for training, the improvements of ADCT reflect improved generalization to illusion-domain shifts rather than tuning to a clean in-distribution set.
4.2. Ablation Studies
Table 2 evaluates two single-component variants (AugMix-only and DA-only) and their combination in ADCT. Relative to the S0 baseline, all augmentation-based variants improve OOD performance. For ResNet-50, ADCT achieves the best OOD5 among the three ablation variants, suggesting that mixing-based perturbations (AugMix) and network-based distortions (DeepAugment) can be complementary under illusion-driven distribution shifts. For EfficientNet-B4, AugMix-only and ADCT yield comparable OOD5, indicating that the OOD5 gains on this backbone are largely captured by the AugMix component, whereas DA-only provides a smaller improvement in OOD5 despite strong clean-reference accuracy. ADCT maintains strong OOD performance and attains the highest reference accuracy, suggesting a more balanced trade-off between the clean reference set and illusion-domain robustness. Overall, the ablation indicates that the marginal benefit of each component is backbone-dependent, and that combining mixed augmentations with network-based distortions can improve robustness without sacrificing predictive reliability.
4.3. Transferability and Generalization Across Backbones
Table 3 evaluates whether the robustness gains generalize across different backbones. Across the evaluated ImageNet-pretrained architectures, ADCT yields consistent average improvements over the reference baselines, although the magnitude of the gain varies substantially across model families. In particular, the improvements are pronounced on residual and compound-scaled convolutional backbones (e.g., ResNet-101 and EfficientNet-B4), while they are more modest on Inception-V3. The largest cross-architecture differences tend to emerge on the most challenging AG subsets, especially those with vertical gratings and larger spacing (e.g., ver8), where tolerance to structured interference diverges. This pattern is qualitatively consistent with the error-structure analysis in Section 4.6.
4.4. Calibration and Uncertainty
We evaluate predictive calibration under illusion-induced shifts using ECE together with proper scoring rules, namely negative log-likelihood (NLL) and the Brier score. Table 4 reports results on OOD5 summarized over five seeds as mean ± std, and additionally includes ECE computed with bins to assess sensitivity to the binning choice. On ResNet-50, moving from S0 to ADCT reduces NLL from 7.44 ± 1.20 to 1.11 ± 0.59, ECE15 from 0.708 ± 0.002 to 0.141 ± 0.099, and the Brier score from 1.416 ± 0.005 to 0.432 ± 0.122. Similar reductions are observed for ResNet-101 and EfficientNet-B4, and the relative comparisons remain stable across bin counts, indicating that the calibration improvements are not an artifact of a particular binning scheme.
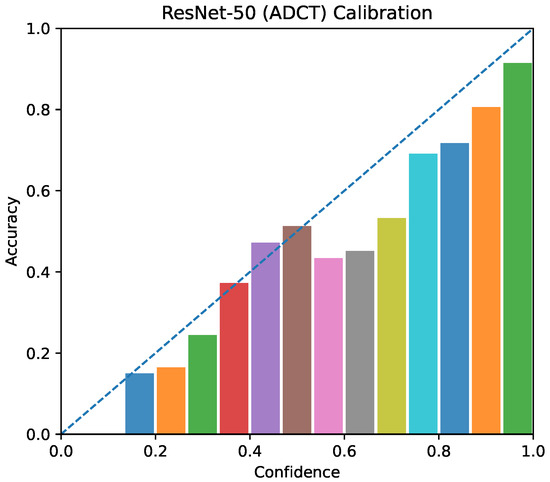
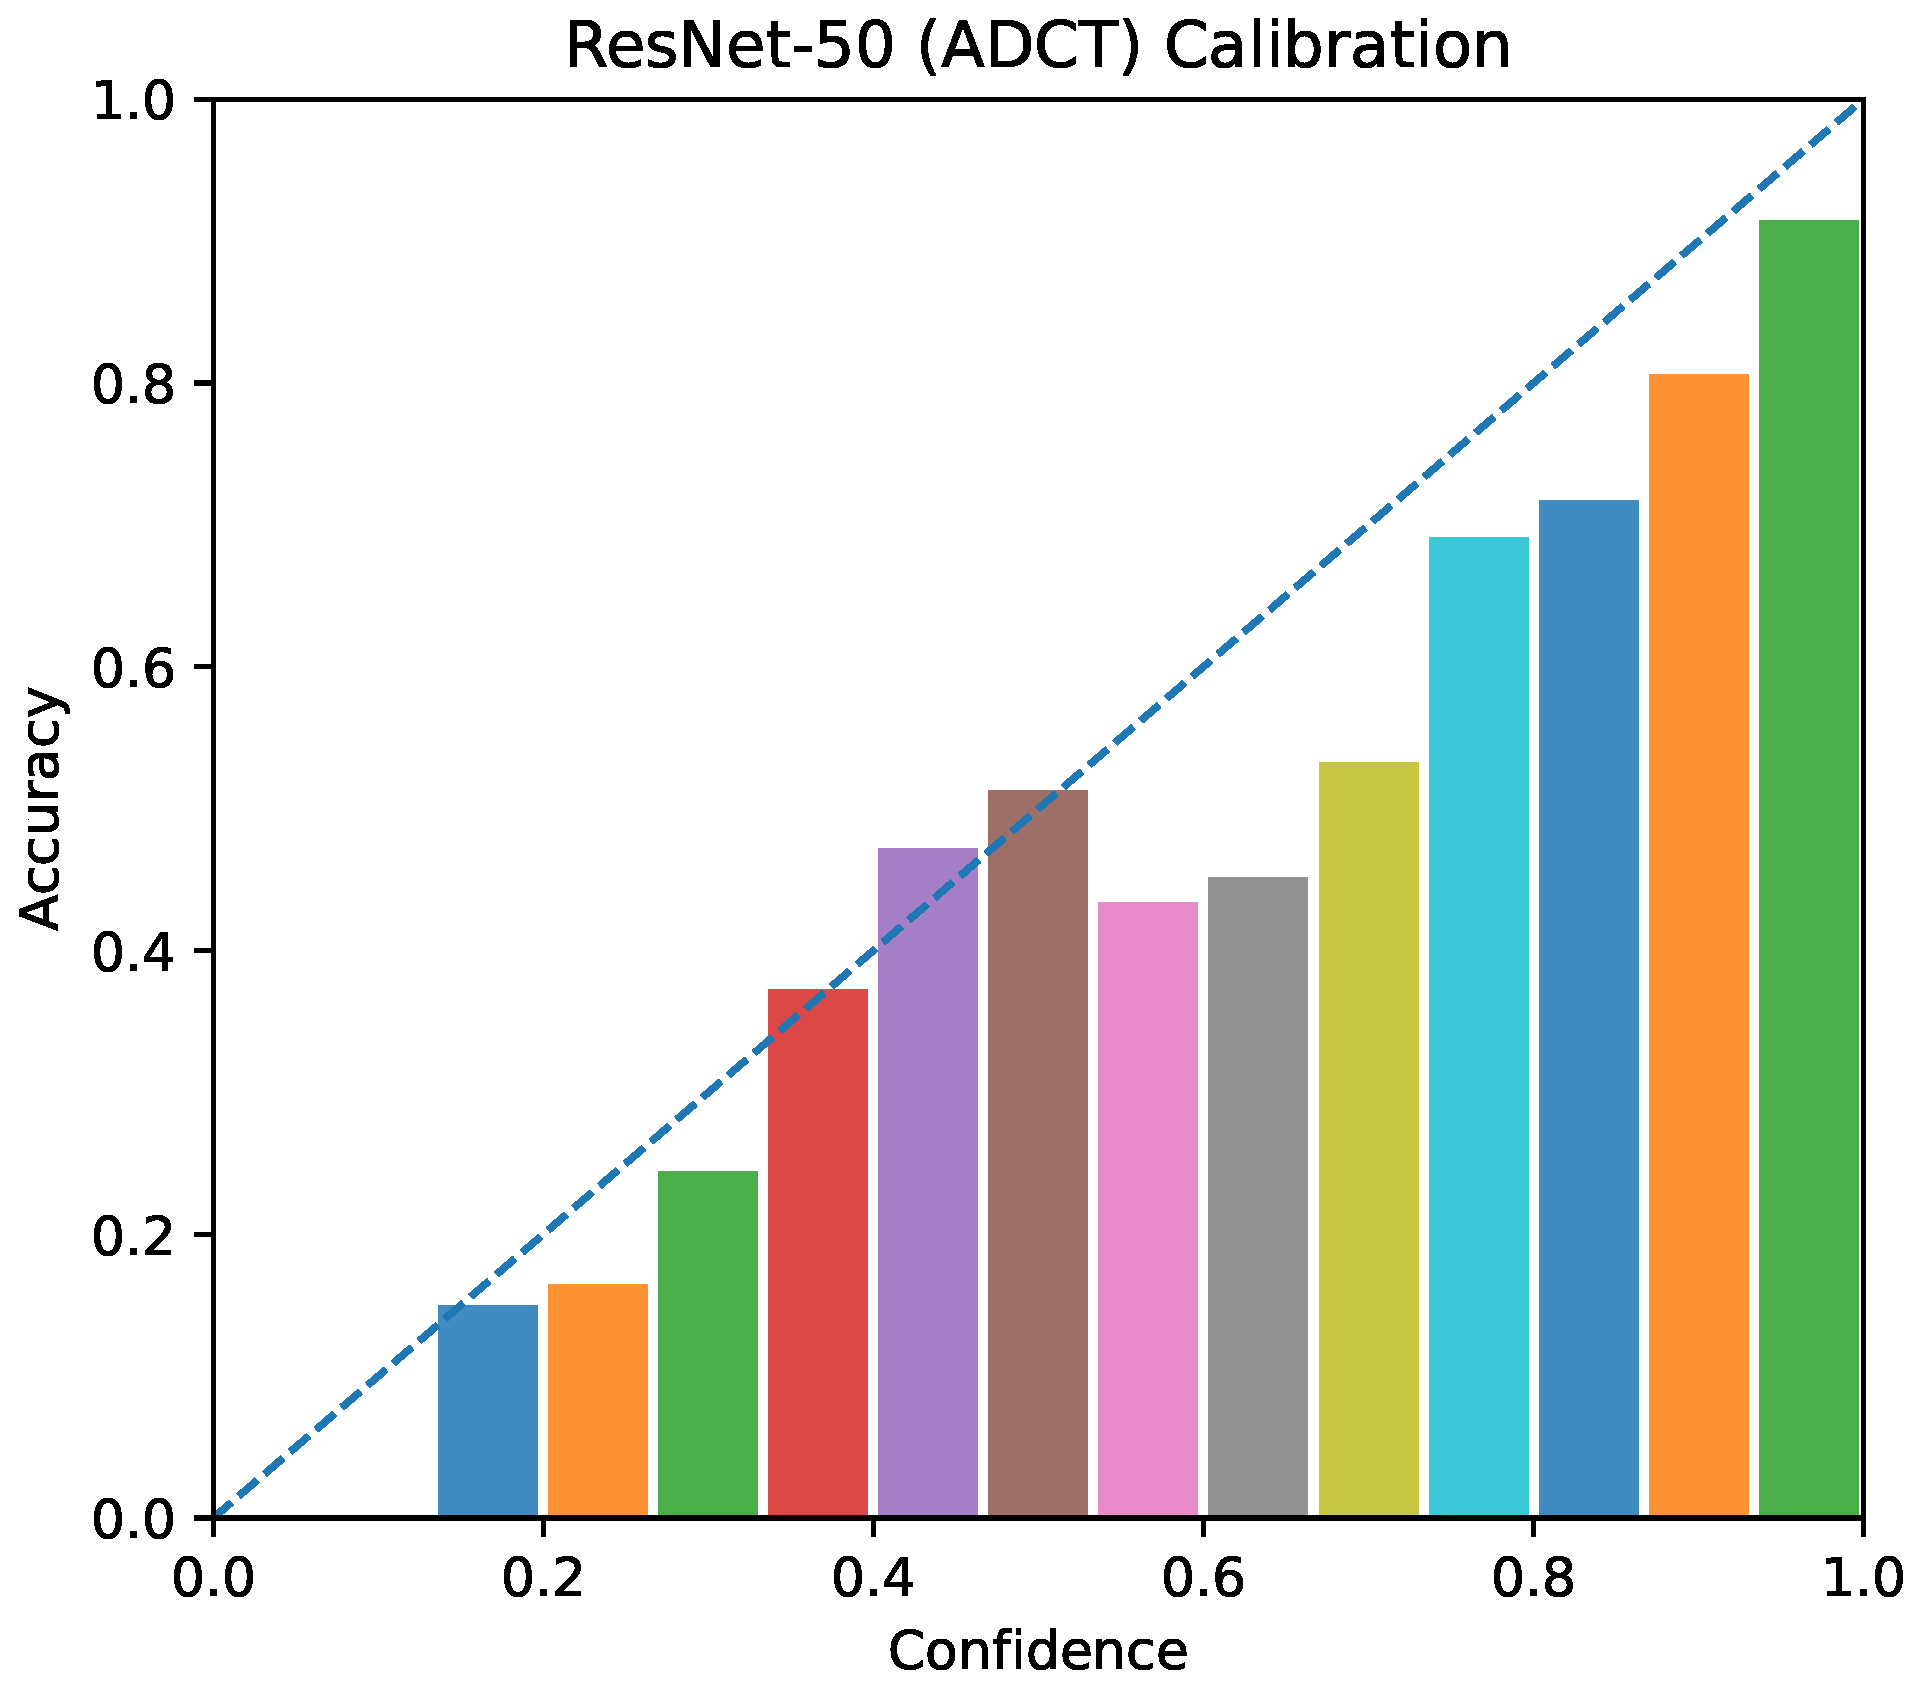
Figure 4 complements these aggregated metrics with a reliability diagram on OOD5 for ResNet-50 trained with ADCT (15 bins). The diagram is constructed by pooling predictions from all five seeds under the same evaluation protocol. The binned accuracies fall reasonably close to the diagonal, while some residual miscalibration remains at high confidence. Taken together, the joint reduction in NLL, ECE, and Brier suggests that the robustness gains of ADCT are accompanied by more reliable confidence estimates, which is relevant to risk-aware decisions such as confidence thresholding or abstention.
Figure 4.
Reliability diagram on the OOD5 evaluation suite for ResNet-50 trained with ADCT ( bins). The dashed diagonal indicates perfect calibration (accuracy equals confidence); deviations from this line reflect miscalibration. The diagram is constructed by pooling predictions from all five seeds under the unified evaluation protocol. Quantitative calibration metrics (mean ± std across seeds) are reported in Table 4.
4.5. Illusion-Pattern Sensitivity
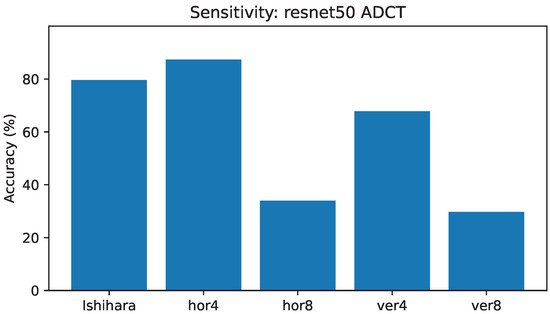
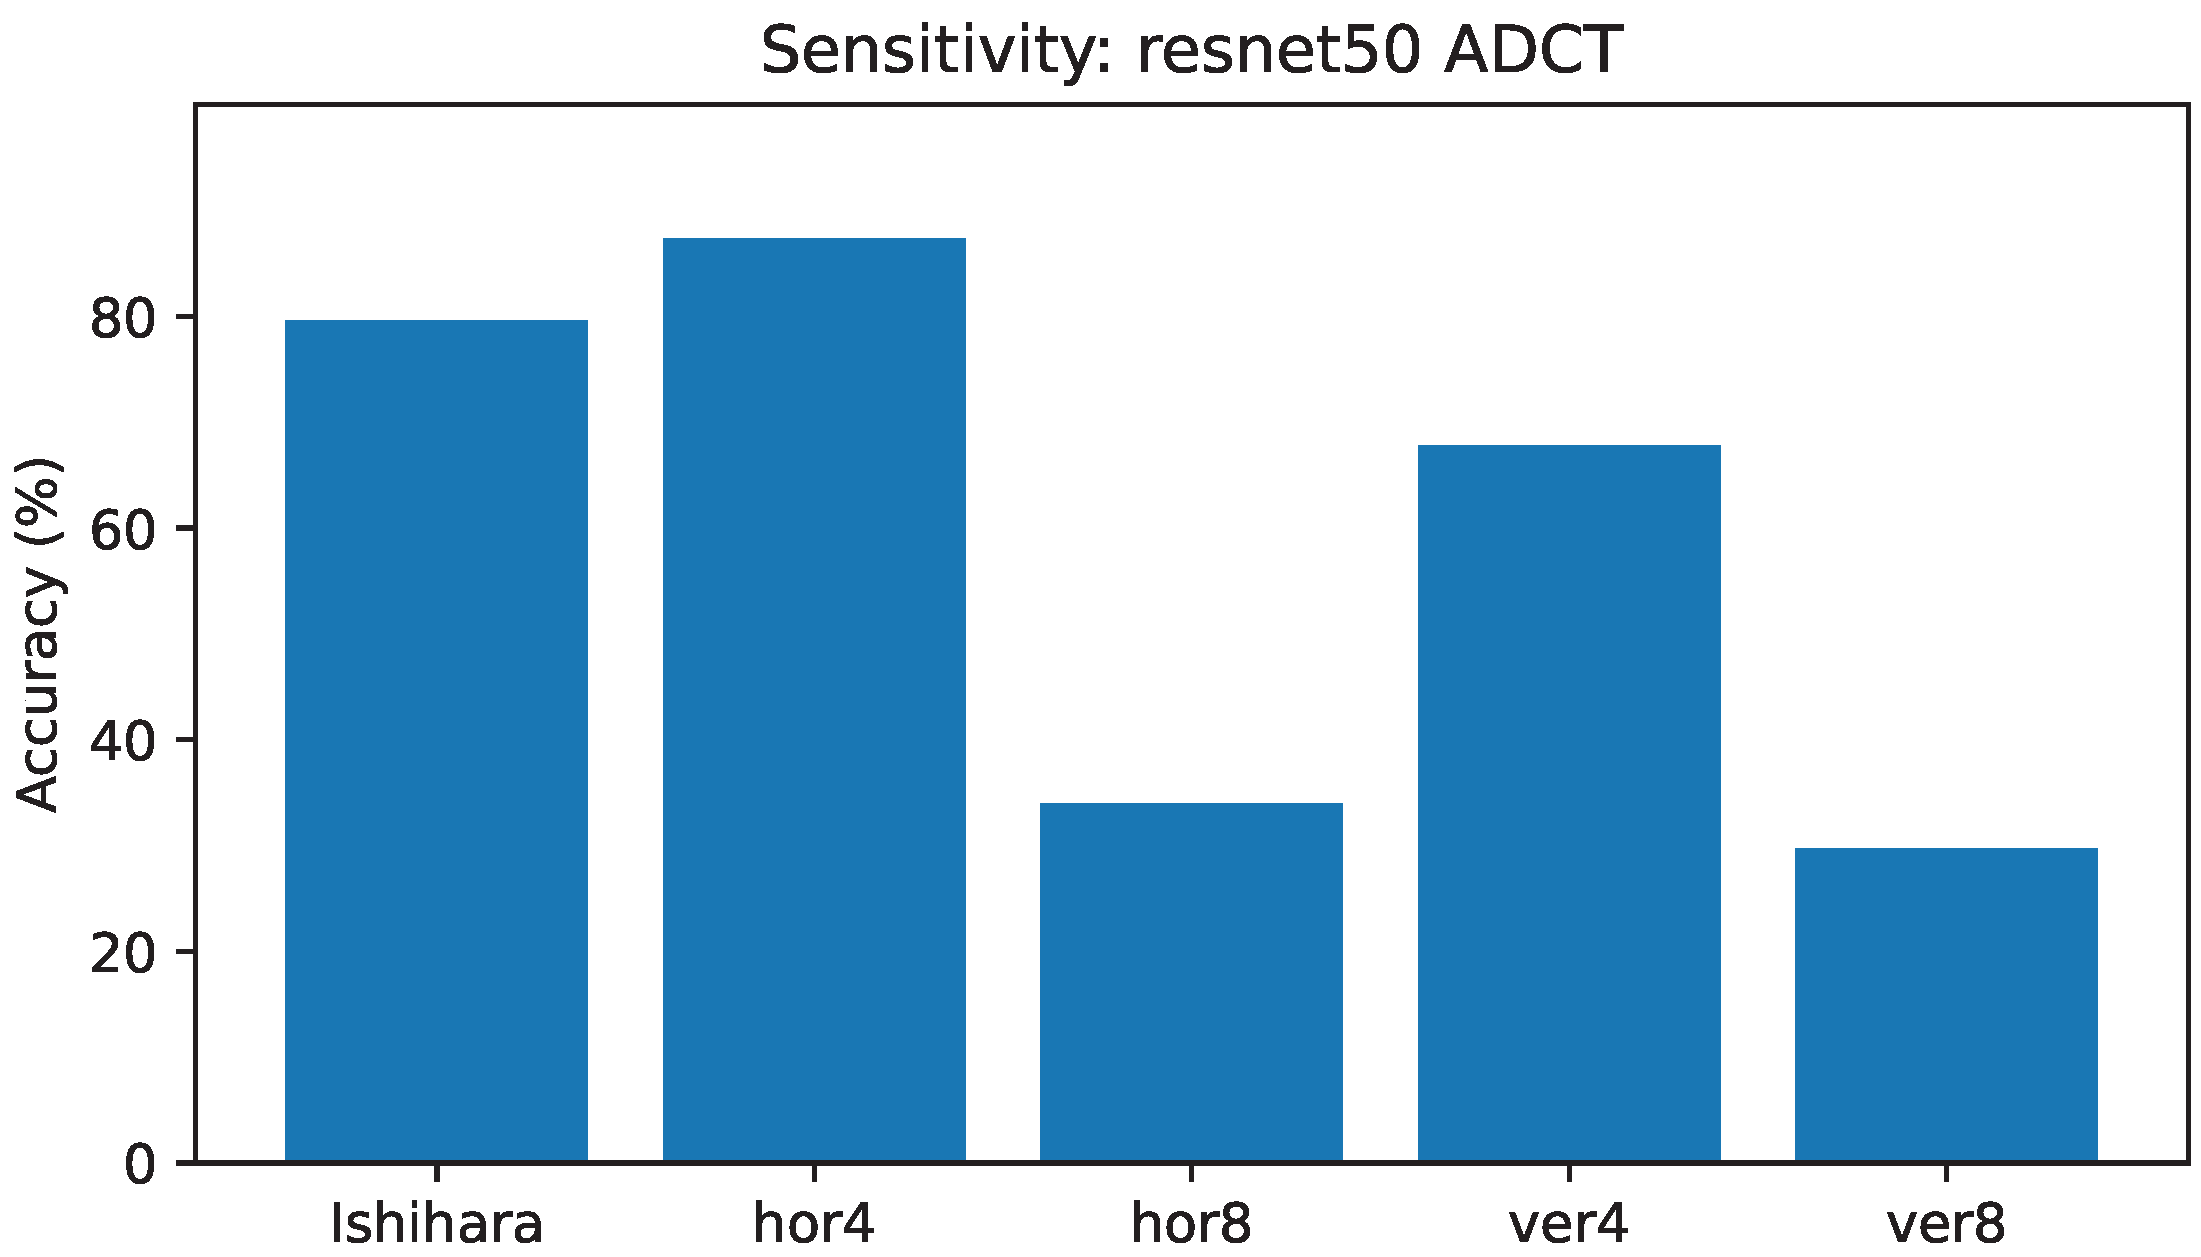
Figure 5 summarizes the illusion-pattern sensitivity of ResNet-50 trained with ADCT across the five OOD test suites, reported as mean accuracy over five seeds (see also Table 1). A clear interaction between grating orientation and spacing emerges on AG-MNIST: moving from spacing 4 to spacing 8 leads to a pronounced accuracy drop (hor4→hor8 and ver4→ver8), and vertical gratings tend to be more challenging than horizontal gratings at the same spacing. In contrast, performance on Ishihara-MNIST is generally much higher than on the spacing-8 AG conditions, indicating that the two illusion families stress different failure modes.
Figure 5.
Illusion-pattern sensitivity for ResNet-50 trained with ADCT. Bars show mean accuracy over five seeds across the five OOD test suites. Performance drops markedly as AG grating spacing increases (4→8), and vertical gratings tend to be more challenging than horizontal gratings.
Overall, the sensitivity plot provides a compact diagnostic view of where illusion shifts are most disruptive: the hardest conditions are consistently associated with large spacing and, in particular, vertical gratings. This observation aligns with our main results and supports the use of orientation/spacing as controllable factors for probing systematic failure modes under structured interference.
4.6. Error-Structure Analysis
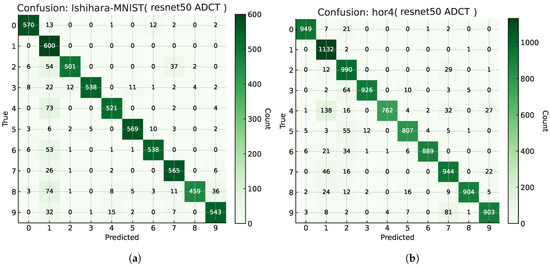
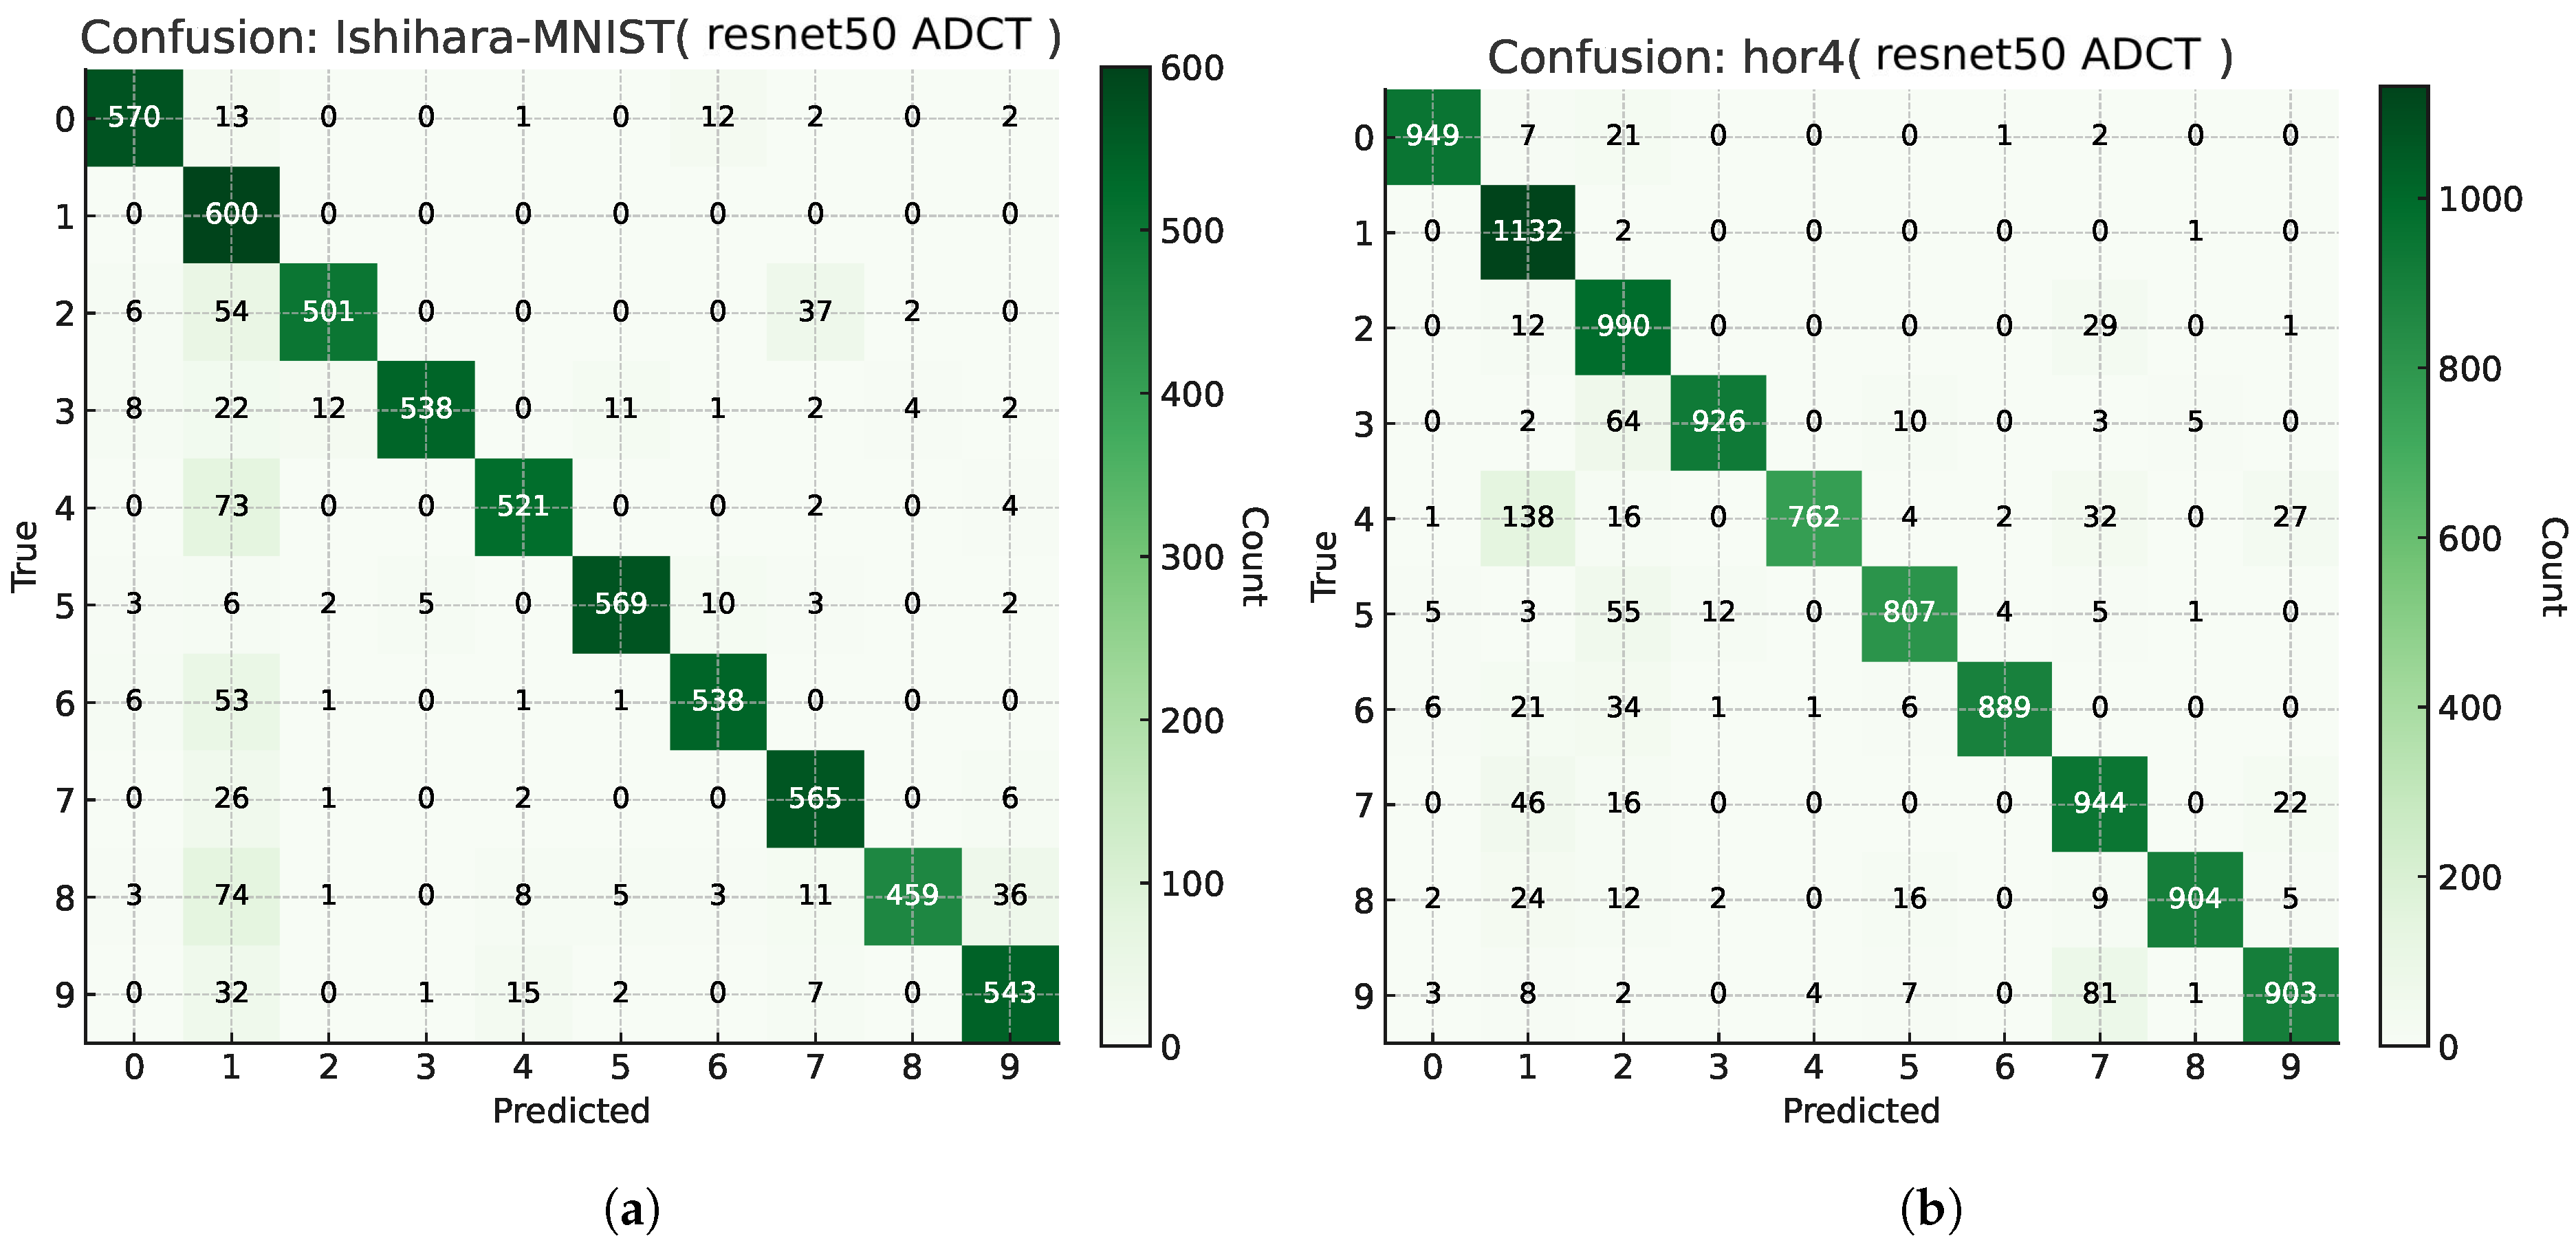
Figure 6a,b visualize representative error structures via confusion matrices on Ishihara-MNIST and AG-MNIST (hor4). Rather than being uniformly distributed, the errors exhibit strong concentration patterns. On Ishihara-MNIST, many misclassified samples collapse toward a small set of predicted digits, most notably digit 1, indicating a systematic bias under pseudoisochromatic camouflage. This suggests that when contour evidence is weakened by dot patterns, the model may fall back to simpler stroke templates that remain salient, leading to class-dependent but highly concentrated confusions.
Figure 6.
Confusion matrices of ResNet-50 with ADCT on two representative OOD datasets, shown for a single seed (seed = 0) for readability. We verified that the qualitative error patterns are consistent across seeds, while quantitative performance is summarized as mean ± std over five seeds in Table 1 and Table 4. (a) Ishihara-MNIST test set (plates merged; , 600 per class). (b) AG-MNIST hor4 (MNIST test with hor4 distortion; N = 10,000).
On AG-MNIST (hor4), misclassifications are again concentrated but spread across a small subset of destination classes (e.g., 1, 2, and 7), with several digits drifting toward visually proximate stroke configurations. These structured confusions are consistent with the grating interference selectively disrupting stroke evidence in an orientation- and spacing-dependent manner. Together with the sensitivity analysis (Section 4.5), these confusion patterns support the view that illusion shifts do not merely introduce random noise, but induce systematic, class-dependent failure modes that can be diagnosed systematically.
4.7. External Validity on CIFAR-10 and CIFAR-10-C
To probe external validity beyond MNIST-derived illusion benchmarks, we further evaluate our training recipe on CIFAR-10 and CIFAR-10-C, a widely used natural-image benchmark and its standardized common-corruption test suite [6,42]. We resize CIFAR-10 images to to match the ImageNet-pretrained backbone setting and keep the preprocessing consistent with our main pipeline. Checkpoints are selected by CIFAR-10 validation accuracy under a fixed data split. Throughout the experiments, we report the standard Top-1 accuracy (‘CIFAR-10 Acc’) on the clean test set. For robustness evaluation, ‘CIFAR-10-C Avg Acc’ denotes the mean Top-1 accuracy averaged over all 75 corruption subsets (comprising 15 corruption types across five severity levels). Results are reported as mean ± std over training seeds (Table 5). Note on naming. In the CIFAR-10/CIFAR-10-C setting, ERM denotes standard single-domain supervised training on CIFAR-10 (i.e., without AugMix or DeepAugment). The labels S0/S1 introduced in Section 3.2 are ERM baselines specific to our MNIST illusion-suite setting (different training-domain compositions, e.g., Ishihara-only vs. multi-domain), and are therefore not used for the CIFAR evaluation in Table 5.
Table 5.
External validity on CIFAR-10 and CIFAR-10-C (mean ± std over seeds). Acc is reported in %. ECE is reported in [0, 1]. CIFAR-10-C Avg is the mean accuracy over all corruptions and severities. Here, ERM is the standard CIFAR-10 baseline; AugMix-only, DA-only, and ADCT follow the definitions in Section 3.2.
Overall, ADCT achieves competitive clean performance on CIFAR-10 while substantially improving robustness on CIFAR-10-C relative to ERM and representative augmentation baselines. In particular, ADCT raises the average corruption accuracy by a large margin over ERM and also provides a clear improvement over AugMix-only and DeepAugment-only (Table 5). Beyond accuracy, ADCT consistently improves predictive reliability under corruption shift: it yields the lowest NLL and the lowest expected calibration error among the compared methods (ECE15 computed with 15 equal-width bins; Table 5), indicating a favorable robustness–calibration trade-off on a natural-image benchmark.
We additionally compare to PixMix [43], a strong augmentation-based method designed for corruption robustness. While PixMix attains slightly higher average corruption accuracy, ADCT achieves better calibration and comparable likelihood-based performance, suggesting that ADCT provides a favorable robustness–calibration trade-off on a natural-image benchmark beyond the MNIST-based illusion setting.
5. Discussion
5.1. Main Findings
Our study is positioned as a controlled evaluation of robustness and calibration under illusion-driven distribution shifts, and as a reproducible engineering training recipe under a unified protocol. Beyond reporting accuracy drops, we explicitly analyze probabilistic calibration under perception-level interference and consolidate robustness–calibration evidence with consistent metrics across backbones. Three observations emerge.
First, ADCT improves robustness on average under illusion shifts. Across the illusion-domain test suite (OOD5), ADCT yields higher mean performance than the two reference baselines (S0/S1) under the same data pipeline and selection criterion, and the overall trend is consistent across backbones (Table 1 and Table 3). We emphasize that S0 and S1 are not designed as improvement strategies: S0 is trained on Ishihara-MNIST only and therefore exhibits an expected failure mode on AG subsets it never observes, while S1 is a plain multi-domain ERM baseline without AugMix/DeepAugment. Because the hardest AG settings can be seed-sensitive, we report mean ± std over five seeds and phrase conclusions as improvements on average rather than uniform gains for every run.
Second, the robustness gains are accompanied by improved probabilistic calibration. Beyond accuracy, ADCT reduces miscalibration under illusion shifts, as reflected by lower ECE together with proper scoring rules (NLL and Brier score; Table 4). Importantly, the relative comparison remains stable when ECE is computed with different numbers of bins (), indicating that the conclusion is not an artifact of a single binning choice. The pooled reliability diagram further provides an aggregate visual summary that is consistent with these metrics (Figure 4). From a practical standpoint, better-calibrated confidence estimates are directly relevant to risk-sensitive decision rules such as confidence thresholding or abstention, where the cost of high-confidence errors is disproportionately high.
Third, illusion shifts exhibit structured sensitivity and structured errors. AG-MNIST shows a clear dependence on grating parameters: larger spacing and vertical orientation are typically more disruptive than their counterparts (Section 4.5). The confusion matrices (Section 4.6) illustrate that errors are not purely random but often class-dependent under structured interference; for Ishihara-style camouflage, errors can become highly skewed toward a small subset of classes, consistent with the loss of reliable contour evidence under pseudoisochromatic dot fields. While these visualizations are shown for a representative run, their qualitative patterns align with the aggregate trends reported across seeds at the metric level.
5.2. Positioning with Respect to Related Reliability Strategies
Training-time robustness is one of several complementary routes toward reliable prediction under distribution shift. Generalized OOD detection aims to flag unfamiliar inputs and optionally abstain; test-time adaptation updates model parameters using unlabeled target data at inference time, and post hoc calibration rescales predicted confidence without changing the underlying classifier. Table 6 positions ADCT among these approaches: it is a purely training-time recipe that leaves the inference-time architecture unchanged, while explicitly targeting both robustness and calibration via consistency regularization.
Table 6.
Positioning of ADCT among common strategies for reliability under distribution shifts.
5.3. Mechanistic Interpretation and Practical Guidance
Illusion images can violate the kinds of local cues that feed-forward CNNs often exploit. In AG-MNIST, strongly oriented grating textures compete with digit strokes and can induce spurious boundaries; in Ishihara-MNIST, pseudoisochromatic dot fields camouflage edges and reduce the continuity of contour evidence. Given the known tendency of standard CNNs to rely on local texture and edge statistics [17,38], these structured distractors can provoke brittle decision boundaries and overconfident errors.
From this perspective, the empirical behavior of ADCT is consistent with a complementary-perturbation view. AugMix provides broad, stochastic mixture-style perturbations, while DeepAugment expands the perturbation space with image-level distortions beyond hand-crafted operators. The JSD consistency loss encourages agreement between clean and perturbed views, which can discourage sharp, shift-sensitive decision boundaries and improve probabilistic calibration under structured interference. We stress that this is a mechanistic interpretation rather than a formal theory; nonetheless, it aligns with the observed joint improvement in OOD accuracy and proper scoring rules on illusion domains.
In practice, when negative interactions occur, they are most often associated with overly aggressive perturbations on the hardest AG conditions. Empirically, we find this is typically mitigated by using a more conservative DeepAugment strength range or reducing the JSD weight, suggesting that extreme distortions can dominate the training signal and destabilize learning under severe contour interference. More broadly, tuning should be carried out under a validation criterion that reflects the intended shift coverage (Section 3.3); the sensitivity study provides a concrete starting point for selecting conservative ranges that avoid destabilizing the hardest AG regimes (Section 4.5). Since ADCT increases training-time computation relative to ERM, it is also important to note that the cost is paid during training only; inference remains unchanged.
5.4. Conclusions and Future Work
This paper studies robustness and calibration under illusion-driven distribution shifts using AG-MNIST and Ishihara-MNIST as diagnostic testbeds. Under a unified protocol and across multiple ImageNet-pretrained backbones, ADCT improves illusion-domain robustness on average and reduces miscalibration as measured by ECE, as well as proper scoring rules (NLL and Brier). We further assess external validity by reporting results on CIFAR-10 and CIFAR-10-C (Section 4.7), which helps contextualize the recipe under a widely used natural-image robustness benchmark.
There are several natural directions to extend and strengthen this line of work. First, while we focus on two representative illusion families and a minimal set of AG factors (orientation × spacing), the same protocol can be expanded to cover additional illusion types (e.g., motion- or depth-related illusions) and broader parameter ranges, enabling a richer stress-test suite for perception-level shifts. Second, although we include representative augmentation-based baselines (including PixMix on CIFAR-10/C), incorporating a wider set of robustness approaches (e.g., stronger regularization, test-time methods, or specialized OOD techniques) would further illuminate the robustness–calibration trade-offs under different kinds of shifts. Third, more systematic hyperparameter selection (or automated tuning) offers a promising route to further improve stability on the most challenging AG conditions. Finally, deeper mechanistic analyses of intermediate representations (e.g., probing orientation/frequency selectivity or feature geometry) may help explain why different backbones diverge most on the hardest subsets and guide more targeted recipe design.
Author Contributions
Conceptualization, H.D. and Y.Y.; methodology, H.D. and Y.Y.; software, H.D.; validation, H.D. and Y.Y.; formal analysis, H.D.; investigation, H.D.; resources, H.D. and Y.Y.; data curation, H.D. and L.Y.; writing—original draft preparation, H.D.; writing—review and editing, H.D. and Y.Y.; visualization, H.D. and L.Y.; supervision, Y.Y.; project administration, H.D. and Y.Y.; funding acquisition, Y.Y. All authors have read and agreed to the published version of the manuscript.
Funding
This research was funded by the Major Science and Technology Projects in Yunnan Province (CN), grant number 202002AE09001002. The funder had no role in the study design, data collection and analysis, decision to publish, or preparation of the manuscript.
Data Availability Statement
The Ishihara-MNIST dataset is available at https://www.kaggle.com/datasets/ammarshaker/ishihara-mnist (accessed on 13 August 2025), and the AG-MNIST dataset can be obtained from https://github.com/DONGOECEAN/ADCT.git (accessed on 13 January 2026). The original contributions presented in this study are included in the article. Further inquiries can be directed to the corresponding authors.
Acknowledgments
The authors wish to thank anonymous reviewers for their helpful comments.
Conflicts of Interest
The authors declare no conflicts of interest.
Appendix A. Additional Materials
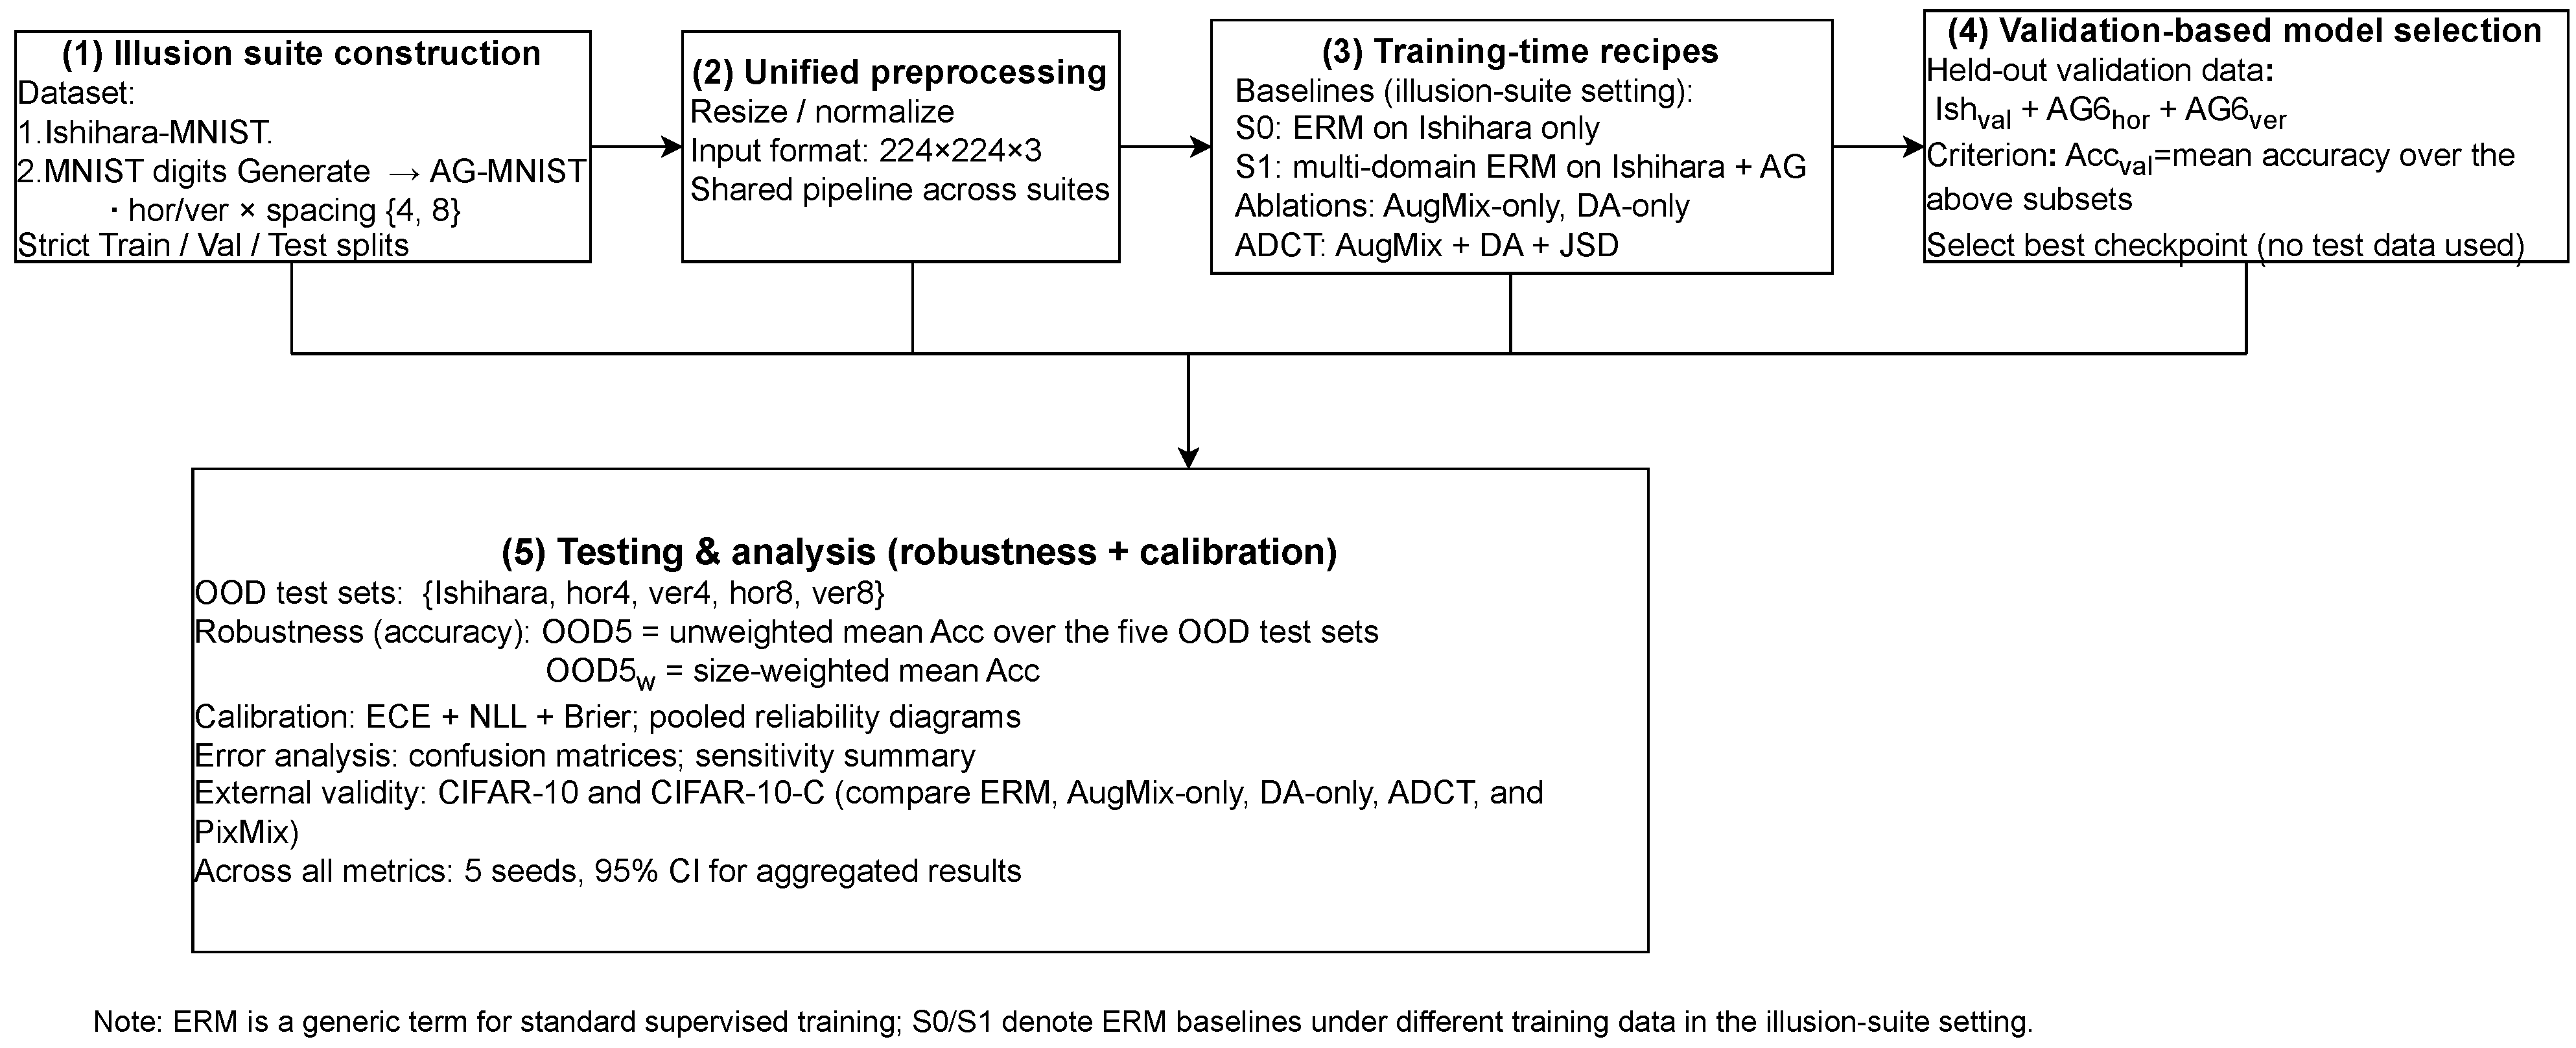
Appendix A.1. Workflow Overview
Figure A1.
Overview of the end-to-end workflow, including illusion-suite construction, unified preprocessing, training-time recipes, validation-based checkpoint selection, and robustness and calibration evaluation.
Appendix A.2. Implementation Details and Hyperparameter Settings
Table A1.
Key hyperparameter settings and protocol details used for ERM, AUGMIX-ONLY, DA-ONLY, ADCT, and PixMix. Unless otherwise stated, the shared training setup is kept fixed across compared methods within each backbone/setting.
Appendix A.3. Sample-Size Weighted OOD5
Table A2.
Appendix: Sensitivity analysis for OOD aggregation: unweighted OOD5 vs. sample-size weighted OOD5w (mean ± std over seeds). Weights correspond to test-set sizes: Ishihara = 6000; hor4/hor8/ver4/ver8 = 10,000 each (i.e., suite-level aggregation is sample-size weighted).
Appendix A.4. Confidence Intervals for Aggregated Metrics
Table A3.
Appendix: 95% confidence intervals (CI) for aggregated accuracy, reported for unweighted OOD5 and sample-size weighted OOD5w. Values are computed over five seeds. CI is based on the two-sided t-interval (df = ); interval bounds are clipped to [0, 100] for presentation.
References
- Ovadia, Y.; Fertig, E.; Ren, J.; Nado, Z.; Sculley, D.; Nowozin, S.; Dillon, J.; Lakshminarayanan, B.; Snoek, J. Can you trust your model’s uncertainty? Evaluating predictive uncertainty under dataset shift. In Proceedings of the Advances in Neural Information Processing Systems; Curran Associates, Inc.: Red Hook, NY, USA, 2019; Volume 32. [Google Scholar]
- Guo, C.; Pleiss, G.; Sun, Y.; Weinberger, K.Q. On Calibration of Modern Neural Networks. In Proceedings of the 34th International Conference on Machine Learning; Precup, D., Teh, Y.W., Eds.; PMLR: Cambridge, MA, USA, 2017; Volume 70, pp. 1321–1330. [Google Scholar]
- Hein, M.; Andriushchenko, M.; Bitterwolf, J. Why ReLU Networks Yield High-Confidence Predictions Far Away From the Training Data and How to Mitigate the Problem. In Proceedings of the IEEE/CVF Conference on Computer Vision and Pattern Recognition (CVPR), Long Beach, CA, USA, 15–20 June 2019. [Google Scholar]
- Liu, J.; Jin, Y. A Comprehensive Survey of Robust Deep Learning in Computer Vision. J. Autom. Intell. 2023, 2, 175–197. [Google Scholar] [CrossRef] [Scilit]
- Wang, L.Y.; Chen, S.G.; Chien, F.T. Robust Deep Convolutional Neural Network against Image Distortions. APSIPA Trans. Signal Inf. Process. 2021, 10, e14. [Google Scholar] [CrossRef] [Scilit]
- Hendrycks, D.; Dietterich, T.G. Benchmarking Neural Network Robustness to Common Corruptions and Perturbations. In Proceedings of the 7th International Conference on Learning Representations (ICLR), New Orleans, LA, USA, 6–9 May 2019; Available online: https://openreview.net/forum?id=HJz6tiCqYm (accessed on 9 August 2025).
- Soriano, M.; Spillmann, L.; Bach, M. The abutting grating illusion. Vis. Res. 1996, 36, 109–116. [Google Scholar] [CrossRef] [Scilit] [PubMed]
- Song, Y.; Baker, C.I., Jr.; Mannion, D.J.; Clifford, C.W.G. Neural mechanisms mediating responses to abutting gratings: Luminance edges vs. illusory contours. Vis. Neurosci. 2006, 23, 181–199. [Google Scholar] [CrossRef] [Scilit] [PubMed]
- Arrieta-Ibarra, I.; Gujral, P.; Tannen, J.; Tygert, M.; Xu, C. Metrics of Calibration for Probabilistic Predictions. J. Mach. Learn. Res. 2022, 23, 1–54. [Google Scholar]
- Huseljic, D.; Herde, M.; Hahn, P.; Müjde, M.; Sick, B. Systematic Evaluation of Uncertainty Calibration in Pretrained Object Detectors. Int. J. Comput. Vis. 2025, 133, 1033–1047. [Google Scholar] [CrossRef] [Scilit]
- Dawood, T.; Chen, C.; Sidhu, B.S.; Ruijsink, B.; Gould, J.; Porter, B.; Elliott, M.K.; Mehta, V.; Rinaldi, C.A.; Puyol-Antón, E.; et al. Uncertainty Aware Training to Improve Deep Learning Model Calibration for Classification of Cardiac MR Images. Med. Image Anal. 2023, 88, 102861. [Google Scholar] [CrossRef] [Scilit]
- Hendrycks, D.; Mu, N.; Cubuk, E.D.; Zoph, B.; Gilmer, J.; Lakshminarayanan, B. AugMix: A Simple Data Processing Method to Improve Robustness and Uncertainty. arXiv 2019, arXiv:1912.02781. [Google Scholar]
- Hendrycks, D.; Basart, S.; Mu, N.; Kadavath, S.; Wang, F.; Dorundo, E.; Desai, R.; Zhu, T.; Parajuli, S.; Guo, M.; et al. The Many Faces of Robustness: A Critical Analysis of Out-of-Distribution Generalization. In Proceedings of the IEEE/CVF International Conference on Computer Vision (ICCV), Montreal, QC, Canada, 10–17 October 2021; pp. 8340–8349. [Google Scholar]
- Rebuffi, S.A.; Gowal, S.; Calian, D.A.; Stimberg, F.; Wiles, O.; Mann, T.A. Data Augmentation Can Improve Robustness. In Proceedings of the Advances in Neural Information Processing Systems; Ranzato, M., Beygelzimer, A., Dauphin, Y., Liang, P., Vaughan, J.W., Eds.; Curran Associates, Inc.: Red Hook, NY, USA, 2021; Volume 34, pp. 29935–29948. [Google Scholar]
- Liu, X.; Karagoz, G.; Meratnia, N. Analyzing the Impact of Data Augmentation on the Explainability of Deep Learning-Based Medical Image Classification. Mach. Learn. Knowl. Extr. 2025, 7, 1. [Google Scholar] [CrossRef] [Scilit]
- Kellman, P.J.; Garrigan, P.B.; Shipley, T.F. Can Convolutional Neural Networks Recognize Kanizsa Shapes? Vis. Res. 2016, 126, 51–63. [Google Scholar]
- Baker, N.; Lu, H.; Erlikhman, G.; Kellman, P.J. Deep Convolutional Networks Do Not Classify Based on Global Object Shape. PLoS Comput. Biol. 2018, 14, e1006613. [Google Scholar]
- Pan, Y.; Chen, M.; Yin, J.; An, X.; Zhang, X.; Lu, Y.; Gong, H.; Li, W.; Wang, W. Equivalent Representation of Real and Illusory Contours in Macaque V4. J. Neurosci. 2012, 32, 6760–6770. [Google Scholar] [CrossRef] [Scilit]
- Pak, A.; Ryu, E.; Li, C.; Chubykin, X.A.A. Top-Down Feedback Controls the Cortical Representation of Illusory Contours in Mouse Primary Visual Cortex. J. Neurosci. 2020, 40, 648–660. [Google Scholar] [CrossRef] [Scilit]
- Pang, Z.; O’May, C.B.; Choksi, B.; VanRullen, R. Predictive coding feedback results in perceived illusory contours in a recurrent neural network. Neural Netw. 2021, 144, 164–175. [Google Scholar] [CrossRef] [Scilit] [PubMed]
- Fan, J.; Zeng, Y. Challenging deep learning models with image distortion based on the abutting grating illusion. Patterns 2023, 4, 100695. [Google Scholar] [CrossRef] [Scilit] [PubMed]
- Henshaw, C.; Dennis, J.; Nadzam, J.; Michaels, A.J. Number Recognition Through Color Distortion Using Convolutional Neural Networks. Computers 2025, 14, 34. [Google Scholar] [CrossRef] [Scilit]
- Gomez-Villa, A.; Martín, A.; Vazquez-Corral, J.; Bertalmío, M.; Malo, J. Color illusions also deceive CNNs for low-level vision tasks: Analysis and implications. Vis. Res. 2020, 176, 156–174. [Google Scholar] [CrossRef] [Scilit] [PubMed]
- Cui, P.; Wang, J. Out-of-Distribution (OOD) Detection Based on Deep Learning: A Review. Electronics 2022, 11, 3500. [Google Scholar] [CrossRef] [Scilit]
- Yang, J.; Zhou, K.; Li, Y.; Liu, Z. Generalized Out-of-Distribution Detection: A Survey. Int. J. Comput. Vis. 2024, 132, 5635–5662. [Google Scholar] [CrossRef] [Scilit]
- Liang, J.; He, R.; Tan, T. A Comprehensive Survey on Test-Time Adaptation Under Distribution Shifts. Int. J. Comput. Vis. 2025, 133, 31–64. [Google Scholar] [CrossRef] [Scilit]
- LeCun, Y.; Cortes, C.; Burges, C.J.C. The MNIST Database of Handwritten Digits. 1998. Available online: https://yann.lecun.org/exdb/mnist/index.html (accessed on 9 August 2025).
- Deng, L. The MNIST database of handwritten digit images for machine learning research [Best of the Web]. IEEE Signal Process. Mag. 2012, 29, 141–142. [Google Scholar] [CrossRef] [Scilit]
- Mumuni, A.; Mumuni, F. Data Augmentation: A Comprehensive Survey of Modern Approaches. Array 2022, 16, 100258. [Google Scholar] [CrossRef] [Scilit]
- Lau, J.S.F.; Cheung, S.H. Illusory contour formation survives crowding. J. Vis. 2012, 12, 15. [Google Scholar] [CrossRef] [Scilit]
- Leila Montaser-Kouhsari, R.R. Attentional modulation of adaptation to illusory lines. J. Vis. 2004, 4, 434–444. [Google Scholar] [CrossRef] [Scilit]
- Miquilini, L.; Ratis, M.A.S.; Lima, M.G.; Bento-Torres, N.V.O.; Lacerda, E.M.C.B.; Cortes, M.I.T.; Rodrigues, A.R.; Silveira, L.C.L.; Souza, G.S. A proposed correction in the weighted method to score the Ishihara test. BMC Res. Notes 2019, 12, 295. [Google Scholar] [CrossRef] [Scilit]
- Jurasevska, K.; Ozolinsh, M.; Fomins, S.; Gutmane, A.; Zutere, B.; Pausus, A.; Karitans, V. Color-discrimination threshold determination using pseudoisochromatic test plates. Front. Psychol. 2014, 5, 1376. [Google Scholar] [CrossRef] [Scilit]
- Souza, G.S.; Malone, F.L.; Crawford, T.L.; Miquilini, L.; Salomão, R.C.; Guimarães, D.L.; Ventura, D.F.; Fitzgerald, M.E.C.; Silveira, L.C.L. Low number of luminance levels in the luminance noise increases color discrimination thresholds estimated with pseudoisochromatic stimuli. Front. Psychol. 2014, 5, 1291. [Google Scholar] [CrossRef] [Scilit] [PubMed]
- Parente, J.R.; da Costa Brito Lacerda, E.M.; Ventura, D.F.; Goulart, P.R.K.; Dutra, N.B.; Souza, G.S.; Miquilini, L. Correlation between parameters estimated by the colour assessment and diagnosis and the Cambridge colour test in color discrimination evaluation. Vis. Res. 2025, 235, 108664. [Google Scholar] [CrossRef] [Scilit] [PubMed]
- Reffin, J.; Astell, S.; Mollon, J.D. Trials of a computer-controlled colour vision test that preserves the advantages of pseudoisochromatic plates. In Proceedings of the Colour Vision Deficiencies X; Drum, B., Serra, A., Eds.; Kluwer Academic: Dordrecht, The Netherlands, 1991; pp. 67–76. [Google Scholar]
- Goulart, P.R.K.; Bandeira, M.L.; Tsubota, K.; Oiwa, N.N.; Ventura, D.F. A Computer-controlled Color Vision Test for Children Based on the Cambridge Colour Test. Vis. Neurosci. 2008, 25, 445–450. [Google Scholar] [CrossRef] [Scilit]
- Geirhos, R.; Rubisch, P.; Michaelis, C.; Bethge, M.; Wichmann, F.A.; Brendel, W. ImageNet-trained CNNs are biased towards texture; increasing shape bias improves accuracy and robustness. arXiv 2019, arXiv:1811.12231. [Google Scholar]
- Maroñas, J.; Paredes, R.; Ramos, D. Calibration of deep probabilistic models with decoupled bayesian neural networks. Neurocomputing 2020, 407, 194–205. [Google Scholar] [CrossRef] [Scilit]
- Wang, Z.; Luo, Y.; Zheng, L.; Chen, Z.; Wang, S.; Huang, Z. In Search of Lost Online Test-Time Adaptation: A Survey. Int. J. Comput. Vis. 2025, 133, 1106–1139. [Google Scholar] [CrossRef] [Scilit]
- Russakovsky, O.; Deng, J.; Su, H.; Krause, J.; Satheesh, S.; Ma, S.; Huang, Z.; Karpathy, A.; Khosla, A.; Bernstein, M.; et al. ImageNet Large Scale Visual Recognition Challenge. Int. J. Comput. Vis. 2015, 115, 211–252. [Google Scholar] [CrossRef] [Scilit]
- Krizhevsky, A. Learning Multiple Layers of Features from Tiny Images; Technical Report; University of Toronto: Toronto, ON, Canada, 2009; Available online: https://api.semanticscholar.org/CorpusID:18268744 (accessed on 6 August 2025).
- Hendrycks, D.; Zou, A.; Mazeika, M.; Tang, L.; Li, B.; Song, D.; Steinhardt, J. PixMix: Dreamlike Pictures Comprehensively Improve Safety Measures. In Proceedings of the IEEE/CVF Conference on Computer Vision and Pattern Recognition (CVPR), New Orleans, LA, USA, 18–24 June 2022; pp. 16783–16792. [Google Scholar]

Disclaimer/Publisher’s Note: The statements, opinions and data contained in all publications are solely those of the individual author(s) and contributor(s) and not of MDPI and/or the editor(s). MDPI and/or the editor(s) disclaim responsibility for any injury to people or property resulting from any ideas, methods, instructions or products referred to in the content. |
© 2026 by the authors. Licensee MDPI, Basel, Switzerland. This article is an open access article distributed under the terms and conditions of the Creative Commons Attribution (CC BY) license.