


Abstract
With the expansion of power grids, the increasing peak-valley load difference threatens grid security, a challenge addressed by time-of-use pricing which incentivizes load shifting. Since central air-conditioning systems account for over 60% of building energy use, optimizing them for efficiency and cost under time-of-use pricing is crucial. This study presents an integrated optimization framework that coordinates photovoltaic generation, battery storage, and grid power. The approach develops a BES-LSTM forecasting model by using the Bald Eagle Search (BES) algorithm to tune Long Short-Term Memory (LSTM) network parameters for accurate cooling-load prediction. A central air-conditioning water-system energy-minimization model is then formulated and solved with an improved BES algorithm that incorporates adaptive opposition-based learning, logistic chaotic mapping, and Lévy flight. Finally, a daily schedule is optimized by partitioning time according to time-of-use price intervals and treating generation output, battery charge/discharge, and grid draw as decision variables. Simulations demonstrate that the framework reduces the central air-conditioning water system’s total energy consumption by an average of 28.7% and lowers energy costs under time-of-use pricing by 22.38%, achieving both significant energy savings and economic benefits.
1. Introduction
In the context of the escalating global energy crisis, the imperative for energy conservation has become a pivotal concern for societal advancement. The accelerating effects of climate change due to global warming have resulted in a growing prevalence of central air-conditioning systems (CACs). In the building sector, energy consumption accounts for over 40% of total global energy use. CAC systems represent a significant component of infrastructure for the regulation of indoor environmental factors, including temperature, humidity, and air quality. These systems play a substantial role in the overall energy consumption of buildings during their operational phase [1]. It is a well-established fact that CAC systems generally comprise both water and air systems. The water system is typically the primary component of the system that consumes energy. The available data indicates that this water system accounts for more than 60% of the total energy consumption of CAC systems [2]. Consequently, the optimization of energy efficiency in CAC water systems has emerged as a pivotal research objective, with the aim of ensuring minimal power consumption while meeting load demands, thereby leading to a substantial reduction in overall energy utilization.
CAC systems are frequently engineered to withstand peak loads; however, they predominantly function at non-peak loads throughout their operational lifespan. A salient issue that emerges pertains to the persistent utilization of parameter configurations that have been optimized for peak load conditions, even when the system operates under lower loads. This phenomenon results in suboptimal efficiency and consequent energy dissipation. Consequently, the identification of the optimal parameters and system configurations that minimize energy use and enhance operational efficiency under varying real-world load conditions is a central focus in energy conservation research for CAC systems. Moreover, as China’s demand for electricity continues to increase, the implementation of a static electricity pricing model results in imbalances within the pricing structure. This, in turn, leads to long-term revenue losses for power enterprises and inefficiencies in social electricity consumption [3]. The implementation of time-of-use pricing strategies has been identified as a potential solution for mitigating grid load imbalances. Time-of-use pricing involves the strategic shifting of consumption from peak to off-peak periods, thereby reducing the demand for expensive grid capacity upgrades [4,5]. The implementation of a differential pricing structure has been identified as a potential strategy to enhance the operational efficiency of the CAC system. This approach is expected to result in a reduction in energy expenditures, thereby mitigating supply–demand imbalances. The adoption of Demand Response (DR) technologies is anticipated to play a pivotal role in this regard, as they facilitate the optimization of energy utilization and the management of supply–demand dynamics [6]. Advancements in photovoltaic power generation and energy storage technologies have further facilitated the optimization of energy utilization under time-of-use pricing frameworks. The utilization of photovoltaic generation during daylight hours for the purpose of charging energy storage devices, which are then discharged during nocturnal periods, has been demonstrated to enhance energy efficiency and reduce operational costs [7,8]. Recent years have seen a notable increase in the implementation of renewable energy generation integrated with storage systems within a time-of-use pricing structure within the context of CAC systems [9,10].
The energy-saving optimization of CAC systems is predicated on the construction of an accurate model of the CAC water system. A plethora of studies have previously utilized an array of techniques, including the Harris Hawk-optimized Elman neural network [11], temporal convolutional networks (TCNs) [12], and various machine learning approaches [13,14,15,16,17,18,19]. However, these models frequently neglect to account for the characteristics of each component within the system, thereby leading to a reduction in accuracy. This study addresses this gap by combining nonlinear modelling techniques for load forecasting and chiller units, while fitting simpler system components to historical operational data, improving model accuracy.
Given the complex couplings and numerous operating parameters in air-conditioning water systems, intelligent algorithms are widely used to search for optimal operating settings. For instance, Liu Y et al. [20] refined PSO through various strategies for energy consumption optimization. Other approaches include improved PSO-SSA and swarm intelligence algorithms [21,22]. Tian H et al. [23] introduced a model-free Upper Confidence Bound–Deep Q-Network (UCB-DQN) algorithm, enabling fast and precise parameter tuning in a simulated environment. Siyuan Y et al. [14] proposed a parallel artificial immune system algorithm that combines exhaustive search, diversified initialization, immigrant operators, and adaptive mutation to identify optimal parameter sets for energy-saving operation.
Research on integrating renewable energy generation and energy storage technologies to supplement power for central air-conditioning systems under peak-valley pricing mechanisms is also increasing. Rebelo F. W. D. et al.’s [8] experiments conducted in regions such as South America (e.g., Brazil) demonstrated that applying photovoltaic technology in air-conditioning systems can significantly reduce electricity consumption, while maintaining operational stability even under high cooling loads. Similarly, Y. Li et al. [9] investigated the actual operation of a grid-connected photovoltaic-powered central air-conditioning system in an office building in Southern China. Their study confirmed that photovoltaic technology not only lowers energy consumption but also ensures stable system performance. Tah et al. [23] summarize the application of photovoltaic modules in buildings and conclude that they hold greater potential for architectural integration. The authors also identify current photovoltaic power generation efficiency and thermal utilization as key challenges requiring resolution in building-integrated photovoltaics. Presently, replacing conventional silicon wafers with high-performance materials represents a significant avenue for enhancing the power generation efficiency of photovoltaic modules, as demonstrated by Abid Ullah et al. [24]. Additionally, integrated building-integrated photovoltaics and solar thermal technologies are becoming increasingly mature. Beyond considering photovoltaic power generation efficiency and thermal insulation, ensuring adequate thermal conductivity in the solar thermal component is also critical. Current academic consensus holds that the thermal conductivity of solar thermal materials is influenced by material composition. However, Siqi Liu et al. [25] discovered through research that material inhomogeneity in solar thermal components can similarly reduce thermal conductivity.
The present research suggests that operating central air-conditioning systems efficiently under time-of-use pricing mechanisms requires a collaborative framework that integrates photovoltaic power generation, energy storage and the grid. Clearly, both single-energy and dual-energy models have limitations. Firstly, relying solely on the grid fails to leverage price differentials fully. Secondly, a direct photovoltaic power supply struggles to match load periods. Furthermore, standalone photovoltaic-storage systems are subject to weather-related constraints and capacity limitations. However, by implementing ‘peak shifting’ (energy storage arbitrage) and ‘source-load matching’, tripartite coordination can simultaneously reduce operating costs, enhance power supply reliability and maximize renewable energy utilization. This paper proposes a collaborative dispatch framework that integrates load forecasting and intelligent optimization. This framework is then used to determine the optimal economic operating strategy for complex systems.
2. Materials and Models
2.1. Problem Formulation
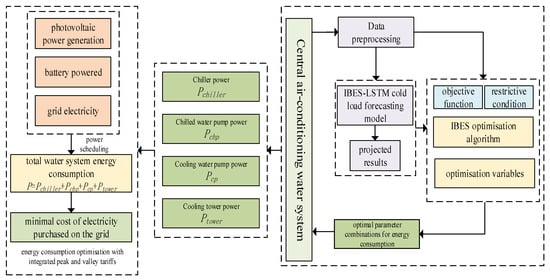
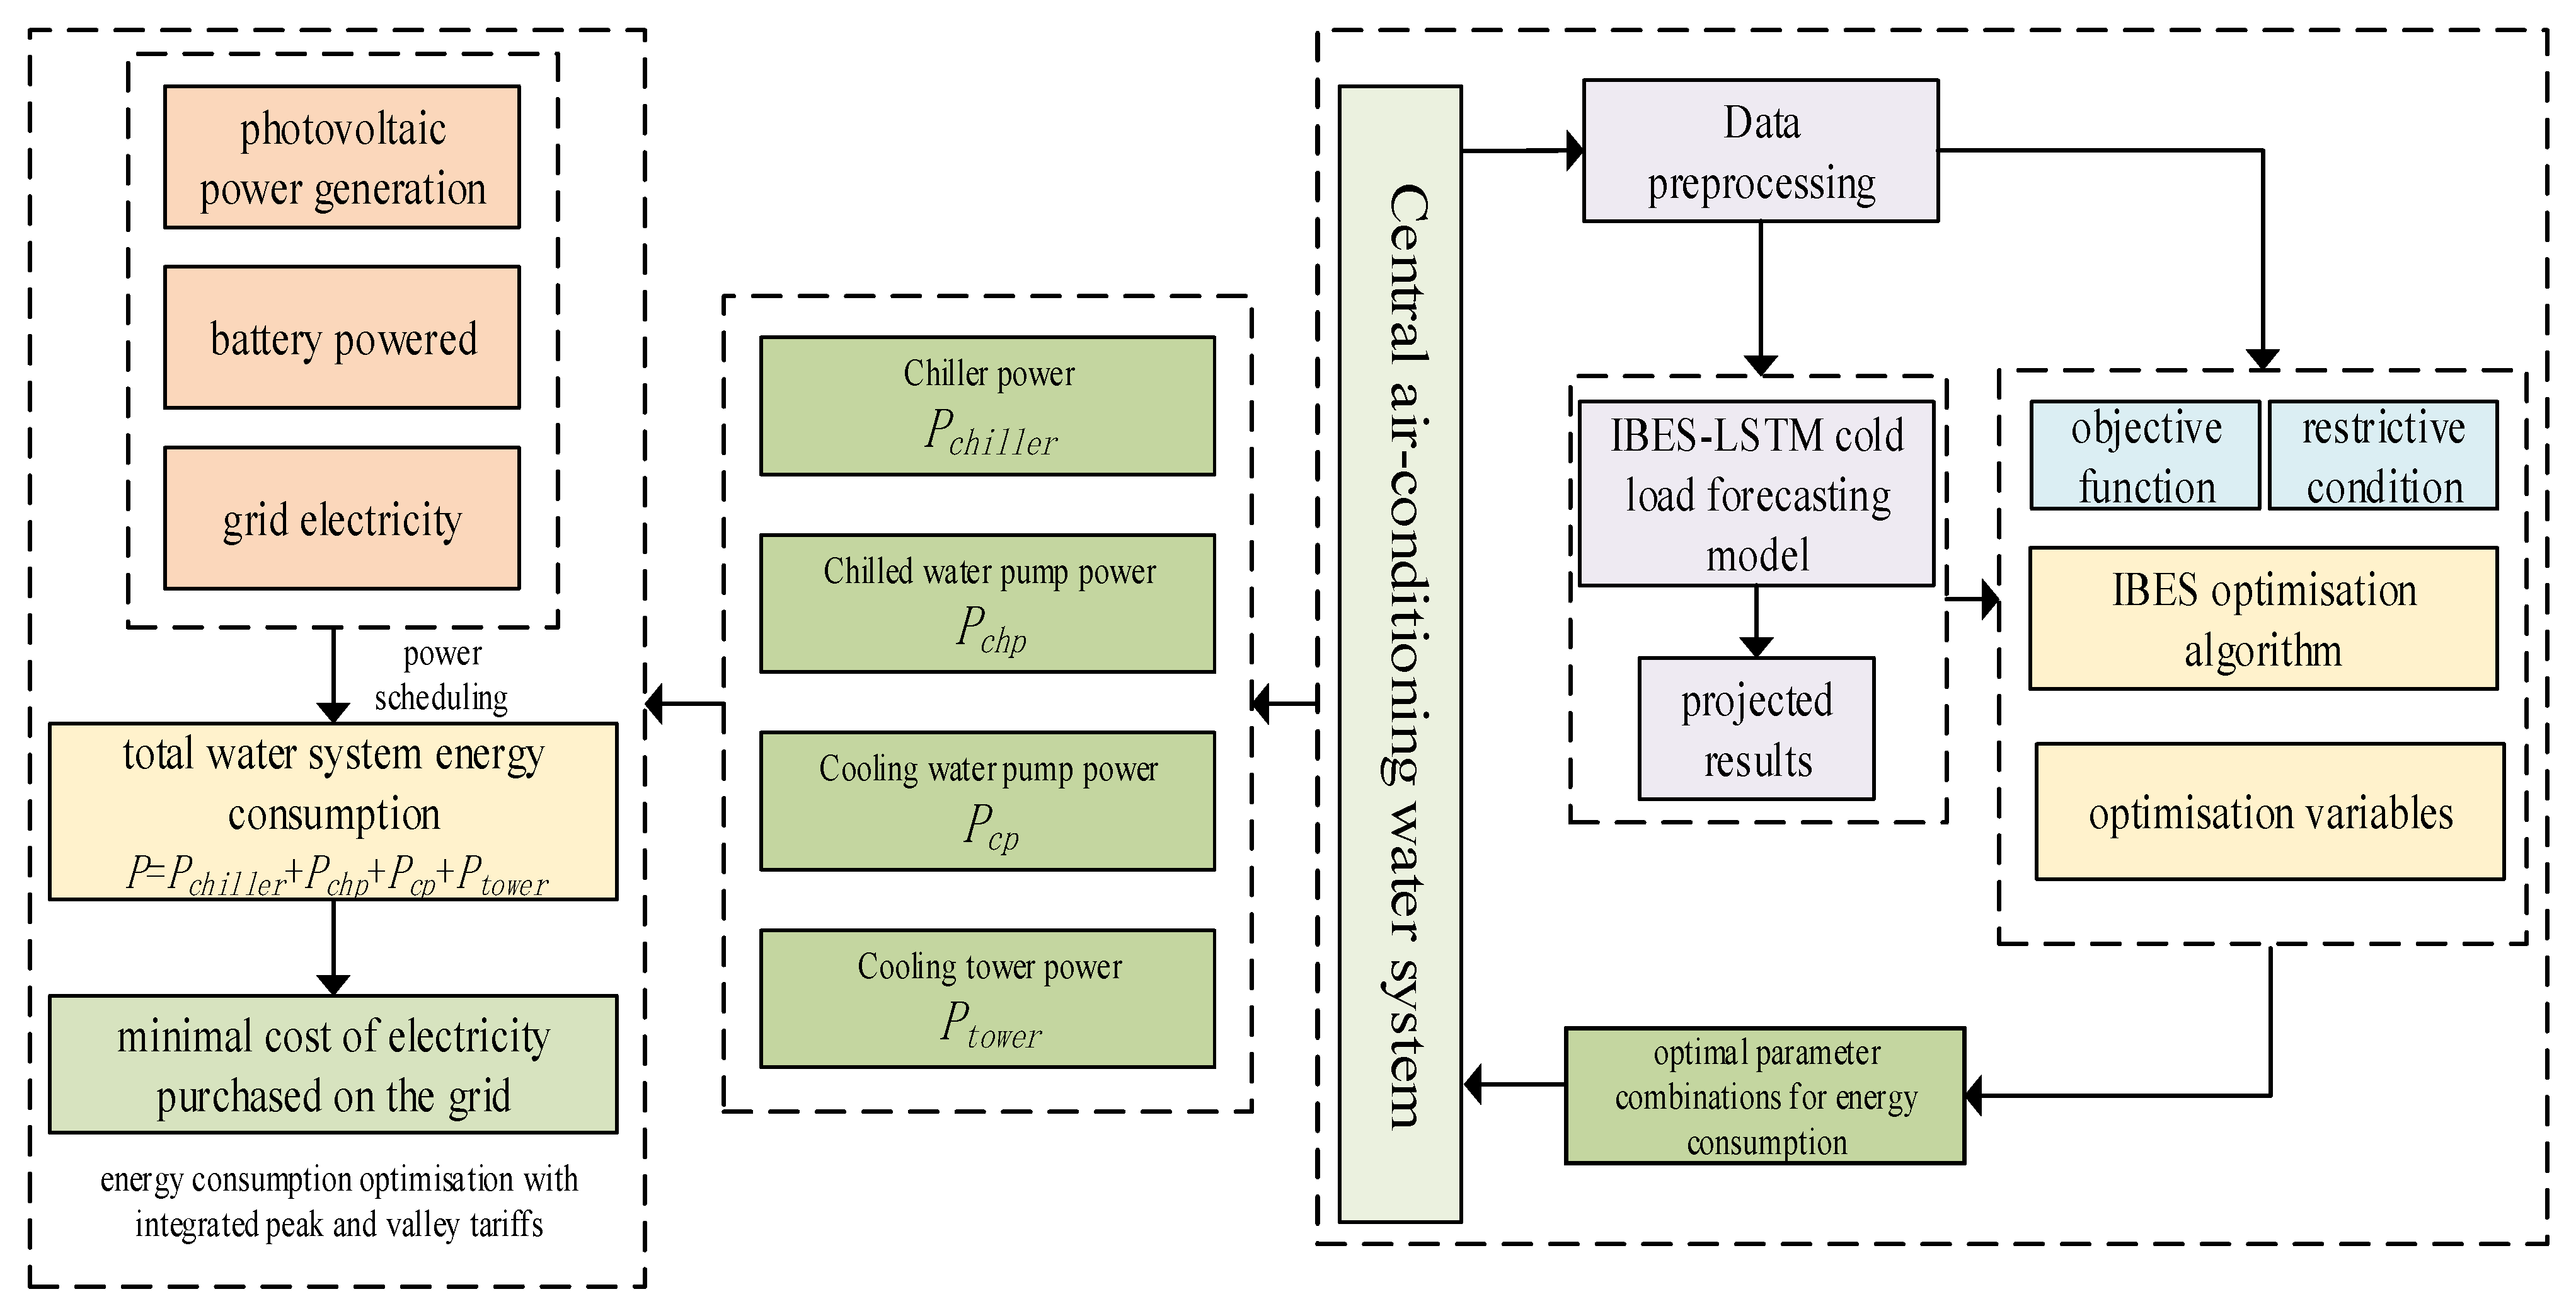
Conventional central air-conditioning water systems are characterized by elevated energy consumption, inefficiency, and a significant reliance on the primary power grid. The implementation of time-of-use pricing policies has been identified as a factor that further complicates the management of operational costs and the scheduling of activities. The integration of photovoltaic generation and energy storage has the potential to offer significant benefits, but it must be noted that this integration also introduces a number of operational challenges. Inadequate scheduling of these resources has the potential to engender a diminution in energy efficiency and economic returns. The proposed system is an enhancement to the existing infrastructure, integrating photovoltaic arrays and battery storage with key water-side components, including chillers, pumps and cooling towers. A novel optimization model for power scheduling is hereby presented, encompassing load forecasting, photovoltaic generation uncertainty, price fluctuations, and battery dynamics. A schematic outline of the entire research framework is presented in Figure 1.
Figure 1.
Overall framework diagram.
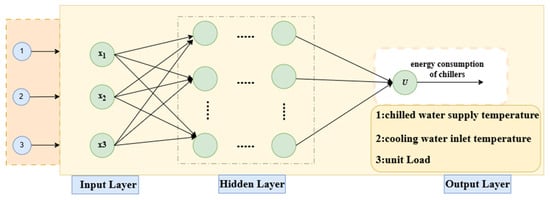
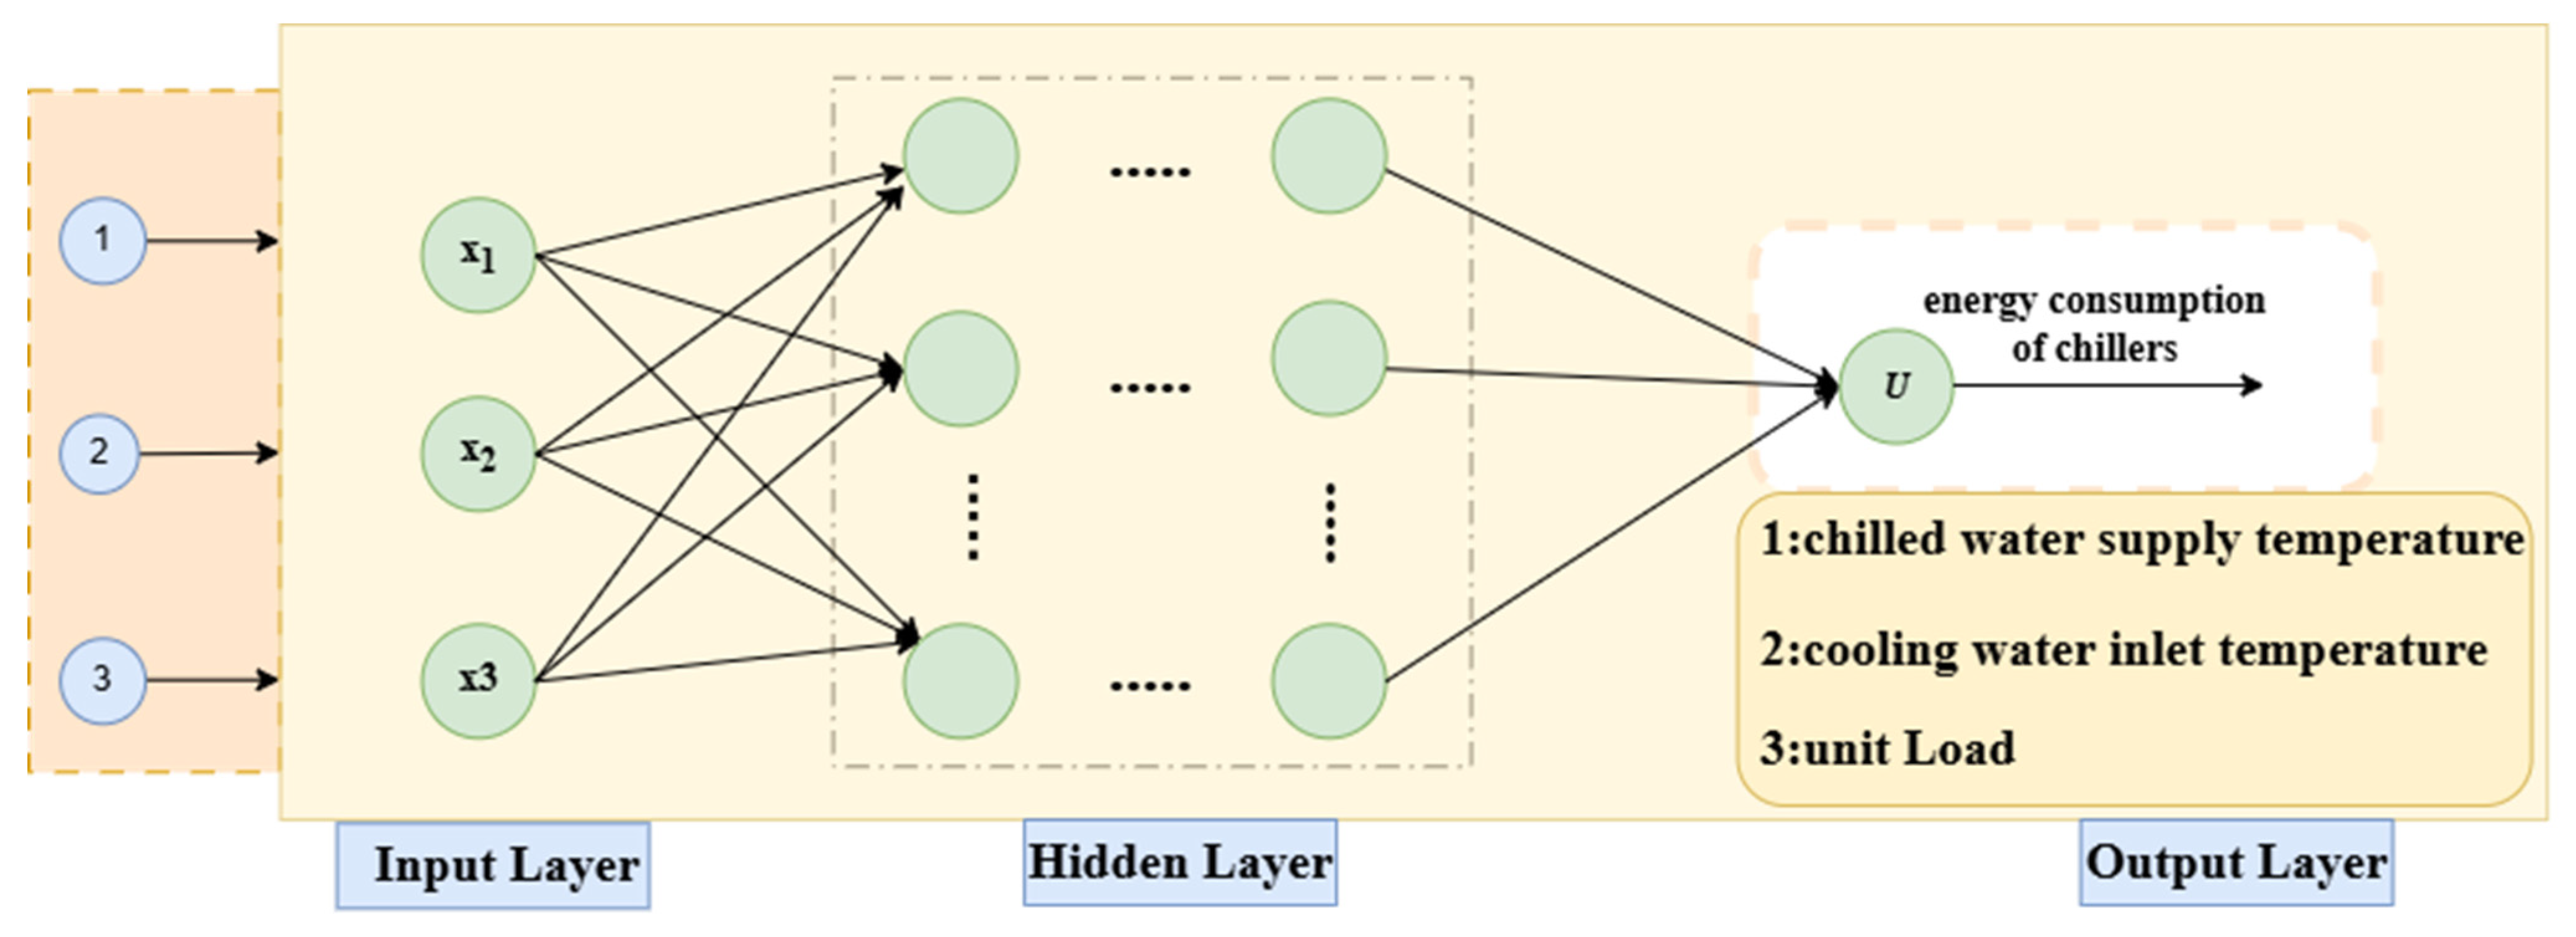
For modeling the energy consumption of chiller units, a data-driven approach utilizes Long Short-Term Memory (LSTM) neural networks to dynamically model the energy consumption of chillers, primarily leveraging their exceptional capability to process long-term dependencies within time series data. The cooling load and energy consumption of central air-conditioning systems exhibit pronounced nonlinearity, temporal correlation, and state dependency. The unique gating mechanism inherent to LSTM effectively captures such dynamic temporal characteristics, thereby enabling accurate description and prediction of system behavior. The overall methodology is illustrated in Figure 2. The models for other components have been derived from historical data.
Figure 2.
Structural model of refrigerator based on LSTM.
To address the high-dimensional, multimodal and constrained nature of central air-conditioning system optimization problems, enhancements have been made to this algorithm. It has been refined by incorporating adaptive adversarial learning to improve initial solution quality, employing logical chaos mapping to maintain population diversity, and integrating Levin flight to enhance global exploration capabilities. These enhancements have significantly boosted the robustness and optimization performance of the algorithm when tackling complex engineering challenges. The enhanced vulture search algorithm has therefore been applied to load forecasting and parameter optimization.
Finally, incorporating peak-valley electricity pricing mechanisms sets the system scheduling objective to minimize grid power purchase costs. Guided by the principle of prioritizing photovoltaic utilization, battery charging and discharging behaviors are rationally coordinated. This achieves energy savings in central air-conditioning water system equipment, as well as peak shaving and valley filling in grid loads and the efficient utilization of renewable energy. Consequently, the operational economics and energy efficiency of the central air-conditioning system are enhanced comprehensively.
2.2. Central Air-Conditioning Water System Model
The primary components of the central air-conditioning water system that are responsible for the highest levels of energy consumption are as follows: chillers, cooling water pumps, chilled water pumps, and cooling towers. The establishment of a direct correlation between system power consumption and operating parameters for the entire air-conditioning water system introduces a complex dynamic, which complicates the representation of inter-component relationships, and potentially results in model overfitting. The present study proposes the development of individual models that establish a correlation between power consumption and operating parameters for each component, including chillers, chilled water pumps, cooling water pumps and cooling towers. The total energy consumption of the air-conditioning water system is determined by summing the power consumption from these four models.
2.2.1. Chiller Model
The chiller represents a pivotal element within the CAC system, with its energy consumption exerting a substantial influence on the overall efficiency of the system. The field of chiller modelling can be broadly categorized into two approaches: mechanism-based and data-driven models. Mechanism-based models necessitate detailed equipment parameters, whereas data-driven models rely on historical operational data.
The input variables for the chiller model are as follows:
where:
: the output variable is the chiller energy consumption;
: the chilled water supply temperature;
: the cooling water inlet temperature;
: the unit load.
In the context of a CAC system, where multiple chillers operate in parallel, the total energy consumption of the chillers is the sum of the energy consumption of each individual chiller. If there are N1 chillers in the CAC system, the energy consumption model of the CAC chillers is as follows:
where
: the total power of the chillers;
: the total number of chillers;
: the power of the i-th chiller.
2.2.2. Chilled Water Pump Model
In configurations employing multiple chilled water pumps in parallel, the aggregate pump energy consumption is calculated as the sum of the individual unit consumptions, according to the following model:
where
: the power of the chilled water pump;
: the rated power of the chilled water pump;
: the frequency of the chilled water pump;
: the ratio of the chilled water pump’s frequency to its rated frequency;
: the undetermined coefficients of the model.
In configurations employing multiple chilled water pumps in parallel, the overall chilled pump energy consumption is aggregated from the consumption of all individual units, according to the following model:
where
: the total power of the chilled water pumps;
: the number of chilled water pumps;
: the power of the j-th chilled water pump.
2.2.3. Cooling Water Pump Model
In a similar manner, the energy consumption model of cooling water pumps can be expressed in the form of a polynomial relation of frequency. The energy consumption model for cooling water pumps is as follows:
where
: the power of the cooling water pump;
: the rated power of the cooling water pump;
: the frequency of the cooling water pump;
: the ratio of the cooling water pump’s frequency to its rated frequency;
: the undetermined coefficients of the model.
In configurations employing multiple cooling water pumps in parallel, the overall cooling pump energy consumption is aggregated from the consumption of all individual units, according to the following model:
where
: total power of the cooling water pumps;
: the number of cooling water pumps;
: the power of the l-th cooling water pump.
2.2.4. Cooling Tower Model
The fan is the primary energy-consuming component in a cooling tower, and its energy consumption can be calculated using a polynomial function of frequency [26]. The energy consumption model of the cooling tower is as follows:
where
: the power of the cooling tower;
: the rated power of the cooling tower;
: the frequency of the cooling tower;
: the ratio of the cooling tower’s frequency to its rated frequency;
: the undetermined coefficients of the model.
In configurations employing multiple cooling towers in parallel, the overall cooling tower energy consumption is aggregated from the consumption of all individual units, according to the following model:
where
: total power of cooling tower;
: the number of cooling tower;
: the power of the k-th cooling tower.
3. Methods
3.1. Bald Eagle Search Algorithm (BES)
The BES algorithm mimics the hunting behavior of bald eagles, and its process is divided into three main stages:
- (1)
- Search Space Selection
In the initialization phase, the algorithm defines the search space and targets regions of highest potential (prey density). This process is mathematically expressed as follows:
where
: the parameter controlling position change, ranging from 1.5 to 2;
: a random number between 0 and 1;
: the current best position;
: the mean distribution position of bald eagles after the previous search;
: the position of the i-th bald eagle.
- (2)
- Prey Search in the Search Space
In the search phase, the algorithm (bald eagle) performs an intensive exploration of the selected region through diverse movement strategies to identify improved solutions. The position update is governed by the following:
where
: the bald eagle’s position in polar coordinates, ranging from −1 to 1;
: the bald eagle’s position in polar coordinates, ranging from −1 to 1;
: the next updated position of the i-th bald eagle.
- (3)
- Swooping to Capture Prey
During the swooping phase, the bald eagle determines and executes the optimal predation strategy. In this process, the algorithm evaluates and selects candidate solutions based on specific evaluation metrics to identify the best solution. The position update formula for the bald eagle is given as follows:
where
: the current best position;
: the mean distribution position of bald eagles after the previous search;
and : the movement intensities of the bald eagle toward the best position, both ranging from 1 to 2;
: the bald eagle’s position in polar coordinates, ranging from −1 to 1;
: the bald eagle’s position in polar coordinates, ranging from −1 to 1.
3.2. Improved Bald Eagle Search Algorithm (IBES)
The Bald Eagle Search (BES) algorithm has certain limitations in convergence speed and local search capability. Below are the improvement strategies for the IBES algorithm proposed in this paper.
- (1)
- Initialization Based on Adaptive Opposition-Based Learning
An initialization update formula incorporating an adaptive opposition-based learning strategy is proposed as follows:
where represents the learning rate, with a value set to 0.1.
- (2)
- Updating Search Space Position Based on Logistic Map
The logistic map plays a significant role in the study of nonlinear systems, and its equation is expressed as follows:
where
t: the t-th iteration;
: the control parameter which governs the evolution of the logistic map, the range is . As increases, the range of the mapping sequence also expands, resulting in a more uniform distribution. When the system enters a state of complete chaos, at which point the uniformity of the distribution reaches its optimum.
The improved update formula for the search space position is as follows:
where
: the parameter controlling position changes, ranging from 1.5 to 2;
: a random number between 0 and 1.
- (3)
- Updating Prey Search Position Based on Lévy Flight
Levy flight is an important stochastic process that simulates long-distance jumps during random walk, enabling more accurate description of certain complex phenomena. Its expression is given as follows:
where
: the stride scaling factor, );
: the current optimal solution.
The update formula for the prey position in the search space based on Lévy flight is defined as follows:
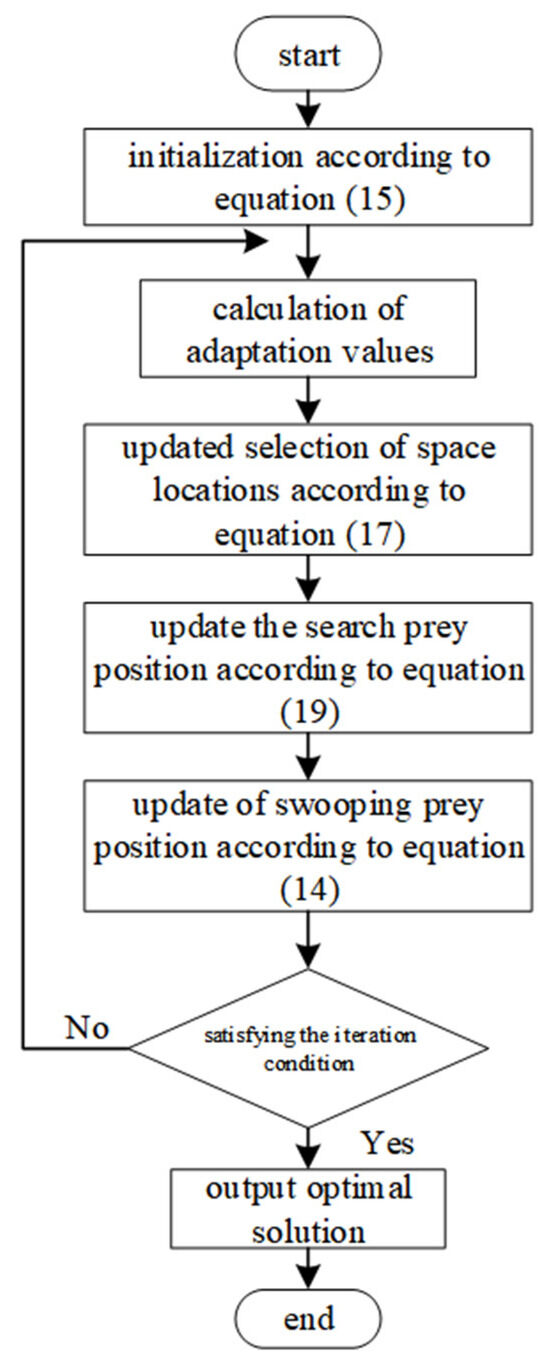
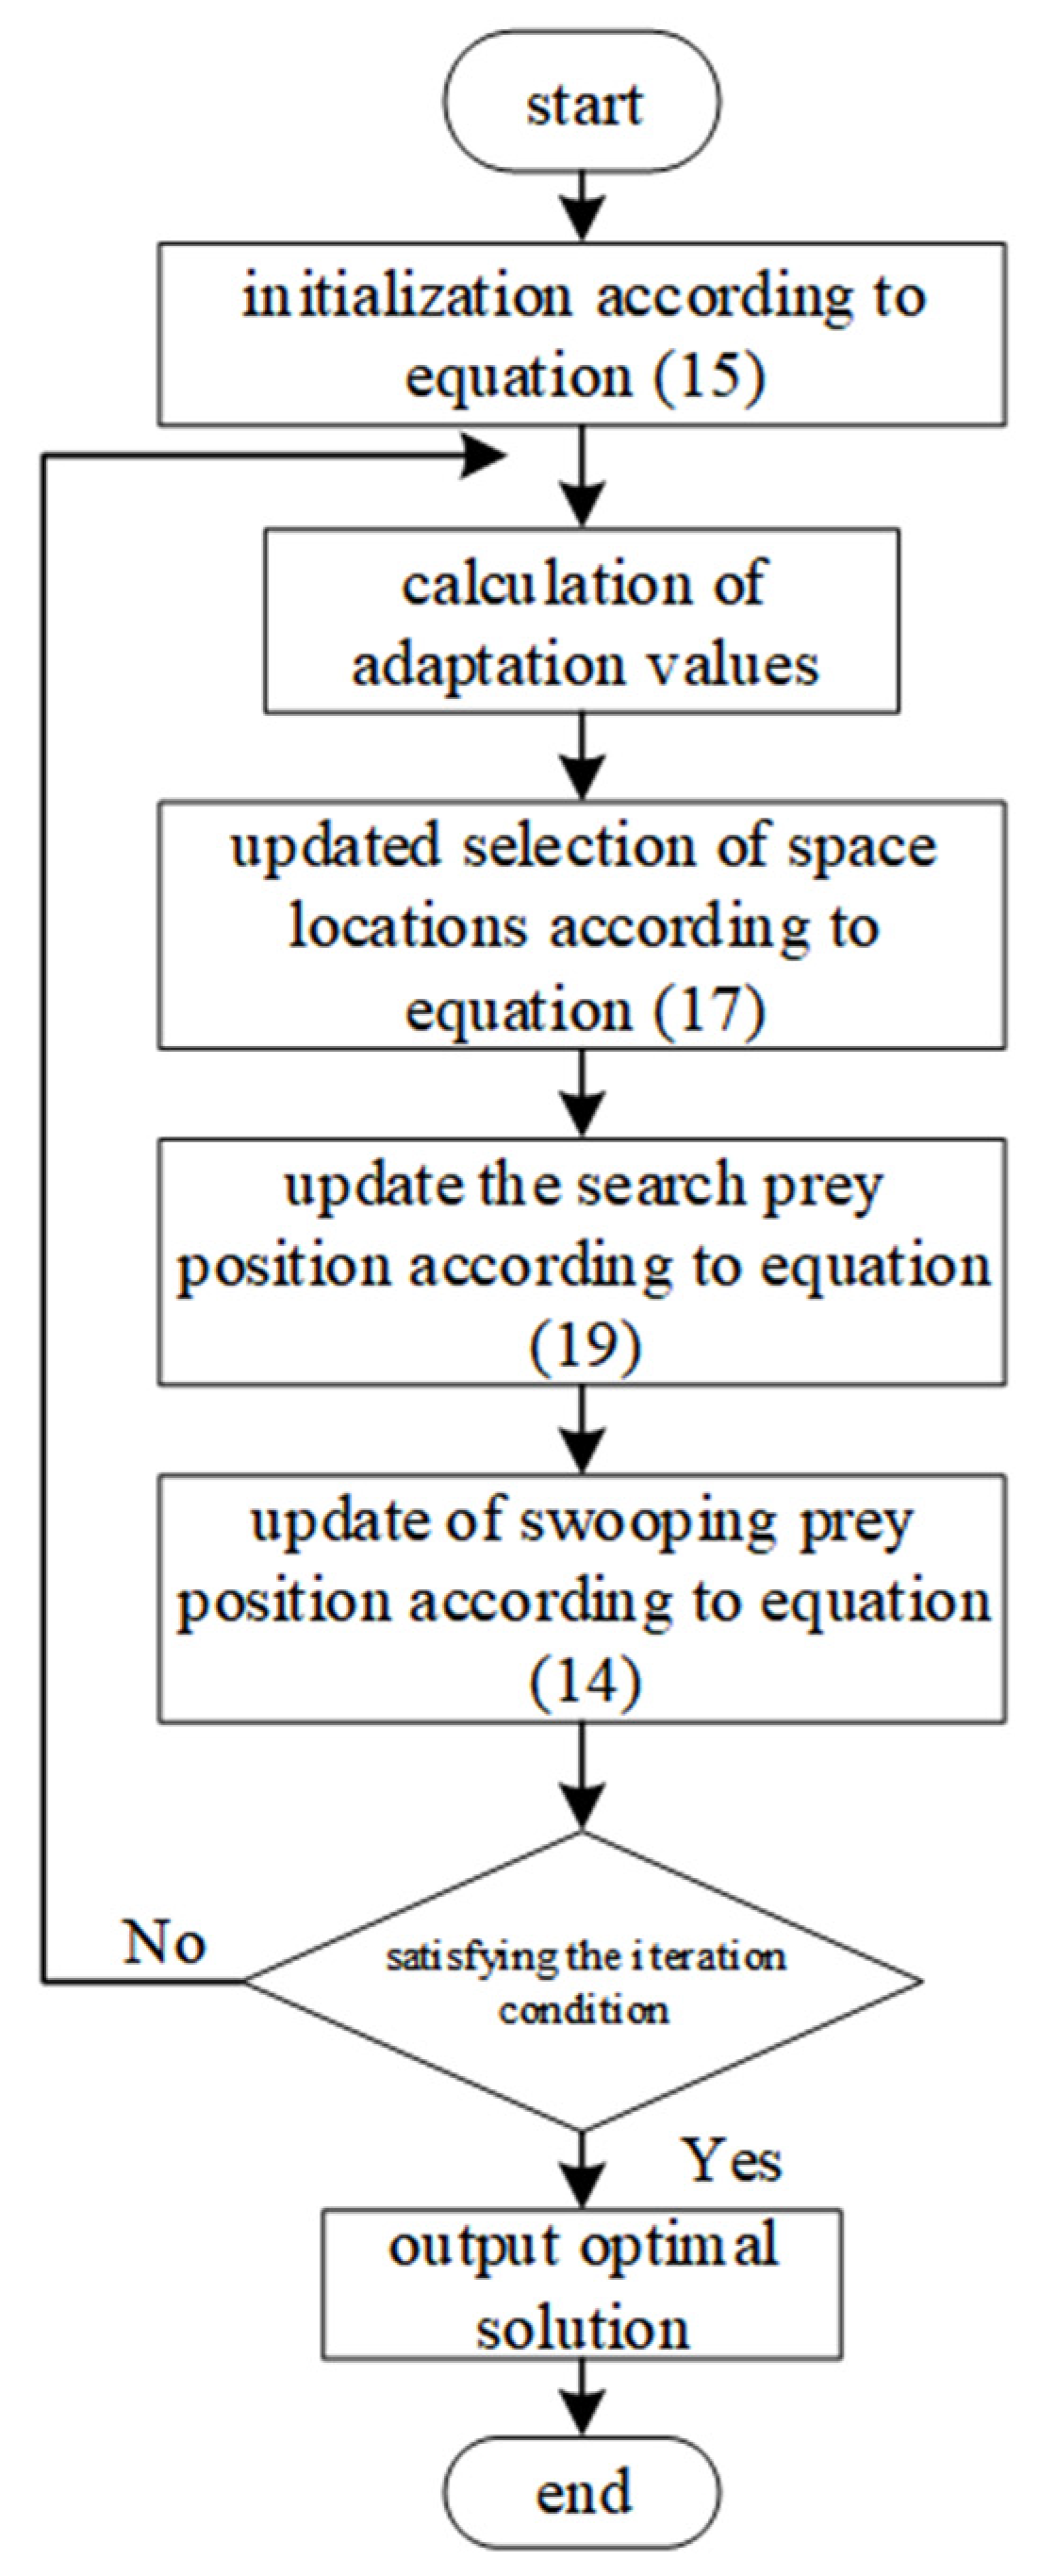
The enhanced BES algorithm initially implements an adaptive opposition-based learning strategy for initialization. Subsequently, a logistic mapping strategy is incorporated during the search space selection phase, and finally a Levy flight strategy is integrated in the prey search phase. These enhancements have been demonstrated to significantly increase the probability of the algorithm obtaining the global optimal solution. The flowchart illustrating the enhanced BES algorithm is presented in Figure 3.
Figure 3.
Flowchart of IBES algorithm.The steps are as follows: initialisation according to Equation (15); calculation of fitness values; update of space locations according to Equation (17); update of search prey position according to Equation (19); update of swooping prey position according to Equation (14). The loop continues until the iteration condition is satisfied, at which point the optimal solution is output.
- (4)
- Test Results and Analysis
In order to provide a comprehensive evaluation of the performance of the proposed IBES algorithm, seven benchmark functions with distinct characteristics were selected for the purposes of a comparative experiment. It is evident that the functions in question were all derived from the widely recognized benchmark set of the IEEE Computational Intelligence Society (CIS) [27]. Five comparison algorithms were selected to evaluate the performance of the IBES algorithm. These algorithms encompass both classical methods and newer approaches proposed in recent years. Parameters were uniformly set for all five algorithms: population size of 30 and maximum iteration count of 1000. Other parameter settings are detailed in Table 1. The second table presents a comparison of the final optimal values and variances of a range of algorithms. The results obtained for test functions F1–F4 demonstrate that the IBES algorithm attains optimization accuracy that is equivalent to that of the original BES algorithm. Furthermore, both algorithms exhibit superior performance in comparison to the PSO, DOA, WOA, and ALO algorithms. Furthermore, the IBES algorithm has been demonstrated to exhibit accelerated convergence properties. In summary, the IBES algorithm demonstrates a markedly superior performance profile. As demonstrated in Table 2, the IBES algorithm is observed to achieve the highest level of optimization accuracy among the range of algorithms that have been analyzed in this study. The findings of this study demonstrate that the enhanced Bald Eagle Search algorithm proposed herein exhibits superior performance in terms of optimization speed and convergence accuracy when compared with alternative algorithms.
Table 1.
Parameter settings.
Table 2.
Benchmark function results comparison.
Beyond the question of accuracy in optimization, the computational cost of an algorithm is a critical metric by which to assess its practicality, especially in the context of real-time applications. In order to evaluate this, a runtime comparison was conducted on a computer that was equipped with an Intel i5-8300H central processing unit and 8 GB of random access memory. The mean runtime of each algorithm was compared across 30 independent runs on the benchmark functions F1–F7, under identical experimental conditions. The results of the study are summarized in Table 3.
Table 3.
Comparison of average running times of various algorithms on the benchmark function.
As demonstrated, the proposed IBES exhibits competitive computational efficiency. The proposed method significantly outperforms PSO, DOA, and particularly ALO. In comparison with the original BES, IBES attains analogous or even reduced runtimes (particularly on F3 and F7), whilst exhibiting enhanced accuracy. This suggests that the enhancements made by us improve performance without resulting in additional computational overheads. Although the Whale Optimization Algorithm (WOA) demonstrates the shortest runtime, it exhibits a significantly lower level of optimization accuracy on functions F1–F4, as illustrated in Table 2. Therefore, the results demonstrate that IBES offers a favorable trade-off between convergence accuracy and computational cost, thus supporting its potential for practical engineering optimizations.
This paper proposes improvements to the BES algorithm aimed at systematically enhancing its global optimization performance, specifically including the following: (1) adaptive adversarial learning initialization to improve initial population quality and accelerate convergence in the early stages; (2) chaotic perturbation based on the logistic map to enhance population diversity during the search process and effectively prevent premature convergence; (3) integration of the Lévy flight strategy to grant the algorithm stronger escape capabilities when trapped in local optima. These three improvements synergistically enable the IBES algorithm to maintain robust local exploration capabilities while achieving superior global exploration capabilities and robustness.
3.3. IBES-LSTM Load Forecasting Model
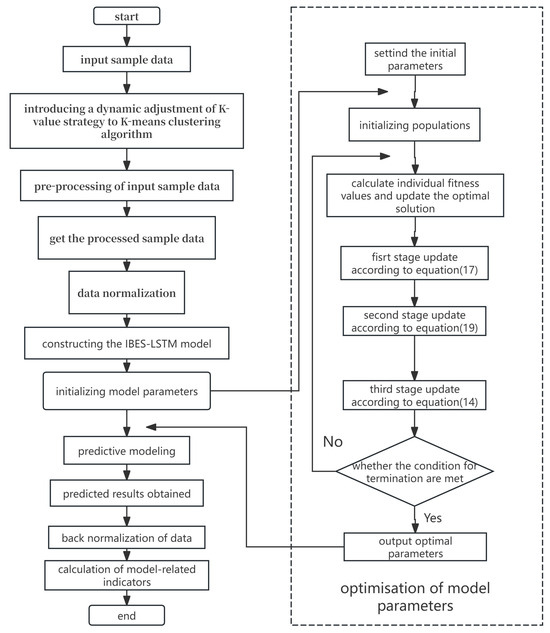
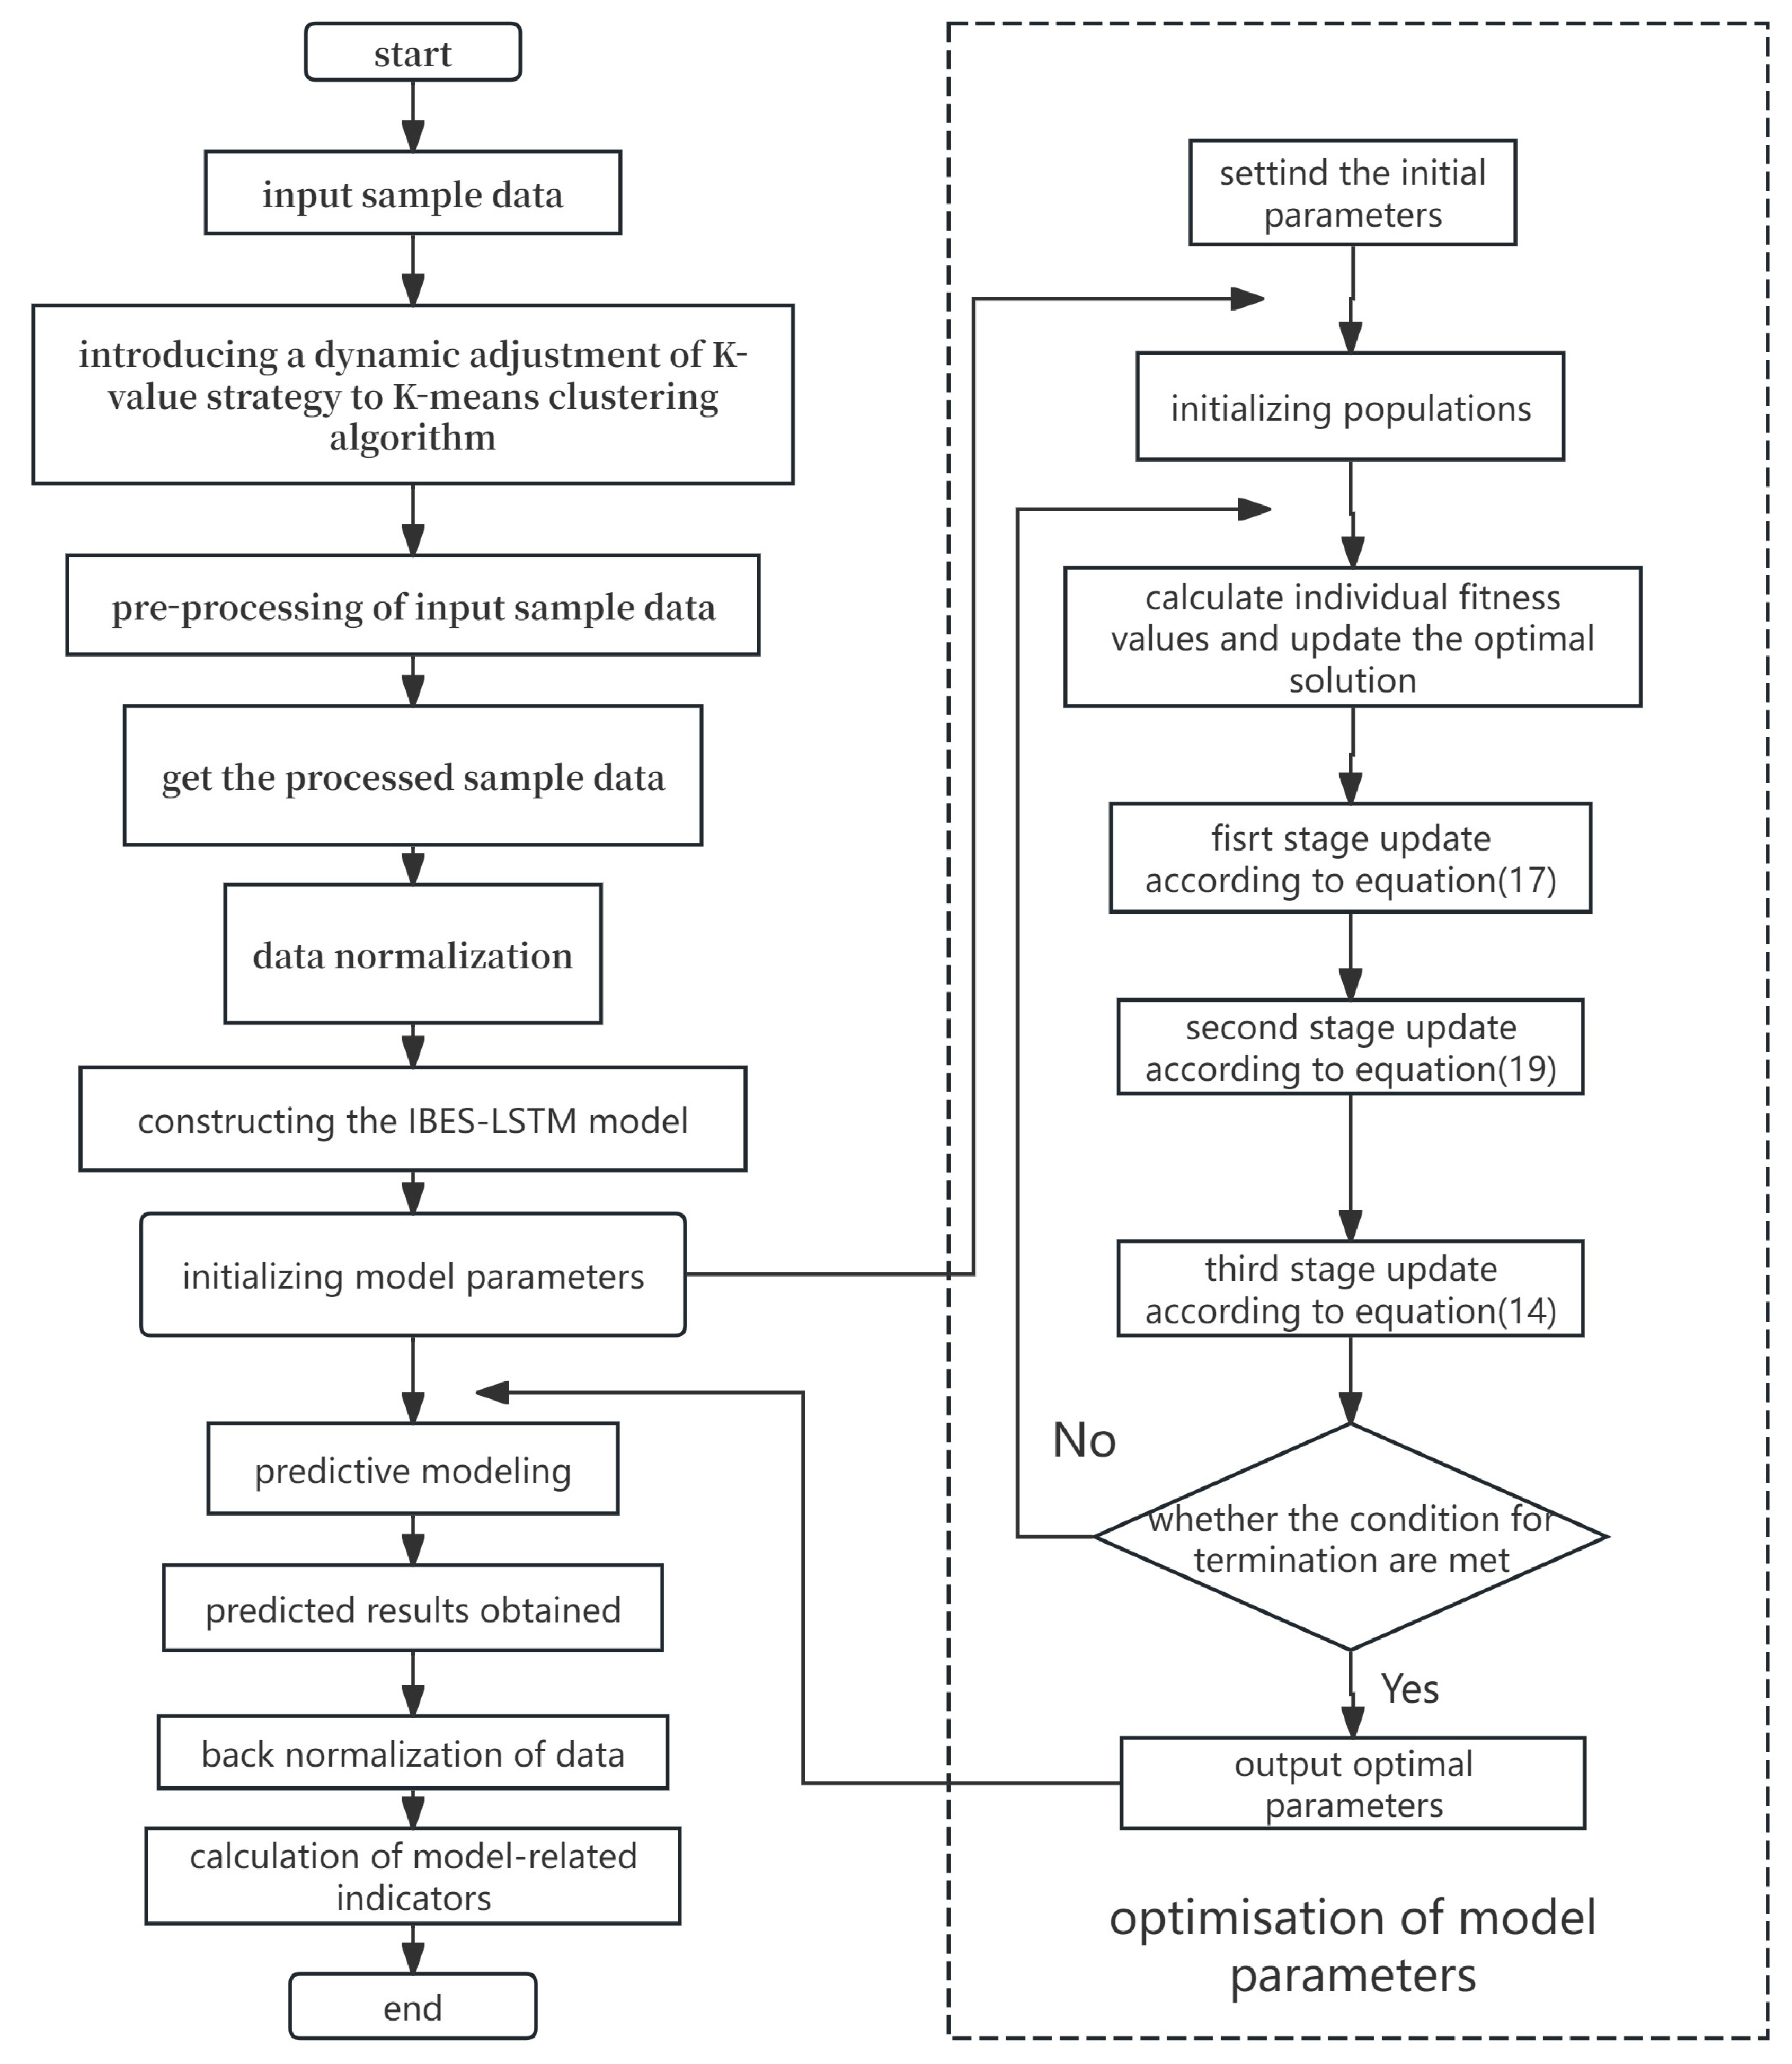
The LSTM network has been demonstrated to be an effective model for multivariate nonlinear systems [28]. However, conventional LSTM models frequently depend on manually configured parameters or empirical rules, which introduces subjective bias and restricts model accuracy. In order to surmount this limitation, a proposal is put forward for an IBES-LSTM load forecasting model. The model first applies the AK-means clustering algorithm to process the input data, thus improving the quality of the dataset and enhancing the forecasting performance. Subsequently, the IBES algorithm optimizes the LSTM parameters with a view to enhancing forecasting accuracy. The flowchart of this model is shown in Figure 4, and the forecasting steps of the IBES-LSTM model are outlined as follows:
Figure 4.
Flowchart of the IBES-LSTM load forecasting model. Update the position and velocity of all individuals using Equations (14), (17) and (19).
Step 1: Introduce a dynamic adjustment strategy for the K-value into the K-means clustering algorithm to obtain the improved AK-means clustering algorithm.
Step 2: Preprocess the input data using the AK-means clustering algorithm.
Step 3: Normalize the processed data.
Step 4: Set initial parameters including population size and maximum number of iterations and initialize the population.
Step 5: Calculate the fitness function value of each individual and update the optimal solution.
Step 6: Based on the current optimal solution, update the position and velocity of all individuals using Equations (14), (17) and (19).
Step 7: Check whether the termination condition is met. If not, return to Step 5; if yes, output the optimal solution.
Step 8: Optimize the LSTM network parameters using the optimal solution and train the network with the training dataset.
Step 9: Use the trained network to perform load forecasting on the test dataset.
Step 10: Denormalize the data.
Step 11: Calculate the relevant evaluation metrics of the model.
To evaluate the accuracy of the forecasting model, five metrics are used: R2 (coefficient of determination), RE (relative error), MAE (mean absolute error), MBE (mean bias error), and RMSE (root mean square error).
R2 measures the goodness-of-fit, indicating the proportion of variance in the dependent variable explained by the independent variables. Its value ranges from 0 to 1, with higher values indicating a better fit.
RE quantifies the error magnitude between predicted and actual values relative to the actual value, offering an intuitive measure of their difference.
MAE represents the average magnitude of prediction errors. A lower MAE indicates smaller average absolute errors, reflecting higher forecasting accuracy.
MBE assesses the average bias in predictions. An MBE value near zero suggests minimal systematic bias in the model.
RMSE calculates the square root of the average squared differences between predicted and actual values. A smaller RMSE indicates greater predictive accuracy.
The calculation formulas for these metrics are as follows:
where
: the sample size;
: the actual value;
: the predicted value.
In order to validate the effectiveness of the proposed IBES-LSTM model, experiments were conducted using the same dataset [29]. Four distinct models—Backpropagation (BP), Convolutional Neural Network (CNN), LSTM, and IBES-LSTM—were utilized to predict the cooling load of the CAC system. The predicted values of each model were then compared with the actual values. The IBES-LSTM model’s parameters are enumerated in Table 4.
Table 4.
Parameters of IBES-LSTM.
In order to minimize potential randomness in the forecasting models, multiple experiments were conducted for each network model, and the average results were compared to assess the performance of each model. As illustrated in Table 5, a comparison of the mean values of the key metrics employed for the evaluation of prediction accuracy is presented across the models.
Table 5.
Relevant indicators.
Based on the comparison of R2, RE, MAE, MBE, and RMSE, the following conclusions can be drawn:
The IBES-LSTM model has an R2 value of 0.9832, exceeding 0.9 and outperforming other models, indicating high fitting accuracy.
In comparison to the BP and CNN models, the LSTM model demonstrates substantial enhancements, with its RE being 1.16% and 0.62% lower than the BP and CNN networks, respectively. Furthermore, its MAE, MBE, and RMSE are reduced by 14.14 kW, 12.97 kW, and 12.21 kW and 12.59 kW, respectively. The findings indicate that the LSTM model exhibits superior fitting capability in comparison to the other two models.
Following the optimization of the LSTM model’s parameters using the IBES algorithm, the IBES-LSTM model demonstrates further enhancements in comparison to the standard LSTM model. It is evident that there is a 0.5% decrease in RE, alongside a 5.82 kW reduction in MAE, a 1.45 kW reduction in MBE, and a 6.1 kW drop in RMSE. The enhancements have been demonstrated to engender superior prediction accuracy for the IBES-LSTM model in comparison to the standard LSTM model.
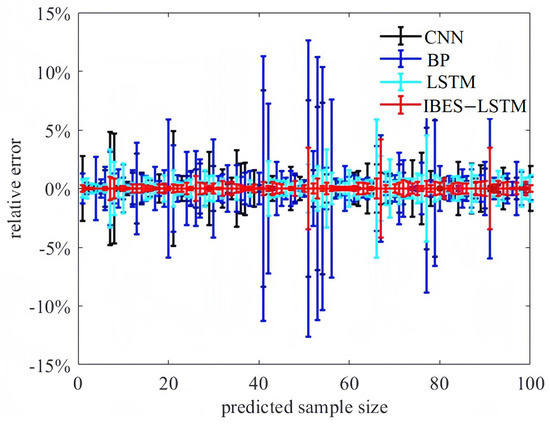
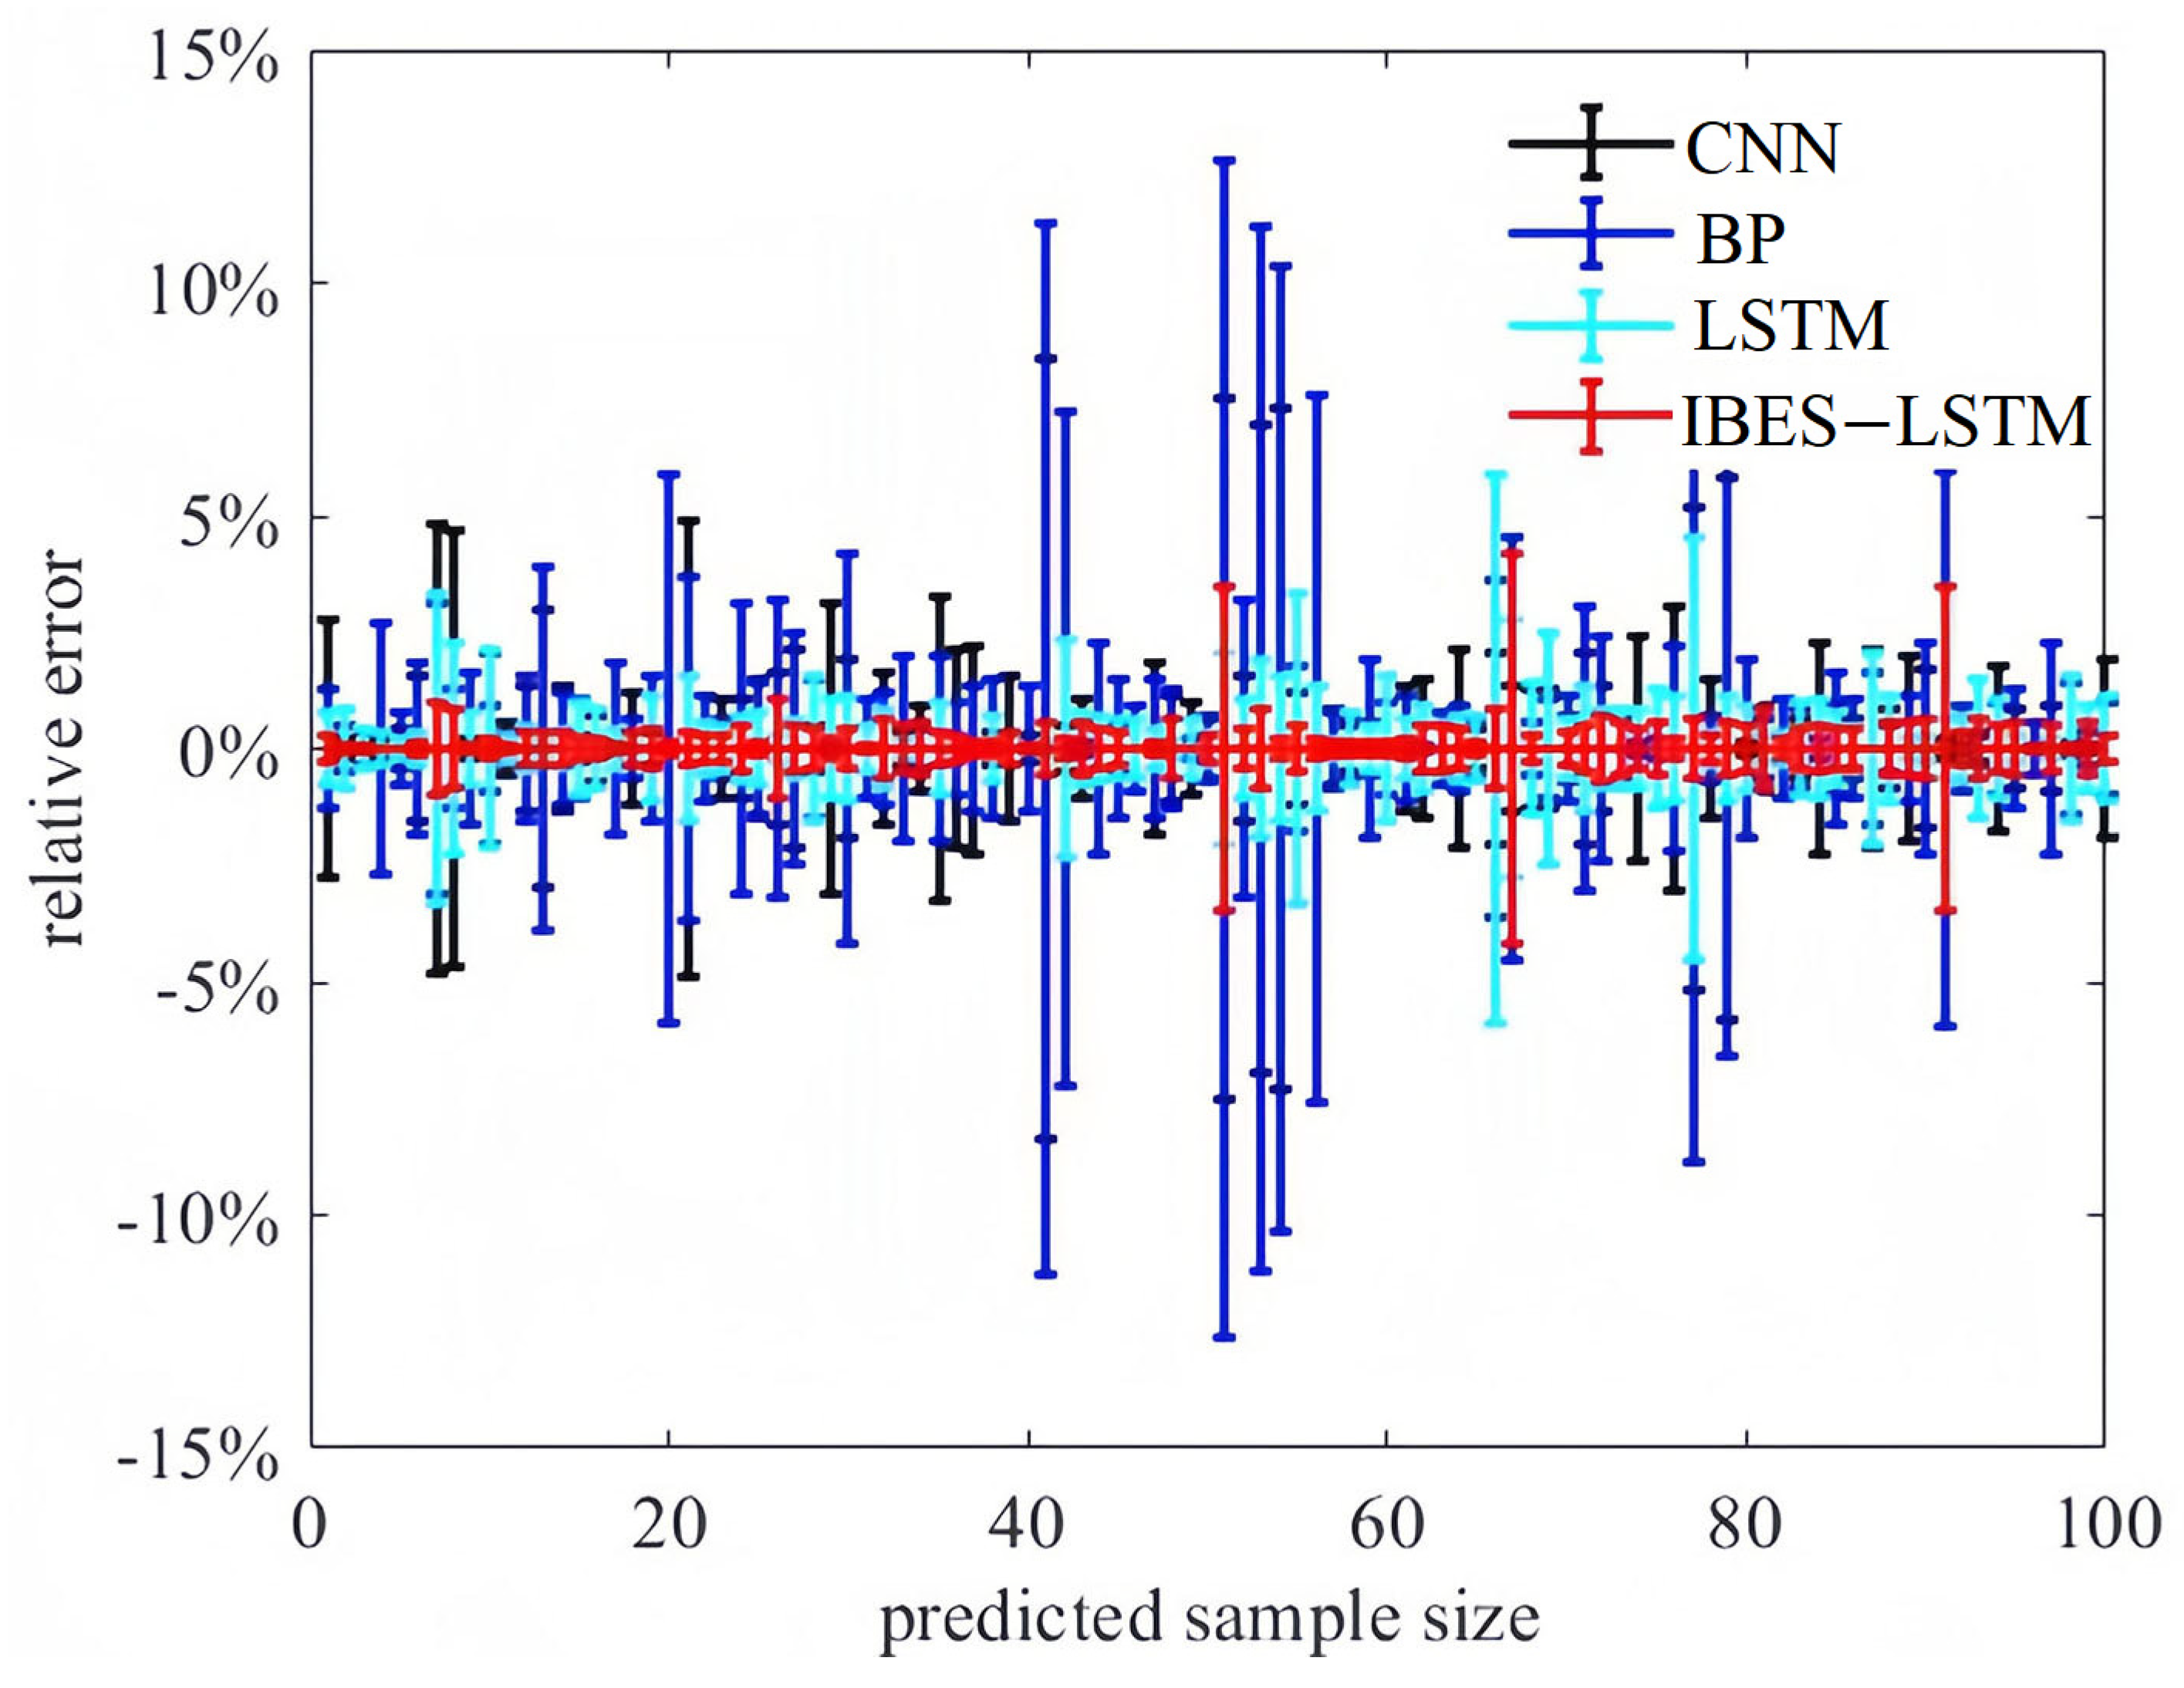
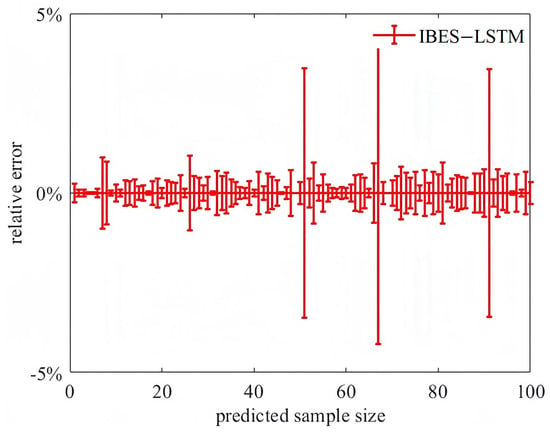
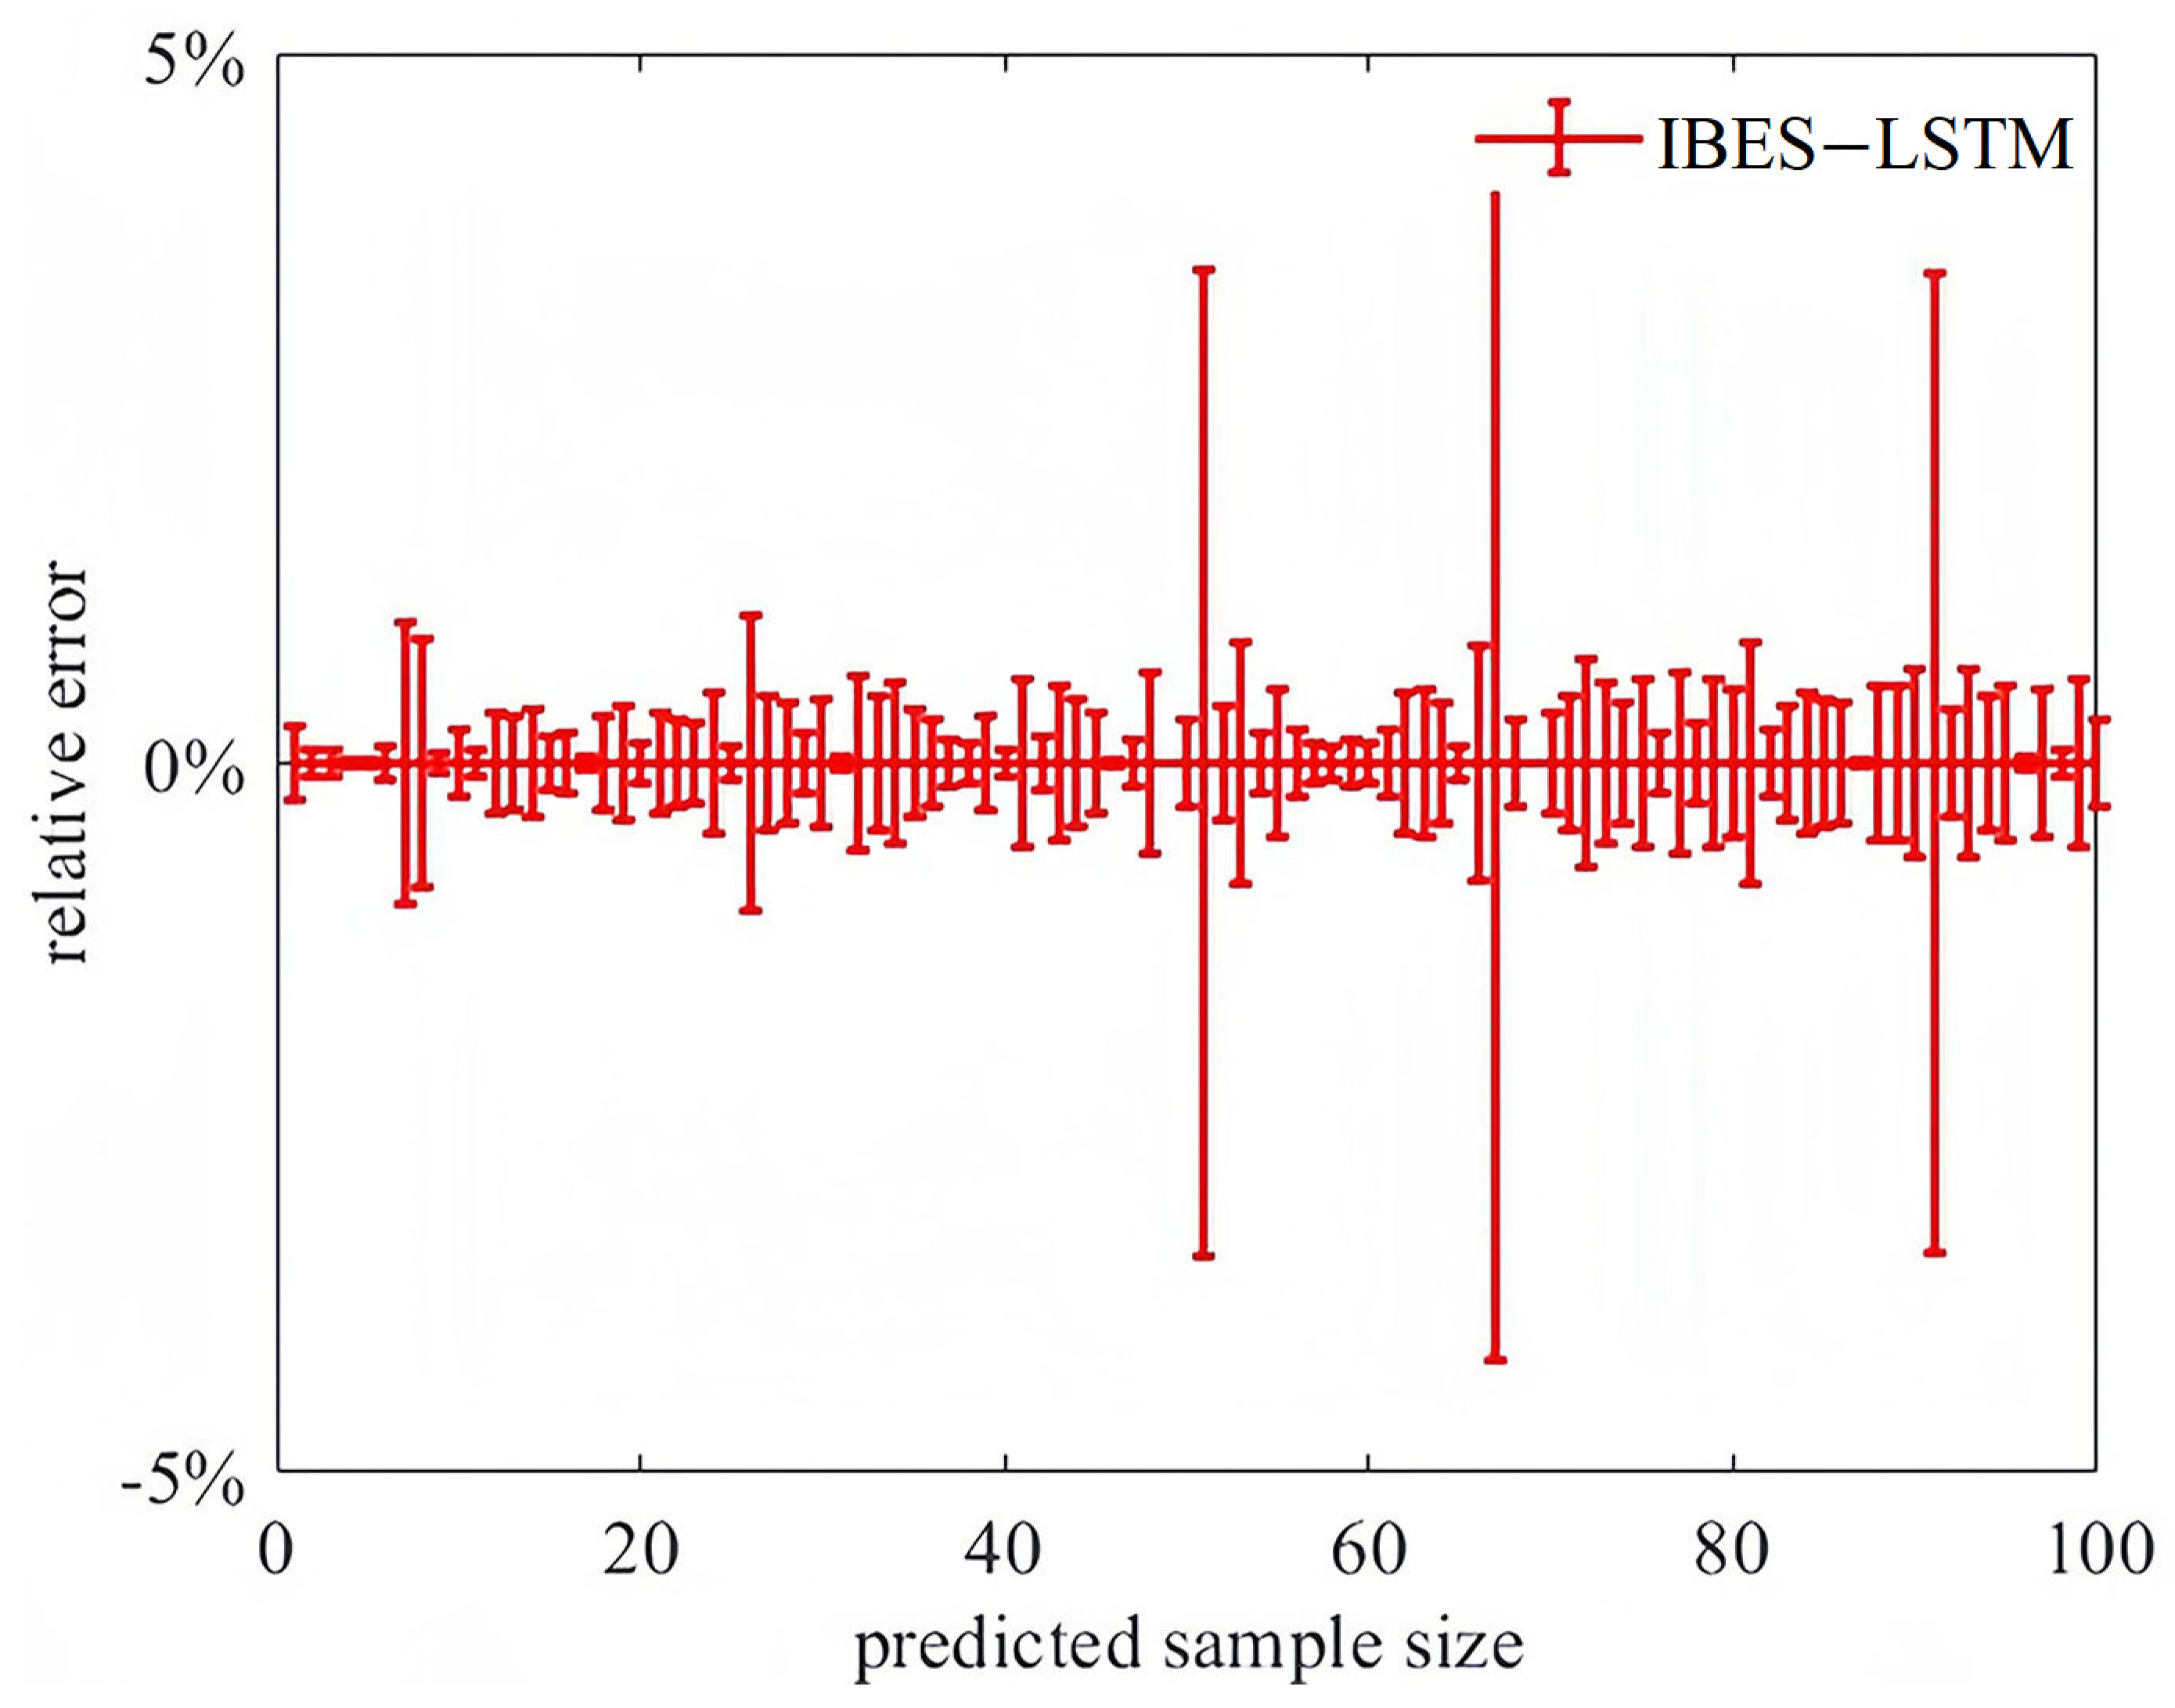
Figure 5 presents a comparison of the relative errors for the various models. The IBES-LSTM model has been shown to demonstrate a tendency to produce significantly smaller relative errors in comparison to other forecasting models. As demonstrated in Figure 6, the discrepancy between the predicted and actual values for the IBES-LSTM model remains below 5%. This finding suggests that the IBES-LSTM model provides enhanced prediction accuracy and more stable performance.
Figure 5.
Comparison of Relative Errors Among Different Models.
Figure 6.
Relative error of the IBES-LSTM model.
3.4. Energy-Saving Regulation Strategy for CAC Systems Under Time-of-Use Electricity Pricing
The power grid utilizes a system of differential time-of-use electricity pricing, with the purpose of guiding load shifting from periods of peak to valley filling. This process is undertaken with the objective of achieving grid load optimization. The power consumption of CAC systems accounts for a substantial proportion of total electricity consumption in the grid. The potential for energy savings can be realized through the optimization of their internal configuration. In the context of time-of-use electricity pricing, energy storage devices have the capacity to be charged during periods of low pricing and subsequently discharged during periods of high pricing. This facilitates the regulation of operational costs of CAC systems, whilst concurrently achieving energy-saving optimization.
3.4.1. Energy Consumption Optimization for CAC Systems
Parameters such as cooling water flow rate, chilled water flow rate, chilled water return temperature, and cooling water inlet temperature are selected as the decision variables for optimization.
- (1)
- Objective Function
The optimization of the water system aims to minimize energy consumption while satisfying the air-conditioning load requirements. The objective function can be specifically expressed as follows:
where Ptotal denotes the total energy consumption of the chiller unit.
- (2)
- Constraint Conditions
To ensure the safe and stable operation of the CAC water system, all components of the CAC water system must operate within their specified working limits during operation. Based on the equipment characteristics of the CAC water system, the optimization process must satisfy the following constraints:
- a.
- Chiller constraints
Tchws,mim, Tchws,max: the minimum and maximum flow rates of the chilled water pump;
Tcws,min, Tcws,max: the lower and upper limits of the chilled water pump frequency;
Tcwt,min, Tcwt,max: the minimum and maximum flow rates of the cooling water pump;
Qch,min, Qch,min: the allowable operating frequency range of the cooling water pump.
- b.
- Chilled Water Pump and Cooling Water Pump Constraints
fchp,min, fchp,max: the lower and upper limits of the chilled water pump frequency;
fcp,min, fcp,max: the lower and upper limits of the cooling water pump frequency.
- c.
- Cooling Tower Constraints
- d.
- Load Constraints
The cooling demand for the next time period is predicted, and the cooling output is adjusted according to the forecasted value. The constraint is formulated as follows:
where Ppre represent the predicted cooling load.
3.4.2. Energy-Saving Optimization Strategy for CAC Systems Under Time-of-Use Electricity Pricing
The fundamental principle of the energy-saving optimization strategy for CAC systems under time-of-use electricity pricing is to maximize the discharge from photovoltaic modules and energy storage batteries while minimizing grid power.
The consumption is determined by the pre-established electricity demand of the CAC system. The specific steps are outlined below:
Step 1: Determine the optimal energy consumption using the CAC system’s energy optimization model.
Step 2: Use the optimal energy consumption values from Step 1, calculated for different time periods, as the power demand on the load side. Optimize the system with the following variables: power supplied by the grid, photovoltaic modules, and energy storage batteries, along with the duration of each power supply.
Step 3: Configure the output of the photovoltaic modules and the charging/discharging schedules of the energy storage batteries according to the optimal power values and their respective duration for grid, photovoltaic, and battery supply as determined in Step 2.
As previously discussed, under time-of-use electricity pricing and with the integration of photovoltaic modules and energy storage batteries, the energy-saving optimization strategy for the CAC system primarily involves optimizing the power output and supply duration from these sources. The formulation of the objective function and constraints is therefore as follows:
(1) Objective Function
The conventional grid-only power supply mode is predicated on reliance on the grid, thus failing to capitalize on renewable energy sources and giving rise to high electricity costs during peak periods. Conversely, the photovoltaic and energy storage synergy collaboration mode prioritizes the utilization of photovoltaic power generation, thereby ensuring the satisfaction of load demand. In addition, the system optimizes energy distribution through the implementation of battery charging and discharging strategies. This, in turn, has the effect of reducing electricity costs and achieving peak shaving and valley filling. The approach entails the strategic management of photovoltaic utilization and battery operation across diverse electricity pricing periods. This strategy serves to minimize grid power purchases during periods of peak demand, while concurrently preventing the undesirable outcomes of battery overcharging or over-discharging. The efficacy of this approach is evidenced by its ability to ensure both system economy and reliability. Therefore, the objective function is formulated to minimize electricity purchase costs, based on the optimized power requirements of the air-conditioning system, as follows:
where
: the power supply at time t;
: the duration of the power supply;
: the unit time.
(2) Constraints
- a.
- Load Power Balance Constraint
To ensure normal power supply to the load, the system power must satisfy the following relationship:
where
: the power directly supplied by photovoltaics at time t which is influenced by solar irradiancer;
: the power supplied by battery discharge at time t.
: the power supply at time t;
: the power used to charge the battery at time t;
- b.
- Photovoltaic Power Constraints
: the maximum available power from photovoltaic generation at time t;
: the power used to charge the battery at time t.
- c.
- Battery Charging/Discharging Constraints
: the battery charging power at time t;
: the maximum charging/discharging power of the battery.
- d.
- Battery State of Charge (SOC) Constraints
: the State of Charge of the battery at time ;
and : the minimum and maximum allowable states of charge, respectively.
- e.
- Grid Power Purchase Constraints
4. Experimental Verification and Analysis
A case study was conducted on the CAC water system of a hotel in a southern Chinese city. The system specifications are as follows: the chiller has a rated cooling capacity of 1974 kW and a rated power of 840 kW; both the chilled water pump and cooling water pump have a rated power of 14 kW; and the cooling tower has a rated power of 24 kW.
4.1. Energy Consumption Optimization Experiment Analysis
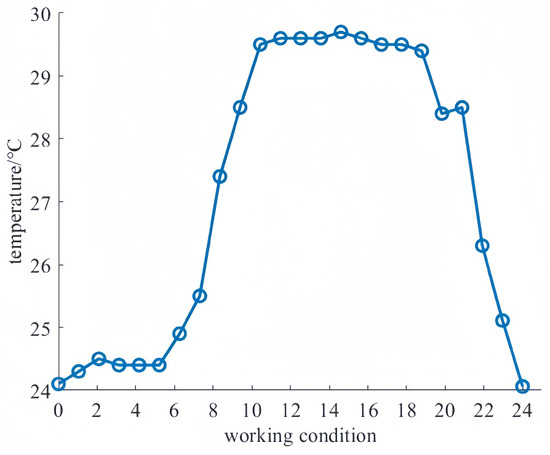
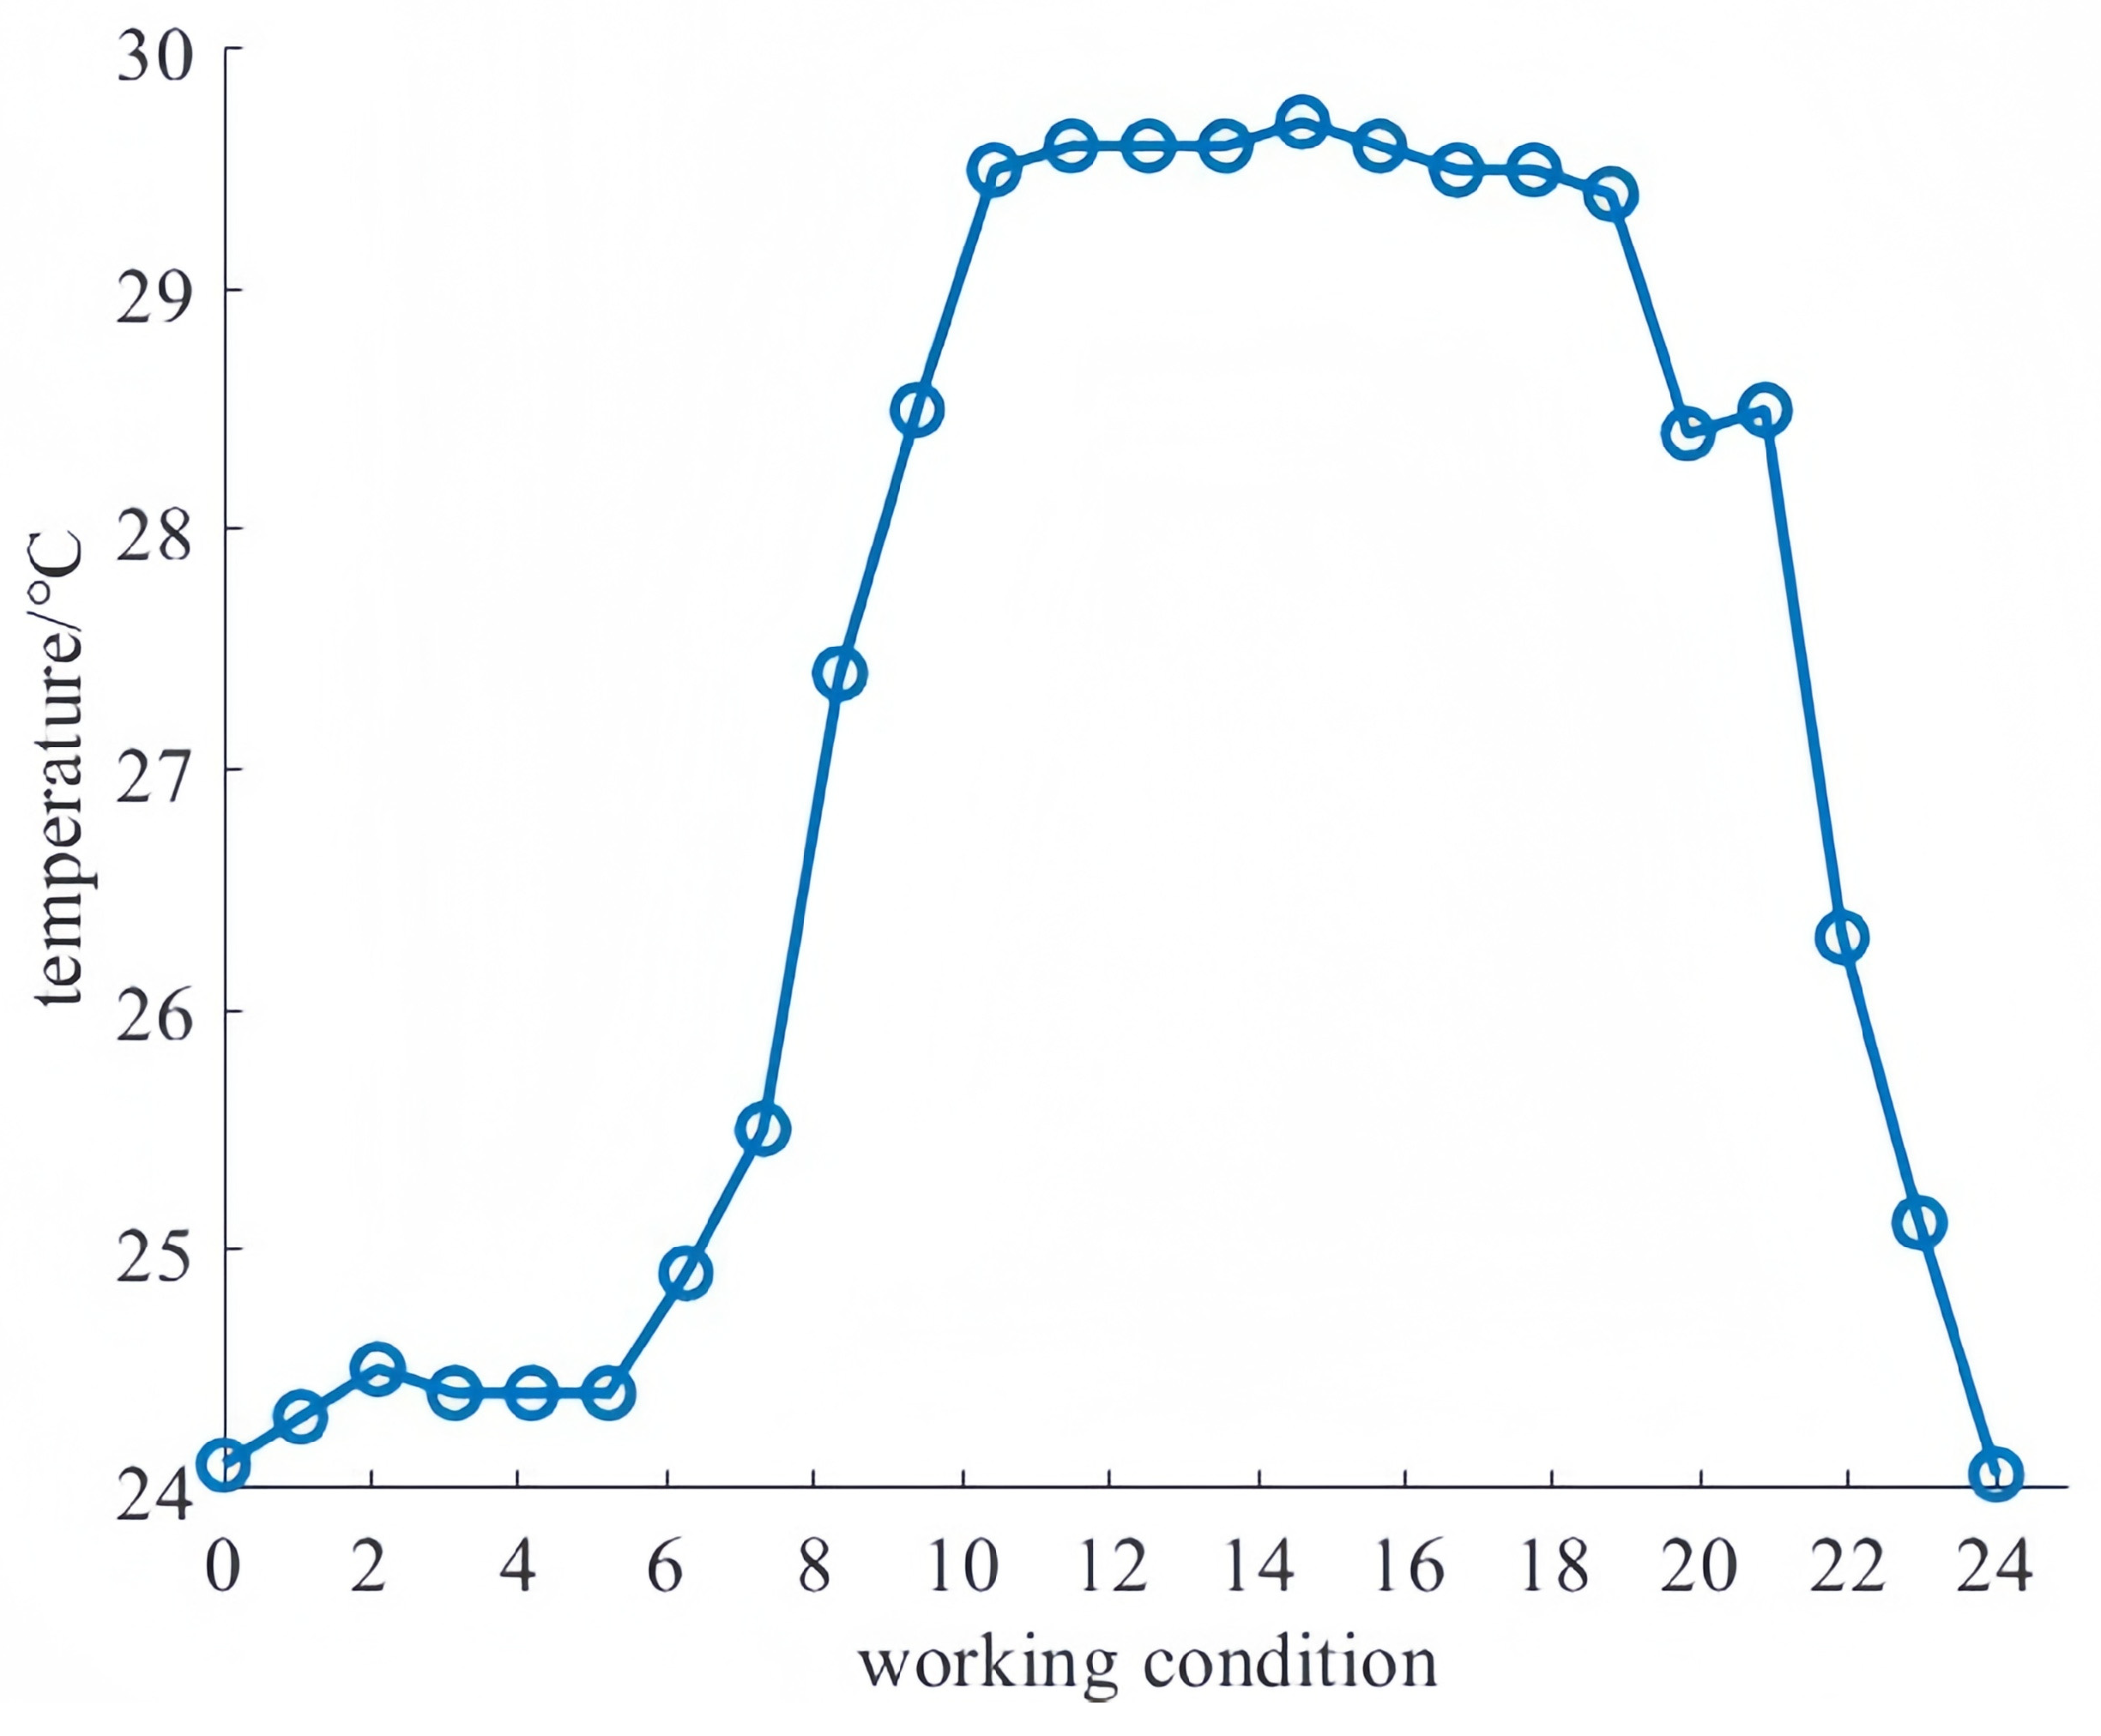
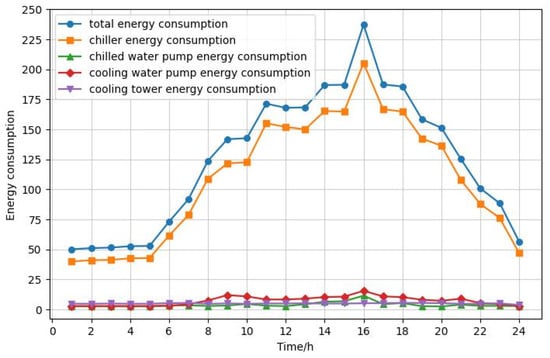
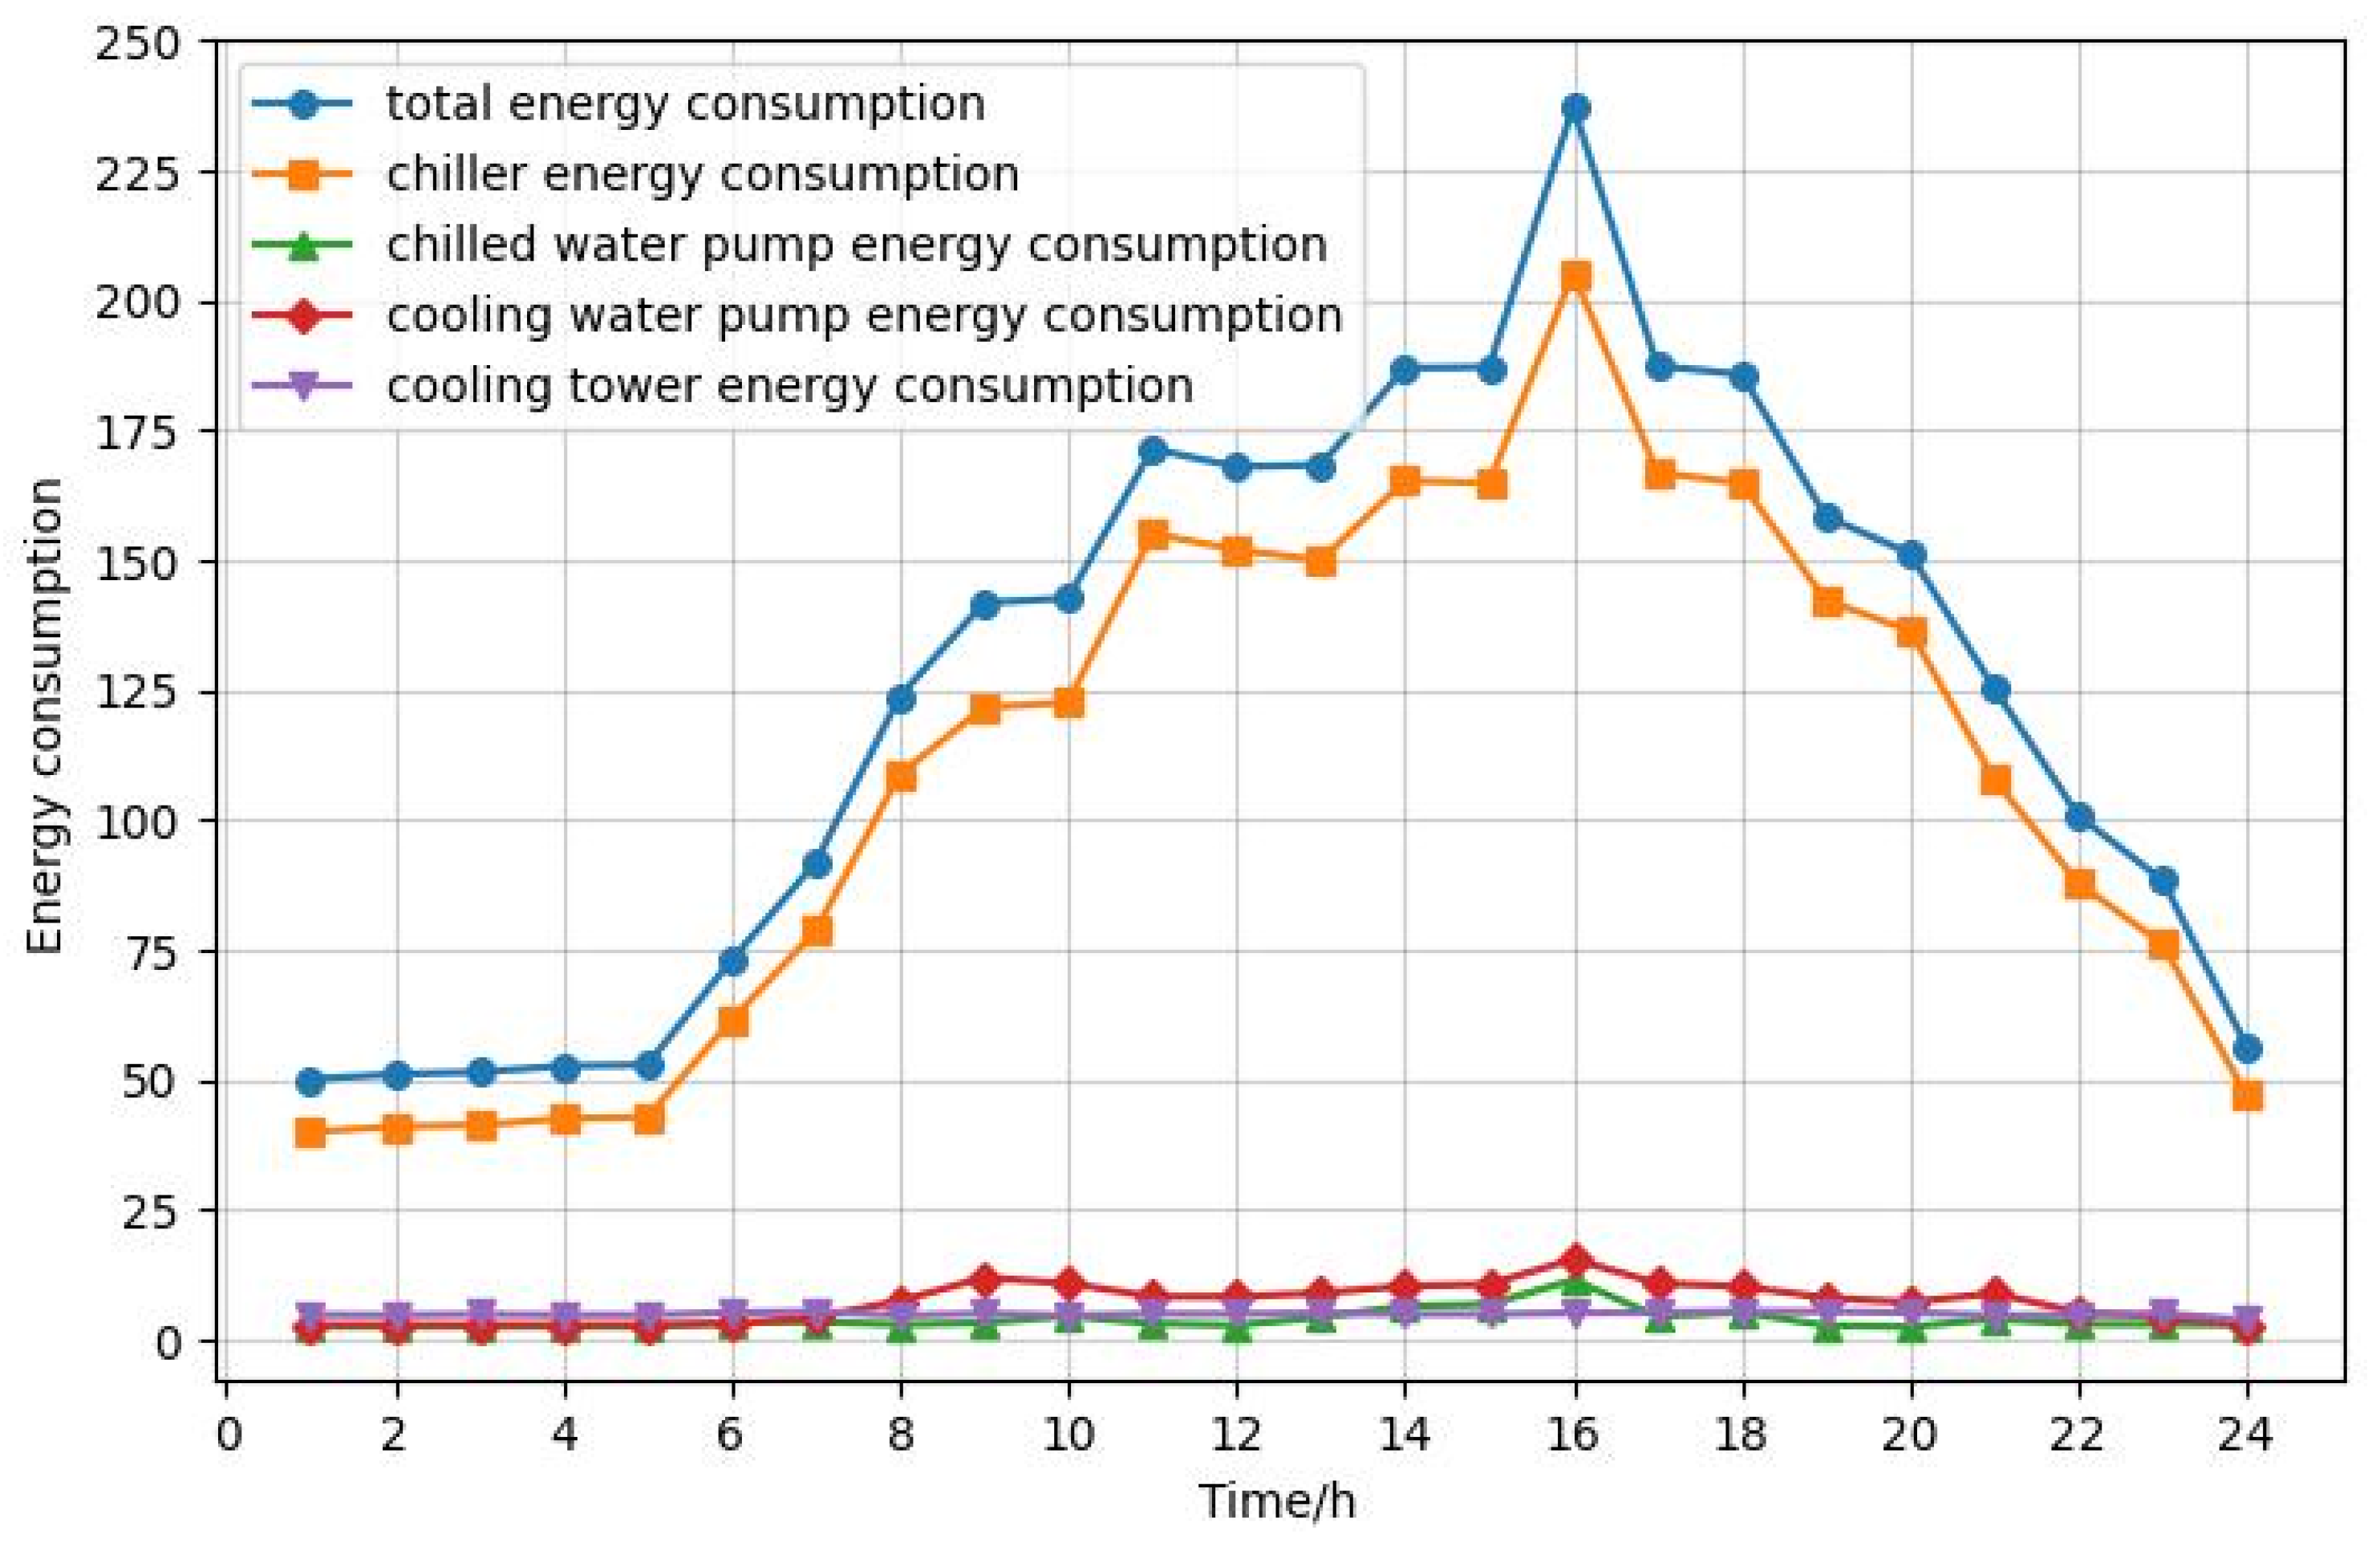
In order to validate the energy-saving effect of the optimized system, the optimized energy consumption of the CAC water system was compared with its actual historical energy consumption data. The selected historical outdoor weather conditions are presented in Figure 7. As illustrated in Figure 8, the energy consumption of individual components and the total system consumption are displayed under different operating conditions prior to optimization. As demonstrated in Figure 8, the chiller unit constitutes the primary component of the system responsible for energy consumption, representing the largest proportion of electricity usage. Conversely, the energy consumption of the chilled water pump, cooling water pump, and cooling tower is comparatively low, contributing marginally to the overall energy use. The variation in chiller energy consumption closely follows the trend in total system energy consumption.
Figure 7.
Outdoor weather conditions.
Figure 8.
Energy consumption breakdown by component before optimization.
In order to mitigate the impact of algorithmic randomness, 30 independent trials were conducted for each operating condition, and the optimization results were subsequently averaged. The IBES algorithm was compared with the PSO algorithm, the standard BES algorithm, and the hybrid strategy improved Whale Optimization Algorithm (MSWOA) from reference [26] for the optimization of energy consumption under various operating conditions. The parameter settings for the algorithms are provided in Table 6, and the comparative optimization results for the four algorithms are shown in Table 7, where the bolded values represent the results optimized by the IBES algorithm.
Table 6.
Algorithm parameter settings.
Table 7.
Comparison of energy consumption between PSO, MSWOA, BES, and IBES algorithms.
As demonstrated in Table 7, all four algorithms attained reductions in energy consumption in comparison to the actual energy usage. However, the IBES algorithm demonstrated a superior capacity for optimization. In comparison with the PSO algorithm, the IBES algorithm has been shown to achieve additional energy savings ranging from 0.84 kW to 10.79 kW across a range of operating conditions. When evaluated in comparison with the MSWOA algorithm, the IBES algorithm yielded supplementary energy savings ranging from 0.23 kW to 10.68 kW. In a similar vein, the IBES algorithm was found to engender further energy savings ranging from 0.26 kW to 4.37 kW when compared to the standard BES algorithm. The findings of this study demonstrate that the IBES algorithm delivers the most effective energy-saving performance.
The optimization model for central air-conditioning systems exhibits high-dimensional, nonlinear, and nonconvex characteristics, leading to multiple local optima for the objective function. The discrepancies in the “optimal” results obtained by different algorithms in Table 7 stem precisely from this—each algorithm converges to the local optimum accessible along its search path. The proposed IBES algorithm enhances global exploration capabilities by incorporating strategies such as Levy flight. This enables it to more effectively escape local optima and converge toward regions with lower costs, demonstrating its superiority over other algorithms.
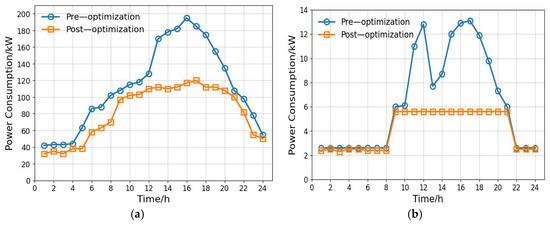
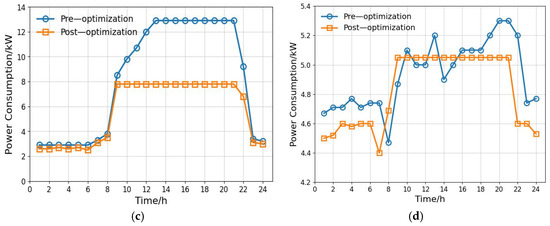
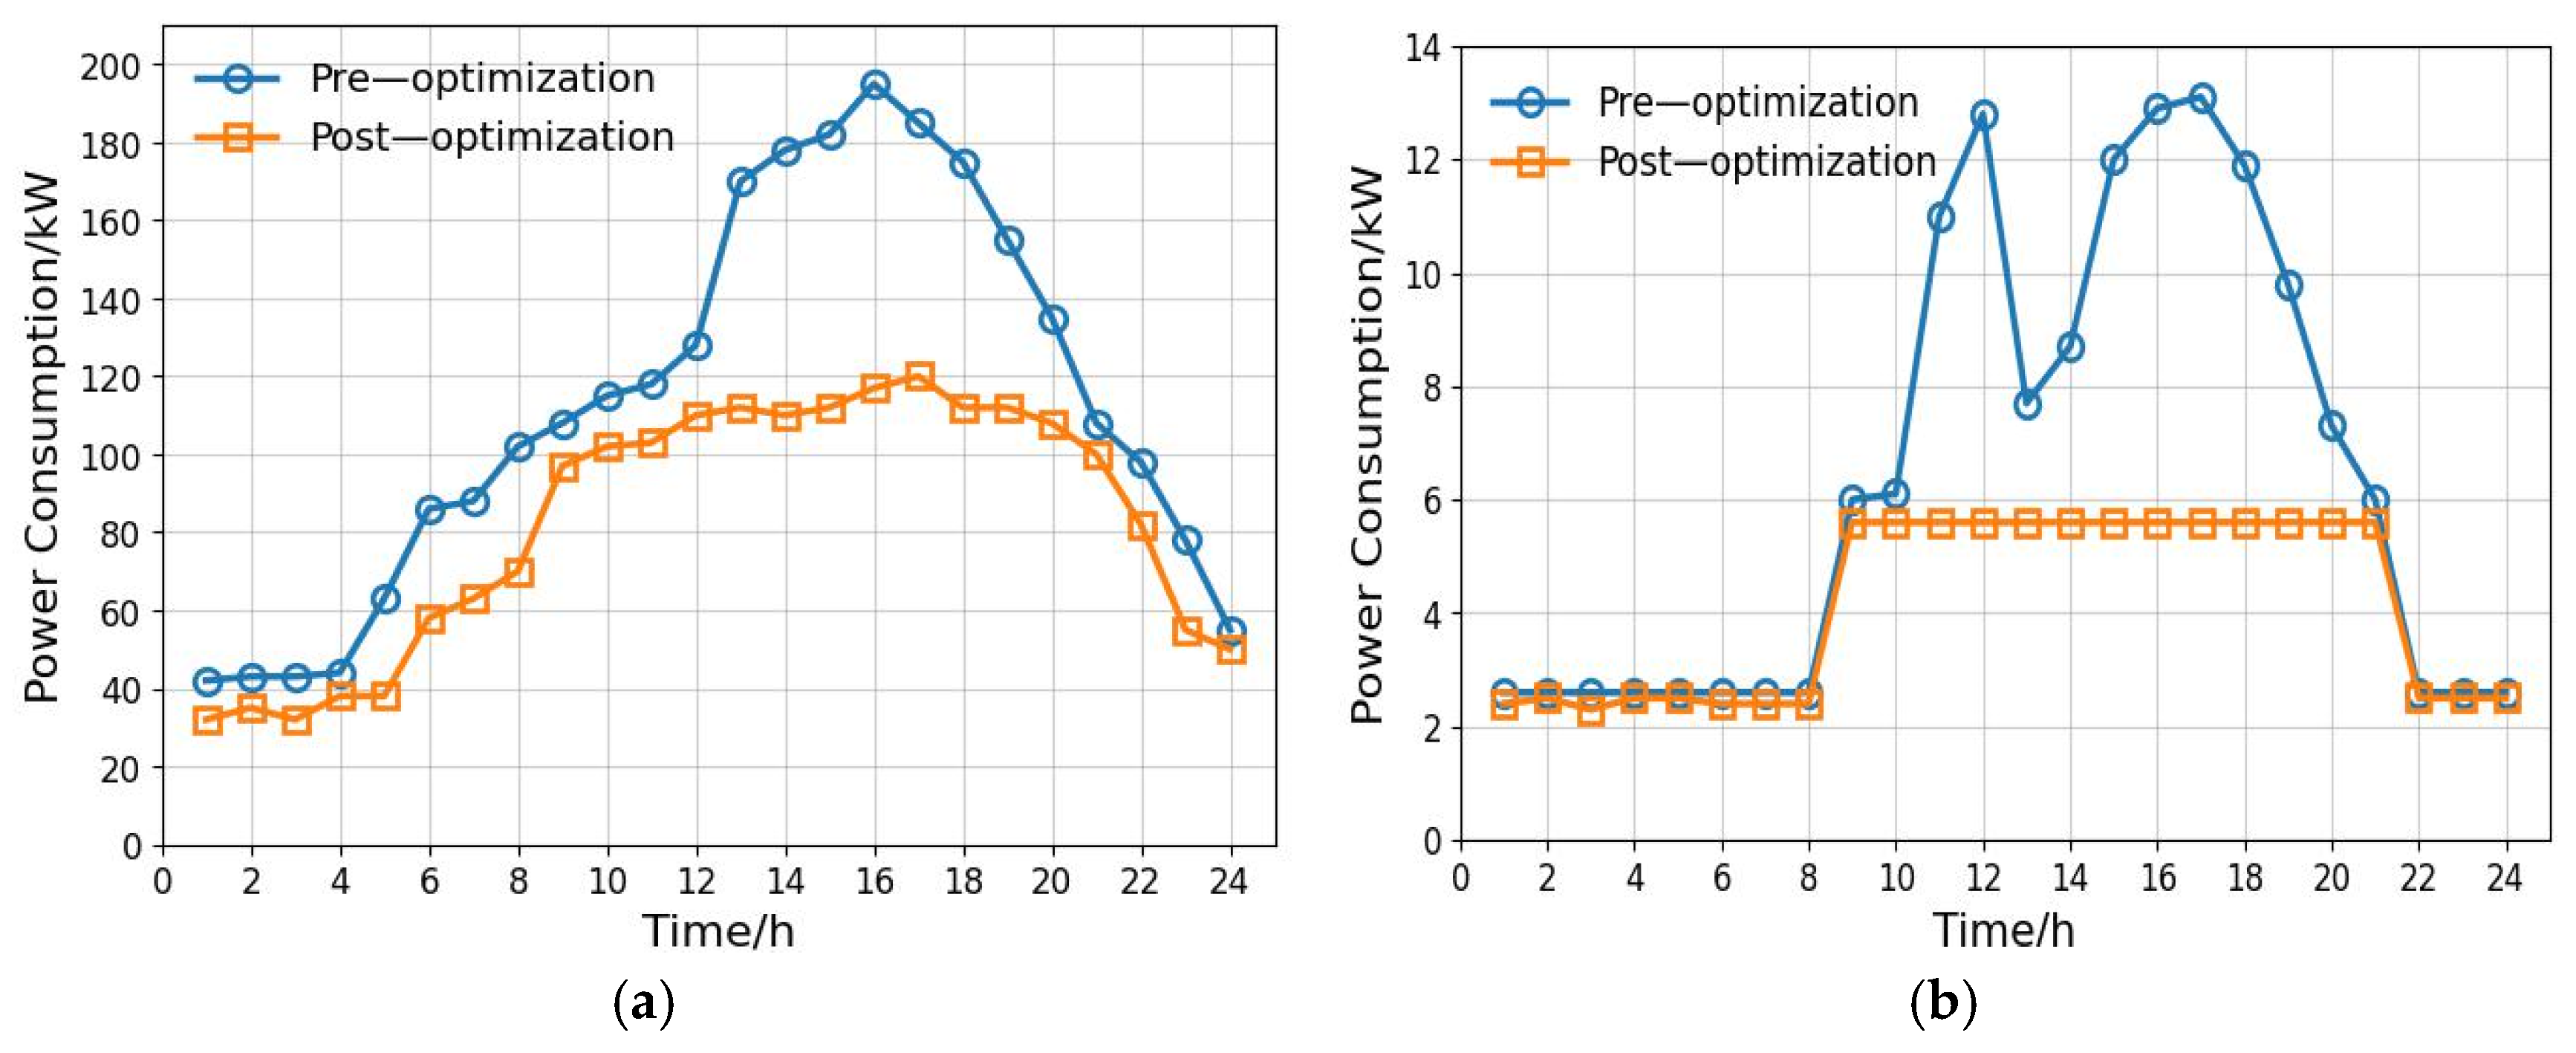
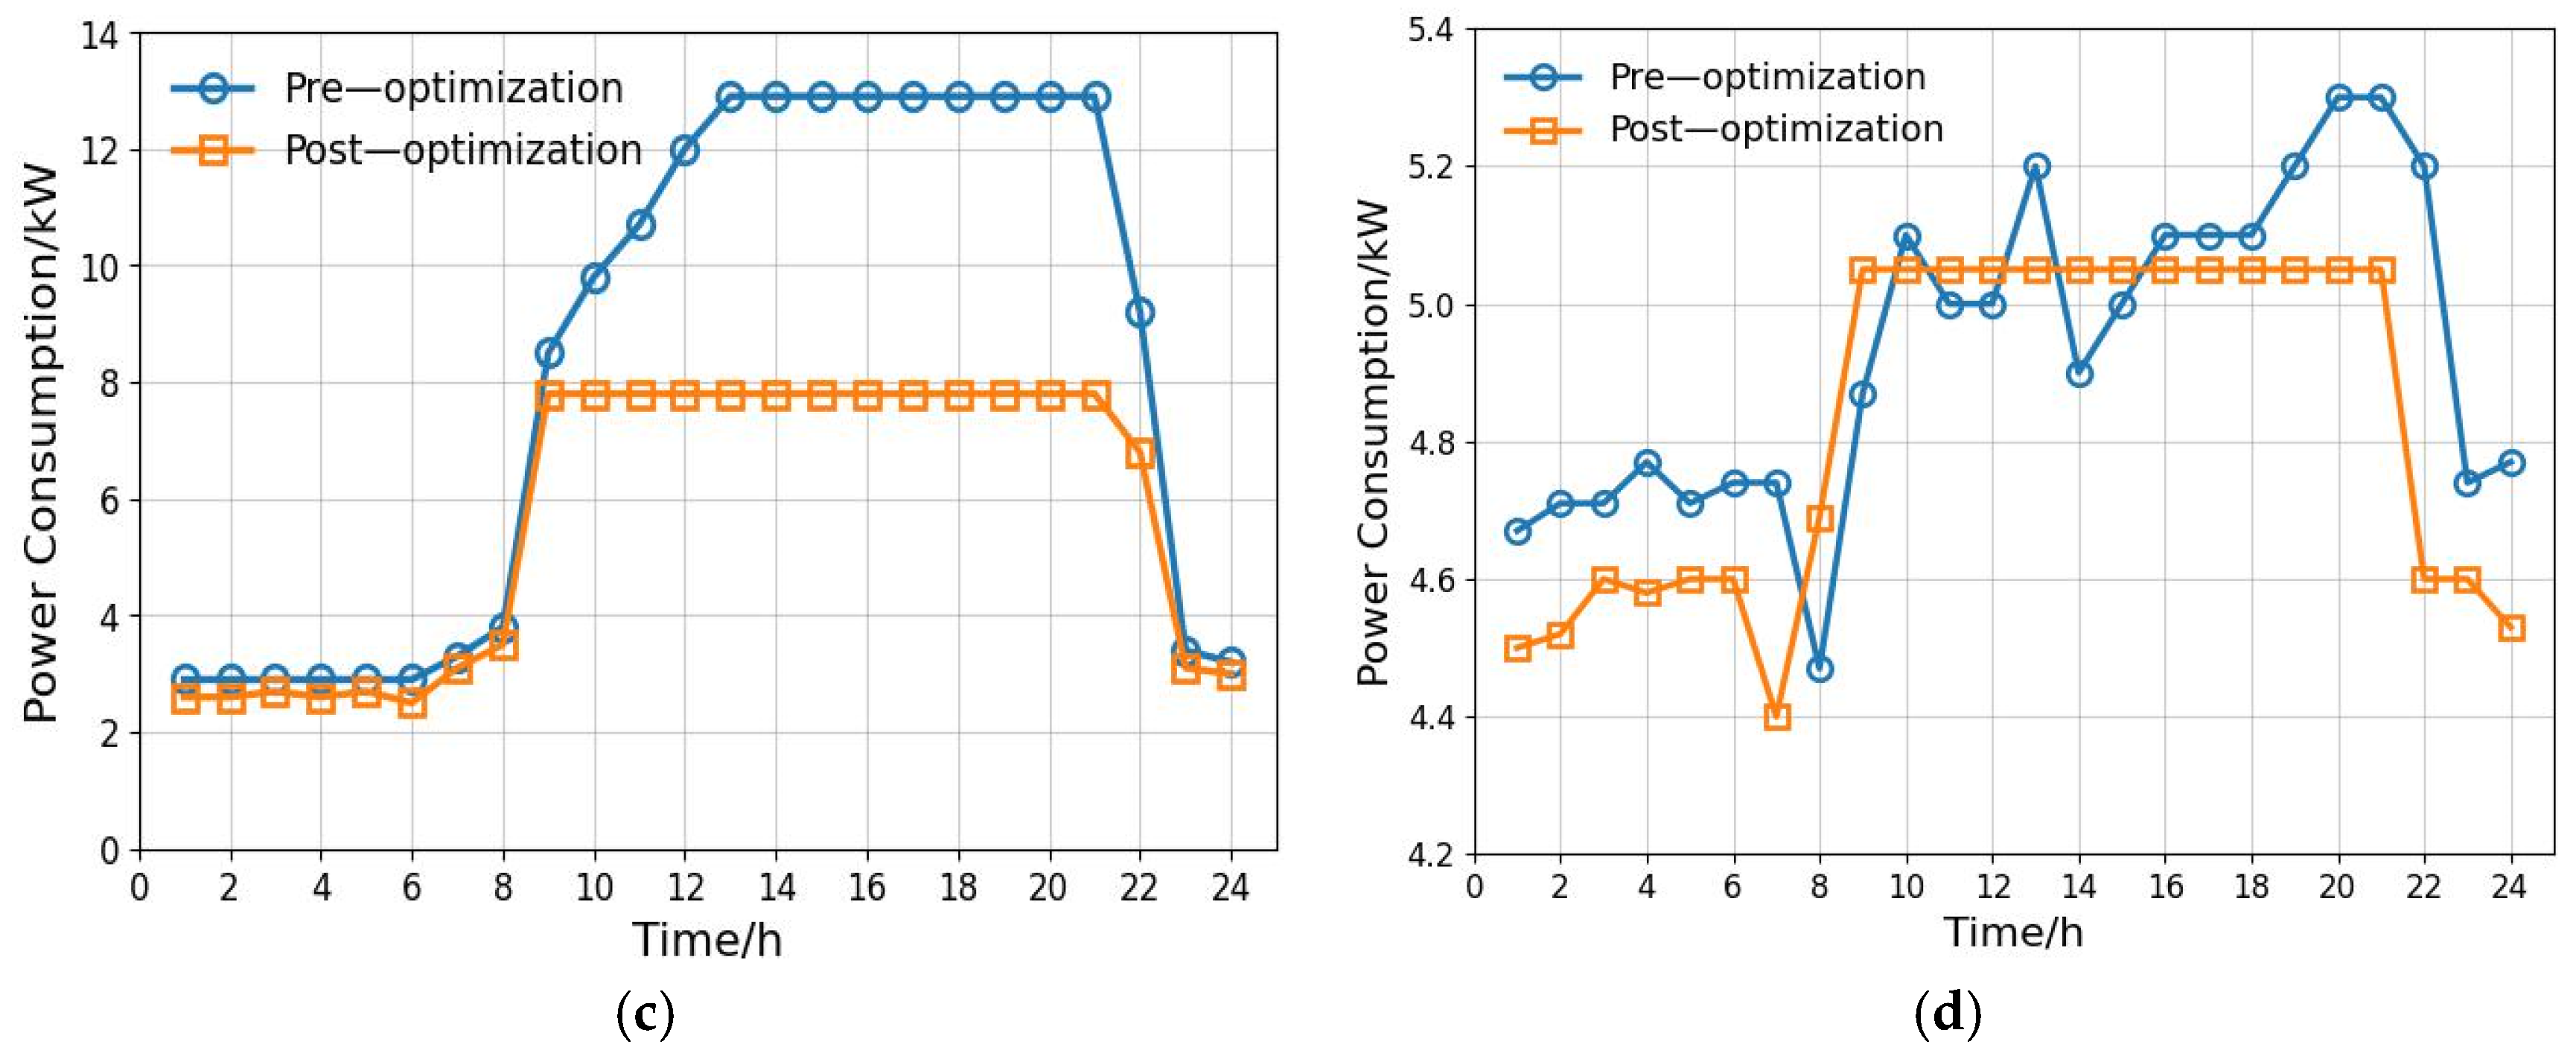
In order to validate the reduction in optimized system energy consumption, the optimized energy consumption of each component under different operating conditions is compared with the actual energy consumption, as illustrated in Figure 9. As demonstrated in Figure 9a, the energy consumption of the chiller units following optimization has been reduced across a range of operating conditions, signifying a substantial enhancement in energy efficiency for the chillers. As illustrated in Figure 9b,c, the chilled water and cooling water pumps function at a minimal frequency during nocturnal hours. This leads to negligible alterations in their energy consumption, both prior to and following the implementation of optimization strategies. However, during the daytime, their optimized energy consumption is notably lower than before, and the energy consumption variation trend remains relatively stable, with no significant fluctuations, promoting stable pump operation. With regard to Figure 9d, it is evident that the energy consumption of the cooling towers following optimization exceeds that which was previously observed under specific operating conditions. However, given that cooling towers account for a negligible proportion of total energy consumption, and in consideration of the data presented in Table 7, it can be deduced that the overall energy consumption of the CAC water system persists in demonstrating a downward trend.
Figure 9.
Comparative analysis of energy consumption optimization by component: (a) comparison of chiller energy consumption; (b) comparison of chilled water pump energy consumption; (c) comparison of cooling water pump energy consumption; (d) comparison of cooling tower energy consumption.
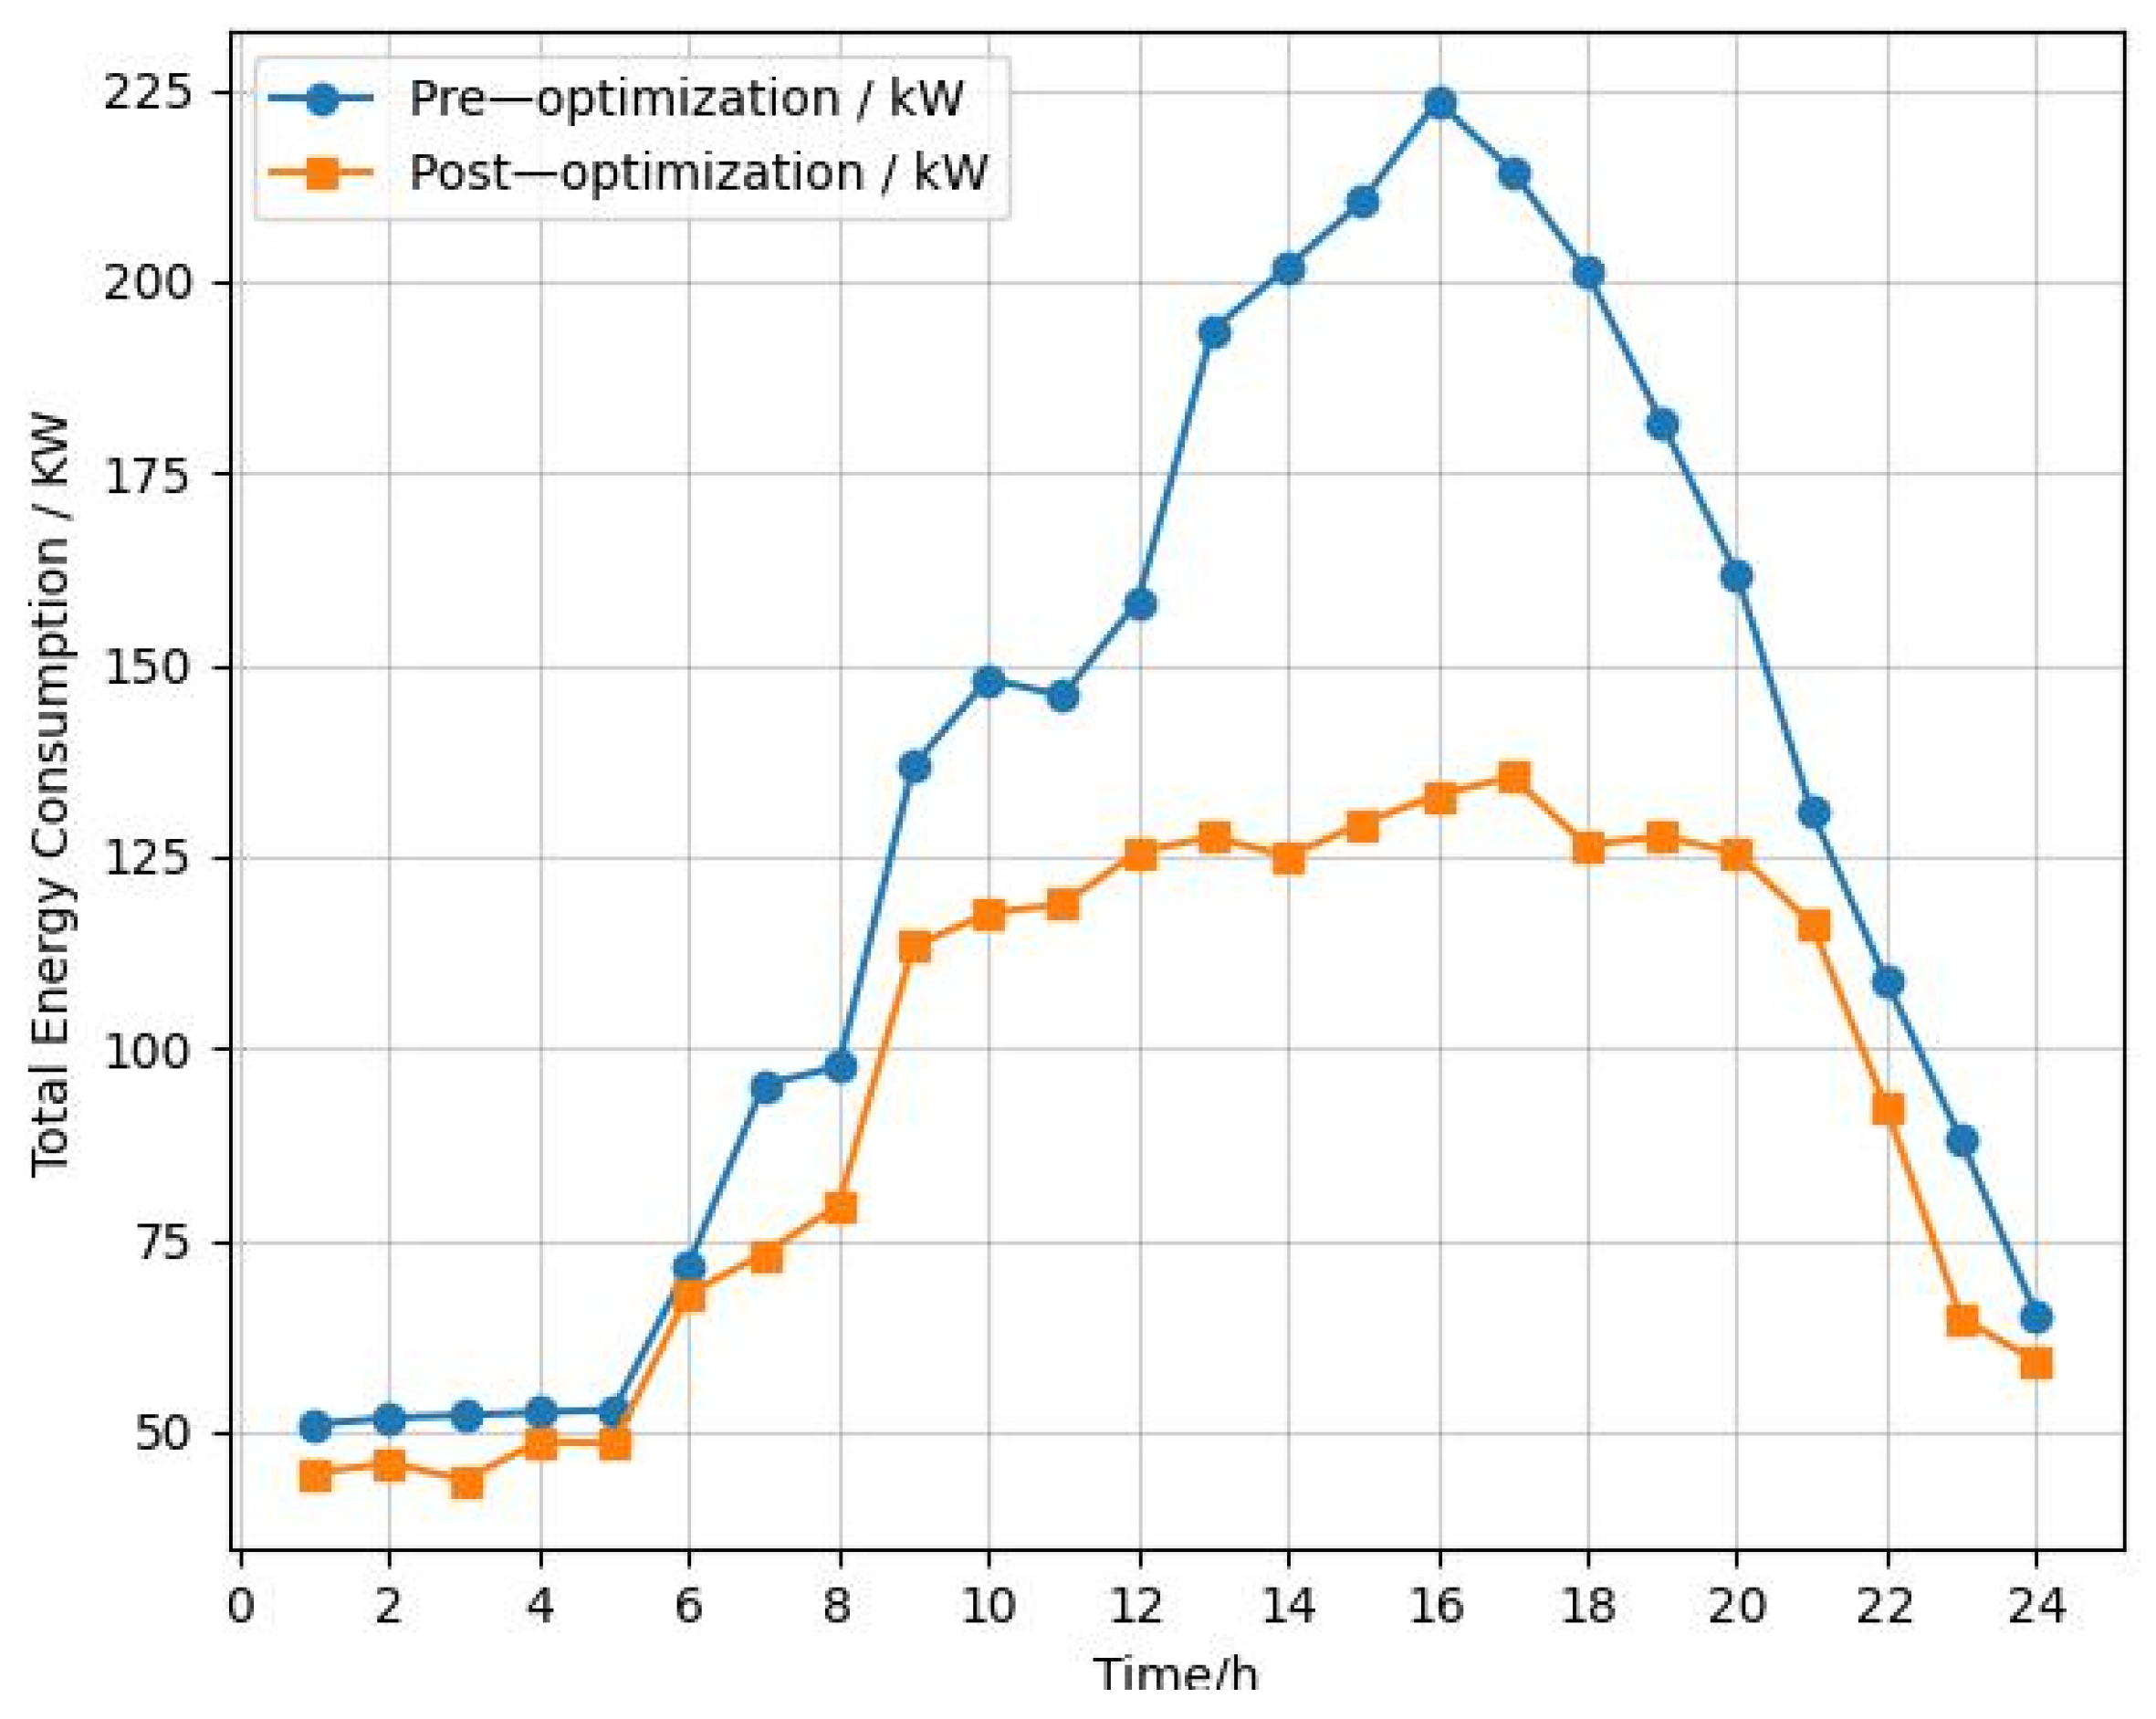
As illustrated in Table 8, the data indicates the percentage reduction in total energy consumption following optimization across a range of operating conditions. As demonstrated in Table 8, the optimized energy consumption of the water system is reduced under all operating conditions. During nocturnal hours, the discrepancy between the energy consumption of the optimized and pre-optimized systems is relatively negligible, although a decline is nevertheless evident. Conversely, during daylight hours, when energy demand typically rises, the optimized energy consumption exhibits a substantial decline. The overall evaluation of the water system indicates an average energy reduction of 26.04%, as determined by the comparison of total energy consumption metrics prior to and following the implementation of optimization strategies.
Table 8.
Performance of energy consumption optimization under various conditions.
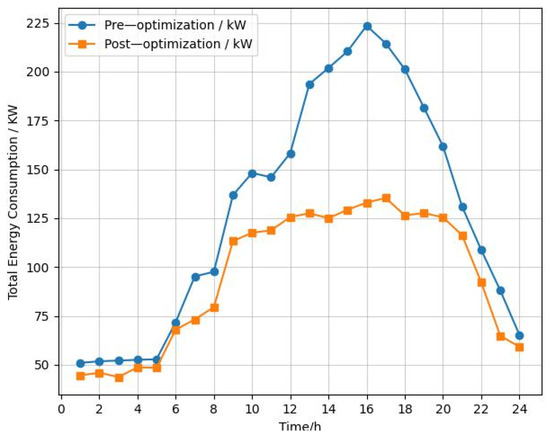
As illustrated in Figure 10, a comparison is made between the total energy consumption of the CAC water system before and after optimization. The findings consistently demonstrate a reduction in energy consumption following optimization. The findings indicate that the integration of load forecasting with the IBES algorithm leads to a substantial reduction in the overall operational energy consumption of the CAC water system, thereby providing considerable energy-saving benefits. Consequently, this research method has been proven to be highly effective in enhancing the energy efficiency of CAC water systems.
Figure 10.
Comparison of total energy consumption.
4.2. Energy Consumption Optimization Considering Time-of-Use Electricity Pricing
It is evident that energy optimization, in isolation, is incapable of achieving a complete reduction in operational costs. This is primarily due to the time-of-use electricity pricing mechanism of the power grid, which engenders substantial variations in electricity costs for equivalent energy consumption across diverse periods. Consequently, this study proposes a novel time-of-use electricity pricing optimization strategy. A model of energy consumption has been developed, with a particular focus on the chiller, chilled water pump, cooling water pump, and cooling tower. In conjunction with this model, a load distribution strategy has been formulated, based on time-of-use electricity pricing. The strategy integrates photovoltaic power generation, battery scheduling, and grid and air-conditioning power management with the objective of achieving peak shaving, valley filling, reducing grid power purchases during high-price periods, and enabling cost-effective operation of the CAC system. The specific steps are outlined below:
First, the CAC water system with optimized energy consumption is powered by a combination of photovoltaic generation, battery storage, and grid power.
Second, the power supply structure is adjusted according to the grid’s time-of-use pricing: during low-price periods, the grid charges the battery; during high-price periods, photovoltaic power and battery discharge are prioritized to minimize grid power purchases.
Finally, based on the power dispatch results, the low-cost operation of the CAC water system is achieved.
4.2.1. Data Configuration
The photovoltaic power generation data utilized in this study were obtained from the Global Solar Atlas platform [30]. Utilizing local meteorological data and the physical parameters of photovoltaic modules, this platform employs a photovoltaic power forecasting model to simulate and calculate power generation output across different time periods, with the average hourly generation presented in Table 9. The data obtained are then utilized to assess the power generation capacity of the photovoltaic system under various weather conditions, serving as input for photovoltaic-battery dispatch optimization. This approach is adopted to ensure the reliability and practical applicability of the research findings.
Table 9.
Average hourly photovoltaic power generation. Total photovoltaic power generation [kWh].
The time-of-use pricing data presented in this study were obtained from the actual tariff policy published by the municipal power utility department. The data set encompasses electricity tariffs designated for peak, flat, and valley periods, with the precise standards delineated in Table 10. The configuration of battery data is summarized in Table 11.
Table 10.
Time-of-use electricity price floating ratios.
Table 11.
Battery system configuration.
4.2.2. Simulation Results and Analysis
The conventional grid-only power supply mode is predicated on the utilization of the grid for uninterrupted operation, thereby ensuring the stable functioning of the CAC system. However, the overall operating cost is relatively high due to the impact of elevated electricity prices during peak periods. Recent progressions in novel energy technologies have engendered the integration of photovoltaic power generation and energy storage systems, thereby presenting novel opportunities for the reduction of electricity costs. The proposed strategy is an optimization strategy that incorporates time-of-use electricity pricing, with the aim of enabling the CAC system to operate in a cost-effective manner. A comparative experiment was designed to assess the impact of photovoltaic power, energy storage, and the time-of-use electricity pricing optimization strategy on the electricity consumption of the CAC system.
- (1)
- Grid-Only Power Supply Mode: The air-conditioning load is entirely supplied by the grid, without considering the contribution of photovoltaic generation or the energy storage system.
- (2)
- Photovoltaic and Energy Storage Collaboration Mode: The utilization of photovoltaic power generation is prioritized. The energy storage system is dispatched according to time-of-use electricity pricing, with charging occurring during off-peak periods and discharging during peak periods. This reduces electricity purchases during high-price hours, thereby lowering overall electricity costs.
- (3)
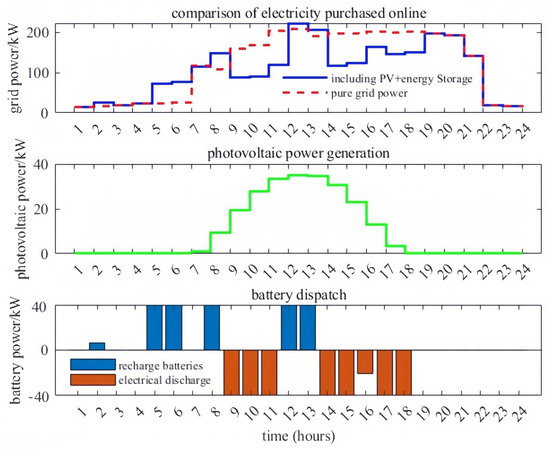
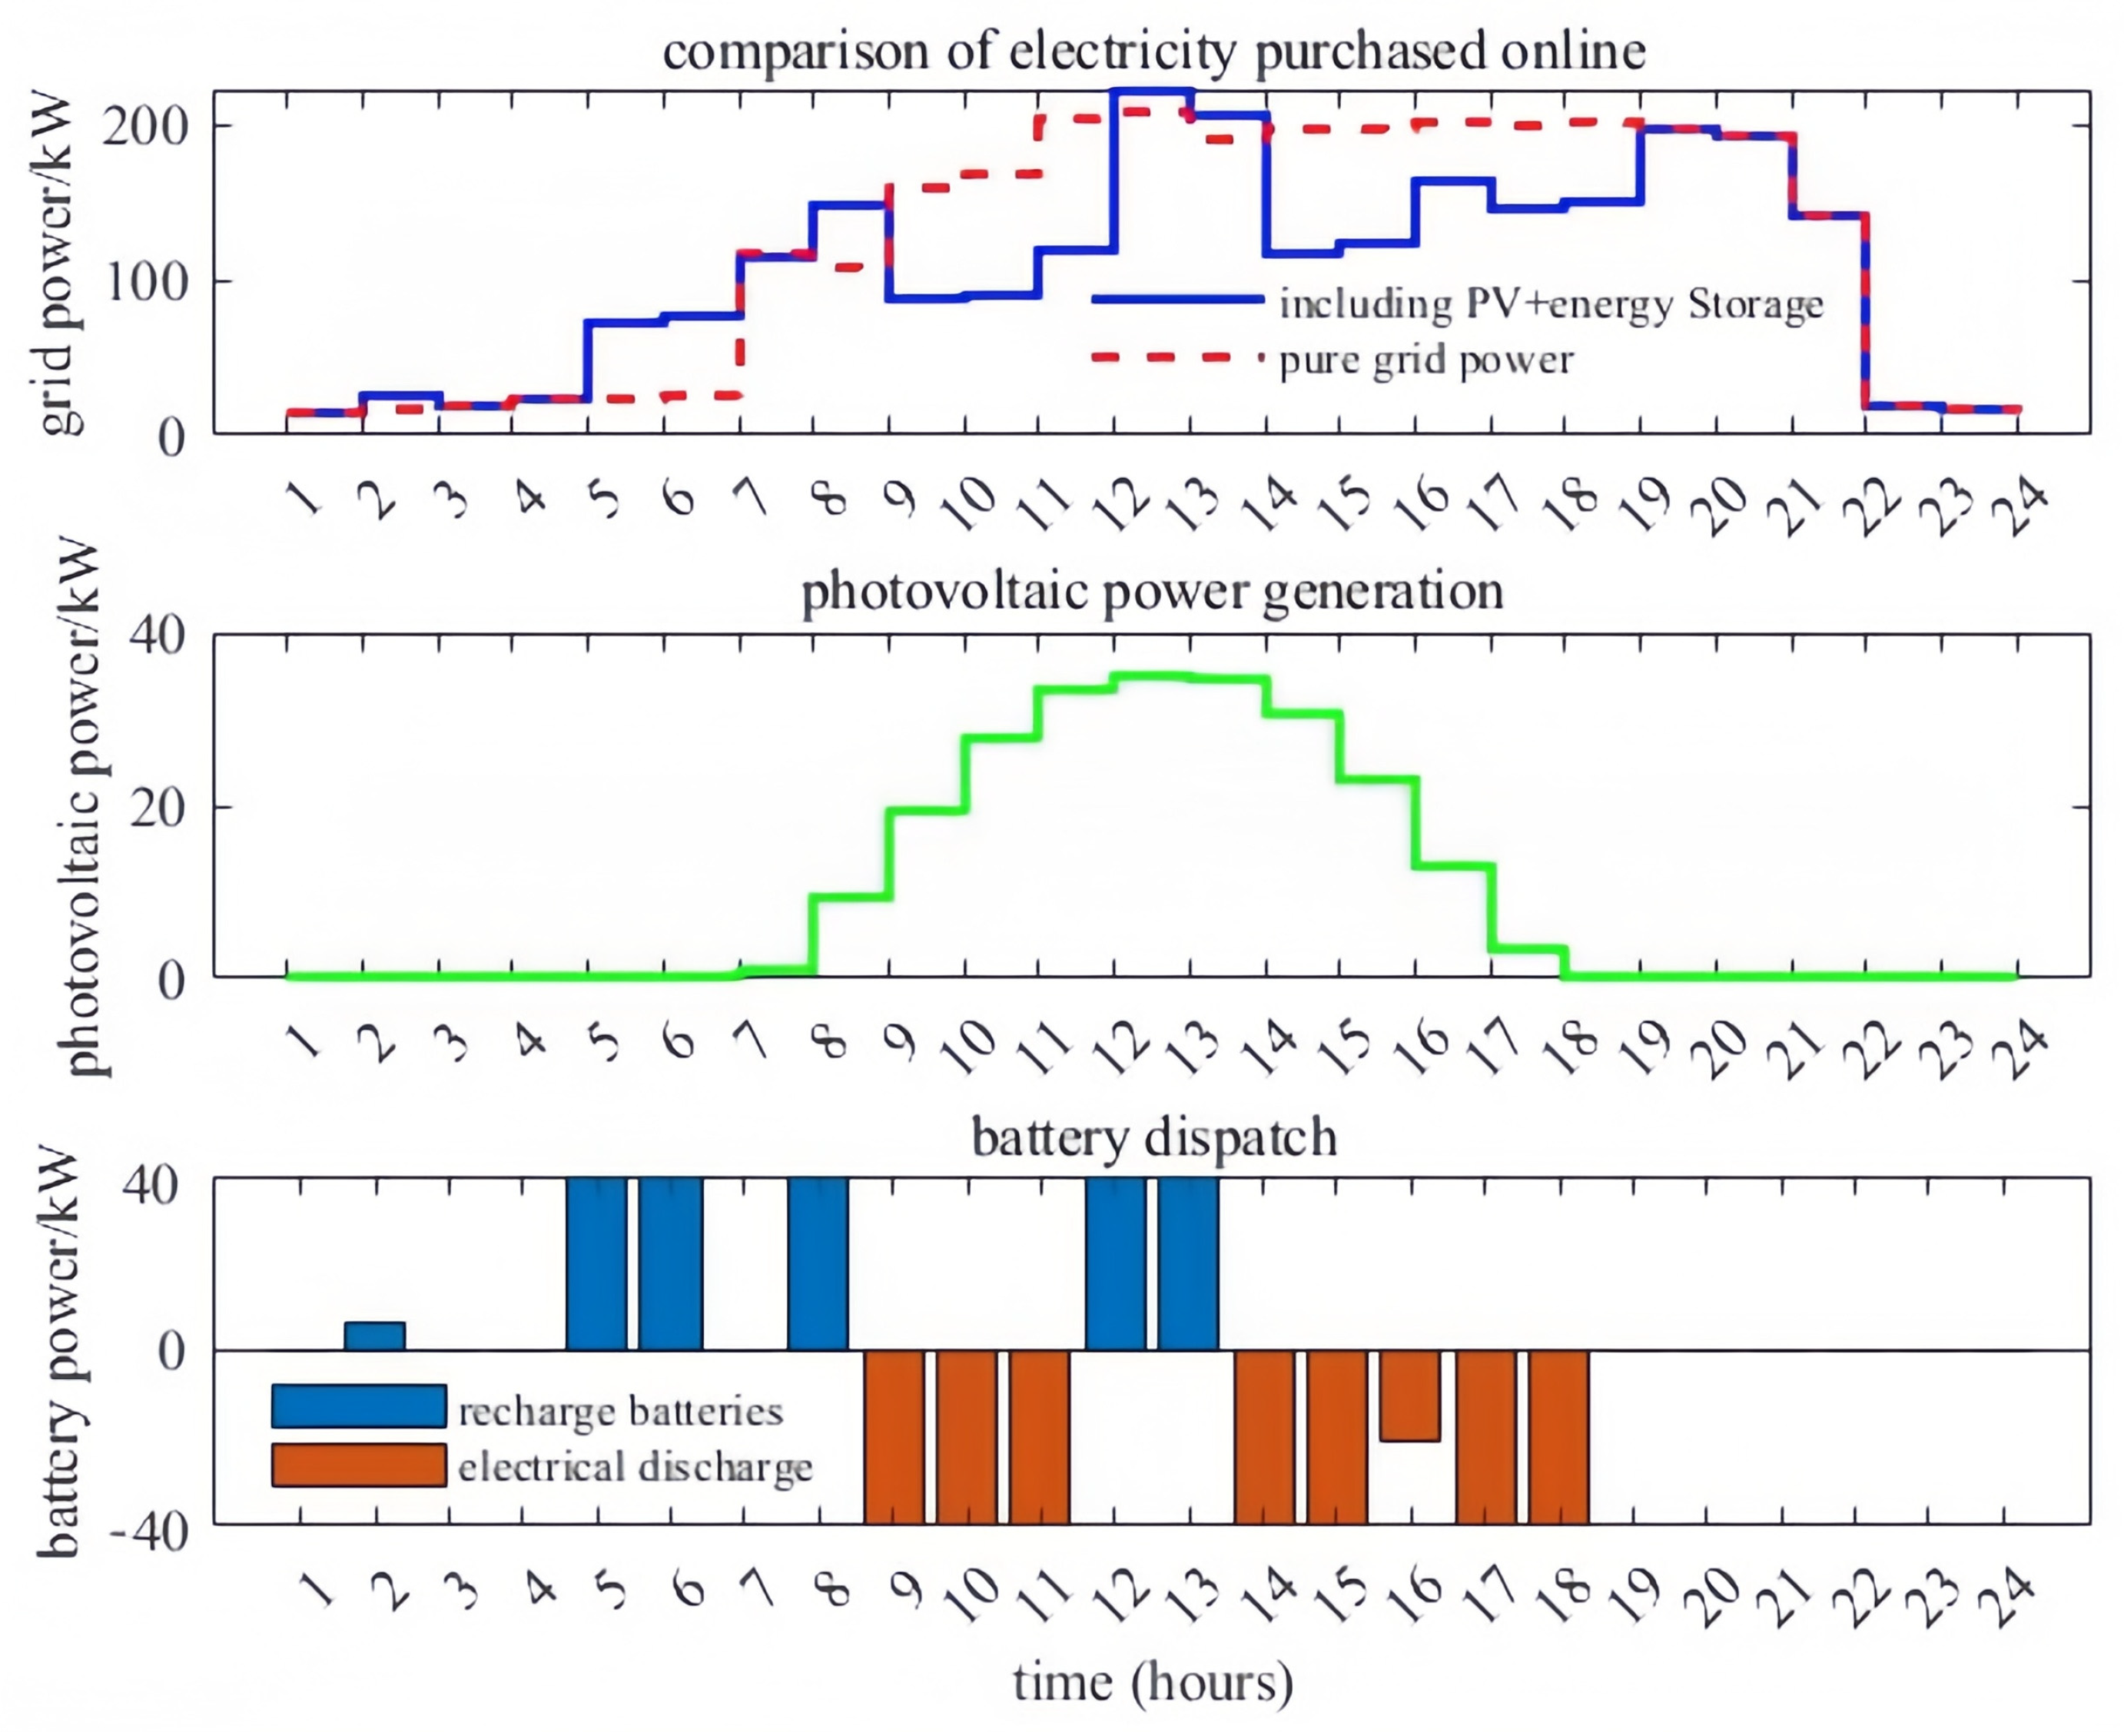
- As illustrated in Figure 11, an analysis of power supply–demand and energy storage dispatch is presented, comparing the grid power purchases under the grid-only mode and the photovoltaic-storage coordinated mode. It is important to note that the horizontal axis represents hours 1–24, corresponding to the time range 0:00–23:00, and the analysis is based on this 24 h period. Table 12 provides details of the power supply–demand and energy storage dispatch changes.Figure 11. Analysis of power supply–demand, photovoltaic and energy storage dispatching.Table 12. Variations in power supply–demand, photovoltaic and energy storage dispatching.
As demonstrated in Figure 11, an analysis of the grid power purchase reveals that during the early morning hours (0–2 h, 7–8 h, and 11–13 h), the grid power purchase under the photovoltaic-storage collaboration mode exceeds that of the grid-only mode. As demonstrated in Table 11, during these periods, the grid power purchases in the photovoltaic-storage collaboration mode are 84.95 kW, 71.51 kW, 130.65 kW, and 133.1 kW, respectively, compared to 44.59 kW, 45.89 kW, 125.59 kW, and 127.52 kW in the grid-only mode. This is due to the fact that these periods correspond to off-peak hours in the Time-of-use electricity pricing mechanism. During these hours, the photovoltaic-storage collaboration mode utilizes the lower electricity prices to charge the battery. As illustrated in Table 12, the charging power during these intervals is 40 kW, 25.26 kW, 40 kW, and 40 kW, respectively.
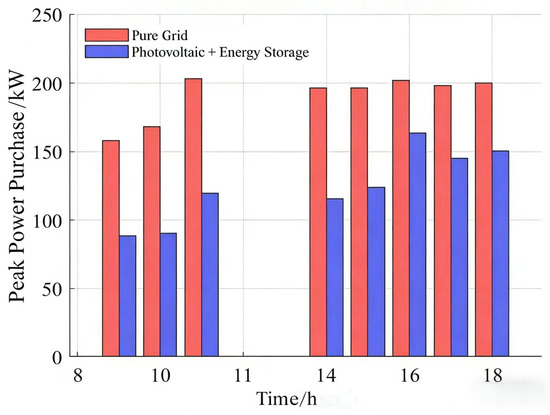
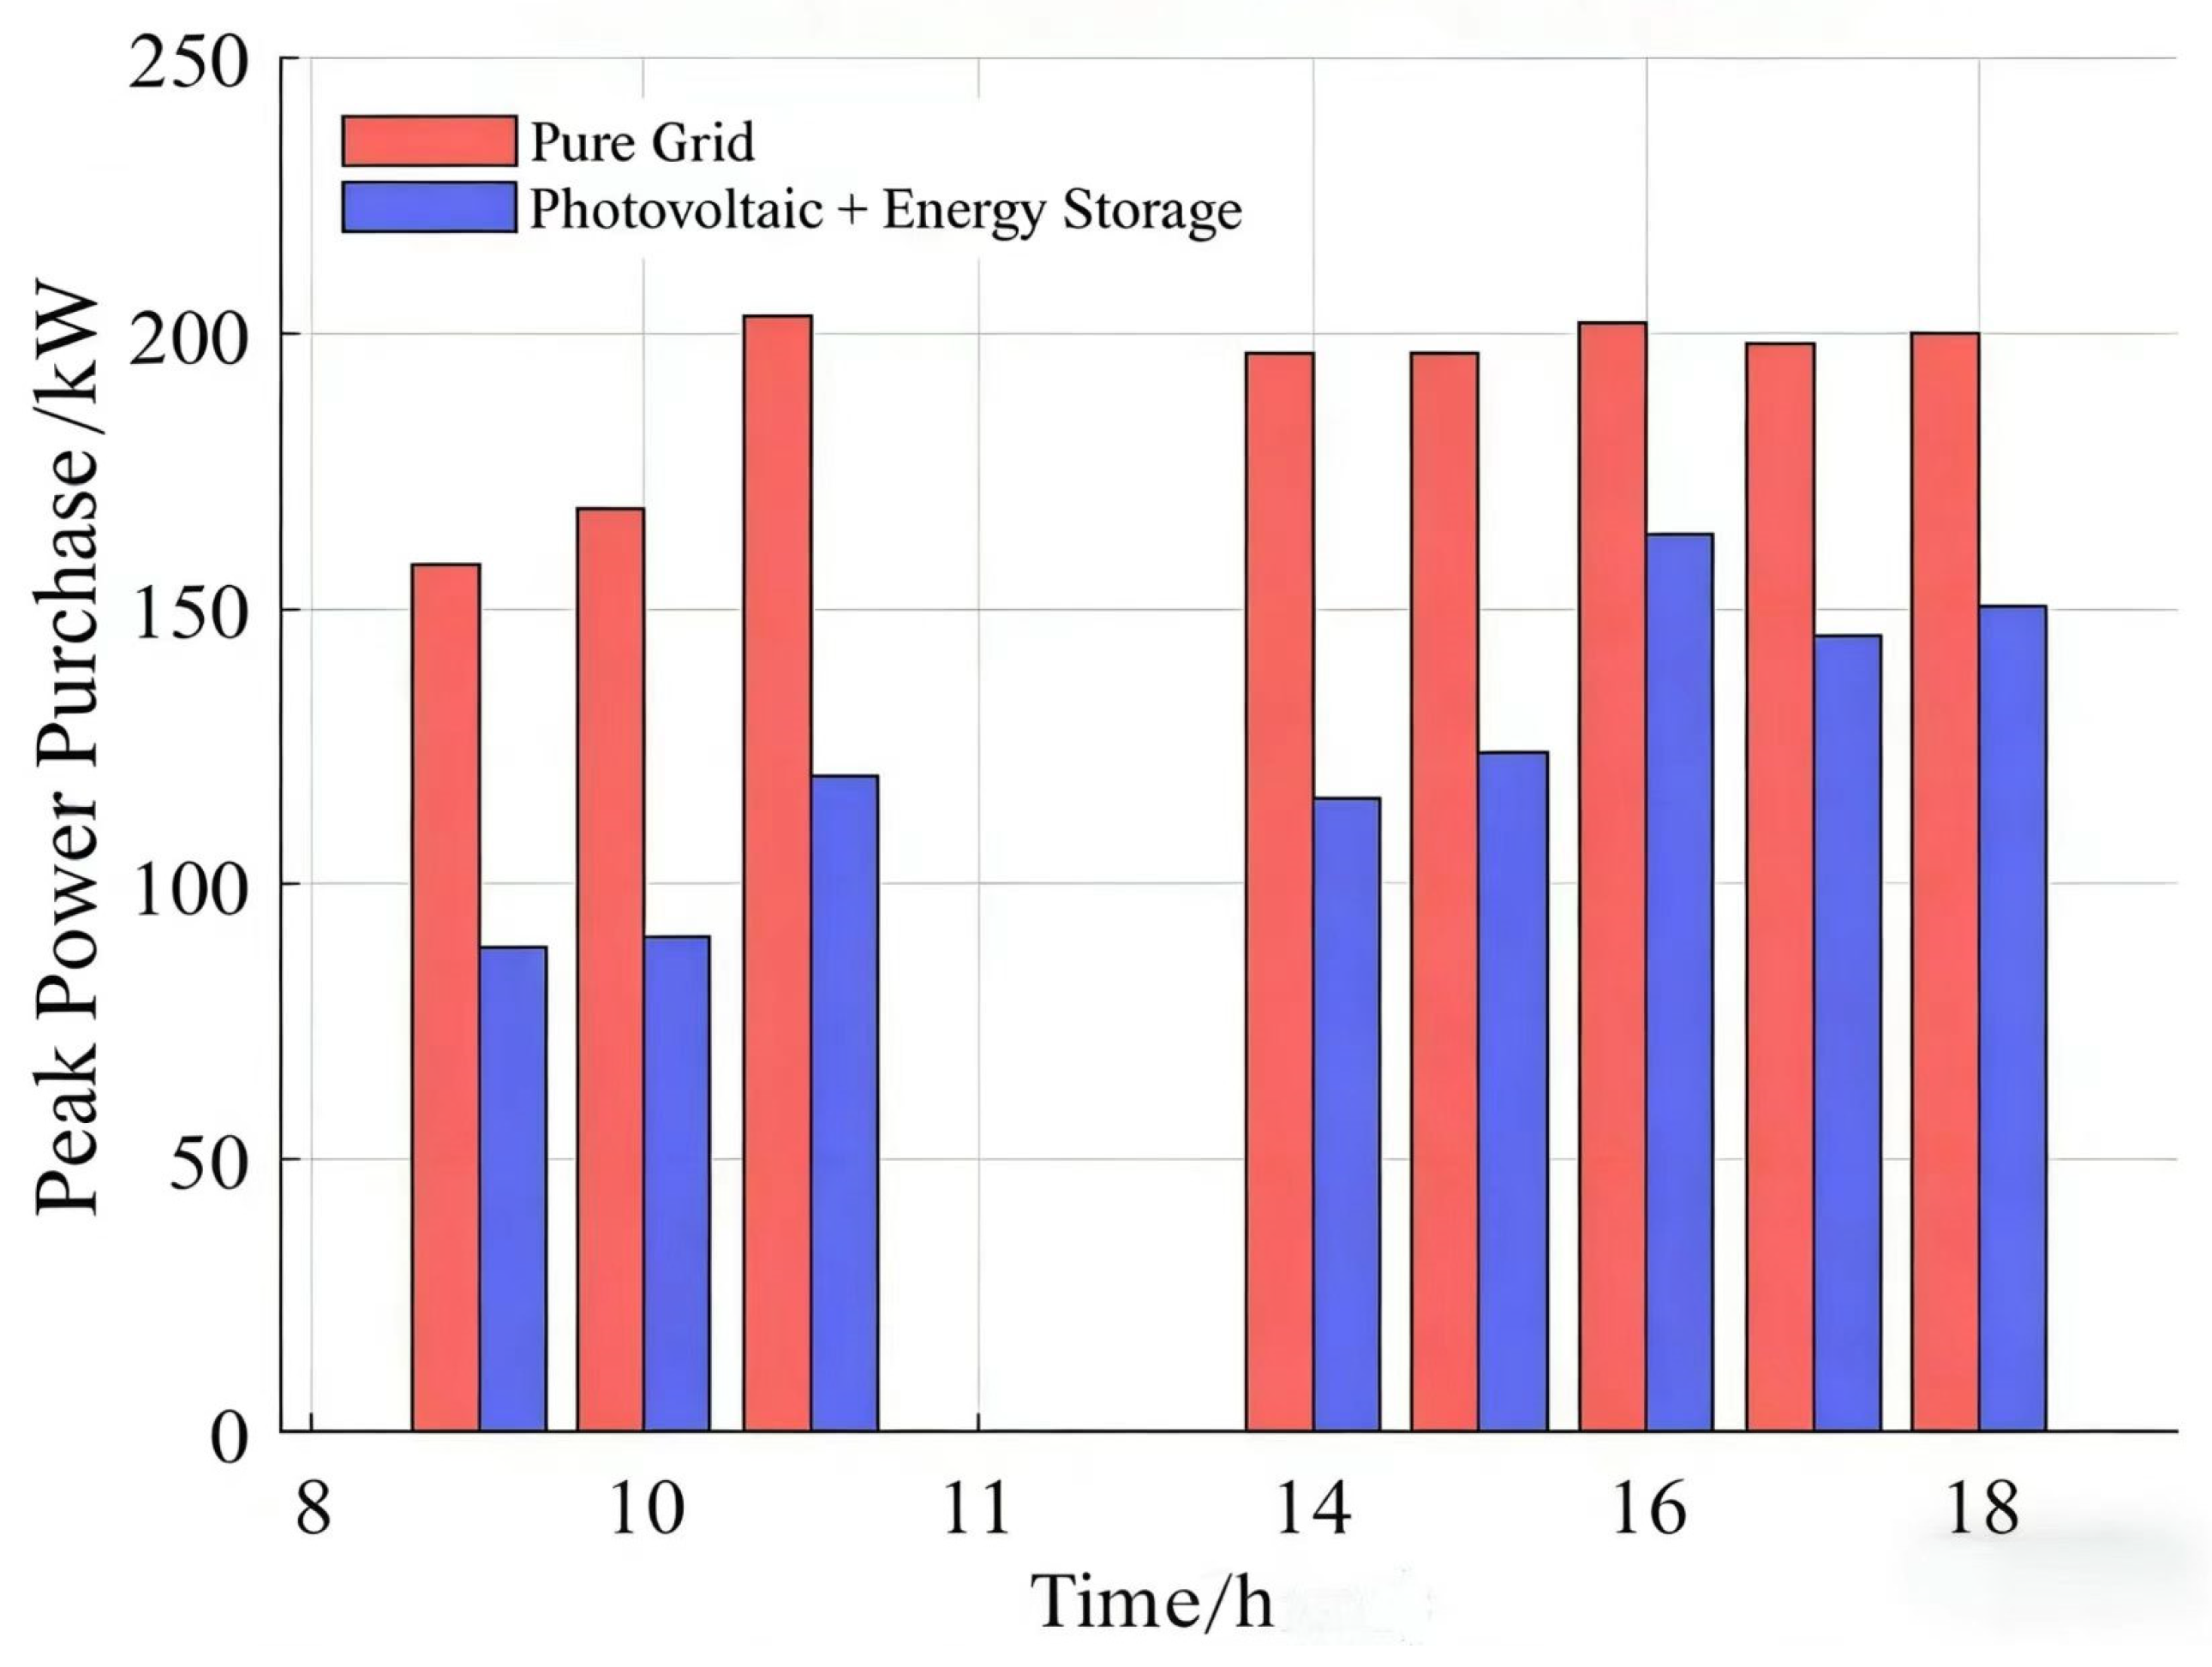
During peak pricing hours (8–11 h and 13–17 h), both the battery and photovoltaic generation collaborate to supply power to the system, thereby reducing grid power purchases during these periods of high price. Consequently, the grid power purchase under the photovoltaic and energy storage collaboration mode is lower than that under the grid-only mode. As demonstrated in Table 12, during peak hours, the grid power purchase in the photovoltaic and energy storage collaboration mode is reduced by 59.25 kW, 59.9 kW, 33.4 kW, 60.44 kW, 62.95 kW, 53.11 kW, and 43.3 kW, respectively.
In grid-only mode, the purchase of power by the grid is contingent exclusively on the demand for air-conditioning, resulting in elevated power purchases during periods of peak demand and, consequently, increased electricity costs. Conversely, under the photovoltaic and energy storage collaboration mode, photovoltaic generation provides a proportion of the power during daylight hours, particularly around midday when solar power output is at its zenith, thereby reducing the reliance on grid power.
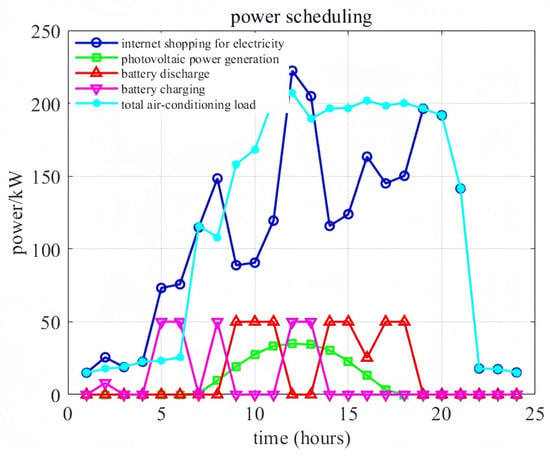
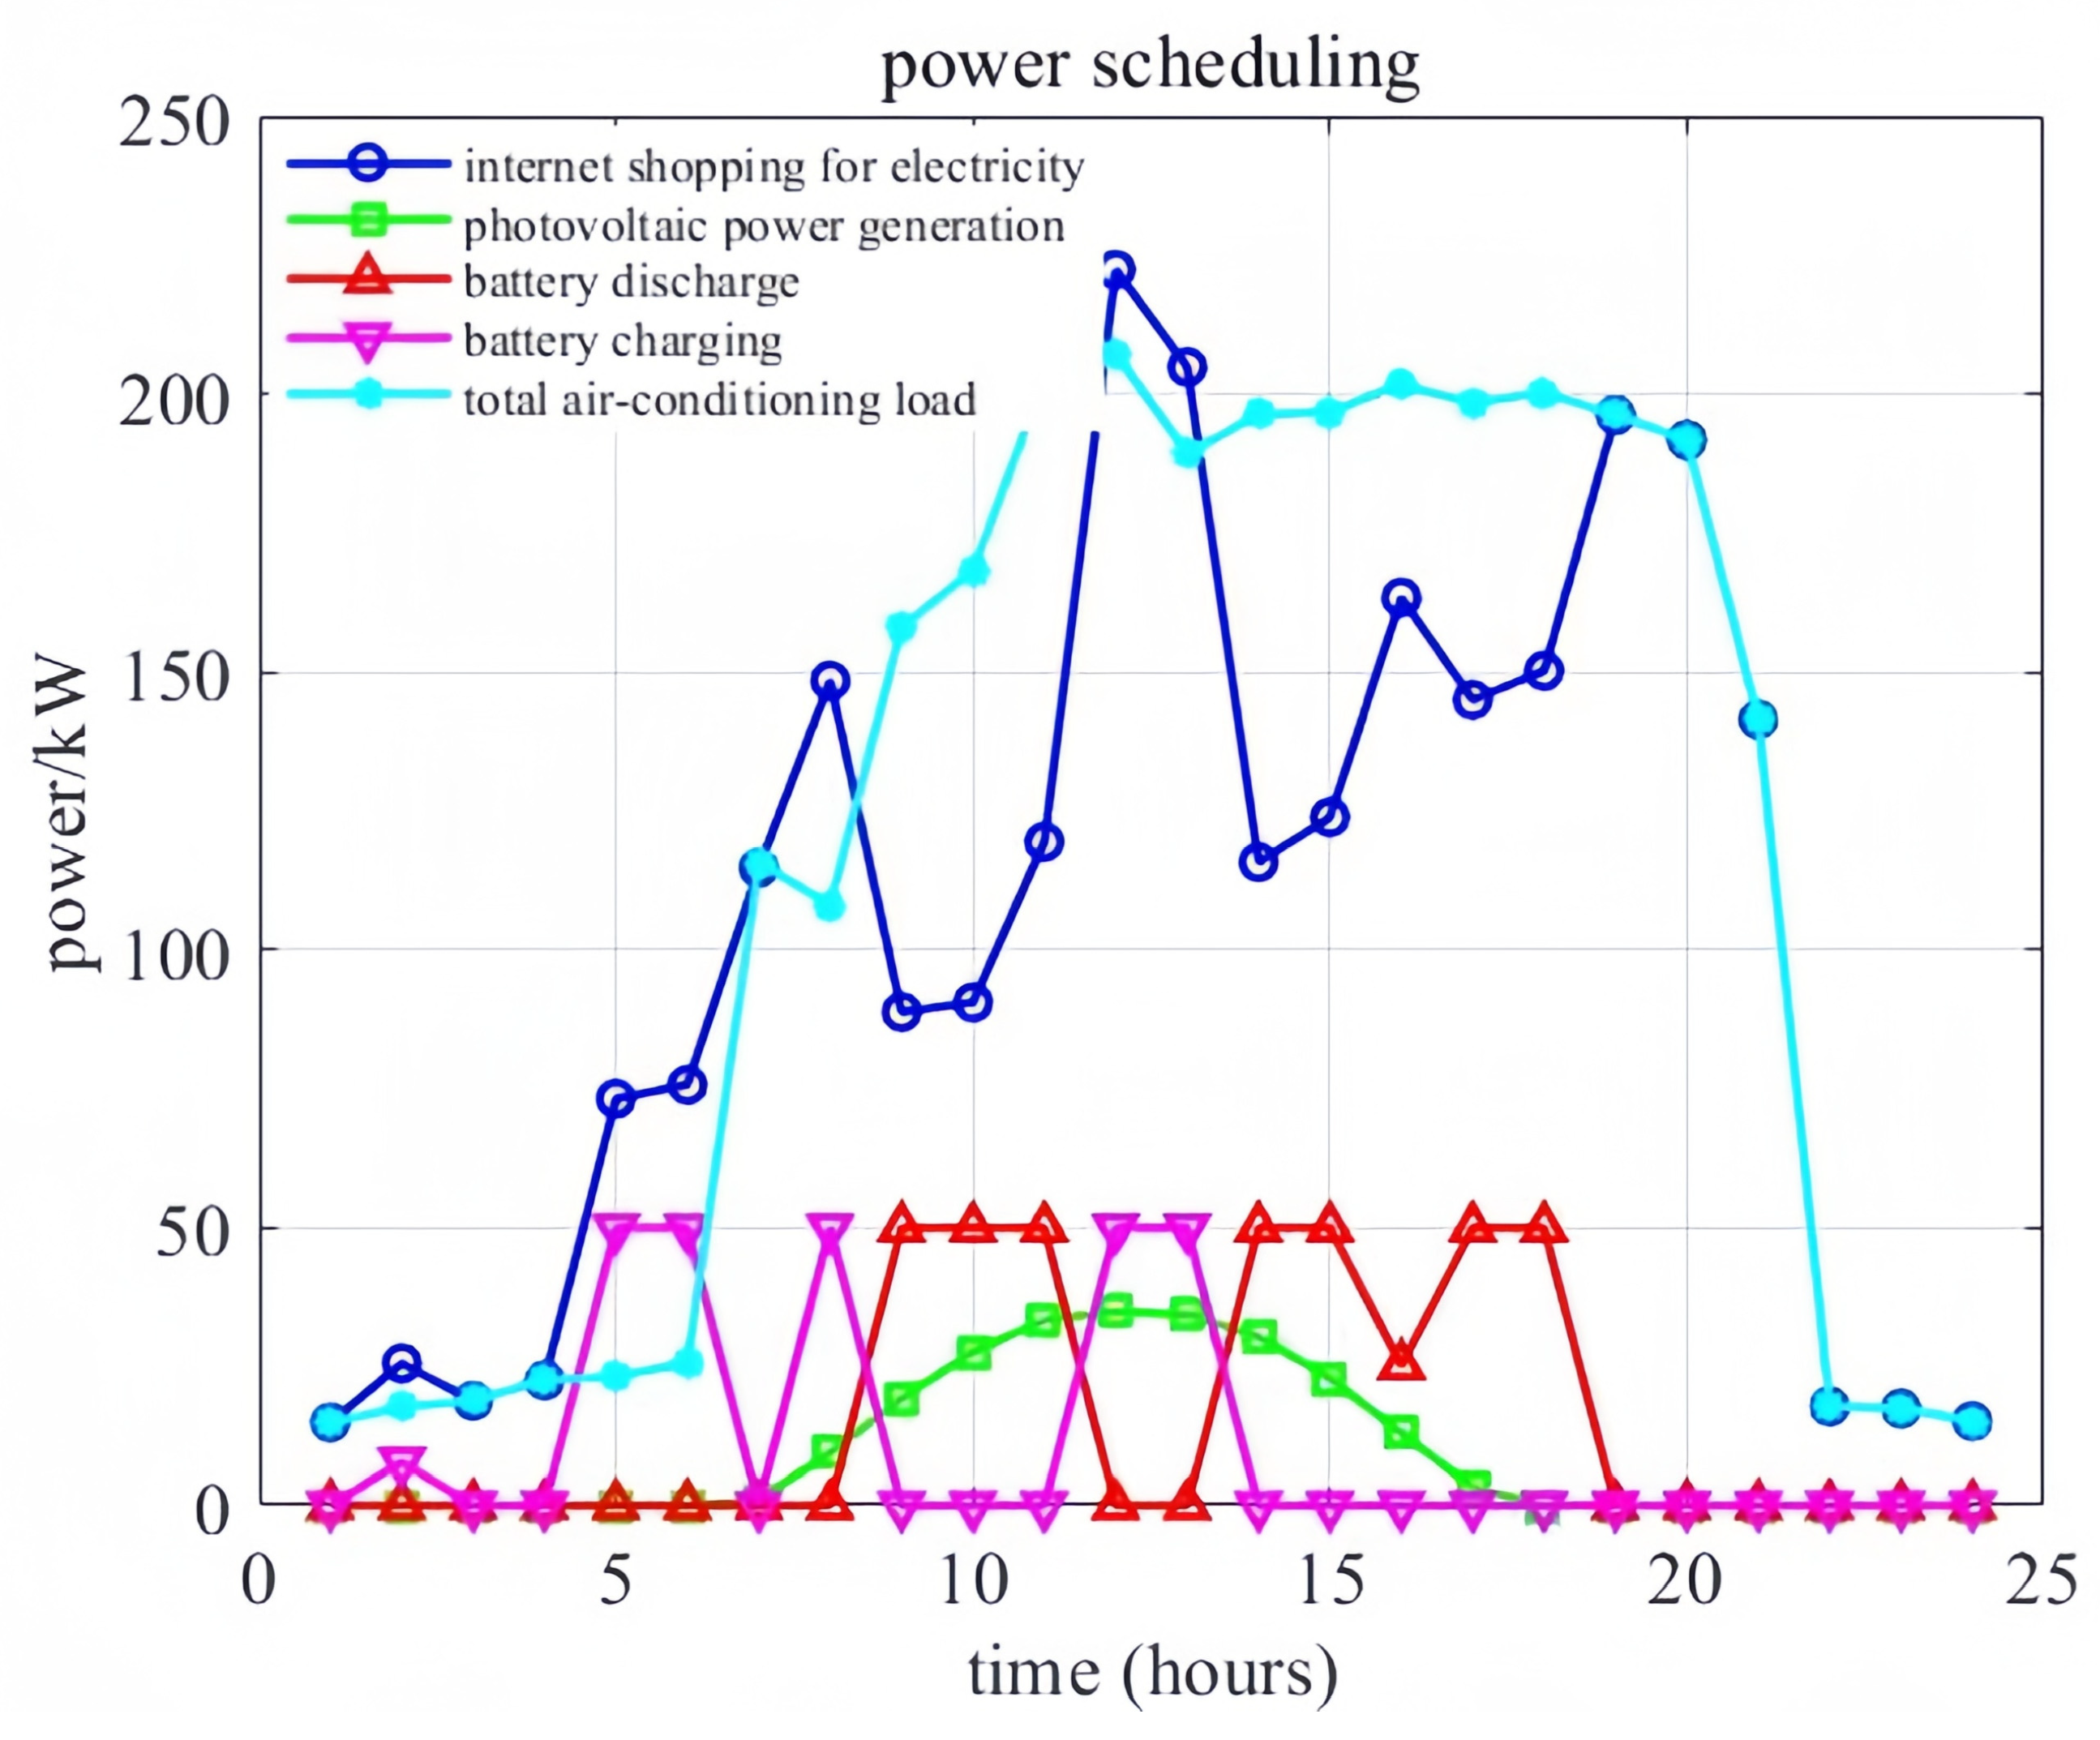
The present study proposes an optimization of the coordinated dispatch of the CAC water system load, photovoltaic power generation, and energy storage systems. The objective of this optimization is to minimize grid electricity purchase costs. The study draws parallels between grid power purchase, photovoltaic generation, and energy storage (battery) charging/discharging behaviors. As illustrated in Figure 12, the power dispatch curve is displayed under the photovoltaic and energy storage collaboration mode.
Figure 12.
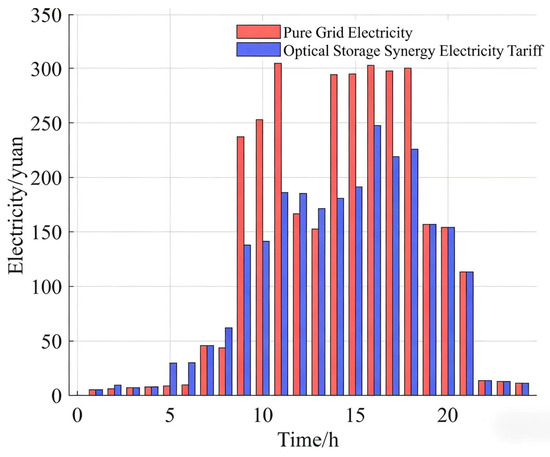
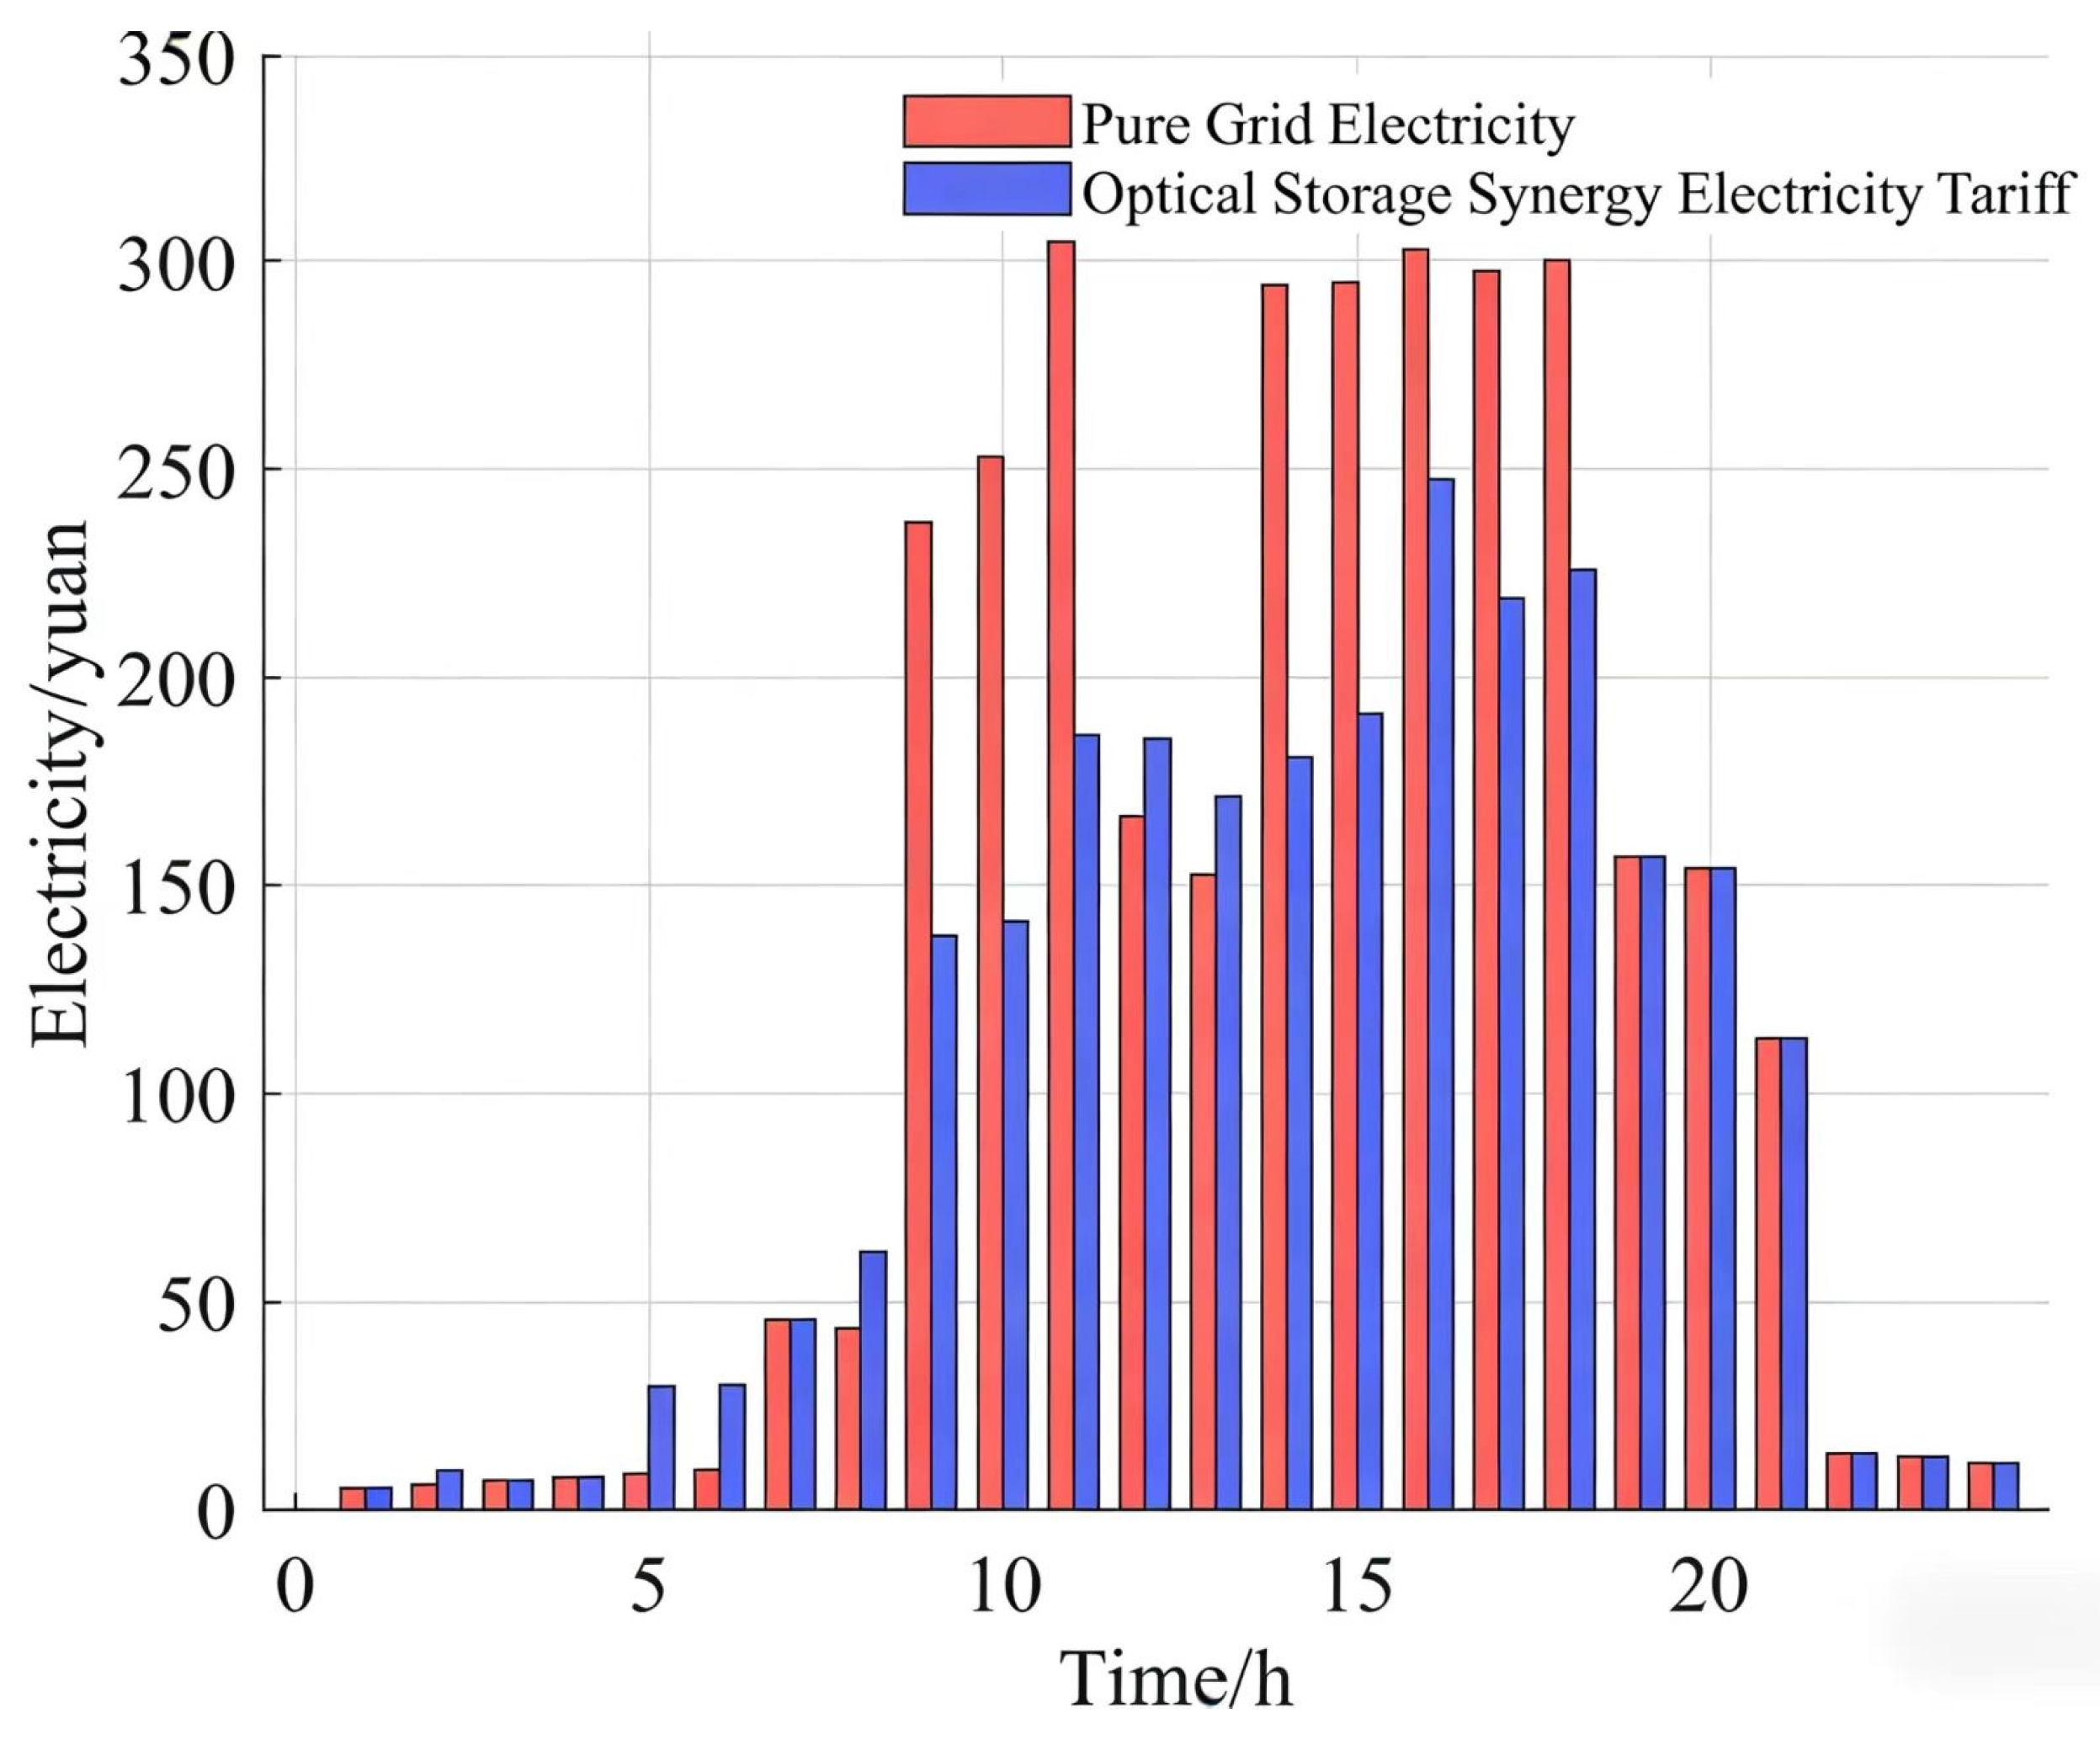
Comparison of hourly electricity costs.
As demonstrated in Figure 13, the photovoltaic and energy storage collaboration mode has been shown to lead to a substantial reduction in grid power purchases, particularly during peak periods when high-cost electricity demand is curtailed. During peak hours, photovoltaic generation and battery discharge supply a portion of the required power, thereby reducing dependence on grid electricity and lowering overall electricity costs. It is evident that the employment of a rational charging/discharging strategy is instrumental in the optimization of electricity costs by the energy storage system. This is achieved through the strategic timing of charging during periods of low prices and discharging during periods of high prices.
Figure 13.
Power dispatch curve under photovoltaic and energy storage collaboration mode.
As demonstrated in Figure 14, the photovoltaic and energy storage collaboration mode exhibits a reduced grid power purchase demand during peak hours in comparison with the grid-only mode. As illustrated in Table 13, a comparison is made of the grid power purchased during peak electricity price periods under both operational modes. As demonstrated, the grid power purchase in the grid-only mode is 998.61 kW, whereas in the photovoltaic and energy storage collaboration mode, it is reduced to 586.28 kW, representing a decrease of 412.33 kW, or 41.29%. The coordinated management of photovoltaic generation and the energy storage system has been demonstrated to result in a substantial reduction in grid power purchase during peak periods. This demonstrates that the photovoltaic and energy storage collaboration mode effectively mitigates power load fluctuations, optimizes electricity costs, and enhances both the economic performance and energy utilization efficiency of the system.
Figure 14.
Power purchases during peak hours.
Table 13.
Comparison of power purchases during peak hours.
Figure 12 compares the hourly electricity costs for the grid-only system and the photovoltaic-energy storage collaboration system over a 24 h period. During daylight hours, when photovoltaic generation is available, the electricity cost in the collaboration mode is lower than in the grid-only mode. This is because photovoltaic generation partially meets demand, and the energy storage system discharges stored energy, reducing reliance on grid power. In the absence of solar power during nocturnal hours, the demand for electricity must be met by the grid, which results in increased costs for consumers. However, due to reduced demand during nocturnal hours, the aggregate electricity cost incurred under the collaboration mode remains lower than that of the grid-only mode.
As demonstrated in Table 14, a comparison of the total electricity costs reveals that the grid-only mode incurs a total cost of 2349.62 yuan, whereas the collaboration mode results in a cost of 1823.55 yuan. This represents a reduction of 526.07 yuan, or 22.38%, demonstrating significant savings during periods of high prices and improved economic efficiency.
Table 14.
Comparison of electricity purchase costs.
5. Discussion
This chapter will conduct an in-depth analysis of the primary findings, elucidate their underlying mechanisms, and evaluate the study’s contributions and limitations.
5.1. Interpretation of Key Findings
Algorithmic Advantage Mechanism: The IBES algorithm demonstrates superior performance in benchmark testing and engineering optimization, owing to the synergistic effects of three enhancements: Adaptive Adversarial Learning improves the quality of the initial population, the logistic chaotic map maintains search diversity and prevents premature convergence, while Lévy Flight enhances global exploration capabilities. Together, these enhancements boost the algorithm’s robustness when tackling high-dimensional and nonlinear problems.
Following system energy trade-off optimization, total energy consumption decreases, yet cooling tower energy consumption increases under certain operating conditions. This reveals an inherent trade-off in system-level optimization: to achieve significant reductions in chiller energy consumption, the algorithm strategically increases cooling tower operation intensity to overcome heat dissipation constraints, thereby attaining global optimization. This phenomenon aligns with the principles of energy conservation and equipment coupling.
Economic Dispatch Logic: The economic viability of the “photovoltaic-Storage-Grid” collaborative framework stems from intelligent response to time-of-use electricity pricing. Its optimization follows an economic priority sequence: prioritizing photovoltaic consumption, charging during off-peak hours and discharging during peak hours to achieve storage arbitrage, while utilizing the grid as a balancing safeguard. This mechanism enables storage to simultaneously fulfill dual roles in smoothing fluctuations and managing costs.
5.2. Comparison with Existing Research
The primary distinction of this study lies in its systematic integration. Unlike research focusing on individual algorithm improvements or standalone prediction models, this paper deeply integrates the enhanced IBES algorithm, LSTM prediction, and equipment modeling. It constructs a closed-loop optimization framework spanning prediction to scheduling while simultaneously considering energy consumption and costs. This framework is applied to specific scenarios of photovoltaic-storage-grid coordination, demonstrating strong engineering applicability.
5.3. Limitations and Future Directions
While the proposed IBES-LSTM framework demonstrates promising performance in the hotel case study, its generalizability to other building types and climatic zones warrants further investigation. The data-driven nature of the LSTM model suggests that the framework is transferable in principle, provided that sufficient and representative historical operational data is available for the target system. However, the availability of such datasets from diverse settings is limited, which is a key limitation of the study. Subsequent endeavors will center on the aggregation of multi-site data for the purpose of cross-validation, a prerequisite for the establishment of the model’s robustness and practical applicability across diverse scenarios. Collaborations with building management entities in various sectors and regions are being sought to address this data gap.
A key direction for future research is to apply and validate the proposed framework across multiple building types and geographical locations. This will not only serve to test the system’s robustness, but also potentially yield insights into the influence of building characteristics and climate patterns on optimization strategies.
Another key research direction involves conducting comprehensive sensitivity analyses to evaluate the impact of varying levels of prediction uncertainty on the system’s economic performance and energy efficiency. Furthermore, extending the deterministic optimization model to a stochastic or robust optimization formulation that explicitly incorporates forecast uncertainty intervals would significantly enhance the practical reliability of the framework for real-world applications.
6. Conclusions
The present research addresses the energy-saving and economic operation challenges of CAC systems under time-of-use electricity pricing by proposing a collaborative optimization framework integrating photovoltaics, energy storage, and the power grid. Focusing on two core research questions—“how to reduce system energy consumption” and “how to minimize electricity costs”—systematic work was completed from methodological innovation to application validation through improved intelligent algorithms, predictive modeling, and optimized scheduling strategies. Key conclusions are summarized as follows:
- (1)
- An IBES algorithm was developed by integrating adaptive adversarial learning, logistic chaotic mapping, and Lévy flight strategy. This significantly improves the algorithm’s global optimization capability and convergence speed when solving high-dimensional, nonlinear, constrained engineering optimization problems. Benchmark function and case study comparisons validate its superiority over traditional algorithms.
- (2)
- An IBES-LSTM collaborative optimization framework was established, successfully integrating load forecasting with system optimization. This framework not only achieves precise cold load prediction but also reduces the average energy consumption of the CAC water system by 26.04% through coordinated scheduling of equipment such as chillers, pumps, and cooling towers, demonstrating significant energy-saving potential.
- (3)
- An economic dispatch model for “photovoltaics-storage-grid” coordination under time-of-use pricing was constructed. Simulation results demonstrate that the proposed strategy, through photovoltaics priority consumption and intelligent “low-charge high-discharge” energy storage scheduling, reduces total system electricity procurement costs by 22.38% while ensuring power supply reliability, achieving dual goals of energy conservation and cost reduction.
The primary contribution of this study lies in proposing and validating a data- and model-driven collaborative optimization framework, providing a systematic solution for CAC systems to participate in demand response and achieve refined energy management.
However, the validation is based on a single case study, and the generalizability of its conclusions requires further testing across diverse buildings and climate zones. Furthermore, extending the deterministic model to a stochastic optimization framework that explicitly handles prediction uncertainties, and integrating electricity optimization with building thermal management, represent key future directions for enhancing system practicality and unlocking deeper energy-saving potential.
Author Contributions
D.Q.: Conceptualization, Investigation, Methodology, Writing—original draft preparation. L.X. and L.D.: Methodology, Writing—review and editing. B.F.: Methodology, Writing—review and editing. H.W.: Methodology, Writing—reviewing and editing, Supervision, Funding acquisition. All authors have read and agreed to the published version of the manuscript.
Funding
This work was supported by the Hubei Provincial Major Project for Technological Innovation (Grant No. 2023BEB038).
Data Availability Statement
The raw data supporting the conclusions of this article will be made available by the authors on request.
Conflicts of Interest
The authors declare that they have no known competing financial interests or personal relationships that could have appeared to influence the work reported in this paper.
References
- Liu, J.; Zhang, Y.; Wen, K.; Ding, Y. Analysis of different neural network models based on variational mode decomposition and dung beetle optimizer algorithm for the prediction of air-conditioning energy consumption in multifunctional complex large public buildings. Energy Build. 2025, 334, 115518. [Google Scholar] [CrossRef] [Scilit]
- Tang, R.; Wang, S.; Sun, S. Impacts of technology-guided occupant behavior on air-conditioning system control and building energy use. Build. Simul. 2021, 14, 209–217. [Google Scholar] [CrossRef] [Scilit]
- Wang, C.; Zhou, K.; Yang, S. A review of residential tiered electricity pricing in China. Renew. Sustain. Energy Rev. 2017, 79, 533–543. [Google Scholar] [CrossRef] [Scilit]
- Wesseh, P.K.; Dogah, K.E. Dynamic tariffs and climate policy interaction: An economic analysis of welfare implications in retail electricity markets. Energy Res. Soc. Sci. 2022, 90, 102679. [Google Scholar] [CrossRef] [Scilit]
- Hao, C.H.; Wesseh, P.K.; Wang, J.; Abudu, H.; Dogah, K.E.; Opoku, E.E.O. Dynamic pricing in consumer-centric electricity markets: A systematic review and thematic analysis. Energy Strategy Rev. 2024, 52, 101349. [Google Scholar] [CrossRef] [Scilit]
- Hu, M.; Xiao, F.; Jørgensen, J.B.; Li, R. Price-responsive model predictive control of floor heating systems for demand response using building thermal mass. Appl. Therm. Eng. 2019, 153, 316–329. [Google Scholar] [CrossRef] [Scilit]
- Yan, Q.; Wang, J.; Lin, T.; Johnston, A.J. Peak-Valley difference based pricing strategy and optimization for PV-storage electric vehicle charging stations through aggregators. Int. J. Electr. Power Energy Syst. 2025, 169, 110812. [Google Scholar] [CrossRef] [Scilit]
- Rebelo, F.W.D.; Ismail, K.A.R.; Lino, F.A.M.; Sousa, G. Experimental investigation of a photovoltaic solar air conditioning system and comparison with conventional unit in the context of the state of Piaui, Brazil. Sol. Energy 2024, 272, 112492. [Google Scholar] [CrossRef] [Scilit]
- Li, Y.; Zhao, B.Y.; Zhao, Z.G.; Taylor, R.A.; Wang, R.Z. Performance study of a grid-connected photovoltaic powered central air conditioner in the South China climate. Renew. Energy 2018, 126, 1113–1125. [Google Scholar] [CrossRef] [Scilit]
- Hu, Z.; Gao, Y.; Sun, L.; Mae, M.; Imaizumi, T. A novel reinforcement learning method based on generative adversarial network for air conditioning and energy system control in residential buildings. Energy Build. 2025, 336, 115564. [Google Scholar] [CrossRef] [Scilit]
- Mao, Y.; Yu, J.; Zhang, N.; Dong, F.; Wang, M.; Li, X. A hybrid model of commercial building cooling load prediction based on the improved NCHHO-FENN algorithm. J. Build. Eng. 2023, 78, 107660. [Google Scholar] [CrossRef] [Scilit]
- He, N.; Zhang, L.; Qian, C.; Gao, F.; Li, R.; Cheng, F.; Chu, D. Short-term cooling load prediction for central air conditioning systems with small sample based on permutation entropy and temporal convolutional network. Energy Build. 2024, 310, 114115. [Google Scholar] [CrossRef] [Scilit]
- Nassif, N. Modeling and optimization of HVAC systems using artificial neural network and genetic algorithm. Build. Simul. 2014, 7, 237–245. [Google Scholar] [CrossRef] [Scilit]
- Yang, S.; Yu, J.; Gao, Z.; Zhao, A. Energy-saving optimization of air-conditioning water system based on data-driven and improved parallel artificial immune system algorithm. Energy Convers. Manag. 2023, 283, 116902. [Google Scholar] [CrossRef] [Scilit]
- Cen, J.; Zeng, L.; Liu, X.; Wang, F.; Deng, S.; Yu, Z.; Zhang, G.; Wang, W. Research on energy-saving optimization method for central air conditioning system based on multi-strategy improved sparrow search algorithm. Int. J. Refrig. 2024, 160, 263–274. [Google Scholar] [CrossRef] [Scilit]
- Xie, J.; Zhang, Y.; Yu, M.; Li, M. Energy consumption optimization of central air-conditioning based on sequential-least-square-programming. In Proceedings of the 32nd Chinese Control and Decision Conference (CCDC), Hefei, China, 22–24 August 2020. [Google Scholar]
- Bai, Y.; Sun, D.; Liu, L.; Shen, Y. Energy-saving optimization of air-conditioning water system based on machine learning and improved bat algorithm. Energy Build. 2025, 283, 115333. [Google Scholar] [CrossRef] [Scilit]
- Zhou, Y.; Du, S.H.; Gao, Y.; Xiao, F.; Gong, K.; Li, J.P. Study On Efficiency Optimization Strategy Of Central Air-Conditioning System. In Proceedings of the 2021 18th International Computer Conference on Wavelet Active Media Technology and Information Processing (ICCWAMTIP 2021), Chengdu, China, 17–19 December 2021. [Google Scholar]
- Li, Q.; Su, Y.; Zhang, D.; Liu, C.; Zhang, H.; Yan, Z. Research on global energy optimization of central air conditioning system based on particle swarm optimizer with penalty functions. In Proceedings of the 2022 37th Youth Academic Annual Conference of Chinese Association of Automation (YAC 2022), Beijing, China, 19–20 November 2022. [Google Scholar]
- Liu, Y.T.; Wang, X.D.; Li, S.J. An improved particle swarm optimization algorithm and its application in energy saving optimization of central air conditioning. IOP Conf. Ser. Earth Environ. Sci. 2018, 186, 012022. [Google Scholar] [CrossRef] [Scilit]
- Lv, L.; Wang, D.; Chen, Y.; Chen, H.; Wei, J. Research on Operation Optimization of Central Air Conditioning Cold Source System Based on PSO-SA Algorithm. J. Phys. Conf. Ser. 2021, 2087, 012098. [Google Scholar] [CrossRef] [Scilit]
- Miao, Y.; Yao, Y.; Hong, X.; Xiong, L.; Zhang, F.; Chen, W. Research on optimal control of HVAC system using swarm intelligence algorithms. Build. Environ. 2023, 241, 110467. [Google Scholar] [CrossRef] [Scilit]
- Tian, H.; Feng, M.; Fan, H.; Cao, R.; Gao, Q. Optimization Control Strategy for a Central Air Conditioning System Based on AFUCB-DQN. Processes 2023, 11, 2068. [Google Scholar] [CrossRef] [Scilit]
- Ullah, A.; Hussain, B.; Youn, Y.; Bae, H.-B.; Hong, J.-E.; Joh, D.W.; Lee, S.-B.; Song, R.-H.; Kim, T.W.; Lim, T.-H. A multicomponent equimolar proton-conducting quadruple hexagonal perovskite-related oxide system. Dalton Trans. 2023, 52, 1885–1894. [Google Scholar] [CrossRef] [Scilit] [PubMed]
- Liu, S.; Liu, W.D.; Lyu, W.; Yin, L.-C.; Yue, Y.; Gao, H.; Li, M.; Shi, X.-L.; Liu, Q.; Wang, N. Alignment of edge dislocations—The reason lying behind composition inhomogeneity induced low thermal conductivity. Nat. Commun. 2025, 16, 9775. [Google Scholar] [CrossRef] [Scilit] [PubMed]
- Anjum, T.; Alam, M.M.; Hossain, I.; Gomaa, M.; Kumar, L. Methods, technologies and challenges of building integrated photovoltaic thermal (BIPV/T) systems to achieve net-zero in high rise buildings: A systematic review. J. Build. Eng. 2025, 114, 114284. [Google Scholar] [CrossRef] [Scilit]
- Liang, J.J.; Qu, B.Y.; Suganthan, P.N. Problem Definitions and Evaluation Criteria for the CEC 2014 Special Session and Competition on Single Objective Real-Parameter Numerical Optimization; 61780053; Zhengzhou University: Zhengzhou, China, 2013. [Google Scholar]
- Hewamalage, H.; Bergmeir, C.; Bandara, K. Recurrent Neural Networks for Time Series Forecasting: Current status and future directions. Int. J. Forecast. 2021, 37, 388–427. [Google Scholar] [CrossRef] [Scilit]
- Validation Dataset. Available online: https://www.tipdm.org/stysj5/1085.jhtml (accessed on 15 October 2024).
- Global Solar Atlas. Available online: https://globalsolaratlas.info/detail?c=26.539394,111972656,6&s=31.01243,112.873535 (accessed on 15 September 2025).

Disclaimer/Publisher’s Note: The statements, opinions and data contained in all publications are solely those of the individual author(s) and contributor(s) and not of MDPI and/or the editor(s). MDPI and/or the editor(s) disclaim responsibility for any injury to people or property resulting from any ideas, methods, instructions or products referred to in the content. |
© 2026 by the authors. Licensee MDPI, Basel, Switzerland. This article is an open access article distributed under the terms and conditions of the Creative Commons Attribution (CC BY) license.