


Abstract
Land-use and land-cover change plays a critical role in shaping urban expansion patterns and modifying near-surface soil conditions, hydrological behaviour, and geomorphological stability in rapidly developing regions. This study presents a comparative modelling framework to analyze long-term land-use change and its implications for regional-scale geotechnical risk screening by integrating historical land-use classification, Markov transition analysis, and machine learning–based spatial simulation. Landsat imagery from 1985 and 2024 was classified using a Support Vector Machine approach, and future land-use projections for 2063 were generated using both the TerrSet Land Change Modeler (LCM) and the GeoFLUS model under identical transition demands. Spatial driving variables included topographic, hydrological, and accessibility-related factors that influence soil behaviour and urban suitability. The results reveal sustained urban expansion primarily driven by the systematic conversion of agricultural land into built-up surfaces, while forested areas and water bodies exhibit high class persistence, as indicated by dominant diagonal values in the Markov transition matrix. Although both models reproduce consistent directional trends, they generate distinct spatial allocation patterns, with LCM producing compact and centralized growth and GeoFLUS generating more spatially dispersed expansion. These differences lead to contrasting implications for potential settlement, flooding, and slope instability zones. By treating future land-use maps as alternative geotechnical screening scenarios rather than fixed predictions, this study demonstrates how model uncertainty can be incorporated into hazard-sensitive planning. The proposed framework supports preliminary geotechnical zoning and infrastructure planning by identifying robust development corridors and spatial uncertainty zones where detailed site investigations may be prioritized. The methodology is transferable to other rapidly urbanizing regions facing complex soil and geomorphological constraints.
1. Introduction
Land-use and land-cover change (LULC) represents one of the most persistent spatial transformations associated with urbanization, infrastructure development, changing socio-economic conditions, and natural hazards [1,2,3]. Beyond visible alterations in landscape patterns, land-use change reorganizes ecological processes, surface and subsurface interactions, soil structure, and hydrological regimes, thereby shaping the long-term sustainability of human settlements [4,5]. In rapidly growing urban regions, land-use decisions not only increasingly influence environmental conditions, but also engineering performance, affecting the spatial distribution of geotechnical risks related to drainage, slope stability, soil compaction, and ground behaviour [6]. Understanding how land-use systems evolve over time and how they may develop under future conditions has therefore become a central concern for spatial planning and engineering-oriented decision-making [7,8].
Most studies addressing land-use change have focused on retrospective analyses, modelling historical transitions and identifying dominant driving factors such as accessibility, population growth, land availability, and topographic constraints [9]. Although these analyses provide valuable insights into past dynamics, they offer limited guidance for proactive planning under rapidly changing environmental and socio-spatial conditions [10]. Land-use transitions typically arise from non-linear interactions between natural conditions, geomorphological settings, and human interventions, rendering future spatial patterns inherently uncertain [11]. Consequently, scenario-based land-use modelling has become increasingly important for exploring plausible future outcomes rather than producing single, deterministic predictions [12,13].
Markov chain-based models, particularly when combined with spatial allocation mechanisms, have been widely employed to simulate land-use transitions [14,15]. Markov models estimate transition probabilities between land-use classes based on observed historical changes, while spatial allocation techniques distribute these transitions according to suitability conditions derived from environmental, topographic, and accessibility-related variables [16]. The integration of artificial neural networks (ANNs) and other machine learning approaches has further enhanced these models by enabling complex, non-linear relationships between land-use change, soil conditions, and driving factors to be captured [17,18]. Previous applications of ANN-supported Markov models have demonstrated their capacity to reproduce long-term land-use trajectories and identify zones prone to future transformation, particularly in regions experiencing rapid urban expansion or post-disaster reconstruction [19,20].
Despite these advances, a key limitation in land-use modelling practice lies in the frequent reliance on a single modelling framework [21]. Different models, even when driven by identical historical data and transition demands, may generate substantially different spatial outcomes due to variations in learning algorithms, neighbourhood effects, and allocation rules [22,23]. This issue is particularly critical for planning and engineering applications where land-use projections are often used to support long-term investment, zoning, infrastructure development, and risk mitigation strategies [24]. Treating a single model output as a definitive representation of the future can therefore obscure uncertainty and potentially misinform decision-making [25].
The Land Change Modeler (LCM) and the GeoSOS-FLUS (GeoFLUS) model represent two widely used but conceptually distinct approaches to land-use simulation [26,27]. LCM combines Markov chain analysis with machine learning-based transition potential modelling, typically using multilayer perceptron neural networks to estimate spatial transition likelihoods. Its structured workflow and transparent parameterisation have made it a common choice in regional land-use and environmental studies [18]. GeoFLUS, by contrast, adopts a flexible cellular automata framework, integrating ANN-based occurrence probabilities with neighbourhood competition and adaptive allocation mechanisms [28]. This structure enables GeoFLUS to capture complex spatial interactions, particularly in heterogeneous landscapes characterized by variable soil properties and geomorphological constraints. Although both models are well established, systematic comparisons using identical datasets and transition demands remain limited [29].
From a geotechnical perspective, land-use change has implications that extend beyond surface-level transformations. Changes in land-cover directly affect infiltration capacity, surface runoff, groundwater recharge, and soil moisture conditions, all of which play critical roles in slope stability, drainage behaviour, and ground response [30]. Urban expansion often involves surface sealing, excavation, compaction, and fill operations that modify the mechanical and hydraulic properties of near-surface soils and unconsolidated sediments [31]. Such interventions may increase flood susceptibility, accelerate erosion, and redistribute geotechnical risks across urban and peri-urban environments [32]. Engineering geology and geotechnical planning frameworks therefore emphasize land-use zoning as a fundamental component of hazard mitigation, particularly in regions exposed to seismic activity, flooding, or slope instability [33].
Although the relationship between land-use change and geotechnical processes is widely recognized, future land-use simulations are still rarely discussed in relation to engineering performance. Model outputs are often presented in environmental or planning contexts without systematically addressing their implications for ground stability, drainage systems, soil behaviour, or engineering suitability. Comparative modelling provides an effective framework for addressing this gap by revealing both the convergent and divergent spatial patterns arising from different modelling assumptions. Identifying zones of model agreement and disagreement enables planners and engineers to distinguish between robust trends and highly uncertain trajectories, thereby supporting more precautionary and informed spatial decisions. Accordingly, this study analyses historical land-use dynamics and compares future projections generated by the LCM and GeoFLUS models, with a specific focus on their implications for urban expansion processes and regional-scale geotechnical planning.
2. Materials and Methods
2.1. Satellite Image Pre-Processing
In order to analyze land-use and land-cover change, Landsat satellite imagery from two different time periods was employed. Landsat-4/5 TM imagery from 1985 represented the initial period, while Landsat-8/9 OLI/TIRS imagery from 2024 was used for the recent period. For both dates, images acquired in August, corresponding to the lowest cloud-cover conditions and comparable seasonal vegetation stages, were selected. Multiple scenes covering the entire study area were mosaicked to ensure spatial continuity (Table 1).
Table 1.
Datasets used in the land-use change modelling framework.
All satellite images and ancillary datasets were transformed to a common coordinate system (UTM, WGS84) and resampled to a spatial resolution of 30 m to ensure pixel-level consistency across all datasets. Continuous raster layers (e.g., DEM-derived products) were resampled using bilinear interpolation, whereas categorical raster data (e.g., classified land-use maps) were resampled using the nearest-neighbour method to preserve class integrity. No additional spatial filtering or super-resolution techniques were applied in order to avoid the artificial enhancement of spatial detail beyond the native sensor resolution.
Subsequently, a subset operation was applied using the study area boundary to generate a common raster framework aligned to the Landsat grid. This harmonization ensured that all terrain, hydrological, and land-use variables were spatially comparable for subsequent classification and modelling.
To enhance classification performance, five spectral indices were derived from both image sets. Vegetation characteristics were represented by the Normalized Difference Vegetation Index (NDVI), which reflects photosynthetic activity and biomass, and the Soil-Adjusted Vegetation Index (SAVI), which reduces soil background effects in sparsely vegetated areas. The Normalized Difference Water Index (NDWI) was used to emphasize surface water bodies and moisture conditions. Built-up areas were highlighted using the Normalized Difference Built-up Index (NDBI), which captures impervious and urban surfaces, while soil and surface characteristics were represented by the Bare Soil Index (BSI), indicating exposed or sparsely vegetated ground.
These indices were stacked together with the original spectral bands and incorporated into the classification process to improve class separability and reduce spectral confusion among vegetation, urban, water, and bare soil surfaces.
2.2. Land-Use/Land-Cover Classification
Land-use/land-cover maps for 1985 and 2024 were produced using the Support Vector Machine (SVM) algorithm implemented in ArcGIS Pro 3.6. SVM was selected due to its robustness in handling high-dimensional, multi-band satellite data and its ability to delineate complex non-linear decision boundaries with limited training samples.
Six land-use classes were defined: built-up areas, agricultural land, forest, mixed vegetation, bare land, and water bodies [34]. Given the spectral heterogeneity within each class, land-use categories were initially subdivided into three sub-classes to better capture internal variability. Approximately forty training polygons were digitized for each sub-class. Training data selection considered topographic variability, the representation of different landforms, and seasonal vegetation characteristics within the study area. During model parametrization, the “samples per class” parameter was set to 700 to ensure balanced representation across classes.
Following classification, sub-classes were merged to reconstruct the six primary land-use categories. Classification accuracy was evaluated for both years using confusion matrices, producer’s and user’s accuracies, and the Kappa coefficient. The Kappa coefficient was used to measure the level of agreement between the classified maps and reference data beyond that expected by random chance, providing a robust indicator of classification reliability.
The average Kappa value of approximately 0.89 indicates a high level of classification accuracy and consistency, confirming that the derived land-use maps provide a reliable basis for subsequent change analysis and spatial simulation using both the Land Change Modeler and GeoFLUS frameworks.
2.3. Driving Variables
Spatial driving variables used in future land-use simulations were determined based on the existing literature and field observations within the study area [18]. In addition to their role in shaping land-use dynamics, these variables also influence near-surface soil behaviour, drainage conditions, and geomorphological stability, which are critical for geotechnical planning. The spatial structure of settlement, agriculture, forest cover, and transportation networks in Adapazarı suggests that land-use transitions are primarily controlled by topographic gradients, surface hydrology, accessibility, and the attraction effects of existing land-use activities [9].
Accordingly, both natural and anthropogenic drivers were incorporated into the modelling framework, including elevation, slope, distance to rivers, distance to roads, distance to settlements, distance to urban centres, distance to agricultural areas, and distance to activity areas. Elevation and slope were included to represent geomorphological constraints affecting soil thickness, sediment accumulation, and slope stability, while distance to rivers was used as a proxy for groundwater dynamics, flood susceptibility, and alluvial deposition zones. Accessibility-related variables (distance to roads and urban centres) reflect development pressure, which is commonly associated with soil sealing, compaction, and excavation processes in expanding urban areas.
Activity areas comprise industrial facilities, commercial centres, sports complexes, and public service units that directly influence land-use transformation dynamics and impose additional loading and disturbance on shallow soil layers. Elevation information was extracted from an ALOS PALSAR-based Digital Elevation Model and used to compute slope rasters. Road networks, rivers, and settlement data were acquired from the OpenStreetMap platform. Prior to rasterisation, all vector datasets underwent topological cleaning to ensure spatial consistency.
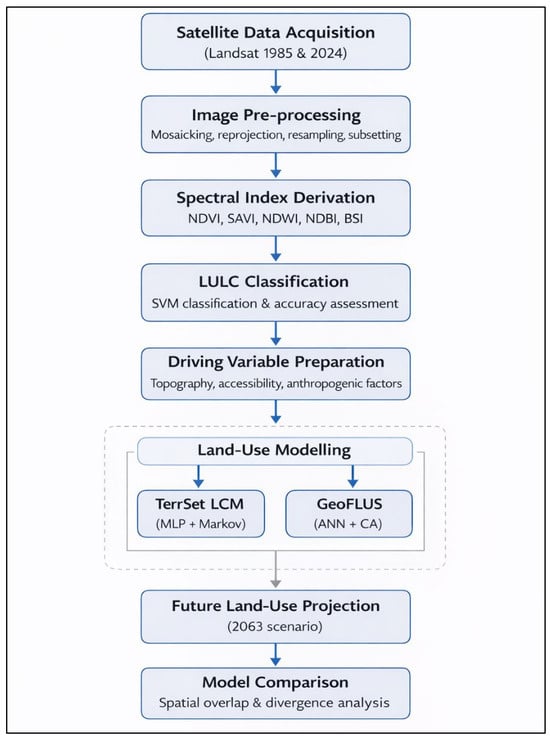
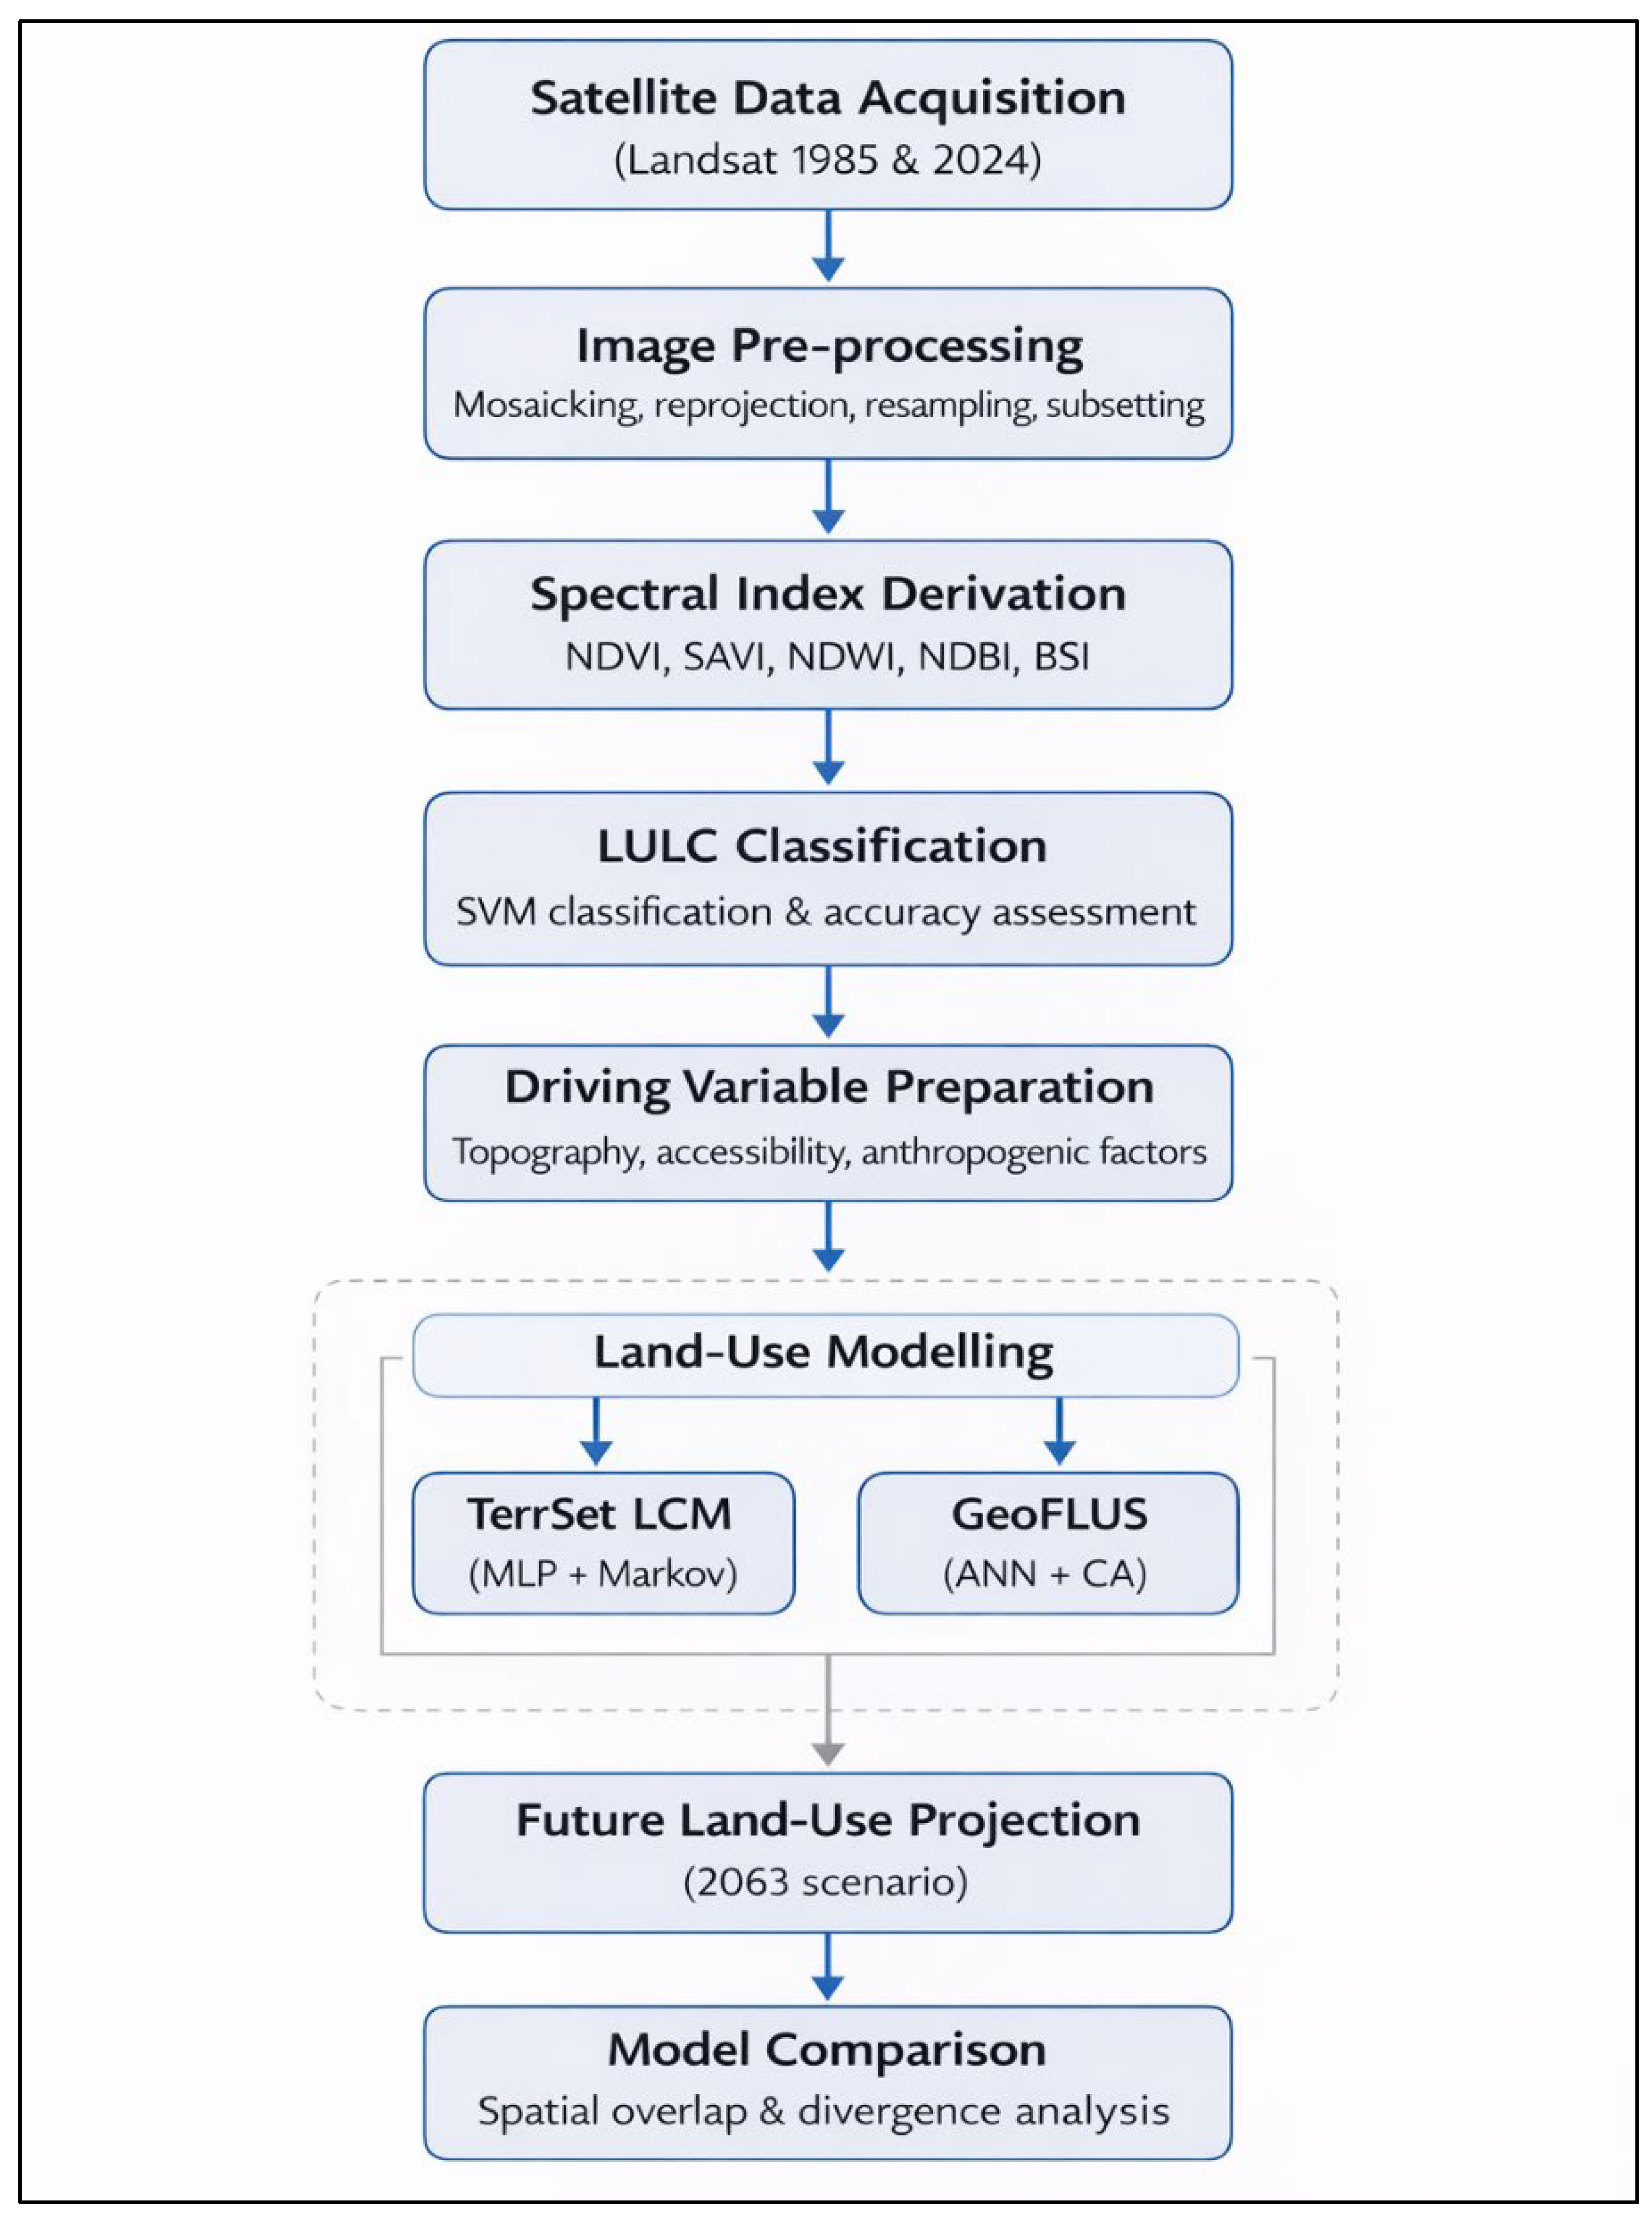
All driving variables were resampled to 30 m resolution, aligned with the Landsat grid, clipped to the study boundary, and harmonized at the pixel level. This spatial harmonization ensures that the terrain, hydrological, and accessibility factors influencing both land-use change and geotechnical conditions are consistently represented at the regional scale. To assess the relationship between driving variables and land-use transitions, Cramer’s V coefficients were calculated, allowing for the relative contribution of each variable to class transitions to be quantitatively evaluated [35]. This workflow follows established practices in land-use change modelling and is consistent with comparable applications in similar regional contexts (Figure 1).
Figure 1.
Workflow of the land-use change modelling.
2.4. TerrSet Land Change Modeler (LCM)
The Land Change Modeler (LCM) module within the TerrSet software v.20 was used to analyze both the quantitative and spatial components of land-use change [36]. In the first stage, land-use maps from 1985 and 2024 were compared to calculate class-based gains, losses, and net changes. Subsequently, a Markov chain approach was applied to generate a transition probability matrix representing the likelihood of land-use conversions after 2024 under the assumption of stationary long-term transition tendencies.
In order to model transition potentials, a Multilayer Perceptron (MLP) neural network was employed. The dataset was divided equally into training and validation subsets. The network architecture consisted of a single hidden layer with ten neurons. During training, model weights and bias values were iteratively updated by minimizing the error function, with the training process running for up to 1000 iterations. Network parameters were optimized using TerrSet’s automated optimization routines.
The resulting MLP-based transition potential surfaces were integrated with Markov land demand within a cellular automata framework to generate a land-use projection for the year 2063. This projection reflects the extrapolation of land-use change rates observed over the 1985–2024 period, corresponding to a 39-year temporal interval, and should therefore be interpreted as a scenario-based representation rather than a deterministic forecast.
2.5. GeoFLUS Modelling
In order to validate LCM results and enable comparison with an alternative algorithmic approach, the same dataset was analyzed using the GeoSOS-FLUS (GeoFLUS) model [37]. GeoFLUS integrates Markov chains, artificial neural networks, and cellular automata to simulate land-use change by jointly considering probabilistic transition tendencies and spatial neighbourhood effects. Compared to LCM, GeoFLUS provides a more flexible decision-making structure by explicitly accounting for spatial competition among land-use classes.
Transition probabilities were calculated using the “ANN-based probability-of-occurrence” module. Uniform sampling was applied with a sampling ratio of 1/1000, and the neural network architecture consisted of a single hidden layer with twelve neurons. Model training produced root mean square error (RMSE) values ranging between 0.18 and 0.19, which indicate the relative goodness-of-fit between observed land-use patterns and modelled occurrence probabilities within the normalized GeoFLUS framework.
Because the probability surfaces are internally standardized within the software environment, RMSE values are reported as relative performance indicators rather than absolute prediction errors in physical units. Lower RMSE values correspond to improved representation of transition likelihoods and reduced calibration uncertainty. These values are consistent with comparable GeoFLUS applications reported in the literature and were therefore considered acceptable for scenario-based spatial simulation.
The resulting probability surfaces were combined with Markov-based land demand and incorporated into the cellular automata structure to generate the 2063 land-use scenario.
2.6. Model Comparison
Land-use projections for 2063 generated by TerrSet LCM and GeoFLUS were compared using the same class schema, spatial resolution, and study area extent. Raster-based comparison techniques were applied to evaluate class-specific area changes, spatial overlap ratios, and spatial divergence patterns between the two models.
Difference maps were produced to visualize areas of convergence and discrepancy, enabling assessment of how each modelling framework simulates land-use change processes and identifies zones of agreement and uncertainty. This comparative approach provides a basis for evaluating model behaviour, structural sensitivity, and scenario uncertainty, supporting interpretation of future land-use outputs in the context of spatial planning and engineering-oriented decision-making.
2.7. Study Area
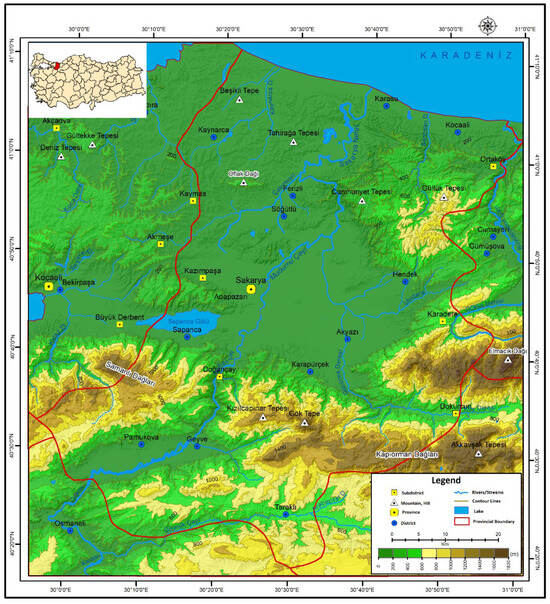
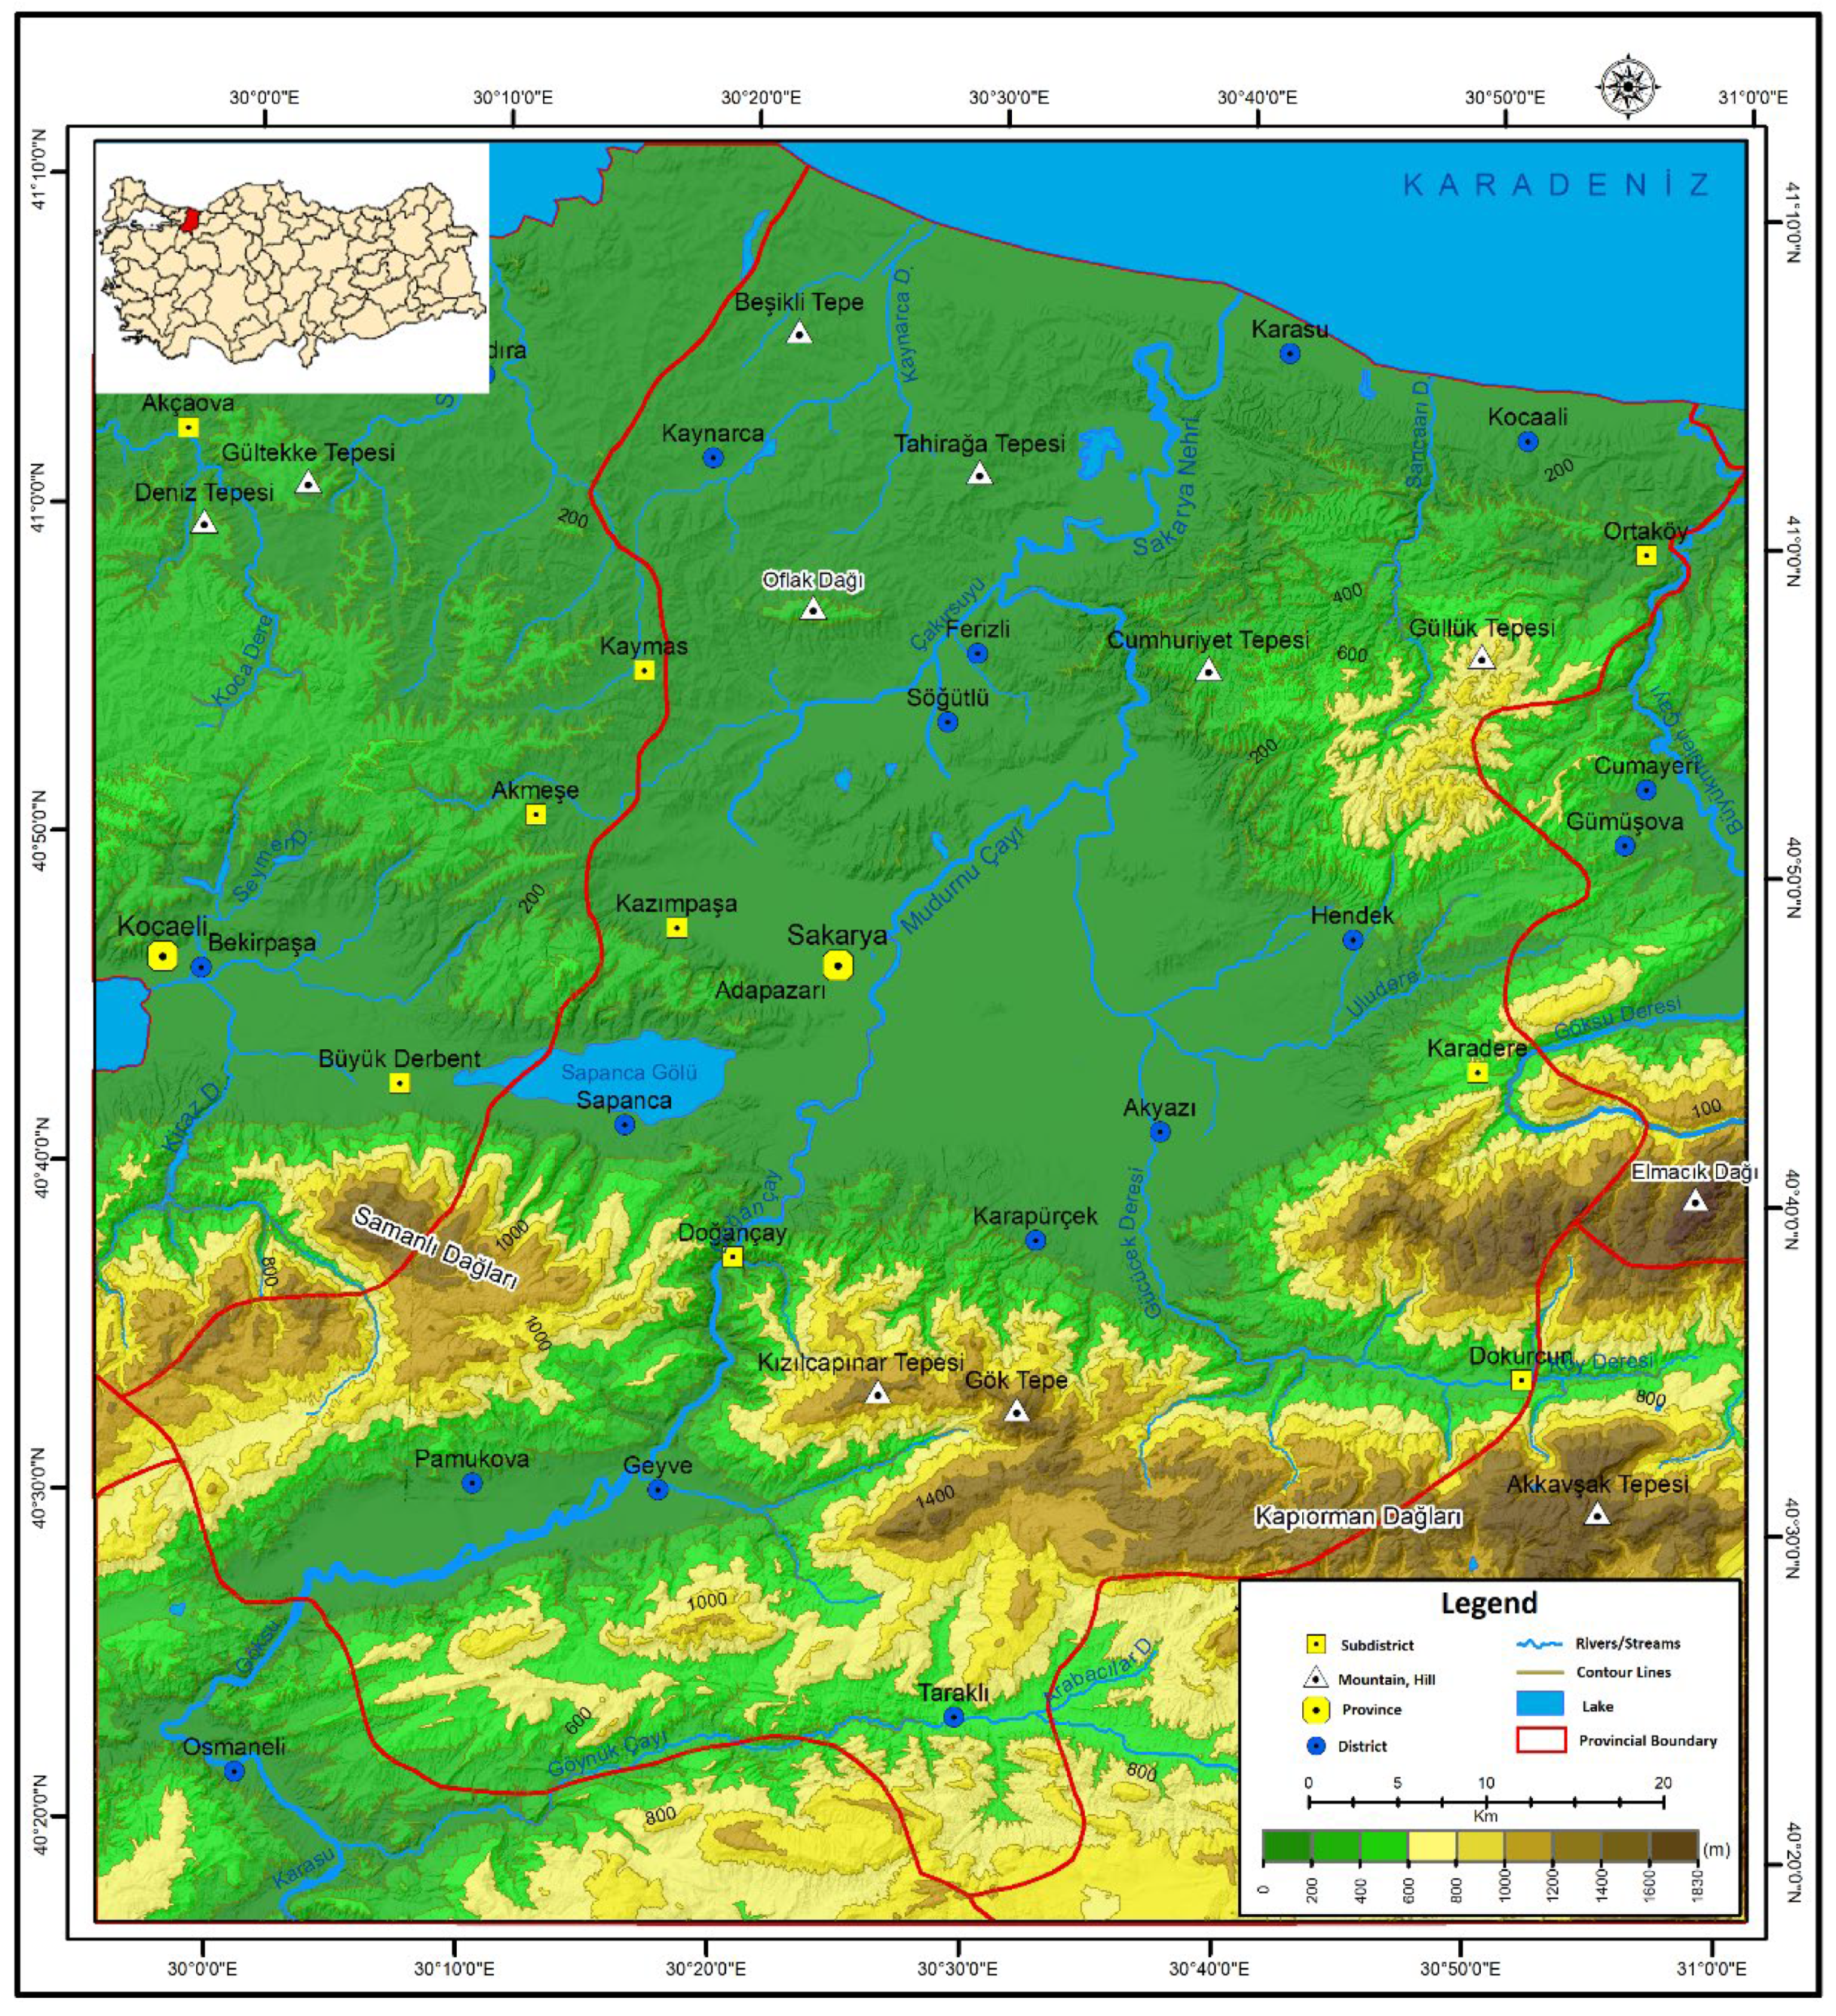
The study area is located within Sakarya Province in northwestern Turkey (40°17′–41°13′ N, 29°57′–30°53′ E), occupying a strategic corridor between the Marmara Region and the Western Black Sea basin. Sakarya comprises 16 districts and spans a projected surface area of approximately 4821 km2, serving as a critical junction for agricultural, industrial, and ecological systems. Its geographic setting encompasses tectonically active mountain ridges (e.g., Samanlı and Keremali Mountains), broad alluvial plains (notably, the 620 km2 Sakarya Plain), hydrological assets such as the Sakarya River and Sapanca Lake, and multiple wetlands such as the Acarlar Floodplain Forest (Figure 2).
Figure 2.
Topographic and administrative map of the study area.
Topographically, the area displays a marked transition from rugged terrain in the south to flat lowlands in the north, reflecting complex geomorphic evolution shaped by active tectonics and fluvial processes. The İzmit-Sapanca trough and the Geyve Valley represent dominant structural depressions formed under Quaternary subsidence dynamics associated with the North Anatolian Fault (NAF). The NAF transects the study area from east to west, precisely passing beneath Sapanca Lake and forming a boundary condition for both seismic hazard and sedimentary architecture [38,39].
Geologically, the region belongs to the Sakarya Composite Terrane, which includes Paleozoic metamorphic basement units (e.g., Soğuksu and Karadere Formations) overlain by Mesozoic to Cenozoic sedimentary sequences. These include Ordovician quartzites, Devonian carbonates (e.g., Yılanlı Formation), and Eocene flysch deposits (e.g., Çaycuma and Akveren Formations), with intercalated volcanics and local unconformities. The stratigraphic succession reflects polyphase tectonism driven by the closure of the Neotethys Ocean and the Alpine orogeny, resulting in intense folding, faulting, and metamorphism, which are particularly visible in the Armutlu-Ovacık Zone and Pontid Arc structures [40,41].
From a geotechnical perspective, the area is characterized by spatially variable subsurface conditions, including Holocene alluvial fans, fluvial terraces, and swamp deposits prone to liquefaction, differential settlement, and slope instability [42]. The pull-apart basin geometry induced by strike-slip faulting has facilitated the accumulation of up to 300 m of unconsolidated sediments in parts of the Adapazarı depression, posing engineering challenges for urban expansion and infrastructure development [43]. Extensive agricultural land in the lowlands has been progressively urbanized since the 1980s, further complicating the hydrogeological and mechanical behaviour of the subsurface [44]. This complex interplay between tectonics, surface hydrology, and land-use change makes Sakarya an ideal natural laboratory for exploring future LULC transitions and their geotechnical implications under different simulation models. The availability of multi-temporal satellite imagery, high-resolution DEMs, and geological-geotechnical maps supports a detailed, spatially explicit analysis of urban growth patterns and hazard-sensitive planning scenarios.
The region was also severely affected by the 1999 Mw 7.4 Kocaeli earthquake, which caused widespread structural damage and exposed the vulnerability of built environments to seismic and geotechnical hazards. In the post-disaster period, reconstruction processes, the expansion of three organized industrial zones, and the presence of two major universities have contributed to sustained population growth driven by both labour- and education-related migration. These dynamics have intensified land-use pressure and accelerated urban transformation, increasing the importance of scenario-based land-use modelling for long-term, risk-sensitive spatial planning.
3. Results
3.1. Explanatory Power of Driving Variables
The explanatory power of site and driving variables was quantified using Cramer’s V statistics. All variables exhibit statistically significant associations with land-use transitions (p < 0.001), confirming their relevance for inclusion in the modelling framework (Table 2).
Table 2.
Explanatory power of site and driving variables used in the land-use change model.
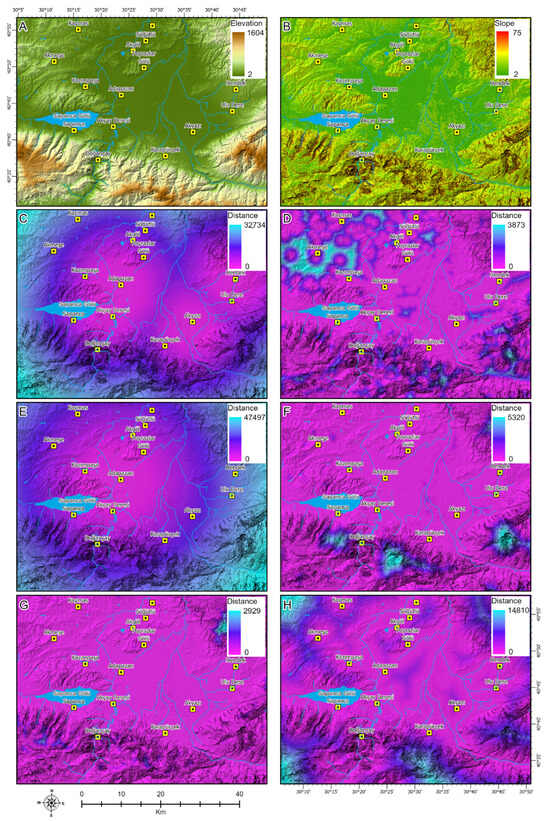
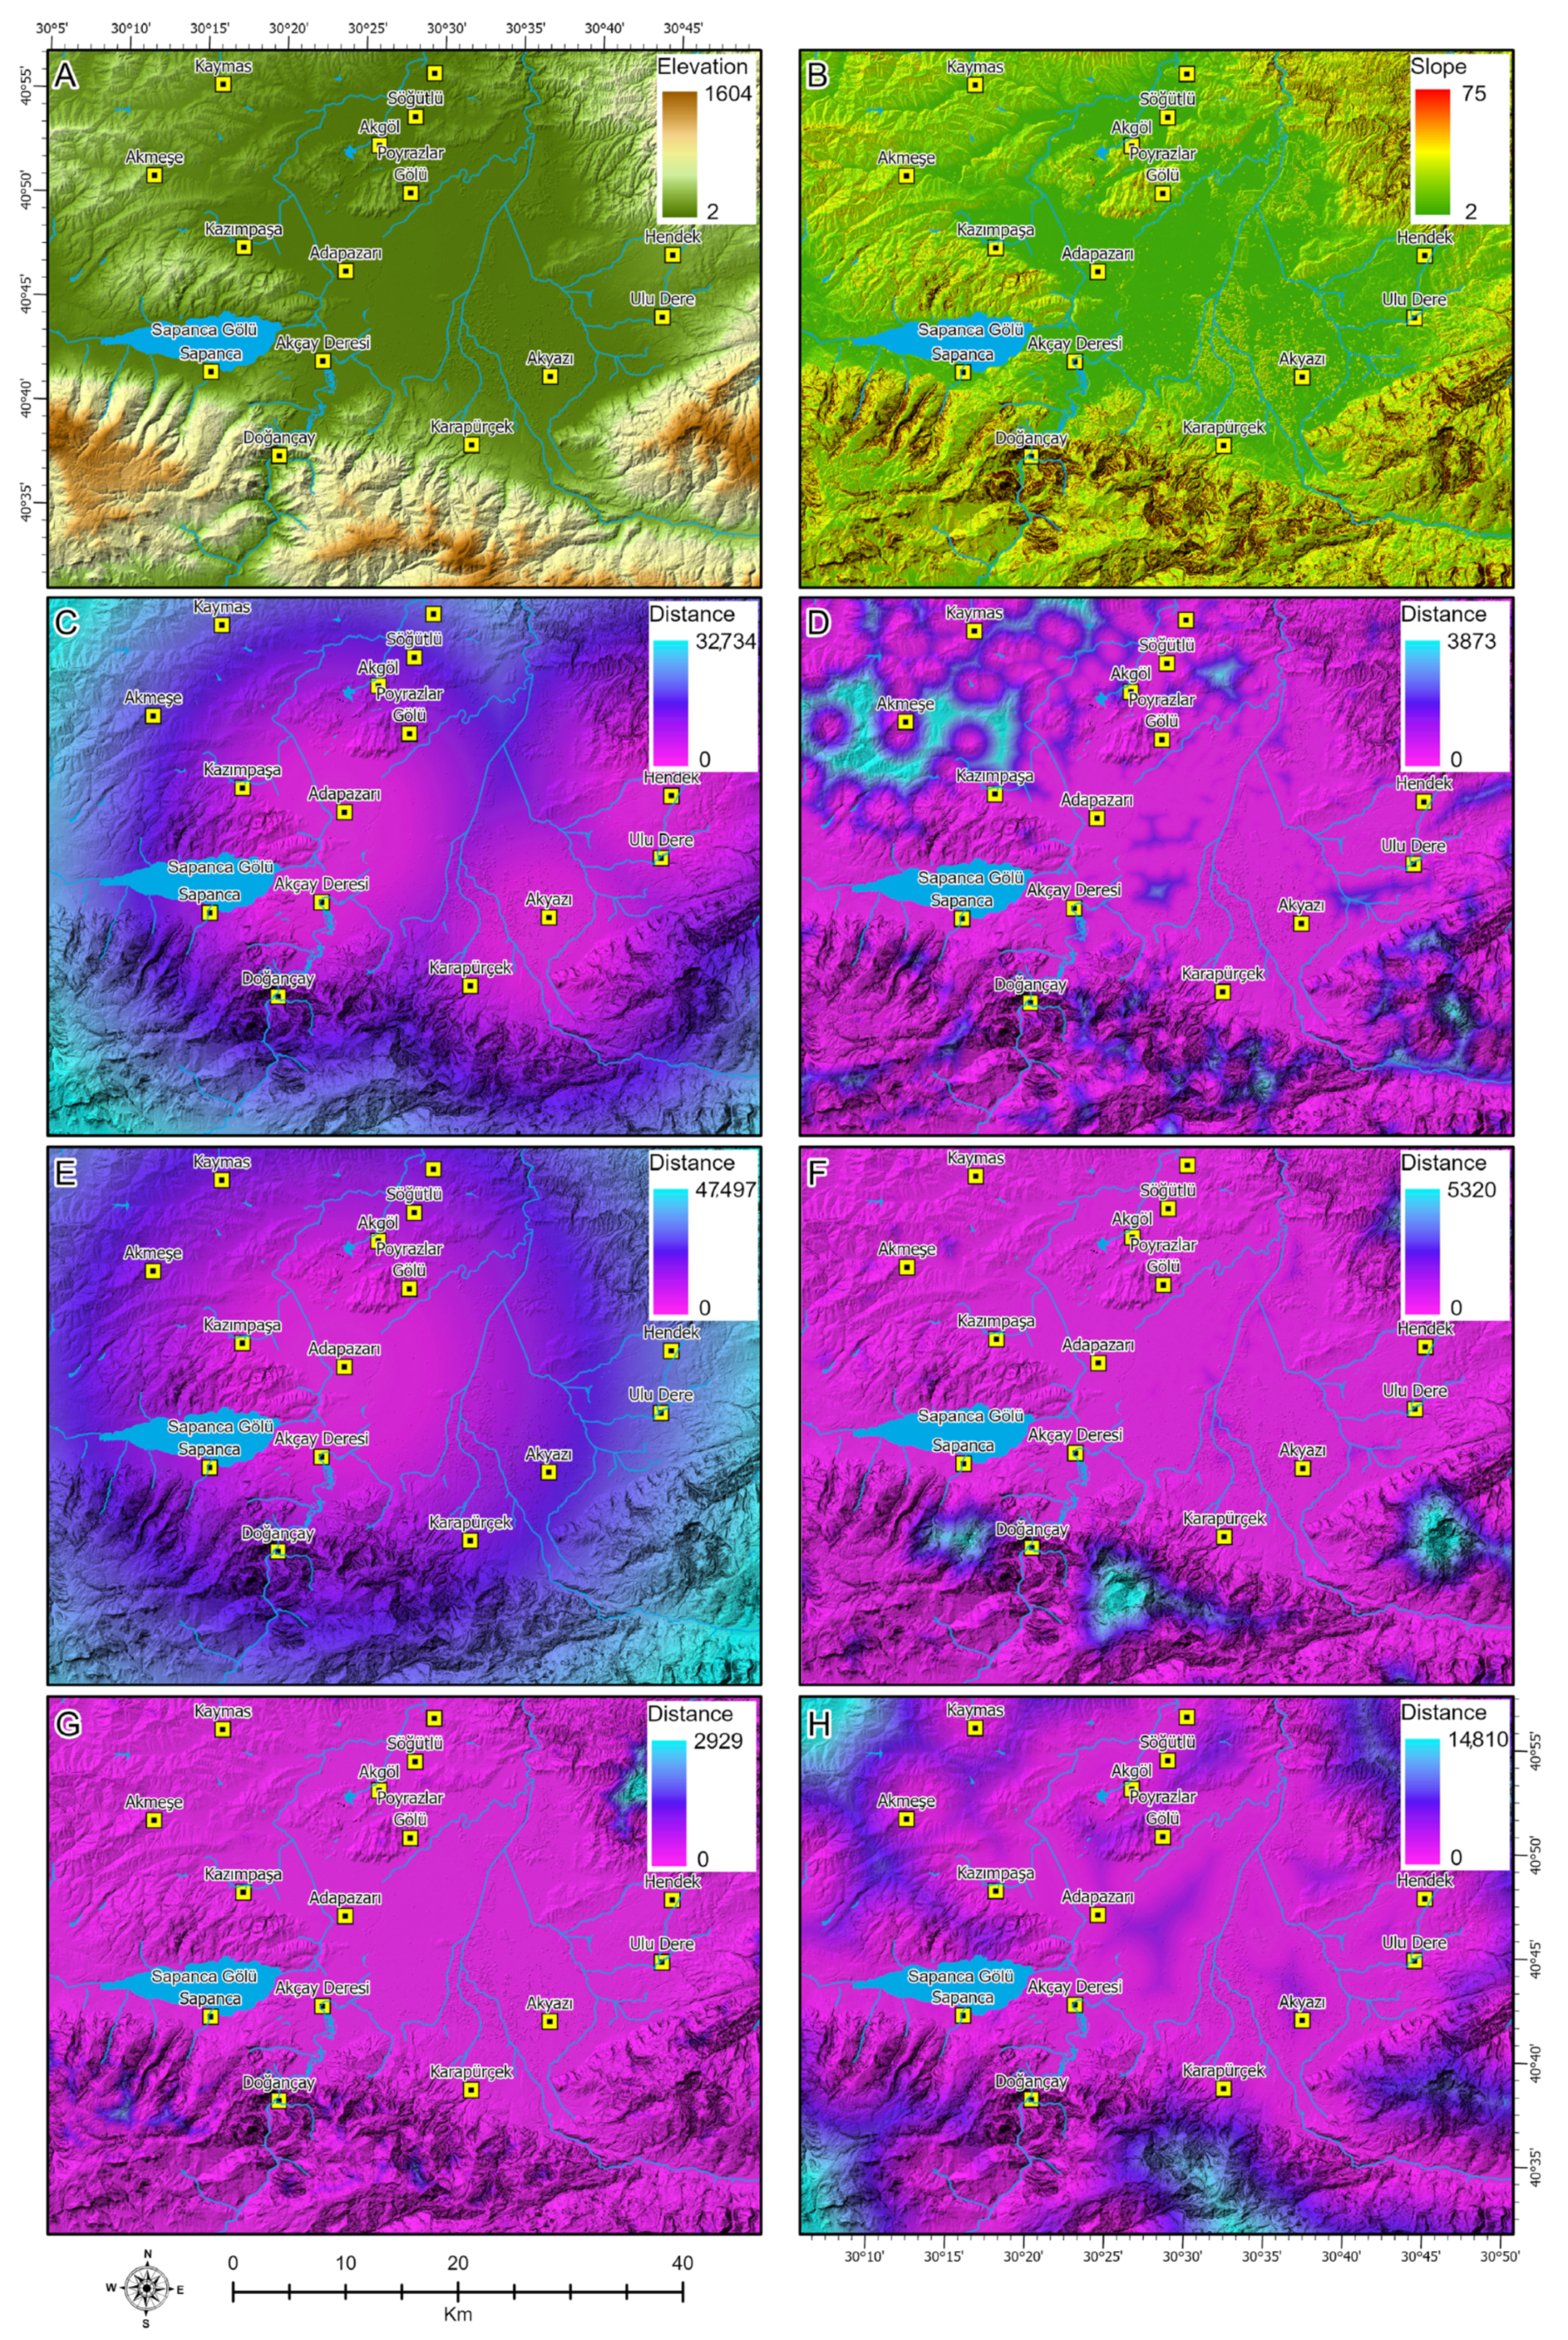
Among the evaluated drivers, elevation (DEM) demonstrates the strongest overall explanatory strength (Cramer’s V = 0.4826). Its particularly high association with forest (0.5651) and agricultural land (0.4808) indicates that topographic constraints exert a dominant control on land-use distribution and transition patterns. Proximity to roads (Cramer’s V = 0.4625) and activity areas (0.4501) also show high explanatory capacity, especially for artificial surfaces (0.2333 and 0.3583, respectively), reflecting the influence of accessibility and concentrated human activities on urban expansion processes. Distance to streams (0.4442) and urban areas (0.4216) exhibit moderate to strong associations, primarily affecting transitions involving forest and agricultural classes. Slope presents a lower but still statistically significant explanatory contribution (0.2702), suggesting a secondary but non-negligible role in shaping land-use transitions, particularly in relation to agricultural suitability. Distance to agricultural areas displays the weakest overall association (0.0774); however, it was retained to preserve spatial completeness and to account for cumulative and indirect effects within the modelling framework. The spatial distribution of these driving variables highlights pronounced gradients across the study area (Figure 3). Elevation and slope exhibit clear contrasts between lowland plains and surrounding uplands, while distance-based variables reveal accessibility patterns structured around transportation corridors, urban centres, and activity nodes. Together, these spatial patterns provide a consistent and statistically supported basis for subsequent land-use simulations using both LCM and GeoFLUS models.
Figure 3.
Spatial distribution of driving variables used in the land-use change models: (A) elevation (DEM), (B) slope, (C) distance to roads, (D) distance to streams, (E) distance to urban areas, (F) distance to activity areas, (G) distance to agricultural areas, and (H) distance to city centre. Each distance map represents continuous proximity gradients expressed in metres or kilometres, as indicated in the legends. Due to variable spatial extents and functional roles of each driver, value ranges differ among panels and are interpreted individually rather than through direct visual comparison.
3.2. Classification Performance and Model Reliability
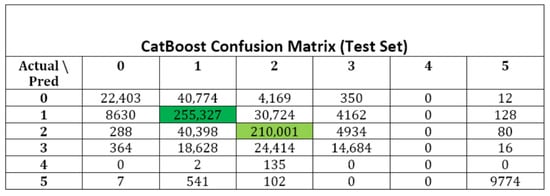
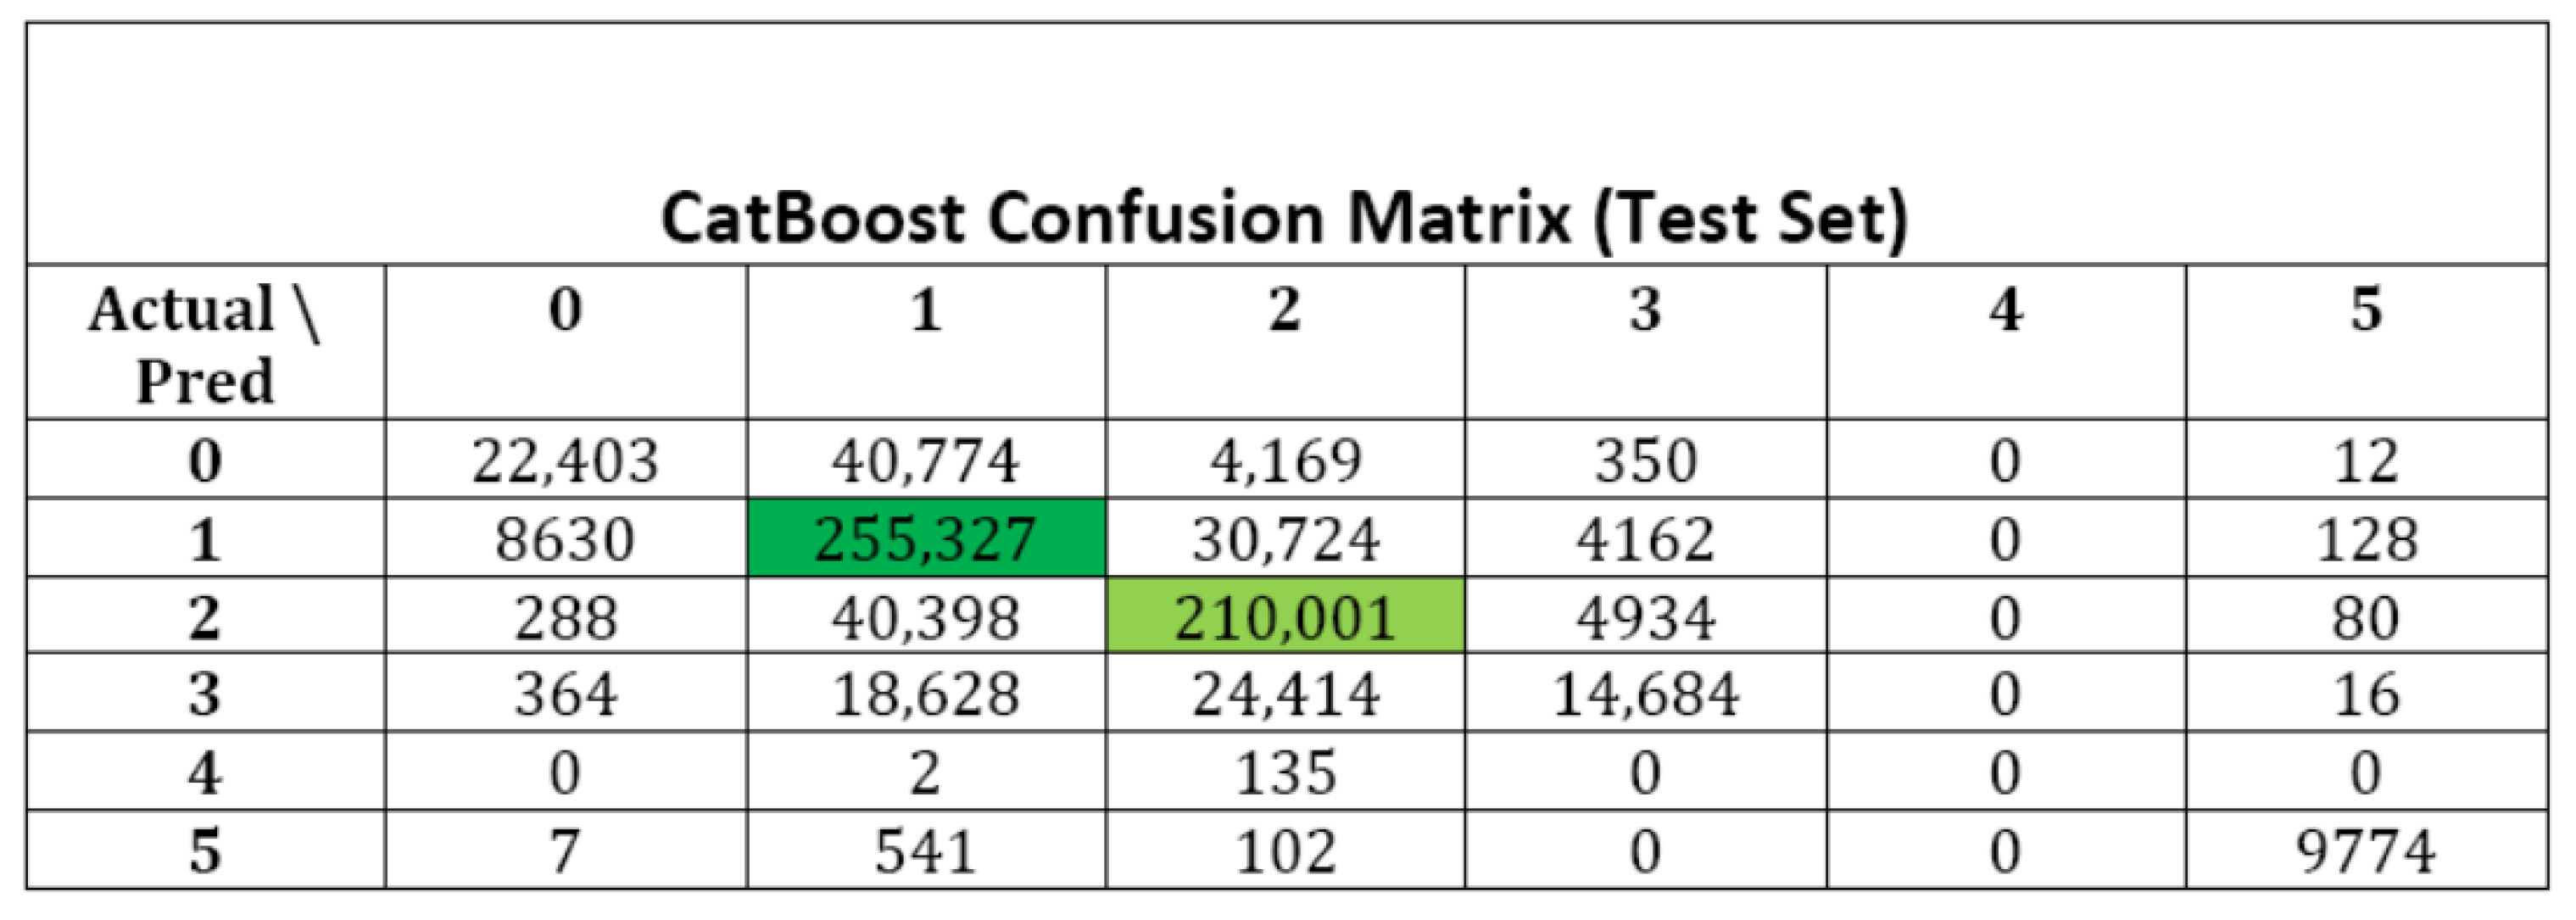
Classification performance was evaluated using a CatBoost-based validation framework. The confusion matrix indicates strong overall classification accuracy, particularly for dominant land-use classes such as agriculture and forest (Figure 4). Agricultural land shows the highest number of correctly classified pixels (255,327), followed by forest (210,001), reflecting robust class separability. Misclassifications are mainly observed between agriculture and mixed vegetation, with 40,398 mixed vegetation pixels classified as agriculture and 30,724 agricultural pixels classified as forest. These confusions primarily reflect spectral similarity and transitional landscape characteristics rather than systematic classification errors. Water bodies and bare land show near-perfect separability, with minimal confusion across other classes. Overall, the classification results provide a reliable basis for land-use change analysis and future simulations.
Figure 4.
Confusion matrix of land-use classification performance. Land-use classes: 0 = Built-up; 1 = Agriculture; 2 = Forest; 3 = Mixed vegetation; 4 = Bare land; 5 = Water bodies. Colour scale represents pixel count.
3.3. Relative Importance of Driving Variables
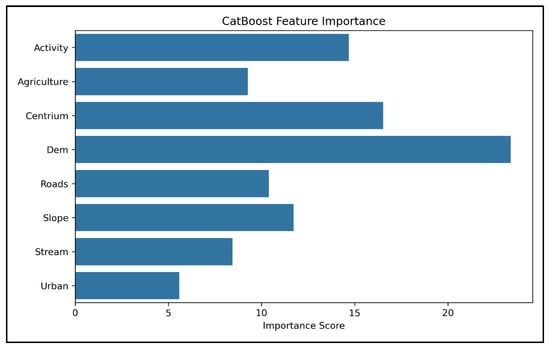
Feature importance analysis derived from the CatBoost model further clarifies the relative influence of individual drivers on land-use transitions (Figure 5). Elevation emerges as the most influential variable with an importance score exceeding 23, substantially higher than all other predictors. The importance score of elevation exceeds that of the second-ranked variable by a substantial margin, indicating a markedly dominant influence on land-use transition dynamics. Proximity to urban centres (Centrium) and activity areas follow with importance scores of approximately 16 and 15, respectively, emphasizing the combined role of centrality and anthropogenic attraction in shaping land-use dynamics. Roads and slopes contribute at intermediate levels, with importance scores ranging between 10 and 12, while streams and urban proximity display lower but non-negligible contributions. The ranking confirms that land-use change is governed by an interaction between biophysical constraints and accessibility-driven human pressures.
Figure 5.
Relative importance of driving variables derived from the CatBoost model.
3.4. Historical Land-Use Change (1985–2024)
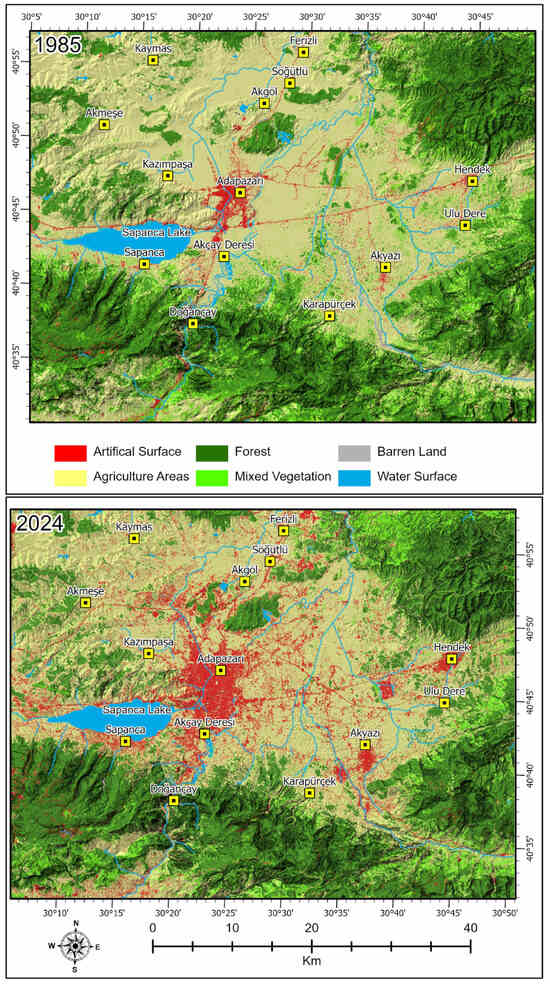
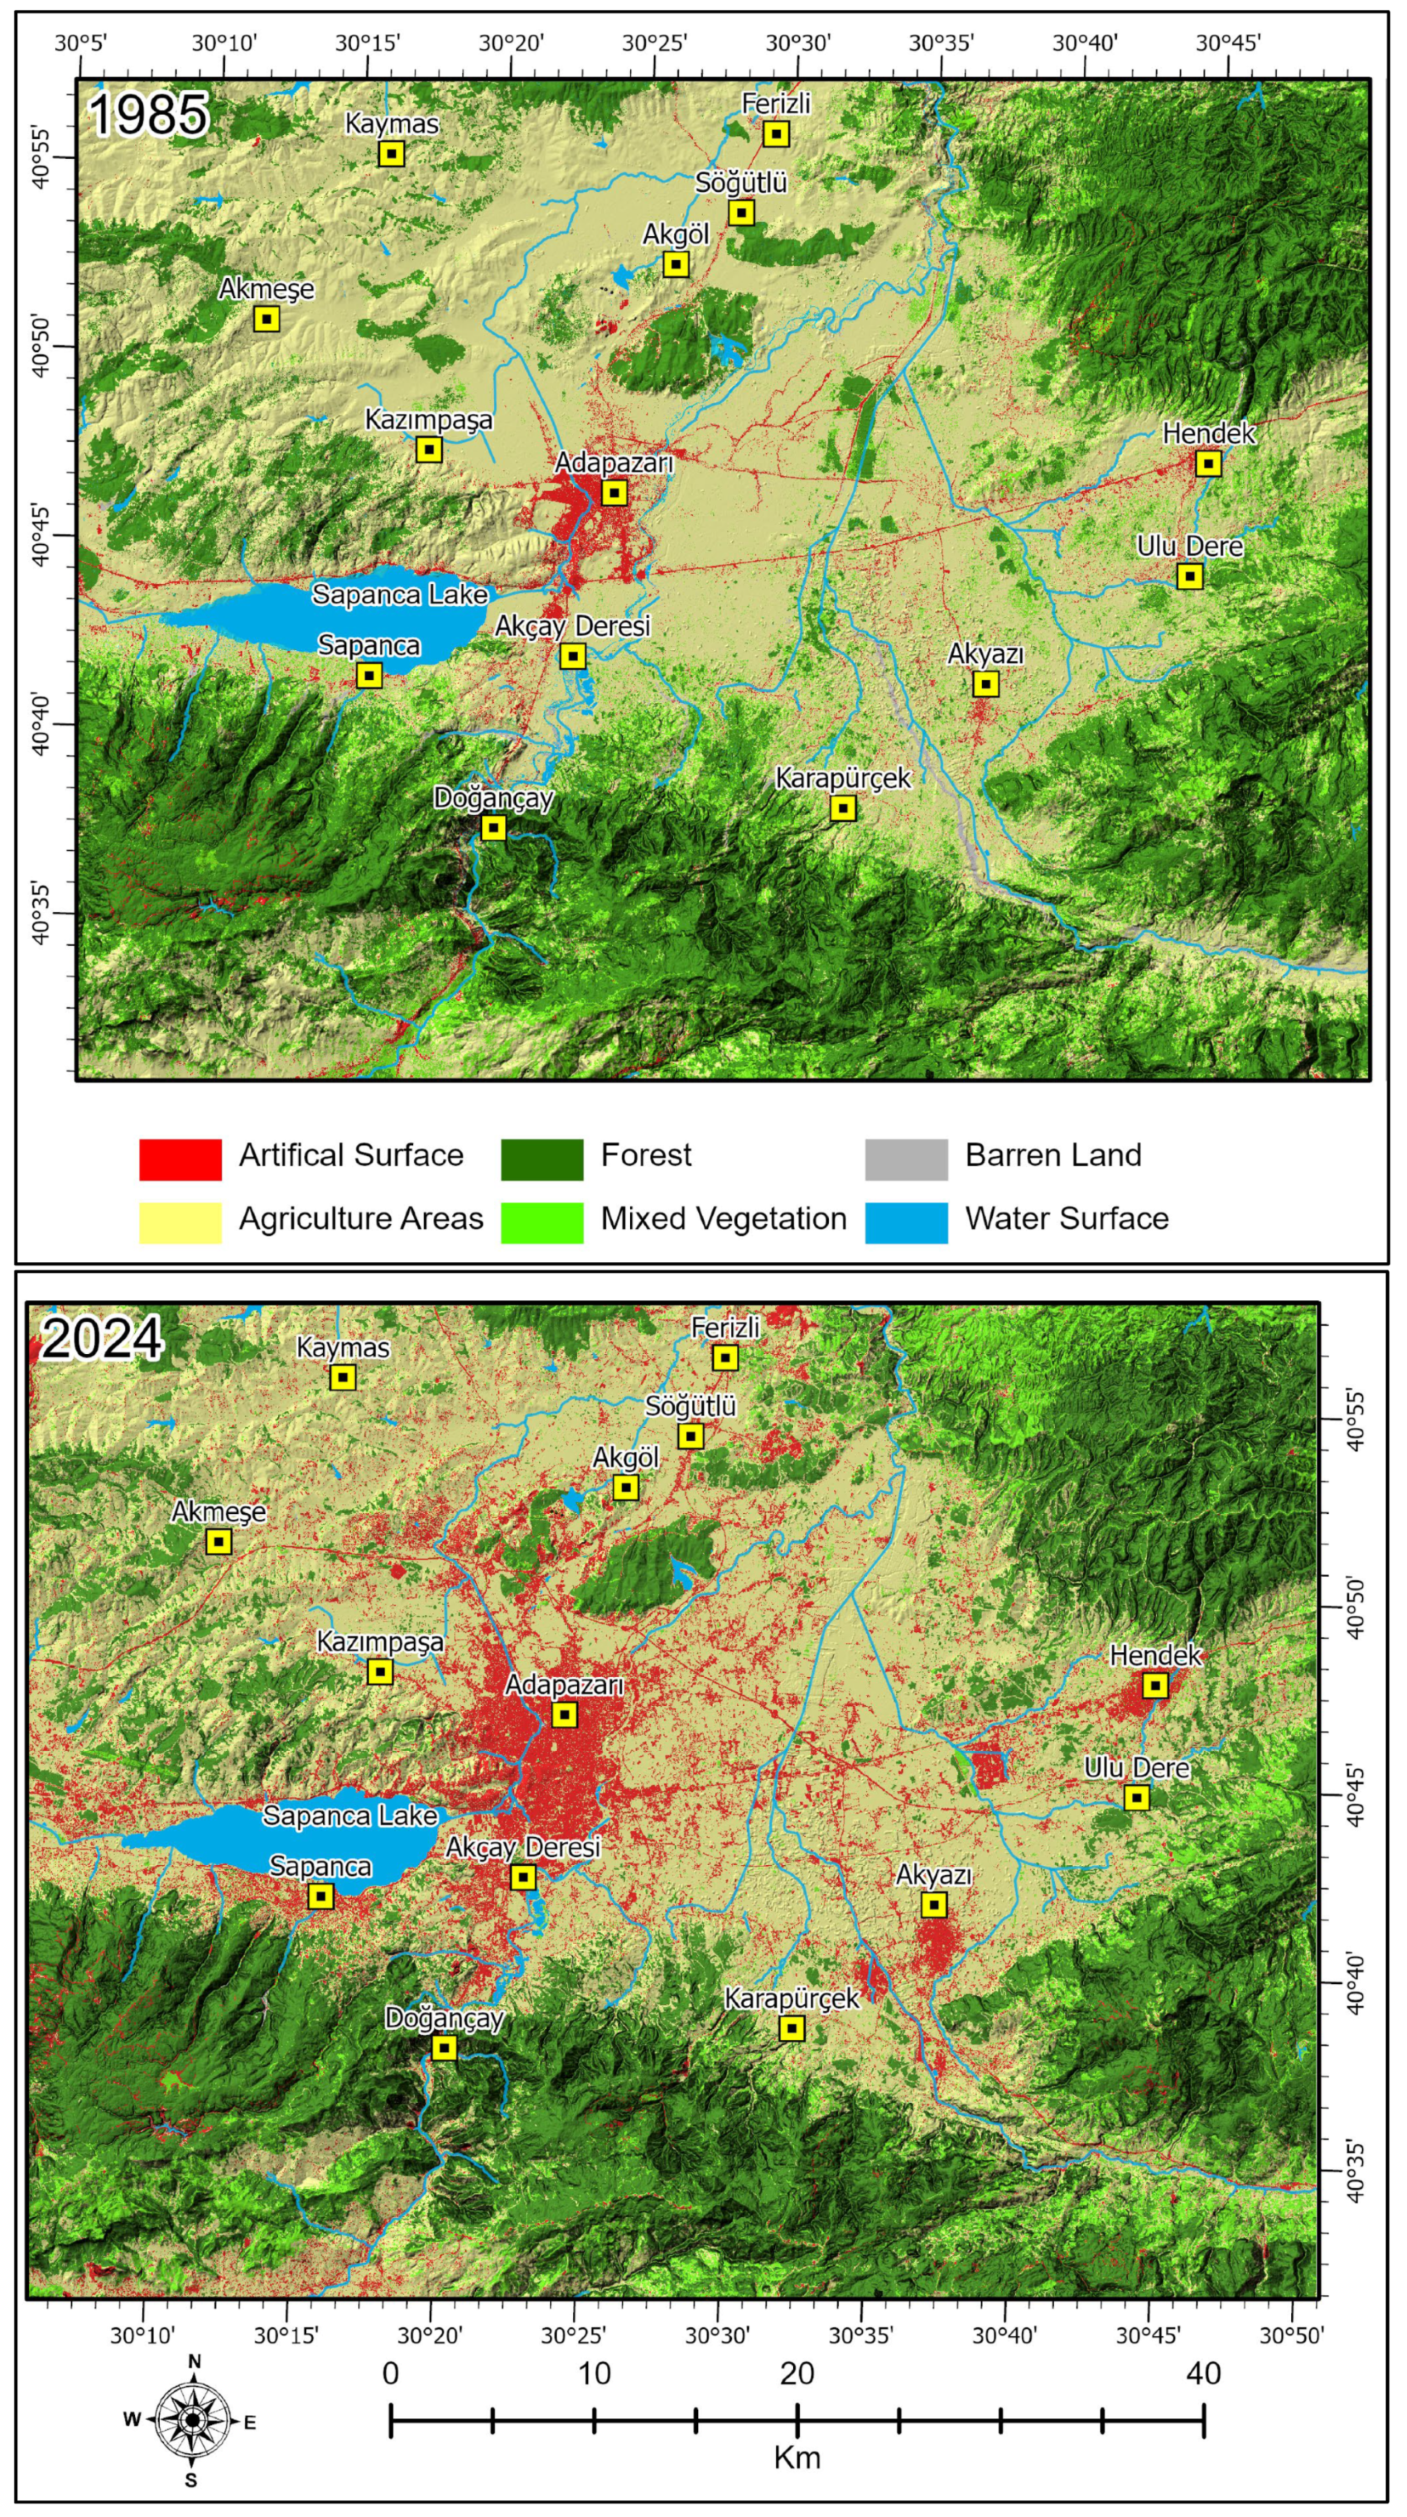
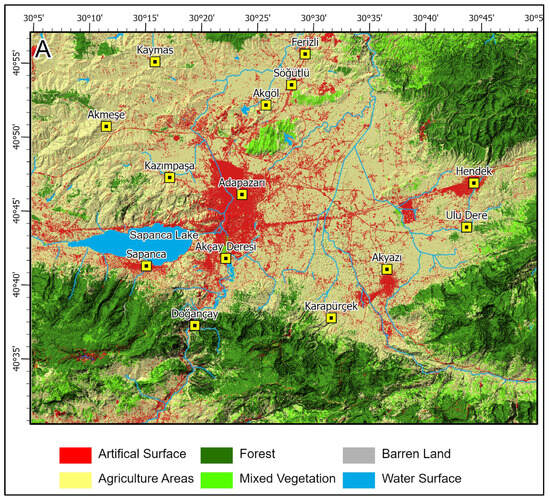
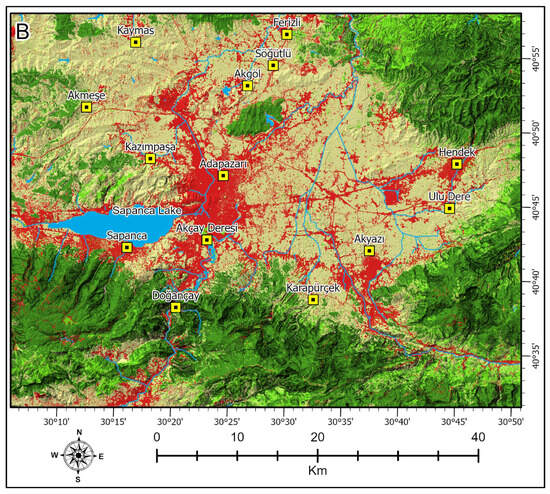
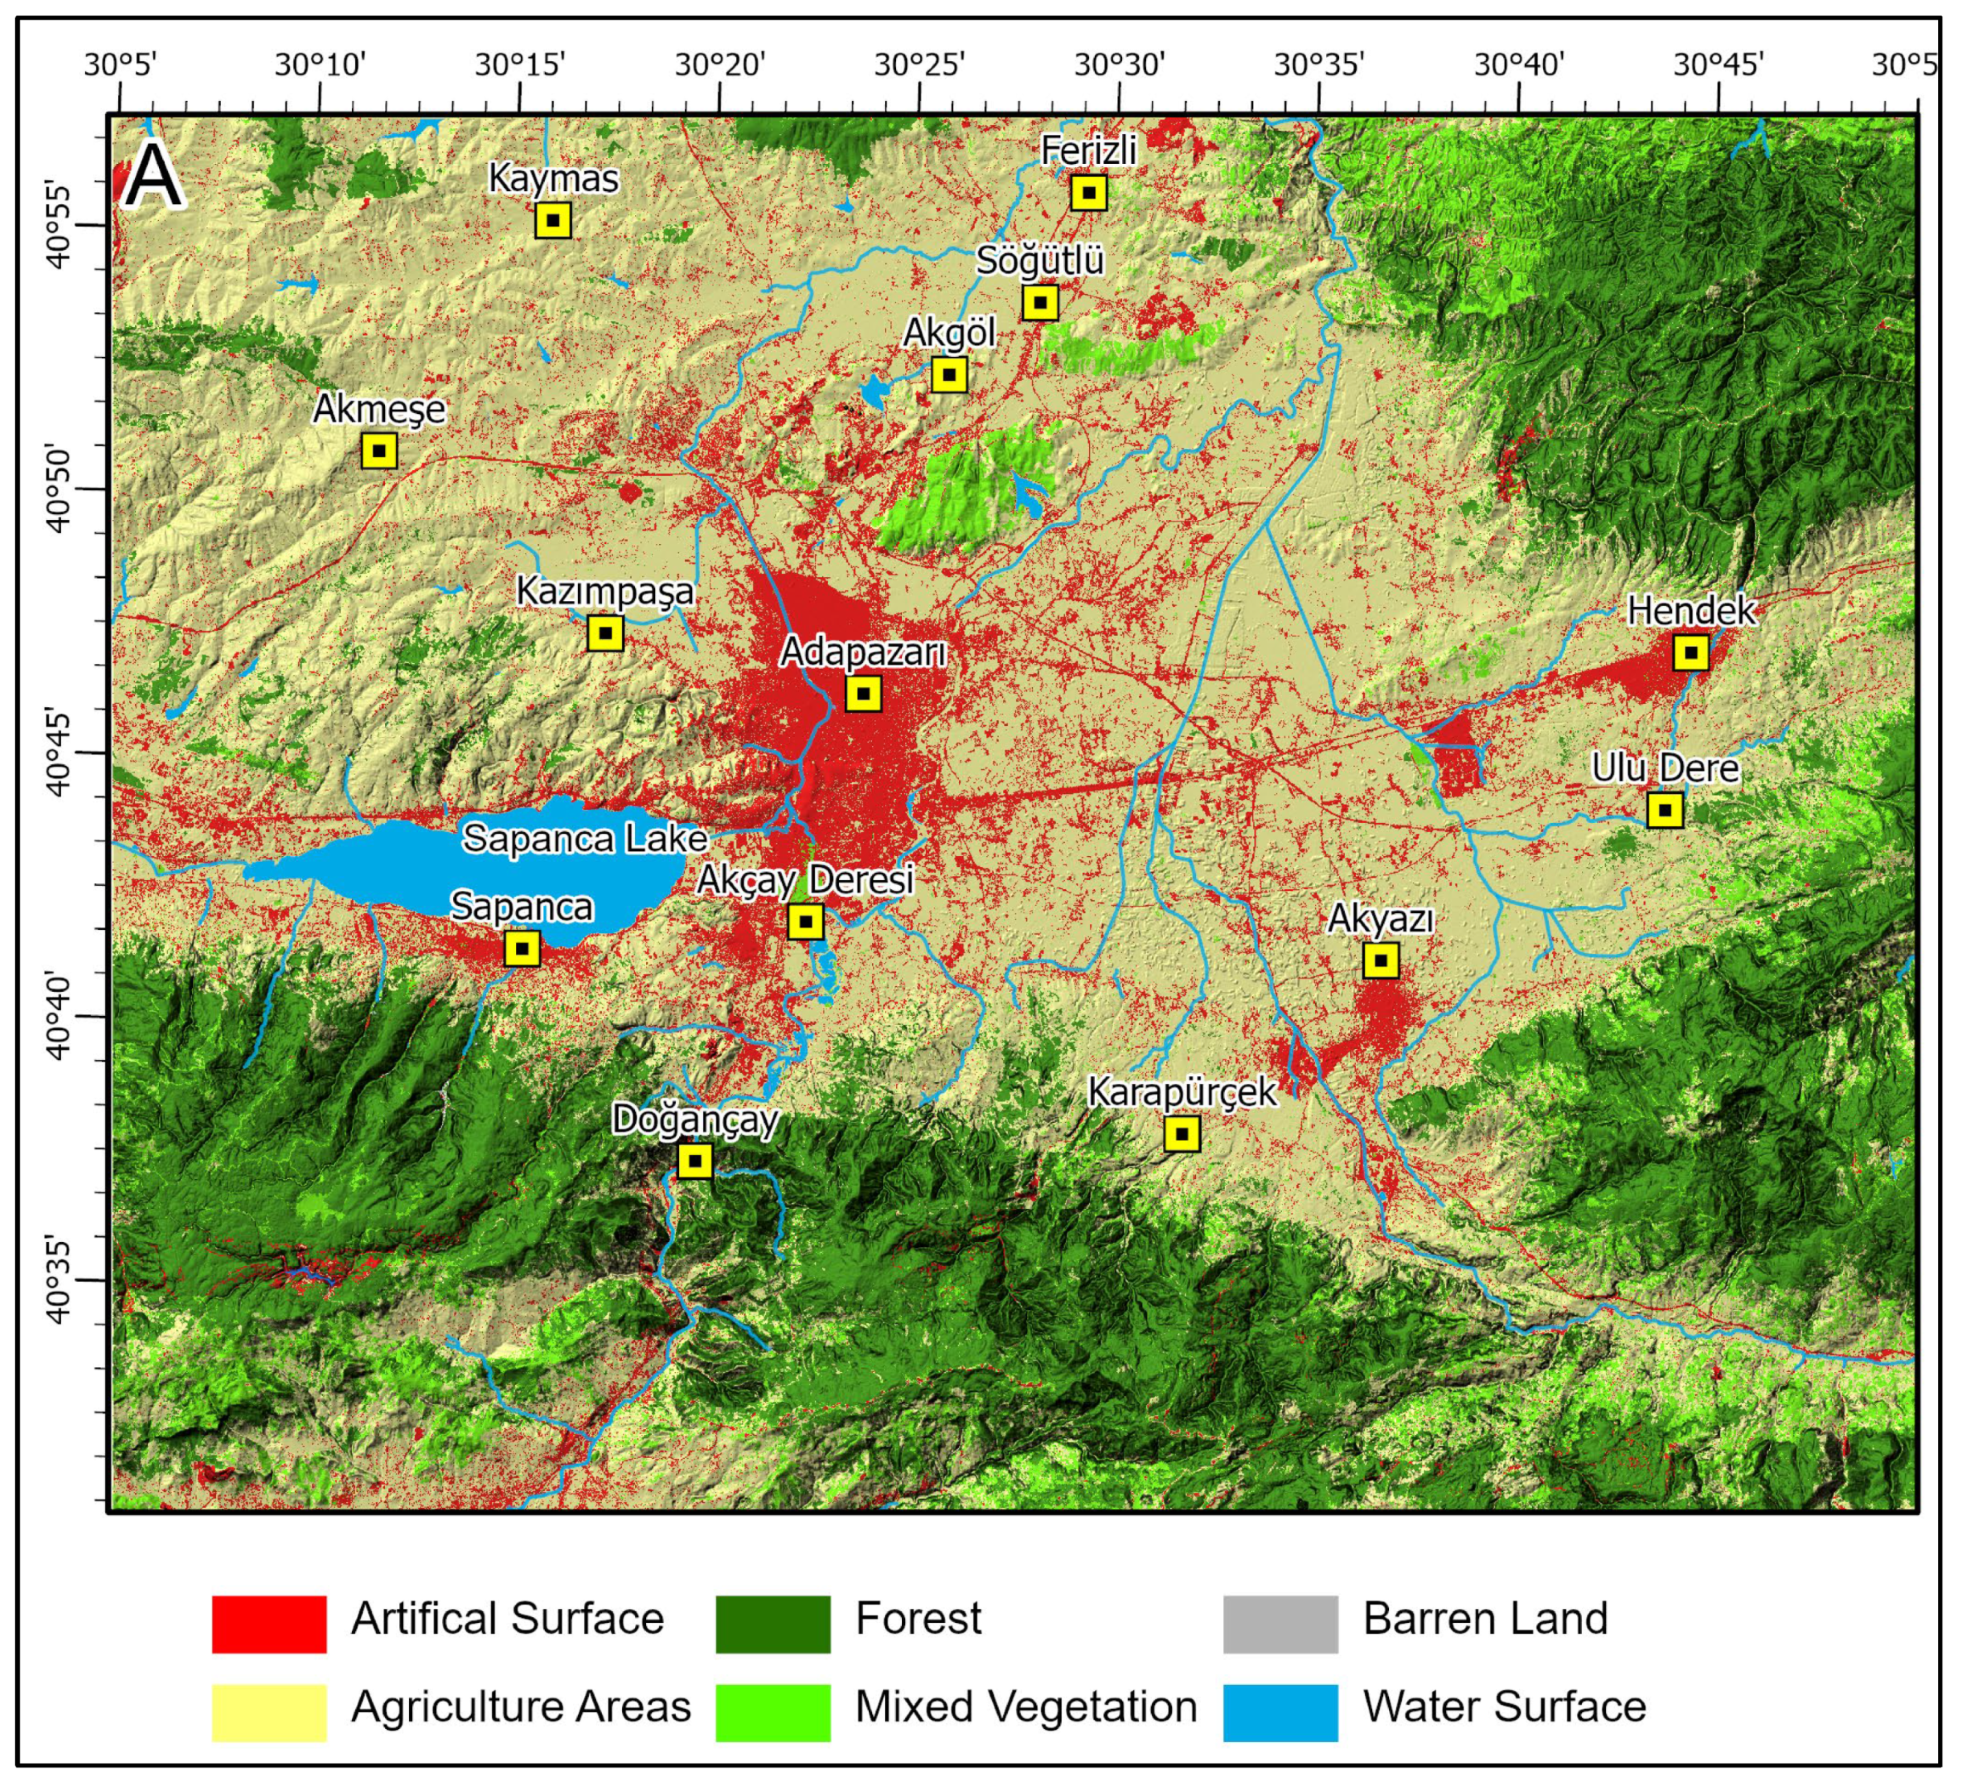
A comparison of the land-use maps from 1985 and 2024 reveals substantial long-term landscape transformation across the study area. The most pronounced change is observed in artificial surfaces, which expanded from 76 km2 in 1985 to 293 km2 in 2024. This corresponds to an increase in proportional share from 2.4% to 9.4%, indicating a nearly fourfold expansion over the 39-year period. The spatial pattern of this growth is concentrated around existing urban cores and major transportation corridors, reflecting a clear outward expansion of built-up areas (Figure 6).
Figure 6.
Land-use maps for 1985 and 2024.
Agricultural land experienced a net decline from 1493 km2 (47.9%) to 1364 km2 (43.8%), representing a loss of approximately 129 km2. Despite remaining the dominant land-use class, this reduction indicates sustained conversion pressure, primarily associated with urban expansion and infrastructure development. Forest cover, in contrast, increased moderately from 1123 km2 (36.1%) to 1160 km2 (37.2%). Although the net gain is relatively limited in absolute terms, the increase suggests localized afforestation efforts or natural regeneration processes, particularly in areas less affected by urban growth dynamics. The magnitude and proportional significance of these long-term changes are quantitatively summarized in Table 3, highlighting the relative dominance and decline of major land-cover classes.
Table 3.
Land-cover area and share (1985–2024).
Mixed vegetation shows the most pronounced relative decline among non-urban classes, decreasing from 351 km2 (11.3%) to 251 km2 (8.1%). This reduction highlights the transitional nature of this land-cover type, which appears particularly vulnerable to conversion toward both agricultural and artificial surfaces. Bare land and water bodies exhibit minimal change throughout the study period, together accounting for less than 2% of the total area in both years, indicating a high degree of stability for these classes.
3.5. Markov Transition Characteristics
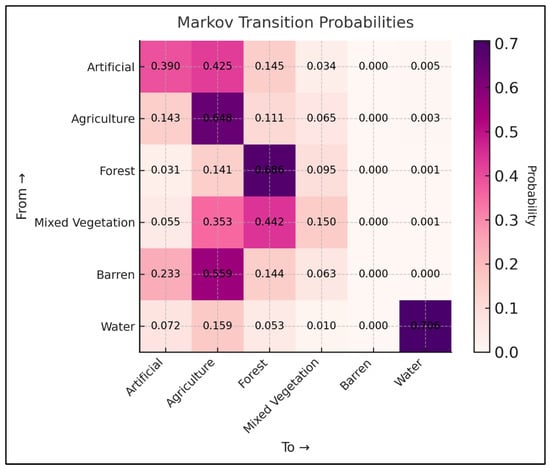
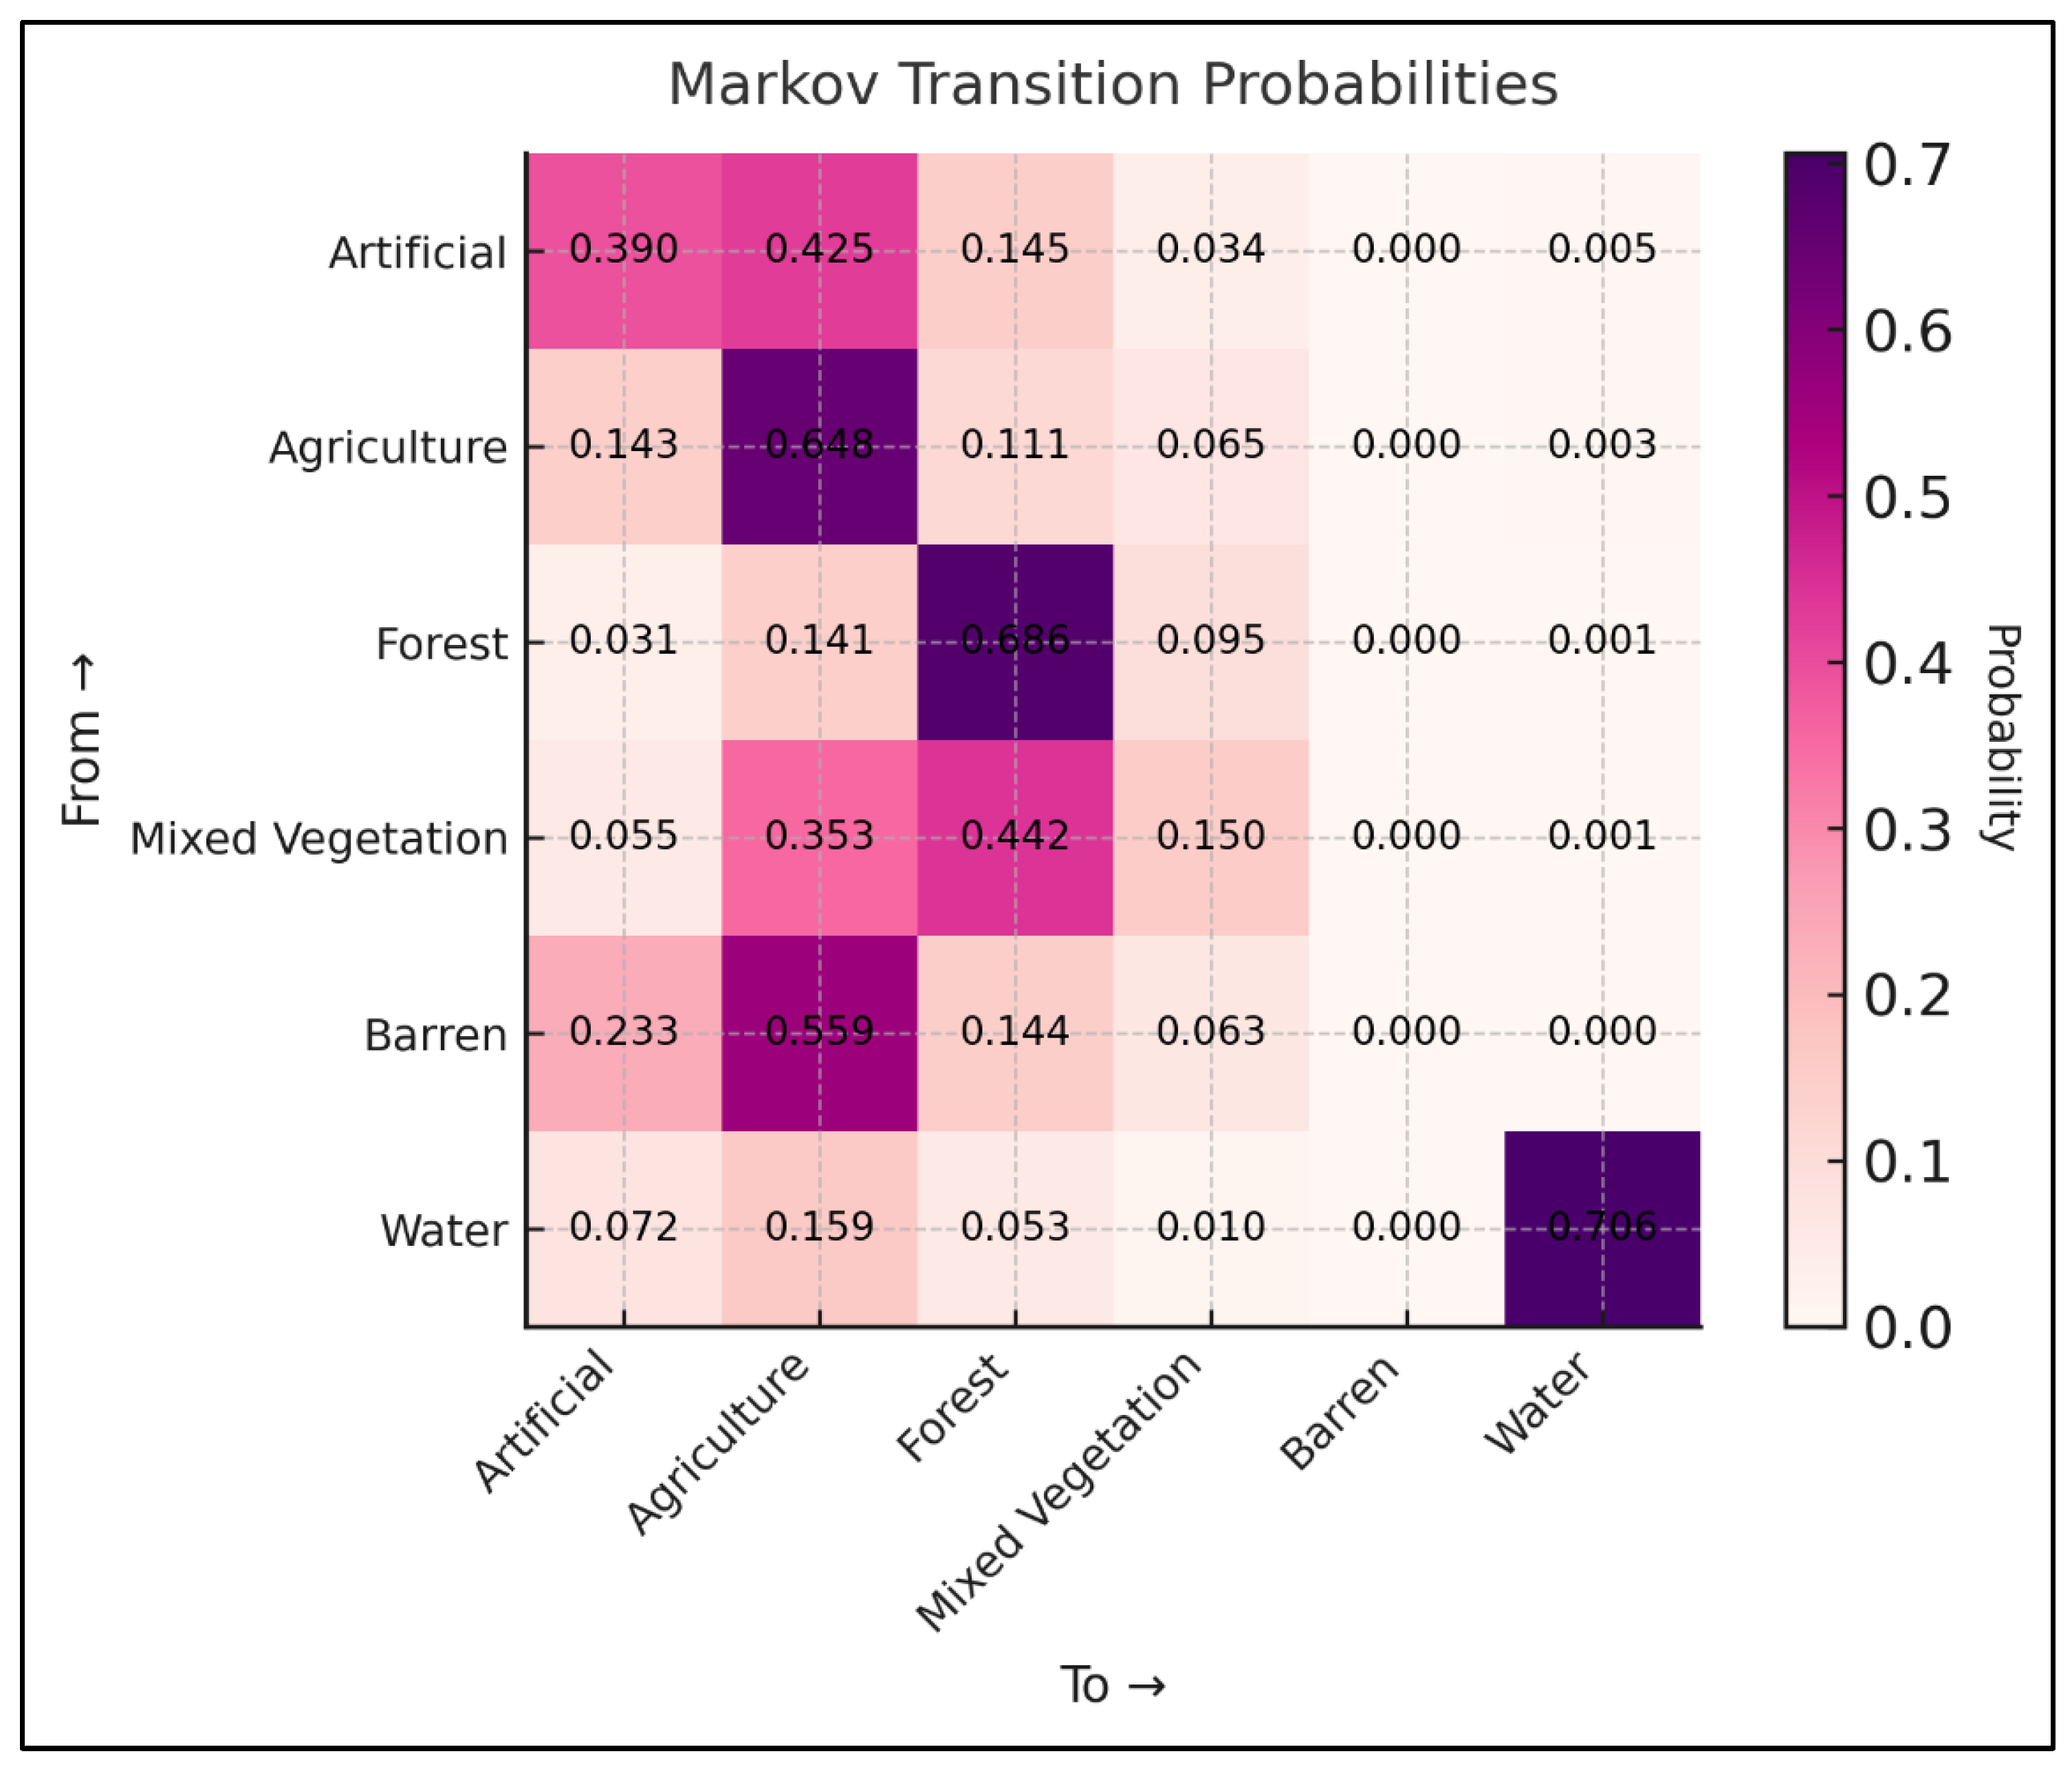
The Markov transition probability matrix provides a quantitative representation of land-use persistence and the dominant conversion pathways during the historical period (Figure 7 and Figure 8). High diagonal values across most classes indicate strong temporal stability within the land-use system. Water bodies exhibit the highest persistence probability (0.706), followed by forest (0.686) and agricultural land (0.648), reflecting limited long-term transformation of these classes over the analyzed period.
Figure 7.
Markov transition probability matrix.
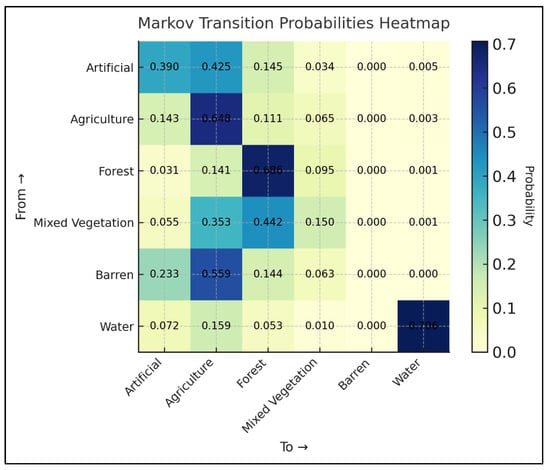
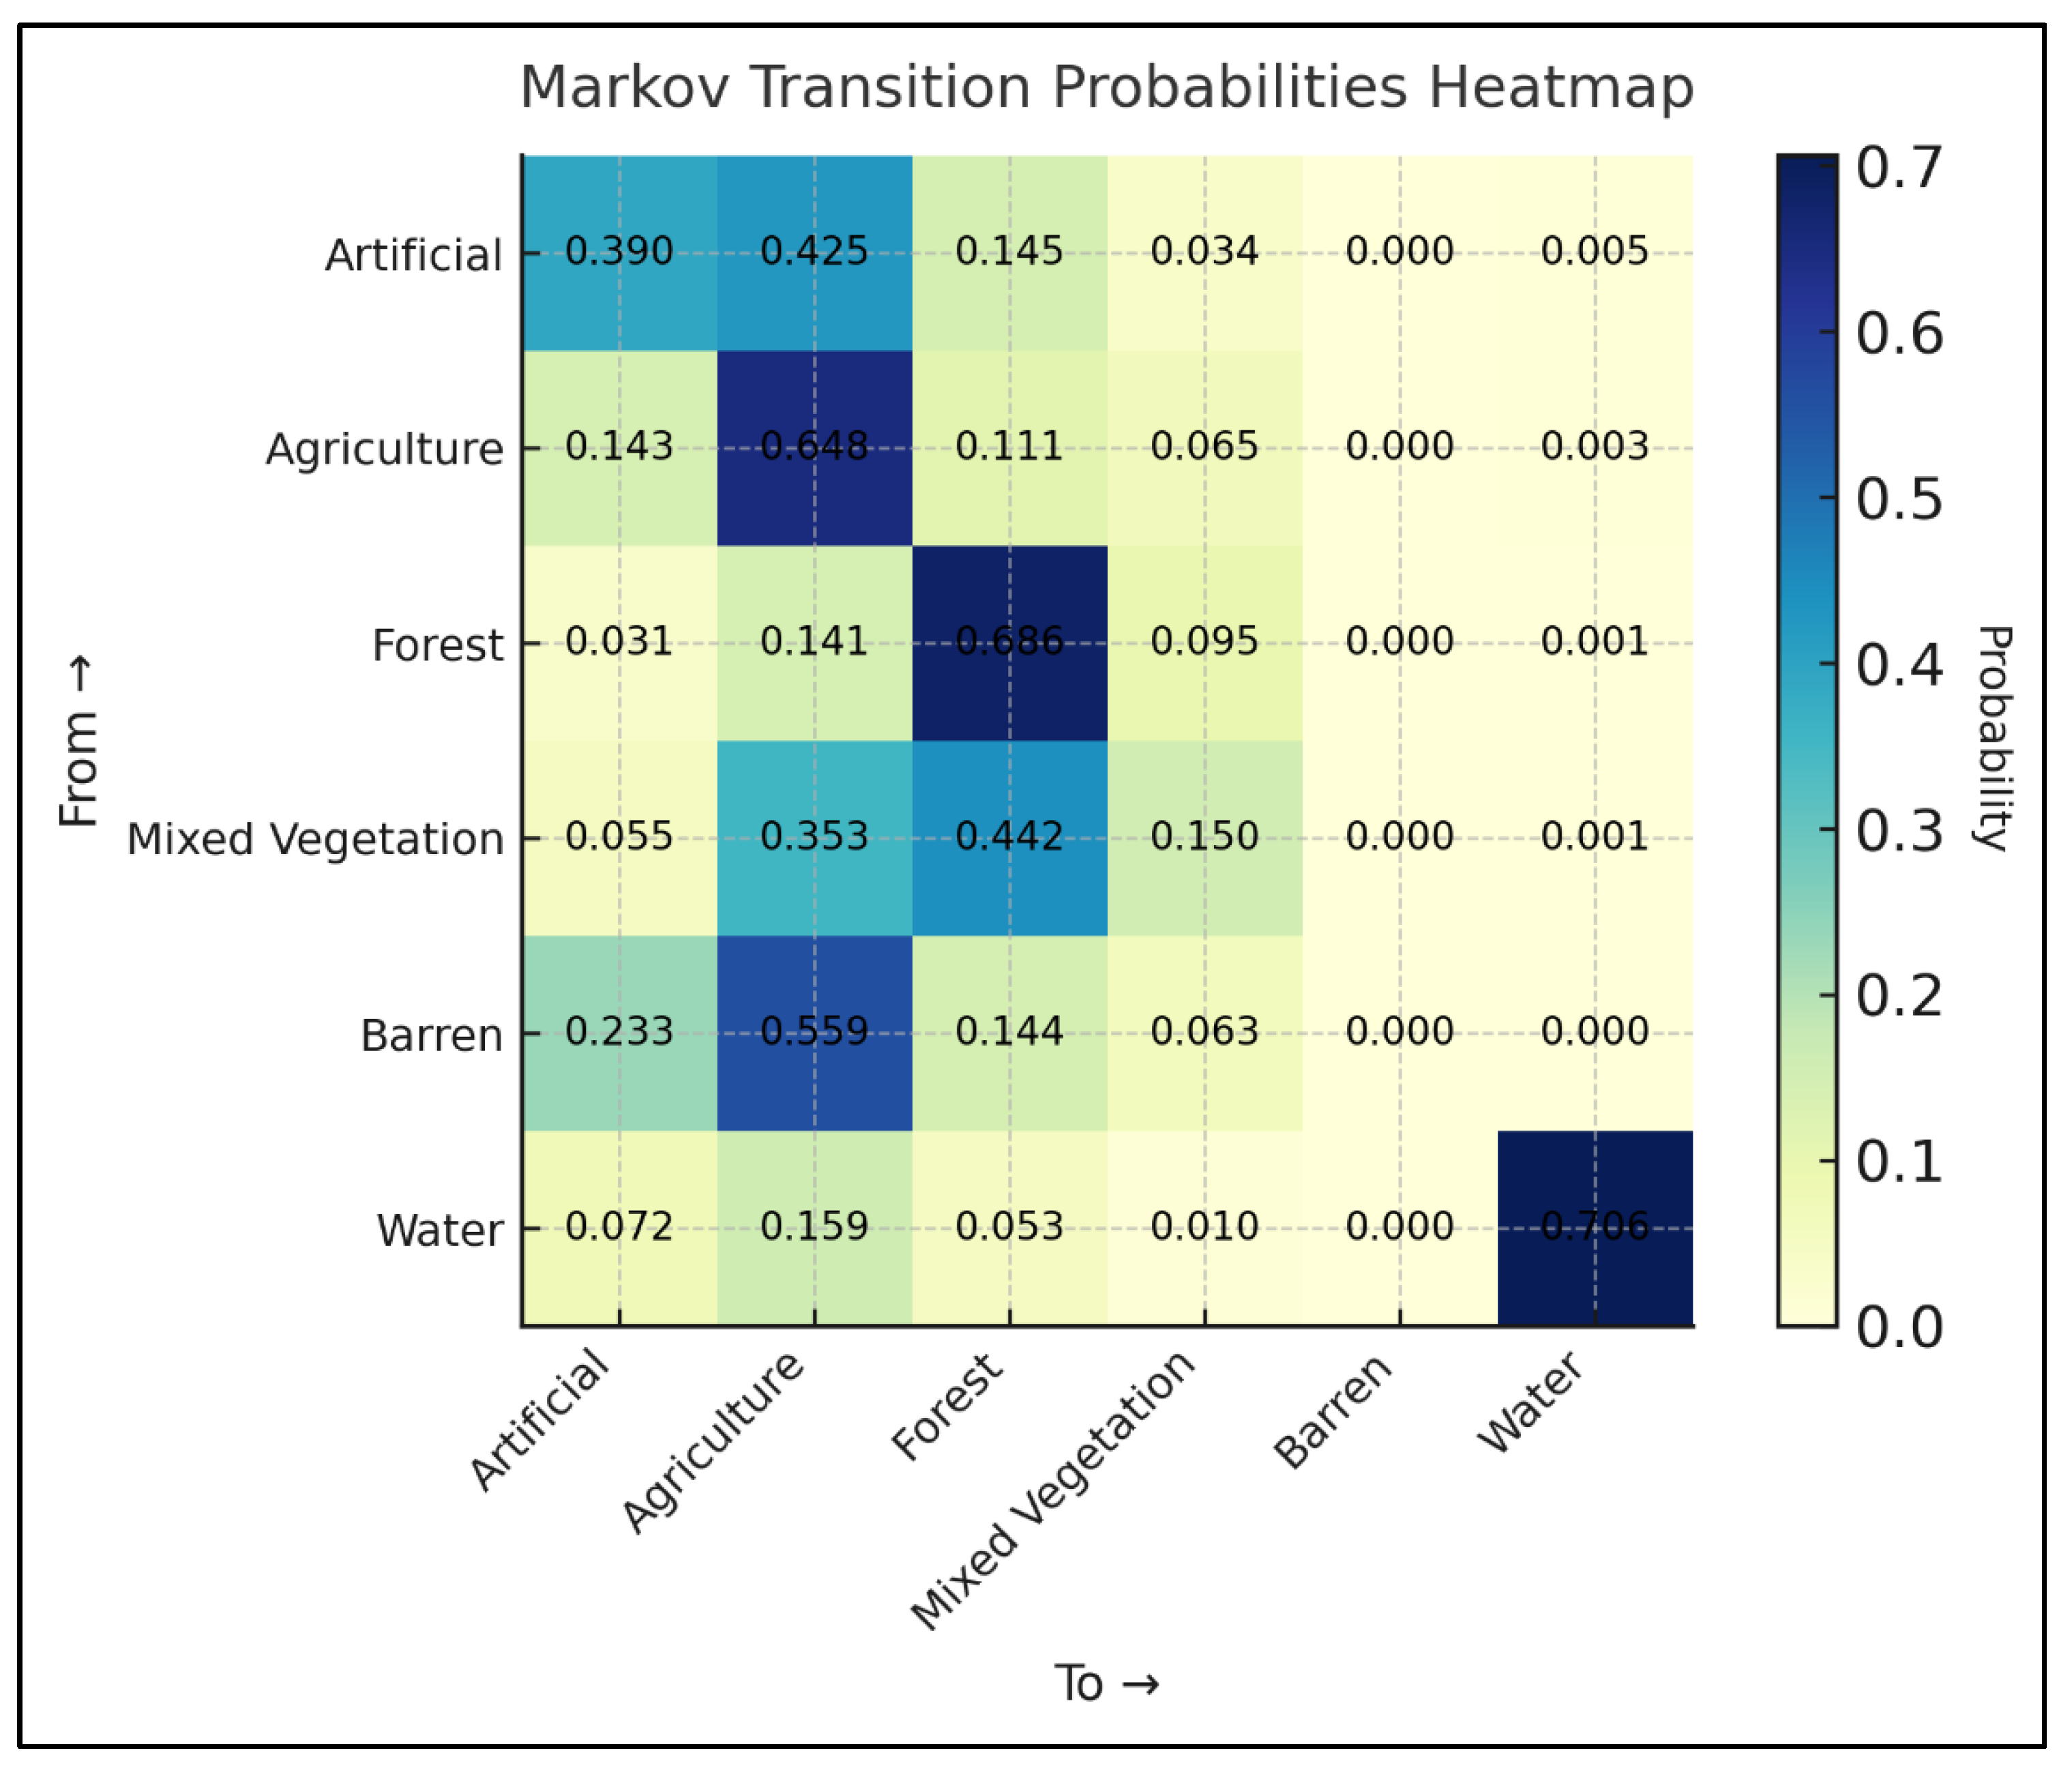
Figure 8.
Markov transition heatmap.
Artificial surfaces display a comparatively lower persistence probability (0.390), indicating a more dynamic behaviour relative to natural land-cover types. Despite this lower self-retention, artificial land shows a pronounced dependence on agricultural land as its primary source of expansion, with a transition probability of 0.425 from agriculture to artificial surfaces. This asymmetric transition pattern highlights agriculture as the dominant donor class for urban growth within the system.
Mixed vegetation demonstrates strong bidirectional connectivity with both forest and agricultural land. The transition probability from mixed vegetation to forest reaches 0.442, while conversion to agriculture amounts to 0.353. These values confirm the transitional character of mixed vegetation, functioning as an intermediary state within broader land-cover transformations. Bare land exhibits a dominant transition toward agriculture (0.559), suggesting systematic conversion to productive land uses rather than long-term persistence.
The heatmap representation (Figure 8) reinforces these patterns by visually emphasizing both the dominance of persistence probabilities along the diagonal and the concentration of off-diagonal transitions associated with agricultural conversion and urban expansion. Transitions involving water bodies remain negligible in non-diagonal cells, consistent with their high persistence and spatial stability.
3.6. Future Land-Use Projections for 2063
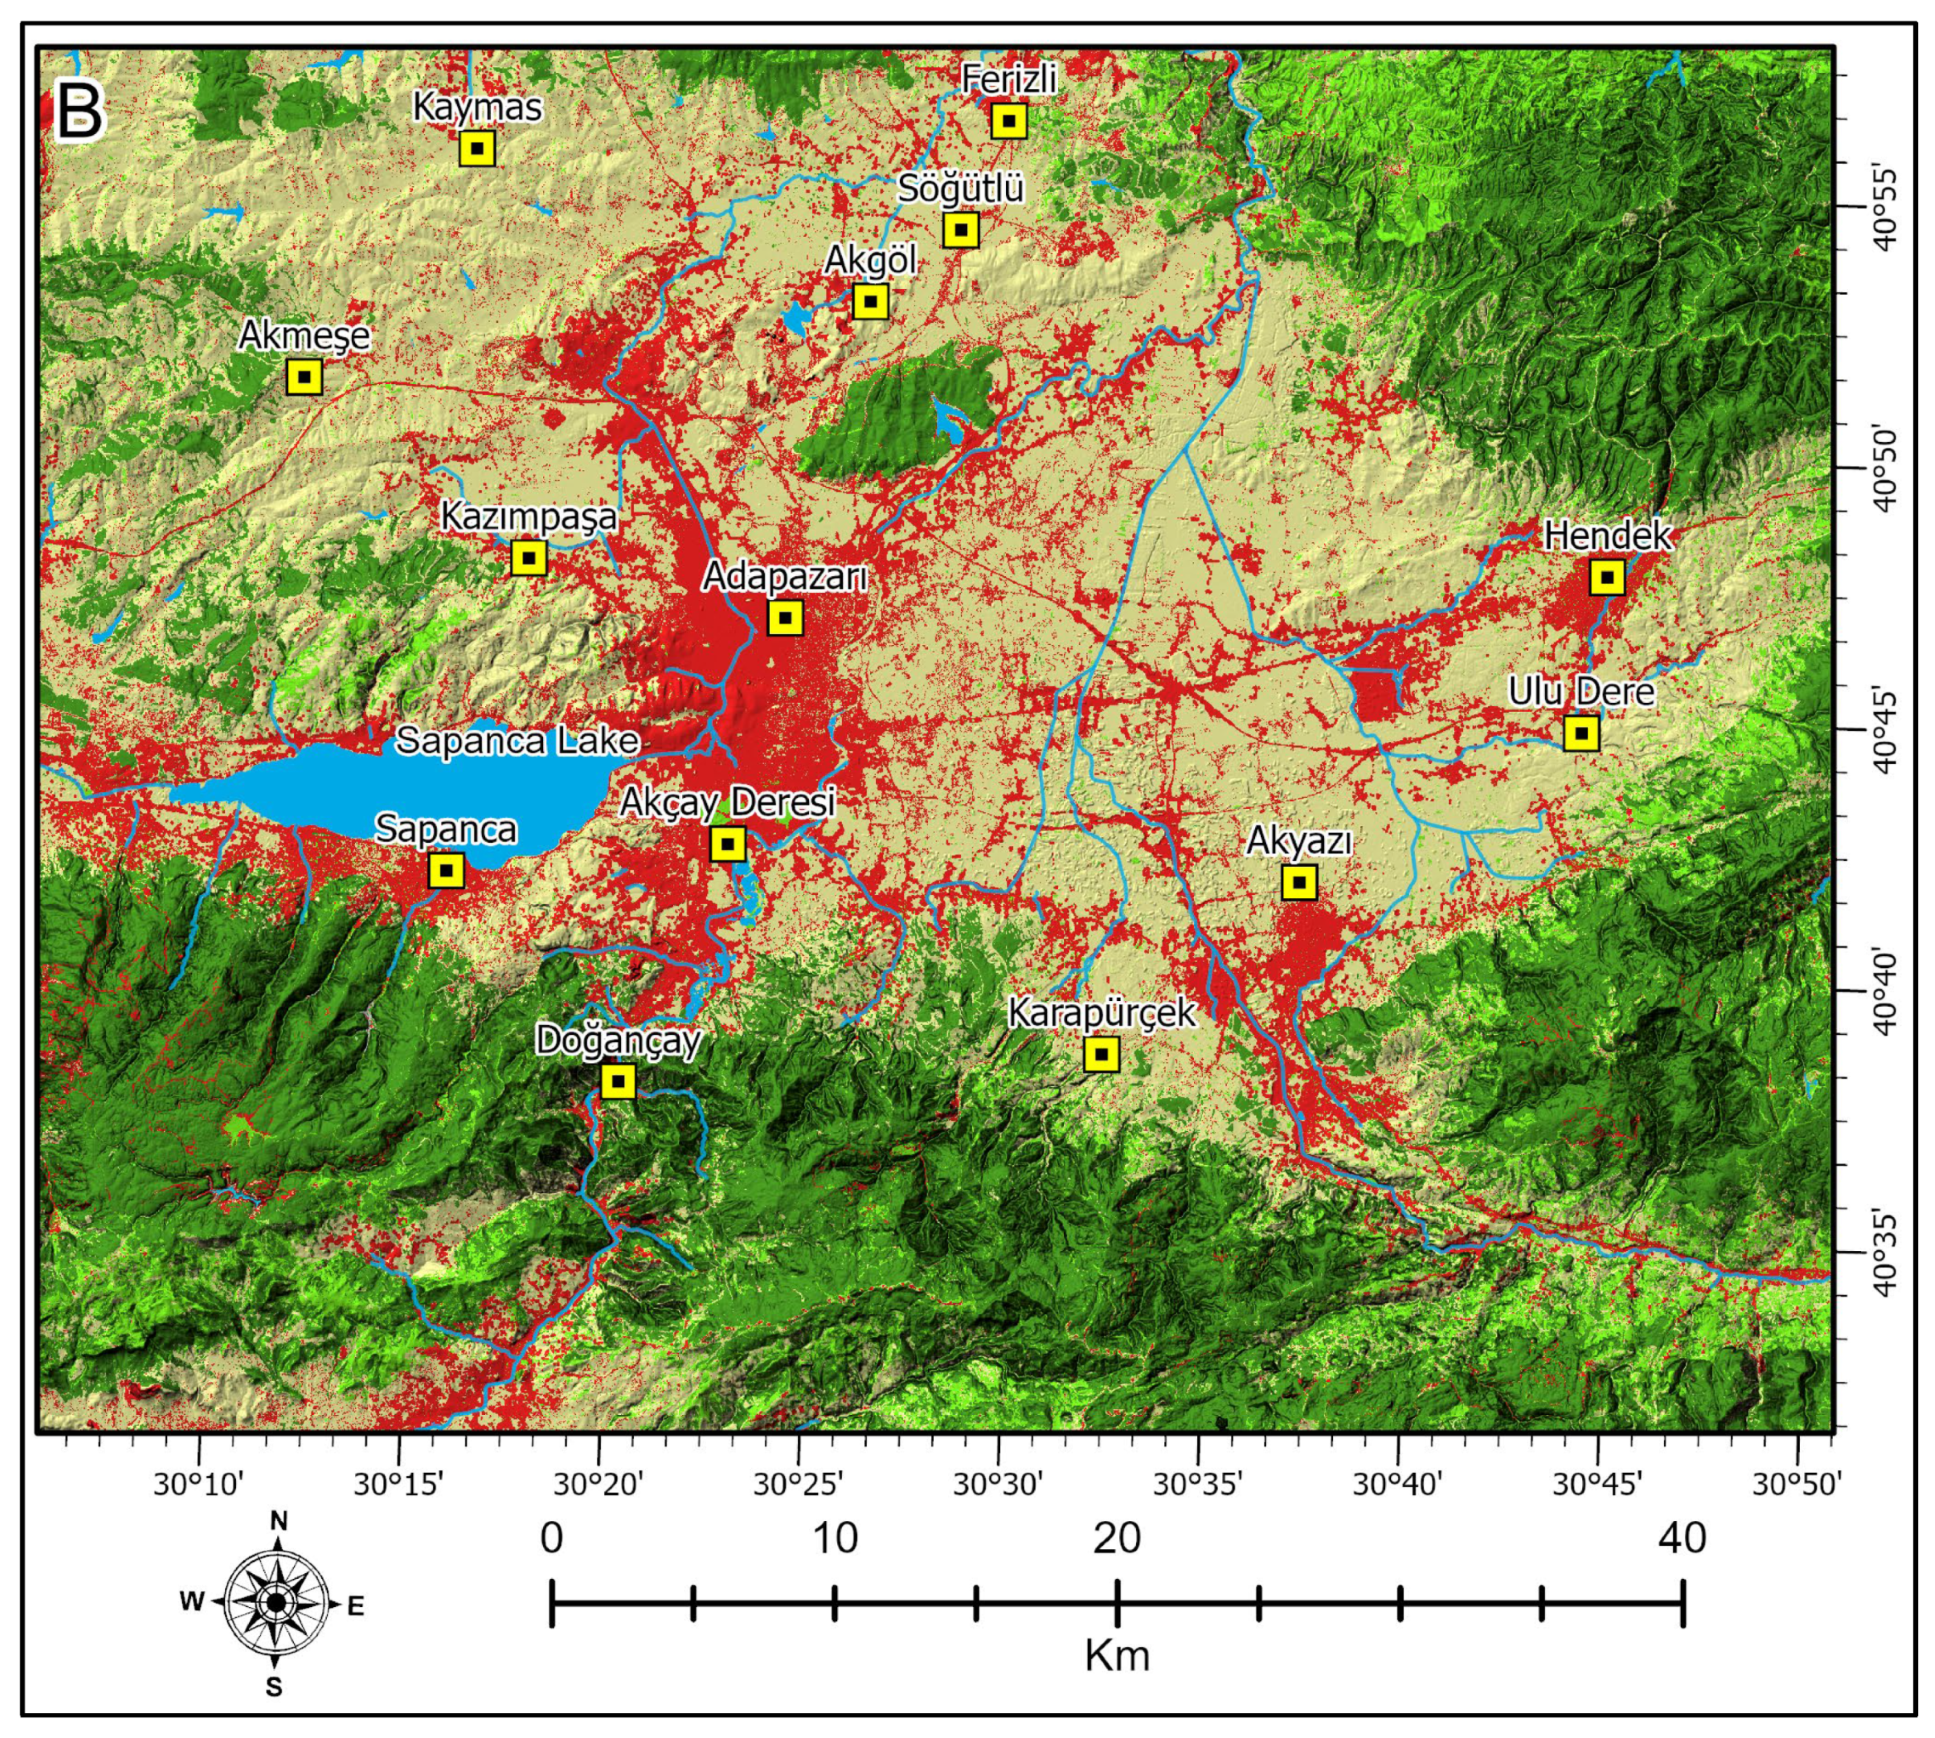
Future land-use projections generated using TerrSet LCM and GeoFLUS reveal both convergent long-term trends and pronounced model-dependent differences in spatial allocation (Figure 9A,B and Table 4). In both simulations, artificial surfaces expand substantially relative to 2024 conditions, confirming continued urban growth as the dominant future trajectory. However, the magnitude and spatial configuration of this expansion differ markedly between the two models.
Figure 9.
Projected land-use maps for 2063 generated using (A) GeoFLUS and (B) LCM.
Table 4.
Projected land-cover area and share in 2063 (FLUS vs. LCM).
Under the LCM projection (Table 4), artificial surfaces increase to 491 km2, whereas GeoFLUS produces a more spatially diffuse pattern with lower urban expansion. In contrast, GeoFLUS estimates a lower expansion of 327 km2 (10.5%), indicating a considerably more conservative urban growth pattern. Relative to 2024 conditions, this corresponds to an increase of approximately 67% in artificial land under LCM, whereas GeoFLUS projects a substantially more moderate expansion. These differences reflect contrasting allocation mechanisms, with LCM producing compact demand-driven urban growth, while GeoFLUS distributes expansion more diffusely through neighbourhood-based competition.
Agricultural land declines in both scenarios, but at notably different rates. LCM projects a reduction to 1264 km2 (40.6%), whereas GeoFLUS retains a considerably larger agricultural extent of 1600 km2 (51.4%). The absolute difference between model projections for agricultural land therefore exceeds 300 km2, highlighting substantial uncertainty in future land allocation despite identical transition demands.
Forest cover shows moderate expansion in both projections, reaching 1061 km2 (34.1%) under LCM and 913 km2 (29.3%) under GeoFLUS. The higher forest allocation simulated by LCM suggests a stronger tendency toward structurally stable natural classes, whereas GeoFLUS maintains a more balanced distribution between forest and agricultural uses. Mixed vegetation exhibits limited net change in both models, reinforcing its role as a transitional land-cover class rather than a dominant end state. Water bodies and bare land remain marginal components of the landscape, with negligible variation between simulations.
4. Discussion
4.1. Interpretation of Historical and Simulated Land-Use Dynamics
The results demonstrate that land-use change in the study area follows long-term structural trends shaped by underlying socio-environmental dynamics rather than random short-term fluctuations. Historical analysis between 1985 and 2024 confirms continuous urban expansion, primarily at the expense of agricultural land, along with moderate forest regrowth. These patterns reflect entrenched spatial processes governed by accessibility, topographic gradients, and socio-economic inertia, which have been widely documented in the land-change literature [1,2,3].
Markov-based transition analysis further supports these findings, indicating strong temporal persistence in land classes such as forest and water bodies, while agricultural land functions as the principal source of urban conversion. Similar dynamics have been reported in post-disturbance and rapidly urbanizing regions in Türkiye and comparable settings [9,18].
Mixed vegetation emerges as a transitional category mediating shifts between forest and agricultural zones. This behaviour is consistent with previous findings highlighting the role of intermediate land-cover classes in buffering ecological processes while remaining vulnerable to development pressure in peri-urban landscapes [16,17].
4.2. Model Behaviour and Structural Differences Between LCM and GeoFLUS
Although LCM and GeoFLUS were calibrated using identical input datasets and transition demands, their simulations exhibit substantial differences in spatial allocation and land-class sensitivity. LCM generates relatively compact and contiguous urban growth patterns, whereas GeoFLUS produces more spatially diffuse outcomes with a higher degree of agricultural land preservation. These contrasts are rooted in the fundamental structural logic of the models.
LCM follows a demand-driven allocation framework based on transition probabilities and suitability surfaces, whereas GeoFLUS relies on adaptive cellular automata principles in which neighbourhood competition and local spatial interactions influence allocation outcomes [15,37]. Similar distinctions between rule-based and adaptive CA frameworks have been noted in comparative modelling studies, particularly in heterogeneous and rapidly changing landscapes [11,16].
The more emergent behaviour observed in GeoFLUS simulations reflects its sensitivity to local spatial context, while LCM’s comparatively deterministic structure tends to reinforce path-dependent urban expansion trajectories. Importantly, these differences should not be interpreted as model deficiencies, but rather as plausible alternative representations of future land-use pathways under uncertainty [1,29].
4.3. Implications for Urban Expansion and Geotechnical Planning
Land-use transitions simulated in this study have direct and measurable implications for geotechnical planning and engineering practice. Urban expansion into former agricultural and vegetated areas alters surface permeability, disrupts natural drainage patterns, and modifies subsurface hydro-mechanical behaviour by affecting soil structure, porosity, and stress distribution. Processes such as soil sealing, excavation, compaction, and artificial filling fundamentally change hydraulic conductivity, bearing capacity, and consolidation characteristics within shallow soil layers [7,30].
Spatial divergence between model outputs is particularly pronounced within transitional zones at the urban–rural interface. These zones are commonly characterized by heterogeneous sedimentary sequences, variable soil thickness, and fluctuating groundwater conditions, which increase susceptibility to differential settlement, surface flooding, and local slope instability [6,32]. In such environments, land-use projections interpreted as deterministic representations may obscure latent vulnerabilities and underestimate cumulative geotechnical risk. Comparative modelling, by contrast, enables the identification of both spatially robust development trends and uncertainty hotspots that warrant priority assessment.
In a region characterized by high seismic vulnerability, post-disaster reconstruction, and strong industrial and migration-driven urbanization pressures, these uncertainties acquire particular practical significance. The spatial patterns identified by both models highlight areas where future land-use transitions may amplify existing geotechnical risks, especially in low-lying alluvial plains and densely urbanized corridors.
Where both models converge in projecting urban growth in low-permeability, compressible, or flood-prone areas, early investment in mitigation strategies such as subsoil drainage systems, ground improvement techniques, soil stabilization, and slope reinforcement can be justified. These interventions can reduce long-term maintenance costs and enhance structural safety. Conversely, areas characterized by strong model disagreement highlight zones of heightened planning uncertainty and should be subject to precautionary field investigations, including borehole logging, standard penetration testing, groundwater monitoring, and infiltration testing, prior to development [6,33].
By integrating multi-model land-use scenarios with geotechnical screening principles, the proposed framework supports a transition from reactive hazard management to proactive, risk-informed spatial planning. This approach allows engineers and planners to prioritize detailed investigations and resilient design strategies in areas where simulated urban expansion intersects with sensitive soil and geomorphological conditions.
4.4. Methodological Contributions and Limitations
This study demonstrates that even under identical transition demands, model structure plays a decisive role in shaping land-use allocation outcomes. The combined use of Markov analysis, machine learning-assisted transition modelling, and comparative spatial interpretation provides a robust methodological framework for exploring land-use uncertainty in regional planning and engineering contexts [14,22].
Several limitations should be acknowledged. First, the Markov assumption of stationarity implies that historical transition rates observed between 1985 and 2024 are projected into the future, which may not adequately capture abrupt changes driven by policy shifts, economic restructuring, demographic transitions, rural-to-urban migration, or climate-related disturbances. Given that the modelling framework relies on only two temporal observation points, long-term trends are necessarily extrapolated in a quasi-linear manner, limiting the capacity to represent non-linear or episodic land-use dynamics.
Second, neither model explicitly incorporates institutional and socio-economic constraints such as zoning regulations, land-market mechanisms, infrastructure investment policies, or migration-driven settlement pressures, which may substantially influence future urbanization trajectories. In rapidly developing regions, these factors may accelerate or redirect land-use change beyond patterns inferred from historical data.
Third, geological and geotechnical heterogeneity is represented indirectly using topographic and hydrological proxies rather than explicit lithological, soil-class, or groundwater-depth layers. While this approach is appropriate for regional-scale screening, the absence of harmonized geotechnical datasets limits the direct quantification of subsurface conditions and engineering properties.
Finally, while geotechnical implications are discussed conceptually, they are not quantified through hazard-specific indices such as slope stability, liquefaction susceptibility, differential settlement potential, or flood vulnerability. Integrating scenario-based land-use simulations with physically based hazard models and site-condition datasets would substantially enhance the operational value of future modelling efforts [6,31].
Future research should aim to construct denser temporal LULC series, for example, using annually or multi-annually acquired satellite imagery from consistent seasonal periods, to improve transition calibration, detect non-linear change trajectories, and assess policy- or shock-induced regime shifts. Coupling such time-series datasets with detailed geological and geotechnical information would enable more robust spatiotemporal forecasting and strengthen the linkage between land-use modelling and hazard-informed spatial planning.
4.5. Planning-Relevant Insights
The findings underscore the sensitivity of land-use simulations to underlying model design, particularly within fast-changing transitional zones. For spatial planning and engineering applications, this reinforces the need to interpret model outputs as probabilistic scenarios rather than deterministic forecasts [11,29].
For geotechnical planning, a multi-model perspective offers clear advantages in regions exposed to compound hazards such as flooding, landslides, or soil subsidence. By identifying areas of both agreement and divergence among model projections, decision-makers can more effectively prioritize site investigations, resilient infrastructure design, and adaptive zoning strategies. In this way, comparative land-use modelling strengthens the interface between spatial simulation and hazard-informed engineering practice.
5. Conclusions
This study presents a comparative modelling framework for evaluating long-term land-use change by integrating historical classification, Markov transition analysis, and machine learning-derived spatial simulation within a geotechnically sensitive regional context. Using identical datasets and transition demands, the Land Change Modeler (LCM) and GeoFLUS models were applied to generate alternative future land-use scenarios that support preliminary geotechnical risk screening and infrastructure planning.
The results demonstrate that urban expansion remains the dominant long-term trend, primarily driven by the conversion of agricultural land. Forest areas exhibit high temporal persistence and moderate expansion, while mixed vegetation functions as a transitional land-cover class mediating shifts between agricultural and forested zones. Water bodies and barren land remain structurally stable and occupy a limited proportion of the landscape. These patterns reflect systematic land-system dynamics shaped by peri-urban development pressure, accessibility, and terrain constraints.
Despite identical transition inputs, the two models produced systematically different spatial allocation patterns. LCM tended to concentrate urban growth into compact and centralized clusters, whereas GeoFLUS generated a more spatially dispersed urban footprint while retaining a larger share of agricultural land. These contrasts indicate that model structure and allocation logic exert a decisive influence on simulated outcomes, often exceeding the influence of input data alone. For engineering applications, this finding highlights the necessity of incorporating structural model uncertainty into spatial decision-making processes.
From a geotechnical and planning perspective, the results emphasize that land-use simulations should be interpreted as plausible risk-informed scenarios rather than deterministic forecasts. Comparative modelling enables decision-makers to identify robust development corridors as well as uncertainty zones that require prioritized site investigations, soil testing, and groundwater assessment. This approach is particularly relevant in regions exposed to settlement, erosion, flooding, liquefaction, or slope instability hazards.
The modelling framework is transferable to other rapidly urbanizing regions characterized by complex soil profiles, heterogeneous sedimentary environments, and active geomorphological processes. By linking land-use simulation with preliminary hazard screening, the approach provides an integrated decision-support tool for land-use policy, infrastructure development, and resilient engineering design. Future research should focus on coupling scenario-based land-use projections with quantitative geotechnical hazard models, such as slope stability, liquefaction susceptibility, and settlement prediction, to further enhance the operational value of spatial planning strategies.
Author Contributions
Conceptualization, A.B.S.G. and F.S.; Methodology, A.B.S.G. and F.S.; Validation, A.B.S.G. and F.S.; Formal Analysis, A.B.S.G.; Investigation, A.B.S.G. and F.S.; Resources, A.B.S.G. and F.S.; Writing—Original Draft Preparation, A.B.S.G.; Supervision, F.S.; Writing—Review and Editing, A.B.S.G. and F.S.; Visualization, A.B.S.G. and F.S.; Project Administration, F.S. All authors have read and agreed to the published version of the manuscript.
Funding
This research received no external funding.
Data Availability Statement
The data supporting the findings of this study are available from the corresponding author upon reasonable request.
Conflicts of Interest
The authors declare that there are no conflicts of interest.
References
- Koomen, E.; Stillwell, J. Modelling land-use change: Theories and methods. In Modelling Land-Use Change: Progress and Applications; Springer: Dordrecht, The Netherlands, 2007; pp. 1–22. [Google Scholar]
- Huang, D.; Zhou, Z.; Zhang, Z.; Dai, Q.; Lu, H.; Li, Y.; Huang, Y. Land use/land cover remote sensing classification in complex subtropical karst environments: Challenges, methodological review, and research frontiers. Appl. Sci. 2025, 15, 9641. [Google Scholar] [CrossRef] [Scilit]
- Rimal, B. Urban growth and land use/land cover change of Pokhara Sub-metropolitan City, Nepal. J. Theor. Appl. Inf. Technol. 2011, 26, 118–128. [Google Scholar]
- Li, K.Y.; Coe, M.T.; Ramankutty, N.; De Jong, R. Modeling the hydrological impact of land-use change in West Africa. J. Hydrol. 2007, 337, 258–268. [Google Scholar] [CrossRef] [Scilit]
- Tasser, E.; Leitinger, G.; Tappeiner, U. Climate change versus land-use change—What affects mountain landscapes more? Land Use Policy 2017, 60, 60–72. [Google Scholar] [CrossRef] [Scilit]
- Fell, R.; Corominas, J.; Bonnard, C.; Cascini, L.; Leroi, E.; Savage, W.Z. JTC-1 Joint Technical Committee on Landslides and Engineered Slopes. Guidelines for landslide susceptibility, hazard and risk zoning for land use planning. Eng. Geol. 2008, 102, 85–98. [Google Scholar] [CrossRef] [Scilit]
- Dörner, J.; Dec, D.; Peng, X.; Horn, R. Effect of land use change on the dynamic behaviour of structural properties of an Andisol in southern Chile under saturated and unsaturated hydraulic conditions. Geoderma 2010, 159, 189–197. [Google Scholar] [CrossRef] [Scilit]
- Du Toit, M.J.; Cilliers, S.S.; Dallimer, M.; Goddard, M.; Guenat, S.; Cornelius, S.F. Urban green infrastructure and ecosystem services in sub-Saharan Africa. Landsc. Urban Plan. 2018, 180, 249–261. [Google Scholar] [CrossRef] [Scilit]
- Sunbul, F. An assessment of urban sprawl in northern Sakarya Province following the 1999 earthquake, NW Turkey. J. Indian Soc. Remote Sens. 2019, 47, 1487–1496. [Google Scholar] [CrossRef] [Scilit]
- Kosugi, Y.; Sakamoto, M.; Fukunishi, M.; Lu, W.; Doihara, T.; Kakumoto, S. Urban change detection related to earthquakes using an adaptive nonlinear mapping of high-resolution images. IEEE Geosci. Remote Sens. Lett. 2004, 1, 152–156. [Google Scholar] [CrossRef]
- Heistermann, M.; Müller, C.; Ronneberger, K. Land in sight? Achievements, deficits and potentials of continental to global scale land-use modeling. Agric. Ecosyst. Environ. 2006, 114, 141–158. [Google Scholar] [CrossRef] [Scilit]
- Gao, L.; Tao, F.; Liu, R.; Wang, Z.; Leng, H.; Zhou, T. Multi-scenario simulation and ecological risk analysis of land use based on the PLUS model: A case study of Nanjing. Sustain. Cities Soc. 2022, 85, 104055. [Google Scholar] [CrossRef] [Scilit]
- Wang, W.; Zhang, Z.; Wang, Y.; Ding, J.; Sun, H.; Deng, C. Multi-scenario prediction of dynamic responses of the carbon sink potential in land use/land cover change in areas with steep slopes. Appl. Sci. 2025, 15, 1319. [Google Scholar] [CrossRef] [Scilit]
- Badshah, M.T.; Hussain, K.; Rehman, A.U.; Mehmood, K.; Muhammad, B.; Wiarta, R.; Silamon, R.F.; Khan, M.A.; Meng, J. The role of random forest and Markov chain models in understanding metropolitan urban growth trajectory. Front. For. Glob. Change 2024, 7, 1345047. [Google Scholar] [CrossRef] [Scilit]
- Batty, M.; Couclelis, H.; Eichen, M. Urban systems as cellular automata. Environ. Plan. B Plan. Des. 1997, 24, 159–164. [Google Scholar] [CrossRef] [Scilit]
- Ghosh, P.; Mukhopadhyay, A.; Chanda, A.; Mondal, P.; Akhand, A.; Mukherjee, S.; Nayak, S.; Ghosh, S.; Mitra, D.; Ghosh, T. Application of cellular automata and Markov-chain model in geospatial environmental modeling—A review. Remote Sens. Appl. Soc. Environ. 2017, 5, 64–77. [Google Scholar] [CrossRef] [Scilit]
- Hishe, S.; Bewket, W.; Nyssen, J.; Lyimo, J. Analysing past land use land cover change and CA-Markov-based future modelling in the Middle Suluh Valley, Northern Ethiopia. Geocarto Int. 2020, 35, 225–255. [Google Scholar] [CrossRef] [Scilit]
- Karadeniz, E.; Sunbul, F. Land use and land cover change in Duzce region following the major earthquake: Implications for ANN and Markov Chain analysis. Environ. Earth Sci. 2023, 82, 243. [Google Scholar] [CrossRef] [Scilit]
- Li, C.; Yang, M.; Li, Z.; Wang, B. How will Rwandan land use/land cover change under high population pressure and changing climate? Appl. Sci. 2021, 11, 5376. [Google Scholar] [CrossRef] [Scilit]
- Fu, F.; Jia, X.; Zhao, Q.; Tian, F.; Wei, D.; Zhao, Y.; Zhang, Y.; Zhang, J.; Hu, X.; Yang, L. Predicting land use change around railway stations: An enhanced CA-Markov model. Sustain. Cities Soc. 2024, 101, 105138. [Google Scholar] [CrossRef] [Scilit]
- Nehzak, H.K.; Aghaei, M.; Mostafazadeh, R.; Rabiei-Dastjerdi, H. Assessment of machine learning algorithms in land use classification. In Computers in Earth and Environmental Sciences; Elsevier: Amsterdam, The Netherlands, 2022; pp. 97–104. [Google Scholar]
- Aryal, J.; Sitaula, C.; Frery, A.C. Land use and land cover (LULC) performance modeling using machine learning algorithms: A case study of the city of Melbourne, Australia. Sci. Rep. 2023, 13, 13510. [Google Scholar] [CrossRef] [Scilit]
- Zhao, Z.; Islam, F.; Waseem, L.A.; Tariq, A.; Nawaz, M.; Islam, I.U.; Bibi, T.; Rehman, N.U.; Ahmad, W.; Aslam, R.W.; et al. Comparison of three machine learning algorithms using Google Earth Engine for land use land cover classification. Rangel. Ecol. Manag. 2024, 92, 129–137. [Google Scholar] [CrossRef] [Scilit]
- Li, X.; Yi, S.; Cundy, A.B.; Chen, W. Sustainable decision-making for contaminated site risk management: A decision tree model using machine learning algorithms. J. Clean. Prod. 2022, 371, 133612. [Google Scholar] [CrossRef] [Scilit]
- Zhang, H.; Zhou, Q. Application of machine learning in urban land use. In Deep Learning for Multimedia Processing Applications; CRC Press: Boca Raton, FL, USA, 2024; pp. 246–283. [Google Scholar]
- Lan, Y.; Zhang, K.; Han, X.; Chen, Z.; Ling, M.; You, H.; Chen, J. The spatiotemporal variation in biodiversity and its response to different future development scenarios: A case study of Guilin as an internationally renowned tourist destination in China. Appl. Sci. 2024, 14, 2101. [Google Scholar] [CrossRef] [Scilit]
- Zhang, Z.; Li, Z.; Li, Z. Evaluating the change and trend of construction land in Changsha City based on GeoSOS-FLUS model and machine learning methods. Sci. Rep. 2025, 15, 9602. [Google Scholar] [CrossRef] [Scilit] [PubMed]
- Ma, Y.; Wang, M.; Zhou, M.; Tu, J.; Ma, C.; Li, S. Multiple scenarios-based on a hybrid economy–environment–ecology model for land-use structural and spatial optimization under uncertainty: A case study in Wuhan, China. Stoch. Environ. Res. Risk Assess. 2022, 36, 2883–2906. [Google Scholar] [CrossRef] [Scilit]
- Weerasinghe, O.; Hewage, K.; Razi, F.; Fatmi, M.; Sadiq, R. Applicability of land-use models for sustainable urban planning: A review. J. Urban Plan. Dev. 2025, 151, 04025037. [Google Scholar] [CrossRef] [Scilit]
- Khan, F.; Das, B.; Mishra, S.R.K.; Awasthy, M. A review on the feasibility and application of geospatial techniques in geotechnical engineering field. Mater. Today Proc. 2022, 49, 311–319. [Google Scholar] [CrossRef] [Scilit]
- Soriano-Cuesta, C.; Romero-Hernández, R.; Mascort-Albea, E.J.; Kada, M.; Fuls, A.; Jaramillo-Morilla, A. Evaluation of open geotechnical knowledge in urban environments for 3D modelling of the City of Seville (Spain). Remote Sens. 2023, 16, 141. [Google Scholar] [CrossRef] [Scilit]
- Sakr, M.A.; Saad, A.M.; Omar, A.E.; Elkholy, S.M.; Shafaey, O.E. Geospatial technology utilization for geotechnical hazard evaluation of sustainable urban development of Buraydah City, Kingdom of Saudi Arabia. Arab. J. Geosci. 2022, 15, 1320. [Google Scholar] [CrossRef] [Scilit]
- Cong, Y.; Inazumi, S. Integration of smart city technologies with advanced predictive analytics for geotechnical investigations. Smart Cities 2024, 7, 1089–1108. [Google Scholar] [CrossRef] [Scilit]
- Chen, J.; Chen, J.; Liao, A.; Cao, X.; Chen, L.; Chen, X.; He, C.; Han, G.; Peng, S.; Lu, M.; et al. Global land cover mapping at 30 m resolution: A POK-based operational approach. ISPRS J. Photogramm. Remote Sens. 2015, 103, 7–27. [Google Scholar] [CrossRef] [Scilit]
- Nwaigwe, E.; Wobo, O.G. Application of Cramer’s rule and digital computing in analyzing multiple linear regression. FNAS J. Math. Stat. Comput. 2024, 2, 66–73. [Google Scholar]
- Eastman, J.R. TerrSet: Geospatial Monitoring and Modeling System (User Manual); Clark University: Worcester, MA, USA, 2016; Available online: https://www.clarku.edu/centers/geospatial-analytics/terrset (accessed on 22 April 2025).
- Wang, Y.; Shen, J.; Yan, W.; Chen, C. Backcasting approach with multi-scenario simulation for assessing effects of land use policy using GeoSOS-FLUS software. MethodsX 2019, 6, 1384–1397. [Google Scholar] [CrossRef] [Scilit] [PubMed]
- Gürbüz, A.; Gürer, Ö.F. Tectonic geomorphology of the North Anatolian fault zone in the Lake Sapanca Basin (eastern Marmara Region, Turkey). Geosci. J. 2008, 12, 215–225. [Google Scholar] [CrossRef] [Scilit]
- Şengör, A.C.; Yilmaz, Y. Tethyan evolution of Turkey: A plate tectonic approach. Tectonophysics 1981, 75, 181–241. [Google Scholar] [CrossRef] [Scilit]
- Okay, A.I.; Tüysüz, O. Tethyan sutures of northern Turkey. Geol. Soc. Lond. Spec. Publ. 1999, 156, 475–515. [Google Scholar] [CrossRef] [Scilit]
- Emre, Ö.; Erkal, T.; Tchepalyga, A.; Kazancı, N.; Keçer, M.; Ünay, E. Doğu Marmara bölgesinin Neojen–Kuvaterner’deki evrimi. MTA Derg. 1998, 120, 233–258. [Google Scholar]
- Tarı, U.; Tüysüz, O. The effects of the North Anatolian fault on the geomorphology in the Eastern Marmara region, northwestern Turkey. Geodin. Acta 2016, 28, 139–159. [Google Scholar] [CrossRef] [Scilit]
- Yiğitbaş, E.; Elmas, A.; Sefunç, A.; Özer, N. Major neotectonic features of eastern Marmara region, Turkey: Development of the Adapazarı–Karasu corridor and its tectonic significance. Geol. J. 2004, 39, 179–198. [Google Scholar] [CrossRef] [Scilit]
- Döker, M.F.; Gül, A. Adapazarı’nda şehirsel büyüme süreci ve arazi kullanım değişiminin izlenmesi (1985–2019). Türk Coğrafya Dergisi 2019, 73, 67–78. [Google Scholar] [CrossRef] [Scilit]

Disclaimer/Publisher’s Note: The statements, opinions and data contained in all publications are solely those of the individual author(s) and contributor(s) and not of MDPI and/or the editor(s). MDPI and/or the editor(s) disclaim responsibility for any injury to people or property resulting from any ideas, methods, instructions or products referred to in the content. |
© 2026 by the authors. Licensee MDPI, Basel, Switzerland. This article is an open access article distributed under the terms and conditions of the Creative Commons Attribution (CC BY) license.