


Abstract
To address the travel delay caused by start-up lag in queued traffic at signalized inter-sections and fill the research gap of unseparated start-up loss characteristics between human-driven vehicles (HDVs) and autonomous vehicles (AVs), this study proposes an analytical start-up loss delay model applicable to both unsaturated and saturated traffic states. The model explicitly quantifies queue-length-dependent cascading propagation effects of start-up loss, and integrates vehicle type-specific parameters based on traffic queue theory and mixed traffic flow field observation data. Conventional models are limited by underestimated delay from neglecting platoon-level start-up loss propagation and failure to account for intrinsic HDV-AV start-up mechanism differences; to resolve these, we first distinguished the two vehicle types’ start-up behaviors (reaction time, acceleration, platoon coordination), then decoupled their start-up loss mechanisms and quantified their delay contributions via theoretical derivation, with validation against field test data and comparison with classical Webster and Clayton models. Field results revealed an order-of-magnitude difference in start-up response: HDVs had an average 2.05 s reaction time with large individual variability, while AVs maintained a stable 0.3–0.5 s response; HDV platoons reached saturated flow at the sixth vehicle, versus the third for AV platoons due to consistent acceleration and shorter headways. Model validation showed that under unsaturated conditions, red light duration significantly affects HDV delay, and the AV mix ratio is exponentially negatively correlated with additional delay. Under saturated conditions, green light duration increases start-up loss delay for both vehicle types, yet the growth rate of AVs (3.1–12.3%) is far lower than that of HDVs (18.2–67.5%), and arranging AVs in the leading position of mixed platoons can further reduce delay. The proposed model improves the accuracy of delay estimation in mixed HDV-AV traffic environments, and provides a theoretical basis for the optimized design of signal control strategies and the efficient management of intersection travel delay.
1. Introduction
Urban signalized intersections represent the core nodes of urban road traffic networks, whose operational efficiency directly dictates the overall performance of the traffic system and the travel experience of road users [1]. Start-up loss time during the green phase—defined as the extra time consumed by queued vehicles to transition from a stationary state to a saturated flow state—constitutes a major component of intersection travel delay. This delay not only prolongs individual travel time and increases vehicle fuel consumption but also exacerbates traffic emissions and driver psychological frustration, posing a dual challenge to urban traffic efficiency and environmental quality [2,3]. With the gradual commercialization and large-scale deployment of autonomous vehicles (AVs), the traffic composition at signalized intersections is undergoing a fundamental shift from homogeneous human-driven vehicle (HDV) flow to heterogeneous HDV-AV mixed traffic flow. AVs exhibit inherent advantages in start-up response time, acceleration consistency, and platoon coordination efficiency due to their on-board sensor systems and automated control logic [4], which significantly alter the queue discharge dynamics at signalized intersections. Against this background, accurately distinguishing the start-up loss characteristics of HDVs and AVs has become an essential prerequisite for precise intersection delay estimation and the formulation of adaptive signal control strategies in mixed traffic environments.
Traditional research on start-up loss at signalized intersections has long focused on the behavioral characteristics of HDVs. The Clayton model [5] first proposed the theoretical concept of the gradual acceleration process of queued HDVs, and the classic Webster model [6] incorporated start-up loss as a fixed penalty into the fixed time signal delay calculation formula. Subsequent studies have further calibrated HDV-specific start-up parameters, including driver perception–reaction time [7], platoon time headway evolution law [8], and the critical position where the platoon reaches saturated flow [9,10]. However, these traditional studies generally simplify start-up loss as a fixed time cost borne only by the first few leading vehicles in the platoon, ignoring the cascading propagation effect of start-up loss delay along the entire queue. This simplification leads to the systematic underestimation of total intersection delay by conventional models, especially under congested traffic conditions with long queues.
In contrast to HDVs, AVs rely on vehicle-to-everything (V2X) communication technology and automated control algorithms, which eliminate human perception–reaction delays and enable real-time coordination between vehicles and between vehicles and road infrastructure [11]. Existing studies have verified that AVs can effectively reduce start-up loss time through cooperative intersection management [12], achieve saturated flow at an earlier platoon position [13], and significantly improve the stability of intersection throughput [14]. Despite these advances, current intersection delay models rarely integrate the type-specific start-up mechanisms of HDVs and AVs into a unified analytical framework. Moreover, the differential impacts of key signal timing parameters (e.g., red light duration, green light duration) on the start-up loss delay of HDVs and AVs have not been quantitatively clarified, which severely limits the applicability of existing models in the optimization of mixed traffic signal control.
In recent years, methodological innovations in traffic delay analysis—such as hidden Markov models [15], trajectory-based traffic performance evaluation metrics [16], and big data-driven delay estimation techniques [17,18]—have greatly improved the granularity and accuracy of delay analysis. For example, scholars have developed travel delay calculation methods based on Google Maps trajectory data [19] and extracted signalized intersection delay indicators from high-precision vehicle trajectory data [20]. Nevertheless, these advanced methods still either treat all vehicles in the traffic flow as a homogeneous group or fail to effectively isolate start-up loss delay from other delay components (e.g., uniform delay, incremental delay). As a result, two critical research gaps remain in the field of mixed traffic start-up loss delay research: (1) the lack of a platoon-level start-up loss propagation model that can capture the queue-length-dependent cumulative characteristics of start-up loss delay; (2) the absence of a theoretically rigorous delay estimation method that distinguishes the intrinsic start-up mechanisms of HDVs and AVs.
To address the above research gaps, this study proposes an analytical start-up loss delay model that explicitly differentiates HDVs and AVs and is applicable to both unsaturated and saturated traffic states at signalized intersections. The specific research objectives are threefold: (1) to quantify the start-up loss propagation characteristics and time headway evolution laws of HDV and AV platoons based on field observation data and simulation experiments; (2) to construct a speed conduction model that can reflect the cumulative delay effect of start-up loss at different queue positions; (3) to establish a multi-factor start-up loss delay model integrating vehicle type-specific parameters and signal timing variables. The proposed model is validated using field test data and compared with the classic Webster and Clayton models to verify its superiority in delay estimation accuracy for mixed HDV-AV traffic scenarios.
This research makes three key contributions to the existing literature: first, it decouples the start-up loss mechanisms of HDVs and AVs by quantifying their differences in start-up response time, acceleration consistency, and saturated flow attainment position, filling the gap of undifferentiated research on start-up loss characteristics of different vehicle types; second, it introduces a queue-length-dependent cascading propagation function of start-up loss, overcoming the limitation of traditional models that simplify start-up loss as a fixed cost for leading vehicles; third, it quantitatively reveals the exponentially negative correlation between the AV penetration rate and additional start-up loss delay, providing actionable insights for the optimization of signal timing and platoon organization strategies at signalized intersections. The research findings lay a theoretical foundation for the design of intersection control strategies in the transitional period of traffic composition and provide technical support for the efficient integration of AVs into urban road traffic networks.
2. Literature Review
2.1. Research on HDV Start-Up Loss at Signalized Intersections
Start-up loss is a classic research topic in the field of signalized intersection traffic engineering, and early research has been centered on HDV flow. Clayton [5] first studied the start-up process of queued vehicles at signalized intersections and proposed that the platoon accelerates gradually rather than reaching saturated flow instantaneously, laying the theoretical foundation for subsequent start-up loss research. Webster [6] further incorporated start-up loss time into the fixed time signal delay formula, defining start-up loss as a fixed parameter and making it an important component of the classic Webster delay model, which has been widely applied in engineering practice.
On the basis of these classic models, subsequent scholars have conducted in-depth research on the key parameters of HDV start-up loss. Li et al. [7] compared the start-up time of the first two vehicles in HDV platoons at signalized intersections and found that driver experience and signal type have significant impacts on start-up response time. Capell [8] studied the evolution law of HDV platoon time headway during the start-up process and pointed out that the headway of the leading vehicles is significantly larger than that of the following vehicles, and the headway gradually stabilizes with the increase in queue position. Wang et al. [9] proposed a cumulative curve method to calculate the saturated flow rate and start-up loss time of HDVs, which improved the accuracy of parameter calibration by using actual traffic flow data. Zhao [10] conducted a comprehensive study on the capacity of signalized intersections and its influencing factors, and confirmed that the start-up loss of HDVs is one of the key factors restricting the intersection capacity, and the platoon generally reaches saturated flow at the sixth vehicle position.
However, these studies on HDV start-up loss have a common limitation: they all simplify start-up loss as a fixed time cost for the first few leading vehicles, ignoring the cascading propagation effect of start-up loss along the entire queue. This simplification leads to the fact that traditional models can only accurately estimate the delay of short queues, and will significantly underestimate the total delay when the queue is long, especially under congested traffic conditions. In addition, most of the existing HDV start-up loss models are calibrated based on homogeneous traffic flow data and cannot be directly applied to mixed HDV-AV traffic environments.
2.2. Research on AV Start-Up Loss and Mixed Traffic Intersection Performance
With the development of autonomous driving technology, an increasing number of scholars have turned their research focus to the start-up loss characteristics of AVs and the operational performance of mixed traffic at signalized intersections. Bansal et al. [11] put forward a policy guide for autonomous vehicle technology, pointing out that AVs can significantly reduce start-up loss time due to the elimination of human reaction delay, and thus improve the operational efficiency of signalized intersections. Dresner and Stone [12] proposed a multi-agent-based autonomous intersection management system, which enables AVs to pass through intersections in a cooperative manner without traditional traffic signals, and the simulation results show that this system can effectively reduce start-up loss and improve intersection throughput.
Qian et al. [13] studied the optimization of spatiotemporal resources at signalized intersections under HDV-AV mixed traffic flow, and found that AVs can reach saturated flow at an earlier platoon position, and the saturation flow rate is significantly higher than that of HDVs. Wang et al. [14] proposed a real-time estimation method of the saturated flow rate for mixed traffic flow based on license plate recognition data, and verified that the increase in the AV penetration rate can effectively improve the saturated flow rate of intersection approach lanes. These studies have fully confirmed the advantages of AVs in reducing start-up loss and improving intersection efficiency, but most of them focus on the qualitative analysis of AV performance advantages and lack the quantitative modeling of the start-up loss delay of AVs and its difference from HDVs.
In addition, some scholars have tried to incorporate AV characteristics into intersection delay models, but these models still have certain limitations. For example, most models only consider the impact of the AV penetration rate on intersection capacity, and do not distinguish the start-up mechanisms of HDVs and AVs at the micro-level; some models assume that AVs have ideal start-up performance, and do not consider the slight start-up delay caused by sensor perception and control system execution, leading to deviations between model results and actual traffic conditions.
2.3. Research on Traffic Delay Estimation Methods
In recent years, with the development of big data and artificial intelligence technology, traffic delay estimation methods have been continuously innovated, providing new technical means for the study of start-up loss delay. Zhao et al. [15] proposed a hidden Markov model to estimate the correlated queue length at signalized intersections in probe vehicle environments, which improved the accuracy of queue length estimation and laid a foundation for subsequent delay calculation. García-Mauriño et al. [16] improved the bus arrival time prediction model by using public transport API data, and the method can be extended to the delay estimation of other vehicle types.
Zhang et al. [17] proposed a method for calculating intersection delay based on mixed low-frequency vehicle trajectory data, which solved the problem of delay estimation under the condition of insufficient high-precision data. Saldivar Carranza et al. [18] extracted the operational performance indicators of traffic signals from high-precision vehicle trajectory data, including start-up loss delay, and realized the fine-grained evaluation of intersection delay components. Farras et al. [19] studied the mathematical relationship between traffic volume, speed, and density at signalized intersections, and provided a theoretical basis for the analysis of the relationship between traffic flow state and start-up loss delay. Liu et al. [20] developed a simulation system and speed guidance algorithm for intersection traffic control based on connected vehicle technology, which can effectively reduce the start-up loss of vehicles by guiding the speed of approaching vehicles.
Although these new delay estimation methods have greatly improved the accuracy and granularity of delay analysis, they still have obvious deficiencies in the study of mixed traffic start-up loss delay: most methods treat all vehicles in the traffic flow as a homogeneous group and do not consider the differences in start-up characteristics between HDVs and AVs; a small number of methods that consider mixed traffic only focus on the impact of the AV penetration rate on total delay and do not isolate and quantify the start-up loss delay of different vehicle types. As a result, the existing delay estimation methods cannot accurately reflect the dynamic characteristics of start-up loss delay in mixed HDV-AV traffic environments and cannot provide a reliable theoretical basis for the optimization of mixed traffic signal control strategies.
2.4. Research Gaps
Synthesizing the above research progress, it can be seen that the existing research has made certain achievements in HDV start-up loss and AV traffic performance and traffic delay estimation methods, but there are still obvious research gaps in the field of mixed HDV-AV traffic start-up loss delay at signalized intersections:
Lack of differentiated start-up loss mechanism research: Most existing studies treat HDVs and AVs as a homogeneous group and do not decouple their intrinsic start-up loss mechanisms from the perspectives of start-up response time, acceleration consistency, and platoon coordination, leading to the inability to accurately capture the differences in start-up loss characteristics between the two vehicle types.
Absence of queue-length-dependent propagation model: Traditional models simplify start-up loss as a fixed cost for the first few leading vehicles, ignoring the cascading propagation effect of start-up loss along the queue, and cannot reflect the cumulative characteristics of start-up loss delay with the increase in queue length.
Insufficient quantitative analysis of influencing factors: The differential impacts of key signal timing parameters (red light duration, green light duration) on the start-up loss delay of HDVs and AVs under different traffic states (unsaturated, saturated) have not been quantitatively clarified, and the relationship between the AV penetration rate and start-up loss delay reduction has not been accurately modeled.
Unified analytical framework for mixed traffic is missing: There is no start-up loss delay model that can integrate vehicle type-specific parameters and signal timing variables, and is applicable to both unsaturated and saturated traffic states, which makes it impossible to provide a reliable theoretical basis for the delay estimation and signal control optimization of mixed HDV-AV traffic at signalized intersections.
This study aims to fill the above research gaps by constructing a differentiated start-up loss delay model for HDVs and AVs, and provide theoretical and technical support for the efficient management of signalized intersections in the transitional period of traffic composition.
3. Methodology of Start-Up Loss Delay
Start-up loss delay is defined as the additional travel time incurred when queued vehicles transition from a stationary state to saturated flow during the green light phase [21]. The core difference in start-up delay mechanisms between HDVs and AVs stems from their distinct control logics: HDVs are influenced by human factors (e.g., perception–reaction time, driving experience), leading to high behavioral variability, while AVs rely on automated control systems, enabling consistent, rapid responses. This study classifies start-up delay into unsaturated and saturated conditions, analyzing each for both vehicle types.
3.1. Unsaturated Flow State
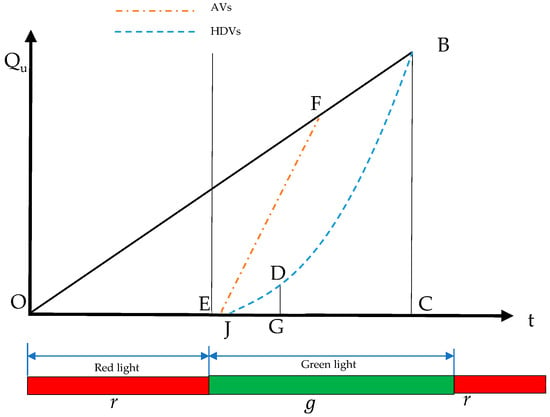
In the unsaturated state, queued vehicles formed during the red light phase can be completely discharged within the green light duration. For both HDVs and AVs, this state is characterized by two features: (1) sufficient green light time to avoid secondary queuing; (2) the start-up wave propagation in the platoon can be quantified by the relationship between queue length, start-up loss time, and delay [22]. However, the dynamic processes differ significantly between the two vehicle types (Figure 1).
Figure 1.
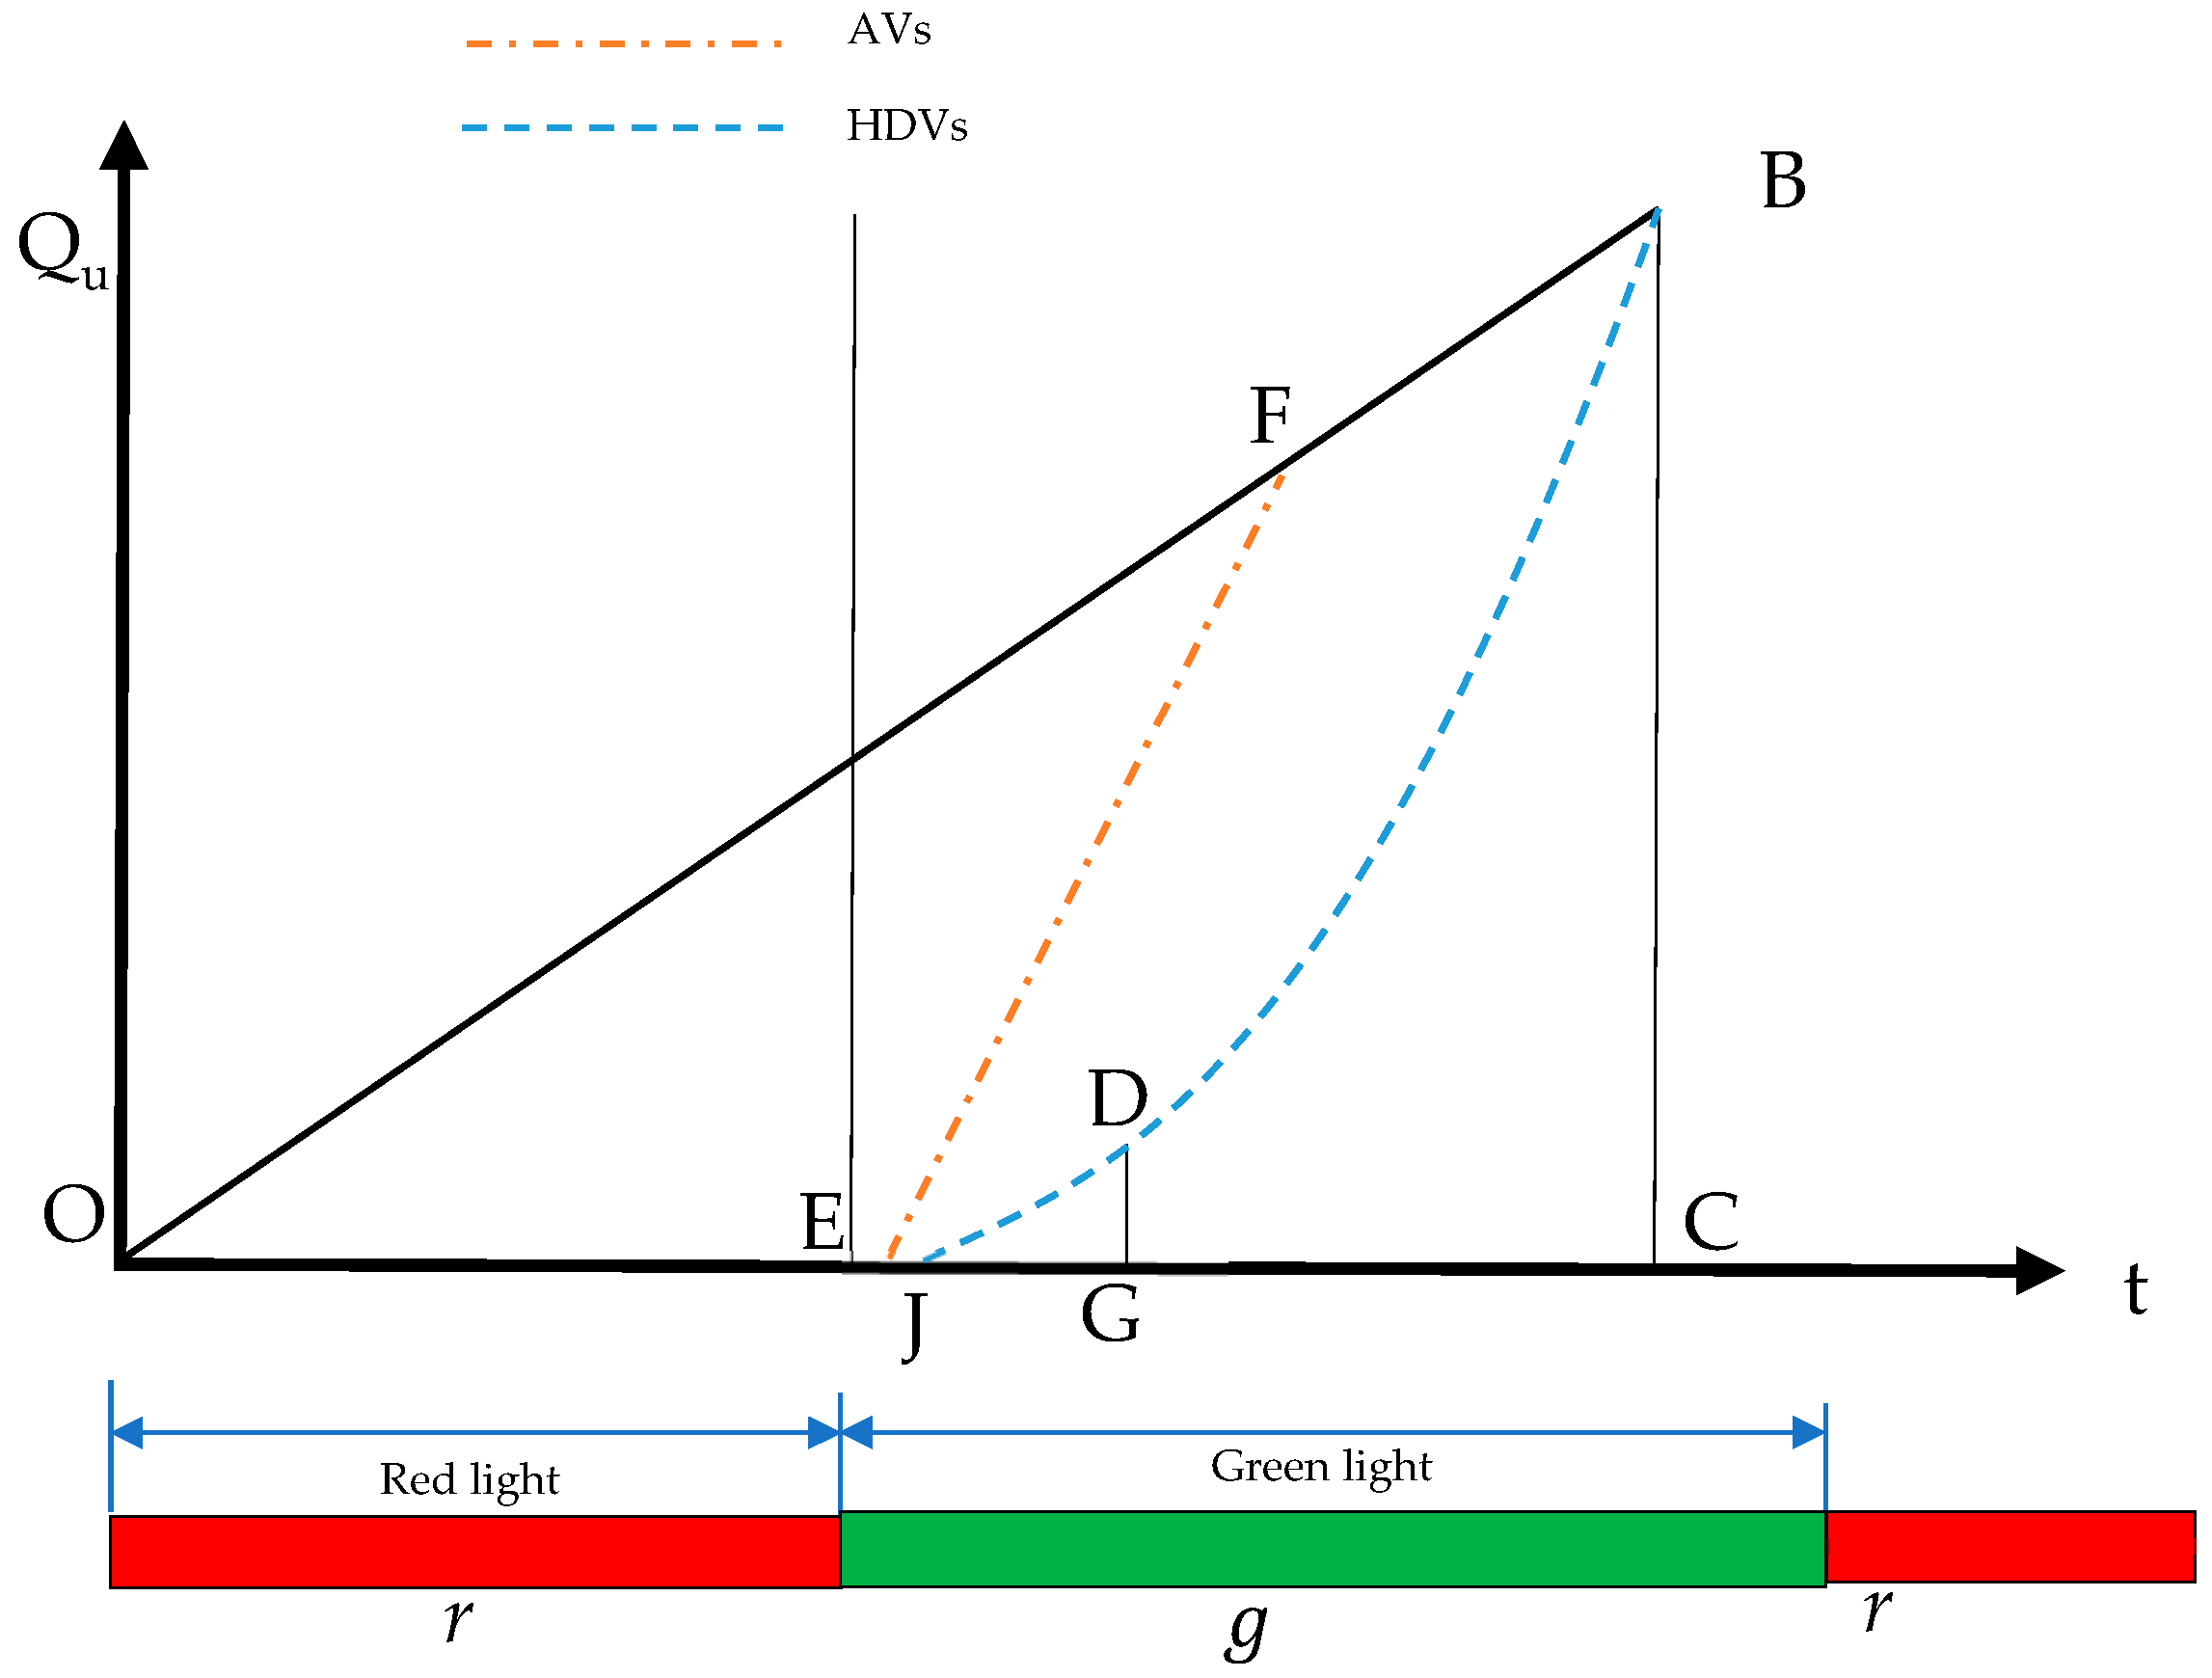
Queue length and delay time of starting loss in unsaturated state.
Figure 1 shows that the queue length and start-up loss delay occur under unsaturated conditions. The x-axis denotes the signal cycle duration (s); the y-axis represents the number of queued vehicles (veh); r represents the red light duration (s); g represents the green light duration (s); represents the vehicle arrival curve (slope = arrival rate q, pcu·h−1); represents the AV departure curve (slope equals the saturated flow rate S, pcu·h−1); represents the HDV departure curve ( represents the unsaturated departure segment, slope equals S’; represents the saturated departure segment, slope equals S); G represents the perpendicular foot of D to time axis; C represents the time when all queued vehicles pass the stop line.
- Delay Model for Avs
For Avs, the start-up process is triggered immediately upon detecting the green signal, with no human reaction delay (response time ~0.3–0.5 s [23]). AVs use V2X (Vehicle-to-Everything) communication to coordinate acceleration profiles and headways, resulting in consistent and rapid start-up. The departure cumulative curve of AV platoons (line in Figure 1 with a slope also equal to S) rises more steeply initially, with the platoon reaching saturation flow at the 3rd vehicle [13].
For AVs, when ignoring start-up loss, the total delay is the area of triangle FOE (Figure 1), calculated as:
where
q = vehicle arrival rate (pcu·h−1);
r = red light duration (s);
S = saturated flow rate (pcu·h−1; due to shorter AV headways [24]).
The number of queued vehicles N1 is derived from :
Average vehicle delay is:
Equation (3) indicates that AVs exhibit smaller average delay than HDVs under the same traffic conditions, attributed to their higher saturated flow rate .
- 2.
- Delay Model for HDVs
For HDVs, when the green light is activated, the first driver requires a perception–reaction time (typically 1.9–2.1 s [25]), followed by vehicle acceleration. The second and subsequent HDVs are affected by the preceding vehicle’s movement, with start-up times influenced by driver experience and following behavior, leading to prolonged and variable headways in the leading part of the platoon [26]. The departure cumulative curve of HDV platoons (curve in Figure 1) shows a slow initial rise, with the platoon reaching saturation flow only after the 6th vehicle [27].
Curve represents the departure cumulative line for the first few vehicles not reaching the saturated flow rate, with a slope equal to the departure flow rate S’ of the first few vehicles; point G is the perpendicular foot of point D to the time axis t, representing the time when the first few vehicles pass the stop line without reaching the saturated flow rate; line is the departure cumulative line when traffic flow reaches saturation, parallel to line , with a slope also equal to S; point C is the moment when all queued vehicles pass the stop line.
If the delay caused by start-up loss is considered, the start-up loss not only increases the delay of the first few vehicles but also increases the delay of the whole fleet. The existence of start-up loss makes the overall increase value of the delay of the fleet , which is the area of the graph . The total delay is the area of the graph , which is the sum of the delay added value and . For the convenience of calculation, the curve is simplified as a polyline ; that is, is a straight line and is a straight line. As shown in Figure 1, the delay is that the area of figure is equal to the area of triangle minus the area of triangle foe and the area of figure . Namely
After simplification, then get:
where
= departure flow rate of the first few vehicles (pcu·h−1, < );
= maximum number of vehicles in the queue(pcu);
= time when all queuing vehicles pass through the stop line(s);
= time when the first vehicle passes through the stop line(s);
= time that the vehicle without reaching the saturated flow rate passes through the stop line(s).
Other parameters are consistent with previous definitions.
Equation (5) indicates that the delay caused by start-up loss is related to seven factors: saturated flow rate , departure cumulative line of the first few vehicles , red light duration , time for the first vehicle to pass the stop line , time for all queued vehicles to pass the intersection , vehicle arrival rate , and time for vehicles not reaching the saturated flow rate to pass the stop line .
3.2. Saturated Flow State
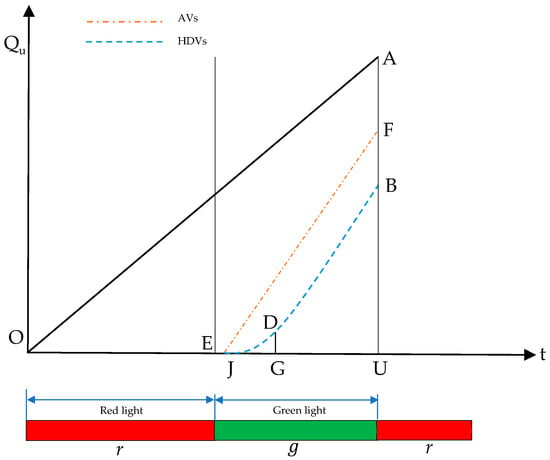
In the saturated state, queued vehicles cannot be fully discharged within a single green light phase, leading to secondary queuing across cycles [28]. For HDVs, the start-up loss accumulates across cycles due to inconsistent driver behavior, resulting in nonlinear growth of delay. For AVs, although secondary queuing still occurs, the consistent start-up dynamics mitigate the cumulative effect of delay (Figure 2).
Figure 2.
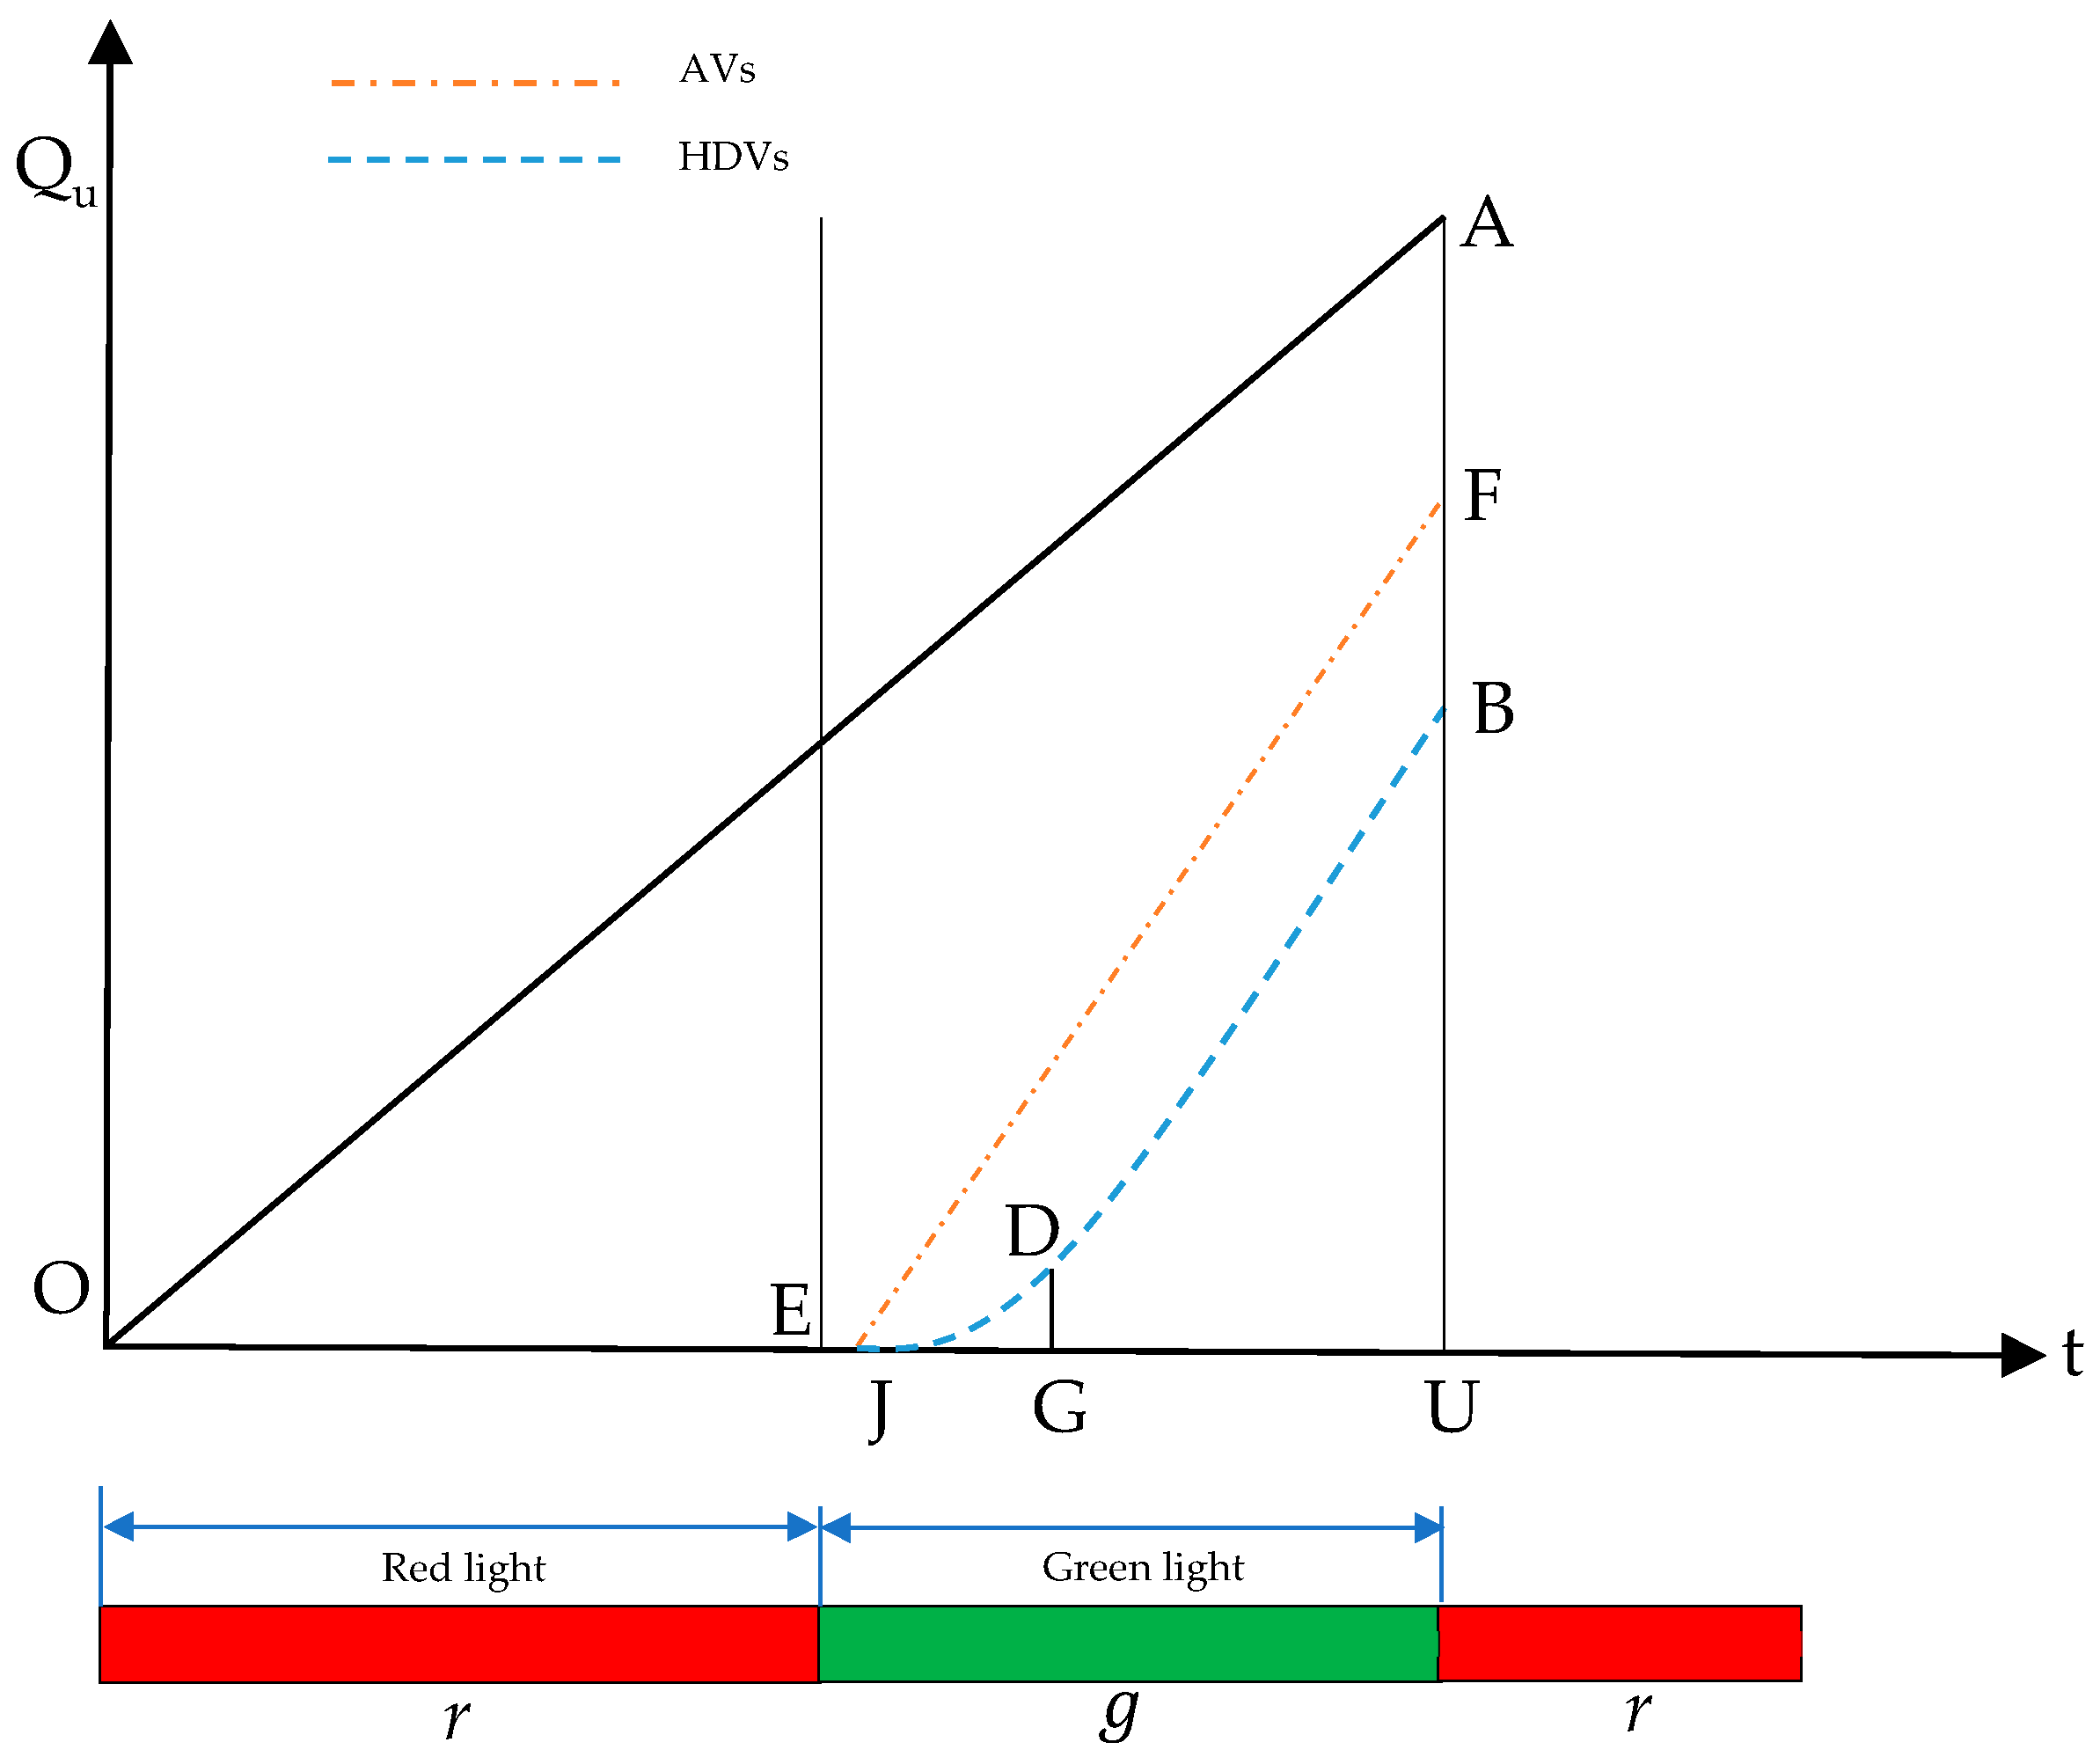
Queue length and delay time of starting loss in saturated state.
Figure 2 shows that the x-axis denotes signal cycle duration, while the y-axis indicates the number of vehicles queued at the stop line. r represents the red light duration; g represents the green light duration. Line denotes the vehicle arrival process at the accumulation line. During the red -light phase, vehicles queue sequentially at the stop line, forming a cumulative arrival curve with a slope equivalent to the vehicle arrival rate q (vehicles per unit time).
Line represents the vehicle departure cumulative line without considering start-up loss, with a slope equal to the saturated flow rate of the platoon ; the first vehicle needs to undergo the driver’s reaction time and vehicle operation time, delaying its passage through the stop line at point J, so line represents the time when the first vehicle passes the stop line; curve represents the vehicle departure cumulative line considering start-up loss, line is the departure cumulative line for the first few vehicles not reaching the saturated flow rate, with a slope equal to the departure flow rate of the first few vehicles; line is the departure cumulative line when traffic flow reaches saturation, parallel to line , with a slope also equal to; point D’s perpendicular foot to the abscissa is point G, and line is the time for vehicles not reaching the saturated flow rate to pass the stop line. Line is the difference between line and line , which represents the actual time for the vehicle not reaching the saturated flow rate to pass through the stop line; line represents the number of vehicles affected by the starting loss, that is, the number of vehicles that have not reached the saturated flow rate.
- 1.
- Delay Model for Avs
As illustrated in Figure 2, when it is autonomous driving, its delay should correspond to the area of the AOEF in the figure, which is equivalent to the area of triangle AOU minus the area of triangle FEU. Through derivation, it can be concluded that:
where
= vehicle arrival rate at the intersection (pcu·h−1);
= duration of the red light (s);
= duration of the green light (s);
= saturated flow rate of vehicles departing from the stop line(pcu·h−1).
The number of queued vehicles corresponds to the value of line segment AU. Through derivation, it can be concluded that.
where
= number of queued vehicles neglecting start-up loss (pcu).
The meanings of the other parameters remain the same as above.
The average delay per vehicle is calculated as the total delay divided by the number of queued vehicles, i.e., as follows:
where
= average delay per vehicle(s).
The meanings of the other parameters remain consistent with those defined above.
From Equation (8), it can be concluded that the average delay of each autonomous vehicle is related to signal timing parameters, the vehicle arrival rate, and the vehicle departure rate.
- 2.
- Delay Model for HDVs
For HDV, the delay under saturation conditions corresponds to the area of the FEJDB graph. The total delay is the area of the AOJDB graph, equal to the sum of incremental delay and basic delay . For simplicity of calculation, the curve JDB is approximated as a polyline JDB (i.e., JD and DB are straight lines). As shown in Figure 2, the delay (area FEJDB) can be obtained by subtracting the area of trapezoid BDGU and triangle DJG from the area of triangle FEU, expressed as
After simplification, it can be concluded that
where
= duration of the green light(s);
= saturated flow rate of the traffic stream (pcu·h−1);
= departure rate of the first few vehicles (pcu·h−1, S’ < S);
= time for the first vehicle to pass the stop line(s);
= time for vehicles not yet reaching the saturated flow rate to pass the stop line(s).
Equation (10) indicates that the start-up loss delay is determined by five factors: the saturated flow rate , green light duration , first vehicle’s stop line passage time , departure rate of the initial vehicles , and passage time of vehicles under non-saturated flow .
3.3. Key Differences in Start-Up Loss Between HDVs and AVs
In summary, the common influencing factors of start-up loss delay at signalized intersections, under both unsaturated and saturated conditions, include the following five aspects: saturated flow rate, signal cycle duration, time for the first vehicle to pass the stop line, departure rate of the initial vehicles, and passage time of vehicles under non-saturated flow. Additionally, under unsaturated conditions, two extra factors must be considered: Total time for all queued vehicles to pass the intersection, Vehicle arrival rate.
Table 1 summarizes the core differences in start-up loss characteristics between HDVs and AVs, which are the foundation for the proposed delay model.
Table 1.
Comparison of start-up loss characteristics between HDVs and AVs.
This study concentrates on the dynamic influencing mechanisms of factors such as the start-up loss time of the first vehicle, departure rate of initial vehicles, and acceleration loss time of the vehicle platoon. By establishing a multi-factor coupling analysis framework, we aim to elucidate how these variables impact intersection throughput efficiency, queue evolution patterns, and system stability.
4. Analysis of Influencing Factors
4.1. Start-Up Response Time
- 1.
- HDVs: Driver Reaction Time
Driver reaction time is the primary component of HDV start-up response time, affected by factors such as countdown signals, driving experience, and vehicle type [31]. Field measurements were conducted at signalized intersections with and without countdown signals, collecting valid data from 78 HDV cases (without countdown) and 79 HDV cases (with countdown). Statistical results (Table 2) show that the average reaction time of HDV drivers is 2.05 s (without countdown) and 1.90 s (with countdown), with a standard deviation of ~0.9 s and a range of 5.84 s (minimum: −0.84 s; maximum: 5 s), indicating significant individual differences. Further analysis reveals that taxi drivers (professional drivers) have shorter reaction times (~1.7 s) than private car drivers (~2.3 s), attributed to more extensive driving experience. The minimum values of the driver reaction time are −0.84 s (without countdown) and −0.62 s (with countdown), respectively, indicating that some drivers take anticipatory actions by observing the phase changes in adjacent traffic signals. Since such drivers account for only a small proportion, this phenomenon has negligible impacts on the overall analysis.
Table 2.
Statistics of HDV driver start-up reaction time.
- 2.
- AVs: Automated Response Time
AV start-up response time is determined by sensor perception latency and control system execution time, with no human-related variability. According to the literature [32,33,34] and manufacturer data, the average start-up response time of Level 4 AVs is 0.3–0.5 s, with a standard deviation of less than 0.05 s. This is because AVs continuously monitor traffic signals through cameras and radar, and the control system initiates acceleration immediately upon detecting a green light transition, eliminating perception–reaction delays and decision-making variability.
4.2. Platoon Acceleration Loss Time and Departure Rate
- 1.
- Acceleration Loss Time
Acceleration loss time refers to the time required for the platoon to transition from stationary to saturated flow, determined by the position where headways stabilize (saturation position). For HDVs, field measurements were conducted using video surveillance, collecting 156 valid platoon samples and 1382 time headway data points. Statistical analysis (Table 3) shows that HDV headways are highly variable for the first five vehicles, with significant differences between adjacent positions (p < 0.05 for the fifth vs. sixth vehicle; Table 4). The sixth vehicle marks the saturation position, with an average front-end loss time of 2.92 s.
Table 3.
Time headway statistics at different queue positions (HDVs vs. AVs).
For AVs, based on simulation data from SUMO (Simulation of Urban Mobility) and field test data, the time headways of AV platoons stabilize at the third vehicle (Table 3). The front-end loss time for AV platoons is only 0.85 s, significantly shorter than that of HDVs, due to consistent acceleration and V2X-coordinated headways.
Based on the 156 valid datasets collected from field surveys, the average time headway of the first five vehicles was first calculated, with detailed results presented in Table 3. Subsequently, the departure rates for vehicles at each position were computed, and the results are summarized in Table 3. This analytical process not only quantifies the time headway characteristics of the leading vehicles but, more importantly, reveals the spatial distribution patterns of departure rates during the platoon start-up process. These findings offer robust data support for a deeper understanding of the propagation characteristics of start-up waves at signalized intersections.
- 2.
- Departure Rate of Unsaturated Vehicles
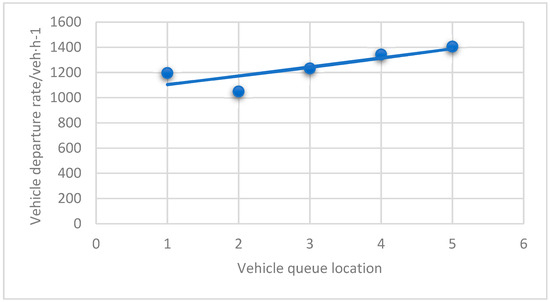
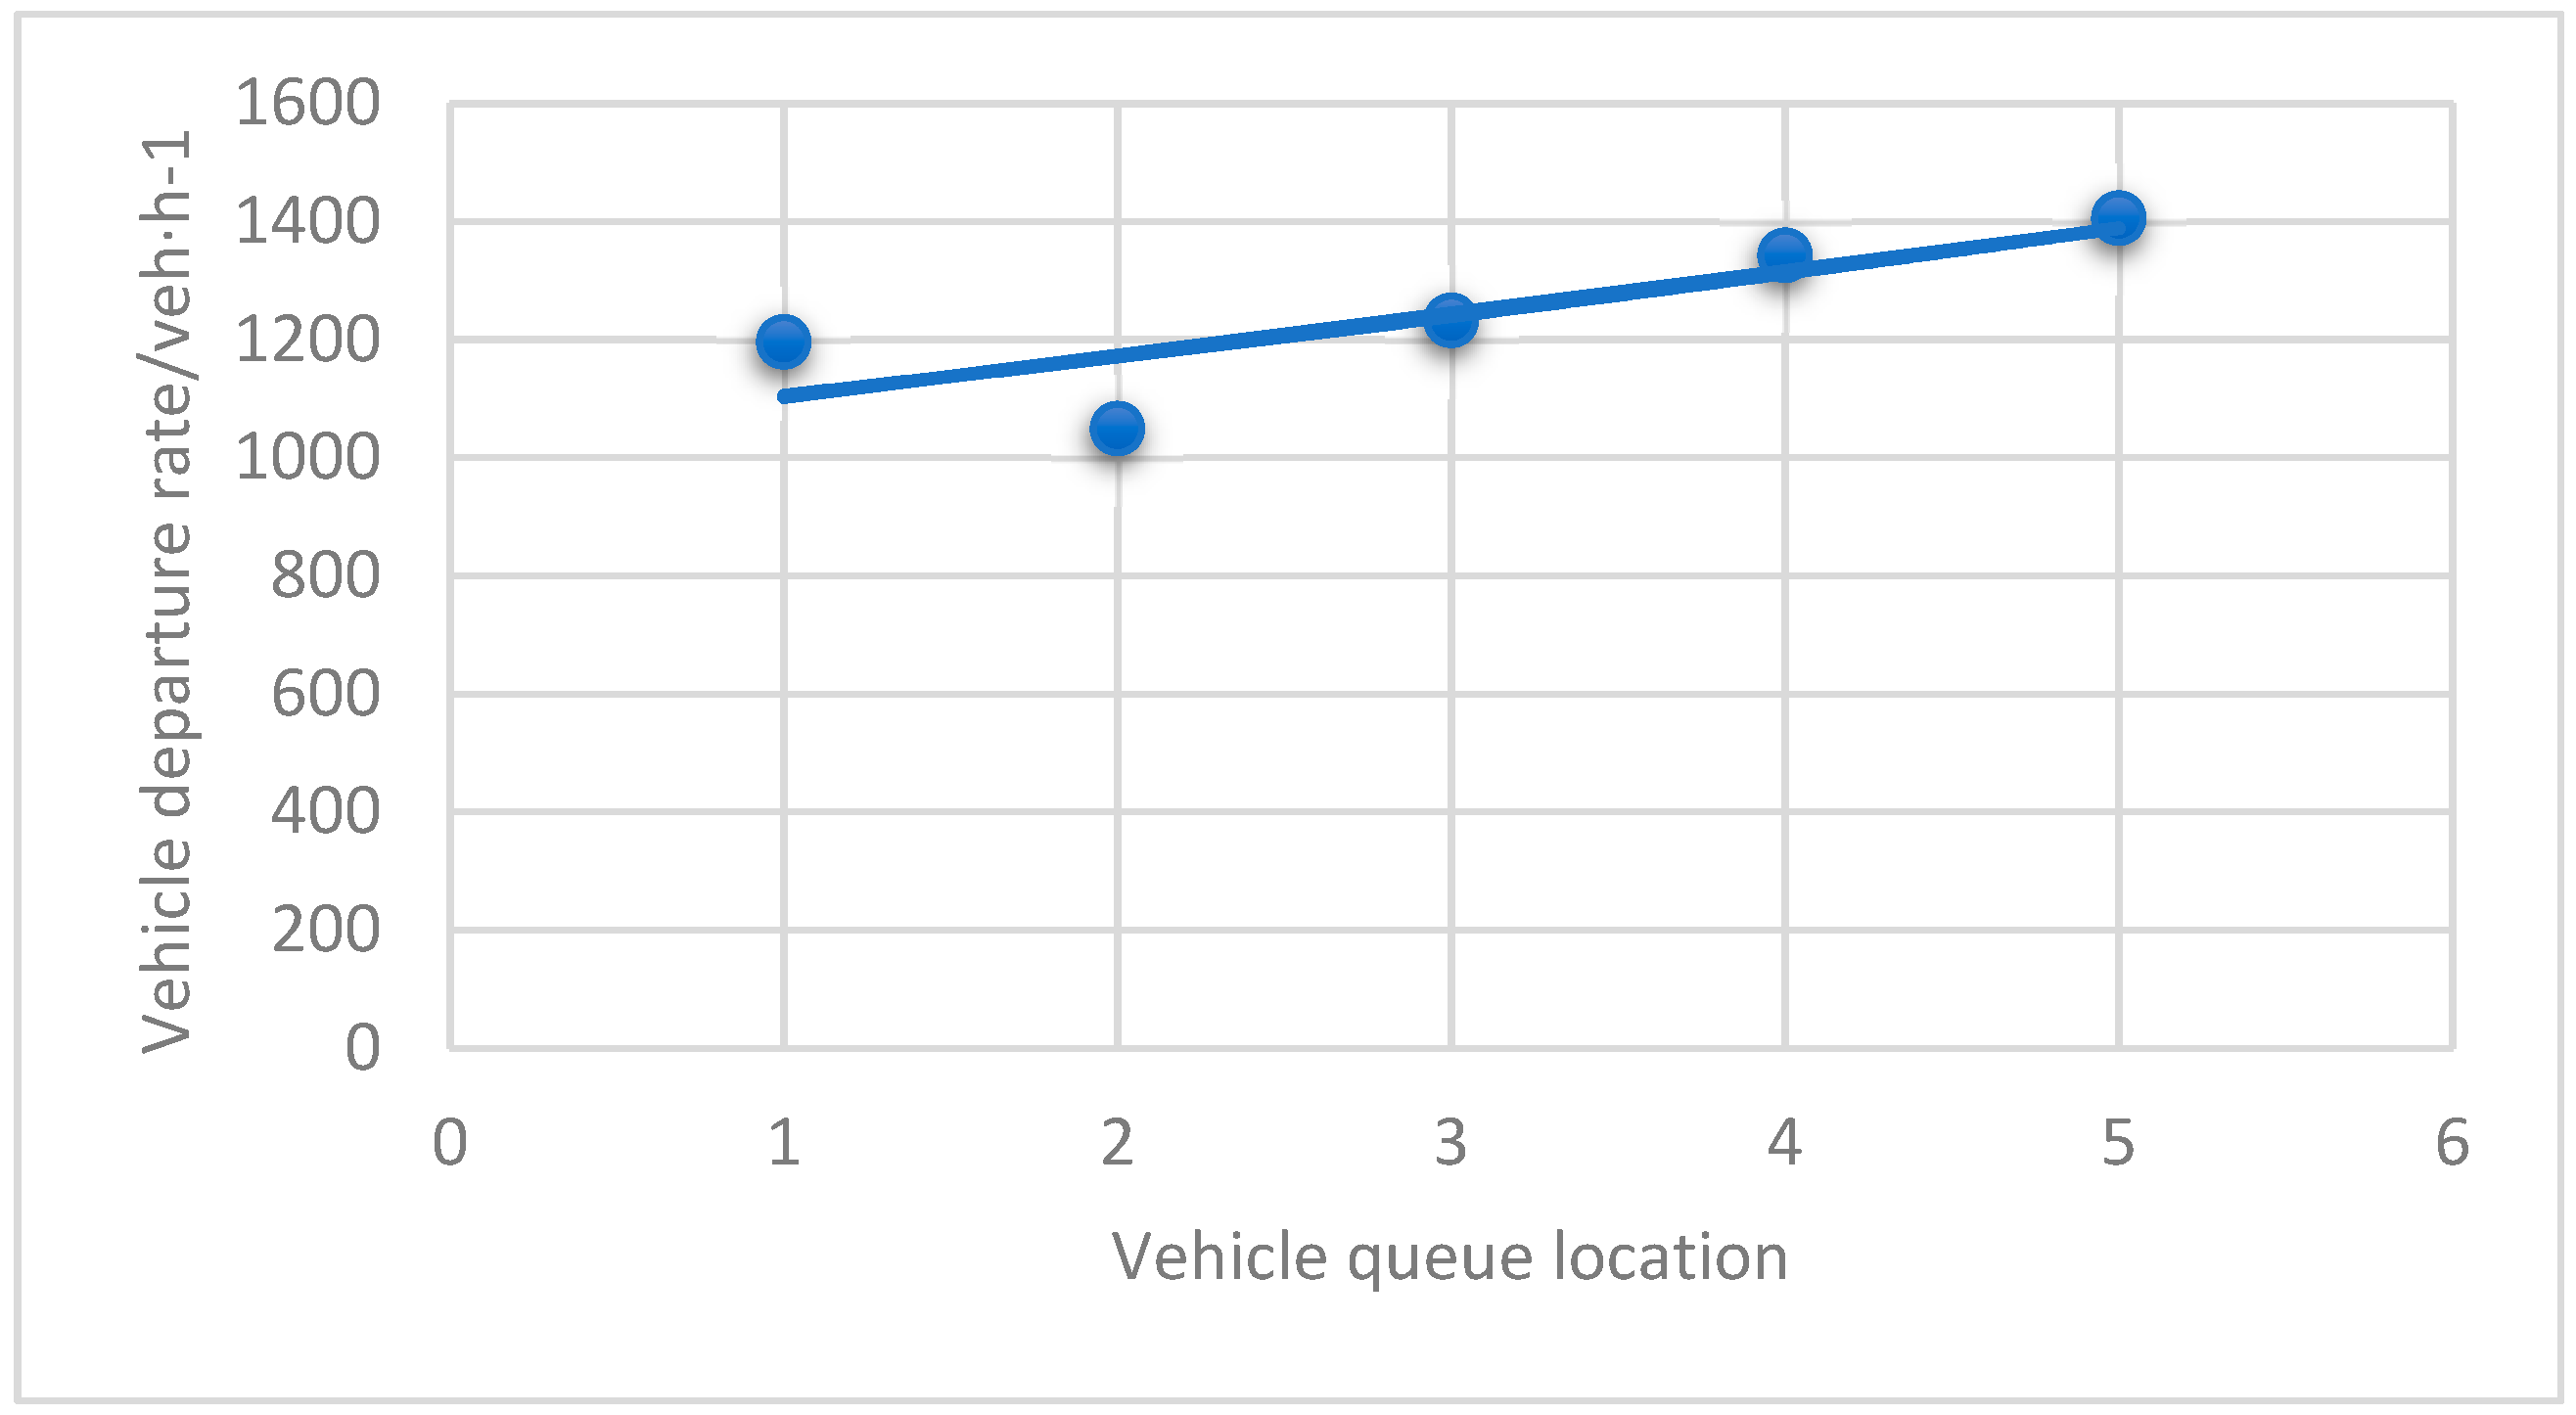
The departure rate is defined as the number of vehicles passing the stop line per unit time during the start-up phase. For HDVs, the departure rate of the first five vehicles (unsaturated phase) increases linearly with queue position (Figure 3). The linear regression model is:
Figure 3.
Departure rate scatter diagram of the first five vehicles.
Through quantitative analysis of Figure 3, the study reveals that the departure rates of the first five vehicles exhibit a distinct linear distribution pattern. Linear regression analysis was applied to derive the fitted model as follows:
where
X = vehicle’s ordinal position (integer values from 1 to 5);
= HDV departure rate (veh·h−1)
= coefficient of determination.
Based on this linear model, the departure rates of the first five non-saturated vehicles can be accurately calculated, providing a reliable theoretical foundation for quantifying the traffic efficiency during the start-up phase at signalized intersections. This finding not only confirms the linear increasing trend of departure rates with platoon position but also offers critical theoretical support for optimizing traffic signal timing and evaluating traffic capacity.
For AVs, the departure rate of the first two vehicles (unsaturated phase) increases linearly, with a steeper slope due to shorter headways. The linear regression model is:
where
x = vehicle ordinal position (1–2);
= AV departure rate (veh·h−1);
= coefficient of determination.
Equations (11) and (12) confirm that AV departure rates are significantly higher than HDV rates at all positions (p < 0.001), with AVs reaching saturation departure rates earlier (third vehicle), demonstrating superior start-up efficiency. The AV model’s higher (0.8934 vs. 0.6676) reflects more consistent AV start-up behavior.
5. Case Study Analysis
A case study was conducted on a four-phase signalized intersection to verify the proposed model. Key parameters are set as follows: green light duration g = 50 s; red light duration r = 40 s (the yellow light duration is considered zero for simplicity). The saturated flow rate . The first vehicle’s stop line passage time is 2 seconds. Vehicles starting from the sixth position achieve the saturated flow rate when passing the stop line. The cumulative departure flow of the first five vehicles is . The objective is to calculate the start-up loss delay for queued vehicles in this direction, ignoring the constraint of road length on queue size.
5.1. Unsaturated State
As established in prior analyses, a critical state occurs when the last queued vehicle passes the stop line precisely as the green light transitions. In this scenario, the vehicle arrival rate reaches its maximum value under unsaturated conditions, expressed as:
The maximum queue length under unsaturated conditions is derived as:
For this case study, the maximum queue length under unsaturated conditions is determined to be 16 vehicles.
- 1.
- Impact of Red Light Duration
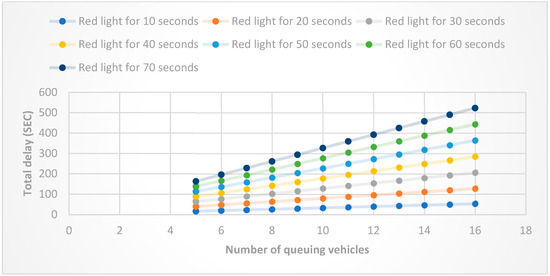
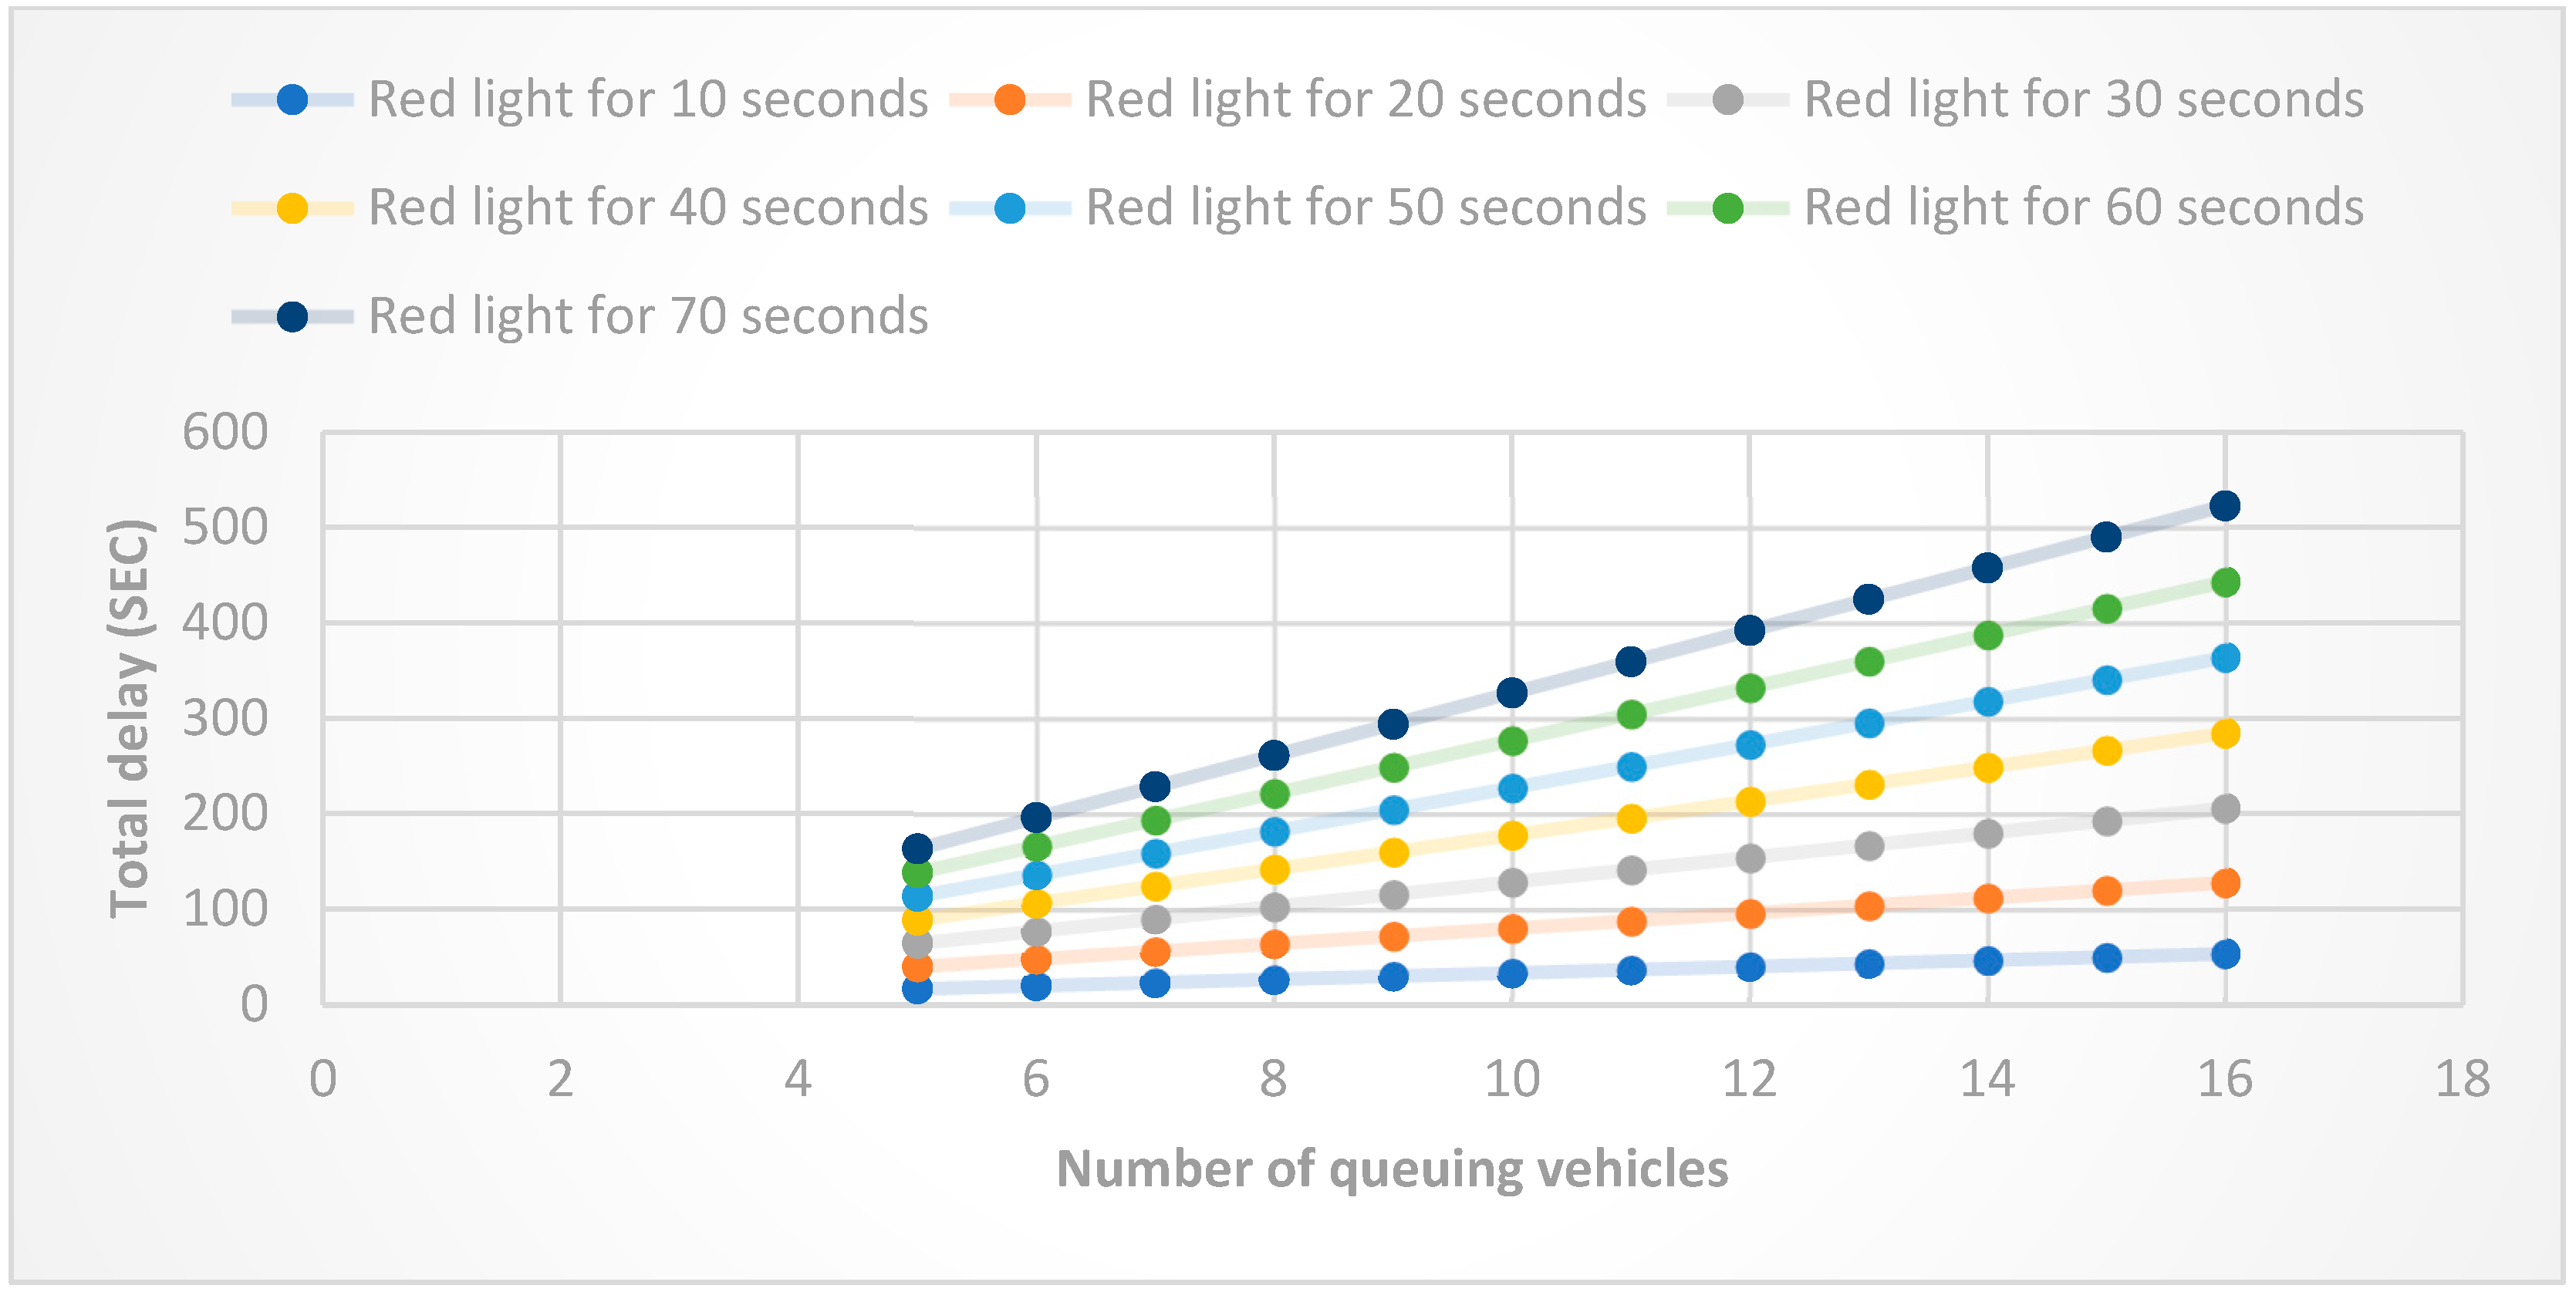
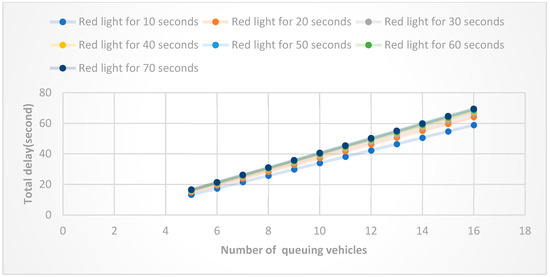
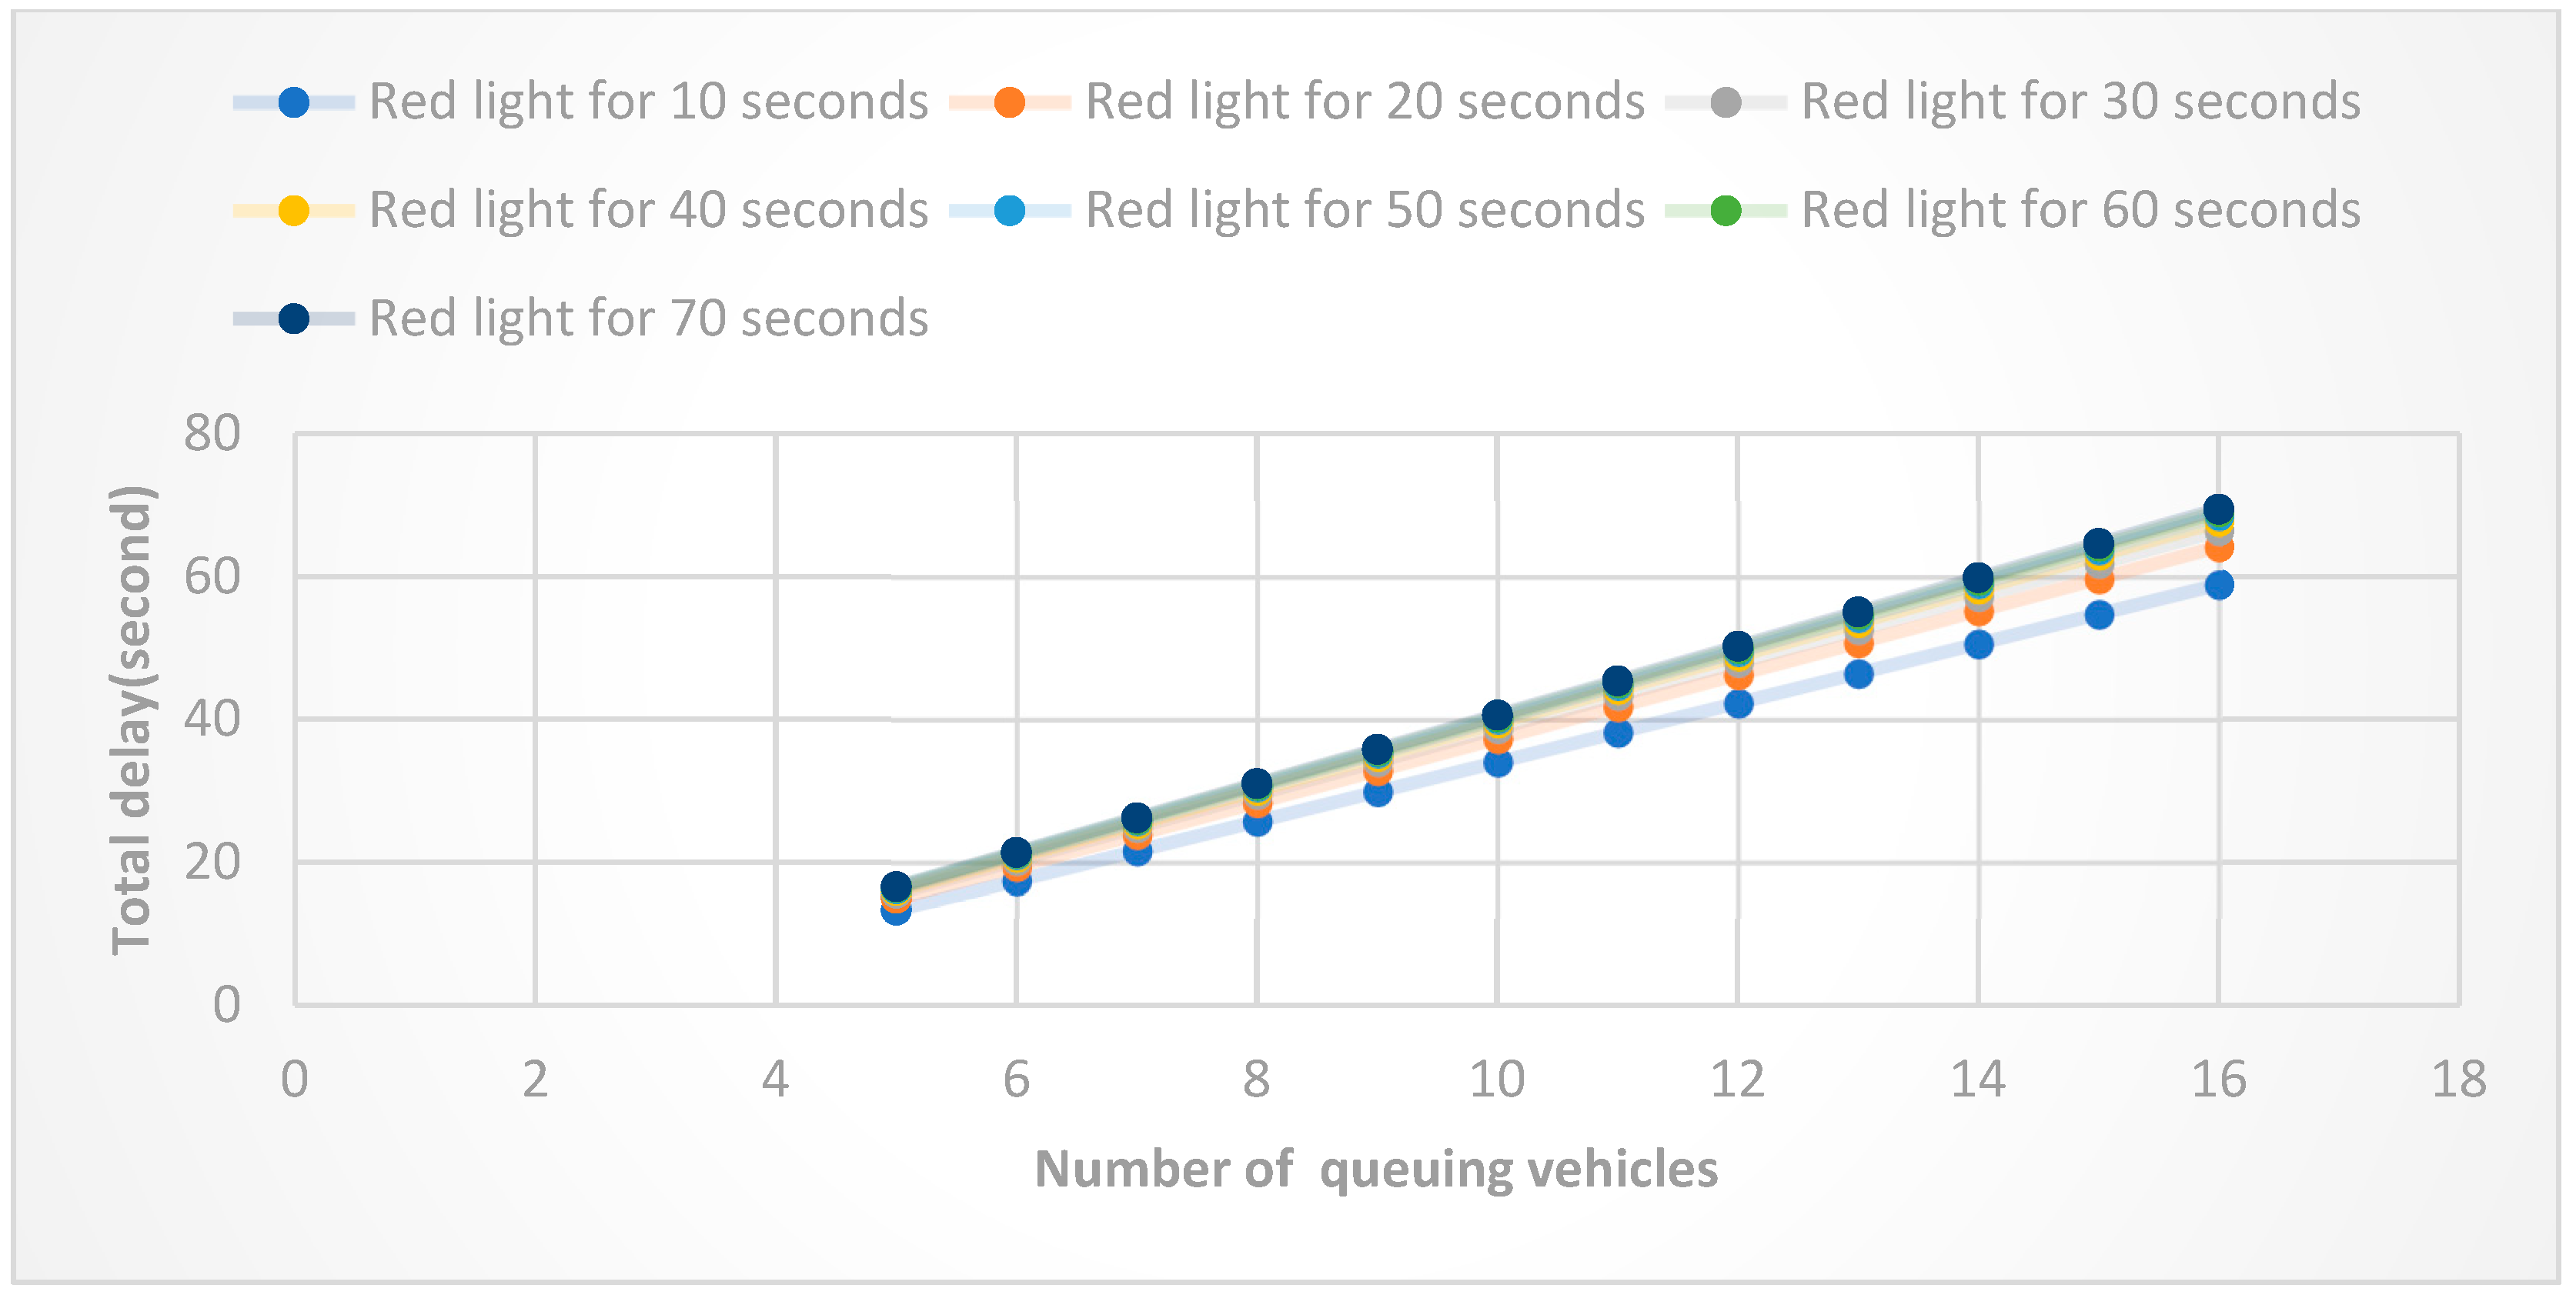
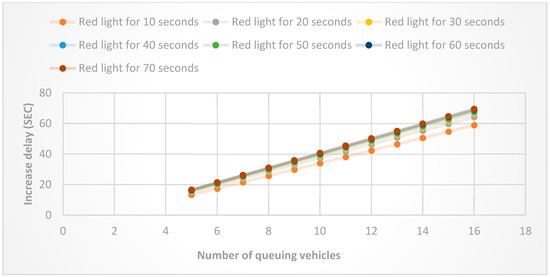
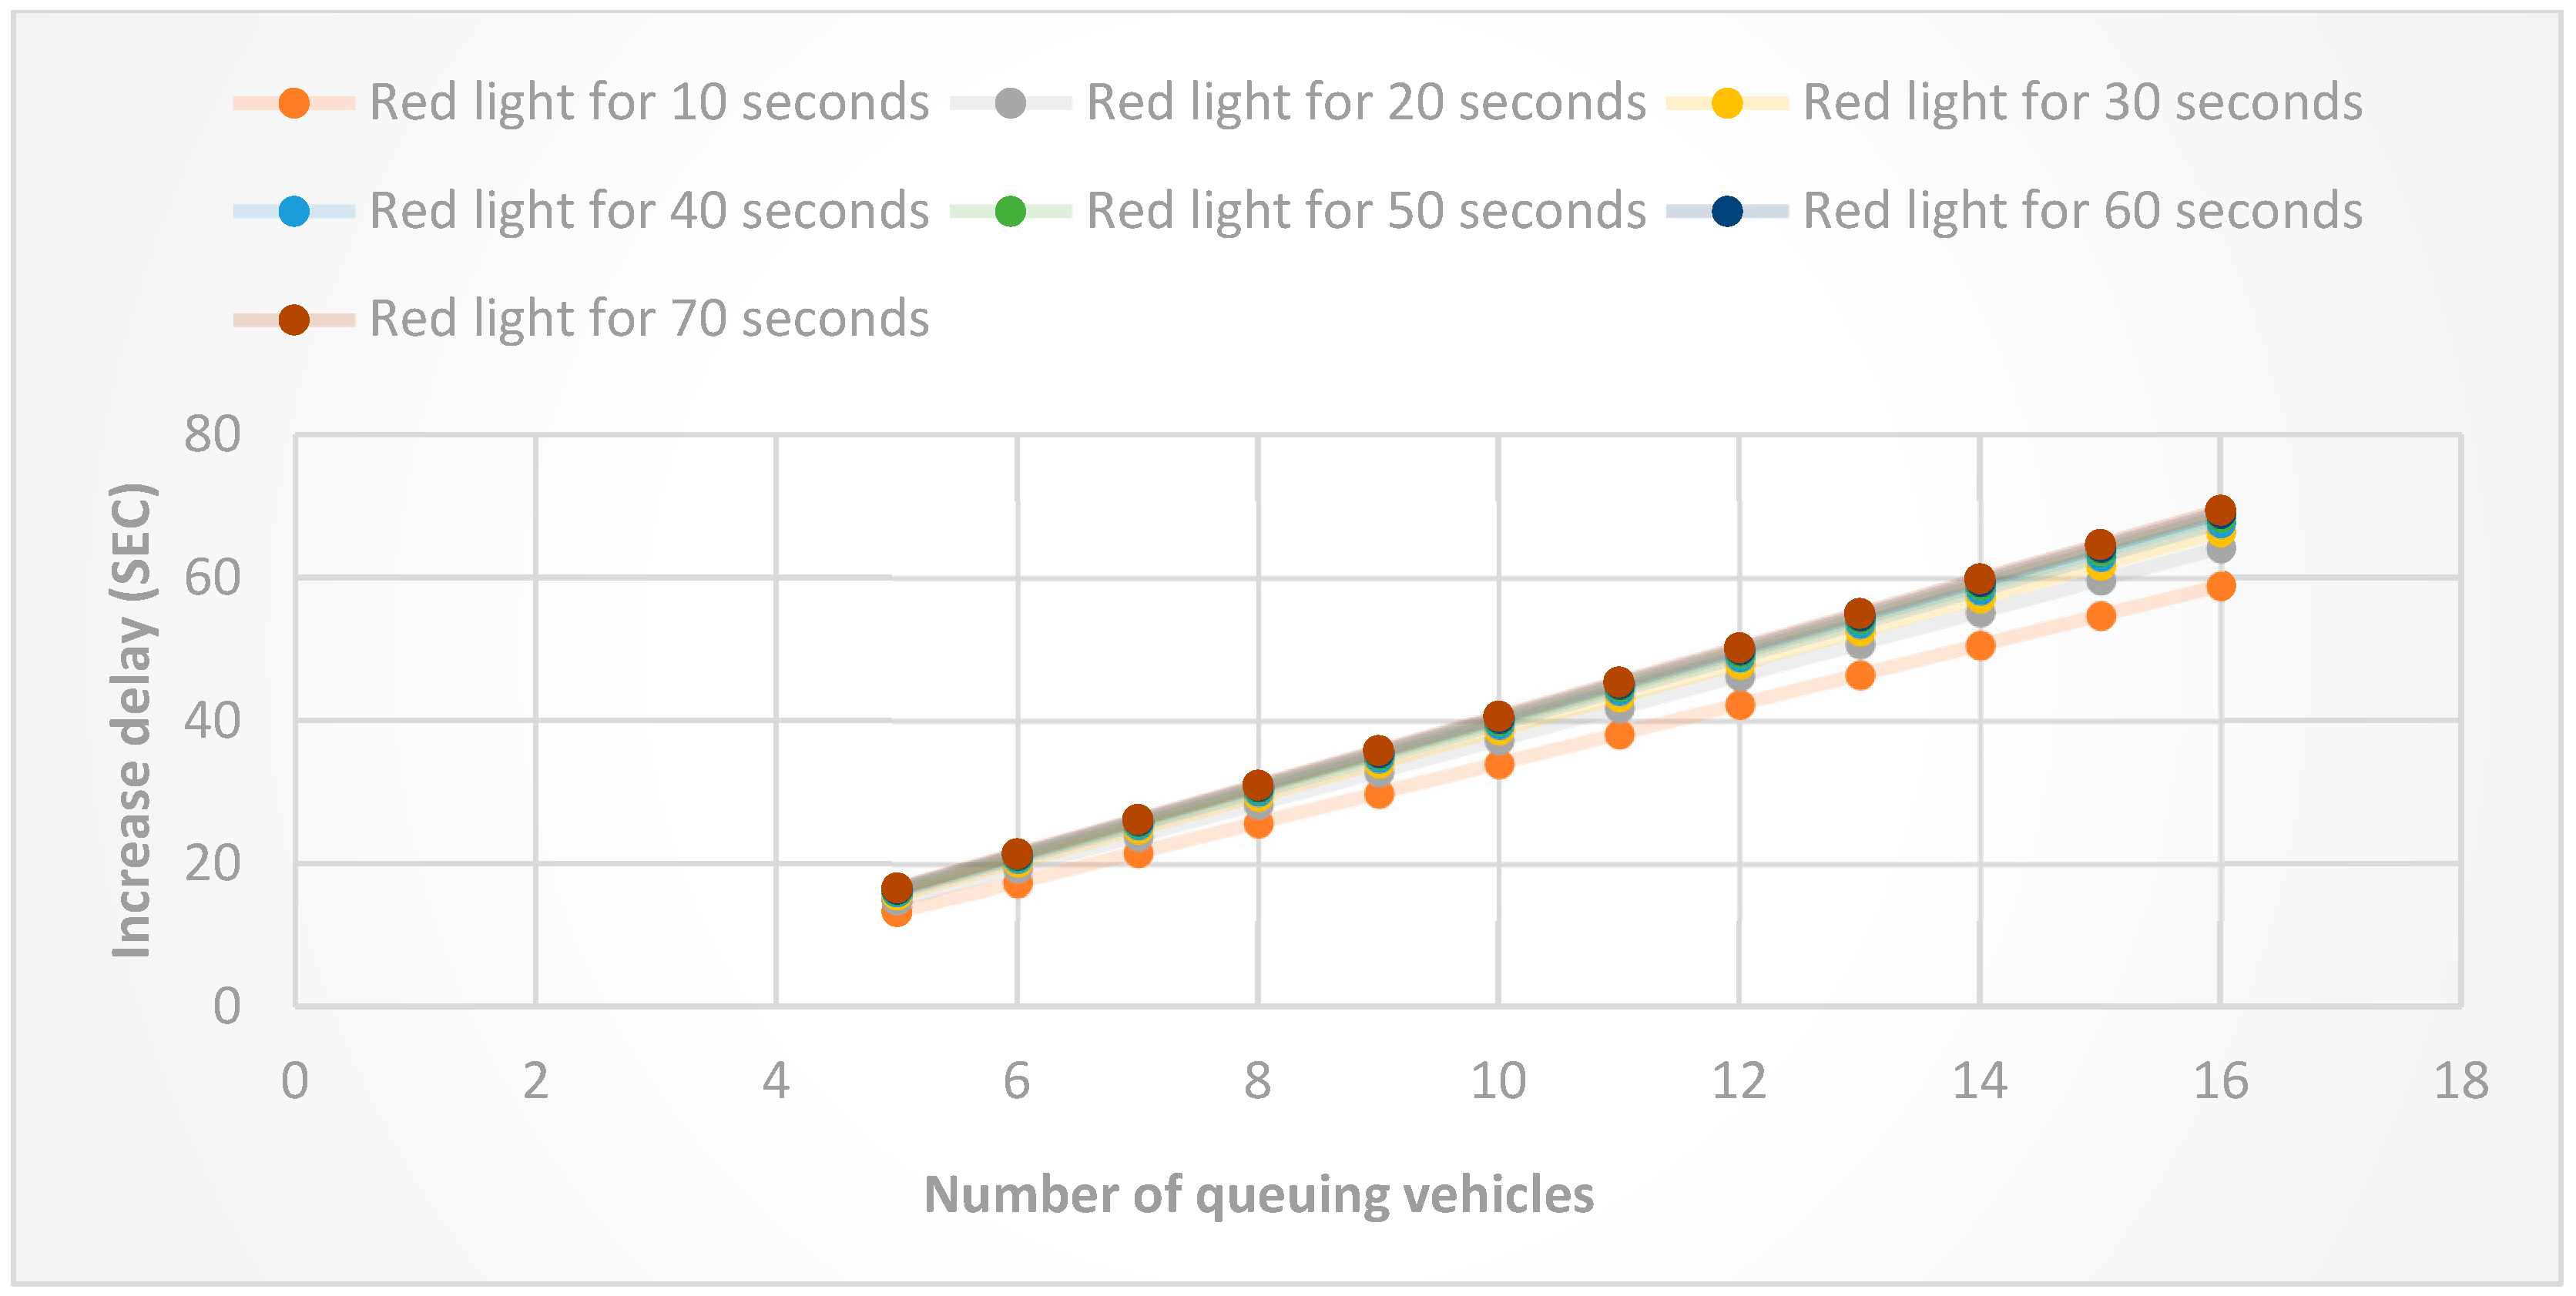
When red light duration varies from 10 s to 70 s (step = 10 s), the total delay ignoring start-up loss increases linearly for both vehicle types, but HDVs have a higher growth rate (140% → 18%) than AVs (95% → 12%) (Figure 4 and Figure 5). The additional delay considering start-up loss for HDVs increases from 2.3 s to 8.7 s, with a growth rate dropping from 12.4% to 0.6%, while for AVs, it only increases from 0.5 s to 2.1 s, with a growth rate of 8.2% → 0.3% (Figure 6). This indicates that red light duration has a more significant impact on HDV start-up loss delay.
Figure 4.
Total delay and queuing vehicles for HDVs.
Figure 5.
Total delay and queuing vehicles for AVs.
Figure 6.
Delay increase and queuing vehicles.
5.2. Saturated State
The maximum queue length under saturated conditions exceeds 16 vehicles, leading to secondary queuing.
- 1.
- Impact of Green Light Duration
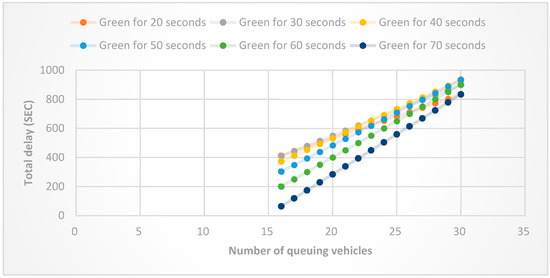
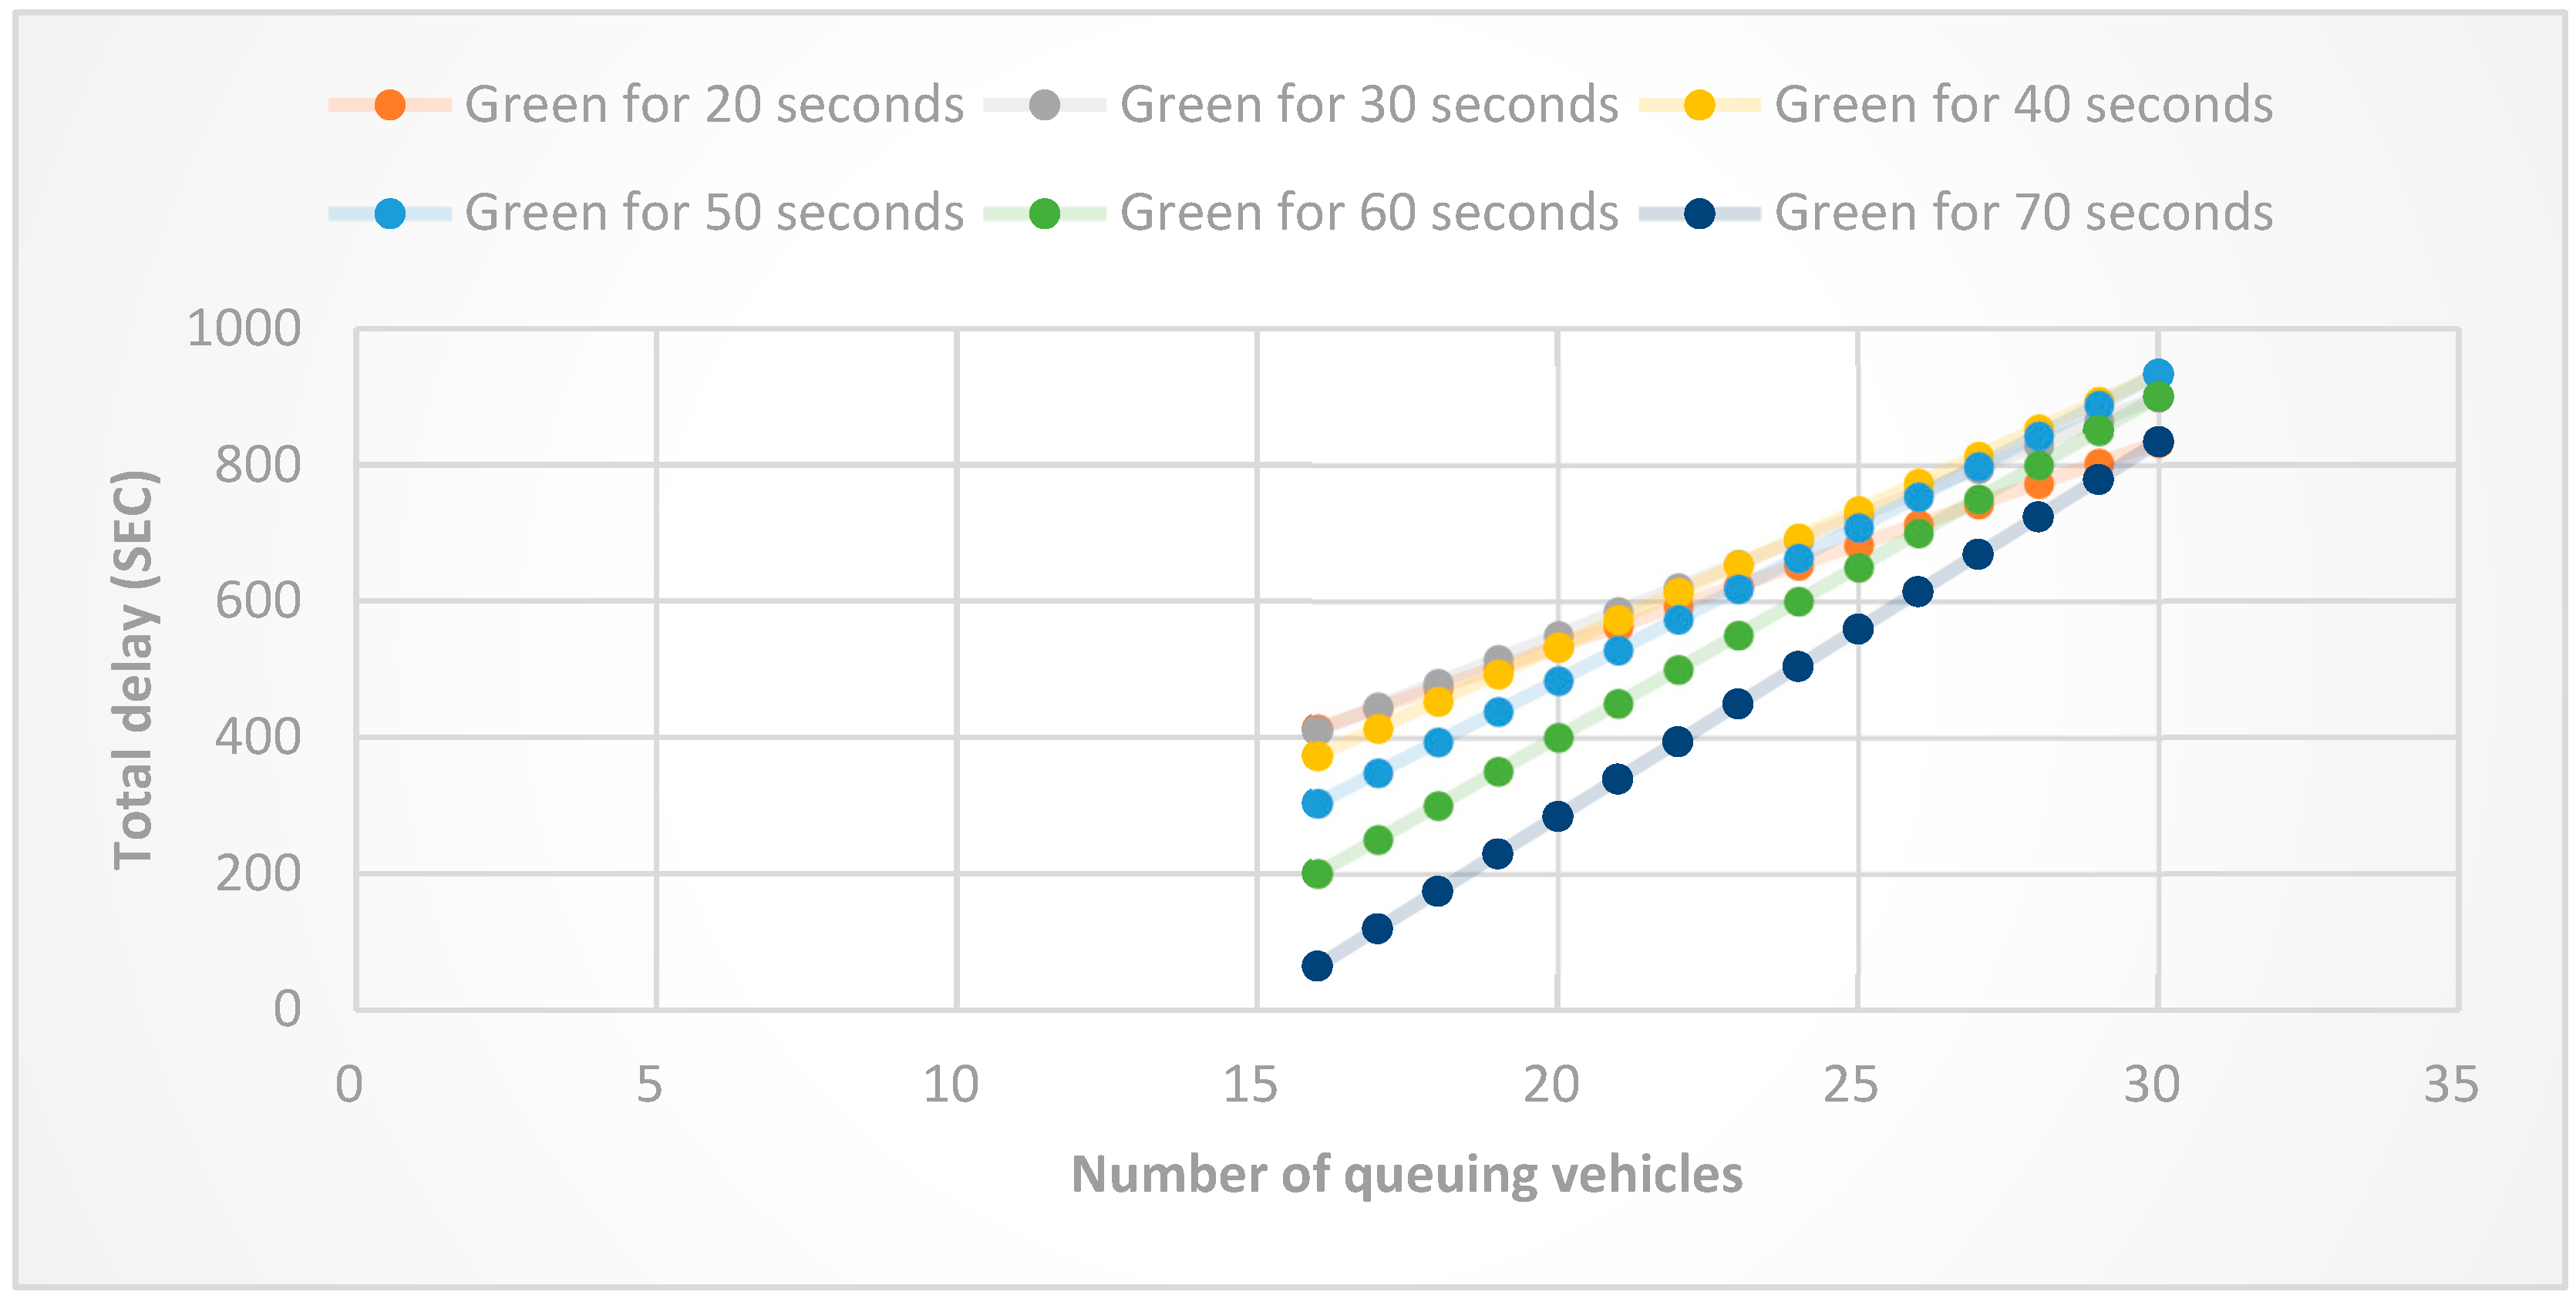
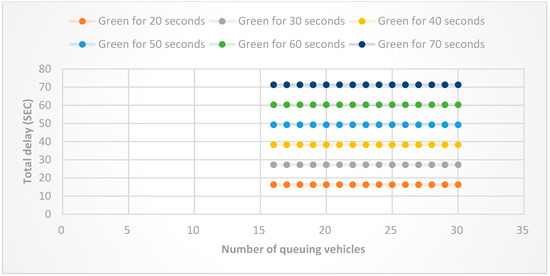
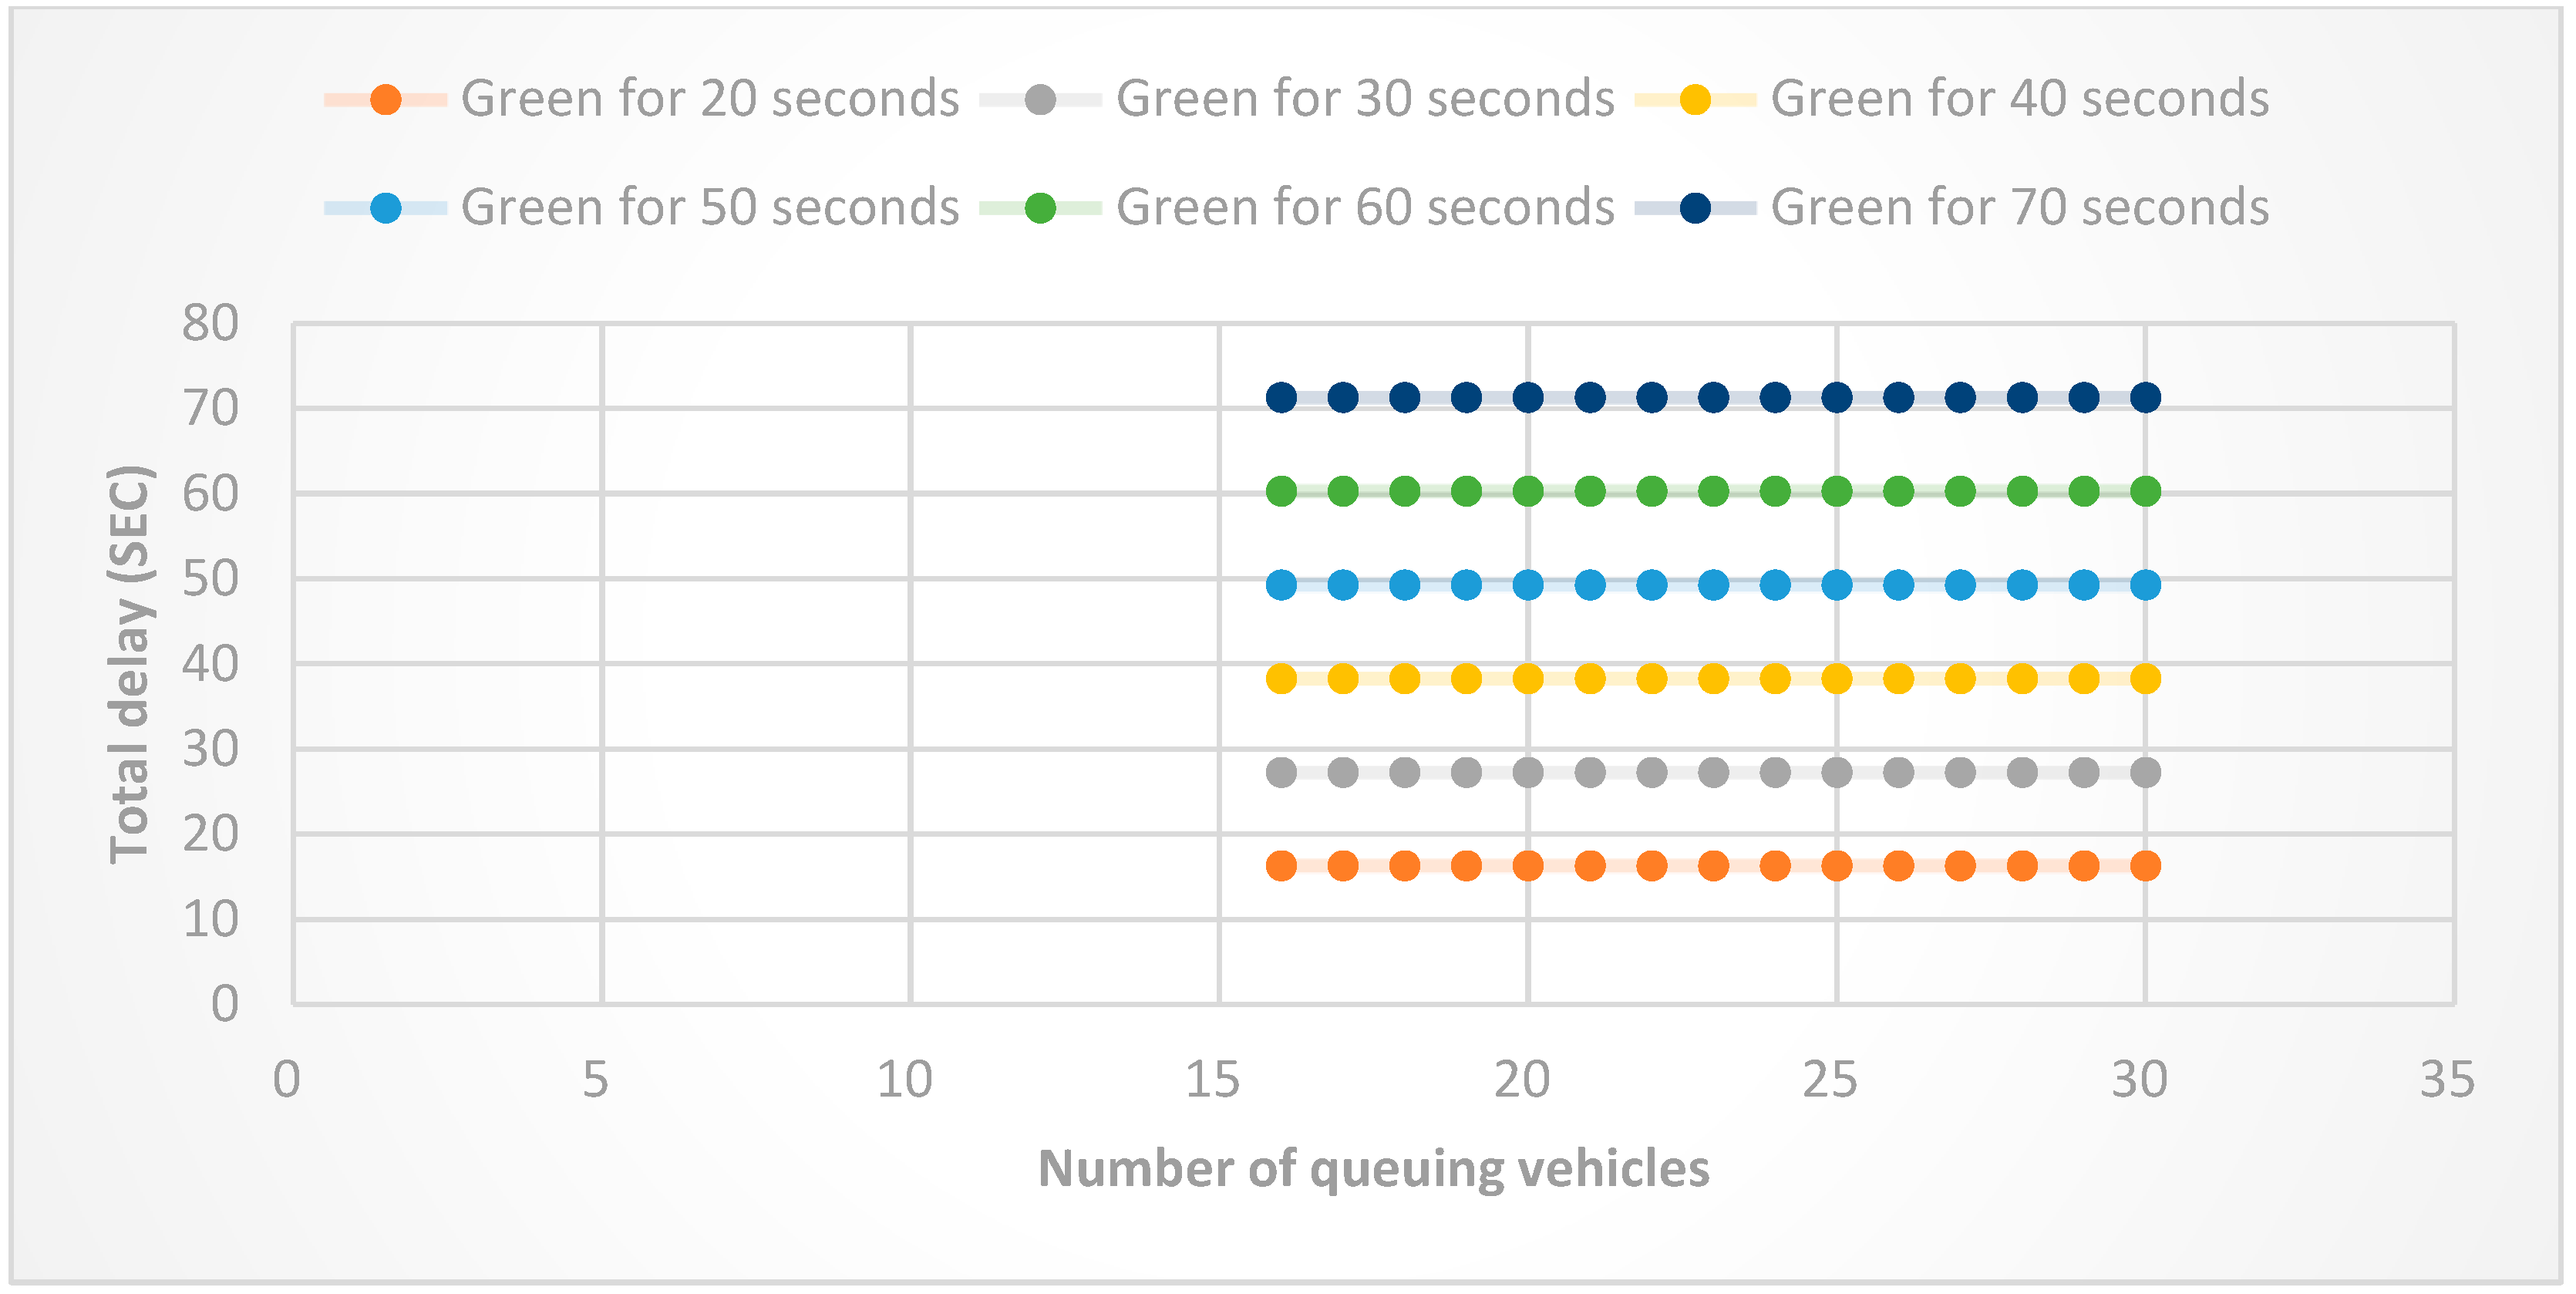
When green light duration varies from 20 s to 70 s (step = 10 s), the total delay ignoring start-up loss decreases for both vehicle types, with HDVs showing a larger reduction rate (212% → 15%) than AVs (185% → 10%) (Figure 7). The additional start-up loss delay for HDVs increases from 16.29 s to 71.29 s, with a growth rate dropping from 67.5% to 18.2%, while for AVs, it increases from 3.8 s to 12.6 s, with a growth rate of 12.3% to 3.1% (Figure 8 and Table 4). This is because extended green light duration allows more vehicles to pass, but the cumulative start-up loss for HDVs is more pronounced due to inconsistent behavior.
Figure 7.
Total delay and queuing vehicles for HDVs.
Figure 8.
Total delay and queuing vehicles for AVs.
Table 4.
Additional delay and growth rate for AVs under saturated conditions (HDVs vs. AVs).
6. Discussions
This study developed a differentiated start-up loss delay model for human-driven vehicles (HDVs) and autonomous vehicles (AVs) at signalized intersections, overcoming the limitations of conventional models that neglect platoon-level cascading delay propagation and vehicle-specific start-up mechanisms. The following discussion interprets the key findings, compares them with the existing literature, analyzes practical implications, and identifies limitations, thereby clarifying the theoretical and applied value of the proposed model.
The experimental results confirm significant discrepancies in start-up loss characteristics between HDVs and AVs, leading to distinct delay performances under unsaturated and saturated traffic conditions. HDVs present an average start-up response time of 2.05 s with a high standard deviation of 0.9 s, and their platoons reach saturated flow at the sixth queued vehicle, consistent with classical observations of human driving behavior. In contrast, traditional models such as Webster and Clayton formulas simplify start-up loss as a fixed penalty for leading vehicles, failing to capture cascading delay propagation along the queue and thus underestimating total delay, especially under congestion. By comparison, AVs maintain a stable start-up response time of 0.3–0.5 s with low variability and achieve saturated flow at the third vehicle, with saturation flow rates 29–47% higher than HDVs. While existing studies have validated AV advantages in motion consistency and platooning efficiency, this research further quantifies the exponentially negative correlation between AV penetration and additional delay reduction, filling a critical gap in quantitative mixed-flow analysis.
Under unsaturated conditions, red light duration dominates HDV start-up loss delay, which increases from 2.3 s to 8.7 s as red light extends from 10 s to 70 s, due to amplified propagation of erratic human start-up behavior. For AVs, additional delay rises mildly from 0.5 s to 2.1 s under identical conditions, thanks to weak propagation effects and high saturation flow. Under saturated conditions, extended green light duration increases start-up loss for both modes, but the growth rate for AVs (3.1–12.3%) is far lower than that for HDVs (18.2–67.5%). This challenges the traditional assumption that longer green phases necessarily reduce delay, revealing that prolonged green intervals aggregate inconsistent HDV responses and amplify cumulative start-up loss—a mechanism rarely addressed in prior studies.
Case studies further validate that placing AVs at the head of mixed platoons effectively reduces delay by stabilizing following HDVs and suppressing cascading start-up loss. This supports the development of V2I-based platoon control strategies and offers actionable guidance for mixed traffic management.
Nevertheless, several limitations remain. The model assumes idealized interactions without considering car-following disturbances between HDVs and AVs. It is calibrated using single-lane data and not yet extended to multi-lane or multi-phase intersections. Only Level 4 connected AVs are considered, without distinguishing performance among different automation levels. Furthermore, data were collected only in Fuzhou, which may restrict parameter generalization. Future work will address these issues to enhance model accuracy and applicability.
7. Conclusions
This study presents an analytical start-up loss delay model for signalized intersections that explicitly differentiates HDVs and AVs under both unsaturated and saturated traffic conditions. Grounded in traffic queue theory and field observations of mixed traffic flow, the model quantifies the queue-length-dependent cascading propagation of start-up loss and incorporates vehicle-specific start-up parameters. It effectively resolves the underestimation of delay in traditional models caused by ignoring platoon-level delay propagation and HDV–AV behavioral differences. Validated against field data and compared with the classical Webster and Clayton models, the proposed framework substantially improves delay estimation accuracy in mixed traffic environments and realistically reproduces the dynamic start-up process of queued vehicles.
Fundamental differences exist in start-up loss characteristics between HDVs and AVs. HDVs exhibit an average start-up response time of 1.90–2.05 s with high variability (SD = 0.9 s) and low acceleration consistency (CV = 0.32), reaching saturated flow at the sixth queued vehicle with a flow rate of 1700–1900 pcu·h−1. In contrast, AVs demonstrate stable response times of 0.3–0.5 s (SD < 0.05 s) and high consistency (CV = 0.08), achieving saturated flow at the third vehicle with a rate of 2200–2500 pcu h−1, 29–47% higher than HDVs. Moreover, HDV start-up loss displays strong cascading propagation, whereas AVs show negligible propagation effects.
Traffic states and signal timing parameters impose distinct impacts on HDV and AV delay. Under unsaturated conditions, red light duration dominates HDV start-up loss, while AV delay remains relatively insensitive. The AV penetration rate exhibits an exponentially negative correlation with additional delay in mixed platoons. Under saturated conditions, extended green light duration increases delay for both vehicle types, but AV delay growth is drastically lower due to consistent motion behavior.
Positioning AVs at the front of mixed platoons serves as an effective strategy to mitigate start-up loss delay. Leading AVs reduce reaction time and headway variability for subsequent HDVs, weakening cascading delay and improving discharge efficiency.
The findings contribute both theoretically and practically. Theoretically, this study decouples HDV and AV start-up loss mechanisms, introduces a queue-dependent propagation function, and quantifies nonlinear relationships between AV penetration and delay reduction, enriching the theoretical framework for mixed traffic delay analysis. Practically, the model supports adaptive signal timing, mixed traffic organization, and intersection efficiency evaluation for transportation authorities. The AV-leading platoon strategy provides a viable solution for enhancing intersection performance during the transition to mixed traffic.
Future research will refine the model by incorporating HDV–AV interactions, multi-lane and multi-phase configurations, and heterogeneous automation levels. Integrated with V2X communication and platoon control, the model can evolve into a unified optimization system for signal control and traffic organization, supporting the development of smart urban transportation and efficient low-delay network operations.
Funding
This research was funded by Fujian University of Technology Scientific Research Fund grant number GY-Z23242 and Fujian Provincial Education Research Projects for Young and Middle-Aged Teachers grant number JAT231055. And The APC was funded by GY-Z23242.
Institutional Review Board Statement
Not applicable.
Informed Consent Statement
Not applicable.
Data Availability Statement
The original contributions presented in this study are included in the article. Further inquiries can be directed to the corresponding author.
Conflicts of Interest
The author declare no conflicts of interest.
References
- Pan, W.; Xue, Y.; He, H.D.; Lu, W.Z. Impacts of traffic congestion on fuel rate, dissipation and particle emission in a single lane based on Nasch Model. Phys. A Stat. Mech. Its Appl. 2018, 503, 154–162. [Google Scholar] [CrossRef] [Scilit]
- Zhong, N.; Cao, J.; Wang, Y. Traffic congestion, ambient air pollution, and health: Evidence from driving restrictions in Beijing. J. Assoc. Environ. Resour. Econ. 2017, 4, 821–856. [Google Scholar] [CrossRef] [Scilit]
- Amiridis, K.; Stamatiadis, N.; Kirk, A. Safety-Based Left-Turn Phasing Decisions for Signalized Intersections. Transp. Res. Rec. 2017, 2619, 13–19. [Google Scholar] [CrossRef] [Scilit]
- Fagnant, D.J.; Kockelman, K.M. Preparing a nation for autonomous vehicles: Opportunities, barriers and policy recommendations. Transp. Res. Part A. 2015, 77, 167–181. [Google Scholar] [CrossRef] [Scilit]
- Clayton, H.W. The capacity of traffic lanes. Highway Res. Board Proc. 1940, 19, 217–231. [Google Scholar]
- Webster, F.V. Traffic Signal Settings. In London: Road Research Laboratory; National Academy of Sciences: Washington, DC, USA, 1958. [Google Scholar]
- Li, Z.; Wang, B.; Zhang, J. Comparative analysis of drivers’ start-up time of the first two vehicles at signalized intersections. J. Adv. Transp. 2016, 50, 228–239. [Google Scholar] [CrossRef] [Scilit]
- Capell, R.G. Delay at traffic signals. Traffic Eng. Control. 1978, 19, 522–526. [Google Scholar]
- Wang, D.H.; Yang, S.H.; Jing, C.G. Cumulative curve method for calculating saturation flow rate and phase loss time. J. Traffic Transp. Eng. 2002, 3, 75–78. (In Chinese) [Google Scholar]
- Zhao, L. Research on Capacity and Influencing Factors of Signalized Intersection. Master’s Thesis, Beijing University of Technology, Beijing, China, 2008. (In Chinese) [Google Scholar]
- Bansal, P.; Kockelman, K.M.; Vinod, A. Autonomous Vehicle Technology: A Guide for Policymakers; University of Texas at Austin: Austin, TX, USA, 2016. [Google Scholar]
- Dresner, K.; Stone, P. A multiagent approach to autonomous intersection management. J. Artif. Intell. Res. 2008, 31, 591–656. [Google Scholar] [CrossRef] [Scilit]
- Qian, G.M.; Fan, J.S.; He, C.G.; Zhang, L.-H.; Wang, D.-H. Optimization of spatial-temporal resources at intersections under environment of mixed traffic flow with connected and autonomous vehicles and human-driven vehicles. J. Zhejiang Univ. (Eng. Sci.) 2021, 55, 1019–1026. (In Chinese) [Google Scholar] [CrossRef]
- Wang, D.H.; Guo, J.L.; Cai, Z.Y. Real-time estimation of saturated flow rate of mixed traffic flow based on automatic license plate recognition data. J. Transp. Syst. Eng. Inf. Technol. 2021, 21, 37–43. (In Chinese) [Google Scholar]
- Zhao, Y.; Shen, S.; Liu, H.X. A hidden Markov model for the estimation of correlated queues in probe vehicle environments. Transp. Res. Part C Emerg. Technol. 2021, 128, 103–128. [Google Scholar] [CrossRef] [Scilit]
- García-Mauriño, C.; Zufiria, P.J.; Jarabo-Peñas, A. Improving bus arrival time predictors using only public transport API data. Transp. Let. 2024, 16, 804–813. [Google Scholar] [CrossRef] [Scilit]
- Zhang, J.B.; Sun, J.P.; Li, X.; Zhao, X.; Xu, D. Calculation of intersection delay based on mixed low-frequency vehicle trajectories. J. Beijing Jiaotong Univ. 2024, 4, 123–130. (In Chinese) [Google Scholar] [CrossRef]
- Saldivar Carranza, E.; Li, H.; Mathew, J.; Hunter, M.; Sturdevant, J.; Bullock, D.M. Deriving operational traffic signal performance measures from vehicle trajectory data. Transp. Res. Rec. 2021, 2675, 1250–1264. [Google Scholar] [CrossRef] [Scilit]
- Farras, N.; Noer, F.; Renni, A. The mathematical relationship between volume, speed, and density at seven approached intersections in the city of Banda Aceh. J. Phys. Conf. Ser. 2024, 2916, 012014. [Google Scholar]
- Liu, S.; Zhang, W.T.; Wu, X.J.; Feng, S.; Pei, X.; Yao, D. A simulation system and speed guidance algorithms for intersection traffic control using connected vehicle technology. Tsinghua Sci. Technol. 2019, 24, 160–170. [Google Scholar] [CrossRef] [Scilit]
- He, X.Z.; Liu, H.X.; Liu, X.B. Optimal vehicle speed trajectory on a signalized arterial with consideration of queue. Transp. Res. Part C Emerg. Technol. 2015, 61, 106–120. [Google Scholar] [CrossRef] [Scilit]
- Islam, M.R.; Hurwitz, D.S.; Macuga, K.L. Improved driver responses at intersections with red signal countdown timers. Transp. Res. Part C Emerg. Technol. 2016, 63, 207–221. [Google Scholar] [CrossRef] [Scilit]
- Li, Z.L.; Zhang, J.K. Effect of traffic signal countdown on driver’s start-reaction time. J. Transp. Inf. Saf. 2013, 31, 77–81. (In Chinese) [Google Scholar] [CrossRef]
- Poliak, M.; Svabova, L.; Benus, J.; Demirci, E. Driver response time and age impact on the reaction time of drivers: A driving simulator study among professional-truck drivers. Mathematics. 2022, 10, 1489. [Google Scholar] [CrossRef] [Scilit]
- Jatoth, J.; Singh, N.K.; Mehar, A. Evaluating the performance of signalized intersection with signal countdown timer. Int. J. Intell. Transp. Syst. Res. 2021, 19, 182–190. [Google Scholar] [CrossRef] [Scilit]
- Livne, W.; Lora, D.; Shinar, D. Effect of uncertainty, transmission type, driver age and gender on brake reaction and movement time. J. Saf. Res. 2002, 33, 117–128. [Google Scholar] [CrossRef] [Scilit]
- Szydlowski, T.; Surminski, K.; Batory, D. Drivers’ psychomotor reaction times tested with a test station method. Appl. Sci. 2021, 11, 2431. [Google Scholar] [CrossRef] [Scilit]
- Liu, Y. Study on Car Following Models. Master’s Thesis, Dalian Jiaotong University, Dalian, China, 2005. (In Chinese) [Google Scholar]
- Bie, Y.M.; Tang, R.R.; Wang, Y.H.; Wen, B.; Ferng, T.; Wang, L. Saturation flow rate estimation method of approaching lanes at signalized intersections. J. Jilin Univ. Eng. Technol. Ed. 2019, 49, 1459–1464. (In Chinese) [Google Scholar] [CrossRef]
- Yang, X.G.; Yang, P.K. Stop rate model before the stop line of the signalized intersection. J. Tongji Univ. 1993, 21, 169–176. (In Chinese) [Google Scholar]
- Milanes, V.; Shladover, S.E.; Spring, J.; Nowakowski, C.; Kawazoe, H.; Nakamura, M. Cooperative adaptive cruise control in real traffic situations. IEEE Trans. Intell. Transp. Syst. 2014, 15, 296–305. [Google Scholar] [CrossRef] [Scilit]
- Shladover, S.E.; Su, D.; Lu, X.Y. Impacts of cooperative adaptive cruise control on freeway traffic flow. Transp. Res. Rec. 2012, 54, 400–414. [Google Scholar] [CrossRef] [Scilit]
- Talebpour, A.; Mahmassani, H.S. Influence of connected and autonomous vehicles on traffic flow stability and throughput. Transp. Res. Part C Emerg. Technol. 2016, 71, 143–163. [Google Scholar] [CrossRef] [Scilit]
- Ma, Y.; Zheng, Y.; Cheng, J.; Zhang, Y.; Han, W. A convolutional neural network method to improve efficiency and visualization in modeling driver’s visual field on roads using MLS data. Transp. Res. Part C Emerg. Technol. 2019, 107, 317–344. [Google Scholar] [CrossRef] [Scilit]

Disclaimer/Publisher’s Note: The statements, opinions and data contained in all publications are solely those of the individual author(s) and contributor(s) and not of MDPI and/or the editor(s). MDPI and/or the editor(s) disclaim responsibility for any injury to people or property resulting from any ideas, methods, instructions or products referred to in the content. |
© 2026 by the author. Licensee MDPI, Basel, Switzerland. This article is an open access article distributed under the terms and conditions of the Creative Commons Attribution (CC BY) license.