


Abstract
The massive elemental dataset of stream sediments and soils accumulated by the projects of the Regional Geochemistry–National Reconnaissance (RGNR) and the National Multi-Purpose Regional Geochemical Survey (NMPRGS) provide core support for the compilation of geochemical maps and hold irreplaceable significance in the field of mineral exploration and soil environment. Geochemical maps produced by traditional methods are heavily dependent on data volume, which limits the comparisons across different areas and different elements. To facilitate the comparisons, a 19-level fixed-value classification method was proposed for Sn, Li, Mo, Ni, etc. However, the method for Cu is still lacking. Here the method for Cu is proposed to divide Cu content into 19 levels on 18 fixed values which are determined based on many typical values such as the detection limit, quartiles from the RGNR and NMPRGS projects, and cutoff grades. The Jinchuan Cu-Ni deposit is a giant deposit in China which is selected as an illustration on the new method. The elemental data of rocks and stream sediments in the Jinchuan area are used to compile elemental concentration maps and elemental concentration-level maps for the elements of Cu and Ni. The results show that the 19-level fixed-value method can not only effectively evaluate the concentration levels of elements but also enable the comparisons among elements. The Jinchuan Cu-Ni deposit is located in the mineralization areas and high anomaly areas of Cu and Ni. Compared with the previous reported maps of Ni, Sn, and Li in other areas, the new method facilitates the recognition of target metals in geochemical exploration. An element with a concentration level of no less than 15 may be mineralized or is the target metal on the 1:200,000 survey data from sediments. The 19-level fixed-value method may hold significant applications in the fields of mineral exploration and environment assessment.
1. Introduction
The projects of the Regional Geochemistry–National Reconnaissance (RGNR) [1] and the National Multi-Purpose Regional Geochemical Survey (NMPRGS) [2] are national-scale regional geochemical survey projects launched in China in 1979 and 1999, respectively. These projects cover over 7 million square kilometers of Chinese mainland surface [3], with stream sediments and soils as the main sampling medium, and conduct surveys at a scale of 1:200,000. In these projects, sampling is implemented in accordance with the standard of combining one representative sample per 4 km2 [4], and systematically analyzes 39 or 54 elements (or items) including Ni, Li, and Sn [5,6]. Eventually, a standardized and high-precision regional geochemical database is established. The massive data accumulated by these projects, as the core data support for geochemical map compilation [7,8], play an irreplaceable and crucial role in the fields of mineral exploration and environment assessment [9,10,11].
A geochemical map is a type of hierarchical color contour map and serves as the most fundamental and critical outcome of geochemical exploration [12,13]. Traditional methods for compiling geochemical maps include the cumulative percentage frequency method [14], the ΔlgC ≈ 0.1 method [15], and the mean ± SD method [16]. In recent years, many advanced methods have been widely used in geochemical data analysis, such as fractal analysis, multivariate statistical analysis, geostatistics, and ROC curve analysis [17,18,19]. These methods have improved the accuracy of anomaly identification and data interpretation to a certain extent. However, all these methods rely on data volume and distribution characteristics, making direct comparisons between different elements and regions impractically [20]. For instance, the concentration thresholds of the cumulative frequency method fluctuate with sample size, the logarithmic interval method is restricted by data distribution patterns, and the mean–standard deviation method is susceptible to interference from outliers, plus fractal methods depend on the overall dataset and complex calculations. These flaws hinder the comparison across elements areas [21].
To break through the bottlenecks of traditional methods, An et al. [20] proposed the fixed-value classification method of Cr on its geochemical maps. By setting 25 fixed values, Cr concentrations were divided into 26 levels, enabling direct comparison of Cr geochemical maps across different regions. This idea was further expanded to multiple elements in subsequent studies and became more refined as a 19-level fixed-value method of Sn Li, Mo, Ni, Au, and Pb, respectively [21,22,23,24,25]. However, the 19-level fixed-value method for Cu has not yet been proposed
The Jinchuan Cu-Ni Deposit is the largest Cu-Ni deposit in China. Despite the exposed area of its rock mass being less than 2 km2, it boasts an extremely high mineralization rate [26,27]. Since its discovery in 1958, numerous geologists have conducted extensive geological surveys, exploration evaluations, and scientific research on it. These studies have mainly focused on the mineralization age, deposit genesis, and metallogenic model, accumulating a wealth of valuable geological data [28,29]. To further accurately grasp the spatial distribution patterns of elements such as Cu and Ni, the 19-level fixed-value method is adopted to compile geochemical maps, facilitating comparative analysis with traditional geochemical exploration results.
Here, the 19-level fixed-value method for Cu was first proposed. Then the new method was used to convert elemental concentrations to concentration levels of Cu, Ni, Sn, and Li for the rocks and the stream sediments in the Jinchuan area. Finally, the comparison across elements and areas was discussed and the potential exploration targets for copper–nickel resources in the Jinchuan area are identified.
2. Study Area, Materials and Elemental Data
2.1. Study Area
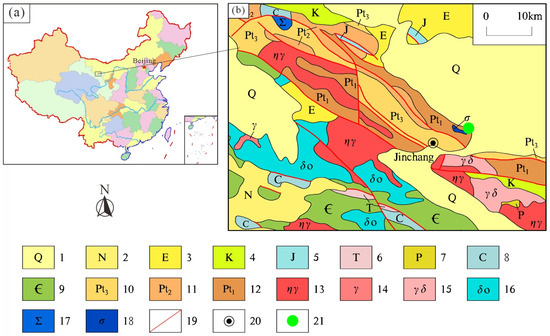
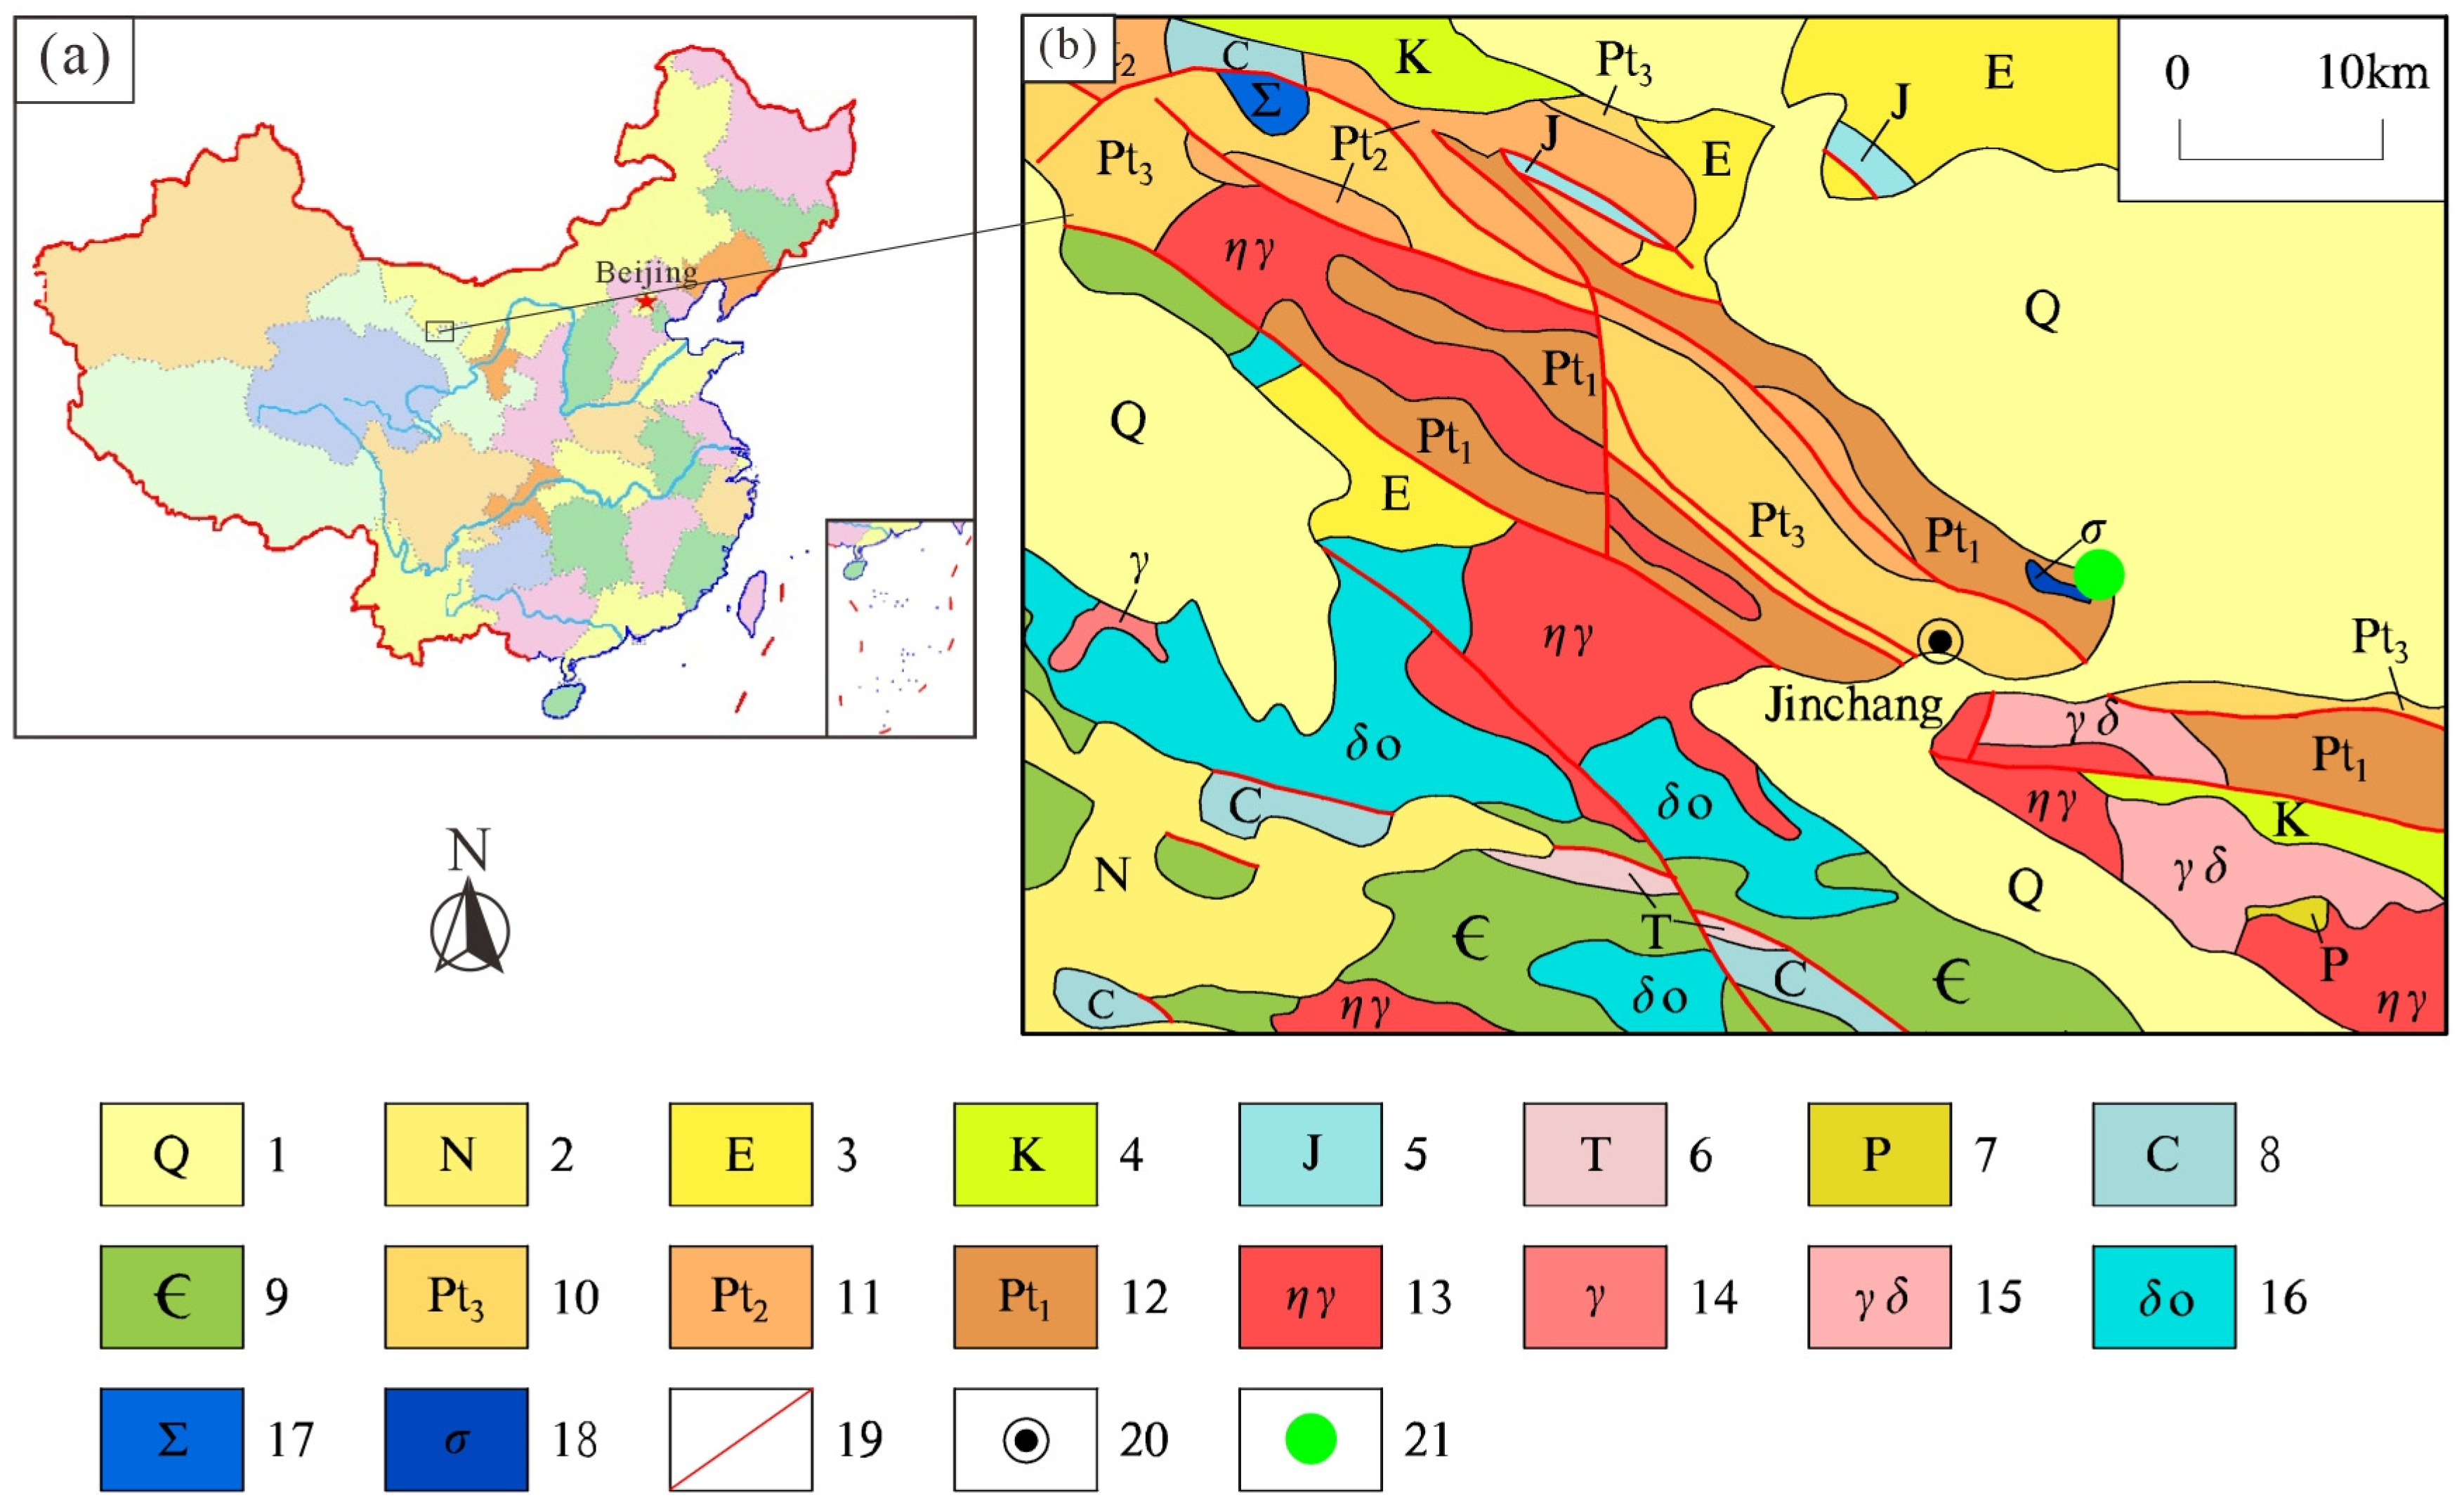
The Jinchuan area is located in the northwestern part of Gansu Province, China. It spans from 101°34′12″ E to 102°23′09.6″ E, extending 70 km from east to west, and from 38°16′51.6″ N to 38°44′20.4″ N, stretching 50 km from north to south, with a total area of ca. 3500 km2 (Figure 1). The terrain of this area slopes from west to east, gradually inclining from the southwest to the northeast. The strata in this area, in chronological order from oldest to youngest, include the Paleoproterozoic, Mesoproterozoic, Neoproterozoic, Cambrian, Carboniferous, Permian, Triassic, Jurassic, Cretaceous, Paleogene, Neogene, and Quaternary (Figure 1). The lithology of these strata is briefly described in Figure 1.
Figure 1.
Regional geological map of the Jinchuan area (Modified after the 1:1,000,000 geological map of J48 and J47 by China Geological Survey). (1) Quaternary: sand, gravel, and clay; (2) Neogene: silty mudstone, sandstone, glutenite; (3) Paleogene: dominated by mudstone and sandstone, rich in gypsum; (4) Cretaceous: sandstone, conglomerate, glutenite, argillaceous siltstone, argillaceous rock, clay, mud shale, siltstone to medium-coarse grained sandstone, sandy shale; (5) Jurassic: sandstone, conglomerate, mudstone, shale and oil shale in the middle-lower part; (6) Triassic: sandstone, siltstone, sandy mudstone; (7) Permian: low-grade metamorphic fine sandstone, meta-conglomerate, siliceous rock; (8) Carboniferous: dominated by quartz sandstone, feldspathic sandstone, argillaceous rock, siltstone, limestone, shale, fine conglomerate; (9) Cambrian: meta-conglomerate, meta-feldspathic sandstone, quartz sandstone, crystalline limestone; (10) Neoproterozoic: meta-tillite, pebbly phyllite and meta-siltstone, limestone; (11) Mesoproterozoic: meta-feldspathic quartz sandstone, meta-pebbly sandstone and meta-conglomerate, siliceous limestone, phyllite; (12) Paleoproterozoic: migmatites, migmatitic gneiss, marble, plagioclase amphibolite, gneiss, schist, leptynite, leptite, quartzite, meta-intermediate-acidic volcanic rocks; (13) monzogranite; (14) granite; (15) granodiorite; (16) quartz diorite; (17) ultramafic rock; (18) peridotite; (19) fault; (20) place name; (21) Jinchuan Cu-Ni deposit (giant).
The Jinchuan Area is located within the Longshoushan Uplift Belt, where tectonic activity is intense [30]. The tectonic features in this area are dominated by northwest-trending faults [31], followed by north–south- and east–west-trending faults. Magmatic rocks are highly developed in the mining area [32]. The exposed igneous rocks mainly include pegmatitic granite and syenite of the Lüliang Period, as well as granite porphyry, ultrabasic rock masses and various dykes of the Caledonian Period [31,33].
Ranging from acidic to ultrabasic and from plutonic rocks to derivative dykes, these igneous rocks are widely distributed. Among them, the magmatic rocks related to mineralization are mainly ultrabasic rock masses and their derivative dykes [34]. As the ore-forming parent rock of the copper–nickel deposits in this mining area, the ultrabasic rocks are peridotite, which is mainly composed of olivine and pyroxene, with only a small amount of plagioclase contained in a few lithofacies [31,35].
The Jinchuan Cu-Ni Deposit is the largest copper–nickel deposit in China [31]. It is hosted primarily within the olivine rock mass of the study area (Figure 1), with copper and nickel as its dominant metallic resources. Its copper resource reserves rank among the top in China [33,36].
2.2. Materials and Elemental Data
The data used in this study include the elemental data of rocks in the Jinchuan area and of stream sediments from the 1:200,000-scale regional geochemical survey.
The rock data include 11 lamprophyre samples and 4 diabase samples from the Jinchuan Area, as well as 2 quartz monzonite samples, 6 monzogranite samples, and 7 olivine gabbro samples from the Yongchang area, totaling 30 rock samples [35,37,38]. The contents of major oxides and trace elements (Cu, Ni, Li) in these 30 rock samples were analyzed using XRF and ICP-MS [35], respectively. The analytical precision of major oxides is less than 2% [37], and the relative standard deviation (RSD) of the analysis is less than 2–8% [38]. The relative uncertainty of Cu and Ni analysis ranges from 5% to 15% [37], and the analysis was conducted in accordance with the industrial standard DZ/T 0223-2001 [38,39].
The data of stream sediments (at a scale of 1:200,000) from the RGNR project cover a total of 836 samples in the study area with ca. 3500 km2. In the RGNR project, major oxides (SiO2, Al2O3, TFe2O3, K2O, Na2O, CaO, MgO, TiO2 or Ti, P2O5 or P, and MnO or Mn) were determined on XRF, while trace elements Cu and Ni were measured on ICP-MS. The detection limits of Cu, Ni, Ti, P, and Mn are 1, 2, 50, 10, and 10 µg/g, respectively, and the detection limit of other major oxides is 0.05%. Both the analytical accuracy and precision meet the requirements of the RGNR project (≤0.05~0.10 ΔlgC and relative standard deviation ≤ 10~17% for different concentrations) [1,40,41].
3. Method and Results
3.1. Classification Method for Cu Concentrations
The 19-level fixed-value method for elements including Sn, Li, Mo, Ni, and Pb [21,22,23,24,25] follows a unified core framework, dividing element concentrations into 19 levels on 18 fixed values: the first value is the detection limit specified in the RGNR [1] or NMPRGS project [2]; the fifth value is the average of the 50% cumulative frequency values in stream sediments and those in soils [42,43]; the ninth value corresponds to the 97.5% cumulative frequency values in stream sediments or soils [42,43], or the minimum screening value for agricultural land in GB 15618-2018 [44]; the twelfth value corresponds to the 99.5% cumulative frequency value in stream sediments or soils [42,43], or the maximum screening value for agricultural land in GB 15618-2018 [44]; the value corresponds to the cutoff grade for associated ores, or the maximum intervention value in agricultural soils according to GB 15618-2018 [44]; and the eighteenth value corresponds to the cutoff grade for primary ores.
Based on the above framework, since Cu is a heavy metal [45,46], its screening values specified in GB 15618-2018 [44] need to be taken into account during the fixed-value setting. The first value for Cu is 1 µg/g, corresponding to the detection limit; the fifth value is 22 µg/g, which is the average of the 50% cumulative frequency value of 20.6 µg/g in stream sediments and 23 µg/g in soils; the ninth value is 50 µg/g, corresponding to the minimum screening value for agricultural land in GB 15618-2018 [44] and closing to the 97.5% cumulative frequency value of 57 µg/g in soils [42,43]; the twelfth value is 200 µg/g, corresponding to the maximum screening value for agricultural land in GB 15618-2018 [44] but a little higher than the 99.5% cumulative frequency value of 126 µg/g in stream sediments [42,43]; the fifteenth value is 600 µg/g, corresponding to the cutoff grade of associated Cu component in lead–zinc deposits specified in DZ/T 0214-2002 [41]; and the eighteenth value is 2000 µg/g, corresponding to the cutoff grade for primary Cu ore specified in DZ/T 0214-2002 [41].
In summary of the above adopted values, the information on the 18 fixed values of Cu classification are listed in Table 1 and Table 2 along with other reported elements.
Table 1.
The information of the 18 fixed concentrations for Cu.
Table 2.
The 19-level fixed values of Cu and other elements.
Based on 18 fixed values, Cu concentrations can be divided into 19 levels, which are further categorized into six types and then refined into three types (background type, anomaly type, and mineralization type). Levels 1 to 5 and 6 to 9 are low and high-background levels with blue and yellow tones, respectively. Therefore, levels 1–9 are collectively referred to as the background type. Levels 10 to 12 are low-anomaly levels or maybe screening-risk levels in environment assessment in a pink tone. Levels 13 to 15 are high-anomaly levels or surely screening-risk levels in environment assessment in a red tone. Therefore, levels 10–15 are collectively referred to as the anomaly type. Levels 16 to 18 are mineralization levels as an associate economic metal in a gray tone. Level 19 is the mineralization level as the main economic metal in rocks in a black color. Therefore, levels 16–19 are collectively referred to as the mineralization type.
3.2. Results on Rocks
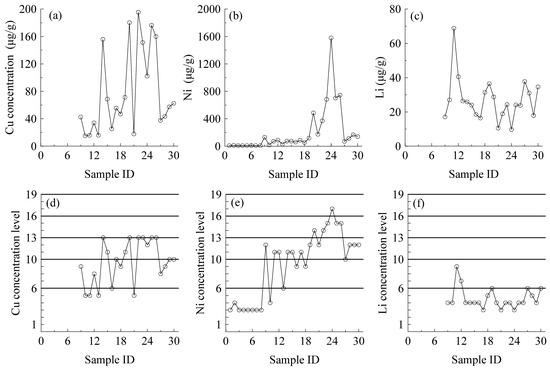
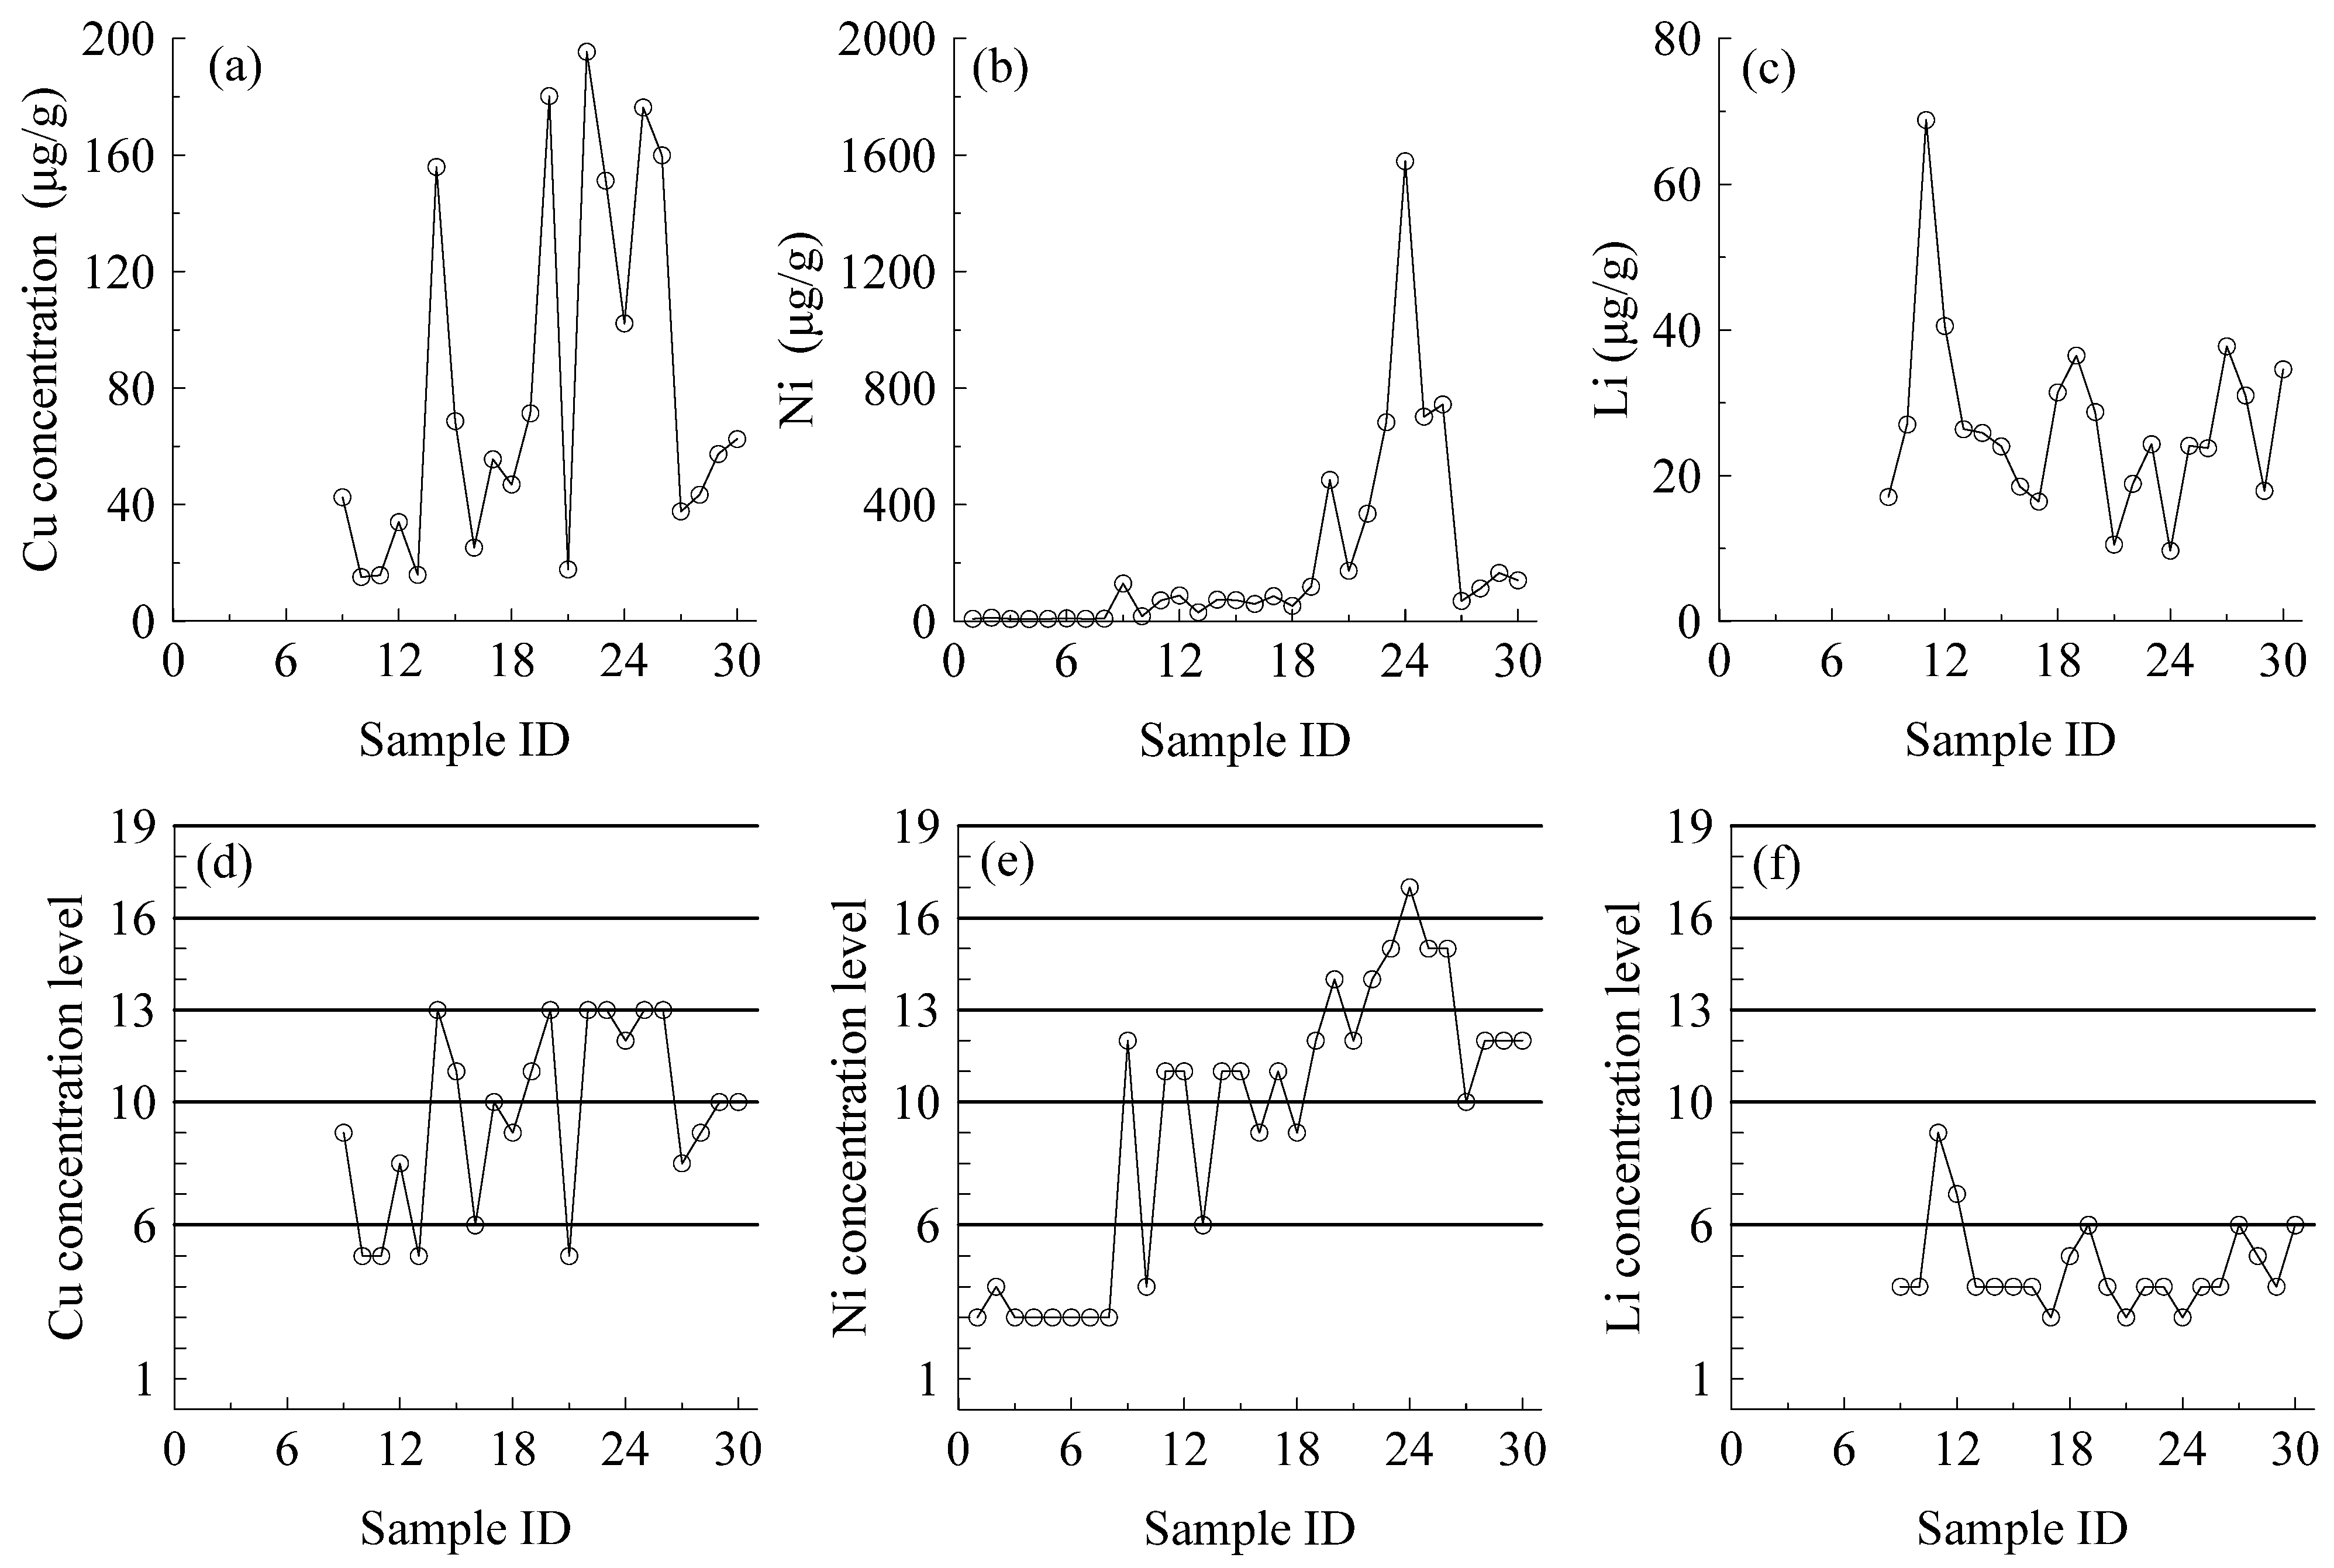
For the convenience of figuring, the 30 rock samples are labeled as 1, 2, 3 … 30 as their ID numbers sequentially herein. Numbers of 1 to 2 refer to the monzogranite samples, numbers of 3 to 8 refer to the quartz monzonite samples, numbers of 9 to 19 refer to the lamprophyre samples, numbers of 20 to 26 refer to the olivine gabbro samples, and numbers of 27 to 30 refer to the diabase samples. The concentration level can also be classified on the fixed values. The concentration values and levels of Cu, Ni, and Li with sample ID are shown in Figure 2.
Figure 2.
The concentration values (a–c) and concentration levels (d–f) of Cu, Ni, and Li in rock samples. Each circle in the figure corresponds to one sample.
In Figure 2a,d, the two quartz monzonite samples and six monzogranite samples (Samples 1–8) from the Yongchang area lack Cu and Li concentration data. Figure 2a–c shows the concentration data of Cu, Ni, and Li in 30 rock samples from the Jinchuan area, where the Cu concentration ranges from 15.2 to 195.4 μg/g, Ni from 7.4 to 1579 μg/g, and Li from 9.68 to 68.8 μg/g. Although these data reflect the concentration variations in each element, direct comparison of these concentration values are not a good idea due to their different geochemical abundances in rocks. The concentration data of Sn in these rocks are lacking, which limits the discussion on Sn in these rocks.
In contrast, Figure 2d–f present the concentration levels which enable comparisons across elements. The levels of Cu are in the range of 5 to 13, the samples attained a maximum level of 13, corresponding to the anomaly type. The levels of Ni are in the range of 3 to 17, the samples attained a maximum level of 17, corresponding to the mineralization type. The levels of Li are in the range of 3 to 9; the samples attained a maximum level of 9, corresponding to the background type. These results indicate that the 19-level fixed-value method is applicable to the comparison across elements.
3.3. Results on Stream Sediments
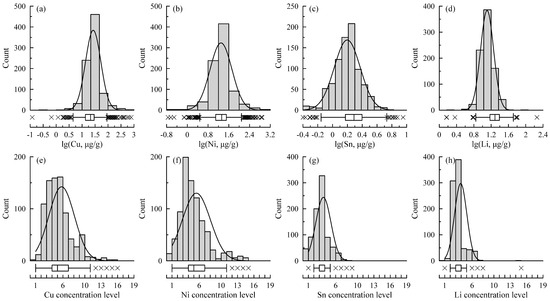
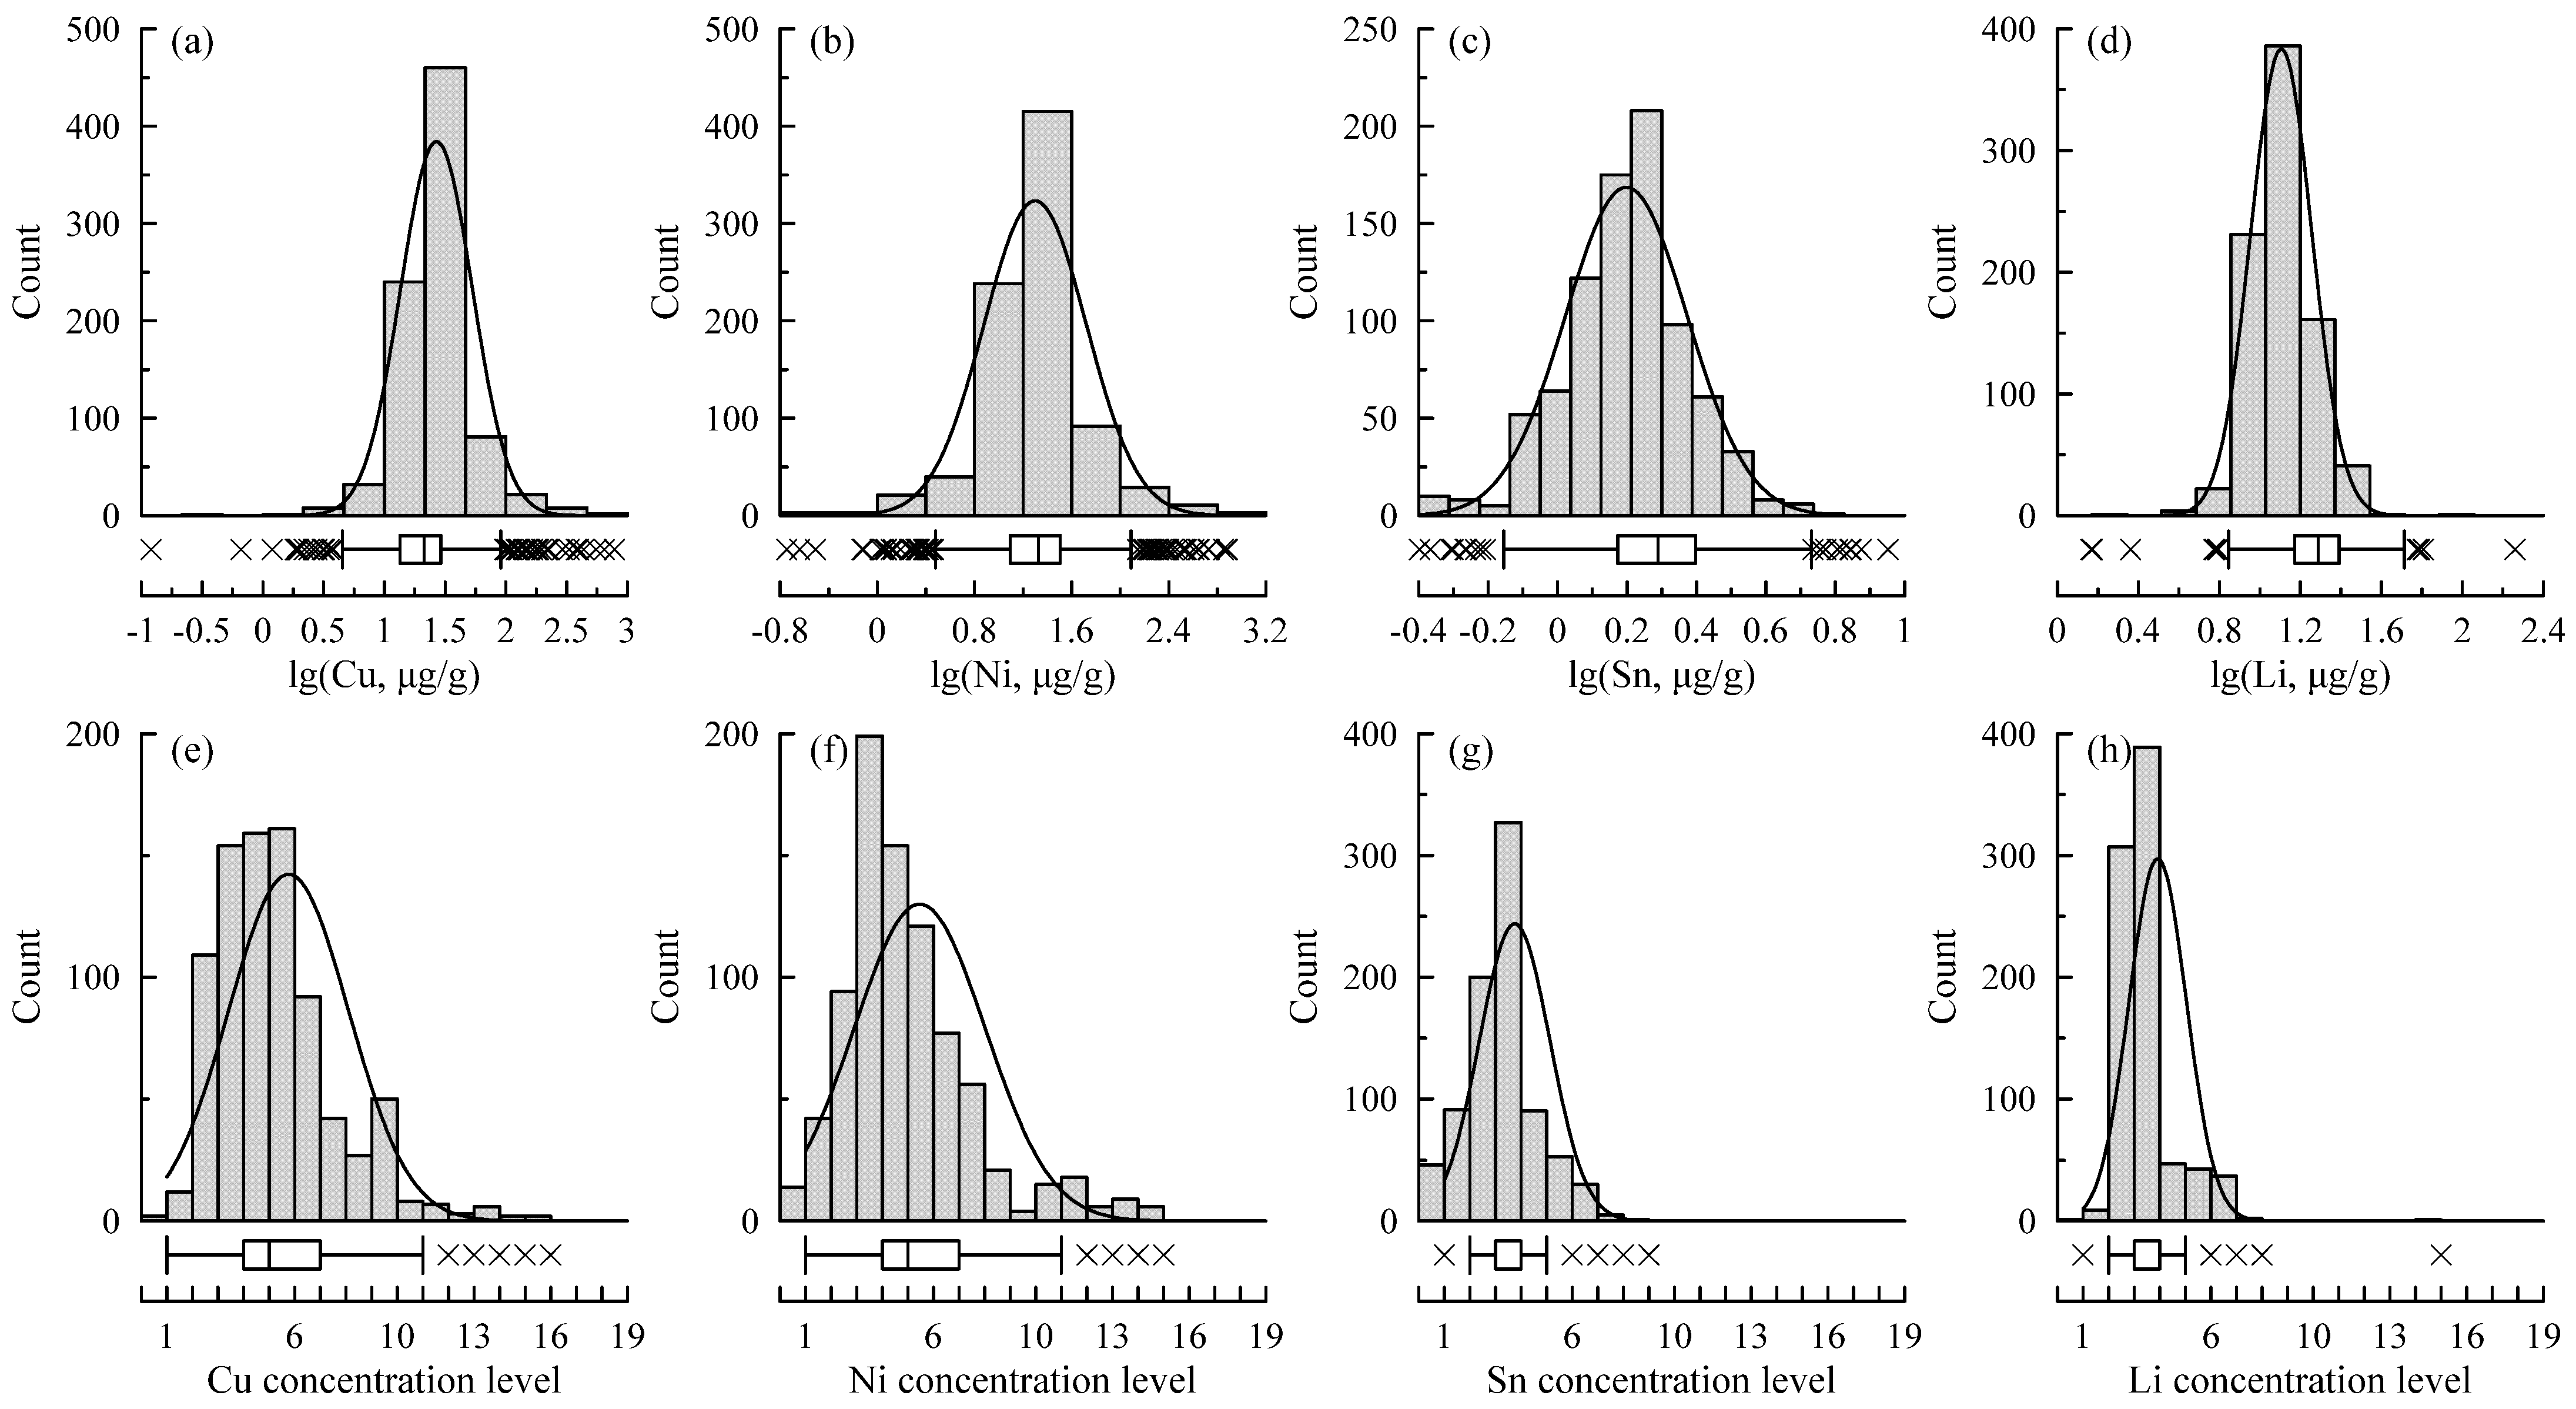
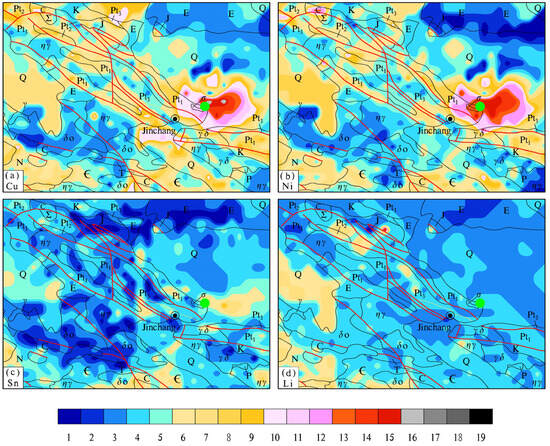
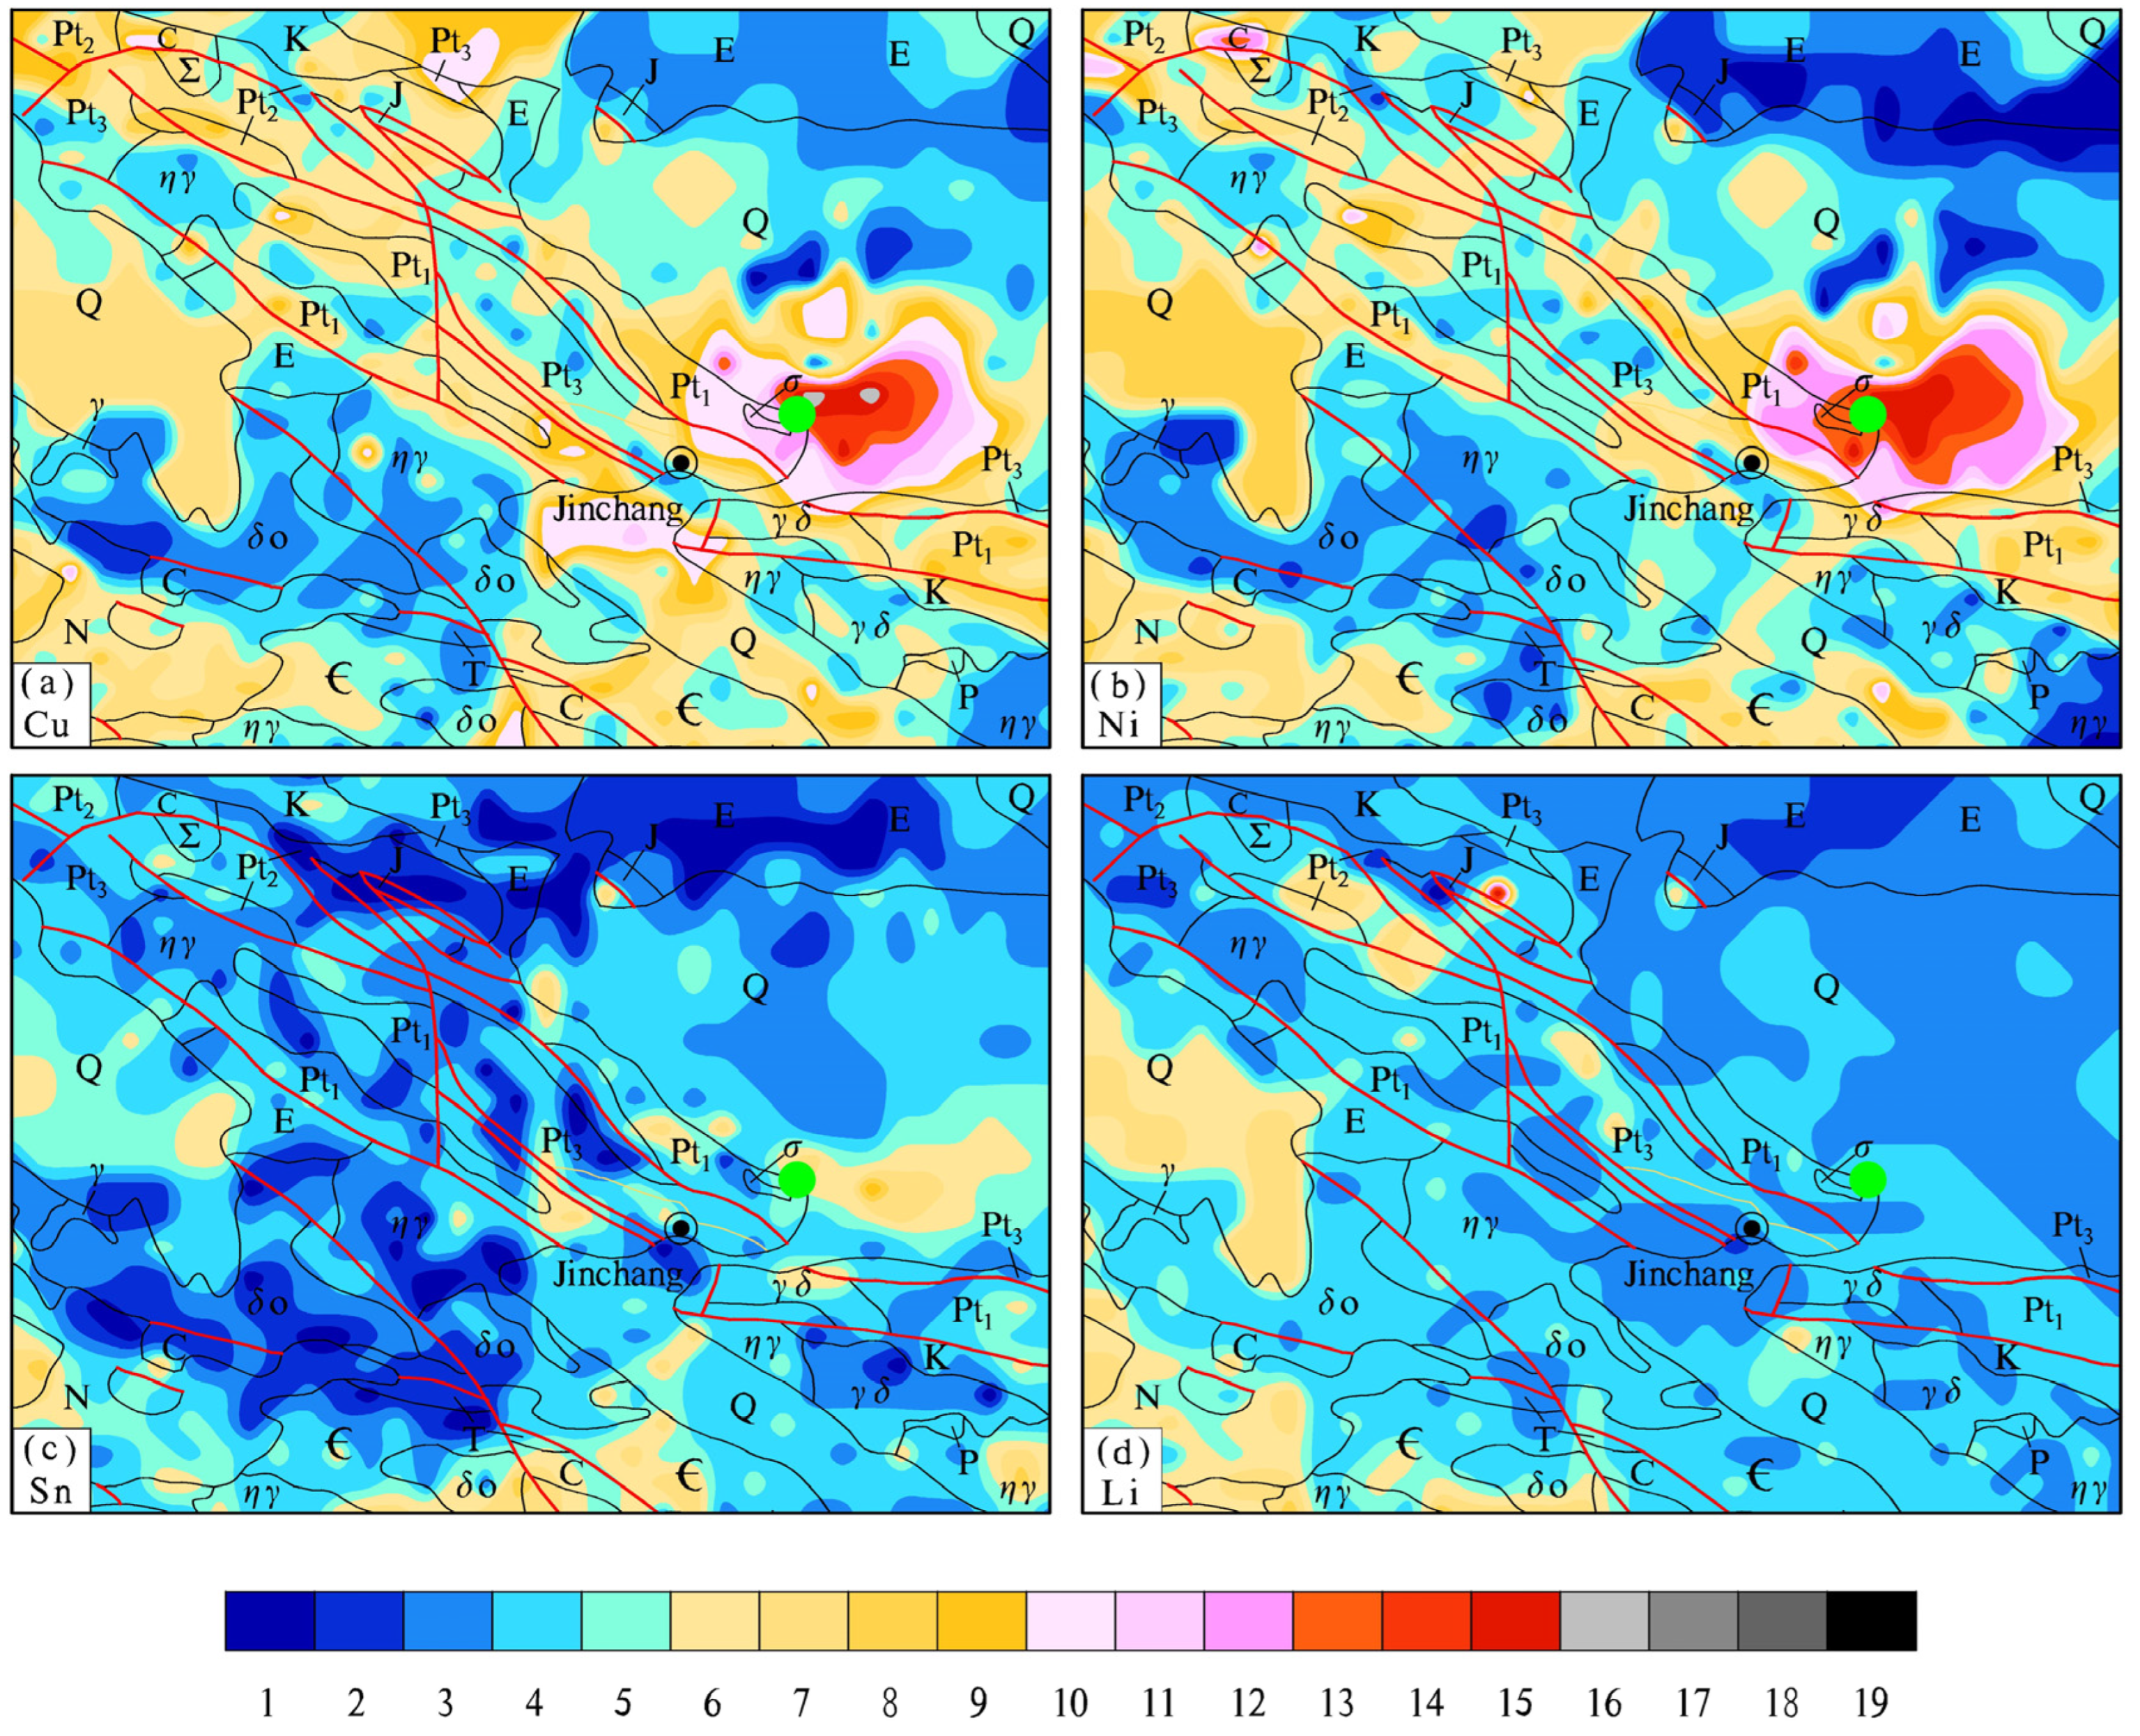
On stream sediments, the concentration data of the 836 samples in the Jinchuan area are first converted into their concentration levels based on the 19-level fixed-value method. Then the statistical parameters (including the maximum, minimum, quartiles Q1, Q2, and Q3, and the mean) of Cu, Ni, Sn, and Li for their concentration values and levels are listed in Table 3. The histogram–boxplot figures for the lgCu, lgNi, lgSn and lgLi values of these 836 samples are displayed in Figure 3a–d, and those for their concentration levels are illustrated in Figure 3e–h. Finally, their geochemical maps are contoured on their concentration levels (Figure 4). On the geochemical map, the GeoExpl 2013 software [14] was used and the nearest point model was adopted with a grid spacing of 2 km and a 9 km search circular.
Table 3.
Statistical parameters of concentration values and levels of Cu, Ni, Sn, and Li of samples in Jinchuan area.
Figure 3.
Histogram–boxplot figures of lgCu, lgNi, lgSn, and lgLi for concentration values (a–d) and concentration levels (e–h) in the Jinchuan area with 836 samples. The crosses (×) represent outliers, and the white patterns in the box plots indicate the median values.
4. Discussion
4.1. Comparison with the Traditional Cumulative Frequency Methods
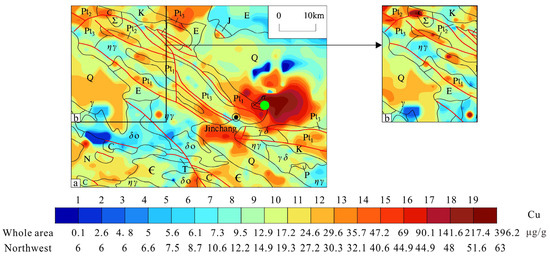
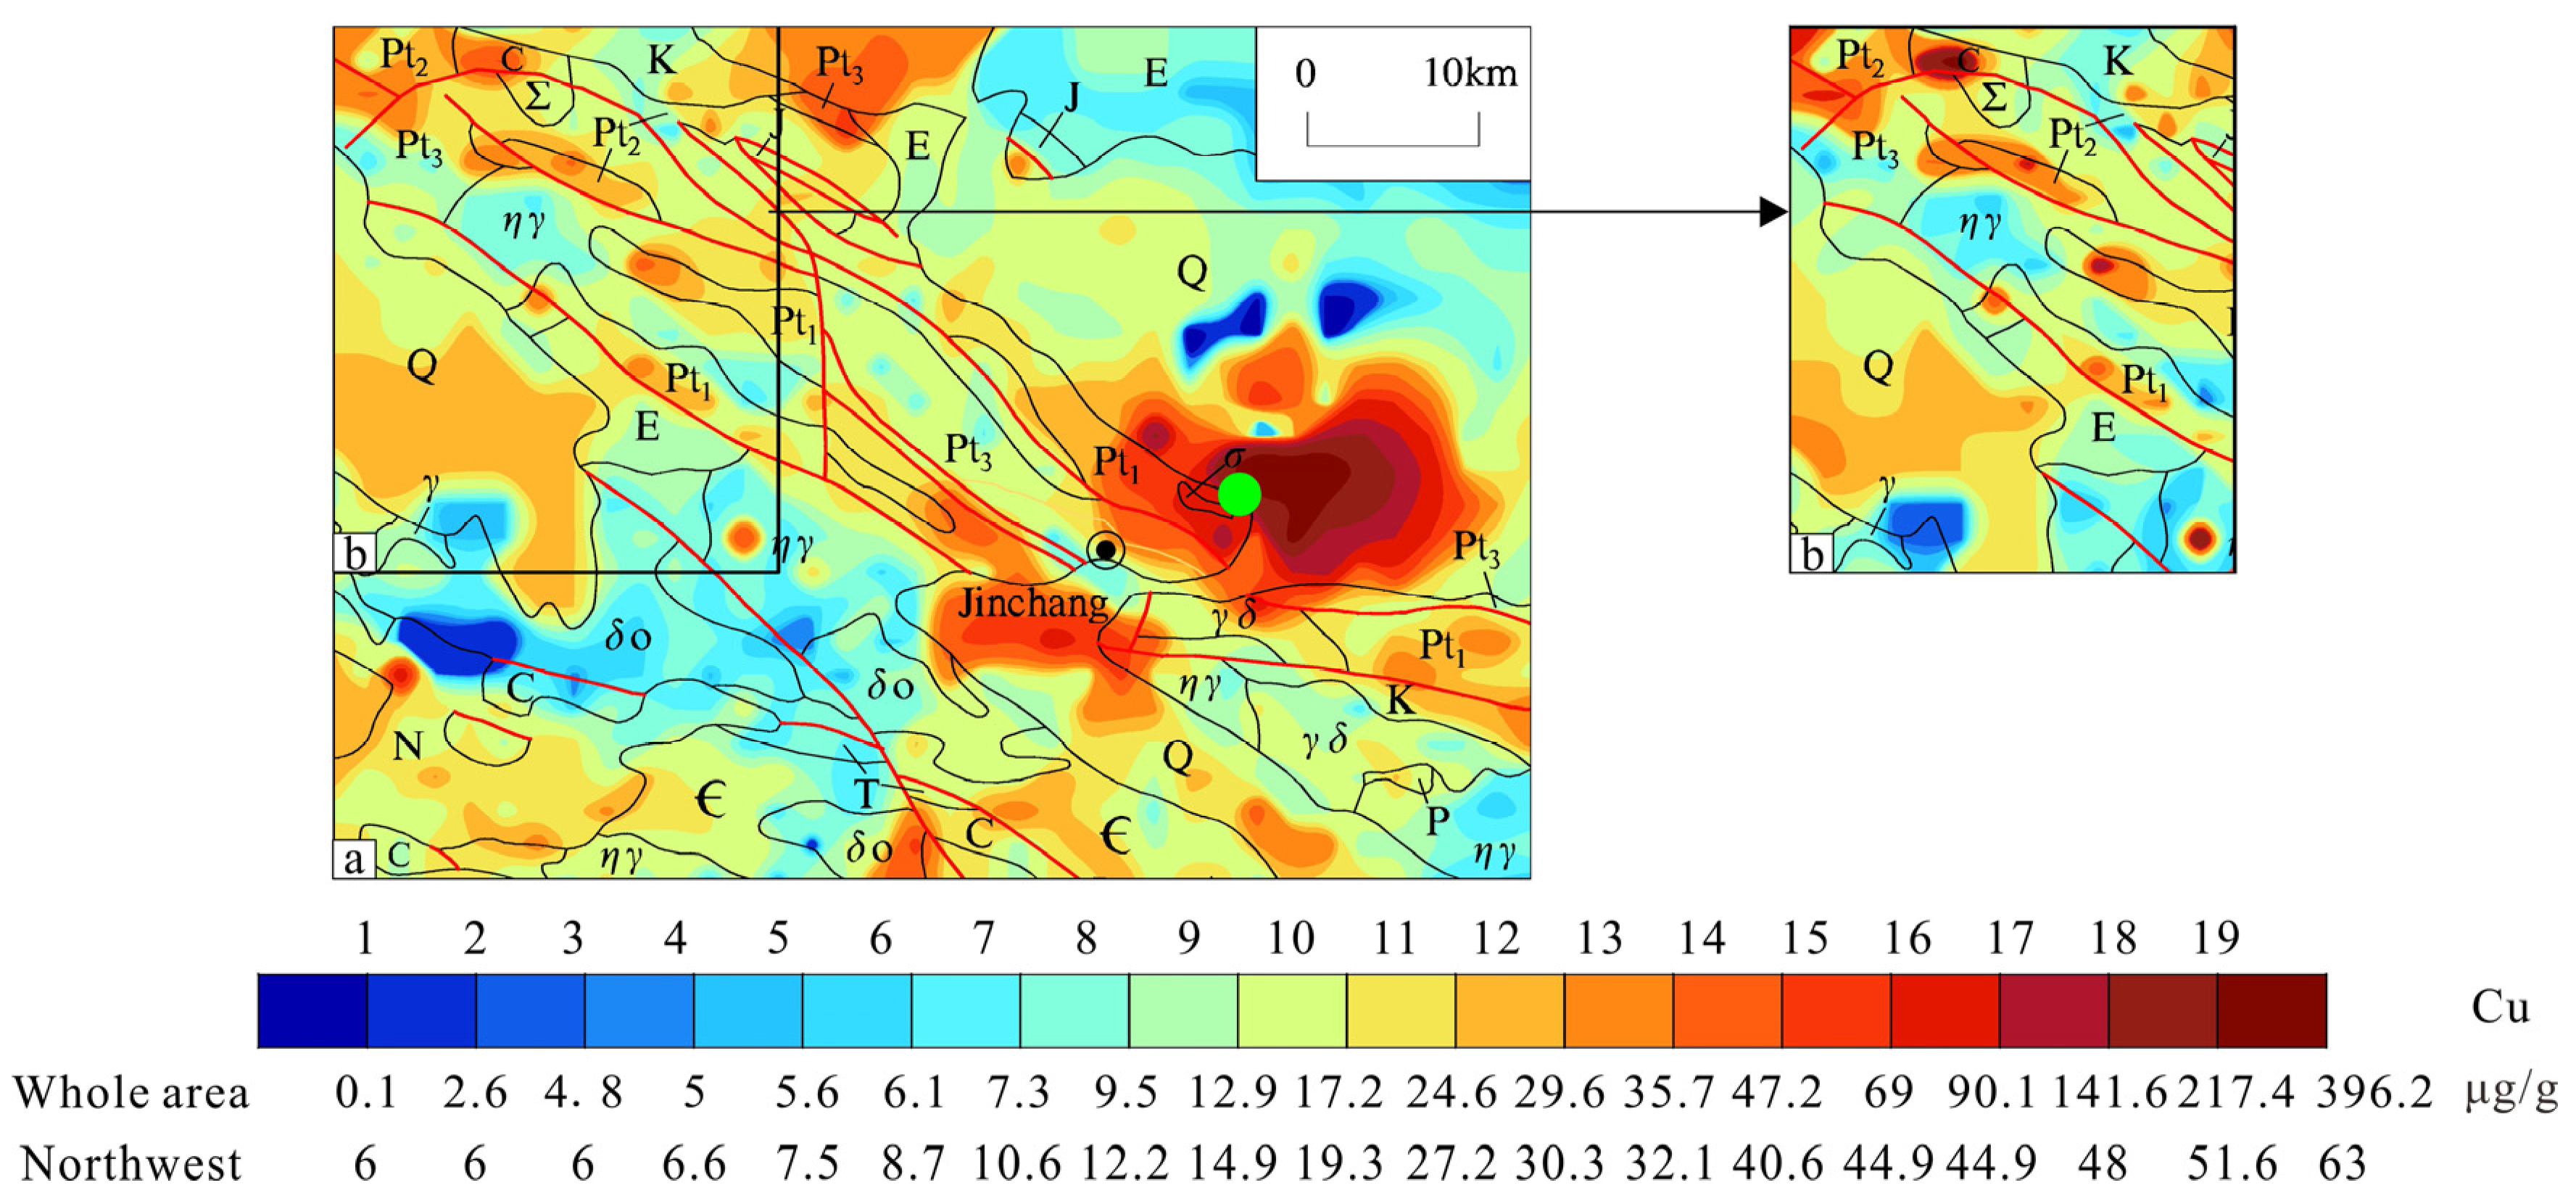
The traditional method of cumulative frequency (CFM) is adopted here to contour the geochemical map (Figure 5) for a comparison with the Cu geochemical map in Figure 4a. The CFM also uses 19 levels for the frequency values of 0.5, 1.2, 2, 3, 4.5, 8, 15, 25, 40, 60, 75, 85, 92, 95.5, 97, 98, 98.8, and 99.5 percentiles with different colors ranging from the blue tone for low values to red tone for high values.
Figure 5.
Geochemical maps of the Jinchuan area (a) and the northwest of the study area (b) on the traditional cumulative frequency method.
The 19-level CFM was used to contour the Cu geochemical maps both in the Jinchuan area (Figure 5a) and the northwest of the study area (Figure 5b). The results show that the Cu level would change if the scope of the map or the data volume changed. For example, the northwest of the study area displays Cu levels of 1 to 14 in Figure 5a on the whole area, while it shows Cu levels of 1 to 19 in Figure 5b in the sub-whole area (or the northwest area) because of the relative method. This inconsistency signifies the notable limitations of the CFM. Firstly, the geochemical maps generated on the CFM could not be compared among different areas. Furthermore, the cumulative frequency levels only have statistical implications but lack clear geological significance. The 19-level fixed-value method has overcome these limitations (Figure 4a) because of its fixed values.
4.2. Comparison Among Elements Statistically
In Table 3, the maximum concentration level of Cu reaches level 16, corresponding to the mineralization type. The maximum levels of Ni and Li are all level 15, corresponding to the anomaly type, while the maximum level of Sn is level 9, corresponding to the background type.
With respect to the quartiles and means, the levels of Q1, Q2, and Q3 and the mean of Cu, Ni, Sn, and Li are all background type. The levels of Q3 of Cu and Ni are high-background level, while those of Sn and Li are low-background level.
The results show that Cu and Ni in the study area are at high-background levels, while Sn and Li are at low-background levels, and the 19-level fixed-value method is applicable for the comparison among elements on their concentration levels.
4.3. Comparison Among Elements Spatially
In Figure 4, a comparison of the four elements in the Jinchuan area shows that their distribution can be clearly distinguished by their levels or colors. The maximum concentration level of Cu reaches level 16, corresponding to the gray tone and belonging to the mineralization type. This level is distributed in the Jinchuan Cu-Ni mining area. Among them, three locations reach level 10. These three locations are distributed in the northwest of the study area, the southwest of the main mining area, and the Pt3 area in the northwest, respectively. The maximum level Ni reaches level 15, corresponding to the red tone and belonging to the anomaly type, and it has two distribution locations: one is the Jinchuan Cu-Ni mining area and the other is the northwest of the study area. The maximum level Li reaches level 15 only in one spot, which corresponds to the red tone and belongs to the anomaly type. Except the one spot, the others belong to the background type. The maximum level of Sn reaches only level 9, which corresponds to the background type and yellow tone in the map. Therefore, the whole area in the map of Sn is in the blue and yellow tone.
The known Jinchuan Cu-Ni deposit is located in the Cu and Ni mineralization regions. The anomaly regions of Cu and Ni in the northwest can be considered a potential target for Cu-Ni exploration in the Jinchuan area. Furthermore, no Li and Sn deposits have been discovered in the Jinchuan area so far, which coincides with the background types in their maps.
The results show that the maximum concentration levels of Cu and Ni in the Jinchuan area both reach level 15 and are much higher than those of Sn and Li (except only one spot). This indicates that the 19-level fixed-value method is applicable for the comparison among elements and their concentration levels.
4.4. Comparison Among Areas
In order to compare the concentration levels among areas, the areas studied on the 19-level fixed-value method are given in Table 4 along with those of Jinchuan area. The statistical parameters, including the maximum, minimum and quartiles (Q1, Q2, Q3), of concentration values and the levels of Cu, Ni, Sn, and Li are extracted from their original references [21,22,23].
Table 4.
Element concentrations in different regions and their corresponding 19-level fixed values and quartiles.
In Table 4, for the comparison of the same element among different areas, the concentration value and level can both be used. However, the element concentration level not only facilitates memorization but also directly and intuitively reflects the geochemical information on background, anomaly and mineralization.
On concentration level, the maximum levels of Ni in the Mojiang area and Sn in the Gejiu area both reach level 19, corresponding to the mineralization type, and are precisely consistent with the proven large-scale deposits in these regions. Meanwhile, the maximum levels of Cu in the Jinchuan area and Li in the Mufushan area both reach level 16, which also corresponds to the mineralization type, and these levels are consistent with the discovered deposits in their target regions. Overall, their maximum concentration levels are all greater than 15 in their deposit regions. On the other hand, the maximum concentration levels of Sn and Li in the Mojiang area and Jinchuan area (except only one spot on Li) do not reach level 15, which corresponds to the geological fact that no Sn and Li deposits have been discovered in these regions.
In summary, the 19-level fixed-value method converts element concentration data into concentration levels of 1 to 19. The method facilitates the comparison across elements and regions with easily remembered integers and geochemical meanings. For the 1:200,000 regional geochemical stream sediment survey data, the probability of the presence of mineral deposits is relatively high when the element concentration level reaches grade 15 or above. However, this conclusion is only a pilot experience and further studies are needed on geochemical survey data at other scales and with other materials (such as soils and rocks).
5. Conclusions
- (1)
- A 19-level fixed-value method for Cu is proposed based on 18 fixed values ranging from 1 µg/g to 2000 µg/g and concentration levels can be further categorized into background, anomaly, and mineralization types.
- (2)
- The new method was used to compare elements in the Jinchuan giant Cu-Ni deposit area and other areas which facilitates the recognition of target metals in geochemical exploration.
- (3)
- The mineral potential is relatively high when the element concentration level reaches the 15th or above on the 1:200,000 survey data from sediments. However, this conclusion is only a pilot experience and further research is needed on other scales and other materials.
Author Contributions
Y.Z.: conceptualization, data curation, writing—original draft. X.F.: data curation, project administration and funding acquisition. Y.L.: data curation, conceptualization. T.Y. and Q.G.: conceptualization, methodology, writing—review and editing. All authors have read and agreed to the published version of the manuscript.
Funding
This work was financially supported by Central Leading Local Science and Technology Development Fund Project (24ZYQF001).
Institutional Review Board Statement
Not applicable.
Informed Consent Statement
Not applicable.
Data Availability Statement
The authors will make the raw data supporting this article’s conclusions available upon request.
Acknowledgments
We greatly appreciate the comments from the anonymous reviewers and editors for their valuable suggestions to improve the quality of this manuscript.
Conflicts of Interest
The authors declare no conflicts of interest.
References
- Xie, X.; Cheng, H. Sixty years of exploration geochemistry in China. J. Geochem. Explor. 2014, 139, 4–8. [Google Scholar] [CrossRef] [Scilit]
- Li, M.; Xi, X.; Xiao, G.; Cheng, H.; Yang, Z.; Zhou, G.; Ye, J.; Li, Z. National multi-purpose regional geochemical survey in China. J. Geochem. Explor. 2014, 139, 21–30. [Google Scholar] [CrossRef] [Scilit]
- Xie, X.; Mu, X.; Ren, T. Geochemical mapping in China. J. Geochem. Explor. 1997, 60, 99–113. [Google Scholar] [CrossRef] [Scilit]
- Hosseini-Dinani, H.; Mokhtari, A.R.; Shahrestani, S.; Vivo, B.D. Sampling Density in Regional Exploration and Environmental Geochemical Studies: A Review. Nat. Resour. Res. 2019, 28, 967–994. [Google Scholar] [CrossRef] [Scilit]
- Chen, S.; Gong, Q.; Li, P.; Xu, S.; Liu, N. Describing geochemical backgrounds of lithium in rock-soil-sediment systems. Appl. Geochem. 2024, 162, 105908. [Google Scholar] [CrossRef] [Scilit]
- Cheng, Z.; Xie, X.; Yao, W.; Feng, J.; Zhang, Q.; Fang, J. Multi-element geochemical mapping in Southern China. J. Geochem. Explor. 2014, 139, 183–192. [Google Scholar] [CrossRef] [Scilit] [PubMed]
- Xie, X. Geochemical Mapping-Evolution of Its Aims, Ideas and Technology. Acta Geol. Sin. 2008, 82, 927–937. [Google Scholar]
- Yousefi, M.; Carranza, E. Prediction–area (P–A) plot and C–A fractal analysis to classify and evaluate evidential maps for mineral prospectively modeling. Comput. Geosci. 2015, 79, 69–81. [Google Scholar] [CrossRef] [Scilit]
- Zuo, R.; Xiong, Y.; Wang, J.; Carranza, E.J. Deep learning and its application in geochemical mapping. Earth Sci. Rev. 2019, 192, 1–14. [Google Scholar] [CrossRef] [Scilit]
- Darnley, A.G. International geochemical mapping and the environment. J. Geochem. Explor. 1991, 41, 81–83. [Google Scholar] [CrossRef] [Scilit]
- Reimann, C.; Matschullat, J.; Birke, M.; Salminen, R. Antimony in the environment: Lessons from geochemical mapping. J. Appl. Geochem. 2010, 25, 175–198. [Google Scholar] [CrossRef] [Scilit]
- Gao, Y.; Chen, J.; Zhang, Y.; Wang, W. Further research on geochemical mapping. Comput. Tech. Geophys. Geochem. Explor. 2015, 37, 538–546, (In Chinese with English abstract). [Google Scholar]
- Zuo, R.; Xiong, Y. Geodata science and geochemical mapping. J. Geochem. Explor. 2020, 209, 106431. [Google Scholar] [CrossRef] [Scilit]
- Xiang, Y.; Mu, X.; Ren, T.; Liu, R.; Wu, X. China regional geochemical exploration database. Geol. China 2018, 45, 41–57. [Google Scholar]
- DZ/T 0145-2017; Code of Practice for Soil Geochemical Survey. Geol. Publ. House: Beijing, China, 2017.
- DZ/T 0011-2015; Specification of Geochemical Reconnaissance Survey (1:50,000). Geol. Publ. House: Beijing, China, 2015.
- Zuo, R.; Carranza, E.J.M.; Cheng, Q. Fractal/multifractal modelling of geochemical exploration data. J. Geochem. Explor. 2012, 122. [Google Scholar] [CrossRef] [Scilit]
- Zhou, D. Adjustment of geochemical background by robust multivariate statistics. J. Geochem. Explor. 1985, 24, 207–222. [Google Scholar] [CrossRef] [Scilit]
- Qi, Y.H.; Li, X.H.; Huo, L.X. Application of factor analysis and geostatistics to geochemical data analysis. Geol. Anhui 2013, 23, 112–115. [Google Scholar]
- An, Y.; Yan, T.; Gong, Q.; Wang, X.; Huang, Y.; Zhang, B.; Yin, Z.; Zhao, X.; Liu, N. Chromium (Cr) geochemical mapping based on fixed-values method: Case studies in China. Appl. Geochem. 2022, 136, 105168. [Google Scholar] [CrossRef] [Scilit]
- Xu, S.; Li, J.; Zhang, X.; Huang, Z.; Huang, Y.; Long, Y.; Xu, Y.; Song, X.; Chen, Z.; Li, Y.; et al. Tin (Sn) geochemical mapping based on fixed-value method: A case illustration in Gejiu area, Southwest China. Appl. Sci. 2024, 14, 1765. [Google Scholar] [CrossRef] [Scilit]
- Li, P.; Gong, Q.; Chen, S.; Li, P.; Li, J.; Wu, X.; Li, X.; Wang, X.; Liu, N. Regional Geochemical Characteristics of Lithium in the Mufushan Area, South China. Appl. Sci. 2024, 14, 1978. [Google Scholar] [CrossRef] [Scilit]
- Jia, G.; Gu, W.; Gong, Q.; Xu, S.; Liu, Y.; Lv, Z. A 19-level fixed-value method to classify the Mo concentrations in Jianshui area of Yunnan province, China. Appl. Geochem. 2025, 180, 106289. [Google Scholar] [CrossRef] [Scilit]
- Zhu, X.; Li, P.; Gong, Q.; Gu, W.; Xu, S.; Yan, T. Geochemical Survey in Mojiang Area of Yunnan Province, China. Appl. Sci. 2025, 15, 2592. [Google Scholar] [CrossRef] [Scilit]
- Yan, T.; Liu, D.; Liu, Y.; Xu, S.; Gong, Q. Lead (Pb) Geochemical Mapping Based on a Fixed- Value Method: A Case Illustration in Wenshan Area, Southwest. Geol. J. 2025; early view. [CrossRef] [Scilit]
- Hua, Z.; Lu, J.; Hou, Y.; Zhao, W.; Li, C.; Sun, X. Geochemical Characteristics and Geological Significance of Platinum Group Elements in Orebody No.2 of the Jinchuan Cu-Ni Sulfide Deposit. World Geol. 2024, 43, 216–227. [Google Scholar]
- Jiao, J.; Tan, F.; Li, L.; Liu, J.; Yang, X.; Gao, D. Tectonic Observation and Analysis of Diagenesis and Mineralization in the Jinchuan Cu-Ni Sulfide Deposit, Gansu Province. Mod. Geol. 2024, 4, 1026–1042. [Google Scholar]
- Chai, K.; Li, X.; Wang, X.; Wei, X. Geological Characteristics and a Preliminary Study on the Genesis of the Jinchuan Cu-Ni Deposit, Gansu Province. World Nonferrous Met. 2021, 20, 86–87. [Google Scholar]
- Su, Z.; Mao, X.; Li, L.; Liu, X. Quantitative Analysis of Tectonic Ore-Controlling in the Jinchuan Cu-Ni Sulfide Deposit. Miner. Explor. 2023, 14, 679–690. [Google Scholar]
- Liu, M.; Su, S.; Liu, X.; Guo, X.; Li, Y. Magmatic Conduit Metallogenic System of the Jinchuan Cu-Ni(Pt) Sulfide Deposit: Mineralogical Evidence. Earth Sci. Front. 2025, 32, 390–411. [Google Scholar]
- Zhao, X.; Lai, J.; Ai, Q.; Wang, Y. Typomorphic Mineralogical Characteristics of Pyrrhotite in Jinchuan Copper Nickel Sulfide Deposit and Its Geological Significance. Adv. Geosci. 2022, 12, 776–783. [Google Scholar] [CrossRef]
- Zeng, R.; Lai, J.; Mao, X.; Tao, J. Formation and Evolution of the Fault System in the Jinchuan Cu-Ni Deposit and Its Control on Ore Bodies. Trans. Nonferrous Met. Soc. China 2013, 23, 2574–2583. [Google Scholar]
- Liu, M.; Su, S.; Yao, Y.; Wu, X.; Cai, N.; Guan, Q. Discovery and genesis of two types of olivines and its significance to metallogeny in Jinchuan magmatic copper-nickel (PGE) sulfide deposit(Article). Acta Petrol. Sin. 2020, 36, 1151–1170. [Google Scholar]
- Ye, L.; Mao, J.; Cao, B.; Luo, J. Geological Condition Analysis of the Eastern Mining District in the Jinchuan Cu-Ni Deposit. West-Chin. Explor. Eng. 2014, 3, 95–96, 100. [Google Scholar]
- Song, C.; Su, S.; Wu, Y.; Cai, N.; Liu, M. Discovery and Significance of High-Mg Diabase Dikes in the Jinchuan Cu-Ni (Pt) Sulfide Deposit, Gansu Province. Acta Petrol. Sin. 2014, 11, 3375–3382. [Google Scholar]
- Jiao, J.; Gao, D.; Zhang, G.; Shao, L.; Rui, H.; Jin, S. Petrological, Geochemical and Geochronological Studies of the Mafic-Ultramafic Intrusions in the Beihaizi Area, Yongchang, Gansu Province. Earth Sci. Front. 2017, 24, 130–139. [Google Scholar]
- Zhang, K.; Jiao, J.; Liu, Q.; Ma, Y.; Duan, J.; Duan, L.; Jia, L.; Liu, J. Paleozoic Magmatic Core Complex Uplift in the Longshoushan Area, Gansu Province: Evidence from Dyke Geochronology and Geochemistry in the Jinchuan Mining District. Geol. Bull. China 2023, 42, 343–362. [Google Scholar]
- Qin, H. Petrological Characteristics of the Early Paleozoic Granites in the North Qilian Orogenic Belt and Their Tectonic Evolutionary Relationships; China University of Geosciences: Beijing, China, 2012. [Google Scholar]
- DZ/T 0223-2001; General Rules for Inductively Coupled Plasma-Mass Spectrometry (ICP-MS) Analytical Methods. The Geological Publishing House: Beijing, China, 2001.
- DZ/T 0167-2006; Specification of Regional Geochemical Reconnaissance Survey (1:200,000). The Geological Publishing House: Beijing, China, 2016.
- DZ/T 0214-2002; Specification for Copper, Lead, Zinc, Silver, Nickel and Molybdenum Mineral Exploration. The Geological Publishing House: Beijing, China, 2002.
- Xiang, Y.; Mu, X.; Ren, T.; Ma, Z.; Liu, R.; Gong, Q.; Wang, M.; Gong, J.; Yang, W.; Yang, Y. Application of Geochemical Survey Data on Potential Evaluation of Mineral Resources in China; The Geological Publishing House: Beijing, China, 2018; pp. 1–445. [Google Scholar]
- Hou, Q.; Yang, Z.; Yu, T.; Xia, X.; Cheng, H.; Zhou, G. Soil Geochemical Parameters in China; The Geological Publishing House: Beijing, China, 2020. [Google Scholar]
- GB15618-2018; Soil Environmental Quality and Agricultural Land Soil Pollution Risk Control Standards (Trial). China Environment Press: Beijing, China, 2018.
- Cao, Y.; Lu, C. Soil Heavy Metal Contamination and Bioavailability in the Baoshan Pottery Clay Mining Area. J. Resour. Ecol. 2024, 15, 909–917. [Google Scholar]
- Lou, S.; Zou, Y.W.; Wang, H.; Zhou, F.; Liu, S.G.; Tu, J.B.; Radnaeva, L.D.; Nikitina, E.; Fedorova, I.V. Kinetics Release of Heavy Metal Cu from Sediment Affected by the Mimic Vegetation Under Unidirectional Flows and Regular Waves. Estuar. Coast. Shelf Sci. 2024, 298, 108653. [Google Scholar] [CrossRef] [Scilit]

Disclaimer/Publisher’s Note: The statements, opinions and data contained in all publications are solely those of the individual author(s) and contributor(s) and not of MDPI and/or the editor(s). MDPI and/or the editor(s) disclaim responsibility for any injury to people or property resulting from any ideas, methods, instructions or products referred to in the content. |
© 2026 by the authors. Licensee MDPI, Basel, Switzerland. This article is an open access article distributed under the terms and conditions of the Creative Commons Attribution (CC BY) license.