


Abstract
The rapid development of renewable energy requires the support of large-scale energy storage technologies to maintain system balance. Salt cavern compressed air energy storage (CAES) is regarded as one of the key technological pathways for large-scale energy storage. In such systems, the wellbore serves as a critical structure connecting surface facilities and the underground salt cavern, while the cement sheath—formed between the casing and formation during well cementing—acts as the primary barrier ensuring the overall sealing integrity of the wellbore. Through cyclic loading–unloading tests on cement slurries under different temperatures, this study yields the following main conclusions: (1) Increasing temperature aggravates the accumulation of fatigue damage in cement specimens. Taking cumulative plastic strain as an example, it rises from 0.45% to 0.99% as the temperature increases from 25 °C to 115 °C. (2) Elevated temperature promotes greater irreversible energy dissipation under fixed cyclic stress limits. When the temperature rises from 25 °C to 115 °C, the dissipated energy density increases from 0.0033 mJ/m3 to 0.0046 mJ/m3, and its proportion relative to the input energy also increases from 5.52% to 7.13%. (3) Temperature rise leads to notable deterioration of the internal pore structure. At 115 °C, the NMR T2 distribution peak shifts rightward by 0.49 ms, the total pore volume increases by 150.53 mm3, and the corresponding permeability rises by 1.398 × 10⁻³ μm2. (4) Elevated temperature (up to 115 °C) weakens material performance through a dual mechanism: it accelerates dehydration of the cementitious system, reducing interparticle bond strength, while also promoting plastic slip. It is recommended to optimize the cement slurry formulation (e.g., by incorporating thermal stabilizers) to enhance its long-term sealing performance under service conditions.
1. Introduction
The extensive consumption of fossil fuels, such as oil and coal, has contributed to serious environmental challenges, including climate change, thereby accelerating the global transition toward renewable energy to mitigate greenhouse gas emissions [1,2]. Although renewable energy sources such as wind and solar have expanded rapidly, their intrinsic intermittency and variability lead to pronounced fluctuations in power generation [3,4]. To maintain power system reliability, large-scale energy storage technologies are required to mitigate the mismatch between variable renewable generation and electricity demand [5,6]. For example, excess electricity produced during periods of high wind or solar availability can be stored and later dispatched during peak demand to reduce supply–demand imbalances.
With the rapid advancement of large-scale energy storage, various technologies have emerged and can be broadly classified into mechanical, electrochemical, electromagnetic, and thermal energy storage [7,8]. Among established technologies, pumped hydro energy storage and compressed air energy storage have received considerable attention because of their large capacity, long service life, extended discharge duration, and relatively low cost [9,10]. Nevertheless, the large-scale deployment of pumped hydro storage is constrained by stringent geographical and hydrological requirements. By comparison, compressed air energy storage involves fewer site limitations and offers high operational safety and reliability, making it a promising alternative for large-scale energy storage applications.
At present, feasible geological settings for compressed air energy storage (CAES) primarily include salt caverns, abandoned mines, aquifers, and depleted oil and gas reservoirs [11,12,13,14,15]. Among these options, salt cavern CAES is regarded as a key pathway for large-scale energy storage because of its low construction cost, high operational safety, fast response, and limited environmental impact [16,17,18].
In salt cavern CAES systems, the wellbore serves as the critical conduit between surface facilities and the underground storage reservoir, and its integrity is essential for overall system stability [19]. The cement sheath, formed by the hardening of cement slurry during well cementing, provides the primary seal for the annulus between the casing and the surrounding formation. During cyclic gas injection (charging) and production (discharging), the wellbore is exposed to frequent low-amplitude cyclic loading [20]. Such repeated loading can induce fatigue damage in the cement sheath and progressively degrade its sealing performance. Once the cement sheath fails, gas leakage and even wellbore instability may occur, posing serious risks to the safe operation of the storage system. Therefore, understanding the mechanical response and long-term stability of cement sheaths under cyclic loading is of both engineering and scientific significance for ensuring reliable CAES operation.
Several studies have examined the mechanical response of set cement subjected to cyclic loading [21,22,23,24,25]. For example, Shadravan et al. performed uniaxial cyclic loading tests on oil-well cement at an 85% load level and reported that the average Young’s modulus first increased and then decreased as the number of cycles increased. Deng et al. carried out triaxial cyclic loading tests on oil-well cement specimens cured at 90 °C, using a 50% load level under a confining pressure of 20 MPa, and found that plastic strain accumulated most rapidly during the first three cycles. Xi et al. compared conventional and latex-modified cement slurries under triaxial cyclic loading at a 70% load level. Their results showed pronounced plastic strain accumulation in both systems after 20 cycles (0.45% for the conventional slurry and 0.56% for the latex-modified slurry). Wang et al. found that cyclic loading alters the microstructure of cement samples, resulting in reduced mechanical properties and increased permeability [26]. These studies generally performed cyclic loading tests at ambient conditions or at only one elevated curing/testing temperature.
However, with increasing well depth, cement sheaths are exposed to elevated formation temperatures, which can markedly influence the mechanical properties of set cement. For instance, Yang et al. reported that increasing the temperature from 25 °C to 140 °C reduced the cohesion and internal friction angle of oil-well cement by 47.5% and 27.2%, respectively [27]. Moreover, when the downhole temperature increased from 25 °C to 140 °C and the cyclic load level rose from 30% to 70%, the accumulated plastic strain increased by up to 13.8 times, indicating a pronounced reduction in fatigue resistance and service life [28]. Zhang et al. also reported that both the compressive strength and Young’s modulus of cement decrease markedly when the temperature increases to 130 °C relative to 25 °C [25]. Cheng et al. reported that cement set at 80 °C showed strength growth during curing, while that set at 240 °C underwent strength loss within 28 days; neither increased silica sand dosage nor coal gangue powder addition inhibited this decline [29]. Furthermore, other studies have investigated how temperature affects hydration products and the evolution of cement microstructure [30,31,32].
However, current research has not adequately addressed the frequent injection-production conditions typical of CAES operations, often employing an insufficient number of simulation cycles. To bridge this gap, the present study simultaneously considers the effects of both temperature and cyclic loading. Cement specimens were prepared under different curing temperatures and subsequently subjected to long-term fatigue tests at their respective temperatures. By systematically analyzing stress–strain curves, cumulative peak and plastic strains, dissipated energy density, as well as changes in pore size distribution, pore volume, and permeability before and after testing, this work comprehensively reveals temperature-dependent fatigue damage evolution of set cement under cyclic loading at temperatures up to 115 °C. The findings and insights obtained provide valuable guidance for assessing the long-term sealing integrity of cement sheaths in CAES systems.
2. Materials and Methods
2.1. Materials
This study employed a well cement formulation based on Class G cement (JH, Sichuan, China), which is widely used in cementing operations for oil and gas extraction as well as geothermal engineering. The specific formulation consisted of 100% neat Class G cement, 4% fluid loss additive (HS, Sichuan, China), 40% fresh water, and 0.25% defoamer (HS, Sichuan, China). The chemical composition and compound contents of the Class G cement are detailed in Table 1.
Table 1.
Chemical composition and compounds of Class G cement.
2.2. Methods
2.2.1. Sample Preparation
The cement slurry was prepared in accordance with API 10B-2 and poured into a custom-designed mold. The mold was then placed in a self-developed high-temperature and high-pressure (HTHP) curing device to reproduce downhole curing conditions. Specimens were cured at 60 °C, 90 °C, and 115 °C, which correspond to typical formation temperatures for burial depths of approximately 1000–3000 m. A reference group was also prepared under ambient curing conditions (25 °C). The curing pressure was maintained at 20 MPa, consistent with API subcommittee findings indicating that curing pressure has a negligible influence on compressive strength once it exceeds 3000 psi (≈20.7 MPa).
Previous studies have shown that cement slurries cured at elevated temperatures generally develop most of their strength within 72 h. Therefore, the curing duration was set to 72 h in this work. To reduce potential thermal or pressure shock, the chamber temperature and pressure were ramped up and down gradually over a 2 h transition period before and after the stable curing stage. After HTHP curing, the specimens were demolded and stored in a water tank for an additional 28 days of curing at ambient temperature.
2.2.2. Experimental Apparatus
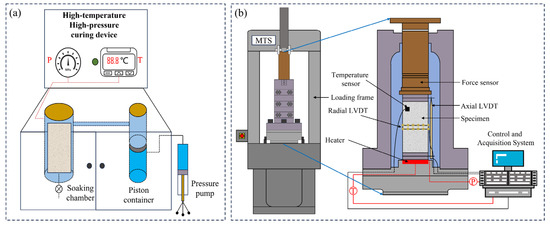
An integrated experimental platform was used to reproduce high-temperature and high-pressure (HTHP) curing conditions, as well as the quasi-static and cyclic loading environments relevant to well cement slurries. As shown in Figure 1, the system consists of two coupled components. The first is an HTHP curing device that provides controlled temperature and confining pressure during specimen curing. The second is an HTHP mechanical testing system (MTS815, Minnesota, USA), which enables triaxial quasi-static compression and cyclic loading–unloading tests under simulated downhole temperature and pressure conditions.
Figure 1.
The innovative testing platform: (a) HTHP curing device and (b) HTHP mechanical testing system.
- (1)
- HTHP curing device
The HTHP curing device (Figure 1a) comprises a confining pressure control system and a temperature control system. After a specimen is placed and sealed within the pressure vessel, the confining pressure control system—consisting of a pressure pump and an intermediate vessel—applies hydrostatic pressure up to a maximum of 50 MPa. Simultaneously, the temperature control system, which includes heaters surrounding the vessel and temperature sensors inside it, maintains the desired temperature up to a maximum of 150 °C.
- (2)
- HTHP mechanical testing system
The HTHP mechanical testing system is used to evaluate the mechanical properties of specimens under simulated conditions (Figure 1b). It integrates four subsystems: an axial load control system, a confining pressure control system, a temperature control system, and a computer control system. The axial load control system can precisely regulate force or displacement during testing via load or displacement sensors, with a maximum load capacity of 1000 kN and a maximum axial displacement of 6 mm. The confining pressure control system accurately maintains the confining pressure up to 100 MPa using pressure sensors. The temperature control system, equipped with heaters and temperature sensors, controls the environmental temperature with a maximum operating limit of 200 °C. The computer control system manages different loading protocols via a dual-computer setup and accurately records all stress and strain data throughout the tests.
- (3)
- Microstructural characterization equipment
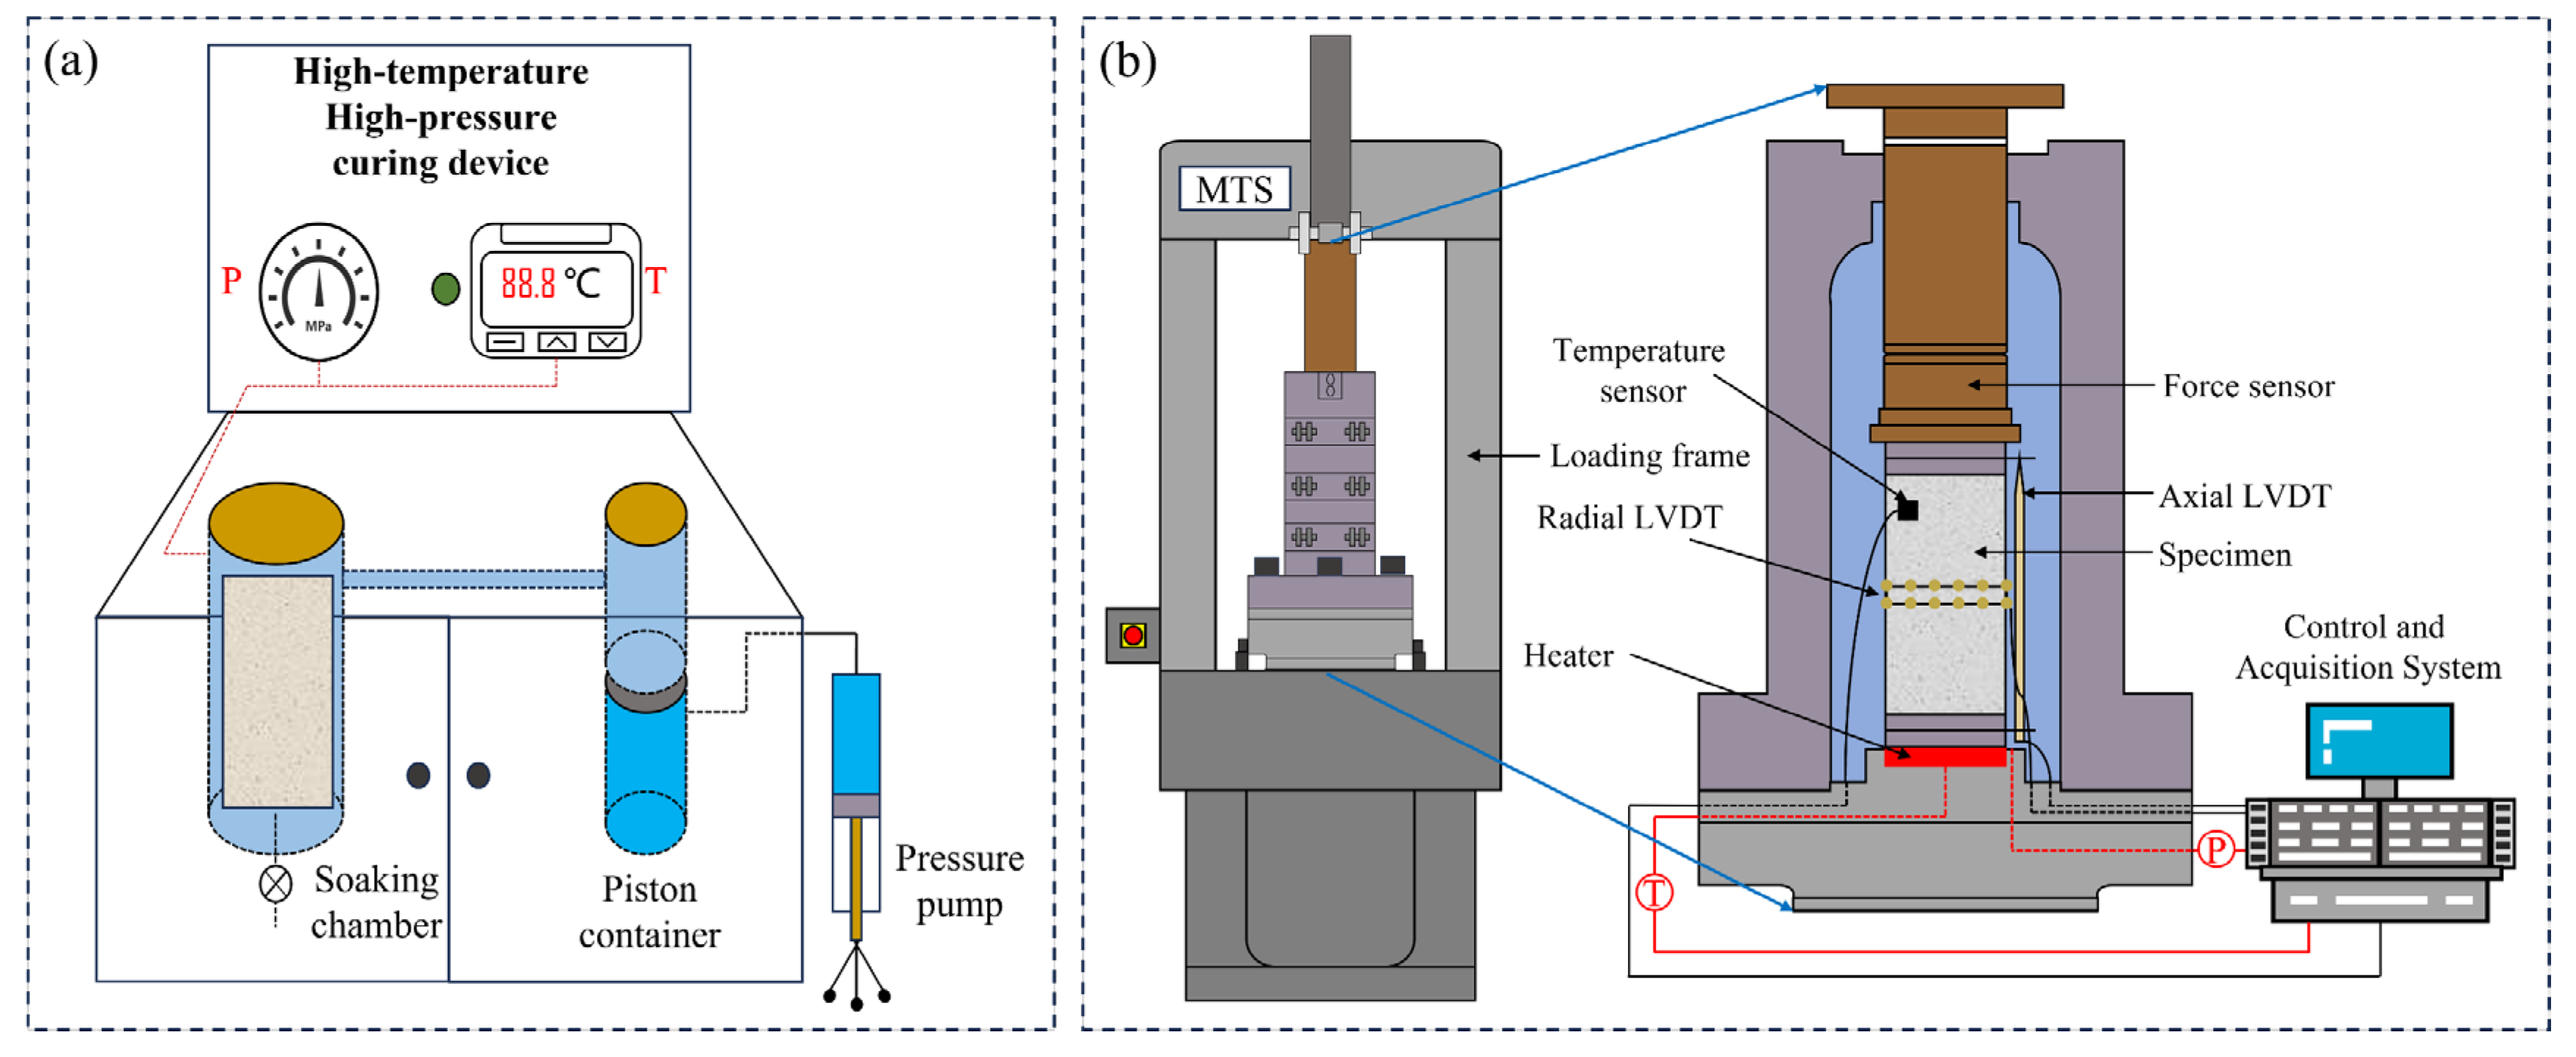
To assess microstructural changes in the cement specimens before and after testing, several characterization techniques were utilized (Figure 2).
Figure 2.
Microstructural characterization equipment.
Nuclear Magnetic Resonance (NMR): NMR was employed to quantitatively characterize the pore size distribution, spanning from nanometer to micrometer scales. A large-aperture NMR imaging analyzer (NM, Suzhou, China was used to determine the pore characteristics of the specimens. This instrument can accommodate samples up to 60 mm in diameter, operates at a magnetic field strength of 0.3 T ± 0.03 T, and provides a magnetic field homogeneity of ≤50 ppm. It is capable of performing T1/T2 relaxation spectroscopy and T1/T2 proton density-weighted imaging.
Permeability Measurement: Permeability, which reflects a material’s capacity for fluid or gas transmission and depends on its physical and structural features (e.g., pore and crack size, connectivity), was measured using a PoroPDP-200 overburden pore-permeability apparatus. The tests were conducted using the transient pressure pulse decay method. Compared to steady-state methods, this technique offers shorter stabilization times and faster testing speeds, making it particularly suitable for low-permeability materials. The instrument has a measurement range of 0.00001~10 mD, with maximum confining and pore pressures of 70 MPa and 12.5 MPa, respectively.
X-ray Computed Tomography (CT): The internal morphology of selected cement specimens was examined after testing using industrial X-ray CT (Baker Hughes, Houston, TX, USA). The scanning parameters were set as follows: magnification factor of 2.94× (corresponding to a voxel resolution of 67 µm), X-ray tube voltage of 190 kV, current of 340 µA, and a rotation step of 0.24°.
2.2.3. Experimental Design
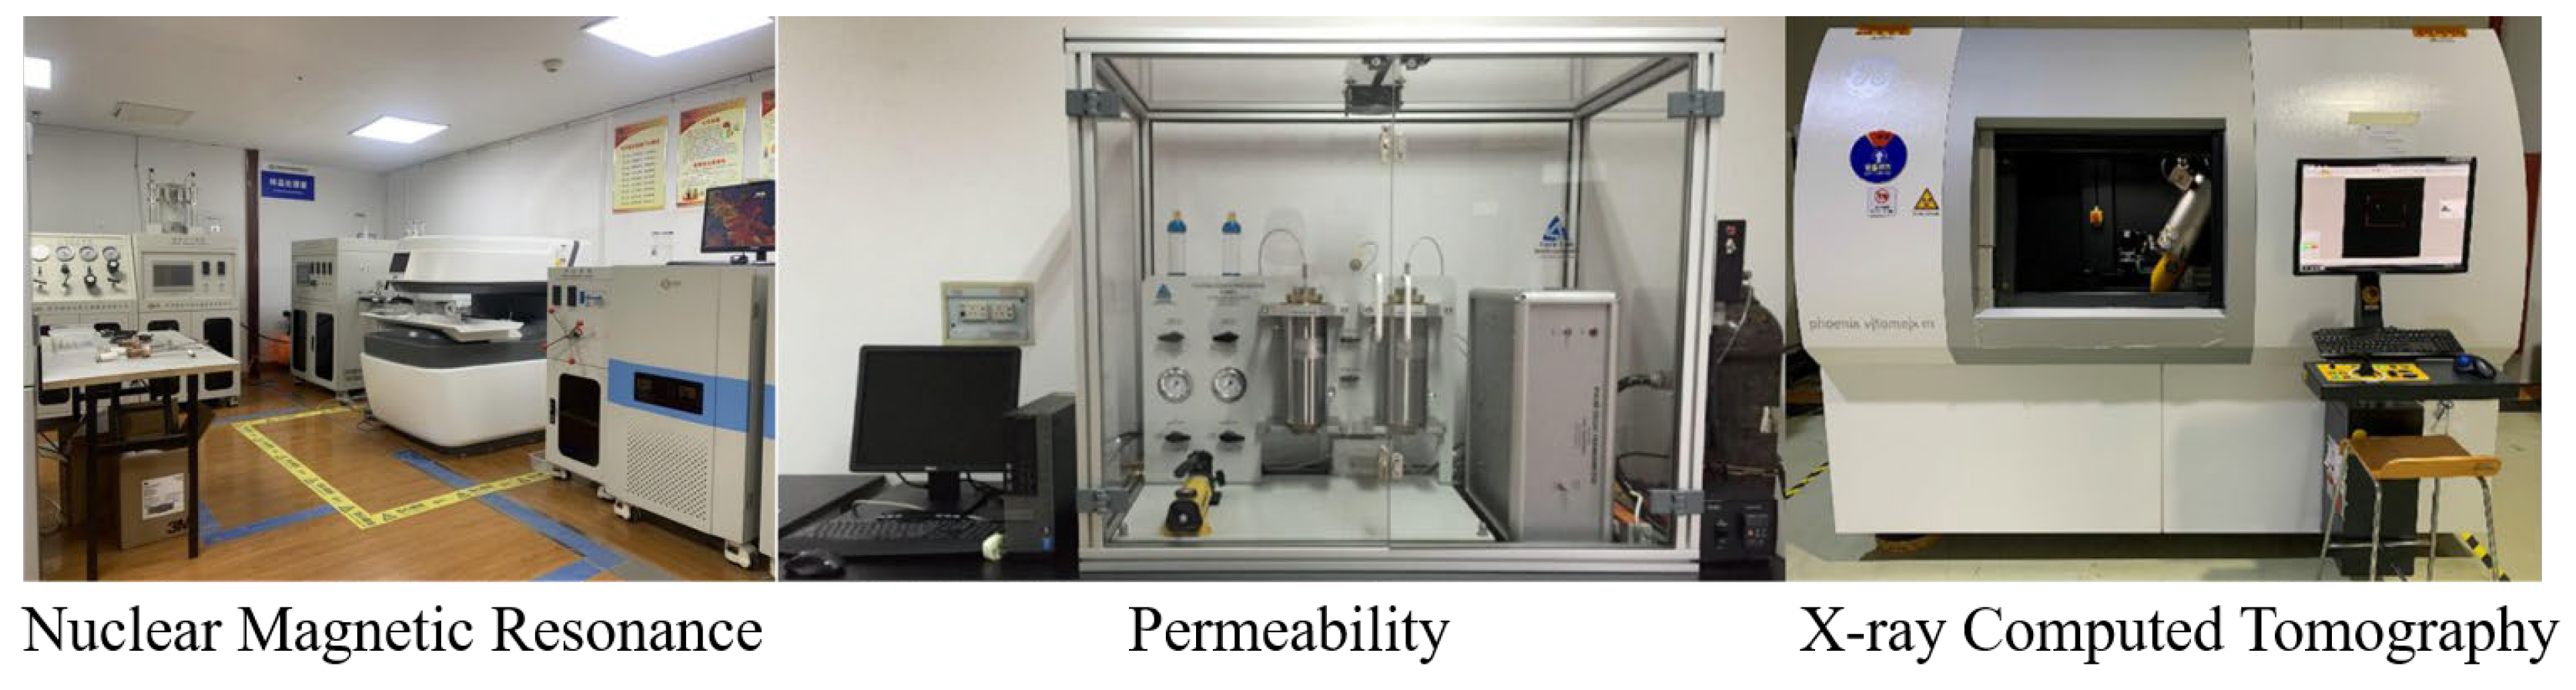
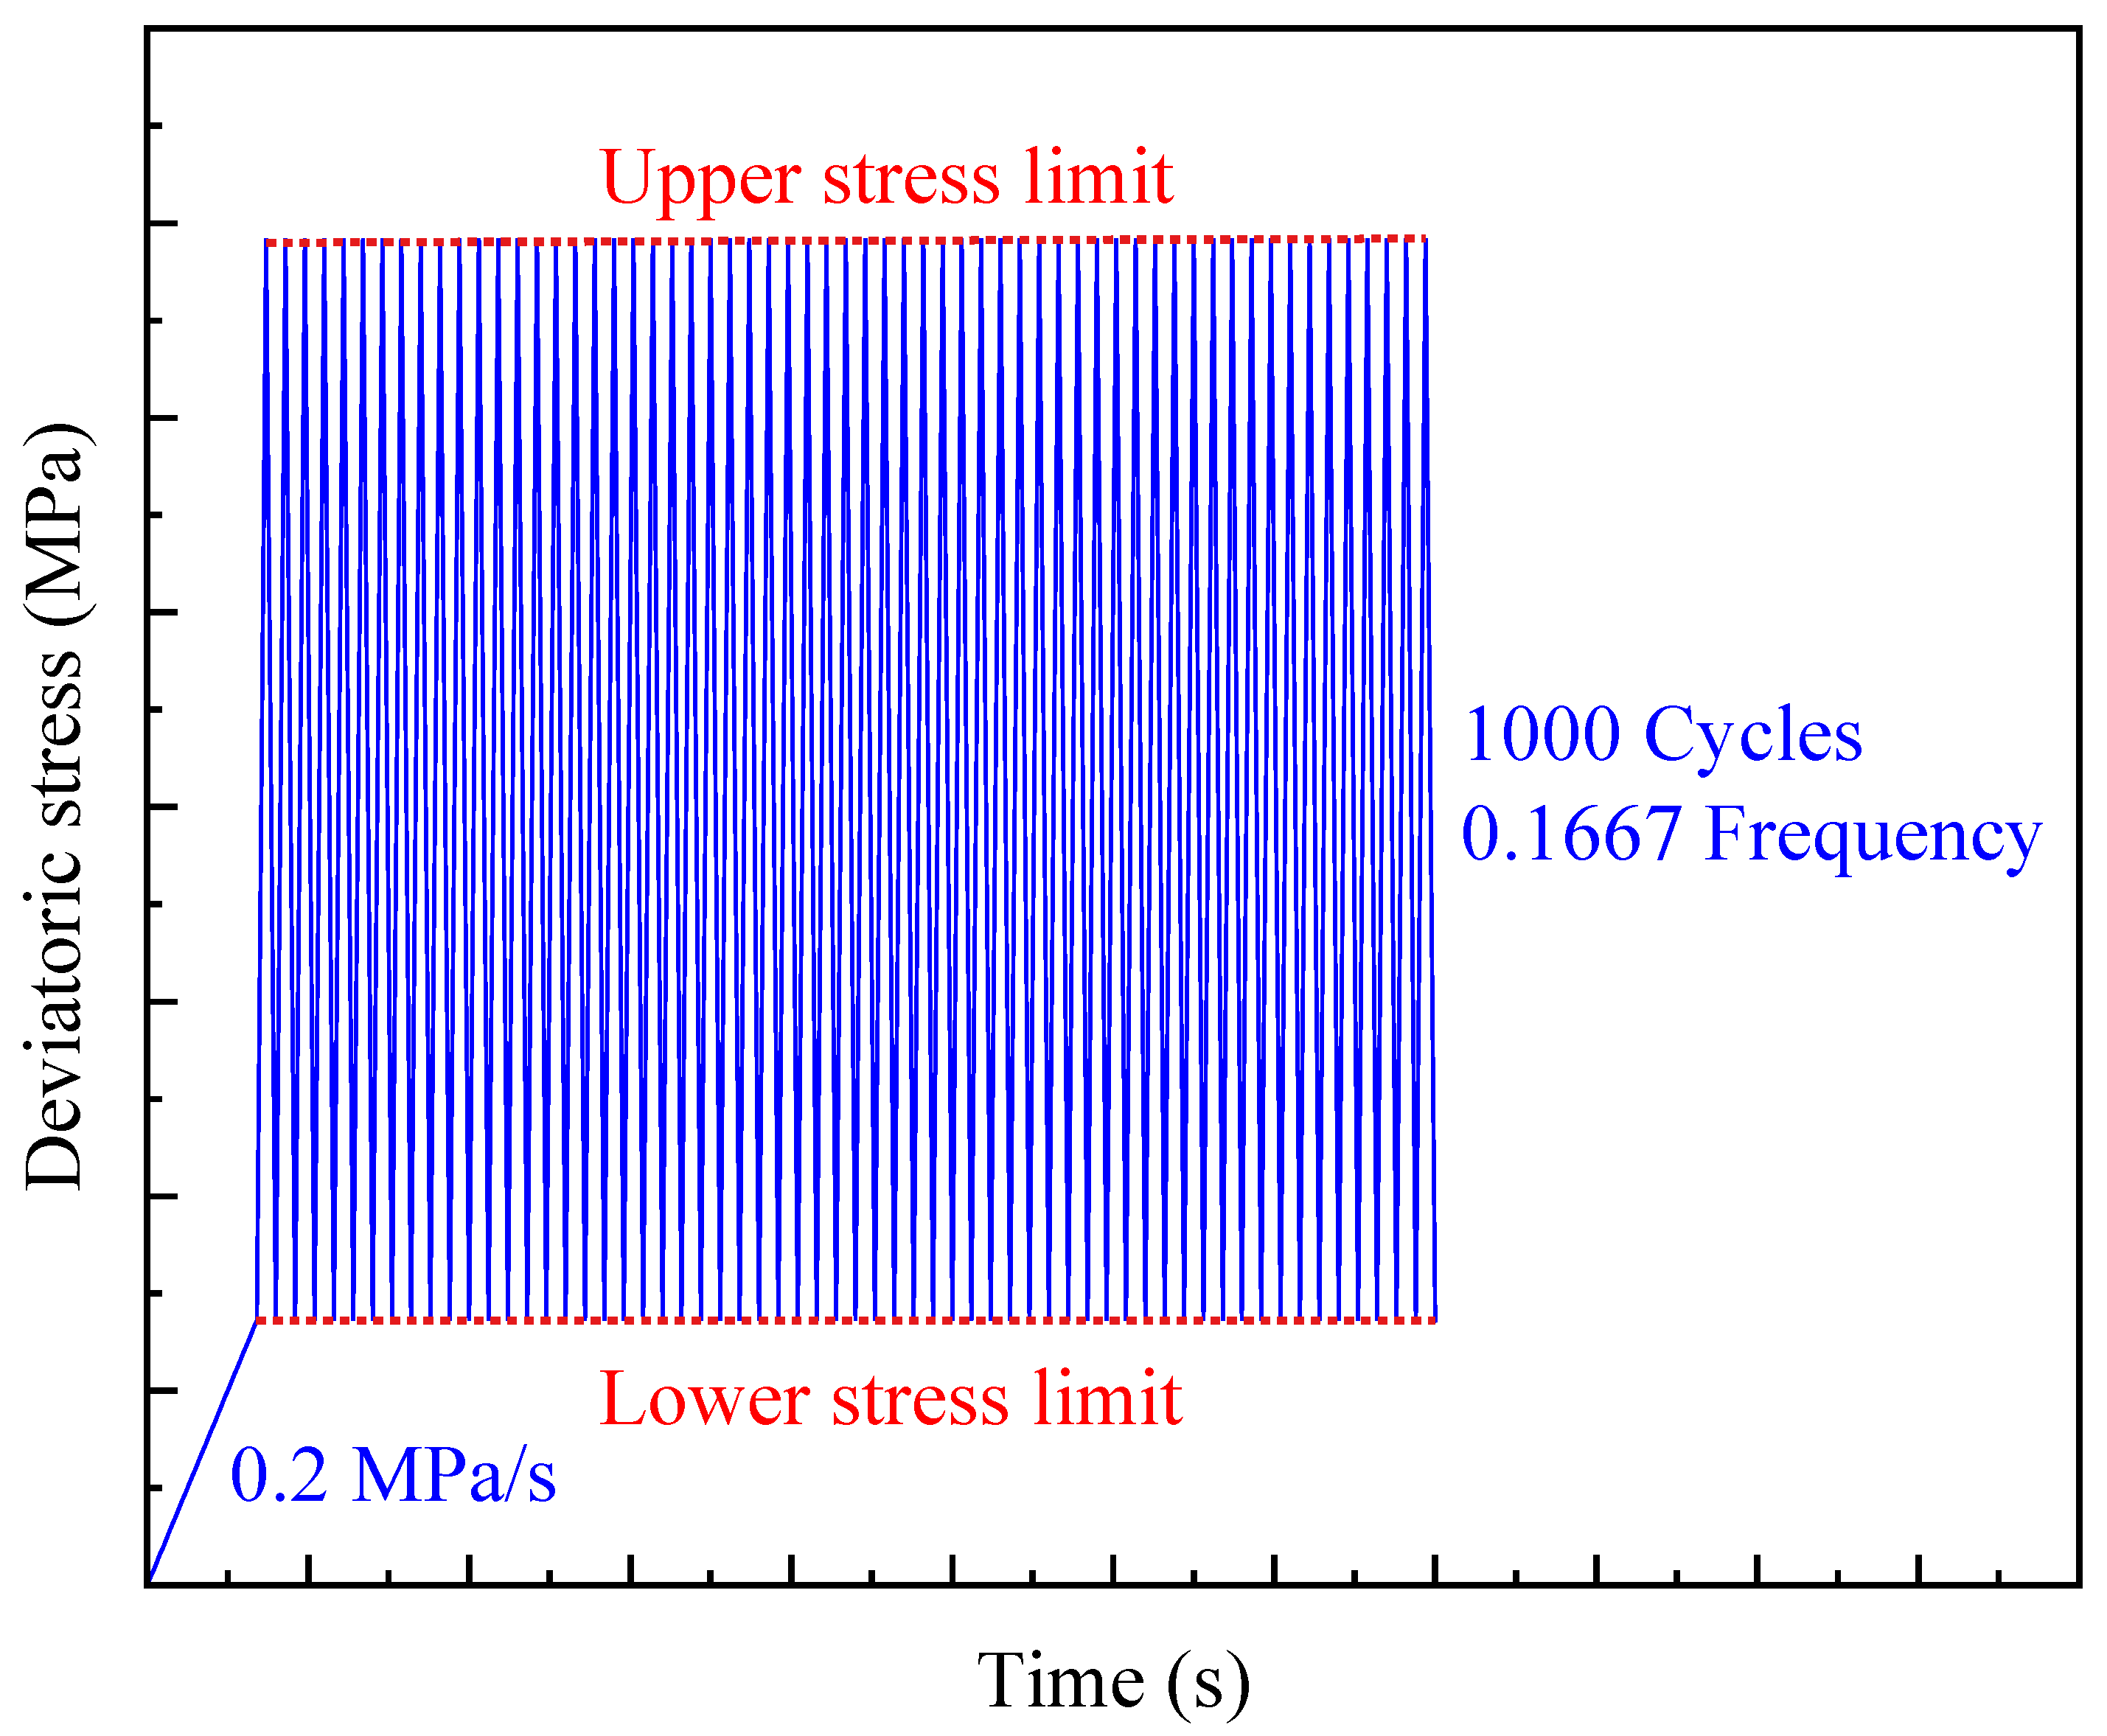
The present work aimed to clarify how temperature affects damage evolution in cement specimens under cyclic loading. Specimens were cured and tested at four temperatures (25 °C, 60 °C, 90 °C, and 115 °C). To reproduce the frequent pressure variations acting on the cement sheath during service, a triangular waveform was adopted to control the loading–unloading process, and one complete loading–unloading sequence was defined as one cycle. All fatigue tests were performed at a cyclic frequency of 0.1667 Hz for 1000 cycles. The cyclic stress limits were kept as constant absolute values, corresponding to 50% and 10% of the peak deviatoric stress measured at 25 °C. The loading path is illustrated in Figure 3.
Figure 3.
Loading path for fatigue test.
The cyclic loading–unloading tests were conducted under stress control using the following procedure:
- (1)
- The specimen was installed in the triaxial chamber, after which the temperature and confining pressure were increased to the target values;
- (2)
- Axial stress was applied at 0.2 MPa/s until reaching the prescribed lower stress limit (6.9 MPa, i.e., 10% of the peak deviatoric stress at 25 °C);
- (3)
- During the fatigue stage, the specimen was repeatedly loaded from the lower limit to the predetermined upper limit and then unloaded back to the lower limit for each cycle. The detailed experimental program is summarized in Table 2.Table 2. The detailed experimental program.
2.2.4. Triaxial Compression Test
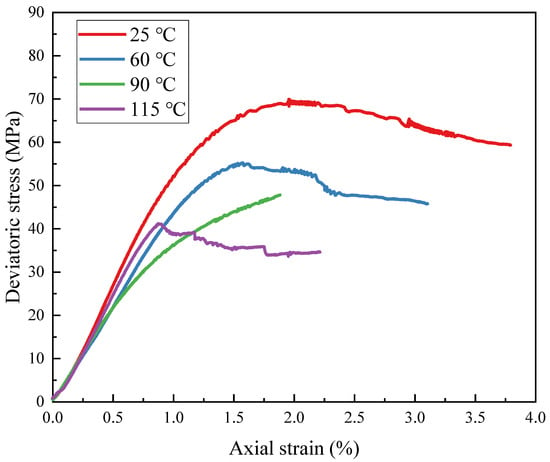
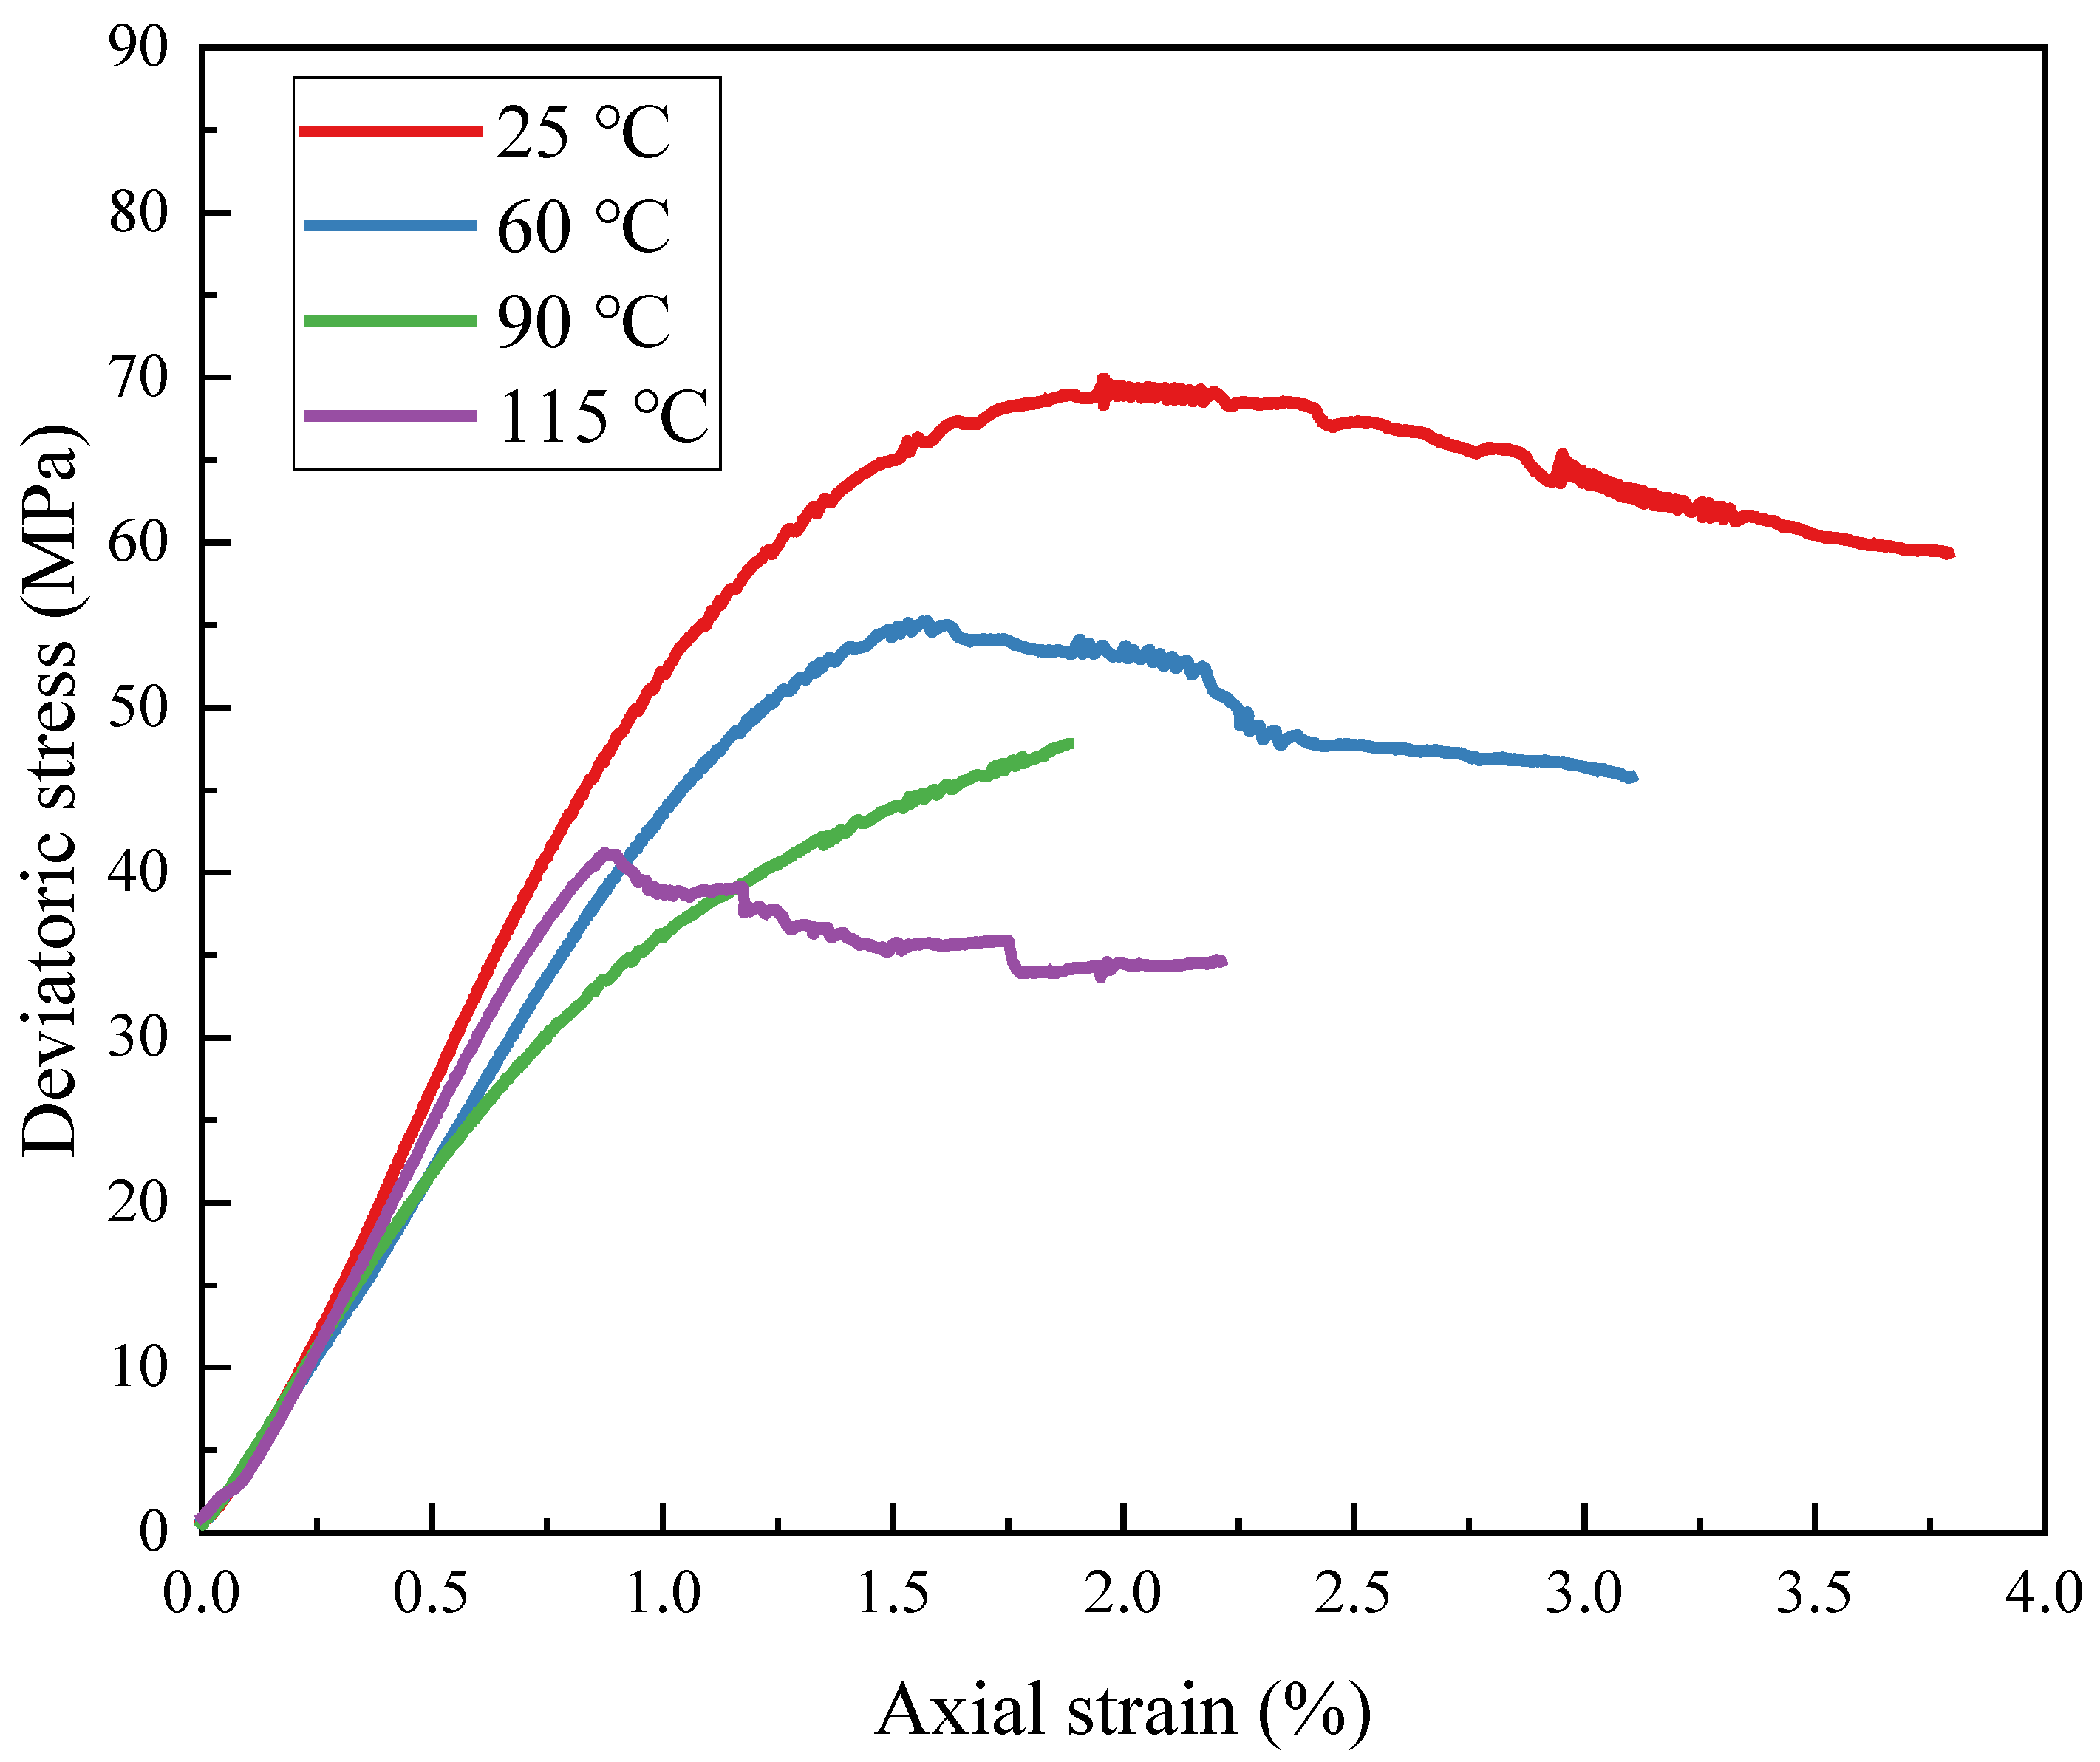
Before performing the cyclic loading–unloading experiments, the fundamental mechanical behavior of the cement specimens at different temperatures was first characterized. After curing, triaxial compression tests were carried out under a constant confining pressure of 20 MPa at 25 °C, 60 °C, 90 °C, and 115 °C. The representative stress–strain responses obtained at these temperatures are presented in Figure 4. The PDS values measured were 69.12 MPa at 25 °C, 54.98 MPa at 60 °C, 47.82 MPa at 90 °C, and 41.13 MPa at 115 °C. The results indicate that with increasing temperature, the strength gradually decreases, showing a maximum reduction of 40.49% at 115 °C compared to the strength at 25 °C. Based on the PDS value at 25 °C, the upper and lower stress limits for the subsequent cyclic loading and unloading tests were set at 50% (34.6 MPa) and 10% (6.9 MPa) of this strength, respectively.
Figure 4.
Stress–strain curve of triaxial compression test under different temperatures.
3. Results and Analysis
3.1. Stress–Strain Curve
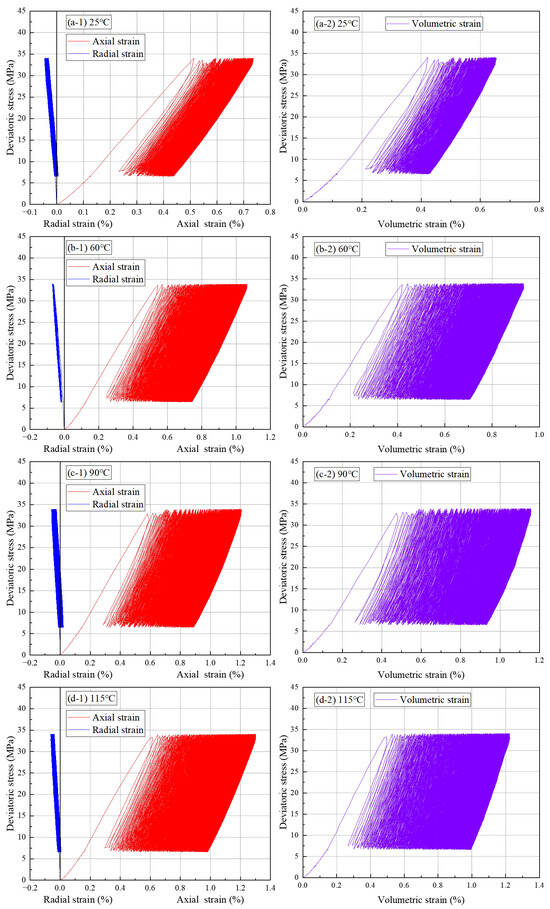
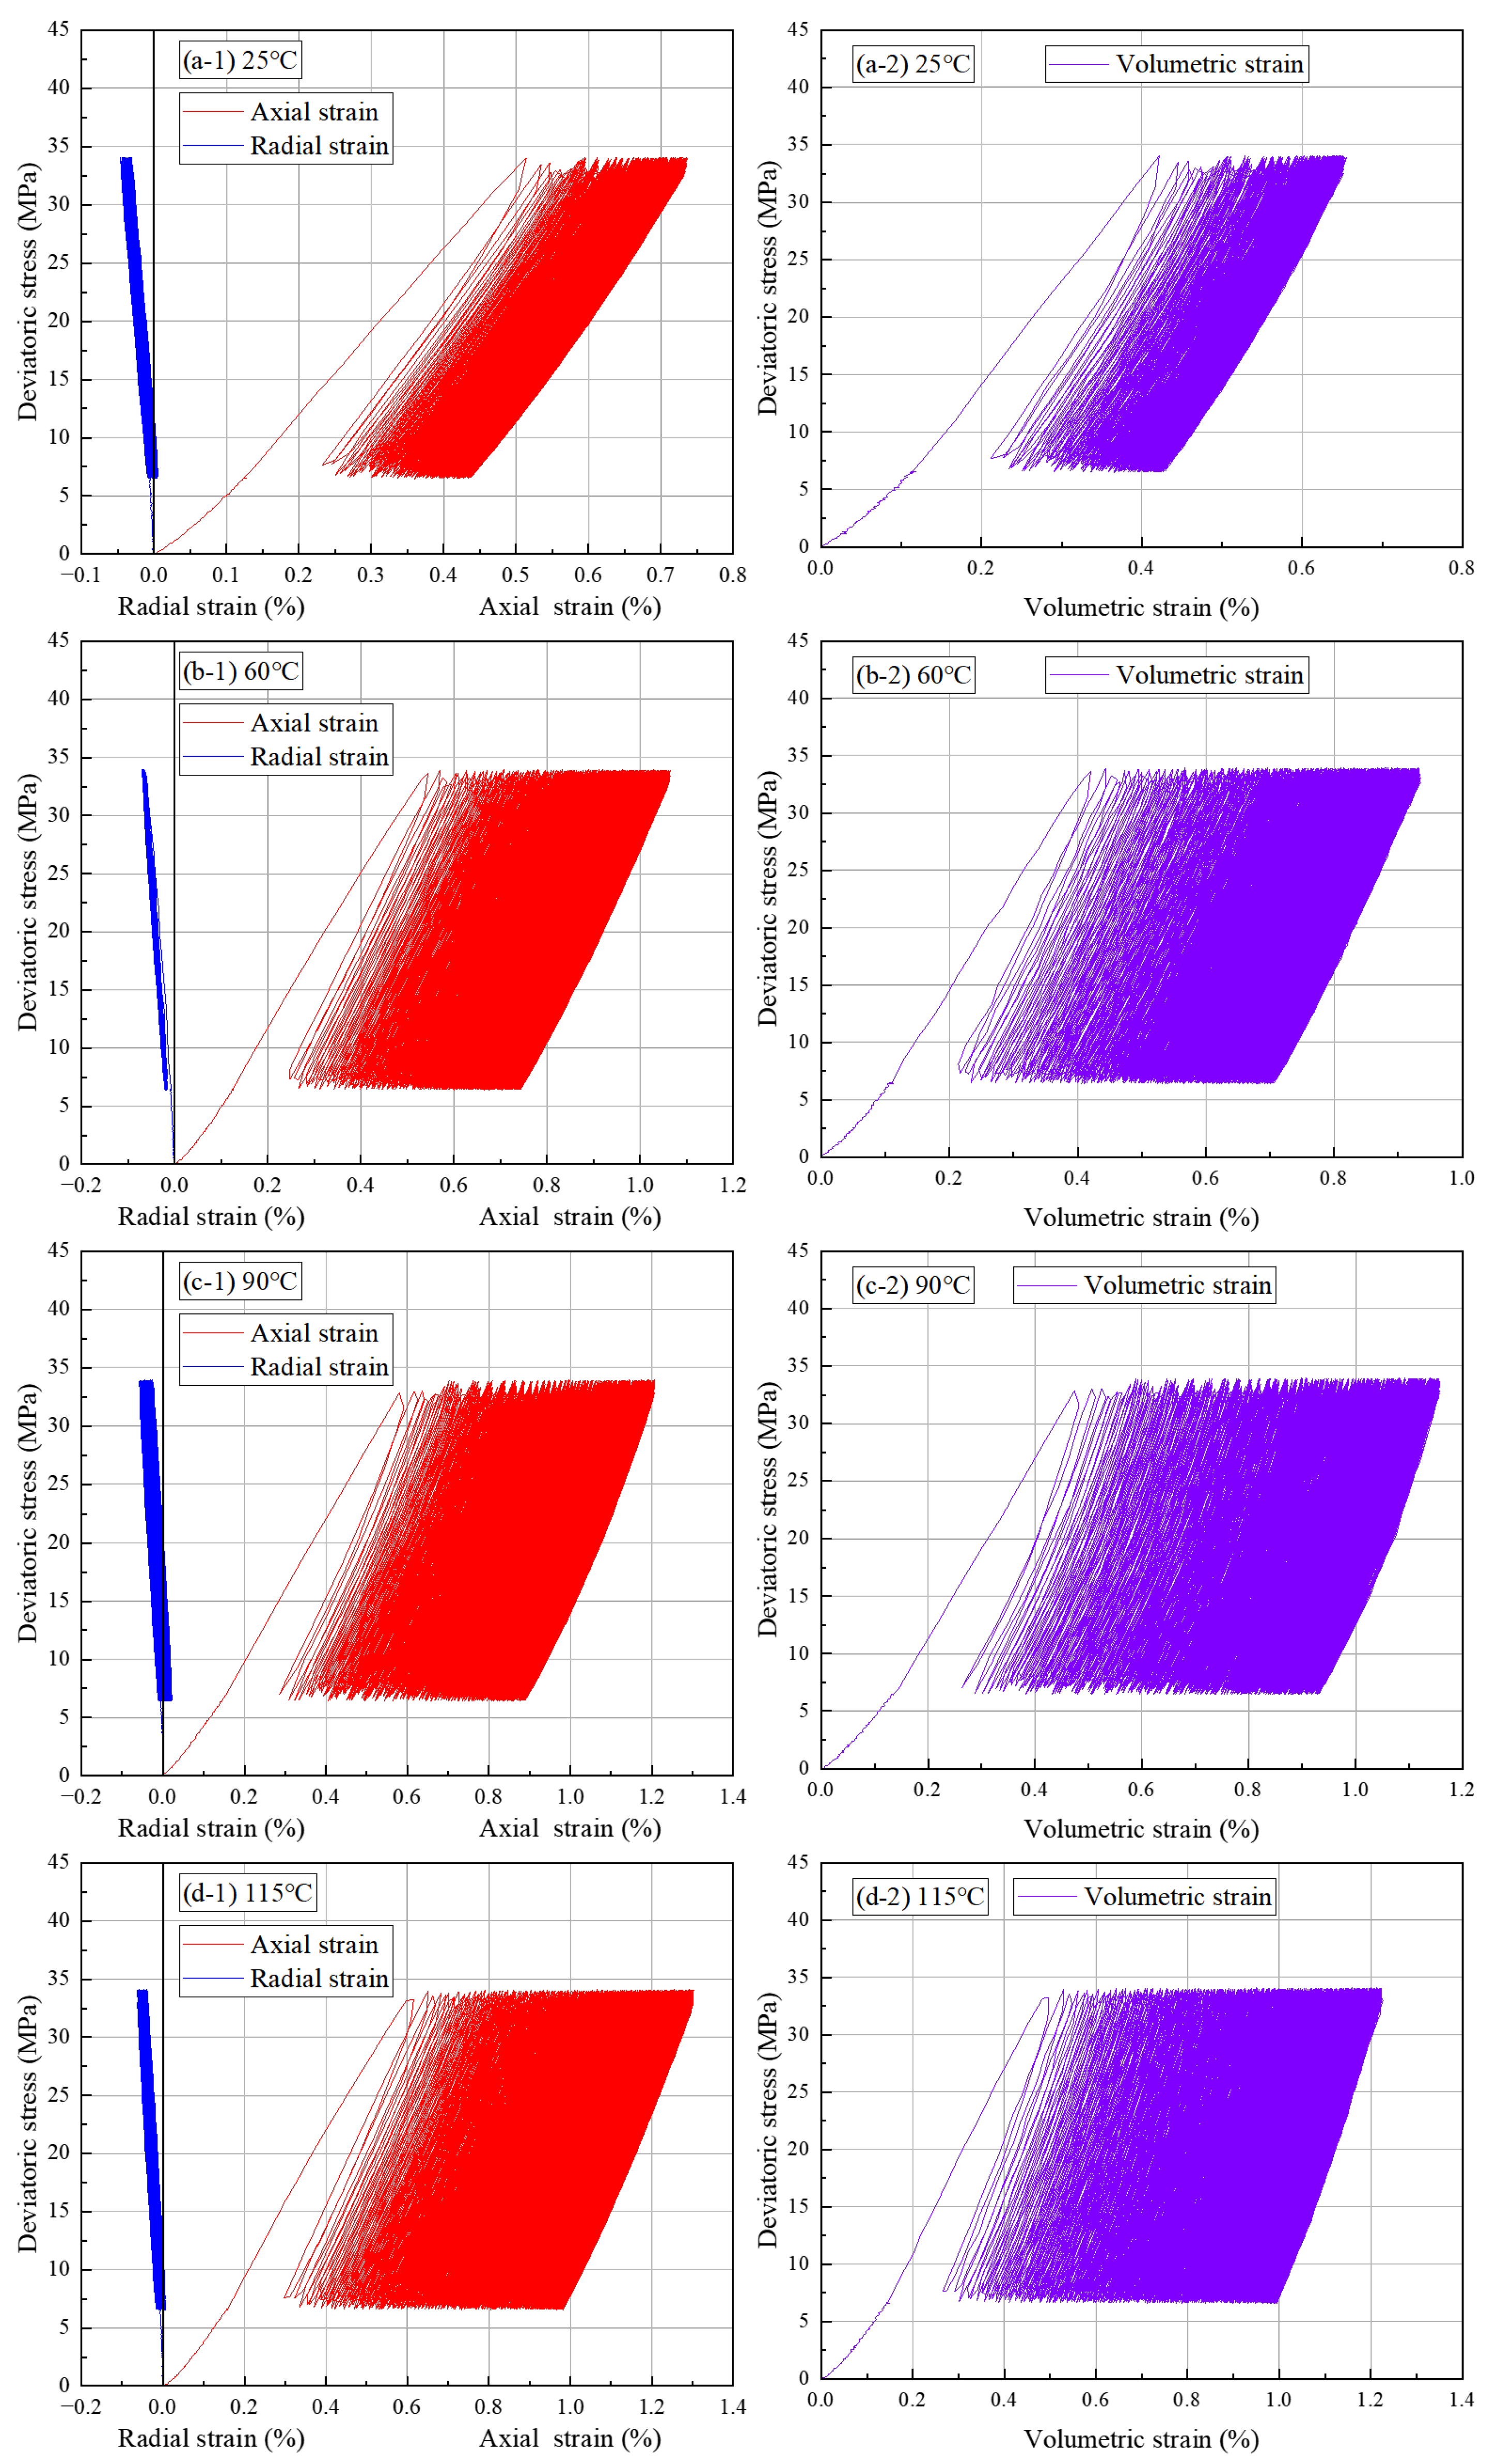
Figure 5 presents the stress–strain curves of cement specimens under different temperatures. Volumetric strain, a key parameter characterizing the overall deformation behavior of the specimen, can be calculated from the axial and radial strains.
Figure 5.
Stress–strain curve of fatigue test under different temperatures: (a) 25 °C; (b) 60 °C; (c) 90 °C and (d) 115 °C.
During cyclic loading and unloading, the stress–strain curves did not coincide, forming typical hysteresis loops. As the number of cycles increased, the distribution of hysteresis loops evolved from sparse to progressively denser, a pattern particularly evident in the axial and volumetric strain curves. In the initial few cycles, the stress rose rapidly, compacting the inherent pores and micro-cracks within the specimen, generating substantial irreversible deformation and resulting in a significantly larger hysteresis loop area.
As the number of cycles continued to increase, the deformation behavior of the specimen gradually entered a stable stage. This stage was macroscopically characterized by more closely spaced stress–strain curves and increasingly consistent hysteresis loop shapes. At this point, the deformation rate of the specimen decreased significantly, and the strain increment gradually stabilized. This indicates that its internal microstructure had undergone a stage of reorganization: the initial pores and fractures were essentially closed due to compaction, while new microcracks continuously initiated and propagated under the sustained action of cyclic loading. These two competing mechanisms collectively constituted a dynamically balanced damage evolution process.
As the temperature increased, the deformation of the specimen increased significantly. Taking the final volumetric strain as an example, when the curing and testing temperature rose from 25 °C to 115 °C, the volumetric strain increased from 0.43% to 0.99%, representing a relative increase of 130.23%. This is primarily attributed to the dual weakening effect of elevated temperature on the material’s microstructure. On the one hand, higher temperatures within the investigated range accelerate dehydration of the cementitious system, weakening the bonding strength between particles. On the other hand, thermal activation promotes plastic slip, leading to a reduction in the overall strength of the material. Consequently, under the same upper stress limit, the increase in temperature more readily induces damage accumulation and deformation development.
3.2. Accumulated Peak/Plastic Strain
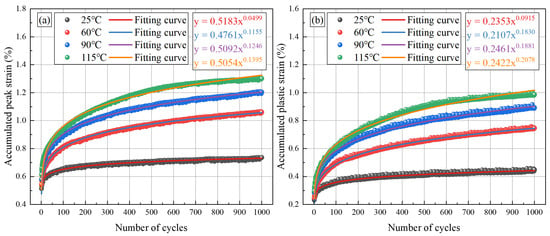
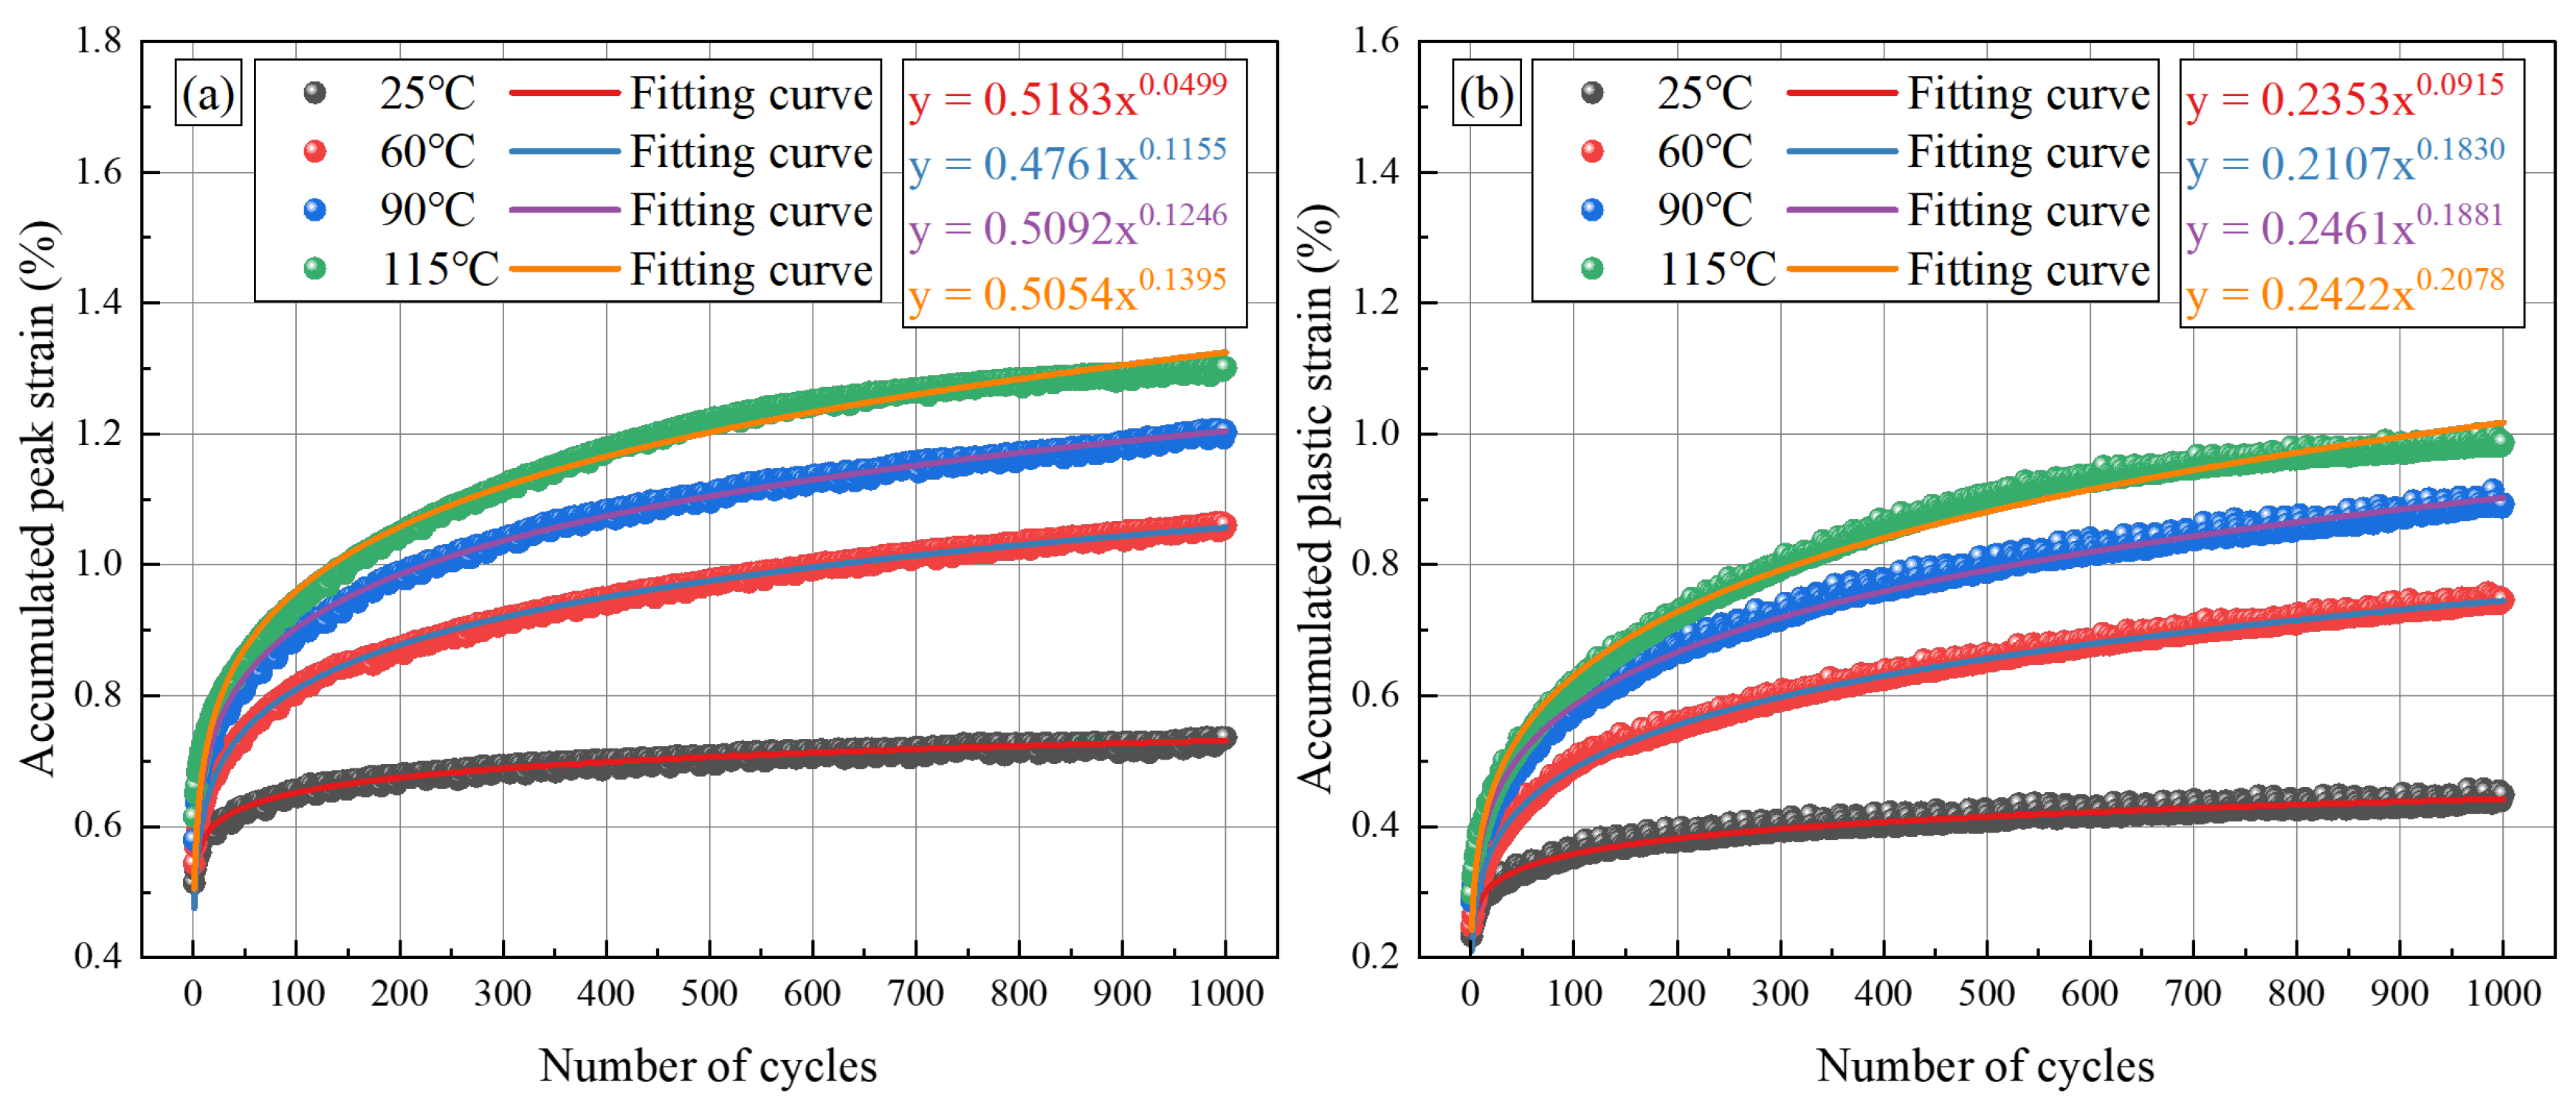
During cyclic loading, cement specimens undergo both elastic and plastic deformation. In the unloading stage, the elastic component recovered, whereas the plastic component accumulated continuously. This accumulation of irreversible deformation is a key factor leading to the eventual failure of the material. As shown in Figure 6, with axial strain as the observed variable, the variations in accumulated peak/plastic strain with the number of cycles exhibit the following pattern: both increased rapidly during the initial cycles, followed by a gradual deceleration in growth rate, eventually stabilizing.
Figure 6.
Accumulated peak/plastic strain under different temperatures: (a) accumulated peak strain and (b) accumulated plastic strain.
Temperature exerted a significant influence on the development of accumulated peak/plastic strain. As the temperature increases from 25 °C to 115 °C, the cumulative peak strain rises from 0.74% to 1.30%, and the cumulative plastic strain increases from 0.45% to 0.99%. This is mainly because elevated temperature promoted the decomposition of internal hydration products and the propagation of microcracks, making the material more prone to plastic slip and accumulated deformation under stress.
To characterize the evolution of accumulated peak/plastic strain with the number of cycles, a power function model was employed for fitting, with the results presented in Figure 6 and Table 3. The coefficients of determination (R2) for all fits exceeded 0.75, indicating that the power function satisfactorily describes the development of accumulated peak/plastic strain. As the temperature increased from 25 °C to 115 °C, the exponents of the power function for cumulative peak strain and cumulative plastic strain increased from 0.05 and 0.09 to 0.14 and 0.21, respectively. The rise in exponent values indicates an accelerated growth rate of strain with cycles under elevated temperature, reflecting faster internal damage evolution and a continuous deterioration of the material’s resistance to deformation.
Table 3.
Fitting equation for accumulated peak/plastic strain.
3.3. Energy Density
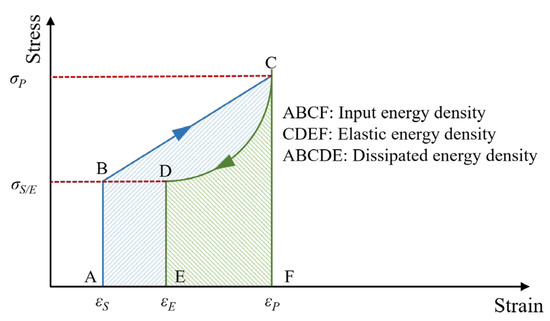
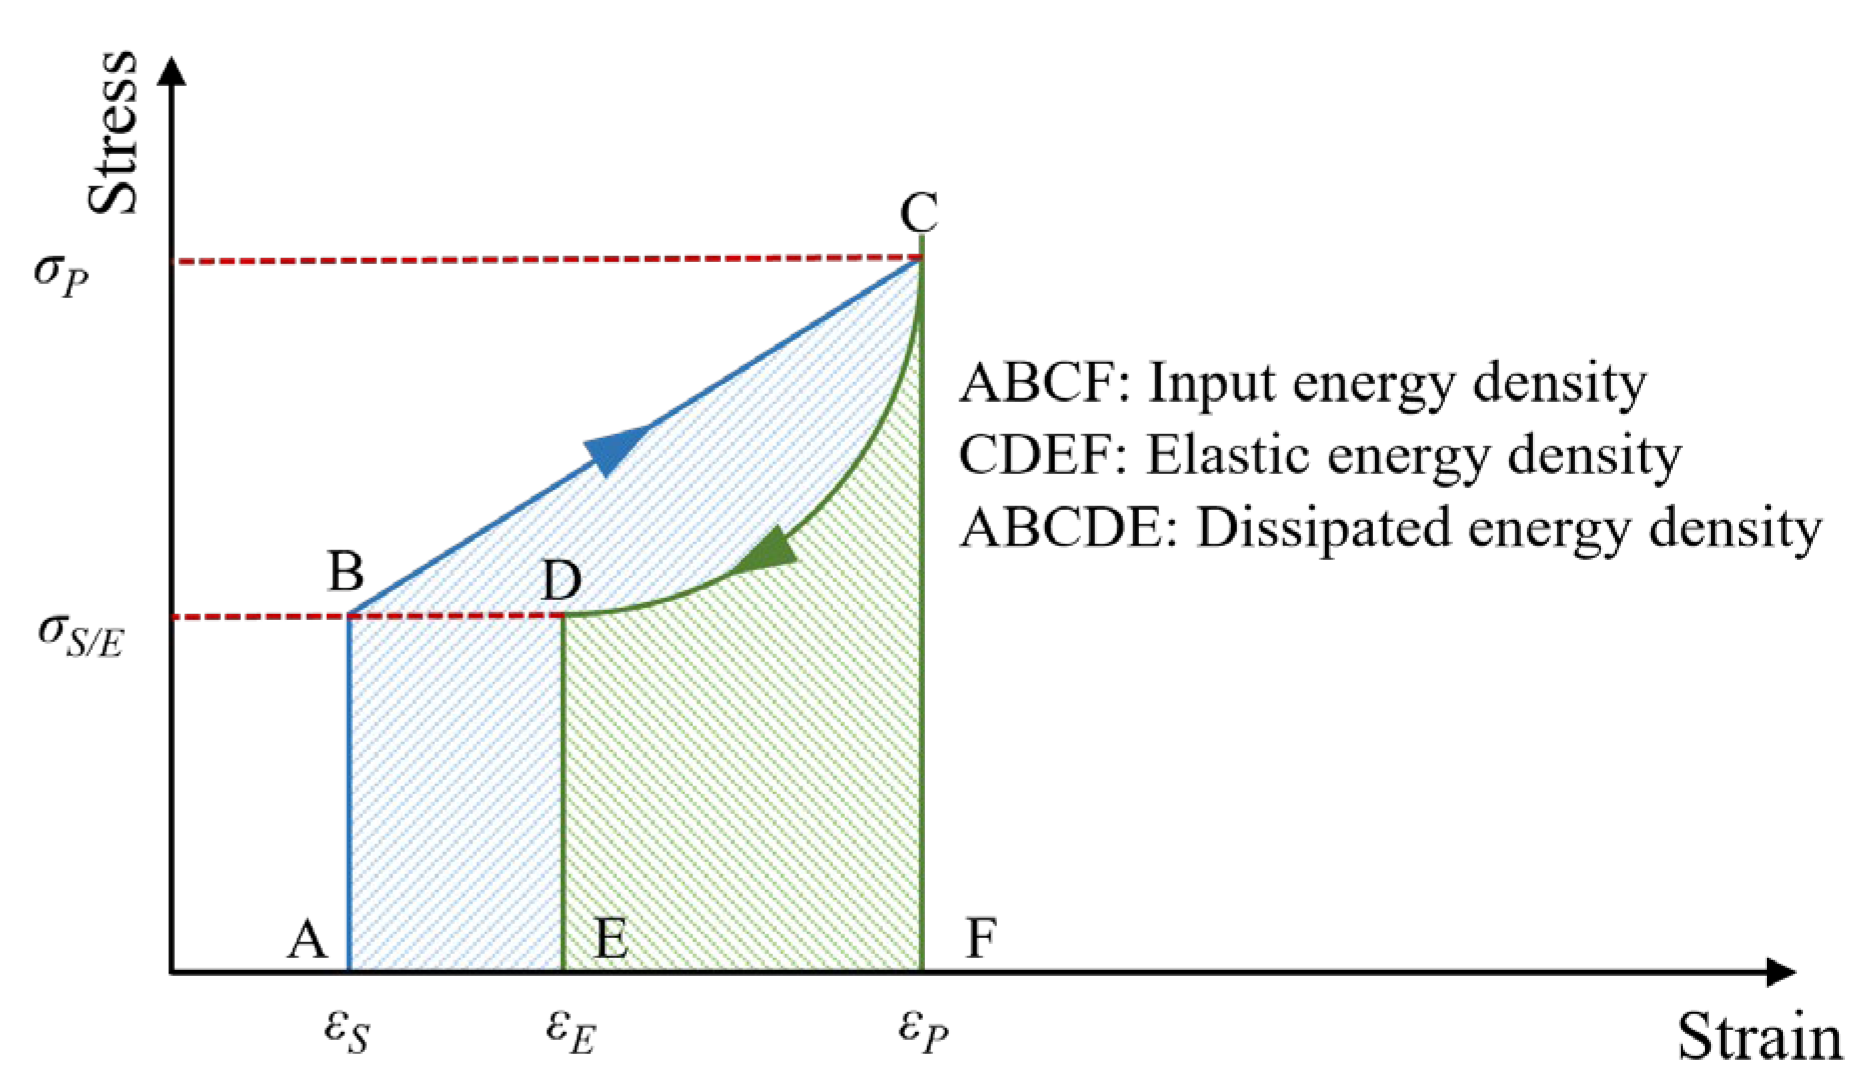
Cyclic loading–unloading failure in cement specimens is fundamentally governed by the evolution of mechanical energy, including input energy, elastic energy, and dissipated energy. Accordingly, tracking the energy partition during each loading–unloading cycle provides a clearer basis for interpreting the underlying damage and failure mechanisms. For the purpose of energy analysis, the specimen is treated as an approximately adiabatic system, and any heat transfer or other energy exchange with the surrounding environment is neglected during the loading process. According to the law of energy conservation and under adiabatic conditions, the input energy from external loading equals the sum of the stored elastic energy and the dissipated energy consumed by the closure or propagation of microcracks.
where U is the input energy, Ue is the elastic energy, and Ud is the dissipated energy.
The above formula can be replaced by the integral form of energy density:
The energy density is determined by integrating the area enclosed by the loading and unloading segments of the stress–strain curve, as illustrated in Figure 7. In the figure, the areas of regions ABCF, CDEF, and ABCDE represent the input energy density, elastic energy density, and dissipated energy density, respectively. The area of each region (i.e., the corresponding energy density) is calculated using the following equation:
Figure 7.
Stress–strain curve and energy density diagram for the i-th cycle.
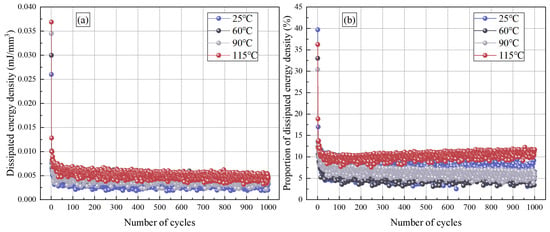
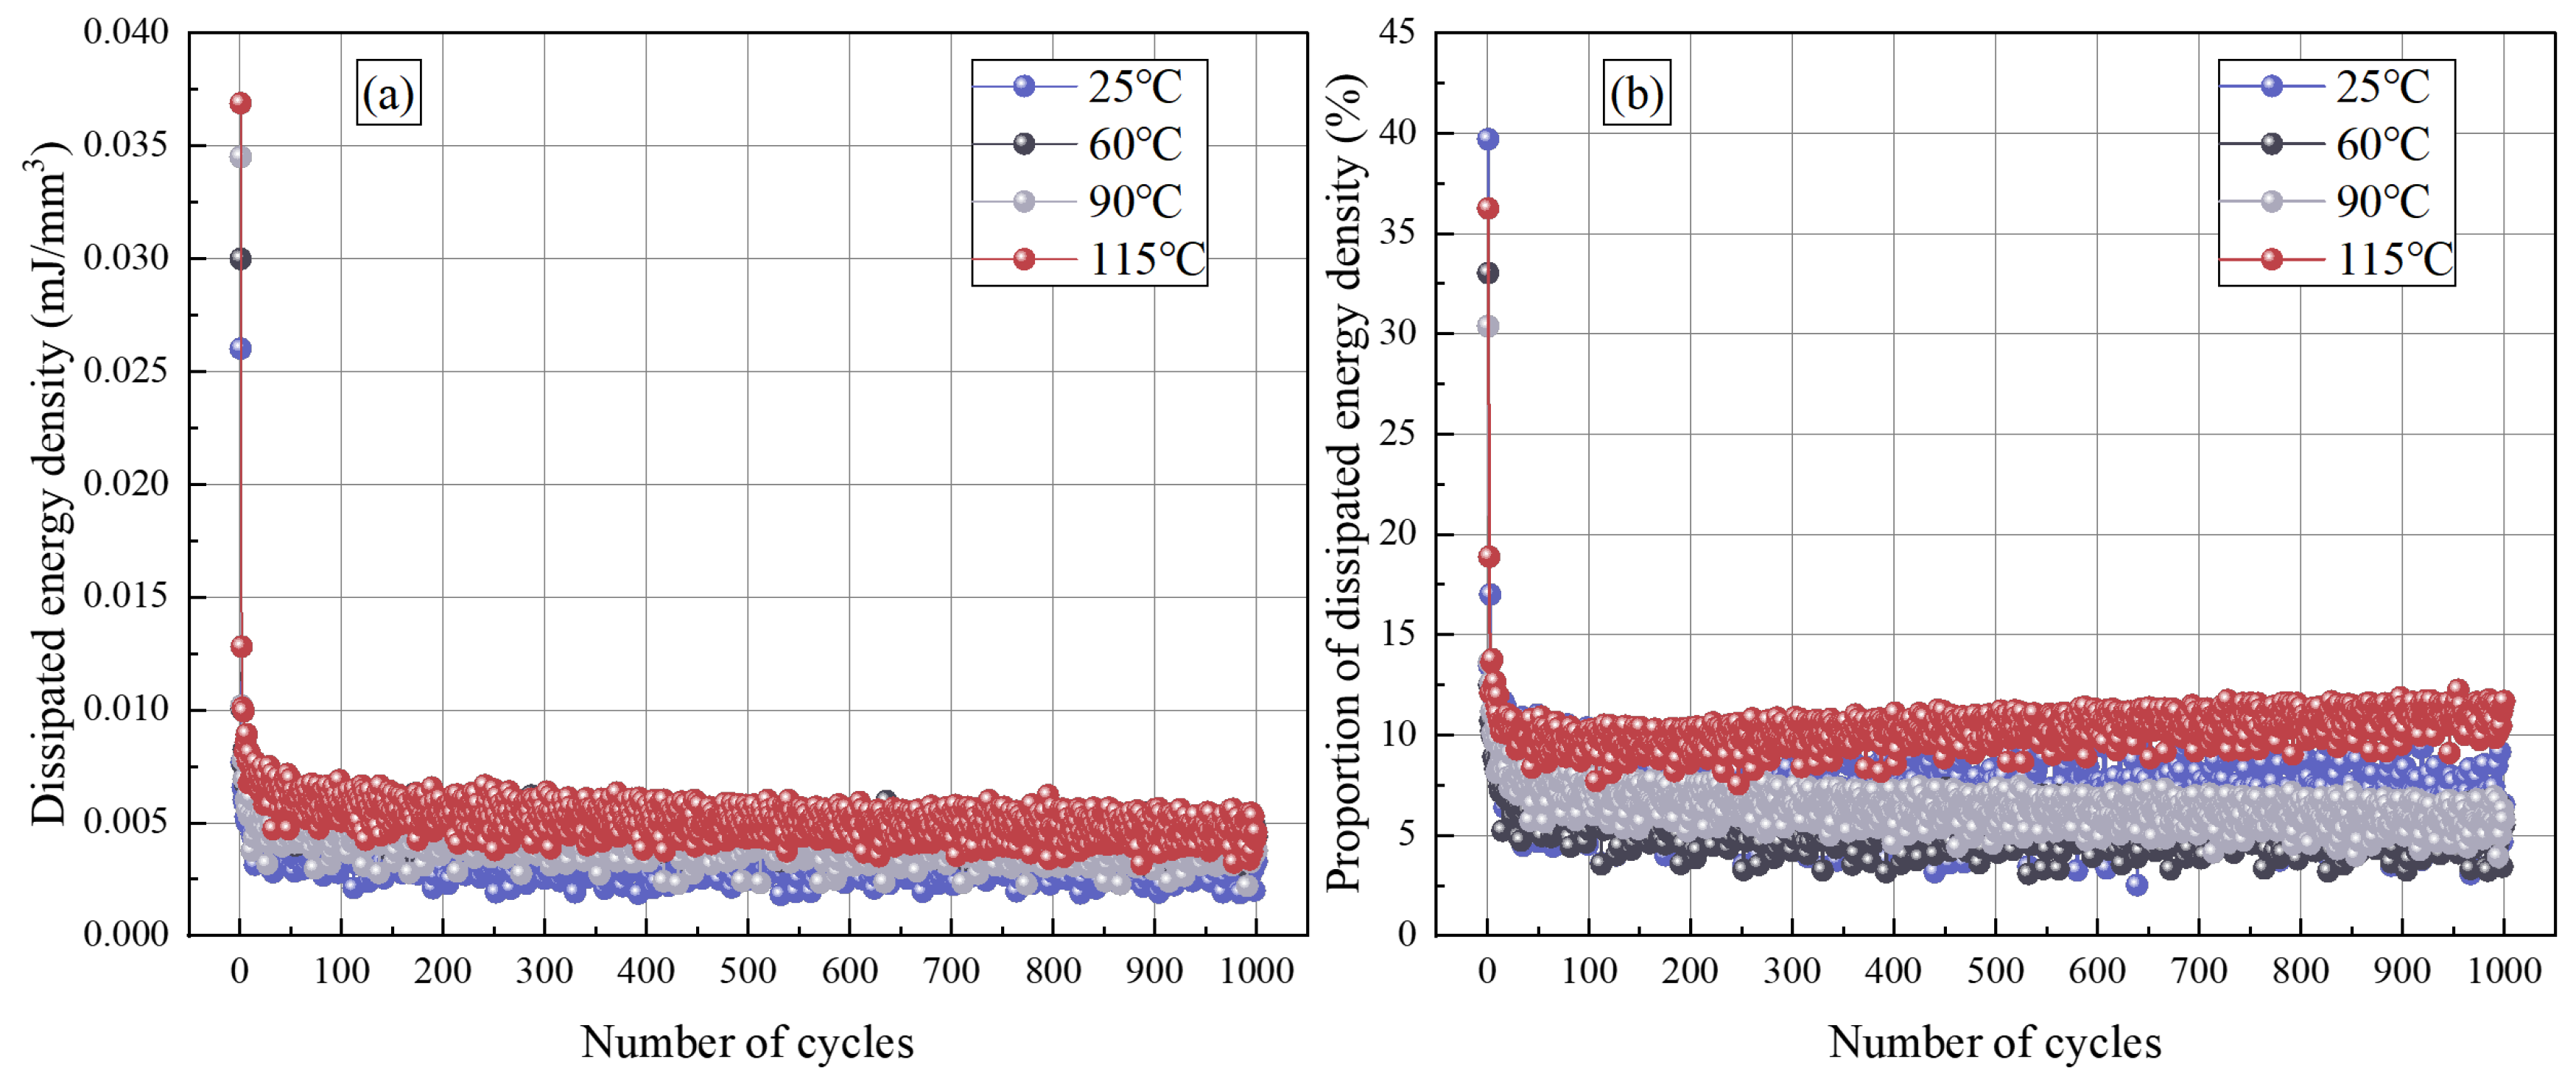
Figure 8 illustrates the evolution of the dissipated energy density and its proportion relative to the input energy density. It can be observed that both the dissipated energy density and its proportion reach their maximum values in the first cycle, and then gradually decrease and eventually stabilize. This is primarily because, during the first cycle, the initial micro-pores and weak interfaces within the cement specimen undergo rapid compaction and sliding, resulting in significant inelastic energy dissipation. As the number of cycles increases, the internal structure of the material gradually adjusts due to accumulated damage, reaching a stable state. At this stage, the additional damage incurred per cycle decreases, leading to a corresponding stabilization in energy dissipation behavior.
Figure 8.
Dissipated energy density curve and proportion under different temperatures: (a) dissipated energy density and (b) proportion of dissipated energy density.
With increasing temperature, both the dissipated energy density and its proportion show a gradual upward trend. Taking the values from the final stable stage as an example, when the temperature rises from 25 °C to 115 °C, the dissipated energy density increases from 0.0033 mJ/m3 to 0.0046 mJ/m3, and its proportion rises from 5.52% to 7.13%. This phenomenon can be attributed to the increased temperature, causing more pronounced plastic slip at the same stress level, resulting in a significant increase in dissipated energy.
3.4. Pore Size Distribution
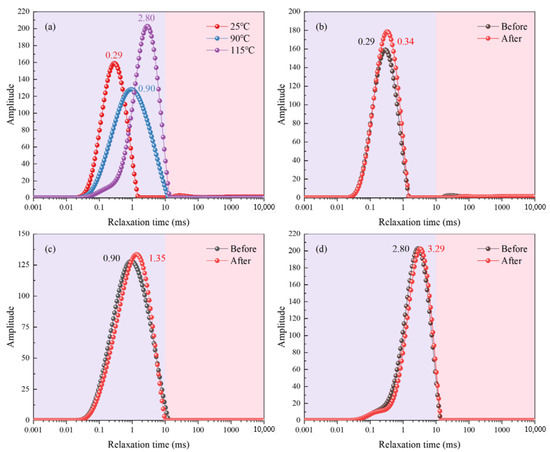
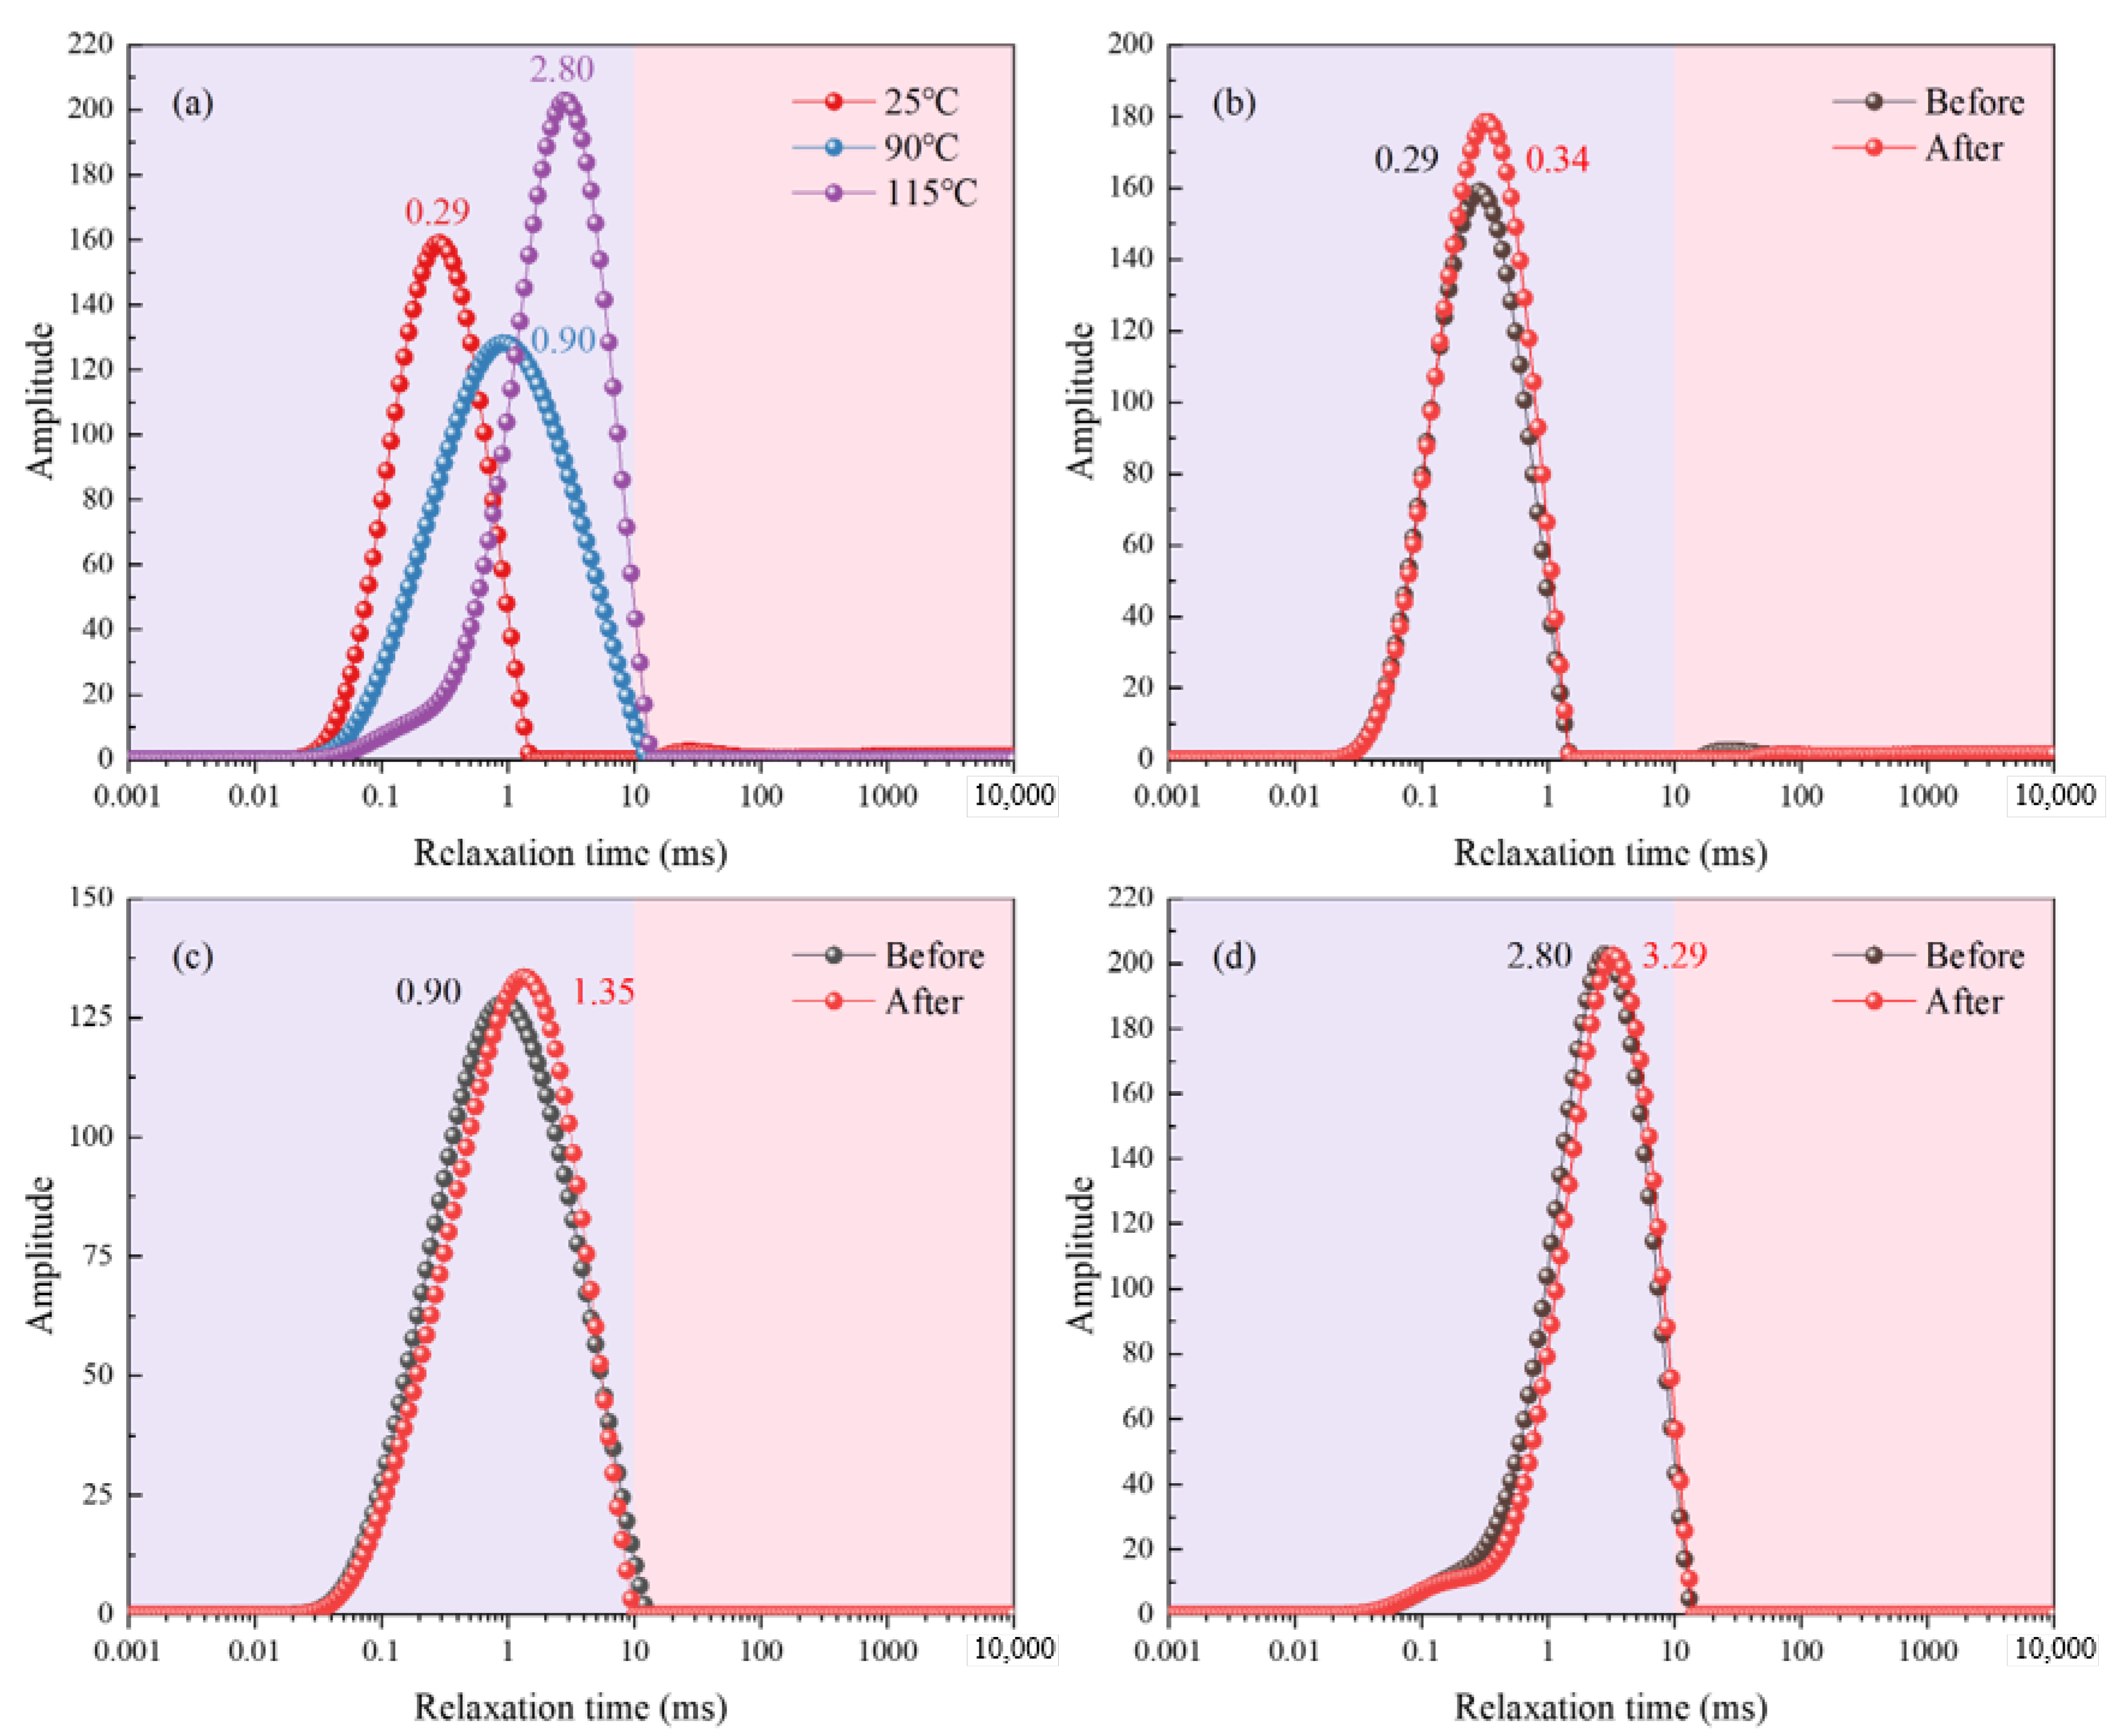
Nuclear magnetic resonance (NMR) relaxation time distributions can effectively characterize changes in the internal pore structure of materials. By comparing the T2 distributions before and after cyclic loading tests, the damage evolution induced by the formation of new microcracks can be revealed. Figure 9 presents the T2 distribution curves under different temperatures. According to the classification proposed by Yang et al., a T2 value less than 10 ms corresponds to small pores, whereas larger values indicate large pores.
Figure 9.
Nuclear magnetic resonance T2 spectrum values under different temperatures: (a) initial; (b) 25 °C; (c) 90 °C and (d) 115 °C.
Figure 9a presents the T2 relaxation time distribution curves for specimens cured at 25 °C, 90 °C, and 115 °C. The peak T2 values of all curves are below 10 ms, indicating that the pore structure of the cured cement samples is predominantly composed of small pores. As the curing temperature increases, the distribution curves progressively shift toward longer T2 values, with the peak T2 increasing from 0.29 ms to 0.90 ms and further to 2.80 ms. This shift demonstrates that higher curing temperatures promote the development of larger pores within the cement matrix. The coarsening of the pore structure provides a microstructural explanation for the corresponding decrease in the peak deviatoric stress observed with increasing temperature.
After cyclic loading tests, the T2 distributions of specimens under all temperatures exhibit a further rightward shift (Figure 9b–d). The peak T2 values increase from their initial states of 0.29 ms, 0.90 ms, and 2.80 ms to 0.34 ms, 1.35 ms, and 3.29 ms, respectively. This change clearly demonstrates that the cyclic loading–unloading process leads to the propagation and coalescence of pores (including microcracks) within the cement specimens, resulting in an enlargement of pore sizes. It is noteworthy that all post-test peak T2 values remain below 10 ms, indicating that the pore structure, even after cyclic loading, is still predominantly characterized by small pores.
3.5. Permeability
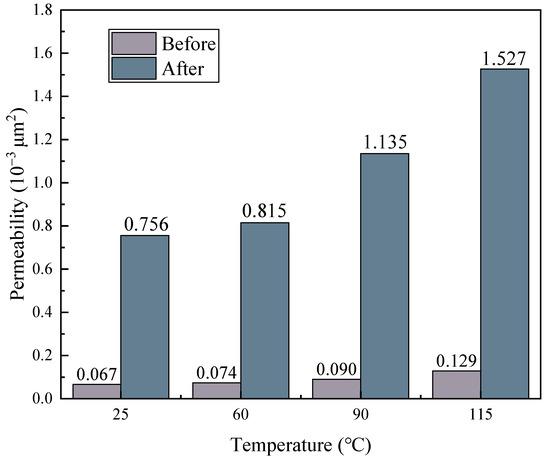
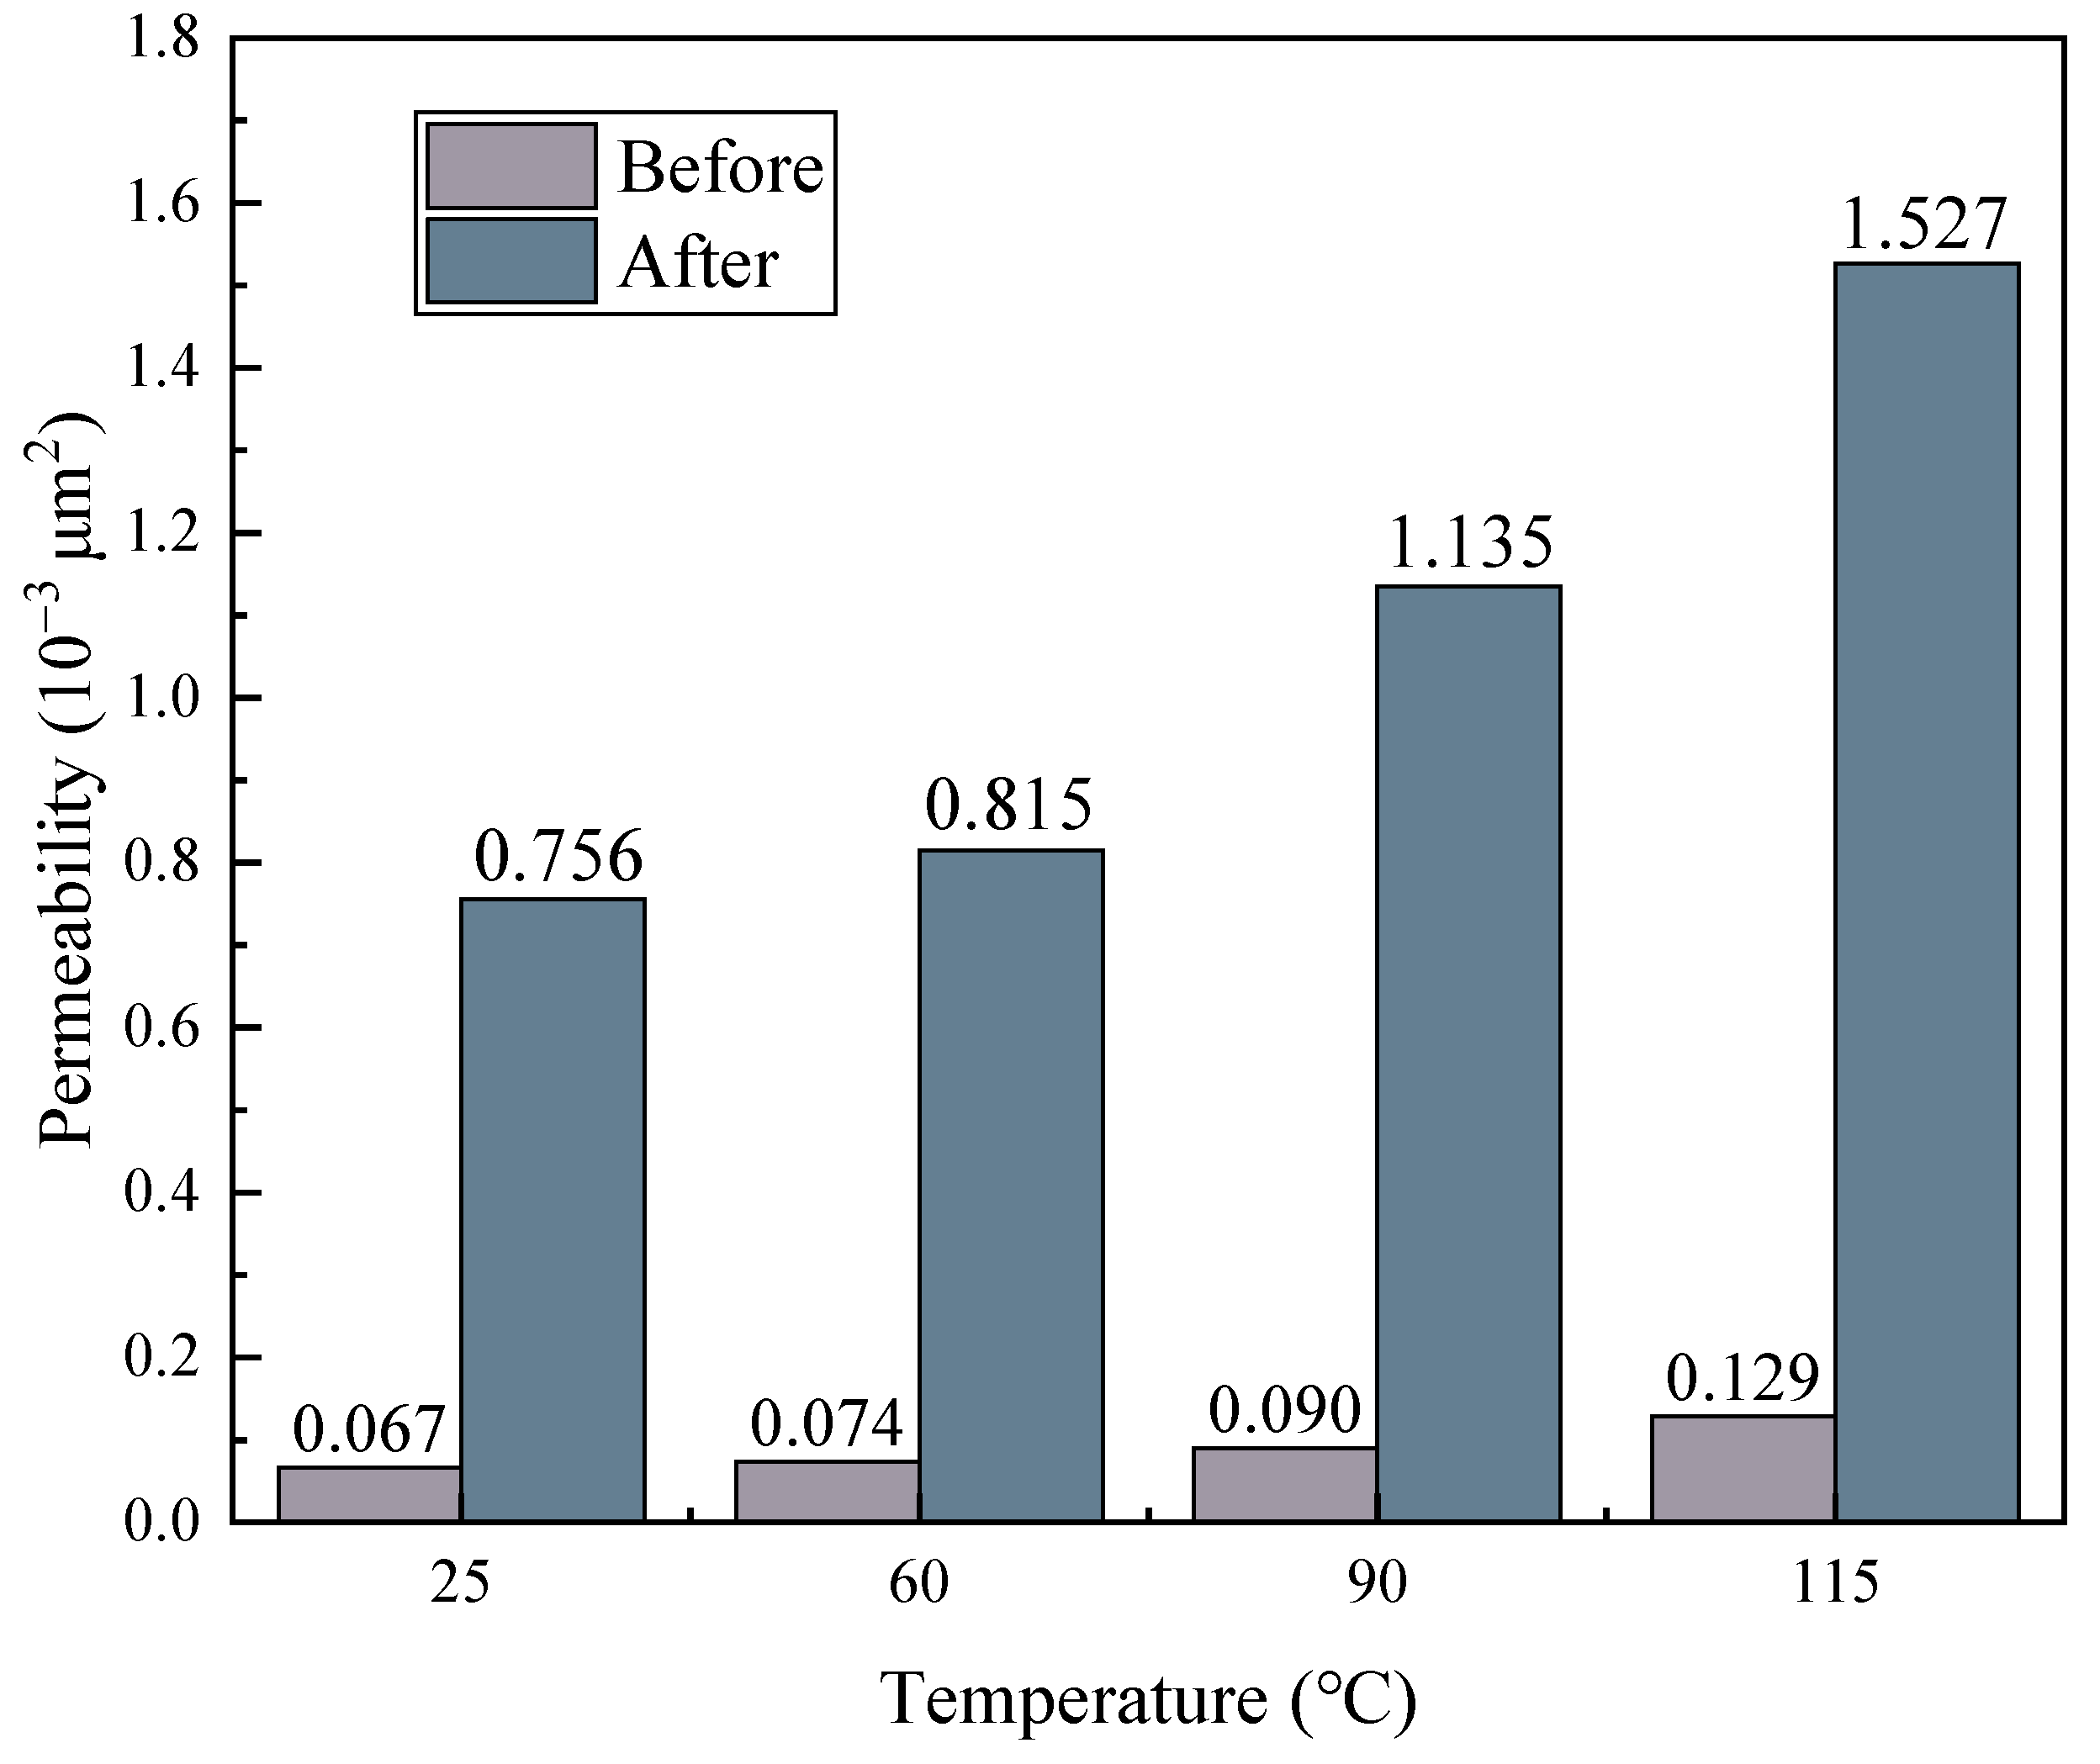
Figure 10 shows the variation in permeability of cement specimens before and after cyclic loading–unloading tests. It can be observed that after curing, the permeability gradually increases with rising curing temperature. Specifically, the permeability increases from 0.067 × 10⁻³ μm2 to 0.074 × 10⁻³ μm2, 0.090 × 10⁻³ μm2, and 0.129 × 10⁻³ μm2, corresponding to relative increments of 10.45%, 34.33%, and 92.54%, respectively. This indicates that higher temperatures lead to a looser internal microstructure and more developed seepage channels in the cement, thereby enhancing its fluid permeability.
Figure 10.
Permeability values under different temperatures.
After the cyclic loading–unloading tests, the permeability of all specimens increased, with the extent of increase growing alongside temperature. The permeability values rose to 0.756 × 10⁻³ μm2, 0.815 × 10⁻³ μm2, 1.135 × 10⁻³ μm2, and 1.527 × 10⁻³ μm2, respectively. Among these, the absolute increase in permeability was smallest at 25 °C (0.689 × 10⁻³ μm2) and largest at 115 °C (1.398 × 10⁻³ μm2). This difference is primarily attributed to variations in the initial compactness and strength of the specimens. The specimen cured at 25 °C possesses the densest structure and highest strength, thus sustaining relatively minor damage under cyclic loading. In contrast, the specimen cured at 115 °C, due to its lower initial strength, experiences more significant damage accumulation during cyclic loading, resulting in the formation of more pores and microcracks and a consequent substantial increase in permeability.
The permeability evolution observed in this study is consistent with trends reported in previous experimental investigations on cementitious and rock-like materials subjected to cyclic loading. For example, Kozhevnikov et al. [33] investigated permeability changes under cyclic confining pressure and demonstrated that repeated loading–unloading promotes progressive pore opening and microcrack connectivity, leading to irreversible permeability enhancement.
3.6. CT Results
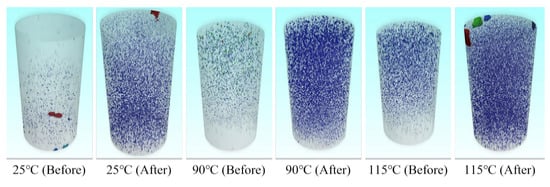
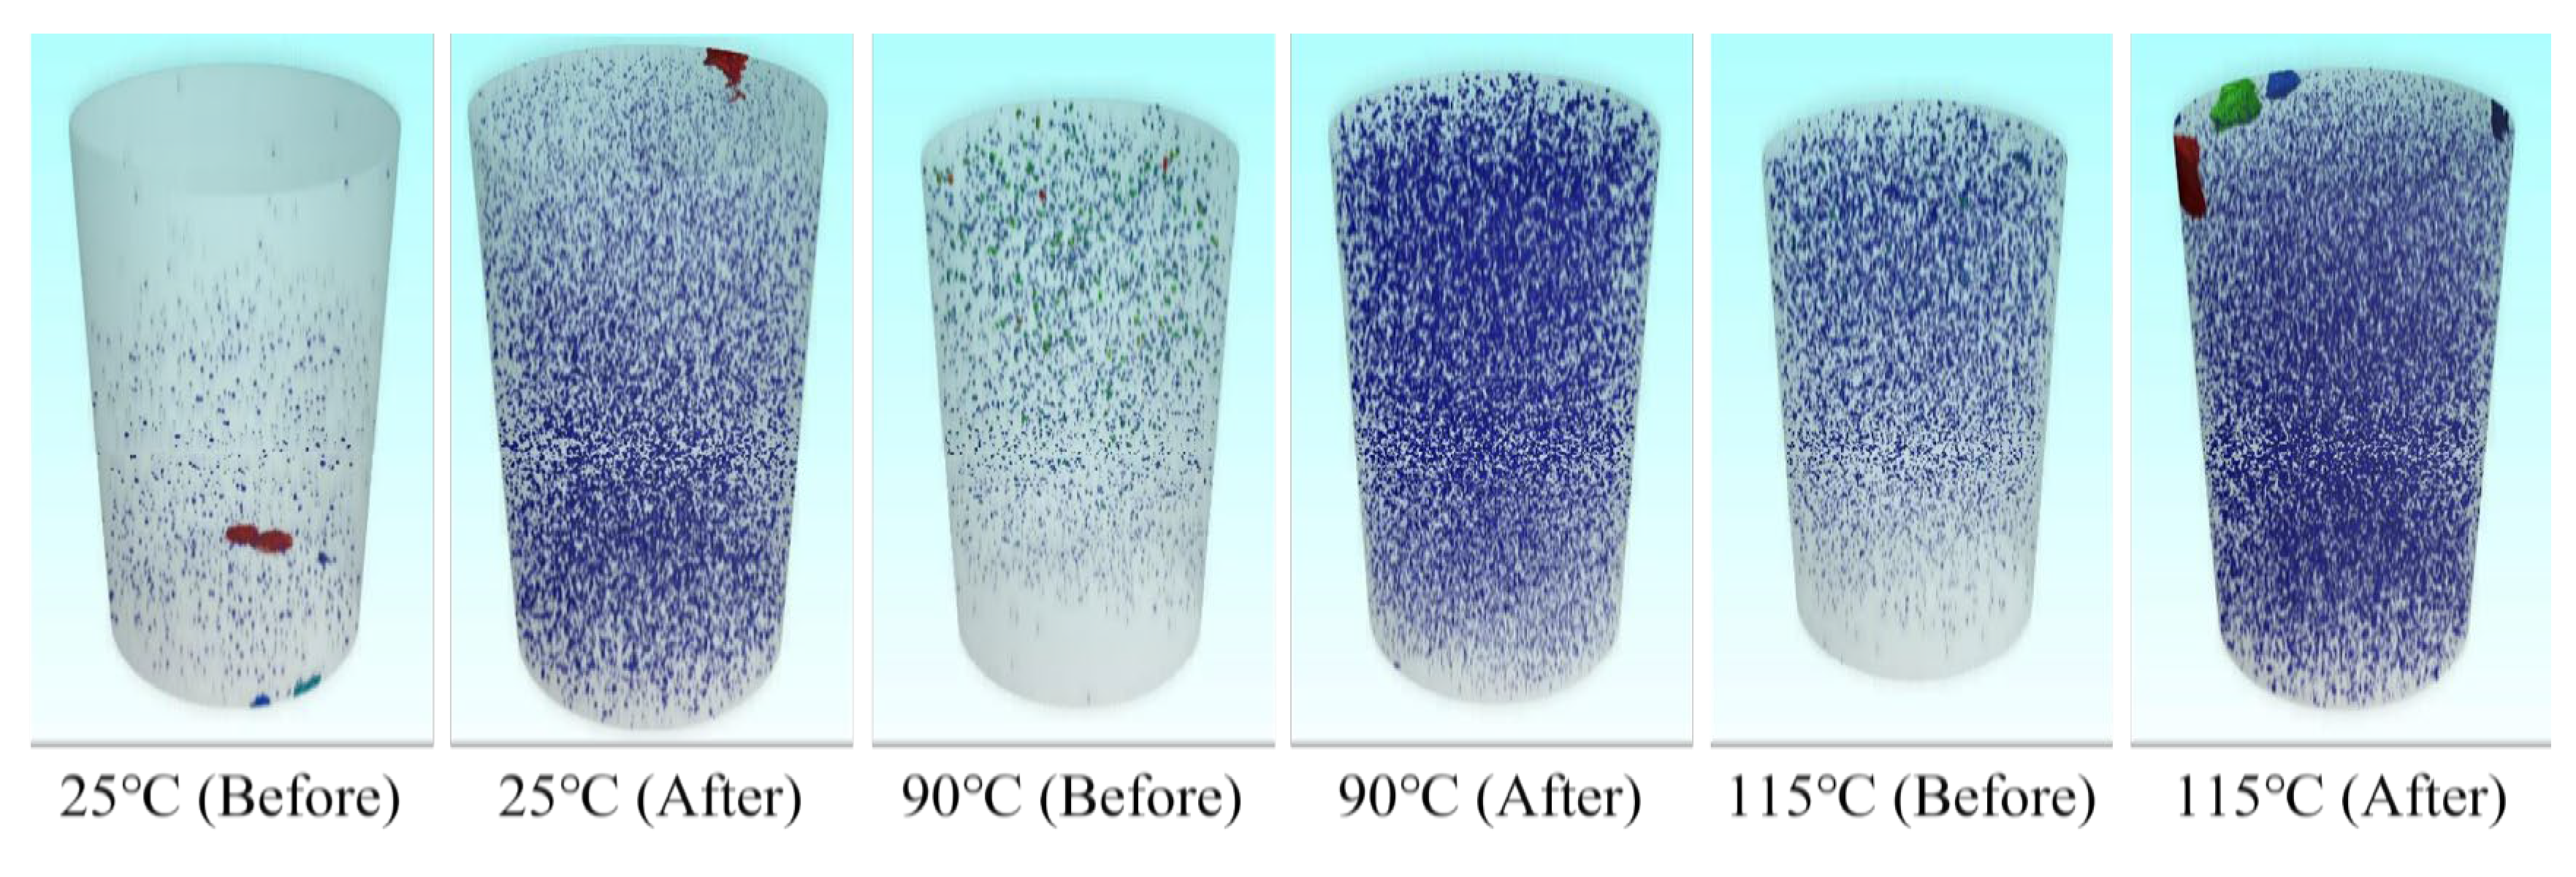
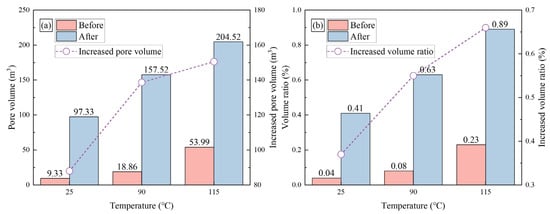
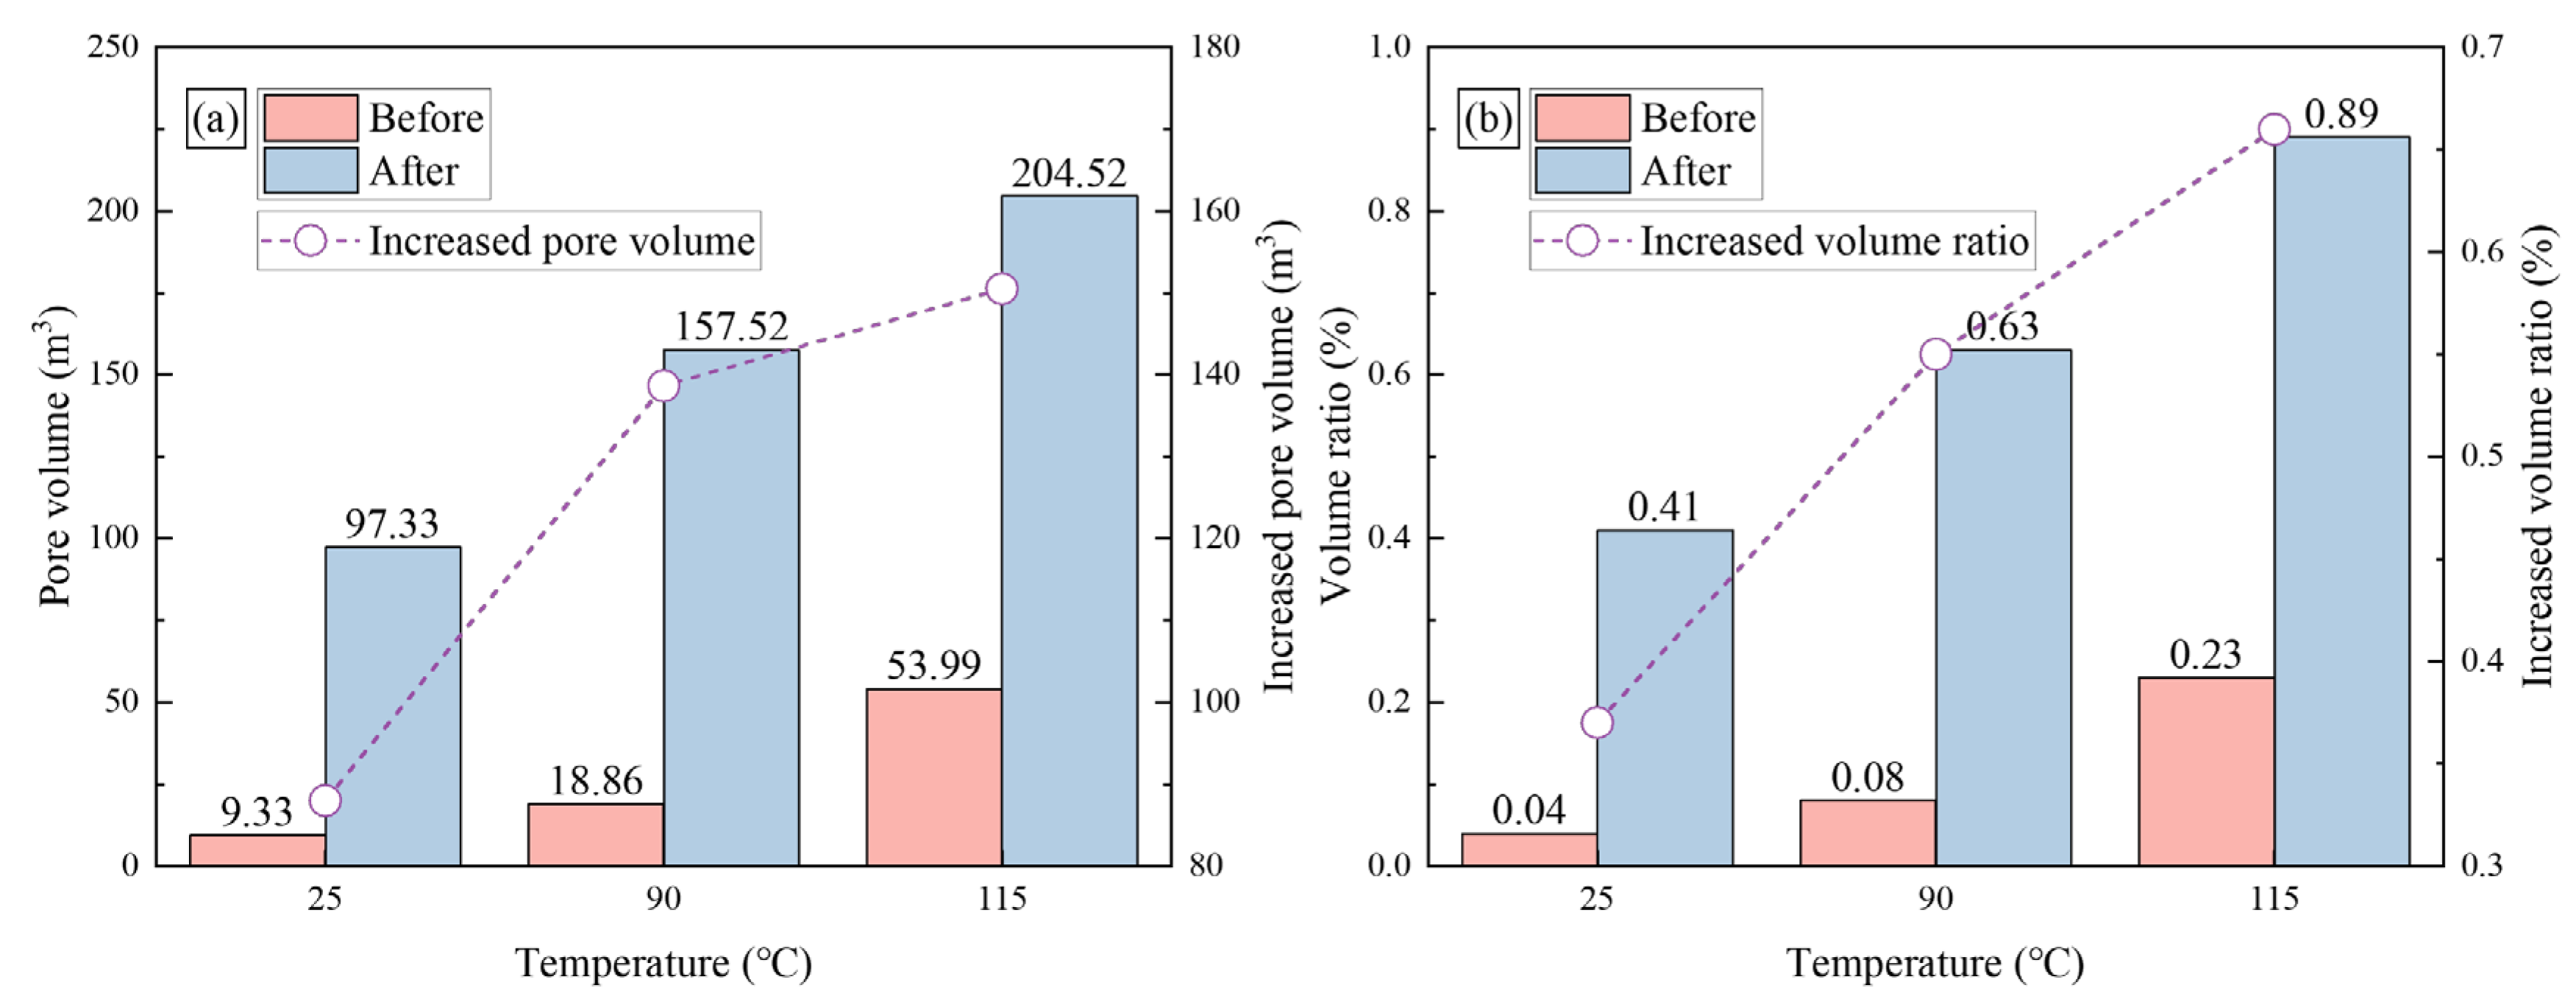
Furthermore, three-dimensional reconstruction based on CT scanning was performed to visualize the internal structure of the cement specimens before and after testing (as shown in Figure 11). Quantitative analysis of the reconstructed images was conducted to calculate the pore volume and its proportion relative to the total specimen volume (Table 4). The results indicate that with increasing curing temperature, both the pore volume and its proportion show a gradual rising trend. Specifically, the pore volume increases from 9.33 mm3 to 53.99 mm3, while the pore proportion rises from 0.04% to 0.23% (Figure 12). This trend is consistent with the pore coarsening behavior previously revealed by NMR analysis.
Figure 11.
Three-dimensional reconstructed image based on CT scanning (the small blue dots indicate pores, while others represent edge damage on the specimen after testing).
Table 4.
Pore volume ratio before and after tests.
Figure 12.
(a) Pore volume and increased pore volume under different temperatures; (b) Volume ratio and increased volume ratio under different temperatures.
4. Discussion
This study focused on the influence of temperature on the fatigue damage of cement specimens. Quantitatively, as the temperature increased from 25 °C to 115 °C, the cumulative plastic strain nearly doubled (from 0.45% to 0.99), while the dissipated energy density increased from 0.0033 mJ/m3 to 0.0046 mJ/m3, indicating a substantial enhancement of irreversible deformation and damage accumulation under otherwise identical cyclic stress limits. At the microstructural level, this macroscopic degradation is consistently supported by the observed rightward shift in the NMR T2 peak, the increase in pore volume by more than 150 mm3, and the order-of-magnitude rise in permeability after cyclic loading at elevated temperatures.
It is important to note that these trends arise under a constant absolute cyclic stress amplitude. As temperature increases, the reduction in cement strength leads to a progressively higher normalized load ratio, which in turn accelerates fatigue damage accumulation. This coupling reflects a realistic operational risk scenario for CAES wellbores, where pressure fluctuation amplitudes during injection–production cycles may remain unchanged while cement mechanical properties degrade with increasing formation temperature. From a practical perspective, the results suggest that cement sheath integrity in CAES applications cannot be reliably assessed based on temperature or cyclic loading alone; instead, their combined effect must be considered. Accordingly, mitigation strategies such as optimizing cement formulations with thermal stabilizers, improving microstructural stability at elevated temperatures, or adjusting operational pressure cycling ranges may be necessary to reduce fatigue-induced degradation and ensure long-term sealing integrity under cyclic service conditions.
5. Conclusions
Based on systematic fatigue tests conducted at various temperatures, the following main conclusions are drawn:
- (1)
- Increasing temperature exacerbates fatigue damage accumulation in the cement specimens. Taking cumulative plastic strain as an example, it increases from 0.45% to 0.99% as the temperature rises from 25 °C to 115 °C.
- (2)
- Elevated temperature promotes irreversible energy dissipation. When the temperature increases from 25 °C to 115 °C, the dissipated energy density rises from 0.0033 mJ/m3 to 0.0046 mJ/m3, and its proportion relative to the input energy increases from 5.52% to 7.13%.
- (3)
- Within the investigated temperature range (25–115 °C), higher temperatures lead to significant deterioration of the internal pore structure. At 115 °C, the peak of the NMR T2 distribution shifts rightward by 0.49 ms, the total pore volume increases by 150.53 mm3, and the corresponding permeability increases by 1.398 × 10⁻³ μm2.
- (4)
- Elevated temperature within the investigated range (25–115 °C) weakens material performance through dual mechanisms of accelerated cementitious system dehydration and promoted plastic slip. It is recommended to optimize the slurry formulation (e.g., by adding thermal stabilizers) to enhance long-term sealing capacity.
The conclusions of this study are valid under the specific boundary conditions of constant absolute cyclic stress amplitude and temperatures up to 115 °C, and should not be interpreted as isolated thermal effects independent of loading conditions. This finding suggests that conventional cement sheath integrity assessments based solely on static strength or temperature-independent criteria may underestimate long-term degradation risks in cyclically operated energy storage wells. In practical implementation, these results support the need for temperature-adapted cement formulations (e.g., incorporation of thermal stabilizers or microstructure-enhancing additives), as well as operational strategies that limit cyclic stress amplitudes as formation temperature increases. Future research should extend the experimental envelope to include higher temperatures and different cyclic stress regimes (e.g., constant normalized load ratios), and replicate testing to quantify variability and establish statistical confidence. In addition, coupling laboratory observations with constitutive modeling and long-term field monitoring data will be essential to translate the observed fatigue damage mechanisms into predictive tools for cement sheath integrity assessment in CAES and other cyclic energy well applications.
Author Contributions
Data curation, Q.Y. and Y.J.; writing—original draft preparation, Z.B., C.S. and T.L.; writing—review and editing, L.W.; supervision, project administration and funding acquisition, Y.G., L.W. and Z.B. All authors have read and agreed to the published version of the manuscript.
Funding
This work was funded by “National Natural Science Foundation of China” (No. 52474085), “National Key R&D Program of China” (No. 2024YFB4007100), “Key Laboratory of Geomechanics and Geotechnical Engineering Safety, Chinese Academy of Sciences” (Grant No. SKLGME-JBGS2404), “Frontier Technology Research and Development Program of Jiangsu Province” (No. BF2024056), and “Natural Science Foundation of Wuhan” (No. 2024040701010062). “Science Foundation of China University of Petroleum, Beijing” (No. 2462025XKBH029).
Data Availability Statement
Data will be made available on request.
Conflicts of Interest
The authors declare that they have no known competing financial interests or personal relationships that could have appeared to influence the work reported in this paper.
References
- Cao, J.; Zhang, J.; Chen, Y.; Fan, R.; Xu, L.; Wu, E.; Xue, Y.; Yang, J.; Chen, Y.; Yang, B.; et al. Current Status, Future Prediction and Offset Potential of Fossil Fuel CO2 Emissions in China. J. Clean. Prod. 2023, 426, 139207. [Google Scholar] [CrossRef] [Scilit]
- Huang, Y.; Shi, X.; Zhu, S.; Wei, X.; Bai, W.; Li, P.; Xu, M.; Li, Y.; Yang, C. Comparative Techno-Economic Analysis of Large-Scale Underground Hydrogen Storage. Appl. Energy 2025, 400, 126564. [Google Scholar] [CrossRef] [Scilit]
- Matos, C.R.; Carneiro, J.F.; Silva, P.P. Overview of Large-Scale Underground Energy Storage Technologies for Integration of Renewable Energies and Criteria for Reservoir Identification. J. Energy Storage 2019, 21, 241–258. [Google Scholar] [CrossRef] [Scilit]
- Enasel, E.; Dumitrascu, G. Storage Solutions for Renewable Energy: A Review. Energy Nexus 2025, 17, 100391. [Google Scholar] [CrossRef] [Scilit]
- Liu, W.; Li, Q.; Yang, C.; Shi, X.; Wan, J.; Jurado, M.J.; Li, Y.; Jiang, D.; Chen, J.; Qiao, W.; et al. The Role of Underground Salt Caverns for Large-Scale Energy Storage: A Review and Prospects. Energy Storage Mater. 2023, 63, 103045. [Google Scholar] [CrossRef] [Scilit]
- Yang, C.; Wang, T.; Li, Y.; Yang, H.; Li, J.; Qu, D.; Xu, B.; Yang, Y.; Daemen, J.J.K. Feasibility Analysis of Using Abandoned Salt Caverns for Large-Scale Underground Energy Storage in China. Appl. Energy 2015, 137, 467–481. [Google Scholar] [CrossRef] [Scilit]
- Huang, L.; Hou, Z.; Fang, Y.; Luo, J.; Wu, L.; Wang, Q.; Guo, Y.; Zhang, X.; Shi, T.; Liu, J. The Development, Frontier and Prospect of Large-Scale Underground Energy Storage: A Bibliometric Review. J. Energy Storage 2024, 103, 114293. [Google Scholar] [CrossRef] [Scilit]
- Xie, Y.; Wu, X.; Hou, Z.; Li, Z.; Luo, J.; Lüddeke, C.T.; Huang, L.; Wu, L.; Liao, J. Gleaning Insights from German Energy Transition and Large-Scale Underground Energy Storage for China’s Carbon Neutrality. Int. J. Min. Sci. Technol. 2023, 33, 529–553. [Google Scholar] [CrossRef] [Scilit]
- Zhang, L.; Xie, M.; Ye, K.; Li, S.; Chen, L. Compressed Air Energy Storage Based on Variable-Volume Air Storage: A Review. J. Energy Storage 2025, 110, 115361. [Google Scholar] [CrossRef] [Scilit]
- Khan, M.K.; Raza, M.; Shahbaz, M.; Farooq, U.; Akram, M.U. Recent Advancement in Energy Storage Technologies and Their Applications. J. Energy Storage 2024, 92, 112112. [Google Scholar] [CrossRef] [Scilit]
- Deng, S.; Li, Y.; Yan, X.; Wang, J.; Liu, C. Harnessing Abandoned Oil Wells for Compressed Air Energy Storage: A Synergistic Approach to Sustainable Energy Infrastructure. J. Energy Storage 2025, 135, 118243. [Google Scholar] [CrossRef] [Scilit]
- Wu, F.; Liu, Y.; Gao, R. Challenges and Opportunities of Energy Storage Technology in Abandoned Coal Mines: A Systematic Review. J. Energy Storage 2024, 83, 110613. [Google Scholar] [CrossRef] [Scilit]
- Fang, J.; Ma, H.; Yang, C.; Li, H.; Zeng, Z.; Zhu, S.; Wang, X.; Nong, X. Airtightness Evaluation of Compressed Air Energy Storage (CAES) Salt Caverns in Bedded Rock Salt. J. Energy Storage 2024, 102, 114100. [Google Scholar] [CrossRef] [Scilit]
- Guo, C.; Pan, L.; Zhang, K.; Oldenburg, C.M.; Li, C.; Li, Y. Comparison of Compressed Air Energy Storage Process in Aquifers and Caverns Based on the Huntorf CAES Plant. Appl. Energy 2016, 181, 342–356. [Google Scholar] [CrossRef] [Scilit]
- Bi, Z.; Guo, Y.; Yan, W.; Yang, C.; Zhang, L.; Fang, J. Feasibility Analysis of Compressed Air Energy Storage in Fracture Space of Depleted Unconventional Oil and Gas Reservoirs. Energy Convers. Manag. 2026, 348, 120645. [Google Scholar] [CrossRef] [Scilit]
- Zhao, K.; Yang, C.; Ma, H.; Daemen, J.J.K. A Creep-Fatigue Model of Rock Salt and Its Application to the Deformation Analysis of CAES Salt Caverns. Comput. Geotech. 2023, 156, 105311. [Google Scholar] [CrossRef] [Scilit]
- Liang, R.; Ma, H.; Li, H.; Wang, X.; Zeng, Z.; Zheng, Z.; Li, W.; Huang, Y.; Zhao, K. Techno-Economic Analysis of Compressed Air Energy Storage in Abandoned Salt Caverns: A Case Study in China. Renew. Energy 2025, 254, 123595. [Google Scholar] [CrossRef] [Scilit]
- Li, W.; Ma, H.; Zhao, K.; Li, H.; Zeng, Z.; Wang, X.; Liang, R.; Yang, C. Stability and Settlement Analysis of Salt Cavern Groups for Compressed Air Energy Storage: A Case Study in China. J. Energy Storage 2025, 122, 116626. [Google Scholar] [CrossRef] [Scilit]
- Wang, L.; Yang, C.; Guo, Y.; Chang, X.; Xiao, J.; Song, Y. Experimental and Numerical Investigation on the Cement Sheath Sealing Failure Induced by Large-Scale Multistage Hydraulic Fracturing in Shale Gas Well. In Proceedings of the 53rd U.S. Rock Mechanics/Geomechanics Symposium, New York City, NY, USA, 23–26 June 2019. [Google Scholar]
- Li, H.; Ma, H.; Liang, W.; Zeng, Z.; Fang, J.; Wang, X.; Liu, Y.; Liang, R.; Yang, C. Stability Assessment of CAES Salt Caverns Using a Fractal-Order Derivative Creep-Fatigue Damage Model. Energy 2025, 317, 134584. [Google Scholar] [CrossRef] [Scilit]
- Shadravan, A.; Kias, E.; Lew, R.; Maharidge, R. Utilizing the Evolving Cement Mechanical Properties under Fatigue to Predict Cement Sheath Integrity. In Proceedings of the SPE Kuwait Oil and Gas Show and Conference, Mishref, Kuwait, 11–14 October 2015. [Google Scholar]
- Zeng, Y.; Liu, R.; Li, X.; Zhou, S.; Tao, Q.; Lu, P. Cement Sheath Sealing Integrity Evaluation under Cyclic Loading Using Large-Scale Sealing Evaluation Equipment for Complex Subsurface Settings. J. Pet. Sci. Eng. 2019, 176, 811–820. [Google Scholar] [CrossRef] [Scilit]
- Kuanhai, D.; Yue, Y.; Yi, H.; Zhonghui, L.; Yuanhua, L. Experimental Study on the Integrity of Casing-Cement Sheath in Shale Gas Wells under Pressure and Temperature Cycle Loading. J. Pet. Sci. Eng. 2020, 195, 107548. [Google Scholar] [CrossRef] [Scilit]
- Xi, Y.; Li, J.; Tao, Q.; Guo, B.; Liu, G. Experimental and Numerical Investigations of Accumulated Plastic Deformation in Cement Sheath during Multistage Fracturing in Shale Gas Wells. J. Pet. Sci. Eng. 2020, 187, 106790. [Google Scholar] [CrossRef] [Scilit]
- Zhang, X.; Bi, Z.; Wang, L.; Guo, Y.; Yang, C.; Yang, G. Shakedown Analysis on the Integrity of Cement Sheath under Deep and Large-Scale Multi-Section Hydraulic Fracturing. J. Pet. Sci. Eng. 2022, 208, 109619. [Google Scholar] [CrossRef] [Scilit]
- Wang, Y.; Feng, Y.; Zhao, Y.; Li, S.; Su, F.; Gu, C.; Li, X. Experimental study on cement sheath integrity of UGS wells under cyclic loading. Geoenergy Sci. Eng. 2024, 239, 212958. [Google Scholar] [CrossRef] [Scilit]
- Yang, H.; Wang, L.; Huang, G.; Zhao, J.; Yang, C.; Bi, Z.; Guo, Y.; Liu, W.V. Effects of Compressive Cyclic Loading on the Fatigue Properties of Oil-Well Cement Slurries Serving in Deep Downhole Environments. Constr. Build. Mater. 2024, 428, 136360. [Google Scholar] [CrossRef] [Scilit]
- Yang, H.; Wang, L.; Yang, C.; Zhao, J.; Huang, G.; Guo, Y.; Liu, W.V. Mechanical Performance of Oil-Well Cement Slurries Cured and Tested under High-Temperatures and High-Pressures for Deep-Well Applications. Cem. Concr. Res. 2024, 175, 107355. [Google Scholar] [CrossRef] [Scilit]
- Cheng, G.; Li, H.; Liu, H.; Wei, H.; Zhou, S.; Fang, K. Strength retrogression mechanisms of silica-enriched oil well cement under 240 °C curing conditions. Chem. Pap. 2025, 2585–7290. [Google Scholar] [CrossRef] [Scilit]
- Pang, X.; Qin, J.; Sun, L.; Zhang, G.; Wang, H. Long-Term Strength Retrogression of Silica-Enriched Oil Well Cement: A Comprehensive Multi-Approach Analysis. Cem. Concr. Res. 2021, 144, 106424. [Google Scholar] [CrossRef] [Scilit]
- Jupe, A.C.; Wilkinson, A.P.; Luke, K.; Funkhouser, G.P. Class H Cement Hydration at 180 °C and High Pressure in the Presence of Added Silica. Cem. Concr. Res. 2008, 38, 660–666. [Google Scholar] [CrossRef] [Scilit]
- Kjellsen, K.O.; Detwiler, R.J.; Gjørv, O.E. Pore Structure of Plain Cement Pastes Hydrated at Different Temperatures. Cem. Concr. Res. 1990, 20, 927–933. [Google Scholar] [CrossRef] [Scilit]
- Kozhevnikov, E.V.; Turbakov, M.S.; Riabokon, E.P.; Gladkikh, E.A.; Poplygin, V.V. Cyclic confining pressure and rock permeability: Mechanical compaction or fines migration. Heliyon 2023, 9, E21600. [Google Scholar] [CrossRef] [Scilit]


Disclaimer/Publisher’s Note: The statements, opinions and data contained in all publications are solely those of the individual author(s) and contributor(s) and not of MDPI and/or the editor(s). MDPI and/or the editor(s) disclaim responsibility for any injury to people or property resulting from any ideas, methods, instructions or products referred to in the content. |
© 2026 by the authors. Licensee MDPI, Basel, Switzerland. This article is an open access article distributed under the terms and conditions of the Creative Commons Attribution (CC BY) license.