


Featured Application
The proposed MSC-Transformer model is designed for intelligent lithology identification during drilling operations based on triaxial vibration signals. By integrating time–frequency analysis with multi-scale convolution and Transformer-based global dependency modeling, the method enables accurate and robust classification of different lithologies under complex drilling conditions. This approach is particularly suitable for real-time or near-real-time applications in smart drilling systems, where reliable lithology recognition can support drilling parameter optimization, enhance drilling efficiency, and reduce operational risks. Moreover, the model provides interpretable insights through attention visualization and spectral analysis, facilitating better understanding of the relationship between vibration responses and lithological characteristics. The proposed framework also demonstrates strong extensibility, offering potential for future integration with multi-modal drilling data and deployment in intelligent drilling and geological monitoring systems.
Abstract
Real-time lithology identification during drilling faces challenges such as indistinct boundaries and difficulties in feature extraction. To address these, this study proposes the MSC-Transformer, a novel model integrating time-frequency features with a deep neural network. A series of drilling experiments were conducted using an intelligent drilling platform, during which triaxial vibration signals were collected from five types of rock specimens: anthracite, granite, bituminous coal, sandstone, and shale. Short-time Fourier Transform (STFT) was applied to generate multi-channel power spectral density (PSD) maps, which were then fused into a three-channel tensor to preserve directional frequency information and used as inputs to the model. The proposed MSC-Transformer combines a multi-scale convolutional (MSC) module with a lightweight Transformer encoder to jointly capture local texture patterns and global dependency features, thereby enabling accurate classification of complex lithologies. Experimental results demonstrate that the model achieves an average accuracy of 98.21 ± 0.49% on the test set, outperforming convolutional neural networks (CNNs), visual geometry group (VGG), residual network (ResNet), and bidirectional long short-term memory (Bi-LSTM) by 5.93 ± 0.90%, 2.54 ± 1.11%, 6.38 ± 2.63%, and 10.56 ± 3.11%, respectively, with statistically significant improvements (p < 0.05). Ablation studies and visualization analyses further validate the effectiveness and interpretability of the model architecture. These findings indicate that lithology recognition based on time-frequency representations of vibration signals is both stable and generalizable, offering technical support for real-time intelligent lithology identification during drilling operations.
1. Introduction
Lithology identification during drilling plays a vital role in geological exploration and mineral resource assessment. Accurately determining the rock types encountered in the drilling process not only facilitates the optimization of drilling parameters and improves operational efficiency, but also provides essential data for analyzing rock mass mechanical properties and evaluating mineral reserves [1,2,3]. Traditional lithology identification methods mainly rely on core analysis and geological logging. While these approaches are intuitive and benefit from expert experience, they suffer from limitations such as notable limitations such as delayed feedback, heavy dependence on manual intervention, and poor continuity in identification [4,5]. These drawbacks make it difficult to meet the growing demand for efficient and intelligent identification techniques. In recent years, the rapid advancement of real-time parameter acquisition and multi-source data integration technologies has spurred interest in intelligent lithology recognition methods based on dynamic response signals [6,7,8]. Recent advancements in low-cost sensing technologies have been extensively developed for various engineering purposes, demonstrating their effectiveness in real-time monitoring and system evaluation [9]. Consistent with this trend of cost-effective engineering monitoring, vibration signals have demonstrated great potential due to their high sensitivity to variations in the bit–rock interaction state and their capacity for real-time acquisition [10]. Effectively mining lithological features embedded in drilling vibration signals and developing robust, deployable recognition models has thus become a key research challenge in the field of intelligent drilling.
During the rock-breaking process, vibration signals at the borehole bottom are generated as a byproduct of the interaction between the drill bit and the rock. As such, these signals inherently contain feature information that reflects both the drilling state and rock properties [11,12,13,14]. In recent years, various real-time lithology recognition approaches have emerged based on vibration, acoustic, and torque signals, with vibration signals in particular exhibiting strong sensitivity and practical utility in response to lithological changes [15,16,17]. For example, a time-frequency image can be generated by extracting the time-frequency characteristics of the vibration signal [18,19], and real-time lithology classification is achieved by combining the CNN model. Cao et al. [20] conducted field vibration monitoring experiments on mining drill rigs and performed amplitude-frequency analysis of the signals, identifying specific energy, variance, and frequency parameters as key indicators for lithology classification. Chen et al. [21] used numerical simulations to extract vibration signals during drilling and applied Hilbert–Huang transform to analyze marginal spectra, establishing a relationship between lithology and both characteristic and intrinsic frequencies. Lazarova et al. [22] collected vibration signals while drilling through andesite, granite, limestone, and concrete using impregnated diamond bits, and analyzed signal variations under different mineral grain sizes and drilling conditions, clarifying the connection between vibration responses and rock properties. Bai et al. [23] observed a strong correlation between vibration signals and lithology identification performance, highlighting their potential as effective inversion signals during borehole drilling. Similarly, Li et al. [24] analyzed the trend lines of average vibration amplitude to perform lithology recognition.
CNNs have been widely applied to lithology classification tasks due to their proven advantages in image recognition [25,26,27,28]. CNNs are effective at extracting local spatial features; however, they are limited in capturing long-range temporal dependencies or modeling global contexts in sequential signals. To enhance temporal modeling capabilities, Hou et al. [29] improved the target detection algorithm of single-shot multi-box detector to enable the intelligent recognition of rock image. Xu et al. [30] developed a deep separable convolutional model based on Xception architecture for intelligent recognition of microscopic rock images. Zhang et al. [31] integrated morphological algorithms and data augmentation into a SegFormer-based model to achieve precise identification of coal–rock interfaces. Zhou et al. [32] constructed a new type of CNN, which classified rocks with similar texture patterns but different particle sizes by means of dynamic expansion, extrusion and excitation strategies. Khoshouei et al. [33] improved the robustness of lithology identification under drilling conditions by adopting a multi-scale spectral modeling approach. However, applying Transformer-based architectures to lithology recognition remains in the early exploratory stage. Existing studies primarily focus on static acoustic signals or single-channel input scenarios, and few have addressed the structural modeling of high-dimensional dynamic signals such as triaxial vibrations. Moreover, multi-channel data fusion techniques have recently gained attention. Chen et al. [34] employed a bidirectional attention mechanism to enhance inter-channel feature interactions for real-time lithology identification. Yue et al. [35] and Tao et al. [36] investigated the effectiveness of triaxial signal fusion mechanisms from vibration and sectional parameters perspectives, respectively. Further, Xu et al. [37] proposed a deep neural network that integrates both sound and vibration signals, achieving significantly improved recognition performance compared with traditional unimodal approaches.
Despite recent progress, existing vibration-based lithology identification methods still face challenges in spectral feature modeling. A critical gap remains in effectively addressing the dual nature of drilling vibration signals, which inherently exhibit both short-term local impact patterns reflecting rock texture and long-range spectral dependencies reflecting the continuous drilling process. Conventional models often fail to simultaneously capture these multi-scale dynamics: CNNs excel at extracting local spatial features but lack the capacity to model global contexts, while standard RNNs struggle to resolve complex time-frequency spatial structures. Consequently, the primary motivation of this study is to bridge this gap by designing a hybrid architecture that synergizes the local feature extraction power of MSC with the global context modeling capability of Transformers. To this end, we propose the MSC-Transformer framework, which maps triaxial signals into a multi-channel time-frequency tensor to achieve robust cross-scale feature aggregation. Comprehensive experiments on real-world drilling data demonstrate that the proposed model significantly outperforms conventional baselines in accuracy and robustness, offering valuable insights for real-time intelligent lithology identification.
The remainder of this paper is organized as follows. Section 2 details the data acquisition platform, signal preprocessing steps, and the specific architecture of the proposed MSC-Transformer model. Section 3 presents the experimental setup, comparative results against baseline models, ablation studies, and visualization analyses. Section 4 discusses the internal mechanisms of the model effectiveness and its potential engineering applications. Finally, Section 5 concludes the study and outlines future research directions.
2. Methodology
2.1. Overall Workflow
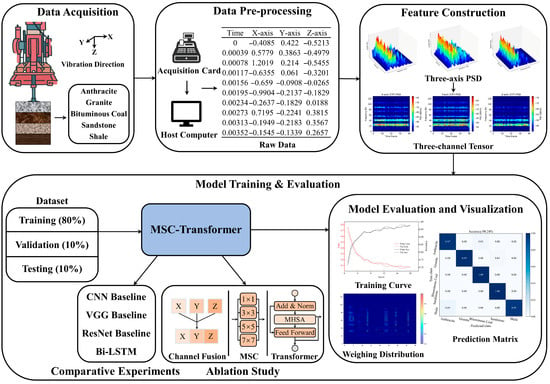
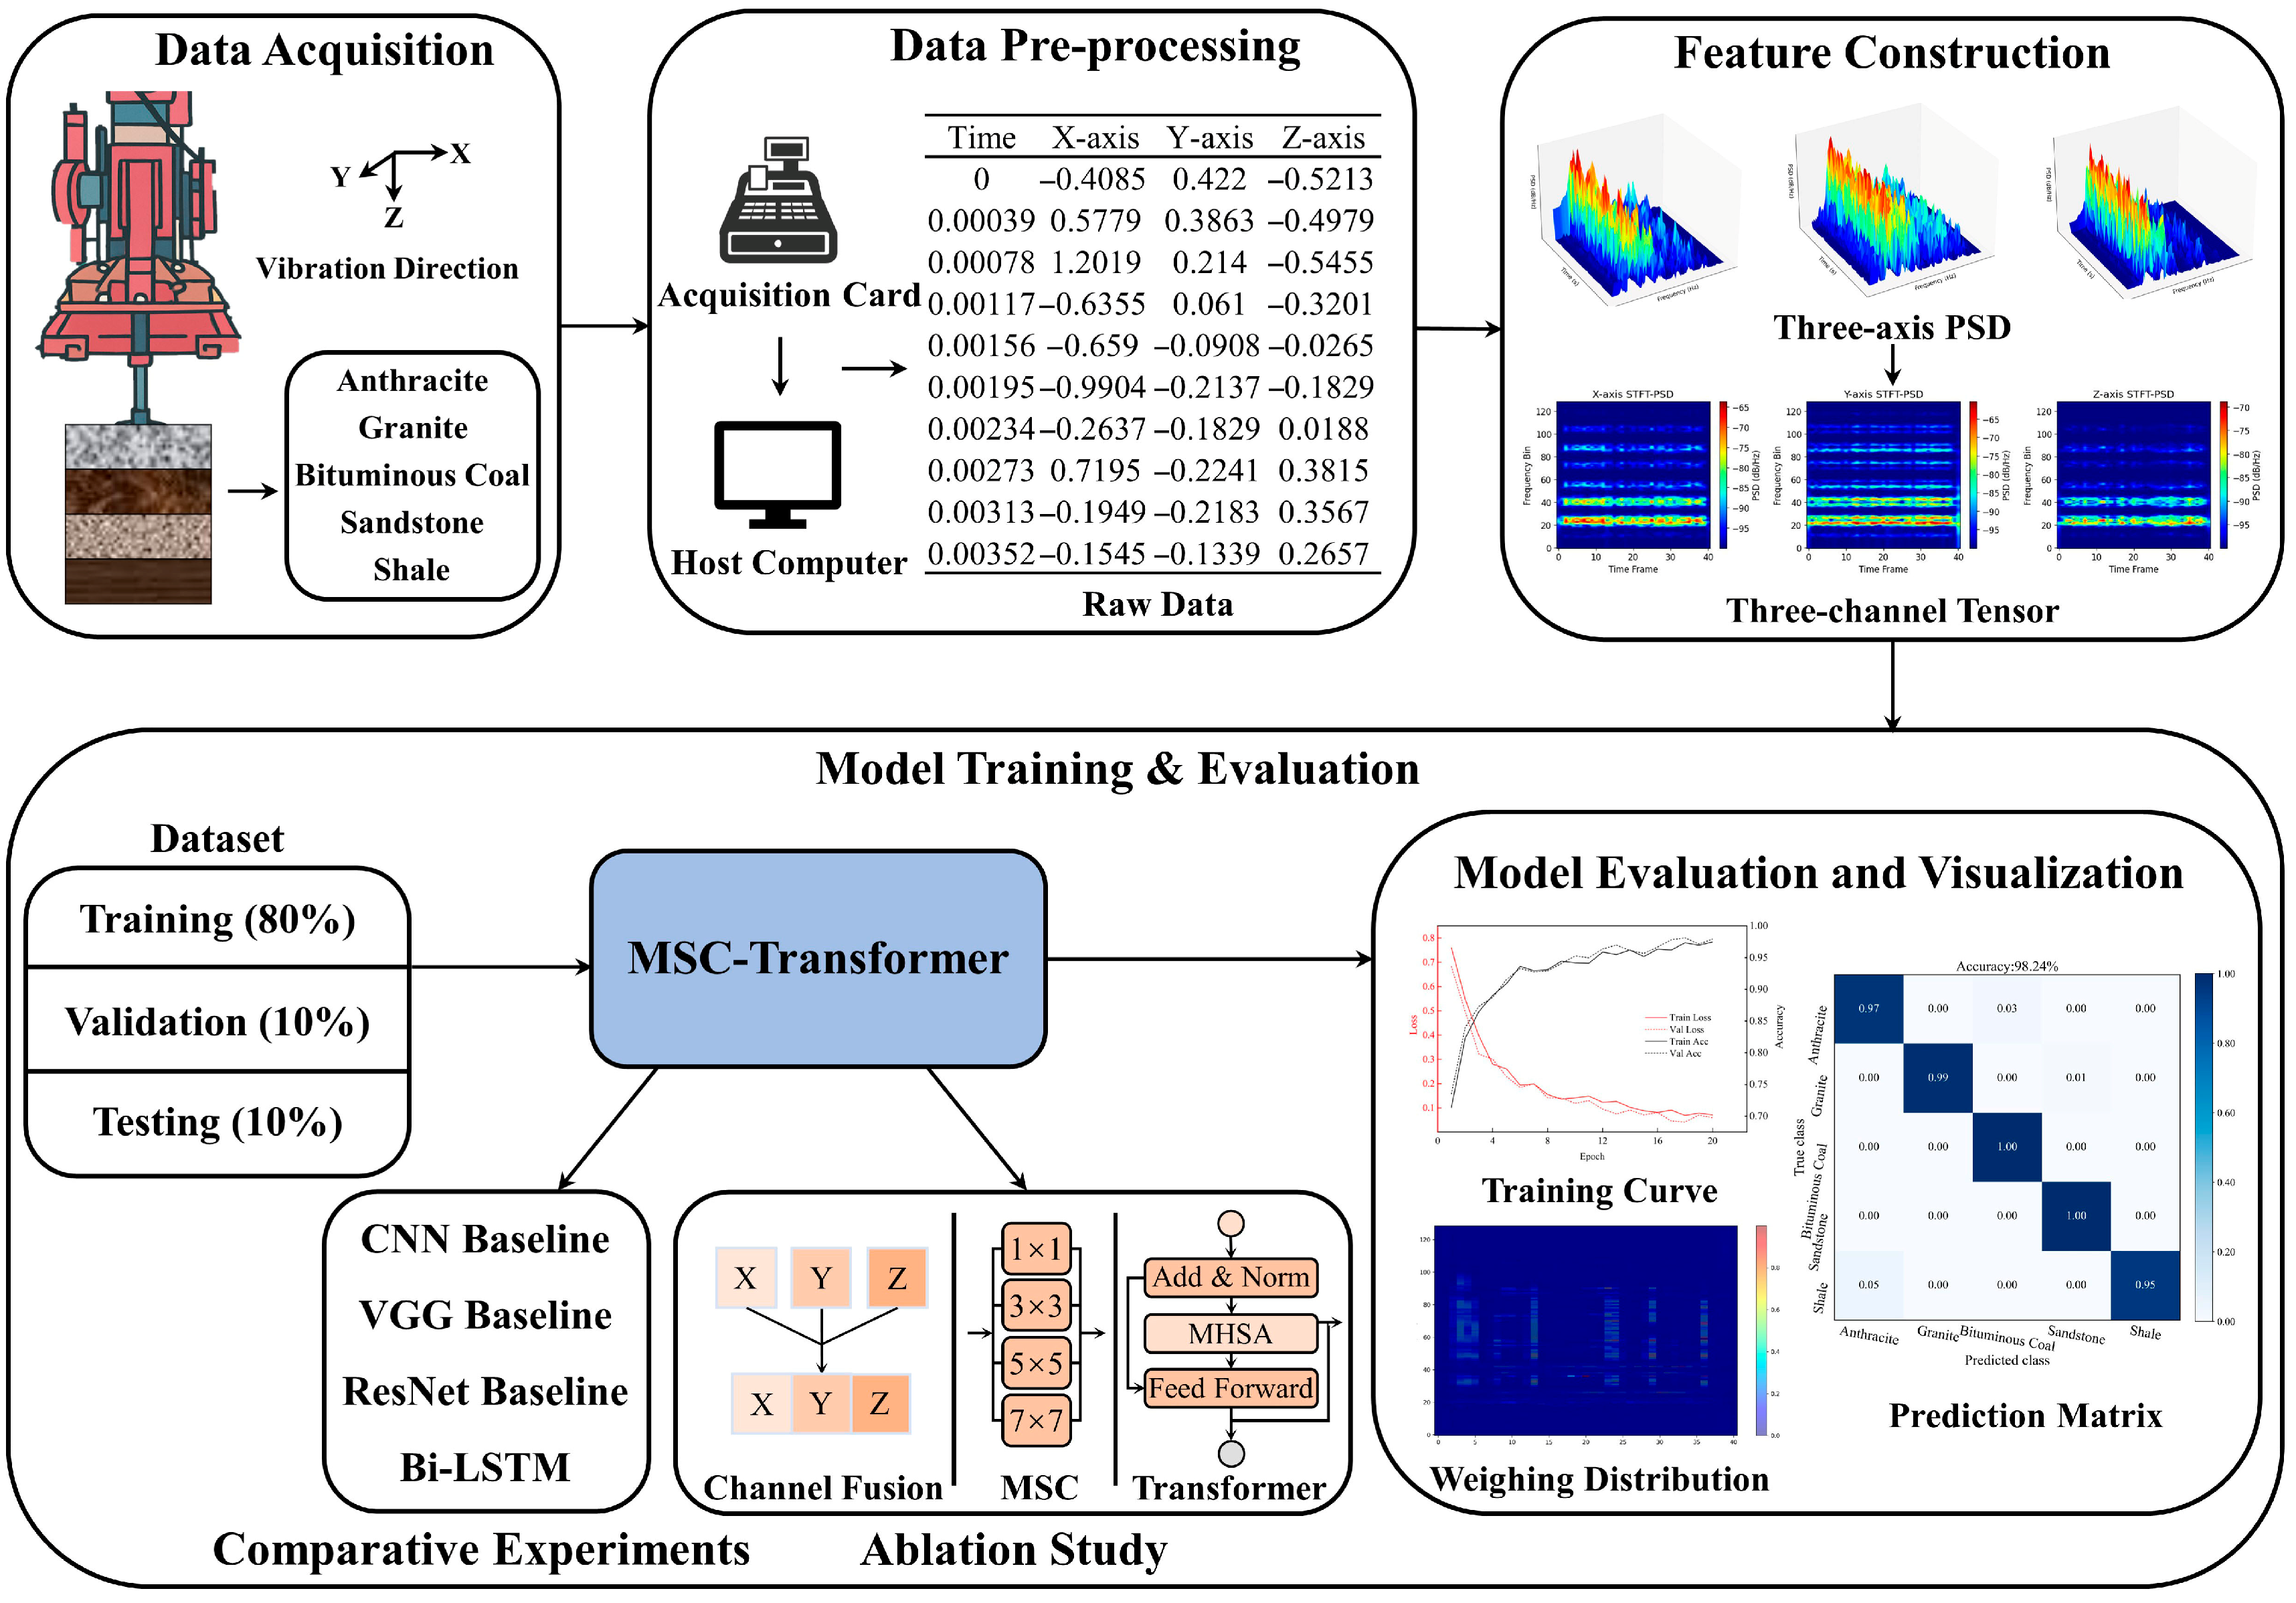
This study is structured around four key stages: data acquisition, feature extraction, model training, and performance evaluation. Utilizing an intelligent drilling platform, five types of rock samples—anthracite, granite, bituminous coal, sandstone, and shale—were arranged in various stacking configurations to simulate real-world coal–rock interbedded formations. During the drilling process, triaxial vibration signals were continuously recorded in real time. After preprocessing the raw vibration signals, STFT was applied to generate PSD images along the x, y, and z axes. These three-axis spectrograms were then stacked along the channel dimension to form a unified input tensor with a shape of 3 × H × W.
A hybrid MSC and Transformer network was constructed to jointly capture local structural features and global time-frequency dependencies. The dataset was split into training, validation, and testing subsets in an 8:1:1 ratio. The model was subsequently trained, evaluated, and optimized using these subsets. To comprehensively assess the model’s performance in terms of accuracy, robustness, and interpretability, comparative experiments were conducted against several baseline models, including CNN, VGG, ResNet, and LSTM. Furthermore, ablation studies were performed on both the MSC module and the Transformer encoder. Attention heatmaps were also employed to visualize the network’s focus on key time-frequency structures, thereby revealing its attention mechanisms. The overall workflow is illustrated in Figure 1.
Figure 1.
Overall experimental workflow.
2.2. Data Acquisition Scheme
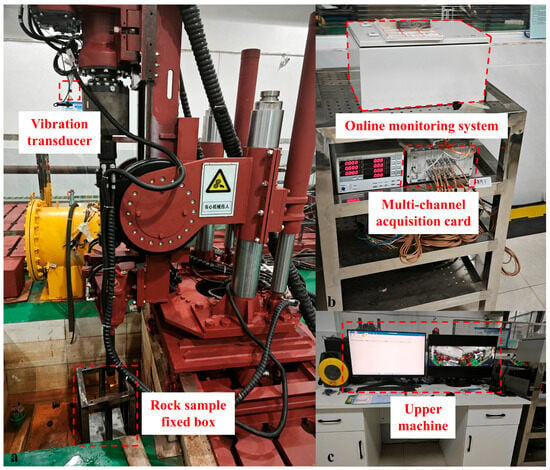
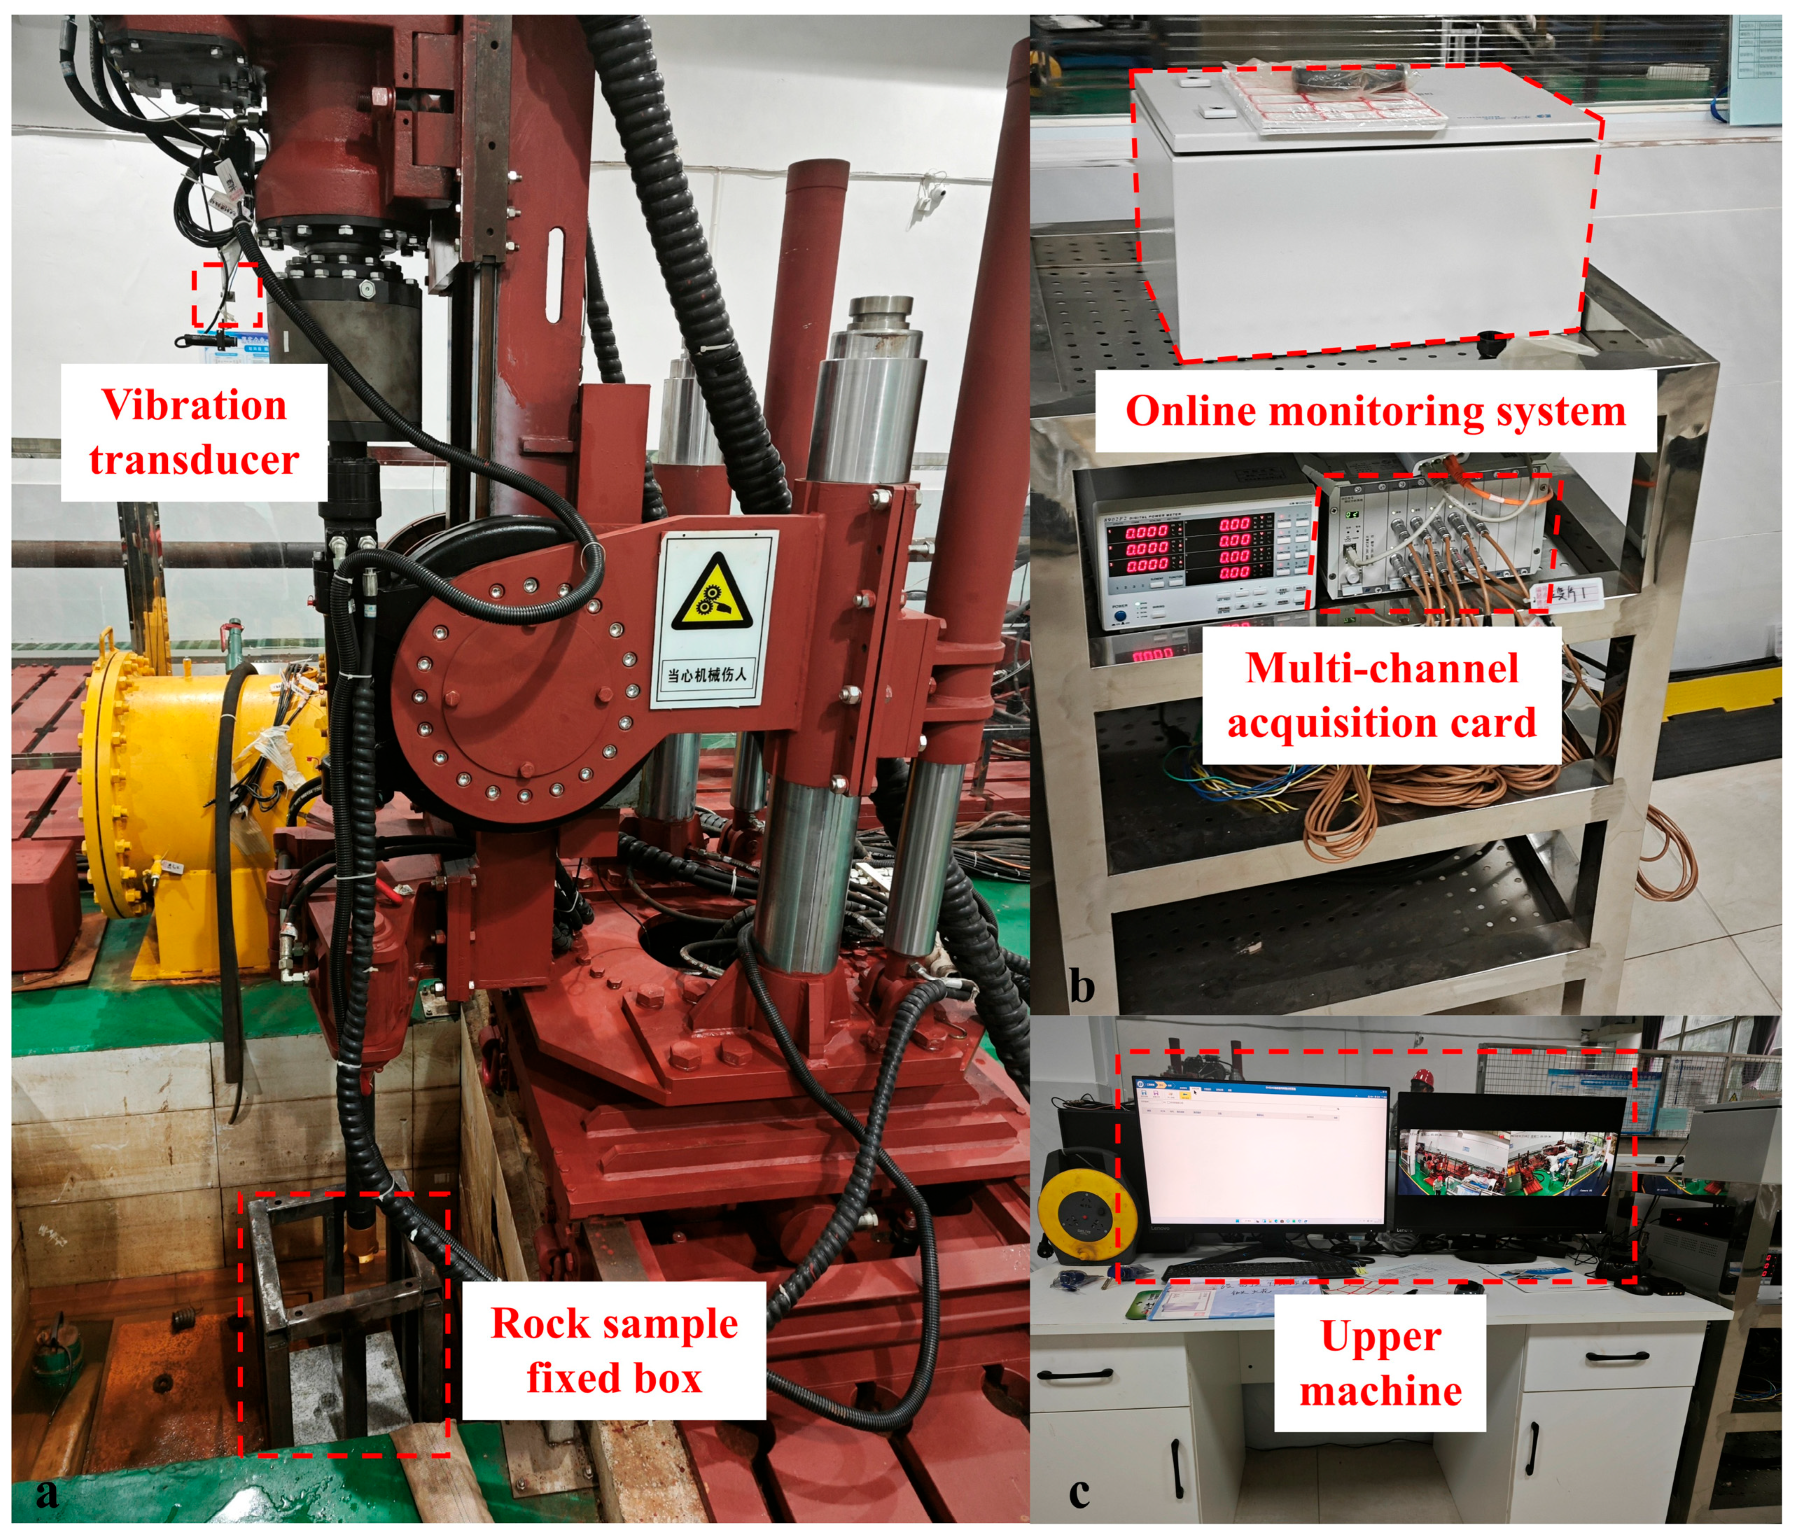
The experiments were conducted using a self-developed Type 4000 intelligent drilling platform (Figure 2), which supports real-time, full-cycle data acquisition throughout the drilling process. The platform is equipped with a triaxial accelerometer featuring a frequency response range of 0.5–10 kHz, a measurement range of 500 g, and a sensitivity of approximately 1 mV/(m∙s−2). It is capable of stable operation under high-pressure (35 MPa) and wide-temperature (40–120 °C) environments, meeting the requirements for capturing high-frequency dynamic signals. The sensor’s x and y axes are aligned with the rotational direction of the drill bit, while the z axis corresponds to the thrust direction of the drill rod. High-fidelity signal acquisition is ensured through an IEPE (Integrated Electronics Piezo-Electric) standard interface.
Figure 2.
Drilling test platform.
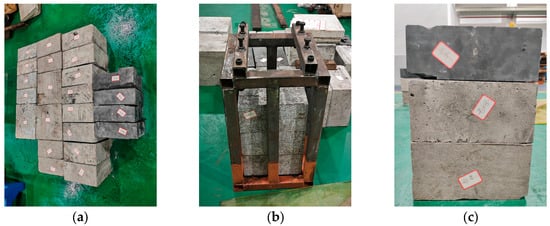
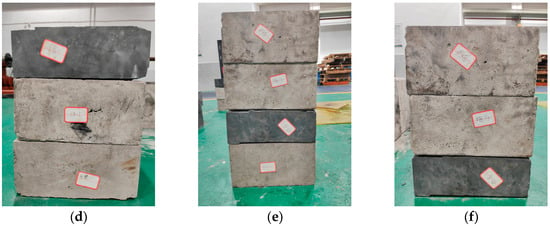
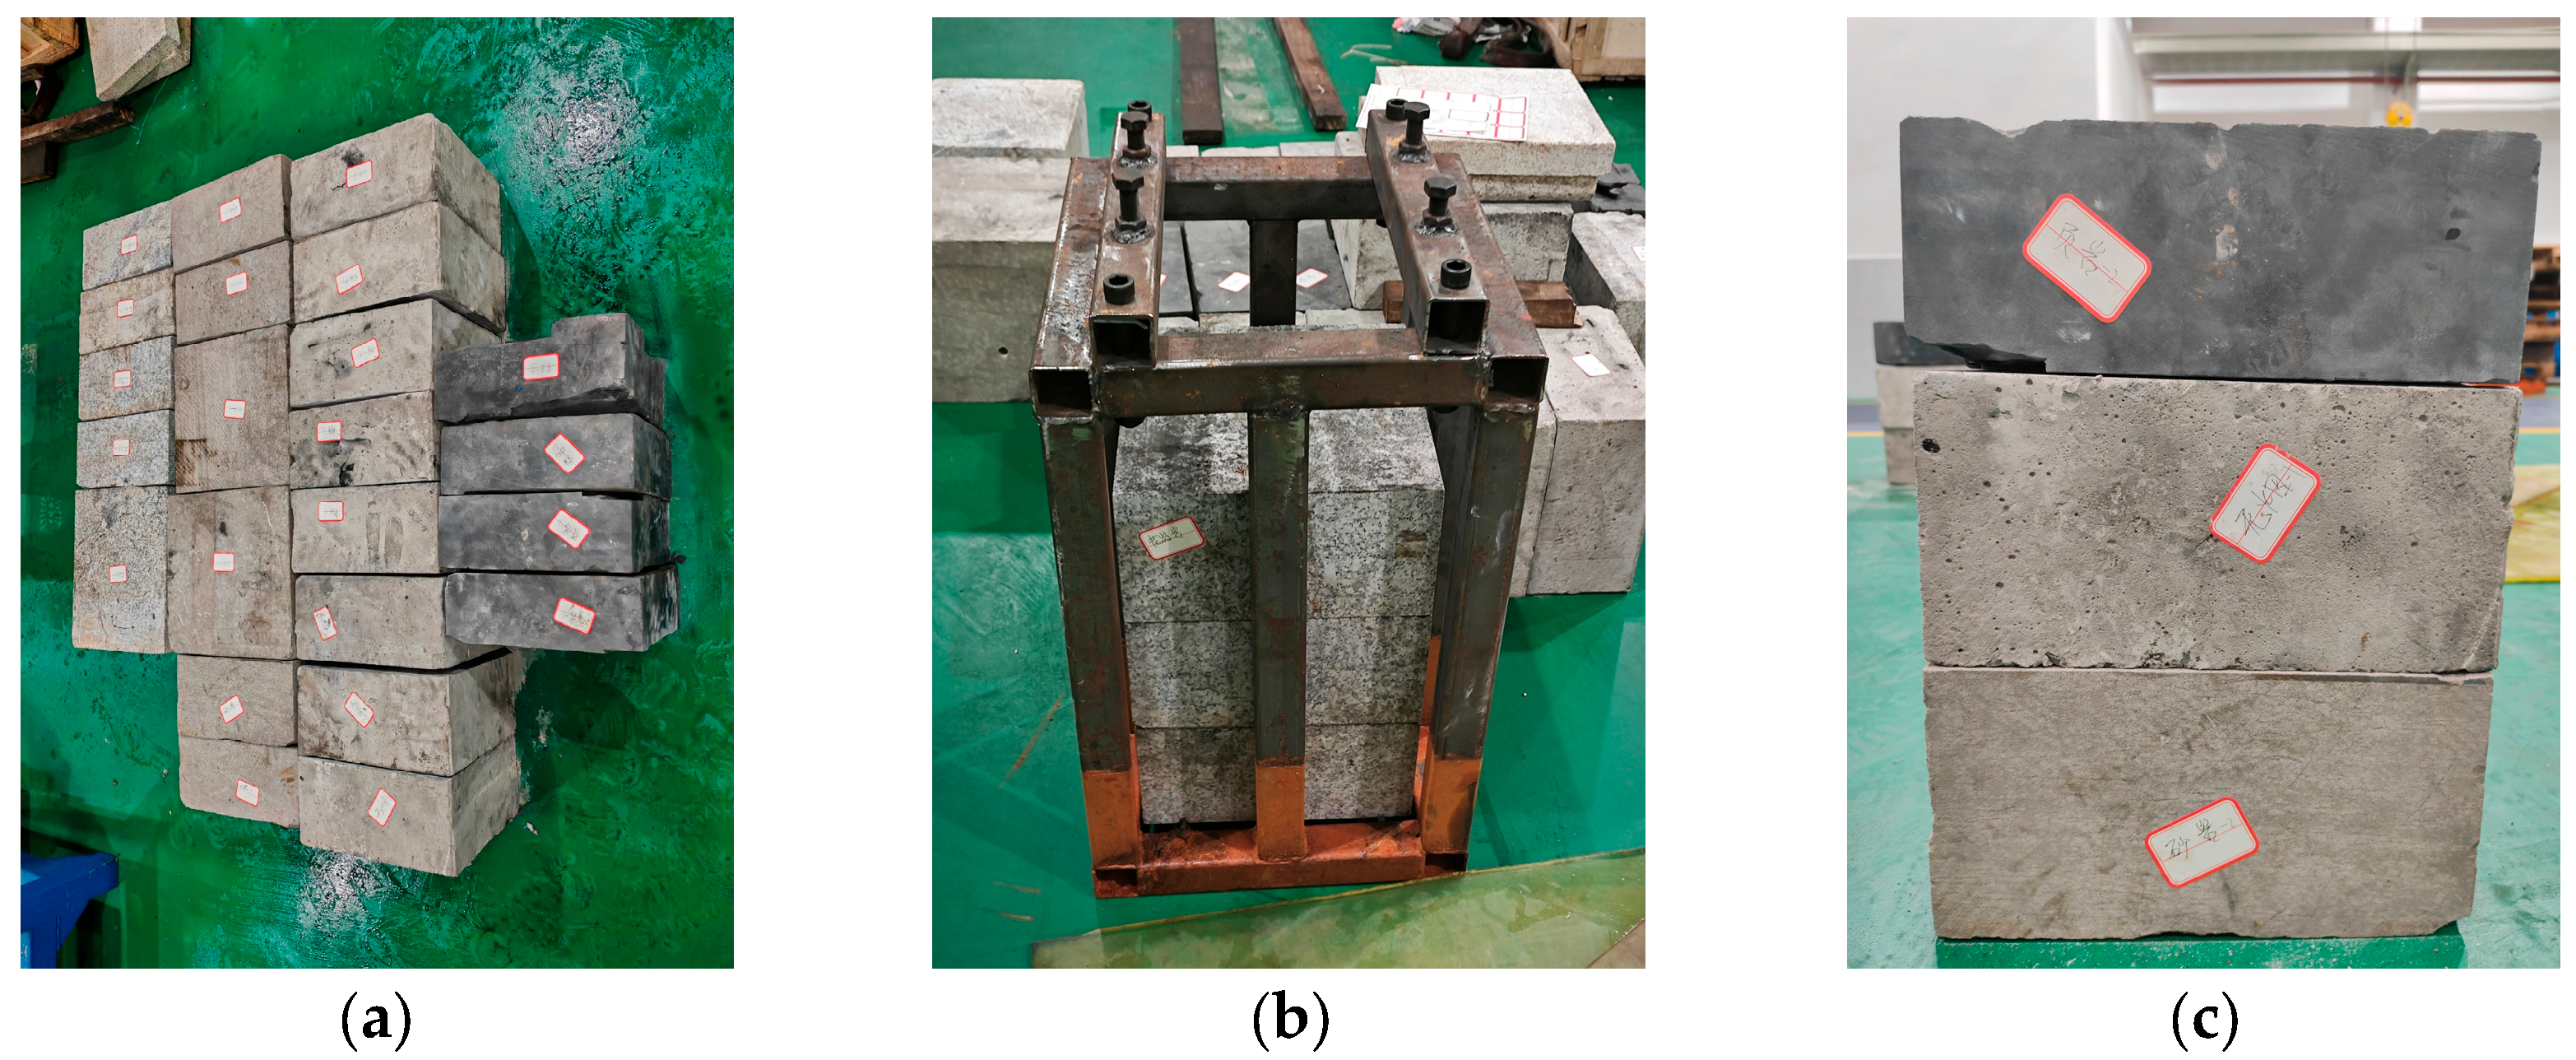
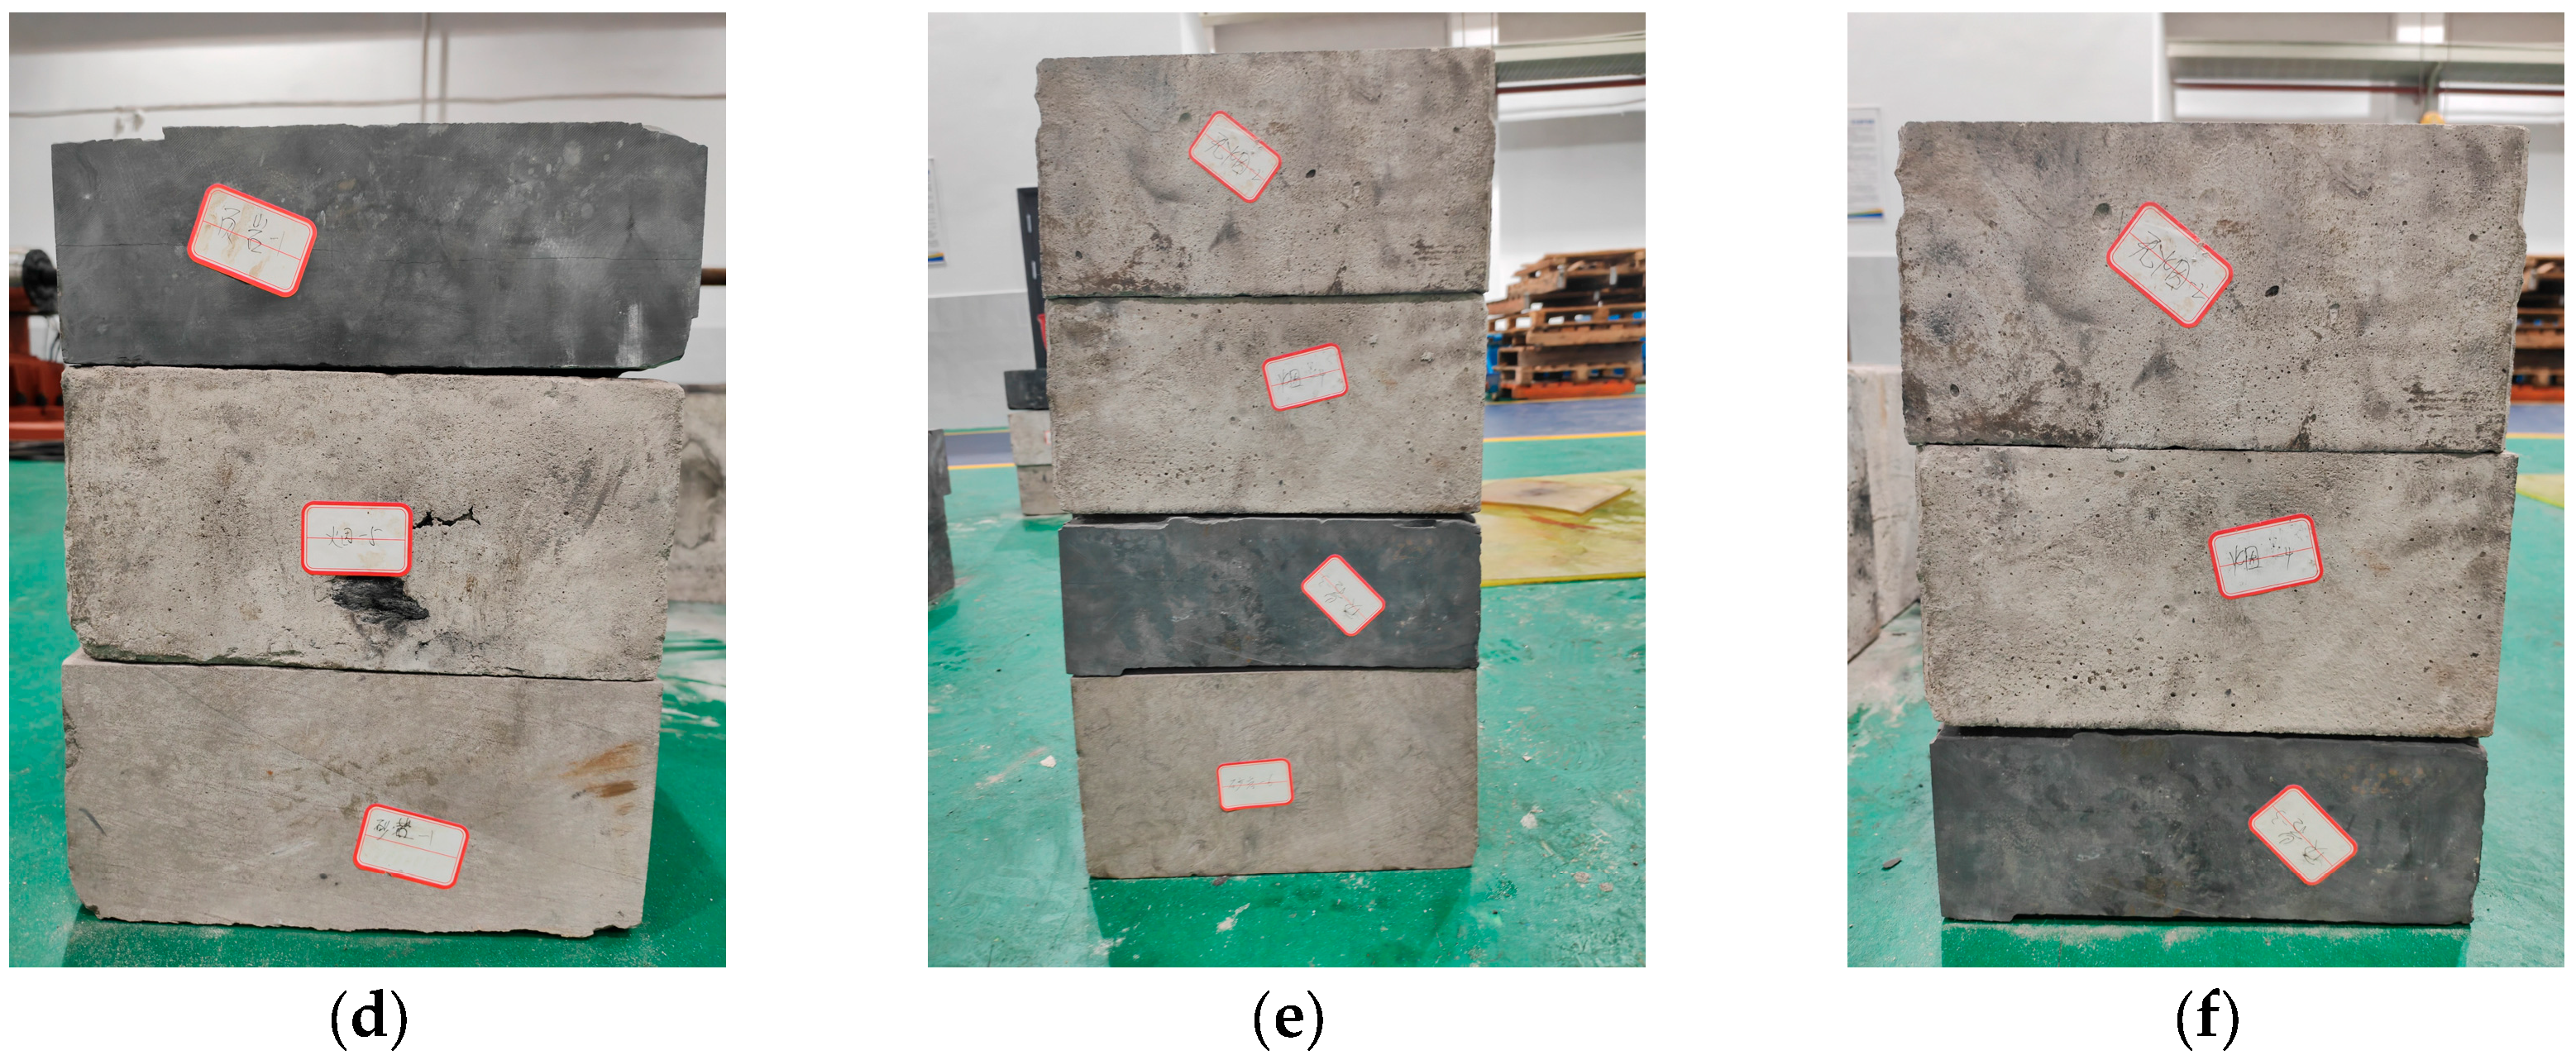
The selected rock types represent five common lithologies in coal-bearing strata: shale, sandstone, bituminous coal, anthracite, and granite. To account for differences in rock hardness and to simulate lithological interfaces with varying contrast, all rock samples were prepared as blocks with dimensions of 30 cm × 30 cm × 15 cm. Bituminous and anthracite coal samples with diameters of 15–20 cm and a thickness of 15 cm were cast and embedded in concrete to form a solid structure. The samples were divided into five groups, each stacked from top to bottom with different lithological combinations (Figure 3) to simulate interbedded strata composed of soft and hard rock. This setup aimed to assess the model’s robustness in identifying lithological transitions.
Figure 3.
Rock samples and stacking conditions. (a) Whole rock samples; (b) Granite group; (c) Shale–Anthracite–Sandstone; (d) Shale–Bituminous Coal–Sandstone; (e) Anthracite–Bituminous Coal–Shale–Sandstone; (f) Anthracite–Bituminous Coal–Shale.
Drilling operations were manually controlled via a handheld operator unit. The sensor sampling frequency was set to 2560 Hz. Due to inherent differences in the physical properties of the rock types, the duration required for the drill bit to penetrate each sample varied, leading to an imbalanced number of samples across lithologies in the constructed dataset. During drilling, triaxial vibration signals were recorded in real time and timestamped. Combined with uniform sample thickness (15 cm) and recorded drilling depth, the raw signals were subsequently segmented based on depth intervals and annotated with lithology labels, thereby generating standardized input data for model training.
2.3. Time-Frequency Feature Extraction
2.3.1. Signal Denoising and Filtering
To address the non-stationary and nonlinear characteristics of drilling vibration signals, we employed a two-stage preprocessing strategy combining adaptive wavelet denoising with Butterworth high-pass filtering. This approach aims to enhance high-frequency dynamic responses while suppressing low-frequency noise, thereby extracting more discriminative features for lithology identification.
- (1)
- Adaptive wavelet denoising
A four-level discrete wavelet transform (DWT) using the Daubechies 4 (db4) wavelet was applied to perform multi-scale denoising. Soft thresholding was used to compress the detail coefficients at each decomposition level. The denoised signal was reconstructed through inverse DWT, effectively eliminating impulse noise and high-frequency disturbances while retaining essential features. The thresholding function is expressed as Equation (1):
where λ is the threshold, σ is the estimated standard deviation of the noise, and n is the signal length.
- (2)
- High-pass filtering
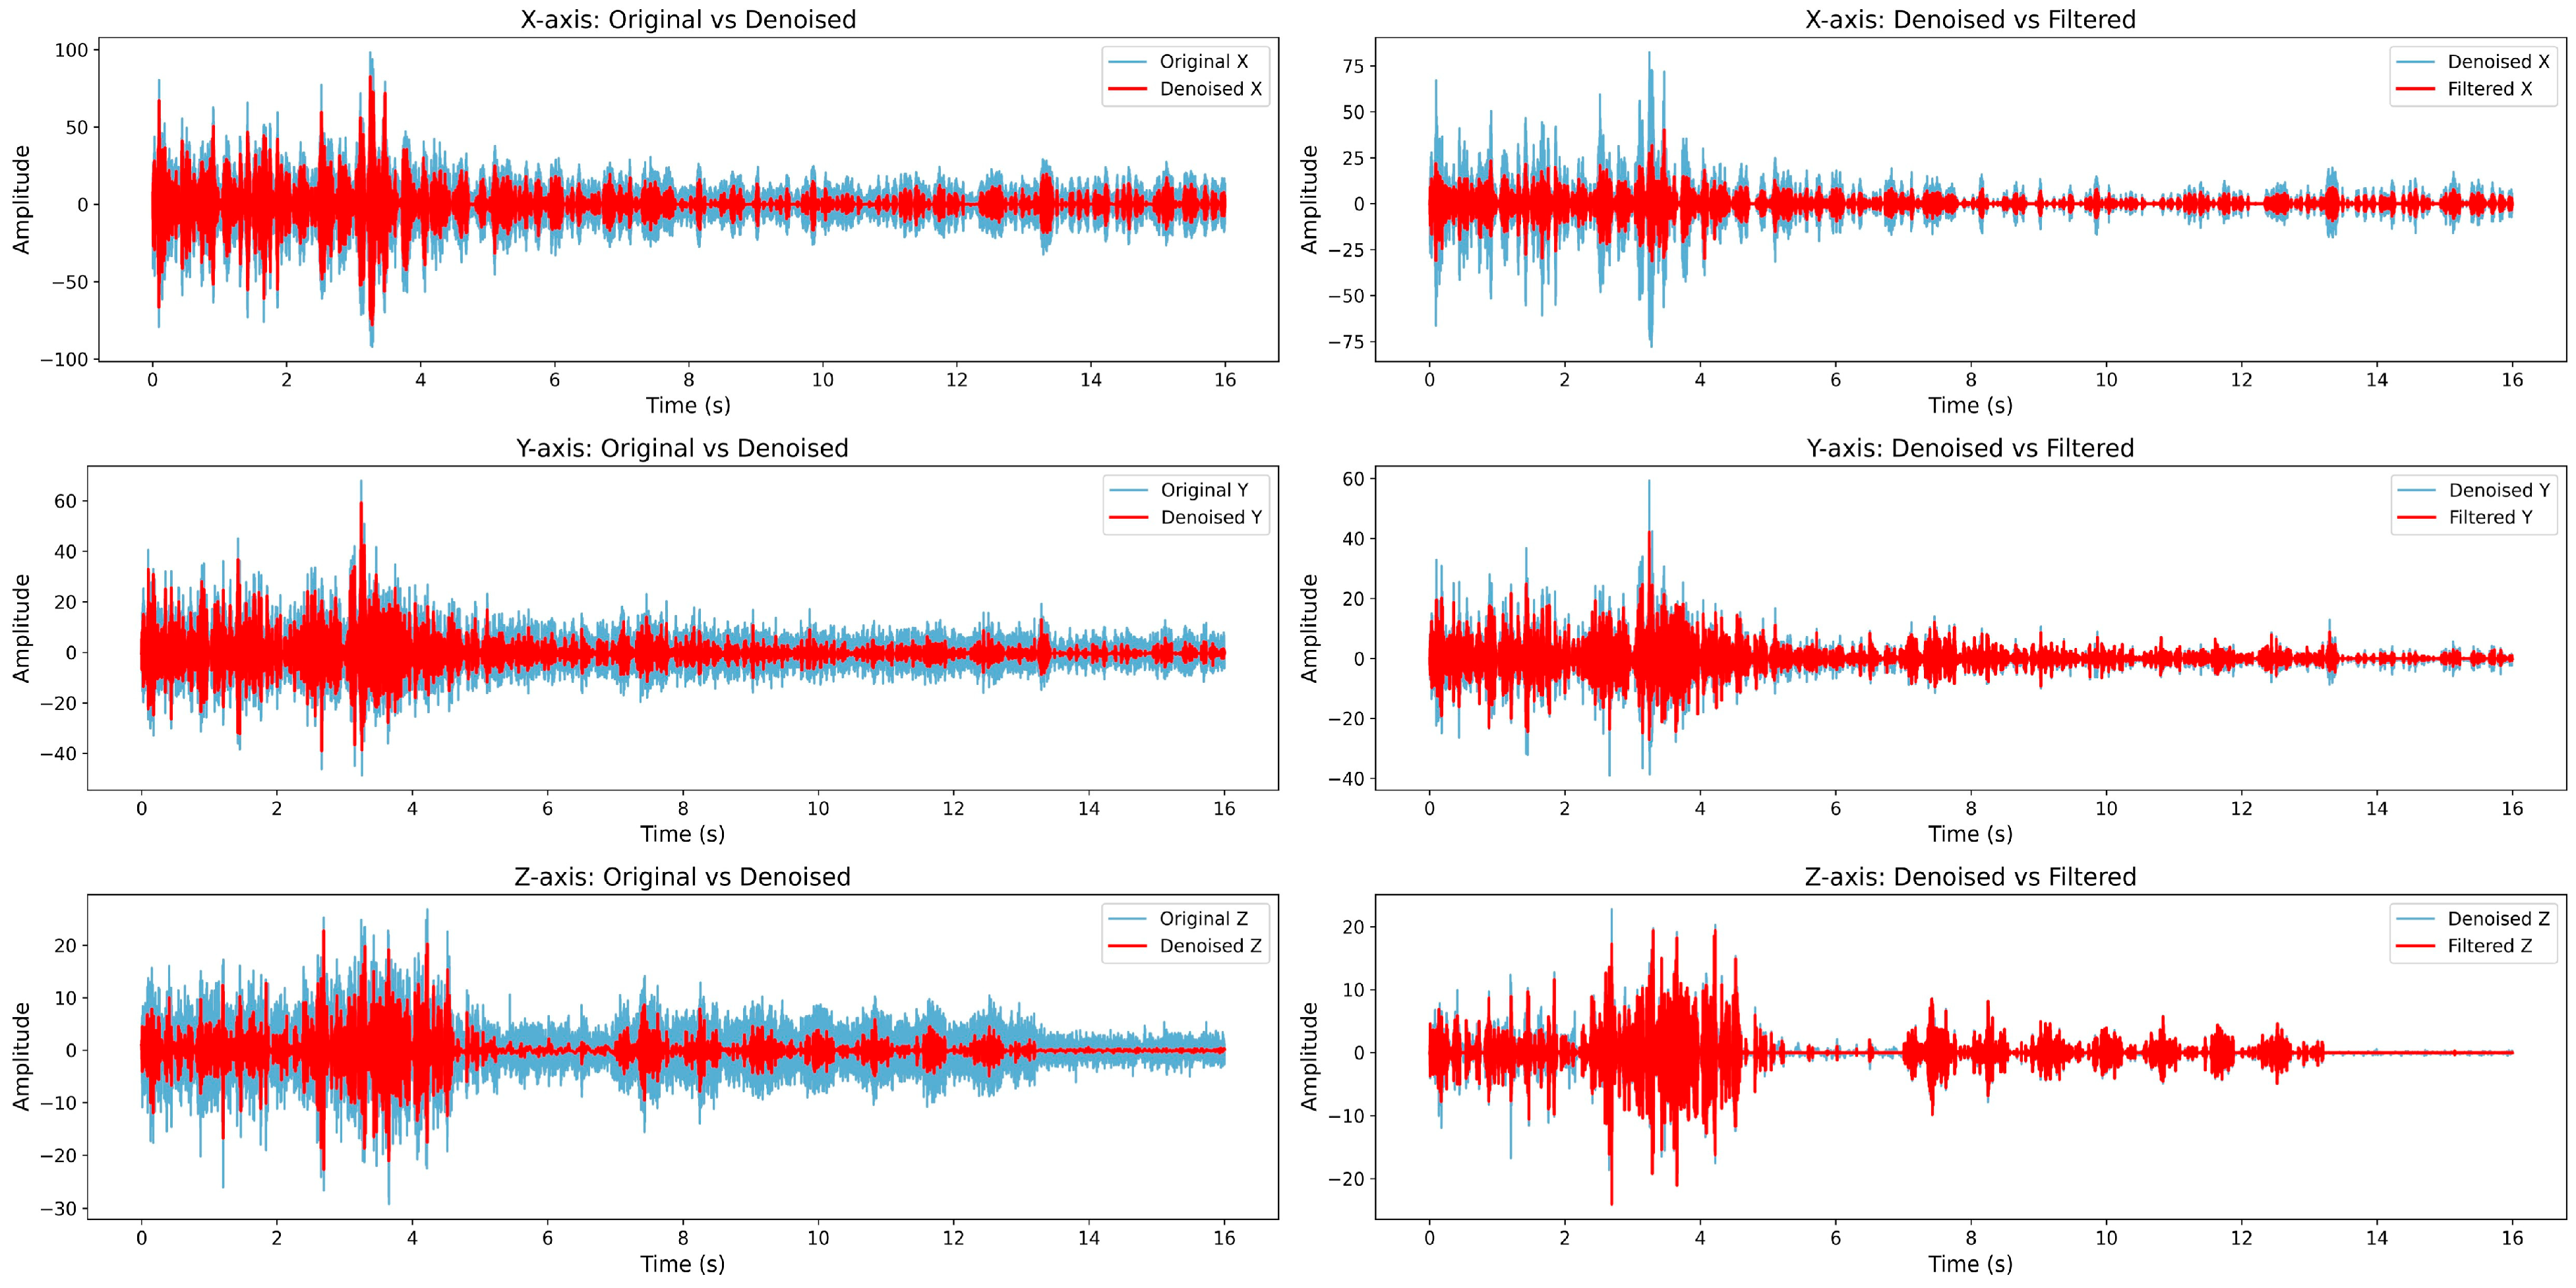
To further eliminate low-frequency drift, mechanical background noise, and other irrelevant components, a Butterworth high-pass filter was applied. This filter is well-suited for continuous dynamic drilling conditions due to its flat frequency response in the pass-band and smooth phase characteristics [38]. The filter was designed with a 4th order configuration, a cutoff frequency of 200 Hz, and a transition (corner) frequency of 20 Hz, effectively preserving dominant spectral components associated with lithological differences. An example of the denoising and filtering effect on granite sample data is illustrated in Figure 4. The transfer function of the filter is defined as Equation (2):
where |H(ω)|2 is the magnitude of the transfer function, n is the filter order, ω is the signal frequency, and ωc is the cutoff frequency.
Figure 4.
Signal preprocessing effect.
Figure 4 visualizes the stepwise preprocessing effects across the triaxial components. The left column (original vs. denoised) demonstrates that adaptive wavelet denoising effectively suppresses high-frequency stochastic interference while rigorously retaining the transient impulses. Subsequently, the right column (denoised vs. filtered) illustrates how high-pass filtering eliminates low-frequency baseline drift, rectifying the signal to a stable zero-mean state. This progressive enhancement ensures that the final signals retain only the valid dynamic responses relevant to lithology identification.
2.3.2. STFT-Based Time-Frequency Analysis
To extract the transient response characteristics of non-stationary vibration signals, STFT was applied to generate time-frequency representations for all three axes of vibration data. To ensure optimal time-frequency resolution while mitigating spectral leakage, a Hamming window (length: 256; step size: 128; 50% overlap) was employed under a sampling rate of 2560 Hz. The STFT is mathematically expressed as Equation (3):
where x[n] is the discrete time-domain signal, ω[n] is the window function, m denotes the center of the window, and ω is the angular frequency.
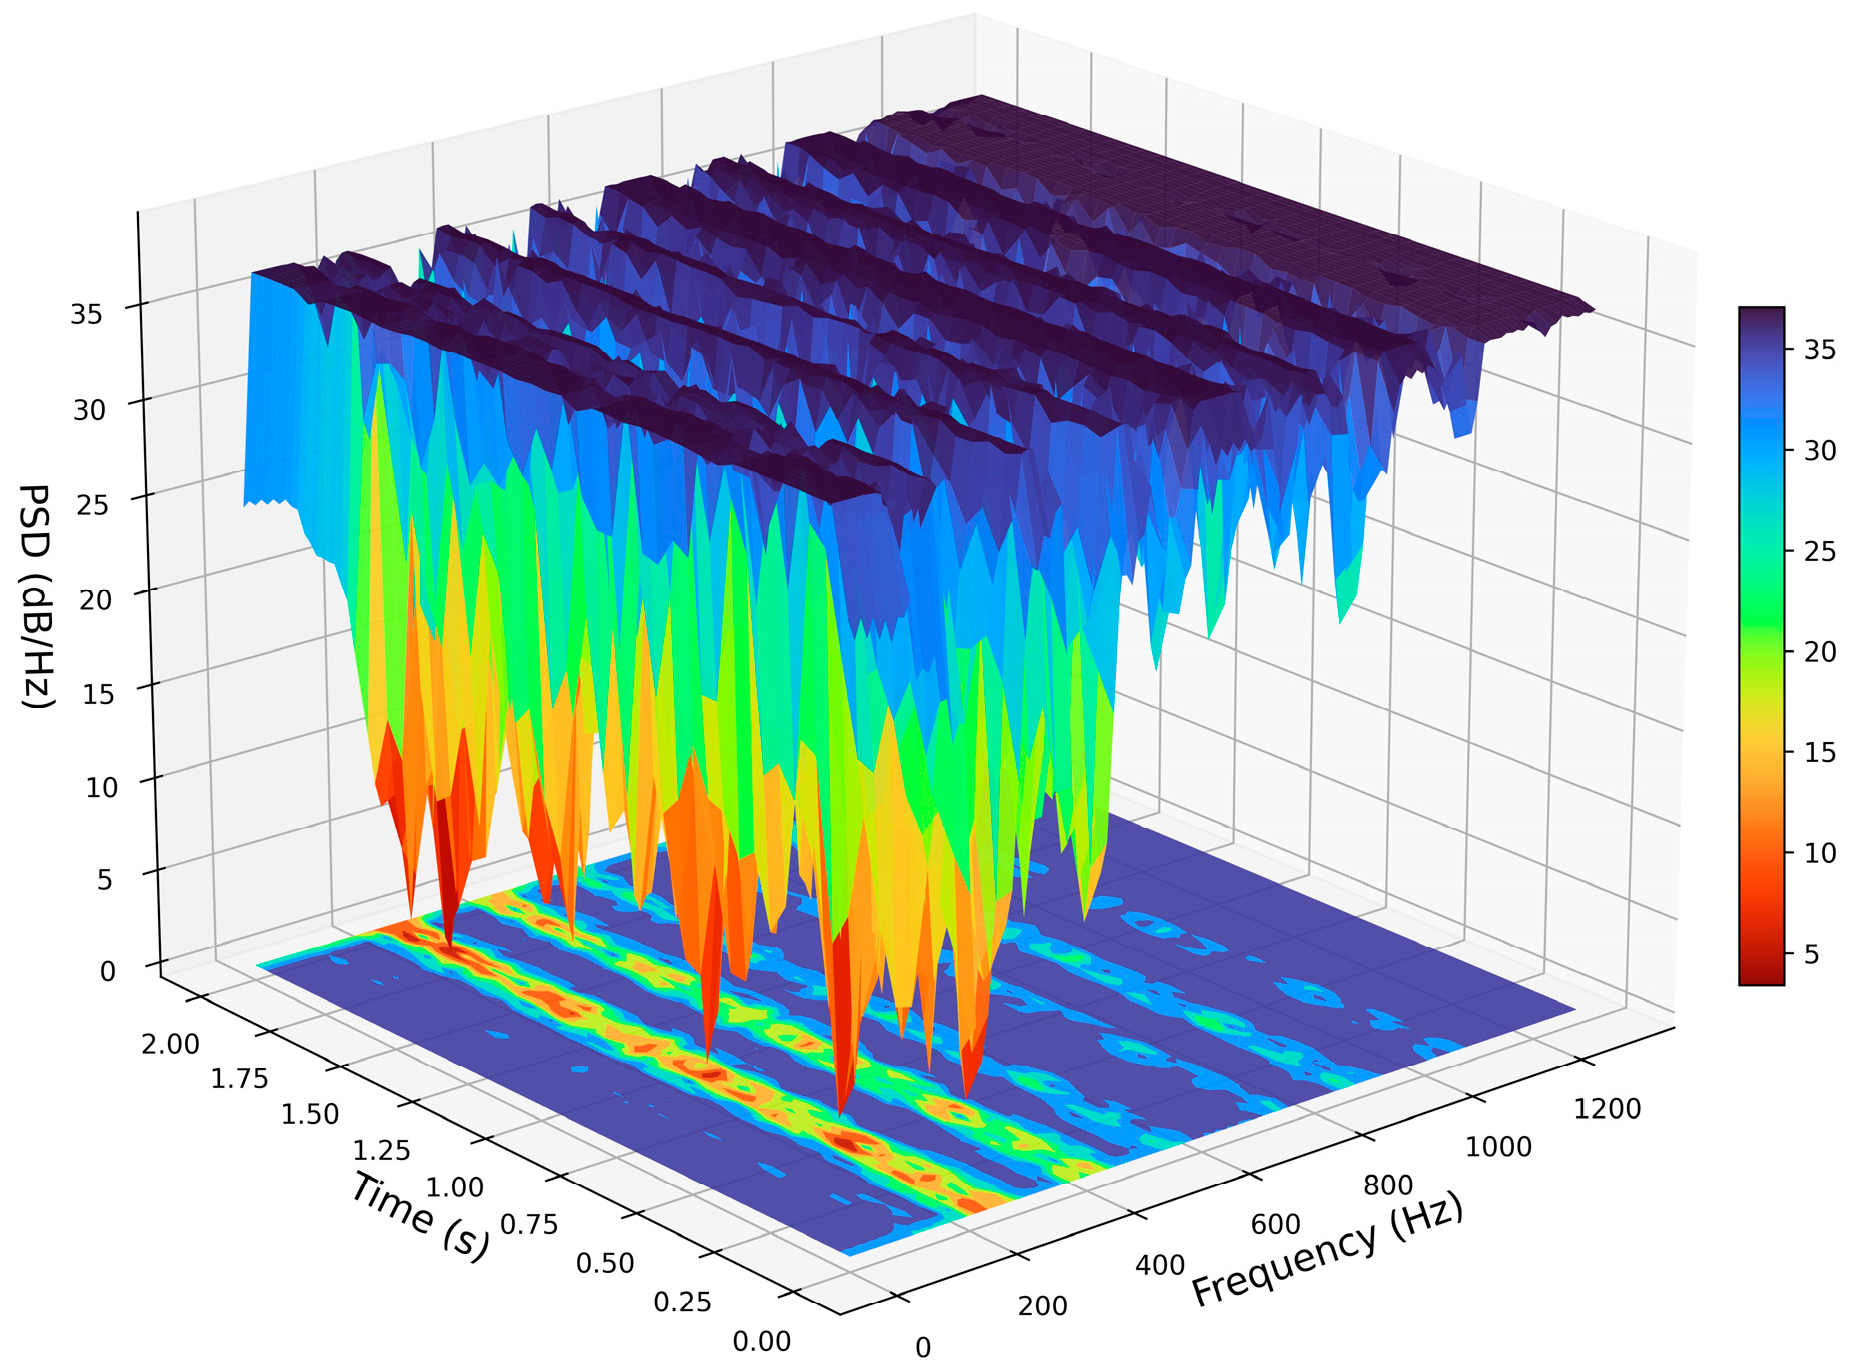
Since vibration signals are classified as power signals, their frequency-domain characteristics are better represented using PSD. Therefore, after applying STFT, the magnitude of each frequency component in each time window was squared and normalized to compute the PSD. This step enhances the visibility of lithology-specific energy distributions and improves the discriminative quality of the resulting input images. Figure 5 illustrates the 3D and 2D PSD representations (x-axis only) for a bituminous coal sample.
Figure 5.
PSD image example.
2.3.3. Multi-Channel Tensor Construction
The triaxial vibration signals acquired during drilling exhibit spatial anisotropy, with each axis capturing distinct spectral patterns corresponding to different lithologies [39,40]. To jointly capture directional dynamics and spectral structures, the PSD maps from the x, y, and z axes were stacked along the channel dimension, forming a three-channel input tensor X ∈ , where C = 3 denotes the number of channels, and H and W represent the frequency and time resolutions, respectively.
In some sections, H and W may also be denoted as F (frequency) and T (time), which are equivalent in meaning and directly derived from the STFT resolution parameters:
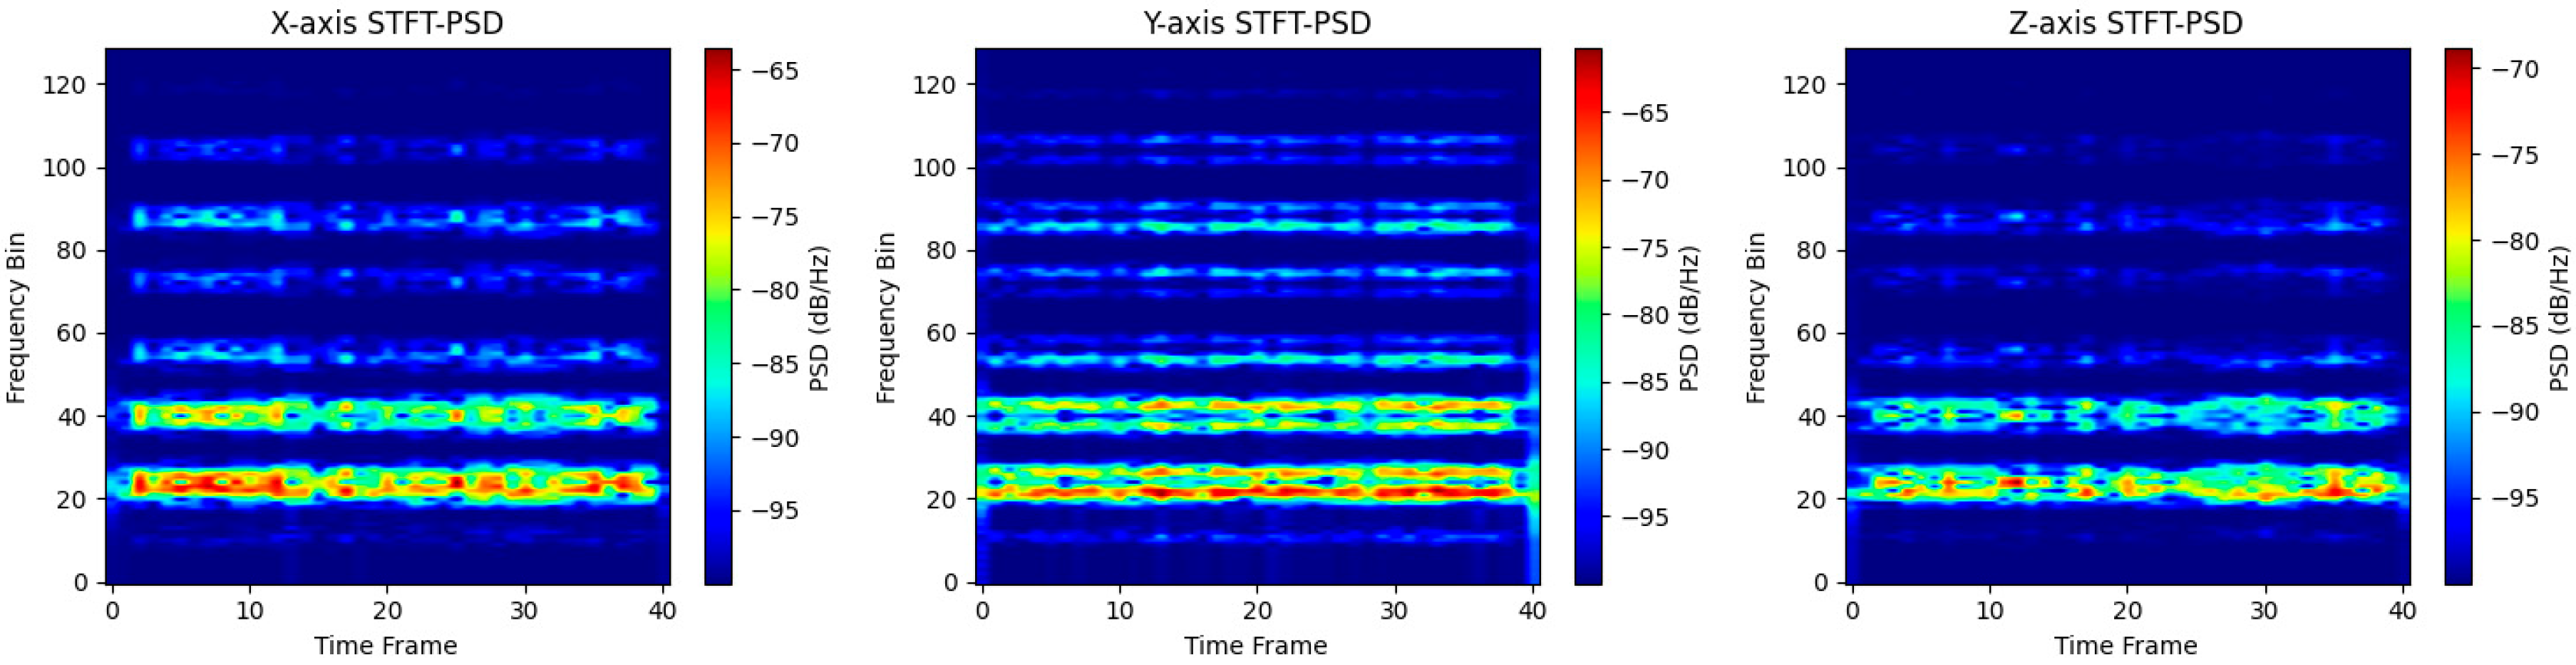
Each directional PSD map is denoted as Ix(t, f), Iy(t, f), and Iz(t, f), respectively. This tensor structure is analogous to an RGB image, where each channel encodes distinct directional information rather than color. Figure 6 shows the stacked PSD tensor of a bituminous coal sample, where the x-axis represents time frames and the y-axis denotes frequency bins. Other lithology types follow a similar stacking format.
Figure 6.
Three-channel tensor stitching effect.
By preserving both time-frequency structure and multi-axis information, this tensor representation facilitates inter-channel interaction and enables joint spatial–temporal modeling. Compared to treating triaxial signals independently, this channel-stacking strategy allows convolutional filters to more effectively learn cross-directional feature patterns, thereby improving the model’s sensitivity to lithological transitions and enhancing overall robustness.
2.4. Network Architecture Design
2.4.1. Multi-Scale Convolution for Local Feature Extraction
To enhance the model’s ability to perceive local structural patterns in time-frequency representations, a MSC module was designed for local feature extraction. This module employs parallel convolutional branches with varying receptive fields [41] to capture multidimensional image features such as energy distribution, spectral structures, and texture variations associated with different lithologies.
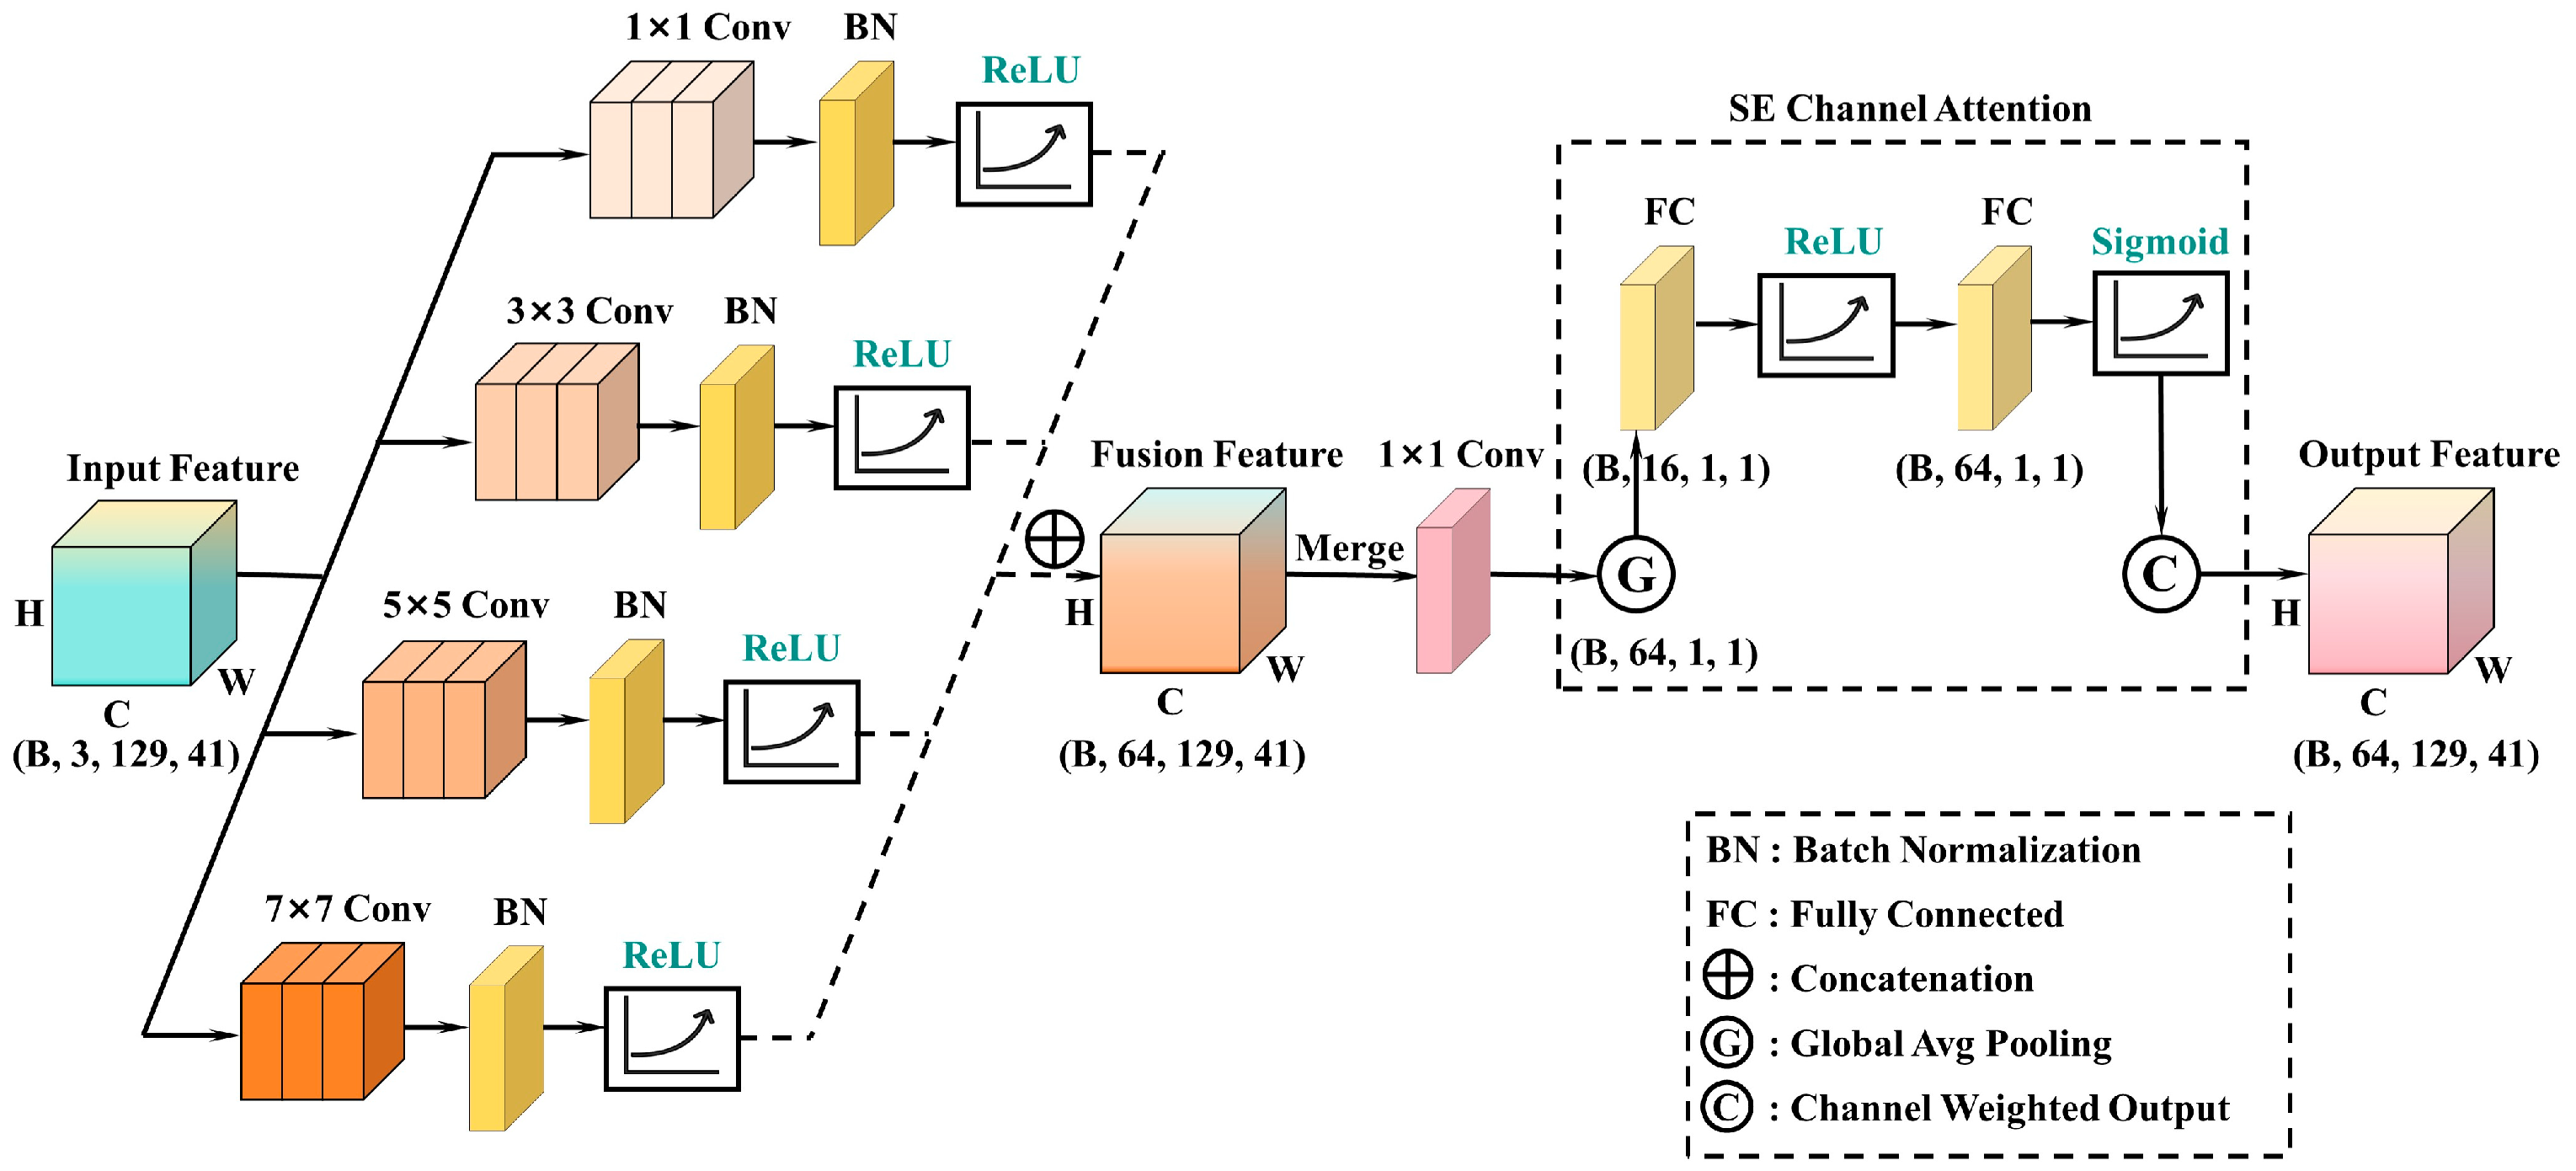
Specifically, the input time-frequency tensor X ∈ is processed through four parallel convolutional branches using kernels of different sizes: 1 × 1, 3 × 3, 5 × 5, and 7 × 7. Each branch is followed by batch normalization and a ReLU activation function to enhance training stability and non-linear expressiveness. The outputs from all branches are concatenated along the channel dimension and passed through a 1 × 1 convolution for dimensionality reduction, resulting in a unified feature map FMSC ∈ C’×H’×W’.
This structure maintains the original spatial resolution of the input while enabling the network to extract features across both fine-grained (small kernels) and coarse-grained (large kernels) scales. As a result, the model’s sensitivity to local time-frequency texture variations is significantly improved.
To further emphasize lithology-relevant features, a squeeze-and-excitation (SE) channel attention mechanism is incorporated into the MSC module. By adaptively learning the importance weights of each channel, this mechanism selectively amplifies informative features while suppressing irrelevant noise across the multi-scale branches. As illustrated in Figure 7, the MSC module serves as the initial feature extractor of the network, laying a rich, multi-granularity foundation for subsequent global modeling.
Figure 7.
Multi-scale convolutional block.
2.4.2. Transformer Encoder Module for Global Dependency Modeling
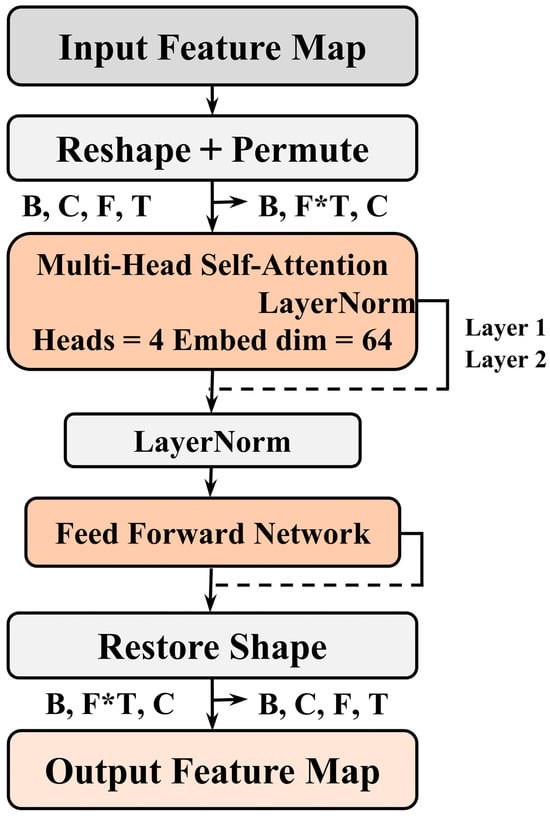
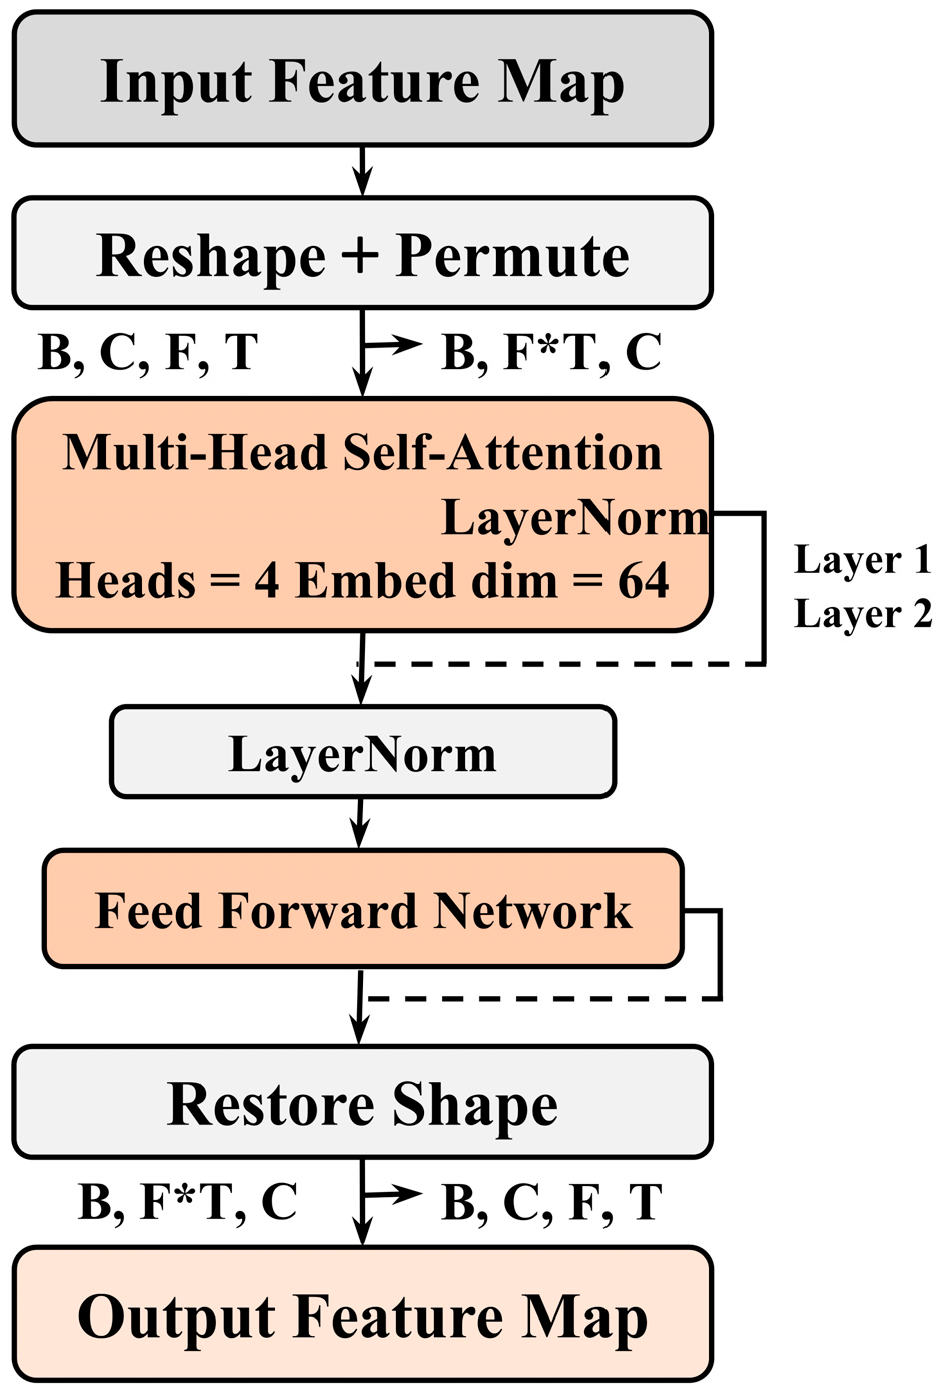
To enhance the model’s capability to capture complex lithological patterns from a global perspective, a Transformer-based encoder module is introduced as a feature enhancement unit, building upon the local features extracted by the MSC module. This module adopts the Vision Transformer architecture, enabling long-range dependency modeling across the entire time-frequency domain. The structure of the Transformer encoder is illustrated in Figure 8.
Figure 8.
Transformer encoder.
The output feature map from the MSC module, denoted as FMSC ∈ C’×H’×W’, is first reshaped and permuted into a sequence of fixed-size image patches. Each patch is flattened and linearly projected into a fixed-dimensional embedding space. Positional encoding is then added to each embedded patch to retain the spatial arrangement, forming the input sequence FMSC ∈ N×d, where N is the number of patches and d is the embedding dimension.
This sequence is then fed into a stack of Transformer encoder layers, each composed of a multi-head self-attention mechanism and a feed-forward network. The global attention mechanism enables inter-patch interactions, allowing the model to capture non-local dependencies across frequency bands and directional channels–critical for representing the coupled structures in time-frequency images [42,43].
After processing through the encoder layers, the output sequence is passed through a global average pooling layer to produce a compact global feature vector Fglobal, which serves as the input to the final classification head.
The Transformer module thus acts as a deep modeling component that complements the MSC’s local feature extraction by enhancing global context awareness, improving both lithology classification accuracy and generalization capability.
2.4.3. Feature Fusion and Classification Head
To achieve synergistic representation of both local and global features, a serial fusion strategy is adopted to integrate the MSC module and transformer encoder into a unified deep architecture. Specifically, the output of the MSC module is channel-compressed and directly fed into the transformer encoder without altering its spatial dimensions. This end-to-end serial integration allows the network to retain fine-grained local detail while enabling robust global modeling.
Such a fusion strategy minimizes feature disruption and information loss, facilitating the capture of multi-scale, direction-sensitive time-frequency features that are critical for lithology recognition.
The global feature vector Fglobal output by the Transformer is then passed into the classification head, which consists of a two-layer multilayer perceptron. The first layer uses ReLU activation, and the second layer outputs a logits vector corresponding to the number of lithology classes. A Softmax function is subsequently applied to compute the class probabilities and perform multi-class lithology classification.
2.5. Model Training and Optimization Strategy
To achieve efficient recognition of vibration signals from multiple lithologies, a training and optimization pipeline was developed based on the proposed MSC-Transformer model. This section details the core training procedures, the choice of loss function, and the evaluation metrics used to assess model performance.
2.5.1. Training Pipeline
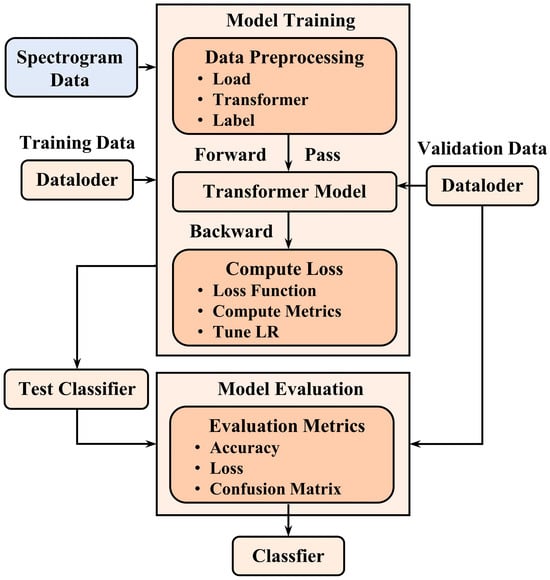
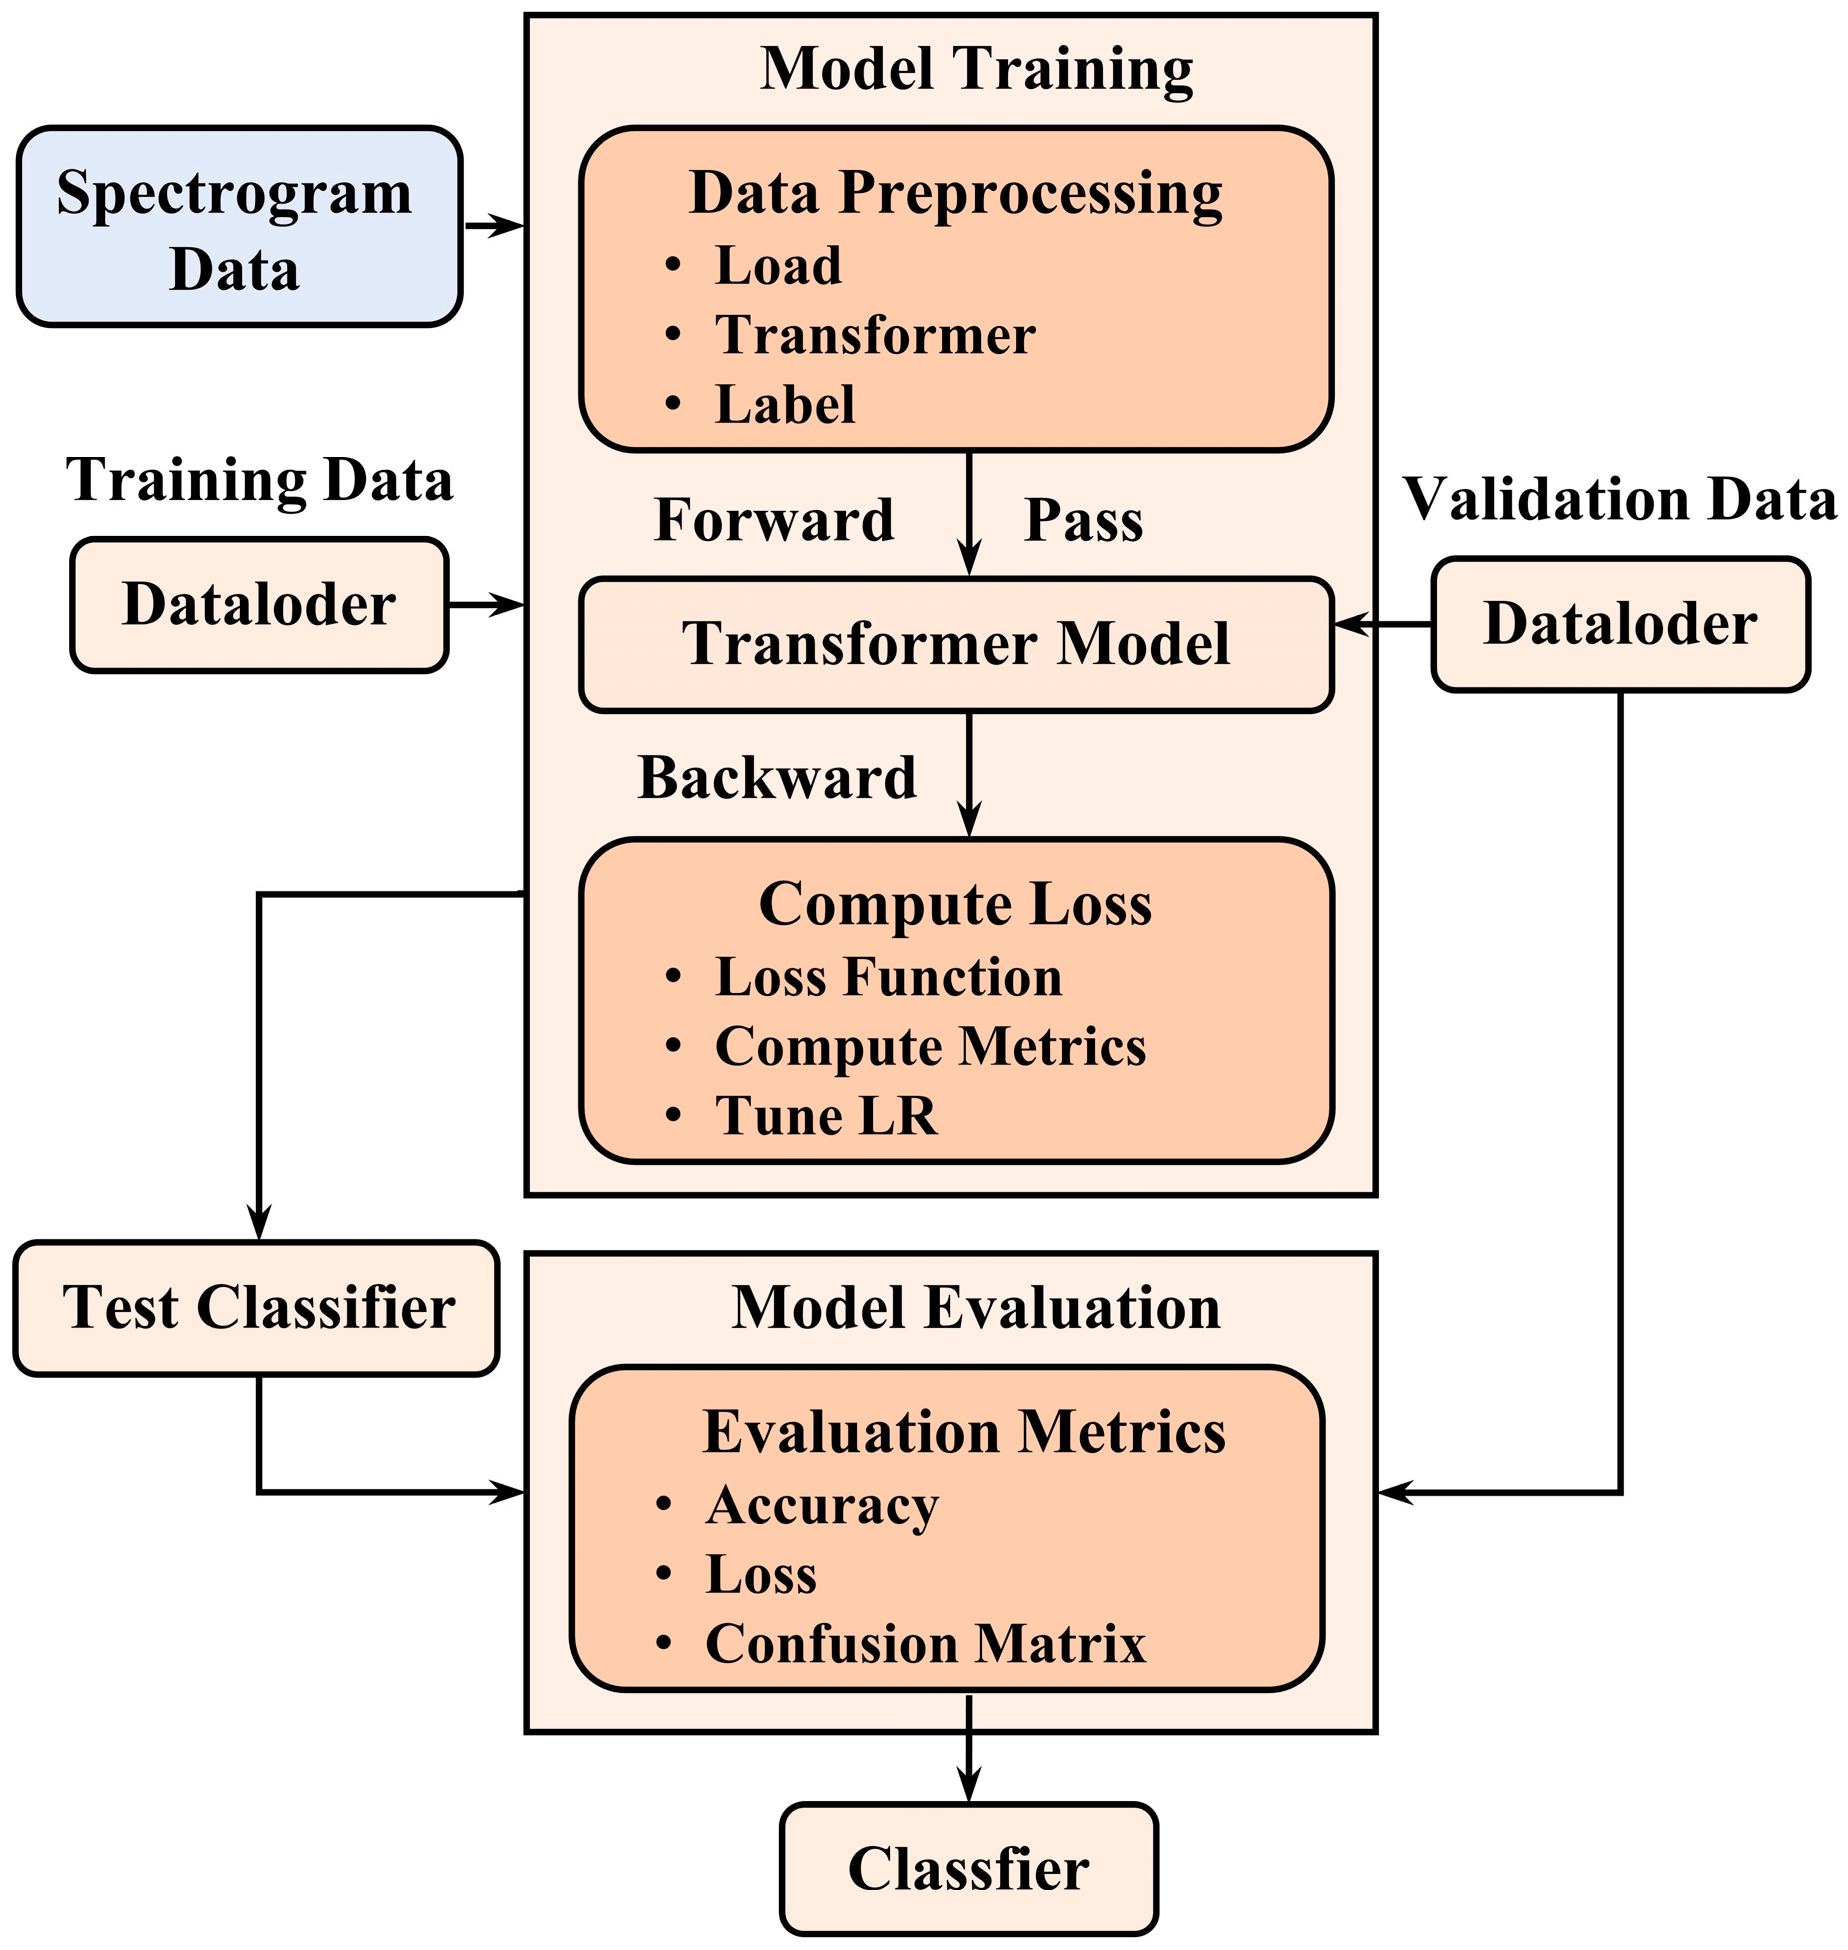
The model takes as input a three-channel time-frequency tensor X ∈ C×H×W, constructed from triaxial vibration signals. The dataset comprises multiple such tensors collected from different lithologies and drilling stages. It is split into training, validation, and testing subsets in a ratio of 8:1:1. During training, both loss and accuracy metrics are monitored across epochs to evaluate convergence. Final model performance is assessed using the test set, as illustrated in Figure 9.
Figure 9.
Model training process.
2.5.2. Loss Function
Given the multi-class nature of the lithology recognition task, the cross-entropy loss function is adopted as the optimization objective. Cross-entropy is well-suited for probabilistic output models and performs effectively in the presence of class imbalance. The loss function is defined as Equation (5):
where zi denotes the one-hot encoded ground truth label, and represents the predicted probability output for class i.
2.5.3. Evaluation Metrics
To comprehensively evaluate model performance, multiple classification metrics are employed, including precision, recall, accuracy, and F1-score. In addition, the p-value from an independent samples t-test is introduced to assess the statistical significance of performance differences. A result is considered statistically significant when p < 0.05, and highly significant when p < 0.01.
Based on the actual and predicted classification outcomes, each prediction is categorized as true positive (TP), false positive (FP), false negative (FN), or true negative (TN). The average accuracy , variance s2, and number of trials n are further computed for statistical analysis.
3. Experiments and Results
3.1. Experimental Setup and Training Configuration
All model training and evaluation tasks were conducted on a workstation equipped with an AMD EPYC 9654 96-core CPU and an NVIDIA GeForce RTX 4090 GPU (24 GB, Driver 535.104, CUDA 11.8), using the PyTorch 2.1.0 deep learning framework. Tensor data were organized by lithology class, and the dataset was randomly split into training, validation, and test sets at a ratio of 8:1:1, ensuring that the distribution of all five lithology types remained consistent across subsets (using a fixed random seed). The detailed sample distribution is provided in Table 1. During training and validation, loss and accuracy curves were recorded in real time. In the testing phase, classification reports and confusion matrices were generated to comprehensively evaluate model performance.
Table 1.
Number of samples and data set division.
3.2. Comparative Experiments
To comprehensively evaluate the effectiveness of the proposed MSC-Transformer model for multi-lithology vibration signal recognition, four representative baseline models are selected for comparison: a basic two-dimensional CNN, a deep VGG, a ResNet, and a Bi-LSTM. All baseline models are implemented under identical data partitions, input features, and training strategies. The depth of each network is adjusted through appropriate stacking methods to match the number of layers in the proposed model, ensuring fair comparisons and reliable conclusions.
The proposed model is trained and evaluated on the triaxial vibration dataset constructed in Section 2, which is derived from real drilling experiments and encompasses five lithology types with significant physical differences. The dataset exhibits complex and variable signal characteristics and includes challenges such as formation boundary interference, signal non-stationarity, and varying lithology stacking sequences, making it representative and well-suited for robustness testing.
For input representation, the CNN, VGG, ResNet, and MSC-Transformer (denoted as MSC-T) models all receive three-channel time-frequency tensor inputs with a shape of 3 × H × W. In contrast, for the Bi-LSTM model, the tensor is first averaged along the frequency dimension to produce a temporal sequence of size 3 × T, which is then fed into the network step-by-step. The architecture and hyperparameter settings of all baseline models are detailed in Table 2.
Table 2.
Configuration of baseline and proposed models.
All deep learning models were trained with a batch size of 4, while other training strategies were kept consistent. The proposed model is denoted as MSC-T. Evaluation metrics include accuracy, F1-score, accuracy improvement (Δ Acc), and p-value, providing a comprehensive assessment of classification performance and class consistency. To ensure statistical robustness, training, validation, and test sets were randomly reshuffled multiple times by changing the random seed, and the results were averaged. The comparison of the test sets is summarized in Table 3.
Table 3.
Performance comparison of different classification models.
The MSC-Transformer achieved a superior test accuracy of 98.21 ± 0.49%. As detailed in Table 3, it consistently outperformed all baseline models, with performance gains ranging from 2.54% (vs. VGG) to over 10% (vs. Bi-LSTM). Independent-sample t-tests (p < 0.05) further confirmed the statistical significance of these improvements.
Among the baseline models, VGG yielded the best performance. This is likely attributed to its stacked small (3 × 3) convolutional kernels, which are highly effective at capturing the fine-grained local texture features inherent in the PSD images. In contrast, Bi-LSTM exhibited the lowest accuracy, which may be attributed to the bidirectional propagation mechanism leading to insufficient sensitivity to local time-frequency structures.
3.3. Ablation Study
3.3.1. Effectiveness of Multi-Scale Input Fusion Strategy
To evaluate the impact of the proposed multi-channel input fusion strategy on model performance, an ablation experiment was designed to compare different tensor input structures while keeping the data preprocessing procedure and backbone network architecture unchanged. By adjusting the tensor input format, the experiment contrasts the performance of the original multi-channel input approach with several single-channel alternatives.
Specifically, the original configuration constructs a tri-axial, three-channel input tensor (denoted as T-TCT) by treating the x-, y-, and z-axis PSD images as three independent channels. This design fully retains the time-frequency characteristics of the triaxial vibration signals. To facilitate comparison, five single-channel input strategies were introduced:
- (1)
- Weighted-Fusion Single-Channel Tensor (WF-SCT): based on the energy ratio of each axis;
- (2)
- Mean-Fusion Single-Channel Tensor (MF-SCT): pixel-wise averaging of the three PSD images;
- (3)
- X-SCT, Y-SCT, and Z-SCT: using only the PSD from a single axis (x, y, or z) as the input.
All six input strategies were used to train identical MSC-T model architectures, and their classification performance was evaluated on both the validation and test sets. Performance was assessed using standard metrics including accuracy, recall, precision, and F1-score. The results are summarized in Table 4.
Table 4.
Performance comparison of six tensor structure models.
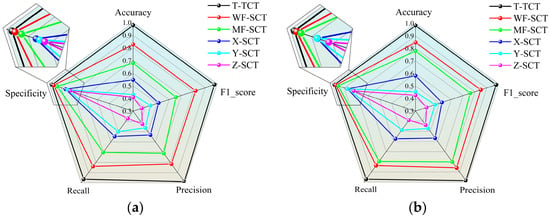
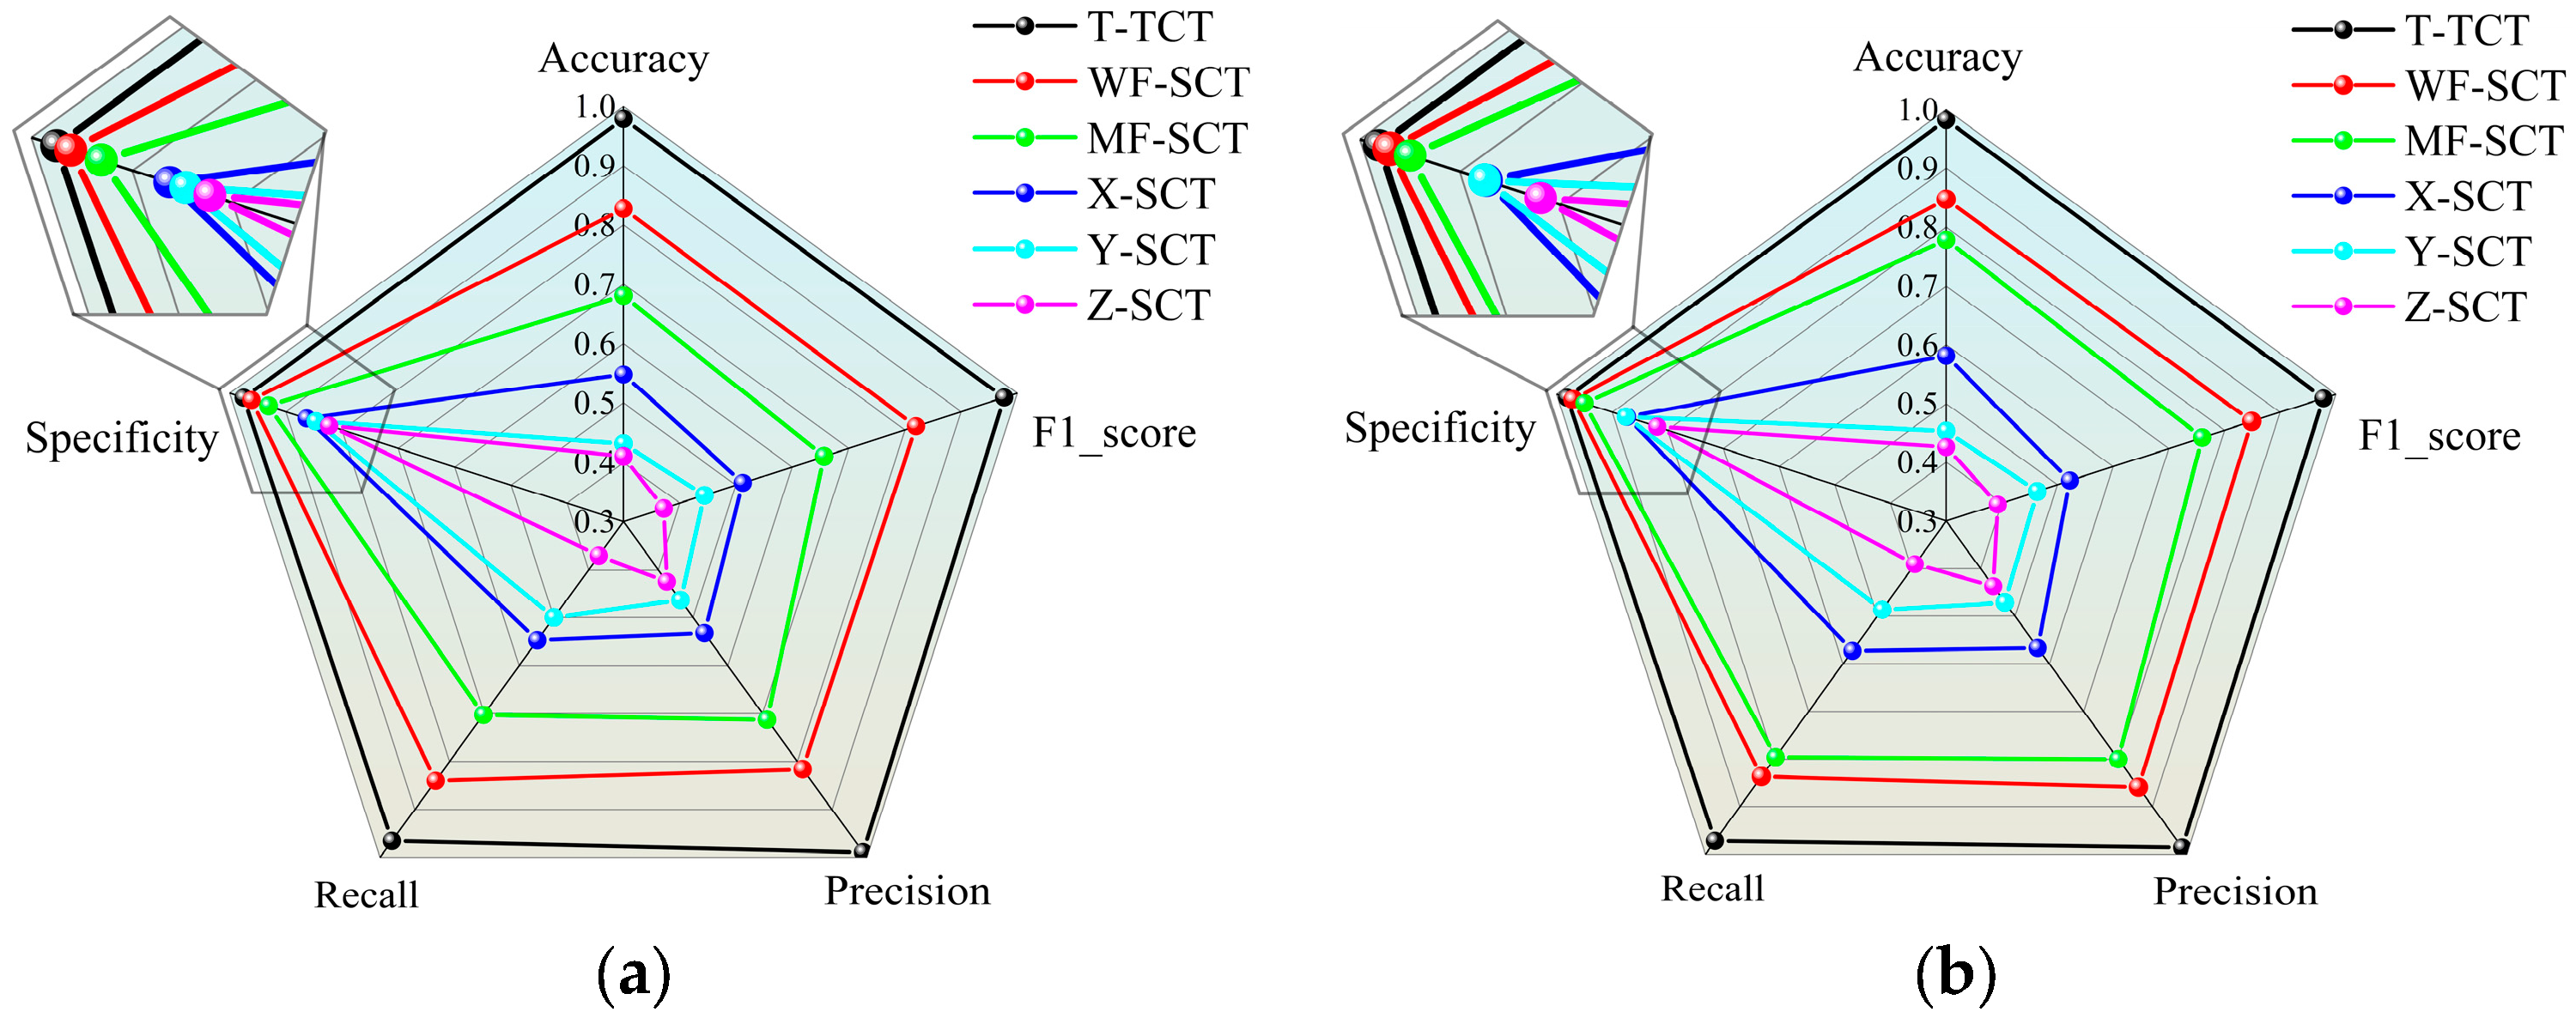
As shown in Figure 10, the MSC-T model using the tri-axial, three-channel tensor (T-TCT) achieved the best overall performance. It reached an accuracy of 98.21 ± 0.49%, an F1-score of 97.78 ± 0.38%, with a balanced recall (97.52 ± 0.65%) and specificity (98.09 ± 0.37%). These results indicate that the multi-channel strategy effectively captures the discriminative characteristics embedded in triaxial vibration signals, enabling a more comprehensive understanding of lithological features.
Figure 10.
Comparison of the performance of five tensor structure with the T-TCT. (a) Validation; (b) Testing.
In contrast, while the weighted-fusion approach (WF-SCT) slightly outperformed the mean-fusion method (MF-SCT) across several metrics, both showed a notable performance gap compared to T-TCT. This suggests that channel-wise averaging or compression may obscure important directional variations, weakening feature expressiveness and ultimately degrading classification accuracy.
Among the three single-axis strategies, the x-axis input (X-SCT) yielded the highest performance but still fell short of the multi-channel baseline. The y- and z-axis inputs were even less effective, with Z-SCT performing the worst (accuracy: 42.62 ± 3.87%, F1-score: 39.25 ± 3.79%), indicating limited capacity in capturing lithological variations. These results further confirm the complementary nature of triaxial data and highlight the inadequacy of single-axis inputs in complex lithology recognition tasks.
In summary, the multi-channel fusion strategy preserves the complete time-frequency structure of the triaxial vibration signals and significantly enhances the model’s perception of both local textures and global dynamics. This strategy provides a more discriminative input representation, effectively supporting the downstream multi-scale convolution and Transformer modules and ultimately improving overall classification performance.
3.3.2. Transformer Encoder Ablation
To evaluate the effectiveness of the Transformer encoder in capturing global time-frequency dependencies, an ablation experiment was conducted by removing the Transformer module while retaining the MSC module and the classification head. All other settings, including input features, training strategies, and hyperparameters, were kept identical to the original configuration.
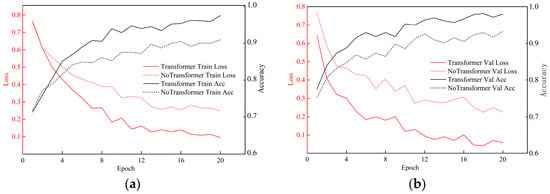
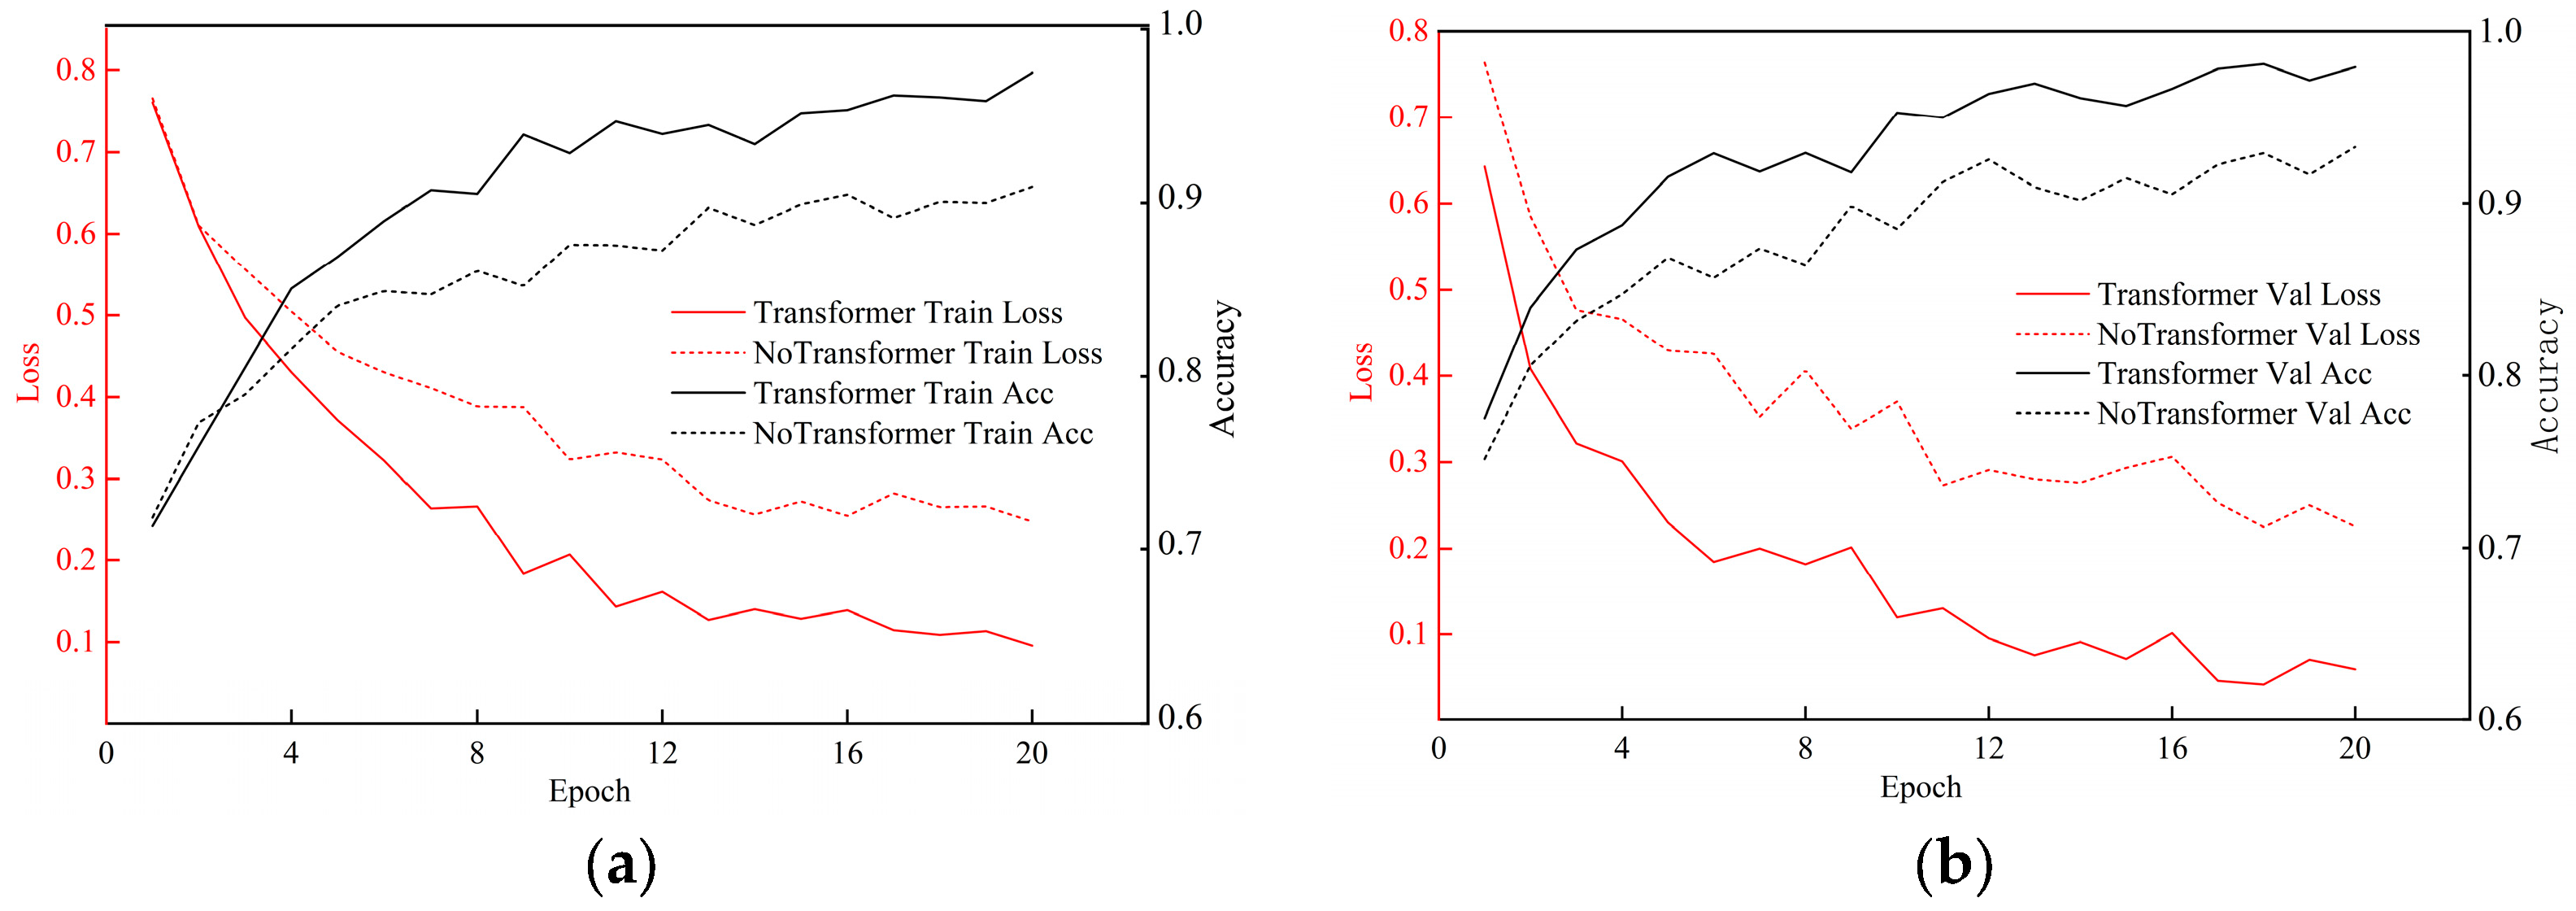
After training, the ablated model exhibited a decrease in performance, with a test accuracy drop of Δ Acc = 2.96 ± 1.21% and a decrease in F1-score of Δ F1 = 4.41 ± 1.60%. Other results are shown at the end of Section 3.3. The training curve of the run closest to the average performance is shown in Figure 11.
Figure 11.
Model training curve before and after ablation. (a) Training set curve; (b) Verification set curve.
As illustrated, the removal of the Transformer encoder resulted in a noticeable decline in overall model performance, particularly with a validation accuracy drop exceeding 5%. This suggests that the Transformer plays a pivotal role in enhancing cross-temporal feature aggregation and capturing long-range contextual dependencies. These results further highlight the necessity and effectiveness of the joint modeling strategy that integrates convolutional operations with Transformer-based encoding.
3.3.3. Effectiveness of Multi-Scale Convolution Strategy
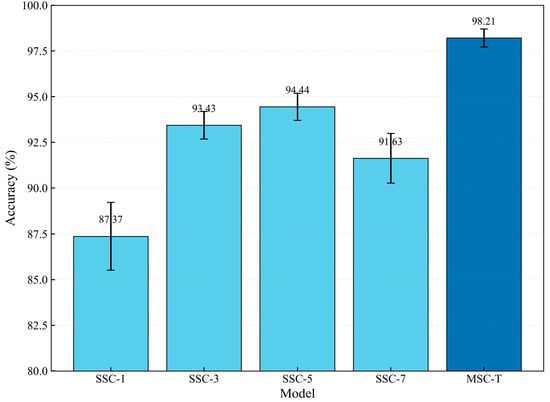
To comprehensively assess the contribution of the MSC module to local structural feature extraction, a series of controlled ablation experiments were designed. The original MSC structure—comprising parallel convolutions with kernel sizes of 1 × 1, 3 × 3, 5 × 5, and 7 × 7—was replaced with single-scale convolutional (SSC) structures using only one kernel size at a time. The Transformer encoder and classification head remained unchanged, and all other configurations were kept consistent.
The resulting models were denoted as SSC-1, SSC-3, SSC-5, and SSC-7, according to the respective kernel sizes. The comparison results are presented in Figure 12.
Figure 12.
The accuracy of MSC ablation model.
All single-scale models underperformed compared to the MSC-based architecture, and their performance fluctuated depending on the receptive field size. This limitation in representation capacity reduced their generalization ability in complex geological settings. In contrast, the MSC module significantly enhanced the model’s responsiveness to diverse texture scales and frequency details by leveraging parallel receptive fields, confirming its effectiveness in lithology classification tasks involving heterogeneous time-frequency patterns.
Furthermore, it should be noted that the comparisons between the full model and the variants lacking either the MSC or the Transformer module sufficiently reveal the individual contributions of each component. As for the variant with both MSC and Transformer removed, its performance is already reflected in the CNN baseline model discussed in Section 3.2, representing the lower bound of joint modeling performance. Therefore, it is not reiterated here. The ablation test set results for the MSC and Transformer modules are shown in Table 5.
Table 5.
Ablation results for MSC and Transformer modules.
3.4. Visualization and Interpretation
3.4.1. Comparison of Time-Frequency Maps
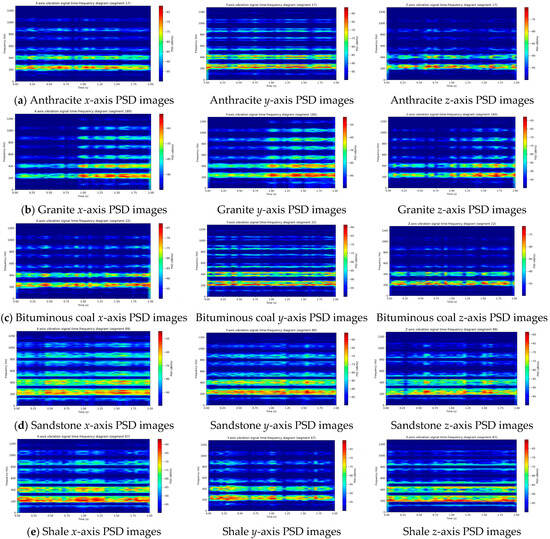
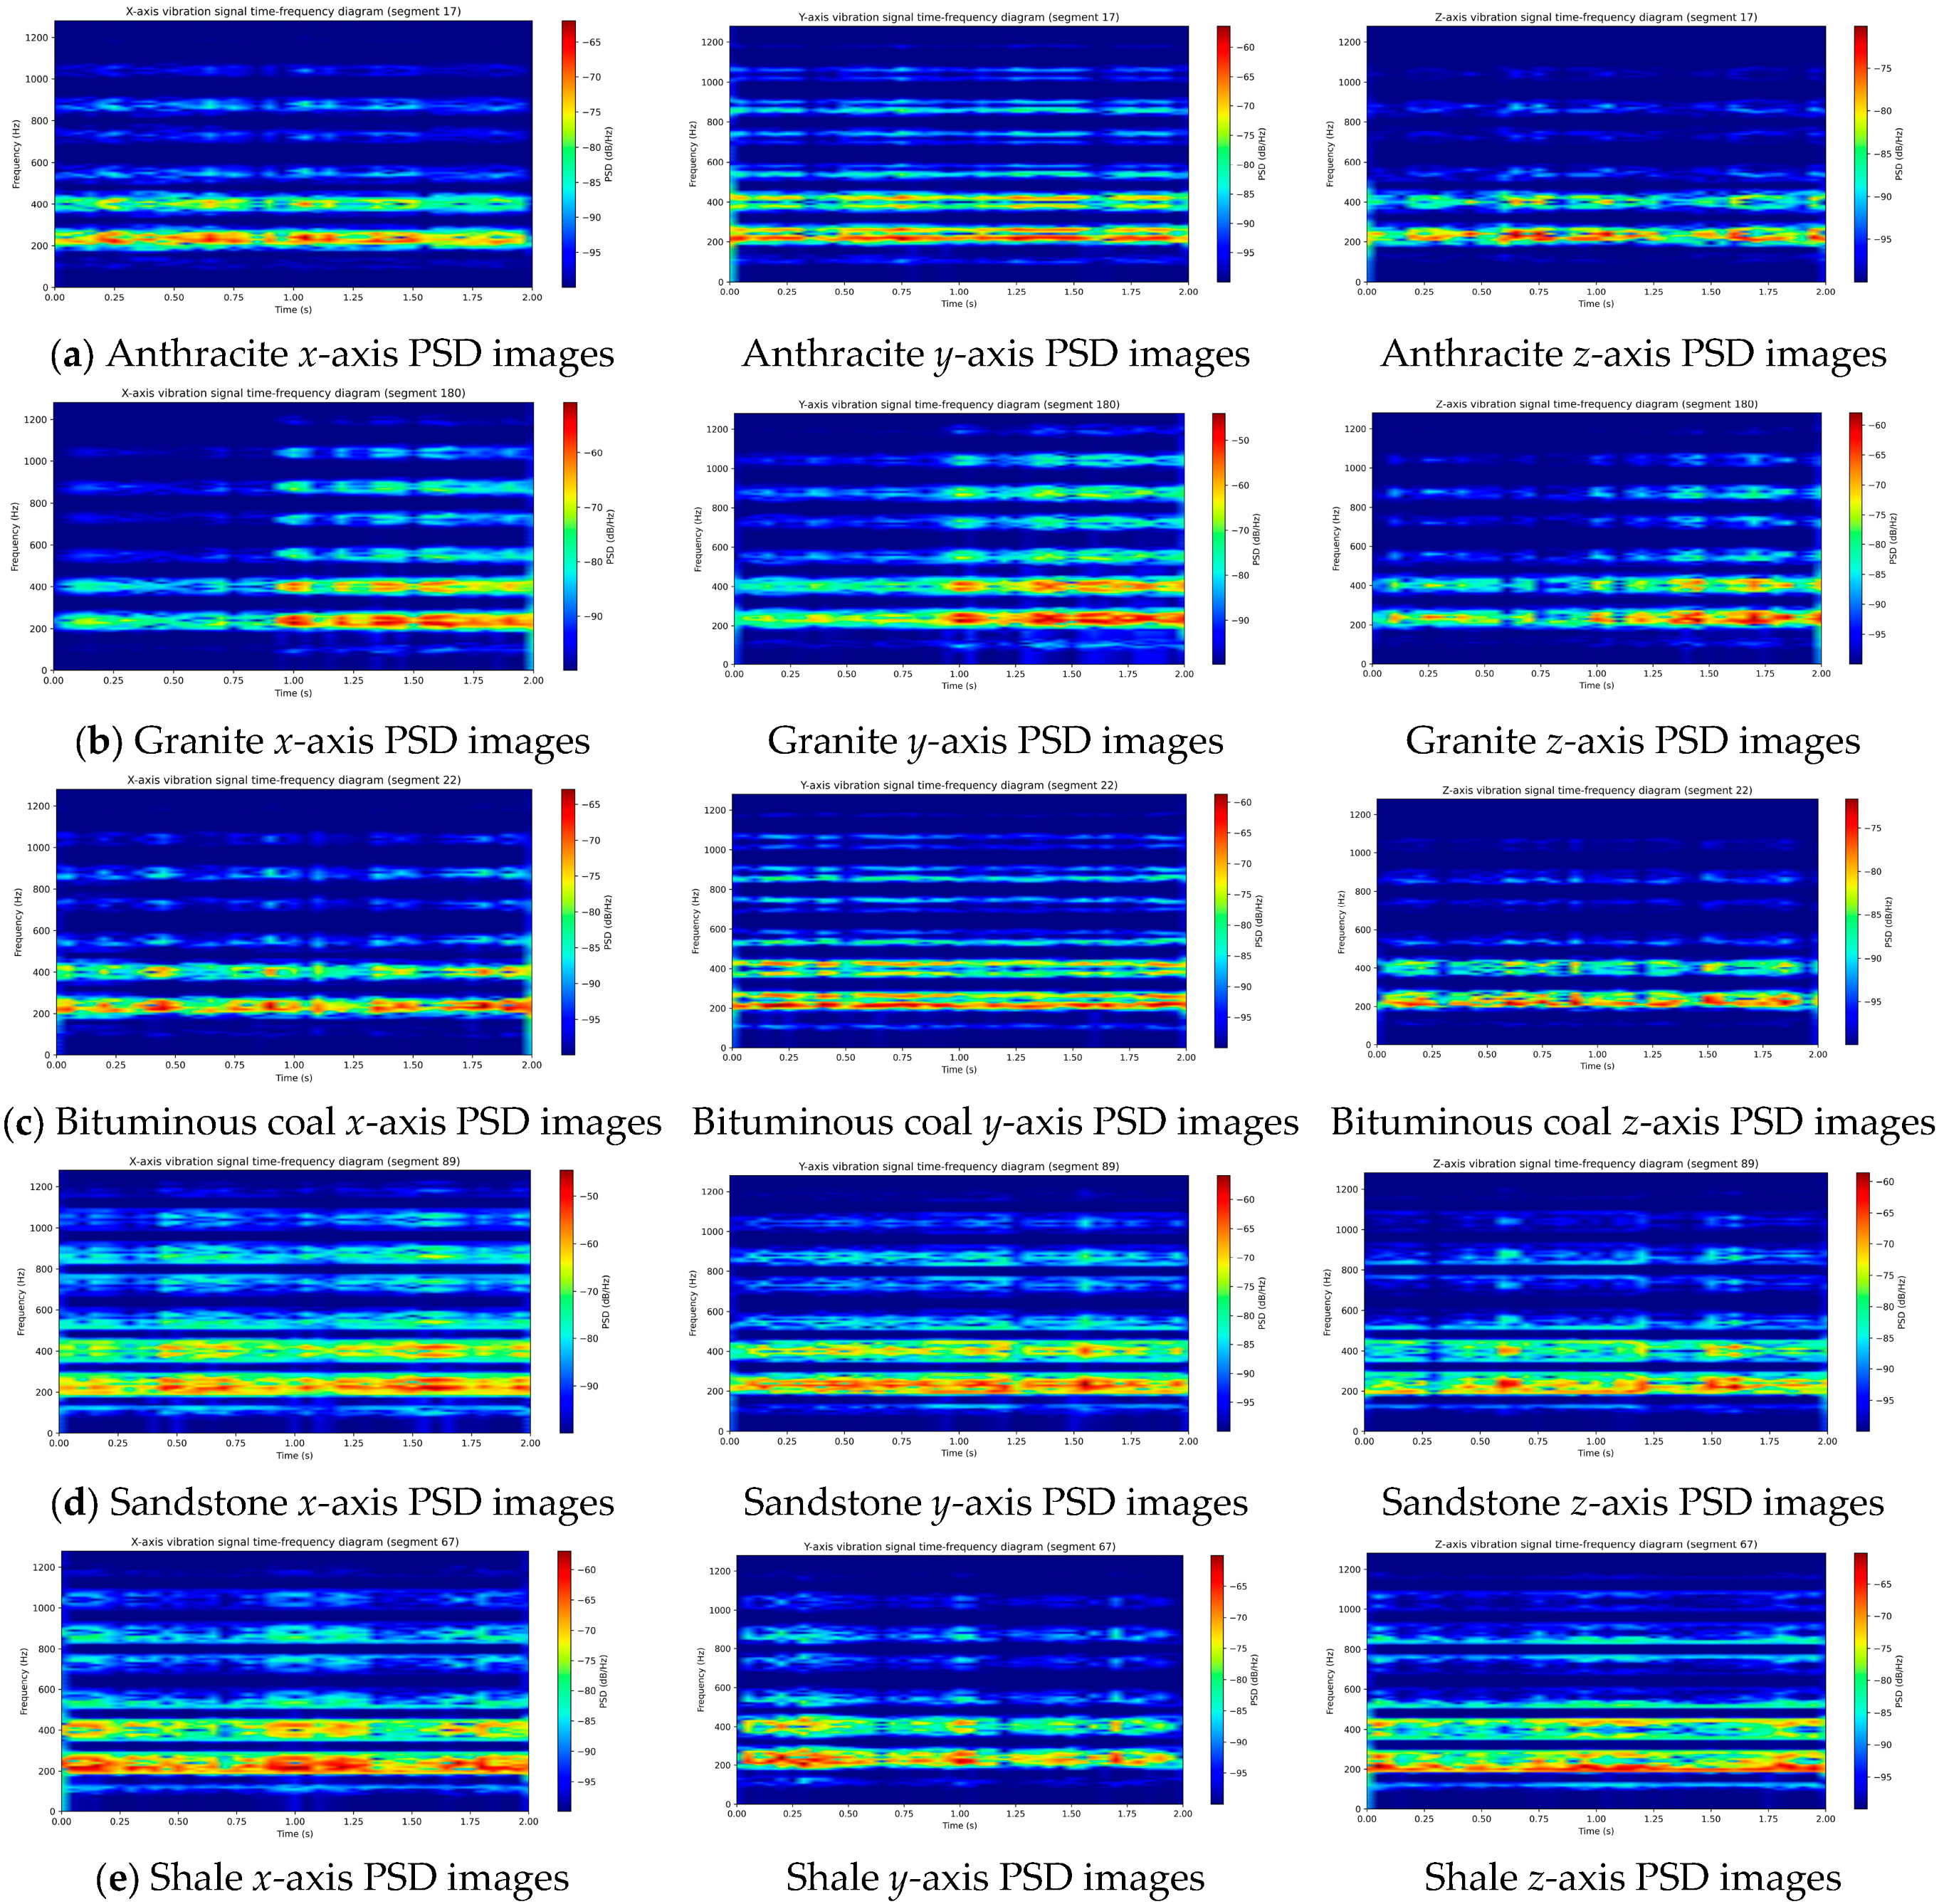
To further analyze the model’s response mechanisms across different lithologies and provide interpretability into its decision-making process, PSD images of correctly classified test samples were visualized and compared (Figure 13). Given the model’s sensitivity to high-frequency components and the practical sampling rate, this section focuses on the 200–1280 Hz range. In this band, preprocessing effectively suppressed low-frequency noise while retaining essential local texture and instantaneous frequency variations.
Figure 13.
Correctly classified PSD images. The rows correspond to different rock samples: (a) Anthracite; (b) Granite; (c) Bituminous coal; (d) Sandstone; (e) Shale. The columns, from left to right, represent the X-axis, Y-axis, and Z-axis components, respectively.
The images reveal distinct texture patterns among the five lithology categories within the high-frequency range. In the 200–450 Hz band, all lithologies exhibit four bright energy bands. However, coal samples show sharper and more uniform edges, whereas rock samples have blurrier texture boundaries. Additionally, rock samples display relatively stable stripe patterns in the 500–1100 Hz range, with visible texture differences between lithologies. Coal samples also show intermittent bands, but with significantly lower brightness. Moreover, the Z-axis spectrogram tends to exhibit lower brightness and less pronounced stripe texture compared to the X- and Y-axes, indicating a relatively weaker capacity for lithological discrimination when used individually.
These differences in stripe patterns provide a strong basis for local feature extraction by the convolutional module and indirectly confirm the discriminative power of high-frequency textures in lithology classification. The correlation between image characteristics and model predictions demonstrates that the proposed model effectively utilizes high-frequency information to distinguish complex lithological types.
3.4.2. Visualization of Attention Weights
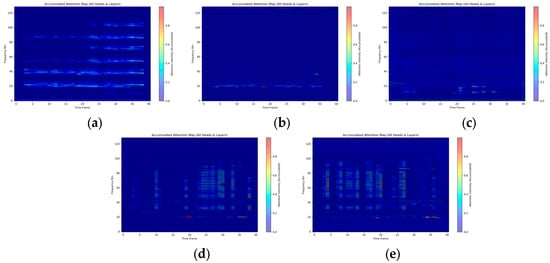
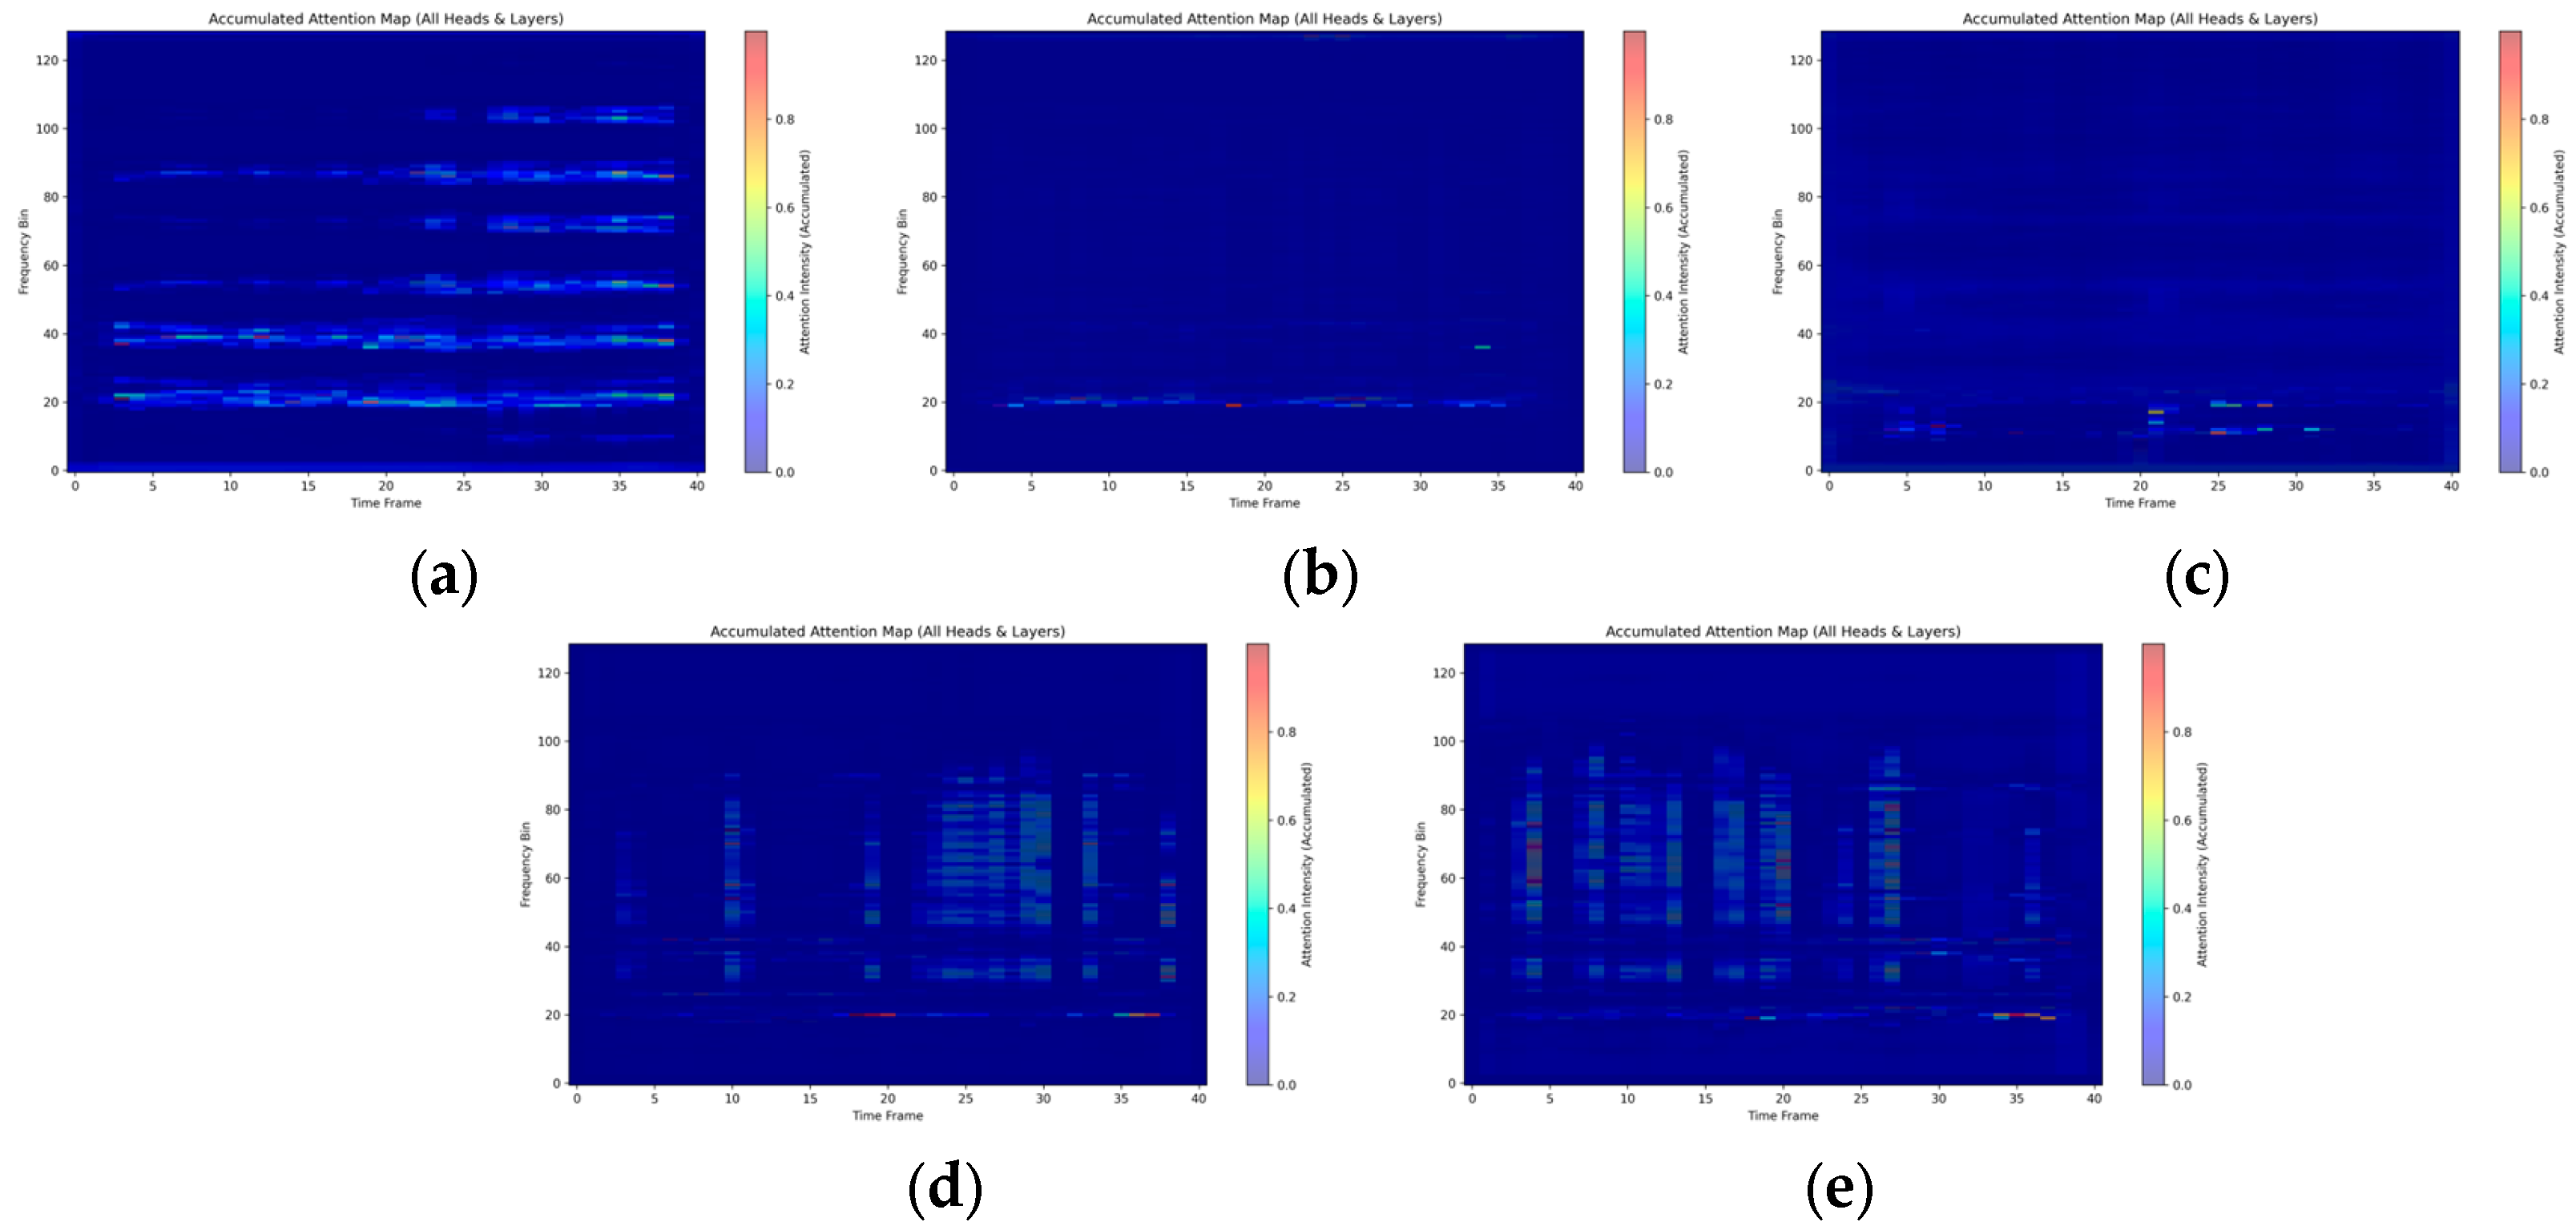
To further investigate the decision basis of the Transformer module and evaluate its role in global feature modeling, attention weights from the trained Transformer encoder were extracted and projected back onto the time-frequency domain of representative samples. These attention maps were visualized as heatmaps (Figure 14), covering five representative lithologies: shale, sandstone, bituminous coal, anthracite, and granite.
Figure 14.
Model attention weight distribution heat map. (a) Granite attention distribution; (b) Sandstone attention distribution; (c) Shale attention distribution; (d) Anthracite attention distribution; (e) Bituminous coal attention distribution.
The visualizations indicate that the model dynamically allocates attention, focusing on regions with abrupt frequency changes or localized energy anomalies. For example, in the case of granite samples, the attention weights are concentrated in the mid-to-late time segments within the 550–1100 Hz frequency band. This area also appears as a stable bright band in the time-frequency spectrogram, suggesting that the model may treat it as a discriminative feature of granite structures. For sandstone, the model pays more attention to the 200–450 Hz range, while the higher frequency bands appear dimmer and less emphasized. In coal samples, the attention tends to focus on spectral differences at specific time points, exhibiting a time-sensitive vertical distribution pattern.
Notably, in rock samples, attention heads exhibit horizontal attention behaviors across broader time scales, maintaining consistent focus on certain frequency regions. This aligns with the model’s demonstrated temporal modeling capabilities in the ablation studies. In contrast, the ablated model without the Transformer fails to establish such long-range dependencies, leading to a reduced capacity to capture dynamic features.
3.4.3. Model Deviation Analysis
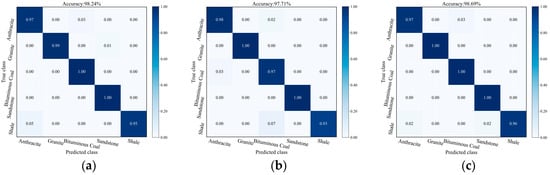
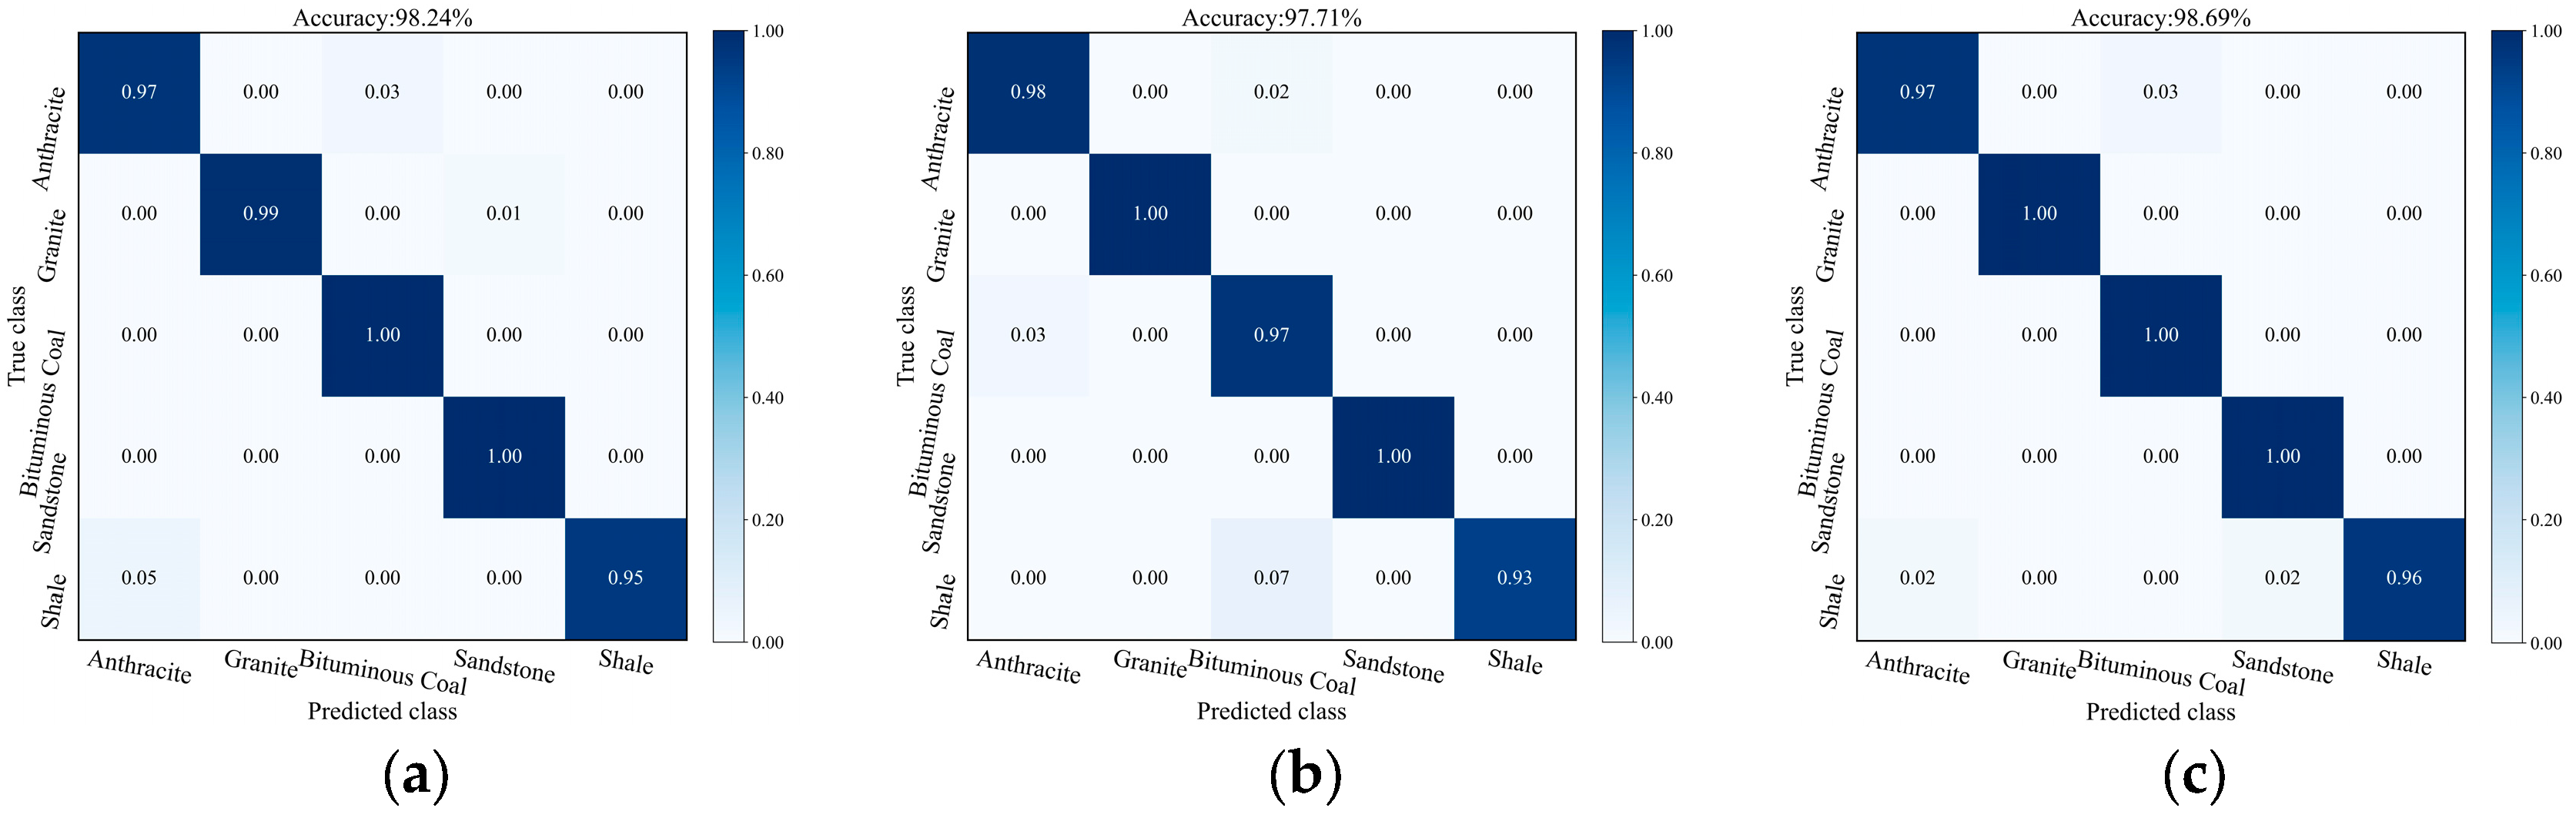
To comprehensively assess the generalization ability and classification stability of the integrated model across multiple lithologies, confusion matrices were generated under three independent training runs using different random seeds (23, 33, and 42). The results are shown in Figure 15.
Figure 15.
Model prediction. (a) Prediction result 1; (b) Prediction result 2; (c) Prediction result 3.
The model demonstrates robust classification performance for most lithologies. But noticeable confusion still exists between certain rock types (e.g., granite vs. sandstone) and coal types (e.g., anthracite vs. bituminous coal). These misclassifications can be reasonably explained by the previous visual analyses: Section 3.4.2 reveals similar high-frequency features among rock types, while Section 3.4.3 shows dispersed attention regions in coal samples, which may lead to less focused feature learning. Moreover, partial overlaps in physical structure and vibrational response between some lithologies could further contribute to inter-class ambiguities.
4. Discussion
4.1. Structural Contributions and Effectiveness Attribution
The experimental results presented in Section 3 demonstrate that the proposed MSC-Transformer model significantly outperforms conventional convolutional (VGG), residual (ResNet), and recurrent (Bi-LSTM) architectures in lithology classification tasks. This performance gain stems not only from architectural innovation, but also from a carefully designed input strategy that preserves discriminative features within the vibration signals.
Specifically, the triaxial multi-channel input strategy plays a critical role in enhancing the model’s sensitivity to directional and structural heterogeneity. By preserving time–frequency information along the X-, Y-, and Z-axes separately, this approach retains axis-specific spectral characteristics that are often compromised during signal fusion or dimensionality reduction. As demonstrated in Section 3.3.1, model performance degrades significantly when using single-channel inputs, regardless of the fusion strategy employed. For example, using only the Z-axis spectrogram results in an accuracy drop to 42.62 ± 3.87%, with a marked decline in F1-score. These findings highlight the importance of retaining complementary spectral contributions from all three axes to ensure robust classification.
In terms of architectural components, the model’s high performance is further attributed to the integration of a lightweight Transformer encoder and a MSC module, each offering distinct but complementary benefits.
The Transformer encoder significantly enhances the model’s capacity to integrate global temporal–frequency structures. According to the ablation study in Section 3.3.2, removing the Transformer module leads to a macro-averaged F1-score drop of 4.41 ± 1.60%, along with increased performance variability. The attention map visualizations in Section 3.4.2 further support this conclusion: for lithic samples, the attention mechanism captures long-range temporal dependencies within specific frequency bands, while for coal samples, it tends to emphasize spectral fluctuations at discrete time points, forming a vertically distributed time-sensitive pattern. This heterogeneous attention distribution enables adaptive learning of frequency-domain patterns, functioning similarly to a set of data-driven spectral filters, thereby improving the model’s ability to characterize subtle structural variations.
The parallel four-branch convolutional module, incorporating kernel sizes of 1 × 1, 3 × 3, 5 × 5, and 7 × 7, provides a diverse set of receptive fields. As shown in the controlled experiments in Section 3.3.3, replacing the multi-scale structure with any single-scale convolution variant results in a 3–6% drop in accuracy and increased performance fluctuations under different data splits. These results confirm that the multi-scale design effectively captures both fine-grained and broad-band patterns, thereby improving the model’s adaptability to complex stratigraphic structures. Additionally, the embedded SE channel attention mechanism further refines the inter-channel feature representation, suppresses intra-class variation, and accelerates convergence.
Finally, the confusion matrix of the full model (Section 3.4.3) exhibits a strong diagonal dominance, indicating consistent classification performance across lithology types. Even for lithologies prone to misclassification—such as shale versus sandstone and anthracite versus bituminous coal—the model maintains relatively low error rates. These results validate the proposed architecture’s effectiveness in distinguishing lithologies with high structural and spectral similarity. Taken together, the ablation results and comparative analyses confirm that the synergistic combination of the triaxial input strategy, MSC module, and Transformer encoder is central to the model’s superior classification performance.
4.2. Practical Implications for Intelligent Drilling
The MSC-Transformer model demonstrates robust generalization capabilities in multi-class lithology identification tasks, indicating strong potential for engineering applications. By utilizing time-frequency tensors derived from triaxial vibration signals and integrating multi-scale convolution with attention-based modeling, the model effectively mitigates challenges associated with ambiguous stratigraphic interfaces, complex texture features, and similar vibration responses.
Building on these technical advantages, the proposed framework offers a promising solution for intelligent drilling exploration. Unlike traditional methods that rely on manual logging or hand-crafted statistical features, this deep learning-based model achieves automated feature extraction, significantly reducing the dependence on expert experience. Furthermore, compared to existing lithology identification approaches based on standard CNNs or RNNs, the proposed MSC-Transformer exhibits superior robustness against complex drilling noise (as evidenced in Section 3.2). This capability makes it a more reliable perception module for real-time formation monitoring, providing instantaneous feedback on geological conditions to optimize drilling safety and efficiency.
4.3. Limitations and Future Directions
Despite the promising results, this study has limitations that represent clear directions for future research. First, the current experimental dataset relies on vibration signals acquired from a laboratory intelligent drilling platform, covering only five typical rock types (granite, sandstone, shale, etc.). While these samples represent common lithologies, actual geological formations are far more complex, often involving interbedded strata, anisotropic characteristics, and mixed lithologies that are difficult to fully replicate in a controlled laboratory setting. Therefore, future work will focus on expanding the variety of rock samples and exploring the model’s lithology identification capabilities under complex multi-lithology conditions.
Second, although the laboratory platform mimics drilling processes, a domain gap inevitably exists between these experimental signals and the acoustic environment of industrial fields. Real-world field drilling operations encounter coupled multi-physics interference—such as drill string resonance and mud circulation noise—that may exceed the complexity of the current experimental setup. To bridge this gap, we plan to collect extensive field experimental data and employ transfer learning techniques to fine-tune the pre-trained model. This strategy aims to enhance the model’s generalization ability and adaptability to the rigorous noise environments encountered in in situ intelligent drilling operations.
5. Conclusions
This study proposes an intelligent lithology identification framework, the MSC-Transformer, to address the challenge of extracting discriminative features from complex drilling vibration signals. By systematically integrating signal processing techniques with deep learning architectures, the research successfully achieved robust automated lithology classification. The key methodologies and findings of this study are summarized as follows:
- (1)
- The primary research tools employed in this study include a hybrid preprocessing strategy (adaptive wavelet denoising and high-pass filtering) for signal enhancement, and the STFT for constructing multi-channel time-frequency tensors. The core modeling tool is the MSC-Transformer network, which utilizes MSC to capture local transient textures and a Transformer encoder to model global long-range dependencies.
- (2)
- Quantitatively, the proposed method achieved an average test accuracy of 98.21 ± 0.49% on the laboratory dataset. This performance significantly outperforms baseline models, including VGG (95.67 ± 0.75%), ResNet-18 (91.83 ± 2.58%), CNN Baseline (92.28 ± 1.03%), and Bi-LSTM (87.65 ± 3.07%). Independent sample t-tests confirm that these improvements are statistically significant (p < 0.05), validating the superiority of the proposed architecture.
- (3)
- Physical interpretability analysis reveals that lithological differences are most pronounced in the high-frequency band (450–1100 Hz), where rock samples exhibit significantly stronger energy responses than coal. Attention map visualizations further verify that the model correctly focuses on these discriminative frequency bands and temporal impact features, ensuring that the classification is driven by valid physical characteristics rather than background noise.
- (4)
- Although limited by the current laboratory-scale dataset, the study verifies the feasibility of using vibration time-frequency features for formation monitoring. Future research will focus on expanding the lithology database to include complex mixed strata and collecting extensive field experimental data. Transfer learning strategies will be employed to bridge the domain gap between laboratory prototypes and real-world field drilling operations, thereby enhancing engineering applicability.
Author Contributions
Conceptualization, S.X.; methodology, S.W.; software, K.L.; validation, S.X.; formal analysis, J.Z. (Jie Zhang 1); investigation, J.Z. (Jie Zhang 2) and K.L.; resources, S.W.; data curation, K.L.; writing—original draft preparation, S.X.; writing—review and editing, S.W., Q.W. and J.B.; visualization, K.L.; supervision, J.Z. (Jie Zhang 1); project administration, J.B.; funding acquisition, S.W. All authors have read and agreed to the published version of the manuscript.
Funding
This research was funded by the National Natural Science Foundation of China (Grant Number 42072339) and the Chengdu University of Technology Everest Scientific Research Project (Grant Number 80000-2022ZF11411).
Data Availability Statement
Since the data generated in this study is part of another ongoing study, the full data sets are not available.
Conflicts of Interest
The authors declare that they have no known competing financial interests or personal relationships that could have appeared to influence the work reported in this paper.
Abbreviations
| Abbreviation | Full name |
| STFT | Short-Time Fourier Transform |
| PSD | Power Spectral Density |
| MSC | Multi-Scale Convolutional |
| CNNs | Convolutional Neural Networks |
| RNN | Recurrent Neural Network |
| VGG | Visual Geometry Group |
| ResNet | Residual Network |
| Bi-LSTM | Bidirectional Long Short-Term Memory |
| DWT | Discrete Wavelet Transform |
| MSC-T | MSC-Transformer |
| T-TCT | Three-Channel input Tensor |
| WF-SCT | Weighted-Fusion Single-Channel Tensor |
| MF-TCT | Mean-Fusion Single-Channel Tensor |
| X-SCT | X-axis Single-Channel Tensor |
| Y-SCT | Y-axis Single-Channel Tensor |
| Z-SCT | Z-axis Single-Channel Tensor |
| SSC | Single-Scale Convolutional |
References
- Yue, Z. Drilling process monitoring for refining and upgrading rock mass quality classification methods. Chin. J. Rock Mech. Eng. 2014, 33, 1977. [Google Scholar] [CrossRef]
- Zhai, S.; Su, G.; Yin, S.; Zhao, B.; Yan, L. Rockburst characteristics of several hard brittle rocks: A true triaxial experimental study. J. Rock Mech. Geotech. Eng. 2020, 12, 279–296. [Google Scholar] [CrossRef] [Scilit]
- Zhai, H.; Chen, H.; Shi, B.; Zhao, H.; Gao, F. Drilling Monitoring While Drilling and Comprehensive Characterization of Lithology Parameters. Appl. Sci. 2025, 15, 11134. [Google Scholar] [CrossRef] [Scilit]
- Zhang, Y.; Li, M.; Han, S. Automatic identification and classification in lithology based on deep learning in rock images. Acta Petrolog. Sin. 2018, 34, 333–342. [Google Scholar]
- Xu, Z.; Yu, T.; Li, S.; Lin, P.; Ma, W.; Han, T.; Li, S. Intelligent identification of lithology and adverse geology: A state-of-the-art review. Smart Undergr. Eng. 2025, 1, 3–25. [Google Scholar] [CrossRef] [Scilit]
- You, M.; Hong, Z.; Tan, F.; Wen, H.; Zhang, Z.; Lv, J. Stratigraphic identification using real-time drilling data. J. Rock Mech. Geotech. Eng. 2024, 16, 3452–3464. [Google Scholar] [CrossRef] [Scilit]
- Elkatatny, S. Real-time prediction of rate of penetration while drilling complex lithologies using artificial intelligence techniques. Ain Shams Eng. J. 2021, 12, 917–926. [Google Scholar] [CrossRef] [Scilit]
- Liu, J.; Tian, F.; Zhao, A.; Zheng, W.; Cao, W. Logging Lithology Discrimination with Enhanced Sampling Methods for Imbalance Sample Conditions. Appl. Sci. 2024, 14, 6534. [Google Scholar] [CrossRef] [Scilit]
- Mobaraki, B.; Lozano-Galant, F.; Soriano, R.P.; Castilla Pascual, F.J. Application of Low-Cost Sensors for Building Monitoring: A Systematic Literature Review. Building 2021, 11, 336. [Google Scholar] [CrossRef] [Scilit]
- Ding, Y. Theory and Method of Intelligent Acquisition of Rock Mass Structure and Mechanical Properties While Drilling. Ph.D. Thesis, University of Science and Technology Beijing, Beijing, China, 2023. Available online: https://link.cnki.net/doi/10.26945/d.cnki.gbjku.2023.000460 (accessed on 1 March 2025).
- Liu, G.; Zhang, J.; Liu, C.; Yang, F.; Du, J. An identification method of vibration signal features when bit drills different mediums. J. Vib. Shock. 2017, 36, 71–78+104. Available online: https://link.cnki.net/doi/10.13465/j.cnki.jvs.2017.08.012 (accessed on 15 May 2021).
- Wang, H.; Zhang, Q. Dynamic identification of coal-rock interface based on adaptive weight optimization and multi-sensor information fusion. Inf. Fusion. 2019, 51, 114–128. [Google Scholar] [CrossRef] [Scilit]
- Yan, T.; Xu, R.; Sun, S.; Hou, Z.; Feng, J. A real-time intelligent lithology identification method based on a dynamic felling strategy weighted random forest algorithm. Petrol. Sci. 2024, 21, 1135–1148. [Google Scholar] [CrossRef] [Scilit]
- Yue, X.; Huang, D.; Yue, Z.; Zhao, J. Using drilling noise and vibration signals for rock layer identification: A study on layered rock samples with weak interlayers. Bull. Eng. Geol. Environ. 2025, 84, 133. [Google Scholar] [CrossRef] [Scilit]
- Al-Shuker, N.; Kirby, C.; Brinsdon, M. The application of real time downhole drilling dynamic signatures as a possible early indicator of lithology changes. In Proceedings of the SPE/DGS Saudi Arabia Section Technical Symposium and Exhibition, Al-Khobar, Saudi Arabia, 15–18 May 2011. [Google Scholar] [CrossRef] [Scilit]
- Xu, M.; Liu, X.; Zhou, Z.; Zhang, L.; Niu, W.; Zhang, T. Formation identification method based on embedding judgment of rotary drilling rig. J. Cent. South Univ. Sci. Technol. 2017, 48, 3344–3350. [Google Scholar] [CrossRef]
- Hao, J.; Liu, H.; Liu, J.; Lv, J.; Zheng, Y.; Liu, J. Experimental study of rock uniaxial compressive strength prediction with drilling based on vibration signals. Chin. J. Rock Mech. Eng. 2024, 43, 1406–1424. [Google Scholar] [CrossRef]
- Hong, G. Lithology Identification Based on Time-Frequency Image of Vibration in Nearly Real Time. Master’s Thesis, China University of Petroleum, Beijing, China, 2019. Available online: https://link.cnki.net/doi/10.27643/d.cnki.gsybu.2019.000719 (accessed on 1 March 2025).
- Wang, C.; Xue, Q.; He, Y.; Wang, J.; Li, Y.; Qu, J. Lithological identification based on high-frequency vibration signal analysis. Measurement 2023, 221, 113534. [Google Scholar] [CrossRef] [Scilit]
- Cao, X.; Li, X.; Yue, F.; Sun, H. Research and application of vibration measurement while drilling in the undersea coal mine. J. Coast. Res. 2020, SI103, 323–327. [Google Scholar] [CrossRef] [Scilit]
- Chen, X.; Liang, N.; Chen, G.; Chen, X. Analysis of rock drilling vibration signal based on the HHT method. Geol. Explor. 2020, 56, 1258–1265. [Google Scholar] [CrossRef]
- Lazarova, E.; Krulakova, M.; Krupa, V.; Labs, M.; Feriancikova, K. Regime and rock identification in disintegration by drilling based on vibration signal differentiation. Int. J. Rock Mech. Min. Sci. 2022, 149, 104984. [Google Scholar] [CrossRef] [Scilit]
- Bai, J.; Wang, S.; Xu, Q.; Luo, Z.; Zhang, Z.; Lai, K.; Wu, J. Intelligent real-time predicting method for rock characterization based on multi-source information integration while drilling. Bull. Eng. Geol. Environ. 2023, 82, 150. [Google Scholar] [CrossRef] [Scilit]
- Li, Z.; Lin, X.; Song, C. Experimental study on spectral characteristics of sound and vibrations in rock drilling. Chin. J. Undergr. Space Eng. 2019, 15, 1008–1016. [Google Scholar]
- Chen, G.; Chen, M.; Hong, G.; Lu, Y.; Zhou, B.; Gao, Y. A new method of lithology classification based on convolutional neural network algorithm by utilizing drilling string vibration data. Energies 2020, 13, 888. [Google Scholar] [CrossRef] [Scilit]
- Zhang, Z.; Xu, Y.; Chen, J. Method of Convolutional Neural Networks for Lithological Classification Using Multisource Remote Sensing Data. Remote Sens. 2026, 18, 29. [Google Scholar] [CrossRef] [Scilit]
- Li, Y.; Chen, J.; Fang, Q.; Zhang, D.; Huang, W. Towards automated lithology classification in NATM Tunnel: A Data-Driven Solution for Multi-dimensional Imbalanced Data. Rock Mech. Rock Eng. 2025, 58, 2349–2366. [Google Scholar] [CrossRef] [Scilit]
- Cui, J.; Ding, Z.; Zhang, C.; Liu, J.; Zhang, W. Enhanced Lithology Recognition in Coal Mining: A Data-Driven Approach with DBO-BiLSTM and Wavelet Denoising. Appl. Sci. 2025, 15, 9978. [Google Scholar] [CrossRef] [Scilit]
- Hou, Z.; Wei, J.; Shen, J.; Liu, X.; Zhao, W. Intelligent Lithology Identification Methods for Rock Images Based on Object Detection. Nat. Resour. Res. 2023, 32, 2965–2980. [Google Scholar] [CrossRef] [Scilit]
- Xu, Z.; Ma, W.; Lin, P.; Hua, Y. Deep learning of rock microscopic images for intelligent lithology identification: Neural network comparison and selection. J. Rock Mech. Geotech. Eng. 2022, 14, 1140–1152. [Google Scholar] [CrossRef] [Scilit]
- Zhang, Y.; Tong, L.; Lai, X.; Cao, S.; Yan, B.; Yang, Y.; Liu, Y.; He, W. Research on coal-rock identification method and data augmentation algorithm of comprehensive working face based on FL-Segformer. Int. J. Coal Sci. Technol. 2024, 11, 48. [Google Scholar] [CrossRef] [Scilit]
- Zhou, Y.; Wong, L.; Tse, K. Novel rock image classification: The proposal and implementation of HKUDES_Net. Rock Mech. Rock Eng. 2023, 56, 3825–3841. [Google Scholar] [CrossRef] [Scilit]
- Khoshouei, M.; Bagherpour, R.; Jalalian, M. Rock type identification using analysis of the acoustic signal frequency contents propagated while drilling operation. Geotech. Geol. Eng. 2022, 40, 1237–1250. [Google Scholar] [CrossRef] [Scilit]
- Chen, J.; Gui, Z.; Rui, Y.; Zhao, X.; Pan, X.; Wang, Q.; Pu, Y.; Li, Z.; Liu, M. A dual attention-based deep learning model for lithology identification while drilling. J. Rock Mech. Geotech. Eng. 2025, 18, 1177–1192. [Google Scholar] [CrossRef] [Scilit]
- Yue, Z.; Yue, X.; Yang, R.; Wang, X.; Li, W.; Dai, S.; Li, Y. Progress of lithology identification technology while drilling. J. Min. Sci. Technol. 2022, 7, 389–402. [Google Scholar] [CrossRef]
- Tao, X.; Zhang, H.; Yang, S.; Chen, D.; Bai, K.; Zhou, F. At-Bit Lithology Estimation Based on Surface Drilling Parameters by Online Machine Learning and Multi-source Data Fusion: Methods and Applications. In Proceedings of the International Field Exploration and Development Conference 2022; Lin, J., Ed.; Springer: Singapore, 2023; pp. 7155–7166. [Google Scholar] [CrossRef] [Scilit]
- Xu, S.; Wang, S.; Lai, K.; Bai, J.; Zhang, Z.; Zhang, J. Intelligent inversion of lithology while drilling method based on acoustic and vibration signal and transfer learning. Sci. Technol. Eng. 2025, 25, 7511–7524. [Google Scholar] [CrossRef]
- Zhang, J.; Wang, S.; Xie, C.; Zhang, Z.; Lai, K.; Bai, J. Ensemble deep learning for lithology identification using drilling sound and vibration signals. Bull. Eng. Geol. Environ. 2025, 84, 523. [Google Scholar] [CrossRef] [Scilit]
- Wan, J. Research of Feature Extraction and Classification Methods Based on Active Imagination EEG Signals. Master’s Thesis, University of Electronic Science and Technology of China, Chengdu, Sichuan, China, 2023. Available online: https://link.cnki.net/doi/10.27005/d.cnki.gdzku.2023.002269 (accessed on 1 March 2025).
- Lv, Y.; Wang, S. A temporal-spatial attention-based dynamic correction method for geological model of coal seam. In Proceedings of the 16th International Conference on Advanced Computational Intelligence (ICACI), Zhangjiajie, China, 16–19 May 2024; pp. 43–48. [Google Scholar] [CrossRef] [Scilit]
- Wang, S.; Li, J.; Chen, Y.; Wu, Z.; Huang, A.; Zhang, L. Multi-scale graph diffusion convolutional network for multi-view learning. Artif. Intell. Rev. 2025, 58, 184. [Google Scholar] [CrossRef] [Scilit]
- Lu, K.; Huang, X.; Xia, R.; Zhang, P.; Shen, J. Cross attention is all you need: Relational remote sensing change detection with transformer. GISci. Remote Sens. 2024, 61, 2380126. [Google Scholar] [CrossRef] [Scilit]
- Sun, Y.; Pang, S.; Li, H.; Qiao, S.; Zhang, Y. Enhanced Lithology Classification Using an Interpretable SHAP Model Integrating Semi-Supervised Contrastive Learning and Transformer with Well Logging Data. Nat. Resour. Res. 2025, 34, 785–813. [Google Scholar] [CrossRef] [Scilit]

Disclaimer/Publisher’s Note: The statements, opinions and data contained in all publications are solely those of the individual author(s) and contributor(s) and not of MDPI and/or the editor(s). MDPI and/or the editor(s) disclaim responsibility for any injury to people or property resulting from any ideas, methods, instructions or products referred to in the content. |
© 2026 by the authors. Licensee MDPI, Basel, Switzerland. This article is an open access article distributed under the terms and conditions of the Creative Commons Attribution (CC BY) license.